microalgal primary producers and their limiting …in 2009, the dutch and german wadden sea entered...
TRANSCRIPT

Microalgal primary producers and their limiting resources

2
ISBN: 9789461918321 Cover design: Juliette Ly, phosphatase activity at a single-cell level detected with
green enzyme-labeled fluorescence (ELF) Printed by: Ipskamp Drukkers BV, Rotterdam, the Netherlands Correspondence: [email protected]

3
Microalgal primary producers and their limiting resources
ACADEMISCH PROEFSCHRIFT
ter verkrijging van de graad van doctor
aan de Universiteit van Amsterdam
op gezag van de Rector Magnificus,
prof. dr. D. C. van den Boom
ten overstaan van een door het college voor promoties ingestelde
commissie, in het openbaar te verdedigen in de Agnietenkapel
op donderdag 10 oktober 2013, te 12:00 uur
door
Juliette Ly
geboren te Ivry sur Seine, Frankrijk

4
Promotor: Prof. dr. L. J. Stal
Copromotor: Dr. J. C. Kromkamp
Overige leden: Prof. dr. J. Huisman
Prof. dr. W. Admiraal
Prof. dr. E. van Donk
Prof. dr. C. P. D. Brussaard
Faculteit der Natuurwetenschappen, Wiskunde en Informatica

1
Contents
CHAPTER 1 Introduction 3
CHAPTER 2 Spatio-temporal variation in phytoplankton biomass and 13 community within a riverine tidal basin
CHAPTER 3 Phosphorus limitation during a phytoplankton spring bloom 49 in the western Dutch Wadden Sea
CHAPTER 4 Spatio-temporal variation in effects of phosphate addition on 75 C-fixation rates of phytoplankton communities in the western Wadden Sea
CHAPTER 5 Absence of microphytobenthos suspension in the western 101
Dutch Wadden Sea: benthic and pelagic community analyses CHAPTER 6 A two-dimensional analysis of photosynthetic activity and 121
vertical migration of microphytobenthos using imaging pulse amplitude modulated (PAM) fluorescence
CHAPTER 7 General discussion 147
References 153
Summary 167
Nederlandse Samenvatting 170
Acknowledgements 173

2

3
CHAPTER 1
Introduction

4
General background
Worldwide, coastal ecosystems and estuaries are facing increased anthropogenic pressure as more and more people live near the coastline. More than 40% of the world population is currently living within 100 km from the coastline (Martínez et al., 2007). Rivers bring nutrients and pollutants from their catchment area and concentrate them in the estuarine system. Estuaries are also important ecologically: they perform several ecosystem functions like providing nursery grounds for fish, sustaining shellfish fisheries industry, and estuaries are an important filter with respect to nutrient discharge into the coastal areas and oceans (Kaiser et al., 2005). Phytoplankton forms the basis of the aquatic food web. Through photosynthesis, phytoplankton produces new organic matter for their own growth as well as providing a food source for the higher trophic levels (Falkowski and Raven, 1997). In coastal systems with large intertidal flats or with a clear water column where light hits the bottom, microphytobenthos (MPB) is another important group of primary producers. There is often a positive linear relationship between MPB primary producers and macrozoobenthos density in intertidal sediments (Herman et al., 1999). In general, primary productivity is constraint by the physiology of the organisms caused on the one hand by limiting resources (i.e. bottom-up control), but on the other hand top-down control (grazing) also controls primary production and the standing stock of phytoplankton or MPB.
Bottom-up control of microalgal primary producers
Nutrient limitation
Photoautotrophic microorganisms require light, macro-nutrients (carbon (C) nitrogen (N), phosphorus (P), and in the case of diatoms, silicon (Si), and micro-nutrients (trace elements and vitamins)) for growth. Dissolved nutrient concentrations fluctuate in aquatic environments and their availabilities are affected by seasonal change in biotic and abiotic factors (see paragraph on seasonality in phytoplankton).
Phytoplankton species are characterized by their chemical composition, size and affinity for the diverse nutrients. The phytoplankton elemental stoichiometry was described by Redfield et al. (1958), who found that below the ocean thermocline the elemental composition of the organic matter has a ratio of C:N:P = 106:16:1, and that this ratio, which has become known as the Redfield ratio, was similar to the values obtained in other field studies. However, it has become clear that the Redfield ratio is less fixed than previously thought. The nutrient stoichiometry ratio can vary considerably amongst microalgae and between different environmental conditions (Geider and Roche, 2002). For example, nutrient limitation can cause a deviation of the nutrient stoichiometry from the Redfield ratio, and often this variation can be described according to the formulation of Droop (1983): μ = μ max (1- Qmin, i /Qi) where μmax is the maximum growth rate when Q become infinite and Qmin is the minimum quota of nutrient i observed when μ = 0. The empirical Droop equation shows that the theoretical internal stores of a nutrient can vary between a minimum and a maximum concentration, although luxury uptake,

5
which takes place when a limiting nutrient is suddenly supplied in excess, can result in an increase of the cell’s storage capacity. In the mixed layer of the water column the nutrient stoichiometry is variable, suggesting that factors such as the availability of light, temperature, nutrient and carbon dioxide can simultaneously affect the nutrient stoichiometry of the cells (De Baar, 1994).
Liebig’s law of the minimum, which is widely used in oceanography and phytoplankton ecology, from a single species to the community level (De Baar, 1994; Danger et al., 2008), states that control of the biomass accrual is determined by a single limiting resource (Liebig, 1842). Hence, macronutrients (N, P and Si for diatoms species) may impair the growth and physiology of photoautotrophic organisms. Liebig’s law of the minimum has been derived from agriculture, and is basically meant to control the maximum biomass (yield) which can be obtained from a limiting nutrient. Co-limitation by different resources can also disrupt cell growth (Arrigo, 2004), but usually indicates that one group in the phytoplankton community lacks of nutrient A, whereas the other population lacks of nutrient B. However, a restricted availability of a nutrient can also disrupt synthesis of components in the cell and decrease growth rates (Hansell and Carlson, 2002).
Seasonality in phytoplankton
Microalgae require at least two major resources in order to form a bloom namely: light and nutrients. Two main peaks of phytoplankton biomass occur in temperate marine systems (Winder and Cloern, 2010).
Winter phytoplankton should be able to grow under low light and temperature (Zingone et al., 2010). Several species can develop resting stages (e.g. spores) that help to survive the winter and return to an active vegetative stage when conditions become more favorable. During the winter period, the mixed layer is deeper than the critical depth, and, hence, the net daily production in the mixed layer becomes insufficient to sustain growth of phytoplankton. In winter, growth of phytoplankton depends on physical factors rather than on grazing or supply of nutrients. Physical and meteorological conditions during winter such as strong winds will cause mixing of the water column and there will be no stratification (thermocline). Although phytoplankton is present during winter and nutrients are distributed evenly in the water column, photosynthesis is hampered by the short day length and the low light intensity. Due to remineralization in winter and the low growth of phytoplankton, high nutrient concentrations are found in the water column before the spring bloom starts. The increase of phytoplankton biomass coincides with the available resources (light and nutrients) present at the water surface that trigger the onset of phytoplankton growth and result in the spring bloom. The spring bloom of phytoplankton is one of the most conspicuous seasonal features in pelagic systems. According to Sverdrup’s hypothesis, the spring phytoplankton bloom is initiated when the mixed layer depth is shallower than the critical depth (water depth when integrated daily photosynthetic carbon assimilation is compensated by the integrated daily respiratory carbon losses) in stratified systems, the net primary production (total photosynthetic carbon assimilation – respiration carbon losses) becomes positive (Sverdrup, 1953). In systems without stratification, the

6
phytoplankton bloom starts when respiratory losses are smaller than gross photosynthesis (defined as the light dependent rate of electron flow from the water to the terminal electron acceptors in the absence of any respiratory losses) due to an increase of day length, higher incident irradiance, and a higher transparency of the water column because of less strong winds. Consequently, the phytoplankton biomass accumulates at the surface or in the mixed layer and conditions (light and nutrients) allow phytoplankton growth. Alternative, to the Sverdrup model, the dilution-recoupling hypothesis suggests that the onset of phytoplankton bloom in spring is caused by a dilution of grazers in deeper mixing layers during winter rather than from nutrient supply (Behrenfeld, 2010). Grazing pressure by zooplankton or depletion of nutrients may cause the breakdown of the spring bloom.
In late summer and early autumn, a second bloom may occur when regeneration processes result in increasing nutrient concentrations in the water column. The autumn phytoplankton bloom is usually less intense than the spring bloom, because light limits phytoplankton growth. The mixed layer migrates to greater depth. As a result, the nutrient concentrations become available at greater depth. In coastal areas, the changes in phytoplankton composition and biomass are tuned to the season but may also be affected by local conditions, such as point sources for nutrient loadings. It is the interplay of light, nutrient availability, physical conditions and biological interactions in the water column that leads to the complex seasonal phytoplankton dynamics (Winder and Cloern, 2010).
Seasonality in microphytobenthos
Unicellular benthic primary producers, MPB, can be important primary producers in coastal systems. In large tidal flat ecosystems, MPB can be responsible for up to 50% of the total primary production of the whole estuary (Underwood and Kromkamp, 1999). Like in the pelagic system, a myriad of physical and biogeochemical factors cause fluctuations in the light intensity, temperature, and nutrient concentrations. The sediment grain size is one of the factors that determine MPB biomass and its spatial distribution (Underwood, 2010). Across different ecosystems, MPB seasonality can vary due to the sediment type and available resources (Billerbeck et al., 2007). Some estuarine ecosystems display seasonal MPB patterns between spring and summer due to high light availability and high temperature (De Jonge and van Beusekom, 1995; Ubertini et al., 2012), while other estuaries show no apparent MPB seasonality (Thornton et al., 2002). Only when grazers are present or when bioturbation by benthic macrofauna takes place, the sediment may be disrupted the integrity of the MPB biofilm.
Tidal basin ecosystem
Wadden Sea ecology
The Wadden Sea is a shallow coastal area bordering the North Sea of the Netherlands, Germany and Denmark and is an important international nature reserve (Lotze et al., 2005). The Wadden Sea is the largest coastal area in northern Europe with extended tidal flats (450 km),

7
stretching from Den Helder in the Netherlands to Esbjerg in Denmark. In 2009, the Dutch and German Wadden Sea entered the UNESCO World Heritage list due to the unique biodiversity of migratory birds, important benthos stocks, extensive seagrass meadows, and the important habitat for fish and seals. This thesis focuses on the westernmost part of the Dutch Wadden Sea, the Marsdiep basin. The Marsdiep basin is a shallow system of barrier islands and tidal inlets. The main sources of nutrients in this area are from the river Rhine and the North Sea, as well as from irregular discharges of freshwater from Lake IJsselmeer (fed by the river IJssel, a branch of the river Rhine) (Van Raaphorst and De Jonge, 2004). Regular tidal exchanges and sediment transport from the North Sea are entering the Marsdiep basin through the Texel inlet (Postma, 1981; Van Heteren et al., 2006). As a consequence, the Wadden Sea is a dynamic coastal ecosystem that is regularly receiving riverine and North Sea inputs.
Eutrophication
Eutrophication is defined as an increase of nutrient loadings to an ecosystem (Nixon, 1995). In order to manage ecosystems perturbed by anthropogenic nutrients, strategies to decrease the P- and N loadings are necessary to alleviate symptoms of eutrophication (Howarth et al., 2011). Phytoplankton is at the base of the food web. Long-term monitoring programs have shown that phytoplankton growth is controlled by nutrient availability in the water column. Nutrient concentrations may be elevated due to external loads and phytoplankton responds directly to such increase in nutrient concentration. Phytoplankton is sensitive to fluctuations in the nutrient concentrations (Paerl et al., 2003). According to a long-term dataset of almost 30 years (1974-2003) of nutrient concentrations and composition of phytoplankton, macrozoobenthos and estuarine birds (Cadée and Hegeman, 2002; Philippart et al., 2007), three distinct periods were identified. In the first period, soluble reactive phosphorus (SRP) concentration and -load increased until the mid-1980s and then a decline was observed during the second period around the 1990s. Si concentrations increased during both periods. Then, after the 1990s was identified as the third period that was characterized by low concentrations of SRP and high dissolved inorganic nitrogen (DIN):SRP and silicate (Si):SRP ratios, compared to the two previous two periods. Nitrogen concentrations did not decrease significantly during these three periods (Philippart et al., 2007).
In order to increase the knowledge of nutrient concentration changes since 2003, data were retrieved from the international institute for coastal and marine management, Rijkswaterstaat (RWS) (Fig. 1). Data of DIN (sum of nitrate, nitrite and ammonium), SRP and Si were extracted from station Noordwijk, located 2 km out of the coast (52° 15’10.29’’N, 4° 24’19.88’’), and under the influence of the river Rhine. Starting from the 1990s, molar DIN:SRP and Si:SRP ratios increased and were above the Redfield ratio of 16, indicating a potential P limitation. Since 1995, the annual median values from the DIN:SRP ratio did not show a decline. The pattern of molar Si:SRP ratios are more complex: between 1990 and 1995, this ratio increased and then appeared to reach a constant value, as was the case with the DIN:SRP ratio. That ratio was just below the Redfield ratio of 16, suggesting a near balance in the Si and SRP demands. However, the molar Si:SRP ratio jumped to values >16 in 1998 and varied slightly

8
from year to year, until 2010, when the ratio decreased. The data thus suggest that, apart from a recent change in Si concentration, the Si:SRP ratios were close to the Redfield ratio in the late 1990s, early 2000s. As shown for the Noordwijk station data, the decrease of P load from river discharge into the Wadden Sea led to a decrease of P availability in the system. Based on monitoring data, P had been identified as the most likely limiting nutrient for phytoplankton (Si is only limiting for diatoms) (Philippart et al., 2007).

9
Figure 1. Soluble reactive phosphorus (SRP), silicate (Si) and molar DIN:SRP and Si:SRP ratios from 1975 to 2012 at station Noordwijk (2 km off the coast). Data were retrieved from the database of Rijkswaterstaat. Dashed lines represented DIN:SRP Redfield ratio 16 and Si:SRP optimum ratio 16.

10
Methodology
Several types of measurements and experiments can be used to test nutrient limitation in aquatic systems (Beardall et al., 2001). The responses of phytoplankton to a variation in nutrient conditions are often measured as the change in chlorophyll-a (Chla) as a proxy of phytoplankton biomass. Chla is a universal pigment found in all algae classes and easy to measure (Jeffrey et al., 1997). However, routine measurements of Chla are not always suitable to estimate phytoplankton biomass for instance because changes in phytoplankton composition may obscure these measurements. The use of Chla gives only “bulk” information on phytoplankton biomass whereas more insights can be obtained if also information is obtained on the changes in the different functional types or different species. The responses of phytoplankton communities and shifts in their taxonomic composition to changing environmental conditions need to be understood.
Therefore, the research described in this thesis used phospholipid fatty acid (PLFA) as a chemotaxonomic biomarker in combination with 13C stable isotope labeling to describe the changes in abundance and activity of specific groups of primary producers (Dijkman et al., 2009) (Fig. 2). PLFA constitutes a major part of the lipid pool and it is an important compound of living cells. It is an ubiquitous compound with short turnover time, and therefore PLFA provides a good indicator of living biomass (Boschker and Middelburg, 2002; Bianchi and Canuel, 2011). Application of PLFA as a biomarker has proven to be a useful indicator of changes in the composition of lower trophic levels (eukaryotic algae, bacteria, fungi and actinomycetes) and the physiological status of the cells because most PLFAs are synthesized de novo (Sargent, 1997; Müller-Navarra et al., 2000). The variability in the PLFA composition results from changes in the metabolism and in species composition that are caused by environmental parameters crucial for phytoplankton primary productivity such as light, temperature, and nutrient concentrations (Dalsgaard et al., 2003; Piepho et al., 2012). Overall, the use of PLFA has been successfully used for the interpretation of changes of specific groups of phytoplankton (Brett and Muller-Navarra, 1997; Middelburg et al., 2000; Dalsgaard et al., 2003; Dijkman and Kromkamp, 2006; Kürten et al., 2013).

11
Figure 2. Major biosynthetic fatty acid pathways in marine algae. Desaturase enzymes Δ12 and Δ15 are only found in primary producers. Examples of specific abundant PLFAs in diatoms, green algae or flagellates. Figure taken from (Bergé and Barnathan, 2005).
Research hypotheses
The main objective of this thesis was to improve our knowledge of the bottom-up control of pelagic and benthic primary producers. For this research, the Marsdiep tidal basin, western Dutch Wadden Sea, was chosen as the location of the investigation. The investigation addressed the major limiting resources (nutrients and light) of phytoplankton growth. According to long-term data series, it has been hypothesized that P is the most important limiting factor for phytoplankton growth following decrease in nutrient concentrations after de-eutrophication in the Marsdiep basin. The conclusion of P limitation was based on nutrient concentrations and ratios. However, few studies have in fact proven that P was the limiting resource for phytoplankton in the Marsdiep tidal basin or have investigated the effects of this limitation on the phytoplankton community. P limitation will select for phytoplankton species that have a high affinity for P and/or a low internal P storage capacity. Hence, it can be expected that this would lead to changes in the composition of the phytoplankton community. Because the Marsdiep basin is a shallow and dynamic tidal basin with large intertidal flats, it was expected that MPB plays a role in P release in the water column. This thesis was set out to confirm and prove P limitation in phytoplankton in the Marsdiep tidal basin and improve our knowledge of the relationship between P and phytoplankton composition.

12
Outline of the thesis
The research questions and hypotheses were answered through a number of field surveys. During these field surveys the limiting resources were investigated in the Marsdiep basin of the western Dutch Wadden Sea at different temporal and spatial scales and related to the phytoplankton community composition. In addition, nutrient enrichment experiments were carried out with natural phytoplankton assemblages.
In chapter 2, the main objective was to test whether spatio-temporal distribution of phytoplankton was under the influence of episodic freshwater discharge into the Marsdiep basin. The spatial variability of abiotic parameters and distribution of the phytoplankton community at different stages of the phytoplankton seasonal cycle were investigated at different locations characteristic for the western Dutch Wadden Sea.
In chapter 3, the limiting nutrients for the phytoplankton biomass were determined with a series of short term nutrient enrichment experiments under controlled light and temperature during the spring bloom at the NIOZ sampling jetty. In addition to phytoplankton biomass (chla), phytoplankton physiological indices were also measured (maximum quantum efficiency of photosystem II and alkaline phosphatase activity).
In chapter 4, the influence of phosphate limitation on phytoplankton natural assemblages was examined at three locations in the Marsdiep basin from mid-spring to early autumn. The effect of phosphate supply in phytoplankton community was measured by a change in C-fixation using 13C stable isotope incorporation into PLFA. .
In chapter 5, it was tested whether MPB was suspended into the water column. To answer this hypothesis, the benthic and pelagic primary producers were described and primary production was estimated at different sampling seasons across three pelagic stations and two benthic stations by comparing two methods: a molecular fingerprint, denaturing gradient gel electrophoresis (DGGE) and a chemotaxonomic biomarker, PLFA. In addition, MPB primary production was estimated.
In chapter 6, a two dimensional analysis using imaging Pulse Amplitude Modulated (PAM) fluorescence was developed to study photosynthetic activity and vertical migration of MPB in muddy and sandy sediments.
Finally, in chapter 7, a synthesis of the results obtained this thesis is presented. It shows that the limiting nutrients have an impact on phytoplankton community composition and the consequences of these changes for consumers in the Wadden Sea ecosystem. In conclusion, the implications of the results are explained in the light of the data obtained from the long-term monitoring studies at the NIOZ sampling jetty.

13
CHAPTER 2
Spatio-temporal variation in phytoplankton biomass
and community structure within a riverine tidal basin
Juliette Ly1, Catharina J.M. Philippart2, Jacco C. Kromkamp1
In preparation
1 Department of Marine Microbiology, Royal Netherlands Institute for Sea Research, P.O. Box 140, 4400 AC Yerseke, The Netherlands 2 Department of Marine Ecology, Royal Netherlands Institute for Sea Research, P.O. Box 59, 1790 AB Den Burg, The Netherlands
14
Abstract
In many coastal ecosystems, long-term monitoring of phytoplankton biomass and community is often restricted to a limited number of sampling stations. To extrapolate local findings to a larger area, spatial and temporal dynamics of the phytoplankton community should be known. Spatio-temporal variation in phytoplankton dynamics is expected to be particularly high in temperate coastal seas which are under the influence of riverine inputs. In this study, we tested this hypothesis by carrying out measurements during four sampling periods (February, March, May and September in 2010) covering different parts of the phytoplankton seasonal cycle across four locations (S2, S5, S11 and S17) in the western part of the Dutch Wadden Sea. PLFA composition and 13C-labeling in PLFA patterns were used to investigate both spatial and temporal distribution of the phytoplankton community in the Marsdiep basin. In conjunction with 13C-PLFA labeling, several parameters were measured such as chlorophyll-a (proxy for phytoplankton biomass), phytoplankton taxonomic composition of the dominant species, and the 13C-labeling in particulate organic carbon. Changes in the phytoplankton composition and abiotic factors at the different stations were not significantly different between high and low tide. Overall, the temporal and spatial differences in phytoplankton communities in the Marsdiep basin were largely determined by freshwater discharge from Lake IJsselmeer. Episodic freshwater discharges occurred during two sampling periods: February and September. This was especially pronounced during the September cruise, when we observed a contribution of Chlorophyceae and cyanobacteria in the phytoplankton taxonomic distribution (CHEMTAX analysis) at low salinity (salinity values ranged from 10 to 23‰). Our findings suggest that the Marsdiep tidal basin can be regarded as a more or less homogeneous mixed system if the riverine/freshwater from Lake IJsselmeer inputs are low. This implies that the long-term field observations near the tidal inlet is representative for a large part of the Marsdiep basin.

15
Introduction
Long-term surveys of nutrient concentrations and phytoplankton communities have been useful in understanding human impacts and ecological changes in ecosystems. Long-term monitoring data can detect changes as a result of management policy in a disturbed aquatic ecosystem going from eutrophic to less eutrophic conditions (van Beusekom, 2005; Schindler, 2006; Smith et al., 2006). During the last decades, the Wadden Sea has undergone changes from a eutrophic state, caused by high load of nutrients, to a more mesotrophic condition. As a result of policy measures to remediate eutrophication, the decrease in nutrient loads was more successful for phosphorus (P) than for nitrogen (N), causing an increase in the N:P ratio of the dissolved inorganic nutrients (Philippart et al., 2007). Whether de-eutrophication will follow the reverse course of the eutrophication with regard to ecosystem characteristics such as phytoplankton biomass and species composition is uncertain. This is even unlikely when alternative stable states exist (Scheffer et al., 2001; Scheffer and van Nes, 2004), or when other environmental conditions have irreversibly changed (Philippart and Epping, 2010).
Several studies used long-term monitoring data to investigate the responses of the Wadden Sea biota to changes in phytoplankton biomass in association with changes in nutrient loadings (Cadée and Hegeman, 2002; Philippart et al., 2007). In the Marsdiep tidal basin of the western Dutch Wadden Sea, a phytoplankton monitoring survey started in the early 1970s and the data obtained from the NIOZ sampling jetty are used to distinguish between changes in the phytoplankton composition originating from natural oscillations and human induced processes (Loebl et al., 2009; Philippart et al., 2010). Although the long-term series showed large inter-annual variability, no trends in the timing of the phytoplankton spring bloom were observed during the period 1974-2007 (Philippart et al., 2010). However, the intensity of the spring bloom showed an increase until the early 1990s followed by a decrease hereafter, and the magnitude of the autumn bloom showed a consistent declining trend throughout the study period from the long-term series.
The NIOZ sampling jetty is located close to the Texel inlet, and samples were always taken at high tide and therefore it cannot be excluded that the data reflect at least partially conditions from the adjacent North Sea (Postma, 1981). This might obscure long-term changes occurring in the Marsdiep basin. Other sources of input are coming from freshwater systems (rivers, Lake IJsselmeer, and rainfall). Water mass balance models used by van Raaphorst and de Jonge (2004) suggest that an increase of discharge from Lake IJsselmeer into the western Dutch Wadden Sea can counteract the ongoing de-eutrophication measured at the NIOZ sampling jetty. However, annually averaged suspended organic matter (SPM) concentrations, as obtained from continuous ADCP measurements on the TESO ferry crossing the Marsdiep inlet, showed a significant relationship with annual turbidity indices as determined from measurements at the NIOZ sampling jetty during high tide, suggesting that conditions at the NIOZ sampling jetty during high tide data reflect environmental conditions in the Marsdiep tidal inlet (Philippart et al., 2012). The primary objective of this study was to investigate spatio-temporal distribution of

16
phytoplankton community under influence of episodic freshwater discharge in the Marsdiep basin. In order to do this we quantified and identified in situ changes of phytoplankton biomass and activity in different phases of the phytoplankton growth season, at different locations and during high and low tide. We also describe the abiotic mechanisms contributing to these temporal and spatial patterns of the phytoplankton community.
Material and methods
Sampling stations in the Marsdiep tidal basin
From 1974 onwards, water samples have been collected with a bucket from the NIOZ sampling jetty, located in the Marsdiep tidal inlet between the North Sea and the Wadden Sea (53°00’06” N, 4°47’21” E; Fig. 1). Sampling was always performed at high tide (±10 minutes) as predicted for Den Helder (http://live.getij.nl) to limit the variation in parameter values as the result of tidal currents. In 2010, the sampling frequency at the NIOZ sampling jetty was 40 times per year, varying from once or twice a month in winter and up to twice a week during spring bloom of phytoplankton in April and May. The accessibility of the NIOZ sampling jetty, the low frequency and handling of the sampling, and the basic analysis techniques were the prerequisites for the long-term monitoring of this station for almost 40 years (Philippart et al., 2010).
In 2010, four additional stations in the western Dutch Wadden Sea (Fig. 1) were sampled during four characteristic periods in the phytoplankton seasonal cycle with the R/V Navicula. These periods were chosen based on the long-term series of phytoplankton biomass observed at the NIOZ sampling jetty (Philippart et al., 2010). Station 2 (S2) was located close to the NIOZ sampling jetty at the junction where the main inlet of the Marsdiep tidal basin is divided into two major branches, i.e. the “Malzwin” which extends to the westernmost freshwater input and the “Vliestroom” which extends to the easternmost freshwater input from Lake IJsselmeer. Station 5 (S5) is located almost at the end of Malzwin close to the freshwater input, whilst station 11 (S11) is situated halfway Vliestroom. Station 17 (S17) is located at the entrance of a third, but much smaller, branch which drains the Balgzand, one of the major tidal flat areas in the Marsdiep tidal basin. For each station, samples were taken during high water (HW) and low water (LW). The February cruise (Nav3, 15th to 19th) was timed to the initial development of the phytoplankton bloom during spring, the March cruise (Nav4, 22de to 26th) was intended to coincide with the main development phase of the spring bloom of phytoplankton, whereas the May cruise (Nav5, 3rd to 7th) was supposed to take place at the maximum of the phytoplankton bloom and the minimum in nutrient availability. The September cruise (Nav6, 6th to 10th) was supposed to coincide with the autumn phytoplankton bloom following the nutrient regeneration period (Brinkman, 2008). At all stations and during all sampling periods, temperature and salinity data were obtained from a standard CTD cast (Seabird SBE9). For each additional station and each sampling period, the sampling took place during local high tide and low tide.

17
13C stable isotope labeling experiments
Water samples were collected with a Niskin bottle at 0.5 m below the water surface. Water samples were divided into six polycarbonate bottles of 2.5 L each. The bottles were incubated under artificial fluorescent light of 100 μmol photons m-2 s-1 during two hours after injection of NaH13CO3 (4% of the ambient dissolved inorganic carbon). Dissolved inorganic carbon averaged at 2.2 ± 0.06 mmol L-1 during the four periods investigated (E. Epping, pers. communication). Before and after each incubation, samples were filtered separately onto pre-combusted 47 mm Whatman GF/F filters for PLFA and POC analysis. Stable isotope data are expressed in the delta notation (δ13C) relative to carbon isotope ratio (R = 13C/12C) of Vienna Pee Dee Belemnite (R VPDB= 0.0111797): δ13C = [(Rsample / RVPDB -1) × 1000]. The 13C fraction in PLFA was calculated as 13C / (13C + 12C) = R/ (R+1). The 13C-incorporation for each PLFA (nmol C L-1) was calculated from the difference of the 13C fraction in PLFA at the start and at the end of the incubation, multiplied by the concentration of the individual PLFA at the start of the incubation (Dijkman et al., 2009).
Phospholipid fatty acid extraction
Lipids were extracted in a mixture of chloroform:methanol:water (1:2:0.8, v:v:v), using a modified Bligh and Dyer method (1959) (Middelburg et al., 2000). The extract was evaporated in a rotation vacuum evaporator for at least two hours at 190 rpm (Rapid Vap®, Labconco Corp., Kansas City, MO, USA). The formation of an aqueous-organic two layers phase separation was induced by the addition of chloroform and water at a ratio of chloroform:methanol:water (1:1:0.9, v:v:v). The lower phase of chloroform containing the total lipid extract was collected. After evaporation of the solvent, the total lipid extract was fractionated into different polarity classes on a silica column (0.5 g Kieselgel 60; Merck) and eluted sequentially with chloroform:acetone:methanol (1:1:2, v:v:v). The methanol fraction containing the PLFA was collected. After evaporation of the methanol, a mixture of methanol:toluene was added (1:1, v:v) and the fatty acids were converted to methyl ester derivatives of the fatty acid (FAME) using mild alkaline methanolysis (1 mL of 0.2 mol L-1 of sodium methylate). In order to stop the methylation reaction, a mixture of hexane:acid acetic:milliQ (1:0.3:1, v:v:v) was added and the upper hexane containing layer was collected. In addition, 20 μL of each internal standard (19:0 and 12:0, both 0.1 mg) was added during the synthesis of the derivatives. The carbon isotopic composition of each individual FAME was determined by GC-C-IRMS, using a Varian 3400 gas chromatograph equipped with a Varian SPI injector that was coupled via a type II combustion interface to a Finnigan Delta S isotope ratio mass spectrometer (Middelburg et al., 2000). The FAMEs were determined according to their retention times compared to a reference standard. Concentrations were calculated from the peak areas using PLFA standards of known concentration.
PLFAs are classified according to the presence/absence and number of double bonds. The PLFA nomenclature used in this study follows the pattern of X:Yω-Z. The ‘‘X’’ position identifies the total number of carbon atoms in the fatty acid. Position ‘‘Y’’ is the number of

18
double bonds and ‘‘Z’’ designates the carbon atom from the aliphatic end before the double bond. This is followed by a ‘‘c’’ for cis or a ‘‘t’’ for trans configuration of monoenoics. The prefixes ‘‘i’’ and ‘‘a’’ stand for “iso” and “anteiso”, respectively, and these PLFA are branched fatty acid (BrFA). If one double bond is present, PLFA is a mono-unsaturated fatty acid (MUFA) and when ≥ 2 double bonds are present, the PLFA is a poly-unsaturated fatty acid (PUFA). If no double bond is present, the PLFA is a saturated fatty acid (SFA).
CHEMTAX analysis
The contribution of phytoplankton classes to the whole community was based on the PLFA composition, which was analyzed using CHEMTAX software (Mackey et al., 1996). According to the microscopic analysis, five phytoplankton classes (Chlorophyceae, Bacillariophyceae, Cryptophyceae, Prymnesiophyceae and cyanobacteria) were present and included in the CHEMTAX initial input ratio file. The initial PLFA ratio matrix of Dijkman and Kromkamp (2006) was modified by including cyanobacteria (supplementary Table 1).
Chlorophyll-a
Samples for chlorophyll-a (Chla) determination were collected onto GF/F Whatman filters. Pigments were extracted with 10 mL of a mixture of 90 mL acetone and 10 mL water using a CO2-gas cooled bead-beater. After extraction and centrifugation (3 min, 1500 rpm) to clear the solution, pigments were separated on a C18 column using reversed phase chromatography. The pigments were detected by a photodiode array and fluorescence detector on a HPLC system (Dionex LC-02). Pigments were identified by their retention time and absorption spectra as given in the literature (Jeffrey et al., 1997).
Suspended particulate matter
SPM was obtained from the water column by filtering 0.5 to 1 L onto pre-combusted GF/F filters (47 mm diameter, Whatman). Samples were analyzed for δ13C using a Carlo Erba Elemental Analyzer coupled inline to a Finnigan Delta S isotope ratio mass spectrometer (EA-IRMS) (Middelburg et al., 2000).
Nutrient concentrations
To determine nutrient concentrations, 125 mL of seawater was collected using a Niskin bottle, filtered through a 0.2 μm Supor Membrane (Acrodisc Pall) and stored in HDPE bottle (Nalgene) at -80oC until analysis. Nutrient concentrations were analyzed with a segmented continuous flow analyzer (TRAACS 800 autoanalyzer, Bran and Luebbe) according to the manufacturers instruction. Total dissolved nitrogen (TDN) and dissolved inorganic nitrogen (DIN) (sum of nitrate (NO3
-), nitrite (NO2-) (= NOx) and ammonium NH4
+), total dissolved phosphorus (TDP), soluble reactive phosphorus (SRP) and silicate (Si) were measured.

19
Statistical analysis
Abiotic parameters and individual PLFAs (concentrations and C-incorporation rates) were used as input data in principal component analysis (PCA). PCA was conducted using the software PRIMER 6 (Clarke and Gorley, 2006). A PCA was used to describe the variation in the data set and determine which variables could be used to explain differences in the data between stations and seasons. The PCA has multidimensional scales, but only two axes with highest explanatory variance were chosen to display the data. The sample scores extracted from principal components one and two were compared among sampling periods and locations using a one-way analysis of variance. The factor loading scores for each abiotic parameter or individual PLFA (mole percent) were used to assess importance of each parameter in the principal component axes. A two-way analysis of variance (two-way ANOVA) was performed on concentrations (total PLFA and POC) and on ratios (PLFA/POC and ΣC16/ΣC18) in order to assess the difference between seasons and among stations. A significance level of p< 0.05 was applied.
Results
NIOZ sampling jetty station
In 2010, regular monitoring at the NIOZ sampling jetty location showed that Chla concentrations during the spring bloom reached highest values during spring in March (17 μg L-
1) and in May (22 μg L-1) with an intermittent dip in April (9 μg L-1) (Fig. 2). From July to October, Chla concentrations were constant with an average of 7.2 ± 0.4 μg L-1. As expected, lowest values were observed in winter. Secchi depth varied from 1 to 1.2 m between February and June, reached a maximum value of 2.5 m in July and decreased again to 1.2 m in December. The molar ratio of Si:SRP based on dissolved inorganic nutrient concentrations showed high values in February-March (38-44), and dropped to ~10 from April to August, thereafter, values increased to ~20. Hence, between April and August the molar ratio of Si:SRP was close to the optimum of 16, suggesting that diatoms might experience either a P or Si-limitation, dependent on their minimal nutrient requirements (Ly et al., submitted; chapter 3). DIN concentrations ranged from 3.2 to 60.8 μmol L-1. Molar DIN:SRP ratio showed one major peak in April (DIN:SRP = 648, data not shown).
Abiotic factors at other sampling stations
An overview of the physicochemical data for each sampling period obtained during the cruises is summarized in Table 1. There was no significant difference between high and low water (one-way ANOVA, Table 2). Therefore, the tide effect (HW and LW) was excluded from further analysis and only HW data were used. For each parameter measured, station average values and their ranges were shown for the four periods. As expected, the coldest and warmest months sampled were February (0.8 °C) and September (15.5 °C), respectively. Salinity fluctuated from 10-28‰, with highest variability in February and September. Water transparency

20
measurements showed that highest Secchi disk depth was reached (1.1 m) and values were similar to those observed in March at the NIOZ sampling jetty. Lowest Secchi disk depth was found in September. SPM concentrations gradually increased from low values in February (129 mg L-1) to high values in September (405 mg L-1). DIN varied from 74.2 μmol L-1 in February to 9.1 μmol L-1 in September. SRP concentrations were below 0.7 μmol L-1, reaching the lowest values in March (0.02-0.04 μmol L-1). Between February and March, Si dropped from 36.7 to 1.1 μmol L-1. Subsequently, the molar Si:SRP ratio decreased from 56 (February) to 11 (May). Molar Si:SRP ratios were high in September, maximum ratio was ~131 at S5. Molar DIN:SRP ratios varied from 1737 in March and 67 in September, and hence, exceeded by far the Redfield C:N ratio of 16 during the samplings.
A PCA was conducted with 11 physicochemical parameters over four sampling periods across four locations (Fig. 3). Because no significant tidal effects were found, we only analyzed HW data with respect to spatial and temporal variation in abiotic factors (one-way ANOVA, Table 2). Because of the large differences in the absolute values of the abiotic factor values, we normalized each parameter to their maximum values. The variance explained by PC1 and PC2 was 85.6%, which indicates that co-variability between physicochemical parameters was high. The explained variance was higher than the minimum value of the variance explained by the first two PCs in the event all parameters were uncorrelated (i.e. 2/11 ~ 18%). Two-way ANOVA analysis on PC1 and PC2 scores showed significant differences between sampling periods and across locations (two-way ANOVA, Table 3). PC1 showed a temporal pattern by separating February from the other sampling periods (March, May and September) whereas PC2 reflected spatial pattern, with significant differences on PC score values separating S5 from the other stations in each sampling period. For each sampling period, S5 (close to the Afsluitdijk of Lake IJsselmeer) showed the highest concentrations of DIN, DON, TN and Si and the lowest salinity values. Four vectors showed a Pearson correlation >0.5, temperature and SRP showed highest scores and negative correlation along PC1 while DON and salinity largely contributed to the spatial distribution along PC2. DIN, TP and TN were also most strongly associated with PC1, although the significance differences of DIN, TP and TN were weaker than for SRP and temperature.
PLFA/POC ratios
C-incorporation rates were estimated using two approaches: (i) as the rate of C-incorporation rates into POC (bulk measurement) and (ii) as the rate of C-incorporation into PLFA. Because POC included algal biomass as well as non-living particles, we calculated the ratio of PLFA/POC concentrations in order to have an estimation of the living biomass after conversion of PLFA into PLFA-C using a conversion factor of 0.046 g PLFA-carbon per carbon biomass (Van den Meersche et al., 2004). The ratio of PLFA/POC-concentration was depicted for each station and season (Fig. 4A) and the ratio of PLFA/POC C-incorporation rate are shown in (Fig. 4B). Both concentrations and C-incorporation rates into POC and PLFA varied significantly different among stations and between seasons (two-way ANOVA, p<0.05). Overall, the ratios of PLFA/POC concentration were below 0.5, implying a large contribution of non-algal C (varying

21
from 20-90%). In February, the ratios of PLFA/POC concentration fluctuated from 0.2-0.6; the highest values were found at S17. In March, the ratios of PLFA/POC concentration reached low values of ~0.2 at all stations. This was because POC concentrations increased while PLFA concentrations remained more or less constant. The ratios of PLFA/POC concentration in May were higher than in March suggesting that the most of the POC originated from living phytoplankton. In September, ratios of PLFA/POC concentration dropped, due to an increase in POC concentrations associated with a decrease in PLFA concentrations. The POC and PLFA concentrations were highly variable between stations. The POC concentrations were highest at S5.
Generally, the ratios of PLFA/POC C-incorporation rate showed similar trends as the ratios of PLFA/POC concentration (Fig. 4B). The ratios of PLFA/POC C-incorporation rate were higher in March and September than the ratios of PLFA/POC concentration. In February, C-incorporation rates into POC and PLFA were the lowest and ratios of PLFA/POC C-incorporation rate were more or less constant during this sampling period. In September, ratios of PLFA/POC based on concentration and on C-incorporation rate showed a similar trend. S5 showed the highest ratio of PLFA/POC C-incorporation rate at each sampling period, but S17 had the highest PLFA/POC ratios based on C-incorporation rate, indicating a higher contribution of PLFA in the POC pool compared to others stations.
Phytoplankton species composition
The most dominant (in abundance) identified phytoplankton taxa are shown in Table 4 (Philippart et al., in prep). In February, microscopic observations showed that the Cryptophyceae Rhodomonas sp. dominated at S5, S11 and S17. With the exception of S11, flagellates were the dominant organisms at all stations. The group “flagellates” contained all cells with a flagellum that could not be taxonomically identified. They might belong either to Prymnesiophyceae, Chlorophyceae or Chrysophyceae. Flagellates can be found as coloured (with chloroplasts) or colourless (without chloroplasts) cells. At S2 and S5, freshwater cyanobacteria were the most dominant taxonomic group. At S11, also chlorophyta were found, which represent another freshwater taxonomic group. In March, dominant centric diatoms belonging to Thalassiosiraceae co-existed with Prasionophyceae and flagellates. Cryptophyceae were not found in March. In May, Thalassiosiraceae were the dominant taxonomic group and the Prymnesiophyceae Emiliana huxleyi was also found at S2 and S11. At S2, the Cryptophyceae Hemiselmis sp. was the most dominant species. Freshwater cyanobacteria were dominant at S5. During May, most of the flagellates were coloured. In September, most of the dominant taxonomic classes belonged to the cyanobacteria. The phytoplankton community included flagellates at S2 and Prasinophyceae at S11.
PLFA groups
The PLFA composition differed markedly among stations and between seasons. The contribution of SFA to the total PLFA was the lowest in February and these values more or less constant between March and September (Fig. 5A). The PLFA 16:0 was the major SFA group and
22
contributed between 10% to 21% to the total PLFA pool. This PLFA is one of the most ubiquitous FA found in phytoplankton. Other ubiquitous SFA such as 14:0, 18:0 and 20:0 were also found and contributed importantly (up to 18%) to total PLFA. Unlike SFA, no particular trend was observed in MUFA, which values ranged between 25-42%. The general PLFA 16:1ω7 showed the largest contribution up to 19%, followed by 18:1ω7 (up to 8%) and 18:1ω9 (up to 4.5%) (Supplementary Table 2). The PUFA represented a major group among the PLFA. Their contribution was highest in February reaching values of up to 47% at S5 and 27% at S11, S2 and S17. From February to March, the contribution of PUFA to the total PLFA pool dropped up to 3-fold. The percentage of BrFA did not vary much and contributed less than 10% of the total PLFA. In February, the contribution of BrFA reached the lowest values.
The percentage of C-incorporation rates was expressed as the relative C-incorporation rate into different PLFA groups (Fig. 5B). Overall, the pattern of C-incorporation into PLFA reflected the relative abundance of different PLFA fractions. During the two hours of incubation, BrFA C-incorporation as a percentage of total PLFA was low (<1%) during all sampling periods. From February to September, the rate of C-incorporation into the different PLFA groups was higher than expected if the concentration would reflect the activity. However, the percentage of C-incorporation into SFA groups in February, March, May, and September were lower than the percentage of SFA concentrations in March, May, and September. The contribution of C-incorporation into MUFA groups was lower based on the MUFA concentration. On the opposite, C-incorporation into PUFA showed higher percentages in total PLFA than the PUFA concentration.
ΣC16/ΣC18 ratios
PLFA characteristics for Bacillariophyceae are 16:1ω7, 16:4ω1, 20:5ω3 and dinoflagellates and Cryptophyceae are rich in 18:4ω3 (Dalsgaard et al., 2003; Kelly and Scheibling, 2012). Because PLFA in Bacillariophyceae are enriched in C16 PUFA (Kattner et al., 1983; Shin et al., 2000), we evaluated the relative contribution of Bacillariophyceae to the whole phytoplankton community by using the ratio ΣC16/ΣC18 (Fig. 6). Values >2 indicate a phytoplankton community dominated by Bacillariophyceae (Alfaro et al., 2006; Kelly and Scheibling, 2012). Values of ~2 coincided with a Bacillariophyceae bloom in March. In February, the ratio ΣC16/ΣC18 based on concentrations was <0.5 for all stations (Fig. 6A). These low values coincided with a quite diverse phytoplankton community (Table 4, Fig. 9). However, ΣC16/ΣC18 ratios based on concentrations were between 1 and 2 in March. Because Bacillariophyceae were the main contributor to the phytoplankton community at that time (Table 4, Fig. 9), a threshold of a ΣC16/ΣC18 ratio close to 1 might be more appropriate to indicate the dominance of this group in the system studied here. The ΣC16/ΣC18 ratio based on C-incorporation rates showed a more dynamic pattern with both lower (S2, S17 and S11 in February) and higher values (S2, S5, S17 in March) than those based on the PLFA concentrations (Fig. 6B). In March, the ΣC16/ΣC18 ratio based on concentration was >1, indicating that Bacillariophyceae were the most abundant group, confirming the microscopic observations. Interestingly, the ΣC16/ΣC18 ratio based on C-labeling was ~4 in March,

23
indicating that the Bacillariophyceae were more active than was expected on the basis of their abundance. However, S11 did not follow this pattern as ΣC16/ΣC18 ratios obtained from C-incorporation rate were low. In May, ΣC16/ΣC18 ratios based on concentration were similar to the ΣC16/ΣC18 ratios based on C-incorporation rate. With the exception of S11, a high ratio of ΣC16/ΣC18 concentrations was observed, demonstrating the Bacillariophyceae at this station was the most abundant and active group. In September, the ratios of ΣC16/ΣC18 C-incorporation rate were 1-2-fold higher than the ratios of ΣC16/ΣC18 concentration, with the exception of S5.
PCA revealed the spatial and temporal differences in the PLFA (concentration and C-incorporation rate) reflected the phytoplankton community composition (Fig. 7). A PCA analysis was carried out that included the tide but there was no difference in the scores between high and low tide (one-way ANOVA, Table 2). The two first principal components, PC1 and PC2 accounted for 71.4% (= 50.2% + 21.2%) of the variance in the dataset which indicates that the spatio-temporal co-variability in PLFA was high. The explained variance was much higher than the minimum value of the variance explained by the first two PCs in the event all PLFAs were uncorrelated (i.e. 2/16 ~13%). ANOVA analysis on PC1 scores showed significant differences between sampling periods and among stations (two-way ANOVA, Table 3). PC1 showed that PLFA composition separated winter (February, positive scores) from the other sampling periods (negative scores). February samples had positive scores for 18:4ω3, 22:6ω3, 20:5ω3 whereas the other periods were characterized by negative scores for 16:1ω7, 16:0, 14:0, 20:0. In general, the PUFA 18:4ω3 and 22:6ω3 are found in Cryptophyceae and dinoflagellates. As a consequence of changes in the phytoplankton community composition between February and March, the largest change was observed in the 18:4ω3 which had disappeared completely in March. Eicosapentaenoic acid (EPA, 20:5ω3), a long chain PUFA, which is absent in Chlorophyceae and cyanobacteria, but abundant in Bacillariophyceae, contributed importantly to the total PLFA (Supplementary Table 2). The ANOVA of PC2 scores on the PLFA dataset did not reveal a significant effect of the stations, but seasons and the interaction between seasons and stations were significantly different (two-way ANOVA, Table 3). This was due to the large scatter of the locations along the PC2 axis in September and to a lesser extent in March. In May, all stations had weak positive scores along PC2. The only PLFA with a high score along PC2 was 20:5ω3 but this did not correlate with a particular station. However, these results show that spatial differences during some seasons (e.g. September) were more pronounced than during other seasons (e.g. May).
A final PCA analysis was performed with C-incorporation into PLFA (Fig. 8). The two axes explained 75.9% of the variance in the data. The analysis showed a distinctive seasonal distribution by separating between February and other periods in PC1, whereas spatial distribution had a negligible influence on the ordination in PC2 (two-way ANOVA, Table 3). On PC1, February stations S2, S5 and S11 had positive scores but S17 showed a negative score. This was due to the fact that PUFA were not as highly labeled as at the other stations (Fig. 5B, supplementary Table 2). Thus, 18:4ω3 characterized the PLFA composition of these three stations in February, while PLFAs 16:0, 16:1ω7 and 20:0 were important variables in PLFA

24
composition in March, May and September. The first two PLFAs seemed to be linked and had a large negative score, whereas 20:0 had a positive score, suggesting spatial separation of the phytoplankton groups possessing these PLFAs.
CHEMTAX analysis as an estimation of phytoplankton composition
The PLFA output ratio resulting from the fitting procedure of the CHEMTAX program are shown in Fig. 9. The results of the CHEMTAX analysis showed differences in the phytoplankton community, among stations and between seasons. In February, the number of taxa in the phytoplankton community was highest. Bacillariophyceae, Cryptophyceae, and flagellates were the major phytoplankton taxonomic classes. Bacillariophyceae represented up to 40% of the total phytoplankton community at S2, 26% at S5 and 36% at S11 whilst S17 showed less than 20% contribution of Bacillariophyceae. Cryptophyceae varied between 10% to 50% of the total phytoplankton community, whilst the lowest Cryptophyceae abundance was found at S17 (10%), the highest at S5 (50%) and intermediate abundance at S2 (16%) and S11 (22%). Prymnesiophyceae contributed to more than 50% at S17, 35% at S2 and 13-15% at S5-S11. Chlorophyceae were a minor phytoplankton group and contributed less than 10% of the total. Cyanobacteria were also a minor group which contributed to 0.7-16% of the total phytoplankton community. In March, the phytoplankton assemblage was less diverse. Bacillariophyceae became the major dominant taxonomic class dominated mainly by the centric diatom genus Thalassiosira sp. The contribution of Bacillariophyceae to the total phytoplankton community exceeded 85%. Chlorophyceae abundance decreased to values <15% in March. Prymnesiophyceae were a minor group and cyanobacteria were almost absent. The Cryptophyceae disappeared after February. In May, the contribution of Prymnesiophyceae, most likely Emiliana huxleyi, increased up to 40% at S2 and S11, and 20% at S17 and S5, thus showing considerable spatial differences in the relative phytoplankton abundance. Another Prymnesiophyceae were also encountered during the period, i.e. Phaeocystis globosa (Philippart et al., in preparation). Bacillariophyceae remained the dominant taxonomic class representing 52% to 73% of the total phytoplankton community. Chlorophyceae presence increased slightly (<10%) to levels found in February. Cyanobacteria were detected at a low percentage 4-6% at S17-S2. In September, despite the fact that Bacillariophyceae remained dominant, the CHEMTAX analysis showed that the relative abundance of Chlorophyceae increased reaching the highest contribution, up to 45%, at S5. The contribution of cyanobacteria was more than 30% at S2-S5 and S17 in September. However, cyanobacteria were not detected at S11. The increase in Chlorophyceae and cyanobacteria was reflected in the decrease of Prymnesiophyceae ( <6%).

25
Discussion
The monitoring program using the NIOZ sampling jetty located at the western edge of the Marsdiep tidal basin aims at understanding the changes in coastal phytoplankton abundance and primary production as a result of climate change and water management strategies (Cadée and Hegeman, 2002; Philippart et al., 2007). In order to validate the NIOZ sampling jetty data as being representative for the Marsdiep basin as a whole, it was necessary to investigate the spatial and temporal changes of phytoplankton community within this tidal basin. Our study focused on the influence of tide (high and low water) and spatial patterns on phytoplankton biomass, activity and taxonomic distribution in the Marsdiep basin. In order to catch the variability of the Marsdiep basin, the sampling locations were chosen strategically to target the different main currents within the Marsdiep basin and included a location near the Afsluitdijk of Lake IJsselmeer.
Influence of the tide in the Marsdiep basin
Analysis of the abiotic factors and the PLFA composition at high and low tide did not show significant differences throughout the Marsdiep tidal basin. As previously demonstrated by Philippart et al. (2012), the effect of tide did also not affect SPM concentrations and turbidity at the NIOZ sampling jetty.
Does the NIOZ sampling jetty catch the seasonal dynamic of phytoplankton biomass?
The high frequency of the sampling at the NIOZ sampling jetty (we averaged the weekly sampling into monthly averages (Cadée et al., 2002)) was compared to the incidental sampling during the Navicula cruises. A possible offset by a week in the bloom dynamics at other locations might explain some of the mismatch in timing between the NIOZ sampling jetty and the cruise data. The complex hydrology in the southern part of the Marsdiep basin around the tidal inlet can create high mixing in the area (Elias et al., 2006). Therefore, sampling may be influenced by small spatial patchiness due to a lower mixing at locations farther away from the Marsdiep inlet. In particular, a peak of phytoplankton biomass was observed in March (Nav3) at the NIOZ sampling jetty whereas other stations showed highest phytoplankton biomass in May (Nav5). At the end of the spring bloom in May, blooms at the other stations might just have terminated. From our previous study Ly et al. (submitted; chapter 3), the spring bloom coincided with periods from March to May when nutrient concentrations were lowest. SRP and Si reached low concentrations, especially in March due to the onset of the phytoplankton spring bloom.
However, phytoplankton biomass according to PLFA measurement was lowest in March and highest in May. Thus the Chla and PLFA indicators of phytoplankton biomass did not agree. A study by Kruskopf and Flynn (2005) showed that Chla is a poor indicator of C-biomass. This discrepancy between Chla and total PLFA concentrations can be explained by changes in the cellular Chla content, which might have been higher in March than in May due to the shorter day lengths which would require a higher light harvesting capacity (Falkowski and Raven, 1997). In

26
addition, in May, the phytoplankton had been exposed to nutrient limitation for at least several weeks, and this might also have decreased the cellular Chla-content. P limitation might cause a replacement of PLFAs by non-phosphorus-containing membrane lipids (van Mooy et al 2009). Hence, both measurements of phytoplankton biomass have their limitations and should be interpreted with care. The fourth sampling period in September corresponded to the beginning of autumn when DIN was lowest but still exceeded 9 μmol L-1, and therefore it was unlikely that N-limited phytoplankton growth.
Changes observed in phytoplankton distribution during the Navicula cruises could also be associated with spatial differences in the Marsdiep basin induced by local and episodic freshwater discharge events from Lake IJsselmeer through the locks in the closing dike (Afsluitdijk), the dam separating it from the Marsdiep basin. However, we did not find a linear relationship or conservative behavior of nutrients, or SPM and salinity during freshwater discharges (data not shown) (Doering et al. 1995). During February (Nav3) and September (Nav6), two major freshwater discharge events from Lake IJsselmeer occurred, lowering the salinity at all stations (Table 1), especially at the station close to the Afsluitdijk (S5) where the salinity was nearly 10‰ lower than at the other stations. This coincided with higher Chla concentrations at S5. A considerable fraction of the dominant phytoplankton species belonged to freshwater Chlorophyceae and cyanobacteria during the two sampling periods (see paragraph about CHEMTAX analysis).
The results of this study described how the common phytoplankton seasonal pattern is influenced by external abiotic factors (freshwater discharge or North Sea influence), which are not related to processes within the Marsdiep basin. Discharge loads from Lake IJsselmeer are influenced by water coming from river IJssel and rainfall, and the catchment of this river can thus be responsible for interannual variability in phytoplankton biomass as observed by the monitoring program at the NIOZ sampling jetty.
Does the NIOZ sampling jetty program give an accurate reflectance of the phytoplankton activity
and taxonomic distribution?
Data from the cruises show that spatial differences in biomass and taxonomic composition exist, but due to the low frequency of our sampling program it might be that the mis-match of the peak of the phytoplankton biomass was caused by the timing of the blooms at the different locations as described above. By investigating PLFA composition, we were able to assess the phytoplankton distribution and the shifts therein (individual PLFA and CHEMTAX analysis). Results from ΣC16/ΣC18 ratios and CHEMTAX analysis agreed about the dominant phytoplankton classes. When the ΣC16/ΣC18 ratio is >1, Bacillariophyceae are the dominant group in the phytoplankton community (Kattner et al., 1983; Shin et al., 2000; Dalsgaard et al., 2003; Alfaro et al., 2006). In February, the ΣC16/ΣC18 ratios across the stations were generally <1, indicating a minor contribution of Bacillariophyceae. CHEMTAX output showed that the phytoplankton community found in February was composed of Bacillariophyceae and several none siliceous phytoplankton taxonomic classes, i.e. Chlorophyceae, Cryptophyceae and

27
Prymnesiophyceae. Some stations also showed the presence of cyanobacteria. Despite the fact that winter is a period with low phytoplankton growth and biomass, the CHEMTAX output showed a higher number of the phytoplankton groups than in other sampling periods. In coastal areas, phytoplankton in the winter period is less abundant but more species possess diverse mechanisms for growth (Zingone et al., 2010). During the first phase of the spring bloom, the ΣC16/ΣC18 ratio was the highest and was indeed dominated by a Bacillariophyceae assemblage. In March, the spring bloom was initiated by Bacillariophyceae and followed in May by a mixed bloom of Prymnesiophyceae (Emiliana huxleyi) and coloured flagellates. Furthermore, during spring bloom often a nuisance bloom of the Prymnesiophyceae species Phaeocystis globosa was observed, but the bloom of this algae occurred between the March (Nav3) en May (Nav4) cruises (Ly et al., submitted; chapter 3). This succession is a recurrent phytoplankton pattern in the Wadden Sea and coastal North Sea (Peperzak et al., 1998; Rousseau et al., 2002; Breton et al., 2006; van Beusekom et al., 2009). In May, the ΣC16/ΣC18 ratio decreased due to an increase in C18-PLFA. The increase of C18-PUFA was attributed to flagellate groups (and/ or Prymnesiophyceae), and although S2 showed the lowest C-incorporation based on the ΣC16/ΣC18, these ratios were similar at the different stations. In September, the ΣC16/ΣC18 ratio remained low with the exception of S11. The high ΣC16/ΣC18 ratio at S11 in September indicated dominance of Bacillariophyceae but also of Prasinophyceae classes (Supplementary Table 2). The increase of Bacillariophyceae abundance at S11 in September (Fig. 6) may have resulted from runoff of suspended benthic diatoms since this site is close to the large Balgzand intertidal flat.
Overall the CHEMTAX analysis allowed a good estimation of the phytoplankton composition compared to microscopy (top three most dominant species). Both of these methods revealed phytoplankton community shifts between different sampling periods. However, despite the overall agreement between microscopy and CHEMTAX some differences were observed. In particular, CHEMTAX seems to be less sensitive to cyanobacteria. Microscopic observations at stations (S2-February; S5-February and S11-September) showed dominant cyanobacterial aggregates from freshwater discharge, but CHEMTAX did not detect them. CHEMTAX has difficulty to estimate the abundance of cyanobacteria because PLFA in cyanobacteria is composed of PLFAs (16:0 and 14:0) that are not specific for this group of organisms (Dijkman et al., 2010; Kelly and Scheibling, 2012). PLFAs are not sensitive to the nutrient and light status of organisms when compared to photosynthetic pigments. PLFAs are therefore a better proxy for phytoplankton biomass than pigments. It is not straightforward to compare CHEMTAX analysis with microscopical observations. CHEMTAX analysis is basically an analysis of biomass, whereas microscopy gives numbers of organisms or cells. Because no estimations of biovolume were made, it is likely that the numerical dominance of small species cells could lead to an underestimation of biomass.
Overall, the bulk composition of the different groups of PLFA showed coherent trends with previous seasonal field studies. When temperature increased, SFA increased and PUFA decreased (Brett and Muller-Navarra, 1997; Hamm and Rousseau, 2003). PUFA composition is

28
also influence by nutrients and salinity (Dalsgaard et al., 2003). PUFA composition has been suggested to influence the dietary value for higher trophic levels and affect the reproduction of zooplankton (Tiselius et al., 2012). PUFA types 18:4ω3 and 22:6ω3 were dominant in winter (see PCA analysis). PUFA are important for maintaining cell membrane fluidity at low temperature and are an important diet source for the development of consumers (Dalsgaard et al., 2003; Brett et al., 2009; Hauss et al., 2012). Later in spring, when nutrients become limiting, lower relative PUFA content was observed compared to February. A decrease of PUFA is associated with a lower food quality, and that may potentially limit the growth rate of consumers (von Elert, 2002; Breteler et al., 2005).
Conclusion
High tide sampling at the NIOZ sampling jetty station reflects the situation of the Wadden Sea and not of the adjacent North Sea. The common phytoplankton seasonal pattern as well as the taxonomic composition can be influenced by external abiotic factors not related to processes within the Marsdiep basin such as freshwater discharges. Such discharges can be responsible for the fluctuations observed in the long-term inter-annual phytoplankton dynamics at the NIOZ sampling jetty. The freshwater discharge includes freshwater phytoplankton species (observed at S5) and can extend across a large spatial scale (km2) in the entire Marsdiep basin. It is unclear whether the Marsdiep can be considered as a homogenous basin when such massive freshwater discharges occur.
Acknowledgments
The authors would like to thank the crew of the R/V Navicula for their assistance with the sampling and for the good food. We thank Annette Wielemaker for producing the Wadden Sea map. This project was funded by the Coast and Sea Program (ZKO) of the Netherlands Organization for Scientific Research (NWO) projects P-reduce (grant nº 839.08.340) and IN PLACE (grant nº 839.08.210).

29
Tab
les
1
Tab
le 1
. Ove
rvie
w o
f th
e C
hla
and
phys
icoc
hem
ical
par
amet
ers
at f
our
stat
ions
for
eac
h sa
mpl
ing
peri
od (
Febr
uary
, Mar
ch, M
ay a
nd S
epte
mbe
r in
2
2010
): te
mpe
ratu
re, s
alin
ity, S
ecch
i dis
k de
pth,
chl
orop
hyll
-a (
Chl
a), d
isso
lved
inor
gani
c ni
trog
en (
DIN
), to
tal d
isso
lved
nitr
ogen
(T
DN
), s
olub
le
3 re
activ
e ph
osph
orus
(SR
P), t
otal
dis
solv
ed p
hosp
horu
s (T
DP)
, sili
cate
(Si
), m
olar
rat
io o
f Si
:SR
P an
d D
IN:S
RP.
Abb
revi
atio
ns u
sed:
ave
rage
4
(avg
), m
in (
min
imum
), m
ax (
max
imum
). O
ne-w
ay a
naly
sis
of v
aria
nce
(AN
OV
A)
test
ing
the
effe
ct o
f tid
e (h
igh
and
low
tide
s) o
n C
hla
and
5 ab
iotic
par
amet
ers
(ns
= no
ne s
igni
fica
nt)
at d
iffe
rent
sam
plin
g pe
riod
. 6
Par
amet
ers
Feb
ruar
y
Mar
ch
May
Se
ptem
ber
avg
(min
; max
)
Tide
p
valu
e av
g (m
in; m
ax)
Ti
de
p va
lue
avg
(min
; max
)
Tide
p
valu
e av
g (m
in; m
ax)
Ti
de
p va
lue
Chl
a (μ
g L
-1)
10
(4; 2
4,5)
0.
23
25.1
(1
4.2;
52.
4)
0.80
10
.1
(7.6
; 14.
0)
0.78
19
.6
(8.8
; 43.
4)
0.08
Tem
pera
ture
(°C
) 0.
8 (-
0.14
; 1.5
7)
-
7.2
(5.9
9; 8
.98)
0.
13
10.9
(1
0.38
; 11.
45)
0.97
15
.5
(14.
51; 1
6.1)
0.
55
Salin
ity
23
(1
4; 2
7)
-
24
(21;
27)
0.
73
27
(25;
28)
0.
33
20
(10;
23)
0.
45
Secc
hi d
epth
(m
)
- -
-
1.1
(0.5
; 1.8
) -
0.
9 (0
.50;
1.4
) -
0.
7 (0
.40;
1.2
) -
SPM
(m
g L
-1)
129
(55;
218
)
0.89
17
4 (9
0; 2
78)
0.43
23
0 (1
32; 3
70)
0.88
40
5 (1
13; 7
93)
0.28
DIN
(μ
mol
L-1
) 74
.2
(53.
8; 1
19.5
) 0.
18
49.2
(3
7.8;
70)
0.
85
22.4
(1
2.4;
42.
3)
0.49
9.
1 (0
.91;
15.
1)
0.55
DO
N (μ
mol
L-1
) 14
.7
(7.9
; 29.
6 )
0.40
10
.7
(0.2
; 13.
7)
0.76
14
.1
(12.
5; 1
6.5)
0.
26
20.2
(2
7; 1
7.1)
0.
24
SRP
(μm
ol L
-1)
0.7
(0.5
8; 0
.75)
0.
60
0.03
(0
.02;
0.0
4)
0.84
0.
3 (0
.09;
0.7
8)
0.70
0.
2 (0
.05;
0.2
4)
0.58
DO
P (μ
mol
L-1
) 0.
2 (0
.28;
0.1
0)
0.42
0.
2 (0
.19;
0.2
4)
0.14
0.
3 (0
.24;
0.3
7)
0.87
0.
3 (0
.37;
0.2
9)
0.38
Si (μ
mol
L-1
) 36
.7
(25.
7; 6
1.9)
0.
19
1.1
(0.2
; 3.4
) 0.
83
3.7
(0.7
; 10.
8)
0.62
14
.9
(0.8
; 39.
7)
0.81
DIN
:SR
P
113
(75-
207)
0.
35
1737
(1
303;
231
8)
0.91
10
5 (5
4; 1
43)
0.
77
67
(19;
164
)
0.38
Si:S
RP
56
(3
6; 1
07)
0.34
30
(1
0; 7
7)
0.62
11
(8
; 14)
0.
43
131
(16;
426
) 0.
99

30
Table 2. Summary table of one-way analysis of variance (ANOVA) of the principal component 1 scores (scores 1) and principal component 2 scores (scores 2) with the tide (high water (HW) and low water (LW)) as fixed factors for each sampling period. In data sets: abiotic parameters, PLFA concentrations and PLFA C-incorporation. p values are shown (* p< 0.05 and ns: no significant).
p values
Months Scores 1 Scores 2
Abiotic
parameters
Feb 0.37 ns 0.63 ns
March 0.98 ns 0.98 ns
May 0.53 ns 0.75 ns
Sept 0.98 ns 0.18 ns
PLFA
concentrations
Feb 0.88 ns 0.25 ns
March 0.72 ns 0.43 ns
May 0.69 ns 0.81 ns
Sept 0.19 ns 0.33 ns
PLFA
C-
incorporation
Feb 0.50 ns 0.38 ns
March 0.97 ns 0.70 ns
May 0.18 ns 0.13 ns
Sept 0.52 ns 0.61 ns

31
Table 3. Summary table of two-way analysis of variance (ANOVA) of the relationship between principal component 1 scores (scores 1) and principal component 2 scores (scores 2) with stations, months and stations × months interaction as fixed factors for abiotic parameters, PLFA concentrations and PLFA C-incorporation. p values are shown (* p< 0.05, ** p< 0.01, p< 0.001, ns: not significant; no correction for multiple comparisons within one data set was applied)
p values
Factors Scores 1 Scores 2
Abiotic
parameters
station 2.2E-05 *** 1.7E-03 **
month 8.0E-09 *** 5.0E-14 ***
station × month 0.19 ns 0.15 ns
PLFA
concentrations
station 3.7E-05 *** 0.23 ns
month 8.8E-04 *** 7.2E-08 ***
station × month 5.1E-03 ** 1.5E-03 **
PLFA
C-incorporation
station 5.7E-03 ** 0.1132815 ns
month 2.7E-08 *** 8.7E-04 ***
station × month 0.091 ns 0.14 ns

32
Tab
le 4
. Thr
ee m
ost n
umer
ous
phyt
opla
nkto
n sp
ecie
s du
ring
fou
r sa
mpl
ing
peri
ods
(Feb
ruar
y, M
arch
, May
and
Sep
tem
ber
in 2
010)
at f
our
sam
plin
g st
atio
ns (
S2, S
5, S
11 a
nd S
17)
in th
e M
arsd
iep
tidal
bas
in (
Phili
ppar
t et a
l., in
pre
p.).
Seas
on
Stat
ion
Ran
k Sp
ecie
s na
me
Ori
gin
Cla
ss
cells
ml-1
F
ract
ion
Win
ter
(Fe
brua
ry)
2 #1
C
yano
bact
eria
(co
lony
cel
ls)
fres
hwat
er
Cya
noba
cter
ia
2886
35
%
#2
Sm
all c
olor
ed fl
agel
late
s (ap
prox
. 3 μ
m)
mar
ine
flag
ella
tes
1058
13
%
#3
Sm
all c
olor
less
flag
ella
tes (
< 6 μm
) m
arin
e fl
agel
late
s 10
58
13%
5
#1
Cya
noba
cter
ia (
colo
ny c
ells
) fr
eshw
ater
C
yano
bact
eria
48
10
27%
#2
Rho
dom
onas
spp
. m
arin
e C
yano
bact
eria
29
82
17%
#3
Smal
l col
ored
flag
ella
tes (
appr
ox. 3
μm
) m
arin
e fl
agel
late
s 22
13
13%
11
#1
Pras
inop
hyce
ae &
Pse
udoc
ourf
ield
ia s
pp.
(app
rox.
3μm
) m
arin
e Pr
asin
ophy
ceae
17
32
22%
#2
C
hlor
ophy
ta (
cells
& c
olon
ies)
fr
eshw
ater
C
hlor
ophy
ceae
17
32
22%
#3
Rho
dom
onas
spp
. m
arin
e C
rypt
ophy
ceae
10
58
13%
17
#1
Pras
inop
hyce
ae &
Pse
udoc
ourf
ield
ia s
pp.
(app
rox.
3μm
) m
arin
e Pr
asin
ophy
ceae
25
01
34%
#2
Sm
all c
olor
ed fl
agel
late
s (ap
prox
. 3 μ
m)
mar
ine
flag
ella
tes
1732
23
%
#3
R
hodo
mon
as s
pp.
mar
ine
Cry
ptop
hyce
ae
1539
21
%
Ear
l spr
ing
(M
arch
)
2 #1
T
hala
ssio
sira
ceae
(6-
10 μ
m)
mar
ine
Bac
illar
ioph
ycea
e 37
52
29%
#2
Smal
l col
orle
ss fl
agel
late
s (<
6 μm
) m
arin
e fl
agel
late
s 25
01
19%
#3
Pr
asin
ophy
ceae
& P
seud
ocou
rfie
ldia
spp
. (a
ppro
x. 3μm
) m
arin
e Pr
asin
ophy
ceae
21
16
16%
5 #1
T
hala
ssio
sira
ceae
(6-
10 μ
m)
mar
ine
Bac
illar
ioph
ycea
e 26
94
15%
#2
Pr
asin
ophy
ceae
& P
seud
ocou
rfie
ldia
spp
. (a
ppro
x. 3μm
) m
arin
e Pr
asin
ophy
ceae
25
97
15%
#3
T
hala
ssio
sira
ceae
(10-
30 μ
m)
mar
ine
Bac
illar
ioph
ycea
e 20
20
11%
11
#1
T
hala
ssio
sira
ceae
(6-
10 μ
m)
mar
ine
Bac
illar
ioph
ycea
e 26
94
42%
#2
Smal
l col
orle
ss fl
agel
late
s (<
6 μm
) m
arin
e fl
agel
late
s 14
43
22%
#3
Smal
l col
ored
flag
ella
tes (
appr
ox. 3
μm
) m
arin
e fl
agel
late
s 77
0 12
%
17
#1
Tha
lass
iosi
race
ae (
6-10
μm
) m
arin
e B
acill
ario
phyc
eae
4521
29
%
#2
Sm
all c
olor
less
flag
ella
tes (
< 6 μm
) m
arin
e fl
agel
late
s 24
05
16%
#3
Smal
l col
ored
flag
ella
tes (
appr
ox. 3
μm
) m
arin
e fl
agel
late
s 23
09
15%

33
Seas
on
Stat
ion
Ran
k Sp
ecie
s na
me
Ori
gin
Cla
ss
cells
ml-1
F
ract
ion
Lat
e sp
ring
(
May
)
2 #1
H
emis
elm
is s
pp. (
2-9μ
m)
mar
ine
Cry
ptop
hyce
ae
2694
14
%
#2
Sm
all c
olor
ed fl
agel
late
s (ap
prox
. 3 μ
m)
mar
ine
flag
ella
tes
2405
13
%
#3
E
mili
ania
hux
leyi
m
arin
e Pr
ymne
siop
hyce
ae
2116
11
%
5 #1
C
yano
bact
eria
(co
lony
cel
ls)
fres
hwat
er
Cya
noba
cter
ia
7696
37
%
#2
Sm
all c
olor
ed fl
agel
late
s (ap
prox
. 3 μ
m)
mar
ine
flag
ella
tes
2886
14
%
#3
T
hala
ssio
sira
ceae
(6-
10μm
) m
arin
e B
acill
ario
phyc
eae
1924
9%
11
#1
T
hala
ssio
sira
ceae
(6-
10μm
) m
arin
e B
acill
ario
phyc
eae
3078
20
%
#2
Sm
all c
olor
ed fl
agel
late
s (ap
prox
. 3 μ
m)
mar
ine
flag
ella
tes
3078
20
%
#3
E
mili
ania
hux
leyi
m
arin
e Pr
ymne
siop
hyce
ae
2020
13
%
17
#1
Smal
l col
ored
flag
ella
tes (
appr
ox. 3
μm
) m
arin
e fl
agel
late
s 27
90
15%
#2
Pse
udo-
nitz
schi
a de
licat
issi
ma
spp.
m
arin
e B
acill
ario
phyc
eae
2597
14
%
#3
T
hala
ssio
sira
ceae
(6-
10μm
) m
arin
e B
acill
ario
phyc
eae
2213
12
%
Aut
umn
(S
epte
mbe
r )
2 #1
C
yano
bact
eria
(co
lony
cel
ls)
fres
hwat
er
Cya
noba
cter
ia
4137
25
%
#2
C
hlor
ococ
cale
s (ap
prox
. 3μm
) m
arin
e C
hlor
ophy
ceae
18
28
11%
#3
Smal
l col
orle
ss fl
agel
late
s (<
6 μm
) m
arin
e fl
agel
late
s 17
32
10%
5
#1
Cya
noba
cter
ia (
colo
ny c
ells
) fr
eshw
ater
C
yano
bact
eria
34
6320
62
%
#2
M
eris
mop
edia
spp
. (co
lony
cel
ls)
fres
hwat
er
Cya
noba
cter
ia
6974
5 12
%
#3
M
icro
cyst
is s
pp. (
colo
ny c
ells
) fr
eshw
ater
C
yano
bact
eria
66
570
12%
11
#1
C
yano
bact
eria
(co
lony
cel
ls)
fres
hwat
er
Cya
noba
cter
ia
7792
39
%
#2
C
yano
bact
eria
(fi
lam
ent c
ells
) fr
eshw
ater
C
yano
bact
eria
30
78
15%
#3
Pr
asin
ophy
ceae
& P
seud
ocou
rfie
ldia
spp
. (a
ppro
x. 3μm
) m
arin
e Pr
asin
ophy
ceae
15
39
8%
17
#1
Cya
noba
cter
ia (
colo
ny c
ells
) fr
eshw
ater
C
yano
bact
eria
24
050
56%
#2
Mic
rocy
stis
spp
. (co
lony
cel
ls)
fres
hwat
er
Cya
noba
cter
ia
3944
9%
#3
Chl
orop
hyta
(ce
lls &
col
onie
s)
fres
hwat
er
Cya
noba
cter
ia
2597
6%

34
Figures
Figure 1. Sampling locations (S2, S5, S11, S17 and NIOZ sampling jetty) in the western part of the Dutch Wadden Sea (NL: Netherlands).

35
Figu
re 2
. Sea
sona
l var
iatio
n in
phy
topl
ankt
on b
iom
ass
(mg
Chl
a- m
-3),
mol
ar r
atio
of
Si:S
RP
and
Secc
hi d
isk
dept
hs (
m)
at th
e m
onito
ring
sta
tion
NIO
Z s
ampl
ing
jetty
in th
e M
arsd
iep
tidal
inle
t in
2010
. Arr
ows
indi
cate
app
roxi
mat
e sa
mpl
ing
peri
ods
at o
ther
sta
tions
in th
e M
arsd
iep
tidal
ba
sin,
i.e.
Nav
3 (1
5-19
Feb
ruar
y), N
av4
(22-
26 M
arch
), N
av5
(3-7
May
) an
d N
av6
(6-1
0 Se
ptem
ber)
in 2
010.

36
1
2
3
Figure 3. Covariance biplot based on PCA (PC1: 62.4% and PC2: 23.2%) of physicochemical parameters 4 (Temp = SST (˚C), Salinity (‰), DOP = dissolved organic phosphorus (μmol L-1); DON = dissolved 5 organic nitrogen (μmol L-1); Si = silicate (μmol L-1); TN = total nitrogen (μmol L-1); TP = total 6 phosphorus (μmol L-1); DIN = dissolved inorganic nitrogen (μmol L-1); SRP= soluble reactive phosphorus 7 (μmol L-1)) as measured during four cruises (Feb, March, May, and Sept in 2010) at four sampling 8 stations (S2, S5, S11 and S17) in the Marsdiep tidal basin. Numbers denote different stations (“2” = 9 station 2; “5” = station 5; “11” = station 11; “17” = station 17), symbols indicate different months. 10
11

37
12
13
Figure 4. Ratios PLFA/POC of (A) concentrations (mg C L-1) and (B) C incorporation (mg C L-1) at four 14 sampling stations (S2, S5, S11 and S17) during four periods (February, March, May, and September in 15 2010) in the Marsdiep tidal basin (average ± SD). PLFA were converted to phytoplankton C as explained 16 in the Material and Methods. 17

38
18
19
20
Feb
Mar
chM
aySe
pt
S5
0
20
40
60
80
100
Feb
Mar
chM
aySe
pt
S2
0
20
40
60
80
100
Feb
Mar
chM
aySe
pt
S11
0
20
40
60
80
100
Feb
Mar
chM
aySe
pt
S17
0
20
40
60
80
100
Con
cent
rati
on (
%)
Months
(A) SFA MUFA PUFA BrFA
Feb
Mar
chM
aySe
pt
S5
0
20
40
60
80
100
Feb
Mar
chM
aySe
pt
S2
0
20
40
60
80
100
Feb
Mar
chM
aySe
pt
S11
0
20
40
60
80
100
Feb
Mar
chM
aySe
pt
S17
0
20
40
60
80
100
C-i
ncor
pora
tion
(%
)
Months
(B) SFA MUFA PUFA BrFA

39
Figure 5. Stacked histograms of PLFA groups (%) (A) Concentration and (B) C-incorporation of 21 saturated fatty acids (SFA), monounsaturated fatty acids (MUFA), polyunsaturated fatty acids (PUFA) 22 and branched fatty acids (BrFA) at four sampling stations (S2, S5, S11, and S17) and at four sampling 23 periods (February, March, May, and September in 2010) in the Marsdiep tidal basin. 24
25
Figure 6. Average Σ C16/ Σ C18 ratios ( avg± SD) at four stations (S2, S5, S11 and S17) and at four 26 sampling periods (February, March, May, and September in 2010) in the Marsdiep tidal basin as 27 calculated from concentration (A) and C-incorporation (B). Dashed lines show the ratio threshold of 2. 28
29
A C16 / C18 (concentration)
rati
o
0
2
4
6
8
10S2S5S17
S11
Feb March May Sept
B C16 / C18 (C-incorporation)
rati
o
0
2
4
6
8
10
Months

40
30
Figure 7. Covariance biplot of PCA (PC1: 50.2% and PC2: 21.2%) of individual PLFAs concentrations 31 as measured during four cruises (February, March, May, and September) at four sampling stations (S2, 32 S5, S11, and S17 in 2010) in the Marsdiep tidal basin. Numbers denote different stations (“2” = station 2; 33 “5” = station 5; “11” = station 11; “17” = station 17), symbols indicate different months. Only variables 34 with Pearson correlation >0.2 were represented. 35

41
36
Figure 8. Covariance biplot of PCA analysis (PC1: 53.5% and PC2: 22.4%) of C-incorporation in 37 individual PLFAs as measured during four cruises (February, March, May, and September in 2010) at 38 four sampling stations (S2, S5, S11, and S17) in the Marsdiep tidal basin. Numbers denote different 39 stations (“2” = station 2; “5” = station 5; “11” = station 11; “17” = station 17), symbols indicate different 40 months. Only variables with Pearson correlation >0.2 were represented. 41

42
42
Figure 9. Relative phytoplankton classes abundance (Chlorophyceae, Bacillariophyceae, Cryptophyceae, 43 Prymnesiophyceae and cyanobacteria) as measured during four cruises (February, March, May, and 44 September in 2010) at four sampling stations (S2, S5, S11, and S17) in the Marsdiep tidal basin using 45 matrix factorization program CHEMTAX from PLFA composition (normalized to PLFA 16:0). 46
47
Feb-
S2Fe
b-S5
Feb-
S11
Feb-
S17
Mar
ch-S
2M
arch
-S5
Mar
ch-S
11M
arch
-S17
May
-S2
May
-S5
May
-S11
May
-S17
Sept
-S2
Sept
-S5
Sept
-S11
Sept
-S17
0
20
40
60
80
100
Perc
enta
ge (
%)
Months-Stations
ChlorophyceaeBacillariophyceaeCryptophyceaePrymnesiophyceaeCyanobacteria

43
Supp
lem
enta
ry t
able
s
48
Supp
lem
enta
ry T
able
1. C
HEM
TAX
inpu
t file
use
d to
esti
mat
e gr
oup
abun
danc
e fr
om th
e PL
FA d
ata.
49
PL
FA
C
hlor
ophy
ceae
T
rebo
uxio
phyc
eae
B
acill
ario
phyc
eae
C
rypt
ophy
ceae
H
apto
phyc
eae
C
yano
bact
eria
i14:
0 0
0 0
0 0
0 14
:0
0.05
0.
01
0.72
0.
34
0.74
0.
15
i15:
0 0
0 0
0 0
0 ai
15:0
0
0 0
0 0
0 15
:0
0 0
0.04
0.
02
0.07
0
16:1ω7
c 0.
40
0.53
1.
49
0.20
0.
19
0.36
16
:2ω4
0
0 0.
35
0 0.
09
0 16
:0
1 1
1 1
1 1
16:3ω4
0
0 0.
52
0 0
0 16
:3ω3
0.
20
1.55
0
0 0
0 16
:4ω3
1.
26
0 0
0 0
0 16
:4ω1
0
0 0.
52
0 0
0.00
18
:1ω9
c 0.
58
0.20
0.
05
0.09
0.
74
0.23
18
:1ω7
c 0.
03
0.07
0.
39
0.69
0.
37
0.06
18
:2ω6
c 0.
46
0.56
0.
09
0.08
0.
10
0.28
18
:3ω3
3.
34
3.18
0.
00
1.63
0.
45
0.82
18
:4ω3
0.
42
0 0.
47
3.78
1.
16
0.24
18
:5ω3
0
0 0
0 0.
39
0.00
20
:5ω3
0
0 2.
10
2.28
0.
36
0.03
22
:6ω3
0
0 0.
43
1.31
1.
51
0.00
50
51

44
Supp
lem
enta
ry T
able
2. P
erce
ntag
e of
PL
FA
con
cent
rati
ons
and
C-i
ncor
pora
tion
(ave
rage
± S
D)
(n=2
).
52
Con
cent
rati
ons
(% P
LF
A t
otal
con
cent
rati
ons)
PL
FA
Feb-
S11
Feb-
S17
Feb-
S2
Feb-
S5
Mar
ch -
S11
Mar
ch -
S17
Mar
ch-S
2 M
arch
-S5
SFA
14
:0
2.46
± 0
.2
2.24
± 0
.25
2.35
± 0
.1
1.82
± 0
.11
5.08
± 3
.46
5.38
± 0
.61
5.54
± 0
.43
4.95
± 0
.48
16:0
10
.53
± 1.
08
10.7
6 ±
1.24
9.
96 ±
0.2
4 10
.2 ±
0.3
10
.4 ±
6.5
9 10
.41
± 0.
85
12.9
1 ±
0.53
11
.46
± 1.
16
18:0
0.
86 ±
0.1
3 0.
79 ±
0.1
9 1.
39 ±
0.4
9 0.
47 ±
0.0
2 0.
83 ±
0.4
8 0.
97 ±
0.1
1.
18 ±
0.3
5 1.
35 ±
0.3
5 20
:0
- -
- -
1.91
± 2
.2
2.83
± 0
.32
2.76
± 0
.19
3.12
± 0
.21
MU
FA
16
:1ω7
10
.94
± 0.
88
10.4
4 ±
0.66
10
.52
± 0.
51
6.93
± 0
.15
12.5
4 ±
8.21
14
.35
± 1.
29
13.1
± 0
.87
14.5
8 ±
0.57
18
:1ω7
5.
27 ±
0.6
2 4.
11 ±
1.3
7 4.
71 ±
0.1
8 2.
86 ±
0.0
9 3.
97 ±
2.5
7 4.
97 ±
0.4
5 5.
01 ±
0.3
8 6.
34 ±
0.5
5 18
:1ω9
2.
77 ±
0.5
5 1.
38 ±
1.0
1 2.
25 ±
0.3
9 1.
8 ±
0.05
1.
86 ±
1.3
3 1.
57 ±
0.1
8 1.
48 ±
0.2
9 3.
27 ±
3.2
3
PU
FA
16
:2ω4
0.
93 ±
0.0
6 0.
38 ±
0.4
4 0.
98 ±
0.0
8 0.
73 ±
0.0
9 2.
56 ±
1.6
8 2.
46 ±
0.2
2 2.
39 ±
0.1
5 2.
08 ±
0.2
5 16
:3ω3
-
0.51
± 0
.44
0.09
± 0
.17
0.33
± 0
.02
1.32
± 2
.59
- -
0.05
± 0
.1
16:3ω4
-
- -
- -
- -
- 16
:4ω1
-
0.24
± 0
.47
- -
1.35
± 1
.56
3 ±
0.36
2.
7 ±
0.33
2.
35 ±
0.6
16
:4ω3
0.
92 ±
0.1
3 0.
7 ±
0.48
1.
01 ±
0.0
8 0.
95 ±
0.1
4 0.
2 ±
0.2
0.37
± 0
.25
0.17
± 0
.21
0.37
± 0
.13
18:2ω6
1.
07 ±
0.1
1 2.
16 ±
2.4
7 0.
98 ±
0.0
6 1.
31 ±
0.0
5 0.
63 ±
0.4
3 0.
95 ±
0.0
9 0.
75 ±
0.0
8 0.
88 ±
0.0
8 18
:3ω3
4.
96 ±
0.5
3 5.
38 ±
0.6
9 4.
39 ±
0.1
9 8.
19 ±
0.2
5 1.
6 ±
1.04
1.
69 ±
0.2
7 2.
02 ±
0.7
7 2
± 0.
42
18:3ω6
-
- -
- 0.
17 ±
0.1
9 0.
16 ±
0.1
8 0.
18 ±
0.1
2 0.
17 ±
0.1
2 18
:4ω3
9.
16 ±
0.5
4 7.
59 ±
5.0
8 8.
03 ±
0.4
9 15
.86
± 1.
22
0.29
± 0
.58
- -
- 18
:5ω3
0.
63 ±
0.4
6 2.
72 ±
2.0
3 1.
02 ±
0.1
7 0.
09 ±
0.1
0.
15 ±
0.1
7 0.
2 ±
0.23
0.
14 ±
0.1
6 0.
14 ±
0.2
8 20
:3ω3
0.
65 ±
0.1
1 1.
32 ±
1.8
0.
65 ±
0.0
5 0.
34 ±
0.0
3 0.
16 ±
0.2
9 -
- 0.
17 ±
0.1
3 20
:4ω6
2.
99 ±
0.4
5 1.
75 ±
1.4
9 2.
43 ±
0.1
8 6.
97 ±
0.2
4 0.
53 ±
0.2
9 0.
55 ±
0.0
6 0.
59 ±
0.0
4 0.
63 ±
0.1
20
:5ω3
17
.62
± 1.
81
11.9
7 ±
7.33
15
.98
± 1.
36
15.6
5 ±
1.06
7.
11 ±
8.0
1 3.
64 ±
7.2
7 17
.26
± 1.
37
14.5
5 ±
0.71
22
:6ω3
2.
18 ±
3.7
1 7.
06 ±
4.3
2 9.
03 ±
0.9
5 11
.43
± 0.
91
- 2.
18 ±
4.3
6 3.
73 ±
7.2
4 7.
6 ±
0.57
BrF
A
10-M
e16:
0 0.
72 ±
0.0
4 0.
6 ±
0.06
0.
67 ±
0.0
3 0.
42 ±
0.0
3 0.
14 ±
0.2
3 0.
25 ±
0.2
9 0.
21 ±
0.2
5 0.
19 ±
0.1
8 ai
-15:
0 1.
25 ±
0.1
3 1.
04 ±
0.1
1.
09 ±
0.0
4 0.
94 ±
0.0
2 1.
24 ±
0.7
7 1.
76 ±
0.1
1.
43 ±
0.1
2 2.
09 ±
0.2
9 i-
14:0
-
0.06
± 0
.11
- 0.
18 ±
0.0
1 1.
35 ±
0.0
3 1.
52 ±
0.1
3 1.
21 ±
0.1
3 1.
16 ±
0.0
2 i-
15:0
-
- -
- 0.
7 ±
0.61
0.
91 ±
0.0
7 0.
83 ±
0.0
9 1.
12 ±
0.1
6

45
Con
cent
rati
ons
(% P
LF
A t
otal
con
cent
rati
ons
)
PLFA
M
ay-S
11
May
-S17
M
ay-S
2 M
ay-S
5 Se
pt-S
11
Sept
-S17
Se
pt-S
2 Se
pt-S
5 SF
A
14:0
6.
74 ±
0.3
9 6.
86 ±
0.7
5 8.
42 ±
0.3
1 3.
41 ±
0.2
4 8.
35 ±
0.4
5 7.
96 ±
3.4
6 6.
49 ±
0.5
6 5.
5 ±
0.61
16
:0
12.6
6 ±
0.77
13
.88
± 0.
61
12.8
9 ±
0.58
11
.14
± 0.
14
16.8
8 ±
0.23
21
.71
± 9.
71
17.3
7 ±
0.84
21
.51
± 2.
07
18:0
1.
59 ±
0.0
8 2.
3 ±
0.16
2.
23 ±
0.1
1 1.
14 ±
0.1
1.
6 ±
0.62
2.
04 ±
0.7
9 2.
15 ±
0.1
4 1.
25 ±
0.1
3 20
:0
5.46
± 0
.53
5.16
± 0
.46
7.47
± 0
.15
4.71
± 0
.48
- 5.
83 ±
2.4
7 5.
5 ±
0.15
4.
65 ±
0.0
9
MU
FA
16
:1ω7
14
.51
± 0.
72
12.9
1 ±
0.6
10.0
7 ±
0.78
12
.15
± 0.
34
16.9
± 1
.6
18.5
9 ±
8.04
14
.6 ±
1.3
4 16
.44
± 0.
53
18:1ω7
7.
8 ±
0.78
7.
95 ±
0.1
3 6.
62 ±
0.0
4 6.
97 ±
0.1
7 5.
13 ±
1.0
7 7.
14 ±
2.7
5 6.
7 ±
0.62
5.
16 ±
0.5
6 18
:1ω9
2.
54 ±
0.1
5 3.
1 ±
0.24
4.
07 ±
0.9
6 2.
77 ±
0.4
3 1.
77 ±
1.1
9 4.
2 ±
1.69
3.
59 ±
0.2
9 4.
53 ±
0.4
1
PU
FA
16
:2ω4
1.
31 ±
0.0
6 1.
28 ±
0.0
8 0.
94 ±
0.1
3 0.
99 ±
0.0
1 3.
14 ±
1.0
4 1.
84 ±
0.8
5 1.
65 ±
0.1
6 1.
29 ±
0.1
3 16
:3ω3
-
- -
- 4.
2 ±
1.52
0.
74 ±
0.3
4 0.
51 ±
0.0
6 0.
93 ±
0.0
2 16
:3ω4
0.
16 ±
0.1
1 0.
12 ±
0.0
8 0.
02 ±
0.0
5 -
0.23
± 0
.27
- 0.
09 ±
0.0
6 0.
02 ±
0.0
4 16
:4ω1
1.
15 ±
0.1
3 1
± 0.
12
0.67
± 0
.05
1.01
± 0
.02
0.99
± 0
.68
1.26
± 0
.6
1.27
± 0
.14
0.29
± 0
.03
16:4ω3
0.
38 ±
0.0
9 0.
63 ±
0.0
9 0.
64 ±
0.1
8 0.
62 ±
0.1
3 0.
3 ±
0.34
1.
57 ±
0.5
9 0.
85 ±
0.1
8 1.
85 ±
0.0
7 18
:2ω6
0.
95 ±
0.0
5 0.
92 ±
0.0
3 1.
16 ±
0.0
4 1.
18 ±
0.1
1 0.
08 ±
0.1
6 2.
06 ±
0.6
9 1.
65 ±
0.1
2 3.
23 ±
0.2
4 18
:3ω3
1.
87 ±
0.1
3 2.
36 ±
0.1
3.
1 ±
0.17
2.
58 ±
0.2
8 -
7.1
± 2.
86
4.46
± 0
.57
10.0
1 ±
0.18
18
:3ω6
0.
22 ±
0.0
5 0.
2 ±
0.02
0.
15 ±
0.1
0.
12 ±
0.1
7 -
0.39
± 0
.09
0.35
± 0
.09
1.07
± 0
.02
18:4ω3
-
- -
- 0.
33 ±
0.3
9 -
- -
18:5ω3
1.
85 ±
0.2
1 0.
1 ±
0.19
1.
62 ±
0.5
4 0.
44 ±
0.0
1 -
0.11
± 0
.13
0.12
± 0
.09
- 20
:3ω3
-
- -
- 0.
25 ±
0.2
9 -
- 0.
03 ±
0.0
5 20
:4ω6
0.
93 ±
0.1
2 1.
29 ±
0.1
1 1.
27 ±
0.0
2 1.
05 ±
0.0
8 -
0.71
± 0
.14
0.81
± 0
.14
0.57
± 0
.18
20:5ω3
14
.25
± 0.
71
15.7
6 ±
0.83
14
.37
± 0.
66
14.4
4 ±
2.23
0.
2 ±
0.23
11
.42
± 4.
07
11.1
5 ±
0.81
5.
12 ±
0.7
1 22
:6ω3
2.
62 ±
5.2
4 -
- 9.
36 ±
2.4
2 7.
51 ±
1.4
1 -
- 2.
83 ±
3.5
9
BrF
A
10-M
e16:
0 -
0.57
± 0
.65
0.6
± 0.
69
- 0.
35 ±
0.4
1 0.
38 ±
0.2
7 0.
27 ±
0.0
3 0.
6 ±
0.06
ai
-15:
0 2.
56 ±
0.1
7 2.
24 ±
0.0
6 2.
12 ±
0.1
4 1.
68 ±
0.0
1 1.
48 ±
0.3
8 2.
6 ±
1 2.
11 ±
0.1
9 1.
87 ±
0.0
9 i-
14:0
1.
02 ±
0.0
5 0.
88 ±
0.0
4 0.
68 ±
0.0
1 0.
31 ±
0.3
1 0.
23 ±
0.2
6 0.
68 ±
0.2
5 0.
61 ±
0.0
3 0.
44 ±
0.1
2 i-
15:0
1.
53 ±
0.1
1.
54 ±
0.0
5 1.
43 ±
0.0
2 1.
04 ±
0.0
2 -
2.03
± 0
.78
1.71
± 0
.14
1.19
± 0
.8
53
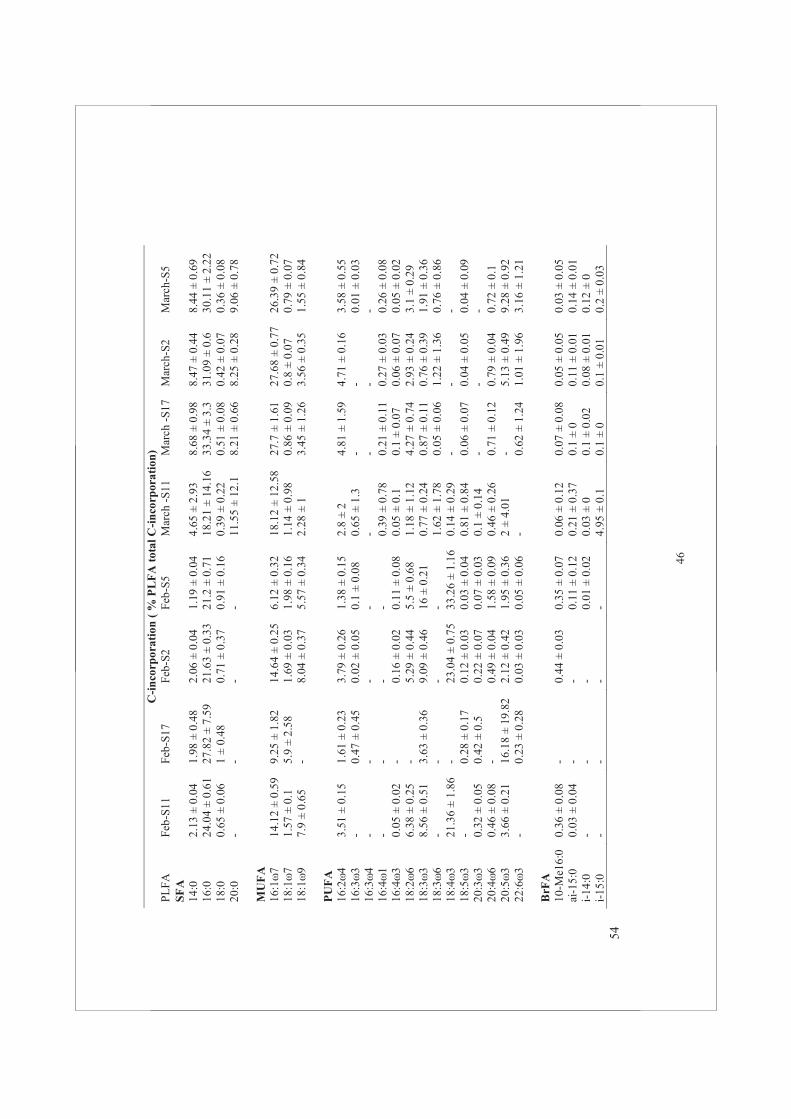
46
C-i
ncor
pora
tion
( %
PL
FA
tot
al C
-inc
orpo
rati
on)
PL
FA
Feb-
S11
Feb-
S17
Feb-
S2
Feb-
S5
Mar
ch -
S11
Mar
ch -
S17
Mar
ch-S
2 M
arch
-S5
SFA
14
:0
2.13
± 0
.04
1.98
± 0
.48
2.06
± 0
.04
1.19
± 0
.04
4.65
± 2
.93
8.68
± 0
.98
8.47
± 0
.44
8.44
± 0
.69
16:0
24
.04
± 0.
61
27.8
2 ±
7.59
21
.63
± 0.
33
21.2
± 0
.71
18.2
1 ±
14.1
6 33
.34
± 3.
3 31
.09
± 0.
6 30
.11
± 2.
22
18:0
0.
65 ±
0.0
6 1
± 0.
48
0.71
± 0
.37
0.91
± 0
.16
0.39
± 0
.22
0.51
± 0
.08
0.42
± 0
.07
0.36
± 0
.08
20:0
-
- -
- 11
.55
± 12
.1
8.21
± 0
.66
8.25
± 0
.28
9.06
± 0
.78
MU
FA
16
:1ω7
14
.12
± 0.
59
9.25
± 1
.82
14.6
4 ±
0.25
6.
12 ±
0.3
2 18
.12
± 12
.58
27.7
± 1
.61
27.6
8 ±
0.77
26
.39
± 0.
72
18:1ω7
1.
57 ±
0.1
5.
9 ±
2.58
1.
69 ±
0.0
3 1.
98 ±
0.1
6 1.
14 ±
0.9
8 0.
86 ±
0.0
9 0.
8 ±
0.07
0.
79 ±
0.0
7 18
:1ω9
7.
9 ±
0.65
-
8.04
± 0
.37
5.57
± 0
.34
2.28
± 1
3.
45 ±
1.2
6 3.
56 ±
0.3
5 1.
55 ±
0.8
4
PU
FA
16
:2ω4
3.
51 ±
0.1
5 1.
61 ±
0.2
3 3.
79 ±
0.2
6 1.
38 ±
0.1
5 2.
8 ±
2 4.
81 ±
1.5
9 4.
71 ±
0.1
6 3.
58 ±
0.5
5 16
:3ω3
-
0.47
± 0
.45
0.02
± 0
.05
0.1
± 0.
08
0.65
± 1
.3
- -
0.01
± 0
.03
16:3ω4
-
- -
- -
- -
- 16
:4ω1
-
- -
- 0.
39 ±
0.7
8 0.
21 ±
0.1
1 0.
27 ±
0.0
3 0.
26 ±
0.0
8 16
:4ω3
0.
05 ±
0.0
2 -
0.16
± 0
.02
0.11
± 0
.08
0.05
± 0
.1
0.1
± 0.
07
0.06
± 0
.07
0.05
± 0
.02
18:2ω6
6.
38 ±
0.2
5 -
5.29
± 0
.44
5.5
± 0.
68
1.18
± 1
.12
4.27
± 0
.74
2.93
± 0
.24
3.1
± 0.
29
18:3ω3
8.
56 ±
0.5
1 3.
63 ±
0.3
6 9.
09 ±
0.4
6 16
± 0
.21
0.77
± 0
.24
0.87
± 0
.11
0.76
± 0
.39
1.91
± 0
.36
18:3ω6
-
- -
- 1.
62 ±
1.7
8 0.
05 ±
0.0
6 1.
22 ±
1.3
6 0.
76 ±
0.8
6 18
:4ω3
21
.36
± 1.
86
- 23
.04
± 0.
75
33.2
6 ±
1.16
0.
14 ±
0.2
9 -
- -
18:5ω3
-
0.28
± 0
.17
0.12
± 0
.03
0.03
± 0
.04
0.81
± 0
.84
0.06
± 0
.07
0.04
± 0
.05
0.04
± 0
.09
20:3ω3
0.
32 ±
0.0
5 0.
42 ±
0.5
0.
22 ±
0.0
7 0.
07 ±
0.0
3 0.
1 ±
0.14
-
- -
20:4ω6
0.
46 ±
0.0
8 -
0.49
± 0
.04
1.58
± 0
.09
0.46
± 0
.26
0.71
± 0
.12
0.79
± 0
.04
0.72
± 0
.1
20:5ω3
3.
66 ±
0.2
1 16
.18
± 19
.82
2.12
± 0
.42
1.95
± 0
.36
2 ±
4.01
-
5.13
± 0
.49
9.28
± 0
.92
22:6ω3
-
0.23
± 0
.28
0.03
± 0
.03
0.05
± 0
.06
- 0.
62 ±
1.2
4 1.
01 ±
1.9
6 3.
16 ±
1.2
1
BrF
A
10-M
e16:
0 0.
36 ±
0.0
8 -
0.44
± 0
.03
0.35
± 0
.07
0.06
± 0
.12
0.07
± 0
.08
0.05
± 0
.05
0.03
± 0
.05
ai-1
5:0
0.03
± 0
.04
- -
0.11
± 0
.12
0.21
± 0
.37
0.1
± 0
0.11
± 0
.01
0.14
± 0
.01
i-14
:0
- -
- 0.
01 ±
0.0
2 0.
03 ±
0
0.1
± 0.
02
0.08
± 0
.01
0.12
± 0
i-
15:0
-
- -
- 4.
95 ±
0.1
0.
1 ±
0 0.
1 ±
0.01
0.
2 ±
0.03
54
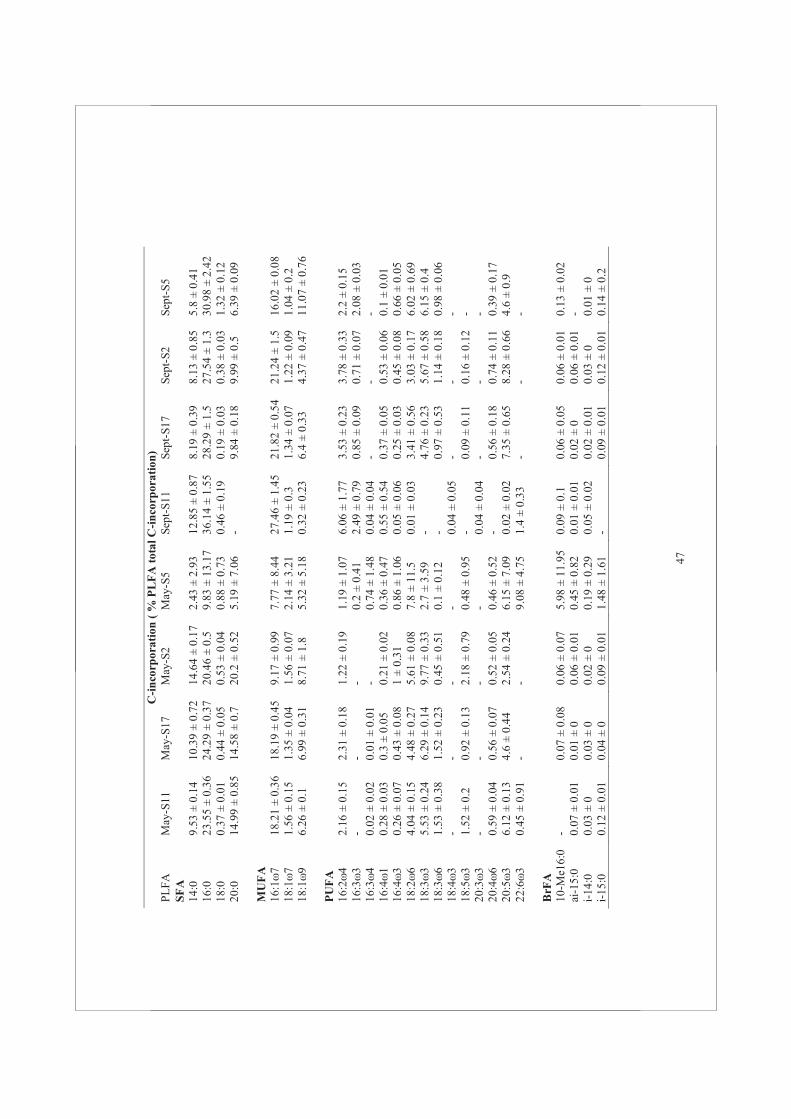
47
C-i
ncor
pora
tion
( %
PL
FA
tot
al C
-inc
orpo
rati
on)
PL
FA
May
-S11
M
ay-S
17
May
-S2
May
-S5
Sept
-S11
Se
pt-S
17
Sept
-S2
Sept
-S5
SFA
14
:0
9.53
± 0
.14
10.3
9 ±
0.72
14
.64
± 0.
17
2.43
± 2
.93
12.8
5 ±
0.87
8.
19 ±
0.3
9 8.
13 ±
0.8
5 5.
8 ±
0.41
16
:0
23.5
5 ±
0.36
24
.29
± 0.
37
20.4
6 ±
0.5
9.83
± 1
3.17
36
.14
± 1.
55
28.2
9 ±
1.5
27.5
4 ±
1.3
30.9
8 ±
2.42
18
:0
0.37
± 0
.01
0.44
± 0
.05
0.53
± 0
.04
0.88
± 0
.73
0.46
± 0
.19
0.19
± 0
.03
0.38
± 0
.03
1.32
± 0
.12
20:0
14
.99
± 0.
85
14.5
8 ±
0.7
20.2
± 0
.52
5.19
± 7
.06
- 9.
84 ±
0.1
8 9.
99 ±
0.5
6.
39 ±
0.0
9
MU
FA
16
:1ω7
18
.21
± 0.
36
18.1
9 ±
0.45
9.
17 ±
0.9
9 7.
77 ±
8.4
4 27
.46
± 1.
45
21.8
2 ±
0.54
21
.24
± 1.
5 16
.02
± 0.
08
18:1ω7
1.
56 ±
0.1
5 1.
35 ±
0.0
4 1.
56 ±
0.0
7 2.
14 ±
3.2
1 1.
19 ±
0.3
1.
34 ±
0.0
7 1.
22 ±
0.0
9 1.
04 ±
0.2
18
:1ω9
6.
26 ±
0.1
6.
99 ±
0.3
1 8.
71 ±
1.8
5.
32 ±
5.1
8 0.
32 ±
0.2
3 6.
4 ±
0.33
4.
37 ±
0.4
7 11
.07
± 0.
76
PU
FA
16
:2ω4
2.
16 ±
0.1
5 2.
31 ±
0.1
8 1.
22 ±
0.1
9 1.
19 ±
1.0
7 6.
06 ±
1.7
7 3.
53 ±
0.2
3 3.
78 ±
0.3
3 2.
2 ±
0.15
16
:3ω3
-
- -
0.2
± 0.
41
2.49
± 0
.79
0.85
± 0
.09
0.71
± 0
.07
2.08
± 0
.03
16:3ω4
0.
02 ±
0.0
2 0.
01 ±
0.0
1 -
0.74
± 1
.48
0.04
± 0
.04
- -
- 16
:4ω1
0.
28 ±
0.0
3 0.
3 ±
0.05
0.
21 ±
0.0
2 0.
36 ±
0.4
7 0.
55 ±
0.5
4 0.
37 ±
0.0
5 0.
53 ±
0.0
6 0.
1 ±
0.01
16
:4ω3
0.
26 ±
0.0
7 0.
43 ±
0.0
8 1
± 0.
31
0.86
± 1
.06
0.05
± 0
.06
0.25
± 0
.03
0.45
± 0
.08
0.66
± 0
.05
18:2ω6
4.
04 ±
0.1
5 4.
48 ±
0.2
7 5.
61 ±
0.0
8 7.
8 ±
11.5
0.
01 ±
0.0
3 3.
41 ±
0.5
6 3.
03 ±
0.1
7 6.
02 ±
0.6
9 18
:3ω3
5.
53 ±
0.2
4 6.
29 ±
0.1
4 9.
77 ±
0.3
3 2.
7 ±
3.59
-
4.76
± 0
.23
5.67
± 0
.58
6.15
± 0
.4
18:3ω6
1.
53 ±
0.3
8 1.
52 ±
0.2
3 0.
45 ±
0.5
1 0.
1 ±
0.12
-
0.97
± 0
.53
1.14
± 0
.18
0.98
± 0
.06
18:4ω3
-
- -
- 0.
04 ±
0.0
5 -
- -
18:5ω3
1.
52 ±
0.2
0.
92 ±
0.1
3 2.
18 ±
0.7
9 0.
48 ±
0.9
5 -
0.09
± 0
.11
0.16
± 0
.12
- 20
:3ω3
-
- -
- 0.
04 ±
0.0
4 -
- -
20:4ω6
0.
59 ±
0.0
4 0.
56 ±
0.0
7 0.
52 ±
0.0
5 0.
46 ±
0.5
2 -
0.56
± 0
.18
0.74
± 0
.11
0.39
± 0
.17
20:5ω3
6.
12 ±
0.1
3 4.
6 ±
0.44
2.
54 ±
0.2
4 6.
15 ±
7.0
9 0.
02 ±
0.0
2 7.
35 ±
0.6
5 8.
28 ±
0.6
6 4.
6 ±
0.9
22:6ω3
0.
45 ±
0.9
1 -
- 9.
08 ±
4.7
5 1.
4 ±
0.33
-
- -
BrF
A
10-M
e16:
0 -
0.07
± 0
.08
0.06
± 0
.07
5.98
± 1
1.95
0.
09 ±
0.1
0.
06 ±
0.0
5 0.
06 ±
0.0
1 0.
13 ±
0.0
2 ai
-15:
0 0.
07 ±
0.0
1 0.
01 ±
0
0.06
± 0
.01
0.45
± 0
.82
0.01
± 0
.01
0.02
± 0
0.
06 ±
0.0
1 -
i-14
:0
0.03
± 0
0.
03 ±
0
0.02
± 0
0.
19 ±
0.2
9 0.
05 ±
0.0
2 0.
02 ±
0.0
1 0.
03 ±
0
0.01
± 0
i-
15:0
0.
12 ±
0.0
1 0.
04 ±
0
0.09
± 0
.01
1.48
± 1
.61
- 0.
09 ±
0.0
1 0.
12 ±
0.0
1 0.
14 ±
0.2


49
CHAPTER 3
Phosphorus limitation during a phytoplankton spring
bloom in the western Dutch Wadden Sea
Juliette Ly1, Catharina J.M. Philippart2 and Jacco C. Kromkamp1
In revision for Journal of Sea Research
1 Department of Marine Microbiology, Royal Netherlands Institute for Sea Research, P.O. Box 140, 4400 AC Yerseke, The Netherlands 2 Department of Marine Ecology, Royal Netherlands Institute for Sea Research, P.O. Box 59, 1790 AB Den Burg, The Netherlands

50
Abstract
Like many aquatic ecosystems, the western Dutch Wadden Sea has undergone eutrophication. Due to changes in management policy, nutrient loads, especially phosphorus decreased after the mid-80s. It is still under debate, however, whether nutrients or light are limiting phytoplankton production in the western Wadden Sea, as studies using monitoring data delivered sometimes opposite conclusions and outcomes were related to years, seasons and approaches used. Clearly, the monitoring data alone were not sufficient. We therefore examined the limiting factors for the phytoplankton spring bloom using different experimental approaches. During the spring bloom in April 2010, we investigated several nutrient regimes on natural phytoplankton assemblages at a long-term monitoring site, the NIOZ-Jetty sampling (Marsdiep, The Netherlands). Four bioassays, lasting 6 days each, were performed in controlled conditions. From changes in phytoplankton biomass, chlorophyll-a (Chla), we could conclude that the phytoplankton in general was mainly P-limited during this period, whereas a Si-P-co-limitation was likely for the diatom populations, when present. These results were confirmed by changes in the photosynthetic efficiency (Fv/Fm), in the expression of alkaline phosphatase activity (APA) measured with the fluorescent probe ELF-97, and in the 13C stable isotope incorporation in particulate organic carbon (POC). During our bioassay experiments, we observed a highly dynamic phytoplankton community with regard to species composition and growth rates. The considerable differences in net population growth rates, occurring under more or less similar environmental incubation conditions, suggest that phytoplankton species composition and grazing activity by small grazers were important structuring factors for net growth during this period.

51
1. Introduction
The need for better understanding the impacts of eutrophication on freshwater, coastal and marine ecosystems has been one of the main reasons to explore relationships between primary producer communities and fluctuations of nutrient concentrations (Cloern, 2001). Apart from influencing productivity levels, changes in ambient nutrient concentrations can also affect phytoplankton species composition, grazer activity and the trophic transfer to higher trophic levels (Brett and Muller-Navarra, 1997; Malzahn et al., 2007; Finkel et al., 2010). Studies on the response of phytoplankton communities to changes in nutrient loads at various scales, ranging from small-scale laboratory techniques, via field mesocosms to lakes and estuaries (Hecky and Kilham, 1988; Beardall et al., 2001; Schindler, 2009), show that interpretation of the results obtained at small scales are sometimes difficult to extrapolate to field conditions.
The widely accepted paradigm on nutrient limitation assumes that nitrogen (N) is the limiting nutrient for primary production in marine ecosystems, whereas phosphorus (P) is the limiting nutrient for primary production in lakes (Hecky and Kilham, 1988; Howarth and Marino, 2006). In both marine and freshwater ecosystems, however, chlorophyll-a (Chla) concentrations were found to be correlated with mean concentrations or loads of total nitrogen (TN) and total phosphorus (TP) (Heip et al., 1995; Smith et al., 2006). The study by Heip et al. (1995) also highlighted the importance of organic matter for primary production, whilst Monbet (1992) demonstrated the influence of the tidal regime on the relationship between N-availability and Chla concentrations. In addition, a meta-analysis on nutrient enrichments in a suite of habitats by Elser et al. (2007) revealed that freshwater systems can be frequently limited by N and marine habitats by P.
The Wadden Sea is one of the world’s largest coastal marine ecosystems which is strongly affected by changes in anthropogenic nutrient loads (Cloern, 2001). In the western part of this area, the concentrations of dissolved inorganic phosphorus (DIP) and dissolved inorganic nitrogen (DIN) increased during the 1970s and decreased after the mid-1980s as the result of changing riverine loads (Cadee and Hegeman, 2002; Philippart et al., 2007; Loebl et al., 2009). These changes in absolute and relative nutrient loads coincided with major changes in phytoplankton community structure during the late 1970’s and the late 1980’s (Philippart et al., 2000) and were followed each time by changes in community structures of macrozoobenthos, fish and estuarine birds (Philippart et al., 2007; Tulp et al., 2008).
Long-term trends in relative nutrient concentrations in the western Wadden Sea strongly suggest that phytoplankton production during the spring and summer blooms was P-limited in the 1970s, Si-limited (diatoms) or N-limited (flagellates) in the 1980s, and P-limited again hereafter (Philippart et al., 2007). Light limitation appears to play a minor role during the blooms. Whilst previous analyses indicated co-limitation by light (Colijn and Cadée, 2003), more recent results using the similar index (Cloern, 1999, 2001) suggested that nutrients were the main limiting resource during the growing season for phytoplankton in the Wadden Sea (Loebl et al., 2009). In addition, the turbidity of these waters was found to be highly variable during this

52
period but did not exhibit the long-term trends as was observed in phytoplankton biomass, productivity and species composition (Philippart et al., 2013).
Previous results on the nature and strength of nutrient limitation in the western Wadden Sea were all based on nutrient concentrations, which are only weak indices of nutrient limitation because no information on uptake and mineralization is taken into account (Dodd, 2003). To unambiguously determine the nature of the actual limiting nutrient, we performed nutrient enrichment experiments during the spring bloom in combination with several physiological measurements. To test the viability of historical statements on nutrient limitation in the western Wadden Sea, we compared the new results from the combination of techniques with the ratio’s in ambient nutrient concentrations.
2. Material and methods
2.1. Sampling procedure
Water samples have been collected using a bucket at weekly intervals at high tide from the NIOZ sampling jetty (53°00′06″ N; 4°47′21″ E) from 30th March to 30th April 2010 (Table 1). The NIOZ sampling jetty is located in the Marsdiep basin near to the inlet between the North Sea and the Wadden Sea (Fig. 1). Sampling was always performed at high tide (± 10 minutes) as predicted for the nearby city of Den Helder (www.getij.nl) in order to keep variation in parameter values as the result of tidal currents as limited as possible (Cadée, 1982). High tide at the NIOZ sampling Jetty falls approximately 30-45 minutes later than at Den Helder, which implies that sampling was just before high tide. Comparison with ferry box observations as determined from a ferry sailing across the Marsdiep tidal inlet during 11 years showed that turbidity at the NIOZ sampling jetty was correlated with total suspended matter concentrations in the Marsdiep tidal inlet (Philippart et al., 2013). This finding strongly suggests that information on trends as derived from the NIOZ sampling jetty samples is indicative for changes in the western Wadden Sea.
2.2. Experimental design
The nutrient enrichment experiments with natural phytoplankton populations were performed in 8 liters polycarbonate bottles which were incubated under controlled light and temperature conditions during 6 days (Table 2). The water was collected and filtered over a 100 μm mesh size filter in order to minimize grazing by meso- and macrozooplankton on the phytoplankton. The enrichment bottles were incubated at in situ temperature conditions (8-10 o
C). A light-dark cycle of 14:10 (L:D) was implemented using fluorescent tubes (Cool White 36 W, Philips) at an irradiance of 100 μmol photons m-2 s-1.
The experimental design incorporated three possible nutrient additions: +N, inorganic nitrogen (addition of NH4NO3 which would give a final concentration of 100 μmol L-1 if no ambient DIN would be present); +P, inorganic phosphorus (10 μmol L-1 (final) KH2PO4) and +Si

53
(100 μmol L-1 (final) Na2SiO5,5H2O). In total, four different nutrient treatments were composed, each in triplicate: C (control without any addition of nutrients); +NP; +NSi; +PSi; +NPSi, where all nutrients are added together (Table 2). In B4, due to an error in the laboratory, no +NSi treatments were added to the experimental design.
As we also performed 13C-labeling experiments and investigated particulate organic carbon (POC) bulk labeling (see below), no single additions were performed as this would increase the number of bottles substantially. Information on the effects of additions of a single nutrient were, therefore, derived by comparing the results of multiple nutrient additions. Water subsamples from the bioassays were taken at the beginning and end of each nutrient addition treatments for 13C stable isotope incubation. Water samples were enriched with 13C-NaHCO3 (99% 13C; Cambridge Isotope Laboratories, Inc.) for 2 hours with a concentration of 4 % of the ambient dissolved inorganic carbon (DIC) concentration.
2.3. Average irradiance depth at the Marsdiep tidal inlet
We estimated the light climate in the Marsdiep basin during the period of our bioassays. As the light attenuation coefficients (Kd; m
-1) were not available during this period we estimated this from the Secchi depths using the following empirical relationship:
Kd = a∙ √(Secchi depth) + b
Where a = 5.377 (m-1) and b = 2.07 (m-1) are fit constants obtained from regression analysis (r2 = 0.71; n = 116) in the western part of the optically similar Oosterschelde estuary (Malkin and Kromkamp, unpublished results). Kd varied between 0.77 to 2.99 m-1 (median = 1.17 m-1). Hourly irradiance (J cm-2) data for the April months of 2009 -2012 were downloaded from the Dutch Meteorological office (http://www.knmi.nl/klimatologie/) station De Kooy (located 8.6 km south from the sampling site) and converted into PAR (μmol photons m-2 s-1) values using an empirical conversion factor of 5.2 (Kromkamp unpublished). According to the obtained values, the average incident irradiance value in the month of April was 380 μmol photons m-2 s-1. In April, the median value of Kd was 0.91 m-1. The average depth of the Marsdiep basin is approximately 4.5 m (Ridderinkhof, 1988).
Assuming the photic depth equals the depth to which 1% of the surface irradiance penetrates, it follows that the photic zone (zeu) to mixing (zm) ratio varies annually from 0.34 to 1.31 with a median value of 0.88, indicating that in nearly the complete water column primary production is taking place. The average zeu/zm ratio for April was 1.12. From Kd, the average depth and the incident irradiance, we calculated that daylight averaged irradiance values in the water column varied between 27 and 112 μmol photons m-2 s-1 (median = 75 μmol photons m-2
s-1). In April, the median water column irradiance equaled 96 μmol photons m-2 s-1, which was
very close to the irradiance value used (100 μmol photons m-2 s-1) during nutrient enrichment experiments.

54
2.4. Nutrient concentrations
Samples for dissolved nutrients ( ammonium (NH4+) , nitrate (NO3
-) , nitrite (NO2-),
phosphate (DIP) and silicate (Si)) were filtered through a disposable filters (0.2 μm) and analysed using an QuAAtro autoanalyser, with segmented flow analysis (Bran+Luebbe, Germany) according to the manufacturers instruction (Hydes D 2010). Dissolved inorganic nitrogen (DIN) is the sum of ammonium, nitrate and nitrite. Total nitrogen (TN) and total phosphorus (TP) were extracted according to Valderrama (1981). In addition, particulate phosphorus (PP) contents were quantified with inductive coupled plasma spectroscopy (ICP-OES; Perkin Elmer Optima 3300 DV) on filtered samples (Nieuwenhuize and Poley-Vos, 1989). Particulate organic nitrogen (PON) samples were analyzed Carlo Erba elemental analyzer (EA) coupled online to a Finnigan Delta S isotope ratio mass spectrometer (IRMS). PON and PP were filtered onto glass-fiber filters (Whatman GF/F). Total dissolved nutrients were defined as TDN = TN – PON and TDP = TP – PP. Then, dissolved organic nitrogen (DON) and dissolved organic phosphorus (DOP) can be deducted; DON = TDN – DIN and DOP = TDP - DIP. Several dissolved nutrient ratios were calculated (DIN:DIP; DIN:TDP; TDN:TDP; Si:DIP), including the biological available nitrogen (BAN) to phosphorus (BAP) ratio where BAN: BAP = ([DON + DIN]/[DOP + DIP]).
2.5. Chlorophyll-a
For each chlorophyll-a (Chla) sample, a volume of 50 to 100 mL was filtered through a 47 mm Whatman GF/F filters and put directly in a glass container with 10 mL of 90% acetone. The Chla samples were stored in the freezer (-20 °C) for at least 24 hours. Then, the Chla concentrations were measured with a fluorometer (Hitachi Fluorescence Spectrophotometer F-2500) with an excitation wavelength of 431 nm and emission wavelength of 671 nm. The fluorometer was calibrated with a known concentration of Chla. Specific growth rates (μ, day-1) were calculated from changes in Chla over time (t; days) as μ = 1/t × ln (Chla (t)/Chla (0)).
2.6. Species counts
As part of the long-term field observation program from the NIOZ sampling jetty, phytoplankton species composition was determined from surface water samples at a sampling frequency from once a month in mid-winter to twice a week during spring blooms. Phytoplankton samples were preserved with Lugol and cells were counted with a Zeiss inverted microscope using 5-ml counting chambers (Philippart et al., in prep). Most algae were identified to species level; some were clustered into taxonomic and size groups (e.g. small flagellates).
2.7. Carbon incorporation using 13C uptake in particulate organic carbon (POC)
Samples for the 13C incubation were filtered over precombusted glass-fiber filters (Whatman GF/F) and later analyzed with a Carlo Erba elemental analyzer (EA) coupled online to a Finnigan Delta S isotope ratio mass spectrometer (IRMS). The fraction of 13C (μg C L-1 h-1) in

55
POC was calculated following specific isotopic calculations (Middelburg et al., 2000). Stable isotope data are expressed in the delta notation (δ13C) relative to carbon isotope ratio (R = 13C/12C) of Vienna Pee Dee Belemnite (RVPDB= 0.0112372): δ13C = [(Rsample/ RVPDB) -1 × 1000]. The 13C uptake of POC (μmol C L-1) was calculated from the difference of the fraction of 13C at the start and at the end of the incubation, multiplied by the concentration of POC at the start of the incubation. After correction for the NaH13CO3 enrichment (4% added of ambient DIC), the rate of 13C-incorporation at the incubation conditions (μmol C L-1 h-1) was obtained by the incubation time (2 hours) The fraction of the POC was calculated as 13C/ (13C + 12C) = R/ (R+1).Total dissolved inorganic carbon (DIC) varied around 2.22 ± 0.06 mmol L-1 (E. Epping, pers. comm).
2.8. Photosynthesis physiology
Chlorophyll fluorescence was measurement with a Water-PAM fluorometer (Heinz Walz, Effeltrich, Germany). For each sample, the minimum fluorescence yield (F0) and the maximum fluorescence yield (Fm) were measured using a 1 min dark adaptation time before measurement in order to obtain the maximum PSII quantum efficiency (Fv /Fm = (Fm - F0)/Fm).
2.9. Alkaline phosphatase activity (APA)
At the beginning and end of each nutrient treatment experiment, samples for specific detection of APA were measured using a molecular probe, ELF-97 (Endogenous Phosphatase Detection Kit; E6601, Molecular Probes, Invitrogen, California) following the instructions provided. The phytoplankton in a sample of 100-150 mL was concentrated using a membrane filter of 0.2 μm, and to 1 mL of the concentrated sample a freshly prepared ELF-97 working solution was added. After 30 min incubation in the dark, 100 μL of the phosphate buffer solution and 20 μL of a mixture of paraformaldehyde and glutaraldehyde (0.01:0.1%) was added. Samples were stored at 4 ° C. The inoculated ELF samples were visualized using an epifluorescence microscope (Carl Zeiss axioplan 2 imaging microscope) connected to a LED illumination system (Colibri, Carl Zeiss SAS, Germany). Carl Zeiss Axiovision software was used to acquire and analyze the images. During the storage, however, the algal cells and other components in the water formed large aggregates making microscopy observations on single algal cells difficult. As the bright green fluorescence of the ELF stain was clearly visible within the aggregates, we decided to make a relative score of the “density” of the ELF stained particles in the aggregates, where an intense bright green fluorescence was scored as “high”, (, a pale green fluorescence as “low”, and the absence of any fluorescence as “zero”. In total, 100 cells or aggregates were scored for each sample. Only ELF fluorescence of intact algal cells was scored, i.e. only when the red chlorophyll autofluorescence was visible, the ELF fluorescence was included.

56
2.10. Statistics analysis
Parameters such as Chla, Fv/Fm and C-incorporation via 13C labeling were analyzed with an analysis of variance (ANOVA), with time of incubation (6 days) and treatments as fixed factors for each bioassay (5 levels: control (C), +NP, +NSi, +PSi, +NPSi). A one way ANOVA was performed to test difference among the nutrient addition treatments for each bioassay at different times during the incubation. Assumptions of ANOVA (normality and homogeneity of variances) were tested. Analyses were undertaken using R version 2.12.0 (http://www.r-project.org/) with a level of significance of p < 0.05.

57
3. Results
3.1. Starting conditions
For each nutrient concentration, significant differences were found between bioassays (one-way ANOVA, p < 0.05). At the start of the first three bioassays (B1, B2 and B3), the DIP concentrations ranged from 0.04 to 0.05 μmol L-1 which was close to the detection limit for this nutrient (Fig. 2). At the start of B4, the DIP concentration was higher, reaching a concentration of 1.5 μmol L-1. The concentrations of Si were below the detection limit at the start of B2 and B3, and low (0.15 μmol L-1 for B1 and 0.07 μmol L-1 for B4) but not significantly different at the start of the other two bioassays. From B1 to B3, NH4
+ concentrations decreased significantly from 0.91 to 0.26 μmol L-1. In B4, NH4
+ concentrations had increased again to 0.67 μmol L-1. NOx was the main contributor of the DIN pool with NO3 contributing around 97% of total NOx, e.g. NOx concentrations were already 40 times higher than NH4
+ in B1. Concentrations of NOx decreased from 40 μmol L-1 at the start of B1 to 17.5 μmol L-1 at the start of B4.
DOP increased from 0.5 μmol L-1 in B1 to 1 and 2 μmol L-1 in B2 and B3, respectively. In B4, DOP levels showed the highest values of about 10 μmol L-1. DON increased over the experimental period from 18 μmol L-1 in B1 to 40 μmol L-1 in B4. For each nutrient ratio, significant differences were found between bioassays (one-way ANOVA, p < 0.05) (Fig. 3).
Within the study period, the N:P ratios of the dissolved nutrients (i.e., DIN:DIP, DIN:TDP, TDN:TDP and BAN:BAP) generally decreased. The DIN:DIP, the TDN:TDP and the BAN:BAP ratios were higher than the Redfield ratio (N:P = 16) during the first three bioassays (B1-B3) and lower than 16 during B4, which suggested P limitation before 24 April and a relative N-shortage hereafter. The PON:POP ratio, however, far exceeded the Redfield ratio and did not differ significantly between bioassays (one-way ANOVA, p =0.6514), suggesting P limitation during the full study period (B1-B4). The Si:DIP ratio was just below the Redfield ratio during B1 and showed very low values for the other bioassays (B2-B4), suggesting Si-limited growth of diatoms compared to P during the full studied period.
At the start of B1, Bacillariophyceae (diatoms) formed the dominant fraction in the phytoplankton community (dominated mainly by Thalassiosira spp) at the start of B2, a massive bloom of the haptophyte Phaeocystis globosa appeared, clearly visible by eye. At the start of B3, P. globosa continued to develop. At the start of B4, the P. globosa bloom declined (Table 3).
3.2. Phytoplankton growth rates
For B1, all treatments resulted in an increase phytoplankton biomass during incubation (Fig. 4). The largest increase in phytoplankton biomass was observed in +PSi and +NPSi treatments (Fig. 4). On the 3rd day of these two treatments, biomass approximately increased 3-fold up to 20 μg L-1. At the end of this bioassay, Chla concentrations in these two treatments were more than 100 times higher than the initial value, reaching a value of 220 μg L-1(Fig. 4). If the C:Chla ratio was constant during the incubation period, then the net community growth rate

58
was approximately 0.64 day-1 (Table 2). Chla concentrations in the +NP or +NSi treatments slightly increased to 24 and 30 μg L-1 at the end of the incubation period, respectively. During the whole duration of this bioassay the differences between treatments were significant (one-way ANOVA, p =1.75 10-3).
At the start of the incubation of B2, the Chla concentrations were approximately five times higher than at the start of B1 (Fig. 4). The +NP, +PSi and +NPSi treatments resulted in an increase in phytoplankton biomass during incubation, whilst biomass decreased for the +NSi treatment and the control (Fig. 4; Table 2). For B2, the largest increase in net growth rate of around 0.20 day-1 was found for the +NPSi treatment (Fig. 4; Table 4).
For B3, the initial Chla concentration was lower than that at the onset of B2 and higher than during the start of B1. As for B2, the +NP, +PSi and +NPSi treatments resulted in an increase in phytoplankton biomass during incubation, whilst biomass decreased for the +NSi treatment and the control (Fig. 4; Table 2). The increase in phytoplankton biomass was highest for the +NPSi treatment. For those treatments at B3 where the biomass increased, net growth rates were higher than observed at B2 (Table 2).
For B4, the response of the phytoplankton community after the addition of the different nutrients was more difficult to interpret than for the other bioassays as we do not have information on the effects of +NSi addition. DIN concentrations, however, seem high sufficient (~20 μmol L-1) not to limit phytoplankton growth. Compared to the previous bioassays, the overall increase in Chla was very limited with highest net population growth rates of approximately 0.19 day-1 in the +NP, +PSi and +NPSi treatments (Fig. 4; Table 2).
3.3. Carbon incorporation rates
The C-incorporation rates as determined by 13C-label incorporation into POC differed between the various bioassays and the various treatments (Fig. 5). ANOVA analysis showed significant differences in 13C derived C-incorporation rates between the nutrient addition treatments at the end of incubation and compared to the t=0 values (one- way ANOVA, p= 1.3 10-14). In B1, like in the Chla results, C-incorporation only increased in the +PSi and +NPSi treatments and reached similar values of approximately 125 μg C L-1 h-1.
In B2, B3 and B4, the label incorporation showed a similar pattern as the Chla results with a similar stimulation of C-incorporation in both the +NP and +PSi treatments and a higher rate of C-incorporation in the +NPSi. However, as we did not measure the C-incorporation rate every day, but only at the start and end of the bioassay, we cannot be sure about this.
3.4. Physiological properties
In the control experiments, Fv/Fm values slowly decreased during the 6 days of experiment in B2 and B3, whereas no changes were observed in B1 and B4 (Fig. 6). In all 4 bioassays, increases in Fv/Fm during incubation were noticeable for some treatments, with responses differing between the bioassays (two- way ANOVA, p=1.1 10-5 (bioassays) and p=6.4 10-11 (treatments)). In B1, the largest increase in Fv/Fm was observed in the +PSi and +NPSi

59
additions, whilst the response of +NP was limited. During the B2 and B3 experiments, Fv/Fm values showed a more or less similar response to nutrient addition in the +NP, +PSi and +NPSi treatments.
In spite of the aggregate formation during storage, still two dominant algal groups could be distinguished by means of the epifluorescence microscopy, ie. Thalassiosiraceae and Phaeocystis globosa. This is in agreement with the long-term field observations on phytoplankton species composition during this period (Philippart et al., in prep).
At the start of B1, B2 and B3, every aggregate showed a high alkaline phosphatase activity (APA) as judged by the high ELF fluorescence (Fig. 7B). In B4, however, less than 40 % of the aggregates showed high ELF and the rest low ELF fluorescence. During the incubations of the controls, the 100% high scores of ELF expression did not change for B1 and B3, and decreased from 100% high to 65% high and 35% low ELF expression in B2. For B4, the 30% high ELF expression increased to 90% during incubation, indicating that the cells depleted most of the DIP and DOP available at the start of the control treatment of this bioassay. For each treatment that included the addition of P (+NP, +PSi and +NPSi), the ELF fluorescence decreased, indicating a depressed APA activity. Only for some cases, aggregates without any APA activity were observed after incubation, e.g. +NP and +PSi addition in B1 where the aggregates showed a 20-30% of the aggregates lower ELF expression. Addition of nutrient mixtures without P (+NSi) also resulted in a lowered ELF expression in B1 and B2, although not as pronounced as when P was added. In the last bioassay (B4), high ELF fluorescence was only observed for less than 20% of the cells and the rest showed a low fluorescence.
In addition to the cells in the aggregates, we could detect single cells of pennate diatoms, which are associated with a benthic lifestyle (Fig. 7A and Fig. 8C and 8D). APA activity levels in the pennate diatoms were in general lower than found in the aggregates cells. In B1 and B2, no pennate diatoms were observed at the beginning of the bioassays. For those treatments in B2 where Si was added (+NSi, +PSi and +NPSi), however, pennate diatoms were observed at the end of the incubation period. Depending on the treatment, these diatoms showed no (+NPSi) to 25% high APA activity (+NSi). At the start of B3, 100% of the pennate diatoms showed a high APA activity, whilst only 60% of the pennate diatoms was comparably active at the start of B4. For B3 and B4, however, pennate diatoms were no longer found after incubation with +NP. The addition of P decreased the percentage of high ELF fluorescence in the diatoms cells in B3 (+PSi and +NPSi), but for B4 the situation was more complex as the +PSi addition did not show a decrease in APA activity, as was the case for the +NPSi treatment.

60
4. Discussion
4.1 Nutrient versus light limitation
The main aim of this research was to examine the nature of the limiting nutrient for phytoplankton production during a spring bloom in the western part of the Dutch Wadden Sea to aid to the understanding of contradictory results on nutrient limitation in the past. In turbid coastal ecosystems such as the Wadden Sea, light conditions during spring may also be a limiting factor for pelagic primary production (Heip et al., 1995; Cloern, 1999; Tillmann et al., 2000; Colijn and Cadée, 2003). For a correct interpretation of our results, we should know which role light limitation may have played in relation to nutrient limitation during our study period.
To examine the relative role of light versus nutrient limitation, Cloern (1999) developed a growth index based on ambient light conditions and concentrations. Applying this index to Marsdiep data from 1995/1996, Colijn and Cadée (2003) concluded that phytoplankton growth was mainly limited by light from August to April, co-limited by light and N (the only nutrient considered here) in June and July, and mainly N-limited in May. For the period from 1991–2005, (Loebl et al., 2009) argued that phytoplankton growth was generally limited by light from October to February, both by light and P in March and in September and mainly by P from April to July/August. Their result showed large interannual fluctuations in the timing and the nature of the nutrient limitation. For some years, for example, the index suggested limitation by Si or by N for one or two months per year.
In addition to ambient light and nutrient conditions, the values of the index are related to the parameter values of the half-saturation coefficients used to calculate the relative importance of the light (KI) and nutrient (KX) resources. Both calculations (Colijn and Cadée, 2003; Loebl et al., 2009) used the values for KI (2.4 mol photons m−2 d-1) and for KN (1.5 μmol L-1) from Cloern (1999). With regard to nutrient limitation, however, Loebl et al. (2009) additionally took the possibility of nitrogen and silicate limitation into account, using KP = 0.5 μmol L-1 and KSi = 5 μmol L-1 for PO4
3- and Si uptake respectively. As the result of the fact that Colijn and Cadée (2003) based their conclusions on nutrient versus light limitation solely on nitrogen, they might have missed nutrient limitation for phytoplankton growth in those months where the availability of nutrients other than nitrogen was low, e.g. in April.
The calculated average irradiance experienced by the algae during the day in April in the Marsdiep tidal basin was approximately 96 μmol photons m-2 s-1 during the photoperiod. The irradiance used during our bioassays (100 μmol photons m-2 s-1) was comparable to the ambient light conditions in the field. This corresponds to a daily light dose of 4.8 to 5 photons m-2 d-1, which is higher larger than KI of 2.4 mol photons m−2 d-1 generally used for phytoplankton in coastal waters (Cloern, 1999; Colijn and Cadée, 2003; Loebl et al., 2009). The general absence of light limitation in April as previously observed (Loebl et al., 2009) and the relatively high light conditions during our study compared to KI (Cloern, 1999) strongly suggests that nutrients and not light was limiting phytoplankton growth during the period of our bioassays.

61
4.2. Bioassays and physiological indices of nutrient limitation
Within all bioassays, the addition of P resulted in an increase in Chla concentrations, indicating that the ambient PO4
3- concentrations were not sufficient to support maximum growth of the phytoplankton community. For many of the bioassays, the biomass appeared not to respond immediately to nutrient addition. Such a lag phase is common in experiments where stimuli are applied, in particular when a limiting nutrient is added (Duarte, 1990; Scharek et al., 1997). Because the duration of the lag phase may vary for different algal species, a pulse of nutrients can potentially change the phytoplankton community structure, with relatively small and fast-growing algal species taking advantage over others (Duarte, 1990; Scharek et al., 1997). If the response of the phytoplankton community following the nutrient additions resulted in an increase of the ratio between Chla and carbon, then Chla-change based growth rates are overestimating actual growth rates. In spite of the fact that we measured POC and Chla, we cannot determine the Chla:C ratio because the algal C fraction is only a small fraction of the total POC. The length of the lag phase of several days further suggests that internal P stores in the phytoplankton were depleted at the start of the incubations, corroborating P limiting growth conditions in the Marsdiep in April 2010 as derived from the biomass response in the bioassays. Although questioned in several studies (Parkhill et al., 2001; Kruskopf and Flynn, 2005), the Fv/Fm ratio has proven to be a trustworthy indicator of nutrient limitation in other cases (Flameling and Kromkamp, 1998; Kolber et al., 1988; Lippemeier et al., 1999; Beardall et al., 2001). Our results clearly showed that when the P limitation of phytoplankton growth was relieved by adding P (i.e., the +NP, +PSi, and +NPSi treatments), the maximum PSII efficiency increased. Furthermore, the conclusions drawn from patterns of change in Fv/Fm were very similar to those from changes in phytoplankton biomass, showing that Fv/Fm can be applied as a reliable indicator of nutrient limitation in shallow coastal ecosystems such as the Wadden Sea. Our results for B4, where Si limitation appeared to have lowered Fv/Fm, is in agreement with the findings for diatom cultures (Lippemeier et al., 1999) but never observed during field studies before. Theoretically, a lowered Fv/Fm can be caused by an interference of phycobilin fluorescence from cyanobacteria (Campbell et al., 1998). According to our pigment data (not shown in this study), however, no zeaxanthin, a pigment biomarker for cyanobacteria, was detected. Therefore, we can conclude that the signal is from eukaryotic phytoplankton. In spite of that fact that Si is no structural component of the photosynthetic apparatus, we think it likely that when cells harvest more light than they can use for growth and formation of storage products, this will cause backpressure on photosystem II, lowering the PSII quantum efficiency. Only when the cells have reduced their pigment contents to cover their need, Fv/Fm will recover.
Alkaline phosphatase activity (APA) is used by many authors as an indicator of P limitation of phytoplankton (González-Gil et a l., 1998; Dyhrman and Palenik, 2001; Rengefors et al., 2003; Duhamel et al., 2010). In marine ecosystems, DOP is often present in higher concentrations than DIP (Dyhrman et al., 2007). APA is generally considered to be able to hydrolyse the phosphate group from DOP only when the phosphate group is ester-bound (C-O-P bond). So-called phosphonates, which are ether-bound organic P compounds (C-P bond), were

62
thought not to be used by phytoplankton until the recent observation of phosphonate utilization by the marine cyanobacterium Trichodesmium sp. (Dyhrman et al., 2006). The characterization of DOP in combination with the capacity of photoautotrophs to utilize the several forms of DOP requires further study.
Some studies suggest that APA is regulated by external phosphate concentrations (Jochem, 2000; Lomas et al., 2004) whereas others indicate that it is the internal P content which regulates APA activity (Rouzic and Bertru, 1997; Lomas et al., 2004; Ranhofer et al., 2009). Although we did not measure internal P storage, our results showed that ELF is a useful indicator of P-limitation, as it corroborates with the results from the changes in Chla, Fv/Fm, extracellular P concentrations, nutrient N:P ratios and C-incorporation rates. During the bioassays, we noticed that pennate diatoms repressed APA faster than the phytoplankton cells in the aggregates upon P-addition. At the end of the bioassays in which P was added, most cells still expressed AP activity although phosphate concentrations varied then between 2 and 8 μmol L-1 (indicating that growth was not P-limited anymore). These observations suggest that the APA life time varies between functional groups, and that algal species or even cells may differ in their APA regulatory response.
Comparison of the bioassays results with ambient nutrient concentrations revealed that the dissolved nutrient ratios did predict the nature of the limiting nutrient well as long as the concentrations were potentially limiting. The particulate N:P (PON:POP) ratio, however, did not give any conclusive information as it remained constant and did not capture the changes in concentrations at the start of B4. Our results suggest that the DIN:DIP ratio gave the best prediction, as the DIN:TDP, TDN:TDP or BAN:BAP ratios did not show P limitation in B3, whereas the other measures showed a P-Si-co-limitation for B3. The BAN:BAP ratio was less accurate than the DIN:DIP ratio suggesting that not all DOP might be biological available. The Si:P ratio is an indicator for competition and succession of diatoms, with ratios being highest in B1 where diatoms were the most dominant group in phytoplankton population (see § 4.3).
4.3. Interactions between nutrient limitation and phytoplankton succession
The variation in external inorganic nutrient concentrations during the spring bloom of 2010 coincided with changes in the phytoplankton community composition. At the beginning of our experimental period, i.e. at the end of March, the phytoplankton was dominated by diatoms, in particular by Thalassiosira species. The increase in Chla concentrations, C-incorporation and maximum photosynthesis quantum yields (Fv/Fm) were the highest in the treatments when Si and P were added (+NPSi and +PSi), indicating that P and Si were the limiting nutrients for phytoplankton growth. In order to build their silica frustules, diatoms require a sufficient amount of silicate in the system to complete their cell cycle (Claquin et al., 2002). Si limitation affects species composition and cells size (Rousseau et al., 2002; Martin-Jézéquel et al., 2003), and a decline in Si availability is shown to select for diatoms with a low Si-requirement (Bakker et al., 1994).

63
At the start of the second bioassay, colonies of the haptophyte Phaeocystis globosa had become very abundant, whilst phosphate concentrations were still very low. Possibly the development of this Phaeocystis bloom was supported by a P-flux from labile P in the sediment into the water column. Alternatively, P. globosa might have been able to utilize DOP as its P resource (Schoemann et al., 2005) or made us of a phosphate reserves stored in the polysaccharide matrix of the colonies (Veldhuis et al., 1991; Schoemann et al., 2005; Beardall et al., 2008). When Si concentration are high (>2 μmol L-1), P. globosa will rarely dominate the plankton community (Breton et al. 2006; Peperzak et al. 1998), but as Si concentrations < 0.15 μmol L-1, this situation did not occur during B2.
Although Si concentrations were not detectable at the start of B2 and B3, pennate diatoms species were found in the phytoplankton community; but remained a minor fraction of population. Bottom-dwelling pennate diatoms might have profited from the available Si-store in the sediment pore water (Rousseau et al., 2002). The addition of Si did not show an enhancement of planktonic diatom growth, indicating that a viable centric diatom population was lacking or that they were only present in very low numbers at the start of B2. This is in agreement with the observation that addition of Si did only stimulate the growth of pennate diatoms. At the start of the fourth bioassay, the ambient nutrient concentrations had changed with Si reaching values of 0.07 μmol L-1, DIP of more than 1.3 μmol L-1, and DOP approximately 7-fold higher than the DIP concentrations. The rise of available Si concentration coincided with a development of diatoms. All this suggest that nutrient limitation was less intense than in previous bioassays. The increase in DIP coincided with a decrease in the percentage of cells showing a high APA.
Nevertheless, all cells still showed ELF fluorescence, apart from a small fraction of pennate diatoms. Fv/Fm also showed a significant increase upon addition of the limiting nutrient(s). Similarly, the C-incorporation rates were enhanced in all nutrient additions scenarios, with the +NPSi addition given the highest rates of C-fixation. This suggests that the diatoms in the phytoplankton community were still Si-limited. But this can only be part of the explanation as also the +NP addition showed an increase in Fv/Fm, and this addition showed a similar response with regard to the increase in Chla as the other additions. Hence, the most likely explanation for these results seemed to be that the increase in DIP and DOP was very recent and that the algae had not yet completely acclimated to the increase in P availability.
This phytoplankton succession in spring from diatoms to P. globosa is a common pattern observed in the North Sea coast and Wadden Sea (Egge and Aksnes, 1992; Cadee and Hegeman, 2002; Rousseau et al., 2002). The ability of P. globosa to form colonies allows them to escape grazing (Peperzak et al., 1998). The consequence of it is that a larger fraction of the primary production will enter the microbial foodweb though ciliates and other microzooplankton are considered as trophic intermediate between small preys and larger predators. Phytoplankton species composition will influence the composition of the grazer community, but vice versa, grazing by microzooplankton will also impact the phytoplankton community structure, especially during Phaeocystis blooms (Stelfox-Widdicombe et al., 2004; Loebl and Van Beusekom, 2008).

64
Diatoms and Phaeocystis usually co-exist during initial phase of the spring bloom, but the grazing activity on the two different phytoplankton groups are different. Large phytoplankton species such as diatoms are generally preyed upon by large grazers like copepods (Loebl and Van Beusekom, 2008). Solitary cells of P. globosa are eaten by smaller grazers, whilst the grazing impact on P. globosa colonies is low. However, as we filtered the field samples using a 100 μm mesh size sieve, we removed the large grazers (and possibly some of the Phaeocystis sp. colonies) but not the microzooplankton. Because P. globosa can reach high growth rates (Schoemann et al., 2005), it seems likely that grazing by microzooplankton caused the lower specific growth rates based on the rate of increase in the Chla-concentration in B2 to B4 (Egge and Aksnes, 1992; Schoemann et al., 2005).
5. Conclusion
During the spring bloom of 2010, bioassays and physiological indices consistently showed that phytoplankton growth in the Marsdiep tidal inlet was limited by P, with co-limitation of P and Si for diatom growth. This corroborates previous general findings on the nature of the limiting nutrient for this part of the Wadden Sea based on dissolved nutrient concentrations (e.g., Philippart et al., 2007; Loebl et al., 2009). Results further underline the importance of knowledge of nutrient affinities of algal species, of conditions of algal cells (e.g., depletion of reserves), of nutrient sources (e.g., P-fluxes from the sediment) and of selective grazing to fully understand phytoplankton succession in shallow coastal waters. If P concentrations in the Wadden Sea further decrease, an increase in the intensity and duration of P limitation is likely and a shift from larger to smaller organisms with a better affinity for phosphate possible. Such a change in the strength of P limitation will not only shape phytoplankton communities but will also have an impact on total primary production, transfer of energy and carbon to higher tropic levels, and ecosystem services such as fishery yields.
Acknowledgements
This project was funded by the Coast and Sea Program (ZKO) of the Netherlands Organization for Scientific Research (NWO) projects P-reduce (grant nº 839.08.340) and IN PLACE (grant nº 839.08.210).

65
Tables
Table 1. Timing and start of the bioassays
Table 2. Relationships between phytoplankton responses towards nutrient additions and limiting
nutrients.
Table 3. Rank, functional group (diatoms or flagellates), abundance (cells ml-1) and contribution
to total density (%) of most dominant phytoplankton species in the Marsdiep tidal inlet during
the period at which the bioassays were performed (Philippart et al., unpublished)
Bioassay Start End
B1 30th March 2010 5th April 2010
B2 10th April 2010 16th April 2010
B3 17thApril 2010 23rd April 2010
B4 24th April 2010 30th April 2010
IF THEN Response to nutrient
additions Limiting nutrient(s)
NP, NSi and NPSi NitrogenNP, PSi, and NPSi Phosphorus NSi, PSi and NPSi Silicon
NP and NPSi Phosphorus &NitrogenNSi and NPSi Nitrogen & SiliconPSi and NPSi Phosphorus & Silicon

66
Table 4. Net growth rate of the phytoplankton community in the bioassays (d-1) based on changes
in Chla concentrations. The highest value within each bioassay is printed in bold, the closest
values to the highest values are underlined (na: none available).
Date Rank Species or taxonomic group D/F cells ml-1(%)
31th of March #1 Thalassiosiraceae (6-10 μm) diatom 3944 35#2 Thalassiosiraceae (10-30 μm) diatom 2597 23#3 Small colored flagellates (approx. 3 μm) flagellate 1539 13
6th of April #1 Thalassiosiraceae (6-10 μm) diatom 2790 25
#2Chaetoceros species (<10 μm; colony cells)
diatom 2405 22
#3 Small colored flagellates (approx. 3 μm) flagellate 1154 1014th of April #1 Phaeocystis globosa (colony cells) flagellate 3463 37
#2 Small colored flagellates (approx. 3 μm) flagellate 1347 14#3 Small colorless flagellates (< 6 μm) flagellate 1058 11
21st of April #1 Phaeocystis globosa (colony cells) flagellate 6734 31#2 Phaeocystis globosa (flagellate cells) flagellate 3752 17
#3Chaetoceros species (<10 μm; colony cells)
diatom 2116 10
29th of April #1 Phaeocystis globosa (flagellate cells) flagellate 5099 22#2 Small colored flagellates (approx. 3 μm) flagellate 3656 16#3 Small colorless flagellates (< 6 μm) flagellate 2501 11
Bioassays C +NP +NSi +PSi +NPSiB1 +0.15±0.088 +0.25±0.045 +0.28±0.077 +0.67±0.081 +0.64±0.063B2 -0.06±0.0.22 +0.14±0.030 -0.027±0.035 +0.15±0.0094 +0.20±0.011
B3 -0.054±0.031 +0.22±0.019 -0.011±0.03 +0.21±0.030 +0.31±0.022B4 -0.100±0.018 +0.19±0.068 na +0.16±0.086 +0.19±0.084

67
Figures
Fig. 1. The location at the NIOZ sampling jetty station in the western part of the Dutch Wadden
Sea.
Fig. 2. Concentrations of (A) Ammonium (NH4+), (B) NOx (nitrite (NO2
-)+ nitrate (NO3-)), (C)
dissolved inorganic phosphorus (DIP), (D) Si, (E) dissolved organic phosphorus (DOP) and (F)
dissolved organic nitrogen (DON) at the beginning of the experiments during weekly bioassays
from 30th March (B1) to 24th April (B4) 2010. Values give an average ± standard deviation
(n=2).

68
Fig. 3. Nutrient ratios (A) DIN:DIP, (B) DIN:TDP, (C) TDP:TDP, (D) Si:DIP, (E) PON:POP,
and (F) BAN:BAP on a logarithmic scale in the four bioassays at the start of the incubations.
Values are average (n=2) and the bar indicates the upper bar of the standard deviation. Dashed
line indicates the Redfield N:P ratio of 16 and the optimum Si:DIP ratio of 16.
B1 B2 B3 B4
(A) NH4+
Bioassays
Con
cent
ratio
nm
ollLL
1
0.0
0.2
0.4
0.6
0.8
1.0
1.2
1.4
B1 B2 B3 B4
(B) NOx
Bioassays
Con
cent
ratio
nm
ollLL
1
0
10
20
30
40
50
B1 B2 B3 B4
(C) DIP
Bioassays
Con
cent
ratio
nm
ollLL
1
0.0
0.5
1.0
1.5
2.0
B1 B2 B3 B4
(D) Si
Bioassays
Con
cent
ratio
nm
ollLL
1
0.0
0.1
0.2
0.3
0.4
0.5
0.6
B1 B2 B3 B4
(E) DOP
Bioassays
Con
cent
ratio
nm
ollLL
1
0
2
4
6
8
10
12
B1 B2 B3 B4
(F) DON
Bioassays
Con
cent
ratio
nm
ollLL
1
0
20
40
60
80
100
120
140

69
Fig. 4. Averages and standard deviation (n = 3) of bulk Chla concentrations in C (control, no
nutrient addition) and the different treatments +NP, +NSi, +PSi, +NPSi for the 4 different
bioassays (B1, B2, B3, B4). Note the difference in scale for B1 compared to B2, B3 and B4.
B1 B2 B3 B4
(A) DIN:DIP
Bioassays
log(
DIN
:DIP
)
0
1
2
3
4
5
B1 B2 B3 B4
(B) DIN:TDP
Bioassays
log
(DIN
:TD
P)
0
1
2
3
4
5
B1 B2 B3 B4
(C) TDN:TDP
Bioassays
log
(TD
N:T
DP)
0
1
2
3
4
5
B1 B2 B3 B4
(D) Si:DIP
Bioassays
log
(Si:
DIP
)
0
1
2
3
4
5
B1 B2 B3 B4
(E) PON:POP
Bioassays
log
(PO
N:P
OP)
0
1
2
3
4
5
B1 B2 B3 B4
(F) BAN:BAP
Bioassays
log
(BA
N:B
AP)
0
1
2
3
4
5

70
Fig. 5. Carbon incorporation into POC (μg C L-1 h-1) in the different nutrient treatments from the
four bioassays (B1-B4) at t=0 and t=6 (C, +NP, +NSi, +PSi and +NPSi) (n = 2). n.a. = data not
available (B4, +NSi treatment).
050
150
250
050
150
250
050
150
250
050
150
250
050
150
250
B1C
NP
NSi
PSiNPSi
050
100
150
050
100
150
050
100
150
050
100
150
050
100
150 B2
050
100
150
050
100
150
050
100
150
050
100
150
050
100
150 B3
050
100
150
050
100
150
050
100
150
050
100
150
050
100
150 B4
0 1 2 3 4 5 6
Chl
agg
L1
Time (days)

71
Fig. 6. Maximum PSII quantum efficiency (Fv/Fm) in C (control, no nutrient addition) and the
different treatments +NP, +NSi, +PSi, +NPSi for the four different bioassays (B1, B2, B3, B4).
Values are average ± standard deviation (n = 3).
t0 C NP NSi PSi NPSi
B1
0
50
100
150
t0 C NP NSi PSi NPSi
B2
0
50
100
150
t0 C NP NSi PSi NPSi
B3
0
50
100
150
t0 C NP NSi PSi NPSi
B4
0
50
100
150
Cin
corp
orat
ionn
ggLL
1hh
1
Treatments

72
Fig. 7. Percentage of cells showing ELF fluorescence: (A) in the pennates diatoms and (B) in
cells in the aggregates in the different bioassays before (t=0) and after (t=6 days) incubation
under different nutrient conditions, i.e. C (control, no nutrient addition), +NP, +NSi, +PSi and
+NPSi. Three categories of ELF fluorescence were distinguished, i.e. high ELF (intense bright
0.4
0.5
0.6
0.7
0.8
0.4
0.5
0.6
0.7
0.8
0.4
0.5
0.6
0.7
0.8
0.4
0.5
0.6
0.7
0.8
0.4
0.5
0.6
0.7
0.8 B1
0.4
0.5
0.6
0.7
0.8
0.4
0.5
0.6
0.7
0.8
0.4
0.5
0.6
0.7
0.8
0.4
0.5
0.6
0.7
0.8
0.4
0.5
0.6
0.7
0.8 B2
0.4
0.5
0.6
0.7
0.8
0.4
0.5
0.6
0.7
0.8
0.4
0.5
0.6
0.7
0.8
0.4
0.5
0.6
0.7
0.8
0.4
0.5
0.6
0.7
0.8 B3
0.4
0.5
0.6
0.7
0.8
0.4
0.5
0.6
0.7
0.8
0.4
0.5
0.6
0.7
0.8
0.4
0.5
0.6
0.7
0.8
0.4
0.5
0.6
0.7
0.8 B4
0 1 2 3 4 5 6
F vF m
Time (days)
CNP
NSi
PSiNPSi

73
green fluorescence), low ELF (pale green fluorescence), and no fluorescence at all. n.d. (none
detected) pennate diatoms, (*NSi in B4) none available data.
Fig. 8. Selected pictures of ELF stained samples. Comparison of fluorescence microscopy
images with a green excitation filters UV excitation. Images showing: red chlorophyll
autofluorescence (left images) and green fluorescence indicating the alkaline phosphatase
activity (right images) for Mediopyxis helysia (A & B), for pennate diatoms (C & D) and for
aggregated cells and a chain-forming Chaetoceros species (E & F).
t0 CN
PN
Si PSi
NPS
i
B1
0
20
40
60
80
100
n.d
t0 CN
PN
Si PSi
NPS
i
B2
0
20
40
60
80
100
n.dt0 C
NP
NSi PS
iN
PSi
B3
0
20
40
60
80
100
n.d
t0 CN
PN
Si PSi
NPS
i
B4
0
20
40
60
80
100
n.d
t0 CN
PN
Si PSi
NPS
i
B1
0
20
40
60
80
100
t0 CN
PN
Si PSi
NPS
i
B2
0
20
40
60
80
100
t0 CN
PN
Si PSi
NPS
i
B3
0
20
40
60
80
100t0 C
NP
NSi PS
iN
PSi
B4
0
20
40
60
80
100Perc
enta
ge (
%)
Treatments
High ELF Low ELF No ELF

74
A B
C D
E F

75
CHAPTER 4
Spatio-temporal variation in effects of phosphate
addition on C-fixation rates of phytoplankton
communities in the western Wadden Sea
Juliette Ly1, Catharina J.M. Philippart2 and Jacco C. Kromkamp1
Submitted to Journal of Phycology
1 Department of Marine Microbiology, Royal Netherlands Institute for Sea Research, P.O. Box 140, 4400 AC Yerseke, The Netherlands 2 Department of Marine Ecology, Royal Netherlands Institute for Sea Research, P.O. Box 59, 1790 AB Den Burg, The Netherlands

76
Abstract
Short term (24 hours) phosphate enrichment experiments were performed with natural phytoplankton communities in the Marsdiep basin of the Wadden Sea at three stations in mid-spring (April), late spring (May/June) and in early autumn (September). During the spring bloom in April, the effect of phosphate supply led to change in phytoplankton community, measured by an increase in C-fixation in phytoplankton using 13C stable isotope incorporation into phospholipid derived fatty acid (PLFA). At all stations, soluble reactive phosphorus (SRP) was the least available for phytoplankton growth and SRP concentrations varied between 0.01 and 0.02 μmol L-1. Phosphorus (P) limitation did occur mainly in spring at all stations investigated, but not all phytoplankton taxa reacted equally to the phosphate addition of the bioassays. The phosphate addition experiments showed that an increase of C-incorporation was found in Bacillariophyceae and Cryptophyceae, whilst Chlorophyceae and flagellates did not respond to it. When in situ SRP concentrations were higher in May compared to April, enhancement of C–incorporation upon phosphate addition was found at those stations where SRP concentrations were ≤ 0.13 μmol L-1. This was the case in two out of the three stations, thus showing spatial differences in the type of limitation. In early autumn, phosphate addition did not lead to an increase in C-incorporation rates. A high percentage of cells expressed cell-specific alkaline phosphatase activity (APA) as 65% to 98% of the cells were labeled with the AP specific fluorescent probe ELF® during April and May, and this decreased to less than 50% during September. This indicates that APA does not necessarily mean that the cells are P-limited as APA was noticed when phytoplankton taxonomic classes were not stimulated to raise their rate of C-fixation by phosphate addition. Dissolved organic phosphorus (DOP) concentrations varied between 0.18 and 0.44 μmol L-1. The high percentage of cells showing cell-specific APA suggests that not all DOP forms were bioavailable and therefore cannot fully sustain phytoplankton growth. Further research on the influence of DOP availability in the Wadden Sea is needed in order to explore the role of DOP in driving phytoplankton growth.

77
Introduction
Phosphorus (P) is an essential element in marine ecosystems, indispensable for cellular metabolism (Paytan & McLaughlin, 2007). It is a vital structural and functional component of living organisms, found in membrane lipids, in nucleic acids (phosphate-ester backbone of DNA and RNA) and is involved in chemical energy transfer through energy-rich phosphate bonds (e.g. as in ATP). Low P availability can limit phytoplankton growth and primary production, subsequently influencing phytoplankton community composition, size structure, and cellular nutrient quotas (Hansell & Carlson, 2002, Irwin et al., 2006, Duhamel et al., 2010). In constantly low P environments, for example, small cells with low metabolic P requirement and large volume to surface ratios are selected over large phytoplankton cells because such traits are advantageous for nutrient resource competition. In contrast to small cells, large cells are poor competitors in low nutrient environments due to their slower grow rates and higher nutrient uptake per unit of biomass (Irwin et al., 2006, Finkel et al., 2010). Because the grazing pressure is different for small compared to large phytoplankton cells, resulting shifts in phytoplankton community size structure are expected to affect transfer of carbon and energy to higher trophic levels (Barber & Hiscock, 2006).
Although marine systems are commonly characterized as nitrogen limited, P limitation is often observed in marine ecosystems (Elser et al., 2007, Ly et al, submitted). In those environments where P is limiting primary production, phytoplankton cells develop biochemical mechanisms to optimize their growth rate by lowering their P-demand. This mechanism forms the basis of the Droop model (Droop, 1974). Recently, lipid composition in phytoplankton cells in P-limited environment has received much attention. Limiting nutrients often induce an increase in storage lipid triglycerides (Lynn et al., 2000, Müller-Navarra, 2008, Yoshimura et al., 2009). The decrease of P in aquatic environments can influence lipid composition and membrane structure in eukaryotic phytoplankton by substituting phospholipids (phosphotidylcholine and/ or phosphatidylethanolamine) to non-phospholipid membranes (betaine lipids) (Van Mooy et al., 2009, Martin et al., 2010).
In contrast to storage lipids, phospholipids fatty acids (PLFAs) are tightly coupled to the growth rate. As such, PLFA can be used as biomarkers to obtain information about phytoplankton community structure (Dalsgaard et al., 2003, Dijkman et al., 2009, Bianchi & Bauer, 2011). Thus, by using stable isotope labeling and analysis of fatty acids in general and of the PLFA pool in particular, one can obtain important information about both the phytoplankton composition and the group specific primary production (Boschker et al., 2005, Dijkman et al., 2009, Ly et al., submitted). We used this approach to study the effect of possible P limitation of phytoplankton in the western part of the Dutch Wadden Sea.
The Wadden Sea is a tidal sea enclosed by barrier islands separated by tidal inlets and the mainland. Between 1970s and 1990s, the Wadden Sea became more eutrophic, due to high loading of nitrogen (N) and phosphorus (P) from anthropogenic activities. Since the 1980s, long-term time series data showed a decrease in inorganic phosphorus and a minor decrease in

78
nitrogen loads in this area (www.waterbase.nl). Comparison of long-term information on riverine nutrient loads and phytoplankton dynamics strongly suggested that the decrease in soluble reactive phosphorus (SRP) concentrations had an effect on the growth and seasonal development of primary producers and primary consumers, although no long-term trends in the timing of the phytoplankton spring bloom were observed (Philippart et al., 2010). In addition, large changes were found higher up in the food webs (Philippart et al., 2007). Previous laboratory and field studies conducted at the long-term monitoring station, the NIOZ sampling jetty in the most western part of the Dutch Wadden Sea, demonstrated that P was the primary limiting nutrient for phytoplankton growth during the spring bloom although diatoms also had a silicate shortage (Ly et al., submitted).
The present study aimed at investigating whether the phytoplankton populations throughout the western part of the Dutch Wadden Sea are P-limited during different phases in the phytoplankton growth season. To investigate the potential P limitation on the phytoplankton community, we performed short-term phosphate enrichment experiments, which were conducted with natural phytoplankton assemblages during 24 hours incubations. To further understand coastal phytoplankton community changes in response to P supply in the environment, we used 13C-incorporation into PLFA analysis to characterize production rates in different phytoplankton groups. By quantifying C-incorporation in phytoplankton PLFA from different taxonomic groups and looking at the expression of alkaline phosphatase activity (APA), we investigated whether phosphate supply leads to changes in C-incorporation for the whole phytoplankton community or whether specific phytoplankton functional groups are affected by the relieve from P limitation.

79
Material and methods
Study sites- Experiments were performed on board of the research vessel “Navicula” (NIOZ) during three different cruises in 2011. The first cruise (Navicula (Nav) 7) took place during the spring bloom (Nav7: 18th to 21st of April), the second during end of the spring bloom (Nav8: 30th of May to 1st of June) and the third in fall (Nav9: 26th to 29th September). The three sampling locations (S18, S19 and S20) are shown in Fig. 1. Water samples were collected at local high tide just below the water surface with a Niskin bottle.
Phosphate addition experiments -The seawater samples were poured into four 10 L polycarbonate bottles and phosphate was added to two bottles (+P treatment ~10 μmol L-1 Na5H3PO4 final concentration). The other two bottles did not receive any phosphate treatment (-P treatment). All bottles were incubated on board under natural light conditions and in situ temperature for 24 hours and regularly mixed in order to prevent sedimentation of the cells. After 24 hours of incubation, NaH13CO3 was added to the bottles, equaling 4% of ambient dissolved inorganic carbon concentration and incubated for another two hours under artificial irradiance of 100 μmol photons m-2 s-1. Experiments were terminated by filtering 2 L of each PLFA sample over pre-combusted glass fiber filters (Whatman GF/F filters, 0.7 μm pore size). The filters were then stored at -80 oC until analysis.
Chla and nutrient measurements - Chla concentrations at the start of the experiment were determined by filtering 500 mL samples over glass fiber filters (Whatman GF/F filters). Filters were extracted with 10 mL of a mixture of 90 mL acetone and 10 mL water using a CO2-gas cooled bead-beater. After extraction and centrifugation (3 min, 1500 rpm) to clear the solution, pigments were separated and analysed by HPLC (Dionex LC-02) using a reversed-phase analytical Novapak C18 column (4 μm, 15 cm) (Rijstenbil, 2003). Chla was detected by a photodiode array and fluorescence detector. The Chla was identified by retention time and its absorption spectra in comparison with those given in the literature (Jeffrey et al., 1997) and calculated after calibration with commercial standards (Sigma, Chla-C5753). To determine nutrients concentrations, 125 mL of seawater was collected into a HDPE bottle (Nalgene), passed through a 0.2 μm Supor Membrane (Acrodisc Pall) and stored at -80 oC until analysis. Nutrient concentrations were analyzed with a segmented continuous flow analyzer (TRAACS 800 autoanalyzer, Bran and Luebbe) according to the instructions provided by the manufacturer. Total dissolved nitrogen (TDN) and total dissolved inorganic nitrogen (DIN = (NOx + NH4
+ ; NOx = NO3- + NO2
-), total dissolved phosphorus (TDP), soluble reactive phosphorus (SRP) and silicate (Si) were measured. Dissolved organic nitrogen (DON) and phosphorus (DOP) were obtained by subtracting total dissolved forms minus inorganic forms.
C-incorporation rates - 13C-incorporation (μg C L-1) in PLFA was calculated following specific isotopic carbon equations (Middelburg et al., 2000). Stable isotope data are expressed in the delta notation (δ13C) relative to carbon isotope ratio (R) (13C/12C) of Vienna Pee Dee Belemnite (R VPDB = 0.0112372), we calculated ratios R from the δ13C ratio:
80
R = [(δ13C / (1000 +1) × Rstd]. The absolute 13C- incorporation rate (μg 13C L-1 h-1) was calculated from the difference between labeled in each individual PLFA to non labeled PLFA for each treatment according to. 13C incorporation = (13Fsample – 13Fbackground) × [PLFA]
where 13F is the fraction isotopic obtained being the 13C fraction (13F = R/(R+1)) in labeled individual PLFA samples (13Fsample) and non labeled samples (13Fbackground). [PLFA] represented individual PLFA concentrations (μg L-1). In order to obtain the C-incorporation rate of the treatments with (+P) and without (-P) phosphate addition, the data were corrected for small differences in initial DI13C concentrations added (4% of ambient DIC) during the incubation time (two hours). The final part of the calculation of C-incorporation rates required the conversion from PLFA to C biomass. In addition, the total phytoplankton PLFA was converted to carbon biomass using the average phytoplankton conversion factor of 0.046 g of total phytoplankton PLFA (PLFAtotal –PLFAbacteria) to C per gram of carbon biomass (Van den Meersche et al., 2004). The conversion factor from phytoplankton PLFA groups (SFA, MUFA and PUFA) to cell carbon biomass was obtained as a product of the percentage of each PLFA group (percentage of total PLFA) corrected for the total phytoplankton conversion factor 0.046 carbon PLFA per carbon biomass. Calculated conversion factor values ranged from 6.7 10-3 to 0.028. The conversion factors for phytoplankton taxonomic classes were derived from PLFA culture data (Dijkman & Kromkamp, 2006) using group specific PLFA (Table 2). The percentage of specific PLFA of each taxonomic class was calculated as the percentage of specific PLFA × percentage of PLFA per unit of carbon. Conversion factor values for phytoplankton taxonomic classes were ranged from 0.023 and 0.056 carbon PLFA per carbon biomass (0.026 Chlorophyceae, 0.056 for Bacillariophyceae, 0.051 for flagellates (combined Prymnesiophyceae and dinoflagellates) and 0.023 for Cryptophyceae).
PLFA analysis- PLFA samples were extracted using a modified Bligh and Dyer method (1959) (Middelburg et al., 2000). At first, total lipids were extracted and separated into different polarity classes of lipids using a silicic acid column. The column eluted several solvents (chloroform, acetone and methanol) representing different lipid fractions. The methanol fraction was collected and contained most of the PLFA. PLFA solutions were derivatized in order to measure fatty acids methyl esters (FAMEs) using gas chromatography-combustion isotope ratio mass spectrometry (GC-c-IRMS) (Dijkman et al., 2010). The FAMEs were determined according to their retention time and were compared to reference standards (12:0 and 19:0). PLFAs can be classified into different classes depending on their presence/ absence and number of double bonds in the PLFA structure. The PLFA nomenclature used in this study follows the pattern of X:YωZ. The ‘‘X’’ position identifies the total number of carbon atoms in the fatty acid. Position ‘‘Y’’ is the number of double bonds. ‘‘Z’’ designates the carbon atom from the aliphatic end before the first double bond. PLFA without double bonds are saturated fatty acids (SFA), PLFA with one double bond are mono-unsaturated fatty acids (MUFA), and PLFAs

81
containing two or more double bonds are poly-unsaturated fatty acids (PUFA). This is followed by a ‘‘c’’ for cis or a ‘‘t’’ for trans configuration of isomeric forms. The prefixes ‘‘i’’ and ‘‘a’’ stand for iso or anteiso, respectively, and these PLFA are called branched fatty acids (BrFA). BrFAs are typically derived from bacteria although they seem to be absent in cyanobacteria (Sharathchandra & Rajashekhar, 2011). The use of PLFA as a chemotaxonomic marker for microorganism classification is based on the fact that these organisms contain a great number of fatty acids, some of them unique, and that a variety of PLFA combinations are characteristic of different phytoplankton taxonomic classes (Table 4).
Alkaline phosphatase activity (APA)- At the beginning of each experiment, samples for specific detection of APA were treated using a molecular probe, ELF-97 (Endogenous Phosphatase Detection Kit; E6601, Molecular Probes, Invitrogen, California) following the instructions provided. The phytoplankton in a sample of 100-150 mL was concentrated by gravity filtration and resuspension using a membrane filter of 0.2 μm, and to 1 mL of the concentrated sample a freshly prepared ELF-97 working solution was added. After 30 min in the dark, 100 μL of the phosphate buffer solution and 20 μL of a mixture of paraformaldehyde and glutaraldehyde (0.01:0.1%) was added for preservation and the samples were then stored at 4 ° C. The ELF samples were analyzed within one week, and were visualized using an imaging epifluorescence Carl Zeiss axioplan 2 microscope. Each cell was scored as positive (green fluorescent precipitate from the ELF probe) or negative (no green fluorescent precipitation).
Statistical analysis- For each sampling period and station, data were analyzed using a two-way analysis of variance (ANOVA) analysis where “groups” (PLFA groups) or “classes” (taxonomic phytoplankton classes) and “treatments” (+P or –P) are considered as factors. Prior to analyses, data were checked for normality and homogeneity of variance.
Results
Chla, total PLFA and nutrient concentrations - The highest Chla concentrations were measured during the sampling period in April (Nav7) with differences observed between stations (Fig. 2). Chla concentrations ranged from 15 μg L-1 at S18 to 5.5 μg L-1 at S19, and S20 showed an intermediate concentration, around 9 μg L1. In May (Nav8), Chla concentrations were lower than in April and more or less similar at all three locations (3-4 μg L-1). In September (Nav9), average Chla concentrations were slightly higher than in May with highest value of 5 μg L-1 at S18. Chla and total PLFA concentrations displayed similar temporal dynamics (Fig. 2). Highest PLFA concentrations were found in April (2.8 to 11.2 μg L-1), followed by the lowest PLFA concentrations in May (0.6 to 2 μg L-1). Concentrations were as high as 6.8 μg L-1 in September. Spatial variation in PLFA concentrations, however, did not reflect the pattern in Chla concentrations (Fig. 2).

82
In April, SRP and Si concentrations were the lowest compared to the other two sampling periods in 2011 (Table 1), with SRP concentrations reaching not more than 0.02 μmol L-1 and Si concentrations varying between 0.27 and 0.41 μmol L-1. DIN concentrations were the highest in this sampling period, reaching values in the order of 20 μmol L-1. Therefore, molar DIN:SRP ratios were especially high during Nav7 (> 1000), far exceeding the Redfield ratio of 16. The molar Si:SRP ratios were between 21 and 31 in April. During Nav7, most of the TDP with concentrations of 0.21 μmol L-1 was in the form of DOP (>90%), whilst for the TDN the contribution of DON was less than 40%. In May, SRP concentrations ranged between 0.11 to 0.17 μmol L-1, which was approximately more than 10 times as high as observed in April. The Si concentrations in May, now varying between 1.53 and 1.94 μmol L-1, were approximately five times as high as those in April (Table 1). The DIN concentrations in May of around 10 μmol L-1 were, however, lower as measured in April. Compared to April, the molar DIN:SRP ratio was lower in May but still higher than 16 , whilst the Si:SRP ratio of all three stations was around the Redfield ratio. In May, approximately 50% of total dissolved phosphorus (SRP) and nitrogen (TDN) consisted of dissolved organic phosphorus (DOP) and dissolved organic nitrogen (DON), respectively. In September (Nav9), SRP concentrations of more than 0.4 μmol L-1 and Si concentrations of more than 8 μmol L-1 were higher than observed before, whilst DIN concentrations were close to values found during April. As in April and May, the molar DIN:SRP and Si:SRP ratios were still above 16. In September, DON and DOP had similar contributions ( ~50%) to TDN and TDP respectively, as was observed in May (Nav8).
C-incorporation rates of total PLFA and PLFA groups- C-incorporation rates for samples where no phosphate was added (-P) and as obtained from total PLFA (GC-IMRS analyses) were the highest during Nav7, and varied between 3 to 17 μg C L-1 h-1, with highest rates observed at S18 and lowest at S20 (Fig. 3), these rates of C-incorporation had decreased to 0.8-4 μg C L-1 h-1
during Nav8, and had increased again to 1 to 7 μg C L-1 h-1 during Nav9. ANOVA analysis showed significant changes in C-incorporation rates between sampling periods and across stations (Table 2). The different groups of PLFA patterns showed no consistent trends between locations within similar sampling periods. In general, C-incorporation rate into SFA groups were slightly higher than for MUFA and PUFA. C-incorporation rates into BrFA represented less than 0.3% of total PLFA-C-incorporation. In general, the addition of phosphate (+P) induced an increase of C-incorporation of total PLFA and the different PLFA groups during sampling periods Nav7 and Nav8, with the exception of S18 at Nav8 (Table 2), the station with the highest SRP concentration (Table 1). During Nav7, S18 showed higher C-incorporation than at the two other stations after addition of phosphate. During Nav9, no effect of phosphate addition was observed at the different stations (Table 2), indicating that the phytoplankton was not limited by P-availability.
Dominant phytoplankton community - The most abundant species during this study are shown in (Table 3; Philippart et al., in prep.). During the spring bloom in April 2011, the phytoplankton

83
community was dominated by Cryptophyceae, especially Hemiselmis spp., at station S18 whilst Prymnesiophyceae, mainly Phaeocystis globosa, dominated at stations S19 and S20. At the end of the bloom period in May/ June (Nav8), the phytoplankton community was dominated by small unidentified flagellates at S18 and S19, and by Thalassiosiraceae (Bacillariophyceae) at S20. In September, during Nav9, unidentified flagellates dominated the phytoplankton at S18 and S20, whereas a large number of Chlorococcales (Chlorophyceae) were observed at S19.
C-incorporation rates in different phytoplankton groups - Phytoplankton C- incorporation was divided into the major phytoplankton groups with the most dominant PLFAs found for each group (Fig. 4). The PLFA 16:1ω4 and 20:5ω3 occurs mainly in Bacillariophyceae, whereas 16:4ω3, 18:2ω6, 18:1ω7 and 18:3ω3 occurred in Chlorophyceae. Prymnesiophyceae and Dinophyceae are rich in 18:5ω3 and 22:6ω3 and are combined in this work as one group, the “autotrophic flagellates”. The PLFA 18:4ω3 has been observed to be one of the most dominant PLFA in Cryptophyceae (Table 4). During Nav7, for each station, significant differences were found between phytoplankton classes and treatments (Table 2). Addition of phosphate stimulated C-incorporation rates mainly the Bacillariophyceae at S18 from 1.3 μg C L-1 h-1 (-P) to 2.1 μg C L-1 h-1 (+P) and Cryptophyceae from 1.4 μg C L-1 h-1 (-P) to 1.8 μg C L-1 h-1 (+P) whereas Chlorophyceae and flagellates did not show significant changes in C-fixation rate after phosphate addition. Similar to the situation observed at S19 and S20, C-incorporation rates of Bacillariophyceae and Cryptophyceae showed a positive response after phosphate addition, although the observed rates were lower than for S18. Again, flagellates and Chlorophyceae did not show a particular response to phosphate addition. The C-incorporation rates in phytoplankton taxa were the lowest at S20, with values below 0.7 μg C L-1 h-1. The species Hemiselmis spp. (Cryptophyceae) was dominant at stations S18 and S20. One of the dominant PLFA in Cryptophyceae (18:4ω3) showed unexpectedly no labeling after addition of phosphate at S20, despite the presence of this PLFA, whereas the labeling was stimulated at S18 and S19. We have no explanation for this observation. Although C-incorporation rates were low and did not exceed 0.9 μg L-1 h-1 during Nav8, Bacillariophyceae seemed to be responsible for most of the C-incorporation at all stations. The two-way ANOVA analysis (Table 2) showed that addition of phosphate induced significant differences (stimulation) between phytoplankton taxonomic classes. However, addition of phosphate did not stimulate C-incorporation in all taxonomic classes distinguished at S18, the station with the highest SRP concentration. At S19, Bacillariophyceae, Chlorophyceae and Cryptophyceae responded positively to phosphate addition. At S20, C-incorporation from Bacillariophyceae and Chlorophyceae showed highest values during this sampling period. The contribution to C activity of Cryptophyceae, however, completely disappeared at S19 and S20 and flagellates also did not show activity at S20. We thus observed large spatial differences in response of the different phytoplankton taxonomic classes. Phosphate supply was not effective anymore as it did not stimulate C-incorporation rates in any of the taxonomic classes during Nav9.

84
In order to investigate the contribution of Bacillariophyceae, we also plotted the ΣC16/ΣC18 ratio which is used as an indicator of Bacillariophyceae abundance relative to other groups (Alfaro et al., 2006). Here, we applied the ratio based on the measured C-incorporation rates deduced from the PLFA labeling pattern. If this ratio, based on C-incorporation rates, exceeds 2, Bacillariophyceae are the most active taxonomic classes (Ly et al., submitted). According to the results, Bacillariophyceae only dominated the phytoplankton community during Nav8 at S20, which is in agreement with the results shown in Fig. 4. However, a closer inspection of the PLFA labeling rates showed that Bacillariophyceae also dominated the C-incorporation at S18 and S19 during Nav8 and S20 during Nav9, although the dominance was less pronounced than for S20 during Nav8 (Fig. 4). Hence the use of this ratio should be applied with caution, and a threshold between 1 and 2 would be more suitable to assess Bacillariophyceae dominance, a result obtained before (Ly et al., submitted).
ELF labeled cell- Most cells expressed APA during Nav7 and Nav8. According to the ELF fluorescence, more than 90% of the cells showed APA, and this coincides with SRP concentrations below 0.17 μmol L-1. The exception is at S18 during Nav7, which showed that 65% of the cells showed cell-specific APA. In agreement with the higher SRP concentrations during Nav9, the percentage of cells expressing ELF-fluorescence decreased substantially: less than 45% of the cell showed cell-specific APA.
Discussion
Our previous study (Ly et al., submitted) demonstrated that the phytoplankton community sampled at the NIOZ sampling jetty was limited by external SRP concentrations during the spring bloom and that Bacillariophyceae suffered from a P-Si co-limitation during part of this period. The present study investigated whether the potential P limitation is affecting differently different taxa within the phytoplankton community and whether the P limitation was also observed in other locations and other periods of the growth season in the Marsdiep basin of the Wadden Sea. The increased rates of PLFA-C-incorporation after the addition of phosphate demonstrate that different phytoplankton taxa respond differently to P limitation during early spring (Nav7) and late spring (Nav8). However, results from the Nav8 cruise show that during this late phase of the spring bloom spatial patterns in P limitation starts to develop, as phytoplankton from S18 is apparently not P-limited anymore whereas S19 and S20 are still P-limited. As the system is highly dynamic, as shown by Ly et al. (submitted), this spatial heterogeneity might indicate that the spatial dynamics in the P-supply and demand processes have a different timing, depending on the location within the Marsdiep basin. Our results suggest that the dynamics in S19 and S20 might lag behind those in S18, with S18 being the station closest to nutrient-rich freshwater input from Lake IJsselmeer.

85
Phytoplankton spring bloom: P limiting period for phytoplankton growth
When the phytoplankton community was P-limited, phosphate addition enhanced C-incorporation of total PLFA, with all PLFA groups (SFA or MUFA or PUFA) reacting positively. However, the strength of response of P-addition on C-incorporation into the different PLFA groups differed between seasons and stations. A laboratory study by Piepho et al. (2012) using unicellular algae demonstrated that PLFA composition is different amongst species and is related to P supply and light intensity. From the results of this field study, changes in PLFA groups from phytoplankton community were observed in different environmental conditions. Our results from mixtures of species composing the phytoplankton community cannot confirm or refute the trends observed in Piepho et al. (2012). PUFA are an essential compound in the diet of consumers (Guschina & Harwood, 2006). Algal cells responded to phosphate addition by altering the PUFA composition and abundance and the observed response varied widely from locations and sampling periods. Because of lack of desaturase enzymes (Δ12 and Δ15) in organisms of higher trophic levels (Hastings et al., 2001), a change in the composition and abundance of available PUFA in the system can potentially impact the grazer community by altering growth and recruitment rates (Brett & Müller-Navarra, 1997).
Alternatively to PLFA groups, results from specific PLFA-C-incorporation in the different taxonomic classes provide a quantification of their different contribution to total C-incorporation rates. Bacillariophyceae responded most to the phosphate addition, as shown from the increase in C-incorporation rates. Hence, the Bacillariophyceae seemed P-limited and are apparently poor competitors in a low phosphate environment, as was similarly observed in other studies (Egge, 1998, Rengefors et al., 2003). Larger cells such as Bacillariophyceae often have competitive disadvantage compared to smaller cells with their higher surface to volume ratio and higher growth rates (Finkel et al., 2010). Similarly to Bacillariophyceae, Cryptophyceae were also P-limited. One of the most abundant PLFA, 18:4ω3 is found in high abundance in Cryptophyceae (Kelly & Scheibling, 2012) but can also be produced in other phytoplankton groups. However, groups apart from Cryptophyceae were a minor component during Nav7, hence we attribute most of this specific PLFA to Cryptophyceae. The range in cell size and growth rates in Cryptophyceae are often similar to Bacillariophyceae (Moal et al., 1987) and for this reason it is not surprising that they behaved similar to the Bacillariophyceae upon a phosphate addition. However, Cryptophyceae have received less attention than other phytoplankton groups and require further investigation.
Not all phytoplankton taxa seem to be limited by SRP, as the Chlorophyceae and flagellates did not show a response to the phosphate addition. It might be that these Chlorophyceae or flagellates were small pico- or nanoplankton, which, due to their high surface/volume ratio, still had sufficient affinity for SRP. Alternatively, it might concern species with a relatively low P-requirement with regard to their size. For example, some flagellates possess a mixotrophic metabolism. It has been shown that mixotrophic flagellates showed lower SRP requirements than other phytoplankton taxonomic classes. They can be good competitors by

86
utilizing other food resources from dissolved or particulate nutrients, especially under low nutrient conditions (Jones, 2001, Boëchat et al., 2007). Another alternative explanation could be that some species with a high internal P-storage capacity (as polyphosphate) did not deplete their internal P-store yet within the 24 hours of the experiment. If these species were slowly growing, it might take several weeks (several cell doublings) to deplete their polyphosphate storage (Kromkamp, 1987).
Because the Wadden Sea receives a major proportion of the total phosphorus loads from freshwater discharge of Lake IJsselmeer and the river Rhine (De Jonge, 1990, Philippart et al., 2000, van Raaphorst & de Jonge, 2004), the marine phytoplankton community is mixed with freshwater species, mainly Chlorophyceae and cyanobacteria. The lower P uptake in Chlorophyceae might be due to a high internal storage caused by higher concentrations in freshwater than in marine systems. In addition, discharge of freshwater phytoplankton species will slow down their growth rates due to osmotic stress caused by the transition from low to high-marine salinity (Kirst, 1990). As a consequence, the freshwater Chlorophyceae may become less affected by short periods of P limitation than other groups, but this does not hold for the marine Chlorophyceae or Prasinophyseae, which were, however, not abundant.
End of phytoplankton spring bloom: a transition period between P limiting and P replete
conditions
In late spring (Nav8), phytoplankton biomass had decreased and SRP increased from near the detection limit to approximatively 0.11-0.17 μmol. L-1. The phytoplankton population during Nav8 showed less biodiversity as there was a dominance of the Bacillariophyceae in the phytoplankton community, especially at S20. The spatial situation was more heterogeneous than during the beginning of the spring bloom (Nav7). The supply of phosphate stimulated the C -incorporation in all PLFA groups (SFA, MUFA and PUFA) at S19 and S20. However, no stimulation was observed at S18 where SRP concentrations were the highest during the sampling period. This pattern coincides with the fact that the SRP concentrations at S18 were approximatively around 0.17 μmol. L-1, compared to the other two stations where concentrations were around 0.12 μmol. L-1 at S19 and S20. This suggests that the threshold for P limitation is between these two concentrations for the phytoplankton growth in the western Dutch Wadden Sea. Care has to be taken, however, with adopting this conclusion because we cannot track the recent nutrient history of the cell, and neither do we have quantification of phosphate fluxes from the porewater in the sediment to the overlying water.
P limitation did not occur homogenously in the Marsdiep basin at all times. During Nav7, all stations visited showed P-limitation, but as shown, during Nav8 only two out of the three stations showed P-limitation. This shows that the use of nutrient ratios as an index for the nature and strength of nutrient limitation should be treated with caution. DIN/SRP ratio during Nav8 varied between 40 and 120 mol mol-1, suggesting a P limitation in all stations. At S18, the lowest DIN/SRP ratio was observed, but the value remained above Redfield ratio implying potential P limitation for the phytoplankton community. Thus, nutrient ratios can only be interpreted in

87
combination with the actual concentrations and nutrient addition experiment. In shallow systems like the Wadden Sea, nutrient release from the sediment might be a source of a considerable nutrient flux, which does not necessarily become apparent in the nutrient concentrations and/or ratios.
When the phytoplankton showed P limitation, it was especially the Bacillariophyceae which were stimulated by phosphate addition. The Si/SRP ratio seems balanced indicating that Bacillariophyceae might experience a Si and P co-limitation, meaning that especially those diatoms with a low Si requirement responded positively to the phosphate addition (Ly et al., submitted), but we cannot prove this with the current data. It should be noted that we did not have the opportunity to also measure the effects of additions of other nutrients such as Si or DIN. The latter is probably not important as concentrations appeared to be too high to be possibly limiting, and therefore DIN probably played a minor role in shaping the development of phytoplankton community during the sampling periods. Si concentrations in late April (Nav7) were low, around 0.4 μmol L-1. Nevertheless, the molar Si/P ratio varied between 21 and 31, suggesting a relative Si surplus, despite the potentially limiting concentrations. Si concentrations were ranging from 1.5 to 1.9 μmol L-1 during Nav8, considerably higher than during Nav7. These values are close to the half saturation constant for uptake according to some studies (Peperzak et al., 1998, Philippart et al., 2007), so only when the diatoms showed a high growth rate, Si might become limiting (Ly et al., submitted).
Autumn period: resources available for phytoplankton growth
During the sampling period in autumn (Nav9), C-incorporation rates did not respond positively to phosphate addition. This agrees with the fact that SRP concentrations had risen to values exceeding 0.4 μmol L-1. In September, the phytoplankton composition had diversified again, especially at S18. Chlorophyceae and Bacillariophyceae were dominant. Flagellates, abundant at S18 and S19, were only a minor taxonomic class in S20. Phytoplankton taxonomic classes showed large spatial differences. Si and DIN concentrations were also high and unlikely to limit phytoplankton growth, suggesting that growth rates were high. As demonstrated by Ly et al. (submitted), despite the high turbidity of the water, the light availability in the water column was unlikely to limit the growth rate due to the shallow average depth (4.5 m) giving a photic zone/mixing depth ratio of 0.8. As a result the average irradiance experienced by algae throughout the water column exceeded 100 μmol photons m-2s-1 (equaling a daily light dose exceeding 4.7 mol photons m-2 d-1, which is substantially higher than the half saturation constant for growth of 2.4 mol photons m-2 d-1 taken in the study by Cloern (1999). Hence, high growth rates seemed possible where only the temperature controls the growth rate. This suggests that during Nav9 phytoplankton biomass was more likely to be limited by top-down control from grazers rather than by bottom up resources which did not seemed to be limiting.

88
Synthesis of PLFA under P limiting condition (C/Chla ratios)
The PLFA concentrations suggest that the phytoplankton biomass increased again after the low concentrations found at late spring during Nav8. However, this conclusion cannot be drawn from the changes in Chla concentrations, which were very similar between Nav8 and Nav9. From the phytoplankton PLFA concentrations, we calculated the phytoplankton derived C-content (PLFA/0.046) and used this to calculate the C/Chla ratios. According to these calculations the C/Chla ratio changed from 20±16 at Nav7 to 8±6 at Nav8 to 25±14 during Nav9. These values are on the low side (C/Chla= 50) , especially during Nav8, suggesting a problem with the PLFA to C-conversion factor obtained from culture studies (Van den Meersche et al., 2004) , but they show that Chla concentrations are a poor indicator of the phytoplankton as previously shown in (Kruskopf & Flynn, 2005). This suggests that the C/Chla ratio varies substantially between stations and seasons. If at Nav7 the PLFA were replaced by non-P containing lipids, this change in C/Chla would even have been higher. In addition, we cannot rule out that during Nav8 phytoplankton replaced their P-containing PLFAs for non-P-containing fatty acids as found in other marine ecosystems (Van Mooy et al., 2009), but one would have expected them to do so also during Nav7, unless the P limitation condition was very recent, so that the algae had no time to replace their PLFAs or other lipids compounds. However, we think the latter is unlikely as a culture study by Martin et al. (2010) with the marine diatom Thalassiosira pseudonana showed that an immediate response after the arrest of P supply caused a replacement of membrane phospholipids with non phosphorus lipids within 48 hours. It is therefore possible that this process could happen even much faster.
Alkaline phosphate activity regulation
Overall, high ELF fluorescence in phytoplankton cells occurred when SRP concentrations were low but not necessarily limiting. In spring during Nav7, a majority of the cells expressed APA causing an increase in AP enzyme synthesis and the availability to use DOP. During Nav8, nearly all cells showed high ELF fluorescence, but only S19 and S20 showed P limitation, whereas S18 did not show P limitation. Although, often ELF fluorescence appears to be a good indicator of P limitation in marine phytoplankton community (Lomas et al., 2004, Duhamel et al., 2010), a problem with the application of ELF-labeling studies is that the molecular probe does not always detect cell-bound AP, hence the absence of ELF fluorescence does not necessarily indicate the absence of APA (Dyhrman & Ruttenberg, 2006). Several studies have tried to find a threshold for SRP concentration below which AP is expressed (Van Boekel & Veldhuis, 1990; Hoppe, 2003). In our study, SRP concentration below 0.6 μmol L-1 induced cell-specific AP synthesis in >50% of the cells. Our results demonstrate that a single threshold for APA synthesis is not to be expected, as some cells were P-limited at lower concentrations than others. Therefore, it is important to combine the interpretation of APA and cell nutrient status with other approaches such as nutrient addition experiments (Beardall et al., 2001, Mackey et al., 2007). Because APA was still expressed at S18, it might be that the relieve of P limitation was only from recent date. Alternatively, due to stable nature of this enzyme

89
(Litchman & Nguyen, 2008), it might have had a long turnover time, so that its expression did not necessarily reflect the current situation. During Nav9, the phytoplankton community did not respond to phosphate addition, suggesting that phosphate supply was sufficient to fuel the cells needs for growth. This was reflected in a lower percentage of cells showing APA. Nevertheless, 30-50% of the cells still showed ELF fluorescence, despite the fact that SRP was not limiting. This suggests that cells actually expressed APA at SRP concentrations exceeding their demands, priming them for lower concentrations. Alternatively, the lower ELF expression might indicate recent cell history with low SRP concentrations. From the monitoring data of RWS (www.live.waterbase.nl) and from the NIOZ sampling jetty data, however, we know that concentrations in July and August varied between 0.2-0.6 μmol L-1, making the priming theory more plausible. However, DOP remained high and is a potential source of dissolved P when SRP is depleted during spring phytoplankton bloom. Thus, the phytoplankton cells might turn to use DOP as source of biologically available dissolved phosphorus to sustain phytoplankton growth (Duhamel et al., 2010), as indicated by the high APA. Nevertheless, the utilization of DOP did not lead to a relief of the P limitation, as found from the C-incorporation rates obtained from the SRP addition experiments. This might indicate that not all DOP is readily available, but that a fraction of the DOP may be in the form of phosphonate, which have a difficult to break ether bond (C-P) (Kolowith et al., 2001, Dyhrman et al., 2006) or occur in other none bioavailable forms (Sannigrahi et al., 2006). Therefore, phytoplankton species with broader potential DOP hydrolysis spectrum might be better competitors (Duhamel et al., 2010). Generally, the composition and seasonality of DOP is poorly understood (Sannigrahi et al., 2006, van Beusekom & de Jonge, 2012). For further insights in how DOP might influence the phytoplankton community development during P limitation, more work on DOP characterization during a seasonal cycle is needed.

90
Acknowledgements
We like to thank the crew of the RV Navicula logistic support during the cruises. We also thank Annette Wielemaker for providing us with the Wadden Sea map and Tadao Kunihiro for helping with C-incorporation calculation. This project was funded by the Coast and Sea Program (ZKO) of the Netherlands Organization for Scientific Research (NWO) projects P-reduce (grant nº 839.08.340) and IN PLACE (grant nº 839.08.210).

91
Tab
les
1
2
Tab
le 1
. Con
cent
ratio
ns a
nd r
atio
s of
dis
solv
ed n
utri
ents
(μ
mol
L-1
) at
the
thre
e st
atio
ns (
S18,
S19
and
S20
) in
the
wes
tern
Wad
den
Sea
visi
ted
in
3
Apr
il (N
av7)
, M
ay/J
une
(Nav
8) a
nd S
epte
mbe
r (N
av9)
201
1. T
DN
: to
tal
diss
olve
d ni
trog
en;
DO
N:
diss
olve
d or
gani
c ni
trog
en;
NO
x: s
um o
f 4
nitr
ate
and
nitr
ite;
NH
4+:
amm
oniu
m;
DIN
: di
ssol
ved
inor
gani
c ni
trog
en D
IN=
NO
x +
NH
4+;
TD
P: t
otal
dis
solv
ed p
hosp
horu
s; D
OP:
dis
solv
ed
5
orga
nic
phos
phor
us; S
RP:
sol
uble
rea
ctiv
e ph
osph
orus
; pho
spha
te a
nd S
i: si
licat
e; m
olar
rat
io D
IN/ S
RP
and
Si/S
RP.
6
Nav
icul
a
Stat
ions
[T
DN
] [D
ON
] [N
Ox]
[N
H4+
] [D
IN]
[T
DP
] [D
OP
] [S
RP
] [S
i]
DIN
/SR
P
Si/S
RP
Nav
7 (1
8/04
-21
/04)
18
35.7
14
.0
21.6
0.
21
21.8
0.
21
0.20
0.
01
0.31
21
76
31
19
29.0
9.
6 19
.0
0.36
19
.4
0.21
0.
20
0.01
0.
27
1935
27
20
29
.6
8.1
21.1
0.
39
21.4
0.
23
0.21
0.
02
0.41
10
72
21
Nav
8 (3
0/05
-01
/06)
18
18.2
11
.5
3.6
3.12
6.
7 0.
35
0.18
0.
17
1.53
40
9
19
25.7
12
.5
8.5
4.73
13
.2
0.34
0.
23
0.11
1.
92
120
17
20
23.3
12
.4
6.8
4.09
10
.9
0.34
0.
21
0.13
1.
94
84
15
Nav
9 (2
6/09
-29
/09)
18
31.9
12
.6
9.6
9.75
19
.4
0.78
0.
37
0.41
8.
1 47
20
19
31
.4
12.6
9.
7 9.
12
18.8
0.
80
0.38
0.
42
7.87
45
19
20
29
.5
10.3
10
.7
8.48
19
.2
1.03
0.
44
0.59
11
.09
32
19
7
8
9

92
Table 2. Summary of the analysis of variance (ANOVA) analysis at different Navicula sampling periods
(Nav7: 18th -21st April; Nav8: 30th of May to 1st of June; Nav9: 26th to 29th of September in 2011) and
stations (S18, S19 and S20). The sources of variability are type and treatments. Types represented
different groups of PLFA (SFA, MUFA, PUFA) or most dominant PLFA in phytoplankton groups
(Bacillariophyceae, Chlorophyceae, Cryptophyceae and flagellates. Treatments represented SRP addition
(+P) or no addition (-P). p values give the significance level of differences between from ANOVA (* p<
0.05, ** p< 0.01, p< 0.001).
Nav7 Nav8 Nav9 Stations Factors p value p value p value
PL
FA
gro
ups
S18 Group 1.1E-07 *** 2.2E-03 ** 2.6E-03 ** Treatment 3.9E-04 *** 0.12 ns 0.07 ns
Interaction 0.02 ns 0.89 ns 0.67 ns S19 Group 3.0E-11 *** 0.23 ns 2.3E-05 ***
Treatment 1.1E-05 *** 0.04 * 0.87 ns Interaction 6.9E-04 *** 0.08 ns 0.53 ns S20 Group 1.9E-05 *** 1.5E-03 ** 8.3E-05 ***
Treatment 0.01 * 0.28 ns 0.73 ns Interaction 0.11 ns 0.045 * 0.95 **
Phy
topl
ankt
on c
lass
es
S18 Class 1.9E-05 *** 1.67E-03 ** 2.5E-03 ** Treatment 0.01 * 0.16 ns 0.13 ns
Interaction 8.5E-04 *** 0.93 ns 0.71 ns S19 Class 5.5E-09 *** 0.035 * 5.2E-06 ***
Treatment 3.1E-04 *** 0.055 ns 0.71 ns Interaction 1.4E-04 *** 0.54 ns 0.67 ns S20 Class 7.1E-05 *** 6.66E-05 *** 1.7E-05 ***
Treatment 0.04 * 0.09 ns 0.91 ns Interaction 0.02 * 0.30 ns 0.79 ns

93
Table 3. Most abundant species or groups of species in the phytoplankton communities sample at local
high tide at the three stations (S18, S19 and S20) in the western Dutch Wadden Sea visited in April
(Nav7), May/June (Nav8) and September (Nav9) 2011 (Philippart et al., in prep.).
Sampling dates Stations Dominante species or orders cells/ml Fraction (%)
Nav7 18/04-21/04
S18 Hemiselmis spp. (2-9 μm) 2051 38 S19 Phaeocystis globosa (colony cells) 1958 28 S20 Phaeocystis globosa (colony cells) 2797 23
Nav8 30/05-01/06
S18 Small colored flagellates (~3μm) 1399 12 S19 Small colored flagellates (~3μm) 1492 41 S20 Thalassiosiraceae (6-10μm) 2984 41
Nav9 26/09-29/09
S18 Small colored flagellates (≈ 3μm) 2704 16
S19 Chlorococcales (solitary cells; ~3 μm) 3450 33
S20 Small colored flagellates (≈ 3μm) 2424 39
Table 4. Dominant individual PLFAs in different phytoplankton taxonomic classes (Bacillariophyceae,
Chlorophyceae, Prymnesiophyceae, Dinophyceae and Cryptophyceae)
Indicator for Dominant PLFA
References
Bacillariophyceae
16:1ω7 16:4ω1 20:5ω3
Dalsgaard et al., 2003
Chlorophyceae
16:4ω3 18:1ω7 18:2ω6 18:3ω3
Dalsgaard et al., 2003, Kelly & Scheibling, 2012
Prymnesiophyceae 18:5ω3 Hamm & Rousseau, 2003
Dinophyceae 22:6ω3 Dalsgaard et al., 2003
Cryptophyceae 18:4ω3 Kelly & Scheibling, 2012

94
Figures
Figure 1. Location of the sampling locations S18, S19 and S20 in the Marsdiep, the westernmost tidal
basin of the Wadden Sea (NL: The Netherlands).
Figure 2. Variation of Chla concentrations (μg L-1), total PLFA concentrations (μg L-1) and SRP
Nav
7S18
Nav
7S19
Nav
7S20
Nav
8S18
Nav
8S19
Nav
8S20
Nav
9S18
Nav
9S19
Nav
9S20[C
hla]
or
[PL
FA]
(g
L-1
) ;
[SR
P] *
10
(m
ol L
-1)
0
5
10
15
20
Chla
total PLFA
SRP

95
concentrations (*10 μmol L-1) at different Navicula sampling cruises periods (Nav7: 18th -21st April;
Nav8: 30th of May to 1st of June; Nav9: 26th to 29th of September in 2011) and across three sampling
locations (S18, S19 and S20). Y axis represented three parameters, Chla concentrations, PLFA
concentrations and SRP concentrations *10.

96
Figure 3. Changes in C-incorporation in total fatty acid (TFA), saturated fatty acid (SFA), mono-
unsaturated fatty acid (MUFA) and polyu-nsaturated fatty acid (PUFA) between phosphate addition (+P)
and no phosphate addition (-P) among three locations (S18, S19 and S20) and between sampling periods
(Nav7: 18th -21st April; Nav8: 30th of May-1st of June; Nav9: 26th to 29th of September in 2011) after 24
hours incubation with SRP addition (+P) and without SRP addition (-P). Data shown are means and
standard deviations. The y-axis in (B) shows different scale.

97
Figure 4.Changes C-incorporation in dominant PLFA between phosphate addition (+P) and no phosphate
addition (-P) in Cryptophyceae (Chlo), Bacillariophyceae (Baci), Cryptophyceae (Cryp) and flagellates
(flag) at the different stations (S18, S19 and S20) during Navicula 7: 18th -21st April (A), Navicula 8: 30th

98
of May-1st of June (B) and Navicula 9: 26th to 29th of September (C) sampling periods in 2011. Data
shown are means and standard deviations.
Figure 5. Changes in ratio ΣC16/ΣC18 (with C-incorporation) between phosphate addition (+P) and no
phosphate addition (-P) at different sampling periods (Nav7: 18th -21st April; Nav8: 30th of May-1st of
June; Nav9: 26th to 29th of September in 2011) and among different stations (S18, S19 and S20) Black
dashed line represented a ratio threshold. If ratio>2 suggests that Bacillariophyceae is the dominant
phytoplankton taxonomic class. Data shown are means and standard deviations.
Nav7-S18 Nav7-S19 Nav7-S20 Nav8-S18 Nav8-S19 Nav8-S20 Nav9-S18 Nav9-S19 Nav9-S20
C16 / C18
Rat
io
0
1
2
3
4
5
-P
+P
Navicula-Stations

99
Figure 6. Changes in percentage (%) of ELF expression, positive response (+ELF) and negative response
(-ELF) in the initial phytoplankton samples at different sampling periods (Nav7: 18th -21st April; Nav8:
30th of May- 1st of June; Nav9: 26th to 29th of September in 2011) and stations (S18, S19 and S20).
Nav
7-S1
8
Nav
7-S1
9
Nav
7-S2
0
Nav
8-S1
8
Nav
8-S1
9
Nav
8-S2
0
Nav
9-S1
8
Nav
9-S1
9
Nav
9-S2
0
0
20
40
60
80
100
Perc
enta
ge (
%)
Nav-Station
+ELF-ELF

100

101
CHAPTER 5
Absence of microphytobenthos suspension in the
western Dutch Wadden Sea: benthic and pelagic
community analyses
Juliette Ly1, Henk Bolhuis1, Catharina J.M. Philippart2 and Jacco C. Kromkamp1
In preparation
1Department of Marine Microbiology, Royal Netherlands Institute for Sea Research, P.O. Box 140, 4400 AC Yerseke, The Netherlands 2 Department of Marine Ecology, Royal Netherlands Institute for Sea Research, P.O. Box 59, 1790 AB Den Burg, The Netherlands

102
Abstract
Benthic and pelagic primary producer communities have been investigated at different sampling seasons (April, May/June and September in 2011) across three pelagic stations (S18, S19 and S20) and two benthic stations (TfS20 and TfS21) by comparing two methods: a molecular fingerprint, denaturing gradient gel electrophoresis (DGGE) and a chemotaxonomic biomarker, phospholipid fatty acid (PLFA). Results from cluster analyses showed that both methods were able to distinguish spatial and temporal changes in benthic and pelagic primary producers. The DGGE cluster analysis showed a clear separation between the benthic and pelagic communities whereas the PLFA cluster analysis showed overlap in the benthic and pelagic communities during May/June. This apparent discrepancy between the two methods may be attributed to different taxonomic resolution and physiological status of the studied communities. Hence, although the mesotidal system of the Marsdiep basin is strongly affected by wind and tidal forces, the data suggested that no major suspension events of MPB were observed. Pelagic cyanobacterial and eukaryotic communities showed a clear seasonal pattern, but no strong seasonal signal was observed in the benthic communities. Influence of freshwater discharge from Lake IJsselmeer may have influenced the cyanobacterial community at S18, which seemed to influence the cyanobacterial community more than the eukaryotic community. Although the C-fixation in MPB can exceed the C-fixation in phytoplankton (in September), the overall contribution of the MPB primary production to the annual aquatic primary production in the intertidal flats was lower than the phytoplankton primary production in the Marsdiep basin of the western Dutch Wadden Sea.

103
Introduction
In intertidal ecosystems, microphytobenthos (MPB) is an important driver of the biogeochemical cycles in the sediment (Paerl & Pinckney, 1996). Primary production of MPB can reach up to 50% in these ecosystems (Underwood & Kromkamp, 1999). Bed sediment in tidal basins consists of a mixture of sandy and muddy sediments (van Ledden et al., 2004). The muddy sediments are mainly composed of silt and clay (particle size <63 μm), an environment rich of organic matter that can host epipelic diatom community. In this type of sediment, MPB plays a role in sediment cohesion and stabilization (De Brouwer et al., 2000). In the transition of muddy to sandy environment, sediment displays less cohesiveness (Winterwerp & van Kesteren, 2004). An environment with coarse sand supports an epipsammic community, i.e. cells attached to the grains with limited motility (MacIntyre et al., 1996, Consalvey et al., 2004, Jesus et al., 2009). The sediment properties are partly a reflection of the hydrodynamic energy in the system and therefore govern MPB composition (Jesus et al., 2009, van der Wal et al., 2010). In addition, seasonal patterns of biological processes originate from higher trophic level may disrupt the stability of the bed sediment by modulating MPB biomass in the sediment with grazing or bird feeding activity (Daborn et al., 1993), making it more prone to erosion. Unlike the clear seasonality observed in phytoplankton blooms of temperate estuarine and coastal systems (Winder & Cloern, 2010), recurrent seasonality patterns of MPB community are more difficult to predict due to a combination of episodic abiotic events such as strong winds that affect erosion and deposition (De Jonge, 1985, Montani et al., 2003, Kang et al., 2006, Ubertini et al., 2012). As a consequence, MPB biomass and species composition can be reset episodically during the year (De Jonge, 1985, Ubertini et al., 2012).
In the eastern Wadden Sea (Ems estuary) where a muddy environment is dominant, up to 30% of the MPB biomass was found in the water column (De Jonge, 1985, De Jonge & Van Beusekom, 1992). Suspension of MPB cells increases pelagic primary production and sediment suspension may alleviate nutrient limitation in the water column (Boero et al., 1996, Coma et al., 2000, Tengberg et al., 2003, Forehead et al., 2013, Leote et al., submitted). Erosion of tidal flats can influence the concentration and composition of organic matter, nutrient fluxes and metabolic activity of the benthic community (Forehead et al., 2013). On the opposite, calm conditions will favor intact MPB biofilms which can act as a trap for nutrients released from the sediment. In the Wadden Sea tidal flats the rate of MPB photosynthesis and nutrient fluxes are variable and depend on the type of sediment (Billerbeck et al., 2007).
Thus far, little work has been done on the exchange between communities of benthic and pelagic primary producers in response to environmental change in the area of the western Dutch Wadden Sea. To fill up these gaps, we characterized benthic and pelagic primary producer communities at different temporal-spatial scales by applying two methodological approaches: phospholipid fatty acid (PLFA) composition of phytoplankton and MPB and denaturing gradient gel electrophoresis (DGGE) targeting the cyanobacterial 16S rRNA- and the micro-Eukarya 18S rRNA genes. PLFA are mainly associated with cell membranes and have short life times after their release in the environment. Thus, PLFA can be used as indicator of actual living biomass

104
and as a chemotaxonomic marker because their composition differs between taxonomic groups (Vestal & White, 1989, Dalsgaard et al., 2003, Bianchi & Canuel, 2011, Dijkman et al., 2009). In addition, we also used DGGE to discriminate between benthic en pelagic microorganisms. We investigated the benthic and pelagic primary producer communities at different pelagic and intertidal stations and at three different stages during their seasonal growth cycle in the Marsdiep basin of the western Dutch Wadden Sea in order (1) to investigate whether MPB is suspended into the water column by using two methods, PLFA and DGGE, (2) to estimate MPB primary production and compare it with pelagic primary production.
Material and methods
Study sites- Seawater was collected at three pelagic stations (S18, S19 and S20) during three sampling periods in 2011 from: Navicula 7 (Nav7: 18th-21st of April), Navicula 8 (Nav8: 30th of May-1st of June) and Navicula 9 (Nav9: 26th-29th September) with the R/V Navicula during high tide (Fig. 1). The coordinates for each station are shown in Table 1. Additionally, MPB communities from the tidal flat were sampled at two different locations TfS20 and TfS21 during low tide. The pelagic locations were chosen in such a way that they gave easily access to the nearby tidal flats. A third station TfS18 was also sampled, but the MPB biomass on this sandy tidal flat was so small causing large uncertainties in the data, that we did not include the data in the results.
PLFA extraction from the water column and sediment PLFA from the water column were sampled using a Niskin bottle just below the surface
and filtered onto pre-combusted glass-fiber filters (Whatman GF/F). PLFA from the tidal flats were collected by scraping the top centimeters from the sediment. All samples were kept at -80 °C until analysis. PLFA samples were extracted using a modified Bligh and Dyer method (1959) (Middelburg et al., 2000). Lipids were extracted in a mixture of chloroform:methanol:water (1:2:0.8, v:v:v). The extraction fluid was evaporated by shaking for at least two hours at speed 190 rpm using a vacuum extractor (Rapid Vap®, Labconco Corp., Kansas City, MO, USA). The formation of an aqueous-organic two layer system was induced by the addition of chloroform and water ratio of chloroform:methanol:water (1:1:0.9, v:v:v). The lower phase of chloroform containing the total lipid extract was collected. After evaporation of the solvent, the total lipid extract was fractionated into different polarity classes on silica columns (0.5 g Kieselgel 60; Merck) and eluted sequentially with chloroform:acetone:methanol (1:1:2, v:v:v). The methanol fraction containing the PLFA was collected. After evaporation of the methanol, a mixture of methanol:toluene was added (1:1, v:v) and methyl ester derivatives of the fatty acids (FAME) were synthesized using mild alkaline methanolysis (1 mL of 0.2 mol L-1 of sodium methylate). In order to stop the methylation reaction, a mixture of hexane:acid acetic:milliQ (1:0.3:1, v:v:v) was added. The upper layer of the aqueous-organic phase separation containing hexane was collected. In addition, 20 μL of each internal standard (19:0 and 12:0, both 0.1 mg) was added during the synthesis of the derivatives. The carbon isotopic composition of each individual

105
FAME was determined with GC-C-IRMS, using a Varian 3400 gas chromatograph equipped with a Varian SPI injector, which was coupled via a type II combustion interface to a Finnigan Delta S isotope ratio mass spectrometer (Middelburg et al., 2000). The FAMEs were identified according to their retention times compared to a reference standard.
Extraction of nucleic acids Samples for DNA extraction were taken from the water column at high tide and 0.5 mg
sediment during low tide. For the water column samples, 200-250 mL samples were filtered over 0.2 μm polycarbonate filters and stored at -80°C until use. Filters were cut into small pieces (area of 0.3 mm2) using a sterile scalpel and DNA was extracted using the UltraClean Soil DNA isolation kit (Mo Bio Laboratories, Inc.) according to the manufacture’s recommendation. The same kit was used for extraction of DNA from sediment samples. DNA concentration and purity were determined with a spectrophotometer NanoDrop ND 1000 (NanoDrop Technologies, Inc., Wilmington, DE 19810, USA).
PCR amplification of 16S- and 18S rRNA genes To amplify the 18S rRNA-Eukarya gene, we used primer pair A (EK1-F and EK1520R)
that amplifies a 1520 bp long fragment and primer pair B (EK1-F and EUK 516r-GC) that amplifies a 556 bp long fragment, and which includes the GC-clamp necessary for DGGE. The 16S rRNA gene fragments from cyanobacteria were amplified using primer pair A (CYA 359f, U1492R) that amplifies 1520 bp long fragment and primer pair B (CYA 359f-GC and CYA 781 R a/b) that amplifies a 462 bp long fragment. The sequences of the primers used are shown in Table 2.
For the DGGE analysis, a nested PCR was performed. In the first PCR, 16S- and 18S-rRNA genes amplification was performed using primer pairs A followed by a second PCR reactions using primer pairs B. The first PCR was performed in a 25 μL volume containing 2μL of DNA template (final concentration 200 ng), 2.5 μL of 10 × PCR buffer (New England Biolabs), 0.125 μL of DMSO (3% final concentration), 2.5 μL of 0.1% w/v bovine serum albumin (BSA), 0.5 μL dNTP (10 mM), 0.5 μL of each primer (10 μM), 0.125 μL of Taq DNA polymerase (New England Biolabs) (2 U/μL) and 15.125 μL of diethyl pyrocarbonate-treated water (DEPC). The second PCR was performed in a volume of 25 μL containing 2 μL of PCR products from the first amplification, 2.5μL of 10 × PCR buffer (GE Healthcare), 1.25 μL of DMSO, 2.5 μL of BSA (0.1% w/v), 0.5 μL of dNTP (10mM), 0.5 μL of each primer, 15.125 μL of DEPC, 0.125 μL of 1 U/μL rTaq DNA polymerase (GE Healthcare). Between the first and the second PCR, the PCR products were purified with a Sephadex G-50 Superfine kit (Sigma-Aldrich) to remove primers and other PCR components that may interfere with the second PCR. The PCR cycling conditions are described in Table 3.

106
DGGE analysis
PCR products were separated based on their GC contents on a denaturing gel containing a gradient of the denaturants urea and formamide ranging from 10% to 60% for 16S rRNA, and from 30% to 55% for the 18S rRNA. Electrophoresis was performed at 60 ºC and 100 V during 16 hours on the PhorU DGGE system (Ingeny, Goes, Netherlands). After electrophoresis, the gel was stained with silver nitrate according to the protocol of Bolhuis et al. (2013).
13C incubation procedures
Water samples were collected with a Niskin bottle just below the water surface. Samples were divided into four polycarbonate bottles of 10L each. Water samples were enriched with NaH13CO3 (99% 13C; Cambridge Isotope Laboratories, Inc.) to 4% of the ambient dissolved inorganic carbon (DIC) (2.2 mmol L-1, E. Epping, pers. communication) and incubated under artificial light at 100 μmol photons m-2 s-1 for two hours. POC samples were separately filtered before and after 13C incubation onto pre-combusted glass fiber filters (Whatman GF/F). The 13C stable isotope composition of the samples was analyzed with a Carlo Erba elemental analyzer coupled inline with a Finnigan Delta S isotope ratio mass spectrometer (EA-IRMS). Excess 13C (μg L-1) in POC was calculated following isotopic calculations according to Middelburg et al. (2000). Stable isotope data are expressed in the delta notation (δ13C) relative to carbon isotope ratio (R = 13C/12C) of Vienna Pee Dee Belemnite (R VPDB = 0.0112372): δ13C = [(Rsample/ RVPDB) -1 × 1000]. The 13C-fixation into bulk organic matter (μg C L-1 h-1) was calculated from the difference of the fraction of 13C in POC at the start and at the end of the incubation, multiplied by the POC concentration at the start of the incubation. The fraction of 13C in POC was calculated as 13C/ (13C + 12C) = R/ (R+1). In the water column, 13C-fixation into bulk organic matter (mg C m-2 h-1) was calculated per unit surface by integrating production rates over the water depth (z = 4.5 m). For each tidal flat station, the 13C labeling experiment was performed using a frame of 0.25 m2 during the emersion period. A volume of 250 mL containing 13C labeled bicarbonate (NaH13CO3) solution was sprayed to the entire sediment surface delimited by the frame. The NaH13CO3 added to the sediment represented 40% of the DIC concentration in the overlying water, assuming that the added DI13C was distributed in the top 3 mm of the sediment. POC samples were collected by scraping the top centimeter of the sediment before and after 13C incubation. The incubation was four hours, depending on the site and started within 30 min after the tide receded. Samples were kept at -80 °C until analysis. The 13C-fixation into bulk organic matter (mg C m-2 h-1) was calculated using a specific density of the sediment (σ= 2.65 kg dm-3) (Slomp et al., 1997).
Data analysis
Cyanobacterial and eukaryal community analyses based on DGGE band patterns were analyzed using BioNumerics 6.6 software (Applied Maths, NV, Sint-Martens-Latem, Belgium). The DGGE banding patterns were examined in two ways, with a cluster analysis and with a Shannon‘s diversity index analysis. A DGGE band was considered to represent an operational
107
taxonomic unit (OTU). The intensity of the DGGE band was taken as a measure for the relative abundance of this OTU in the community. From the number of OTU, the Shannon’s diversity index (H) was calculated (Shannon & Weaver, 1948). Using the number of bands, a matrix of similarity was obtained by applying the Jaccard algorithm. Based on this similarity matrix, unweighted pair-group averaging, the so-called UPGMA clustering method was applied using software Primer (version 6.1.12) (Clarke & Gorley, 2006). A similar clustering method was performed on the PLFA data (composition expressed as the mol percentage of total PLFA). Results from DGGE and PLFA are presented as dendograms. To test for significant differences (p<0.05) between stations and sampling periods in C-fixation rates in pelagic and benthic systems, two way analysis of variance (two-way ANOVA) was applied to the data.
Results
Fig. 2 shows three cluster analyses of DGGE band patterns with cyanobacterial 16S rRNA, eukaryal 18S rRNA and PLFA from five locations (three pelagic locations: S18, S19 and S20 and two benthic locations: TfS20 and TfS21).
Cyanobacterial DGGE band patterns and diversity
Cluster analysis of the cyanobacterial DGGE band patterns revealed two distinct groups which separated benthic (A1) and pelagic (A2) communities (Fig. 2A). None of the fingerprints within the two groups showed 100% similarity. Within the benthic group (A1), DGGE band patterns did not show apparent temporal and spatial grouping. On the opposite, the pelagic cyanobacterial group (A2) was divided into three subgroups, separating the three sampling periods (Nav7, Nav8 and Nav9). S18 did not group with the other stations during the Nav8 and Nav9 cruises. The cyanobacterial community at S18 from the Nav7 grouped with the Nav8 communities (with ~ 30% similarity), whereas the community from S18/Nav9 clustered more closely related to the communities found during Nav7 (~ 40% similarity). The cyanobacterial H-index in the pelagic stations was lower during Nav7 than during Nav8 and Nav9 (Fig. 3A). Diversity in the cyanobacterial benthic community was higher than in the pelagic communities during Nav7 and Nav9, whereas the H-index was comparable between both types of communities during Nav8. The highest H-index was observed at Tf20 (Nav9) (1.9) and the lowest value was observed at TfS21 (Nav7) (0.7).
Eukaryal DGGE band patterns and diversity
Cluster analysis of the eukaryal DGGE band patterns revealed a higher number of bands than for the cyanobacterial DGGE (Fig. 2B). Similar to the cyanobacterial cluster analysis, eukaryal community cluster patterns revealed a clear distinction between benthic (B1) and pelagic (B2) communities. The eukaryal benthic cluster B1 revealed two major subgroups. One subgroup comprised the communities of TfS21 during Nav7 and Nav8. Only during Nav9, both stations TfS20 and TfS21 formed one group. Clustering analysis of the eukaryal pelagic DGGE

108
bands showed a clear temporal pattern (B2): each of the three seasons formed a separate cluster with a similarity of approximately 55%. Within each of these clusters, S18 and S19 were more similar to each other than to S20 during Nav8 and Nav9, whereas during Nav7, S18 was more similar to S20 than to S19. The H-index in eukaryal communities was higher than for the cyanobacterial communities (Fig. 3B). The H-index for the eukaryal pelagic community only showed little variability between the stations and the three different seasons. The eukaryal benthic H-index at the two stations was more variable although no particular pattern was discerned. At TfS20, diversity was lower than at TfS21 during Nav7 and the situation was opposite during Nav8. The H-index were similar between the two benthic communities (TfS20 and TfS21) during Nav9. Overall, eukaryal diversity was higher in the pelagic than in the benthic communities.
PLFA composition pattern
A cluster analysis based on the relative abundance of PLFA is depicted in Fig. 2, C. The cluster analysis included PLFA synthesized by bacteria (branched fatty acids), but removing these branched fatty acids from the analysis did not affect the clustering patterns. The cluster analysis without bacterial PLFA revealed two groups. Cluster C1 included all the benthic and pelagic stations sampled during Nav8, and they overlapped with a similarity close to 75%. The pelagic stations sampled during Nav7 and Nav9 clustered with a similarity around 70% (cluster C2), although S19 sampled during Nav7 did not group with the other two stations.
C-fixation in phytoplankton and microphytobenthos
The C-fixation rates of the phytoplankton community were significantly different between sampling periods (two-way ANOVA, p= 1.05. 10-6) (Fig. 4). During Nav7, the C-fixation rates at S18 reached 18.2 mg C m-2 h-1 and were more than four times higher compared to stations S19 and S20 (two-way ANOVA, p= 3.18. 10-5). Subsequently, during Nav8 and Nav9, the C-fixation rates decreased and values remained below 1.5 mg C m-2 h-1 at all stations. Although the C-fixation in MPB also showed significant differences between the sampling periods (two-way ANOVA, p= 1.1. 10-6), the C-fixation rates in MPB followed a different trend compared to the C-fixation in the phytoplankton community. During the three sampling periods, the C-fixation rates were below 3.2 mg C m-2 h-1 at all stations with the exception of TfS20 during Nav9 when the value reached 7.7 mg C m-2 h-1. During Nav8 and Nav9, stations TfS20 showed significantly higher values compared to TfS21 (two-way ANOVA, p= 9.8. 10-8).

109
Discussion
This study investigated spatial and temporal distribution of pelagic and benthic communities in the Marsdiep basin using two methodological approaches: DGGE and PLFA analyses. PLFAs are a good indicator of viable biomass but the taxonomic resolution is quite low (Dijkman et al., 2009, Bianchi & Canuel, 2011). The DGGE method has a higher taxonomic resolution; however, this method has its limitations. Because of its sensitivity, one species may display multiple bands on a DGGE gel and be erroneously interpreted as multiple species(Nübel et al., 1997, Muyzer, 1999, Díez et al., 2001). This study shows that molecular fingerprint and chemotaxonomic biomarker methods lead to partly different conclusions. However, the combination of both methods simultaneously provides information which cannot be obtained by either of them alone, and we will discuss them below.
No suspension of benthic communities occurs in the water column
Cluster analysis of the DGGE banding patterns showed that both cyanobacterial and eukaryal benthic communities were distinctively separated from the pelagic communities during all sampling periods. This indicates that mixing of pelagic and benthic compartments, either by sedimentation of the pelagic community or by suspension of the benthic community, was not important. As the hydrodynamic energy in the Marsdiep area is largely attributed to tidal and wind forces, sinking of the phytoplankton community is not likely to happen.
The results from the cluster analysis of the PLFA composition showed discrepancies with the DGGE fingerprints. The cluster analysis of PLFA data revealed an overlap between the benthic and the pelagic communities during the Nav8 cruise. The most likely explanation for this discrepancy with the DGGE results is that during the Nav8 sampling, the algal groups in the benthic and pelagic compartments were similar. At a higher taxonomic level, the PLFA composition between pelagic and benthic groups is not different (Dijkman et al., 2009, Dijkman et al., 2010, Kelly & Scheibling, 2012). An alternative to explain the overlap between benthic and pelagic communities during Nav8 could be that PLFA composition indicates similar physiological status between organisms (Dalsgaard et al., 2003, Piepho et al., 2012). The results of PLFA which agree only partly with the DGGE analysis, highlight the different sensitivities of the two methods. These findings disagree with results obtained by De Jonge & Van Beusekom (1992) who found that MPB in the eastern Dutch Wadden Sea contribute up to 30% of phytoplankton biomass. Hence, suspension of benthic microalgae may not be the major factor that increase the turbidity of the water and disrupt the phytoplankton primary production during these sampling periods (Schallenberg & Burns, 2004, MacIntyre et al., 2004, Porter et al., 2010). Minor seasonality in the benthic community- Phytoplankton communities in temperate regions often show a clear seasonal pattern whereas MPB seasonality is less conspicuous (Thornton et al., 2002, Winder & Cloern, 2010). Some studies show that MPB bloom reaches its maximum biomass between spring and summer (Montani et al., 2003, Ubertini et al., 2012) while other studies did not reveal any MPB seasonality (Thornton et al., 2002).We only sampled three

110
different periods during the algal growth season, our data lacked a clear seasonal signal in the MPB community. Only few studies investigated MPB seasonality in the Wadden Sea. The study by De Jonge & van Beusekom (1995) in the Ems estuary suggested that only one large bloom in MPB biomass occurs in summer between May and June. In the eastern part of the Wadden Sea (Ems Dollard) the mud content is often higher than in the tidal flats of the Marsdiep basin. The sampled stations are characterized as fine sand environment as the median grain size sediment D50 values ranged between 158- 213 μm (K. Philippart, pers. communication). A satellite based study on several estuaries bordering the North Sea demonstrated that MPB biomass changes in sandy locations are less affected by seasonality than MPB biomass occurring at muddy sites, which corroborates with our results (van der Wal et al., 2010).
Temporal and spatial patterns in pelagic and benthic communities
The eukaryal pelagic community revealed a distinct grouping between the different sampling periods, which is taken as an indication of a seasonal pattern. In contrast to the patterns observed for the eukaryotic pelagic communities, the cluster analysis showed that the cyanobacterial pelagic community depicts a less predictable seasonality as S18 did not cluster with other stations during Nav7 and Nav9. Less seasonality of the cyanobacterial community might be due to the fact that these organisms are present most of the year in the water column (Riegman et al., 1993). Furthermore, the pelagic cyanobacterial diversity during April (Nav7) was lower than in the other sampling periods. In contrast to pelagic cyanobacterial diversity, pelagic eukaryal diversity did not show particular trends. The decrease in cyanobacterial diversity might be attributed to a P limitation as the results obtained in April showed that autotrophic community experienced a P limitation (Ly et al., submitted). The cyanobacterial pelagic community and diversity may also be influenced by freshwater discharge from Lake IJsselmeer. Hence, S18 differed from the other stations because this station is located close to the locks of the Afsluitdijk, which separates Lake IJsselmeer from the Wadden Sea. This suggests that the freshwater discharge from Lake IJsselmeer influences S18 more than the other stations. The evidence that stations close to the Afsluitdijk have different properties was also observed from a PCA analysis carried out in chapter 2 where an analysis of physicochemical parameters and of PLFA composition and abundance showed that the station closest to the Afsluitdijk was separated from the other stations that form a tight cluster.
C-fixation rates in the pelagic and benthic communities of the Marsdiep basin
A comparison between the C-fixation of the benthic and pelagic communities (based on the 13C labeling in POC) has to be calculated with care. First uncertainty is that the total concentration of the DI13C added is estimated assuming that the DI13C is distributed homogenously in the top 3 mm of the sediment. The second uncertainty is that the DIC concentration in the upper lit layer of the sediment is not known. Because the incubations started immediately after the tide emerged, we assumed that the DIC concentration in the pore water was similar as in the seawater. However, photosynthesis will decrease the dissolved CO2 concentration, but according to a modeling study by F. Meysman (pers. communication), the

111
bicarbonate concentration in the upper layers of the sediment stays more or less constant (in the absence of large bioturbators). Since the bulk of the DIC is bicarbonate and because most algae possess a carbon concentrating mechanism, it is likely that the total DIC concentration in the photic layer of the sediment will see only little change. It should be taken into account that the MPB derived C-fixation rates are the result of the activity of the whole photic zone, hence the average irradiance will be lower than the incident irradiance. When taking these uncertainties into account, the C-fixation rates of the pelagic and benthic microalgae can be compared. The results suggest that based on surface area the phytoplankton primary production exceeded the MPB production during spring (Nav7), but that at the end of the growth season in fall the MPB primary production was higher than the pelagic primary production (Nav9). At the end of spring (Nav8), the areal rates of primary production were similar. In order to extrapolate our data of the integrated primary production per hour to annual productions rates, we multiplied the obtained hourly rates times the number of days for one year and multiplied this with 4, assuming a 4h low tide period during the daylight period. This gives an annual estimate of the benthic primary production ranging from 0.86 to 12 g C m-2. These ranges of primary production are lower compared to other estimates of benthic primary production which varied between 62 and 276 g C m-2 yr-1 in the Wadden Sea (Colijn & de Jonge, 1984, Philippart & Epping, 2010). Compared to the MPB primary production estimated in this study, higher annual primary production rates that were observed in the Ems-Dollard estuary by Colijn & de Jonge (1984) were attributed to MPB communities on muddy sediment. The difference between the rates of MPB primary production measured in this study and those reported in the literature can be partly explained by MPB in muddy sediments fix more C because of their apparent higher activity and higher densities (Billerbeck et al., 2007). Alternatively, patchiness of the MPB biomass in the tidal flats or methodologies for primary production measurements could also explain differences in primary production. If we had measured in the mussel beds on the Balgzand tidal flat (where TfS20 was located), we might have measured much higher primary production rates because the MPB communities in these muddy sediments were dense (personal observations). However, the sites that we selected were, at least by eye, more representative for most of the surface area of the tidal flats.
The Marsdiep basin has extensive intertidal flats with a total surface area of 9451 ha
(range of low water levels +65 to –77 cm), the annual average high and low tide area, whereas the total surface area of the Marsdiep basin is 67230 ha. Therefore, the benthic primary production ranges from 38 to 538 tons of C per year, whereas the phytoplankton production ranged from 954 to 31895 tons of C per year in the Marsdiep basin. Although the primary production of the MPB per unit area can exceed the phytoplankton primary production, the overall contribution of the MPB to the total aquatic primary production is also dependent on the morphology of the system.

112
Acknowledgements
The authors would like to thank the crew of the R/V Navicula. We thank Annette Wielemaker for producing the Wadden Sea map. We also thank to Veronique Confurius for assistance with DGGE. This project was funded by the Coast and Sea Program (ZKO) of the Netherlands Organization for Scientific Research (NWO) projects P-reduce (grant nº 839.08.340) and IN PLACE (grant nº 839.08.210).

113
Tables
Table 1. Coordinates of the pelagic (S18, S19 and S20) and benthic stations (TfS18, TfS20 and TfS21) at
different sampling periods (April: Nav7, May/June: Nav8 and September: Nav9 2011)
Navicula sampling
Stations Type Coordinates (Lat N)
Coordinates (Long E)
Nav7 S18 Pelagic 53° 03.136' 5°01.026' Nav8 S19 Pelagic 53°0.853' 4°54.817' Nav9 S20 Pelagic 52° 57.560' 4°48.626' Nav7 TfS18 Benthic 53°02.546' 4°59.451' Nav7 TfS21 Benthic 53°06.825' 4°56.208' Nav7 TfS20 Benthic 53°06.837' 4°56.217' Nav8 TfS18 Benthic 52°08.004' 4°19.477' Nav8 TfS21 Benthic 53°07.705' 4°56.743' Nav8 TfS20 Benthic 52°56.900' 4°50.399' Nav9 TfS18 Benthic 53°02.532' 4°59.440' Nav9 TfS21 Benthic 53°07.513' 4°56.534' Nav9 TfS20 Benthic 53°56.852' 4°56.747'
Table 2. Primers used and target sites
Genes Name Sequence (5' → 3') References 18S rRNA EK1-F CTGGTTGATCCTGCCAG López-García et al., 2003 18S rRNA EK-1520R CYGCAGGTTCACCTAC López-García et al., 2003
18S rRNA EUK516r-GC
CGCCCGGGGCGCGCCCCGGGCGGGGCGGGGG CACGGGGGGACCAGACTTGCCCTCC
Díez et al., 2001
16S rRNA cya781RA GACTACTGGGGTATCTAATCCCATT Nübel et al., 1997
16S rRNA Cya781RB GACTACAGGGGTATCTAATCCCTTT
16S rRNA Cya359F GGGGAATYTTCCGCAATGGG Nübel et al., 1997
16S rRNA CYA359f-GC
CGCCCGCCGCGCCCCGCGCCGGTCCCGCCGC CCCCGCCCGGGGGAATYTTCCGCAATGGG
Nübel et al., 1997
16S rRNA U1492R GGTTACCTTGTTACGACTT van der Wielen et al., 2005

114
Tab
le 3
. PC
R p
rogr
ams
cond
ition
s of
the
nest
ed P
CR
(1 10
ste
ps in
whi
ch a
nnea
ling
tem
pera
ture
dec
reas
ed w
ith -
0.5
°C p
er s
tep;
2 two
sepa
rate
1
reac
tion,
late
r co
mbi
ned)
2
TA
RG
ET
P
RIM
ER
S
PC
R C
ON
DIT
ION
S
Num
ber
of
cyc
les
In
itial
de
natu
ratio
n
Den
atur
atio
n
Ann
ealin
g
Ext
ensi
on
Fina
l ex
tens
ion
time
°
C
tim
e
° C
time
°
C
tim
e
° C
time
°
C
Nes
ted
1
Euk
arya
E
K1F
,EK
1520
R
35
3'
94
60''
94
30
''
54
90''
72
7'
72
Cya
noba
cter
ia
CY
A35
9f,
U14
92R
35
15
' 94
60
'' 94
30
'' 54
90
'' 72
7
72
Nes
ted
2
Euk
arya
E
K1F
, E
UK
S16r
-GC
35
18
0''
95
30''
95
45''
56
130'
' 72
30
'' 72
Cya
noba
cter
ia
CY
A35
9g-G
C
CY
A78
1R a
/b1
10
180'
' 95
60''
95
60
'' 60
-552
12
0''
72

115
Figures
Figure 1. Map of Marsdiep basin (pelagic stations S18, S19 and S20; benthic stations: TfS18, TfS20 and
TfS21) (NL: the Netherlands).

116

117

118
Figure 2. Cluster analysis of DGGE based on
OTU presence of 16 S RNA-Cyanobacteria
community (A) and 18 S RNA-Eukarya
community (B) 15 samples during three
sampling seasons (April: Nav7 , May/June:
Nav8 and September: Nav9 2011) at three
pelagic stations (S18, S19 and S20) and two
benthic stations (TfS20 and TfS21).
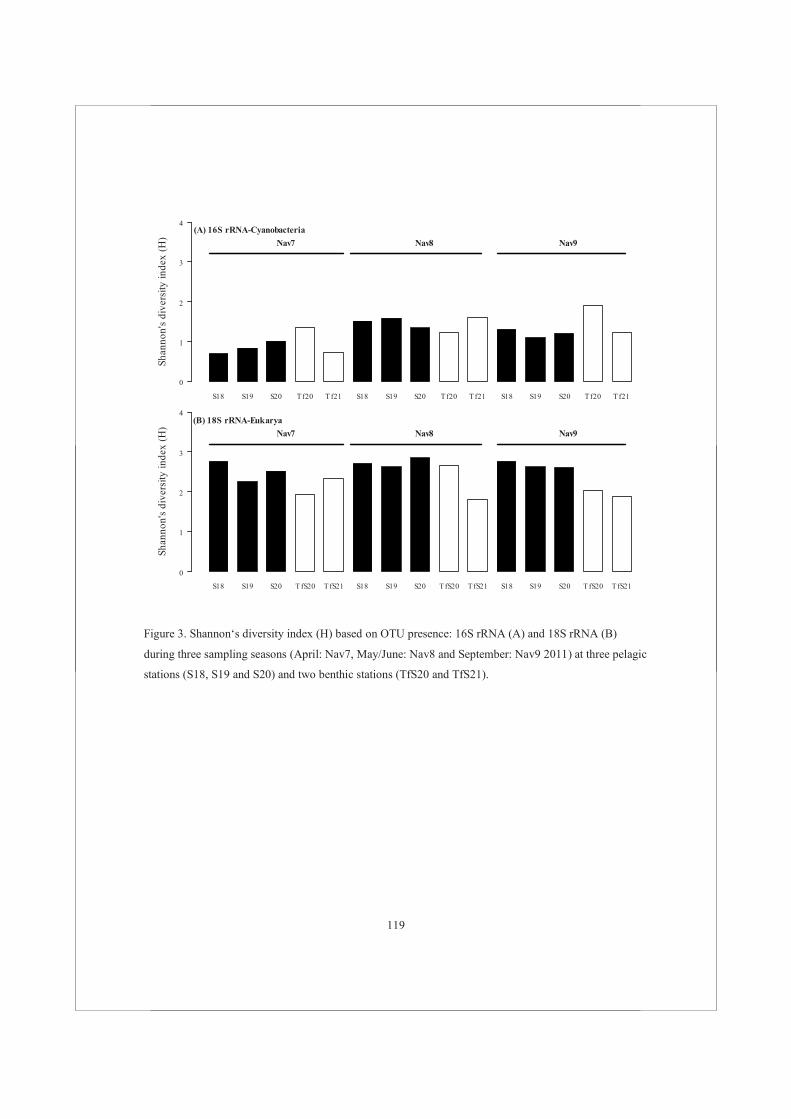
119
Figure 3. Shannon‘s diversity index (H) based on OTU presence: 16S rRNA (A) and 18S rRNA (B)
during three sampling seasons (April: Nav7, May/June: Nav8 and September: Nav9 2011) at three pelagic
stations (S18, S19 and S20) and two benthic stations (TfS20 and TfS21).
S18 S19 S20 Tf20 Tf21 S18 S19 S20 Tf20 Tf21 S18 S19 S20 Tf20 Tf21
Shan
non'
s di
vers
ity in
dex
(H)
0
1
2
3
4
Nav7 Nav8 Nav9
(A) 16S rRNA-Cyanobacteria
S18 S19 S20 TfS20 TfS21 S18 S19 S20 TfS20 TfS21 S18 S19 S20 TfS20 TfS21
Shan
non'
s di
vers
ity in
dex
(H)
0
1
2
3
4
Nav7 Nav8 Nav9
(B) 18S rRNA-Eukarya

120
Figure 4. 13C-fixation into bulk into organic matter (mg C m-2 h-1) during three sampling seasons (April:
Nav7, May/June: Nav8 and September: Nav9 2011) at three pelagic stations (S18, S19 and S20) and two
benthic stations (TfS20 and TfS21). Data are represented as average with SD errors.
S18 S19 S20 TfS20 TfS21 S18 S19 S20 TfS20 TfS21 S18 S19 S20 TfS20 TfS21
Prim
ary
prod
uctio
n n m
gC m
-2h
-1
0
5
10
15
20
25
Nav7 Nav8 Nav9
pelagicbenthic

121
CHAPTER 6
A two-dimensional analysis of photosynthetic activity and
vertical migration of microphytobenthos using imaging
pulse amplitude modulated (PAM) fluorescence
Juliette Ly1, João Serôdio2, João Ezequiel2 and Jacco C. Kromkamp1
In preparation for Aquatic Microbial Ecology
1Department of Marine Microbiology, Royal Netherlands Institute for Sea Research, P.O. Box 140, 4400 AC Yerseke, The Netherlands 2Departamento de Biologia, CESAM—Centro de Estudos do Ambiente e do Mar, Universidade de Aveiro, Campus de Santiago, 3810-193 Aveiro, Portugal

122
Abstract
The photosynthetic activity and vertical migration of microphytobenthos (MPB) were investigated in two types of sediment: a muddy location (Vista Alegre: VA) and a sandy location (Costa Nova: CN) at the Ria de Aveiro (Portugal). The MPB biomass (using fluorescence as a proxy), photosynthetic activity (effective PSII photochemical efficiency: ΔF/Fm’) and relative photosynthetic electron transport rate (rETR) were measured at different sediment depth layers (0-0.5, 0.5-1, 1-1.5 and 1.5-2 mm) on a flat vertical section of a sediment core with the non-invasive technique imaging pulse amplitude modulated fluorometer (iPAM). In addition, the hyperspectral reflectance was measured at the sediment surface which allowed the calculation of the normalized difference vegetation index (NDVI). The results showed that biomass and photosynthetic activity were the highest at the turning of the low tide (LW) in all measured depth layers at the muddy site. An upward movement was already observed in the few hours before the emersion period under the dark condition, an indication that the vertical movement of the cells originated from an endogenous driven vertical migration. In the sandy sediment, the MPB biomass was homogeneously distributed over the sediment depth. The upward movement observed of the MPB biomass in the homogenized sediment of CN site is likely to be attributed to a positive phototaxis response. Complementary to the fluorescence measurements, in situ measurement of the C-incorporation rates into particulate organic carbon (POC), carbohydrate and phospholipid fatty acid (PLFA) were also measured at the two locations. The incorporation of 13C stable isotope into different PLFAs was used to give an indication on MPB activity of specific groups. The POC and carbohydrate concentrations indicated a higher standing stock of biomass at the CN site compared to the VA site. This agreed with the iPAM measurements, but remarkably, the C-incorporation rate into PLFAs from the sandy site (CN) was nearly twice as high as in the muddy site (VA). Hence, the epipelic diatoms appeared to be more productive compared to the epipsammic microalgae. At both sites glucose was the main form of synthesized carbohydrate. The high activity of the epipelic diatoms at the muddy site VA might have been the result of the exudation of extracellular polymeric substances (EPS) during vertical migration of the epipelic diatoms.

123
Introduction
Estuarine intertidal microphytobenthos (MPB) communities contribute up to 50% of the total estuarine primary production (Underwood & Kromkamp 1999). In intertidal sediment, MPB needs to adapt rapidly to fluctuations in environmental parameters such as light, temperature, salinity, nutrient availability, grazing and sediment exchange with the water column (Barranguet et al. 1998, Blanchard et al. 2001). Two main types of MPB communities are distinguished: an epipsammic community, consisting of immotile cells attached to the sand grains, and an epipelic community, consisting of highly motile cells that can move between sediment grains and which are generally found in muddy sediment. A third type, consisting of tychoplanktonic species, i.e. species which combine a benthic and a pelagic life styles are less common and not much is known about this group (Marcus & Boero 1998). As a common behaviour, epipelic diatoms migrate toward the sediment surface during emersion period in daytime and migrate down to deeper layer before the onset of immersion or sunset. Evidence suggests that the vertical migration in MPB is driven by an endogenous clock as the migratory patterns continue to synchronize with diurnal and tidal cycles for a few days in the absence of tides or other environmental stimuli (light and tides) (Serôdio et al. 1997). Seasonal and short term temporal variations of migratory behaviour of MPB have been modelled as the combined results of the daily rhythm superimposed on the tidal cycle (Pinckney & Zingmark 1991). During a tidal cycle a maximum photosynthetic activity is found at low tide during daytime when cells migrate to the surface in order to perform photosynthesis (Serôdio et al. 2008). Before immersion, the MPB cells migrate downward and the biofilm disintegrates at the sediment surface. Only when conditions are too extreme (high irradiance, extreme temperature, and desiccation), cells may migrate downward early to avoid physiological stress in deeper layers. Due to this complex migratory behaviour that is the result of biological clock driven migration and photo- and chemotaxis, MPB cells move up and down the sediment during the day and, as a consequence, alter the photosynthetic activity at the sediment surface (Consalvey et al. 2004). Other factors trigger and modify the endogenous vertical migration of MPB, in particular sediment re-working from abiotic factors such as wave action or from bioturbation, and influence the depth where MPB cells are present. Several methods have been used to study the MPB vertical migration. These include the lens tissue method by which migrating cells are trapped (Eaton & Moss 1966). Optical techniques like hyperspectral reflectance and PAM fluorescence have been used to study the variability of MPB biomass at the sediment surface (Kromkamp et al. 1998, Paterson et al. 1998, Serôdio 2003, Kromkamp et al. 2006). During the last few decades, the use of active fluorescence measurements to estimate primary production has become increasingly popular as it is a quick and non-invasive method (Kromkamp et al. 1998, Barranguet & Kromkamp 2000, Consalvey et al. 2004). However, optical modelling studies have shown that active fluorescence techniques can seriously overestimate photosynthesis activity in the MPB community (Forster & Kromkamp 2004, Serôdio 2003), which is due to the contribution of ‘deep layer’ fluorescence. Signals emanating from the subsurface and the deeper layers are still under investigated (Perkins et al. 2010). In deeper layers where dark and

124
anaerobic conditions can occur, some biofilms inactivate their photosynthetic process (Kromkamp et al. 2007).
The technique used in this study is the imaging pulse-amplitude modulated (iPAM) chlorophyll fluorescence. The use of the iPAM to study photosynthetic process has the advantage to cover a larger study area compared to oxygen measurements with microsensor techniques or to the more common PAM fluorometers used such as the Diving-PAM or the mini-PAM. With the iPAM the average spatial heterogeneity in photosynthetic parameters of MPB during a daily and tidal cycle can be investigated in two dimensions.
In this study, we developed a method to quantify the vertical migration and study photosynthetic activity at different depth intervals. The goal was to develop a technique which can obtain measurements of the MPB vertical migration biomass and photosynthetic activity at different depths simultaneously by using an imaging fluorescence technique that allows larger surface areas to be measured simultaneously. For this reason a special coring device was developed that produces a flat cross section suitable for the iPAM measurements. In addition to the photosynthetic activity measurements, we assessed MPB communities (migrating MPB species composition and phospholipid fatty acid (PLFA) composition) and compared the rate of C-fixation by quantifying 13C-incorporation rates in bulk of particulate organic carbon (POC) and carbohydrate for each location.
Material and methods
Study site Ria de Aveiro is a mesotidal shallow lagoon located at the Atlantic north-west Portuguese
coast that is characterized by symmetrical tides. Two distinct locations were sampled (Fig. 1): one muddy site, Vista Alegre, VA (40° 38’ 1.98 N, 8° 39’33.40 W) and a sandy site: Costa Nova, CN (40°38’ 1.70 N, 8°39’33.3W) in November 2010. The days of measurements were chosen to coincide with daytime low tide.
Fluorescence measurements
From each site (CN and VA), sediment samples were collected using custom made Perspex corers of 7.5 cm diameter. The sediment was kept overnight in the dark at ambient temperature. The measurements were done the next morning. For each station, two types of measurements were made, one on an intact sediment core with an undisturbed MPB community, while the other was made on material that was scraped from the surface (included most of the MPB), was homogenized, and subsequently the MPB community was allowed to reposition itself.
In order to create a flat vertical cross section, a specially designed device was pushed over the sediment core (Fig. 2). The upper half of this device was removed and fitted with a flat and sharp Perspex plate (“knife”) that sliced the upper part of the core into two halves. After removing the unsupported half, the other part provided an intact core with a smooth cross

125
section. The flat cross section was tightly fitted to an imaging pulse amplitude modulated (iPAM) fluorometer equipped with red LEDs and actinic light (IMAG-MIN PAM, Walz E eltrich, Germany). The minimal fluorescence as proxy of MPB biomass and photosynthetic parameters were measured in the four different successive layers (L1, L2, L3 and L4) up to 2 mm in the sediment depth (Fig. 3). For each selected layer, the fluorescence intensities were measured on a rectangular area of 0.5 mm width and 6.6 mm length. The iPAM monitored fluorescence parameters during 10 hours in the laboratory. During the period when emersion took place in the field, the light was switched on (100 μmol photons m-2 s-1) in order to measure the spectral reflectance (see below) at the time of the measurement. The overlying water on the core was removed at the onset of the emersion period, but it was not added back when the emersion period ended. A saturating pulse was applied every 15 minutes in order to measure steady state fluorescence (F), the maximum fluorescence in the presence of actinic light (Fm’) and effective quantum efficiency of the photosystem II (ΔF/Fm’). ΔF was calculated as: Fm’-F at the subsurface layer (L1) (see paragraph on NDVI measurements). Before the measurements were started, a correction procedure as suggested by the manufacturer was followed in order to correct for none homogeneity in the light field. Measurements performed in darkness corresponded to the minimal fluorescence Fo and the maximum fluorescence Fm. All measurements were done using identical settings, facilitating the comparison of microalgal biomass between the cores. Although we were unable to measure the light penetration in the sediment during the emersion period, we assumed that the light intensity in the deeper layers was low and therefore the effective PSII efficiencies measured in L1 (muddy site), L2, L3 and L4 were probably close to Fv/Fm.
Rapid light curve (RLC) measurements
Every hour, rapid light curves were recorded with 12 incremental irradiance steps (1, 36, 84, 141, 235, 350, 444, 527, 631, 756, 912 and 1100 μmol photon m-2 s-1) of 10 seconds duration. RLCs were recorded for each depth layer (L1-L4). Before each RLC, the samples were placed in the dark condition for at least two minutes. Because we were unable to determine the absorption coefficient of the MPB cells, the relative photosynthetic electron transport rate (rETR) was calculated by multiplying the effective PSII photochemical efficiency ΔF/Fm’ with the irradiance E. From the RLC the maximum photosynthesis electron transport rate (rETRmax), the light utilization coefficient in the light limited region of the RLC (α), and light saturating irradiance (Ek = rETRmax/α) were determined by fitting RLCs to a modified version of the equation of Eilers and Peeters (1988): rETR = E/ (aE2 + bE + c), where a = (α × Ek
2)-1; b = (rETRmax )-1 - 2 × (α × Ek)
-1; c = α-1. Because rETR=ΔF/Fm’ × E, the photosynthetic parameters rETRmax and α can also be obtained after normalizing rETR to E, taking out the dependency of rETR on E: ΔF/Fm’ = (aE2 + bE + c)-1. By fitting ΔF/Fm’ as a function of irradiance, the RLC were fitted according to an R script developed by Silsbe and Kromkamp (2012).

126
Spectral reflectance (NDVI index
The changes in MPB biomass were recorded using normalized difference vegetation index (NDVI) as a biomass proxy targeting an area with a homogeneous microalgal biomass on the sediment surface. During the NDVI measurement, light was applied on the sediment surface using a Schott KL 2500 LCD fibre-optic light source (Schott, Marlborough, MA). The artificial light was switched on (100 μmol photons m-2 s-1) and off at the respective time corresponding to the start and end of the emersion period at the sampled sites. Spectral reflectance was measured every five minutes using an Ocean optics USB2000 spectrometer (Ocean Optics, Dunedin, USA). During the simulated emersion period, the targeted area was a circle of approximately 5 cm diameter. From the reflectance measurements, the NDVI was calculated in order to estimate microalgal biomass. The NDVI was calculated as follows: NDVI = (Infrared - red) / (Infrared + red), where infrared is the average reflectance in the range of 748–752 nm and red the average reflectance in the range of 673–677 nm. The reflectance of the sediment was measured against a diffuse white calibrated standard (WS-1-SL Spectralon Reference Standard, Ocean Optics).
13C-labeling experiments (POC, PLFA and carbohydrate)
In order to measure incorporation rates of 13C stable isotope into different pools (POC, PLFA and carbohydrate), 13C-labeling experiments were performed in situ at each site. At the two locations an area of 0.25 m2 of the sediment surface was sprayed with 250 ml of 13C-NaHCO3 solution (99% 13C; Cambridge Isotope Laboratories, Inc) at ambient salinity, giving a final concentration of 1 g m-2 DI13C. Samples of unlabeled and labeled particulate organic carbon (POC), phospholipid fatty acid (PLFA) and bulk carbohydrate were taken before and after 4h of incubation. The 13C stable isotope composition of the POC samples was analyzed with a Carlo Erba elemental analyser coupled inline to a Finnigan Delta S isotope ratio mass spectrometer (EA-IRMS) according to Middelburg et al., (2000).
PLFA samples were extracted according to a modified Bligh and Dyer method (1959) (Middelburg et al. 2000). First, total lipids were extracted and separated into different polarity classes using a silicic acid column. The column eluted several solvents (chloroform, acetone and methanol) representing different lipid fractions. The methanol fraction was collected and contained most of the PLFA. Derivatives of PLFA were synthesized in order to measure the methyl ester derivatives of the fatty acids (FAMEs) by gas chromatography-combustion isotope ratio mass spectrometry (GC-c-IRMS) (Dijkman et al. 2010). The FAMEs were identified according to their retention times and were compared to internal standards (12:0 and 19:0).
Carbohydrate in the sediment was extracted according to Boschker et al. (2008). Freeze dried sediment was treated with 1.1 mol L-1 H2SO4 for one hour at 120 °C in order to hydrolyze the carbohydrates. The solution was brought to pH 5.5-6 by adding SrCO3, and the precipitated SrSO4 was removed by centrifugation (15 min, 4500 g). Monosaccharide concentrations and isotope ratios were analyzed with high-performance liquid chromatography combined with

127
isotope ratio mass spectrometry (HPLC-IRMS) equipped with a Carbopac PA20 (Dionex Benelux, Amsterdam, The Netherlands).
MPB species The migrating MPB was collected from the surface of the homogenized sediment at the
two sites by the lens tissue method (Eaton & Moss 1966). On the surface of the sediment, the lens tissues were left during a part of the emersion period, removed after 3h, suspended in filtered sea water and then fixed with 10% (v/v) glutaraldehyde for identification of the species. Epipelic microalgae taxonomic groups were determined using a light microscopy.
Results
General observation of the MPB biomass with fluorescence (F) images
Fig. 4 shows selected images generated by iPAM. The two columns of selected images on the left were taken from cores (intact and homogenized) obtained at the muddy site VA. Emersion period started at ~11:00h and the turning of the low tide (LW) was ~13:30h. Immersion started at ~18:00h, whereas sunset was at ~17:00h. At 09:00h, no MPB biomass was visible near the surface, but at 12:00h an accumulation of the benthic algae was found at the surface. The single yellow/orange dots observed in deeper layers were the colonies of the cyanobacterium Merismopedia sp. which showed an upward movement. At 16:00h, the MPB biomass density at the sediment surface decreased again, and the biomass had migrated away from the surface at 20:00h. The homogenized sediments of a core of station VA showed a visible accumulation of the MPB biomass at 09:00h and also the bioturbation occurred at the sediment surface. At 12:00h, the MPB biomass in the upper layer had increased due to an upward vertical migration. Most of the MPB biomass was visible just below the surface at a depth of 200 μm. The bioturbation was also visible as the fluorescence in the burrow increased. Most of the MPB biofilm on the surface had disintegrated at 20:00h, showing a similar MPB biomass to those observed at 09:00h.
The right two columns of selected images in Fig. 4 were obtained from the sandy sediments of station CN. The turning of the low tide at this station was ~15:45h. No particular changes in MPB biomass was observed through time. As the measurement on both types of sediments were performed using the same settings of the iPAM, a higher MPB biomass was observed at CN which was distributed over a larger depth compared to the MPB biomass at VA. As the light penetrated deeper in sandy sediment the photosynthetically active biomass was thus substantially higher at CN than at VA. However, near LW, the MPB biomass in the upper depth layers was similar to the surface biomass. In contrast to the intact core of CN, F in the homogenized core showed an increase near LW, which continued after immersion (20:00h).
128
MPB biomass (F) in different depth layers
Vertical migration in the muddy sediment of station VA (Fig 5, A1) showed that the steady state fluorescence (F) at the four different layers was similar at 09:00h two hours before the onset of emersion. This suggested that up to 2 mm depth the biomass was equally distributed at VA. Between the start of the measurement at 09:00h and the start of emersion period at 11:00h F values increased, demonstrating that the upward movement was initiated before the onset of the emersion period. When the emersion period started, which coincided with the onset of actinic light, F values stopped increasing in the layers L1, L2 and L3. F in L4 fluctuated in the first half of the emersion time but reached a maximum around LW. After LW, the values of F decreased in all layers and were similar to those observed two hours before the onset of emersion. Fluorescence measurements in the homogenized sediment of station VA showed F values which were four times higher than in intact sediment of VA (Fig 5, A2). Like the situation for the intact core, F values in the homogenized sediment increased before the onset of emersion and showed a peak in all layers which coincided with LW around noon. In contrast to the situation in the intact core, the migration in L1 was not as high as in L2-L4 and this led to the formation of a subsurface maximum. Immediately after LW, MPB in all layers showed a downward migration. Measurements on the intact sediment of station CN (Fig 5, B1), showed that F was constant in all layers before and during the emersion period. F was lowest in L1 and fluctuated without showing a trend during the emersion period. F slightly decreased in all layers at 13:00h when the light was switched on (start of emersion period). In the homogenized sediment of CN station (Fig 5, B2) F showed a gradually increase during the measurement at all depth layers, without any apparent peak around LW. However, this upward migration only started after the actinic light was switched on and when the water was removed to stimulate the emersion period.
Variation of the biomass at the sediment surface in cores of station VA: F of L1 compared to
NDVI
The changes in biomass at the subsurface layer (L1) as revealed by using the proxies F, obtained from measurements with the iPAM, and NDVI, obtained from the spectral reflectance measurements, showed a similar pattern. F did not increase between the onset of emersion and LW in the intact sediment (Fig. 6A). However, NDVI increased between the onset of emersion period and LW. As shown in Fig. 5A, the upward migration based on the fluorescence (F) measurements took place in the hours before the onset of emersion. After LW, F started to decrease whereas the decrease in NDVI due to the downward vertical migration only commenced two hours after LW. Thus, both measurements showed downward migration of the MPB after LW but the migration patterns differed in their timing. In the homogenized sediment (Fig. 6B), both types of measurement showed upward migration of the MPB at different speed. NDVI increased rapidly reaching a plateau at 11:00h before LW whereas F showed a maximum at 13:00h (LW). Then, a decrease was observed in F just after LW whereas the NDVI showed hardly a decrease.

129
Maximum quantum efficiency of photosystem II (Fv /Fm)
To simplify the nomenclature between the subsurface (L1) and the deeper layers (L2, L3 and L4), we used Fv/Fm for all layers even if the PSII quantum efficiency was measured in the light. In the intact sediments of VA station (Fig. 7A1), Fv/Fm showed a steep increase in all layers until the beginning of the emersion period. Before the emersion, Fv/Fm in L1 was higher than in other layers. After the beginning of emersion Fv/Fm did not change further. Two hours before LW, Fv/Fm decreased in L1 but remained constant in the other layers. Near the end of the emersion period Fv/Fm started to decrease in all layers. In the homogenized sediment of station VA (Fig. 7A2), Fv/Fm increased in L2, L3 and L4 until LW and then decreased. Fv/Fm in L1 was higher than in other layers during most of the emersion period, as was also found in the intact core. In contrast to other layers, Fv/Fm in layer L1 decreased from the beginning to the end of the measurement.
Measurements made in an intact core from station CN showed a small increase in Fv/Fm in all layers before the emersion period (Fig. 7B1). During the emersion period, Fv/Fm in all layers remained constant. Fv/Fm in L1 was slightly higher than in L2, L3 and L4. At the end of emersion period (when the light went off) Fv/Fm remained constant until the end of the measurement. In the homogenized sediment from station CN (Fig. 7B2) in all layers, Fv/Fm fluctuated in the dark before the onset of emersion. During the emersion period, Fv/Fm increased in all layers until LW, became constant and decreased when the emersion period ended. During the measurement, the values of Fv/Fm in L2, L3 and L4 were lower than those observed for L1 during the measurement.
Rapid Light Curves (RLC)
Relative ETRmax increased slowly before the emersion at all depth layers on an intact core from station VA (Fig. 8A1). After the onset of emersion period, ETRmax in the L1 and L2 showed a rapid increase and reached high values. In L3 and L4, rETRmax slowly increased and reached a high at LW. After LW, rETRmax decreased in all layers. At the end of the emersion period and after the light went off (17:30) rETRmax was equal to the values found at the start of the emersion period. A similar pattern was observed in the homogenized sediment of VA (Fig. 8A2) rETRmax values were similar between different layers under the dark periods in both the intact and homogenized sediments. rETRmax in the homogenized sediment from station VA increased before the emersion period and until LW. Measurements on an intact core from station CN revealed that rETRmax in L1 was constant before the emersion period (Fig. 8B1). After LW, a slight increase of rETRmax was observed. A depth gradient in rETRmax was observed with the highest values at the surface (L1) and the lowest values in L4. The homogenized sediment of the CN site showed the lowest values of rETRmax in all sediment types (Fig. 8B2). rETRmax did not differ between the different depth layers, with the exception of the situation ~08:00h, when it was higher in L1 than in the other layers. Before emersion started, rETRmax increased in all layers. The increase of rETRmax in L2, L3 and L4 was faster than in L1.

130
During the emersion period rETRmax fluctuated without a particular trend regarding the tidal cycle.
In the intact sediment of station VA, α (light utilization coefficient in the light limited region of the RLC) values slightly increased in all layers until LW although the trend in L4 was less clear (Fig. 9A1). After LW, α values were similar and slowly decreased in all layers, The decrease of α in all layers apparently continued after the emersion period had ended. The patterns of α were similar in the homogenized sediment as in the intact core of VA (Fig. 9A2). The values of α were lower in L1 when compared to the other layers. In the intact sediment of station CN, the α values were more or less constant in all layers until LW when α decreased (Fig. 9B1). The values of α were similar in the layers L1-L3 and α was lower in L4. In the homogenized sediment of station CN (Fig. 9B2) α showed a different trend. It decreased until 10:30h and then increased and reached a maximum one hour after LW. Thereafter, α decreased in all layers. The value of α was highest in L1. Because the magnitude of changes in α was smaller than that of rETRmax, changes in Ek reflected similar patterns as described for rETRmax (Fig. 10).
C-incorporation
The rate of 13C-incorporation in POC and in different carbohydrates in VA (4213 ± 75 mg 13C m-2 h-1) was twice that in CN (2439 ± 249 mg 13C m-2 h-1) (Table 1). Glucose was the main carbohydrate product labeled during the first 4h of the incubation and contributed 48% (CN) and 64% (VA) of the bulk of POC C-fixation. The 13C-incorporation rates in other carbohydrates were lower than 80 mg 13C m-2 h-1. Because PLFA can be used as a chemotaxonomic marker for microalgae, we were able to identify the active groups of the MPB community at both stations (Fig. 11). Contrary to rates of 13C-labeling in POC and carbohydrate, the 13C-incorporation rate in most of the individual PLFA was higher at CN than at VA, reflecting higher biomass at the sandy site. At CN, the ubiquitous 16:0 and 16:1ω7 revealed the highest 13C-incorporation rates. A noticeable exception was 20:5ω3, a PLFA found in high abundance in diatoms. The 13C-incorporation rate into 20:5ω3was higher in VA than in CN. On the opposite, 13C-incorporation in C18 polyunsaturated fatty acids (18:2ω6, 18:3ω3, 18:3ω6 and 18:4ω3) were higher at CN than at VA.
Dominant microalgae species composition
At the muddy VA location, large epipelic diatoms were found which belong to Pleurosigma sp. The cyanobacterium Merismopedia sp. was observed but did not pass through the lens tissue. At the other location, MPB was composed of epipsammic diatoms at CN that could not be harvested by lens tissue. However, some epipelic MPB species were observed such as the green algae Euglena sp., the filamentous cyanobacterium Oscillatoria sp., and small epipelic diatoms belonging to Gyrosigma sp.

131
Discussion
MPB migration
Sediment type is an important abiotic factor in structuring MPB communities (Underwood & Kromkamp 1999, Forehead et al. 2013). In muddy environments, 90% of the photosynthetic activity occurs within the upper 400 μm depth (Kühl et al. 1997). At the two studied sites vertical migration took mainly place in the muddy environment of station VA. The MPB migration was measured from the sediment surface up to 2 mm deep, thus deeper than the photic zone. A previous study by Coelho et al. (2011) at VA showed that the MPB cells accumulated at the sediment surface under incident PAR ranging between 50-250 μmol m-2 s-1. This is in contrast to our observations, which showed that in the dark upward migration starting two hours before emersion. This suggests that the upward migration was controlled by an endogenous rhythm of the epipelic diatoms and was most likely related to the tidal cycle at the VA location.
Epipelic diatoms need to migrate to the sediment surface in order to capture sufficient light, perform photosynthesis and replenish intracellular organic carbon stores (storage lipids, storage carbohydrate chrysolaminaran) (Stal & de Brouwer 2003). However, at the sediment surface, prolonged light exposure can also cause photo-damage and depletion of CO2 and bicarbonate. These stress conditions might induce downward migration where cells at the surface are replaced by those from greater depth (Kromkamp et al. 1998). The unicellular, colony-forming cyanobacterium Merismopedia sp. was visible as the orange spots (on fluorescence false colour scale) in the cores of the muddy station VA (Fig. 4A). They were observed in deeper layers and migrated upward without reaching the subsurface layer. As far as we know vertical migration of Merismopedia sp. has not been reported previously. Vertical migration of MPB may also be affected by biotic activity such as bioturbation (Reise 2002, Orvain et al. 2004). This was visible in our results with the accumulation of MPB inside the burrow of a bioturbator in the homogenized muddy sediment. Bioturbation can re-oxygenate the sediment and can transport cells into deeper layers (Larson & Sundbäck 2008, Middelburg & Levin 2009).
Light penetrates deeper in sandy than in muddy sediments (Kühl & Jørgensen 1994). Therefore, in sandy sediments MPB cells might also find suitable conditions for photosynthetic activity in deeper layers. At CN, the presence of photosynthetic biomass at greater depths indicates that light penetrates deeper in sandy sediment. This suggests that the photosynthetic active biomass was substantially higher at CN than at the muddy site. The homogenous distribution of the MPB at CN can also be explained by frequent sediment reworking caused by the tides.
The lens tissue technique only captured the migrating species while the majority of the community at CN was categorized as epipsammic. The MPB biomass increased in all layers after homogenization of the sandy sediment of a CN core. However, the upward migration only started after the onset of the emersion period when the actinic light was switched on. Thus, in contrast to the situation in the muddy sediment, the MPB in the sandy sediment apparently

132
required an exogenous stimulus (i.e. light) in order to start the upward movement. For this reason we conclude that the migration in the homogenized sediment of the sandy site is probably under control of positive phototaxis.
MPB photo-acclimation and C-fixation
From previous studies, differences between the photo-acclimation strategies were observed between muddy and sandy sediments (Consalvey et al. 2004, Jesus et al. 2009). In the muddy environment (VA) where light is strongly attenuated, 1% of the surface light level occurred between 0.5 and 1 mm. Hence, the layers L3 and L4 of the muddy site were probably in darkness during the measurement. All layers showed tidally driven changes in rETRmax and Ek at the muddy location of VA. These changes were more pronounced in L1 and L2 than in L3 and L4. Both the maximum rate of photosynthetic electron transport rETRmax and the light saturation coefficient Ek were highest near LW. This indicates that more light was needed to saturate the rate of photosynthetic electron transport and was taken as evidence of photo-acclimation of the cells to high light. In sandy sediments, light penetrates deeper and the 1% of surface light may be found up to 4 mm (Kromkamp unpublished). No changes were observed in rETRmax and Ek that could be related to the tidal cycle in sandy site.
In sediment cores from both sites, rETRmax and Ek were highest at the surface (L1) and lowest in L4, except the homogenized sediment of CN. This suggests a different photo-acclimation status between the surface and deeper layers. It is unlikely that the light levels played a role at CN in explaining depth differences in RLC parameters (rETRmax, Ek and α) with depth because the deeper layers (L2, L3 and L4) were always in darkness. The concentration of oxygen concentrations plays a role in determining the depth related RLC parameters. Oxygen is apparently required for efficient photosynthesis (Kromkamp et al. 2007, Cox et al. 2010). However, the top 2 mm of the CN cores were oxygenated (as judged from the absence of black sediment), and we nevertheless observed depth-dependent changes in rETRmax and Ek. Therefore, oxygen was not a major factor that could explain photo-acclimation at the different depths. The most likely explanation for photo-acclimation at different depths is that more cyanobacteria are found at greater depth and that this caused a lower quantum efficiency of electron transport rates compared to diatoms. The phycobilins in the cyanobacteria add to the “background” fluorescence and this will decrease Fv/Fm and, consequently, the value of rETR (Campbell et al. 1998).
According to the fluorescence measurements, MPB biomass was highest at the sandy site and was distributed over a greater depth. In accordance with the fluorescence measurements, the net growth rates of the population, as measured from the labeling patterns in the PLFA, were also higher at the sandy site than at the muddy site. On the opposite, C-incorporation rates into the POC- and carbohydrate pools were higher than in the muddy sediments. This indicates that MPB cells at sandy and muddy locations partitioned the C-fixed in different ways. At the sandy site, the fixed C was used for MPB growth, whereas at the muddy site it was channelled to carbohydrate. Epipelic diatoms produce copious amounts of extracellular polymeric substance

133
(EPS) which is mainly composed of glucose (De Brouwer & Stal 2001). This EPS is exuded through the raphe of the diatom frustules and is involved in motility (Lind et al. 1997). Microscopic observations and the rate of 13C-incorporation in specific PLFA, distinguished two different MPB communities: one in the muddy environment and one in the sandy environment. The muddy environment hosted mainly large migrating diatoms such as Pleurosigma sp. This station has a high specific activity as indicated in 13C-incorporation in POC and in 20:5ω3, which is a specific PLFA of diatoms. In contrast, the sandy environment supported large numbers of different MPB taxa (the green alga Euglena sp., the cyanobacterium Oscillatoria sp. and diatoms, especially Gyrosigma sp). Green algae is the main active group in the MPB of the sandy site as suggested from C-incorporation in potential biomarker of green algae (18:2ω6, 18:3ω3, 18:3ω6 and 18:4ω3) (Dijkman et al., 2009). Cyanobacteria and green algae have the capacity to synthesize a variety of PUFA from C18 (18:2ω6, 18:3ω3, 18:3ω6 and 18:4ω3), making it difficult to separate cyanobacteria from green algae as there are no PLFAs that are unique for one of these groups (Kelly & Scheibling, 2012, Dijkman et al., 2009). However, green algae normally have a higher content of these PLFAs than cyanobacteria, and we therefore assume that most of the PLFA found at CN originated from green algae.
Surface biomass measurements
Vertical migration of MPB biomass has been followed using changes in fluorescence (F) as a proxy of biomass (Honeywill et al. 2002) or by measuring changes in surface reflectance, using NDVI as a proxy of biomass (Kromkamp et al. 2006, Serôdio et al. 2006). Both methods may yield qualitatively similar results (Serôdio et al. 2006), as demonstrated in this study. However, differences between fluorescence and surface reflectance results may occur because the fluorescence signal is not only influenced by biomass, but also by the photosynthetic characteristics of the cell. In high light, photoprotective reactions such as the induction of the xanthophyll cycle may induce non-photochemical quenching (NPQ), which affects the linear relationship between F and Chla (Honeywill et al. 2002). The NDVI measurements do not suffer from this problem as this index is based on the absorption of light rather than its utilisation (Kromkamp et al. 2006). As the light intensity applied when measuring NDVI was below Ek, the intrusive effect was expected to be minimal. Although non-photochemical quenching (NPQ) can occur in diatoms even at low rates of ETR, light applied at the sediment surface did not induce NPQ and was expected to be limited (Jakob et al. 2001). In addition, the changes in F were also observed in deeper layers in dark condition, where the light induced NPQ cannot take place. Therefore, it is unlikely that the differences between F and NDVI in the speed of vertical migration at the sediment surface were caused by light-induced NPQ.
In summary, we have shown that vertical migration and photosynthetic activity in muddy sediments seem to be controlled by an endogenous rhythm triggered by the tides. The upward migration started at all depth layers investigated (0-2 mm) already before the onset of emersion in the absence of any external trigger. This is in contrast to the situation found in the sandy sediment, where we observed little if any migration in the intact core. However, when the

134
sediment was homogenized, MPB migrated to the sediment surface. However, as this migration only started after switching on the light, it is probably positive phototaxis.
Acknowledgments
We would like to thank Greg Silsbe for his help in fitting RLC curves and Tanja Moerdijk for carbohydrate analysis. This work received financial support from Schure-Beijerinck-Popping (SBP) Fonds.

135
Figures and tables
Figure 1. Map of the Ria de Aveiro and sampling locations: muddy site, VA (Vista Alegre) and sandy site, CN (Costa Nova).

136
Figure 2. Schematic drawing of the core device.

137
Figure 3. Measuring areas chosen: Layer 1 (L1), Layer 2 (L2), Layer 3 (L3) and Layer 4 (L4).

138
VISTA ALEGRE COSTA NOVA Intact sediment Homogenized
sediment Intact sediment Homogenized sediment
9:00h 9:00h 9:00h 9:00h
12:00h 12:00h 12:00h 12:00h
16:00h 16:00h 16:00h 16:00h
20:00h 20:00h 20:00h 20:00h

139
Figure 4. Two dimensional images showing steady state fluorescence (F) at different times of the day (9h, 12h, 16h and 20h) at station Vista Alegre (VA)-intact sediment (peak of LW 14:17h), VA-homogenized sediment (peak of LW 12:57h), Costa Nova (CN)-intact sediment (peak of LW 16:51h), CN-homogenized sediment (peak of LW 15:44h). Relative values ranging from 0 to 100 are displayed using an identical false color scale of relative biomass. Two units in the false color scale correspond to 500 μm.
Figure 5. Changes in steady state fluorescence (F) at two stations: Vista Alegre (VA) and Costa Nova (CN) measured of two types of sediment: intact (VA: A1 and CN: B1) and homogenized (VA: A2 and CN: B2). Note the difference of y-axis scale in graphic (A1). Arrows indicate the turning of the low tide (LW) and horizontal dashed grey lines indicate emersion period.

140
Figure 6. NDVI index at the sediment surface and steady state fluorescence (F) at the subsurface layer (L1) measured of two types of sediment: intact (A) and homogeneous (B) during the illuminated period. Arrows indicate the turning of the low tide (LW) and horizontal dashed grey lines indicate emersion period. Note the differences in Y-axis scale for F between both figures.

141
Figure 7. Changes in maximum quantum efficiency of photosystem II (Fv / Fm) at two stations: Vista Alegre (VA) and Costa Nova (CN) measured of two types of sediment: intact (VA: A1 and CN: B1) and homogenized (VA: A2 and CN: B2). Arrows indicate the turning of the low tide (LW) and horizontal dashed grey lines indicate emersion period.

142
Figure 8. Comparison of maximum electron transport rate (rETRmax) from rapid light curves fitting (RLC) derived from Eilers and Peeters (1988) at two stations: Vista Alegre (VA) and Costa Nova (CN) measured of two types of sediment: intact (VA: A1 and CN: B1) and homogenized (VA: A2 and CN: B2). Arrows indicate the turning of the low tide (LW) and horizontal dashed grey lines indicate emersion period.

143
Figure 9. Comparison of alpha (α) from rapid light curves fitting (RLC) derived from Eilers and Peeters (1988) at two stations: Vista Alegre (VA) and Costa Nova (CN) measured on two types of sediment: intact (VA: A1 and CN: B1) and homogenized (VA: A2 and CN: B2). Arrows indicate the turning of the low tide (LW) and horizontal dashed grey lines indicate emersion period.

144
Figure 10. Comparison of light saturation coefficient (Ek) from rapid light curves fitting (RLC) derived from Eilers and Peeters (1988) at two stations: Vista Alegre (VA) and Costa Nova (CN) measured on two types of sediment: intact (VA: A1 and CN: B1) and homogenized (VA: A2 and CN: B2). Arrows indicate the turning of the low tide (LW) and horizontal dashed grey lines indicate emersion period.
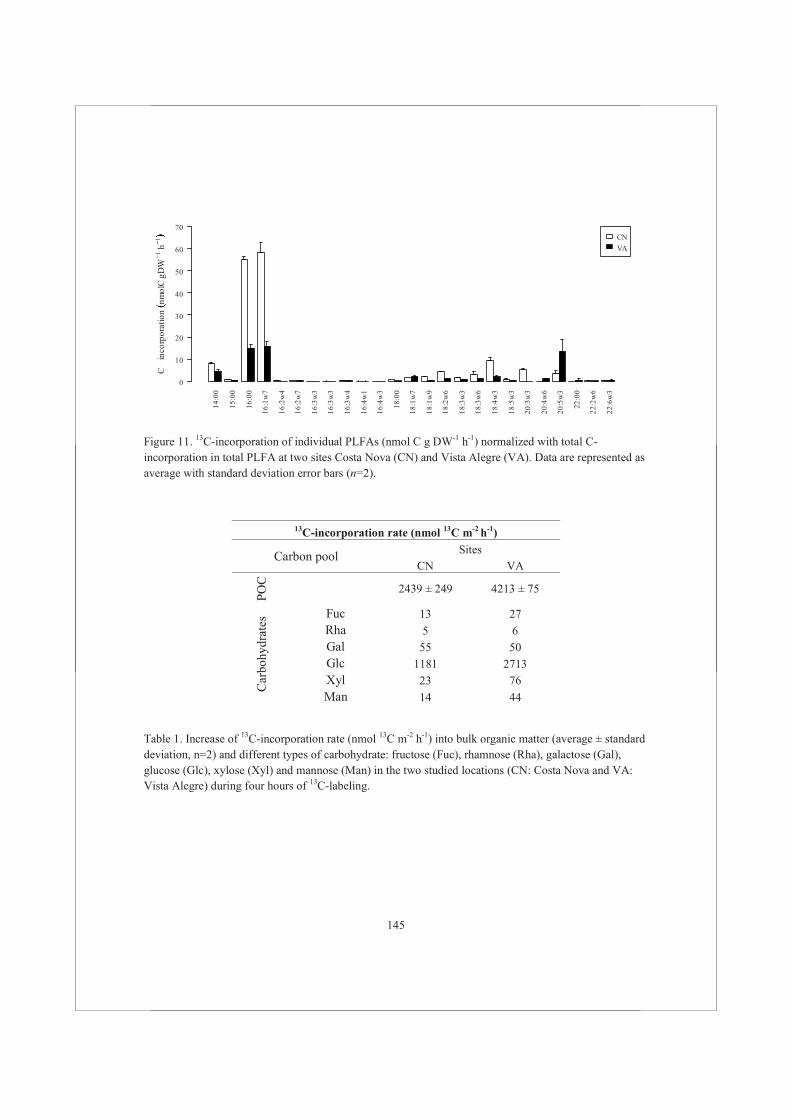
145
Figure 11. 13C-incorporation of individual PLFAs (nmol C g DW-1 h-1) normalized with total C-incorporation in total PLFA at two sites Costa Nova (CN) and Vista Alegre (VA). Data are represented as average with standard deviation error bars (n=2).
13C-incorporation rate (nmol 13C m-2 h-1)
Carbon pool Sites CN VA
POC
2439 ± 249 4213 ± 75
Car
bohy
drat
es Fuc 13 27
Rha 5 6 Gal 55 50 Glc 1181 2713 Xyl 23 76 Man 14 44
Table 1. Increase of 13C-incorporation rate (nmol 13C m-2 h-1) into bulk organic matter (average ± standard deviation, n=2) and different types of carbohydrate: fructose (Fuc), rhamnose (Rha), galactose (Gal), glucose (Glc), xylose (Xyl) and mannose (Man) in the two studied locations (CN: Costa Nova and VA: Vista Alegre) during four hours of 13C-labeling.
14:0
0
15:0
0
16:0
0
16:1
w7
16:2
w4
16:2
w7
16:3
w3
16:3
w3
16:3
w4
16:4
w1
16:4
w3
18:0
0
18:1
w7
18:1
w9
18:2
w6
18:3
w3
18:3
w6
18:4
w3
18:5
w3
20:3
w3
20:4
w6
20:5
w3
22:0
0
22:2
w6
22:6
w3
Cin
corp
orat
ion
nmol
CCgD
W1
h1
0
10
20
30
40
50
60
70CN
VA

146

147
CHAPTER 7
General discussion

148
In this thesis, I have demonstrated that P is the limiting resource for phytoplankton growth during the spring bloom in the western Dutch Wadden Sea. By using the PLFA biomarker, it was concluded that P is a limiting resource that affects phytoplankton biomass, community composition and C-uptake. Additionally, influence of freshwater discharges or nutrient fluxes from the sediment were also shown to be important factors that modified P availability in the Marsdiep basin. In this last chapter, I will discuss the results obtained from previous chapters and will integrate it into a broader context of the Wadden Sea ecology according to the following three major questions:
Is phosphorus the main limiting resource for phytoplankton growth? How will a change in phytoplankton composition affect the transfer of organic
matter produced by primary producers to primary consumers? What are the implications of this study for the interpretation of the data for
monitoring program?
Phosphorus is the main limiting resource for phytoplankton growth
Availability of nutrients and light are crucial factors for the wax and wane of phytoplankton (Sverdrup, 1953; Winder and Cloern, 2010). Various studies and long-term data series of the ecology of the Wadden Sea considered the factors that could be responsible for changes in primary production (Philippart et al., 2007). Cloern et al. (1999) developed an index for coastal ecosystem sensitivity in order to diagnose the effect of nutrient enrichment, based on a phytoplankton growth model. When Cloern’s index was applied to the Marsdiep basin, it suggested that the phytoplankton community in the western Dutch Wadden Sea was limited both by light and P (Colijn and Cadée, 2003; Loebl et al., 2009). The nutrient enrichment experiments carried out in this study revealed that P (and Si for diatoms) rather than light was the limiting resource for phytoplankton growth during the spring bloom in the Marsdiep basin (chapters 3 and 4). Although the effect of light on the phytoplankton community was not experimentally studied in this thesis, from geographic information system and Secchi disk data it was concluded that it was unlikely that light was the limiting factor for phytoplankton growth in the Marsdiep basin during the period when this study was carried out (chapter 3). A depletion of Si in the water column during spring can shape the phytoplankton community and increase harmful algae blooms (Hecky and Kilham, 1988; Müller et al., 2013). However, the Marsdiep basin receives episodic freshwater discharges and also sedimentary mineralization processes occurring on tidal flats can alleviate Si or P limitation during the spring bloom (Van Bennekom et al., 1974; De Jonge, 1990; Van Raaphorst and De Jonge, 2004; chapters 2 and 4).
When soluble reactive phosphorus (SRP) concentrations are low (<0.03 μmol L-1), the phytoplankton community is considered to be P-limited, while when the SRP concentrations are

149
intermediate in late spring (between 0.11 and 0.17 μmol L-1), the phytoplankton is in a transition to becoming P-replete (chapters 2, 3 and 4). When inorganic P is depleted, other potential sources of dissolved P such as DOP may become available that could sustain phytoplankton growth (Karl, 2007; Duhamel et al., 2010). The concentration of DOP in the water column is often higher than that of SRP (Kolowith et al., 2001; Duhamel et al., 2010) (see DOP paragraph).
As reported in chapter 4, not all phytoplankton taxonomic groups were limited by P during the spring bloom. Shifts to small phytoplankton types and low diversity are expected under limiting nutrient conditions (Interlandi and Kilham, 2001). The results presented in this thesis confirm that Bacillariophyceae are poor competitors for phosphate when compared to flagellates (Egge, 1998; Irwin et al., 2006; Finkel et al., 2010). The surface/volume ratio of the cell affects the nutrient uptake. Large cells experience a disadvantage because their surface is small compared to their cell volume and therefore the rate with which they can take up nutrients is much slower. P limitation will therefore result in the disappearance of Bacillariophyceae from the phytoplankton community and cause a shift to non-diatom primary producers with smaller cell sizes. Small cell size species are associated with small grazers like dinoflagellates and ciliates who will increase C cycling (Barber and Hiscock, 2006).
How will a change in phytoplankton composition affect the transfer of organic matter produced by primary producers to primary consumers?
In this thesis, the phytoplankton community is described from a bottom up viewpoint, i.e. nutrients and light control phytoplankton growth. A shift in the phytoplankton species composition can shape higher trophic levels, because for instance the PLFA composition of the phytoplankton may influence the diet values (food quality) in aquatic food webs (Brett and Muller-Navarra, 1997; Kattner et al., 2007). The available food source is a critical component that determines growth and survival of marine herbivores as well as of higher trophic levels (Brett and Muller-Navarra, 1997). Organisms of the higher trophic levels lack certain enzymes (Δ12 and Δ15 desaturases) that are required for fatty acid synthesis, and therefore they depend on essential fatty acids that are produced by the phytoplankton (Brett et al., 2009). A decrease of polyunsaturated fatty acids (PUFA) (18:3ω3, 20:5ω3 and 22:6ω3) that are produced abundantly by Bacillariophyceae and flagellates can decrease the growth rate of consumers considerably (Boersma, 2000; Von Elert, 2002). During the spring bloom, phytoplankton is usually dominated by Bacillariophyceae and the flagellate Phaeocystis sp. (chapter 3). With respect to the PLFA composition, Bacillariophyceae are considered to be a better quality food with higher amount of PUFA than Phaeocystis sp. (Turner et al., 2002; Kelly and Scheibling, 2012). Under P-limiting conditions, Phaeocystis sp. survives better because they form colonies that act as P reservoirs (Schoemann et al. 2005). Therefore, an increase of the intensity of Phaeocystis sp. will affect the transfer of energy to consumers (Cadée and Hegeman, 2002; Hamm and Rousseau, 2003; Schoemann et al., 2005). For example, large Phaeocystis sp. colonies (>10 μm) could not be

150
grazed by larvae of the bivalve Crassostrea gigas (Pacific oyster) in the Wadden Sea (V. Lemphful, personal communication).
Although not treated as it was outside the scope of this thesis, it is not only via the PLFA composition that phytoplankton or MPB can influence their grazers. As grazers seem to have less flexibility in their nutrient stoichiometry (or a stronger control on element stoichiometry) than the primary producers, a food source with a too low P-content can cause P-limited growth of grazers (Lukas et al., 2012, Elser et al., 2000; Sterner et al., 1998). As the P-requirement of herbivores also varies (Schulz et al., 1999), a food source with a low P-content (i.e. P-limited phytoplankton) can in principle also lead to species succession in grazers. In addition there is direct evidence that zooplankton can be directly P-limited as well. The freshwater crustacean Daphnia magna grew faster on a diet of heat stopped P-limited Scenedesmus acutus growth with added inorganic P than on a diet of P-limited Scenedesmus acutus alone (Urabe et al., 1997). Organisms differ in the C:N:P ratio, thus in their requirements for these elements. The nutrient stoichiometry between these elements influences several ecological processes such as competitive interaction, nutrient limitation, population stability, trophic interaction (Li et al., 2012 and references therein). There seems to be a relation between this nutrient stoichiometry and growth rate. The “growth rate hypothesis” (GRH) suggests that fast-growing organisms have low C:P and N:P ratios. Most of this research on ecological stoichiometry has been carried out in freshwater ecosystems, where P is often the limiting nutrient, with a few studies in the terrestrial environment (e.g. Li et al., 2012), confirming some of the concept of the GRH. The GRH might not be available when a co-limitation occurs in the herbivore (Lukas et al., 2011). More research in the marine field is warranted, but is not unreasonable to suggest that the growth rate hypothesis will be also valid in the marine environment.
What are the implications of this study for the interpretation of the data for long term monitoring program?
Limitation of phytoplankton biomass measurement with Chla
Long-term monitoring studies on phytoplankton aim to understand and assess the disturbances that have an ecological impact on the system studied. In many long term monitoring programs, Chla is used as a rapid measurement to detect inter-annual changes in phytoplankton biomass. We showed that because of this “bulk” biomass measurement, changes in the composition of the phytoplankton community as the result of different nutrient regimes were difficult to uncover (chapter 3). In this thesis, PLFA was used as a chemotaxonomy biomarker to identify different groups of primary producers (chapters 2, 4, 5 and 6). Although phytoplankton that responded to P limitation was identified, they were restricted to higher taxonomic classes. The NIOZ sampling jetty monitoring program and monitoring programs in general would benefit when they monitor genes that code for enzymes that are induced under P limitation or even better to detect their

151
transcripts in order to show P limitation in certain key species of phytoplankton of the Wadden Sea.
Characterization of the dissolved organic phosphorus (DOP) pool
Several approaches have been used to measure P limitation in phytoplankton communities. The inorganic DIN:SRP molar ratio or SRP concentrations cannot entirely assess P limitation in phytoplankton and conclusions made from the measurements should be interpreted cautiously. In the first place, in a phytoplankton community, nutrient requirements and uptake rates vary among different taxonomic groups (Geider and Roche, 2002; chapter 4). Secondly, when SRP is scarce, DOP (estimated indirectly from the differences between total dissolved P and SRP) represents an alternative source of P for the phytoplankton (Labry et al., 2005; Duhamel et al., 2010). Under P stress, marine phytoplankton synthesizes alkaline phosphatase (AP) that is capable of hydrolyzing the phosphomonoester of the DOP to inorganic phosphate (Dyhrman and Ruttenberg, 2006; Nicholson et al., 2006; Duhamel et al., 2010). The results presented in chapter 4 demonstrate that, although DOP and SRP concentrations were high in fall (respectively > 0.40 μM for DOP and 0.20 μM for SRP), ~40% of the phytoplankton cells expressed AP. This suggests that not all DOP was available for phytoplankton growth. DOP may occur in a variety of size classes and the molecular structures may exhibit different bioavailabilities. Only phytoplankton species that can utilize a large spectrum of DOP compounds will be able to survive when P becomes limiting (Dyhrman et al., 2006; Duhamel et al., 2010). In particular, cyanobacteria are known to synthesize phosphonatase, an enzyme capable to hydrolyze refractory DOP with stable C-P bonds (Dyhrman et al., 2006). In most of the monitoring programs in coastal systems, more is known about DIP than about DOP. Unfortunately, DOP has also not been considered as a parameter for nutrient limitation in the Wadden Sea (Van Beusekom and De Jonge, 2012). Therefore, more effort is needed to characterize DOP compounds and determine its bioavailability in coastal systems.
Lack of data on microphytobenthos (MPB)
Comparison between different regions of the Wadden Sea showed differences in the annual rate of photosynthesis in different sediment types (Billerbeck et al., 2007). The measurements reported in the chapters 5 and 6 show that the rate of C-fixation was higher in the muddy sediment than in the sandy sediment. Comparison of the MPB community, seasonality patterns, and primary production in the fine sandy locations of the western Dutch Wadden Sea (chapter 5) to the MPB of the mudflats in the eastern Wadden Sea must be done with caution (De Jonge and Van Beusekom, 1992; De Jonge and Colijn, 1994). Despite that sandy sediment is less cohesive than muddy sediment, suspension of the MPB at the sandy sites of the Marsdiep tidal flats did not occur (chapter 5). The large and heavy sand grains do probably not go so easy in suspension.
Efflux of DIP, calculated from the pore water in situ profiles, showed a high release to the water column during spring and summer (L. Mulder, personal communication). The phytoplankton was shown to be P-limited (chapters 3 and 4), and a supply of bioavailable P from

152
the sediment pore water to the overlying water can alleviate P limitation for phytoplankton after the spring bloom. In the subtidal area of the Marsdiep basin, P fluxes fueled approximately 40% of the annual pelagic primary production (Leote et al., submitted; chapter 5). In order to perform photosynthesis at the interface sediment-water, MPB obtains nutrients from the overlying water and also from the sediment (Underwood and Kromkamp, 1999). Although the overlying water P concentrations may be limiting for benthic microalgae in spring, porewater P concentration appeared to be sufficient to support MPB growth. The assessment of primary production in the Wadden Sea should include the contribution of MPB because this can be considerable.

153
REFERENCES Alfaro, A. C., Thomas, F., Sergent, L. & Duxbury, M. 2006. Identification of trophic interactions
within an estuarine food web (northern New Zealand) using fatty acid biomarkers and stable isotopes. Estuarine Coastal and Shelf Science 70:271-86.
Arrigo, K. R. 2004. Marine microorganisms and global nutrient cycles. Nature 437:349-55. Bakker, C., Herman, P. M. J. & Vink, M. 1994. A new trend in the development of the
phytoplankton in the Oosterschelde (SW Netherlands) during and after the construction of a storm-surge barrier. Hydrobiologia 282:79-100.
Barber, R. T. & Hiscock, M. R. 2006. A rising tide lifts all phytoplankton: Growth response of other phytoplankton taxa in diatom-dominated blooms. Global Biogeochemical Cycles 20.
Barranguet, C., Kromkamp, J. & Peene, J. 1998. Factors controlling primary production and photosynthetic characteristics of intertidal microphytobenthos. Marine Ecology Progress Series 173:117-26.
Beardall, J., Allen, D., Bragg, J., Finkel, Z. V., Flynn, K. J., Quigg, A., Rees, T. A. V., Richardson, A. & Raven, J. A. 2008. Allometry and stoichiometry of unicellular, colonial and multicellular phytoplankton. New Phytologist 181:295-309.
Beardall, J., Young, E. & Roberts, S. 2001. Approaches for determining phytoplankton nutrient limitation. Aquatic Sciences 63:44-69.
Behrenfeld, M. J. 2010. Abandoning Sverdrup's critical depth hypothesis on phytoplankton blooms. Ecology 91:977-89.
Bergé, J. P. & Barnathan, G. 2005. Fatty acids from lipids of marine organisms: molecular biodiversity, roles as biomarkers, biologically active compounds, and economical aspects. Marine Biotechnology 96:49-125.
Bianchi, T. S. & Canuel, E. A. 2011. Chemical biomarkers in aquatic ecosystems. Princeton University Press, 396.
Billerbeck, M., Røy, H., Bosselmann, K. & Huettel, M. 2007. Benthic photosynthesis in submerged Wadden Sea intertidal flats. Estuarine, Coastal and Shelf Science 71:704-16.
Blackman, F. F. 1905. Optima and limiting factors. Annals of Botany 19:281-96. Blanchard, G. F., Guarini, J.-M., Orvain, F. & Sauriau, P.-G. 2001. Dynamic behaviour of
benthic microalgal biomass in intertidal mudflats. Journal of Experimental Marine Biology and Ecology 264:85-100.
Bligh, E. G. & Dyer, W. J. 1959. A rapid method of total lipid extraction and purification. Canadian Journal of Biochemistry and Physiology 37:911-17.
Boëchat, I. G., Weithoff, G., Krüger, A., Gücker, B. & Adrian, R. 2007. A biochemical explanation for the success of mixotrophy in the flagellate Ochromonas sp. Limnology and Oceanography 52:1624-32.
Boero, F., Belmonte, G., Fanelli, G., Piraino, S. & Rubino, F. 1996. The continuity of living matter and the discontinuities of its constituents: do plankton and benthos really exist? Trends in Ecology & Evolution 11:177-80.
Boersma, M. 2000. The nutritional quality of P-limited algae for Daphnia. Limnology and Oceanography 45:1157-61.
Bolhuis, H., Fillinger, L. & Stal, L. J. 2013. Coastal microbial mat diversity along a natural salinity gradient. PLoS ONE 8 (5):e63166.

154
Boschker, H. T. S., Kromkamp, J. C. & Middelburg, J. J. 2005. Biomarker and carbon isotopic constraints on bacterial and algal community structure and functioning in a turbid, tidal estuary. Limnology and Oceanography 50:70-80.
Boschker, H. T. S. & Middelburg, J. J. 2002. Stable isotopes and biomarkers in microbial ecology. FEMS Microbiology Ecology 40:85-95.
Boschker, H. T. S., Moerdijk-Poortvliet, T. C. W., Van Breugel, P., Houtekamer, M. & Middelburg, J. J. 2008. A versatile method for stable carbon isotope analysis of carbohydrates by high-performance liquid chromatography/isotope ratio mass spectrometry. Rapid Commun. Mass Spectrom. 22:3902-08.
Breteler, W., Schogt, N. & Rampen, S. 2005. Effect of diatom nutrient limitation on copepod development: role of essential lipids. Marine Ecology Progress Series 291:125-33.
Breton, E., Rousseau, V., Parent, J. Y., Ozer, J. & Lancelot, C. 2006. Hydroclimatic modulation of diatom/Phaeocystis blooms in nutrient-enriched Belgian coastal waters (North Sea). Limnology and Oceanography 51:1401-09.
Brett, M. T., Kainz, M. J., Taipale, S. J. & Seshan, H. 2009. Phytoplankton, not allochthonous carbon, sustains herbivorous zooplankton production. Proc. Natl. Acad. Sci. U. S. A. 106:21197-201.
Brett, M. T. & Müller-Navarra, D. C. 1997. The role of highly unsaturated fatty acids in aquatic food web processes. Freshwater Biology 38:483-99.
Brinkman, A. 2008. Nutrient-en chlorofylgehaltes in het westelijke en oostelijke deel van de Nederlandse Waddenzee; waarden en trends tussen 1980 en 2005 en mogelijke oorzaken daarvan. IMARES report.
Cadée, G. C. 1982. Tidal and seasonal variation in particulate and dissolved organic carbon in the western Dutch Wadden Sea and Marsdiep tidal inlet. Netherlands Journal of Sea Research 15:228-49.
Cadée, G. C. & Hegeman, J. 2002. Phytoplankton in the Marsdiep at the end of the 20th century; 30 years monitoring biomass, primary production, and Phaeocystis blooms. Journal of Sea Research 48:97-110.
Campbell, D., Hurry, V., Clarke, A. K., Gustafsson, P. & Öquist, G. 1998. Chlorophyll fluorescence analysis of cyanobacterial photosynthesis and acclimation. Microbiol. Mol. Biol. Rev. 62:667-83.
Claquin, P., Martin-Jézéquel, V., Kromkamp, J. C., Veldhuis, M. J. W. & Kraay, G. W. 2002. Uncoupling of silicon compared with carbon and nitrogen metabolisms and the role of the cell cycle in continuous cultures of Thalassiosira pseudonana (Bacillariophyceae) under light, nitrogen, and phosphorus control. Journal of Phycology 38:922-30.
Clarke, K. & Gorley, R. N. 2006. PRIMER v6: user manual/tutorial. PRIMER-E Ltd., Plymouth. Cloern, J. E. 1999. The relative importance of light and nutrient limitation of phytoplankton
growth: a simple index of coastal ecosystem sensitivity to nutrient enrichment. Aquatic Ecology 33:3-15.
Cloern, J. E. 2001. Our evolving conceptual model of the coastal eutrophication problem. Marine Ecology Progress Series 210:223-53.
Coelho, H., Vieira, S. & Serôdio, J. 2011. Endogenous versus environmental control of vertical migration by intertidal benthic microalgae. European Journal of Phycology 46:271-81.
Colijn, F. & Cadée, G. C. 2003. Is phytoplankton growth in the Wadden Sea light or nitrogen limited? Journal of Sea Research 49:83-93.

155
Colijn, F. & de Jonge, V. N. 1984. Primary production of microphytobenthos in the Ems-Dollard Estuary. Marine Ecology Progress Series 14:185-96.
Coma, R., Ribes, M., Gili, J.-M. & Zabala, M. 2000. Seasonality in coastal benthic ecosystems. Trends in Ecology & Evolution 15:448-53.
Consalvey, M., Paterson, D. M. & Underwood, G. J. C. 2004. The ups and downs of life in a benthic biofilm: migration of benthic diatoms. Diatom Research 19:181-202.
Daborn, G. R., Amos, C. L., Brylinsky, M., Christian, H., Drapeau, G., Faas, R. W., Grant, J., Long, B. & Paterson, D. M. 1993. An ecological cascade effect: Migratory birds affect stability of intertidal sediments. Limnology and Oceanography 38:225-31.
Dalsgaard, J., St John, M., Kattner, G., Müller-Navarra, D. & Hagen, W. 2003. Fatty acid trophic markers in the pelagic marine environment. Advances in Marine Biology 46:225-340.
Danger, M., Daufresne, T., Lucas, F., Pissard, S. & Lacroix, G. 2008. Does Liebig's law of the minimum scale up from species to communities? Oikos 117:1741-51.
De Baar, H. J. W. 1994. von Liebig's law of the minimum and plankton ecology (1899–1991). Progress in Oceanography 33:347-86.
De Brouwer, J. F. C., Bjelic, S., De Deckere, E. M. G. T. & Stal, L. J. 2000. Interplay between biology and sedimentology in a mudflat (Biezelingse Ham, Westerschelde, The Netherlands). Continental Shelf Research 20:1159-77.
De Jonge, V. N. 1985. The occurrence of ‘epipsammic’ diatom populations: a result of interaction between physical sorting of sediment and certain properties of diatom species. Estuarine, Coastal and Shelf Science 21:607-22.
De Jonge, V. N. 1990. Response of the Dutch Wadden Sea ecosystem to phosphorus discharges from the River Rhine. North Sea—Estuaries Interactions. Springer, pp. 49-62.
De Jonge, V. N. & Colijn, F. 1994. Dynamics of microphytobenthos biomass in the Ems estuary. Marine Ecology Progress Series 104:185-96.
De Jonge, V. N. & Van Beusekom, J. E. E. 1992. Contribution of resuspended microphytobenthos to total phytoplankton in the Ems estuary and its possible role for grazers. Netherlands Journal of Sea Research 30:91-105.
De Jonge, V. N. & Van Beusekom, J. E. E. 1995. Wind-and tide-induced resuspension of sediment and microphytobenthos from tidal flats in the Ems estuary. Limnology and Oceanography 40:766-78.
Díez, B., Pedrós-Alió, C., Marsh, T. L. & Massana, R. 2001. Application of denaturing gradient gel electrophoresis (DGGE) to study the diversity of marine picoeukaryotic assemblages and comparison of DGGE with other molecular techniques. Appl. Environ. Microbiol. 67:2942.
Dijkman, N. A., Boschker, H. T. S., Middelburg, J. J. & Kromkamp, J. C. 2009. Group-specific primary production based on stable-isotope labeling of phospholipid-derived fatty acids. Limnology and Oceanography-Methods 7:612-25.
Dijkman, N. A., Boschker, H. T. S., Stal, L. J. & Kromkamp, J. C. 2010. Composition and heterogeneity of the microbial community in a coastal microbial mat as revealed by the analysis of pigments and phospholipid-derived fatty acids. Journal of Sea Research 63:62-70.
Dijkman, N. A. & Kromkamp, J. C. 2006. Phospholipid-derived fatty acids as chemotaxonomic markers for phytoplankton: application for inferring phytoplankton composition. Marine Ecology Progress Series 324:113-25.

156
Dodd, N., Blondeaux, P., Calvete, D., De Swart, H. E., Falqués, A., Hulscher, S. J. M. H., Różyński, G. & Vittori, G. 2003. Understanding coastal morphodynamics using stability methods. Journal of Coastal Research 19:849-65.
Doering, P. H., Oviatt, C. A., Nowicki, B. L., Klos, E. G. & Reed, L. W. 1995. Phosphorus and nitrogen limitation of primary production in a simulated estuarine gradient. Marine Ecology Progress Series 124:271-87.
Droop, M. R. 1974. The nutrient status of algal cells in continuous culture. Journal of the Marine Biological Association of the United Kingdom 54:825-55.
Droop, M. R. 1983. 25 years of algal growth kinetics a personal view. Botanica Marina 26:99-112.
Duarte, C. M. 1990. Time lags in algal growth: generality, causes and consequences. Journal of Plankton Research 12:873-83.
Duhamel, S., Dyhrman, S. T. & Karl, D. M. 2010. Alkaline phosphatase activity and regulation in the North Pacific Subtropical Gyre. Limnology and Oceanography 55:1414.
Dyhrman, S. T., Ammerman, J. W. & Van Mooy, B. A. S. 2007. Microbes and the marine phosphorus cycle. Oceanography 20:110-16.
Dyhrman, S. T., Chappell, P. D., Haley, S. T., Moffett, J. W., Orchard, E. D., Waterbury, J. B. & Webb, E. A. 2006. Phosphonate utilization by the globally important marine diazotroph Trichodesmium. Nature 439:68-71.
Dyhrman, S. T. & Palenik, B. 2001. A single-cell immunoassay for phosphate stress in the dinoflagellate Prorocentrum minimum (Dinophyceae). Journal of Phycology 37:400-10.
Dyhrman, S. T. & Ruttenberg, K. C. 2006. Presence and regulation of alkaline phosphatase activity in eukaryotic phytoplankton from the coastal ocean: Implications for dissolved organic phosphorus remineralization. Limnology and Oceanography 51:1381-90.
Eaton, J. W. & Moss, B. 1966. The estimation of numbers and pigment content in epipelic algal populations. Limnology and Oceanography 11:584-95.
Egge, J. K. 1998. Are diatoms poor competitors at low phosphate concentrations? Journal of Marine Systems 16:191-98.
Egge, J. K. & Aksnes, D. L. 1992. Silicate as regulating nutrient in phytoplankton competition. Marine Ecology Progress Series 83:281-89.
Elias, E., Cleveringa, J., Buijsman, M., Roelvink, J. & Stive, M. 2006. Field and model data analysis of sand transport patterns in Texel Tidal inlet (the Netherlands). Coastal Engineering 53:505-29.
Elser, J. J., Bracken, M. E. S., Cleland, E. E., Gruner, D. S., Harpole, W. S., Hillebrand, H., Ngai, J. T., Seabloom, E. W., Shurin, J. B. & Smith, J. E. 2007. Global analysis of nitrogen and phosphorus limitation of primary producers in freshwater, marine and terrestrial ecosystems. Ecology Letters 10:1135-42.
Elser, J. J., Fagan, W. F., Denno, R. F., Dobberfuhl, D. R., Folarin, A., Huberty, A., Interlandi, S., Kilham, S. S., McCauley, E. & Schulz, K. L. 2000. Nutritional constraints in terrestrial and freshwater food webs. Nature 408:578-80.
Falkowski, P. G. & Raven, J. A. 1997. Aquatic photosynthesis. Malden, MA: Blackwell Science Finkel, Z. V., Beardall, J., Flynn, K. J., Quigg, A., Rees, T. A. V. & Raven, J. A. 2010.
Phytoplankton in a changing world: cell size and elemental stoichiometry. Journal of Plankton Research 32:119-37.

157
Flameling, I. A. & Kromkamp, J. 1998. Light dependence of quantum yields for PSII charge separation and oxygen evolution in eucaryotic algae. Limnology and Oceanography 43:284-97.
Forehead, H., Thomson, P. & Kendrick, G. A. 2013. Shifts in composition of microbial communities of subtidal sandy sediments maximise retention of nutrients. FEMS Microbiology Ecology 83:279-98.
Forster, R. M. & Kromkamp, J. C. 2004. Modelling the effects of chlorophyll fluorescence from subsurface layers on photosynthetic efficiency measurements in microphytobenthic algae. Marine Ecology Progress Series 284:9-22 .
Geider, R. J. & Roche, J. L. 2002. Redfield revisited: variability of C:N:P in marine microalgae and its biochemical basis. European Journal of Phycology 37:1-17.
González-Gil, S., Keafer, B. A., Jovine, R. V. M., Aguilera, A., Lu, S. & Anderson, D. M. 1998. Detection and quantification of alkaline phosphatase in single cells of phosphorus-starved marine phytoplankton. Marine Ecology Progress Series 164:21-35.
Guschina, I. A. & Harwood, J. L. 2006. Lipids and lipid metabolism in eukaryotic algae. Prog. Lipid Res. 45:160-86.
Hamm, C. E. & Rousseau, V. 2003. Composition, assimilation and degradation of Phaeocystis globosa derived fatty acids in the North Sea. Journal of Sea Research 50:271-83.
Hansell, D. A. & Carlson, C. A. 2002. Biogeochemistry of marine dissolved organic matter. Academic Press: San Diego,
Hastings, N., Agaba, M., Tocher, D. R., Leaver, M. J., Dick, J. R., Sargent, J. R. & Teale, A. J. 2001. A vertebrate fatty acid desaturase with Δ5 and Δ6 activities. Proceedings of the National Academy of Sciences 98:14304-09.
Hauss, H., Franz, J. M. S. & Sommer, U. 2012. Changes in N:P stoichiometry influence taxonomic composition and nutritional quality of phytoplankton in the Peruvian upwelling. Journal of Sea Research 73:74-85.
Hecky, R. E. & Kilham, P. 1988. Nutrient limitation of phytoplankton in freshwater and marine environments: a review of recent evidence on the effects of enrichment. Limnology and Oceanography 33:796-822.
Heip, C. H. R., Goosen, N. K., Herman, P. M. J., Kromkamp, J., Middelburg, J. J. & Soetaert, K. 1995. Production and consumption of biological particles in temperate tidal estuaries. Oceanography and Marine Biology: an annual review 33:1-149.
Herman, P. M. J., Middelburg, J. J., Van de Koppel, J. & Heip, C. H. R. 1999. Ecology of estuarine macrobenthos. Advances in Ecological Research 29:195-240.
Honeywill, C., Paterson, D. & Hagerthey, S. 2002. Determination of microphytobenthic biomass using pulse-amplitude modulated minimum fluorescence. European Journal of Phycology 37:485-92.
Hoppe, H. G. 2003. Phosphatase activity in the sea. Hydrobiologia 493:187-200. Howarth, R., Chan, F., Conley, D. J., Garnier, J., Doney, S. C., Marino, R. & Billen, G. 2011.
Coupled biogeochemical cycles: eutrophication and hypoxia in temperate estuaries and coastal marine ecosystems. Frontiers in Ecology and the Environment 9:18-26.
Howarth, R. W. & Marino, R. 2006. Nitrogen as the limiting nutrient for eutrophication in coastal marine ecosystems: Evolving views over three decades. Limnology and Oceanography 51:364-76.
Interlandi, S. J. & Kilham, S. S. 2001. Limiting resources and the regulation of diversity in phytoplankton communities. Ecology 82:1270-82.
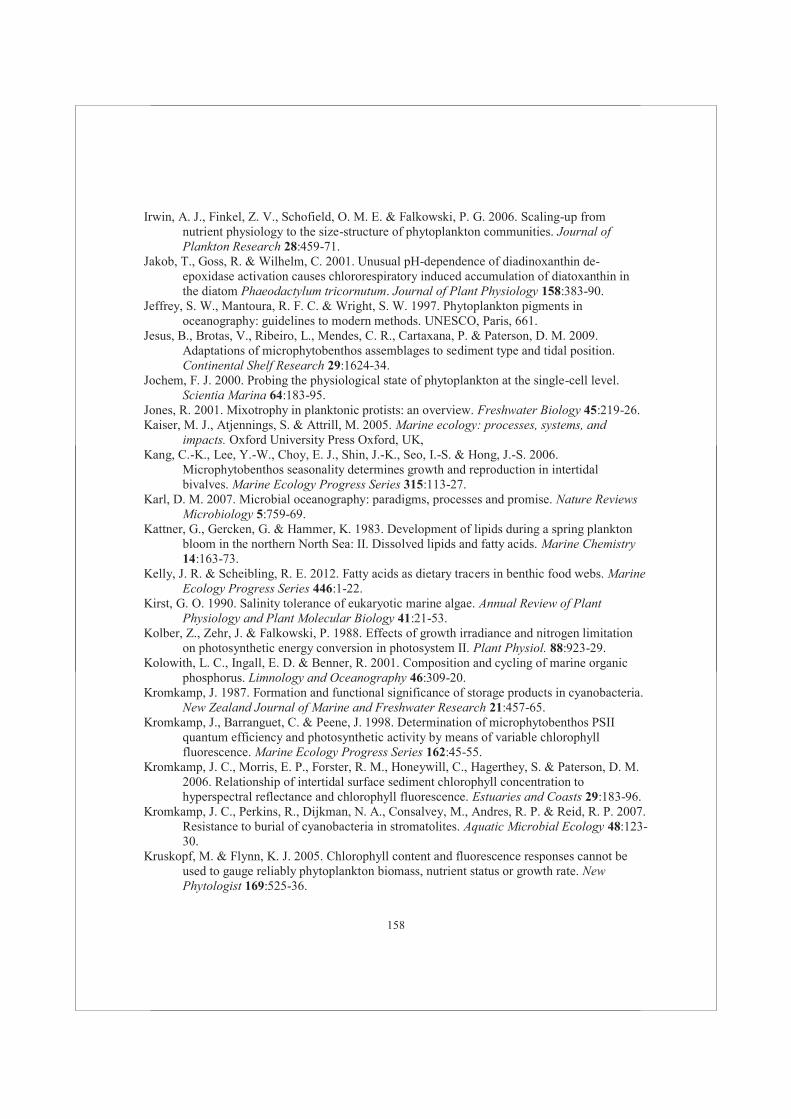
158
Irwin, A. J., Finkel, Z. V., Schofield, O. M. E. & Falkowski, P. G. 2006. Scaling-up from nutrient physiology to the size-structure of phytoplankton communities. Journal of Plankton Research 28:459-71.
Jakob, T., Goss, R. & Wilhelm, C. 2001. Unusual pH-dependence of diadinoxanthin de-epoxidase activation causes chlororespiratory induced accumulation of diatoxanthin in the diatom Phaeodactylum tricornutum. Journal of Plant Physiology 158:383-90.
Jeffrey, S. W., Mantoura, R. F. C. & Wright, S. W. 1997. Phytoplankton pigments in oceanography: guidelines to modern methods. UNESCO, Paris, 661.
Jesus, B., Brotas, V., Ribeiro, L., Mendes, C. R., Cartaxana, P. & Paterson, D. M. 2009. Adaptations of microphytobenthos assemblages to sediment type and tidal position. Continental Shelf Research 29:1624-34.
Jochem, F. J. 2000. Probing the physiological state of phytoplankton at the single-cell level. Scientia Marina 64:183-95.
Jones, R. 2001. Mixotrophy in planktonic protists: an overview. Freshwater Biology 45:219-26. Kaiser, M. J., Atjennings, S. & Attrill, M. 2005. Marine ecology: processes, systems, and
impacts. Oxford University Press Oxford, UK, Kang, C.-K., Lee, Y.-W., Choy, E. J., Shin, J.-K., Seo, I.-S. & Hong, J.-S. 2006.
Microphytobenthos seasonality determines growth and reproduction in intertidal bivalves. Marine Ecology Progress Series 315:113-27.
Karl, D. M. 2007. Microbial oceanography: paradigms, processes and promise. Nature Reviews Microbiology 5:759-69.
Kattner, G., Gercken, G. & Hammer, K. 1983. Development of lipids during a spring plankton bloom in the northern North Sea: II. Dissolved lipids and fatty acids. Marine Chemistry 14:163-73.
Kelly, J. R. & Scheibling, R. E. 2012. Fatty acids as dietary tracers in benthic food webs. Marine Ecology Progress Series 446:1-22.
Kirst, G. O. 1990. Salinity tolerance of eukaryotic marine algae. Annual Review of Plant Physiology and Plant Molecular Biology 41:21-53.
Kolber, Z., Zehr, J. & Falkowski, P. 1988. Effects of growth irradiance and nitrogen limitation on photosynthetic energy conversion in photosystem II. Plant Physiol. 88:923-29.
Kolowith, L. C., Ingall, E. D. & Benner, R. 2001. Composition and cycling of marine organic phosphorus. Limnology and Oceanography 46:309-20.
Kromkamp, J. 1987. Formation and functional significance of storage products in cyanobacteria. New Zealand Journal of Marine and Freshwater Research 21:457-65.
Kromkamp, J., Barranguet, C. & Peene, J. 1998. Determination of microphytobenthos PSII quantum efficiency and photosynthetic activity by means of variable chlorophyll fluorescence. Marine Ecology Progress Series 162:45-55.
Kromkamp, J. C., Morris, E. P., Forster, R. M., Honeywill, C., Hagerthey, S. & Paterson, D. M. 2006. Relationship of intertidal surface sediment chlorophyll concentration to hyperspectral reflectance and chlorophyll fluorescence. Estuaries and Coasts 29:183-96.
Kromkamp, J. C., Perkins, R., Dijkman, N. A., Consalvey, M., Andres, R. P. & Reid, R. P. 2007. Resistance to burial of cyanobacteria in stromatolites. Aquatic Microbial Ecology 48:123-30.
Kruskopf, M. & Flynn, K. J. 2005. Chlorophyll content and fluorescence responses cannot be used to gauge reliably phytoplankton biomass, nutrient status or growth rate. New Phytologist 169:525-36.

159
Kühl, M. & Jørgensen, B. B. 1994. The light-field of microbenthic communities - radiance distribution and microscale optics of sandy coastal sediments. Limnology and Oceanography 39:1368-98.
Kühl, M., Lassen, C. & Revsbech, N. P. 1997. A simple light meter for measurements of PAR (400 to 700 nm) with fiber-optic microprobes: application for P vs E-0 (PAR) measurements in a microbial mat. Aquatic Microbial Ecology 13:197-207.
Kürten, B., Painting, S. J., Struck, U., Polunin, N. V. C. & Middelburg, J. J. 2013. Tracking seasonal changes in North Sea zooplankton trophic dynamics using stable isotopes. Biogeochemistry 113:167-87.
Labry, C., Delmas, D. & Herbland, A. 2005. Phytoplankton and bacterial alkaline phosphatase activities in relation to phosphate and DOP availability within the Gironde plume waters (Bay of Biscay). Journal of Experimental Marine Biology and Ecology 318:213-25.
Larson, F. & Sundbäck, K. 2008. Role of microphytobenthos in recovery of functions in a shallow-water sediment system after hypoxic events. Marine Ecology Progress Series 357:1-16.
Leote, C., Mulder, L. L. & Epping, E. submitted. A budget of bioavailable phosphorus in the sediment for the western Wadden Sea.
Li, Y., Waite, A. M., Gal, G. & Hipsey, M. R. 2012. An analysis of the relationship between phytoplankton internal stoichiometry and water column N:P ratios in a dynamic lake environment. Functional Ecology 25:1206-14.
Liebig, J. 1842. Chemistry in its application to agriculture and physiology. Third American edition. John Owen, Boston, Massachusetts, USA.
Lippemeier, S., Hartig, P. & Colijn, F. 1999. Direct impact of silicate on the photosynthetic performance of the diatom Thalassiosira weissflogii assessed by on-and off-line PAM fluorescence measurements. Journal of Plankton Research 21:269-83.
Litchman, E. & Nguyen, B. L. V. 2008. Alkaline phosphatase activity as a function of internal phosphorus concentration in freshwater phytoplankton. Journal of Phycology 44:1379-83.
Loebl, M., Colijn, F., Van Beusekom, J. E. E., Baretta-Bekker, J. G., Lancelot, C., Philippart, C. J. M., Rousseau, V. & Wiltshire, K. H. 2009. Recent patterns in potential phytoplankton limitation along the Northwest European continental coast. Journal of Sea Research 61:34-43.
Loebl, M. & Van Beusekom, J. E. E. 2008. Seasonality of microzooplankton grazing in the northern Wadden Sea. Journal of Sea Research 59:203-16.
Lomas, M. W., Swain, A., Shelton, R. & Ammerman, J. W. 2004. Taxonomic variability of phosphorus stress in Sargasso Sea phytoplankton. Limnology and Oceanography 49:2303-10.
López-García, P., Philippe, H., Gail, F. & Moreira, D. 2003. Autochthonous eukaryotic diversity in hydrothermal sediment and experimental microcolonizers at the Mid-Atlantic Ridge. Proceedings of the National Academy of Sciences 100:697-702.
Lotze, H. K., Reise, K., Worm, B., van Beusekom, J., Busch, M., Ehlers, A., Heinrich, D., Hoffmann, R. C., Holm, P. & Jensen, C. 2005. Human transformations of the Wadden Sea ecosystem through time: a synthesis. Helgoland Marine Research 59:84-95.
Lukas, M., Sperfeld, E. & Wacker, A. 2011. Growth Rate Hypothesis does not apply across colimiting conditions: cholesterol limitation affects phosphorus homoeostasis of an aquatic herbivore. Functional Ecology 25:1206-14.

160
Ly, J., Philippart, C. J. M. & Kromkamp, J. C. submitted. Phosphorus limitation during a phytoplankton spring bloom in the western Dutch Wadden Sea.
Lynn, S. G., Kilham, S. S., Kreeger, D. A. & Interlandi, S. J. 2000. Effect of nutrient availability on the biochemical and elemental stoichiometry in the freshwater diatom Stephanodiscus minutulus (Bacillariophyceae) Journal of Phycology 36:510-22.
MacIntyre, H. L., Geider, R. J. & Miller, D. C. 1996. Microphytobenthos: The ecological role of the “secret garden” of unvegetated, shallow-water marine habitats. I. Distribution, abundance and primary production. Estuaries 19:186-201.
MacIntyre, H. L., Lomas, M. W., Cornwell, J., Suggett, D. J., Gobler, C. J., Koch, E. W. & Kana, T. M. 2004. Mediation of benthic–pelagic coupling by microphytobenthos: an energy-and material-based model for initiation of blooms of Aureococcus anophagefferens. Harmful Algae 3:403-37.
Mackey, K. R. M., Labiosa, R. G., Calhoun, M., Street, J. H., Post, A. F. & Paytan, A. 2007. Phosphorus availability, phytoplankton community dynamics, and taxon-specific phosphorus status in the Gulf of Aqaba, Red Sea. Limnology and Oceanography 52:873-85.
Mackey, M. D., Mackey, D. J., Higgins, H. W. & Wright, S. W. 1996. CHEMTAX a program for estimating class abundances from chemical markers: application to HPLC measurements of phytoplankton. Marine Ecology Progress Series 14:265-83.
Malzahn, A. M., Aberle, N., Clemmesen, C. & Boersma, M. 2007. Nutrient limitation of primary producers affects planktivorous fish condition. Limnology and Oceanography 52:2062-71.
Marcus, N. H. & Boero, F. 1998. Minireview: the importance of benthic-pelagic coupling and the forgotten role of life cycles in coastal aquatic systems. Limnology and Oceanography 43:763-68.
Martin-Jézéquel, V., Hildebrand, M. & Brzezinski, M. A. 2003. Silicon metabolism in diatoms: implications for growth. Journal of Phycology 36:821-40.
Martin, P., Van Mooy, B. A. S., Heithoff, A. & Dyhrman, S. T. 2010. Phosphorus supply drives rapid turnover of membrane phospholipids in the diatom Thalassiosira pseudonana. ISME J. 5:1057-60.
Martínez, M. L., Intralawan, A., Vázquez, G., Pérez-Maqueo, O., Sutton, P. & Landgrave, R. 2007. The coasts of our world: Ecological, economic and social importance. Ecological Economics 63:254-72.
Middelburg, J. J., Barranguet, C., Boschker, H. T. S., Herman, P. M. J., Moens, T. & Heip, C. H. R. 2000. The fate of intertidal microphytobenthos carbon: An in situ 13C-labeling study. Limnology and Oceanography 45:1224-34.
Middelburg, J. J. & Levin, L. A. 2009. Coastal hypoxia and sediment biogeochemistry. Biogeosciences Discussions 6:3655-706.
Moal, J., Martin-Jezequel, V., Harris, R. P., Samain, J.-F. & Poulet, S. A. 1987. Interspecific and intraspecific variability of the chemical-composition of marine-phytoplankton. Oceanologica Acta 10:339-46.
Monbet, Y. 1992. Control of phytoplankton biomass in estuaries: a comparative analysis of microtidal and macrotidal estuaries. Estuaries and Coasts 15:563-71.
Montani, S., Magni, P. & Abe, N. 2003. Seasonal and interannual patterns of intertidal microphytobenthos in combination with laboratory and areal production estimates. Marine Ecology Progress Series 249:79-91.

161
Müller-Navarra, D. C. 2008. Food web paradigms: The biochemical view on trophic interactions. International Review of Hydrobiology 93:489-505.
Müller-Navarra, D. C., Brett, M. T., Liston, A. M. & Goldman, C. R. 2000. A highly unsaturated fatty acid predicts carbon transfer between primary producers and consumers. Nature 403:74-77.
Müller, F., Struyf, E., Hartmann, J., Weiss, A. & Jensen, K. 2013. Impact of grazing management on silica export dynamics of Wadden Sea saltmarshes. Estuarine, Coastal and Shelf Science 127:1-11.
Muyzer, G. 1999. DGGE/TGGE a method for identifying genes from natural ecosystems. Curr. Opin. Microbiol. 2:317-22.
Nieuwenhuize, J. & Poley-Vos, C. H. 1989. A rapid microwave dissolution method for the determination of trace and minor elements in lyophilized plant material. Atomic Spectroscopy 10:148-53.
Nixon, S. W. 1995. Coastal marine eutrophication: a definition, social causes, and future concerns. Ophelia 41:199-219.
Nübel, U., Garcia-Pichel, F. & Muyzer, G. 1997. PCR primers to amplify 16S rRNA genes from cyanobacteria. Appl. Environ. Microbiol. 63:3327-32.
Orvain, F., Sauriau, P.-G., Sygut, A., Joassard, L. & Le Hir, P. 2004. Interacting effects of Hydrobia ulvae bioturbation and microphytobenthos on the erodibility of mudflat sediments. Marine Ecology Progress Series 278:205-23.
Paerl, H. W. & Pinckney, J. L. 1996. A mini-review of microbial consortia: Their roles in aquatic production and biogeochemical cycling. Microb. Ecol.31:225-47.
Paerl, H. W., Valdes, L. M., Pinckney, J. L., Piehler, M. F., Dyble, J. & Moisander, P. H. 2003. Phytoplankton photopigments as indicators of estuarine and coastal eutrophication. Bioscience 53:953-64.
Parkhill, J. P., Maillet, G. & Cullen, J. J. 2001. Fluorescence-based maximal quantum yield for PSII as a diagnostic of nutrient stress. Journal of Phycology 37:517-29.
Paterson, D. M., Wiltshire, K. H., Miles, A., Blackburn, J., Davidson, I., Yates, M. G., McGrorty, S. & Eastwood, J. A. 1998. Microbiological mediation of spectral reflectance from intertidal cohesive sediments. Limnology and Oceanography 43:1207-21.
Paytan, A. & McLaughlin, K. 2007. The oceanic phosphorus cycle. Chem. Rev. 107:563-76. Peperzak, L., Colijn, F., Gieskes, W. W. C. & Peeters, J. C. H. 1998. Development of the
diatom-Phaeocystis spring bloom in the Dutch coastal zone of the North Sea: the silicon depletion versus the daily irradiance threshold hypothesis. Journal of Plankton Research 20:517-37.
Philippart, C. J. M., Beukema, J. J., Cadée, G. C., Dekker, R., Goedhart, P. W., van Iperen, J. M., Leopold, M. F. & Herman, P. M. J. 2007. Impacts of nutrient reduction on coastal communities. Ecosystems 10:96-119.
Philippart, C. J. M., Cadée, G. C., van Raaphorst, W. & Riegman, R. 2000. Long-term phytoplankton-nutrient interactions in a shallow coastal sea: Algal community structure, nutrient budgets, and denitrification potential. Limnology and Oceanography 45:131-44.
Philippart, C. J. M., Van Iperen, J. M., Cadée, G. C. & Zuur, A. F. 2010. Long-term field observations on seasonality in Chlorophyll-a concentrations in a shallow coastal marine ecosystem, the Wadden Sea. Estuaries and Coasts 33:286-94.

162
Philippart, K. J. M. & Epping, E. G. 2010. The Wadden Sea: a coastal ecosystem under continuous change. In: Kennish, M.J., Paerl, H.W. (eds) Coastal lagoons: critical habitats of environmental change. CRC Press - Marine Science Book Series, 568.
Philippart, C. J. M., Salama, M. S., Kromkamp, J. C., van der Woerd, H. J., Zuur, A. F. & Cadée, G. C. 2013. Four decades of variability in turbidity in the western Wadden Sea as derived from corrected Secchi disk readings. Journal of Sea Research 83:67-79.
Piepho, M., Arts, M. T. & Wacker, A. 2012. Species-specific variation in fatty acid concentrations of four phytoplankton species: does phosphorus supply influence the effect of light intensity or temperature? Journal of Phycology 48:64-73.
Pinckney, J. & Zingmark, R. G. 1991. Effects of tidal stage and sun angles on intertidal benthic microalgal productivity. Marine Ecology Progress Series 76:81-89.
Porter, E. T., Mason, R. P. & Sanford, L. P. 2010. Effect of tidal resuspension on benthic-pelagic coupling in an experimental ecosystem study. Marine Ecology Progress Series 413:33-53.
Postma, H. 1981. Exchange of materials between the North Sea and the Wadden Sea. Marine Geology 40:199-213.
Ranhofer, M. L., Lawrenz, E., Pinckney, J. L., Benitez-Nelson, C. R. & Richardson, T. L. 2009. Cell-specific alkaline phosphatase expression by phytoplankton from Winyah Bay, South Carolina, USA. Estuaries and Coasts 32:943-57.
Redfield, A. C. 1958. The biological control of chemical factors in the environment. Am. Sci. 46:205-21.
Reise, K. 2002. Sediment mediated species interactions in coastal waters. Journal of Sea Research 48:127-41.
Rengefors, K., Ruttenberg, K. C., Haupert, C. L., Taylor, C., Howes, B. L. & Anderson, D. M. 2003. Experimental investigation of taxon-specific response of alkaline phosphatase activity in natural freshwater phytoplankton. Limnology and Oceanography 48:1167-75.
Ridderinkhof, H. 1988. Tidal and residual flows in the western Dutch Wadden Sea .2. An analytical model to study the constant flow between connected tidal basins. Netherlands Journal of Sea Research 22:185-98.
Riegman, R., Kuipers, B. R., Noordeloos, A. A. M. & Witte, H. J. 1993. Size-differential control of phytoplankton and the structure of plankton communities. Netherlands Journal of Sea Research 31:255-65.
Rijstenbil, J. W. 2003. Effects of UVB radiation and salt stress on growth, pigments and antioxidative defence of the marine diatom Cylindrotheca closterium. Marine Ecology Progress Series 254: 37-48.
Rousseau, V., Leynaert, A., Daoud, N. & Lancelot, C. 2002. Diatom succession, silicification and silicic acid availability in Belgian coastal waters (Southern North Sea). Marine Ecology Progress Series 236:61-73.
Rouzic, B. L. & Bertru, G. 1997. Phytoplankton community growth in enrichment bioassays: Possible role of the nutrient intracellular pools. Acta Oecologica 18:121-33.
Sannigrahi, P., Ingall, E. D. & Benner, R. 2006. Nature and dynamics of phosphorus-containing components of marine dissolved and particulate organic matter. Geochimica et Cosmochimica Acta 70:5868-82.
Sargent, J. R. 1997. Fish oils and human diet. Br. J. Nutr. 78:S5-S13.
163
Schallenberg, M. & Burns, C. W. 2004. Effects of sediment resuspension on phytoplankton production: teasing apart the influences of light, nutrients and algal entrainment. Freshwater Biology 49:143-59.
Scharek, R., Van Leeuwe, M. A. & De Baar, H. J. W. 1997. Responses of Southern Ocean phytoplankton to the addition of trace metals. Deep Sea Research Part II: Topical Studies in Oceanography 44:209-27.
Scheffer, M., Carpenter, S., Foley, J. A., Folke, C. & Walker, B. 2001. Catastrophic shifts in ecosystems. Nature 413:591-96.
Scheffer, M. & Van Nes, E. H. 2004. Mechanisms for marine regime shifts: Can we use lakes as microcosms for oceans? Progress in Oceanography 60:303-19.
Schindler, D. W. 2006. Recent advances in the understanding and management of eutrophication. Limnology and Oceanography 51:356-63.
Schindler, D. W. 2009. A personal history of the Experimental Lakes Project. Canadian Journal of Fisheries and Aquatic Sciences 66:1837-47.
Schoemann, V., Becquevort, S., Stefels, J., Rousseau, V. & Lancelot, C. 2005. Phaeocystis blooms in the global ocean and their controlling mechanisms: a review. Journal of Sea Research 53:43-66.
Schulz, K. L. & Sterner, R. W. 1999. Phytoplankton phosphorus limitation and food quality for Bosmina. Limnology and Oceanography 44:1549-56.
Serôdio, J. 2003. A chlorophyll fluorescence index to estimate short-term rates of photosynthesis by intertidal microphytobenthos. Journal of Phycology 39:33-46.
Serôdio, J., Coelho, H., Vieira, S. & Cruz, S. 2006. Microphytobenthos vertical migratory photoresponse as characterised by light-response curves of surface biomass. Estuarine, Coastal and Shelf Science 68:547-56.
Serôdio, J., daSilva, J. M. & Catarino, F. 1997. Nondestructive tracing of migratory rhythms of intertidal benthic microalgae using in vivo chlorophyll a fluorescence. Journal of Phycology 33:542-53.
Serôdio, J., Vieira, S. & Cruz, S. 2008. Photosynthetic activity, photoprotection and photoinhibition in intertidal microphytobenthos as studied in situ using variable chlorophyll fluorescence. Continental Shelf Research 28:1363-75.
Shannon, C. E. & Weaver, W. 1948. A mathematical theory of communication. American Telephone and Telegraph Company.
Sharathchandra, K. & Rajashekhar, M. 2011. Total lipid and fatty acid composition in some freshwater cyanobacteria. Journal of Algal Biomass Utilization 2:83-97.
Shin, K., Hama, T., Yoshie, N., Noriki, S. & Tsunogai, S. 2000. Dynamics of fatty acids in newly biosynthesized phytoplankton cells and seston during a spring bloom off the west coast of Hokkaido Island, Japan. Marine Chemistry 70:243-56.
Silsbe, G. M. & Kromkamp, J. C. 2012. Modeling the irradiance dependency of the quantum efficiency of photosynthesis. Limnology and Oceanography-Methods 10:645-52.
Slomp, C. P., Malschaert, J. F. P., Lohse, L. & Van Raaphorst, W. 1997. Iron and manganese cycling in different sedimentary environments on the North Sea continental margin. Continental Shelf Research 17:1083-117.
Smith, V. H., Joye, S. B. & Howarth, R. W. 2006. Eutrophication of freshwater and marine ecosystems. Limnology and Oceanography 51:351-55.

164
Stal, L. J. & de Brouwer, J. F. C. 2003. Biofilm formation by benthic diatoms and their influence on the stabilization of intertidal mudflats. Berichte-Forschungszentrum Terramare 12:109-11.
Stelfox-Widdicombe, C. E., Archer, S. D., Burkill, P. H. & Stefels, J. 2004. Microzooplankton grazing in Phaeocystis and diatom-dominated waters in the southern North Sea in spring. Journal of Sea Research 51:37-51.
Sterner, R., Clasen, J., Lampert, W. & Weisse, T. 1998. Carbon: phosphorus stoichiometry and food chain production. Ecology Letters 1:146-50.
Sverdrup, H. U. 1953. On conditions for the vernal blooming of phytoplankton. Journal du Conseil 18:287-95.
Tengberg, A., Almroth, E. & Hall, P. 2003. Resuspension and its effects on organic carbon recycling and nutrient exchange in coastal sediments: in situ measurements using new experimental technology. Journal of Experimental Marine Biology and Ecology 285:119-42.
Thornton, D. C. O., Dong, L. F., Underwood, G. J. C. & Nedwell, D. B. 2002. Factors affecting microphytobenthic biomass, species composition and production in the Colne Estuary (UK). Aquatic Microbial Ecology 27:285-300.
Tillmann, U., Hesse, K. J. & Colijn, F. 2000. Planktonic primary production in the German Wadden Sea. Journal of Plankton Research 22:1253-76.
Tiselius, P., Hansen, B. W. & Calliari, D. 2012. Fatty acid transformation in zooplankton: from seston to benthos. Marine Ecology Progress Series 446:131-44.
Tulp, I., Bolle, L. J. & Rijnsdorp, A. D. 2008. Signals from the shallows: in search of common patterns in long-term trends in Dutch estuarine and coastal fish. Journal of Sea Research 60:54-73.
Turner, J. T., Ianora, A., Esposito, F., Carotenuto, Y. & Miralto, A. 2002. Zooplankton feeding ecology: does a diet of Phaeocystis support good copepod grazing, survival, egg production and egg hatching success? Journal of Plankton Research 24:1185-95.
Ubertini, M., Lefebvre, S., Gangnery, A., Grangeré, K., Le Gendre, R. & Orvain, F. 2012. Spatial variability of benthic-pelagic coupling in an estuary ecosystem: Consequences for microphytobenthos resuspension phenomenon. PLoS ONE 7.
Underwood, G. J. C. 2010. Microphytobenthos and phytoplankton in the Severn estuary, UK: Present situation and possible consequences of a tidal energy barrage. Marine Pollution Bulletin 61:83-91.
Underwood, G. J. C. & Kromkamp, J. 1999. Primary production by phytoplankton and microphytobenthos in estuaries. In: Nedwell, D. B. & Raffaelli, D. G. [Eds.] Advances in Ecological Research, Vol 29: Estuaries. Elsevier Academic Press Inc, San Diego, pp. 93-153.
Urabe, J., Clasen, J. & Sterner, R. W. 1997. Phosphorus limitation of Daphnia growth: is it real? Limnology and Oceanography 42:1436-43.
Valderrama, J. C. 1981. The simultaneous analysis of total nitrogen and total phosphorus in natural waters. Marine Chemistry 10:109-22.
Van Bennekom, A. J., Krijgsman-van Hartingsveld, E., Van der Veer, G. C. M. & Van Voorst, H. F. J. 1974. The seasonal cycles of reactive silicate and suspended diatoms in the Dutch Wadden Sea. Netherlands Journal of Sea Research 8:174-207.
Van Beusekom, J. E. E. 2005. A historic perspective on Wadden Sea eutrophication. Helgoland Marine Research 59:45-54.
165
Van Beusekom, J. E. E. & De Jonge, V. N. 2012. Dissolved organic phosphorus: An indicator of organic matter turnover? Estuarine Coastal and Shelf Science 108:29-36.
Van Beusekom, J. E. E., Loebl, M. & Martens, P. 2009. Distant riverine nutrient supply and local temperature drive the long-term phytoplankton development in a temperate coastal basin. Journal of Sea Research 61:26-33.
Van Boekel, W. H. M. & Veldhuis, M. J. W. 1990. Regulation of alkaline phosphatase synthesis in Phaeocystis sp. Marine Ecology Progress Series 61:281-89.
Van den Meersche, K., Middelburg, J. J., Soetaert, K., van Rijswijk, P., Boschker, H. T. S. & Heip, C. H. R. 2004. Carbon-nitrogen coupling and algal-bacterial interactions during an experimental bloom: Modeling a C-13 tracer experiment. Limnology and Oceanography 49:862-78.
Van der Wal, D., Wielemaker-van den Dool, A. & Herman, P. M. J. 2010. Spatial synchrony in intertidal benthic algal biomass in temperate coastal and estuarine ecosystems. Ecosystems 13:338-51.
Van der Wielen, P. W. J. J., Bolhuis, H., Borin, S., Daffonchio, D., Corselli, C., Giuliano, L., D'Auria, G., de Lange, G. J., Huebner, A. & Varnavas, S. P. 2005. The enigma of prokaryotic life in deep hypersaline anoxic basins. Science 307:121-23.
Van Heteren, S., Oost, A. P., van der Spek, A. J. F. & Elias, E. P. L. 2006. Island-terminus evolution related to changing ebb-tidal-delta configuration: Texel, The Netherlands. Marine Geology 235:19-33.
Van Ledden, M., Wang, Z.-B., Winterwerp, H. & de Vriend, H. 2004. Sand–mud morphodynamics in a short tidal basin. Ocean Dynamics 54:385-91.
Van Mooy, B. A. S., Fredricks, H. F., Pedler, B. E., Dyhrman, S. T., Karl, D. M., Koblí & zcaron, M. 2009. Phytoplankton in the ocean use non-phosphorus lipids in response to phosphorus scarcity. Nature 458:69-72.
Van Raaphorst, W. & De Jonge, V. N. 2004. Reconstruction of the total N and P inputs from the IJsselmeer into the western Wadden Sea between 1935–1998. Journal of Sea Research 51:109-31.
Veldhuis, M., Colijn, F. & Admiraal, W. 1991. Phosphate utilization in Phaeocystis pouchetii (Haptophyceae). Marine Ecology 12:53-62.
Vestal, J. R. & White, D. C. 1989. Lipid analysis in microbial ecology. Bioscience 39:535-41. Von Elert, E. 2002. Determination of limiting polyunsaturated fatty acids in Daphnia galeata
using a new method to enrich food algae with single fatty acids. Limnology and Oceanography 47:1764-73.
Winder, M. & Cloern, J. E. 2010. The annual cycles of phytoplankton biomass. Philosophical Transactions of the Royal Society B: Biological Sciences 365:3215-26.
Winterwerp, J. C. & Van Kesteren, W. G. M. 2004. Introduction to the physics of cohesive sediment dynamics in the marine environment. Elsevier Science,
Yoshimura, K., Ogawa, T. & Hama, T. 2009. Degradation and dissolution properties of photosynthetically-produced phytoplankton lipid materials in early diagenesis. Marine Chemistry 114:11-18.
Zingone, A., Dubroca, L., Iudicone, D., Margiotta, F., Corato, F., Ribera d’Alcalà, M., Saggiomo, V. & Sarno, D. 2010. Coastal phytoplankton do not rest in winter. Estuaries and Coasts 33:342-61.

166

167
SUMMARY The long-term monitoring series as runs in the coastal ecosystem of the Wadden Sea
revealed that the decrease of dissolved inorganic nitrogen (DIN) and dissolved inorganic phosphorus (DIP) loads was especially successful for DIP after the 1980s. In order to reverse eutrophication, measures have been implemented in order to decrease DIN. However, these measures were not successful, resulting in an increase in the DIN:DIP to above the Redfield ratio of 16. Monitoring data of nutrients and chlorophyll-a (Chla) were used as a proxy for phytoplankton biomass in the western Dutch Wadden Sea. These data suggest that DIP is currently limiting the growth of primary producers. However, there is not much experimental data that supports the occurrence of P limitation of primary producer communities in the Marsdiep basin. Therefore, field surveys and a series of nutrient enrichment experiments were conducted in the Marsdiep basin aiming at the identification of the limiting nutrient for the phytoplankton community.
A long-term data series of phytoplankton and water quality has been obtained from the NIOZ sampling jetty, a station close to the Marsdiep inlet. In order to be able to extrapolate these data to a larger area, such as the whole Marsdiep basin, the spatial and temporal dynamics of the phytoplankton community has to be known. The different scales of variation in phytoplankton community were investigated by carrying out surveys during different phases of the development of phytoplankton during the growth season and at different locations in the Marsdiep basin (chapter 2). Sampling was routinely done at high and low tide. There were no significant differences in the physicochemical parameters or the phospholipid fatty acid (PLFA) composition between low or high tide. From these results it was concluded that the NIOZ sampling jetty data at high tide reflect the situation in the Marsdiep basin. The influence of the episodic freshwater discharges from Lake IJsselmeer into the Marsdiep basin caused spatial differences in the nutrient concentrations, particulate organic matter and phytoplankton species composition (PLFA composition from the CHEMTAX analysis), which, consequently, may influence phytoplankton productivity in the Marsdiep area.
In order to verify the conclusions drawn from the monitoring data of nutrients and phytoplankton dynamics in the Marsdiep basin, multiple nutrient enrichment experiments were carried out under laboratory conditions with natural phytoplankton communities sampled from the NIOZ sampling jetty during the spring bloom (chapter 3). These measurements were combined with assays of the physiological status of the phytoplankton. The characterization of the underwater light field strongly suggested that the light was not limiting phytoplankton growth during the spring bloom nor after the remainder of the growth season. However, nutrient concentrations and ratios suggested a possible limitation by either phosphate or silicate. We observed a highly dynamic phytoplankton community with regard to species composition and growth rates. The phytoplankton succession from diatoms to Phaeocystis globosa that took place in the Wadden Sea and in the coastal North Sea occurred also in the natural phytoplankton assemblage at the NIOZ sampling jetty, which were used for the bioassay experiments. The

168
results of the bioassays indicated that the changes in Chla, photosynthetic efficiency (Fv/Fm), the expression of alkaline phosphatase activity, and the 13C stable isotope incorporation in particulate organic carbon, pointed to P limitation, although there was a short period of Si-P-co-limitation of the diatoms. The conclusion drawn in chapter 3 was that the limited availability of inorganic P influenced in the photosynthetic parameters and the net growth rates of phytoplankton. The net growth rates of the diatoms were low as a result of grazing losses. The outcome of chapter 3 supported the hypothesis that the phytoplankton during the spring bloom experienced P limitation and that this limitation resulted in a low phytoplankton biomass. Chapter 4 continues this research and reports on the effect of P limitation on the composition of the phytoplankton community.
Nutrient limitation influences the physiological and biochemical properties of phytoplankton and its growth rate and this is also true for P limitation. A series of short term (24h) phosphate enrichments were performed at different locations of the western Dutch Wadden Sea from mid-spring to early autumn, covering the phytoplankton seasonal cycle. This allowed us to follow the response of natural phytoplankton assemblages after P addition (chapter 4). During spring (April and May), the phytoplankton community responded to P addition by increasing the rate of C-incorporation into PLFA. However, not every phytoplankton taxon responded equally to this phosphate addition. In particular, the Bacillariophyceae were P-limited and were a poor competitor when compared to other phytoplankton groups. At the end of the spring bloom in May, P concentrations increased and induced spatial differences in phytoplankton P status (P-limited and P-replete). The threshold for P limitation in phytoplankton ranged from 0.11-0.17 μmol L-1. During the spring bloom (April and May sampling periods), most phytoplankton expressed alkaline phosphatase (AP), an enzyme synthesized under P limitation and capable to hydrolyze a broad range of DOP (especially those with phosphomonester bonds). Subsequently, phytoplankton recovered from P limitation and the concentration of soluble reactive phosphorus (SRP) rose from 0.11-0.17 (May) to 0.4-0.6 μmol L-1 (September). Nevertheless, about 40% of the cells still expressed AP. A threshold of P concentration for APA synthesis is not expected to be similar between sampling months because some cells were P-limited at lower SRP concentrations during the spring sampling.
It was investigated whether MPB is suspended into the water column of the Marsdiep (Chapter 5). In order to answer this question, benthic and pelagic microalgae were compared using two methodological approaches, i.e. the chemotaxonomic biomarker PLFA and denaturing gradient gel electrophoresis (DGGE). For DGGE, primers for cyanobacterial-16S rRNA- and general eukaryal-18S rRNA genes were used. The DGGE cluster analyses revealed a separation between the benthic and pelagic communities. The PLFA cluster analysis gave similar results as with DGGE, with the exception of an overlap of the benthic and pelagic communities in May-June. This difference between the two methods could be attributed to different taxonomic resolution and physiological status of the studied communities. The DGGE cluster analysis revealed seasonal changes for the Eukarya, while this was not so much the case for the cyanobacteria. Despite the turbulent hydrodynamic conditions in the Marsdiep basin caused by

169
wind and tidal currents, no major suspension events of microphytobenthos (MPB) into the water column were observed.
A method was developed for a two-dimensional quantification of MPB vertical migration and photosynthetic activity in different sediment depth layers using an imaging pulse amplitude modulated fluorescence (iPAM) (Chapter 6). Measurements were performed on cores from a muddy and sandy location. At the muddy site, epipelic MPB species migrated in the sediment and this appeared to be driven by endogenous rhythms. The cells started to migrate to the surface in darkness a few hours before low tide (hence, the changes were not triggered by light). The photosynthetic activity was highest during the middle of low tide. The migration patterns were present at all depth layers investigated (up to 2 mm). At the sandy sediment, the increase of surface biomass and photosynthetic activity was apparently caused by positive phototaxis. In addition to the fluorescence measurements, DI13C labeling in situ experiments were done at both locations. Although biomass was lower at the muddy site, C-fixation rates were higher in these sediments. At both sites more than 50% of the fixed C was recovered in glucose. The higher specific activity of the epipelic MPB of the muddy site was probably due to EPS production associated with the motility of the diatoms.
Summarizing the main discoveries described in this thesis, it was demonstrated that the phytoplankton community in the Marsdiep basin of the western Dutch Wadden Sea was influenced by a variety of abiotic factors. P was a main limiting factor during the spring bloom which lasted until May and this had a strong influence on the phytoplankton biomass and composition. It became also clear that DOP needs to be better characterized in order to understand its source of P for phytoplankton growth. Lastly, MPB primary production needs to be included in future monitoring programs of the Wadden Sea because it will give a better understanding of the carrying capacity of this environment and bottom up regulation of higher trophic levels.
170
SAMENVATTING Uit tijdseries van anorganische opgeloste nutriënten in de Nederlandse Waddenzee,
waaronder opgelost anorganisch fosfaat (DIP) en opgelost anorganisch stikstof (DIN), blijkt dat de verlaging van de nutriëntenbelasting in de jaren tachtig vooral voor fosfaat succesvol is geweest. De getroffen maatregelen om de DIN belasting te verlagen en daarmee de eutrofiëring terug te dringen zijn echter minder succesvol gebleken. Het verschil in succes resulteerde in een stijging van de verhouding DIN:DIP tot boven Redfield’s verhouding van 16. Deze data suggereren ook dat DIP momenteel de groei van primaire producenten in de Nederlandse Waddenzee beperkt, maar concrete experimentele data ontbreken om deze hypothese te verifiëren. Daarom is in deze studie getracht om door middel van veldmetingen en nutriëntverrijkingsexperimenten te achterhalen wanneer welke nutriënt de groet van de fytoplanktongemeenschap beperkt.
De Waddenzee tijdserie, waarin fytoplankton en waterkwaliteit worden gemeten, wordt bemonstert vanaf de NIOZ steiger in het Marsdiep. Om deze tijdserie te kunnen extrapoleren naar een groter gebied, zoals het Mardiep bekken, is kennis over de ruimtelijke en temporele dynamiek van de fytoplankton gemeenschap onontbeerlijk. Deze dynamiek hebben we bestudeerd door fytoplankton tijdens hoog- en laagwater gedurende een voorjaarswaterbloei te bemonsteren op geselecteerde locaties in het Marsdiep bekken (zie Hoofdstuk 2). Er bleek geen significant verschil in de fysische en chemische parameters tussen hoog- en laagwater, noch in de samenstelling van de fosfolipidevetzuren (PLFA). Daaruit kon worden geconcludeerd dat bij hoogwater de monstername van de NIOZ steiger een goede weergave geeft van de temporele variaties in het gehele Marsdiepbekken. Ruimtelijke verschillen in nutriëntenconcentratie, partikelvormig organisch materiaal (POM) en fytoplankton soortensamenstelling (PLFA samenstelling uit de CHEMTAX analyse) konden vooral worden toegeschreven aan de frequente toevoer van zoetwater vanuit het IJsselmeer. Dit zorgt voor ruimtelijke verschillen in de fytoplankton productie in het Marsdiepbekken.
Om de hypothese te testen dat DIP de fytoplanktongroei beperkt werd fytoplankton verrijkt met nutriënten. Deze experimenten werden uitgevoerd in het lab met de natuurlijke gemeenschap van het fytoplankton. De monsters werden genomen vanaf de NIOZ steiger tijdens verschillende fases van de voorjaarswaterbloei (Hoofdstuk 3). Daarnaast werden a-biotische factoren in het water en de fysiologische status van het fytoplankton bepaald. De soortensamenstelling en groeisnelheid veranderden snel gedurende het seizoen met een successie van een door kiezelwieren naar een door Phaeocystis globosa gedomineerde gemeenschap. Lichtmetingen in het water toonden aan dat er gedurende het gehele seizoen voldoende licht aanwezig was en dat het daarom de groei dus niet kon beperken. De lage concentraties van DIP en silica (DSi) alsmede hun verhouding tot DIN suggereerde dat deze beide nutriënten mogelijk de groei konden beperken. Dit was slechts het geval gedurende een korte periode waarin de kiezelwieren de fytoplanktongemeenschap domineerden.Uit de nutriëntenverrijkingexperimenten bleek dat chlorofyl a, de fotosynthetische efficiëntie (Fv/Fm), POM, alkaline fosfatase en de

171
opname van 13C ten gunste van de fytoplankton veranderden wanneer DIP werd toegevoegd. Daaruit kon worden geconcludeerd dat de beschikbaarheid van DIP de groei en hoeveelheid biomassa van fytoplankton tijdens de voorjaarswaterbloei beperkt. De groeisnelheid en hoeveelheid biomassa van kiezelwieren werd daarnaast ook nog beperkt door DSi en begrazing.
Hoofdstuk 4 gaat over de fytoplanktongemeenschap en hoe deze wordt beïnvloed door de beschikbaarheid van DIP. De beperkte beschikbaarheid van nutriënten zoals DIP heeft gevolgen voor de fysiologie en de biochemische eigenschappen van het fytoplankton. Om dit nader te bestuderen werden er een serie korte (24 uur) experimenten uitgevoerd waarbij fytoplankton werd verrijkt met DIP. Tussen het midden van het voorjaar en het begin van het najaar in 2010 werden monsters genomen op meerdere plekken in het westelijke deel van de Nederlandse Waddenzee. De snelheid waarmee koolstof werd ingebouwd in PLFA steeg met de DIP-verrijking in het voorjaar (april-mei). Deze stijging was niet voor elke taxon gelijk. Vooral de kiezelwieren hadden in het voorjaar een tekort aan DIP en konden daardoor slecht concurreren met andere fytoplankton taxa. Aan het einde van de voorjaarswaterbloei (mei) was meer DIP beschikbaar, maar dit leidde ook tot grote ruimtelijke verschillen in het DIP tekort. Bij een DIP concentratie lager dan 0.11-0.17 μmol L-1 ondervindt fytoplankton een DIP tekort. Dit kunnen ze tegengaan door het enzym alkaline fosfatase (AP) aan te maken dat in staat is organisch opgelost fosfaat (DOP) te hydrolyseren. Hierdoor komt DOP beschikbaar als fosfaatbron. Tijdens de voorjaarsbloei (april-mei) produceren de meeste fytoplanktonsoorten AP. Zelfs in het najaar, wanneer de DIP concentratie is toegenomen tot 0.4-0.6 μmol L-1, maakt nog 40% van de fytoplanktoncellen AP aan. Er is waarschijnlijk geen ondergrens van de DIP concentratie voor het aanmaken van AP.
In hoofdstuk 5 werd onderzocht of de suspensie van bodemwieren (microfytobenthos, hierna afgekort tot MPB) in de waterkolom van het Marsdiep een belangrijk fenomeen is. Hiervoor werd de wierensamenstelling op het sediment en in de waterkolom met elkaar vergeleken doormiddel van de analyse van de chemotaxonomische biomarker PLFA en met behulp van denaturing gradient gel electrophoresis (DGGE). De DGGE werd uitgevoerd met primers voor het cyanobacteriële 16S rRNA gen en het algemene 18S rRNA gen van eukaryoten. Zowel de clusteranalyse van de DGGE als van de PLFA laten een duidelijke scheiding zien tussen de wieren in het sediment en die uit de waterkolom. Daarnaast bleek uit de DGGE analyse dat de eukaryoten een sterke seizoen dynamiek kennen, in tegenstelling tot de cyanobacteriën. In mei en juni overlapten de gemeenschappen van het sediment en die van de waterkolom deels in de PLFA analyse. Dit werd echter niet bevestigd door de DGGE analyse. Deze discrepantie is waarschijnlijk het gevolg van verschillen in de taxonomische resolutie van beide methoden of in de fysiologische conditie van de betreffende gemeenschappen. Dus hoewel de verwachting was dat op grond van de golfslag en de windcondities in de Waddenzee suspensie van bodemwieren zou moeten plaatsvinden, blijkt dit niet uit de metingen.
In hoofdstuk 6 wordt een nieuwe methode beschreven om de tweedimensionale verticale migratie in het sediment en de fotosynthese van MPB te kwantificeren. Deze methode maakt gebruik van imaging pulse amplitude modulated fluorescence (iPAM). Met deze methode

172
werden een slijkig en een zandig sediment met elkaar vergeleken. In het slijkig sediment migreerden epipelische MPB met een vast ritme, terwijl in het zandige sediment de migratie licht gestuurd leek te zijn. Enkele uren voor laagwater bewogen de MPB zich omhoog in het slijkig sediment, terwijl het nog niet licht was. Fotosynthese was gecorreleerd aan laagwater. Door de toevoeging van DI13C in beide sedimenten kon worden vestgesteld dat de fixatie van koolstof (C) hoger was in slijkig sediment, terwijl daar juist een kleinere hoeveelheid biomassa was. Meer dan de helft van de koolstoffixatie werde teruggevonden in glucose. De hogere koolstoffixatie is het best te verklaren met de productie van extracellulaire polymere substantie (EPS), hetgeen kenmerkend is voor migrerende epipelische kiezelwieren.
Concluderend toont dit proefschrift aan dat de fytoplanktongemeenschap in het Marsdiepbekken in het westelijke deel van de Nederlandse Waddenzee sterk wordt beïnvloed door niet-biologische factoren. Fosfaattekort beperkt de groei tijdens de voorjaarswaterbloei die van april tot eind mei duurt. Dit heeft ook gevolgen voor de soortensamenstelling en de hoeveelheid biomassa van het fytoplankton. Dit proefschrift toont ook aan dat DOP een belangrijke bron is voor de groei van het fytoplankton, maar ook dat de DOP samenstelling en zijn beschikbaarheid voor het fytoplankton beter bestudeerd moeten worden. Voor toekomstige monitoring van het fytoplankton is het raadzaam om ook de primaire productie van het MPB mee te nemen. Op deze wijze kan de draagkracht van de Waddenzee in zijn geheel worden bepaald en zullen we beter begrijpen hoe primaire producenten de hogere trofische niveaus beïnvloeden.

173
ACKNOWLEDGEMENTS
The completion of my Ph. D thesis has been a long journey…There were downs as well as ups but I am always learning and hope I will never stop learning.
Many brilliant colleagues and friends had inspired me on my way...
First and foremost, I would like to give my profound gratitude to my supervisor Jacco Kromkamp for guiding me throughout these four years of my PhD. His deep scientific insights and patience helped me at various stages. I am very grateful to him that he gave me the chance to live the life of a young research as a PhD student in the Netherlands.
My sincere gratitude is reserved to Lucas Stal for his constructive suggestions and willingness to correct several times the various drafts of the final version of the PhD manuscript. I enjoyed very much to work with the marine microbiology working group, both past and present, I thank all the MM members (Henk, Eric, Greg, Ina, Tetsuro, Veronique, Tanja, Julia, Christine, Clara, Michele, Anita and many more) for their collegiality and friendship.
I also enjoyed exploring the wonderful Dutch Wadden Sea. Most of the results in this thesis wouldn’t have been obtained without a close collaboration with the monitoring research program IN PLACE. This project was coordinated by Katja Philippart, I would like to express my gratitude to her not only for her scientific support but also for her kindness. Her useful comments and engagement through the learning process of this thesis help me to broader my perspectives. I would also like to acknowledge the others participants of this project (Thalia, Mark, Magriet, Suhyb, Eelke…) and the nice Navicula crew for helping me understanding my research area. I wish all the best to the two Ph.D partners of the project P-LIM: Lieke, I know you will submit a brillant Ph.D thesis and I also want to thank you for willing to translate my summary and Viola, I really appreciate the time we spent together on Texel.
Furthermore, I would like to thank Joaõ Serôdio and Joaõ Izequiel who had provided all the research facilities at the University of Aveiro during my stay in Portugal. The expertise found on the ecology and physiology of microphytobenthos has always amazed me.
I would like to pay tribute to the many amazing brains and souls who had spent time with me for anything and everything, listened to me when I need an ear. Thanks Diana and Haoxin for accepting to be my paranymphs, Diana, you are a wonder of Nature, you always found and will find nice words to help me seeing the bright sight of everything (little Luna is a very lucky one) and Haoxin, you have been a perfect office mate, many of the best lessons, I learned them by listening to you, I enjoyed very much our discussions, I already miss you a lot! Also, the JAY team, Alessia and Yayu, I miss you incredibly and I know somehow we will find a way to be together again, the caring, unique and supportive Tadao and Zhigang, Rohit I am fortunate to have you as a wise friend. To the smiling faces, warm and friendly hearts, I am forever indebted to all of you: Francesc (my first dearest friend in the Netherlands), Eduardo, Roger, Luciana,

174
Sairah, Eva, Dorina, Silvia, Francesco, Lucy, Heiko, Lara, Christina, Quan Xing, Zhenchang, Cheng Hui, Hélène, Marie, Laura, Loran, Kris and many more people…
Outside the NIOZ and Yerseke village, amazing hobbies put a smile on my face but also kept me ‘alive’ in the last phase of the Ph.D, I especially thank Sensei Baruto and Sensei Ruud for welcoming me in your respective dojos, Move’s crew for your good vibes and always ready to share your contagious passion, dance!
Words cannot convey the feelings I have for you, Sven…Thank you from the deep bottom of my heart for your unconditional support and love.
Finally, I would like to sincerely thank my world spread family members for their never ending inspiration and instilling in me not only confidence but many admirable qualities to finish this Ph.D. I wish to thank my two brothers for keeping down to Earth (the crazy creative ‘Ke’ and sweet generous ‘Ti’), my father and especially, my great role model, beautiful, inspiring and wise Mama.
I THANK you all once again!