microarray data analysis introduction -...
TRANSCRIPT

Microarray data analysis
Introduction
Department of Bioinformatics, Centro de Investigación Príncipe Felipe, and
Functional genomics node, INB, Spain.http://www.gepas.org.
http://www.babelomics.orghttp://bioinfo.cipf.es

Progress in science depends on new techniques, new discoveries and new ideas, probably in that order.
Sydney Brenner, 1980
Background
The introduction and popularisation of highthroughput techniques has drastically changed the way in which biological problems can be addressed and hypotheses can be tested.
But not necessarily the way in which we really address or test them…

From genotype to phenotype.
>protein kunase
acctgttgatggcgacagggactgtatgctgatctatgctgatgcatgcatgctgactactgatgtgggggctattgacttgatgtctatc....
…code for proteins...
…whose structure accounts for function...
Genes in the DNA...
…plus the environment...
…produces the final phenotype
The pregenomics paradigm

From genotype to phenotype.
(in the functional post-genomics scenario)
>protein kunase
acctgttgatggcgacagggactgtatgctgatctatgctgatgcatgcatgctgactactgatgtgggggctattgacttgatgtctatc....
…when expressed in the proper moment and place...
…in cooperation with other proteins…
…conforming complex interaction networks...
Genes in the DNA...
…whose final effect
configures the phenotype...
Each protein has an average of 8 interactions
A typical tissue is expressing among 5000 and 10000
genes
Now: 22240 (NCBI build 35 12/04) 5070% display alternative splicing25%60% unknownTransfrags
…code for proteins...
…whose structures account for function...
That undergo posttranslational
modifications, somatic recombination...
100K500K proteins
…which can be different because of the variability.
10 million SNPs
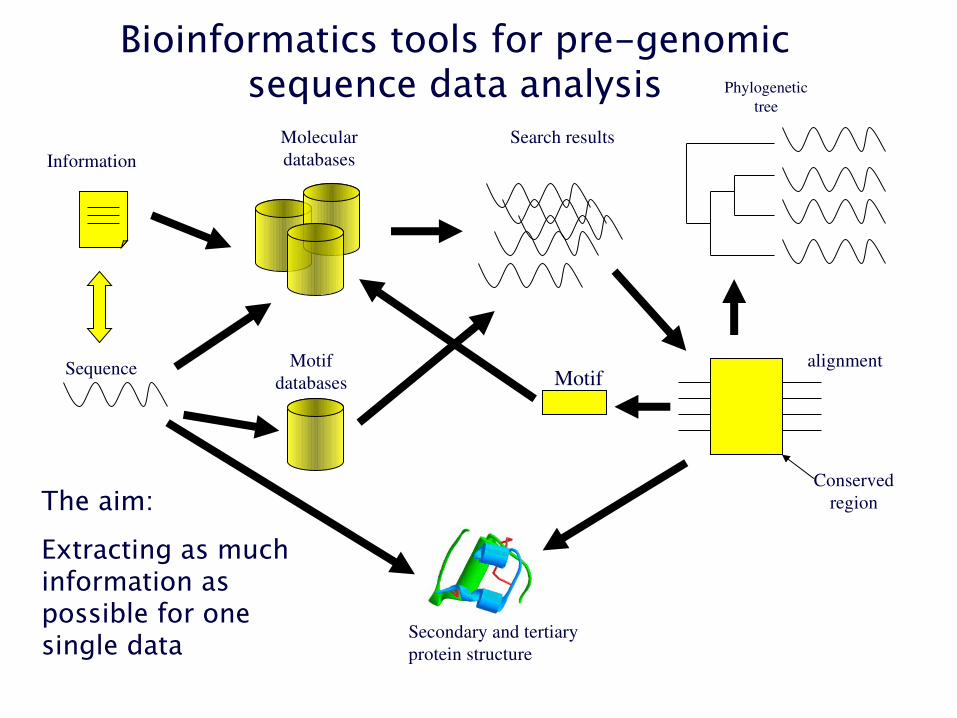
Sequence
Molecular databases
Search results
Phylogenetic tree
alignment
Conserved region
MotifMotif
databases
Information
Secondary and tertiary protein structure
Bioinformatics tools for pre-genomicsequence data analysis
The aim:
Extracting as much information as possible for one single data

Post-genomic vision

Post-genomic vision
Our capacity of producing data surpasses our capacity of analysing data
Guilty by association
Genome sequencing
2-hybrid systemsMass spectrometry
for protein complexes
ExpressionArrays
Literature, databases
Who?
Where, when and how much?
Real knowledge
In what way?
SNPs
And who else?
Data = information

Genome wide data and a note of caution:
Hypothesis Experiment test
Is gene A involved in process B?
Experiment (sometimes) test Hypothesis
Is there any gene (or set of genes) involved in any process?
Risks of the “guilty by association” concept.
Genome-wide technologies allows us to produce vast amounts of data. But... dealing with many data (omic data) increase the occurrence of spurious associations due to chance
Sure, but... Is it real? (many hypotheses are rejected while this one is accepted a posteriori: numerology)
The test is dependent on the hypothesis and not vice versa

genes
interactions
Post-genomic vision: whole system picture
Gene expression
Information
polimorphisms
InformationDatabases
New concepts:Clustering
Feature selectionFunctional
interpretation
Similar things behave similar
Not everything in the data is
relevant
The data has to be transformed into biological information

Gene expression profiling.Historic perspective
Differences at phenotype level are the visible cause of differences at molecular level which, in many cases, can be detected by measuring the levels of gene expression. The same holds for different experiments, treatments, strains, etc.
• Classification of phenotypes / experiments. Can I distinguish among classes (either known or unknown), values of variables, etc. using molecular gene expression data? (sensitivity)
• Selection of differentially expressed genes among the phenotypes / experiments. Did I select the relevant genes, all the relevant genes and nothing but the relevant genes? (specificity)
• Biological roles the genes are carrying out in the cell. What general biological roles are really represented in the set of relevant genes? (interpretation)

Microarrays arrive to an acceptable level of reproducibility

FDA approves the first predictor based on microarrays

Cy5 Cy3
cDNA arrays Oligonucleotide arrays
DNA microarrays: the paradigm of a post-genomic technique

Transforming images into numbersTwo-colorTest sample labeled red (Cy5)Reference sample labeled green (Cy3)Red : gene overexpressed in test sampleGreen : gene underexpressed in test sampleYellow - equally expressedred/green - ratio of expression
One colorIntensity of a gene using the probes
AffymetrixIntensity of a gene using the probes PM and in MM
Scanners generate a graphic file.
Software analyzes the file: GenePix Pro (by Axon Instruments, Inc.) or Imagene (By Biodiscovery, Inc.) There are free systems too: TIGR Spotfinder, ScanAlyze, etc
PM/MM

Normalisation
Before (left) and after (right) normalisation. A) BoxPlots, B) BoxPlots of subarrays and C) MA plots (ratio versus intensity)
(a) After normalization by average (b) after printtip lowess normalization (c) after normalisation taking into account spatial effects
There are many sources of error that can affect and seriously bias the interpretation of the results. Differences in the efficiency of labelling, the hybridisation, local effects, etc.
Normalisation is a necessary step before proceeding with the analysis
A
B
C

The dataCharacteristics of the data:
• We NEVER deal with individual arrays, we deal with collections of arrays obtained for a given experimental design
• Most of the genes are not informative with respect to the trait we are studying (account for unrelated physiological conditions, etc.)
• Number of variables (genes) is several orders of magnitude larger than the number of experiments
• Low signal to noise ratio
Genes(thousands)
Experimental conditions (from tens up to no more than a few houndreds)
A B C
Expression profile of a gene across the experimental conditions
Expression profile of all the genes for a experimental condition (array)
Different classes of experimental conditions, e.g. Cancer types, tissues, drug treatments, time survival, etc.
...

Co-expressing genes... What do they have in
common?
Different classes...
What genes are responsible for?
Molecular classification of
samples
Studies must be hypothesis driven.
What is our aim? Class discovery? sample classification? gene selection? ...
Can we find groups of experiments with similar gene expression profiles?
Unsupervised
Supervised

Co-expressing genes...
• What genes co-express?• How many different expression patterns do we have?• What do they have in common?• Etc.
Unsupervised problem: class discovery
Can we find groups of experiments with similar gene expression profiles?
Our interest is in discovering clusters of items (genes or experiments) which we do not know beforehand

Unsupervised clustering methods:Method + distance: produce groups of
items based on its global similarity
Non hierarchical hierarchical
K-means, PCA UPGMA
SOM SOTA
Different levels of
information

An unsupervised problem: clustering of genes.
• Gene clusters are previously unknown
• Distance function
• Cluster gene expression patterns based uniquely on their similarities.
• Results are subjected to further interpretation (if possible)

Perou et al., PNAS 96 (1999)
Clustering of experiments:The rationale
Distinctive gene expression patterns in human mammary epithelial cells and breast cancers
Overview of the combined in vitro and breast tissue specimen cluster diagram. A scaled-down
representation of the 1,247-gene cluster diagram The black bars show the positions of the clusters
discussed in the text: (A) proliferation-associated, (B) IFNregulated, (C) B lymphocytes, and (D) stromal cells.
If enough genes have their expression levels altered in the different experiments, we might be able of finding these classes by comparing gene expression profiles.

Clustering of experiments:The problems
Any gene (regardless its relevance for the classification) has the same weight in the comparison.
If relevant genes are not in overwhelming majority we will find:
Noise
and/or
irrelevant trends

Supervised problems: Class prediction and gene selection, based on gene expression profiles Information on classes (defined on criteria external to the gene
expression measurements) is used.
Problems:
How can classes A, B, C... be distinguished based on the corresponding profiles of gene expression?
How a continuous phenotypic trait (resistance to drugs, survival, etc.) can be predicted?
And
Which genes among the thousands analysed are relevant for the classification?
Genes(thousands)
Experimental conditions (from tens up to no more than a few houndreds)
A B C
Class prediction
Gene selection

Gene selection.The simplest way: univariant gene-by-
gene. Other multivariant approaches can be used
• Two classesT-testBayesData-adaptiveClear
• MulticlassAnovaClear
• Continuous variable (e.g. level of a metabolite)
PearsonSpearmamRegression
• SurvivalCox model The T-rex tool

A simple problem: gene selection for class discrimination
Genes differentially expressed among classes (t-test ), with p-value < 0.05
~15,000 genes
Case(10)/control(10)

Sorry... the data was a collection of random numbers labelled for two classes
So... Why do we find good p-values?
You were not interested a priori in the first (whatever), best
discriminant, gene.
Adjusted p-values must be used!

On the problem of multiple testing
Take one coin, flip it 10 times. Got 10 heads? Use it for betting
= 10 heads. P=0.5 =0.00098... 10
:
1000 coins
10 heads !!!
P= 1-(1-0.5 ) =0.62
It is not the same getting 10 heads with my coin than getting 10 heads in one
among 1000 coins
10 1000
Will you still use this coin for betting?

NE EECGenes differentially expressed between
normal endometrium and endometrioid
endometrial carcinomas
G Symbol A Number
Hierarchical Clustering of 86 genes with different expression patterns between Normal Endometrium and
Endometrioid Endometrial Carcinoma (FDR adjusted p<0.05) selected
among the ~7000 genes in the CNIO oncochip
Moreno et al., 2003 Cancer Research 63, 5697-5702

Of predictors and molecular signatures
What is a predictor?
Intuitive notion:A B X
Is X, A or B?
Most probably X belongs to class B
Diff (B, X) = 2 Diff (A, X) = 13
Algorithms: DLDA, KNN, SVM, random forests, PAM, etc.

CrossvalidationThe efficiency of a classifier can be estimated through a process of crossvalidation.
Typical are threefold, tenfold and leaveoneout (LOO), in case of few samples for the training

Selection bias
A B
Feature selection
A B
CV
Produce artificially small (biased-down) errors.
A
Training
Evaluation
B

Unbiased CVA B
Feature selection
A B
A
Training
Evaluation
B

Predictor of clinical outcome in breast cancer
van’t Veer et al., Nature, 2002
Genes are arranged to their correlation eith the pronostic groups
Pronostic classifier with optimal accuracy

Functional profiling of genome-scale experiments in the post-genomic era
How are structured?
Analysis
What is this gen?
Links
My data...
?
Functional profiling
What are these groups?
Cell cycle...
DBs Information
A B

Two-steps functional interpretation
statistic
+
A
Metabolism
Transport...Reproduction
test
A B
BMetabolismTransport...Reproduction
test
t-test
1
1
1Genes are selected based on their experimental values and...
2 Enrichment in functional terms is tested (FatiGO, GoMiner, etc.)
2
2

Testing two GO terms (remember, we have to test thousands)
Biosynthesis 60% Biosynthesis 20%
Sporulation 20% Sporulation 20%
Group A Group B
Genes in group A have significantly to do with biosynthesis, but not with sporulation.
Are this two groups of genes carrying out different biological roles?
The popular Fisher’s test
A
B
Bios
ynth
esis
Other
6
82
4

GO terms found in sets of 50 genes
10.122953cell adhesionGO:0007155
0.6043280.00875837vitamin metabolismGO:0006766
10.0276032catabolismGO:0009056
0.4594170.0123062initiation of viral infectionGO:0019059
0.1813530.016503viral infectious cycleGO:0019058
10.129865metabolism GO:0008152
10.151987organismal physiological process
GO:0050874
10.116317deathGO:0016265
0.3000940.0157944homeostasisGO:0042592
10.0595683sulfur metabolismGO:0006790
Adjusted pvaluepvalueDefinitionGO
Each row corresponds to a random selection of 50 genes from the E. coli genome, compared with respect to the rest of the genome.
GO terms in blue (p-value < 0.05 in individual test) have assymetrical distributions by chance (see adjusted p-values).

How to test significant differences in the distribution of biological tems between groups of genes?
FatiGO: GO-driven data analysisProvides a statistical framework able to deal with multiple-testing hipothesis
Al-Shahrour et al., 2004 Bioinformatics (3rd most cited paper in computing sciences. Source: ISI Web of knowledge.)
Al-Shahrour et al., 2005 Bioinformatics. Al-Shahrour et al., 2005 NAR
Al-Shahrour et al., 2006 NAR. Al-Shahrour et al., 2007 BMC Bioinformatics
Al-Shahrour et al., 2007 NAR

Compilation of tools for functional interpretation of sets of genes
Tool Statistical model Correction for multiple
experiments
Functional labels Site (webbased applications)
Reference
Babelomics Fisher's exact test, ttest, KolmogorovSmirnov
FDR, qvalue GO, KEGG, protein domains, swissprot keywords, Transfac motifs, CisRed motifs, chromosomal location, tissues, bioentities (textmining)
http://www.babelomics.org (AlShahrour et al., 2006; AlShahrour et al., 2005)
BayGO hypergeometric bayesian GO (Vencio et al., 2006) DAVID / EASEonline Fisher's exact test Bonferroni GO, pathways, diseases,
protein domains, interactions http://david.abcc.ncifcrf.gov/ (Dennis et al., 2003; Hosack et al.,
2003) FatiGO+ Fisher's exact test stepdown minP, FDR GO, KEGG, protein domains,
swissprot keywords, Transfac motifs, CisRed motifs, chromosomal location, tissues
http://www.fatigo.org (AlShahrour et al., 2004)
FuncSpec hypergeometric Bonferroni GO, phenotypes, protein interactions, etc. (only for yeast)
http://funspec.med.utoronto.ca/ (Robinson et al., 2002)
GeneMerge hypergeometric Bonferroni GO, KEGG, chromosomal location, other.
http://genemerge.bioteam.net/ (CastilloDavis & Hartl, 2003)
GO:TermFinder hypergeometric Bonferroni GO (Boyle et al., 2004) GoMiner Fisher's exact test FDR GO (Zeeberg et al., 2003; Zeeberg et al.,
2005) GOstat X2 Fisher's exact test FDR, Holm GO http://gostat.wehi.edu.au/ (Beissbarth & Speed, 2004) GoSurfer X2 qvalue GO (Zhong et al., 2004) GOToolBox hypergeometric, binomial,
Fisher's exact test Bonferroni GO http://crfb.univmrs.fr/GOToolBox/index.php (Martin et al., 2004)
Ontology Traverser hypergeometric FDR GO http://franklin.imgen.bcm.tmc.edu/rhoold/services/OntologyTraverser/
(Young et al., 2005)
OntoTools X2, binomial, hypergeometric Fisher's exact test
Sidak, Holm, Bonferroni, FDR GO, KEGG http://vortex.cs.wayne.edu/projects.htm (Draghici et al., 2003; Khatri et al., 2005)
FuncAssociate Fisher's exact test GO http://llama.med.harvard.edu/cgi/func/funcassociate (Berriz et al., 2003) GOTM hypergeometric GO http://bioinfo.vanderbilt.edu/gotm/ (Zhang et al., 2004) CLENCH Hypergeometric, X2, binomial GO (only for A. thaliana) (Shah & Fedoroff, 2004)

Gene List1
Gene List2
Organism
Biological process Molecular functionCellular component
KEGG pathwaysInterpro motifs
Swissprot keywordsBioentities from literature (Marmite)
Gene Expression (TMT)Transcription Factor binding sitesCis-regulatory elements (CisReD)
Functional terms


PTL LBC
Martinez et al., Clinical Cancer Research. 10: 4971-4982.
Limphomas from mature lymphocytes (LB) and precursor T-lymphocyte (PTL).
Genes differentially expressed, selected among the ~7000 genes in the CNIO oncochip
Genes differentially expressed among both groups were mainly related to immune response (activated in mature lymphocytes)
Understanding why genes differ in their expression between
two different conditions

Martinez et al., Human Genetics Laboratory. Molecular Pathology Programme, CNIO
Biological processes shown by the genes differentially expressed among PTL-LB
Obvious? NO
2) You now know that there are no other co-variables (e.g. age, sex, etc)
3) If you do not have previously a strong biological hypothesis, now you have an explanation

Weaknesses of the two-steps, functional enrichment approach
B17 with normal tolerance to glucose (NTG)
A8 with impaired tolerance (IGT) + 18 with type 2 diabetes mellitus (DM2)
A B
(Mootha et al., 2003)
Low sensitivity of conventional gene selection methods
Instability of molecular signatures. Variable selection with microarray data can lead to many solutions that are equally good from the point of view of prediction rates, but that share few common genes (Ein-Dor 2006 PNAS)
Platform comparison. There are still some concerns with the cross-platform coherence of results. Paradoxically, despite the fact that gene-by-gene results are not always the same, the biological themes emerging from the different platforms are increasingly consistent (Bammler 2005 Nat Methods)

Functional enrichment approach reproduces pre-genomics paradigms
experiments
interpretation
testno
pass
Context and cooperation between genes is ignored
experiments
testinterpretationtest
testtesttesttesttesttest....
::

Functional genomics.Historic perspective and future
Differences at phenotype level are the visible cause of differences at molecular level which, in many cases, can be detected by measuring the levels of gene expression. The same holds for different experiments, treatments, strains, etc.
• Classification of phenotypes / experiments. Sensitivity
• Selection of differentially expressed genes Specificity
• Biological roles the genes are carrying out in the cell. Interpretation
• Reformulating the questions. Are we asking the proper questions? What are the real bricks that account for the cellular behaviour and for the phenotype or the response to environmental stimuli? The genes or other higher level units?

What is the basic functional component in the cell?
Genes PHENOTYPE
Genes PHENOTYPEFunctional
module
e.g. KEGG pathway defines a functional module

Cooperative activity of genes can be detected and related to a macroscopic observation
statistic
+
A B GO1 GO2 GO3 Ranking: A list of genes is ranked by their differential expression between two experimental conditions A and B (using fold change, a t-test, etc.)
Distribution of GO: Rows GO1, GO2 and GO3 represent the position of the genes belonging to three different GO terms across the ranking.
The first GO term is completely uncorrelated with the arrangement, while GOs 2 and 3 are clearly associated to high expression in the experimental conditions B and A, respectively.
Note that genes can be multi-functional

A previous step of gene selection causes loss of information and makes the test insensitive
statistic
+
A B GO1 GO2
If a threshold based on the experimental values is applied, and the resulting selection of genes compared for over-abundance of a functional term, this migh not be found.
t-test with two tails.
p<0.05
Significantly over-expressed
in B
Significantly over-expressed
in A
Classes expressed as blocks in A and B
Very few genes selected to arrive to a significant
conclussion on GOs 1 and 2

A previous step of gene selection causes loss of information and makes the test insensitive
statistic
+
A B GO1 GO2 The main problem is that the two-steps approach cannot distinguish between these two different cases.
We put both sides of the partition into two bags and destroy the structure of the data.
t-test with two tails.
p<0.05
Significantly over-expressed
in B
Significantly over-expressed
in A
up downGO
no GO
3
0
9
25
Same contingency table for GO1 and GO2 !!

Gene-set enrichment methodsGSEA
+
A B FatiScan
significance
p1
p2
p3
Gene set
background
statisticIndependent of the
experimental design

FatiScan, a segmentation test, provides an easy approach to directly testing functional terms
statistic
+
A B
p1
p2
p3
GOs can be directly tested by a segmentation test. A series of partitions of the list are performed (p1, p2, p3…) and the GO terms for each functional class in the upper part are compared to the corresponding ones in the lower part by a Fisher test. Asymmetrical distributions of terms towards the extremes of the list will produce significant values of the test.
Finally, p-values are adjusted by FDR
Al-Shahrour et al., 2005 Bioinformatics
E.g., term GO2, partition p1
up downGO
no GO
4
2
6
30
GO1 GO2 GO3
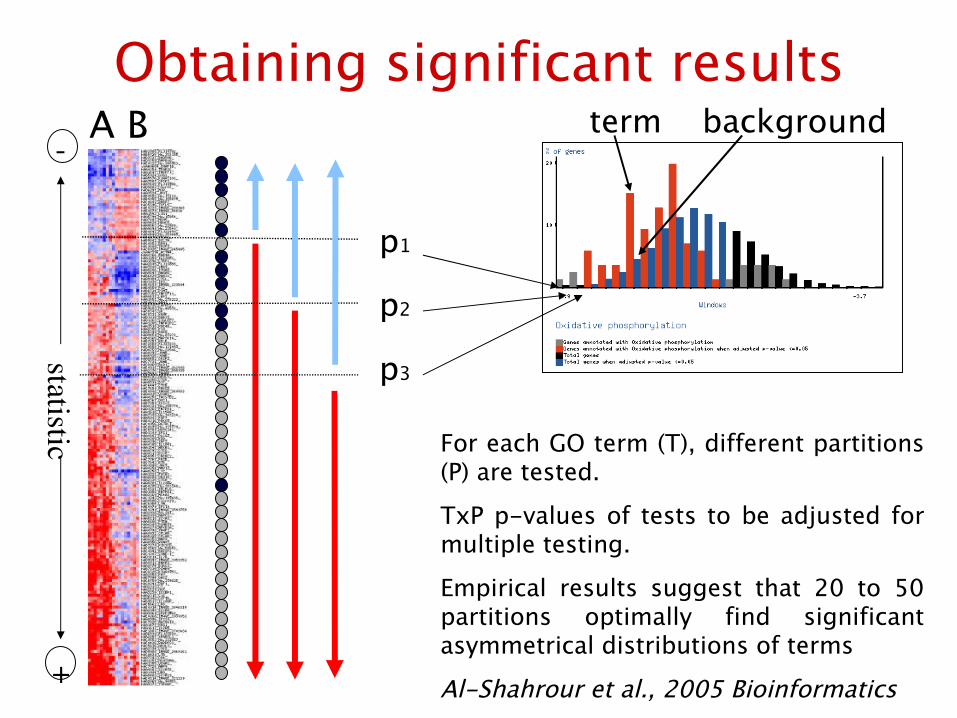
Obtaining significant results
statistic
+
A B
p1
p2
p3
For each GO term (T), different partitions (P) are tested.
TxP p-values of tests to be adjusted for multiple testing.
Empirical results suggest that 20 to 50 partitions optimally find significant asymmetrical distributions of terms
Al-Shahrour et al., 2005 Bioinformatics
term background

% Genes with the specific GO annotation for each partition
+
+
+U
U L
+
L

Case study: functional differences in a class comparison experiment
B17 with normal tolerance to glucose (NTG)
A8 with impaired tolerance (IGT) + 18 with type 2 diabetes mellitus (DM2)
A BNo one single gene shows significant differential expression upon the application of a t-test
Nevertheless, many pathways, and functional blocks are significantlyactivated/deactivated
Repository Healthy vs
diabetic Functional class GO KEGG Swissprot keyword
Oxidative phosphorylation X X
ATP synthesis X Ribosome X
Ubiquinone X Ribosomal protein X Ribonucleoprotein X
Mitochondrion X X Transit peptide X
Nucleotide biosynthesis X
NADH dehidrogenase (ubiquinone)
activity
X
Upregulated
Nuclease activity X Dow
regulated Insulin signalling
pathway X
(Mootha et al., 2003)

Beyond discrete variables: Survival data
Microarrays34 samples fromtumours of hypopharyngeal cancer (GEO GDS1070)
Cox ProportionalHazards model to study how theexpression of each gene across patients is related to their survival
Gen riskGen1 5.8
Gen2 5’6
Gen3 5.4
Gen4 5.2
Gen5 5.2
Gen6 5.0
…… ….
…… ….…… ….Gen1000 6.0Gen1001 6.3
Survival
+ Survival
Gene selection
Since FatiScan depends only on a list of ordered genes, and not on the original experimental values, it can be applied to different experimental designs

Functional analysis of a time series in P. falciparum
Genes at each time point are ranked from highest (red) to lowest (green) relative expression with respect to time 1.
For each list of ranked genes generated in any time point, the significant overrepresented GO terms in the tail corresponding to the highest expression values are recorded.
The partitions used to decide that a given term is significantly overrepresented in the upper tail of the list with respect to the lower part are used for the graphical representation.
...

Comparison of gene set methods at a glance
Terms from distinc repositories, reported by different methods in the diabetes dataset (Mootha et al., 2003)
GSEA 2003
FatiScan 2005
PAGE 2005
Tian 2005

Still one more problem… are functional modules defining
real coexpression classes?Not a naïve and trivial question.
Functional enrichment methods and gene set analysis methods rely on the assumption that the modules tested do coexpress
There are tens of thousands GO terms and hundreds of KEGG pathways

3034
Normalization A1 A2 A3 … A3034
Probeset1 g11 g12 g13…Probeset2 g21 g22 g23…Probeset3 g31 g32 g33…
… …. …. ….Probeset54675 ….
54675 probesets
A1 A2 A3 … A3034ENS1 g11 g12 g13…ENS2 g21 g22 g23…ENS3 g31 g32 g33…… …. …. ….ENS10866 ….
10866 transcripts
ENS1 0ENS2 d2,1 0ENS3 d3,1 d3,2 0
……………………..
ENS10866 …. …. …. ….
ENS1 ENS 2 ENS 3 …… ENS10866
10866 x 10866 correlation
matrix
Functional module A
ENS xENS y
ENS z
10000 random sampledmodules
Empirical distribution of medians
Median A
p-value
-1 0 1correlation

But are functional modules defining real co-expression entities?
Coherence index: (1-p-value)*100. CI > 95% means internal co-expression significantly
higher than random co-expression
57%32%
46%

Weighting gene module membership by co-expression
Unweighted test Weighted test
KEGG pathway statistic pvalueadjustedpvalue statistic pvalue
Adjustedpvalue
Caprolactam degradation 2.741 0.059 0.289 3.124 0.003 0.034Cell cycle 2.588 0 0 2.711 0 0Maturity onset diabetes of the young 2.517 0.075 0.289 2.734 0.008 0.034RNA polymerase 2.497 0.077 0.289 2.657 0.009 0.034One carbon pool by folate 2.497 0.077 0.289 2.766 0.007 0.034Urea cycle and metabolism of amino groups 2.497 0.077 0.289 2.674 0.009 0.034Heparan sulfate biosynthesis 2.478 0.078 0.289 2.818 0.006 0.034Alanine and aspartate metabolism 2.386 0.087 0.289 2.497 0.012 0.04Amyotrophic lateral sclerosis (ALS) 2.386 0.087 0.289 2.91 0.005 0.034betaAlanine metabolism 2.318 0.094 0.289 2.668 0.009 0.034Basal transcription factors 2.125 0.116 0.298 2.431 0.014 0.04Benzoate degradation via CoA ligation 2.072 0.123 0.298 2.468 0.013 0.04Limonene and pinene degradation 1.986 0.135 0.298 2.306 0.018 0.048
Very simple weight schema:W=2 if correlation is positiveW=0.5 if negativeW=1 if not in the class

Future directions
Pathways are not categorical variables
Testing hierarchies is better
Functions and pathways are correlated.
Testing models will increase our sensitivity
In general (systems) biology is behind. Our questions must be inspired directly by biology

Array CGH
A new way of studying copy number alterations with virtually a few bases resolution...
Jump over

ISA CGH (In silico array-CGH)
Estimating copy number, corelation copy number – expression and the minimum common amplified / lost region

Estimating copy number
deletion
amplification
Zoom of the region

Minimum region with consistent losses or gains

Correlation copy number to expression value

Array-CGH. DAS server
InSilicoArray-CGH http://isacgh.bioinfo.cipf.es
Detection of copy number alterations (two new methods)
Relationship expression / copy number alteration
Functional annotation of altered regions
DAS server

What to useWeb tools gain popularity
Web tool URL Citations1
GEPAS http://www.gepas.org 252ExpressionProfiler http://www.ebi.ac.uk/expressionprofiler 46
caGEDA http://bioinformatics.upmc.edu/GEDA.html 30
GenePublisher http://www.cbs.dtu.dk/services/GenePublisher 25ExpressYourself http://bioinfo.mbb.yale.edu/expressyourself 24RACE http://race.unil.ch/ 22ArrayPipe http://www.pathogenomics.ca/arraypipe 19VAMPIRE http://genome.ucsd.edu/microarray/ 17MIDAW http://muscle.cribi.unipd.it/midaw/ 13tprofiler http://www.tprofiler.org 12CARMAweb https://carmaweb.genome.tugraz.at 10
Microarray data analysis webtools with at least 10 citations1.
1) Scholar Google citations over all the references of the tool.
• Interactive• Heavy calculations at server side• Large databases at server side• Always the last version

GEPAS
Since october 2007, GEPAS 4.0

DNMAD
Hierarchical SOM
SOTAK-means
Expresso
Preprocessor
Affymetrix arrays
Two-colour arrays
Raw data
FatiGO+
FatiGO
Marmite TMT
FatiScan
GSEA
CAAT
KNN DLDA SVM
Random forestProphet
T-Rex
Two classes
Multi classes
Correlation
Survival
Gene Set
enrichment
Functional
enrichment
ISACGH
Babelomics
Differential expresionClass Prediction
Clustering
Functional Annotation
Normalization
Arrays-CGH
RIDGE analysis
Herrero et al., 2003, 2004; Vaquerizas et al., 2005 NAR; Montaner et al., 2006 NAR; AlShahrour et al., 2005, 2006, 2007 NAR; 2005 Bioinformatics, 2007
BMC Bioinformatics
GEPAS
BLAST2GO: Automatic functional annotation

Some numbersMore than 150,000 experiments analysed during the last year.
More than 500 experiments per day.
24h usage map as of June 8, 2006
297 papers cite GEPAS during the last three years 260 papers cite Babelomics/FatiGO (source ISI Web of Knowledge, December2007)

Web tools for functional profiling
Tool URL Analysis type References CitationsGSEA http://www.broad.mit.edu/gsea/ GSA (3,33) 1013DAVID http://www.DAVID.niaid.nih.gov FE (34) 504GOMiner http://discover.nci.nih.gov/gominer/ FE (35,36) 408Babelomics http://www.babelomics.org FE, GSA (1113,29) 402MAPPFinder http://www.GenMAPP.org FE (37) 379GOStats http://gostat.wehi.edu.au/ FE (27) 249Ontotools http://vortex.cs.wayne.edu/ontoexpress/ FE (38,4043) 223GOTM http://genereg.ornl.gov/gotm/ FE (44) 164FunSpec http://funspec.med.utoronto.ca webcite FE (45) 100GeneMerge http://www.oeb.harvard.edu/hartl/lab/publications/GeneMerge.html FE (46) 96FuncAssociate http://llama.med.harvard.edu/Software.html FE, GSA (39) 91GOToolBox http://gin.univmrs.fr/GOToolBox FE (28) 74GFINDer http://www.medinfopoli.polimi.it/GFINDer/ FE (47,48) 49WebGestalt http://bioinfo.vanderbilt.edu/webgestalt/ FE (49) 46GOAL http://microarrays.unife.it GSA (50) 25Pathway Explorer https://pathwayexplorer.genome.tugraz.at/ FE (51) 25PLAGE http://dulci.biostat.duke.edu/pathways/ GSA (52) 18tprofiler http://www.tprofiler.org/ GSA (53) 12WebBayGO http://blasto.iq.usp.br/~tkoide/BayGO/ FE (54) 10
Web tools with 10 or more Scholar Google citations

Other tools (non-commertial)
To cover more specific analysis requirements
Bioconductor: http://www.bioconductor.org
BRB tools: http://linus.nci.nih.gov/BRB-ArrayTools.html
TM4 (MeV): http://www.tm4.org/mev.html

The bioinformatics department at the Centro de Investigación Príncipe Felipe (Valencia, Spain)...
Joaquín DopazoEva AllozaLeonardo ArbizaFátima Al-ShahrourJordi BurguetEmidio CapriottiLucía CondeAna ConesaHernán DopazoToni GabaldonFrancisco GarcíaStefan GoetzJaime HuertaMarc MartíIgnacio MedinaPablo MinguezDavid MontanerJoaquín TárragaPeio Ziarsolo
...the INB, National Institute of Bioinformatics (Functional Genomics Node) and the CIBER-ER Nertwork of Centers for Rare Diseases