microbial chapter diversity and global environmental issues€¦ · diversity and global...
TRANSCRIPT

MICROBIALDIVERSIT Y ANDGLOBALENVIRONMENTALISSUES
C H A P T E R
11
Chapter contents
Microbial diversity and indexes ofenvironmental change
Global climate change
Stratospheric ozone depletion
Toxic chemical pollution
Conservation of global biodiversity
Conclusion
Questions for further investigation
Suggested readings
INTRODUCTION
There is a meta-cultural conventional wisdom that the intrinsic values of tangible endow-ments are never fully appreciated until their demise occurs. In view of the fact that nomicroorganism has ever been proven to become extinct, it follows that we may never trulyappreciate the significance of their individual contributions to the global ecosystem (Pimmand Raven, 2000). There is no shortage of answers to the question: Of what use are microor-ganisms? Many consumer products resulting from the multibillion dollar biotechnologyindustry demonstrate the contributions of specific microorganisms to the global economy.However, it is more challenging to find answers to the question: Of what use is microbialdiversity? The easy but shortsighted response is that the existing diversity of microorgan-isms provides a resource reservoir from which individual species with special traits can beselected to serve biotechnological purposes. This response is inadequate because it ignoresthe functional gestalt of microbial communities, where multiple and complex interactionsdefine the sustainability of critical ecological processes. Therefore, it is important to make adistinction here between microbiological resources and microbiological diversity, whichis the variability of genes, species, and community composition. A compendium of resource-driven interests in microbial diversity is now available (Bull, 2003). The emerging conun-drum regarding the appreciation of microbial diversity in the context of mainstreamdiscussions on environmental conservation is an extension of the difficulty faced by inves-tigators attempting to quantitatively value global biodiversity as an integrated communityof organisms. These attempts are sometimes rejected for being too subjective or too fre-quently plagued by uncertainties and wide margins of error (Milon and Shogren, 1995;OECD 2002).
A long stretch of the early history of environmental microbiology was necessarily dom-inated by observations of microbial forms and functions in pure cultures. The constructionof “microbial diversity” as a distinct concept emerged from classical microbial systematics,which was based on user-defined phenotypic differences along a continuum of anatomicaland physiological traits. The concept of microbial diversity also relied on inferences aboutpossible interactions among organisms isolated from similar ecosystems. These inferenceswere based on the characteristics of individual isolates under well-defined, unchanginggrowth conditions. It is now possible to observe microbial forms and functions withinvarious ecological communities with unprecedented clarity using new technical capabilities
OGU11 8/14/04 11:52 AM Page 225

226 PART II Principles and applications
engendered by progress in molecular biology. Comparative assessments of molecularsequence data have revolutionized the traditional concepts of microbial diversity, and thesecomparisons bring new opportunities for understanding and appreciating the concertedinfluence of microbial communities to the integrity of ecosystems. It is fairly straightforwardto glimpse the ecological influences of microorganisms through long-term habitat moni-toring programs at the local level, but a global ecosystem perspective is essential for build-ing robust information databases that link microbial diversity to the dynamic nature ofenvironmental parameters. This chapter focuses on strategies for making such linkages,beginning with the relationship between indexes of microbial diversity and the indicatorsrelated to changes in global environmental conditions. Thereafter, specific global environ-mental change events are considered as examples to demonstrate the potential for usingassessments of microbial diversity to detect environmental change and to use such knowl-edge in the best service of ecosystem restoration.
MICROBIAL DIVERSIT Y AND INDEXES OFENVIRONMENTAL CHANGE
The international Convention on Biological Diversity (CBD) defines biodiversity as “thevariability among living organisms from all sources including, inter alia, terrestrial, marine,and other aquatic ecosystems and the ecological complexes of which they are part” (UNEP,1992). For those concerned with quantitative assessments of biological diversity, the key issuein the CBD definition is how to measure variability. The development of robust indicatorsof biodiversity has been fraught with problems for several reasons pertaining to the differ-ent scales at which biodiversity is usually presented. For example, there are no universallyaccepted discrete boundaries between functional genes, between species, or between ecosys-tems. Therefore, it is not possible to quantify the absolute numbers of varieties within eachof these three categories across phylogenetic domains. Perlman and Adelson (1997) havealleged that the current definitions of biodiversity on the basis of genes, species, and ecosys-tems fail both in theory and practice because they do not recognize the conceptual difficul-ties inherent in these constituent terms; they ignore practical and technical problemsinvolved in making real-world inventories; they do not account for the lack of commensu-rability between different scales; and they make no distinctions in the worth of biodiversityunits within each scale of assessment.
Despite these shortcomings, attempts to develop quantitative indexes of biological diver-sity that are sensitive to environmental change have relied on three major concepts, namelyscale, component, and viewpoint (Van Kooten, 1998). The scale aspect focuses on the crite-ria of species richness and the geographical distributions of individuals among the species(evenness). Species richness within a local ecosystem is referred to as alpha diversity. Thevariation in alpha diversity among ecosystems within the same landscape is referred to asbeta diversity, and, when measurable, gamma diversity represents species richness at theregional and global scales (Fig. 11.1). Gamma diversity is sensitive primarily to phenomenathat impact the environment at the global level (e.g. major climate shifts) as opposed to local-scale impacts such as erosion, fires, the introduction of new invasive species, and exposureto toxic chemical pollutants, all of which influence alpha and beta diversities. Applicationsof the component concept in assessing biodiversity are aimed at empirically determiningthe minimum viable number of species necessary to maintain ecosystem functions. Finally,the viewpoint concept, perhaps the vaguest and most subjective of the three criteria, refersto the necessity of juxtaposing alternative viewpoints in assessing biodiversity, including butnot limited to utilitarian, practical, and aesthetic viewpoints (NRC, 1999; OECD, 2002).
Not all these criteria apply uniformly to the assessments of microbial diversity withoutmajor refinements. For example, in estimating microbial species richness, it is frequently notpossible to account for all species in an environmental sample. Therefore, carefully definedsubsets are designated as indicator or surrogate species, and these are monitored to repre-
OGU11 8/14/04 11:52 AM Page 226

Global environmental issues CHAPTER 11 227
sent overall diversity (Fjeldsa, 2000; Williams and Humphries, 1996). Species “weighting”can also be used as a shortcut to arrive at a quantitative estimate of changing diversity inmicrobial communities where only a fraction of existing species have been characterized.For example, the presence and relative population densities of organisms known to haveunique ecological functions (e.g. nitrogen fixation or biodegradation of a particular toxiccompound) are assigned larger weights than the presence of organisms whose ecologicalfunctions are either unknown or not immediately relevant for the purpose of the biodiver-sity assessment. Weighting is facilitated by the construction of phylogenetic trees describingthe relationships between microorganisms present in a particular habitat (see Chapter 5).Phylogenetic trees provide a visual representation of the level of redundancy that may existwithin groups and among distantly related species. Changes in environmental conditionsthat are likely to affect most members of phylogenetic groups can also be weighted morehighly than changes that affect a fraction of members belonging to phylogenetic groups withseveral representatives.
Quantitative measures of species diversity
No single quantitative index of biological diversity can capture the magnitude and directionof environmental change. However, there is no shortage of ecological techniques for moni-toring changes in the biological diversity of specific ecosystems, although most of the avail-able field methods were designed for macroscopic organisms with fairly well-known spatialdistributions and physiological characteristics (Purvis and Hector, 2000). There are severalreasons why the tools that have been developed for assessing biodiversity in plant and animalcommunities are not appropriate for measuring microbial diversity. Ecologists have tradi-tionally relied on integrating multiple biotic and abiotic indexes to explain past trends inenvironmental parameters and to account for trajectories of change. The simplest measuresof species diversity rely only on the number of species (s) and the total number of individ-
Community species diversity
Measurable characteristics:richness, evenness, composition, interaction
Ecosystem functions Ecosystem resilience
Alpha diversity (local ecosystems)
Beta diversity (ecosystems across landscapes)
Gamma diversity (regional and global ecosystems)
Fig. 11.1 Indexes of species diversity and ecosystem function are based on some quantitatively measurable characteristics such asspecies richness, evenness of distribution, and composition. Some measures are more difficult to quantify, such as interactions amongdifferent species. Indexes of species diversity and parameters of environmental change are linked through the roles performed byspecies in sustaining ecosystem functions and ecosystem resilience. These roles are integrated into measures of biodiversity at differ-ent geographical scales, namely alpha, beta, and gamma diversities, which are sensitive to perturbations at the habitat, ecosystem,and global scales, respectively.
OGU11 8/14/04 11:52 AM Page 227

228 PART II Principles and applications
uals representing all the species (N). For example, the Margalef index (Dm) computes thespecies diversity according to the following equation (Margalef, 1958 and 1963):
The Margalef index and similar indexes do not support the differentiation of com-munities that have identical s and N values because the evenness of the distribution ofindividuals within the communities is not considered. To correct this shortcoming, someinvestigators have introduced the concept of species dominance into measures of diversity.For example, Simpson (1949) demonstrated that if two individuals are selected randomlyfrom a community, the probability (Pd) that the two individuals belong to the same speciesis a measure of dominance (ds), and it is given by the following equation:
where ni is the abundance of individual members belonging to species i. Simpson’s measureof dominance has been modified to compute species diversity as follows:
Simpson’s diversity index has been referred to as the probability of an interspecific encounter,which expresses the number of times required to select two independent individuals at random from the community before both are found to belong to the same species (Hurlburt, 1971; Brower et al., 1998). Estimates of Ds are based on the assumption that the data on the number of species and abundance of individual members are derived fromrandomly collected environmental samples. However, in cases where it is possible to conduct an exhaustive sampling of a community (e.g. microcosm experiments), where direct molecular methods that can capture the complete spectrum of diversity are used (see Figs. 11.2 and 11.3), or where other non-random methods are applied, modifiedSimpson’s indexes of dominance (l) and diversity (Ds) are represented as follows:
These probability-based measures of species diversity have not found as much use asmeasures based on the concept of uncertainty as defined by information-theoretic indexes.In a community with relatively low species diversity, there is a relatively high level of cer-tainty that the identity of a species selected at random can be predicted. Conversely, in a relatively diverse community, the level of certainty in predicting the species identity of a ran-domly selected individual is low. The Shannon diversity index (H¢) is perhaps the best knownof diversity measures rooted in information theory (Perkins, 1982; Shannon, 1948):
where pi is the fraction of the total number of individuals in the community that belong tospecies i. The equation can be rewritten to facilitate the calculation of H¢ without the needto convert abundances (ni) to proportions (pi) as follows:
Skujins and Klubek (1982) used Shannon’s index to investigate the correlations betweenthe diversity of microbial populations, the nitrification potential, changes in organic carboncontent, and nitrogen content pools of soils along a montane sere consisting ofmeadow–aspen–fir–spruce (a sere is the sequence of communities that develops through theprocess of ecological succession). These investigators demonstrated that when organic
¢ = - ( )( ) ∏ÂH N N n n Ni ilog log
¢ = -ÂH p pi ilog
Ds = ∏ = ∏ Â1 2 2l N ni
D P N N n ns d i i= ∏ = -( ) ∏ -( )Â1 1 1
d P n n N Ns d i i= - = - -( ) ∏ -( )Â1 1 1 1
D s Nm = -( ) ∏1 log
OGU11 8/14/04 11:52 AM Page 228

Global environmental issues CHAPTER 11 229
Fluorescence in situ hybridization (FISH)
Sample
Fixation
Fixed cells,permeabilized
Hibridization
Fluorescently labeledoligonucleotides (probes)
Ribosomes
Target (rRNA)
Hybridized cells
Epifluorescence microscopy
Fluorescent dyeProbe
Washing
Detection
(a)
(b)
(c)
Fig. 11.2 Direct molecular methods aimed at collecting data appropriate for computing indexes of microbial diversity include fluorescence in situ hybridization (FISH). (a) Diagrammatic scheme for conducting FISH with oligonucleotide rRNA gene probes. Thistechnique is particularly suitable for directly assessing microbial diversity in environmental samples where many of the organisms areknown and their molecular signatures have been identified. (b) and (c) In situ identification of bacteria in a water sample fromPiburger See in Germany by a combination of hybridization with CY3-labeled, rRNA-targeted oligonucleotide probes and DAPI staining. (b) Hybridization with probe EUB338 specific for Bacteria. (c) Hybridization with probe BET42a specific for beta-subclassProteobacteria. Identical microscopic fields are shown by epifluorescence microscopy using filter sets specific for DAPI (left) and CY3 (right). By courtesy of Dr. Frank Oliver Glöckner, MPI for Marine Microbiology, Bremen, Germany.
OGU11 8/14/04 11:52 AM Page 229

230 PART II Principles and applications
Increasingdenaturinggradient
Melting temperature(Tm)
GC clamp
(a)
M 1 2 3
(b)
Fig. 11.3 Polymerase chain reaction and denaturing gradient gel electrophoresis (PCR-DGGE) based on unique 16S rDNA sequencesare particularly suitable for assessing overall diversity in microbial communities where many of the organisms have not been cul-tured. (a) depicts the scheme for DGGE. Lane M represents a molecular size marker, and each band in lanes 1, 2, and 3 represents microbial phylotypes after separation of 16S rDNA PCR products. (b) shows an electrophoresis gel result of DGGE used to resolve the variety and differences of bacterial communities in groundwater well samples originating from two different hot oil reservoirs (A and B). The replications demonstrate considerable within-site variability, which has to be considered when determining how muchband differences contribute to differences in between-site microbial diversity. Strategies to quantify diversity assessments based onDGGE are not yet fully developed, but the technique is invaluable for comparative assessments. By courtesy of Odd Gunnar Brakstad,Norway.
carbon increased along the sere from 2.15 to 26.8%, and total nitrogen increased from 0.13to 0.98%, the index of microbial diversity according to Shannon’s formula (H¢) increasedfrom 0.87 to 1.28. Furthermore, there was a statistically significant correlation between H¢and organic carbon and total nitrogen (r2 = 0.99 and 0.98, respectively). The conclusion that may be reached from this assessment is limited because it includes both species rich-ness and evenness in the same index of diversity (see Pielou 1966a and b). It is possible toexpress evenness as a separate measure by determining the closeness between observedspecies abundances and the abundance associated with a hypothetical situation withmaximum possible species diversity. For example, the maximum possible species diversity(Hmax) is observed only when the set of N individuals is distributed evenly among s numberof species, or
The maximum possible Shannon’s diversity index can thus be expressed as:
where c is the integer value of N ∏ s, and r is the remainder. The index of evenness (E¢) orrelative diversity is expressed by the ratio of observed diversity (H¢) and maximum diversity(Hmax):
See Box 11.1 for hypothetical examples of how these measures may be applied to studies inthe assessment of microbial diversity.
¢ = ¢ ∏E H Hmax
H N s r c r c Nmax = - -( ) - +( )( ) ∏log ! log ! log !1
n N si = ∏
OGU11 8/14/04 11:52 AM Page 230

Global environmental issues CHAPTER 11 231
In a bid to develop a conceptual model for evaluating ecological indicators, the USNational Research Council (NRC) identified ecosystem productivity, the capacity to capturesolar energy and store it as carbon-based molecules, as the foundation upon which specificcategories of ecological indexes should be erected. Since ecosystem productivity is influencedby biodiversity, temperature, moisture, and soil fertility, indexes developed to monitorchanges in each of these categories must be clearly related to changes in other categories,
BOX 11.1
The logical conclusion is that the three species are very nearly evenly distributed in thewater sample. Note: For very large values of N, the common hand-held calculator maynot have sufficient computing capacity. In such cases, the following approximation maybe used for computing log N!:
There is, however, considerable theoretical analyses suggesting that the highly dynamicand random growth pattern of most prokaryotes leads to uneven distribution of speciesin microbial communities. For example, Curtis and colleagues (2001) have used adifferent statistical approach based on log-normal species abundance curves (SAC)to estimate the diversity of prokaryotes on a small scale (70 per ml in sewage; 160per ml in oceans, and 6400–38,000 per gm in soils). On a larger scale, they estimatethat the entire prokaryote diversity in oceans is unlikely to exceed two million,whereas a metric ton of soil could contain four million different taxonomic groups. Theassumption of a log-normal distribution of species in prokaryotic communities meansthat very few species dominate communities in terms of large numbers of individuals,and a small number of species have relatively few individual members, whereas, mostspecies have an intermediate number of individuals. The SAC approach is based on twomeasurable variables: (i) the total number of individuals in a prokaryotic community(NT); and (ii) the abundance of the most abundant members of that community (Nmax).It is assumed that the least abundant taxonomic group has an abundance of 1 (Nmin).The relationship between these variables is defined by the following equation:
Where the area under the curve S(N) is the number of taxa that contain N individualsin a log-normal community. The function NS(N) is defined as the “individuals curve”.In a commentary on the SAC approach, Ward (2001) noted that efforts to quantify thenumber of species in a prokaryotic community presupposes consensus on the definitionof “species” among prokaryotes (see Chapter 1 for a discussion on challengessurrounding species concepts). Partly because of this challenge, Curtis and colleagues(2001) concluded that experimental approaches to solve the conundrum of estimatingprokaryote diversity will be fruitless. However, innovative research approaches thatdefine prokaryotic diversity in terms of metabolic capacity are yielding interestingresults (for example, see Tyson et al., 2004 and Venter et al., 2004). Furthermore, inthe case of viruses where genomic fingerprints are potentially reliable indicators ofdiversity, the combination of experimental and statistical approaches is providing long-awaited information on marine viral communities (Breitbart et al., 2002).
N NS N NTN
N
min
max= ( )Ú d
log ! . log .N n n . ni i i= +( ) - +0 5 0 4343 0 3991
Hypothetical example demonstrating the derivation of the diversity index forunicellular microbial populations.
Imagine that there are 3.5 ¥ 102 microbial cells (N), determined by directmicroscopic counting, in a 1 ml of sample obtained from an oligotrophic lake. Imaginefurther that molecular staining through fluorescent in situ hybridization targetedagainst organisms in this sample revealed the presence of three species (s). See Figs.11.2 and 11.3 for technique and visual representations of microscopic and molecularmethods for assessing microbial diversity. If the three species are present in thefollowing numbers:
Species 1 (S1) = 120 cells (34.28%)Species 2 (S2) = 80 cells (22.86%)Species 3 (S3) = 150 cells (42.86%)
Then, Shannon’s diversity index (H¢) is computed according to the following equation:
To compute the maximum possible diversity, Hmax, we use the following equation:
And we need to calculate c and r:
Therefore, c = 116, and r = 2
The index of evenness (E¢) is a measure of how close the observed H¢ is to themaximum possible Hmax:
¢ = ¢ ∏= ∏=
E H Hmax
0 464 0 469
0 989
. .
.
Hmax = - -( ) - +( )( ) ∏= -( )( )-( )( )( ) ∏= ∏ =
log ! log ! log !
. . .
. .
350 3 2 116 2 116 1 350
740 02 1 190 531 2 192 599 350
164 363 350 0 469
N s∏ = ∏ =350 3 116 67.
H N s r c r c Nmax = - -( ) - +( )( ) ∏log ! log ! log !1
¢ = -¢ = - + +( )= - -( )+ -( )+ -( )( )= - - - -( )=
H p p
Hi iS log
. log . . log . . log .
. . . . . .
. . .
.
0 343 0 343 0 229 0 229 0 429 0 429
0 343 0 465 0 220 0 640 0 429 0 368
0 159 0 147 0 158
0 464
OGU11 8/14/04 11:52 AM Page 231
232 PART II Principles and applications
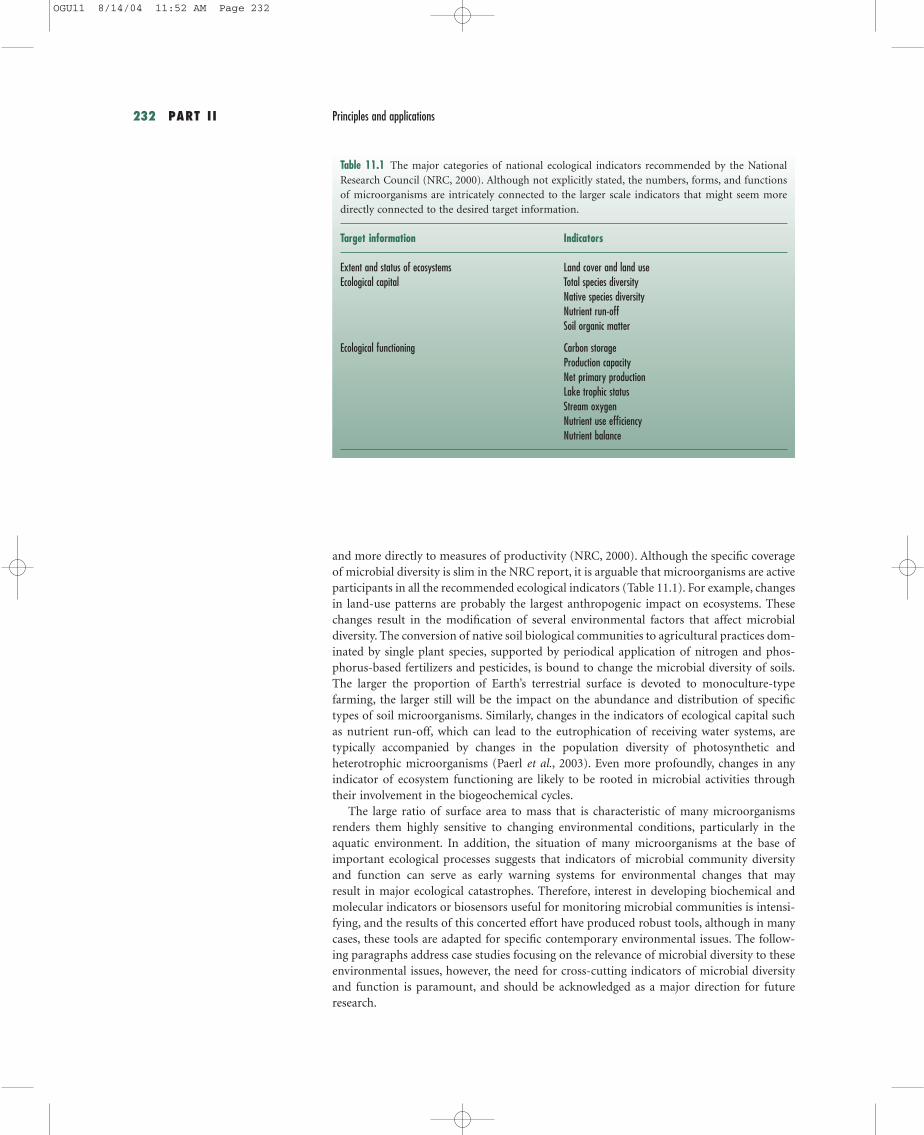
and more directly to measures of productivity (NRC, 2000). Although the specific coverageof microbial diversity is slim in the NRC report, it is arguable that microorganisms are activeparticipants in all the recommended ecological indicators (Table 11.1). For example, changesin land-use patterns are probably the largest anthropogenic impact on ecosystems. Thesechanges result in the modification of several environmental factors that affect microbialdiversity. The conversion of native soil biological communities to agricultural practices dom-inated by single plant species, supported by periodical application of nitrogen and phos-phorus-based fertilizers and pesticides, is bound to change the microbial diversity of soils.The larger the proportion of Earth’s terrestrial surface is devoted to monoculture-typefarming, the larger still will be the impact on the abundance and distribution of specifictypes of soil microorganisms. Similarly, changes in the indicators of ecological capital suchas nutrient run-off, which can lead to the eutrophication of receiving water systems, are typically accompanied by changes in the population diversity of photosynthetic and heterotrophic microorganisms (Paerl et al., 2003). Even more profoundly, changes in anyindicator of ecosystem functioning are likely to be rooted in microbial activities throughtheir involvement in the biogeochemical cycles.
The large ratio of surface area to mass that is characteristic of many microorganismsrenders them highly sensitive to changing environmental conditions, particularly in theaquatic environment. In addition, the situation of many microorganisms at the base ofimportant ecological processes suggests that indicators of microbial community diversityand function can serve as early warning systems for environmental changes that may result in major ecological catastrophes. Therefore, interest in developing biochemical andmolecular indicators or biosensors useful for monitoring microbial communities is intensi-fying, and the results of this concerted effort have produced robust tools, although in manycases, these tools are adapted for specific contemporary environmental issues. The follow-ing paragraphs address case studies focusing on the relevance of microbial diversity to theseenvironmental issues, however, the need for cross-cutting indicators of microbial diversityand function is paramount, and should be acknowledged as a major direction for futureresearch.
Table 11.1 The major categories of national ecological indicators recommended by the NationalResearch Council (NRC, 2000). Although not explicitly stated, the numbers, forms, and functionsof microorganisms are intricately connected to the larger scale indicators that might seem moredirectly connected to the desired target information.
Target information Indicators
Extent and status of ecosystems Land cover and land useEcological capital Total species diversity
Native species diversityNutrient run-offSoil organic matter
Ecological functioning Carbon storageProduction capacityNet primary productionLake trophic statusStream oxygenNutrient use efficiencyNutrient balance
OGU11 8/14/04 11:52 AM Page 232

Global environmental issues CHAPTER 11 233
GLOBAL CLIMATE CHANGE
Discussions focused on the relevance of microbial diversity to major shifts in the globalclimate should be preceded by a declaration that in the history of the Earth, microorgan-isms have indeed survived several major climate changes; and that the current projected sce-narios of climate change are not likely to precipitate novel irreversible configurations of themicrobial world. This declaration is predicated not only on the natural historical record ofmicroorganisms, but also on the recognition of their prolific and extremely effective adap-tive strategies. Concern for the unpredictability of the direction of microbial adaptation tomajor environmental changes, and the necessity for predicting the trajectory of change inorder to mitigate adverse impacts on human settlements and other organisms, are drivingthe efforts to seek indicators of pace and impacts of climate change at all levels of ecologi-cal organization. Therefore, it is important that microbial indicators of large-scale ecologi-cal change are consistent with indicators based on large multicellular organisms and onabiotic environmental factors including global mean temperature, sea surface temperatures,and atmospheric carbon dioxide concentrations (Butterworth et al., 2001). For example, theelevated atmospheric concentration of carbon dioxide is likely to result in changes in plantgrowth characteristics, affecting root systems, exudates, and litter production. Changes invegetation cover will in turn affect the growth and distribution of free-living fungi, mych-orrhizal relationships, soil bacterial diversity, and the occurrence of plant diseases. Thesesimple interactions may then cascade to modify the activities of fungivores, bacterivores, andomnivores. All these changes are likely to be accompanied by dramatic fluctuations in localnitrogen cycling, and in the efficiency of other biogeochemical cycles (Carter, 1986; Wall et al., 2001).
In aquatic ecosystems, certain microbial indicators have proven to be very useful inunderstanding the ecological impacts of climate-linked events such as the increasing frequency of hurricanes. For example, Paerl and colleagues (2003) have demonstrated forestuaries in North Carolina that Hurricane Floyd-induced hydrological changes in river discharge and flushing rates are correlated with changes in phytoplankton taxonomic groupsas a function of contrasting growth characteristics and photosynthetic pigment signatures.Elevated freshwater flows were linked to an increase in the contributions of organisms withrelatively high nutrient uptake rates such as diatoms, cryptophytes, and chlorophytes to thechlorophyll-a pool of the water system. Furthermore, Cyanobacteria predominated underconditions of minimal flushing and longer residence times for freshwater in the estuary.
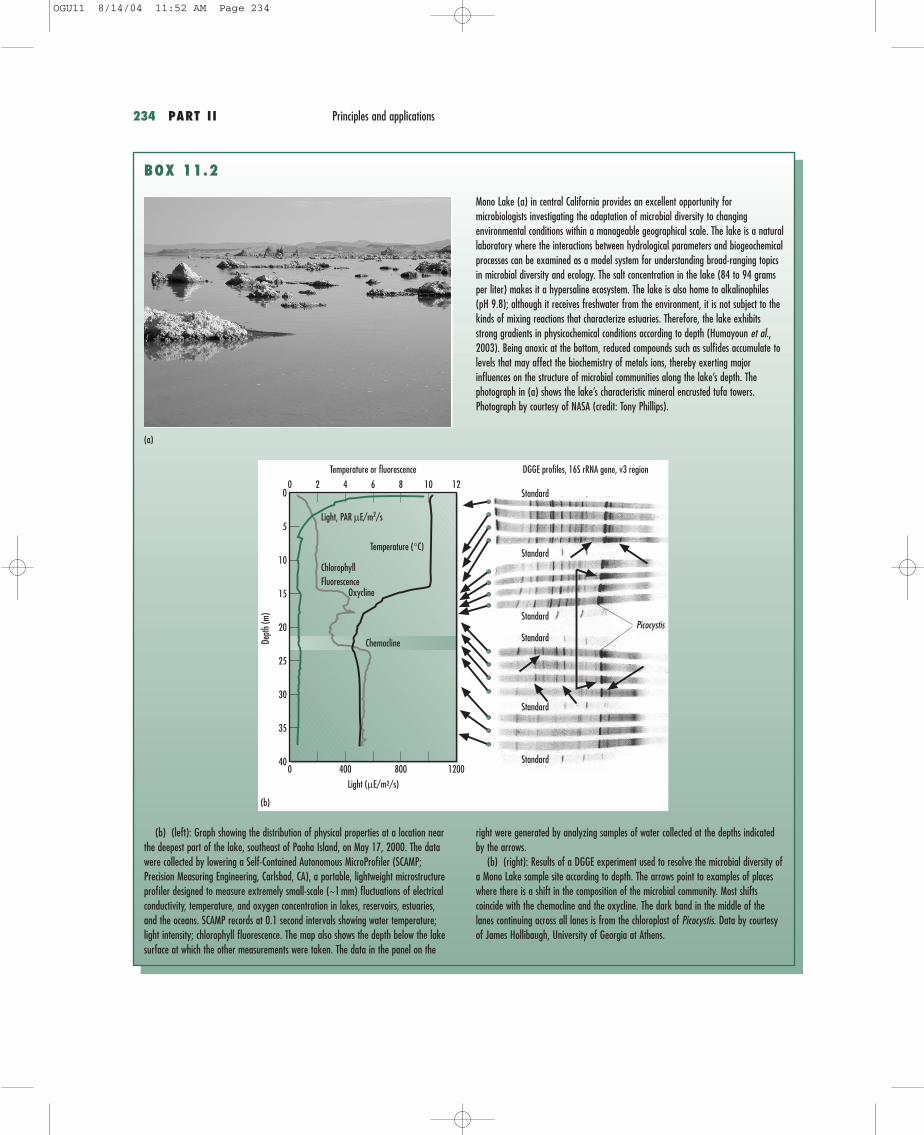
The episodic nature of extreme events such as hurricanes and other climate change-linkedimpacts makes it difficult to generate consistent reproducible data on microbial indicators.With increasing frequency of these events, it should be possible to test various hypothesesthat have been proposed to explain the changes in local microbial diversity in response toglobal scale events. However, the investigation of relatively more stable aquatic ecosystemsmay provide a natural microcosm where some of these hypotheses can be explored on asmaller scale. For example, a glimpse of how microbial diversity responds to environmentalparameters in aquatic ecosystems is given by James Hollibaugh and colleagues at the Uni-versity of Georgia through their Microbial Observatory project on Mono Lake, a meromic-tic soda lake in California (Box 11.2). The study involved simultaneous time series andcross-sectional assessment of abiotic parameters including changes in temperature and incident light by depth, correlated with biotic factors such as molecular-level diversity,dominant species, and chlorophyll concentration. Shifts in the microbial diversity index,measured by PCR-DGGE, coincided with marked gradients from the surface level in the diffusion of oxygen (oxycline), dissolved salt (chemocline), and temperature inversion(thermocline) (see Fig. 11.3 for general DGGE protocol). Of particular note is the distribu-tion of Picocystis, a recently discovered unicellular chlorophytic alga, with respect to geo-chemical gradients. The increase in chlorophyll fluorescence at the depth of 15–20 m, wherelight intensity and oxygen concentration are relatively low, was attributed to Picocystis cellsthat have colonized this unique ecological zone.
OGU11 8/14/04 11:52 AM Page 233
234 PART II Principles and applications
BOX 11.2
Mono Lake (a) in central California provides an excellent opportunity formicrobiologists investigating the adaptation of microbial diversity to changingenvironmental conditions within a manageable geographical scale. The lake is a naturallaboratory where the interactions between hydrological parameters and biogeochemicalprocesses can be examined as a model system for understanding broad-ranging topicsin microbial diversity and ecology. The salt concentration in the lake (84 to 94 gramsper liter) makes it a hypersaline ecosystem. The lake is also home to alkalinophiles(pH 9.8); although it receives freshwater from the environment, it is not subject to thekinds of mixing reactions that characterize estuaries. Therefore, the lake exhibitsstrong gradients in physicochemical conditions according to depth (Humayoun et al.,2003). Being anoxic at the bottom, reduced compounds such as sulfides accumulate tolevels that may affect the biochemistry of metals ions, thereby exerting majorinfluences on the structure of microbial communities along the lake’s depth. Thephotograph in (a) shows the lake’s characteristic mineral encrusted tufa towers.Photograph by courtesy of NASA (credit: Tony Phillips).
40
15
5
25
0
Dept
h (m
)
0
20
35
30
10
Light (mE/m2/s)
400 800 1200
0 4 8 122 6 10
Temperature or fluorescence
Chemocline
OxyclineFluorescenceChlorophyll
Temperature (°C)
Light, PAR µE/m2/s
DGGE profiles, 16S rRNA gene, v3 region
Standard
Standard
Standard
Standard
Standard
Standard
(b)
Picocystis
(a)
(b) (left): Graph showing the distribution of physical properties at a location nearthe deepest part of the lake, southeast of Paoha Island, on May 17, 2000. The datawere collected by lowering a Self-Contained Autonomous MicroProfiler (SCAMP;Precision Measuring Engineering, Carlsbad, CA), a portable, lightweight microstructureprofiler designed to measure extremely small-scale (~1 mm) fluctuations of electricalconductivity, temperature, and oxygen concentration in lakes, reservoirs, estuaries, and the oceans. SCAMP records at 0.1 second intervals showing water temperature;light intensity; chlorophyll fluorescence. The map also shows the depth below the lakesurface at which the other measurements were taken. The data in the panel on the
right were generated by analyzing samples of water collected at the depths indicatedby the arrows.
(b) (right): Results of a DGGE experiment used to resolve the microbial diversity ofa Mono Lake sample site according to depth. The arrows point to examples of placeswhere there is a shift in the composition of the microbial community. Most shiftscoincide with the chemocline and the oxycline. The dark band in the middle of thelanes continuing across all lanes is from the chloroplast of Picocystis. Data by courtesyof James Hollibaugh, University of Georgia at Athens.
OGU11 8/14/04 11:52 AM Page 234

Global environmental issues CHAPTER 11 235
Picocystis species, strain ML, accounts for approximately 25% of the primary productionduring the winter bloom, and its contribution exceeds 50% during other seasons (Roesleret al., 2002). Therefore, environmental factors, which are not conducive to the growth ofthis organism will be reflected in the observation of a decline in primary production, andin all other biogeochemical processes depending on primary productivity. As such, Picocys-tis is a good indicator organism for ecosystem function in this seemingly low-diversity envi-ronment. However, the robustness of biological indicators is subject to strong bioticinfluences, and indeed Humayoun and colleagues (2003) demonstrated a complex bacterialdiversity in the proximity of the habitat colonized by Picocystis. By employing protocolsbased on direct DNA analysis to reveal the presence of phylogenetic groups, these investi-gators showed that samples collected from the oxycline zone had low bacterial diversity withonly nine phylotypes, whereas the chemocline contained 27 phylotypes. These bacteriabelong to the five major lineages of the domain Bacteria, namely alpha- and gamma-Proteobacteria; Cytophaga-Flexibacter- Bacteroides; Actinobacteria; Bacillus; and Clostridium.It is not yet clear from these findings what is the nature of the interactions that occur betweenthe dominant primary producer, Picocystis, and the diverse heterotrophic bacteria with which it co-exists. There are strong prospects that additional broad-spectrum indicators ofextreme environmental change will be recovered from ecosystems typified by Mono Lake.
STRATOSPHERIC OZONE DEPLETION
As in the case of humans, microbial activities contribute ozone-depleting chemicals to theatmosphere, and they are also sensitive to the impacts of stratospheric ozone depletionthrough increased exposure to ultraviolet radiation. A sophisticated real-time informationdatabase is available for monitoring the size of the ozone layer in the stratosphere, and thereis a well-developed index of specific health risks to human populations in many part of theworld (Fig. 11.4) (de Gruijl et al., 1994; Setlow et al., 1993). In contrast, indexes of ecologi-cal impacts of increased UV exposure are either non-existent or poorly developed. This lackof information is due in part to the very wide range of exposure and responses exhibited bywildlife organisms and ecosystem processes to increased UV exposures (Blumthaler andAmbach, 1990; Fleischmann, 1989). In addition, ecological effects of UV exposure are likelyto cascade hierarchically, rather than to remain with affected individuals or processes(Herndl et al., 1993; Lyons et al., 1998). Therefore, attempts to produce generalized responsemodels that could serve as the foundation for the development of reliable indicators arefraught with uncertainties.
Biological responses to UV radiation can occur at the level of DNA damage or systemi-cally through a reduction in the growth rate of organisms. Theoretically, biological responseis modeled after the action spectrum of UV radiation, the weighting parameter thatdescribes the variation in energy at different wavelengths. The relationship between theaction spectrum and biological response produces an index referred to as the biologicallyeffective dose (BED), which is described by the following equation:
Where UV and A represent the ultraviolet irradiance and action spectrum values at agiven wavelength (l), respectively. The total UV dose is then computed by integrating overthe entire wavelength range. Figure 11.5 shows four examples of action spectra.
The first repercussion of UV exposure on microbial populations is damage to DNAthrough the production of pyrimidine dimers and cyclobutane. These compounds arecapable of generating mutations that vary in their lethality. In view of the fact that UV-protective compounds are not common in the microbial community, and their relativelysmall size may preclude the development of protective pigmentation, microorganisms arefrequently considered as highly sensitive to the impact of increasing UV radiation (Aas
BED d= ( ) ( )Ú UV Al
l l l
OGU11 8/14/04 11:52 AM Page 235

236 PART II Principles and applications
0
20
40
60
80
100
–100 –80 –60 –40 –20 0 20 40
1000
100
10
1
0.1
0.010.001
Pres
sure
(hPa
)
Heigh
t (km
)
Temperature (°C)
Mesopause
Mesosphere
Stratopause
StratosphereOzone maximumTropopause
Troposphere
(a)
(b)
(c) (d)
Fig. 11.4 (a) The size of the stratospheric ozone layer is continuously monitored by the Total Ozone Mapping Spectrometer (TOMS) satellite operated by NASA. The global maps are updateddaily. Ozone concentrations are measured in Dobson units. (b) shows a substantial depletion of the ozone layer in the Antarctic region. The size of the ozone layer is inversely proportionalto the incident UV dose on the Earth’s surface, although the relationship is complex because it is influenced by several other environmental factors. Incident UV irradiance is used to computethe biologically effective dose for human risk factors. (c) and (d) show the computed erythemal UV dose for the Americas and globally. For a complete discussion of these ecological indica-tors, see the website for TOMS at http://jwocky.gsfc.nasa.gov/. Data used in (a) are from the British Met Office: http://www.met-office.gov.uk/research/stratosphere/. Maps on Ozone andUV dose are by courtesy of NASA/Goddard Space Flight Center Scientific Visualization Studio.
280
Relat
ive re
spon
se
300 320 340 360 380 40010–6
10–4
10–2
100
ErythemalNon-melanomaFish melanomaDNA damage
Wavelength (nm)
Fig. 11.5 Graph showing four action spectra for UV-related biological responses, namely microbiologically relevant DNA damageaction spectrum (Setlow, 1974), the erythemal action spectrum (McKinlay and Diffey, 1987), the mammalian non-melanoma skincancer action spectrum (de Gruijl and van der Leun, 1994), and the action spectrum for melanoma induction in a species of fish(Setlow et al., 1993). The spectra for DNA damage, mammalian non-melanoma, and erythema decline rapidly with increasing wave-length, suggesting that the UV-B portion (280–320 nm) of the spectrum is more effective at eliciting a response than UV-A (360–400 nm). Theoretically, these biological responses are more sensitive to ozone depletion, which increases irradiance levels in the UV-B region. In contrast, the fish melanoma action spectrum shows a significant dependence on UV-A, suggesting that ozone deple-tion would have a relatively low effect on melanoma induction in certain kinds of fish. Direct comparisons of UV dose required foran induced effect should not be made on the basis of action spectra alone. The spectra only indicate the relative effectiveness of par-ticular wavelengths, not the actual dose required to produce a biological response. Data from the Center for International Earth ScienceInformation Network (http://sedac.ciesin.columbia.edu/ozone/docs/AS.html).
OGU11 8/14/04 11:52 AM Page 236
Global environmental issues CHAPTER 11 237
et al., 1996; Garcia-Pichel, 1994; Winter et al., 2001). It is difficult to generalize from this reasoning because exposure to UV radiation (360–400 nm) in certain microbial populationscan have beneficial effects on photo-enzymatic mechanisms which are required for repair-ing damage to DNA (Kaiser and Herndl, 1999). In addition, exposure of complex organiccompounds to UV radiation increases their breakdown, thereby increasing the pool of nutri-ents that are biologically available to support microbial growth (Wetzel et al., 1995; Tam etal., 2003). Most microorganisms are expected to respond to UV exposure, but there is a widevariation in responses (Arrieta et al., 2000; Jeffrey et al., 1996; Joux et al., 1999).
Attempts to quantify the net impact of UV radiation on natural microbial communitieshave focused on developing models for estimating the effect of ozone depletion on primaryecosystem production. With respect to evaluating the impact of UV irradiance on produc-tion in microbial communities, several investigators have used DGGE analysis of 16S rRNAand 16S rDNA sequences to monitor changes in microbial diversity across geographicalzones that vary in incident UV. For example, Winter and colleagues (2001) demonstrated,through field measurements and laboratory experiments, minimal changes in the bacterio-plankton community structure in different geographical locations identified by different UVradiation regimes. Approximately less than or equal to 10% of the operational taxonomicunits recovered from the North Sea were determined to show adverse sensitivity to UV radi-ation. The conclusion that the composition of microbial communities is not strictly sensi-tive to excess UV radiation might suggest the futility of basing indexes of ozone depletionand UV exposure on microbial diversity. However, it is worth noting that most of the studiesin this direction have focused on average responses, while recognizing the tremendous diver-sity of both adverse and potentially beneficial responses to UV among microorganisms. Insuch cases, a more effective approach would be to select specific sentinel species to indicatethe direction of changes in microbial population dynamics and primary production. Muchmore research is needed before such sentinel approaches can be sufficiently developed forintegration into ecosystem indicator models that include, for example, prophage inductionand mutation assays.
TOXIC CHEMICAL POLLUTION
The distribution of toxic chemicals from industrial and domestic origins into aquatic and terrestrial ecosystems is now clearly recognized as a global phenomenon in terms oftheir sources, sinks, and ecological impacts. To address this problem, the international community has attempted to restrict the manufacture, sale, and use of several chemicals. For example, the United Nations Environment Program (UNEP, 1992;see http://www.chem.unep.ch/pops/) coordinated an international initiative to ban persist-ent organic pollutants (POPs). Different categories of chemicals are included in the POPslist, namely, the pesticides hexachlorobenzene, toxaphene, chlordane, aldrin, DDT, mirex,Dieldrin, pentachlorophenol, Endrin; industrial byproducts of polyaromatic hydrocarboncompounds (PAHs), dioxins, and furans; and the industrial chemicals polychlorinatedbiphenyls (PCBs) and hexabromobiphenyl. These chemicals persist in the environment,bioaccumulate through the food web, and pose a risk of causing adverse effects to humanhealth and the ecosystem, including precipitating the emergence of new diseases (King,2000). In addition, evidence of long-range transport of these chemicals to regions where theyhave never been used or produced and the consequent threats they pose to the global ecosys-tem have commanded the urgent attention of the research community. In general, POPs aresparingly soluble in water, relatively highly soluble in fatty tissue, and volatile. These char-acteristics contribute to their long environmental half-lives, and to their ubiquitous distri-bution in nature. In addition to POPs, ecosystem contamination by heavy metals is widelyconsidered to be a global environmental problem. Unlike POPs, most heavy metals ofconcern are natural constituents of the Earth’s crust, but anthropogenic activities have dras-tically altered the geochemical cycles that regulate their distribution. Of particular impor-
OGU11 8/14/04 11:52 AM Page 237

238 PART II Principles and applications
tance for ecosystem health are lead, mercury, and chromium. These metals are never elimi-nated from ecosystems, but they are capable of forming organic and inorganic compoundsthat alter their compartmentalization into different ecological zones (Doelman et al., 1994).
There is a two-prong connection between microbial diversity and toxic chemicals in theenvironment. First, microorganisms are presumed to be particularly sensitive to the toxiceffects of pollutants, and as such, ecosystem functions that depend on microbial activitieswill likely suffer adverse impacts from repeated exposures (Domsch et al., 1983; Ogunseitanet al., 2000). Secondly, much research has been dedicated toward exploiting the physiologi-cal diversity that exists in the microbial community for the purpose of environmental remediation and ecosystem restoration after pollution incidents (Pritchard et al., 1995;Ogunseitan, 1994 and 2002). In both cases, qualitative and quantitative knowledge of micro-bial diversity in target ecosystems is essential for predicting impacts on ecosystem functions,or the direction and outcome of toxic chemical biotransformation (Kennedy and Papendick,1995; Tebbe et al., 1992).
Both biochemical and molecular genetic techniques have been used to explore theimpacts of chemical exposures on microbial diversity (Bakermans and Madsen, 2002). Forexample, Fig. 11.6 shows the results of DGGE used to analyze the variation in microbial communities transecting a petrochemical-contaminated aquifer environment. The results ofseveral such studies are consistent with the observation that toxic chemical exposures tendto narrow the spectrum of microbial diversity because organisms that are not capable ofresisting the toxic effects either die or enter a static metabolic phase, leaving those that have evolved resistance mechanisms to proliferate and become dominant members of theimpacted ecosystem (Ogunseitan, 1994 and 2000). Biotechnological approaches to environ-mental remediation have employed this kind of adaptation/selection process for identifyingmicroorganisms with enhanced capacity to detoxify pollutants.
CONSERVATION OF GLOBAL BIODIVERSIT Y
The World Health Organization (WHO) declared in 1980 that smallpox had been eradicatedfrom the Earth. This of course only meant that the human disease condition has been extin-guished from human societies, and the news was greeted with much jubilation around theworld. About 20 years later, on June 30, 1999, WHO announced plans to destroy the lastremaining stock of smallpox virus particles. At the time, the news was met with controversyfrom various sectors (Ogunseitan, 2002a). The debates were framed by two very differentschools of thought. At one end were those who believed that stockpiles of smallpox virusremain undeclared by rogue nations for the clandestine purpose of developing biologicalweapons. Therefore, as a precaution, the known stock of the virus should not be destroyedin case vaccines would need to be produced quickly in the event of biological warfare orother emergencies. At the other end were those individuals who opposed any deliberateactions that humans might take to cause the extinction of any other organism, includingviruses. The latter argument was embedded in a growing appreciation of biological diver-sity at all levels of organization. In addition to human health-related concerns about micro-bial diversity, the rapid expansion of the biotechnology industry, fueled in part through thediscovery of novel properties among microbial populations, provided the rationale for theintegration of microorganisms into the 1992 Convention on Biological Diversity (Kelly,1995).
The establishment of the global Microbial Resources Centers (MIRCEN) network by theUnited Nations Educational, Social, and Cultural Organization (UNESCO) is one of themajor results of renewed interests in microbial diversity. The objectives of MIRCEN includethe provision of a global infrastructure that incorporates national, regional, and inter-regional cooperating laboratories geared to the management, distribution, and utilization ofthe microbial gene pools; reinforcing the conservation of microorganisms, with emphasis
OGU11 8/14/04 11:52 AM Page 238

Global environmental issues CHAPTER 11 239
(a)
(b) (c)
Fig. 11.6 Exposure of microbial communities to potentially toxic environmental pollutants tends to reduce the spectrum of microbial diversity, as demonstrated in (a) with DGGE conductedon samples collected along a transect at various distances from the center of a petrochemical pollution plume (0 m, and “under”). A high level of variation in band position occurs outside theplume, and the band positions are relatively similar within the plume zones (boxes). (b) shows the results of phylogenetic identification of specific bands resolved from samples collected at-20, 0, and 6 m along the transect. The solid, hatched, and hollow arrows represent organisms that use nitrate, iron (III), and sulfate as terminal electron acceptors, respectively. All the iron(III) reducers belong to the family Geobacteriaceae, and these are the only organisms in these systems that were shown to degrade the petrochemicals benzene, toluene, ethylbenzene, andxylene. Members of the Geobacteriaceae within the plume are extremely diverse as shown by fine-scale DGGE results for 14 isolates in (c). The dendogram on the right side of the panelshows that the 14 isolates can be placed into only seven phylogenetic groups. Data credit to Wilfred Roling and Komang Ralebitso-Senior at Vrije Universiteit, Amsterdam.
OGU11 8/14/04 11:52 AM Page 239
240 PART II Principles and applications
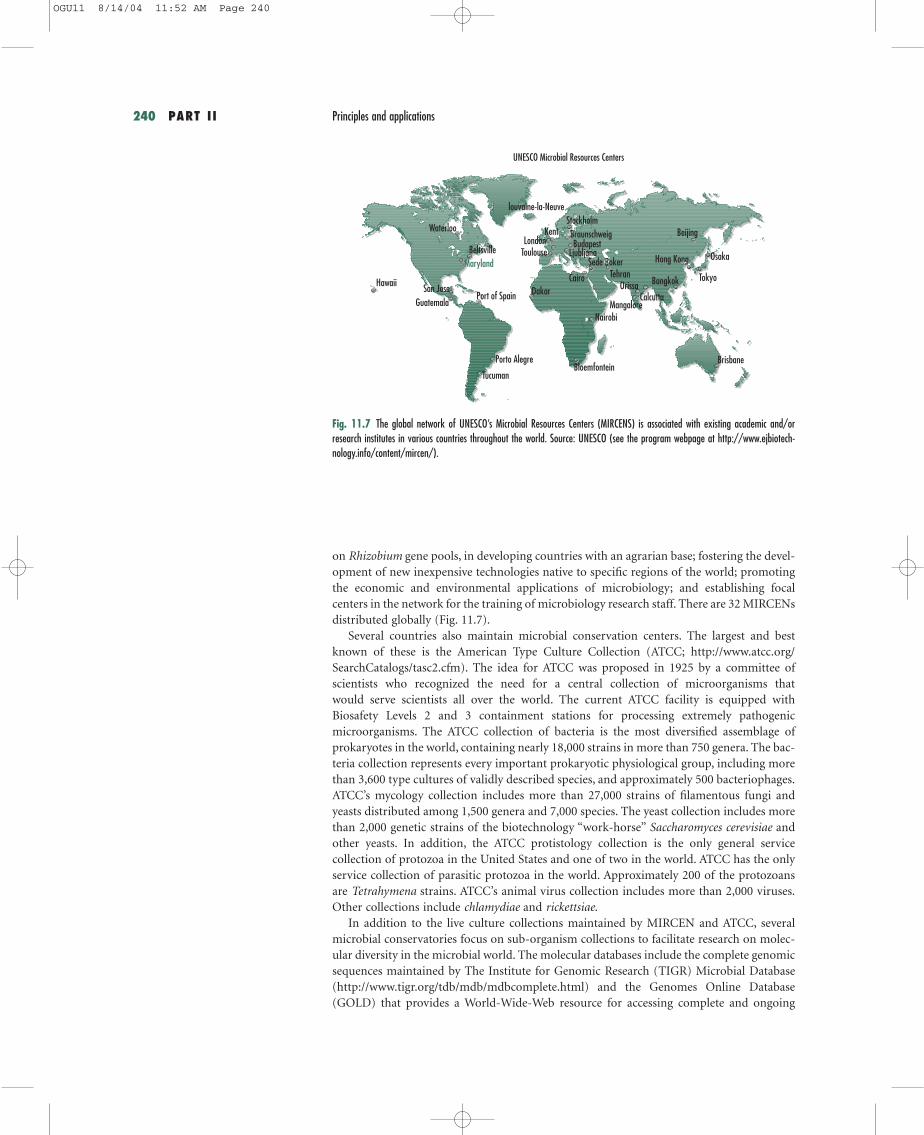
on Rhizobium gene pools, in developing countries with an agrarian base; fostering the devel-opment of new inexpensive technologies native to specific regions of the world; promotingthe economic and environmental applications of microbiology; and establishing focalcenters in the network for the training of microbiology research staff. There are 32 MIRCENsdistributed globally (Fig. 11.7).
Several countries also maintain microbial conservation centers. The largest and bestknown of these is the American Type Culture Collection (ATCC; http://www.atcc.org/SearchCatalogs/tasc2.cfm). The idea for ATCC was proposed in 1925 by a committee ofscientists who recognized the need for a central collection of microorganisms that would serve scientists all over the world. The current ATCC facility is equipped with Biosafety Levels 2 and 3 containment stations for processing extremely pathogenic microorganisms. The ATCC collection of bacteria is the most diversified assemblage ofprokaryotes in the world, containing nearly 18,000 strains in more than 750 genera. The bac-teria collection represents every important prokaryotic physiological group, including morethan 3,600 type cultures of validly described species, and approximately 500 bacteriophages.ATCC’s mycology collection includes more than 27,000 strains of filamentous fungi andyeasts distributed among 1,500 genera and 7,000 species. The yeast collection includes morethan 2,000 genetic strains of the biotechnology “work-horse” Saccharomyces cerevisiae andother yeasts. In addition, the ATCC protistology collection is the only general service collection of protozoa in the United States and one of two in the world. ATCC has the onlyservice collection of parasitic protozoa in the world. Approximately 200 of the protozoansare Tetrahymena strains. ATCC’s animal virus collection includes more than 2,000 viruses.Other collections include chlamydiae and rickettsiae.
In addition to the live culture collections maintained by MIRCEN and ATCC, severalmicrobial conservatories focus on sub-organism collections to facilitate research on molec-ular diversity in the microbial world. The molecular databases include the complete genomicsequences maintained by The Institute for Genomic Research (TIGR) Microbial Database(http://www.tigr.org/tdb/mdb/mdbcomplete.html) and the Genomes Online Database(GOLD) that provides a World-Wide-Web resource for accessing complete and ongoing
Hawaii
Waterloo
BeltsvilleMaryland
San JoseGuatemala
Port of Spain
Porto Alegre
TucumanBloemfontein
Nairobi
Dakar
KentLondon
Toulouse
louvaine-la-NeuveStockholmBraunschweig
Cairo
Sede BokerLjubljana
Budapest
Tehran
MangaloreCalcutta
Orissa Bangkok Tokyo
Hong Kong Osaka
Beijing
Brisbane
UNESCO Microbial Resources Centers
Fig. 11.7 The global network of UNESCO’s Microbial Resources Centers (MIRCENS) is associated with existing academic and/orresearch institutes in various countries throughout the world. Source: UNESCO (see the program webpage at http://www.ejbiotech-nology.info/content/mircen/).
OGU11 8/14/04 11:52 AM Page 240

Global environmental issues CHAPTER 11 241
genome projects around the world (Bernal et al., 2001) (http://wit.integratedgenomics.com/GOLD/). Finally, the database on ribosomal RNA and DNA sequences has beenextremely influential in providing molecular tools for assessing microbial diversity in different ecosystems all over the world (Maidak et al., 2001). The Ribosomal Database Project(RDP) is housed at the Center for Microbial Ecology at Michigan State University(http://www.cme.msu.edu/RDP).
The microbial conservatories have been instrumental in elevating support for microbialdiversity research to levels that approach those dedicated to botanical and zoological species.However, deeper insights into the nature of speciation and processes that generate molecu-lar and physiological diversity among microorganisms are needed to facilitate the establish-ment of more comprehensive, evidence-based global inventories of microbial diversity.
CONCLUSION
In the history of planet Earth, microorganisms have been responsible for the most profoundforms of global environmental change. The emergence of new phylogenetic lineages accom-panied by innovative physiological processes has continuously modified aquatic, terrestrial,and atmospheric systems in ways that reinvent niches and create opportunities for specia-tion. It is difficult to compare the global impacts of contemporary changes attributed tohuman industrial activities with the “natural” changes that are engendered by microbialactivities. Perhaps attempts to compare these impacts are misguided because human activities can be viewed as a protracted extension of microbial evolution. Instead, an all-encompassing model of the interactions between all life forms and the environment (co-evolution) may serve better to place recent changes in a broader context that facilitates deeperunderstanding of the relationship between causes, effects, and remedial strategies. Problemssuch as reduction of biodiversity, toxic chemical pollution, climate change, and the ozonehole have assumed a status of urgency in human affairs primarily because we “like” the seem-ingly hierarchical organization of the biosphere with humans at the top. Therefore, we wishto maintain the status quo and to restrict the pace of co-evolution when in fact, organismextinctions, displacements, and replacements have dominated the Earth’s history. In thiscontext, the appreciation of microbial diversity hinges on utilitarian values: the microbialworld is extremely rich in resources with which we can manipulate environmental condi-tions, and detect subtle changes in ecosystem integrity. So far, we have only tapped into the“tip of the iceberg” of microbial resources.
If there is a “silver lining” in the “cloudy” prospects of global environmental changeimpacts, it is that research on integrating various indexes of environmental change is inten-sifying. The need to incorporate microbial indicators into existing indexes is now unques-tionable. The reliability of microbial indicators depends on how well we can capture thevariety of responses which characterize the inherent diversity of microbial communities.The additional benefit of developing robust microbial indicators of environmental changeis the probable discovery of novel capabilities that will contribute to the repertoire ofbiotechnological strategies for addressing environmental problems. The global nature ofthese problems warrants far-reaching solutions that are accessible to scientists all over theworld. Therefore, carefully annotated conservatories of microorganisms located in strategicgeographical regions should facilitate rapid technology transfers. A few of these conservato-ries already exist, but they need to be strengthened and made more uniformly accessible,although the advisable caution about restricting access to pathogens needs to be consideredseriously. In the end, the study of microbial diversity and its implications is by necessity amultidisciplinary endeavor. With the rapid progress in the exploration of Space, microbialdiversity will soon likely become also a multiplanetary endeavor. Indeed, it can be arguedthat we are already at the interplanetary stage. Hopefully, we will have mastered microbialsolutions to the global environmental problems on Earth before the multiplanetary stage ofmicrobial diversity is with us.
OGU11 8/14/04 11:52 AM Page 241
242 PART II Principles and applications
QUESTIONS FOR FURTHER INVESTIGATION
1 Find and discuss examples of microbial products and microbial processes that best illustrate your understanding of subtledifferences in answers to the two questions: “Of what use are microorganisms?” and “Of what use is microbial diversity?”2 The integration of redundancy into ecological indicators is likely to provide a robust information network on the size andstatus of ecosystems, ecological capital, and ecosystem functioning. For each of the indicators listed in Table 11.1 find in theliterature at least two examples of microorganisms, microbial communities, or microbial processes that can serve the role of“ecological indicators”.3 Describe two methods for producing data on the composition of microbial communities that can be used for generatingsingle indexes of diversity. Search the literature for at least one application of each of the methods that you described.4 Access the interactive website dedicated to NASA’s Total Ozone Monitoring Spectrometer (http://jwocky.gsfc.nasa.gov/).Follow the instructions on the website to produce a global map of today’s incident ultraviolet radiation. Identify theapproximate UV dose around your residence. Discuss the potential impacts of that dose for the structure and function ofmicrobial communities.5 Search the literature for specific examples of microorganisms that are capable of degrading or detoxifying each of thechemical categories included in the list of persistent organic pollutants (POPs) established by the United Nations EnvironmentProgram (UNEP). Do these degradative organisms cluster around any specific phylogenetic branch?6 Compare and contrast the challenges facing the conservation of global microbial diversity as opposed to the challengesfacing the conservation of global animal and/or plant diversity.
SUGGESTED READINGS
Arrieta, J.M., M.G. Weinbauer, and G.J. Herndl. 2000. Interspecific vari-ability in sensitivity to UV radiation and subsequent recovery inselected isolates of marine bacteria. Applied and EnvironmentalMicrobiology, 66: 1468–73.
Bernal, A., U. Ear, and N. Kyrpides. 2001. Genomes OnLine Database(GOLD): A monitor of genome projects world-wide. Nucleic AcidsResearch, 29: 126–7.
Bull, A.T. (ed.) 2003. Microbial Diversity and Bioprospecting. Washing-ton, DC: American Society for Microbiology.
Kelly, J. 1995. Microorganisms, indigenous intellectual property rightsand the Convention on Biological Diversity. In D. Allsop, R.R.Colwell, and D.L. Hawksworth (eds.) Microbial Diversity and Ecosys-tem Function, pp. 415–26. Wallingford, England: United NationsEnvironment Program and Center for Agriculture and Biotechnol-ogy International.
King, J. 2000. Environmental pollution and the emergence of new dis-eases. In L. Margulis, C. Matthews, and A. Haselton (eds.) Environ-mental Evolution (second edition), pp. 249–62. Cambridge, MA: MITPress.
Maidak, B., J. Cole, T. Lilburn, C. Parker, P. Saxman, R. Farris, G.Garrity, G. Olsen, T. Schmidt, and J. Tiedje. 2001. The RDP-II (Ribosomal Database Project). Nucleic Acids Research, 29: 171–3.
NRC. 1999. Perspectives on Biodiversity: Valuing its Role in an Ever
Changing World. Washington, DC: National Research Council.National Academy Press.
NRC. 2000. Ecological Indicators for the Nation 2000. Washington, DC:National Research Council. National Academy Press.
Ogunseitan, O.A. 2000. Microbial proteins as biomarkers of ecosystemhealth. In K. Scow, G.E. Fogg, D. Hinton, and M.L. Johnson (eds.)Integrated Assessment of Ecosystem Health, pp. 207–22. Boca Raton,FL: CRC Press.
Ogunseitan, O.A., S. Yang, and J.E. Ericson. 2000. Microbial delta-aminolevulinate dehydratase as a biosensor of lead (Pb) bioavail-ability in contaminated environments. Soil Biology and Biochemistry,32: 1899–906.
Paerl, H.W., J. Dyble, P.H. Moisander, R.T. Noble, M.F. Piehler, J.L.Pinckney, T.F. Steppe, L. Twomey, and L.M. Valdes. 2003. Microbialindicators of aquatic ecosystem change: Current applications toeutrophication studies. FEMS Microbiology Ecology, 1561: 1–14.
Pimm, S.L. 1984. The complexity and stability of ecosystems. Nature,307: 321–6.
Pimm, S. and P. Raven. 2000. Extinction by numbers. Nature, 403:843–5.
Wall, D.H., G. Adams, and A.N. Parsons. 2001. Soil biodiversity. In F.S.Chapin, O.E. Sala, and E. Huber-Sannwald (eds.) Global Biodiversityin a Changing Environment, pp. 47–82. New York: Springer-Verlag.
OGU11 8/14/04 11:52 AM Page 242