microbial source-tracking project · progress in developing and validating microbial...
TRANSCRIPT

Science report: Microbial Source-Tracking project
Microbial Source-Tracking project Science report: SC070003
SCHO1008BOVQ-E-P

Science report: Microbial Source-Tracking project ii
The Environment Agency is the leading public body protecting and improving the environment in England and Wales. It’s our job to make sure that air, land and water are looked after by everyone in today’s society, so that tomorrow’s generations inherit a cleaner, healthier world. Our work includes tackling flooding and pollution incidents, reducing industry’s impacts on the environment, cleaning up rivers, coastal waters and contaminated land, and improving wildlife habitats. This report is the result of research commissioned and funded by the Environment Agency’s Science Programme.
Published by: Environment Agency, Rio House, Waterside Drive, Aztec West, Almondsbury, Bristol, BS32 4UD Tel: 01454 624400 Fax: 01454 624409 www.environment-agency.gov.uk ISBN: 978-1-84432-965-6 © Environment Agency October 2008 All rights reserved. This document may be reproduced with prior permission of the Environment Agency. The views expressed in this document are not necessarily those of the Environment Agency. This report is printed on Cyclus Print, a 100% recycled stock, which is 100% post consumer waste and is totally chlorine free. Water used is treated and in most cases returned to source in better condition than removed. Further copies of this report are available from: The Environment Agency’s National Customer Contact Centre by emailing [email protected] or by telephoning 08708 506506.
Author: Porter, J Dissemination Status: Publicly available / Released to all regions Keywords: Microbial, Source, Tracking, DNA signatures, ICREW, Cycleau Research Contractor: National Laboratory Service Starcross Laboratory, Staplake Mount, Starcross, Devon, EX6 8PE Environment Agency’s Project Manager: Andrew Wither Collaborators: Scottish Environment Protection Agency, Scottish Government, UK Water Industry Research Ltd. Science Project Number: SC070003 Product Code: SCHO1008BOVQ-E-P

Science report: Microbial Source-Tracking project
iii
Science at the Environment Agency Science underpins the work of the Environment Agency. It provides an up-to-date understanding of the world about us and helps us to develop monitoring tools and techniques to manage our environment as efficiently and effectively as possible. The work of the Environment Agency’s Science Group is a key ingredient in the partnership between research, policy and operations that enables the Environment Agency to protect and restore our environment. The science programme focuses on five main areas of activity:
• Setting the agenda, by identifying where strategic science can inform our evidence-
based policies, advisory and regulatory roles;
• Funding science, by supporting programmes, projects and people in response to long-term strategic needs, medium-term policy priorities and shorter-term operational requirements;
• Managing science, by ensuring that our programmes and projects are fit for purpose and executed according to international scientific standards;
• Carrying out science, by undertaking research – either by contracting it out to research organisations and consultancies or by doing it ourselves;
• Delivering information, advice, tools and techniques, by making appropriate products available to our policy and operations staff.
Steve Killeen Head of Science

Science report: Microbial Source-Tracking project
iv
Executive summary In order to manage faecal pollution in our bathing waters, we need more information on the sources of such pollution. This project aimed to develop, test and establish routine procedures to determine the original host animal group of faecal bacteria found in water. The project proceeded in two stages. Stage 1 involved training staff and developing a routine service to distinguish faecal pollution from human and ruminant (farm) animal sources for the 2007 bathing water season. At the time the project started (January 2007), this was as far as the technology allowed. Stage 2 was to develop and test new markers to allow further discrimination of the possible sources of faecal pollution, in the priority order of birds, dogs, humans. Stage 1 established a routine service in two regions of the UK, where the service was actively promoted. Other work was also undertaken (such as for Scottish Environment Protection Agency), including some commercial work. The service has been offered to all sponsors since May 2008. Stage 2 investigated a variety of possible markers for birds and dogs, and an alternative marker for humans. All markers were screened against individual faecal samples from known host animals to confirm specificity and sensitivity. The best performing candidate markers were characterised and the information gained from each evaluated. These will be incorporated into the routine service. An application for UKAS accreditation was made for the initial tests in December 2007. The feedback from UKAS regarding the application has been very positive, and subject to a satisfactory response, it is anticipated that accreditation for the laboratory procedures will be awarded during 2008. Applications for accreditation for the new markers will likewise be made to UKAS. Without knowing where faecal pollution in bathing waters is coming from, we risk using up considerable resources without properly tackling the sources of pollution. This project has developed non-quantitative routine methods to identify the sources of microbiological pollution, set the groundwork for semi-quantitative data, and established a route towards quantitative data. This information will help guide remedial action, and focus resources when tackling problems.

Science report: Microbial Source-Tracking project
v
Contents Executive summary iv 1. Introduction 1 2. Experimental approach 4 3. Discussion 18 4. Recommendations 20 5. References 23 Appendix 1 25 Appendix 2 30

Science report: Microbial Source-Tracking project
1
1 Introduction 1.1 Rationale The Environment Agency was the lead partner of an EU-funded project called ‘ICREW’ – Improving Coastal and Recreational Waters. This project ran between April 2003 and April 2006 (see www.ICREW.info) The project was intended to help five partner EU member states (United Kingdom, Ireland, France, Portugal and Spain) to improve the quality of coastal and recreational waters and to prepare for new EU legislation in this area. The project consisted of seven pilot actions. Pilot Action 3, which included partners from Ireland, France, Portugal and the UK, addressed the issue of microbial source-tracking of faecal pollution from a regulatory perspective. Its objective was to develop a working tool to discriminate the sources of pollution in an environmental sample. As part of the project, a comprehensive literature review was carried out to identify methods which showed potential as a practical tool. These methods were further reviewed at an international workshop in Guildford, UK in January 2004. The workshop was attended by scientists from around the world who were actively working with microbial source-tracking. As result of the literature review and workshop, two methods were chosen for practical evaluation. These were Bacteriodetes genotyping and FRNA bacteriophage genotyping. Both methods were found to perform well in field studies. The Bacteriodetes genotyping method, based on polymerase chain reaction (PCR) technology, was considered the most amenable for a routine analytical service and was therefore chosen for further development. Further work was carried out by the Environment Agency to develop the Bacteriodetes markers to provide semi-quantitative information on likely sources of pollution. The Water Framework Directive (WFD) is a highly significant milestone in European water legislation, aiming to introduce an integrated and co-ordinated approach to water management, which in turn allows more effective risk assessment. Meeting the requirements of the WFD will be a significant task, and will require high quality information, based on sound science. The WFD sets countries a target of aiming to achieve good ecological and chemical status for surface water bodies. It focuses on the ecological aspects of waters, as well as ensuring that water quality meets the traditional chemical standards. All aspects of water management are being brought under one directive, to eliminate gaps and inconsistencies which existed when separate areas of legislation were in operation. In particular, the WFD will help deal with diffuse pollution, which has remained a problem despite improvements to most point source discharges. Tackling diffuse pollution is far more technically challenging than tackling point source pollution. Point sources are more readily identified, and the required remedial action is often more straightforward. The cost of tackling diffuse pollution could be higher than that for point source pollution. Information on pollutant type, sources, movements and sinks is required, which requires a suite of methods and data for routine monitoring and more detailed investigations where necessary. Routine monitoring establishes background information – helping to fulfil the monitoring requirement of the WFD – but must be cost-effective. More extensive investigations would only be carried out when required.

Science report: Microbial Source-Tracking project
2
Previous work carried out through ICReW, and also through a second Environment Agency-led, European-funded project, Cycleau (www.cycleau.com), made significant progress in developing and validating microbial source-tracking methods within a European context. The methods developed through the ICReW project were of particular interest, as the approaches would be suitable for routine environmental testing. This project set out to develop molecular biological methods for catchment management. Traditional (culture-based) methods have served us well over many years; however, molecular biology offers significant advantages in helping us to determine approximate proportions of faecal pollution from the main likely host animal groups in the UK. 1.2 Applying molecular ecology to microbial source-tracking The use of microbiological indicators of faecal pollution is well established in water quality monitoring. Microbial source-tracking techniques have been developed to help determine the source of such pollution. This has advanced considerably beyond the assessment of point source inputs, and their contribution to total bacterial numbers, to efforts to analyse diffuse pollution inputs and to determine the original host species of any faecal contamination. Candidate organisms for source-tracking have included Bacteriodetes spp. (Bernhard and Field, 2000a&b), and E. coli (Dombek et al., 2000), in addition to other biological (bacteriophage, animal viruses) and chemical (caffeine, faecal sterols) approaches. Each method has been tested with varying degrees of success. A key recommendation from the ICReW project was that the use of Bacteroides has perhaps the greatest potential for routine work in this area (Gawler et al., 2007). Analysing the nucleic acids of indicator bacteria offers the most promise for unambiguous screening of samples routinely collected for water quality monitoring. The aim is to establish a procedure that reliably indicates faecal pollution from the original host animal. Initially, all genotype-based characterisations require validation of the specificity and sensitivity of the procedure. Microbiological source-tracking methods using Bacteroidetes species involves screening DNA preparations from water for the presence of species associated only with one host animal group. Further explanation on screening DNA preparations is provided in Appendix 1. Bacteroidetes methods have the key advantage that they can be adapted to be quantitative, providing data on the relative contribution of each of the marker bacteria from each animal host group to the total faecal bacteria present. Other methods may be developed in the future to verify the source-tracking data. 1.3 Using the microbial source-tracking information The aim of this project was to develop a toolbox of methods to help environmental managers trace the sources of pollution in rivers and bathing waters to a required degree of resolution. At present, a subset of the tests outlined above could be used as the first choice for routine use. Further tests could then be applied, based upon data from the initial work. As the nucleic acids can be stored, even if not formally archived, there is further opportunity for retrospective testing. For example, if pollution in a well-characterised catchment was shown to be predominantly from agricultural and not human sources, then further testing might not be necessary. If however, the first set of tests showed that pollution from agricultural and human sources was only a small part of the pollution present, further tests could be used to identify or rule out other candidate sources.

Science report: Microbial Source-Tracking project
3
When combined with count data, it will ultimately be possible to rank the sources of pollution in order to pinpoint the major sources, giving focused information to enable real environmental improvement. This information could also feed into quantitative microbial risk assessments for human health as the potential to screen for genes indicative of pathogenicity would be implicit within the archiving and test procedures. Such data can inform quantitative microbial risk assessments through hazard identification and exposure assessment. 1.4 Key objectives The main aims of this project were to:
• Offer a simple routine microbial source-tracking service for human and ruminant markers for the bathing water season 2007.
• Develop and characterise new host animal markers for birds, dogs and humans. • Offer a more complete routine service to all sponsors for the bathing water season
2008. • Investigate formal archiving of DNA for possible future work.

Science report: Microbial Source-Tracking project
4
2 Experimental approach
2.1 Objective 1: Offer a simple limited routine microbial source-tracking service for human and ruminant markers for the bathing water season 2007
This stage of the project started in January 2007. A training plan with competency criteria was prepared and training was given to three members of staff (a fourth member was subsequently trained when one of the original staff left). A work scheme and physical laboratory work plan following standard laboratory practice for molecular biology was established. The use of quantitative polymerase chain reaction (Q-PCR) instrumentation and data processing was simplified through the creation of Excel template files and Excel macros. Staff were trained in time for the start of the 2007 bathing water season, which was advertised (by Word documents distributed by email and by several informal presentations) to interested parties from the sponsors. The service was delivered as stated in the original proposal. Initial feedback showed interest from those approached, but raised the question of costs. In response to concern over the perceived cost, the service was (and continues to be) offered in a staged process. Although some work was requested according to a specific protocol, for most situations samples for microbial source-tracking (MST) were collected in parallel to standard bacti. samples. A measured volume was then filtered, and the filter stored in a stable state (frozen) for a small charge. This allowed users to be provided with the bacterial count data, from which to decide how to proceed – discard, continue to store, or process for DNA extraction and measurement of the three marker sequences for general, human and ruminant animals. The ability to store the samples for a small charge was welcomed by all customers as a way of ensuring maximum value from their budgets. Towards the end of the 2007 bathing water season, a summary set of data were compiled to assess the method. Further work was also carried out towards an application to UKAS for accreditation of two methods: DNA extraction and Q-PCR.
Science report: Microbial Source-Tracking project
5
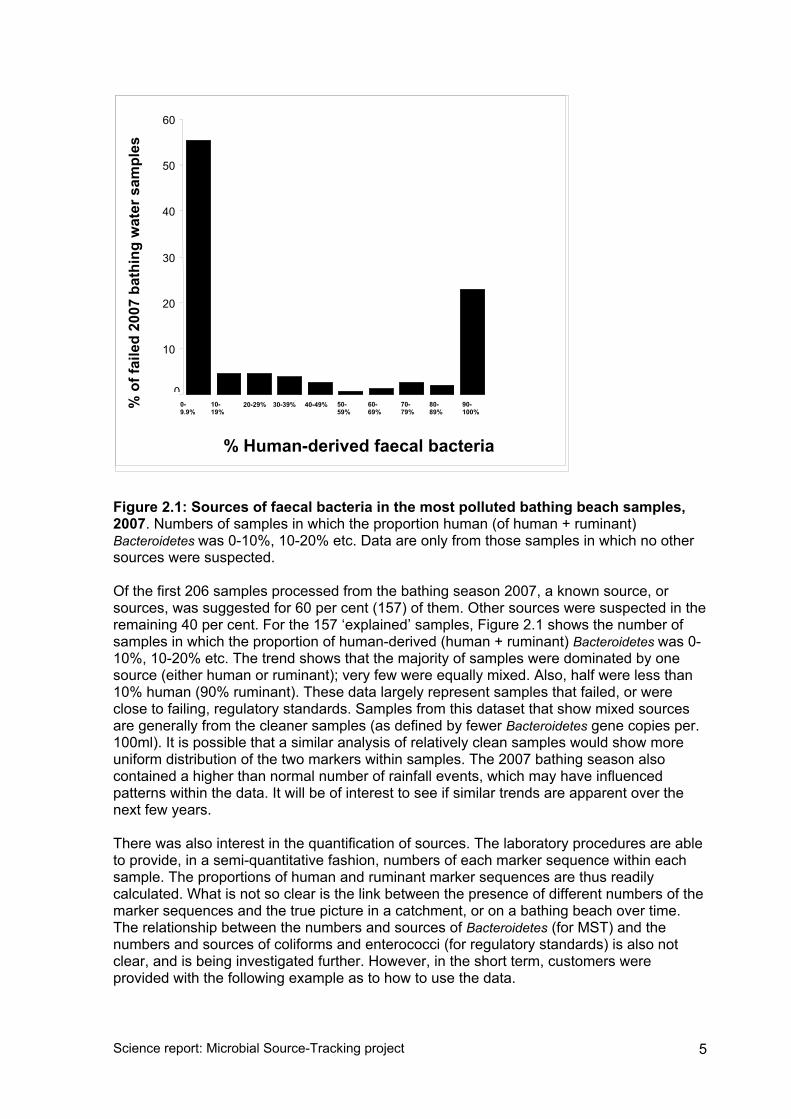
Figure 2.1: Sources of faecal bacteria in the most polluted bathing beach samples, 2007. Numbers of samples in which the proportion human (of human + ruminant) Bacteroidetes was 0-10%, 10-20% etc. Data are only from those samples in which no other sources were suspected. Of the first 206 samples processed from the bathing season 2007, a known source, or sources, was suggested for 60 per cent (157) of them. Other sources were suspected in the remaining 40 per cent. For the 157 ‘explained’ samples, Figure 2.1 shows the number of samples in which the proportion of human-derived (human + ruminant) Bacteroidetes was 0-10%, 10-20% etc. The trend shows that the majority of samples were dominated by one source (either human or ruminant); very few were equally mixed. Also, half were less than 10% human (90% ruminant). These data largely represent samples that failed, or were close to failing, regulatory standards. Samples from this dataset that show mixed sources are generally from the cleaner samples (as defined by fewer Bacteroidetes gene copies per. 100ml). It is possible that a similar analysis of relatively clean samples would show more uniform distribution of the two markers within samples. The 2007 bathing season also contained a higher than normal number of rainfall events, which may have influenced patterns within the data. It will be of interest to see if similar trends are apparent over the next few years. There was also interest in the quantification of sources. The laboratory procedures are able to provide, in a semi-quantitative fashion, numbers of each marker sequence within each sample. The proportions of human and ruminant marker sequences are thus readily calculated. What is not so clear is the link between the presence of different numbers of the marker sequences and the true picture in a catchment, or on a bathing beach over time. The relationship between the numbers and sources of Bacteroidetes (for MST) and the numbers and sources of coliforms and enterococci (for regulatory standards) is also not clear, and is being investigated further. However, in the short term, customers were provided with the following example as to how to use the data.
0
10
20
30
40
50
60
% Human-derived faecal bacteria
% o
f fai
led
2007
bat
hing
wat
er s
ampl
es
0-9.9%
10-19%
20-29% 30-39% 40-49% 50-59%
60-69%
70-79%
80-89%
90-100%

Science report: Microbial Source-Tracking project
6
What does it tell you? Bathing waters case study Twenty bathing water samples were collected, filtered and stored. Only the three samples that failed mandatory or guideline standards were processed for MST. Agricultural sources dominated the three failed samples:
• First: 33% human, 67% ruminant, no other sources suspected (NOSS). • Second: 0.8% human, 99.2% ruminant, NOSS. • Third: 13% human, 87% ruminant, NOSS.
We are NOT able to state that for this site we have (67 + 99.2 + 87) / 3 = 84% ruminant sources. We ARE able to state that faecal bacteria associated with ruminant animals dominated in these samples, as the trend is so clear. 2.2 Evaluation Strengths
• The methods are reliable and applicable to a routine service. • The service is delivered in a staged approach, allowing the customer to control
budgets. • The methods are semi-quantitative and may produce data which ranks contributions
from different sources. • The methods are affordable under existing budgets.
Weaknesses
• Marker sequences are not available for every animal group. • Customers need information to shape their expectations of the data. Immediate
answers are not available; repeat samples are required over time to establish trends.
• It is not yet possible to provide absolute quantification (source apportionment). The data may be limited to ranking the possible sources of faecal contamination.
• There is high variability in the relative amounts of specific marker sequences (used to identify faecal pollution from specific host animal groups) and a general marker sequence (used to identify general faecal pollution). This variability can limit identifying humans as the sole source. It is likely that some samples are reported as “other sources cannot be eliminated” when human sources may be the dominant source.
2.3 Objective 2: Develop new host animal markers for birds, dogs and
humans This work started in April 2007. The initial plan was that any new markers could be used in the procedures developed for routine Bacteroidetes work; that is, using the same sample and DNA preparation. The literature was consulted to identify bacterial species with a host distribution appropriate to the aim (predominantly birds, but also dogs). There are a variety of approaches to source-tracking. The Bacteroidetes approach requires species which are uniquely associated with each animal host group. Another approach is to use bacterial species found in all the host animal groups of interest, with a unique character associated with each animal group. Both such approaches were considered. The options were not

Science report: Microbial Source-Tracking project
7
limited to culturable species; sequence data obtained from clone libraries were also investigated. E. coli isolates have successfully been used to differentiate faecal pollution from ducks/geese from that of other host animal groups (Hamilton et al., 2006; Yan et al., 2007). However, the approach still requires culture and isolation of the bacterium. Although this has been achieved using an automated procedure (Yan et al., 2007), over 700 isolates need to be analysed to obtain a satisfactory answer. This approach would thus be more time-consuming than the current Bacteroidetes approach, and the requirement for 700 isolates would not fit into routine work. Discussions with colleagues at IFREMER, (Brest, France) allowed access to a clone library of Bacteroidetes from a variety of animal host groups, including birds (this work builds on that of Gourmelon et al., 2007). Examination of the 44 avian Bacteroides sequences within the clone library failed to identify specific sequences associated only with birds when compared to sequences from pigs, cows and humans (total number of clone sequences = 277). This finding – that the Bacteroidetes population structure within the avian gut is too variable to identify suitable candidate marker species – is consistent with that of other workers (Devane et al., 2007; Dick et al., 2005). Other possible markers that would fit the requirements of the routine service have been suggested (Devane et al., 2007). A bacterial isolate from mallard faeces (putatively identified as a Desulfovibrio species), if present in a sample, would be captured at the filtration stage, lysed and the DNA recovered. It could then be analysed following the development and validation of a Q-PCR assay. However, the isolate was shown to have a limited distribution between bird groups, in that it was detected in 76% (n = 42) of duck faeces, 20% (n = 10) of swan faeces and 15% (n = 20) of Canada goose faeces. It was also detected in 13% (n = 15) of goat faecal samples. Similar work suggests that other bacterial species often used in source-tracking, such as E. coli and enterococcal species, are not suitable to identify avian markers due to variability (Fogarty et al., 2003). This claim is countered by some authors, such as Hamilton et al. (2006), who have used E. coli for this purpose. Other reports (Baele et al., 2002; Kuntz et al., 2004) suggest that differences may exist between different host animal groups, although no clear consensus has been reached on likely candidate species. It is clear from such studies, though, that a universal bacterial indicator specifically associated with faecal contamination from all bird species has yet to be discovered. Nonetheless, the report by Baele et al. (2002) suggested that an assay for the detection of Enterococcus columbae might be of use for this project, being a major component of the bacterial flora of pigeons and possibly other bird species including gulls ((Baele et al., 2002; Fogarty et al., 2003). To investigate this further, DNA sequence databases (EMBL and RDP) were interrogated to determine which candidate genes had a reasonable number of sequences that might be useful for designing an assay for the routine work. Initial work concentrated on the 16S ribosomal RNA genes (rrn), sub-unit B of the RNA polymerase gene (rpoB) and sub-unit A of the superoxide dismutase gene (sodA). Quality, full-length sequences for these candidate marker genes were downloaded and aligned, primarily using the ClustalW algorithm. Aligned data files were read into the Boxshade processing software (http://www.ch.embnet.org/software/BOX_form.html) to obtain consensus sequences where needed. A consensus of 50-60 % was generally used to determine a base call. The most likely candidate target for the specific detection of Enterococcus columbae was found to be the sodA gene. Alignments from the enterococcal rrn genes showed that it

Science report: Microbial Source-Tracking project
8
would be difficult to design primers with the required specificity (assuming that the taxonomic descriptions associated with each sequence were correct). Similar issues were noted for the rpoB gene. Specific PCR primers for the E. columbae sodA gene were designed using the 35 partial sodA sequences in the database (as described by Poyart et al., 2000) and validated against the sequence database. A selection of known host enterococcal type species were obtained from the BCCM culture collection (http://bccm.belspo.be/index.php; Table 2.1) and cultured. Table 2.1: Enterococcus and related species used for the specific detection of E. columbae _____________________________________________________________________ Species Sourcea _____________________________________________________________________ Enterococcus avium ATCC 14025 (NCTC 9938) Enterococcus durans ATCC 19432 (NCTC 8307) Enterococcus faecalis ATCC 19433 (NCTC 775) Enterococcus faecium ATCC 19434 Enterococcus villorum ATC 700913 Enterococcus canis LMG 12316 Enterococcus columbae LMG 11740 Lactococcus lactis ATCC 19435 Staphylococcus aureus NCTC 8178 Escherichia coli ATCC 9001 (K12) R1 (wild type) T2 (wild type) NCTC 12210 ATCC 25992 Bathing Water isolates Various _______________________________________________________________________ a Culture collections: ATCC – American Type Culture Collection NCTC – National Collection Type Cultures LMG – Laboratory of Microbiology, Ghent (Belgian Culture Collection of Microorganisms) Faecal samples from a variety of known host birds were collected. DNA preps were prepared from cultures and from faeces using the Qiagen DNEasy protocol. For the faecal material, the proteinase K digestion step was also included, following the manufacturer’s instructions. PCR products of the expected size were obtained only from E. columbae. No PCR products indicative of the presence of E. columbae were obtained from faecal DNA from a variety of mammalian animal groups (humans, cattle, sheep). PCR products indicative of the presence of E. columbae were obtained from faecal DNA from three out of eight (38 %) kittiwakes from North East England, but not from four Canada geese or from 14 black-headed gull samples (South West region). Additionally, a range of salt concentrations (0.4 to 7.5 %), a range of concentrations of 2-phenyl ethanol, and different pH values (7.2 to 9.0) did not selectively enrich for E. columbae. A similar approach was taken to selectively enrich, and to specifically detect by PCR, Enterococcus canis as a bacterial species specifically associated with dogs (de Graef et al., 2003; 2005). The data above demonstrate the problem: whilst some bacteria may be specifically associated with birds, to date there are no candidate species associated with all bird species, or nearly all individuals tested from a known population. Other possibilities for detecting the presence of pollution from birds were also investigated, including the presence of uric acid in bathing water samples. The question was when faecal pollution not associated with either the human or ruminant-specific marker was detected,

Science report: Microbial Source-Tracking project
9
whether an above average concentration of uric acid would indicate pollution from birds. Test kits for uric acid are commercially available; however, the kit tested in this project (Infinity Uric Acid Detection System, Sigma) had a reliable detection limit in seawater samples of approximately 25-50 mg/l uric acid. Seawater samples taken from Dawlish, and Dawlish Warren – areas known to have high numbers of birds – did not contain detectable uric acid by this kit. An average uric acid concentration of 1.38 mg/l was reported by Burzyk et al. (2006) during the summer months, for the western sea coast of Spitzbergen, when colonised by many thousands of sea birds. The limitations of the above approaches suggested that the only reliable approach to detect birds (as class Aves) would be to develop an assay for the DNA of the host animal directly. The alternative would be to assess a range of bird species and possible indicator bacteria for each region of the UK. One concern with this approach was that the numbers of marker genes shed into bathing waters would be much lower than those of the faecal bacteria, thus impairing detection limits. As a result, the target sequences selected for the initial developmental work were chosen to be within the mitochondrial genome. Mitochondria – the cell organelles associated with energy metabolism in eukaryotes – possess an independent genome, encoding proteins and functions that are not produced by the host cell. Selection of mitochondrial targets was justified by the facts that there are multiple genomes per mitochondrion, and multiple mitochondria per cell (Satoh and Kuroiwa, 1991) and that many host epithelial cells are shed into the intestine every day (Iyengar et al., 1991; Bullen et al., 2006). A range of mitochondrial genome sequences from the public database (European Molecular Biology Laboratory; http://www.ebi.ac.uk/) were downloaded and aligned using the CLC Bio workbench software (CLC Bio, Aarhus, Denmark; http://www.clcbio.com/). The entire genomes used are listed in Table 2.2. Where multiple sequences were available (Table 2.2), a consensus sequence was also produced. The aligned sequences were examined to determine sections which were unique to different host animals. Sections of sequence that appeared – after visual examination – to contain these diagnostic areas were examined in greater detail. Initially, these sections were tested against the available DNA database (EMBL) using the Washington University Basic Local Alignment Tool (BLAST-WU). Output parameters were adjusted to return hits which showed a high degree of homology, and (separately) to show similar sequences with less homology. This ensured that very close matches and quite close matches were examined, which enabled a number of initial possible diagnostic sequences to be rejected. Sequences were also rejected on other criteria, including overall amplicon length and base composition. The Q-PCR assay works more efficiently when copying DNA sections of 70 to 150 bases long. This restricts the development of an assay to using DNA sequences of the required specificity which are approximately 70 to 150 bases apart. Likewise, copying DNA is more efficient when the base composition (guanosine and cytosine content; % GC) is not excessively high, and within the range 30-70 % GC. Remaining possible sequences were examined using the Primer Express software (version 3.1, Applied Biosystems, Warrington, UK). Possible primer/probe combinations were examined, and again screened on the basis of length and base composition. Possible probe sequences were produced using both standard and minor-groove-binder (MGB) probes. The latter probes may offer some advantages in a Q-PCR assay. The remaining primer/probe combinations were further screened for specificity against the EMBL database, representative genomes in the databases, and within the downloaded genomes (Table 2.2). These were finally ranked according to their potential, and up to ten sets of primers were synthesised (Applied Biosystems, Warrington) for birds, dogs and

Science report: Microbial Source-Tracking project
10
humans. Control oligonucleotides were synthesised (VHBio, UK) to contain the target sequences at a known concentration. Table 2.2: Mitochondrial genome sequences used to design the detection assays ______________________________________________________________________________________ Common name Latin name Accession number ______________________________________________________________________________________ Acanthamoeba castellanii Acanthamoeba castellanii U12386 Atlantic cod Gadus morhua X99772 Atlantic salmon Salmo salar U12143 Blackish oyster catcher Haematopus ater AY074886 Canada goose Branta canadensis DQ019124 Chicken Gallus gallus AP003317 Chicken Gallus gallus AP003318 Chicken Gallus gallus AP003319 Chicken Gallus gallus AP003322 Chicken Gallus gallus AY235570 Chicken Gallus gallus AY235571 Chicken Gallus gallus DQ648776 Chicken Gallus gallus X52392 Chicken Gallus gallus spadiceus AP003321 Chicken Gallus gallus bankvia AP003323 Cow Bos taurus AF492351 Cow Bos taurus V00654 Dog Canus lupus familiaris AY729880 Dog Canis lupus familiaris DQ480489 Dog Canis lupus familiaris U96639 Dogfish Scyliorhinus canicula Y16067 Dominican gull Larus dominicanus AY293619 Donkey Equus asinus X97337 Greater Rhea Rhea americana AF090339 Greyheaded broad bill Smithornis sharpei AF090340 Haddock Melanogrammus aeglefinus DQ020497 Horse Equus caballus AY584828 Horse Equus caballus X79547 Human Homo sapiens AF347015 Human Homo sapiens DQ358977 Human Homo sapiens J01415 Human Homo sapiens X93334 Lesser Rhea Pterocnemia pennata AF338709 Mosquito Anopheles gambiae L20934 Ostrich Struthio camelus AF338715 Peregrine falcon Falco peregrinus AF090338 Pig Sus scrofa AJ002189 Pig Sus scrofa AY334492 Pig Sus scrofa AY337045 Pig Sus scrofa AY574045 Pig Sus scrofa AY574046 Pig Sus scrofa AY574047 Pig Sus scrofa AY574048 Pig Sus scrofa DQ466081 Rainbow trout Oncorhyncus mykiss DQ288269 Rat Rattus norvegicus AJ428514 Rat Rattus norvegicus AY769440 Rat Rattus norvegicus X14848 Redhead duck Aythya americana AF090337 Rock Cod Gadus ogac DQ356941 Rook Corvus frugilegus Y18522 Ruddy turnstone Arenaria interpres AY074885 Sheep Ovis aries AF010406 Sheep Ovis aries AY858379 Swan Cygnus columbianus DQ083161 Village indigo bird Vidua chalybeata AF090341 Wolf Canis lupus DQ480503 Wolf Canis lupus DQ480504 ______________________________________________________________________________ Initial screens of the PCR primer pairs were performed using the SYBR Green assay, with PCR product size (specificity) assessed by the melting temperature. SYBR Green is a fluorescent dye which will bind to DNA. Fluorescence from the dye increases when bound

Science report: Microbial Source-Tracking project
11
to DNA, allowing quantification of the amount of DNA as it is synthesised during PCR, as well as monitoring of a decrease in fluorescence when labelled, double-stranded DNA melts (becoming single-stranded and releasing the dye). Melting occurs at a temperature determined by the size of the DNA and the % GC content of the DNA. This allows a relatively inexpensive approach to testing PCR primer specificity. MGB Q-PCR probes were synthesised for those primer sets which demonstrated the appropriate specificity and sensitivity. The use of these probes allows detection of fluorescence during PCR according to probe degradation as part of the process. The use of the probe allows further confidence in the specificity of the reaction, as it is determined by probe sequence (which must match the target sequence). The final screen produced a new primer/probe test set for birds and for dogs, but used a previously published pair of primers (Anderson et al., 1981) with a new MGB probe designed during this project to adapt the test for a Q-PCR assay. Assays were tested in vitro against the control oligonucleotide sequences to determine optimal cycling conditions and detection limits for Q-PCR. Detection limits were shown to be comparable to those of the Bacteroidetes assays used for the routine service. Faecal samples from known bird species were obtained from a range of sources (Table 2.3). Similar samples were also obtained from other host animal groups (Table 2.3). DNA preparations from all faecal sources were screened for the presence of all three mitochondrial markers using the MGB Q-PCR. The results confirmed the expected specificity of the assays. The human mitochondrial marker was present only in human samples, and the dog mitochondrial marker was present only in dog samples. The bird mitochondrial marker was present in every known bird species and sample tested. It was absent from all dog (and human) mouth swabs, but was present in 50 % of the human faecal samples, and in 29 % of the dog faecal samples. The presence of the bird marker in these faecal samples was presumably as a result of diet. Levels of the bird marker were less than those of the host animal marker levels. Example relative proportions of bird and human mitochondrial markers found in sewage effluent samples over time are presented in Table 2,4. It is clear that the numbers of each marker vary considerably between samples (Table 2.4).

Science report: Microbial Source-Tracking project
12
Table 2.3: Sources of faecal samples ________________________________________________________________________ Source and type Location Number of separate samples ________________________________________________________________________ Dog mouth swab Devon & Somerset 14 Dog Starcross 7 Cow Devon 12 Sheep Devon 12 Pigeons Exeter 23 Pigeons Southern 4 Wood pigeon Southern 1 Starling Blackpool 39 Starling BTO 3 Starling cloacal swab BTO 2 Starling Southern 11 Black-headed gull Southern 2 Mallard Southern 1 Mute swan Southern 1 Kittiwake NE 38 Herring gull St Andrews 13 Common gull St Andrews 15 Northern Gannet St Andrews 11 Black legged kittiwake St Andrews 14 Redshank cloacal swab BTO 9 Redshank faeces BTO 9 Human Starcross 12 (Total number = 253) ___________________________________________________________________________ All samples were faecal samples unless otherwise stated Southern region – sample collection arranged by Ian Dunhill, Environment Agency NE region – sample collection arranged by Bob Midgley, Environment Agency Blackpool – sample collection arranged by Sheila Bethwaite, Environment Agency BTO – sample collection arranged by Mark Rehfisch, British Trust for Ornithology, Thetford Table 2.4: Numbers and proportions of human and bird mitochondrial markers found in waste water treatment. Samples were collected on three consecutive days from Countess Wear WwTW, Exeter, Devon. ______________________________________________________________________________________ Date Treatment stage Human mitochondrial Bird mitochondrial Bird:Human DNA copies/100ml DNA copies/100ml ______________________________________________________________________________________ 15-Oct-07 Influent 4.95E+08 3.10E+07 0.06 16-Oct-07 Influent 6.93E+08 2.18E+07 0.03 17-Oct-07 Influent 3.33E+08 1.85E+06 0.01 mean = 0.03 15-Oct-07 Pre UV 2.90E+07 5.33E+06 0.18 16-Oct-07 Pre UV 1.94E+07 5.62E+06 0.29 17-Oct-07 Pre UV 5.75E+07 9.44E+05 0.02 mean = 0.16 15-Oct-07 Post UV 9.56E+06 4.82E+05 0.05 16-Oct-07 Post UV 1.61E+07 2.83E+05 0.02 17-Oct-07 Post UV 2.75E+07 4.14E+06 0.15 mean = 0.07 ______________________________________________________________________________________

Science report: Microbial Source-Tracking project
13
A major concern in the use of mitochondrial sequences as targets for source-tracking is the number of target sequences in natural water samples. All three mitochondrial assays (bird, dog, human) were tested using water samples from the North West and South West regions of the Environment Agency collected through the 2007 bathing season. Following consultation with local staff, samples were also collected where contamination with the appropriate markers was expected (a WwTW; down-stream from a kennel; from a beach where dogs were thought to be a likely source of pollution; bathing water samples in which other sources were suspected following the Bacteroidetes analysis). Example data detecting mitochondrial markers in a bathing water sample is presented in Figure 2.2.
A
B

Science report: Microbial Source-Tracking project
14
Figure 2.2: Example data plot of Q-PCR detection of bird mitochondrial DNA in a bathing water sample (St. Annes North, 2007). Figure 2.2A shows sample plots (blue and purple lines) with the addition of a known number of target molecules (green line). Figure 2.2B shows standards of a known number of target molecules used for quantification. Each plot consists of duplicate standards, from left to right 10(7), 10(6), 10(5) and 10(4) molecules. Both the standards (2.2B) and the spiked control (2.2A) are used to determine the number of molecules of the target sequence in the actual sample (Figure 2.2A). Further sample processing for these markers is ongoing. However, preliminary data are shown in Table 2.5. Of the samples tested so far, when present in a sample, average numbers of the bird marker sequence are greater than that of human or dog marker sequences. A greater proportion of samples tested as positive for the bird and human marker sequences than for the dog sequence (Table 2.5). Table 2.5: Example data of numbers of the mitochondrial DNA sequence found in natural water samples ________________________________________________________________________________ Marker Number of samples Number of zero values Average (St Dev) / 100ml ________________________________________________________________________________ Bird 28 15 1.83x10⁴ (2.14x10⁴) Dog 42 31 1.57x10³ (4.42x10³) Human 55 28 3.08x10³ (7.17x10³) ________________________________________________________________________________ Average dog mitochondrial sequence per 100 ml data omits samples taken from a stream nearby a large kennel. Numbers in this stream were 4.7x10⁶ / 100 ml.

Science report: Microbial Source-Tracking project
15
2.4 Evaluation Strengths
• New markers have been developed for the target species of birds, dogs and humans.
• The new markers show exceptional specificity. • The new markers have been developed as a Q-PCR assay, which fits directly into
the current routine service, meeting the requirements of being quantitative, rapid and reliable.
Weaknesses
• The approach of using mitochondria is very new and the numbers of these sequences in the natural world are as yet unknown. This will change quickly.
• The use of mitochondrial DNA markers may suffer from having high detection limits. Although at least some samples are testing as positive, it is not yet known what proportion of the unexplained sources will be clarified using this approach.
• The detection of the bird marker sequence in human and dog faeces will require that when pollution from birds is suspected, samples will probably also require analysis for the human marker as well. This will allow an interpretation of whether the bird marker is present with the human marker (possible sewage) or whether the bird marker is present alone (direct pollution). This requirement involves the cost of an extra marker test.

Science report: Microbial Source-Tracking project
16
2.5 Objective 3: Offer a more complete routine service to all sponsors for the bathing water season 2008
The experiences gained during the 2007 bathing water season have allowed us to develop and tailor the service in response to feedback from users. The service was available to all sponsors for the 2008 bathing water season. Data obtained from the mitochondrial markers aimed to fill the gap in the service offered during 2007. These tests have been added to the suite of tests offered under the MST service, and formed part of the dissemination workshop series completed during May 2008. Several formal requests have been made for stored samples to be analysed for the mitochondrial markers, demonstrating that the project has met a real need for the regulators. Our experiences over the 2007 bathing water season enabled us to identify bottlenecks and workflow issues. Overcoming these has allowed us to keep the analytical costs stable for 2008.
2.6 Evaluation Strengths.
• The tests are ready to go and expand our ability to identify possible host animal groups that could be causing faecal pollution.
• The service is amenable to routine use. Weaknesses.
• We are as yet unable to routinely analyse shellfish flesh (in general, it is more difficult to extract the DNA from a solid matrix). This work is progressing through shellfish dissection prior to analysis.
2.7 Objective 4: Investigate formal archiving of DNA for
possible future work Currently, after a DNA preparation has been analysed as part of the routine service, the remaining DNA has been stored at -70 ºC in case the customer requests further analysis (which has frequently happened). Although effective short-term, DNA will eventually degrade when stored this way, and degradation would be increased if a power cut or mechanical failure resulted in defrosting of the freezer. Commercially available storage cards, for example from Whatman (www.whatman.co.uk/), describe a room temperature storage system which maintains DNA in a stable state for over 10 years. The system was tested as part of this project in preparation for a DNA archive/library, which would allow the Environment Agency to store biological information from samples for extended periods of time, and thus permit environmental changes to be assessed in detail at a future date if necessary. DNA from several sources, including gull faecal extracts, was stored on Whatman Clone saver FTA Cards at room temperature, in accordance with the manufacturer’s instructions.

Science report: Microbial Source-Tracking project
17
DNA was added to the cards in April 2007, and tested over time. Example data are presented in Figure 2.3. PCR-ready DNA was retrieved from the cards.
Figure 2.3: PCR amplification of E. coli from gull faecal DNA recovered from Whatman FTA Clone Saver cards after approximately one year at room temperature. DNA was recovered according to the manufacturer’s suggestions. Sub-sections of card are punched from the parent card and DNA is then eluted from the punch disc, or the whole disc is added to a PCR amplification. Lanes 2-9, template DNA eluted in water or TE buffer. Lanes 10-17, template DNA added as punched disc. Lanes 18-20, eluted DNA controls. Lanes 21-23, punch disc controls. Lanes 1 and 26 100 bp DNA ladder (Fermentas).
2.8 Evaluation Strengths
• The system apparently stores DNA from faecal preps in a stable state at room temperature.
• The system is reliable and easy to store the material. Separate cards can be easily stored at room temperature in separate buildings or sites to ensure protection from fire, for example.
Weaknesses
• The system has only been evaluated for 11 months (the manufacturer claims the DNA is stable for over 14 years).
• The system has a finite capacity for binding DNA. • Recovery of the DNA is best from the punched discs, which can be fiddly to
manipulate. The discs have not yet been tested for interference in a Q-PCR assay; extraction of DNA from the discs may be required.
1 2 3 4 5 6 7 8 9 10 11 12 13 14 15 16 17 18 19 20 21 22 23 24 25 26

Science report: Microbial Source-Tracking project
18
3 Discussion The ultimate goal of microbial source-tracking is to be able to quantify all sources of bacteria causing faecal pollution. This goal is still some way off, although work undertaken in this project has made some progress towards it. Notable achievements under this project include: (1) the introduction of DNA-based analyses into routine environmental testing; (2) training of staff and development of UKAS-accredited DNA-based methods suitable for routine laboratory use, in a format that allows useful control over cost; (3) useful dialogue between laboratory and regulatory staff; (4) the further development of source-tracking markers to expand application across the UK; (5) initiation of a DNA archive for UK bathing waters. Further to these points, the work has also progressed by participation in a verification project in association with the Centre for Research into Environment and Health (CREH). This project is presented in a separate report. There has been recognition of the need to bring molecular biological tools into routine environmental testing, including applying them to source-tracking (Edge and Schaefer, 2006). This represents the first wide-scale application of DNA extraction and subsequent polymerase chain reaction amplification of target sequences from aquatic samples within the UK regulatory agencies. Testing and validation of procedures for this purpose has yielded a great deal of useful information and expertise, which will be available to all sponsors. The methods must be rapid and reliable, as well as of reasonable cost. The experiences of training staff familiar with routine microbiology, but not with molecular biological methods, within such an environment will also be available to all sponsors. A wide range of molecular biological approaches can be applied to environmental testing. The information available through molecular biology cannot be readily accessed in any other way, and may be of great benefit to regulators. Discussions between the sponsors, NLS staff and regulatory workers (from environment officers to staff working on policy) prompted by this project have made it clear that some form of quantification will be necessary for environmental testing, and to this end, quantitative PCR has a major role to play. Alternative approaches such as micro-arrays, which can provide presence/absence data on a wide range of organisms, will inevitably suffer from low sensitivity if testing environmental DNA preparations directly (Lee et al., 2006). Improving this sensitivity to useful (regulatory) detection limits through some form of DNA amplification prior to analysis by micro-arrays inevitably loses the ability to quantify. Thus the most useful current method, combining sensitivity with the ability to quantify, is that of quantitative PCR. This project has enabled the introduction of Q-PCR testing of environmental DNA preparations within an ISO17025 compatible quality framework, with the laboratory work being inspected and passed for UKAS accreditation. The development of novel markers for source-tracking using mitochondrial DNA has demonstrated exceptional specificity, and at a potentially useful phylogenetic level for detection of pollution from birds. This potential must be balanced against several drawbacks. Firstly, the link between the faecal bacteria causing a regulatory failure, and the DNA marker which is being used to try and explain that failure, is as yet unknown, and is further compounded when using the mitochondrial DNA than when using Bacteroidetes DNA. Secondly, the presence of bird DNA from the human diet is readily detected using these assays, and thus the assay requires assessment of at least two markers (bird and human), increasing costs. Nevertheless, this approach remains the first potential marker for the detection of pollution from birds, and is applicable across the UK. The ability to test for DNA from birds (as class Aves) has advantages in that separate assays are not required for each bird species and geographical region. As the tests are used further, the database of

Science report: Microbial Source-Tracking project
19
gene copy numbers of these sequences in environmental samples will increase and possible correlations between different parameters can thus be explored. Collecting bathing beach (and other) samples in accordance with regulatory requirements represents a considerable resource allocation for all sponsors and regulators. Obtaining the maximum amount of information from these samples thus makes sense, and the ability to store DNA in a stable state for a number of years opens up the possibility of realising this potential. An archive of DNA from selected sites (such as those known to frequently have issues with pollution) will permit retrospective testing of these samples as new technologies are introduced. Such an archive could act as an excellent reference point for determining changes over time (quantifying the results of improvement actions or determining causes of gradual deterioration of water quality, for example). The formal establishment of a DNA archive could also meet some monitoring requirements of the Water Framework Directive. These results represent significant progress towards the introduction and use of routine molecular biological tools in environmental testing. The data generated by this project has provided information for the sponsors to critically evaluate the initial bacterial markers used for source-tracking (2007 bathing water season), and a framework within which the newly developed mitochondrial markers can be applied (2008 bathing water season). This project has thus established a firm basis for source-tracking for the UK regulatory agencies.

Science report: Microbial Source-Tracking project
20
4 Recommendations
4.1. The sample collection programme, sample processing decisions and format of the presented data require further consideration.
The majority of samples for MST are from UK bathing beach sites, collected as part of the routine bathing beach runs. In general, bathing beach samples that fail guideline or mandatory bacteriological standards are selected for processing. Previous efforts at discussing the limitations of the data have argued that reliance on data from single samples is dangerous, and that it is important to establish trends over time from the same site (workshops organised by this project have consolidated and extended these efforts). However, the data may be reported as percentage human and/or percentage ruminant Bacteroidetes markers. Despite the following disclaimer, “Although the uncertainty of measurement [UoM] of the laboratory testing has been assessed, the UoM in the real world situation is unknown. Until this has been further evaluated, the microbial source-tracking data should not be considered as quantitative. It is strongly recommended that repeat samples are processed over time to look for trends”, the percentage data has on at least two occasions resulted in over-interpretation of data with a perceived accuracy and/or precision that is not currently justifiable. The data from the MST (produced through Q-PCR) has always been considered semi-quantitative from the perspective of defining and analysing a sequence to represent a bacterial species. In addition, there is no straightforward method to compare relative inputs assessed by Bacteroidetes and those assessed by mitochondrial gene sequence. Coupled with the UoM in the real world, it may be more appropriate to present data as ranked, rather than with numerical values. Verification of the ranking process, especially when comparing Bacteroidetes gene numbers with mitochondrial gene numbers, is required. A method of presenting data that allows for ranking of sources from the same site over time, that does not allow over-interpretation, should be investigated. This should be developed in conjunction with the sampling programme to ensure that single or isolated samples are not submitted for analysis unless unusual circumstances make it acceptable.
4.2. The link between numbers of Bacteroidetes, mitochondrial DNA and regulatory faecal indicator organisms requires further examination, including discharges from UV (ultra-violet) treated sewage effluent.
MST methods used for the routine service do not attempt to recover all DNA for a quantitative assessment of Bacteroidetes numbers. Although significant correlations between Bacteroidetes numbers (assessed by Q-PCR) and coliforms (assessed by the ISO membrane filtration method) have been noted, this relationship does not extend to faecal streptococci, and may not always apply to coliforms. Any assumption that reduction of a source identified as significant using Bacteroidetes will automatically lead to a reduction in

Science report: Microbial Source-Tracking project
21
regulatory faecal indicator organisms cannot yet be justified. This point could also be made during data reporting (see previous section). Likewise, absolute numbers of mitochondrial gene copies are not assessed, but rather presence, absence, or relative abundance (such as avian to human) are used to suggest whether a sample contains such sequences, and if so, from the human diet or directly from birds. The link between mitochondrial gene copies and both Bacteroidetes gene copies and FIO numbers should be investigated further, especially with respect to enterococci (which often do not show clear associations with other current regulatory parameters). A further aspect, raised during one of the dissemination workshops, is the effects of UV treatment on effluent organisms. When working correctly, such treatment clearly reduces culturable numbers of FIOs, but has little effect on numbers of Bacteroidetes gene copy number, when assessed by Q-PCR. This may further strain any relationship between the two parameters, especially if the effluent discharges close to a designated bathing water.
4.3. The persistence of Bacteroidetes, mitochondrial DNA and regulatory faecal indicator organisms in natural environments requires further examination.
There are several (relatively small) data sets which suggest that DNA from Bacteroidetes cells declines quickly within the environment, as growth of these anaerobes is not likely to occur. The rate of decline of total and animal-specific bacterial DNA has been shown to be the same. Similarly, there is no likelihood of the specific mitochondrial genes replicating in the environment, once shed from the host. However, there are now several (relatively small) data sets which suggest that FIO may undergo limited replication in at least some environments, and that reservoirs of environmental strains exist. These considerations may further confound the relationships between these parameters, and the relationship between faecal pollution and FIOs. The role of free-living and particle-attached organisms, together with diversity assessment of the FIOs, should be investigated further to clarify the relationships between these parameters.
4.4. Monitoring, testing and introduction of new
techniques is necessary. Research into MST techniques and applications is a rapidly-changing field and although approaches such as those using Bacteroidetes and mitochondrial DNA are currently of clear benefit over some other methods, novel approaches should be assessed and, if appropriate, tested. As a result of this project and ongoing sampling, an exceptionally useful resource of DNA extractions from known sites with associated data for other useful parameters now exists, which should be used for maximum benefit. There is currently no universal approach for MST, and no single approach has enabled identification of all possible sources of faecal pollution, even for relatively simple catchments. Applying a single approach to all sources may be the most clear-cut way of source apportionment (categorising inputs from all possible sources). Mitochondrial DNA is probably the most promising current approach to this, although factors such as poorer detection limits, a less-direct link between measured parameter and regulatory organism, and possible problems with a “universal” detection system that includes all contributory organisms without cross-reacting with non-contributing organisms (such as plants), may

Science report: Microbial Source-Tracking project
22
limit the overall effectiveness. If, as seems likely, a toolbox approach is required to identify all possible sources, then it is essential that analytical staff are familiar with the strengths and weaknesses of all potential tools.

Science report: Microbial Source-Tracking project
23
5 References Anderson, S., Bankier, A.T., Barrell, B.G., de Bruijn, M.H.L., Coulson, A.R., Drouin, J. Eperon, I.C., Nierlich, D.P., Roe, B.A., Sanger, F., Schreier, P.H., Smith, A.J.H., Staden, R. and Young, I.G. 1981. Sequence and organization of the human mitochondrial genome. Nature, 290, 457-465. Baele, M., Devriese, L.A., Butaye P. and Haesebrouck, F. 2002. Composition of enterococcal and streptococcal flora from pigeon intestines. Journal of Applied Microbiology, 92, 348-351. Bernhard, A.E. and Field, K.G. 2000a. Identification of nonpoint sources of fecal pollution in coastal waters by using host-specific 16S ribosomal DNA genetic markers from fecal anaerobes. Applied Environmental Microbiology, 66,1587-1594. Bernhard, A.E. and Field, K.G. 2000b. A PCR assay to discriminate human and ruminate feces on the basis of host differences in Bacteroides-Prevotella genes encoding 16S rRNA. Applied Environmental Microbiology, 66, 4571-4574. Bullen, T.F., Forrest, S., Campbell, F., Dodson, A.R., Hershman, M.J., Pritchard, D.M., Turner, J.R., Montrose, M.H. and Watson, A.J.M. 2006. Characterization of epithelial cell shedding from human small intestine. Laboratory Investigation, 86, 1052-1063. Burzyk, M., Pulina, M., Sajewicz, M. and Zjawiony, I. 2006. Uric acid in the surface waters of Spitsbergen and its role in the dissolution processes which affect carbonate rocks. Polish Polar Research, 27, 327-340. De Graef, E.M., Devriese, L.A., Vancanneyt, M., Baele, M., Collins, M.D., Lefebvre, K., Swings, J. and Haesebrouck, F. 2003. Description of Enterococcus canis sp. nov. from dogs and reclassification of Enterococcus porcinus Teixeira et al. 2001 as a junior synonym of Enterococcus villorum Vancanneyt et al. 2001. Int. J. Syst. Evol. Microbiol. 53, 1069-1074. De Graef, E.M., Devriese, L.A., Baele, Vancanneyt, M., Swings, J., Haesebrouck, F. and Decostere, A. 2005. Identification of enterococcal, streptococcal and Weissella species in the faecal flora of individually owned dogs. Journal of Applied Microbiology, 99, 348-353. Devane, M., Robson, B., Nourozi, F., Scoles, P. and Gilpin, B.J. 2007. A PCR marker for detection in surface waters of faecal pollution derived from ducks. Water Research, 41, 3553-3560. Dick, L.K., Bernhard, A.E., Brodeur, T.J., Santo Domingo, J.W., Simpson, J.M., Walters, S.P. and Field, K.G. 2005. Host distributions of uncultivated faecal Bacteroidales bacteria reveal genetic markers for fecal source identification. Applied Environmental Microbiology, 71, 3184-3191. Dombek, P.E., Johnson, L.K., Zimmerley, S.T., and Sadowsky, M.J., 2000. Use of repetitive DNA sequences and the PCR to differentiate E. coli isolates from human and animal sources. Applied Environmental Microbiology, 66, 2572-2577. Edge, T.A. and Schaefer, K.A. 2006. Microbial source-tracking in aquatic ecosystems: the state of the science and an assessment of needs. National Water Research Institute, Burlington,

Science report: Microbial Source-Tracking project
24
Ontario. NWRI Scientific Assessment Report Series no. 7 and Linking Water Science to Policy Workshop Series. 23p. Fogarty, L.R., Haack, S.K., Wolcott, M.J. and Whitman, R.L. 2003. Abundance and characteristics of the recreational water quality indicator bacteria Escherichia coli and enterococci in gull faeces. Journal of Applied Microbiology, 94, 865-878. Gawler, A., Beecher, J., Brandao, J., Carroll, N., Falcao, L., Gourmelon, M., Masterson, B., Nunes, B., Porter, J., Rincé, A., Rodrigues, R., Thorp, M., Walters, M. and Meijer, W.G. 2007. Validation of host specific Bacteroidetes 16S rRNA genes as markers to determine the origin of faecal pollution in Atlantic Rim countries of the European Union. Water Research, 41, 3780-3784. Gourmelon, M., Caprais, M.P. Segura, R. Le Mennec, C. Lozach, S. Piriou, J.Y. and Rince, A. 2007. Evaluation of two library-independent microbial source-tracking methods to identify sources of fecal contamination in French estuaries. Applied Environmental Microbiology, 73, 4857-4866. Hamilton, M.J., Yan, T. and Sadowsky, M.J. 2006. Development of goose- and duck-specific DNA markers to determine sources of Escherichia coli in waterways. Applied Environmental Microbiology, 72, 4012-4019. Iyengar, V., Albaugh, G.P., Lohani, A. and Nair, P.P. 1991. Human stools as a source of viable colonic epithelial cells. Federation of American Societies for Experimental Biology Journal5,2856-2859. Kuntz, R.L., Hartel, P.G., Rodgers, K. and Segars, W.I. 2004. Presence of Enterococcus faecalis in broiler litter and wild bird feces for bacterial source-tracking. Water Research, 38, 3551-3557. Lee, D-Y., Shannon, K., Beaudette, L.A. 2006. Detection of bacterial pathogens in municipal wastewater using an oligonucleotide microarray and real-time quantitative PCR. Journal of Microbiological Methods, 65, 453-467. Poyart, C., Quesnes, G. and Trieu-Cuot, P. 2000. Sequencing the gene encoding manganese-dependent superoxide dismutase for rapid species identification of Enterococci. Journal of Clinical Microbiology, 38, 415-418. Satoh, M. and Kuroiwa, T. 1991. Organization of multiple nucleoids and DNA molecules in mitochondria of a human cell. Experimental Cell Research. 196, 137-140. Yan, T., Hamilton, M.J. and Sadowsky, M.J. 2007. High-throughput and quantitative procedure for determining sources of Escherichia coli in waterways by using host-specific DNA marker genes. Applied Environmental Microbiology, 73, 890-896.

Science report: Microbial Source-Tracking project
25
Appendix 1: Amplification and detection of DNA from environmental samples Nearly every technique used in the microbial source-tracking project involves analysing a DNA sequence which can provide information on the original host animal group. We can look for specific DNA sequences using a variety of approaches, but we have to balance these approaches against laboratory requirements for a reliable, routine service with acceptable turn-around times. At present, we are not looking for RNA. As a general rule, the sequences we look for are present in small numbers. In order to find them, we copy them until there are very large numbers which are easy to work with. To copy them, we need a clean DNA preparation and an appropriate copying system – in this case the polymerase chain reaction or PCR.
A1.1 DNA extraction The samples arrive in the lab as one-litre volumes in a bottle. We pass the water through a 0.45 um pore size filter, which retains the bacteria of interest, and also other intact cells. It does not retain viruses or “free” DNA molecules (unless they are attached to a particle, in which case they could be retained). The filter is then stored frozen. A cell lysis buffer is added to the filter, and incubated. Most cells will be lysed by this procedure. We will never get every DNA molecule out of an environmental sample, and resistant cell types (e.g. many spores) will probably remain intact. However, the cells that contain the DNA of interest will lyse – bacterial and mammalian (and others algal, prokaryotes, shellfish flesh etc.) This has some implications for our procedures. The DNA from all lysed cells is now in suspension. The suspension is added to the top of a DNA extraction column (commercially produced by Qiagen), and spun in a centrifuge. The lysate passes through a matrix and into a collection tube. Under high salt concentrations (which exist in the lysis buffer), DNA will bind to the matrix. Thus, as the lysate is spun, the DNA sticks to the matrix and the remaining waste material can be discarded. We can then wash the matrix (with a high salt wash buffer and spinning) whilst the DNA remains bound. We then spin again in a low salt buffer, when the DNA comes off the matrix and through into a collection tube. This procedure is reasonably quick and suitable for processing a large number of samples in one day. If forced to, one person could process about 200 in one day (50 is comfortable). This can also be scaled up, though this is not yet tested. At this point, the DNA is present in a reasonably clean state, though we need to control for inhibition of the copying process. However, the column has a finite capacity to bind DNA. Therefore, if there is a lot of DNA in the lysate, some will be lost, as it cannot bind. This has

Science report: Microbial Source-Tracking project
26
clear implications for processing for example shellfish flesh, where although we can recover DNA, very little of it is bacterial DNA. In brief – the DNA extraction process is robust, but has some issues in carry-over of inhibitors and sensitivity when there are large amounts of non-target DNA present.
A1.2 Polymerase chain reaction (PCR) The copying process mimics the copying process used by cells, where chromosomes must be replicated before cell division. Kits for this are commercially available and contain an enzyme, a buffer optimised for the enzyme to work, and the nucleotide monomers which are joined together (by the polymerase enzyme) to make the DNA polymer (of a specific sequence determined by the sequence being copied). We need to supply other components, including the PCR primers. The enzyme copies single-stranded DNA, but requires a short section of double-stranded DNA to start from (primed). The PCR primers are key to ensuring we copy the correct, specific, sequence. Designing and working with these sequences is the most challenging technical aspect of the work, and also where a substantial part of our intellectual property lies. Another component we need to supply is a protein (bovine serum albumin; BSA). The DNA preparation kit allows some molecules through which bind to proteins. The enzyme used to copy the DNA is clearly a protein, and can be prevented from working if it is interacting with other molecules. Thus we add an alternative protein to the mix, so that inhibitors bind to the BSA, and reduce enzyme inhibition. The final component we supply is molecular biology-grade water (filtered, UV-treated and autoclaved). In common with all enzymatic reactions, the copying process (enzyme activity) is slow to start, becomes very active and then activity reduces as, for example, the enzyme wears out, or substrate/co-factors become more slow to reach the enzyme. This gives a classic ‘S’-shaped curve of enzyme activity/product formation over time. The initial work used this process until the reaction was complete with analysis of the end products. This gave a yes/no answer to a specific sequence present, but not any idea of quantity (Figure A1.1).
Figure A1.1: Agarose gel electrophoresis of pig mitochondrial DNA from a suspected pollution incident. M = DNA standard for size comparison. Lanes 1-3, environmental samples possibly containing pig waste. Lanes 4-6, laboratory blanks for samples 1-3. Lanes 7-12 are samples 1-6 with the addition of known pig DNA extracted from bacon.
Science report: Microbial Source-Tracking project
27
It was quickly clear that an idea of (relative) quantities of starting concentrations of sequence would be far more useful to inform decisions/environmental management. Thus, we now detect the production of specific products during the copying process as they are made, rather than at the end. More detail is given below, but essentially, the more common a sequence is within a DNA prep, the sooner it will be copied, and thus the sooner we can see it being copied. In brief – the standard DNA copying process is useful, but has the major limitation of giving presence/absence data only. A1.3 Quantitative-PCR Copying the DNA requires the PCR primers to direct the specificity and the direction of the enzyme as it works. Most DNA in our preps will be double-stranded (the default situation for most cellular DNA). In order to copy it, we melt the double-stranded DNA, by heating, so we have two single strands. The tube is then cooled and at an appropriate temperature, the primers anneal to their complementary sequence. An enzyme molecule then recognises a short section of double-stranded DNA in the midst of a long single-stranded DNA molecule, attaches and copies. It works along the single-stranded molecule, adding a complementary base to the base in the template DNA. When this occurs inside a living cell, the enzyme has a “check” feature, which makes sure the copying process is working correctly. It can detect and correct errors. If we add a third artificial DNA molecule, which can also bind to a complementary sequence within the target DNA, the enzyme will recognise that this is present, and will cut it up as it moves along the template strand to allow it to produce an accurate copy. This third DNA molecule could act like a primer, but does not do so as chemically, the ends of the molecule cannot accept new DNA bases. To differentiate it from the primers, it is called a probe. In fact, both ends of the probe are linked to a fluorescent dye. When the molecule is intact, the two fluorescent dyes are held quite close together. If light excites one of the dyes, the fluorescence energy it emits is absorbed by the other dye, and there is no overall fluorescence. However, if the enzyme recognises the presence of the probe, and thus cuts it up, the two fluorescent dyes are separated, and excitation light would result in a fluorescence signal. Fluorescence from the reaction mix can be monitored as the copying process occurs, that is, each time the process goes through the cycles of heat (to melt the DNA) and cooling (to allow the primers to bind and the enzyme to work). DNA copied from the first cycle can also be used as template for the next cycle, thus doubling the amount of target DNA in that tube. We use approximately 40 such cycles, with the copying process possibly able to double the amount of DNA each time. Measuring fluorescence at the end of each cycle shows how many new copies have been produced. We carry out this procedure in 96-well trays (12 columns of 8 rows). We also refer to standards, where we add a known number of target molecules into tubes, blanks to check for contamination, and spikes, where a known number of target molecules are added to the sample DNA. The type of data we get is shown in Figure A1.2.

Science report: Microbial Source-Tracking project
28
Figure A1.2: Example data output from a Q-PCR run. Part A: example plots of change in fluorescence with cycle number. Part B: format of a 96-well plate with samples identified by DNA prep number. Every third sample well (those in columns 3, 6, 9 and 12) is spiked with one million molecules of known DNA template. Standards refer to wells with a known number of target molecules. NTC refers to No Template Controls (blanks). Several of the DNA preps will also be laboratory blanks, where

Science report: Microbial Source-Tracking project
29
sterile buffers are passed through the apparatus, filtration, DNA extraction etc. The images can be enlarged to become more readable. The Q-PCR process outlined above is repeated for each marker. Quality control checks are performed (controlling for satisfactory amplification and for contamination). Ratios of each marker can then be calculated per unit volume. This enables relative quantification. Absolute numbers are also available, and have proven useful for determining, for example, whether the total signal from all Bacteroidetes can be explained by the specific markers, or whether we suspect a different source is also important. A very similar approach has been taken for the mitochondrial work, with Q-PCR probes also designed, and it is anticipated that this approach will be followed. Although we would have no information on numbers of mitochondrial DNA in UK waters, detecting them in this way has clear advantages in the laboratory work, being quicker, cheaper and minimising possible contamination of the laboratory environment. In brief – the Q-PCR copying process is currently the most useful, with the major advantages of quantification and suitability for acceptable laboratory process time
.

Science report: Microbial Source-Tracking project
30
Appendix 2: Methods for the detection of Bacteroidetes-specific sequences using Q-PCR This section contains further detail on the laboratory methods used in the microbial source-tracking project. It focuses primarily on the detection of Bacteroidetes, but some detail is also provided on methods used for standard PCR detection (such as for Enterococcus columbae). A2.1 Collection of environmental samples Water samples from bathing beaches and from freshwater tributaries were collected in one-litre sterile PET bottles by Environment Agency samplers, according to the standard operating procedure specified by the Environment Agency for bathing water sample collection. Samples were transported to the laboratory using the Environment Agency courier system. Samples were thus held between 2 and 6 °C during transport, and sample processing was started within 24 hours of collection. Samples from known sources were generally collected using Dacron swabs (Eurotubo, DeltaLab, Spain). Mouth swab samples from human volunteers and from dogs were collected from the cheek surface by passing the sterile swabs over the surface several times. Faecal swabs were obtained from faecal samples or from farm slurry by pushing the swab into the faecal material, twisting it several times, and replacing the swab (visibly discoloured) into the collection tube. Samples from identified bird species were obtained through several sources. Faecal swabs were obtained from various locations around the UK as described above. In such instances, the host bird identification relied upon the expertise of the Environment Agency Environment Officers taking the samples. Faecal material from starlings at Blackpool was obtained by placing a clean tarpaulin underneath known roosting areas. Once contaminated, individual faecal samples were collected by swabs from the tarpaulin. Faecal material from sea birds was collected by Mrs Elaine Tait, School of Geography and Geosciences, University of St. Andrews. Both faecal material and cloacal swabs from the same birds were provided by the British Trust for Ornithology (Thetford, UK). Faecal material from seals was provided by Professor Phil Hammond, Sea Mammal Research Unit. Both faecal material and fish tissue was obtained from specimens caught and identified by Mr Steve Wilde or Mr Kevin Rowse, an experienced amateur fisherman, Devon. A2.2 DNA extraction and purification Water sample bottles were shaken end over end to homogenise before cells were captured on 0.45 µm pore size cellulose acetate filters (Pall Gelman) using vacuum filtration. The volumes filtered were recorded by weighing the bottles before and after filtration. Up to one litre was processed through one or two filters (two filters being used for samples higher in particulates). DNA was extracted from the filters using the procedure described by Gourmelon et al. (2007) with the Qiagen DNeasy tissue kit. A separate DNA spin column was used for each filter. Purified DNA preparations from two columns were pooled before analysis. Once purified, DNA preparations were stored frozen (-20 ºC) until analysis. Note

Science report: Microbial Source-Tracking project
31
that this procedure is not designed to collect all DNA from a sample (absolute DNA extraction); rather, it aims to extract a representative portion of the DNA from a sample. No attempt was made to quantify DNA yield from swabs. Swabs were placed into 2.5 ml sterile microtubes before cutting the swab stem with flamed pliers. DNA was extracted from the swabs following the Qiagen DNeasy tissue kit instructions (Qiagen, Germany) for tissue. Briefly, 0.5 ml of ATL buffer and 40 µl Proteinase K were added to the tubes, followed by incubation at 55 ºC for one hour to promote lysis. The fluid was then pipetted onto the spin column for purification. Faecal material not on swabs, and fish gut tissue was processed in a similar fashion. Where appropriate, tissue wet weight was recorded. Purified DNA was eluted from each spin column in a 100 µl volume of AE buffer. When two spin columns were used for the same DNA sample, the purified DNA was pooled after elution. Preparations were stored at -20 ºC until required. A2.3 Primer and probe design for polymerase chain reaction (PCR) Partial or complete gene sequences of interest, in FASTA format, were identified and retrieved using string searches, or published accession numbers, from the European Bioinformatics Institute (EBI; part of the European Molecular Biology Laboratory [EMBL]) databases, available at http://www.ebi.ac.uk/. Ribosomal RNA gene sequences were also obtained from the Ribosomal Data Base Project (Release 9; http://rdp.cme.msu.edu/). Target sequences were aligned using the Clustal-W software (http://www.ebi.ac.uk/Tools/clustalw2/), using the default settings. Consensus sequences were produced using the Boxshade software (http://www.ch.embnet.org/software/BOX_form.html) with >50 % agreement required to determine a consensus position. Where possible, consensus sequences included sequences from type strains. Mitochondrial genome sequence alignments were produced locally using the CLC Workbench Sequence Viewer 4.6 (CLC Bio, Aarhus, Denmark; http://www.clcbio.com/). Clustal-W alignments were produced using maximum sensitivity. Consensus sequences were obtained from CLC Sequence Viewer, and exported in FASTA format where required. PCR primers for “standard” PCR were designed from alignments in several approaches. Manual design involved the examination of Boxshade outputs to identify areas of specificity for the target sequence. The design of primer pairs generally included design of an internal probe. Primers and probes were checked for suitability using a variety of parameters, including the DNA calculator software from Sigma Genosys (http://www.sigma-genosys.com/calc/DNACalc.asp). Secondary structures were also examined using the MFold software from Michael Zuker, available on the web at (http://www.bioinfo.rpi.edu/applications/hybrid/quikfold.php). Temperatures and buffer conditions were set according to the expected PCR cycling conditions. PCR primers and TaqMan probes were designed from specific or from consensus sequences, using the Primer 3 software (Applied Biosystems, Warrington, UK), using both primer/probe combinations as suggested by the software defaults, or manually. Primer and probe specificity and secondary structures were confirmed using Primer 3, and using MFold.

Science report: Microbial Source-Tracking project
32
A2.4 Polymerase chain reaction (PCR) Standard PCR was performed using the KOD Hot Start DNA polymerase (Novagen, Merck Biosciences, Germany). Primers were obtained from MWG Biotech (Germany). Typical reactions used 1.5 mM MgSO4, 0.2 mM each dNTP, 10 pmol each primer and 0.5 units enzyme. PCR cycling was performed using a PTC-200 DNA Engine (MJ Research, BioRad, UK). Typical PCR optimisation involved testing Mg2+ concentrations from 1 to 5 mM, and using a temperature gradient to empirically optimise DNA synthesis. PCR products were typically electrophoresed through 1.0% agarose gels at 8V/cm, in the presence of ethidium bromide (0.2 ng/ml). Gels were examined using UV light (GeneFlash, Syngene, UK). _____________________________________________________ Primer Sequence (5’-3’) Tm (ºC) _____________________________________________________ EcsodAF39 CATCACAACACTTACGTTACT 60 EcsodAR416 GTAAAGTACCTGTCGTTGGC 60 _____________________________________________________ Table A2.1. Primer sequences used for the specific detection of Enterococcus columbae superoxide dismutase gene. Expected amplicon size was 396 bp. Specific detection of Ent. columbae was achieved using primers designed in this project (Table A2.1). Specific detection and discrimination of Ent. columbae using the rpoB genes or 16S rRNA genes was not achieved. A2.5 Quantitative-PCR Each of the three Bacteroidetes markers was quantified using Q-PCR. The general and ruminant markers were analysed according to the AllBac assay described by Layton et al. (2006) and the ruminant-specific assay BacR described by Reischer et al. (2006) respectively. The human marker used a Q-PCR assay to detect the HF8 sequence of Bernhard and Field (2000b). The primer and probe sequences are currently subject to intellectual property considerations and are not published here. Q-PCR primer and probe combinations were designed from mitochondrial genome alignments for human, bird and dog assays. Again, the primer and probe sequences are currently subject to intellectual property considerations and are not published here. Each Q-PCR marker was assayed separately. A Stratagene MxPro 3005 instrument using 96-well plates was used for all Q-PCR assays. Universal Q-PCR master mix was obtained from Applied Biosystems (Warrington, UK). TaqMan probes with minor-groove binder non-fluorescent quenchers were obtained from Applied Biosystems, as were Q-PCR primers. Control oligonucleotides were obtained from VHBio (Gateshead, UK). A2.6 Q-PCR data analysis PCR controls included filtration blanks (passing 500 ml sterile quarter-strength Ringers solution through the filter apparatus at the end of each filter run; one blank per technical staff), no-template-controls and ten-fold dilutions of quantified target sequences. Amplification efficiencies were monitored for each 96-well tray, and rejected if efficiencies were outside the range 80-110 %. The regression line of the standards (prepared from

Science report: Microbial Source-Tracking project
33
duplicates covering the four-log range 107 to 104 molecules per µl) was accepted if the R-squared value was above 0.98. A separate aliquot of sample was spiked with 106 molecules of target oligonucleotide. Average values from duplicate wells were corrected for enzyme inhibition using the spiked samples, before any comparison of gene copy numbers.

We are The Environment Agency. It's our job to look afteryour environment and make it a better place – for you, andfor future generations.
Your environment is the air you breathe, the water you drinkand the ground you walk on. Working with business,Government and society as a whole, we are making yourenvironment cleaner and healthier.
The Environment Agency. Out there, making yourenvironment a better place.
Published by:
Environment AgencyRio HouseWaterside Drive, Aztec WestAlmondsbury, Bristol BS32 4UDTel: 0870 8506506Email: [email protected]
© Environment Agency
All rights reserved. This document may be reproduced withprior permission of the Environment Agency.