microbubbles for targeted drug delivery barriers using
TRANSCRIPT
Persistent link: http://hdl.handle.net/2345/bc-ir:104127
This work is posted on eScholarship@BC,Boston College University Libraries.
Boston College Electronic Thesis or Dissertation, 2014
Copyright is held by the author, with all rights reserved, unless otherwise noted.
Transient disruption of vascularbarriers using focused ultrasound andmicrobubbles for targeted drug deliveryin the brain
Author: Muna Aryal

Boston College
The Graduate School of Arts and Sciences
Department of Physics
Transient disruption of vascular barriers using
focused ultrasound and microbubbles for targeted
drug delivery in the brain
a dissertation by
MUNA ARYAL
submitted in partial fulfillment of the requirements
for the degree of
Doctor of Philosophy
December 2014

© copyright by Muna Aryal 2014
Transient disruption of vascular barriers using
focused ultrasound and microbubbles for targeted
drug delivery in the brain
By: Muna Aryal
Advisors: Prof. Nathan J. McDannold
and
Prof. Cyril P. Opeil, S. J.
Abstract
The physiology of the vasculature in the central nervous system (CNS) which
includes the blood–brain-barrier (BBB) and other factors, prevents the transport of
most anticancer agents to the brain and restricts delivery to infiltrating brain tumors.
The heterogeneous vascular permeability in tumor vessels (blood-tumor barrier; BTB),
along with several other factors, creates additional hurdles for drug treatment of brain
tumors. Different methods have been used to bypass the BBB/BTB, but they have
their own limitations such as being invasive, non-targeted or requiring the formulation

of new drugs. Magnetic Resonance Imaging guided Focused Ultrasound (MRIgFUS),
when combined with circulating microbubbles, is an emerging noninvasive method to
temporarily permeabilize the BBB and BTB. The purpose of this thesis was to use this
alternative approach to deliver chemotherapeutic agents through the BBB/BTB for
brain tumor treatment in a rodent model to overcome the hinderances encountered in
prior approaches tested for drug delivery in the CNS.
The results presented in thesis demonstrate that MRIgFUS can be used to
achieve consistent and reproducible BBB/BTB disruption in rats. It enabled us to
achieve clinically-relevant concentrations of doxorubicin (~ 4.8±0.5 µg/g) delivered
to the brain with the sonication parameters (0.69 MHz; 0.55 MPa; 10 ms bursts; 1 Hz
PRF; 60 s duration), microbubble concentration (Definity, 10 µl/kg), and liposomoal
doxorubicin (Lipo-DOX) dose (5.67 mg/kg) used. The resulting doxorubicin
concentration was reduced by 32% when the agent was injected 10 minute after the
last sonication. Three weekly sessions of FUS and Lipo-DOX appeared to be safe in
the rat brain, despite some minor tissue damage. Importantly, the severe neurotoxicity
seen in earlier works using other approaches does not appear to occur with delivery
via FUS-BBB disruption. The resuls from three weekly treatments of FUS and Lipo-
DOX in a rat glioma model are highly promising since they demonstrated that the
method significantly inhibits tumor growth and improves survival. Animals that
received three weekly sessions of FUS + Lipo-DOX (N = 8) had a median survival
time that was increased significantly (P<0.001) compared to animals who received
Lipo-DOX only (N = 6), FUS only (N = 8), or no treatment (N = 7). Median survival
for animals that received FUS + Lipo-DOX was increased by 100% relative to
untreated controls, whereas animals who received Lipo-DOX alone had only a 16%
improvement. Animals who received only FUS showed no improvement. No tumor
cells were found in histology in 4/8 animals in the FUS + Lipo-DOX group, and only
a few tumor cells were detected in two animals. Tumor doxorubicin concentrations
increased monotonically (823±600, 1817±732 and 2432±448 ng/g) in the control
tumors at 9, 14 and 17 days respectively after administration of Lipo-DOX. With
FUS-induced BTB disruption, the doxorubicin concentrations were enhanced
significantly (P<0.05, P<0.01, and P<0.0001 at days 9, 14, and 17, respectively) and
were greater than the control tumors by a factor of two or more (2222±784, 3687±796
and 5658±821 ng/g) regardless of the stage of tumor growth. The transfer coefficient
Ktrans was significantly (p<0.05) enhanced compared to control tumors only at day 9
but not at day 14 or 17. These results suggest that FUS-induced enhancements in
tumor drug delivery for Lipo-DOX are relatively consistent over time, at least in this

tumor model. These results are encouraging for the use of large drug carriers, as they
suggest that even large/late-stage tumors can benefit from FUS-induced drug
enhancement. Corresponding enhancements in Ktrans were found variable in large/late-
stage tumors and not significantly different than controls, perhaps reflecting the size
mismatch between the liposomal drug (~100 nm) and Gd-DTPA (molecular weight:
938 Da). Overall, this thesis research provides pre-clinical data toward the
development of MRIgFUS as a noninvasive method for the delivery of agents such as
Lipo-DOX across the BBB/BTB to treat patients with diseases of the central nervous
system.
i
Acknowledgements
I would like to express my deep and sincere gratitude to my supervisor and
mentor, Prof. Nathan J. McDannold. His extraordinary supervision, encouragement,
guidance and support throughout my graduate studies enabled me to develop a deep
and comprehensive understanding of the subject matter and to succeed in the great
achievement of completing my dissertation. I would like to express my sincere thanks
to Rev. Cyril P. Opeil, S.J. for his great support and inspiration throughout this work.
I couldn’t have conducted my thesis without his constant support. I would like to
thank committee members Prof. Krzysztof Kempa and Prof. Stephen Wilson for
reviewing this dissertation.
Many thanks go to Prof. Micheal J. Naughton and Prof. Rein Uritam for
allowing me doing research of my interest off-campus without any discontinuity of
mental or financial support. I also extend my thanks to all the faculty members, staff
members and graduate students of the physics department at Boston College. It has
been my great luck and an honor to be a member of Focused Ultrasound Laboratory at
Brigham and Women's Hospital, Harvard Medical School. I am particularly obliged to
Dr. Chang-Sheng Mei for his cordial support and for introducing me to Prof. Nathan J.
ii
McDannold. It would have been difficult for me to complete this thesis work without
the skilled hands and efforts of Dr. Natalia Vykhodtseva and the members of the
laboratory. I am particularly grateful to Dr. Yong-Zhi Zhang and Mrs. Chanikarn
"Yui" Power for their immense help and training for the animal experiments. I am
grateful to all the current and former members especially Dr. Juyoung Park, Dr. Eun
Joo Park, Dr. Costas Arvanitis, Phillip Alexander, and Keiko Fujiwara.
I owe my loving thanks to my husband Dr. Binod Rizal, daughter Bina and
brothers- Rajendra and Harishchandra Aryal for their love and support. I will always
be indebted to my parents and parents-in-law for keeping me in their thoughts and
prayers to god and of their wishes for success and joy in my life. I dedicate this
dissertation to them.

iii
Table of Contents
Acknowledgements .......................................................................................................i
Table of Contents ....................................................................................................... iii
List of Figures........................................................................................................... viii
List of Tables ................................................................................................................x
Chapter 1: Introduction ..............................................................................................1
1.1Motivation.................................................................................................................1
1.2 The Blood-Brain Barrier ..........................................................................................1
1.3 The Blood Tumor Barrier ........................................................................................3
1.4 Methods for Drug Delivery in the Brain.................................................................4
1.4.1 Invasive Approaches to Brain Drug Delivery....................................................4
1.4.2 Transvascular Brain Drug Therapy: Biopharmaceutical Approaches ...............5
1.4.3 Transvascular Brain Drug Therapy BBB Disruption.........................................8
1.5 Ultrasound..........................................................................................................9
1.5.1 Focused Ultrasound .........................................................................................11
1.5.2 Application.......................................................................................................13
1.6 Ultrasound and Microbubble ...........................................................................15
1.6.1 Linear Bubble Vibration ..................................................................................15
1.6.2 Nonlinear Bubble Vibration.............................................................................19
1.6.3 Coated Bubble Vibration .................................................................................20
1.7 Acoustic Characterization................................................................................21
1.8 Application in the Brain...................................................................................22
1.8.1 Ultrasound-Induced BBB Disruption ..............................................................23
1.8.2 Effect of Ultrasound Parameters and Other Factors on BBB Disruption ...........25
1.8.3 Optimal Parameters for BBBD ........................................................................29
1.8.4 Potential Mechanisms ......................................................................................30
1.8.5 Bioeffects Induced by FUS and Microbubbles................................................32
iv
1.8.6 Delivery of Imaging/Therapeutic Agents and Tests in Animal Disease Models 37
1.8.6.1 Delivery of Imaging Tracers............................................................................37
1.8.6.2 Delivery of Therapeutics..................................................................................40
1.8.6.3 Disease Models ................................................................................................41
1.8.7 Treatment Planning, Monitoring and Evaluation.............................................45
1.8.7.1 Treatment Planning..........................................................................................45
1.8.7.2 Treatment Monitoring and Control..................................................................48
1.8.7.2.1 Acoustic Emission ........................................................................................49
1.8.7.3 Treatment Evaluation.......................................................................................51
1.9 Dynamic Contrast Enhanced Magnetic Resonance Imaging...........................53
1.9.1 Pharmacokinetic Analysis of DCE-MRI .........................................................53
1.9.1.1 Tofts and Kermode (TK) Model ......................................................................53
1.10 Magnetic Resonance Imaging..........................................................................56
1.10.1 Basic Principles of MRI...................................................................................56
1.10.2 MRI Sequences ................................................................................................59
1.11 Doxorubicin .....................................................................................................61
1.12 Scope of this Thesis .........................................................................................63
Chapter 2: Methods and Materials ..........................................................................66
2.1. Animals ............................................................................................................66
2.2 Ultrasound Transducer.....................................................................................67
2.1.2.2 Transducer Characterization ............................................................................68
2.1.2.3 Transducer Calibration.....................................................................................69
2.1.2.4 Estimated Pressure Amplitude in the Brain .....................................................71
2.3 Experimental Set-up.........................................................................................71
2.4 Magnetic Resonance Imaging..........................................................................72
2.5 Fluorometry......................................................................................................74
2.6 Targeted Doxorubicin Delivery through Blood Brain and Blood Tumor Barrier using Transcranial MRI-guided Focused Ultrasound ..................................................75
v
2.6.1 Sonications.......................................................................................................76
2.6.2 Chemotherapy ..................................................................................................77
2.6.3 Effect of Drug Injection Protocol on Doxorubicin Delivery to the Brain .......78
2.6.3.1 Fluorometric Assay..........................................................................................79
2.6.3.2 Extraction and Quantification of Doxorubicin ................................................80
2.6.3.3 Statistical Analysis...........................................................................................80
2.6.4 Fluorescence Imaging ......................................................................................81
2.6.4.1 Tissue Preparation............................................................................................81
2.7 Multiple Sessions of Liposomal Doxorubicin and Ultrasound-Mediated Blood-Brain Barrier Disruption: A Safety Study in the Rat Brain .........................................82
2.7.1 Study Design....................................................................................................82
2.7.2 Magnetic Resonance Imaging..........................................................................83
2.7.3 Histology..........................................................................................................84
2.8 Multiple Treatments with Liposomal Doxorubicin and Ultrasound-Induced Disruption of Blood-Tumor and Blood-Brain Barriers Improve Outcomes in a Rat Glioma Model ..............................................................................................................84
2.8.1 Cell Culture......................................................................................................85
2.8.2 Tumor Implantation .........................................................................................85
2.8.3 Study Design....................................................................................................86
2.8.4 Sonication ........................................................................................................87
2.8.5 Chemotherapy ..................................................................................................88
2.8.6 Magnetic Resonance Imaging..........................................................................88
2.8.7 Image Analysis.................................................................................................89
2.8.8 Histology..........................................................................................................89
2.8.9 Statistical Analysis...........................................................................................90
2.9 Enhancement in Blood-Tumor Barrier Permeability and Delivery of Liposomal Doxorubicin using Focused Ultrasound and Microbubbles: Evaluation during Tumor Progression in a Rat Glioma Model .....................................................90
2.9.1 Bilateral Tumor Implantation ..........................................................................91
2.9.2 Study Design....................................................................................................91
2.9.3 Magnetic Resonance Imaging..........................................................................92

vi
2.9.4 Fluorometric Assay and Doxorubicin Extraction ............................................93
2.9.5 Data Analysis ...................................................................................................94
2.9.6 Statistical Analysis...........................................................................................95
2.9.7 Histology..........................................................................................................95
2.9.5 Acoustic Emission ...........................................................................................96
Chapter 3:Targeted Lipo-DOX Delivery through Blood-Brain and Blood-Tumor Barriers using Transcranial MRI-Guided Focused Ultrasound ...........................97
3.1 Results..............................................................................................................97
3.1.1 Permeabilization of BBB/BTB ........................................................................97
3.1.2 Effect of Lipo-DOX Injection Protocol on doxorubicin Delivery to the Brain 98
3.1.3 Fluorescence Imaging ....................................................................................100
3.2 Discussion......................................................................................................103
Chapter 4:Multiple Sessions of Focused Ultrasound Blood-Brain Barrier Disruption to Enhance Delivery of Liposomal Doxorubicin: A Safety Study....106
4.1 Results............................................................................................................107
4.1.1 BBB Permeabilization ...................................................................................107
4.1.2 Histological Findings .....................................................................................109
4.2 Discussion......................................................................................................112
Chapter 5: Multiple Treatments with Liposomal Doxorubicin and Ultrasound-Induced Disruption of Blood–Tumor and Blood–Brain Barriers Improve Outcomes in a Rat Glioma Model ..........................................................................117
5.1 Results............................................................................................................117
5.1.1 BBB/BTB Permeabilization...........................................................................117
5.1.2 Tumor progression ............................................................................................120
5.1.3 Histological Findings .....................................................................................124
5.1.4 Survival Analysis ...........................................................................................130
5.2 Discussion......................................................................................................131
Chapter 6: Enhancement in Blood-Tumor Barrier Permeability and Delivery of Liposomal Doxorubicin using Focused Ultrasound and Microbubbles: Evaluation during Tumor Progression in a Rat Glioma Model ..........................138
6.1 Results............................................................................................................140
vii
6.1.1 Bilateral Tumor Progression and BBB/BTB Disruption ...............................140
6.1.2 Doxorubicin Concentration and Kinetics of BBB/BTB Permeability Changes 142
6.1.3 Histological findings......................................................................................147
6.2 Discussion......................................................................................................149
6.3 Acoustics Emission........................................................................................152
6.3.1 Acoustic Emissions vs. MRI..........................................................................153
6.3.2 Discussion......................................................................................................155
Chapter 7:Conclusions and Future Work....................................................................................................................................156
7.1 Conclusions....................................................................................................156
7.2 Future work....................................................................................................162
References.................................................................................................................166
Appendix......................................................................................................... 186-1867
viii
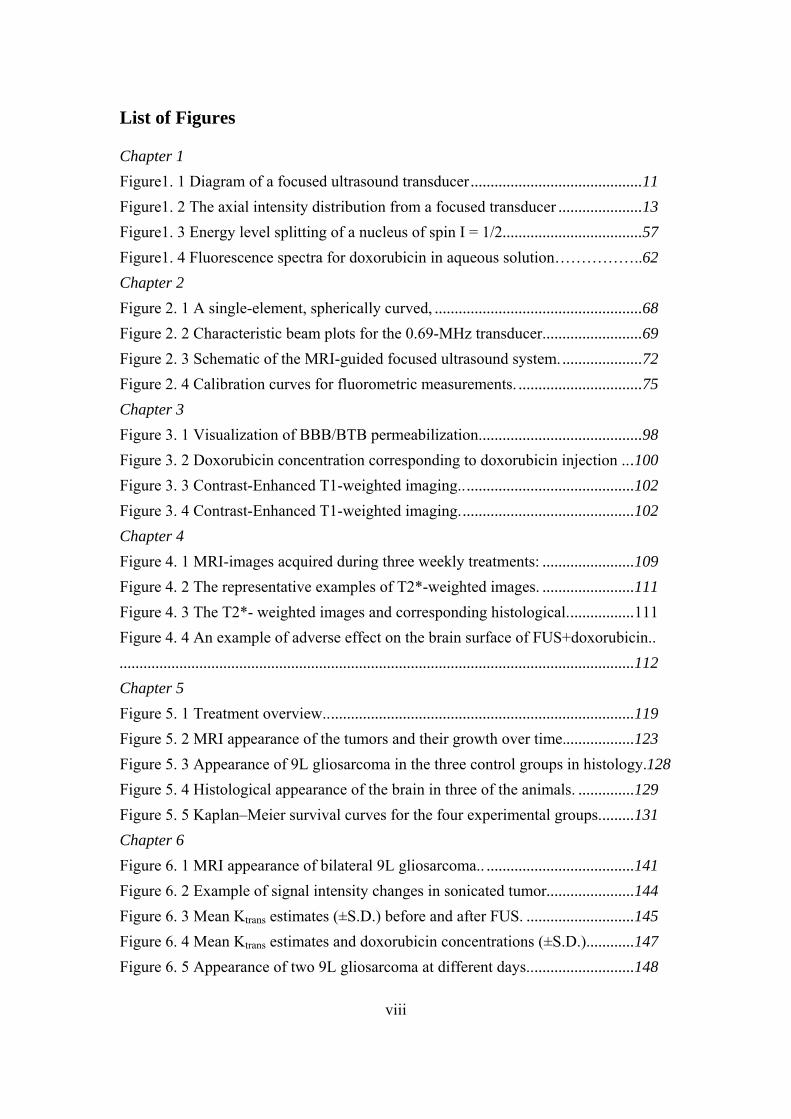
List of Figures
Chapter 1
Figure1. 1 Diagram of a focused ultrasound transducer ...........................................11
Figure1. 2 The axial intensity distribution from a focused transducer .....................13
Figure1. 3 Energy level splitting of a nucleus of spin I = 1/2...................................57
Figure1. 4 Fluorescence spectra for doxorubicin in aqueous solution……………..62
Chapter 2
Figure 2. 1 A single-element, spherically curved, ....................................................68
Figure 2. 2 Characteristic beam plots for the 0.69-MHz transducer.........................69
Figure 2. 3 Schematic of the MRI-guided focused ultrasound system. ....................72
Figure 2. 4 Calibration curves for fluorometric measurements. ...............................75
Chapter 3
Figure 3. 1 Visualization of BBB/BTB permeabilization.........................................98
Figure 3. 2 Doxorubicin concentration corresponding to doxorubicin injection ...100
Figure 3. 3 Contrast-Enhanced T1-weighted imaging.. ..........................................102
Figure 3. 4 Contrast-Enhanced T1-weighted imaging. ...........................................102
Chapter 4
Figure 4. 1 MRI-images acquired during three weekly treatments: .......................109
Figure 4. 2 The representative examples of T2*-weighted images. .......................111
Figure 4. 3 The T2*- weighted images and corresponding histological.................111
Figure 4. 4 An example of adverse effect on the brain surface of FUS+doxorubicin..
.................................................................................................................................112
Chapter 5
Figure 5. 1 Treatment overview..............................................................................119
Figure 5. 2 MRI appearance of the tumors and their growth over time..................123
Figure 5. 3 Appearance of 9L gliosarcoma in the three control groups in histology.128
Figure 5. 4 Histological appearance of the brain in three of the animals. ..............129
Figure 5. 5 Kaplan–Meier survival curves for the four experimental groups.........131
Chapter 6
Figure 6. 1 MRI appearance of bilateral 9L gliosarcoma.. .....................................141
Figure 6. 2 Example of signal intensity changes in sonicated tumor......................144
Figure 6. 3 Mean Ktrans estimates (±S.D.) before and after FUS. ...........................145
Figure 6. 4 Mean Ktrans estimates and doxorubicin concentrations (±S.D.)............147
Figure 6. 5 Appearance of two 9L gliosarcoma at different days...........................148

ix
Figure 6. 6A-B Acoustic emissions during tumor sonication and MRI. ................154

x
List of Tables
Chapter 1
Table1. 1 Different methods investigated to get around the BBB...............................9
Table1. 2 Reported effects of different parameters on BBB disruption via FUS. ....28
Table1. 3 Example different tracers that have been delivered across the BBB ........39
Table1. 4 Example therapeutic agents that have been delivered across the BBB ....44
Chapter 2
Table 2. 1 Acoustic efficiency of air-backed single-element transducer..................70
Chapter 3
Table 5. 1 Outcomes in FUS+doxorubicin group...................................................124
Table 5. 2 Survival analysis ....................................................................................131
1
Chapter 1: Introduction
1.1 Motivation
Since the time immemorial there researchers have pondered over the vast
empire of the brain. The central nervous system (CNS) has remained a focus of
research and continued to hold some of the greatest mysteries in science and in
medicine because it is challenging to utilize most drugs due to the presence of
vascular barriers that prevent their delivery. For the treatment of brain-borne ailments
in general, and tumors in particular, several techniques have been investigated to
overcome these barriers, and new innovations are yet in process. In these other
techniques, there have been significant shortcomings, such as invasiveness, non-
targetedness, or the requirement and expense of new drug formulation. The central
inclination of this dissertation was to study an alternative approach with the potential
to overcome the hinderances encountered in these other techniques to deliver a
chemotherapeutic agent across the blood-brain barrier (BBB) and the blood-tumor
barrier (BTB) for brain tumor treatments in a rodent model..
1.2 The Blood-Brain Barrier
The blood-brain barrier (BBB) is a specialized non-permeable barrier in

2
cerebral microvessels consisting of endothelial cells connected together by tight
junctions, a thick basement membrane, and astrocytic endfeet. The tight junctions
between the endothelial cells, together with an ensemble of enzymes, receptors,
transporters, and efflux pumps of the multidrug resistance (MDR) pathways, control
and limit access of molecules in the vascular compartment to the brain by paracellular
or transcellular pathways [1]. The BBB normally protects the brain from toxins and
helps to maintain the delicate homeostasis of the neuronal microenvironment.
However, it also excludes 98% of all small-molecule drugs and approximately 100%
of large-molecule neurotherapeutics from reaching the brain parenchyma [2,3]. Only
small-molecule drugs with high lipid solubility and a molecular mass under 400-500
Daltons (Da) can cross the BBB in pharmacologically significant amounts, resulting
in effective treatments for only a few diseases such as depression, affective disorders,
chronic pain, and epilepsy. Given the paucity of small-molecule drugs that have been
shown to be effective for the majority of CNS disorders, it is clear that the BBB is a
primary limitations for the development and use of drugs in the brain. Overcoming
this hindrance could mean potential therapies for a wide range of disorders, including
Alzheimer’s and Huntington’s disease, amytrophic lateral sclerosis (ALS), neuro-
AIDS, stroke, brain or spinal cord trauma, autism, lysosomal storage disorders, fragile
3
X syndrome, inherited ataxias, and blindness.
1.3 The Blood Tumor Barrier
Tumors of the brain, also face challenges for effective drug delivery. While
the blood vessels of primary and metastatic brain tumors are often somewhat
permeable from the lack of a fully formed BBB, infiltrating cancer cells at the tumor
margins and small metastatic seeds may be protected by the BBB of the surrounding
normal tissue [4]. Glioblastomas in particular, are highly infiltrative, and commonly
recurring after localized treatments such as conformal radiotherapy or surgery.
Relapse usually occurs within a few centimeters of the treatment site [5–7].
Furthermore, their vasculature permeability is heterogeneous, and additional barriers
to drug delivery include increased interstitial pressures [8] and drug efflux pumps
that contribute to their multidrug resistance phenotype [9]. As for metastatic tumors,
work in mice suggests that the BTB is only partially compromised in breast
adenocarcinoma brain metastases, and that toxic concentrations of chemotherapy
agents are only achieved in a small subset of tumors that are highly permeable [10].
Also, systemic drug accumulation in brain metastases can be substantially less than in
extracranial metastases [10]. Thus, the BTB is a hindrance of effective drug delivery
in addition to the BBB.
4
1.4 Methods for Drug Delivery in the Brain
In order to overcome these limitations, it is necessary to either bypass these
vascular barriers altogether, or to facilitate passage across it via controlled
exploitation of endogenous transport mechanisms. Different methods have been
explored to bypass the BBB (or the BTB) (Table 1.1) [11–13]. While these methods
are promising, they also have limitations.
1.4.1 Invasive Approaches to Brain Drug Delivery
High local drug concentrations can be achieved by inserting a needle or
catheter into the brain and directly injecting or infusing drugs or by implanting drug-
exuding devices. With such techniques, therapeutic benefits have been shown for
brain tumors and other disorders [14–17]. Because of their invasiveness, there are
some risks of infection or brain trauma, and they may not be amenable for repeated
treatments or for drug delivery to large areas of the brain. It can also a challenge to
control the drug distribution, as drug concentrations decrease exponentially from the
injection or implantation site [18]. When convection-enhanced diffusion is used, the
infused agents are delivered preferentially along white matter tracts [19], which may
not be desirable.

5
Another approach for bypassing the BBB is to introduce drugs into the
cerebrospinal fluid (CSF) via intrathecal or intraventricular routes. It then follows the
flow patterns of the CSF and enters the brain parenchyma via diffusion. This approach
has been successful in cases where the target is in the subarachnoid space [20], but
drug diffusion drops off exponentially from the brain surface and penetration into the
brain parenchyma can be limited [11]. It is also possible to deliver drugs transnasally
from the submucus space into the olfactory CSF [21–24]. This approach has
advantages of being noninvasive and being relatively easy to administer. However,
only small drug volumes can be delivered and interindividual variability and other
factors may pose challenges to this procedure [24]. Nevertheless, the technique is a
promising route to bypass the BBB and is currently being investigated by numerous
researchers.
1.4.2 Transvascular Brain Drug Therapy: Biopharmaceutical
Approaches
A number of approaches have been investigated to develop drugs that can
cross the BBB or to modify or encapsulate existing drugs so they can. While these
methods are highly promising and offer the ability to easily administer drugs to the

6
CNS as in other organs, they do require the expense and time of developing new
agents, and they result in drugs being delivered to the entire brain, which may not
always be desirable. Converting water-soluble molecules that would not ordinarily
cross the BBB into lipid-soluble ones is one approach to brain drug therapy. This can
be achieved by the addition of lipid groups, or functional groups such as acetate to
block hydrogen bonding. The molecule would then undergo passive diffusion across
the BBB. An example of this is the conversion of morphine to heroine by the
acetylation of two hydroxyl groups, which results in the removal of the molecule from
hydrogen bonding with its aqueous environment [25]. Although utilized by the
pharmaceutical industry, this approach has limited applicability to drugs greater than
400-450 Da [26,27] .
Another approach involves utilizing the large variety of solute carrier proteins
(SLC) on the endothelial surface that specifically transport many essential polar and
charged nutrients such as glucose, amino acids, vitamins, small peptides, and
hormones transcellularly across the BBB [28]. These transporters move the solute
into the cytoplasm where they await another SLC at the opposite cell membrane to
exocytose them into the brain parenchyma. An example of an SLC used for brain drug

7
therapy is the large neutral amino acid transporter type 1 (LAT1), which transports the
amino acid Parkinson’s drug L-dopa across the BBB. Once across, it is converted to
dopamine by aromatic amino acid decarboxylase, and can then bind to its target
receptor. Dopamine being water-soluble cannot cross the BBB [26,29].
Finally, the molecular targeting of endothelial-surface receptors, colloquially
termed the “Trojan Horse” approach, is yet another paradigm in drug transport across
the BBB. This involves using a targeting ligand such as a serum protein, monoclonal
antibody, or other high affinity targeting molecule that binds to its receptor and
activates endocytosis of the complex into a vesicle that is transported across to, and
released from the opposite pole (i.e., transcytosis). In theory, if the ligand is
chemically linked to a drug or drug carrier, it too is transported across the BBB. Over
the last two decades, a number of animal studies have suggested the transport of
antineoplastic drugs, fusion proteins, genetic therapies (plasmid vectors, siRNA),
liposomes, and nanoparticles by this mechanism [30–33] . For transcytosis to occur,
it requires that the endosome not fuse with lysosomes while in the cytoplasm, which
would degrade the internalized macromolecules. Unlike other tissues, endothelial
cells in brain capillaries appear to have low levels of endosome fusion with lysosomes,

8
facilitating transport of necessary substances through the transcellular route [34–36].
1.4.3 Transvascular Brain Drug Therapy BBB Disruption
Others have investigated methods to temporarily disrupt the BBB to enable
CNS delivery of circulating agents. One such technique investigated intensively for
several decades is the use of intraarterial injection of a hyperosmotic solutions such as
mannitol. This causes shrinkage of the endothelial cells and consequent stretching of
the tight junctions [37–40], through which drug may pass. This method has been
shown repeatedly to enhance delivery of therapeutic agents to brain tumors, and
several promising clinical trials have been performed [41–46] . Other agents, such as
bradykinin, have also been investigated [47–50]. While such methods can be an
effective means to deliver drugs to large brain regions, they are invasive procedures
that require general anesthesia, and can have side effects. For example, one study
reported focal seizures in 5% of osmotic BBB disruption [41], and others have noted
vasovagal response with bradycardia and hypotension [40]. As I describe below, to
overcome limitations of invasive and biopharmaceutical approaches of brain drug
delivery, focused ultrasound (FUS) combined with circulating microbubbles has been
investigated by numerous researchers.
9
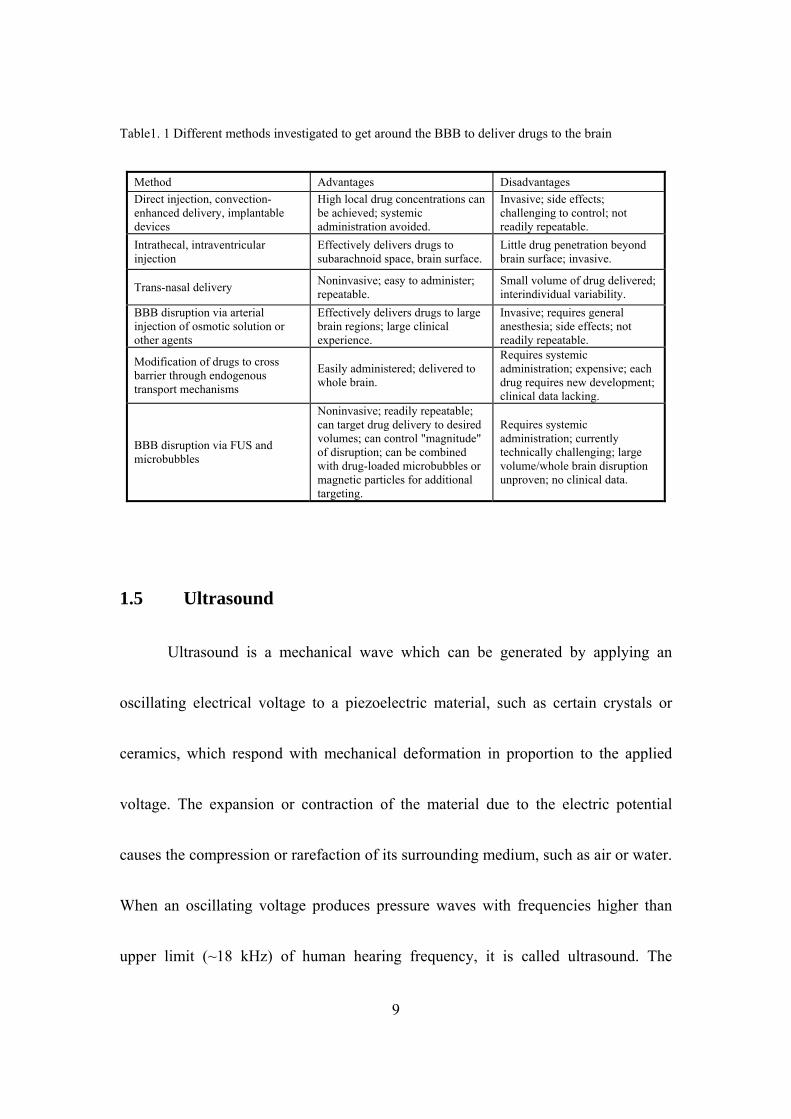
Table1. 1 Different methods investigated to get around the BBB to deliver drugs to the brain
Method Advantages Disadvantages
Direct injection, convection-enhanced delivery, implantable devices
High local drug concentrations can be achieved; systemic administration avoided.
Invasive; side effects; challenging to control; not readily repeatable.
Intrathecal, intraventricular injection
Effectively delivers drugs to subarachnoid space, brain surface.
Little drug penetration beyond brain surface; invasive.
Trans-nasal delivery Noninvasive; easy to administer; repeatable.
Small volume of drug delivered; interindividual variability.
BBB disruption via arterial injection of osmotic solution or other agents
Effectively delivers drugs to large brain regions; large clinical experience.
Invasive; requires general anesthesia; side effects; not readily repeatable.
Modification of drugs to cross barrier through endogenous transport mechanisms
Easily administered; delivered to whole brain.
Requires systemic administration; expensive; each drug requires new development; clinical data lacking.
BBB disruption via FUS and microbubbles
Noninvasive; readily repeatable; can target drug delivery to desired volumes; can control "magnitude" of disruption; can be combined with drug-loaded microbubbles or magnetic particles for additional targeting.
Requires systemic administration; currently technically challenging; large volume/whole brain disruption unproven; no clinical data.
1.5 Ultrasound
Ultrasound is a mechanical wave which can be generated by applying an
oscillating electrical voltage to a piezoelectric material, such as certain crystals or
ceramics, which respond with mechanical deformation in proportion to the applied
voltage. The expansion or contraction of the material due to the electric potential
causes the compression or rarefaction of its surrounding medium, such as air or water.
When an oscillating voltage produces pressure waves with frequencies higher than
upper limit (~18 kHz) of human hearing frequency, it is called ultrasound. The
piezoelectric effect also works in reverse: mechanical stress can conversely induce an
electric voltage across the material. Thus piezoelectric transducers can be used both to
generate and receive ultrasonic signals. In medical ultrasound, these frequencies
typically range between 200 kHz and 10 MHz. The wavelength λ of the ultrasound is
determined by the frequency f
fc / 1. 1
where c is the speed of sound in the tissue. Typically sound velocity in soft
tissue is c ≈ 1540 m/s. In soft tissues, this wave is primarily longitudinal, but shear
waves can be generated under some circumstances, such as at soft tissue-bone
interfaces.
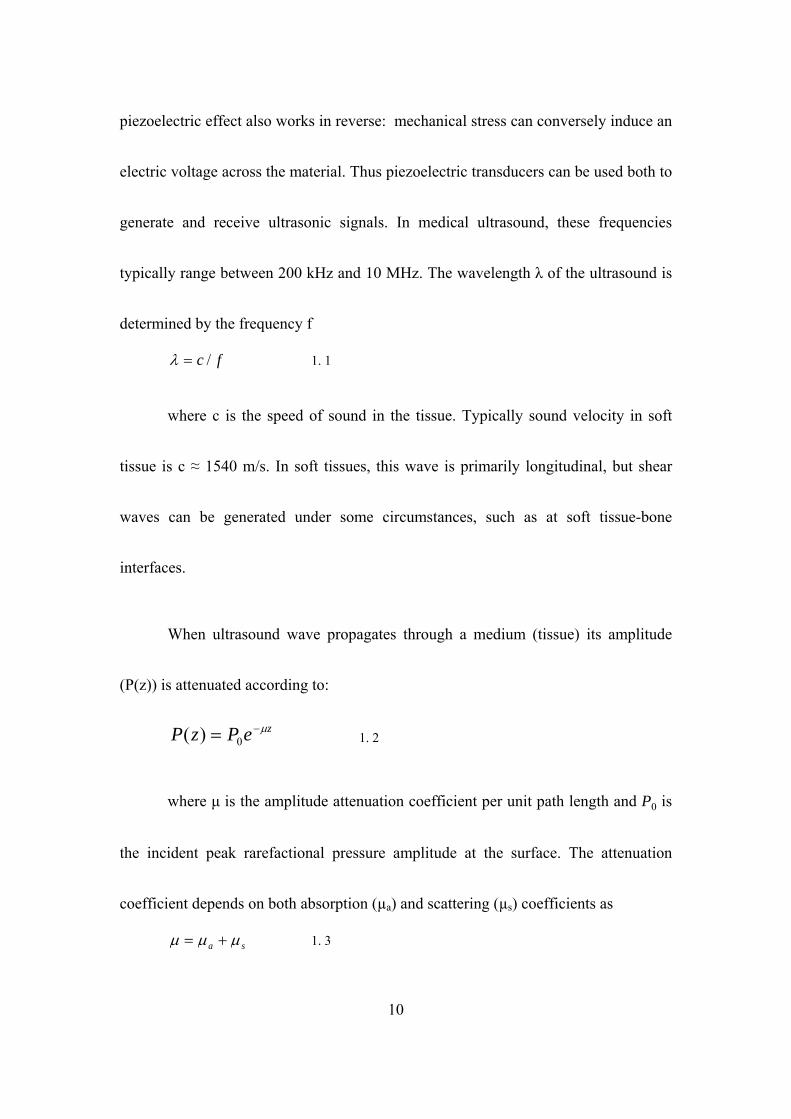
When ultrasound wave propagates through a medium (tissue) its amplitude
(P(z)) is attenuated according to:
1. 2 zePzP 0)(
where μ is the amplitude attenuation coefficient per unit path length and P0 is
the incident peak rarefactional pressure amplitude at the surface. The attenuation
coefficient depends on both absorption (µa) and scattering (µs) coefficients as
sa 1. 3
10

Both the absorption and scattering of ultrasound energy can produce heating in
the medium [51]. Ultrasound has a relatively low absorption rate in soft tissue,
enabling it to propagate into even deep tissue strucutres. For example ultrasound with
1.0 MHz, having an approximate wavelength of 1.5 mm, can penetrate up to 10
cm [52].
1.5.1 Focused Ultrasound
Focused ultrasound is an application of ultrasound in which the wave energy is
concentrated to provide high gains and localized energy deposition. Ultrasound can be
focused using a curved transducer geometry, a lens or reflector, or via electronic
focusing. A diagram of a single element spherically curved transducer is as shown in
Figure1. 1
11
Figure1. 1 Diagram of a focused ultrasound transducer
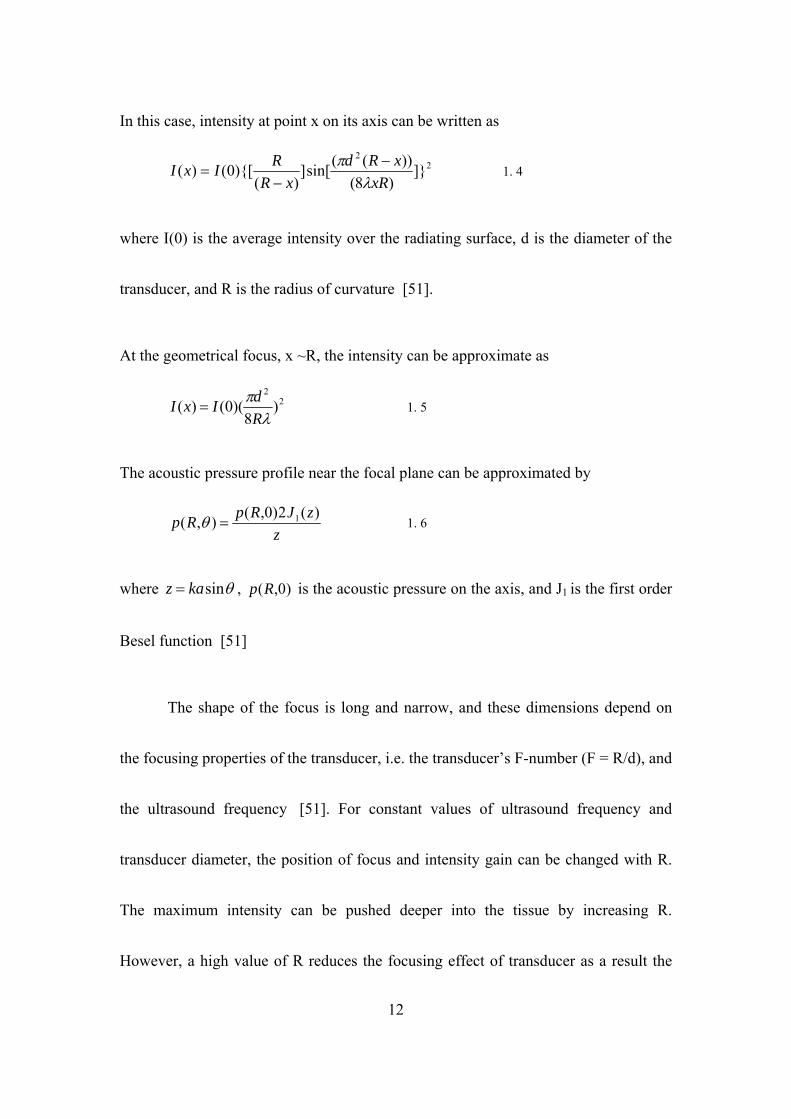
In this case, intensity at point x on its axis can be written as
22
]})8(
))((sin[]
)(){[0()(
xR
xRd
xR
RIxI
1. 4
where I(0) is the average intensity over the radiating surface, d is the diameter of the
transducer, and R is the radius of curvature [51].
At the geometrical focus, x ~R, the intensity can be approximate as
22
)8
)(0()(
R
dIxI 1. 5
The acoustic pressure profile near the focal plane can be approximated by
z
zJRpRp
)(2)0,(),( 1 1. 6
where sinkaz , is the acoustic pressure on the axis, and J1 is the first order
Besel function [51]
)0,(Rp
The shape of the focus is long and narrow, and these dimensions depend on
the focusing properties of the transducer, i.e. the transducer’s F-number (F = R/d), and
the ultrasound frequency [51]. For constant values of ultrasound frequency and
transducer diameter, the position of focus and intensity gain can be changed with R.
The maximum intensity can be pushed deeper into the tissue by increasing R.
However, a high value of R reduces the focusing effect of transducer as a result the
12

focal region becomes longer and peak intensity smaller. Finally, the value of intensity
becomes less than 1. Figure1. 2 shows the distribution of intensity along the axis of
focused transducer with fixed value of d and frequency for different value of R.
Moreover, the sharpness of the focus depends on the frequency. Ultrasound with
higher frequencies can achieve tighter foci, while lower frequencies can produce
wider focal regions.
Figure1. 2 The axial intensity distribution from a focused transducer (diameter 60mm, frequency
1MHz) for various values of radius of curvature calculated in tissue (attenuation 10 Npm-1).
1.5.2 Application
Ultrasound technology has been used for both diagnostic as well as therapeutic
13

14
applications. In diagnostic imaging, it is most notably used for fetal imaging and
echocardiography. Low acoustic pressures (< 0.5 MPa peak-rarefactional) and short
pulse lengths are used for this application. Typically, pulses are only a few cycles
long, but are rapidly emitted to acquire real-time images at a rate of 10 to 30 frames
per second. For current medical applications, diagnostic ultrasound is considered a
safe imaging device that is routinely used to diagnose disease. Therapeutic
applications of FUS can be achieved with both thermal and mechanical effects. For
thermal application, the induced temperature is raised high enough over a short period
of time (~ seconds) to cause cell death by protein denaturization and coagulative
necrosis (tissue ablation), while in hyperthermia, an induced temperature change of
only a few degrees for an extended period of time (~ minutes) can sensitize tissue to
radiation and chemotherapy.
In addition to thermal effects, it can induce mechanical effects in biological
tissue. In cavitation, the interaction of a gas bubble with the acoustic field, whether by
radial oscillation (stable cavitation) or violent collapse (inertial cavitation), can
significantly enhance absorption and heating effects in tissue [53]. Gas bubbles can
form spontaneously in tissue during exposure to high intensity FUS, or pre-formed
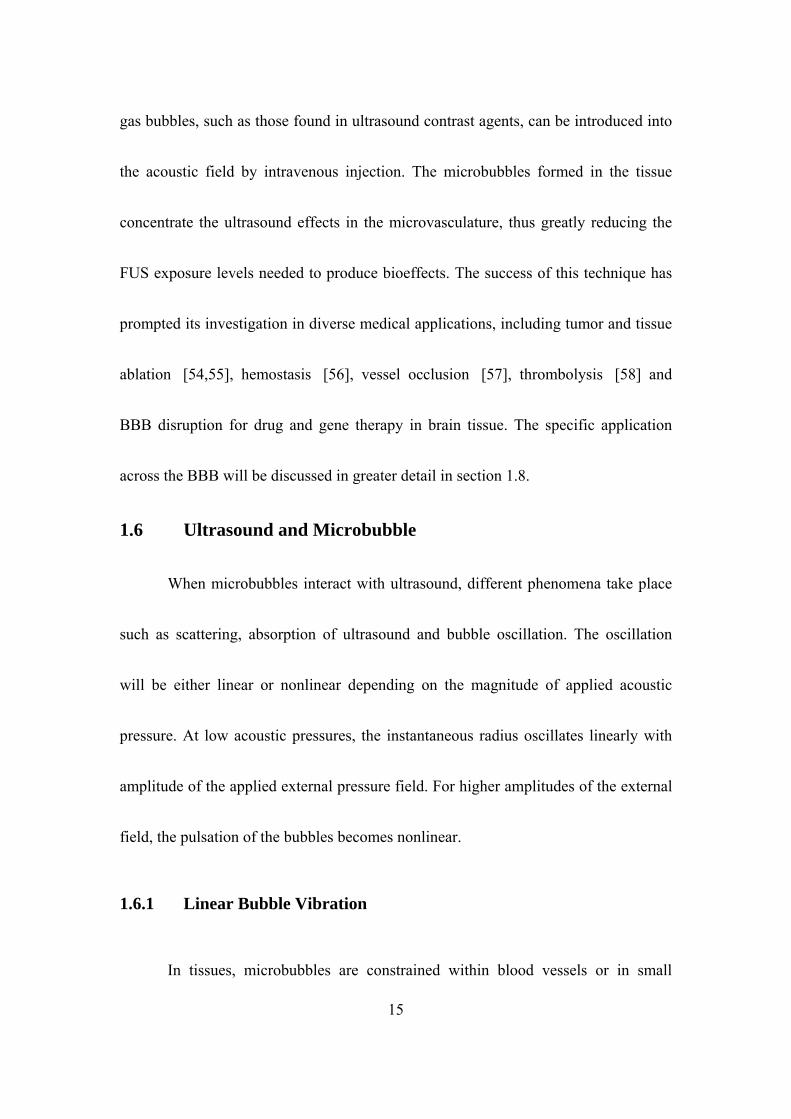
15
gas bubbles, such as those found in ultrasound contrast agents, can be introduced into
the acoustic field by intravenous injection. The microbubbles formed in the tissue
concentrate the ultrasound effects in the microvasculature, thus greatly reducing the
FUS exposure levels needed to produce bioeffects. The success of this technique has
prompted its investigation in diverse medical applications, including tumor and tissue
ablation [54,55], hemostasis [56], vessel occlusion [57], thrombolysis [58] and
BBB disruption for drug and gene therapy in brain tissue. The specific application
across the BBB will be discussed in greater detail in section 1.8.
1.6 Ultrasound and Microbubble
When microbubbles interact with ultrasound, different phenomena take place
such as scattering, absorption of ultrasound and bubble oscillation. The oscillation
will be either linear or nonlinear depending on the magnitude of applied acoustic
pressure. At low acoustic pressures, the instantaneous radius oscillates linearly with
amplitude of the applied external pressure field. For higher amplitudes of the external
field, the pulsation of the bubbles becomes nonlinear.
1.6.1 Linear Bubble Vibration
In tissues, microbubbles are constrained within blood vessels or in small

16
regions of water within different tissue structures. Modeling the bubble behavior
under such constraints is complex. A good understanding can be achieved by making
some simple assumptions:
1. A bubble is considered spherical and surrounded by a liquid of infinite extent and
a constant viscosity. The bubble volume is defined by a single variable, the radius,
and the motion of bubble is spherically symmetric.
2. The wavelength of the ultrasound field is much larger than the bubble diameter,
and only the motion of the bubble surface is of interest. The vapor pressure
remains constant during the compression and expansion phase, and that there is no
rectified diffusion during the short period of exposure to ultrasound.
3. The gas inside the bubble is assumed to be ideal and compression and expansion
takes place according to the gas law.
4. At small excitation levels, the displacement of the bubble wall can be compared to
the displacement of a simple one-dimensional mass spring oscillator. The
oscillator is defined by its mass, restoring force, damping, and applied force.
The equation of bubble motion can be modeled as:
drivFSx
dt
dx
dt
xdm
2
2 1. 7
where m is the mass of the bubble–liquid system, is the mechanical resistance
related to the dissipation, S is the stiffness of the system, Fdriv(t) is the driving force,
and x(t) is the radial displacement of the bubble wall relative to the initial radius R0,
according to x(t) = R(t) - R0.
For undamped simple harmonic oscillation the resonance frequency of bubble
can be written as
m
S
RfR 2
1 1. 8
For gas bubbles in a liquid, the stiffness is that of the enclosed volume of gas
that acts like a spring when the bubble is disturbed from its equilibrium radius. The
inertia is principally due to the mass of the liquid surrounding the bubble that
oscillates with it. The derived value of the mass, the mechanical resistance, and the
stiffness are [59]
, 304 Rm mtot , 0012 RPS 1. 9
where is the density of the surrounding medium, tot is the total damping, is the
17
angular frequency, is the heat capacity ratio (Cp/Cv), and P0 is the ambient pressure.
The total damping tot is sum of reradiation damping ( tot rad), damping due to
viscosity of the surrounding fluid ( tot vis) and thermal damping ( tot th) i.e.
18
tot = tot rad+ vis + tot th 1. 10 tot
The damping coefficients depend on the bubble size and the frequency of the
acoustic field and are nominally on the order of 0.1 for bubbles with a diameter
between 1 and 10 m . Exact expressions for the different damping components can be
found in [60].
Substitution of value m, , and S into equation 1.8 above gives the final
expression for the resonance frequency for a bubble motion without losses.
3
RfR 2
1
P 1. 11
This equation shows that the resonant frequency is inversely proportional to
the radius.
For an encapsulated bubble, the surrounding shell causes an additional
restoring force. This can increase the resonance frequency [61] of the bubble.

m
shellS
Rf
ref
24
22
1. 12
where is the resonance frequency of the encapsulated bubble, is the resonance
frequency for a free gas bubble, and Sshell the stiffness due to the shell. The shell is
assumed to be homogeneous, of constant thickness, and perfectly elastic. The shell
influences the surface tension and probably also the thermal damping.
re Rf f
1.6.2 Nonlinear Bubble Vibration
For large acoustic pressure fields equation 1.7 it is thought to be inadequate to
fully model the bubble vibration phenomenon and a more sophisticated model is
needed. In developing the initial model Rayleigh made following assumptions:
5. The bubble is spherical, and is surrounded by an incompressible liquid with
constant viscosity to infinite extent.
6. The gas in the bubble is compressed and expanded according to the gas law with
the polytropic exponent remaining constant during the vibration.
7. Pressure at the bubble wall is at equilibrium. Combining the Rayleigh–Plesset
equation and the polytropic gas law with the boundary condition, Nico-de Jong
19
)(423
12
2
30
3
000
2
2
2
1 tPpdt
dR
RRdt
dR
CR
R
Rp
dt
dR
dt
RdR ac
1. 13
where R, dR/dt, dR2/dt2 represent the radius, velocity and acceleration of the bubble
wall, 1 is the density of the liquid, p0 is the ambient pressure, is the surface
tension, is the polytropic gas exponent, is the viscosity of the surrounding water,
c is the speed of sound, and Pac(t) is the applied acoustic field. For simplicity only the
viscous damping caused by the surrounding liquid has been taken into account.
1.6.3 Coated Bubble Vibration
Encapsulation of the bubbles dramatically changes their acoustical behavior.
The shell causes an increase in resonance frequency due to its stiffness and an
increase in damping due to its viscosity. Encapsulated microbubbles were first
modeled by De Jong et al. [61] and De Jong and Hoff [62] incorporating
experimentally determined elasticity and friction parameters into the Rayleigh–Plesset
model. Church [63] used linear visco-elastic constitutive equations to describe the
shell. Since then many models have been defined to investigate the influence of the
shell on the bubble’s vibration, e.g. [64–67] including Marmottant model for
20

phospholipid-coated bubbles [68] where he proposed three parameters to describe the
properties of the shell: a buckling radius, the compressibility of the shell, and a break-
up shell tension. These three regimes can be expressed as following which add
term in equation 1.13, )(R is equal to zero if R ≤ Rbuckling,
1)(
2
2
bucklingR
RR if
Rbuckling ≤ R≤ Rbreak-up and )(R becomes )(water if R ≥ Rruptured. Buckling radius
(Rbuckling) is a state that naturally occurs with dissolution of gas, or that can be
accelerated by repeated pulses.
1.7 Acoustic Characterization
As mentioned previously, when bubbles interact with ultrasound they absorb
as well as scatter energy. Both absorbed and scattered energy can be determined by
using different kinds of measurement techniques [69]. The scattered power of a free
microbubble can be determined by its scattering cross-section and can be expressed
as [61]:
22
2
2
2
)1(
4
totr
s
f
f
R
1. 14
where s is scattering cross-section and f is applied ultrasound field.
In case of coated bubble, there exists an additional damping constant due to
21

shell viscocity [70]
30
12
a
SdSeS
1. 15
The expressions for other three damping constants are the same as equation
1.10. However, the resonance frequency of the bubble depends on the shell properties,
and this alters the value of damping constant. It was observed that encapsulated
bubbles could scatter energy with different harmonics such as n-harmonics, sub-and
ultraharmonics [69] Like in case of scattering, absorption cross section also depends
on damping coefficient as:
)1( rad
sa 1. 16
where a is absorption cross section. The total energy loss for an acoustic beam
travelling through bubble solution is determined by the sum of scattering and
absorption cross sections.
1.8 Application in the Brain
FUS has been investigated since the 1940’s for noninvasive ablation in the
brain as a potential alternative to surgical resection and radiosurgery [71–74]. Until
recently, clinical testing required a craniotomy to allow for ultrasound propagation
22

23
into the brain [75,76] because of ultrasonic heating of the skull bone and beam
aberration caused by the skull’s irregular shape and large acoustic impedance. In the
past decade, FUS thermal ablation systems have been developed that overcome these
obstacles produced by the skull [77]. They reduce skull heating through active
cooling of the scalp and a transducer design with a large aperture to distribute the
ultrasound energy over a large skull region, and they correct for beam aberrations
using a phased array transducer design. When combined with methods that use
acoustic simulation based on CT scans of the skull bone to determine the phase and
amplitude corrections for the phased array [78,79] and MRI temperature imaging
(MRTI) to monitor the heating [80], a completely noninvasive alternative to surgical
resection in the brain becomes possible. These systems, use very high intensities to
enable thermal ablation through the human skull, and are currently in initial human
trials [81,82], .
1.8.1 Ultrasound-Induced BBB Disruption
Since the early years of investigation into ultrasound bioeffects on the brain,
several studies have noted localized BBB disruption, either accompanied with tissue
necrosis or without evident tissue damage [73,83–88]. None of these early studies

24
however, elucidated sonication parameters that could repeatably and reliably produce
BBB disruption without occasionally producing lesions or necrosis.
In 2000 our laboratory discovered that if short ultrasound bursts are preceded
by an intravenous injection of a microbubble ultrasound contrast agent, the BBB can
be consistently opened without the production of lesions or apparent neuronal
damage [89]. The circulating microbubbles appear to concentrate the ultrasound
effects to the blood vessel walls, causing BBB disruption through widening of tight
junctions and activation of transcellular mechanisms, with little effect on the
surrounding parenchyma [90]. Furthermore, the opening occurs at acoustic power
levels orders of magnitude lower than was previously used, making this method
substantially easier to apply through the intact skull. For BBB disruption, the
sonications have been typically applied as short (~1-20 ms) bursts at a low duty cycle
(1-5%) for 0.5-1 min. With a few simple modifications to enable low-intensity bursts,
existing clinical brain FUS systems can be used for BBB disruption [91]. Clinical
translation may also be possible using simpler FUS systems [92].

25
1.8.2 Effect of Ultrasound Parameters and Other Factors on BBB
Disruption
A number of sonication parameters can be varied in ultrasonic BBB disruption.
Each parameter variation may impact the threshold pressure amplitude needed to
disrupt the BBB, along with the magnitude of its disruption, and the resultant drug
quantity delivered to the brain parenchyma. As determined from a number of studies,
parameter variations and their effects are listed in Table1. 2. These studies used an
MRI contrast agent, fluorescent probe, or drug to evaluate the BBB disruption. Given
the large parameter space, and different techniques and criteria used to evaluate the
disruption (each with different sensitivities), it can be challenging to compare results
from different laboratories. Such comparisons are additionally confounded by
uncertain accuracies in estimates of acoustic pressure amplitude when sonicating
through the skull [93]. However, general trends can be observed.
For a fixed set of parameters, as one increases the pressure amplitude, the
magnitude of the BBB disruption increases, and at some level it appears to
saturate [94–96]. Below some value, no disruption is detected, and at some higher
pressure threshold, vascular damage is produced along with the disruption (see below).
26
Such studies repeated while varying a different parameter have shown that the
threshold for BBB disruption depends strongly on the ultrasound frequency [97] and
burst length [98]. Most experiments have been done with commercially-available
ultrasound contrast agents that consist of microbubbles with a wide range of diameters.
Experiments with microbubbles with narrow size distributions suggest that the BBB
disruption threshold can also be reduced by using larger microbubbles [99–101].
Pulse repetition frequency can also influence the magnitude of disruption up to a
point [102,103], but other studies have seen no dependence [98]. Finally, the
magnitude of the disruption can be increased by increasing the sonication
duration [96] or by repeating the sonication after some delay [104,105], but
excessive durations may result in tissue damage [105,106] . Factors such as using an
infusion instead of a bolus injection of microbubbles [107] and choice of anesthesia
protocol [108] may also influence the resulting disruption. Other factors such as the
delay between the microbubble injection and the start of sonication, and whether the
drug or tracer is administered before or after the sonication may also be expected to
have an effect. Additive effects have been observed when FUS-induced BBB
disruption is combined with agents that affect vascular permeability [109–111].
27
These trends observed in parametric studies are difficult to interpret with
confidence since the exact mechanism by which microbubble-enhanced FUS induces
BBB disruption is currently unknown (see below). They are perhaps consistent with
the following notions. First, for BBB disruption to occur, the microbubbles
oscillations may need to reach a certain minimal radius, which can be achieved by
increasing the pressure amplitude or by using larger microbubbles, and assuming the
bubbles grow during each burst via rectified diffusion, by decreasing the ultrasound
frequency or increasing the burst length. Next, in addition to depending on the bubble
size during its oscillation, the magnitude of the disruption depends on the number of
sites on which the microbubbles interact with the vasculature. The number of these
sites can be increased by increasing the microbubble dose, or by increasing the
sonication duration and/or number of bursts. Data showing a strong dependence on
burst length may also suggest that the threshold and magnitude of the disruption
depend on the amount of time the microbubbles interact with the blood vessels during
each burst. Pulse repetition frequency may have an influence if the microbubbles are
being fragmented or destroyed-time may be needed to replenish them if that is the
case [112]. Finally, it appears that the magnitude of the disruption can saturate at
some level, and increasing the different parameters has no additional effect.

Table1. 2 Reported effects of different parameters on BBB disruption via FUS and microbubbles.
Parameter Effect on BBB disruption
Pressure amplitude Increase in BBB disruption magnitude as pressure amplitude increases; saturation at some point [94–96] ; vascular damage produced at high pressure amplitudes.
Ultrasound frequency Decrease in BBB disruption threshold as frequency decreases; some evidence of improved safety for lower frequencies [97]
Burst length
For burst lengths less than 10 ms, BBB disruption threshold increases and BBB disruption magnitude decreases as burst length is reduced [98,102,103,113]; little or no increase in disruption magnitude for longer bursts [93,102,114].
Pulse repetition frequency BBB disruption magnitude increases as repetition frequency increases up to a point [102]. Other works have observed no effect on BBB disruption magnitude [98].
Ultrasound contrast agent dose Magnitude of BBB disruption increases with dose [102,115–117] ; other experiments have reported no effect [98].
Sonication duration Longer durations [96] or repeated sonication [105,118], increase magnitude of BBB disruption; damage reported with excessive sonication [96,105] .
Microbubble diameter Threshold for BBB disruption lower for larger microbubbles; disruption magnitude increased with larger microbubbles [100,101,119] .
Ultrasound contrast agent Similar outcomes reported for Optison® and Definity® microbubbles [120]. Sonovue® microbubbles and research agents are also commonly used.
28

29
1.8.3 Optimal Parameters for BBBD
Overall, these studies have made it clear that BBB disruption is possible over a
wide range of exposure parameters. Disruption has been demonstrated at frequencies
between 28 kHz [121] and 8 MHz [113], burst lengths as low as a few ultrasound
cycles [102,103,122] up to 100 ms [114], and over a range of pulse repetition
frequencies, microbubble doses, and sonication times. It is not clear what the
“optimal” parameters are, or what criteria to use to establish them. In our view, the
primary consideration could be to find parameters that maximize the window in
acoustic pressure amplitude where robust BBB disruption is possible without
producing vascular damage. It will be challenging to precisely estimate the pressure
amplitude in the human brain after transcranial sonication, and having the widest
safety margin possible will be desirable for clinical translation. How close the FUS
frequency is to the “resonant size” of the microbubbles may have an impact on the
width of this safe window. Additional important criteria would be to optimize the
frequency and transducer geometry to produce the desired focal spot size, to
effectively focus through the skull with minimal distortion, and if a phased array
transducer is used, to be able to steer the focal region throughout the brain. It may also
30
be desirable to find parameters that enable BBB disruption in the shortest possible
sonication time so that multiple targets can be targeted in a reasonable amount of time,
and to maintain a safe dose of microbubbles.
1.8.4 Potential Mechanisms
Even though FUS exposures combined with microbubbles have been
investigated to disrupt the BBB in numerous studies, the exact mechanism to open
BBB still remains unknown. It does appear that two known effects that can be
induced by FUS, bulk heating and inertial cavitation, are not responsible. Initial
studies on the method utilized MRI-based temperature imaging [114] during the
sonications, and no measureable heating was observed. Studies that recorded the
acoustic emissions during the sonications [123–125] have found that BBB disruption
can be achieved without wideband acoustic emission, which is a signature for inertial
cavitation [74]. It may not also be the same mechanism utilized for so-called
“sonoporation”, where transient pores in cell membranes created by sonication with
microbubbles enable drugs to enter [126]. Those pores are rapidly resolved, while
FUS-induced BBB disruption lasts for several hours.
Fundamentally, one does not know if the FUS/microbubble interactions

31
physically modify the vessel walls, or if they are triggering a physiological response
that includes temporary BBB breakdown. As described below, electron microscopy
studies have shown delivery of tracers through widened tight junctions [90,127],
which could be consistent with a direct physical force pulling them apart, as well as
active transport [90,128]. Other work has shown the sonications can induce vascular
spasm [129,130]. While the role of this spasm is not clear, it does make clear that the
sonications can trigger a physiological response.
In the absence of bulk heating and inertial cavitation, mechanical effects
induced during the microbubble oscillations in the ultrasound field are likely sources
for the disruption. A number of effects are produced with potential to induce the
observed BBB disruption. Microbubbles tend to move in the direction of the wave
propagation via acoustic radiation force [131], which will bring them in contact with
vessel endothelium. During oscillation, the shell of the microbubble can break, the
bubbles can be fragmented into smaller bubbles, and they can grow via rectified
diffusion. Microstreaming due to microbubble oscillations can induce biologically-
significant shear stresses on the neighboring endothelium, and the oscillations
produce inward forces that in extreme cases can pull the vessel wall inward [132].
32
Clearly, the behavior of a microbubble in an acoustic field is complex, and it can be
different in free fluid than when constrained within a capillary [133].
1.8.5 Bioeffects Induced by FUS and Microbubbles
The BBB disruption occur almost immediately with sonication [130] and
appears to decay exponentially over several hours thereafter [94,114,118,134]. The
amount of agent delivered across the barrier appears to be much larger in grey matter
than in white matter, presumably due to differences in vascular density [91]. Several
studies have found that the barrier appears to be largely restored in approximately 4-6
hours [94,114,118,128,134,135]; other experiments have observed low-level
disruption at 24 hours after sonication or longer [101]. The source of this discrepancy
is not clear, but it could be simply that more sensitive detection methods such as high-
field MRI combined with large doses of MRI contrast agent are capable of detecting
low-level disruption missed in other works. The duration of the opening to different
tracers appears to be reduced for larger tracers [134].
This window in time where the barrier is open is thought to be good for the
prospect of delivering even long-circulating drugs, but not so long as to produce
concern of toxicity arising from chronic BBB breakdown. Indeed, the appearance of

33
the brain after BBB disruption in light microscopy appears to be normal [136], even
after repeated weekly sessions [91]. The only major feature that has been observed in
many studies is the presence of tiny clusters of extravasated red blood cells
(petechiae) [137,138]. It is thought that these petechiae are formed during inertial
cavitation, and experiments where no wideband emissions (a signature for inertial
cavitation) were observed, no such extravasations were observed [139]. Some have
suggested that wideband emissions can be observed without producing such
petechiae [140]. While the presence of these petechiae is undesirable, their impact on
the brain may be minimal. Investigations looking for apoptosis or ischemia, which
may be expected if serious vascular damage were occurring, failed to anything more
than a few individual damaged neurons, and long-term effects have not found
evidence of neuronal damage with such sonications [137,138,141]. However, as I
show in section 4.1.2, this vascular damage might be exacerbated by a chemotherapy
agent. At excessive exposure levels, more severe vascular damage, parenchymal
damage, and neuronal loss can occur [114,142].
Transmission electron microscopy (TEM) investigations have demonstrated an
increase of cytoplasmic vesicles in endothelium and pericytes (suggestive of

34
transcytosis), formation of trans-endothelial fenestrae, widened tight junctions, and
transport of serum components across the BBB [90]. The use of a 44 kDa tracer
molecule helped elucidate arterioles as the major sight of trans-endothelial vesicle
transport (followed by capillaries then venules), and showed extensive tracer
deposition in the endothelial paracellular space, basement membrane, and surrounding
brain parenchyma [128]. Finally, using immunogold labeling, the disappearance of
tight junction (TJ) proteins occludin, claudin-5, and ZO-1 were shown, along with
opened endothelial junctions and tracer leakage at 1-4 hours post-sonication [127].
The TJ proteins reappeared at 6 and 24 hours. Other work has shown down-regulation
of the same TJ proteins along with their mRNA, and recovery to normal levels at 12
hours post-sonication [143]. Reorganization of connexin gap junction proteins have
also been reported [144]. An increase of endothelial vesicles in normal [145] and
tumor microvessels [146] have also been observed on TEM with an up-regulation of
caveolin proteins/mRNA, suggesting that caveolae-mediated transcytosis (CMT) as a
contributing mechanism for permeability. These researchers also found increased
phosphorylation of Src and caveolin-1/2, noting that Src-induced phosphorylation of
caveolins is a trigger for CMT [147].

35
Intracellular signaling cascades in response to mechanical stimulation by FUS-
induced BBB disruption is likely, but has only recently been addressed. Increased
phosphorylation of Akt and its downstream molecule GSK3β has been shown in
neurons flanking the BBB disruption at 24 hours, well after tight junction
reassembly [148]. Akt phosphorylation has been implicated in neuroprotection after
stroke [149], while activation of the p38 JNK MAP kinases promote neuronal
apoptosis [150,151] . Alonso et al. showed increased protein ubiquitination in
neurons not glia post sonication, no increase in heat shock proteins, and limited
neuronal apoptosis at 24 hours in areas staining positive for extravasated
albumin [152]. Ca2+ signaling has also been suggested as being stimulated by FUS-
induced BBB disruption. Specifically, temporary disruption of the endothelial plasma
membrane (i.e., sonoporation) can induce immediate transient changes of intracellular
Ca2+ concentration in cells with direct contact with microbubbles, and delayed
fluctuations in nearby cells [153]. When factoring in fluid shear induced in an in vitro
flow channel (intended to mimic cerebral vessels), the membrane disruption and Ca2+
transients were much lower [154].
Multiphoton microscopy (MPM) has provided useful insights into the

36
bioeffects of FUS-induced BBB disruption. Initial work with this technique
demonstrated arteriolar vasospasm in 14/16 mice lasting up to 5 minutes, and
interrupted cerebral blood flow [129]. Although this could cause ischemic injury, it
has been noted that mice have enhanced vasomotor excitability over other rodents,
such as rats [155]. Indeed, a similar study in rats showed vasospasm in only 25% of
the vessels examined [130]. Initial work has also noted two forms of vessel dye
leakage, rapid focal microdisruptions (3-9 seconds) that were prevalent at vessel
bifurcations, and slow disruptions that were observed as a gradual increase in
extravascular signal intensity [156]. Subsequent work noted three rather than two
leakage types: (1) fast, characterized by rapid increase to peak intensity and rapid
decrease, (2) sustained, described as rapid increase to peak which persisted for up to
an hour, and (3) slow, a gradual increase to peak intensity [130]. The authors noted
that differing vessel calibers have preferences for different leakage types, and
interestingly, that distinct peak negative pressures also show preference for leakage
types. Continuing work suggested correlation between fast leakage, common with
high pressure amplitudes, and detachment of astrocyte endfeet from the vessel
walls [157].
37
1.8.6 Delivery of Imaging/Therapeutic Agents and Tests in Animal
Disease Models
1.8.6.1 Delivery of Imaging Tracers
One advantage of this method for targeted drug delivery in the brain is that it
appears to be “drug neutral” – that is, it appears that many agents with a wide range of
properties can be successfully delivered across the BBB and/or the BTB. A large
number of imaging tracers Table1. 3 and therapeutic agents Table1. 4 which normally
do not cross the BBB have been delivered to the brain or to brain tumor models with
FUS and microbubbles. The amount of substance delivered and the distance from the
blood vessels that it penetrates appears to depend on its size. For example, less
delivery of an albumin-bound MRI contrast agent (MW: ~67 kDa) was evident
compared to a standard agent (MW: 928 Da) in a macaque [91]. This is even clearer
in another study, where fluorescent Dextrans with different molecular weights are
delivered to the mouse hippocampus. For 3,000 Da Dextrans, a relatively uniform
fluorescence was observed; for the larger 70 kDa tracer, it was more concentrated
near the blood vessels, and a 2000 kDa was found not to penetrate at all [158]. This
result points to a need for close examination of how the delivery of large agents

38
occurs – it may not be enough to look for the presence of the agent, but to also
investigate whether it is delivered far enough from the vasculature at a high enough
concentration to reach the desired target at a therapeutic level. Low-resolution
methods such as MRI may not be sufficient for this purpose. It may be possible, for
example, for agents to make it past the endothelial cells but get trapped at the
basement membrane [159].

39
Table1. 3 Example different tracers that have been delivered across the BBB
Agent Size Use
Lanthanum chloride 139 Da Electron microscopy tracer [127] 99mTc-Diethylenetriaminepentaacetic pentaacetate
492 Da SPECT agent [160]
Omniscan® (Gd-DTPA-BMA) 574 Da MRI contrast agent [101]
Magnevist® (Gd-DTPA) 928 Da MRI contrast agent [114] Trypan blue, Evans blue ~67 kDa Tissue dyes (binds to albumin) [91,161]
Ablavar® (Gadofosveset trisodium) ~67 kDa MRI contrast agent (binds to albumin) [91]
Horseradish peroxidase 40 kDa Electron microscopy tracer [90] Dextran 3-70 kDa Fluorescent tracer [158]
Immunoglobulin G ~150 kDa Endogenous antibodies [162] pCMV-EGFP¹ ? Plasmid DNA [163] MION-47 20 nm MRI contrast agent [141] Gold nanoparticles 50 nm Carrier for drugs or imaging [164] Gold nanorods 10×40 nm Photoacoustic imaging contrast agent [165]
Dotarem, P846, P792, P904, P03680 1-65 nm MRI contrast agents [134]
40
1.8.6.2 Delivery of Therapeutics
A large number of therapeutic agents have also been delivered to the brain and
to brain tumor models (Table 4). Many of the studies so far have investigated the
delivery of chemotherapy agents, such as BCNU [166], doxorubicin [118],
methotrexate [167], cytarabine [168], and temozolomide [169]. Enhanced delivery
of chemotherapy packaged in liposomes [95,170] , targeted liposomes [171] and
magnetic particles [172–174], which allow for MRI-based tracking and enhanced
delivery via magnetic targeting have also been demonstrated. Other works have
shown Trastuzumab, an antibody-based agent used for HER2-positive breast
cancer [175,176], and boronophenylalanine, which is used for boron neutron capture
therapy, can be delivered to the brain and to brain tumor models [177,178]. FUS-
induced BBB disruption has also been shown to improve the delivery of natural killer
cells in a brain tumor model [179]. Finally, a number of experiments have loaded
chemotherapy and other agents into the microbubbles used for the
disruption [163,174,180–182], which offers the possibility of achieving even higher
local payload at the targeted region. Delivering agents for neurodegenerative diseases,
such as Alzheimer’s, Huntington’s, and Parkinson’s disease, have also been an active

41
area of research by several groups. A number of therapies for neurodegenerative
diseases such as neuroprotective agents [181,183] , antibodies [162,184], plasmid
DNA [163], and siRNA [157] have all been successfully delivered across the BBB
using FUS and microbubbles. Other investigations have shown that circulating neural
progenitor cells [185] or viral vectors for gene therapy [186–188] can be delivered to
the sonicated regions after FUS-induced BBB disruption.
1.8.6.3 Disease Models
While delivery of these agents is promising, one also needs to demonstrate
that the amount of drug delivered – and the drug penetration – is sufficient to produce
a therapeutic response. In some cases it is also important to demonstrate that the drug
reaches the desired target and is active after it is delivered [183]. Several studies have
shown that FUS enhancement of the BTB can slow tumor growth and/or improve
survival in orthotopic murine models of primary or metastatic brain
tumors [166,170,172,173,189–191] . While in some cases the response has been
modest, several of these studies have seen substantial improvements. Using multiple
treatments may be necessary to achieve a pronounced improvement [170]. One factor

42
that has not been investigated in depth so far is to confirm that drugs can successfully
be delivered to infiltrating tumor cells, which are a major feature in glioma and other
primary tumors, and to metastatic “seeds”. Both can be protected by the normal BBB.
The orthotopic models investigated so far do generally not have large infiltrating
zones, and the benefit observed in studies so far may have been primarily due to FUS-
enhanced permeability of the BTB. It may be challenging to get therapeutic levels to
distant regions that are protected by the BBB. Some agents may have neurotoxic
effects on the normal brain that may limit this ability.
Beyond brain tumors, a study by Jordao et al. showed that delivery of
antibodies targeted to amyloid plaques can reduce the plaque burden in Alzheimer’s
disease model mice [192]. While the decrease was modest, with multiple treatment
sessions this may be an effective treatment strategy. In an intriguing follow-up study,
the same group recently showed that FUS-induced BBB disruption alone can reduce
the size of the plaques, perhaps through the delivery of endogenous antibodies [193].
We anticipate that these studies are only the beginning, and that FUS has a large
potential for Alzheimer’s disease and other neurodegenerative disorders. Issues
regarding the feasibility and safety of disrupting the BBB in large brain regions (or

43
the whole brain – perhaps repeatedly) may be need further investigation, however.

44
Table1. 4 Example therapeutic agents that have been delivered across the BBB or BTB
Therapeutic Agent Size Use Delivered to
Temozolomide 194 Da Chemotherapy Glioma model (9L)¹ [194]
1,3-bis(2-choroethyl-1-nitrosourea (BCNU)²
214 Da Chemotherapy Glioma model (C6)¹ [180,195]
Cytarabine 243 Da Chemotherapy Normal brain [168] Boronophenylalanine 330 Da Agent for boron neutron
capture therapy Glioma models (GBM 8401 [177]; 9L [178])
Doxorubicin 540 Da Chemotherapy Normal brain [118]
Methotrexate 545 Da Chemotherapy Normal brain [167]
siRNA ~13 kDa Huntington's disease therapy Normal brain [157]
Glial cell line-derived neurotropic factor (GDNF)²
24 kDa Neuroprotective agent Normal brain [181]
Brain-derived neurotropic factor (BDNF)
27 kDa Neuroprotective agent Normal brain³ [183]
Herceptin (Trastuzumab) 148 kDa Anti-cancer antibody Normal brain [175]; Breast cancer brain met. model (BT474)¹ [190]
BAM-10 Aβ targeted antibodies
~150 kDa Therapeutic antibody for Alzheimer's Disease
TgCcrND8 Alzheimer's model mice¹ [184]
BCNU-VEGF² ~150 kDa Antiangiogenic-targeted chemotherapy
Glioma model (C6)¹ [182]
Plasmid DNA (pBDNF-EGFP)²
~3600 kDa4 Gene therapy Normal brain [163]
Epirubicin in Magnetic nanoparticles
~12 nm Magnetic targeted chemotherapy
Glioma model (C6)¹ [196]
Doxorubicin in magnetic nanoparticles²
~6-10 nm Magnetic targeted chemotherapy
Glioma model (C6) [174]
BCNU in magnetic nanoparticles
~10-20 nm Magnetic targeted chemotherapy
Glioma model (C6)¹ [173]
Adeno-associated Virus (AAV)
~25 nm Gene therapy vector Normal brain [186–188]
Liposomal doxorubicin (Lipo-DOX)
90 nm Chemotherapy Normal brain [115]; Glioma model (9L)¹ [170,191]
Interleukin-4 receptor targeted Lipo-DOX
100-120 nm Chemotherapy Glioma model (8401) [171]
Neural progenitor cells 7-10 µm Stem cell Normal brain [185]
Natural killer cells (NK-92)
~10 µm Cell therapy for brain tumor Breast cancer brain met. model (MDA-MB-231-HER2) [179]
¹ Also showed improved outcomes with FUS-induced BBB disruption;
² Used drug-loaded microbubbles;
³ Also showed drug activity after delivery;
4 Assumed 660 Da per base pair (bp), 760 bp for BDNF, and 4700 bp for pEGFP-N1
45
1.8.7 Treatment Planning, Monitoring and Evaluation
As described above, FUS-induced BBB disruption utilizes the mechanical
interactions between microbubbles oscillating in the ultrasound field and the
vasculature. These interactions critically depend on the exposure parameters as well
as the vascular density and perhaps other properties of the vascular bed. The latter,
can affect the local concentration of microbubbles, how they interact with the
ultrasound field [133], and, more importantly, how much drug will be delivered to
the brain [91]. Unfortunately, many of these parameters are difficult to predict and
are expected to vary significantly across different patients and diseases. Thus,
methods are needed to (i) determine what parameters to use (treatment planning), (ii)
refine them during sonication to ensure BBB disruption without overexposure
(treatment monitoring), and (iii) evaluate the treatment effects (treatment evaluation).
1.8.7.1 Treatment Planning
In most cases, experiments evaluating FUS-induced BBB disruption in animal
models have used a fixed set of acoustic parameters determined from prior experience
and simple, geometrically-focused transducers. In general, accurate targeting can be
46
achieved with such systems using stereotactic frames [197] if image-guidance is not
available, and fairly repeatable results can be obtained with sonication through the
thin skull in mice and rats, or in larger animals through a craniotomy. Methods to
avoid standing waves [93] that take into account variations in skull thickness [198]
can improve repeatability in small animal studies where transcranial sonication is
used. Such approaches may be challenging to translate to human subjects, where the
thicker skull is complex (a layer of trabecular bone surrounded by layers of cortical
bone) and can vary substantially between individuals (3.5-9.5 mm) [199]. The skull,
which has a substantially higher acoustic impedance than soft tissue, will reflect most
of the ultrasound beam, and the amount transmitted will depend strongly on the angle
between the bone and the face of the transducer [200]. Its irregular shape can also
deflect and distort the beam, and reflections within the skull cavity need to be taken
into account. To correct for beam-aberrations introduced by thick skulls, phased
arrays composed of more than 1000 elements combined with skull aberration
correction algorithms that utilize CT data are employed [78,79]. These arrays can
also be programmed to rapidly steer the beam electronically to multiple targets
enabling coverage of tissue volumes [91], and different portions of the array can be
disabled to reduce internal reflections or exclude certain structures.
47
While these approaches that use acoustic simulations and CT scans are
effective in restoring the focusing of the array after transmission through the skull,
clinical experience with them for thermal ablation have shown that one still needs to
correct for small errors (~1-2 mm) in targeting [81,82]. To achieve this correction,
one needs to be able to visualize the focal region at exposure levels that do not induce
damage or other unwanted effects. Currently, this can be achieved using MRI-based
methods that can visualize low-level (1-2°C) focal heating [80,201] or map small
tissue displacements of a few microns induced by radiation force [202]. Ensuring
accurate targeting will be most important if one aims to precisely disrupt the BBB at
discrete locations. In addition, since the strength of the total microbubble activity, as
well as magnitude of the disruption will depend on the vascularity of the targeted
tissue (gray vs. white matter, for example [91], it will be important to know exactly
where the target is located. It might also be desirable to avoid direct sonication on
large blood vessels. If one is uncertain about the targeting of the focal region, it may
be challenging to understand whether a poor or unexpected result is due to an
incorrect exposure level or to mistargeting. Pre-treatment imaging delineating
vascularity, perfusion, or other vascular properties may prove useful for planning the
treatment. It may also be useful to combine these measurements with models of the

48
microbubble oscillations within the microvasculature [133,203].
Accurate control of the focal pressure is critical to ensure BBB disruption is
produced while preventing inertial cavitation. The thick and complex human skull
makes accurate focal pressure estimations extremely challenging. While the acoustic
modeling methods developed for aberration correction may provide estimates of the
focal pressure amplitude, it has not been validated to my knowledge. It may be
possible to use the MRI-based methods mentioned above that can visualize focal
displacements or heating to ensure a predictable focal pressure amplitude. Marty et al.,
for example, used MRI acoustic radiation force imaging to ensure a consistent
exposure level between subjects in BBB disruption experiments in rats [134].
However, one needs to take the underlying tissue properties (which may be unknown
for tumors or other abnormalities) into account or test it in proximal normal brain
locations.
1.8.7.2 Treatment Monitoring and Control
Given the challenges in predicting the focal pressure amplitude when
sonicating transcranially, it is anticipated that effective monitoring of the procedure
will be important if this technology is to be translated to clinical use. At minimum,

49
such monitoring should provide an indication that the exposure level is sufficient to
induce BBB disruption and alert the user if inertial cavitation is occurring. One could
use MRI methods for this purpose. Contrast-enhanced imaging can be used to
visualize when the disruption occurs, and T2*-weighted or susceptibility-weighted
MRI can be used to detect petechiae produced by inertial cavitation [114,138]. These
methods could be used now for control over the procedure in initial clinical tests of
FUS-induced BBB disruption with experienced users. However, performing multiple
MRI acquisitions would be time-consuming and may require to use excessive
amounts of both US and MRI contrast agents, thus real-time and, perhaps, more direct
methods are desirable for the prospect of widespread clinical implementation.
1.8.7.2.1 Acoustic Emission
Acoustic cavitation describes the oscillatons of either vapour or gas filled
cavities within a liquid. Acoustic emissions from the oscillating microbubbles offer a
potential way to guide and monitor bubble activities during ultrasound exposure in
biological tissue. Harmonic (nf0, n = 1, 2, 3.., f0 = fundamental frequency) signal
components can arise from different sources such as tissue, coupling media and
microbubbles. Conversely, subharmonic (f0/2) and ultraharmonic (3f0/2, 5f0/2..)
50
emissions can arise only from bubble emissions and are indicators of stable
cavitation [204]. Acoustic cavitation can be detected both actively and passively.
Active techniques use a pulse echo transducer to monitor the region where cavitation
is expected. If transient cavitation occurs the diagnostic pulse will reflect off of the
generated bubble cloud and a change in the backscattered signal will be detected. The
same technique can be used to detect changes in backscattered signal following the
injection of microbubbles. Alternatively, a passive transducer can be used to monitor
the field and record the signal following sonications from the active transducer [125].
The spectral content and strength of the recorded emissions is sufficient to
characterize and subsequently control the microbubble oscillations. Inertial cavitation
is manifested in the frequency domain of the acoustic emission as a broadband
signal [74], and has generally been associated with the production of vascular
damage during BBB disruption [123,125], although other studies have suggested that
it can occur without damage [124]. Harmonic and/or sub- and ultra-harmonic
acoustic emissions in the absence of broadband signal are indicative of stable
volumetric oscillations, which consistently have been associated with safe BBB
disruption [123–125]. Arvanitis et.al have explored the strength of the harmonic

51
emissions as a basis for such a controller, as they have found that one can reliably
detect it before inertial cavitation occurs and that it is correlated with the magnitude of
the BBB disruption measured via MRI contrast enhancement [123,125]. If one can
integrate a large number of receivers into the FUS system, one can use passive
reconstruction methods [205,206] to create two- or even three-dimensional maps of
the microbubble activity to ensure that it is occurring at the expected location.
1.8.7.3 Treatment Evaluation
As described above, contrast-enhanced imaging and T2*- or susceptibility-
weighted imaging can be used to verify that BBB disruption has occurred and whether
significant vascular damage has occurred, respectively. For tumors, it may be
necessary to compare the signal enhancement after contrast injection to measurements
obtained before FUS. However, as I show in section 6.1.2, the permeability changes
to a small molecule MRI contrast agent may be minimal for late stage tumors. Other
imaging modalities may also be useful [207]. If the contrast-enhanced imaging is
obtained before the therapeutic agent is injected, one can confirm that the BBB
disruption is only occurring at the targeted locations before administering the drug,
providing another level of control to ensure that drugs are delivered only to desired
52
regions.
Post-treatment imaging could be more useful if one could use it to estimate
drug uptake and penetration in the brain tissue. This can be achieved directly by
labeling the drug with a contrast agent for MRI or other modality [174]. It might also
be possible to use a standard contrast agent as a surrogate measurement. A number of
studies have related signal intensity changes of contrast-enhanced MRI at the end of
the sonication with tissue drug concentrations [95,175,208]. More quantitative and
repeatable techniques, such as estimating contrast agent concentrations via T1-
mapping [134,209] or vascular transfer coefficients via analysis of dynamic contrast-
enhanced MRI (DCE-MRI) [99] have been used to perform spatial and temporal
characterization of BBB permeability. DCE-MRI can also predict the resulting
payload of drugs [118] and in some cases in tumors [209]. I explored this method
with a liposomal agent in section 1.9. If one understands the relationship between the
concentrations of the therapeutic and the imaging contrast agent, which can perhaps
be established in animals, one might be able to titrate the drug administration to
achieve a desired level in the brain. However, this may be challenging in tumors,
where the vascular permeability can change over time [209].

1.9 Dynamic Contrast Enhanced Magnetic Resonance Imaging
The technique of dynamic contrast enhanced magnetic resonance imaging
(DCE-MRI), in which multiphase MRI scans are taken following the intravenous
injection of a contrast agent. It has broadly been used in past studies to compute the
permeability in applications such as embolic stroke, various types of cancer and
injuries, both in humans [210–212] and animals [209,213–215].
1.9.1 Pharmacokinetic Analysis of DCE-MRI
There are many kinetic models; however, the Toft and Kermode (TK) model
is usually used in clinical studies [216–218]. This model provides information about
the influx forward volume transfer constant from plasma into the extravascular
extracellular space (EES) and fractional volume of EES per unit volume of tissue.
1.9.1.1 Tofts and Kermode (TK) Model
The TK model is one of the popular compartment models, which assumes the
equilibrium of contrast media between the plasma and the EES and the isodirectional
permeability therefore, the equilibrium is described by
)/(/ etptranst CCKdtdC 1. 17
53

where t is the time, Ct is the concentration of contrast media (CM) in tissue, Cp
is the concentration of CM in plasma, Ktrans is the influx forward volume transfer
constant (into EES from plasma), and ve is the fractional volume of EES per unit
volume of tissue.
The original TK model (one-compartment, two parameter model) assumes the
concentration of the CM is derived from the EES components and the plasma
component is negligible:
1. 18 '.}]/))'(exp[{()'()(0
dtttKtCKtC etrans
t
ptranst
The modified TK model (two-compartment, three parameter model) assumes
the concentration of the CM is derived from the EES and plasma
),('}]/))'(exp[{()'()(0
tCdtttKtCKtC ppetrans
t
ptranst 1. 19
where υe is the fractional volume of plasma per unit volume of tissue.
Substituting Ct and Cp in equation (1.19) variables (Ktrans, vp, ve) can be esitimated.
Patlak analysis was used to estimate Ktrans and vp which assumed the value of the
exponential term is unity because either the back diffusion rate Ktrans/ve is small, t-t’
is small or both. Under this condtion equation (1.19) becomes
54

1. 20 ),(')'()(0
tCdttCKtC pp
t
ptranst
Dividing entire equation by Cp(t) gives a linear equation and it’s slope and
intercept gives the value of Ktrans and vp, respectively. For this analysis the required
value of Ct can be obtained from DCE-MRI. However, the relationship between the
signal intensity (SI) and the concentration of the CM is not linear, so the conversion
of the SI into the concentration of CM is needed. In our case, the agent Gd-DTPA
(Magnevist, Gd-DTPA; Bayer Healthcare; 0.25 ml/kg) as a CM was used.
The Gd-DTPA concentration was estimated as a function of time at each
image voxel with the following equation:
1. 21 CRTT 1101 /1/1
where T10 is T1 relaxation time before injection of Gd-DTPA, T1 is T1
relaxation times during the dynamic sequence (during and after injection of Gd-
DTPA), R1 is a constant (relaxation rate) of Gd-DTPA, which is 4.39 s−1 mM−1 [219]
and C is the concentration of Gd-DTPA during the dynamic sequence. Maps of T10
were generated by fitting the signal intensity of an spoiled gradient echo (SPGR)
sequence acquired at multiple flip angles as described elsewhere [220]. T1(t) was
estimated using a SPGR sequence with the following expression:
55

)0(
)(
)exp(cos1
)exp(1
],cos1
1log[
1
)(
1
10
10
1
S
tS
T
TRT
TR
A
whereA
A
TRtT
1. 22
where and TR are the flip angle and repetition time of the SPGR sequence,
respectively (more detail in chapter 1.13). S(t) is the signal intensity of the sequence
as a function of time, and S(0) indicating the signal intesnsity before the contrast
injection.
The concentration of Gd-DTPA in plasma Cp(t) can be written as Cp(t) = Cb
(t)/ (1-Hematocrit) where Cb(t) could be obtained by chosing a region of interest in a
vascular unit (ophthalmic artery ortransverse sinus) and value of hematocrit in rat was
adjusted for a 45% capillary hematocrit level [220].
1.10 Magnetic Resonance Imaging
1.10.1 Basic Principles of MRI
In the presence of external magnetic field B0 along z axis, a spin 1/2 nucleus
can have one of two energy states Figure1. 3 with corresponding energies [221]
0I γBmBμE 0z 1. 23
56

where mI = ±1/2 are the values of z-component of angular moment of the
nucleus, is gyromagnetic ratio with a typical value for hydrogen nucleus is 2.675
X 108 s-1 tesla-l, and = 1.05× 10⁻³⁴ J s is the Dirac constant.
Figure1. 3 Energy level splitting of a nucleus of spin I = 1/2 in a static magnetic field B0
The two energy leveles of the spin 1/2 nucleus depend on the relative
orientation of spin with respect to applied magnetic field. The nuceli with parallel and
anti-parallel spin orentations have low and high enerigies, respectively. The energy
difference (E) between two levels depend on the applied magnetic field as
0γBE 1. 24
The corresponing electromagentic frequency 0γB is called Larmor
frequency (42.6 MHz/Tesla) and at this frequency atomic nuclus precess in the
magnetic field. The value of magnetization in the direction of the applied field
(longitudinal magnetization) is the sum of z-component of the nuculear magnet within
unit volume and at thermal equilibrium this can be obtained by using Boltzman statics
kT4
BγNM 02
0 1. 25
57

58
is spin density. Fo RI p , the most used spin 1/2 nuclus is
hydrogen nucleus due to its abundance in animals. The magnetization due to the
hydrogen nuclues is the source of signal in a MRI. For the detection of the
magnetization, its direction is tilted away from B by applying radio frequency signals
with frequency equals to Larmor frequency. When RF pulses are applied, the nuclear
magnets start to distribute equally over the two energy states and gain the phase
coherence.The magnetization can be tilted completely in transverse direction
(perpendicular to B ) when the RF pulse is applied for long time. Immediately after
RF pulse application, the spins start to return to thermal equilibrium and lose phase
coherence. As a result the transverse magnetization (M ) begins to decay
exponentially as
where N r M urpose
0
0
20)(M T
t
eMt 1. 26
. In case of the inhomogeneous
applied magnetic field, an additional decay in magnetization happened with time
constant T2. In this case overall time constant is called T2* relaxation which can be
written as
where T2 is called the spin-spin relaxation time
'2
1
2
1
2
1
TTT 1. 27
59
e value of lon a ation (Mz) start to
increase as
At the same time, th gitudinal m gnetiz
)1()(M 10
T
t
z eMt 1. 28
lled spin-lattice rela ation. 1 and T2 relaxation times
depend on the medium and are responsible for much of the tissue contrast exploited in
standard MRI imaging sequences.
roperties of MRI is to visualize the specific structure
of biological tissue. The signal intensity depends on many parameters, including
proton density, T1 and T2 relaxation times. Different pulse sequence parameters such
as repetition time (TR) and echo time (TE) can vary with different bilogical tissues.
TR is the time between two consecutive RF pulses measured in milliseconds. For a
given type of nucleus in a given environment, TR determines the contributions to
image contrast arising from the spin-lattice relaxation time T1. The longer the TR, the
more the longitudinal magnetisation is recovered. Tissues with short T1 have greater
signal intensity than tissues with a longer T1 at a given TR. A long TR allows more
where T1 is ca x The T
1.10.2 MRI Sequences
One of the most useful p

60
magnetization to recover and thus reduces differences in the contribution of T1 to the
image contrast. Signals with differing T1 values will therefore not be reduced in
intensity to differing extents, giving rise to little or no T1-weighted contrast. TE is the
time from the application of an RF pulse to the measurement of the MRI signal. TE
determines how much decay of the transverse magnetisation is allowed to occur
before the signal is read. It therefore controls the spin-spin relaxation time T2 and
signal intensities in images will be weighted according to T2 values. The application
of RF pulses at different TRs and the receiving of signals at different TEs produces
variation in contrast in MRI images. A number of pulse sequences have been (and
continue to be) developed. Here, we briefly discuss two basic sequences that illustrate
the generation of T1-, T2- and T2*-weighted images. (1) The spin echo (SE) sequence
is the most commonly used pulse sequence to create T1-and T2-weighted images. The
sequence comprises two radiofrequency pulses - the 90 degree pulse that creates the
detectable magnetisation and the 180 degree pulse that refocuses it at TE. The
selection of TE and TR determines resulting image contrast. (2) Gradient echo (GRE)
sequences can be generated by means of reversal of a pulsed field gradient, rather
than by the introduction of a 180 degree pulse. Gradient echoes are commonly used in
rapid imaging sequences; they generate T2*-weighted images.

61
weight: 580Da) is a commonly-used anticancer drug
for treatment of a wide range of cancers. Also known as Adriamycin, it is an
anthracycline antibiotic derived from daunorubicin, which was isolated from the
pigment producing bacteria Streptomyces peucitis [222]. Doxorubicin is active
against leukemias and many solid tumours, including breast, endometrial, ovarian and
bladder cancers, as well as adult and pediatric sarcomas, either alone or more
commonly in combination with other drugs [223]. Typically administered as
infusions of 50 mg/m2 repeated every four weeks, the dose and frequency of
administration are limited by acute myelosuppression, the occurrence of which is
correlated with the integral of the plasma doxorubicin concentrations over time [224].
Figure1. 4 shows that intratumoral Doxorubicin concentration is strongly correlated
(R2 = 0.90) with patient response rate, irrespective of the type of cancer [225].
However, it has not typically used for brain related diseases because it can not pass
through the BBB. Walter et.al [226], showed that direct intratumoral infusion of
Doxorubicin prolonged the survival time in glioma patients. It is believed that
doxorubicin’s antitumour effect is due to its localization in the nucleus of tumour cells
where it binds to topoisomerase II and prevents resealing of the double helix during
1.11 Doxorubicin
Doxorubicin (molecular
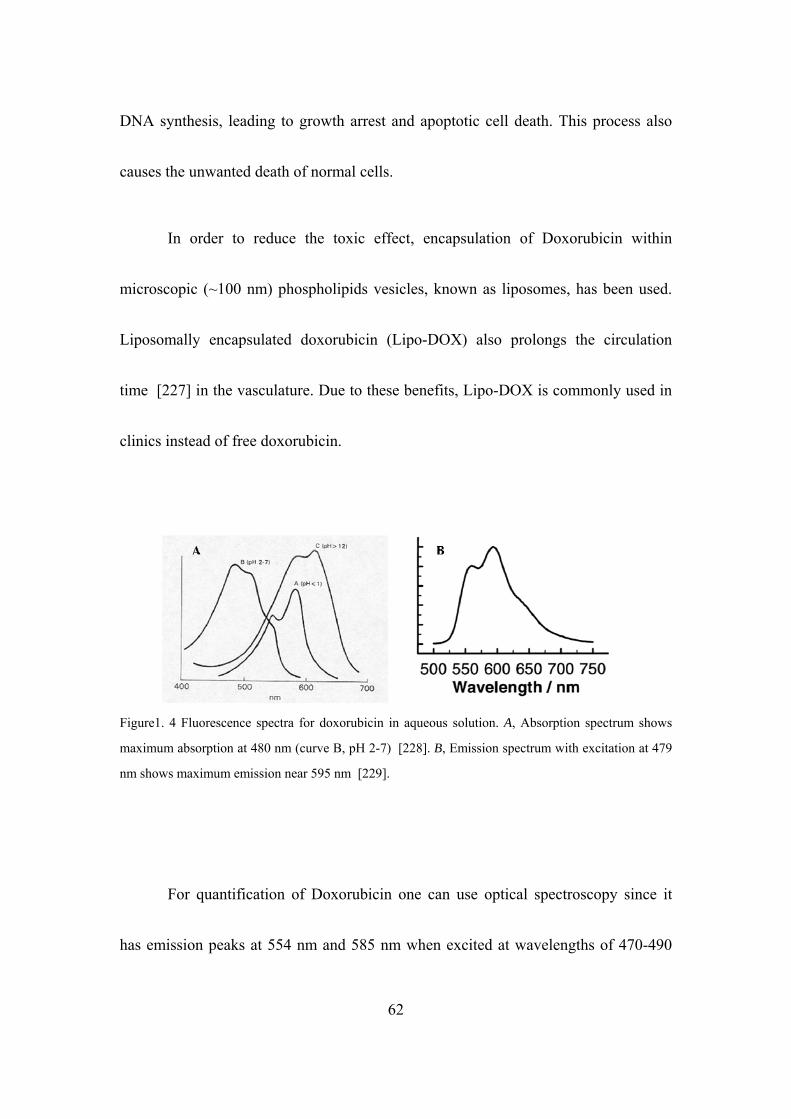
DNA synthesis, leading to growth arrest and apoptotic cell death. This process also
causes the unwanted death of normal cells.
62
In order to reduce the toxic effect, encapsulation of Doxorubicin within
microsc
opic (~100 nm) phospholipids vesicles, known as liposomes, has been used.
Liposomally encapsulated doxorubicin (Lipo-DOX) also prolongs the circulation
time [227] in the vasculature. Due to these benefits, Lipo-DOX is commonly used in
clinics instead of free doxorubicin.
Figure1. 4 Fluorescence spectra for doxorubicin in aqueous solution. A, Absorption spectrum shows
maximum absorption at 480 nm (curve B, pH 2-7) [228]. B, Emission spectrum with excitation at 479
For quantification of Doxorubicin one can use optical spectroscopy since it
has em
nm shows maximum emission near 595 nm [229].
ission peaks at 554 nm and 585 nm when excited at wavelengths of 470-490

63
of t is Thesis
Prior research work demonstrated that FUS can enhance the delivery of Lipo-
DOX i
The first set of experiments were focused on the study of the distribution and
quantif
nm [228,229].
1.12 Scope h
n normal brain through the BBB using high frequency (1.6 MHz) ultrasound
with a long exposure time [95]. In addition, a single treatment with FUS and Lipo-
doxorubicin in glioma tumor model showed an improvement ~24% compared to
untreated controls [115]. However, detailed quantification of the drug delivery
though BBB and therapeutic efficacy of multiple treatments have not been studied.
The overall objective of this thesis work was to investigate effect of low frequency
(0.69 MHz) transcranial FUS (similar to that used clinically) on the permeability of
the BBB/BTB, the pharmacokinetics of Lipo-DOX, and the therapeutic efficacy and
safety profile of multiple treatments with FUS+Lipo-DOX in an animal model.
ication of Lipo-DOX and the released free doxorubicin, both on a macroscopic
and a microscopic level. Here the doxorubicin concentrations after BBBD were
compared for cases when the agent was administered before and after ultrasound. The
findings of this study helped to establish the drug injection protocol to increase the

64
In the second set of experiments using the developed protocol for drug
injectio
Using the parameters established in the above safety study, the therapeutic
efficacy
The usefulness of MRI as a monitoring and feedback tool for the delivery of
Lipo-D
local penetration of Lipo-DOX across the BBB to achieve a high concentration of
doxorubicin for subsequent drug delivery experiments.
n, the effect of multiple sessions of FUS-induced BBB disruption with and
without Lipo-DOX were compared in the normal rat. Variations in the acoustic power
required to to disrupt the BBB were established over three weeks to take into account
the thickening of the skull as the rats grew. This safety study showed that FUS-BBBD
can be used for treatment at multiple times based on histological evaluation, and it
identified potential risks related to inertial cavitation.
of multiple treatment sessions with FUS-BBBD and Lipo-DOX was explored
in the 9L rat glioma model. These treatments were compared to control animals and to
animals who received treatments with FUS-BBBD or Lipo-DOX only. The impact of
multiple treatments on tumor growth rates, survival times and histology were
compared among these four groups.
OX was explored by comparing the transfer coefficient Ktrans for the MRI
65
Overall, these results provide evidence that the multiple treatments with this
ultrasou
contrast agent Gd-DTPA, which was measured using DCE-MRI, to the resulting
doxorubicin concentration in the tumor. Moreover, acoustic monitoring of bubble
activity during sonication was correlated with signal intensity of Gd-DTPA after
sonication.
nd-enhanced drug delivery technique has a good potential to enable the
effective use of Lipo-DOX for the treatment of brain tumor.
66
Chapter 2: Methods and Materials
2.1. Animals
The experiments performed in our laboratory were approved by our
institutional animal committee. The test subjects used were male Sprague-Dawley rats
(200-400 g) acquired from Charles River Laboratories (Boston, Massachusetts). In
preparation for imaging, surgery or sonication, the rats were anesthetized by i.p.
administration of ketamine (90 mg/kg) and xylazine (10 mg/kg) per hour, or as
needed. The hair covering the dorsal surface of the skull was removed with depilatory
lotion. For experiments requiring i.v. administration of contrast agents or
chemotherapy, a 24-gauge catheter was inserted into the tail vein.
All animals were cared for in accordance with our institutional animal care
policy. For animals in experiments of ultrasound-mediated drug delivery, animals
were euthanized by transcardiac methods with normal saline 1-4 h after the last
sonication. For animals which were implanted with glioma for the survival study,
euthanasia of those exhibiting severely impaired activity or weight loss exceeding
20% within one week, tumor dimensions exceeding 10–11 mm, or if treatment-related
severe adverse events occurred that caused pain or distress and that could not be

67
ameliorated. Euthanasia in these animals was conducted by transcardial perfusion
with saline followed by 10% phosphate-buffered formalin while under deep
anesthesia. The animals employed in the safety study that did not exhibit such poor
outcomes were euthanized approximately seven weeks after the last treatment by
transcardial perfusion with saline followed by 10% phosphate-buffered formalin
while under deep anesthesia.
2.2 Ultrasound Transducer
For all experiments, the ultrasonic fields were generated by a single-element,
spherically curved, air-backed piezoelectric (PZT-Lead zirconium titanate) transducer
(manufactured in-house) with a diameter of 100 mm, radius of curvature of 80 mm,
and resonant frequency of 0.690 MHz (Figure 2. 1). The electrical impedance of the
transducer was matched to the output impedance of the amplifier by means of an
inductor-capacitor circuit contained within an external matching box. The function
generator, amplifier, power meter, and matching circuit were part of the MRI-
compatible FUS system described below in section 2.1.3

Figure 2. 1 A single-element, spherically curved, air-backed piezoelectric transducer with a diameter of
100 mm, radius of curvature of 80 mm, and resonant frequency of 0.690 MHz.
2.1.2.2 Transducer Characterization
Figure 2. 2 shows the characteristic beam plots of the 0.690 MHz transducer,
which produced a ellipsoid focal spot with diameter and length of 2.3 mm and 12 mm,
respectively, at half-maximum pressure amplitude. The plots were created by
scanning a needle hydrophone (ONDA, Sunnyvale,CA) in a raster pattern
perpendicular (top) and parallel (bottom) to the direction of the ultrasound beam.
68

Figure 2. 2 Characteristic beam plots of the intensity for the 0.69 MHz transducer
2.1.2.3 Transducer Calibration
The transducer efficiency was measured using an acoustic radiation force
balance system [51]. The system is based on the principle that an acoustic wave
exerts a force F on an absorbing target that is proportional to the total ultrasonic
power (P) intercepted by the target surface. The radiation force (F) is
v
DPF 2. 1
where v is the propagation velocity of the wave in water and D is a constant
that depends on the type of interaction between the target and beam. For a perfect
absorber D = 1. If R is the radius of curvature of the transducer, L is the focal length,
and the angle of incidence is zero degrees, then the force measured along the beam
axis is
])[()2
)(( 2
1222 LLR
R
L
v
PF 2. 2
The transducer was immersed in degassed, deionized water (pO2 <1 ppm) and
driven at peak-to-peak voltages ranging from 0.01-0.09 V in 10 mV steps. A densely
bristled brush was used as the absorbing target to encompass the complete acoustic
beam emitted by the transducer. The brush was suspended in the water by a thin wires
69

70
attached to an electronic scale so that its face lay directly opposite the transducer. For
each voltage, the acoustic power output of the transducer was calculated from the
force exerted on the brush, which was measured by the change in weight of the
absorbing brush. The output acoustic power was averaged over three measurements
was divided by the input electrical power to compute the efficiency of the transducer
(Table 2.1). Measurements made at the lowest applied voltage were disregarded.
Table 2. 1 Acoustic efficiency of air-backed single-element transducer. Frequency: 0.69 MHz; Radius
of curvature: 80 mm; Diameter: 100 mm; F number: 0.8.
Applied Voltage (V) Electrical Power (W) Acoustic Power (W) Efficiency (%)
0.01 0.025 0.0059 23 0.02 0.112 0.089 80 0.03 0.25 0.19 76.5
0.039 0.42 0.39 76.9 0.04 0.44 0.41 78
0.041 0.46 0.42 77 0.042 0.48 0.44 78.5 0.043 0.5 0.47 78 0.044 0.53 0.48 77.7 0.045 0.56 50 76 0.05 0.68 0.53 77.6 0.06 0.99 0.76 77.5 0.07 1.36 1.05 76.9 0.08 1.77 1.35 76 0.09 2.25 1.56 70.6

71
2.1.2.4 Estimated Pressure Amplitude in the Brain
Throughout this thesis, the reported exposure levels are absolute peak negative
pressure amplitudes measured in water with a membrane hydrophone (Marconi; 0.5
mm diameter). Attenuation by the brain and rat skull is expected to reduce the
pressure amplitude by ~30% at this frequency [198] with additional uncertainty
arising from standing waves within the skull and increases in skull thickness as the
animal ages [230].
2.3 Experimental Set-up
The sonication system was operated within a clinical 3T MRI scanner (Signa;
GE Healthcare). The transducer was immersed in a small tank of degassed, deionized
water and attached to an MRI-compatible, manually-operated positioning system
(Figure 2. 3). The animal was laid supine on a tray above this tank, with a water bag
providing an acoustic path to the dorsal surface of the head. The animal's body
temperature was maintained with a heated water pad. Before treatment, the heating in
a silicone phantom was visualized using temperature-sensitive MRI to localize the
acoustic focal point in the MRI coordinate space.

Figure 2. 3 Schematic of the MRI-guided FUS system. Inside the MRI magnet room, the transducer
was mounted on a manual MRI-compatible 3-D positioning system and immersed in a water tank
integrated into the MRI table. Outside the magnet room, a network consisting of a function generator,
power amplifier, power meter, and dual directional coupler served to control the transducer. The animal
was laid supine on a tray above this tank, with a water bag providing an acoustic path to the dorsal
surface of the head.
2.4 Magnetic Resonance Imaging
The experimental set-up shown in Figure 2-3 was integrated into the table of a
3-Tesla clinical MRI scanner (Signa; General Electric Healthcare) for image guidance
and evaluation. Each animal was placed on the table in the supine position with the
dorsal surface of the head centered on a 7.5-cm-diameter transmit/receive surface coil
(constructed in-house).
For all BBB disruption experiments, two-dimensional T2-weighted fast spin-
echo (FSE) images were acquired in three orthogonal planes to plan the sonications
(parameters: repetition time (TR): 2000 ms; echo time (TE): 79.7 ms; echo train
72

73
length (ETL): 8; matrix size: 256×256; slice thickness/spacing: 1 mm/interleaved;
field of view (FOV): 8 cm; number of excitations/averages (NEX): 2; bandwidth:
15.63 kHz). The target site for BBB disruption was identified on the MR images and
the transducer repositioned accordingly. Sonications were performed through the
opening of the surface coil, which was filled with a plastic bag [poly(vinyl chloride),
thickness ~75 μm] containing degassed water. After ultrasound-mediated BBB
disruption was completed, a bolus of gadopentatate dimeglumine (Gd-DTPA) MRI
contrast agent (Magnevist; Berlex Laboratories, Wayne, NJ; 0.125 mmol/kg; 0.25
mL/kg; molecular weight: 938 Da) was injected into the tail vein and T1-weighted
fast spin-echo (FSE) images (repetition/echo time (TR/TE): 500/17 ms; echo train
length (ETL): 4; matrix size: 256 x 256; slice thickness: 1 mm; field of view (FOV): 8
cm; number of excitations (NEX): 2; flip angle (FA): 90 degrees) brain were acquired
in three orthogonal planes to confirm BBB permeabilization. Axial three-dimensional
T2*-weighted fast spoiled gradient echo images were also acquired (TR/TE: 33.3/19
ms; matrix size: 256×256×28; slice thickness: 0.8 mm; FOV: 8 cm; NEX: 1; flip
angle: 15°; bandwidth: 15.63 kHz). These images are sensitive to small susceptibility
changes and were used for detecting iron-containing petechaie caused by excessive
FUS [114] and hemorrhagic regions within the tumor and additional images were

74
acquired as needed.
2.5 Fluorometry
A benchtop cuvette fluorometer (VersaFluor; Bio-Rad Laboratories, Hercules,
California) with changeable filters was used to quantify doxorubicin accumulation in
brain tissue. Because doxorubicin absorbs the most light between approximately 473
nm and 494 nm and emits maximal fluorescent light at about 590 nm [229,231],
fluorescence measurements were performed using filters with excitation and emission
wavelengths of 480 ± 10 nm and 590 ± 5 nm, respectively.
To calibrate the fluorometer for doxorubicin quantification, a serial dilution of
doxorubicin in acidified alcohol was used to measure the fluorescent signal of the
extracted supernatant. The gain of the VersaFluor fluorometer was set to medium for
doxorubicin concentrations of 100-1000 ng/mL. For lower doxorubicin concentrations
of 10-100 ng/mL, the fluorometer was not sensitive enough to differentiate small
differences in concentration using medium gain, so the gain was set to high. For each
experiment, a freshly prepared solution of acidified alcohol was used as a "blank" to
zero the fluorometer. Figure 2. 4 shows the calibration curves used to convert the
fluorometric readings to doxorubicin concentration.

Figure 2. 4 Calibration curves for fluorometric measurements of doxorubicin concentration showing a
strong linear correlation between the arbitrary fluorometric units and the doxorubicin concentration for
medium gain (R2 = 0.99) in A and high gain (R2 = 0.99) in B. The calibration coefficients were
obtained after forcing each linear fit through zero.
2.6 Targeted Doxorubicin Delivery through Blood Brain and Blood Tumor Barrier using Transcranial MRI-guided Focused Ultrasound
The first step towards developing a protocol for targeted drug delivery across
the BBB/BTB in a standard pre-clinical rodent model was the modification of the
ultrasound parameters needed to achieve reproducible, localized BBB/BTB disruption
in rats. Although ultrasound is strongly attenuated in bone, past studies had shown
that the skull of the rat is thin enough to permit the focusing of the ultrasound beam
75

76
sufficient to induce localized BBB opening [Refs].
2.6.1 Sonications
Energy was delivered in pulsed sonications with burst length of 10 ms and
pulse repetition frequency of 1 Hz (i.e., 10 ms ON followed by 990 ms OFF; duty
cycle: 1%) for 60 s. Each sonication was accompanied by a bolus of a microbubble-
based ultrasonic contrast agent (Definity, Lantheus Medical Imaging; N. Billerica,
MA) 0.01 mL/kg) into the tail vein catheter. Each mL of Definity contains a
maximum of 1.2 × 10¹⁰ microbubbles, which are composed of octafluoropropane gas-
filled lipid shells with a mean diameter of 1.1-3.3 × 10⁻⁶ m. The administration of 0.01
mL/kg Definity was as a bolus approximately 9 s before sonication, followed by a 0.2
mL saline flush. To facilitate the injections of such a small volume, the Definity was
diluted to 0.1× normal concentration in phosphate buffered saline (PBS). Multiple
sonications in an individual rat were spaced 3-5 min apart to allow time for vascular
clearance of most of the Definity, which has a pulmonary elimination half-life of 1.9
min in humans.
The pressure amplitude 0.4 MPa was initially set based on a prior study in rats
with this device [232] for BBB disruption. The range from 0.55 to 0.81 MPa based

77
on empirical observations on the exposure level needed to achieve a consistent level
of BBB disruption as the age and weight of the animals increased. This observation
was made in our initial treatments and is similar to previous reports that demonstrated
that the skull becomes thicker as the animal ages [198].
Once the parameters for consistent BBB disruption by transcranial sonication
were modified as needed, the technique to aid in the targeted delivery of Lipo-DOX in
the rat brain was adapted. In the first set of experiment, the central aim was to develop
a drug injection protocol for ultrasound-mediated BBB disruption which would allow
Lipo-DOX to accumulate at sufficient levels in the normal in rat brain to have a
therapeutic effect and in the second set, to visualize and quantify the resulting
doxorubicin distribution at the focal plane.
2.6.2 Chemotherapy
In our experiments, a chemotherapy agent was administered intravenously.
Doxorubicin hydrochloride encapsulated in long-circulating pegylated liposomes
(Dox-NP; Avanti POLAR LIPIDS, INC., Alabaster, AL; 5.67 mg/kg, Half life in
plasma: 2-3 days) was selected for targeted delivery through the blood-brain barrier.
In this form, greater than 90% of the drug is encapsulated within the liposomes. Once

78
the liposomes pass from the vascular compartment to the parenchyma, the liposome is
degraded by endogenous enzymatic processes, and the encapsulated doxorubicin is
released in the tissue. In the first set of experiments, a drug injection protocol which
would deliver a therapeutic level of Lipo-DOX through the BBB was sought to be
identified.
2.6.3 Effect of Drug Injection Protocol on Doxorubicin Delivery to the
Brain
The experimental set-up of the first study was used. A peak negative pressure
amplitude of 0.55 MPa was used to provide BBB disruption to deliver Lipo-DOX to
the brain. The sonications were delivered at 3-5 min intervals in a grid pattern
(spacing: 1-1.5 mm) to 9 targets.
In the first set, the rats were assigned in two groups: (A) Lipo-DOX injection
before FUS (N = 5), (B) Lipo-DOX injection after FUS (N = 4). For the animals in
group A, both hemispheres were sonicated. A full dose of Lipo-DOX (5.67 mg/kg)
was divided into a 9 fractions in the first sonicated hemisphere; one fraction was
administered before each sonication in this hemisphere. Since Lipo-DOX has such a
long circulation time, we assumed that a full dose was already in the circulatory
79
system of the subject, so we did not administer any additional drug before sonication
in the contralateral hemisphere. For the animals in group B, only one hemisphere was
sonicated and the other hemisphere served as a control. A full dose of Lipo-DOX was
administered 10 minute after the sonications.
2.6.3.1 Fluorometric Assay
Trypan blue (Aldrich Chemical Company, Inc. Milwaukee, WI, USA;
2.5ml/kg) was administered through the tail vein after the completion of the
sonications and imaging to further confirm successful BBB disruption and to mark the
target site of sonication for tissue harvesting. Each animal was put into a state of deep
anesthesia with an overdose of ketamine and xylazine. To flush unabsorbed Lipo-
DOX from the cerebral vasculature, the brain was perfused by transcardiac methods
with normal saline 4 h after the last sonication. The site of BBB disruption,
identifiable by its trypan blue stain, was harvested along with nonsonicated control
tissue. The concentration of Lipo-DOX of each tissue sample was determined by
taking the average of at least three fluorometric readings on a benchtop fluorometer.
80
2.6.3.2 Extraction and Quantification of Doxorubicin
A preparation of acidified alcohol (0.3 N HCl in 50% EtOH) was used to
extract doxorubicin from harvested tissue samples for fluorometric
quantification [233]. For these minute samples, the tissue density was assumed to be
approximately 1 g/cm3. Thus, the mass of each sample was equal to its volume. The
mass of each sample was measured and cut down until was approximately 30 mg.
Each sample was put into a 1.5-mL centrifuge tube with 20 volumes (400-500 μL) of
acidified alcohol, then homogenized with a tissue blender (Next Advance, Averill
Park, NY), refrigerated for 24 hours at 4ºC. Samples were then centrifuged at 16,000×
g for 25 min. at 4ºC. The supernatant was extracted for immediate fluorometric
reading using a benchtop fluorometer (VersaFluor; Bio-Rad Laboratories, Hercules,
CA; Ex/Em: 480/590 nm) or stored at -80ºC.
2.6.3.3 Statistical Analysis
Sonicated and contralateral control paired samples were compared using a
two-tailed paired student’s t-test. Values of p < 0.05 were considered statistically
significant. Additional analyses included least-squares linear regression and
calculation of correlation coefficients.
81
2.6.4 Fluorescence Imaging
In the second set of experiments, a fluorescent microscope was used to
visualize the distribution of doxorubicin in the brain after treatment with ultrasound-
induced focal BBB/BTB disruption and intravenous Lipo-DOX administration.
Doxorubicin has excitation maximum of 480 nm and emission maximum at 590 nm
respectively. Fluorescence images were acquired using a fluorescent microscope
Observer.Z1 with the X-Cite 120Q series light source and a AxioCam MRm mounted
camera (Zeiss, Germany) with 10× objective, 1.6x optovar, and a 500 ms exposure
time. High resolution images of different tissue sections were obtained in tiles using a
motorized stage so that the distribution of doxorubicin was obtained for the entire
tissue section.
2.6.4.1 Tissue Preparation
The rat brain was flash frozen in dry ice with 2-methylbutane (Fisher,
Pittsburgh PA). For tissue sectioning, the frozen rat brain was mounted with a
minimal amount of optimal cutting medium (OCT) compound (the owner of the
cryostat did not want OCT to come into contact with the cryotome blade), and
sectioned at a 20µm thickness using a Microm HM550 cryostat (Mikron Instruments

82
Inc, Vista, CA). The specimen temperature was set at -19ºC and the chamber
temperature at -20ºC. Tissue sections were thaw-mounted on microscope glass slides
(Fisher, Pittsburgh PA) for fluorescence imaging.
2.7 Multiple Sessions of Liposomal Doxorubicin and Ultrasound-Mediated Blood-Brain Barrier Disruption: A Safety Study in the Rat Brain
After the identification of the Lipo-DOX injection protocol that could deliver
a therapeutic level of Lipo-DOX through the BBB and showed the doxorubicin
distribution in the sonicated area with fluorescence microscope, the safety profile of
this delivery was investigated in normal rat brain.
2.7.1 Study Design
Lipo-DOX (5.67mg/kg) was administered intravenously. That dosage was
selected on the basis of prior work testing this agent in rats [234]. Nine rats were
assigned to one of two groups: (1) three weekly treatments with FUS and concurrent
chemotherapy (FUS+Lipo-DOX) (N=5), (2) three weekly treatments with FUS only
(N=4). After determining the coordinates of the focal point within the MRI space,
treatment planning MRI was acquired, and the focal region was positioned so its
center was 2 mm lateral to the midline and 4 mm deep from the dorsal brain surface.
83
They were centered 2.5 mm anterior to the bregma in the striatum. The striatum was
of interest because that was the place where 9L-rat glioma tumors were grown and
treated [170]. Sonications (0.69 MHz; 0.55-0.81 MPa; 10 ms bursts; 1 Hz PRF; 60s
duration) were performed in a grid pattern at 5, 9, and 12 targets, respectively. Before
each sonication, ultrasonic contrast agent (Definity, Lantheus Medical Imaging; 0.01
mL/kg) was administered intravenously. To facilitate the injections of such a small
volume, the agent was diluted to 0.1× normal concentration in PBS. It was injected as
a bolus approximately 9 s before each sonication, followed by a 0.2 mL saline flush.
Lipo-DOX was administered intravenously over multiple slow injections just before
each sonication.
2.7.2 Magnetic Resonance Imaging
MRI was used to evaluate and monitor treatment effects. T2-weighted imaging
was used to plan the treatments. BBB disruption was evaluated using T1-weighted
imaging acquired before and after administration of the MRI contrast agent
gadopentatate dimeglumine (Magnevist Gd-DTPA; Bayer Healthcare; 0.25 mL/kg).
T2*-weighted imaging was used to confirm that petechaie, which are produced by
excessive FUS exposures, did not occur [114] .
84
2.7.3 Histology
All of the animals from FUS-Only and FUS+Lipo-DOX were sacrificed
seventy days from the first treatment to evaluate the histological effects. The animal
was deeply anesthetized with ketamine/xylazine, sacrificed, and the brain fixed via
transcardial perfusion (0.9% NaCl, 100 mL; 10% buffered formalin phosphate, 250
mL). The brain was then removed, embedded in paraffin, and serially sectioned at 5
μm sections in the axial plane (perpendicular to the direction of ultrasound beam
propagation). Every 50th section (250 μm apart) was stained with hematoxylin and
eosin (H&E). The author who evaluated the histology was blind to the FUS exposure
parameters.
2.8 Multiple Treatments with Liposomal Doxorubicin and Ultrasound-Induced Disruption of Blood-Tumor and Blood-Brain Barriers Improve Outcomes in a Rat Glioma Model
The therapeutic efficacy of the technique was investigated in rats with
implanted aggressive glioma using the same paramaters used in the experiments
where the safety profile for multiple treatments with FUS only and FUS +
doxorubicin were investigated. The following steps were involved in this work.

85
2.8.1 Cell Culture
9L rat gliosarcoma cells (passage number 3, obtained from the Neurosurgery
Tissue Bank at University of California-San Francisco) were grown in Minimum
Essential Medium (1×) with Earle's salts, supplemented with 10% fetal bovine serum,
1% L-glutamine, 1% MEM nonessential amino acids, and 0.1% gentamicin in a 5%
CO2 chamber held at 37°C.
2.8.2 Tumor Implantation
In the anesthetized rat, the dorsal surface of the skull was sterilized with an iodine
swab. A 5-mm skin incision was made and a 1-mm burr hole was drilled into the skull
approximately 1 mm anterior to the bregma and 2 mm lateral to the midline. A 4 μl
volume of cell suspension (1 × 10⁵ cells) was injected into the right caudate putamen
at a depth of 3.5 mm relative to the dural surface using a 10 μl gas-tight syringe
(Hamilton). The cells were injected over a period of 5 min. Two min later, the needle
was retracted slowly over another 5 min, and the skin was closed with 5-0 silk sutures
(Ethicon, Somerville, New Jersey). The rat recovered from anesthesia under
observation. Each animal was given a one-time dose of antibiotic (Baytril, 2.5 mg/kg;
Bayer HealthCare, Wayne, New Jersey) and analgesic (Buprenex, 0.05 mg/kg; Reckitt

86
Benckiser Healthcare, Hull, England, UK) every 12 h for 24 h following surgery by
i.p. administration. The sutures were removed 5 days later, and treatment began on
day 7 or 8, at which point the tumor had an MRI-evident diameter between 1 and 3
mm.
2.8.3 Study Design
The rats were randomly assigned to one of four groups: (1) no treatment
(Control) (N=7), (2) three weekly treatments with FUS-induced BBB/BTB
permeabilization (FUS-Only) (N=8), (3) three weekly treatments with liposomal
doxorubicin (Lipo-DOX-Only) (N=6), and (4) three weekly treatments with FUS and
concurrent chemotherapy (FUS+Lipo-DOX) (N=8). The animals were monitored
regularly to evaluate the treatment effects on survival and tumor growth. Animals
surviving 6 weeks after treatment were considered long-term survivors. However,
some were followed for longer periods for later histological examination, as they
appeared healthy. The animals were euthanized if they exhibited severely impaired
activity, weight loss exceeding 20% within one week, tumor dimensions exceeding
10–11 mm, or if treatment-related severe adverse events occurred that caused pain or
distress and that could not be ameliorated. The animals were euthanized via

87
transcardial perfusion with saline followed by 10% phosphate-buffered formalin
while under deep anesthesia. The brain was removed and immersed in 10%
phosphate-buffered formalin for histological preparation. To avoid skin infections that
were observed in two animals (Table 5. 1), animals receiving FUS and chemotherapy
were treated with an antibiotic Baytril (Bayer; 2.5 mg/kg).
2.8.4 Sonication
Animals in group 2 (FUS only) and 4 (FUS+Lipo-DOX) were provided
treatment with microbubble-enhanced MRI-guided FUS. After determining the
coordinates of the focal point within the MRI space, treatment planning MRI was
acquired, and the focal region was positioned within the tumor. Sonication parameters
were the same as in the safety study and consisited of multiple points in and around
the tumor combined with microbubbles. The sonications were delivered at 5 min
intervals in a grid pattern (spacing: 1 or 1.5 mm, depending on tumor volume) to 5-20
targets, with the number of locations increasing over the three weeks as the tumor
volume increased. The central aim was to permeabilize the BTB in the entire tumor
and the BBB in a surrounding rim of at least 1 mm.

88
2.8.5 Chemotherapy
Animals in group 3 (Lipo-DOX Only) and 4 (FUS+Lipo-DOX) were
administered chemotherapy. For chemotherapy, 5.67 mg/kg of Lipo-DOX was
administered intravenously. In initial experiments (5 rats in Lipo-DOX Only group; 5
in FUS + Lipo-DOX group), DOXIL (Centocor Ortho-Biotech) was used. Due to a
current national shortage of this agent that occurred during these experiments, Lipo-
Dox (TTY Biopharm) was used for the remaining animals (1 rat in the Dox-Only
group; 3 in the FUS+Lipo-DOX group). For the FUS+Lipo-DOX group,
chemotherapy was administered over multiple slow injections administered just
before each sonication. For the Lipo-DOX Only group, the agent was administered
over 5 slow injections at 5 min intervals. This scheme was adopted from chapter 2.6.3.
Each injection was followed by a 0.2 mL saline flush.
2.8.6 Magnetic Resonance Imaging
T2-Weighted imaging was used to plan the treatments and measure tumor
volumes. BBB/BTB disruption was evaluated using T1-weighted imaging acquired
before and after administration of the MRI contrast agent gadopentatate dimeglumine
(Magnevist Gd-DTPA; Bayer Healthcare; 0.25 mL/kg). T2*-Weighted imaging was

89
used to investigate whether petechiae, which are produced by excessive FUS
exposures, did not occur [114] and to evaluate hemorrhagic regions in the tumors.
2.8.7 Image Analysis
Non-contrast MRI imaging was performed weekly (±1–3 days depending on
MRI availability). Tumor boundaries were manually segmented in axial T2-weighted
images using ImageJ; the volume was calculated by the sum of the areas multiplied by
the image thickness. In weeks 1–2, the tumors appeared as clearly circumscribed
volumes, which were sometimes surrounded by hyperintense regions (presumably
edema). These boundaries were sometimes not evident at later times in the
FUS+Lipo-DOX group, and it was not clear whether MRI abnormalities were
residual/recurring tumor or treatment-related effects. To be conservative, such cases
were included in the volume calculations.
2.8.8 Histology
Representative examples from the Control (4/7 animals) and FUS-Only (5/8
animals) groups were selected for histological examination. The treatment response
varied for animals in the Lipo-DOX Only and FUS+Lipo-DOX groups (see Table 5.
90
1) and all brains from these animals were examined. Tissue blocks containing the
tumor were embedded in paraffin and cut into 4–6 μm serial sections perpendicular to
the direction of ultrasound propagation. Sections with the largest evident tumor were
stained with H&E for examination in light microscopy.
2.8.9 Statistical Analysis
Tumor volumes for the four groups were compared using one-way ANOVA.
The Kaplan–Meier method was used to compare survival of animals in each group.
Significance was calculated by using log-rank test with Yates' correction. These
analyses were performed using Matlab (MathWorks) and Microsoft Excel. The
Bonferroni method was used to compare multiple pairs of groups [235]. With four
treatment groups (including controls) and with six possible paired comparisons, pair-
wise P values less than the Bonferroni-corrected threshold of 0.05/6 = 0.0083 were
considered statistically significant.
2.9 Enhancement in Blood-Tumor Barrier Permeability and Delivery of Liposomal Doxorubicin using Focused Ultrasound and Microbubbles: Evaluation during Tumor Progression in a Rat Glioma Model
After the therapeutic efficacy of the technique was investigated in a rat glioma

91
model, DCE-MRI was used to characterize the FUS-induced permeability changes of
the BBB/BTB at different times after implantation, and these changes were related to
the doxorubicin concentrations.
2.9.1 Bilateral Tumor Implantation
The previously described techniques for tumor cell implantation were adopted
for a bilateral tumor model where 9L rat gliosarcoma cells were injected into both the
right and left caudate putamen at a depth of 3.5 mm relative to the dural surface.
Tumors on both hemispheres were observed in MRI on day 7 or 8. Animals were
included in the study if the tumors on both hemispheres were approximately the same
size: a diameter between 1-3 mm on day 7 or 8. The animals were euthanized if they
exhibited severely impaired activity, weight loss exceeding 20% within one week, or
tumor dimensions exceeding 10-11 mm.
2.9.2 Study Design
The rats were randomly assigned to one of three groups where FUS was
applied on day 9, day 14, or day 17 after implantation (N=5 for each group). After
determining the coordinates of the focal point within the MRI space, the focal region

92
was positioned in the tumor in the right hemisphere. The nonsonicated left tumors
served as controls. Ultrasound bursts were then applied at multiple points in and
around the tumor at pressures amplitudes ranging from 0.55-0.81 MPa (burst length:
10 ms, pulse repetition frequency: 1 Hz, duration: 60 s). Before each sonication,
ultrasonic contrast agent (Definity, Lantheus Medical Imaging; 0.01 mL/kg) was
administered intravenously. To facilitate the injections of such a small volume, the
agent was diluted to 0.1× normal concentration in PBS. It was injected as a bolus
approximately 9 s before each sonication, followed by a 0.2 mL saline flush. The
sonications were delivered at 5 min intervals in a grid pattern (spacing: 1.5 mm) to 5-
20 targets, depending on the tumor volume. The goal was to permeabilize the BTB in
the entire tumor and the BBB in a surrounding rim of at least 1 mm. For drug delivery,
5.67 mg/kg of Lipo-DOX was administered in fractions over multiple slow injections
intravenously just before each sonication Each injection was followed by a 0.2 mL
saline flush.
2.9.3 Magnetic Resonance Imaging
T2, T1-contrast and T2* weighted images were obtained as described above. In
addition, DCE-MRI was performed before and after the sonications. For T1-mapping,

93
a spoiled gradient echo (SPGR) sequence (TR/TE: 9.9/4.8 ms; matrix size: 256×256;
slice thickness: 2 mm; FOV: 8 cm; Scan time for each flip angle: 15.3s; bandwidth:
31.25 kHz) acquired at multiple flip angles (30/20/15/10/2°). For the DCE imaging,
eight pre-contrast sets of SPGR images (TR/TE: 9.9/4.8 ms; matrix size: 256×256;
slice thickness: 2 mm; FOV: 8 cm; Scan time: 534.6s flip angle: 35°; bandwidth:
31.25 kHz) were acquired. Then, a bolus of Gd-DTPA (2x 0.25 mL/kg) was
administered I.V. and an additional 62 sets of SPGR images were acquired with a
temporal resolution of 7.6 s for 8 min. A double dose of Gd-DTPA was used in order
to secure the presence of a bolus peak in the vascular system to determine the arterial
input function (AIF) and to obtain accurate tissue concentrations [236]. Identical slice
locations were used for T1 mapping and DCE-MRI. These measurements were made
before and after FUS-BBBD in the right tumor. The time interval between
measurements was at least an hour to avoid excessive Gd-DTPA accumulation.
2.9.4 Fluorometric Assay and Doxorubicin Extraction
After the completion of the sonication and imaging session, Trypan Blue was
administered through the tail vein to mark the regions where the BBB was disrupted
and to improve visualization of the tumors. Animals were deeply anaesthetized with
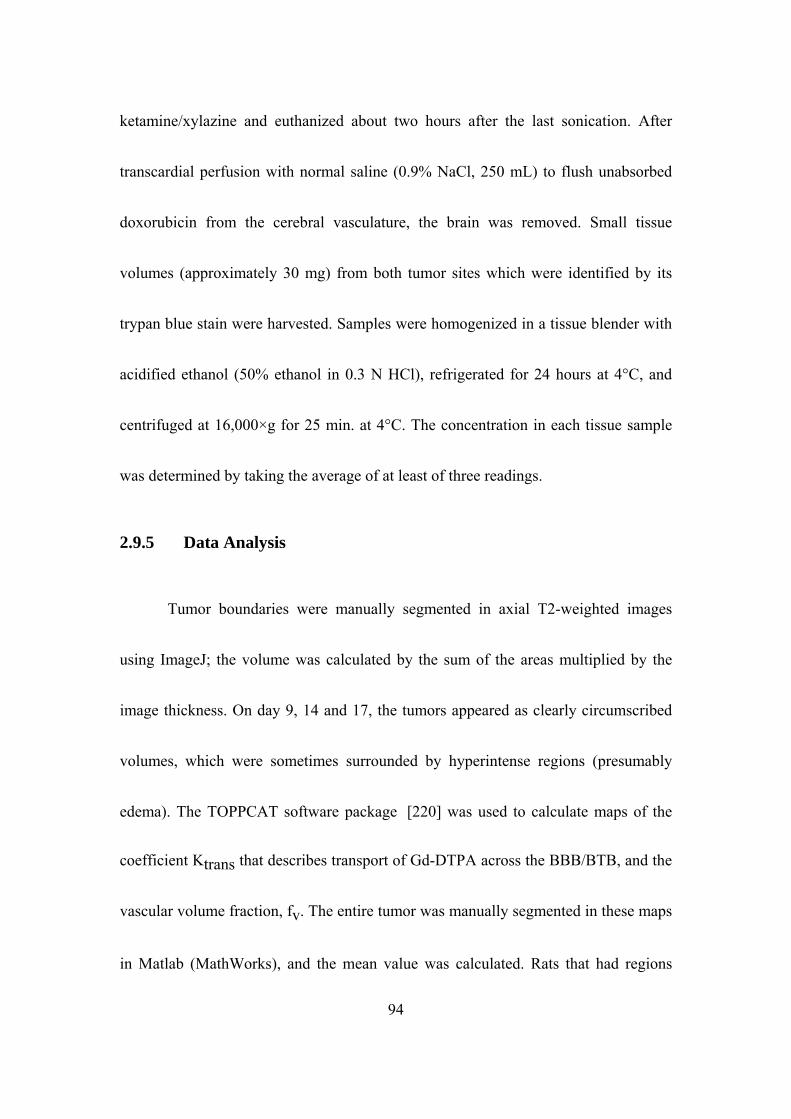
94
ketamine/xylazine and euthanized about two hours after the last sonication. After
transcardial perfusion with normal saline (0.9% NaCl, 250 mL) to flush unabsorbed
doxorubicin from the cerebral vasculature, the brain was removed. Small tissue
volumes (approximately 30 mg) from both tumor sites which were identified by its
trypan blue stain were harvested. Samples were homogenized in a tissue blender with
acidified ethanol (50% ethanol in 0.3 N HCl), refrigerated for 24 hours at 4°C, and
centrifuged at 16,000×g for 25 min. at 4°C. The concentration in each tissue sample
was determined by taking the average of at least of three readings.
2.9.5 Data Analysis
Tumor boundaries were manually segmented in axial T2-weighted images
using ImageJ; the volume was calculated by the sum of the areas multiplied by the
image thickness. On day 9, 14 and 17, the tumors appeared as clearly circumscribed
volumes, which were sometimes surrounded by hyperintense regions (presumably
edema). The TOPPCAT software package [220] was used to calculate maps of the
coefficient Ktrans that describes transport of Gd-DTPA across the BBB/BTB, and the
vascular volume fraction, fv. The entire tumor was manually segmented in these maps
in Matlab (MathWorks), and the mean value was calculated. Rats that had regions

95
within either tumor with little or no signal enhancement after Gd-DTPA
administration were excluded, as these regions were assumed to be necrotic.
2.9.6 Statistical Analysis
Tumor volumes, measurements of Ktrans and fv, and doxorubicin
concentrations for the sonicated and non-sonicated tumors were compared using
unpaired, two-tailed t-tests. Comparisons of Ktrans and fv before and after sonication
were made using a paired t-test. Other analysis included linear least-squares
regression and calculation of correlation coefficients. Data analysis was performed
using Matlab and Microsoft Excel.
2.9.7 Histology
Two additional animals, one animal with tumors at day 9 and one at day 14,
were sacrificed 4 hours after the last sonication via transcardial perfusion with 0.9%
NaCl solution followed by 10% phosphate-buffered formalin while under deep
anesthesia with ketamine and xylazine. Brains were harvested and fixed in formalin.
Tissue blocks containing the tumor were embedded in paraffin and cut into 4-6 μm
serial axial sections. The section with biggest tumor was stained with hemotoxylin
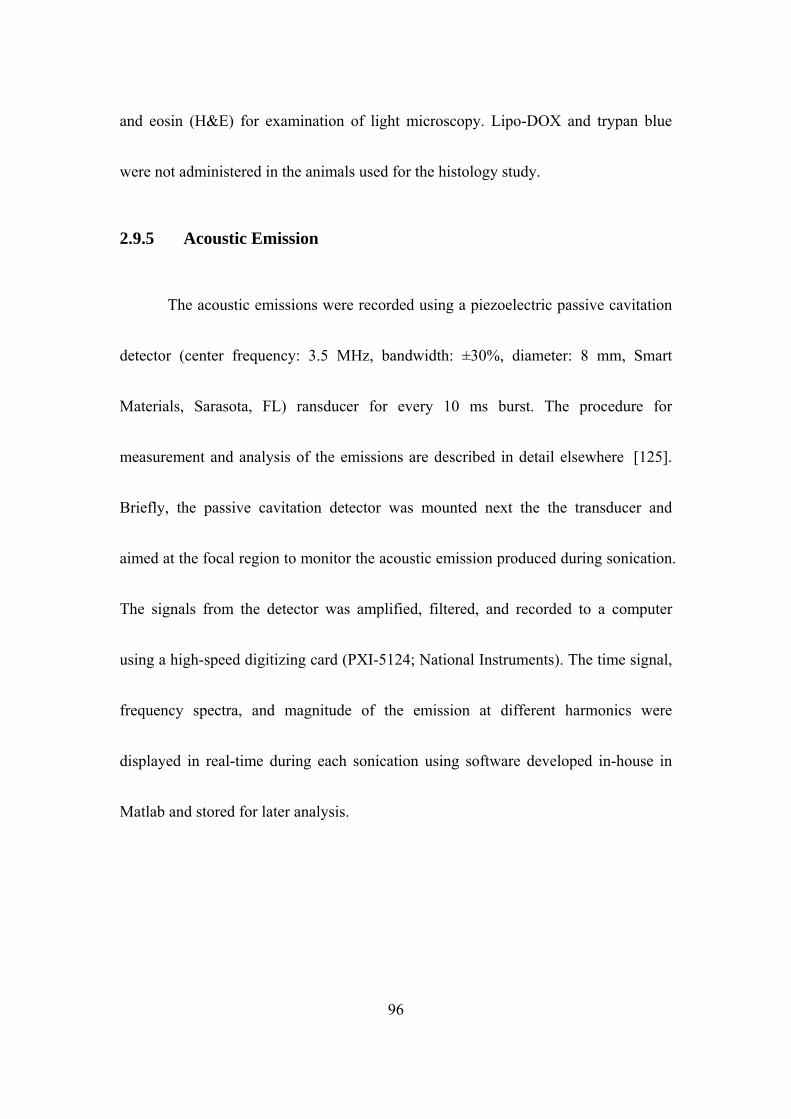
96
and eosin (H&E) for examination of light microscopy. Lipo-DOX and trypan blue
were not administered in the animals used for the histology study.
2.9.5 Acoustic Emission
The acoustic emissions were recorded using a piezoelectric passive cavitation
detector (center frequency: 3.5 MHz, bandwidth: ±30%, diameter: 8 mm, Smart
Materials, Sarasota, FL) ransducer for every 10 ms burst. The procedure for
measurement and analysis of the emissions are described in detail elsewhere [125].
Briefly, the passive cavitation detector was mounted next the the transducer and
aimed at the focal region to monitor the acoustic emission produced during sonication.
The signals from the detector was amplified, filtered, and recorded to a computer
using a high-speed digitizing card (PXI-5124; National Instruments). The time signal,
frequency spectra, and magnitude of the emission at different harmonics were
displayed in real-time during each sonication using software developed in-house in
Matlab and stored for later analysis.

97
Chapter 3: Targeted Lipo-DOX Delivery through Blood-Brain and
Blood-Tumor Barriers using Transcranial MRI-Guided
Focused Ultrasound
3.1 Results
3.1.1 Permeabilization of BBB/BTB
BBB permeabilization and the presence or lack of petechiae were confirmed
using contrast-enhanced and T2*-weighted MRI, respectively.. All animals
demonstrated hyperintense regions in contrast enhanced T1-weighted images after
FUS, confirming BBB permeabilization. In several cases, one or more hypointense
spots were observed in T2*-weighted MRI at the brain surface in the cortex,
demonstrating the presence of petechiae. Such spots were observed in both
hemispheres near the brain surface in 4 of the 5 animals in the animals where
doxorubicin concentrations were measured and that received Lipo-DOX before or
during after sonication. They were not observed in animals who received Lipo-DOX
after sonication.

Figure 3. 1 Visualization of BBB/BTB permeabilization. (A) Axial images acquired before (left) and
after (right) the FUS-BBBD showing the signal enhancement in T1-weighted MRI after Gd-DTPA
injection. Before FUS, the tumor was a small enhancing area (red circle). The magnitude and extent of
this enhancement were increased after FUS. (B) Signal enhancement in this example as a function of
time.
3.1.2 Effect of Lipo-DOX Injection Protocol on doxorubicin Delivery to
the Brain
Doxorubicin concentrations were compared for cases when the Lipo-DOX
was injected before or after sonication Figure 3. 2. In group A, both hemispheres were
sonicated. In the right hemisphere, Lipo-DOX was administered in 9 fractions, one
before each sonication whereas in the left, sonications were performed without
98

99
additional Lipo-DOX administration. In group B, the sonications were performed only
in one hemisphere, and the total dose of Lipo-DOX was injected in bolus 10 min later.
The sonication time was approximately 30 min for the 9 targets.
In group A, the mean doxorubicin concentrations in the right and left
hemispheres were 4.7 ± 0.5 and 4.8 ± 0.5 µg/g, respectively; they were not
significantly different (p > 0.05). In group B, the doxorubicin concentration was
significantly less (p < 0.001) than in both hemispheres in group A. The mean
concentration in these animals was 3.2 ± 0.3 µg/g, 32% less compared to the volumes
in group A. The doxorubicin concentrations were significantly enhanced in all cases
(p < 0.001) compared to the control tissue. In addition, in every case the doxorubicin
concentrations in the sonicated areas exceeded our goal of 0.819±0.482 µg/g, a value
reported to correlate with a clinical response for human tumors [237].

Figure 3. 2 Doxorubicin concentrations corresponding to different Lipo-DOX injection protocols. The
doxorubicin concentration was 4.7±0.5 and 4.8±0.5 µg/g, when the agent was administered in fractions
during the sonications and when it was injected before sonication, respectively; these values were not
significantly different from each other (p>0.05). This concentration was reduced by 32% to a value of
3.2±0.3 µg/g when Lipo-DOX was administered 10 min after the last sonication. This reduction was
significant (p<0.001). In all groups, the doxorubicin concentration was significantly larger than in
control tissue that did not receive FUS-BBBD. The concentrations in all sonicated volumes were above
our goal of 0.819±0.482 µg/g, a value reported to correlate with a 39% clinical response rate in human
tumors (Cummings and McArdle 1986).
3.1.3 Fluorescence Imaging
100
Fluorescence microscopy was used to investigate the distribution of
doxorubicin in the normal brain and in a tumor. Example results from animals
euthanized xxx-xxx h after Lipo-DOX administration and FUS-BBBD are shown in
Figures (3.3) and (3.4) respectively. In the normal brain, the pattern of extravasation
of the fluorescent drug matched well with the focal contrast enhancement on T1-
weighted MRI and focal trypan blue staining evident on tissue blocks. High
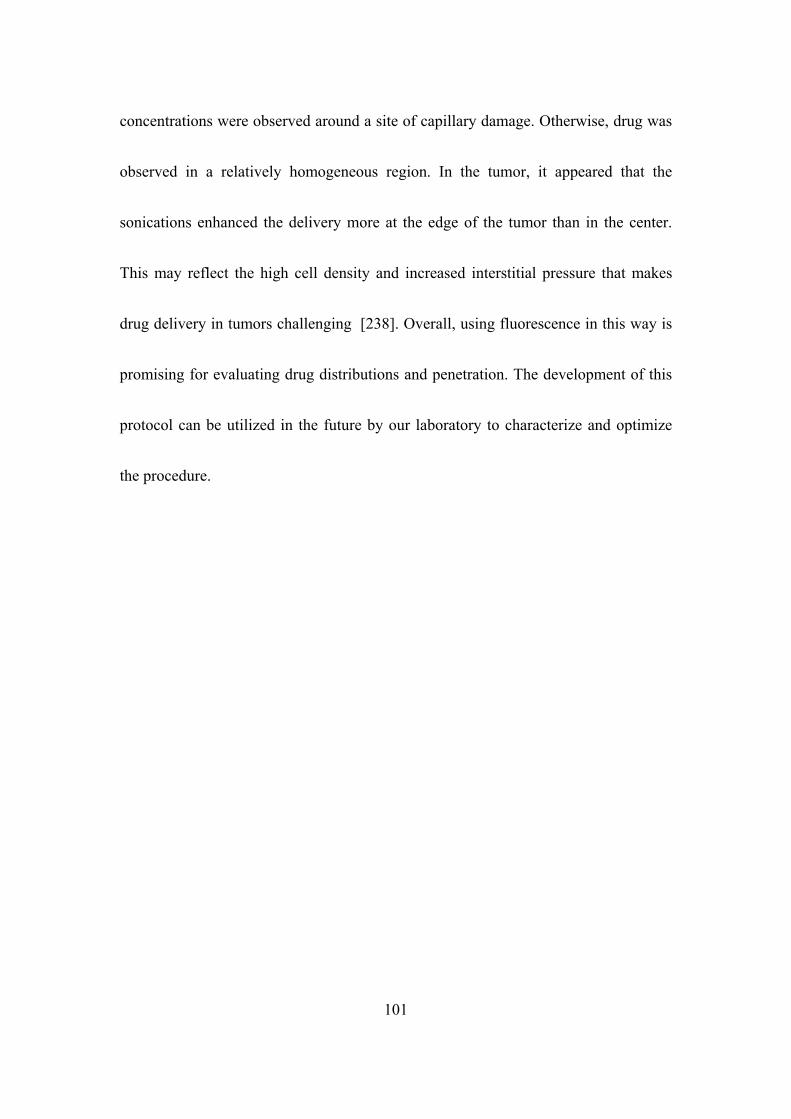
101
concentrations were observed around a site of capillary damage. Otherwise, drug was
observed in a relatively homogeneous region. In the tumor, it appeared that the
sonications enhanced the delivery more at the edge of the tumor than in the center.
This may reflect the high cell density and increased interstitial pressure that makes
drug delivery in tumors challenging [238]. Overall, using fluorescence in this way is
promising for evaluating drug distributions and penetration. The development of this
protocol can be utilized in the future by our laboratory to characterize and optimize
the procedure.
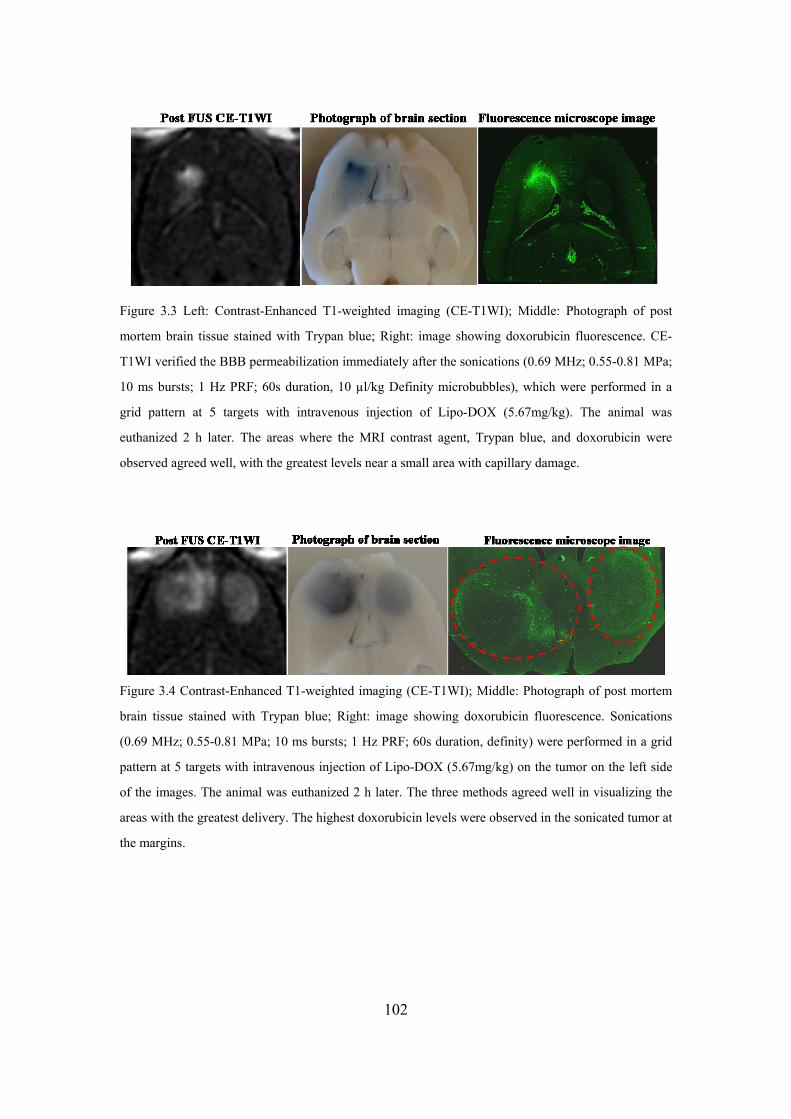
Figure 3.3 Left: Contrast-Enhanced T1-weighted imaging (CE-T1WI); Middle: Photograph of post
mortem brain tissue stained with Trypan blue; Right: image showing doxorubicin fluorescence. CE-
T1WI verified the BBB permeabilization immediately after the sonications (0.69 MHz; 0.55-0.81 MPa;
10 ms bursts; 1 Hz PRF; 60s duration, 10 µl/kg Definity microbubbles), which were performed in a
grid pattern at 5 targets with intravenous injection of Lipo-DOX (5.67mg/kg). The animal was
euthanized 2 h later. The areas where the MRI contrast agent, Trypan blue, and doxorubicin were
observed agreed well, with the greatest levels near a small area with capillary damage.
Figure 3.4 Contrast-Enhanced T1-weighted imaging (CE-T1WI); Middle: Photograph of post mortem
brain tissue stained with Trypan blue; Right: image showing doxorubicin fluorescence. Sonications
(0.69 MHz; 0.55-0.81 MPa; 10 ms bursts; 1 Hz PRF; 60s duration, definity) were performed in a grid
pattern at 5 targets with intravenous injection of Lipo-DOX (5.67mg/kg) on the tumor on the left side
of the images. The animal was euthanized 2 h later. The three methods agreed well in visualizing the
areas with the greatest delivery. The highest doxorubicin levels were observed in the sonicated tumor at
the margins.
102
103
3.2 Discussion
It has been demonstrated that ultrasound and microbubbles can enhance the
delivery of Lipo-DOX into the healthy rat brain parenchyma and the 9L glioblastoma
rat tumor model. If this result can be translated, it would have some advantages over
other drug delivery methods. For example, being able to use the currently approved
drug removes the need and expense of developing and testing new drug formulations.
The method is noninvasive and restricts the drug delivery only to desired brain
regions.
While a high doxorubicin concentration was achieved in each group, higher
concentrations were achieved when we injected Lipo-DOX before sonication (group
A) rather than afterwards (group B). This finding may have been due to partial BBB
restoration in group B. With the acoustic parameters used in this study, Park et al.
reported an exponential decay in permeability to Gd-DTPA (molecular weight: 938
Da) after FUS-BBBD with half-life of 2.2 hours [118]. With this time, the barrier
permeability would be reduced by approximately 20% for the first target that was
sonicated 40 min before Lipo-DOX administration. Others have shown that this

104
restoration is faster for larger agents and suggested that an agent the size of Lipo-
DOX (100 nm) would have a half-life of only a few minutes [134].
This finding might also reflect transient effects occurring during sonication
that actively transported Lipo-DOX out of the blood vessels. A number of studies on
“sonoporation” have shown that sonication with microbubbles can drive drugs across
cell membranes through the creation of pores that are present for a short time [239].
It may also be possible that the microbubble-enhanced sonications lysed the ~100 nm
liposomes, releasing free doxorubicin which was readily transported through the BBB
disruption. Others have shown that microbubble collapse can cause such a release
when the liposomes are attached to the microbubbles [240], and perhaps something
similar happened here. Additional experiments would be necessary however to
determine whether the exposure levels used here could release doxorubicin.
Another unexpected finding was that surface damage was observed in the
animals in group A in the doxorubicin concentration study, but not in group B. This
finding could suggest that the presence of Lipo-DOX, which was in circulation during
the sonications in group A, somehow reduced the inertial cavitation threshold. The
mechanism by which this lowering could have been produced is unknown. This

105
finding needs to be verified.
My investigation into using fluorescence to map the released doxorubicin into
the rat brain and into a tumor was promising for future work. It would also be
interesting to fluorescently tag Lipo-DOX and examine in microscopy how far the
intact liposomes, and at a later time the released doxorubicin, penetrates into the brain
after FUS-BBBD. In addition, it would be interesting to repeat these experiments
using a smaller drug or a drug with a short plasma half-life. The dependence on the
order of the sonication and the drug administration on the delivered drug
concentrations may be different in such cases.

106
Chapter 4: Multiple Sessions of Focused Ultrasound Blood-Brain
Barrier Disruption to Enhance Delivery of Liposomal
Doxorubicin: A Safety Study
An effective drug treatment for an invasive brain tumor such as glioma will require
chemotherapy delivery to the normal tissues at the tumor margin, where the BBB
protects infiltrating tumor cells, in addition to the semipermeable solid tumor. In a
patient with a glioma, this infiltrative margin can extend several centimeters [241].
While an earlier study of FUS-BBBD and Lipo-DOX found that a single drug
delivery session did not result in the normal brain tissue damage in rats [191] , it is
possible that multiple treatments could produce side effects such as those observed in
our survival study tumor-bearing rats (see section 5.1.3 below). Furthermore, early
studies with mannitol BBB disruption and free doxorubicin suggested that this drug is
significantly neurotoxic, even at small concentrations [242,243]. Others have
observed concentration-dependent neurotoxicity when free doxorubicin or Lipo-DOX
was infused into the brain via convection-enhanced delivery [244].
For these reasons, we tested whether multiple sessions of Lipo-DOX
administration and FUS-mediated BBB disruption (FUS-BBBD) can induce severe
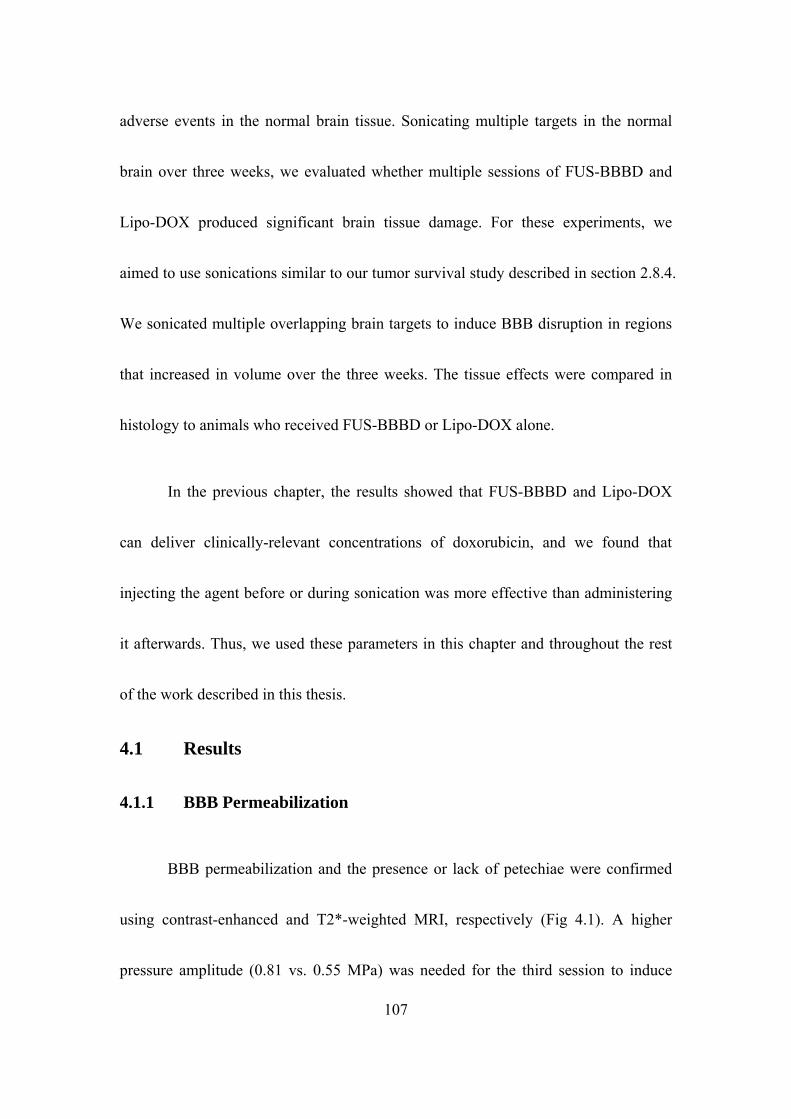
107
adverse events in the normal brain tissue. Sonicating multiple targets in the normal
brain over three weeks, we evaluated whether multiple sessions of FUS-BBBD and
Lipo-DOX produced significant brain tissue damage. For these experiments, we
aimed to use sonications similar to our tumor survival study described in section 2.8.4.
We sonicated multiple overlapping brain targets to induce BBB disruption in regions
that increased in volume over the three weeks. The tissue effects were compared in
histology to animals who received FUS-BBBD or Lipo-DOX alone.
In the previous chapter, the results showed that FUS-BBBD and Lipo-DOX
can deliver clinically-relevant concentrations of doxorubicin, and we found that
injecting the agent before or during sonication was more effective than administering
it afterwards. Thus, we used these parameters in this chapter and throughout the rest
of the work described in this thesis.
4.1 Results
4.1.1 BBB Permeabilization
BBB permeabilization and the presence or lack of petechiae were confirmed
using contrast-enhanced and T2*-weighted MRI, respectively (Fig 4.1). A higher
pressure amplitude (0.81 vs. 0.55 MPa) was needed for the third session to induce

108
consistent BBB permeabilization, presumably because of an increase in skull or dura
thickness as the rats grew [198]. All animals demonstrated hyperintense regions in
contrast enhanced T1-weighted images after each session, confirming BBB
permeabilization. In several cases, one or more hypointense spots were observed in
T2*–weighted MRI in the focal plane or at the brain surface in the cortex,
demonstrating the presence of petechiae. Such spots were observed after the second or
third session in 4 of the 5 animals who received both FUS-BBBD and Lipo-DOX and
in 3 of the 4 animals who received FUS-BBBD alone. They were not seen in animals
who received MRI at day 53 or 67. In addition to these hypointense spots in the focal
plane, hypointense spots were also observed in the cortex at the brain surface in every
animal except one who received FUS-BBBD alone.

Figure 4. 1 MRI-images acquired during three weekly treatments: T2-weighted imaging (T2WI) used
for treatment planning; Contrast-Enhanced T1-weighted imaging (CE-T1WI) verified the BBB
permeabilization; T2*-weighted imaging (T2*WI) detected tissue damage. The targeted spots are
indicated in dots; the yellow curves outlined extent of MRI contrast enhancement due to BBB
permeabilization. Sonications (0.69 MHz; 0.55-0.81 MPa; 10 ms bursts; 1 Hz PRF; 60s duration) were
performed in a grid pattern at 5, 9, and 12 targets, respectively, mimicking the three weekly treatments,
which were administered in the tumor treatment study described in section 2.8.4. (bars: 5mm)
4.1.2 Histological Findings
All animals that received FUS-BBBD alone were found to be unaffected in the
targeted plane in the striatum (Figure 4.2). However, four of the five rats who
received FUS-BBBD and Lipo-DOX had small regions with evidence of prior
damage in the focal plane (Figure 4.3). In three of these animals, this was evidenced
by the presence of small scars with largest dimensions of 0.5-2.0 mm. These scars
109
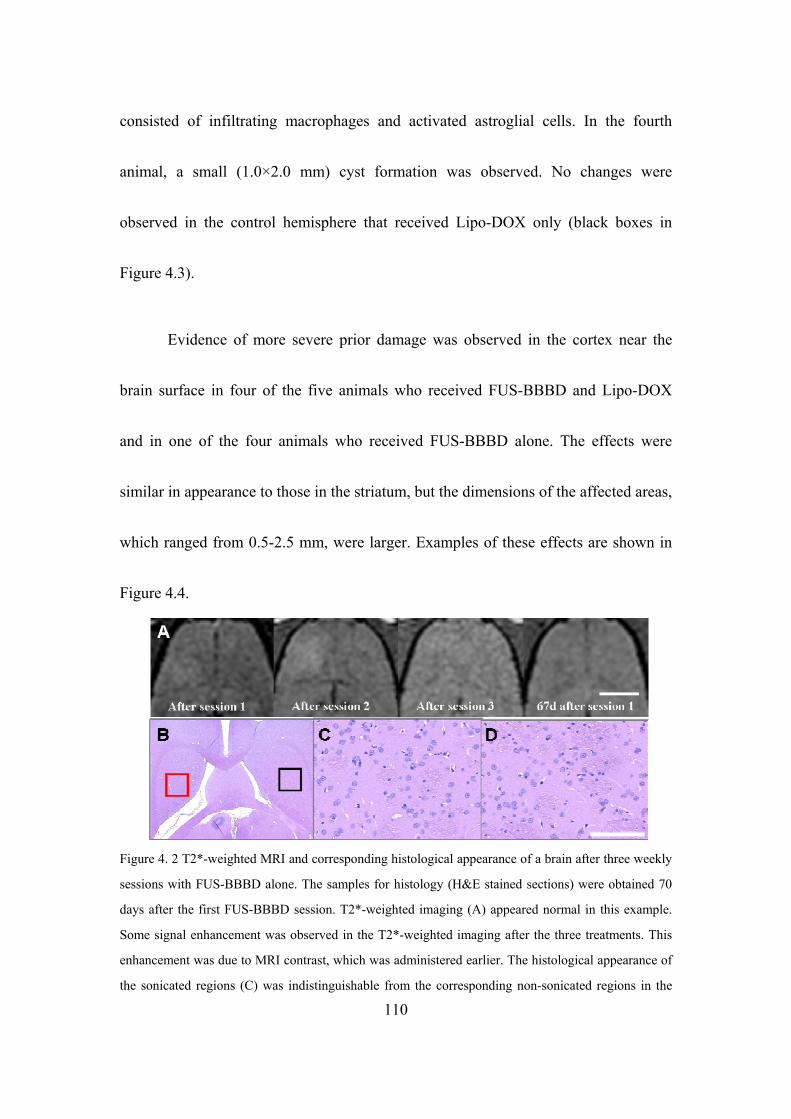
consisted of infiltrating macrophages and activated astroglial cells. In the fourth
animal, a small (1.0×2.0 mm) cyst formation was observed. No changes were
observed in the control hemisphere that received Lipo-DOX only (black boxes in
Figure 4.3).
Evidence of more severe prior damage was observed in the cortex near the
brain surface in four of the five animals who received FUS-BBBD and Lipo-DOX
and in one of the four animals who received FUS-BBBD alone. The effects were
similar in appearance to those in the striatum, but the dimensions of the affected areas,
which ranged from 0.5-2.5 mm, were larger. Examples of these effects are shown in
Figure 4.4.
Figure 4. 2 T2*-weighted MRI and corresponding histological appearance of a brain after three weekly
sessions with FUS-BBBD alone. The samples for histology (H&E stained sections) were obtained 70
days after the first FUS-BBBD session. T2*-weighted imaging (A) appeared normal in this example.
Some signal enhancement was observed in the T2*-weighted imaging after the three treatments. This
enhancement was due to MRI contrast, which was administered earlier. The histological appearance of
the sonicated regions (C) was indistinguishable from the corresponding non-sonicated regions in the
110
other hemisphere (D). The regions shown in C and D are indicated in B by the red and black squares,
respectively. (bars: 5 mm in A-B; 200 µm in C-D).
Figure 4. 3 Representative examples of T2*- weighted images and histology (H&E stained sections) in
the focal plane for rats who received three weekly sessions of FUS-BBBD and Lipo-DOX. Histology
was obtained 70 days after the first FUS-BBBD session. (A-D) Example where the treated regions
appeared unaffected in both T2*-weighted MRI (A) and histology (B-D). The histological appearance
of the sonicated regions (C) was indistinguishable from the corresponding non-sonicated regions in the
other hemisphere (D). The regions shown in C and D are indicated in B by the red and black squares,
respectively. (E-H) Example where hypointense areas (arrows) were evident in T2*-weighted MRI
after session 2 and a scar was observed in histology (G). Note that the location of the scar was evident
in the area that was hypointense in T2*weighted imaging. A small cluster of hemosiderin (inset) was
observed, likely remnants from earlier petechiae. No changes were observed in the control location in
the other hemisphere (H). The regions shown in C and D are indicated in B by the red and black
squares, respectively. Some signal enhancement was observed in the T2*-weighted imaging (A,E) after
the three treatments. This enhancement was due to MRI contrast, which was administered earlier. .
(bars: 5 mm in A,B, E,F; 200 µm in C-D, G-H).
111

Figure 4. 4 An example of adverse effects in the cortex near the brain surface in an animal that received
three sessions of FUS-BBBD and Lipo-DOX. A: Hypointense spots (arrows) were detected in T2*-
weighted imaging after the second treatment. Tissue necrosis (C) is evident in the area that appeared
hypointense in T2*weighted imaging. Hemosiderin (yellowish brown granular pigments formed by
breakdown of hemoglobin) was observed in macrophages within the necrotic area (inset in C). No
changes were found in the contralateral hemisphere that did not receive FUS-BBBD. These adverse
effects, which were evident in four of the five animals who received FUS-BBBD and Lipo-DOX and in
one of the four animals who received FUS-BBBD alone, were probably due to the long focal length of
the transducer (full-width, half maximum of the pressure field: 12 mm) compared to thickness of the rat
brain (10-12 mm) and reflections within the skull. (bars: 5 mm in A-B; 200 µm in C-D).
4.2 Discussion
112
Regardless of the order of the sonication, it is clear that the sonication
parameters used here effectively resulted in a clinically-relevant doxorubicin
concentration in the normal brain. However, the severe neurotoxicity that was
observed in earlier studies was not observed here. Early work on the toxicity of
intracarotid administration of free doxorubicin in rats and dogs following osmotic
BBB modification revealed that this agent can be significantly neurotoxic, even at
small concentrations [242,243]. In that study, the animals developed neurological

113
deficits including seizures, with corresponding necrosis and hemorrhagic infarcts
observed in histopathology. Other experiments using convection-enhanced delivery
have also observed extensive necrosis when high concentrations of doxorubicin or
Lipo-DOX were infused into the brain [244]. These studies, along with effects we
observed previously at the tumor margins [170], prompted the current study to
investigate whether FUS-BBBD and Lipo-DOX can induce such extensive damage.
Such effects were not observed.
Evidence for small regions of minor prior tissue damage, however, was
detected in this work. We suspect these regions were due capillary damage induced
during the sonications. The exposure levels used were the same as in our prior study
in tumors and were somewhat aggressive, as evidenced by the presence of
hypointense spots in T2*-weighted imaging in most animals. Prior work suggests that
these dark spots are caused by the presence of iron-laden particles from
petechiae [245] presumably caused by capillary damage caused by inertial
cavitation [123]. Based on other studies examining long-term effects of FUS-BBBD,
such minor capillary damage is not expected to result in significant long-term
effects [94,137], and indeed this was the case here for the animals who did not receive
114
Lipo-DOX. In contrast, evidence of small areas of prior tissue damage was observed
in most of the animals who received FUS-BBBD and Lipo-DOX. The cause of this
difference is not known, but it is possible that excessive doxorubicin concentrations
resulted around capillaries damaged by inertial cavitation. It may also be possible that
doxorubicin impaired repair or otherwise exacerbated such capillary damage that
could have resolved over time without the drug. Based on these results we anticipate
that while sonication with low-level inertial cavitation may be acceptable – or even
desirable – when the focal region is inside a solid tumor, such aggressive exposure
levels may not be appropriate for delivering Lipo-DOX to the surrounding normal
brain tissue.
An unexpected finding of this work was that more severe damage was evident
in both MRI and histology near the brain surface in the cortex. This damage could
have been the result of the low frequency and a long focal region – longer than the
thickness of the rat brain – that was used in this study. This frequency was chosen to
be similar to the transcranial FUS system that is currently being used in clinical
trials [246] and it is known that such a frequency can result in reflections and standing
waves when sonicating transcranially in a rat [93]. However, the lack of tissue
115
damage in the far-field close to the skull base, where one might expect the pressure
amplitude to be highest due to reflection, suggests that perhaps something else caused
these surface effects. Perhaps the microbubble concentration was sufficiently large in
the highly vascular cortex to produce shielding, resulting in a lower pressure
amplitude at the focal point. While future work is needed to verify this speculation, if
it were correct, it may be possible that under some circumstances elevating the
exposure level of the sonications can lead to diminishing returns in FUS-BBBD at the
focal plane.
Another unexpected finding was that surface damage was observed in the
animals in group A in the doxorubicin concentration study, but not in group B. This
finding could suggest that the presence of Lipo-DOX, which was in circulation during
the sonications in group A, somehow reduced the inertial cavitation threshold. The
mechanism by which this lowering could have been produced is unknown. This
finding needs to be verified.
This study had some limitations. The sample size was relatively small,
and more work is needed to verify the link between the capillary damage produced
during some of the sonications and the small areas of downstream tissue damage that
116
were evident here with the delivery of Lipo-DOX. We also only considered a single
dose of Lipo-DOX and a single set of sonication parameters, and we examined the
tissue effects only at a single time point using standard light microscopy and H&E
stained sections. A larger study using more sensitive methods may find minor tissue
effects that were missed here. However, the relevance of such potential minor effects
is questionable in the context of a glioma treatment.

117
Chapter 5: Multiple Treatments with Liposomal Doxorubicin and
Ultrasound-Induced Disruption of Blood–Tumor and
Blood–Brain Barriers Improve Outcomes in a Rat
Glioma Model
The purpose of this work was to evaluate whether multiple treatment sessions can
effectively improve the therapeutic effect of Lipo-DOX in a rat glioma model.
Previous work has shown that a single treatment with FUS-enhanced delivery of this
agent to orthotopically-implanted 9L rat gliosarcoma model had a modest
improvement in survival and tumor growth [191]. Here we examined whether three
weekly sessions can provide a more pronounced treatment effect in this tumor model.
We also utilized low-frequency FUS to better match an existing clinical FUS
device [81].
5.1 Results
5.1.1 BBB/BTB Permeabilization
BBB/BTB permeabilization and a lack of significant FUS-induced tissue damage
were confirmed using contrast-enhanced and T2*-weighted MRI, respectively. A
higher pressure amplitude (0.81 vs. 0.55 MPa) was needed for the third treatment to
118
induce consistent BBB/BTB permeabilization, presumably because of an increase in
skull or dura thickness as the rats grew [198]. To confirm that the sonications
increased the vascular permeability in the tumor, contrast-enhanced imaging before
and after the sonications in several animals was performed (Figure 5. 1 A-B).
Sonication targets were applied in a grid to cover the tumor evident in T2-weighted
imaging plus a surrounding margin (C). Weekly MRI examination was used to
monitor the tumor progression. Representative examples from each experimental
group over the first three weeks and the tumor volume measurements are shown in
Figure 5.2.
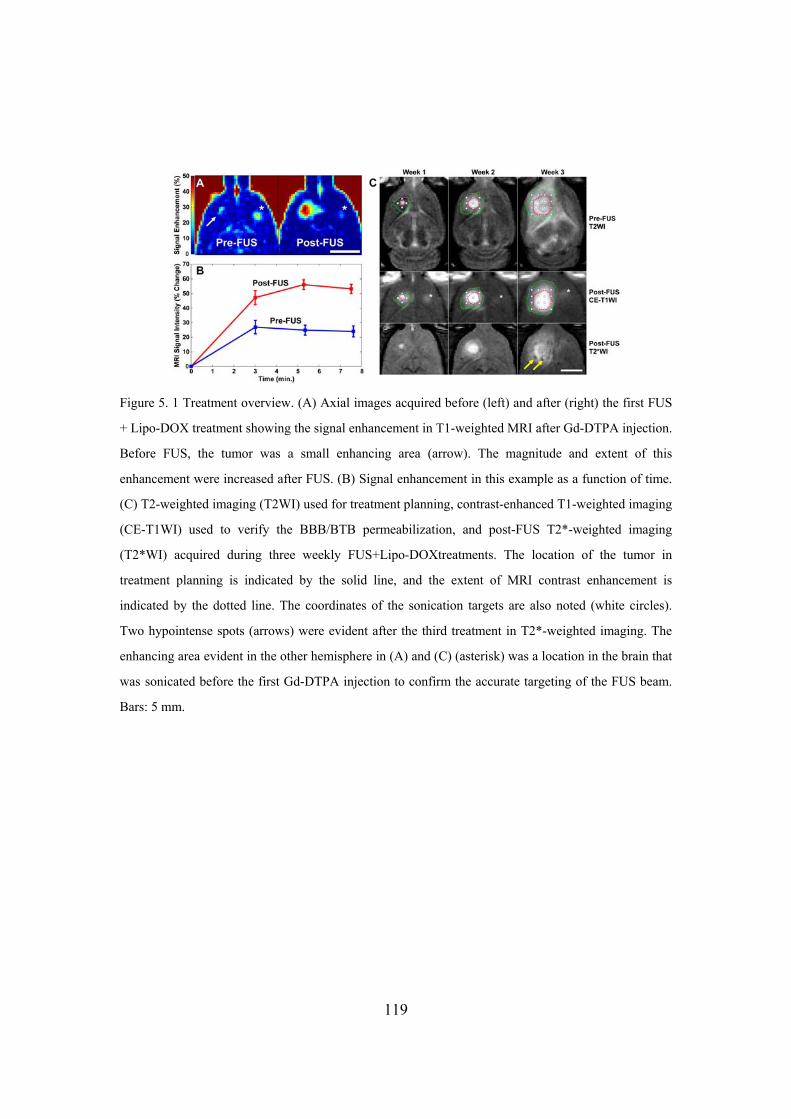
Figure 5. 1 Treatment overview. (A) Axial images acquired before (left) and after (right) the first FUS
+ Lipo-DOX treatment showing the signal enhancement in T1-weighted MRI after Gd-DTPA injection.
Before FUS, the tumor was a small enhancing area (arrow). The magnitude and extent of this
enhancement were increased after FUS. (B) Signal enhancement in this example as a function of time.
(C) T2-weighted imaging (T2WI) used for treatment planning, contrast-enhanced T1-weighted imaging
(CE-T1WI) used to verify the BBB/BTB permeabilization, and post-FUS T2*-weighted imaging
(T2*WI) acquired during three weekly FUS+Lipo-DOXtreatments. The location of the tumor in
treatment planning is indicated by the solid line, and the extent of MRI contrast enhancement is
indicated by the dotted line. The coordinates of the sonication targets are also noted (white circles).
Two hypointense spots (arrows) were evident after the third treatment in T2*-weighted imaging. The
enhancing area evident in the other hemisphere in (A) and (C) (asterisk) was a location in the brain that
was sonicated before the first Gd-DTPA injection to confirm the accurate targeting of the FUS beam.
Bars: 5 mm.
119

120
5.1.2 Tumor progression
In most animals in the three control groups, the tumor grew rapidly over this
time Figure 5.2 (A) resulting in significant midline shift and compression of the
lateral ventricles. Hypointense regions were often evident within the tumor in T2*-
weighted imaging in all groups. Eleven of fifteen rats (73%) in these groups either
died or were euthanized before the third treatment due either to tumor dimensions
exceeding 10–11 mm or poor health conditions (weight loss exceeding 20% or
severely impaired activity). The rest died or were euthanized for these reasons before
week 4. One rat in the Lipo-DOX Only group was euthanized before the third
treatment; the rest were euthanized shortly after week 3.
All animals in the FUS + Lipo-DOX group received all three treatments, and
no rat in this group was euthanized before week 4 Figure 5.2 (B–C). The tumor
volume reached a maximum at weeks 3 or 4, after which they began to shrink. The
outcomes for the eight animals in this group varied and are summarized in Table 5. 1 .
The maximum tumor volume varied substantially, with some tumors reaching
volumes similar to the control group, and others never reaching 100 mm³. The mean
tumor volume in the FUS + Lipo-DOX group was less than in the three control groups

121
at weeks 2–3 Figure 5.2 (C). These differences were not found to be significant.
The first two rats treated in the FUS + Lipo-DOX group (Rats 1 and 2 in Table
5. 1) exhibited local skin toxicity (inflammation, peeling; minor bleeding) on the scalp
and the front and hind paws beginning on or after week two. These two animals
developed a skin infection and were euthanized at days 34 and 35. In their last
imaging session, one of these animals had no tumor evident in MRI, and the other had
a small tumor that appeared to be responding to the treatment. Subsequent animals
were treated prophylactically with antibiotics. While skin irritation or mild
inflammation was observed, they did not develop infections.
Three animals (Rats 3, 4 and 8 in Table 5. 1) did not exhibit any evident
morbidity. They gained weight and behaved normally. These animals were followed
for 9 or more weeks, at which time they were euthanized for histological examination.
One of these long-term survivors was euthanized at day 66; the other two were
observed for longer periods (136 and 142 days). Tumors in these animals grew to a
substantial volume (greater than 300 mm3) before they began to resolve. MRI from
one of these animals is shown in (Figure 5.2B). After the tumors disappeared, brain
tissue loss at the former tumor site was evident in MRI, along with damage in

122
adjacent tissues and enlarged ventricles. Tissue damage appeared as highly
hyperintense regions in T2-weighted imaging. In some regions, within this damaged
area, discrete hyperintense zones in both T2* and T2-weighted imaging were seen.
Two animals in the FUS + Lipo-DOX group (Rats 5 and 7 in Table 5. 1) were
euthanized due to poor health at days 32 and 36, respectively. At the time of sacrifice,
one of these animals exhibited only a small hyperintense region in T2-weighted
imaging, and no tumor was evident in histology (see below). The other had an
extensive hyperintense area in T2-weighted imaging, but only a small cluster
containing a few tumor cells was found in histology. Finally, in one animal (Rat 6 in
Table 5. 1), a large hypointense region was observed in T2*-weighted imaging at
week 4 that was assumed to be intratumoral hemorrhage. This animal also exhibited
impaired activity and was euthanized at this time.

Figure 5. 2 MRI appearance of the tumors and their growth over time. (A) MRI for the three control groups for weeks 1–3. The rapid growth that was observed in most of the rats in these groups is evident in T2-weighted imaging (T2WI). Hypointense areas were often observed within the tumor in T2*-weighted MRI (T2*WI). (B) Serial MRI for a long-term survivor in the FUS + Lipo-DOX group (Rat 4 in Table 5. 1) showing rapid tumor growth and subsequent resolution. The volume was maximum at week four, at which time it covered a significant portion of one hemisphere. It then began to shrink, and from week 8 onwards it was no longer evident. Brain tissue loss at the former site was evident, and the lateral ventricle was enlarged and filled much of this space. Tissue adjacent to the former tumor mass was highly hyperintense in T2-weighted imaging, and presumably damaged. A hypointense region was observed at the former tumor site in T2*-weighted imaging starting at weeks 6–7, which slowly shrunk over time. Imaging between weeks 8 and 20 was mostly similar. Note that the T2*-weighted imaging in the FUS-Only and FUS + Lipo-DOX animals was acquired after Gd-DTPA in weeks 1–3; contrast enhancement was observed in the tumor and surrounding brain. Bar: 5 mm. (C) MRI-measured tumor volumes as a function of time for each experimental group. Tumors were implanted at week 0. The number of surviving animals at each week is noted below the plot (MRI from two animals in the FUS-Only group was not included in this analysis due to poor image quality). Mean ± S.E. is shown.
123
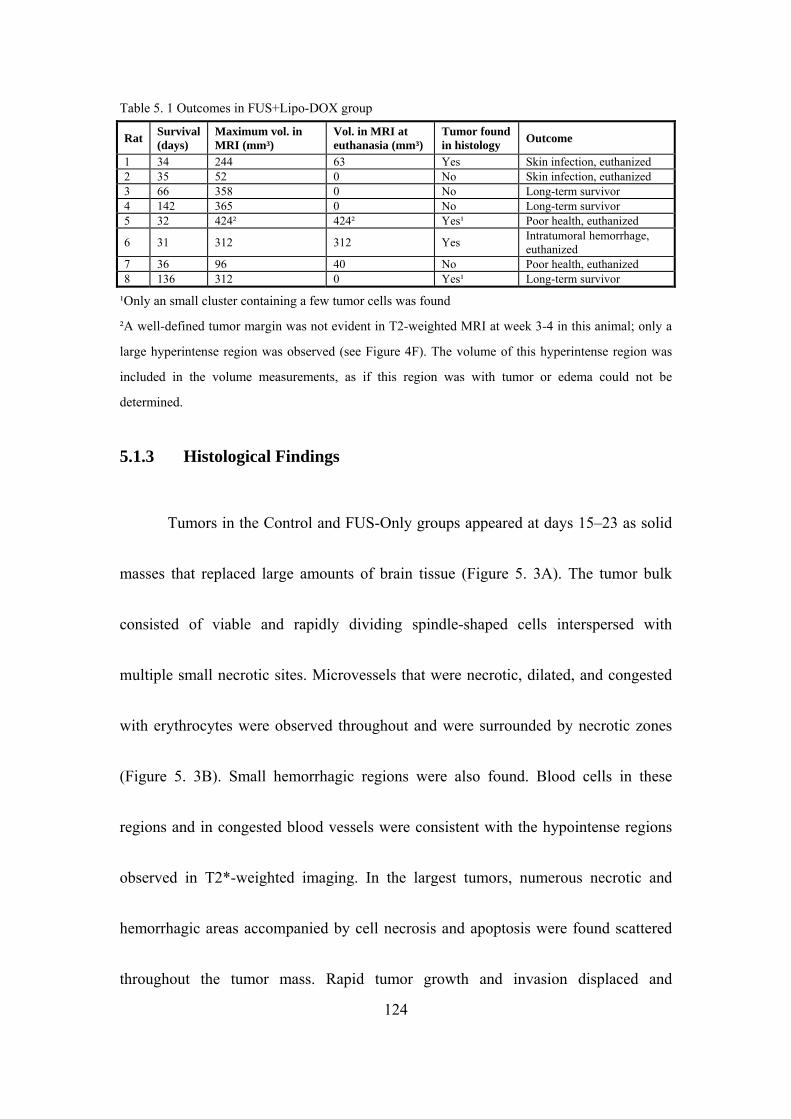
124
Table 5. 1 Outcomes in FUS+Lipo-DOX group
Rat Survival (days)
Maximum vol. in MRI (mm³)
Vol. in MRI at euthanasia (mm³)
Tumor found in histology
Outcome
1 34 244 63 Yes Skin infection, euthanized 2 35 52 0 No Skin infection, euthanized 3 66 358 0 No Long-term survivor 4 142 365 0 No Long-term survivor 5 32 424² 424² Yes¹ Poor health, euthanized
6 31 312 312 Yes Intratumoral hemorrhage, euthanized
7 36 96 40 No Poor health, euthanized 8 136 312 0 Yes¹ Long-term survivor
¹Only an small cluster containing a few tumor cells was found
²A well-defined tumor margin was not evident in T2-weighted MRI at week 3-4 in this animal; only a
large hyperintense region was observed (see Figure 4F). The volume of this hyperintense region was
included in the volume measurements, as if this region was with tumor or edema could not be
determined.
5.1.3 Histological Findings
Tumors in the Control and FUS-Only groups appeared at days 15–23 as solid
masses that replaced large amounts of brain tissue (Figure 5. 3A). The tumor bulk
consisted of viable and rapidly dividing spindle-shaped cells interspersed with
multiple small necrotic sites. Microvessels that were necrotic, dilated, and congested
with erythrocytes were observed throughout and were surrounded by necrotic zones
(Figure 5. 3B). Small hemorrhagic regions were also found. Blood cells in these
regions and in congested blood vessels were consistent with the hypointense regions
observed in T2*-weighted imaging. In the largest tumors, numerous necrotic and
hemorrhagic areas accompanied by cell necrosis and apoptosis were found scattered
throughout the tumor mass. Rapid tumor growth and invasion displaced and
125
compressed the surrounding brain tissue, resulting in ischemia and cell death
(infarction) in some adjacent brain regions (Figure 5. 3C). A narrow (0.5–1 mm) band
of invading/infiltrating cells was evident at the tumor margin (Figure 5. 3D).
The tumor appearance in the Lipo-DOX Only group varied. Although viable
and dividing cells were generally present, a reduced cellularity compared to the other
control groups, along with unhealthy-appearing tumor cells and an intensely
vacuolated matrix was evident in this group (Figure 5. 3E). Large regions of necrosis
were observed in some cases, but some viable tumor cells were always found within
these necrotic areas. Substantial hemorrhage was evident at the periphery of some
tumors, accompanied by infarction in the surrounding brain. Tumor cell invasion
along perivascular tracts and tumor cell clusters were observed at sites as far as 1–2
mm from the edge of the solid tumor mass (Figure 5. 3F). In one animal (euthanized
at day 26 due to impaired activity), no tumor cells were found in histology.
In contrast to the controls, all but one of the animals in the FUS + Lipo-DOX
group exhibited a strong treatment response, with no tumor mass detected in 6/8
animals. However, in two of these animals a few residual or recurrent tumor cells
were found in the former tumor site. In one rat, which was euthanized due to skin
126
infection at day 34, a tumor was found to be shrunken compared to its maximum size
in MRI and partly destroyed. The central area contained a viable tumor mass, and a
surrounding rim of tissue appeared to be damaged. Only one animal (Rat 6 in Table 5.
1) had a large tumor like most rats in the control groups. This animal, in which
intratumoral bleeding was suspected in MRI, was euthanized at week 4. Histological
examination confirmed hemorrhagic infarction in a region of tumor necrosis. This
region was restricted to the tumor mass; no blood was found inside the adjacent
ventricular space.
Example histological findings from the FUS + Lipo-DOX group are shown in
Figure 5. 4. In the three long-term survivors, where the tumors grew to a substantial
volume before beginning to resolve, brain tissue loss was evident at the former tumor
site (Figure 5. 4A). The adjacent lateral ventricle was significantly enlarged and filled
this missing area. A region in the adjacent brain was necrotic, with an appearance
consistent with infarct (Figure 5. 4B). A small cyst was observed within this necrotic
zone. The hypointense regions evident in MRI contained hemosiderin — either in
clusters or taken up by macrophages (inset in Figure 5. 4B). In one long-term survivor,
a small cluster of recurring or residual tumor cells was found.

127
Findings from two animals from the FUS + Lipo-DOX group that were
euthanized for impaired activity are shown in (Figure 5. 4C–H). In one case
(euthanized at day 36) only a small necrotic area with macrophage infiltration was
found at the former tumor site (Figure 5. 4C–E). In the second animal (euthanized at
day 32), a larger necrotic area was found at the former tumor site, and affected or
damaged tissue was observed in the surrounding brain that was hyperintense in T2-
weighted MRI (Figure 5. 4F–H). A tiny cluster of tumor cells was found in this
example (inset in Figure 5. 4G).

Figure 5. 3 Appearance of 9L gliosarcoma in the three control groups in histology. Animals receiving
no treatment or FUS-Only (A–D) all had a similar appearance. The tumor appeared as a solid mass that
replaced large volumes of brain tissue (A). The bulk of the tumors consisted of viable and rapidly
dividing spindle-shaped cells (inset in A). Congested blood vessels were observed throughout,
surrounded by necrotic tissue (B). Some regions of adjacent brain tissue were severely damaged,
presumably from ischemia (C). There was a rim of infiltrating cells at the margin (D). Most tumors in
the Lipo-DOX Only group (E–F) were also large masses of tumor cells with an infiltrating margin (E).
However, unlike the other two control groups, they had a lower cellularity, unhealthy tumor cells, and
intensely vacuolated matrix (inset in E). Tumor cell invasions along perivascular tracts and tumor cell
clusters were observed at distant sites up to 2 mm from the edge of the solid tumor. The vacuolation
evident in the tumor mass was often not observed in the infiltrating margin (* in F).
128

Figure 5. 4 Histological appearance of the brain in three of the animals from the FUS + Lipo-DOX
group. (A–B) Long-term survivor (see xxxB for MRI). No tumor cells were found. Brain tissue loss at
the former tumor site was evident, and the lateral ventricle was enlarged and filled this space. Tissue
necrosis (infarct) was observed in the adjacent tissue, presumably from ischemia. Hemosiderin, either
in clusters or inside macrophages was observed within the necrotic area. A small cyst (*) was also
observed. (C–E) Example frogman animal, whose tumor was resolved, but the animal was euthanized
at day 36 due to poor health. (C) T2-weighted MRI showing tumor growth and shrinkage. At week 4,
only a small hyperintense region was visible. (D–E) A small necrotic area with macrophage infiltration
was found at the former tumor site. (F–H) Another animal with a strong treatment response, but that
was euthanized due to poor health at day 32. In this animal, the tumor grew to a relatively large size
over weeks 1–2. At week 4, an extensive hyperintense area was observed in T2-weighted imaging (F).
A necrotic area with micro-hemorrhages was found in histology at the former tumor site (G–H).
Damaged or necrotic brain tissue was evident in the area that was hyperintense in T2-weighted imaging.
A small cluster of tumor cells remained (inset in G).
129

130
5.1.4 Survival Analysis
Kaplan–Meier survival analysis is shown in Figure 5. 5; the corresponding
statistical data are summarized in Table 5. 1. The median survival time for the animals
in both the Control and FUS-Only groups was about 18 days. For animals in the Lipo-
DOX Only group, it was 20.3 days - a 16% improvement over the animals in the
Control group. However, this difference was not significant (P = 0.16). In contrast,
the animals in the FUS + Lipo-DOX group showed a significant survival benefit (P <
0.001) compared to the other three groups. The median survival time was 35 days, a
100% and 72% improvement over the Control and Lipo-DOX Only groups,
respectively. Note that this analysis did not censor the two animals euthanized early
due to skin infection. If one assumes those animals did not die from their tumor and
censors them, the estimated median survival of the FUS + Lipo-DOX group would be
longer than 142 days, as more than 50% of the remaining animals survived until this
time.

Figure 5. 5 Kaplan–Meier survival curves for the four experimental groups. Three long-term survivors,
who did not exhibit impaired activity, were euthanized at different times (tick marks). Afterwards they
were censored.
Table 5. 2 Survival analysis
Treatment Group
N rats
Max. survival (days)
Median survival (days)
ISTmedian (%)
Mean survival ± S.D. (days)
P-value, Hazard ratio
Control 7 23 17.5 ..... 18.6 ± 3 ..... FUS-Only 8 21 18.0 2.9 18.9 ± 1 0.85, 1.16 Lipo-DOX Only
6 27 20.3 16.2 22.5 ± 3 0.16, 1.18
FUS+Lipo-DOX
8 >142 35.0 100.0 64.0 ± 48 0.00031, 5.36
Note - Increase in Survival Time [ISTmedian (%)], P-value, and Hazard ratio are relative to the Control
group. P-value and Hazard ratio from Log-Rank test between FUS+Lipo-DOX and Dox-Only group
are 0.00057, 4.52 respectively.
5.2 Discussion
Doxorubicin is a commonly-used anticancer drug for treatment of a wide
131

132
range of cancers. While its effectiveness against glioma has been shown in
vitro [247] and in vivo when injected directly into the tumor [226,248], systemic
administration has not been effective clinically [249], presumably reflecting
insufficient delivery [250]. A number of drug formulations have been developed to
enhance the delivery of doxorubicin in animal glioma models [251–255] and at least
one clinical trial is ongoing with such an agent [256]. Here, ultrasound and
microbubbles can effectively improve outcomes in a rat glioma model using an
existing liposomal agent, removing the need to develop and test new drug formulation
was demonstrated. The method is noninvasive and restricts the drug delivery only to
desired brain regions. While more work is needed to optimize the treatment and to
better understand its safety profile, these results are promising for the development of
new treatment options for glioma patients. They join several other studies that showed
this FUS method can enhance drug delivery and improve outcomes in brain tumor
models [166,167,172,173,190,191,257].
This study also demonstrates the importance of multiple treatments.
Previously, a modest survival improvement (24%) compared to untreated controls
was observed with a single treatment in this tumor model [191]. With three weekly
133
treatments, median survival was increased by 100% compared to the controls, and it
was observed that 72% survival improvement compared to treatment with
chemotherapy only. While the drug alone produced some treatment effects, it did not
significantly improve survival or stop tumor proliferation in most cases. Histological
examination of the tumors in this group showed a heterogeneous response to the
treatment, with necrotic areas interspersed with viable tumor cells — perhaps
consistent with heterogeneous vascular permeability and insufficient drug delivery to
some regions. It also appeared that perhaps the drug did not reach the infiltrating
tumor cells, as the matrix vacuolation evident in the tumor mass was not seen around
the tumor cells at the tumor margin. In contrast, all but one of the tumors in the FUS +
Lipo-DOX group exhibited a strong treatment effect
Several adverse events were observed. Three rats with little or no tumor
evident in histology – one in the Lipo-DOX Only group and two in the FUS + Lipo-
DOX group were euthanized due to impaired activity after three treatments. This
finding may suggest that we used an aggressive treatment schedule that may not be
tolerated by all subjects. Doxorubicin, even when encapsulated, has multiple known
side effects, some of them severe. Use of medications to reduce the symptoms of
134
these side effects may help to avoid the impairment we observed. In one animal
(shown in Figure 5. 4F–H), damaged brain tissue was evident over a large portion of
the treated hemisphere. Brain tissue loss and necrosis in the surrounding brain in the
three long-term survivors in the FUS + Lipo-DOX group was observed. It was not
known whether these effects were due to the FUS + Lipo-DOX treatment or to the
extensive tumor burden that could have damaged the surrounding brain due to mass
effects. The results in Chapter 4 suggest that the amount of doxorubicin delivered
across the BBB in the normal brain with these sonication parameters would not result
in such severe neurotoxicity.
A potentially significant adverse event was the extensive intratumoral
hemorrhagic area that occurred in one animal one week after the last FUS + Lipo-
DOX treatment. While frank bleeding (such as into the ventricles) was not observed,
vascular risks associated the treatment should be examined in more detail. This
hemorrhage may have resulted from necrosis of the vessel wall in a large tumor vessel.
Others have reported hemorrhages in this tumor model with different doxorubicin
formulations [255,258]. Skin toxicity was observed, a finding that may not be
surprising since such toxicity, particularly in the hands and feet, is a known side effect
135
of doxorubicin [259]. However, it might be prudent to confirm that the sonications do
not increase drug delivery into the scalp. The focal region of our transducer
overlapped the small rat skull, and the intensity on the scalp may have been relatively
high. While the intensity on the scalp is expected to be less in humans, this issue
might still be important, as large tumors may require sonication at hundreds of
individual targets, and any low-level effects may accumulate. Reflections from the
skull bone can exacerbate this effect.
This study had several limitations. One limitation was our tumor model. While
the 9L rat gliosarcoma model is highly aggressive and the robust survival
improvement observed here is certainly encouraging, future work is needed with
models that are genetically similar to human GBM and that have similar growth
patterns. The 9L glioma model is not considered to be highly infiltrating [260] and
only a relatively narrow infiltrating zone was observed. The disruption of the BBB in
the surrounding brain tissue may not have played as large a role in our outcomes as
might be anticipated clinically. Targeting infiltration is anticipated to be critically
important with human GBM, and based on clinical patterns of recurrence [5,6,261], a
margin extending several centimeters into the “normal” brain may require BBB
136
disruption for effective therapy. Additional work in a more infiltrating tumor model is
needed to ensure that such regions can safely and effectively to be targeted. Finally,
this model has been reported to be immunogenic [260], which may have led to more
improved outcomes than would be achieved in non-immunogenic tumor model.
Another limitation was to use two different drug formulations in some animals
due to a national shortage of doxorubicinIL. While they had similar liposome
properties, there may have been differences unknown to us that may have impacted
our results. The sample size was also relatively small, and more work is needed to
better characterize the effectiveness of the treatment and the rate of adverse events.
More consistent results may be obtained using online methods to optimize the
exposure levels. While the exposure levels based on the animal age and weight were
modified, retreatment of regions where MRI contrast enhancement was poor to
attempt to achieve a uniform level of enhancement was performed. The monitoring
the microbubble dynamics in real-time using online acoustic emission
monitoring [139,204] and re-treating areas with poor contrast enhancement can
improve the local delivery and perhaps allow for a reduced systemic dose was being
anticipated. Here, only one dose of liposomal doxorubicin was evaluated. By utilizing

137
post-treatment MRI contrast imaging, which can be correlated to drug
concentrations [95,118], along with online methods to control the exposures was
expected, the optimization of the drug dose delivered to the tumor and the
surrounding brain tissue. If one understands the relationship between the
concentrations of the therapeutic and the imaging contrast agent, which can perhaps
be established in animals, one might be able to titrate the drug administration to
achieve a desired level in the brain. However, this may be challenging in tumors,
where the vascular permeability can change over time. This relationship was explored
in work described in the next Chapter.

138
Chapter 6: Enhancement in Blood-Tumor Barrier Permeability
and Delivery of Liposomal Doxorubicin using Focused
Ultrasound and Microbubbles: Evaluation during
Tumor Progression in a Rat Glioma Model
It would be desirable to demonstrate that the amount of drug delivered and its
penetration into the brain parenchyma is sufficient to produce a therapeutic response.
Ideally, this would be performed for each patient. Post-treatment imaging could
provide this assurance by labeling the drug with a contrast agent for MRI or other
imaging modality [174]. It might also be possible to use a standard contrast agent as a
surrogate measurement, which would be advantageous since it could be used with
existing drugs. A number of studies have related signal intensity changes in contrast-
enhanced MRI after BBB disruption with tissue drug concentrations [95,175,208].
More quantitative and repeatable techniques, such as estimating contrast agent
concentrations via T1-mapping [134,209] or vascular transfer coefficients via
analysis of dynamic contrast-enhanced MRI (DCE-MRI) [99] have been used to
perform spatial and temporal characterization of BBB permeability after FUS. DCE-
MRI can also been investigated to predict the resulting payload of drugs to the

139
brain [118] and in tumors [262].
Despite these promising findings, one needs to be careful when expanding to
different patient populations or if different drugs are used. The relationship between
the delivery of a contrast agent and a therapeutic can be complicated. For example, a
relationship found in the normal brain may not translate to patients with CNS
disorders. This challenge could be particularly difficult in tumors where the vascular
properties can change over time [238]. Further complications may arise when the
therapeutic has a different size or other chemical property than the contrast agent.
Here, the usefulness of MRI as a monitoring and feedback tool for the drug
delivery procedure was explored. I measured the transfer coefficient Ktrans of the MRI
contrast agent Gd-DTPA with DCE-MRI for cases with and without sonication and
Lipo-DOX administration. I then compared Ktrans to the resulting doxorubicin
concentrations in tumors. Morever, I performed this characterization at three time
points to investigate if this relationship changes over time as the tumor blood vessels
become more degenerate. Finally, a feasibility study was performed where acoustical
monitoring of bubble activity during sonication was correlated with signal intensity
changes in contrast-enhanced MRI was investigated.

140
6.1 Results
6.1.1 Bilateral Tumor Progression and BBB/BTB Disruption
The MRI appearance of the bilateral tumors on day 9, 14, and 17 were monitored in
MRI where they grew rapidly over time (Figure 6. 1A), resulting in significant
midline shift and compression of the lateral ventricles. The tumor volumes in the right
hemisphere were 14.5, 113.8 and 151.4 mm³ at days 9, 14, and 17 respectively. The
corresponding volumes of the left tumors were 16.0, 110.8, and 143.8 mm³, and were
not significantly different (P=0.9) from those on the right (Figure 6. 1B). A higher
pressure amplitude (0.81 vs 0.55 MPa) was needed at day 17 to induce consistent
BBB/BTB permeabilization, presumably because of an increase in skull or dura
thickness as the rats grew [198]. The sonication pattern was similar to the studies in
earlier chapters, where 5-20 targets were applied in a grid (spacing: 1.5 mm) to cover
the entire tumor and a rim of surrounding brain tissue. Post–FUS T2*-weighted
images were used to detect small petechaie which would appear in this imaging as
hypointense spots.
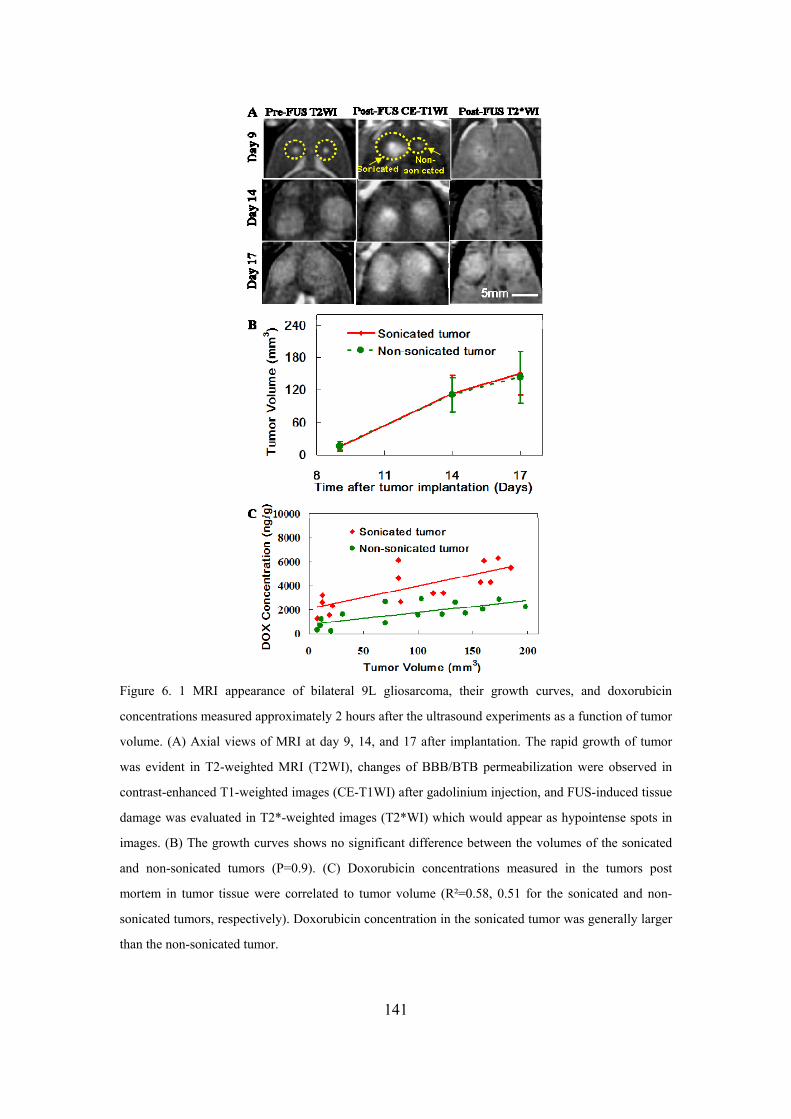
Figure 6. 1 MRI appearance of bilateral 9L gliosarcoma, their growth curves, and doxorubicin
concentrations measured approximately 2 hours after the ultrasound experiments as a function of tumor
volume. (A) Axial views of MRI at day 9, 14, and 17 after implantation. The rapid growth of tumor
was evident in T2-weighted MRI (T2WI), changes of BBB/BTB permeabilization were observed in
contrast-enhanced T1-weighted images (CE-T1WI) after gadolinium injection, and FUS-induced tissue
damage was evaluated in T2*-weighted images (T2*WI) which would appear as hypointense spots in
images. (B) The growth curves shows no significant difference between the volumes of the sonicated
and non-sonicated tumors (P=0.9). (C) Doxorubicin concentrations measured in the tumors post
mortem in tumor tissue were correlated to tumor volume (R²=0.58, 0.51 for the sonicated and non-
sonicated tumors, respectively). Doxorubicin concentration in the sonicated tumor was generally larger
than the non-sonicated tumor.
141

142
6.1.2 Doxorubicin Concentration and Kinetics of BBB/BTB
Permeability Changes
Lipo-DOX was administered in fractions immediately before each sonication, and its
concentration in the tumors was measured about two hours later. The doxorubicin
concentration measured post mortem via fluorometry increased monotonically as a
function of tumor volume in both the left (non-sonicated) and right (sonicated) tumors
(Figure 6. 1C). A good correlation (R² = 0.58 and 0.51 for the left and right tumors,
respectively) was observed between doxorubicin concentration and tumor volume
(Fig.2C). The concentration in the sonicated tumor (2222±784, 3687±796 and
5658±821ng/g) was generally greater than in the non-sonicated tumor (823±600,
1817±732 and 2432±448ng/g).
In most animals, DCE-MRI was obtained before and after FUS-induced
BBB/BTB to calculate the transfer coefficient Ktrans for Gd-DTPA. Example maps of
Ktrans and changes of signal intensity before and after sonication are shown in (Figure
6. 2). After FUS, the signal intensity on sonicated tumor was increased significantly
(P < 0.05), at day 9 but not at day 14 or 17 compared with before FUS (Figure 6. 2A-
C). Before FUS, the Ktrans values for the both tumors appeared similar on days 9, 14

143
and 17. They increased, particularly at day 9, for the sonicated tumors (shown by the
arrow in Figure 6. 2D). Comparisons of mean Ktrans before and after sonication are
shown in Figure 6. 3. In the non-sonicated tumor, the mean Ktrans values (±S.D) before
FUS were 0.0068±0.0027, 0.0088±0.0026 and 0.012 ± 0.0086 min-1 at day 9, 14 and
17, respectively; after the sonications these values were 0.0044±0.0018,
0.0103±0.0047 and 0.0115±0.0015 min-1 (Figure 6. 3A). In the sonicated tumors, the
mean Ktrans values before FUS were 0.0077±0.0053, 0.0082±0.0025, and
0.01006±0.0019 at day 9, 14, and 17, respectively. After FUS they were
0.0129±0.0064, 0.0128±0.0062 and 0.0116±0.0018 (Figure 6. 3B). No significant
difference (P>0.05) was observed in the mean Ktrans between the two DCE-MRI
acquisition for the non-sonicated tumor at any day. However, for the sonicated tumor,
Ktrans was significantly increased (P < 0.05) at day 9 but not at day 14 or 17.

Figure 6. 2 Example of signal intensity changes in sonicated tumor and permeability maps in the
bilateral tumors at different stages of tumor growth before and after FUS. (A-C) Change of signal
intensity of Gd-DTPA on sonicated tumor was measured (before and after FUS) at three different days
(9, 14 and 17 days after implantation) during DCE-MRI. After FUS, the signal intensity of Gd-DTPA
on sonicated tumor was increased significantly (P < 0.05), at day 9 but not at day 14 or 17 compared
with before FUS. (D) Maps of Ktrans for Gd-DTPA obtained after two separate injections (before and
after FUS) on three different days (9, 14 and 17 days after implantation). Before FUS, the Ktrans
values for the both tumors appeared similar on days 9, 14 and 17. They increased, particularly at day 9,
for the sonicated tumors (shown by arrow in Fig. 3D). Ktrans values are indicated in the color bar.
144

Figure 6. 3 Mean Ktrans estimates (±S.D.) before and after FUS for the sonicated and control (non-
Figure 6. 4 shows the comparison of Ktrans and doxorubicin concentration
between the sonicated and non-sonicated tumors obtained DCE-MRI after sonication
of one of the tumors. Similar to the results shown in Figure 6. 3, Ktrans was
significantly greater (P<0.05) at day 9, but not at days 14 or 17. The mean ratio of
sonicated) tumors at different stages of tumor growth. (A) The Ktrans measurements in non-sonicated
tumors were not significantly enhanced between the two DCE-MRI acquisitions (before and after FUS)
at any day. (B) For the sonicated tumors, mean Ktrans was significantly increased (P < 0.05) at day 9 but
not at day 14 or 17. (* P<0.05)
145

146
Ktrans between the sonicated and non-sonicated tumors was 1.7±1.2, 1.6±2, 1.1±2, and,
respectively, at days 9, 14, and 17 (Figure 6. 4)A. In contrast, the doxorubicin
concentration was enhanced significantly at all days (P < 0.05 at day 9, P < 0.01 at
day 14 and P < 0.0001 at day 17) (Fig. 5B). The ratio of doxorubicin concentration
between the sonicated and non- sonicated tumors was 2.7±1.3, 2.03±1.08, and
2.33±1.8 for days 9, 14, and 17 respectively (Figure 6. 4B). Other than a moderate
correlation (R²=0.44) at day 9, there was no clear relationship between doxorubicin
concentration and Ktrans after FUS-induced BBB disruption. No significant difference
(P>0.05) was observed in fv between measurements made before and after FUS or
between the sonicated and non-sonicated tumors.
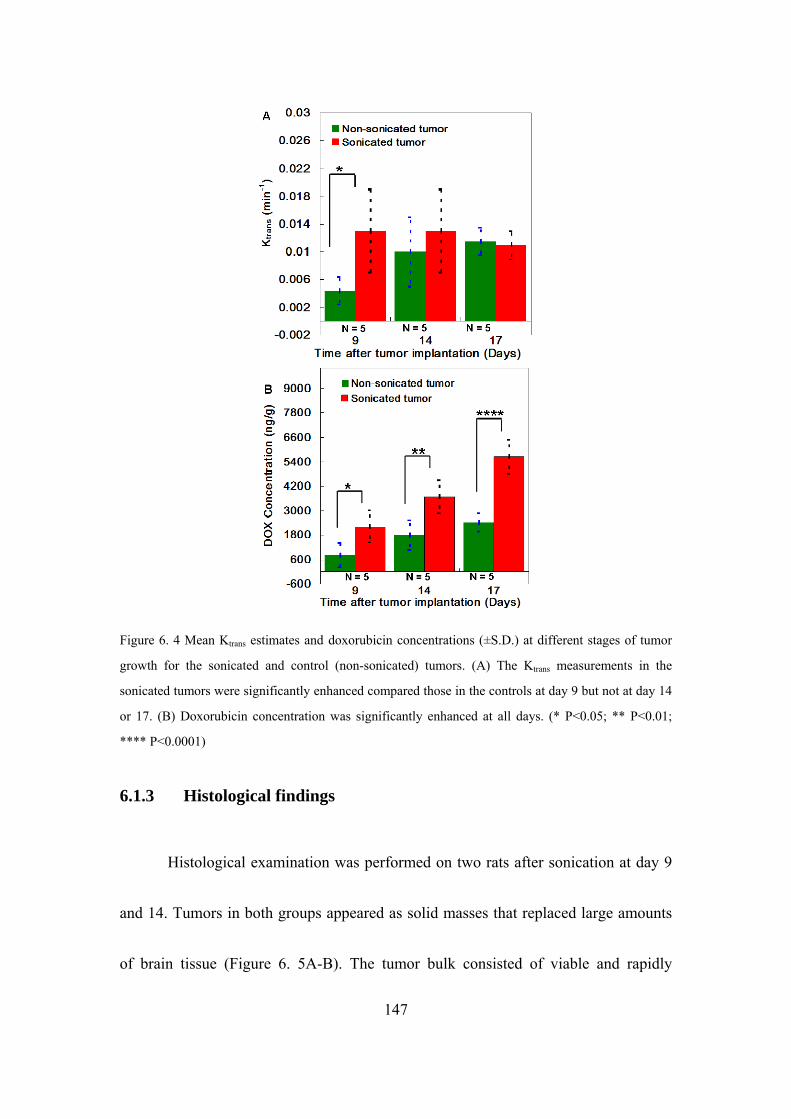
Figure 6. 4 Mean Ktrans estimates and doxorubicin concentrations (±S.D.) at different stages of tumor
growth for the sonicated and control (non-sonicated) tumors. (A) The Ktrans measurements in the
sonicated tumors were significantly enhanced compared those in the controls at day 9 but not at day 14
or 17. (B) Doxorubicin concentration was significantly enhanced at all days. (* P<0.05; ** P<0.01;
**** P<0.0001)
6.1.3 Histological findings
Histological examination was performed on two rats after sonication at day 9
and 14. Tumors in both groups appeared as solid masses that replaced large amounts
of brain tissue (Figure 6. 5A-B). The tumor bulk consisted of viable and rapidly
147

dividing spindle-shaped cells. Tiny necrotic sites scattered throughout the tumor were
observed on day 14 but not on day 9 (yellow square in Figure 6. 5B). Those sites were
comparatively smaller than the rest of the tumor mass. The sonicated tumors appeared
unaffected in the H&E stained sections. The only effect of note was a small number of
tiny clusters of extravasated erythrocytes (petechaie) that were scattered throughout
the sonicated tumor regions (Figure 6. 5C-D, magnified view of red squares).
Figure 6. 5 Appearance of two 9L gliosarcoma at different days after implantation in histology. (A-B)
Appearance of the tumors in an H&E stained section at day 9 (5×) and 14 (1.25×). The tumors
appeared as solid masses that replaced large volumes of brain tissue. The bulk of the tumors consisted
of rapidly dividing spindle-shaped cells with some small necrotic zones evident on day 14 (yellow
square in B). (C-D) Magnified views (20x) of the red boxes. Most of the sonicated region appeared
unaffected, but in a few areas tiny petechiae were observed.
148

149
6.2 Discussion
This study investigated the pharmacokinetic characteristics of small and large-
molecule agents at different stages of tumor growth after BBB/BTB permeabilization
with microbubble-enhanced FUS. Gd-DTPA (938 Da) and DCE-MRI were used to
noninvasively provide semiquantitative measures of transport across these vascular
barriers, and the concentration of doxorubicin, which was administered in ~100 nm
liposomes, was measured in the tumor post mortem. Microbubble-enhanced FUS
succeeded in increasing doxorubicin concentration by a factor of two or more
regardless of the stage of tumor growth, but the enhanced delivery of Gd-DTPA,
reflected in transport coefficient Ktrans measured in DCE-MRI, was significantly
enhanced only at the early stage of tumor growth. Ktrans was slightly elevated
compared to the non-sonicated tumors at later time points, but there was substantial
variation and the increases were not statistically significant. That finding is consistent
with the results of a study by Chu et al., who also found that microbubble-enhanced
sonication could increase delivery of Gd-DTPA in early, but not in late-stage
tumors [209]
If this finding that Ktrans for Gd-DTPA of late-stage tumors cannot be
significantly increased is correct, it suggests that that there could be a size-dependent

150
maximum level enhancement in BTB permeability that can be achieved by FUS and
microbubbles. In contrast to Gd-DTPA, the sonication-induced enhancement in
doxorubicin delivery increased at days 14 and 17. However, future work investigating
agents with a range of different sizes would be necessary to understand whether these
results are true in general. In addition, the 9L gliosarcoma is a highly aggressive
tumor model; it would be interesting to investigate less aggressive models to further
understand how tumor development influences the ability to enhance delivery of
drugs of different sizes.
The fact that FUS appeared to be more effective in delivering a drug
encapsulated in a large carrier regardless of the tumor stage is encouraging, as it
suggests that even late-stage tumors can benefit from FUS-induced drug enhancement.
Many promising drug carriers such as liposomes and various other nano-carriers are
being developed that may be useful for brain tumors if the challenges created by the
BTB and BBB can be overcome. These agents can be more targeted and have fewer
side effects compared to the broad-spectrum chemotherapy agent doxorubicin.
However, more work is needed to confirm that drug penetration away from the blood
vessels, which can be relatively small for large particles, is sufficient to achieve a
151
therapeutic response. Prior work with liposomal doxorubicin and brain tumor
models [170,191], and the development of “brain-penetrating” nano-carriers [263]
are encouraging in this regard.
Unfortunately, a good correlation with doxorubicin delivery and Ktrans
measurements with the commonly-used MRI contrast agent Gd-DTPA was not seen,
which would have been useful since it could enable one to noninvasively estimate
drug concentrations. Several studies have found a good correlation between signal
intensity changes in contrast enhanced MRI and that of a drug or tracer in the normal
brain or in tumor models [208,264,265]. Most relevant to this study, Treat et al.
compared MRI signal enhancement after Gd-DTPA injection and doxorubicin
concentration in the normal rat brain after FUS-BBBD [95]. Unlike in this work
those experiments, which also used liposomal doxorubicin, a good correlation was
observed between these two measurements. This discrepancy was likely due to
differences between normal brain and tumor blood vessels. In contrast to the normal
brain, where FUS-induced permeability changes to the BBB might be expected to be
relatively reproducible, the vascular permeability in a tumor can vary widely and can
change over time, and it is likely that predicting the sonication-induced changes to the
152
BTB is not straightforward. This discrepancy is likely to be particularly stark when
the drug and contrast agent have a large difference in size or in other chemical
properties. It would be interesting to repeat this study with liposomal MRI contrast
agent.
6.3 Acoustics Emission
Previous work has demonstrated that the acoustic emissions recorded during
sonication can be used to characterize the microbubble activity, which can be useful
for monitoring FUS-BBBD [124,125,139,204]. This work has shown that signatures
for robust stable cavitation – strong harmonics, subharmonics, or ultraharmonics – are
produced when the microbubbles are sonicated at an intensity that results in BBBD. In
contrast, when wideband emissions are produced, which are a signature for inertial
cavitation [74], vascular damage is produced in addition to FUS-BBBD [139]. As I
showed in Chapter 4, avoiding this vascular damage in the brain outside the tumor
margins can be important for avoiding permanent brain damage. To date, nobody has
investigated this approach in tumors.
Thus, in addition to above-mentioned DCE-MRI method, we performed a
feasibility study where analysis of acoustic emission of microbubbles were compared
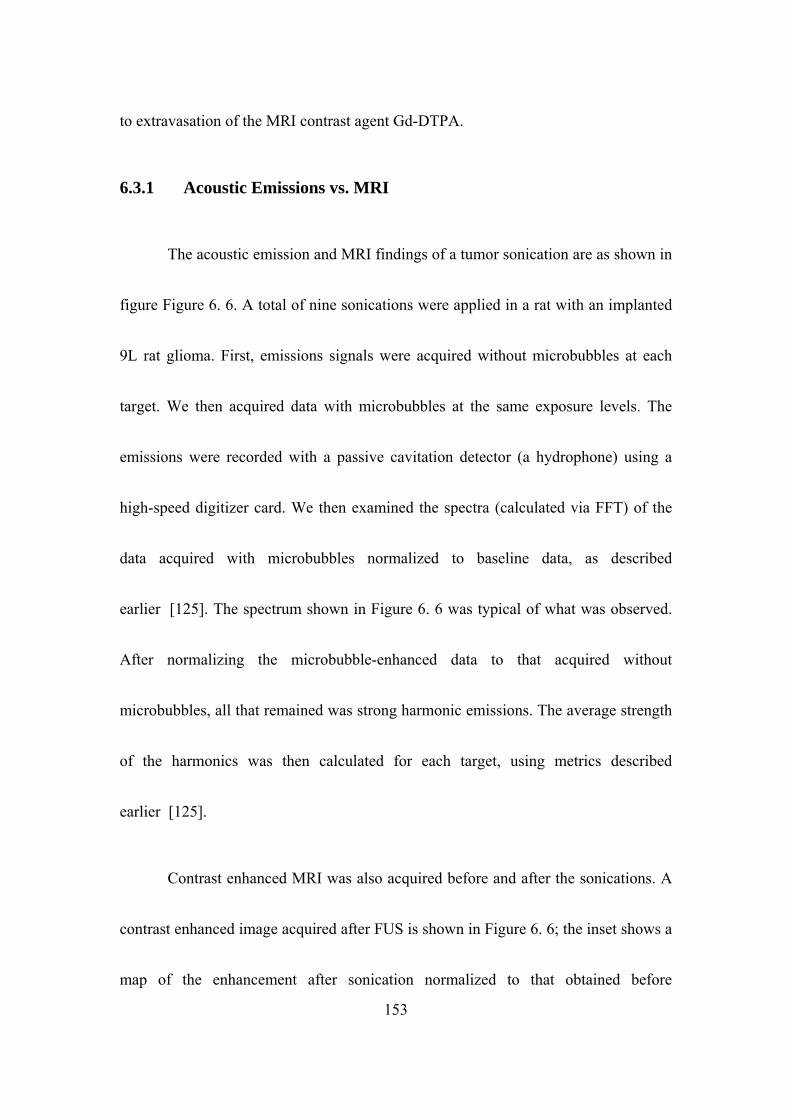
153
to extravasation of the MRI contrast agent Gd-DTPA.
6.3.1 Acoustic Emissions vs. MRI
The acoustic emission and MRI findings of a tumor sonication are as shown in
figure Figure 6. 6. A total of nine sonications were applied in a rat with an implanted
9L rat glioma. First, emissions signals were acquired without microbubbles at each
target. We then acquired data with microbubbles at the same exposure levels. The
emissions were recorded with a passive cavitation detector (a hydrophone) using a
high-speed digitizer card. We then examined the spectra (calculated via FFT) of the
data acquired with microbubbles normalized to baseline data, as described
earlier [125]. The spectrum shown in Figure 6. 6 was typical of what was observed.
After normalizing the microbubble-enhanced data to that acquired without
microbubbles, all that remained was strong harmonic emissions. The average strength
of the harmonics was then calculated for each target, using metrics described
earlier [125].
Contrast enhanced MRI was also acquired before and after the sonications. A
contrast enhanced image acquired after FUS is shown in Figure 6. 6; the inset shows a
map of the enhancement after sonication normalized to that obtained before
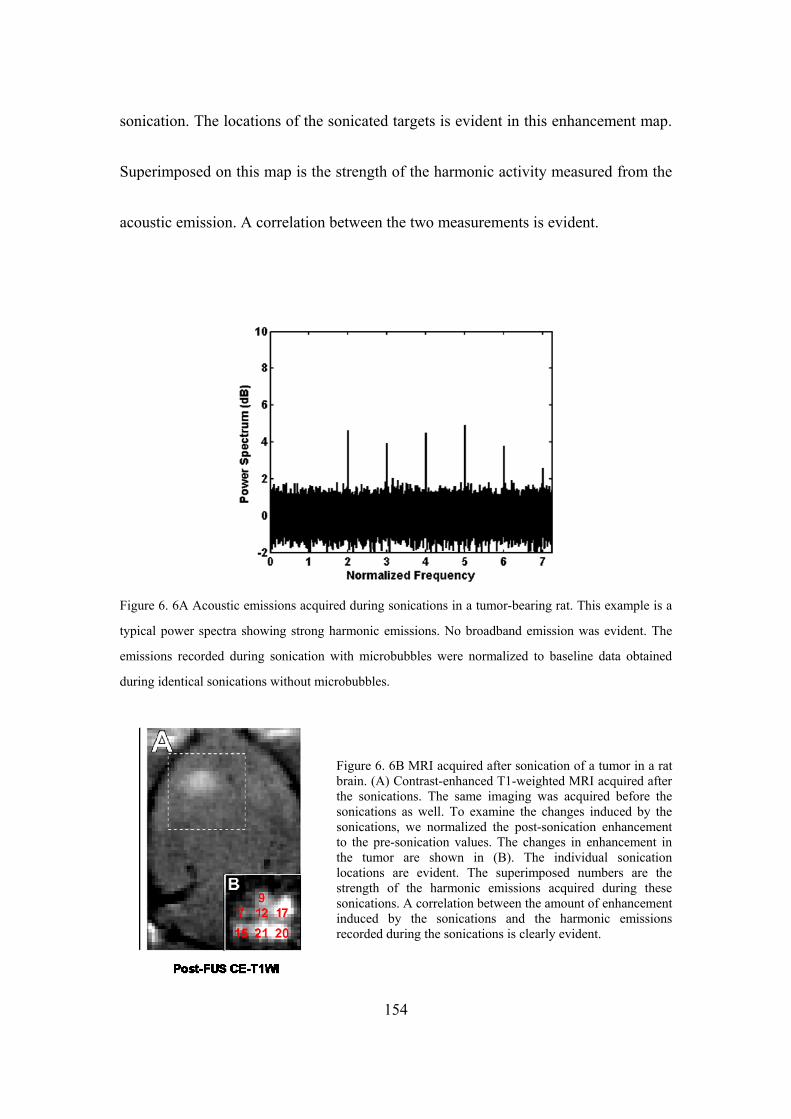
sonication. The locations of the sonicated targets is evident in this enhancement map.
Superimposed on this map is the strength of the harmonic activity measured from the
acoustic emission. A correlation between the two measurements is evident.
Figure 6. 6A Acoustic emissions acquired during sonications in a tumor-bearing rat. This example is a
typical power spectra showing strong harmonic emissions. No broadband emission was evident. The
emissions recorded during sonication with microbubbles were normalized to baseline data obtained
during identical sonications without microbubbles.
Figure 6. 6B MRI acquired after sonication of a tumor in a rat brain. (A) Contrast-enhanced T1-weighted MRI acquired after the sonications. The same imaging was acquired before the sonications as well. To examine the changes induced by the sonications, we normalized the post-sonication enhancement to the pre-sonication values. The changes in enhancement in the tumor are shown in (B). The individual sonication locations are evident. The superimposed numbers are the strength of the harmonic emissions acquired during these sonications. A correlation between the amount of enhancement induced by the sonications and the harmonic emissions recorded during the sonications is clearly evident.
154

155
6.3.2 Discussion
While we clearly need to repeat this study in more animals, these results are
encouraging for the prospect of controlling FUS-BBBD. Our laboratory found
previously that the strength of the harmonic emsissions is correlated with the strength
of BBB disruption in nonhuman primates [125], and using this as a method to control
FUS-BBBD to ensure that it is safe and effective. The present results suggest that the
strength of the harmonic emissions, may also be related to the change in vascular
permeability in a tumor. If these results are verified, it could be an important
development for the clinical translation of this technology.

156
Chapter 7:Conclusions and Future Work
7.1 Conclusions
In this thesis, MRgFUS technology was used to induce BBB/BTB permeabilization
for the targeted delivery of a chemotherapy agent that normally does not reach the
brain at all and that normally is not effectively delivered to brain tumors. The
BBB/BTB and their limitations for brain drug delivery have prompted several
different techniques to overcome these limitations, including invasive methods,
biopharmaceutical approaches, and different methods to transiently disrupt the BBB
distuption. These methods, including FUS, have different advantages and
disadvantages, as I discussed in Chapter 1. Additionally, the underlying mechanisms
due to interaction of microbubble with ultrasound were described briefly in that
chapter. Furthermore, the working principles of MRI and DCE-MRI method used to
observe the BBB/BTB permeability change due to FUS were outlined.
An overview of common methods and materials used in this dissertation was
discussed in Chapter 2. In that chapter I described the animal preparation protocol, my
experimental set up for MRI-guided FUS, the chemotherapy agent I used, the methods
I used for transducer calibration, the MRI sequences I used to guide the procedure and
157
evaluate the results, and the fluorometry and fluorescent microscopy techniques I
employed to visualize and measure drug concentrations.
Ultrasound-mediated Lipo-DOX delivery through BBB and its concentration
in the brain were described in Chapter 3. Clinically relevant concentrations of
doxorubicin (~4.8±0.5 µg/g) were delivered to the brain with the sonication
parameters (0.69 MHz; 0.55 MPa; 10 ms bursts; 1 Hz PRF; 60s duration),
microbubble concentration (Definity, 10 µl/kg), and Lipo-DOX dose (5.67 mg/kg) I
used. I found that I could achieve a clinically-relevant concentration, which I based on
a study that compared doxorubicin concentrations in human tumors with clinical
outcomes [237]. I also found that the resulting concentration was reduced by 32%
when the agent was injected 10 minute after the last sonication. These results are
encouraging for the prospect of using this drug delivery technique in an invasive
glioma, where we will need to deliver drugs across the intact BBB to reach cancer
cells infiltrating into the normal brain, and for optimizing the procedure.
The safety of using multiple sessions of FUS-BBBD and Lipo-DOX in the
normal brain was investigated in Chapter 4. From histological analysis, we found that
after three weekly treatments, the sonicated brain tissue in the focal plane was

158
unaffected in rats that received FUS-BBBD only, despite MRI evidence that minor
vascular damage occurred during some of the sonications. In contrast, only one out of
four rats that received FUS-BBBD and Lipo-DOX appeared completely unaffected at
focal plane; the other three evidence of prior tissue damage (small scars and a small
cyst in one case). The result indicates that while delivery of Lipo-DOX to the rat brain
can result in minor damage, the severe neurotoxicity seen in earlier works [266] does
not appear to occur with delivery via FUS-BBB disruption. While future work is
needed, the results suggest that Lipo-DOX can exacerbate damage resulting from
inertial cavitation. I base this speculation on the fact that MRI evidence suggested that
vascular damage was produced during the sonications in the animals that both did and
did not receive Lipo-DOX, while evidence of permanent prior damage was only
observed in the rats who received Lipo-DOX. Based on these findings, I would
recommend caution when sonicating the margin around a tumor.
The therapeutic efficacy of three weekly sessions of FUS and Lipo-DOX in
the 9L rat glioma model has been demonstrated in chapter 5. Animals that received
FUS and Lipo-DOX (N=8) had a median survival time that was increased
significantly (P < 0.001) compared to animals who received Lipo-DOX only (N = 6),
159
FUS only (N=8), or no treatment (N=7). The median survival for animals that
received FUS and Lipo-DOX was increased by 100% relative to untreated controls,
whereas animals who received Lipo-DOX alone had only a 16% improvement.
Animals who received only FUS showed no improvement. No tumor cells were found
in histology in 4/8 animals in the FUS + Lipo-DOX group, and in two animals, only a
few tumor cells were detected. Overall, this work demonstrates that multiple sessions
using this FUS technique to enhance the delivery of Lipo-DOX can result in a
pronounced therapeutic effect, at least in this rat glioma model. I would recommend
continuing this work in a better tumor model that is genetically similar to a human
glioma and that is more infiltrative. Methods to minimize the systemic dose and to
avoid side-effects also should be pursued.
Changes in vascular permeability in a rat glioma model resulting from FUS
and microbubbles were investigated as a function of time after tumor implantation
using dynamic contrast-enhanced MRI (DCE-MRI) in Chapter 6. The transfer
coefficient (Ktrans) describing the extravasation of the MRI contrast agent Gd-DTPA
was measured via DCE-MRI before and after sonication. I then euthanized the animal
and measured doxorubicin concentration in the tumors. Tumor doxorubicin

160
concentrations increased monotonically (823±600, 1817±732 and 2432±448 ng/g) in
non-sonicated control tumors at 9, 14 and 17 days respectively. With FUS-induced
BTB permeabilizaiton, the Lipo-DOX concentrations were enhanced significantly
(P<0.05, P<0.01, and P<0.0001 at days 9, 14, and 17, respectively) and were greater
than the control tumors by a factor of two or more (2222±784, 3687±796 and
5658±821 ng/g) regardless of the stage of tumor growth. In contrast, the transfer
coefficient Ktrans was significantly (p<0.05) enhanced compared to control tumors
only at day 9 but not at day 14 or 17. These results suggested that FUS-induced
enhancements in Lipo-DOX delivery are relatively consistent over time, at least in
this tumor model. These results are also encouraging for the use of large drug carriers,
as they suggest that even large/late-stage tumors can benefit from FUS-induced drug
enhancement. The corresponding enhancements in Ktrans, however, were found to be
variable in large/late-stage tumors and not significantly different than controls. This
difference perhaps reflects the size mismatch between the liposomal drug (~100 nm)
and Gd-DTPA (molecular weight: 938 Da) and is unfortunate since it could be helpful
to be able to use the MRI contrast agent as a drug surrogate to predict drug delivery. It
may be necessary to use a larger MRI contrast agent to effectively evaluate the
sonication-induced enhanced permeabilization in large/late-stage tumors when a large
161
drug carrier such as a liposome is used. In addition to DCE-MRI method, I
investigated the feasibility of using recordings of the acoustic emissions produced by
the microbubbles can be related to the extravasation of Gd-DTPA, as has been done
previously in normal brain tissue [123,125]. While more work beyond this feasibility
study is clearly needed, a correlation was evident between these two measurements
suggesting that such methods can be useful for monitoring the sonications. Such
methods are important when considering clinical translation. Ultimately we want to
move this procedure out of the MRI environment. Having a method to reliably control
the exposure level to ensure an adequate level of BBB/BTB permeabilization can
enable this translation.
This work shows that FUS is a unique technology that can induce BBB or
BTB permeabilization that is targeted, noninvasive and transient. It can enable the
delivery of therapeutics (even nanocarriers such as a liposome) that normally do not
reach the brain, enhance their delivery to brain tumors, and improve outcomes in a
tumor model. When inertial cavitation is avoided, the sonications do not appear to
have any deleterious effects on the brain, and the method is readily repeatable. I
demonstrated that multiple treatments with FUS and Lipo-DOX significantly
162
inhibited tumor growth, increased survival, and appeared to completely eradicate the
tumor in an aggressive rat gliosarcoma model. I also showed how MRI and acoustic
methods can help to plan, monitor, and evaluate the treatment which offers the
possibility of having control over the locations where drugs are delivered and
concentrations of the drugs used. Importantly, my work has demonstrated that such
methods can become more complicated in tumors and when a chemotherapy drug is
used. When such methods are being developed, one cannot simply evaluate them in
normal brain with imaging tracers.
7.2 Future work
The ultimate goal of this research is to translate ultrasound-mediated drug
delivery technology from an animal model to human patients of with disorders of the
CNS. Further research works need to be done before this technology becomes
practical for widespread clinical trials. The results of the work in this thesis can help
guide this future research.
Preliminary optical imaging results presented in Chapter 3 offer interesting
findings on the likely cellular colocalization of doxorubicin in the brain after
ultrasound-enhanced chemotherapy. While these results are not conclusive, it is clear

163
that this method has promise to further improve and optimize the procedure. For
example, it is known that high interstitial pressures and a dense extracellular matrix
can impede the delivery of drugs far enough from the vasculature to reach tumor cells,
which can survive even in a hypoxic state [238]. By visualizing the drug and by
staining blood vessels, we can investigate and even quantify this penetration
depth [267]. We can then investigate different sonication parameters and other
factors that we can use to improve drug penetration in addition to simply getting the
drugs out of the blood vessels.
The experiments with FUS and Lipo-DOX in Chapters 4 and 5 showed that
multiple treatments can have significant therapeutic outcomes while avoiding serious
neurotoxicity. More consistent results may be obtained using online methods to
optimize the exposure levels. Microbubble dynamics in real-time using online
acoustic emission can be monitored [139,204] and re-treating areas with poor
contrast enhancement can improve the local delivery and perhaps allow for a reduced
systemic dose. It would also be interesting to investigate whether the sonications can
release the doxorubicin from the liposomes, and has been observed by others with
liposome-coated microbubbles [240] . While the 9L rat gliosarcoma model is highly

164
aggressive and the robust survival improvement observed here is certainly
encouraging, future work is needed with models that are genetically similar to human
GBM and that have similar growth patterns. Additional work in a more infiltrating
tumor model is needed to ensure that we can safely and effectively target such regions.
Since 9L has been shown to be immunogenic [260], it would be helpful to show that
one can reproduce similar outcomes in non-immunogenic model.
In Chapter 6, if my finding that the transfer coefficient Ktrans for Gd-DTPA
of late-stage tumors cannot be significantly increased is correct, it suggests that there
could be a size-dependent maximum level enhancement in BTB permeability that can
be achieved by FUS and microbubbles. In contrast to Gd-DTPA, the sonication-
induced enhancement in doxorubicin delivery increased at days 14 and 17. However,
future work investigating agents with a range of different sizes would be necessary to
understand whether these results are true in general. It would also be interesting to
repeat this study with liposomal MRI contrast agent with size similar to Lipo-DOX. In
addition, the 9L gliosarcoma is a highly aggressive tumor model; it would be
interesting to investigate less aggressive models to further understand how tumor
development influences the ability to enhance delivery of drugs of different sizes.
165
Finally, beyond its ability to enhance drug delivery for brain tumors, FUS can
induce a number of different effects through mechanical, thermal, and vascular
interactions. I am fascinated by the wide array of transient and irreversible bioeffects
that we can induce using FUS in the brain. These bioeffects can be employed to
develop new therapies and to probe brain function. I am particularly interested in
studying the physiological response of the brain to ultrasound exposure in more detail.
For example, it would be interesting to investigate the effects of ultrasound on the
local concentrations of neurotransmitters/neuroinhibitors in different brain structures.
If we can use FUS to modulate these substances in a controllable and predictable way,
we will have a valuable tool that can open up entirely new directions for neuroscience.
Targeted drug delivery is just the beginning.

166
References
[1] E. A. Neuwelt, B. Bauer, C. Fahlke, G. Fricker, C. Iadecola, D. Janigro, L.
Leybaert, Z. Molnár, M. E. O’Donnell, J. T. Povlishock, N. R. Saunders, F.
Sharp, D. Stanimirovic, R. J. Watts, and L. R. Drewes, Nat. Rev. Neurosci. 12,
169 (2011).
[2] N. J. Abbott and I. A. Romero, Mol. Med. Today 2, 106 (1996).
[3] W. M. Pardridge, Mol. Biotechnol. 30, 57 (2005).
[4] A. F. Eichler, E. Chung, D. P. Kodack, J. S. Loeffler, D. Fukumura, and R. K.
Jain, Nat. Rev. Clin. Oncol. 8, 344 (2011).
[5] G. Minniti, D. Amelio, M. Amichetti, M. Salvati, R. Muni, A. Bozzao, G.
Lanzetta, S. Scarpino, A. Arcella, and R. M. Enrici, Radiother. Oncol. J. Eur.
Soc. Ther. Radiol. Oncol. 97, 377 (2010).
[6] M. C. Dobelbower, O. L. Burnett Iii, R. A. Nordal, L. B. Nabors, J. M.
Markert, M. D. Hyatt, and J. B. Fiveash, J. Med. Imaging Radiat. Oncol. 55, 77
(2011).
[7] M. C. Chamberlain, J. Neurooncol. 101, 319 (2011).
[8] D. Fukumura and R. K. Jain, J. Cell. Biochem. 101, 937 (2007).
[9] A. Régina, M. Demeule, A. Laplante, J. Jodoin, C. Dagenais, F. Berthelet, A.
Moghrabi, and R. Béliveau, Cancer Metastasis Rev. 20, 13 (2001).
[10] P. R. Lockman, R. K. Mittapalli, K. S. Taskar, V. Rudraraju, B. Gril, K. A.
Bohn, C. E. Adkins, A. Roberts, H. R. Thorsheim, J. A. Gaasch, S. Huang, D.
Palmieri, P. S. Steeg, and Q. R. Smith, Clin. Cancer Res. Off. J. Am. Assoc.
Cancer Res. 16, 5664 (2010).
[11] D. R. Groothuis, Neuro-Oncol. 2, 45 (2000).
[12] W. M. Pardridge, Drug Discov. Today 12, 54 (2007).
[13] J. P. Blumling Iii and G. A. Silva, Curr. Pharm. Biotechnol. 13, 2417 (2012).

167
[14] T. Tomita, J. Neurooncol. 10, 57 (1991).
[15] R. H. Bobo, D. W. Laske, A. Akbasak, P. F. Morrison, R. L. Dedrick, and E. H.
Oldfield, Proc. Natl. Acad. Sci. U. S. A. 91, 2076 (1994).
[16] C. Guerin, A. Olivi, J. D. Weingart, H. C. Lawson, and H. Brem, Invest. New
Drugs 22, 27 (2004).
[17] H. Brem and P. Gabikian, J. Control. Release Off. J. Control. Release Soc. 74,
63 (2001).
[18] L. K. Fung, M. Shin, B. Tyler, H. Brem, and W. M. Saltzman, Pharm. Res. 13,
671 (1996).
[19] J. Voges, R. Reszka, A. Gossmann, C. Dittmar, R. Richter, G. Garlip, L.
Kracht, H. H. Coenen, V. Sturm, K. Wienhard, W.-D. Heiss, and A. H. Jacobs,
Ann. Neurol. 54, 479 (2003).
[20] G. Fleischhack, U. Jaehde, and U. Bode, Clin. Pharmacokinet. 44, 1 (2005).
[21] L. Illum, J. Control. Release Off. J. Control. Release Soc. 87, 187 (2003).
[22] L. Illum, Drug Discov. Today 7, 1184 (2002).
[23] M. I. Ugwoke, R. U. Agu, N. Verbeke, and R. Kinget, Adv. Drug Deliv. Rev.
57, 1640 (2005).
[24] A. Pires, A. Fortuna, G. Alves, and A. Falcão, J. Pharm. Pharm. Sci. Publ. Can.
Soc. Pharm. Sci. Société Can. Sci. Pharm. 12, 288 (2009).
[25] W. H. Oldendorf, S. Hyman, L. Braun, and S. Z. Oldendorf, Science 178, 984
(1972).
[26] N. J. Abbott, A. A. K. Patabendige, D. E. M. Dolman, S. R. Yusof, and D. J.
Begley, Neurobiol. Dis. 37, 13 (2010).
[27] W. M. Pardridge, Drug Discov. Today 12, 54 (2007).
[28] E. Y. Zhang, G. T. Knipp, S. Ekins, and P. W. Swaan, Drug Metab. Rev. 34,
709 (2002).

168
[29] W. M. Pardridge, Mol. Interv. 3, 90 (2003).
[30] W. M. Pardridge, Pharm. Res. 24, 1733 (2007).
[31] P. Blasi, S. Giovagnoli, A. Schoubben, M. Ricci, and C. Rossi, Adv. Drug
Deliv. Rev. 59, 454 (2007).
[32] J.-C. Olivier, NeuroRx J. Am. Soc. Exp. Neurother. 2, 108 (2005).
[33] A. Schnyder and J. Huwyler, NeuroRx J. Am. Soc. Exp. Neurother. 2, 99
(2005).
[34] R. D. Broadwell, B. J. Balin, and M. Salcman, Proc. Natl. Acad. Sci. U. S. A.
85, 632 (1988).
[35] I. Mellman, Annu. Rev. Cell Dev. Biol. 12, 575 (1996).
[36] S. Mukherjee, R. N. Ghosh, and F. R. Maxfield, Physiol. Rev. 77, 759 (1997).
[37] S. I. Rapoport, Am. J. Physiol. 219, 270 (1970).
[38] S. I. Rapoport, Expert Opin. Investig. Drugs 10, 1809 (2001).
[39] R. A. Kroll and E. A. Neuwelt, Neurosurgery 42, 1083 (1998).
[40] M.-A. Bellavance, M. Blanchette, and D. Fortin, AAPS J. 10, 166 (2008).
[41] N. D. Doolittle, M. E. Miner, W. A. Hall, T. Siegal, E. Jerome, E. Osztie, L. D.
McAllister, J. S. Bubalo, D. F. Kraemer, D. Fortin, R. Nixon, L. L. Muldoon,
and E. A. Neuwelt, Cancer 88, 637 (2000).
[42] W. A. Hall, N. D. Doolittle, M. Daman, P. K. Bruns, L. Muldoon, D. Fortin,
and E. A. Neuwelt, J. Neurooncol. 77, 279 (2006).
[43] K. Jahnke, D. F. Kraemer, K. R. Knight, D. Fortin, S. Bell, N. D. Doolittle, L.
L. Muldoon, and E. A. Neuwelt, Cancer 112, 581 (2008).
[44] L. Angelov, N. D. Doolittle, D. F. Kraemer, T. Siegal, G. H. Barnett, D. M.
Peereboom, G. Stevens, J. McGregor, K. Jahnke, C. A. Lacy, N. A. Hedrick, E.
Shalom, S. Ference, S. Bell, L. Sorenson, R. M. Tyson, M. Haluska, and E. A.
Neuwelt, J. Clin. Oncol. Off. J. Am. Soc. Clin. Oncol. 27, 3503 (2009).
169
[45] J. A. Boockvar, A. J. Tsiouris, C. P. Hofstetter, I. Kovanlikaya, S. Fralin, K.
Kesavabhotla, S. M. Seedial, S. C. Pannullo, T. H. Schwartz, P. Stieg, R. D.
Zimmerman, J. Knopman, R. J. Scheff, P. Christos, S. Vallabhajosula, and H.
A. Riina, J. Neurosurg. 114, 624 (2011).
[46] D. J. Guillaume, N. D. Doolittle, S. Gahramanov, N. A. Hedrick, J. B.
Delashaw, and E. A. Neuwelt, Neurosurgery 66, 48 (2010).
[47] T. Inamura, T. Nomura, K. Ikezaki, M. Fukui, G. Pöllinger, and K. L. Black,
Neurol. Res. 16, 125 (1994).
[48] M. Gutman, R. Laufer, A. Eisenthal, G. Goldman, A. Ravid, M. Inbar, and J.
M. Klausner, Cancer Immunol. Immunother. CII 43, 240 (1996).
[49] K. L. Black and C. C. Chio, Neurol. Res. 14, 402 (1992).
[50] H. E. de Vries, M. C. Blom-Roosemalen, M. van Oosten, A. G. de Boer, T. J.
van Berkel, D. D. Breimer, and J. Kuiper, J. Neuroimmunol. 64, 37 (1996).
[51] K. Hynynen and Gautherie M, in Biophys. Technol. Ultrasound Hyper-
Thermia (New York: Springer-Verlag, 1990), pp. 61–115.
[52] K. Hynynen and B. A. Lulu, Invest. Radiol. 25, 824 (1990).
[53] T. G. Leighton, The Acoustic Bubble (Academic Press Limited, San Diego, CA,
1994).
[54] C. J. Diederich, R. J. Stafford, W. H. Nau, E. C. Burdette, R. E. Price, and J. D.
Hazle, Med. Phys. 31, 405 (2004).
[55] N. McDannold, C. M. Tempany, F. M. Fennessy, M. J. So, F. J. Rybicki, E. A.
Stewart, F. A. Jolesz, and K. Hynynen, Radiology 240, 263 (2006).
[56] S. Vaezy, R. Martin, and L. Crum, Echocardiogr. Mt. Kisco N 18, 309 (2001).
[57] C. Delon-Martin, C. Vogt, E. Chignier, C. Guers, J. Y. Chapelon, and D.
Cathignol, Ultrasound Med. Biol. 21, 113 (1995).
[58] M. J. Borrelli, W. D. O’Brien Jr, E. Hamilton, M. L. Oelze, J. Wu, L. J.
Bernock, S. Tung, H. Rokadia, and W. C. Culp, J. Vasc. Interv. Radiol. JVIR

170
23, 1677 (2012).
[59] H. Medwin, Ultrasonics 15, 7 (1977).
[60] N. de Jong, A. Bouakaz, and P. Frinking, Echocardiogr. Mt. Kisco N 19, 229
(2002).
[61] N. de Jong, L. Hoff, T. Skotland, and N. Bom, Ultrasonics 30, 95 (1992).
[62] N. de Jong and L. Hoff, Ultrasonics 31, 175 (1993).
[63] C. C. Church, J. Acoust. Soc. Am. 97, 1510 (1995).
[64] J. S. Allen and M. M. Rashid, J. Appl. Mech. 71, 195 (2004).
[65] Hoff, Sontum, and Hovem, J. Acoust. Soc. Am. 107, 2272 (2000).
[66] K. E. Morgan, J. S. Allen, P. A. Dayton, J. E. Chomas, A. L. Klibaov, and K.
W. Ferrara, IEEE Trans. Ultrason. Ferroelectr. Freq. Control 47, 1494 (2000).
[67] K. Sarkar, W. T. Shi, D. Chatterjee, and F. Forsberg, J. Acoust. Soc. Am. 118,
539 (2005).
[68] P. Marmottant, S. van der Meer, M. Emmer, M. Versluis, N. de Jong, S.
Hilgenfeldt, and D. Lohse, J. Acoust. Soc. Am. 118, 3499 (2005).
[69] N. de Jong, M. Emmer, A. van Wamel, and M. Versluis, Med. Biol. Eng.
Comput. 47, 861 (2009).
[70] L. Hoff, Acoustic Characterization of Contrast Agents for Medical Ultrasound
Imaging (Kluwar Academic, 2001).
[71] J. G. Lynn and T. J. Putnam, Am. J. Pathol. 20, 637 (1944).
[72] W. J. FRY and F. J. FRY, IRE Trans. Med. Electron. ME-7, 166 (1960).
[73] H. T. BALLANTINE Jr, E. BELL, and J. MANLAPAZ, J. Neurosurg. 17, 858
(1960).
[74] P. P. Lele, in Ultrasound, edited by M. H. Repacholi, M. Grandolfo, and A.
Rindi (Springer US, Boston, MA, 1987), pp. 275–306.
171
[75] R. MEYERS, W. J. FRY, F. J. FRY, L. L. DREYER, D. F. SCHULTZ, and R.
F. NOYES, J. Neurosurg. 16, 32 (1959).
[76] R. F. Heimburger, Indiana Med. J. Indiana State Med. Assoc. 78, 469 (1985).
[77] K. Hynynen and N. McDannold, Int. J. Hyperth. Off. J. Eur. Soc.
Hyperthermic Oncol. North Am. Hyperth. Group 20, 725 (2004).
[78] G. T. Clement and K. Hynynen, Phys. Med. Biol. 47, 1219 (2002).
[79] J. F. Aubry, M. Tanter, M. Pernot, J. L. Thomas, and M. Fink, J. Acoust. Soc.
Am. 113, 84 (2003).
[80] Y. Ishihara, A. Calderon, H. Watanabe, K. Okamoto, Y. Suzuki, K. Kuroda,
and Y. Suzuki, Magn. Reson. Med. Off. J. Soc. Magn. Reson. Med. Soc. Magn.
Reson. Med. 34, 814 (1995).
[81] N. McDannold, G. T. Clement, P. Black, F. Jolesz, and K. Hynynen,
Neurosurgery 66, 323 (2010).
[82] E. Martin, D. Jeanmonod, A. Morel, E. Zadicario, and B. Werner, Ann. Neurol.
66, 858 (2009).
[83] L. BAKAY, H. T. BALLANTINE Jr, T. F. HUETER, and D. SOSA, AMA
Arch. Neurol. Psychiatry 76, 457 (1956).
[84] N. Vykhodtseva, 5th Int. Symp. Ultrasound Biol Med Puschino Russ. (1981).
[85] J. T. Patrick, M. N. Nolting, S. A. Goss, K. A. Dines, J. L. Clendenon, M. A.
Rea, and R. F. Heimburger, Adv. Exp. Med. Biol. 267, 369 (1990).
[86] N. I. Vykhodtseva, K. Hynynen, and C. Damianou, Ultrasound Med. Biol. 21,
969 (1995).
[87] A. H. Mesiwala, L. Farrell, H. J. Wenzel, D. L. Silbergeld, L. A. Crum, H. R.
Winn, and P. D. Mourad, Ultrasound Med. Biol. 28, 389 (2002).
[88] N. McDannold, N. Vykhodtseva, F. A. Jolesz, and K. Hynynen, Magn. Reson.
Med. Off. J. Soc. Magn. Reson. Med. Soc. Magn. Reson. Med. 51, 913 (2004).
[89] K. Hynynen, N. McDannold, N. Vykhodtseva, and F. A. Jolesz, Radiology 220,

172
640 (2001).
[90] N. Sheikov, N. McDannold, N. Vykhodtseva, F. Jolesz, and K. Hynynen,
Ultrasound Med. Biol. 30, 979 (2004).
[91] N. McDannold, C. D. Arvanitis, N. Vykhodtseva, and M. S. Livingstone,
Cancer Res. 72, 3652 (2012).
[92] F. Marquet, Y.-S. Tung, T. Teichert, V. P. Ferrera, and E. E. Konofagou, PloS
One 6, e22598 (2011).
[93] M. A. O’Reilly, Y. Huang, and K. Hynynen, Phys. Med. Biol. 55, 5251 (2010).
[94] K. Hynynen, N. McDannold, N. A. Sheikov, F. A. Jolesz, and N. Vykhodtseva,
NeuroImage 24, 12 (2005).
[95] L. H. Treat, N. McDannold, N. Vykhodtseva, Y. Zhang, K. Tam, and K.
Hynynen, Int. J. Cancer J. Int. Cancer 121, 901 (2007).
[96] R. Chopra, N. Vykhodtseva, and K. Hynynen, ACS Chem. Neurosci. 1, 391
(2010).
[97] N. McDannold, N. Vykhodtseva, and K. Hynynen, Ultrasound Med. Biol. 34,
834 (2008).
[98] N. McDannold, N. Vykhodtseva, and K. Hynynen, Ultrasound Med. Biol. 34,
930 (2008).
[99] F. Vlachos, Y.-S. Tung, and E. E. Konofagou, Phys. Med. Biol. 55, 5451
(2010).
[100] J. J. Choi, J. A. Feshitan, B. Baseri, S. Wang, Y.-S. Tung, M. A. Borden, and E.
E. Konofagou, IEEE Trans. Biomed. Eng. 57, 145 (2010).
[101] G. Samiotaki, F. Vlachos, Y.-S. Tung, and E. E. Konofagou, Magn. Reson.
Med. Off. J. Soc. Magn. Reson. Med. Soc. Magn. Reson. Med. 67, 769 (2012).
[102] J. J. Choi, K. Selert, Z. Gao, G. Samiotaki, B. Baseri, and E. E. Konofagou, J.
Cereb. Blood Flow Metab. 31, 725 (2011).
[103] J. J. Choi, K. Selert, F. Vlachos, A. Wong, and E. E. Konofagou, Proc. Natl.
173
Acad. Sci. 108, 16539 (2011).
[104] J. Park, Y. Zhang, N. Vykhodtseva, F. A. Jolesz, and N. J. McDannold, J.
Control. Release Off. J. Control. Release Soc. 162, 134 (2012).
[105] F.-Y. Yang, Y.-S. Lin, K.-H. Kang, and T.-K. Chao, J. Control. Release Off. J.
Control. Release Soc. 150, 111 (2011).
[106] R. Chopra, N. Vykhodtseva, and K. Hynynen, ACS Chem. Neurosci. 1, 391
(2010).
[107] M. A. O’Reilly, A. C. Waspe, M. Ganguly, and K. Hynynen, Ultrasound Med.
Biol. 37, 587 (2011).
[108] N. McDannold, Y. Zhang, and N. Vykhodtseva, Ultrasound Med. Biol. 37,
1259 (2011).
[109] J. Wang, Y. Liu, L. Liu, C. Xia, Z. Zhang, and Y. Xue, J. Neurooncol. 102,
213 (2011).
[110] Z. Zhang, C. Xia, Y. Xue, and Y. Liu, J. Neurosci. Res. 87, 2282 (2009).
[111] Z. Zhang, Y. Xue, Y. Liu, and X. Shang, Neurosci. Lett. 481, 21 (2010).
[112] D. E. Goertz, C. Wright, and K. Hynynen, Ultrasound Med. Biol. 36, 916
(2010).
[113] K. F. Bing, G. P. Howles, Y. Qi, M. L. Palmeri, and K. R. Nightingale,
Ultrasound Med. Biol. 35, 1298 (2009).
[114] K. Hynynen, N. McDannold, N. Vykhodtseva, and F. A. Jolesz, Radiology 220,
640 (2001).
[115] L. H. Treat, N. McDannold, N. Vykhodtseva, Y. Zhang, K. Tam, and K.
Hynynen, Int. J. Cancer J. Int. Cancer 121, 901 (2007).
[116] J.-C. Weng, S.-K. Wu, W.-L. Lin, and W.-Y. I. Tseng, Magn. Reson. Med. Off.
J. Soc. Magn. Reson. Med. Soc. Magn. Reson. Med. 65, 802 (2011).
[117] F.-Y. Yang, W.-M. Fu, W.-S. Chen, W.-L. Yeh, and W.-L. Lin, Ultrason.
Sonochem. 15, 636 (2008).

174
[118] J. Park, Y. Zhang, N. Vykhodtseva, F. A. Jolesz, and N. J. McDannold, J.
Control. Release Off. J. Control. Release Soc. 162, 134 (2012).
[119] F. Vlachos, Y.-S. Tung, and E. Konofagou, Magn. Reson. Med. Off. J. Soc.
Magn. Reson. Med. Soc. Magn. Reson. Med. 66, 821 (2011).
[120] N. McDannold, N. Vykhodtseva, and K. Hynynen, Ultrasound Med. Biol. 33,
584 (2007).
[121] H.-L. Liu, C.-H. Pan, C.-Y. Ting, and M.-J. Hsiao, Ultrasound Med. Biol. 36,
325 (2010).
[122] M. A. O’Reilly, A. C. Waspe, M. Ganguly, and K. Hynynen, Ultrasound Med.
Biol. 37, 587 (2011).
[123] N. McDannold, N. Vykhodtseva, and K. Hynynen, Phys. Med. Biol. 51, 793
(2006).
[124] Y.-S. Tung, F. Vlachos, J. J. Choi, T. Deffieux, K. Selert, and E. E. Konofagou,
Phys. Med. Biol. 55, 6141 (2010).
[125] C. D. Arvanitis, M. S. Livingstone, N. Vykhodtseva, and N. McDannold, PloS
One 7, e45783 (2012).
[126] C. X. Deng, F. Sieling, H. Pan, and J. Cui, Ultrasound Med. Biol. 30, 519
(2004).
[127] N. Sheikov, N. McDannold, S. Sharma, and K. Hynynen, Ultrasound Med.
Biol. 34, 1093 (2008).
[128] N. Sheikov, N. McDannold, F. Jolesz, Y.-Z. Zhang, K. Tam, and K. Hynynen,
Ultrasound Med. Biol. 32, 1399 (2006).
[129] S. B. Raymond, J. Skoch, K. Hynynen, and B. J. Bacskai, J. Cereb. Blood
Flow Metab. Off. J. Int. Soc. Cereb. Blood Flow Metab. 27, 393 (2007).
[130] E. E. Cho, J. Drazic, M. Ganguly, B. Stefanovic, and K. Hynynen, J. Cereb.
Blood Flow Metab. Off. J. Int. Soc. Cereb. Blood Flow Metab. 31, 1852 (2011).
[131] P. Dayton, A. Klibanov, G. Brandenburger, and K. Ferrara, Ultrasound Med.

175
Biol. 25, 1195 (1999).
[132] H. Chen, W. Kreider, A. A. Brayman, M. R. Bailey, and T. J. Matula, Phys.
Rev. Lett. 106, 034301 (2011).
[133] E. Sassaroli and K. Hynynen, Phys. Med. Biol. 50, 5293 (2005).
[134] B. Marty, B. Larrat, M. Van Landeghem, C. Robic, P. Robert, M. Port, D. Le
Bihan, M. Pernot, M. Tanter, F. Lethimonnier, and S. Meriaux, J. Cereb. Blood
Flow Metab. 32, 1948 (2012).
[135] G. P. Howles, K. F. Bing, Y. Qi, S. J. Rosenzweig, K. R. Nightingale, and G.
A. Johnson, Magn. Reson. Med. Off. J. Soc. Magn. Reson. Med. Soc. Magn.
Reson. Med. 64, 995 (2010).
[136] B. Baseri, J. J. Choi, Y.-S. Tung, and E. E. Konofagou, Ultrasound Med. Biol.
36, 1445 (2010).
[137] N. McDannold, N. Vykhodtseva, S. Raymond, F. A. Jolesz, and K. Hynynen,
Ultrasound Med. Biol. 31, 1527 (2005).
[138] H.-L. Liu, Y.-Y. Wai, W.-S. Chen, J.-C. Chen, P.-H. Hsu, X.-Y. Wu, W.-C.
Huang, T.-C. Yen, and J.-J. Wang, Ultrasound Med. Biol. 34, 598 (2008).
[139] N. McDannold, N. Vykhodtseva, and K. Hynynen, Phys. Med. Biol. 51, 793
(2006).
[140] Y.-S. Tung, F. Vlachos, J. J. Choi, T. Deffieux, K. Selert, and E. E. Konofagou,
Phys. Med. Biol. 55, 6141 (2010).
[141] K. Hynynen, N. McDannold, N. Vykhodtseva, S. Raymond, R. Weissleder, F.
A. Jolesz, and N. Sheikov, J. Neurosurg. 105, 445 (2006).
[142] H.-L. Liu, Y.-Y. Wai, P.-H. Hsu, L.-A. Lyu, J.-S. Wu, C.-R. Shen, J.-C. Chen,
T.-C. Yen, and J.-J. Wang, J. Cereb. Blood Flow Metab. Off. J. Int. Soc. Cereb.
Blood Flow Metab. 30, 674 (2010).
[143] X. Shang, P. Wang, Y. Liu, Z. Zhang, and Y. Xue, J. Mol. Neurosci. MN 43,
364 (2011).
176
[144] A. Alonso, E. Reinz, J. W. Jenne, M. Fatar, H. Schmidt-Glenewinkel, M. G.
Hennerici, and S. Meairs, J. Cereb. Blood Flow Metab. Off. J. Int. Soc. Cereb.
Blood Flow Metab. 30, 1394 (2010).
[145] J. Deng, Q. Huang, F. Wang, Y. Liu, Z. Wang, Z. Wang, Q. Zhang, B. Lei, and
Y. Cheng, J. Mol. Neurosci. MN 46, 677 (2012).
[146] C. Xia, Y. Liu, P. Wang, and Y. Xue, J. Mol. Neurosci. MN 48, 281 (2012).
[147] A. N. Shajahan, C. Tiruppathi, A. V. Smrcka, A. B. Malik, and R. D. Minshall,
J. Biol. Chem. 279, 48055 (2004).
[148] S. Jalali, Y. Huang, D. J. Dumont, and K. Hynynen, BMC Neurol. 10, 114
(2010).
[149] H. Zhao, R. M. Sapolsky, and G. K. Steinberg, Mol. Neurobiol. 34, 249 (2006).
[150] R. Nath, K. McGinnis, S. Dutta, B. Shivers, and K. K. Wang, Cell. Mol. Biol.
Lett. 6, 173 (2001).
[151] J. Harada and M. Sugimoto, Jpn. J. Pharmacol. 79, 369 (1999).
[152] A. Alonso, E. Reinz, M. Fatar, J. Jenne, M. G. Hennerici, and S. Meairs,
Neuroscience 169, 116 (2010).
[153] J. Park, Z. Fan, R. E. Kumon, M. E. H. El-Sayed, and C. X. Deng, Ultrasound
Med. Biol. 36, 1176 (2010).
[154] J. Park, Z. Fan, and C. X. Deng, J. Biomech. 44, 164 (2011).
[155] C. Ayata, H. K. Shin, S. Salomone, Y. Ozdemir-Gursoy, D. A. Boas, A. K.
Dunn, and M. A. Moskowitz, J. Cereb. Blood Flow Metab. Off. J. Int. Soc.
Cereb. Blood Flow Metab. 24, 1172 (2004).
[156] S. B. Raymond, J. Skoch, K. Hynynen, and B. J. Bacskai, J. Cereb. Blood
Flow Metab. Off. J. Int. Soc. Cereb. Blood Flow Metab. 27, 393 (2007).
[157] A. Burgess, Y. Huang, W. Querbes, D. W. Sah, and K. Hynynen, J. Control.
Release Off. J. Control. Release Soc. 163, 125 (2012).
[158] J. J. Choi, S. Wang, Y.-S. Tung, B. Morrison 3rd, and E. E. Konofagou,
177
Ultrasound Med. Biol. 36, 58 (2010).
[159] L. L. Muldoon, M. A. Pagel, R. A. Kroll, S. Roman-Goldstein, R. S. Jones,
and E. A. Neuwelt, AJNR Am. J. Neuroradiol. 20, 217 (1999).
[160] K.-J. Lin, H.-L. Liu, P.-H. Hsu, Y.-H. Chung, W.-C. Huang, J.-C. Chen, S.-P.
Wey, T.-C. Yen, and I.-T. Hsiao, Nucl. Med. Biol. 36, 853 (2009).
[161] F.-Y. Yang, H.-E. Wang, G.-L. Lin, H.-H. Lin, and T.-T. Wong, Int. J.
Nanomedicine 7, 723 (2012).
[162] S. B. Raymond, L. H. Treat, J. D. Dewey, N. J. McDannold, K. Hynynen, and
B. J. Bacskai, PloS One 3, e2175 (2008).
[163] Q. Huang, J. Deng, F. Wang, S. Chen, Y. Liu, Z. Wang, Z. Wang, and Y.
Cheng, Exp. Neurol. 233, 350 (2012).
[164] A. B. Etame, R. J. Diaz, M. A. O’Reilly, C. A. Smith, T. G. Mainprize, K.
Hynynen, and J. T. Rutka, Nanomedicine Nanotechnol. Biol. Med. 8, 1133
(2012).
[165] P.-H. Wang, H.-L. Liu, P.-H. Hsu, C.-Y. Lin, C.-R. C. Wang, P.-Y. Chen, K.-
C. Wei, T.-C. Yen, and M.-L. Li, J. Biomed. Opt. 17, 061222 (2012).
[166] H.-L. Liu, M.-Y. Hua, P.-Y. Chen, P.-C. Chu, C.-H. Pan, H.-W. Yang, C.-Y.
Huang, J.-J. Wang, T.-C. Yen, and K.-C. Wei, Radiology 255, 415 (2010).
[167] J. Mei, Y. Cheng, Y. Song, Y. Yang, F. Wang, Y. Liu, and Z. Wang, J.
Ultrasound Med. Off. J. Am. Inst. Ultrasound Med. 28, 871 (2009).
[168] H.-Q. Zeng, L. Lü, F. Wang, Y. Luo, and S.-F. Lou, J. Chemother. Florence
Italy 24, 358 (2012).
[169] K.-C. Wei, P.-C. Chu, H.-Y. J. Wang, C.-Y. Huang, P.-Y. Chen, H.-C. Tsai,
Y.-J. Lu, P.-Y. Lee, I.-C. Tseng, L.-Y. Feng, P.-W. Hsu, T.-C. Yen, and H.-L.
Liu, PloS One 8, e58995 (2013).
[170] M. Aryal, N. Vykhodtseva, Y.-Z. Zhang, J. Park, and N. McDannold, J.
Controlled Release 169, 103 (2013).

178
[171] F.-Y. Yang, T.-T. Wong, M.-C. Teng, R.-S. Liu, M. Lu, H.-F. Liang, and M.-C.
Wei, J. Control. Release Off. J. Control. Release Soc. 160, 652 (2012).
[172] H.-L. Liu, M.-Y. Hua, H.-W. Yang, C.-Y. Huang, P.-C. Chu, J.-S. Wu, I.-C.
Tseng, J.-J. Wang, T.-C. Yen, P.-Y. Chen, and K.-C. Wei, Proc. Natl. Acad. Sci.
U. S. A. 107, 15205 (2010).
[173] P.-Y. Chen, H.-L. Liu, M.-Y. Hua, H.-W. Yang, C.-Y. Huang, P.-C. Chu, L.-A.
Lyu, I.-C. Tseng, L.-Y. Feng, H.-C. Tsai, S.-M. Chen, Y.-J. Lu, J.-J. Wang, T.-
C. Yen, Y.-H. Ma, T. Wu, J.-P. Chen, J.-I. Chuang, J.-W. Shin, C. Hsueh, and
K.-C. Wei, Neuro-Oncol. 12, 1050 (2010).
[174] C.-H. Fan, C.-Y. Ting, H.-J. Lin, C.-H. Wang, H.-L. Liu, T.-C. Yen, and C.-K.
Yeh, Biomaterials 34, 3706 (2013).
[175] M. Kinoshita, N. McDannold, F. A. Jolesz, and K. Hynynen, Proc. Natl. Acad.
Sci. U. S. A. 103, 11719 (2006).
[176] E.-J. Park, Y.-Z. Zhang, N. Vykhodtseva, and N. McDannold, J. Control.
Release Off. J. Control. Release Soc. 163, 277 (2012).
[177] F.-Y. Yang, Y.-W. Chen, F.-I. Chou, S.-H. Yen, Y.-L. Lin, and T.-T. Wong,
Future Oncol. Lond. Engl. 8, 1361 (2012).
[178] R. D. Alkins, P. M. Brodersen, R. N. S. Sodhi, and K. Hynynen, Neuro-Oncol.
15, 1225 (2013).
[179] R. Alkins, A. Burgess, M. Ganguly, G. Francia, R. Kerbel, W. S. Wels, and K.
Hynynen, Cancer Res. 73, 1892 (2013).
[180] C.-Y. Ting, C.-H. Fan, H.-L. Liu, C.-Y. Huang, H.-Y. Hsieh, T.-C. Yen, K.-C.
Wei, and C.-K. Yeh, Biomaterials 33, 704 (2012).
[181] F. Wang, Y. Shi, L. Lu, L. Liu, Y. Cai, H. Zheng, X. Liu, F. Yan, C. Zou, C.
Sun, J. Shi, S. Lu, and Y. Chen, PloS One 7, e52925 (2012).
[182] C.-H. Fan, C.-Y. Ting, H.-L. Liu, C.-Y. Huang, H.-Y. Hsieh, T.-C. Yen, K.-C.
Wei, and C.-K. Yeh, Biomaterials 34, 2142 (2013).
[183] B. Baseri, J. J. Choi, T. Deffieux, G. Samiotaki, Y.-S. Tung, O. Olumolade, S.

179
A. Small, B. Morrison, and E. E. Konofagou, Phys. Med. Biol. 57, N65 (2012).
[184] J. F. Jordão, C. A. Ayala-Grosso, K. Markham, Y. Huang, R. Chopra, J.
McLaurin, K. Hynynen, and I. Aubert, PloS One 5, e10549 (2010).
[185] A. Burgess, C. A. Ayala-Grosso, M. Ganguly, J. F. Jordão, I. Aubert, and K.
Hynynen, PloS One 6, e27877 (2011).
[186] E. Thévenot, J. F. Jordão, M. A. O’Reilly, K. Markham, Y.-Q. Weng, K. D.
Foust, B. K. Kaspar, K. Hynynen, and I. Aubert, Hum. Gene Ther. 23, 1144
(2012).
[187] A. Alonso, E. Reinz, B. Leuchs, J. Kleinschmidt, M. Fatar, B. Geers, I.
Lentacker, M. G. Hennerici, S. C. de Smedt, and S. Meairs, Mol. Ther. Nucleic
Acids 2, e73 (2013).
[188] P.-H. Hsu, K.-C. Wei, C.-Y. Huang, C.-J. Wen, T.-C. Yen, C.-L. Liu, Y.-T.
Lin, J.-C. Chen, C.-R. Shen, and H.-L. Liu, PloS One 8, e57682 (2013).
[189] K.-C. Wei, P.-C. Chu, H.-Y. J. Wang, C.-Y. Huang, P.-Y. Chen, H.-C. Tsai,
Y.-J. Lu, P.-Y. Lee, I.-C. Tseng, L.-Y. Feng, P.-W. Hsu, T.-C. Yen, and H.-L.
Liu, PloS One 8, e58995 (2013).
[190] E.-J. Park, Y.-Z. Zhang, N. Vykhodtseva, and N. McDannold, J. Controlled
Release 163, 277 (2012).
[191] L. H. Treat, N. McDannold, Y. Zhang, N. Vykhodtseva, and K. Hynynen,
Ultrasound Med. Biol. 38, 1716 (2012).
[192] J. F. Jordão, C. A. Ayala-Grosso, K. Markham, Y. Huang, R. Chopra, J.
McLaurin, K. Hynynen, and I. Aubert, PloS One 5, e10549 (2010).
[193] J. F. Jordão, E. Thévenot, K. Markham-Coultes, T. Scarcelli, Y.-Q. Weng, K.
Xhima, M. O’Reilly, Y. Huang, J. McLaurin, K. Hynynen, and I. Aubert, Exp.
Neurol. 248, 16 (2013).
[194] K.-C. Wei, P.-C. Chu, H.-Y. J. Wang, C.-Y. Huang, P.-Y. Chen, H.-C. Tsai,
Y.-J. Lu, P.-Y. Lee, I.-C. Tseng, L.-Y. Feng, P.-W. Hsu, T.-C. Yen, and H.-L.
Liu, PLoS ONE 8, e58995 (2013).
180
[195] H.-L. Liu, M.-Y. Hua, P.-Y. Chen, P.-C. Chu, C.-H. Pan, H.-W. Yang, C.-Y.
Huang, J.-J. Wang, T.-C. Yen, and K.-C. Wei, Radiology 255, 415 (2010).
[196] H.-L. Liu, M.-Y. Hua, H.-W. Yang, C.-Y. Huang, P.-C. Chu, J.-S. Wu, I.-C.
Tseng, J.-J. Wang, T.-C. Yen, P.-Y. Chen, and K.-C. Wei, Proc. Natl. Acad. Sci.
U. S. A. 107, 15205 (2010).
[197] J. J. Choi, M. Pernot, S. A. Small, and E. E. Konofagou, Ultrasound Med. Biol.
33, 95 (2007).
[198] M. A. O’Reilly, A. Muller, and K. Hynynen, Ultrasound Med. Biol. 37, 1930
(2011).
[199] S. Pichardo, V. W. Sin, and K. Hynynen, Phys. Med. Biol. 56, 219 (2011).
[200] P. J. White, G. T. Clement, and K. Hynynen, Ultrasound Med. Biol. 32, 1085
(2006).
[201] K. Hynynen, N. I. Vykhodtseva, A. H. Chung, V. Sorrentino, V. Colucci, and
F. A. Jolesz, Radiology 204, 247 (1997).
[202] N. McDannold and S. E. Maier, Med. Phys. 35, 3748 (2008).
[203] N. Hosseinkhah and K. Hynynen, Phys. Med. Biol. 57, 785 (2012).
[204] M. A. O’Reilly and K. Hynynen, Radiology 263, 96 (2012).
[205] V. A. Salgaonkar, S. Datta, C. K. Holland, and T. D. Mast, J. Acoust. Soc. Am.
126, 3071 (2009).
[206] M. Gyöngy and C.-C. Coussios, J. Acoust. Soc. Am. 128, EL175 (2010).
[207] F.-Y. Yang, H.-E. Wang, G.-L. Lin, M.-C. Teng, H.-H. Lin, T.-T. Wong, and
R.-S. Liu, J. Nucl. Med. Off. Publ. Soc. Nucl. Med. 52, 478 (2011).
[208] F.-Y. Yang, S.-C. Horng, Y.-S. Lin, and Y.-H. Kao, J. Magn. Reson. Imaging
JMRI 32, 593 (2010).
[209] P.-C. Chu, W.-Y. Chai, H.-Y. Hsieh, J.-J. Wang, S.-P. Wey, C.-Y. Huang, K.-
C. Wei, and H.-L. Liu, BioMed Res. Int. 2013, 627496 (2013).
181
[210] H. C. Roberts, T. P. Roberts, R. C. Brasch, and W. P. Dillon, AJNR Am. J.
Neuroradiol. 21, 891 (2000).
[211] L. W. Turnbull, NMR Biomed. 22, 28 (2009).
[212] L. Z. Li, R. Zhou, H. N. Xu, L. Moon, T. Zhong, E. J. Kim, H. Qiao, R. Reddy,
D. Leeper, B. Chance, and J. D. Glickson, Proc. Natl. Acad. Sci. U. S. A. 106,
6608 (2009).
[213] Q. Jiang, J. R. Ewing, G. L. Ding, L. Zhang, Z. G. Zhang, L. Li, P. Whitton, M.
Lu, J. Hu, Q. J. Li, R. A. Knight, and M. Chopp, J. Cereb. Blood Flow Metab.
Off. J. Int. Soc. Cereb. Blood Flow Metab. 25, 583 (2005).
[214] R. A. Knight, T. N. Nagaraja, J. R. Ewing, V. Nagesh, P. A. Whitton, E.
Bershad, S. C. Fagan, and J. D. Fenstermacher, Magn. Reson. Med. Off. J. Soc.
Magn. Reson. Med. Soc. Magn. Reson. Med. 54, 813 (2005).
[215] D. M. Cohen, C. B. Patel, P. Ahobila-Vajjula, L. M. Sundberg, T. Chacko, S.-J.
Liu, and P. A. Narayana, NMR Biomed. 22, 332 (2009).
[216] P. S. Tofts, J. Magn. Reson. Imaging JMRI 7, 91 (1997).
[217] P. S. Tofts, G. Brix, D. L. Buckley, J. L. Evelhoch, E. Henderson, M. V.
Knopp, H. B. Larsson, T. Y. Lee, N. A. Mayr, G. J. Parker, R. E. Port, J. Taylor,
and R. M. Weisskoff, J. Magn. Reson. Imaging JMRI 10, 223 (1999).
[218] M. O. Leach, B. Morgan, P. S. Tofts, D. L. Buckley, W. Huang, M. A.
Horsfield, T. L. Chenevert, D. J. Collins, A. Jackson, D. Lomas, B. Whitcher, L.
Clarke, R. Plummer, I. Judson, R. Jones, R. Alonzi, T. Brunner, D. M. Koh, P.
Murphy, J. C. Waterton, G. Parker, M. J. Graves, T. W. J. Scheenen, T. W.
Redpath, M. Orton, G. Karczmar, H. Huisman, J. Barentsz, A. Padhani, and
Experimental Cancer Medicine Centres Imaging Network Steering Committee,
Eur. Radiol. 22, 1451 (2012).
[219] K. L. Li, X. P. Zhu, J. Waterton, and A. Jackson, J. Magn. Reson. Imaging
JMRI 12, 347 (2000).
[220] D. P. Barboriak, in (McLean VA, 2004).

182
[221] C. Kittel, Introduction to Solid State Physics, Seventh (John Wiley & Sons,
n.d.).
[222] G. Minotti, P. Menna, E. Salvatorelli, G. Cairo, and L. Gianni, Pharmacol. Rev.
56, 185 (2004).
[223] J. Holland and E. Frei, Cancer Medicine, 8th ed. (People’s Publishing House,
Shelton, Connecticut, 2010).
[224] D. A. Gewirtz, Biochem. Pharmacol. 57, 727 (1999).
[225] J. Cummings and C. S. McArdle, Br. J. Cancer 53, 835 (1986).
[226] K. A. Walter, R. J. Tamargo, A. Olivi, P. C. Burger, and H. Brem,
Neurosurgery 37, 1128 (1995).
[227] J. W. Park, Breast Cancer Res. BCR 4, 95 (2002).
[228] E. Hodgson, J. Bend, R. Philpot, and editors, Reviews in Biochemical
Toxicology (Elsevier Biochemical, New York, 1984).
[229] K. K. Karukstis, E. H. Thompson, J. A. Whiles, and R. J. Rosenfeld, Biophys.
Chem. 73, 249 (1998).
[230] M. A. O’Reilly, A. Muller, and K. Hynynen, Ultrasound Med. Biol. 37, 1930
(2011).
[231] T. Htun, J. Fluoresc. 14, 217 (2004).
[232] M. Pilatou, N. Vykhodtseva, and N. McDannold, in (Washington, DC, 2008).
[233] N. R. Bachur, A. L. Moore, J. G. Bernstein, and A. Liu, Cancer Chemother.
Rep. 54, 89 (1970).
[234] R. D. Arnold, D. E. Mager, J. E. Slack, and R. M. Straubinger, Clin. Cancer
Res. Off. J. Am. Assoc. Cancer Res. 11, 8856 (2005).
[235] J. M. Bland and D. G. Altman, BMJ 310, 170 (1995).
[236] F. Vlachos, Y.-S. Tung, and E. E. Konofagou, Phys. Med. Biol. 55, 5451
(2010).

183
[237] J. Cummings and C. S. McArdle, Br. J. Cancer 53, 835 (1986).
[238] R. K. Jain, K. Schlenger, M. Hockel, and F. Yuan, Nat. Med. 3, 1203 (1997).
[239] I. Lentacker, I. De Cock, R. Deckers, S. C. De Smedt, and C. T. W. Moonen,
Adv. Drug Deliv. Rev. 72, 49 (2014).
[240] B. Geers, I. Lentacker, N. N. Sanders, J. Demeester, S. Meairs, and S. C. De
Smedt, J. Control. Release Off. J. Control. Release Soc. 152, 249 (2011).
[241] D. Fukumura and R. K. Jain, J. Cell. Biochem. 101, 937 (2007).
[242] E. A. Neuwelt, M. Glasberg, E. Frenkel, and P. Barnett, Ann. Neurol. 14, 316
(1983).
[243] A. Kondo, T. Inoue, H. Nagara, J. Tateishi, and M. Fukui, Brain Res. 412, 73
(1987).
[244] R. Zhang, R. Saito, Y. Mano, M. Kanamori, Y. Sonoda, T. Kumabe, and T.
Tominaga, J. Neurosci. Methods 222, 131 (2014).
[245] K. Hynynen, Med. Phys. 18, 1156 (1991).
[246] W. J. Elias, D. Huss, T. Voss, J. Loomba, M. Khaled, E. Zadicario, R. C.
Frysinger, S. A. Sperling, S. Wylie, S. J. Monteith, J. Druzgal, B. B. Shah, M.
Harrison, and M. Wintermark, N. Engl. J. Med. 369, 640 (2013).
[247] A. C. Stan, S. Casares, D. Radu, G. F. Walter, and T. D. Brumeanu, Anticancer
Res. 19, 941 (1999).
[248] S. Voulgaris, M. Partheni, M. Karamouzis, P. Dimopoulos, N. Papadakis, and
H. P. Kalofonos, Am. J. Clin. Oncol. 25, 60 (2002).
[249] S. Ananda, A. K. Nowak, L. Cher, A. Dowling, C. Brown, J. Simes, M. A.
Rosenthal, and Cooperative Trials Group for Neuro-Oncology (COGNO), J.
Clin. Neurosci. Off. J. Neurosurg. Soc. Australas. 18, 1444 (2011).
[250] H. von Holst, E. Knochenhauer, H. Blomgren, V. P. Collins, L. Ehn, M.
Lindquist, G. Norén, and C. Peterson, Acta Neurochir. (Wien) 104, 13 (1990).
[251] T. Hekmatara, C. Bernreuther, A. S. Khalansky, A. Theisen, J. Weissenberger,

184
J. Matschke, S. Gelperina, J. Kreuter, and M. Glatzel, Clin. Neuropathol. 28,
153 (2009).
[252] T. Siegal, A. Horowitz, and A. Gabizon, J. Neurosurg. 83, 1029 (1995).
[253] S. C. J. Steiniger, J. Kreuter, A. S. Khalansky, I. N. Skidan, A. I. Bobruskin, Z.
S. Smirnova, S. E. Severin, R. Uhl, M. Kock, K. D. Geiger, and S. E. Gelperina,
Int. J. Cancer J. Int. Cancer 109, 759 (2004).
[254] S. Wohlfart, A. S. Khalansky, C. Bernreuther, M. Michaelis, J. Cinatl Jr, M.
Glatzel, and J. Kreuter, Int. J. Pharm. 415, 244 (2011).
[255] R. Zhou, R. Mazurchuk, and R. M. Straubinger, Cancer Res. 62, 2561 (2002).
[256] P. J. Gaillard, C. C. M. Appeldoorn, R. Dorland, J. van Kregten, F. Manca, D.
J. Vugts, B. Windhorst, G. A. M. S. van Dongen, H. E. de Vries, D. Maussang,
and O. van Tellingen, PloS One 9, e82331 (2014).
[257] F.-Y. Yang, M.-C. Teng, M. Lu, H.-F. Liang, Y.-R. Lee, C.-C. Yen, M.-L.
Liang, and T.-T. Wong, Int. J. Nanomedicine 7, 965 (2012).
[258] I. Brigger, J. Morizet, L. Laudani, G. Aubert, M. Appel, V. Velasco, M.-J.
Terrier-Lacombe, D. Desmaële, J. d’ Angelo, P. Couvreur, and G. Vassal, J.
Control. Release Off. J. Control. Release Soc. 100, 29 (2004).
[259] B. Uziely, S. Jeffers, R. Isacson, K. Kutsch, D. Wei-Tsao, Z. Yehoshua, E.
Libson, F. M. Muggia, and A. Gabizon, J. Clin. Oncol. Off. J. Am. Soc. Clin.
Oncol. 13, 1777 (1995).
[260] R. F. Barth and B. Kaur, J. Neurooncol. 94, 299 (2009).
[261] M. C. Chamberlain, J. Neurooncol. 101, 319 (2011).
[262] P.-C. Chu, W.-Y. Chai, H.-Y. Hsieh, J.-J. Wang, S.-P. Wey, C.-Y. Huang, K.-
C. Wei, and H.-L. Liu, BioMed Res. Int. 2013, 627496 (2013).
[263] E. Nance, K. Timbie, G. W. Miller, J. Song, C. Louttit, A. L. Klibanov, T.-Y.
Shih, G. Swaminathan, R. J. Tamargo, G. F. Woodworth, J. Hanes, and R. J.
Price, J. Control. Release Off. J. Control. Release Soc. (2014).

185
[264] L. H. Treat, N. McDannold, N. Vykhodtseva, Y. Zhang, K. Tam, and K.
Hynynen, Int. J. Cancer J. Int. Cancer 121, 901 (2007).
[265] M. Kinoshita, N. McDannold, F. A. Jolesz, and K. Hynynen, Proc. Natl. Acad.
Sci. U. S. A. 103, 11719 (2006).
[266] E. A. Neuwelt, M. Pagel, P. Barnett, M. Glassberg, and E. P. Frenkel, Cancer
Res. 41, 4466 (1981).
[267] A. J. Primeau, A. Rendon, D. Hedley, L. Lilge, and I. F. Tannock, Clin. Cancer
Res. Off. J. Am. Assoc. Cancer Res. 11, 8782 (2005).
186
Appendix
I. M. Aryal, C. D. Arvanitis, P. M. Alexander, N. McDannold, “Ultrasound-mediated
blood-brain barrier disruption for targeted drug delivery in the central nervous system”,
Advanced Drug Delivery Reviews, 72,94-109 (2014)/DOI 10.1016/j.addr.2014.01.008
Material from this manuscript is included in Chapter 1 in this thesis. I would like to thank
my coauthors for their permission to include text that they contributed to this work.
II. M. Aryal, N. Vykhodtseva, Y. Z. Zhang, J. Park, N. McDannold, “Multiple treatments
with liposomal doxorubicin and ultrasound-induced disruption of blood–tumor and
blood–brain barriers improve outcomes in a rat glioma model”, J. Control. Release 169,
103–111 (2013)/ DOI 10.1016/j.jconrel.2013.04.007
This manuscript describes the experiments presented in Chapter 5..
III. M. Aryal, J. Park, N. Vykhodtseva, Y. Z. Zhang, N. McDannold, “Enhancements in
blood-tumor barrier permeability and delivery of liposomal doxorubicin using focused
ultrasound and microbubbles: evaluation during tumor progression in a rat glioma model”,
(submitted)
This manuscript describes the experiments presented in Chapter 6..
IV. M. Aryal, N. Vykhodtseva, Y. Z. Zhang, N. McDannold, “Multiple use of ultrasound to
deliver liposomal doxorubicin after blood-brain barrier disruption”, A safety study
(submitted)
This manuscript describes the experiments presented in Chapter 4.
V. J. Park, M. Aryal, N. Vykhodtseva, Y. Z. Zhang, N. McDannold, “Increased blood-tumor
barrier permeability and enhanced doxorubicin delivery into rat glioma by MRI guided
focused ultrasound and microbubbles”, (under preparation)

Appendix I
Ultrasound-mediated blood–brain barrier disruption for targeted drug
delivery in the central nervous system
Muna Aryal, Costas D. Arvanitis , Phillip M. Alexander and Nathan McDannold
Adv Drug Deliv Rev. 2014 Jun;72:94-109
Ultrasound-mediated blood–brain barrier disruption for targeted drugdelivery in the central nervous system☆,☆☆
Muna Aryal a,b, Costas D. Arvanitis b, Phillip M. Alexander b,c, Nathan McDannold b,⁎a Department of Physics, Boston College, Chestnut Hill, USAb Department of Radiology, Brigham & Women's Hospital, Harvard Medical School, Boston, USAc Institute of Biomedical Engineering, Department of Engineering Science, and Brasenose College, University of Oxford, Oxford, UK
a b s t r a c ta r t i c l e i n f o
Article history:Accepted 14 January 2014Available online xxxx
Keywords:BrainDrug deliveryUltrasoundMicrobubbles
The physiology of the vasculature in the central nervous system (CNS), which includes the blood–brain barrier(BBB) and other factors, complicates the delivery of most drugs to the brain. Different methods have beenused to bypass the BBB, but they have limitations such as being invasive, non-targeted or requiring the formula-tion of new drugs. Focused ultrasound (FUS), when combined with circulating microbubbles, is a noninvasivemethod to locally and transiently disrupt the BBB at discrete targets. This review provides insight on the currentstatus of this unique drug delivery technique, experience in preclinical models, and potential for clinical transla-tion. If translated to humans, this methodwould offer a flexiblemeans to target therapeutics to desired points orvolumes in the brain, and enable the whole arsenal of drugs in the CNS that are currently prevented by the BBB.
© 2014 Elsevier B.V. All rights reserved.
Contents
1. Introduction . . . . . . . . . . . . . . . . . . . . . . . . . . . . . . . . . . . . . . . . . . . . . . . . . . . . . . . . . . . . . . . 02. Methods for drug delivery in the brain . . . . . . . . . . . . . . . . . . . . . . . . . . . . . . . . . . . . . . . . . . . . . . . . . . . 0
2.1. Invasive approaches to brain drug delivery . . . . . . . . . . . . . . . . . . . . . . . . . . . . . . . . . . . . . . . . . . . . . . 02.2. Transvascular brain drug therapy: Biopharmaceutical approaches . . . . . . . . . . . . . . . . . . . . . . . . . . . . . . . . . . . 02.3. Transvascular brain drug therapy: BBB disruption . . . . . . . . . . . . . . . . . . . . . . . . . . . . . . . . . . . . . . . . . . 0
3. Focused ultrasound . . . . . . . . . . . . . . . . . . . . . . . . . . . . . . . . . . . . . . . . . . . . . . . . . . . . . . . . . . . 04. Ultrasound-induced BBB disruption . . . . . . . . . . . . . . . . . . . . . . . . . . . . . . . . . . . . . . . . . . . . . . . . . . . . 0
4.1. Effect of ultrasound parameters and other factors on BBB disruption . . . . . . . . . . . . . . . . . . . . . . . . . . . . . . . . . . 04.2. Optimal parameters? . . . . . . . . . . . . . . . . . . . . . . . . . . . . . . . . . . . . . . . . . . . . . . . . . . . . . . . 04.3. Potential mechanisms . . . . . . . . . . . . . . . . . . . . . . . . . . . . . . . . . . . . . . . . . . . . . . . . . . . . . . . 04.4. Bioeffects induced by FUS and microbubbles . . . . . . . . . . . . . . . . . . . . . . . . . . . . . . . . . . . . . . . . . . . . . 04.5. Delivery of imaging/therapeutic agents and tests in animal disease models . . . . . . . . . . . . . . . . . . . . . . . . . . . . . . . 0
4.5.1. Delivery of therapeutics . . . . . . . . . . . . . . . . . . . . . . . . . . . . . . . . . . . . . . . . . . . . . . . . . . 04.5.2. Disease models . . . . . . . . . . . . . . . . . . . . . . . . . . . . . . . . . . . . . . . . . . . . . . . . . . . . . . 0
4.6. Methods to plan, monitor, and evaluate FUS-induced BBB disruption . . . . . . . . . . . . . . . . . . . . . . . . . . . . . . . . . . 04.6.1. Treatment planning . . . . . . . . . . . . . . . . . . . . . . . . . . . . . . . . . . . . . . . . . . . . . . . . . . . . 04.6.2. Treatment monitoring and control . . . . . . . . . . . . . . . . . . . . . . . . . . . . . . . . . . . . . . . . . . . . . 04.6.3. Treatment evaluation . . . . . . . . . . . . . . . . . . . . . . . . . . . . . . . . . . . . . . . . . . . . . . . . . . . 0
5. Going forward . . . . . . . . . . . . . . . . . . . . . . . . . . . . . . . . . . . . . . . . . . . . . . . . . . . . . . . . . . . . . . 06. Conclusion . . . . . . . . . . . . . . . . . . . . . . . . . . . . . . . . . . . . . . . . . . . . . . . . . . . . . . . . . . . . . . . 0References . . . . . . . . . . . . . . . . . . . . . . . . . . . . . . . . . . . . . . . . . . . . . . . . . . . . . . . . . . . . . . . . . . 0
1. Introduction
Theblood–brain barrier (BBB) is a specialized non-permeable barrierin cerebral microvessels consisting of endothelial cells connectedtogether by tight junctions, a thick basement membrane, and astrocyticendfeet. The tight junctions between the endothelial cells, together with
Advanced Drug Delivery Reviews xxx (2014) xxx–xxx
☆ This review is part of the Advanced Drug Delivery Reviews theme issue on“Ultrasound triggered drug delivery”.☆☆ Support: This work was supported by NIH grants P01CA174645, P41EB015898,P41RR019703, and R25CA089017.
⁎ Corresponding author at: 75 Francis Street, Boston, MA 02115, USA. Tel.: +1 617278 0605; fax: +1 617 525 7450.
E-mail address: [email protected] (N. McDannold).
ADR-12569; No of Pages 16
0169-409X/$ – see front matter © 2014 Elsevier B.V. All rights reserved.http://dx.doi.org/10.1016/j.addr.2014.01.008
Contents lists available at ScienceDirect
Advanced Drug Delivery Reviews
j ourna l homepage: www.e lsev ie r .com/ locate /addr
Please cite this article as: M. Aryal, et al., Ultrasound-mediated blood–brain barrier disruption for targeted drug delivery in the central nervoussystem, Adv. Drug Deliv. Rev. (2014), http://dx.doi.org/10.1016/j.addr.2014.01.008

an ensemble of enzymes, receptors, transporters, and efflux pumps ofthe multidrug resistance (MDR) pathways, control and limit access ofmolecules in the vascular compartment to the brain by paracellular ortranscellular pathways [1]. The BBB normally protects the brain fromtoxins, and helps maintain the delicate homeostasis of the neuronalmicroenvironment. However, it also excludes 98% of small-moleculedrugs and approximately 100% of large-molecule neurotherapeuticsfrom the brain parenchyma [2,3]. Only small-molecule drugs with highlipid solubility and a molecular mass under 400–500 Da can cross theBBB in pharmacologically significant amounts, resulting in effectivetreatments for only a few diseases such as depression, affective disor-ders, chronic pain, and epilepsy. Given the paucity of small-moleculedrugs effective for CNS disorders, it is clear that the BBB is a primarylimitation for the development and use of drugs in the brain. Overcomingthis hindrance could mean potential therapies for a wide range ofdisorders, including Alzheimer's andHuntington's diseases, amyotrophiclateral sclerosis (ALS), neuro-AIDS, stroke, brain or spinal cord trauma,autism, lysosomal storage disorders, fragile X syndrome, inheritedataxias, and blindness.
Tumors, particularly those in the brain also face challenges foreffective drug delivery. While the blood vessels in most primary andmetastatic brain tumors are often somewhat permeable from the lackof a fully formed BBB, infiltrating cancer cells at the tumor marginsand small metastatic seedsmay be protected by the BBB of surroundingnormal tissue [4]. Glioblastomas in particular are highly infiltrative, andcommonly recur after localized treatments such as conformal radiother-apy or surgery. Relapse usually occurs within a few centimeters of thetreatment site [5–7]. Furthermore, their vascular permeability is hetero-geneous, and additional barriers to drug delivery include increasedinterstitial pressures [8] and drug efflux pumps that contribute totheir multidrug resistance phenotype [9]. As for metastatic tumors,work in mice suggests that the blood–tumor barrier (BTB) is onlypartially compromised in breast adenocarcinoma brain metastases,and that toxic concentrations of chemotherapy are only achieved in asmall subset of tumors that are highly permeable [10]. Also, systemicdrug accumulation in brain metastases can be substantially less thanin extracranial metastases [10]. Thus, the BTB is a hindrance to effectivedrug delivery similarly to the BBB.
2. Methods for drug delivery in the brain
In order to overcome these limitations, it is necessary to either bypassthese vascular barriers altogether, or to facilitate passage across it viacontrolled exploitation of endogenous transport mechanisms. Differentmethods have been explored to bypass the BBB (or the BTB) (Table 1)[11–13]. While these methods are promising, they also have limitations.
2.1. Invasive approaches to brain drug delivery
High local drug concentrations can be achieved by inserting a needleor catheter into the brain and directly injecting or infusing drugs or by
implanting drug-exuding devices. With such techniques, therapeuticbenefits have been shown for brain tumors and other disorders[14–17]. However, because of their invasiveness, there are some risksof infection or brain trauma, and theymay not be amenable for repeatedtreatments or for drug delivery to large areas of the brain. It can also be achallenge to control the drug distribution, as drug concentrationsdecrease exponentially from the injection or implantation site [18].When convection-enhanced diffusion is used, the infused agents aredelivered preferentially along white matter tracts [19], which may notbe desirable.
Another approach for bypassing the BBB is to introduce drugs intothe cerebrospinal fluid (CSF) via intrathecal or intraventricular routes.It then follows the flow patterns of the CSF and enters the brain paren-chyma via diffusion. This approach has been successful in cases wherethe target is in the subarachnoid space [20], but drug diffusion dropsoff exponentially from the brain surface and penetration into the brainparenchyma can be limited [11]. It is also possible to deliver drugstransnasally from the submucus space into the olfactory CSF [21–24].This approach has advantages of being noninvasive and being relativelyeasy to administer. However, only small drug volumes can be deliveredand interindividual variability and other factors may pose challenges tothis procedure [24]. Nevertheless, the technique is a promising route tobypass the BBB and is currently being investigated by numerousresearchers.
2.2. Transvascular brain drug therapy: Biopharmaceutical approaches
Anumber of approaches have been investigated to develop ormodifydrugs that can cross the BBB. While these methods are highly promisingand offer the ability to easily administer drugs to the CNS as in otherorgans, they do require the expense and time of developing new agents,and they result in drugs being delivered to the entire brain, which maynot always be desirable.
Converting water-soluble molecules that would not ordinarily crossthe BBB into lipid-soluble ones is one approach to brain drug therapy.This can be achieved by the addition of lipid groups, or functional groupssuch as acetate to block hydrogen bonding. The molecule would thenundergo passive diffusion across the BBB. An example of this is the con-version of morphine to heroine by the acetylation of two hydroxylgroups, which results in the removal of the molecule from hydrogenbonding with its aqueous environment [25]. Although utilized by thepharmaceutical industry, this approach has limited applicability todrugs greater than 400–450 Da [12,26].
Another approach involves utilizing the large variety of solute carrierproteins (SLC) on the endothelial surface that specifically transportmany essential polar and charged nutrients such as glucose, aminoacids, vitamins, small peptides, and hormones transcellularly acrossthe BBB [27]. These transporters move the solute into the cytoplasmwhere they await another SLC at the opposite cell membrane to exocy-tose them into the brain parenchyma. An example of SLC used for braindrug therapy is the large neutral amino acid transporter type 1 (LAT1),
Table 1Different methods investigated to get around the BBB to deliver drugs to the brain.
Method Advantages Disadvantages
Direct injection, convection-enhanceddelivery, implantable devices
High local drug concentrations can be achieved; systemicadministration avoided.
Invasive; side effects; challenging to control; not readilyrepeatable.
Intrathecal, intraventricular injection Effectively delivers drugs to subarachnoid space, brain surface. Little drug penetration beyond brain surface; invasive.Trans-nasal delivery Noninvasive; easy to administer; repeatable. Small volume of drug delivered; interindividual variability.BBB disruption via arterial injection ofosmotic solution or other agents
Effectively delivers drugs to large brain regions; large clinicalexperience.
Invasive; requires general anesthesia; side effects; not readilyrepeatable.
Modification of drugs to cross barrierthrough endogenous transportmechanisms
Easily administered; delivered to whole brain. Requires systemic administration; expensive; each drug requiresnew development; clinical data lacking.
BBB disruption via FUS andmicrobubbles
Noninvasive; readily repeatable; can target drug delivery to desiredvolumes; can control “magnitude” of disruption; can be combined withdrug-loadedmicrobubbles ormagnetic particles for additional targeting.
Requires systemic administration; currently technicallychallenging; large volume/whole brain disruption unproven; noclinical data.
2 M. Aryal et al. / Advanced Drug Delivery Reviews xxx (2014) xxx–xxx
Please cite this article as: M. Aryal, et al., Ultrasound-mediated blood–brain barrier disruption for targeted drug delivery in the central nervoussystem, Adv. Drug Deliv. Rev. (2014), http://dx.doi.org/10.1016/j.addr.2014.01.008
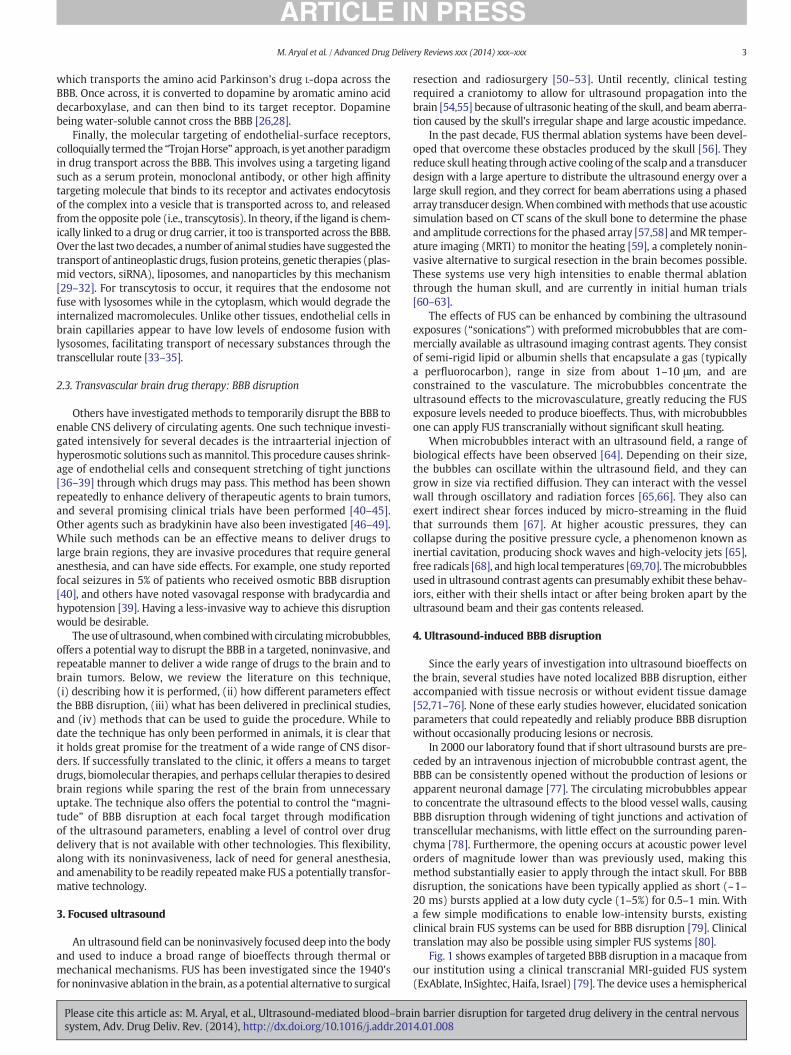
which transports the amino acid Parkinson's drug L-dopa across theBBB. Once across, it is converted to dopamine by aromatic amino aciddecarboxylase, and can then bind to its target receptor. Dopaminebeing water-soluble cannot cross the BBB [26,28].
Finally, the molecular targeting of endothelial-surface receptors,colloquially termed the “TrojanHorse” approach, is yet another paradigmin drug transport across the BBB. This involves using a targeting ligandsuch as a serum protein, monoclonal antibody, or other high affinitytargeting molecule that binds to its receptor and activates endocytosisof the complex into a vesicle that is transported across to, and releasedfrom the opposite pole (i.e., transcytosis). In theory, if the ligand is chem-ically linked to a drug or drug carrier, it too is transported across the BBB.Over the last twodecades, a number of animal studies have suggested thetransport of antineoplastic drugs, fusion proteins, genetic therapies (plas-mid vectors, siRNA), liposomes, and nanoparticles by this mechanism[29–32]. For transcytosis to occur, it requires that the endosome notfuse with lysosomes while in the cytoplasm, which would degrade theinternalized macromolecules. Unlike other tissues, endothelial cells inbrain capillaries appear to have low levels of endosome fusion withlysosomes, facilitating transport of necessary substances through thetranscellular route [33–35].
2.3. Transvascular brain drug therapy: BBB disruption
Others have investigatedmethods to temporarily disrupt the BBB toenable CNS delivery of circulating agents. One such technique investi-gated intensively for several decades is the intraarterial injection ofhyperosmotic solutions such asmannitol. This procedure causes shrink-age of endothelial cells and consequent stretching of tight junctions[36–39] through which drugs may pass. This method has been shownrepeatedly to enhance delivery of therapeutic agents to brain tumors,and several promising clinical trials have been performed [40–45].Other agents such as bradykinin have also been investigated [46–49].While such methods can be an effective means to deliver drugs tolarge brain regions, they are invasive procedures that require generalanesthesia, and can have side effects. For example, one study reportedfocal seizures in 5% of patients who received osmotic BBB disruption[40], and others have noted vasovagal response with bradycardia andhypotension [39]. Having a less-invasive way to achieve this disruptionwould be desirable.
The use of ultrasound,when combinedwith circulatingmicrobubbles,offers a potential way to disrupt the BBB in a targeted, noninvasive, andrepeatable manner to deliver a wide range of drugs to the brain and tobrain tumors. Below, we review the literature on this technique,(i) describing how it is performed, (ii) how different parameters effectthe BBB disruption, (iii) what has been delivered in preclinical studies,and (iv) methods that can be used to guide the procedure. While todate the technique has only been performed in animals, it is clear thatit holds great promise for the treatment of a wide range of CNS disor-ders. If successfully translated to the clinic, it offers a means to targetdrugs, biomolecular therapies, and perhaps cellular therapies to desiredbrain regions while sparing the rest of the brain from unnecessaryuptake. The technique also offers the potential to control the “magni-tude” of BBB disruption at each focal target through modificationof the ultrasound parameters, enabling a level of control over drugdelivery that is not available with other technologies. This flexibility,along with its noninvasiveness, lack of need for general anesthesia,and amenability to be readily repeatedmake FUS a potentially transfor-mative technology.
3. Focused ultrasound
An ultrasound field can be noninvasively focused deep into the bodyand used to induce a broad range of bioeffects through thermal ormechanical mechanisms. FUS has been investigated since the 1940'sfor noninvasive ablation in thebrain, as a potential alternative to surgical
resection and radiosurgery [50–53]. Until recently, clinical testingrequired a craniotomy to allow for ultrasound propagation into thebrain [54,55] because of ultrasonic heating of the skull, and beam aberra-tion caused by the skull's irregular shape and large acoustic impedance.
In the past decade, FUS thermal ablation systems have been devel-oped that overcome these obstacles produced by the skull [56]. Theyreduce skull heating through active cooling of the scalp and a transducerdesign with a large aperture to distribute the ultrasound energy over alarge skull region, and they correct for beam aberrations using a phasedarray transducer design.When combinedwithmethods that use acousticsimulation based on CT scans of the skull bone to determine the phaseand amplitude corrections for the phased array [57,58] andMR temper-ature imaging (MRTI) to monitor the heating [59], a completely nonin-vasive alternative to surgical resection in the brain becomes possible.These systems use very high intensities to enable thermal ablationthrough the human skull, and are currently in initial human trials[60–63].
The effects of FUS can be enhanced by combining the ultrasoundexposures (“sonications”) with preformed microbubbles that are com-mercially available as ultrasound imaging contrast agents. They consistof semi-rigid lipid or albumin shells that encapsulate a gas (typicallya perfluorocarbon), range in size from about 1–10 μm, and areconstrained to the vasculature. The microbubbles concentrate theultrasound effects to the microvasculature, greatly reducing the FUSexposure levels needed to produce bioeffects. Thus, with microbubblesone can apply FUS transcranially without significant skull heating.
When microbubbles interact with an ultrasound field, a range ofbiological effects have been observed [64]. Depending on their size,the bubbles can oscillate within the ultrasound field, and they cangrow in size via rectified diffusion. They can interact with the vesselwall through oscillatory and radiation forces [65,66]. They also canexert indirect shear forces induced by micro-streaming in the fluidthat surrounds them [67]. At higher acoustic pressures, they cancollapse during the positive pressure cycle, a phenomenon known asinertial cavitation, producing shock waves and high-velocity jets [65],free radicals [68], and high local temperatures [69,70]. Themicrobubblesused in ultrasound contrast agents can presumably exhibit these behav-iors, either with their shells intact or after being broken apart by theultrasound beam and their gas contents released.
4. Ultrasound-induced BBB disruption
Since the early years of investigation into ultrasound bioeffects onthe brain, several studies have noted localized BBB disruption, eitheraccompanied with tissue necrosis or without evident tissue damage[52,71–76]. None of these early studies however, elucidated sonicationparameters that could repeatedly and reliably produce BBB disruptionwithout occasionally producing lesions or necrosis.
In 2000 our laboratory found that if short ultrasound bursts are pre-ceded by an intravenous injection of microbubble contrast agent, theBBB can be consistently opened without the production of lesions orapparent neuronal damage [77]. The circulating microbubbles appearto concentrate the ultrasound effects to the blood vessel walls, causingBBB disruption through widening of tight junctions and activation oftranscellular mechanisms, with little effect on the surrounding paren-chyma [78]. Furthermore, the opening occurs at acoustic power levelorders of magnitude lower than was previously used, making thismethod substantially easier to apply through the intact skull. For BBBdisruption, the sonications have been typically applied as short (~1–20 ms) bursts applied at a low duty cycle (1–5%) for 0.5–1 min. Witha few simple modifications to enable low-intensity bursts, existingclinical brain FUS systems can be used for BBB disruption [79]. Clinicaltranslation may also be possible using simpler FUS systems [80].
Fig. 1 shows examples of targeted BBB disruption in amacaque fromour institution using a clinical transcranial MRI-guided FUS system(ExAblate, InSightec, Haifa, Israel) [79]. The device uses a hemispherical
3M. Aryal et al. / Advanced Drug Delivery Reviews xxx (2014) xxx–xxx
Please cite this article as: M. Aryal, et al., Ultrasound-mediated blood–brain barrier disruption for targeted drug delivery in the central nervoussystem, Adv. Drug Deliv. Rev. (2014), http://dx.doi.org/10.1016/j.addr.2014.01.008

1024-element phased array operating at 220 kHz, and is integratedwith a 3T MRI scanner. The focal region can be electronically steeredto different locations using this array without physically moving thetransducer. Volumes can be targeted by systematically steering thefocal point to different targets, enabling one to deliver drugs to desiredbrain regions. Fig. 2 shows an example of such “volumetric” FUS-induced BBB disruption. BBB disruption was evaluated using two MRIcontrast agents and with the vital dye trypan blue. Note the lack of con-trast enhancement in white matter despite evident staining with thedye. This difference is presumably due to the lower vascular density inwhite matter compared to gray matter.
4.1. Effect of ultrasound parameters and other factors on BBB disruption
A number of sonication parameters can be varied in ultrasonic BBBdisruption. Each parameter variationmay impact the threshold pressureamplitude needed to disrupt the BBB, the magnitude of its disruption,and the resultant drug quantity delivered to the brain parenchyma. Asdetermined from a number of studies, parameter variations and theireffects are listed in Table 2. These studies used an MRI contrast agent,fluorescent probe, or drug to evaluate the BBB disruption. Given thelarge parameter space, and different techniques and criteria used toevaluate the disruption (each with different sensitivities), it can bechallenging to compare results from different laboratories. Such com-parisons are additionally confounded by uncertain accuracies in esti-mates of acoustic pressure amplitude when sonicating through theskull [81]. However, general trends can be observed.
For a fixed set of parameters, as one increases the pressure ampli-tude, the magnitude of the BBB disruption increases, and at some levelit appears to saturate [82–84]. Below some value, no disruption isdetected, and at some higher pressure threshold, vascular damage isproduced along with the disruption (see below). Such studies repeatedwhile varying a different parameter have shown that the threshold forBBB disruption depends strongly on the ultrasound frequency [85] andburst length [86]. Most experiments have been done with commercially-available ultrasound contrast agents that consist of microbubbles witha wide range of diameters. Experiments with microbubbles withnarrow size distributions suggest that the BBB disruption thresholdcan also be reduced by using larger microbubbles [87–89].
By fixing the pressure amplitude and varying each parameter, onecan evaluate their effects on the magnitude of the disruption. The mag-nitude has been found to increasewith the burst length up to a durationof approximately 10 ms, with further increases in burst length havinglittle or no effect [77,81,86,90,90–92]. Several groups have shown thatthe disruption magnitude may be increased by using a larger dose of
ultrasound contrast agent [83,93–95] (although other works haveshown little or no effect [86,90]) or by using larger microbubbles[87–89]. Pulse repetition frequency can also influence the magnitudeof disruption up to a point [90,91], but other studies have seen nodependence [86]. Finally, the magnitude of the disruption can beincreased by increasing the sonication duration [84] or by repeating thesonication after some delay [96,97], but excessive durations may resultin tissue damage [84,97]. Factors such as using an infusion instead of abolus injection of microbubbles [98] and choice of anesthesia protocol[99] may also influence the resulting disruption. Other factors such asthe delay between the microbubble injection and the start of sonication,andwhether the drug or tracer is administered before or after the sonica-tion may also be expected to have an effect. Additive effects have beenobserved when FUS-induced BBB disruption is combined with agentsthat affect vascular permeability [100–102].
These trends observed in parametric studies are difficult to interpretwith confidence since the exact mechanism by which microbubble-enhanced FUS induces BBB disruption is currently unknown (seebelow). They are perhaps consistent with the following notions. First,for BBB disruption to occur, the microbubbles oscillations may need toreach a certain minimal radius, which can be achieved by increasingthe pressure amplitude or by using larger microbubbles, and assumingthe bubbles grow during each burst via rectified diffusion, by decreasingthe ultrasound frequency or increasing the burst length. Next, in addi-tion to depending on the bubble size during its oscillation, the magni-tude of the disruption depends on the number of sites on which themicrobubbles interact with the vasculature. The number of these sitescan be increased by increasing the microbubble dose, or by increasingthe sonication duration and/or number of bursts. Data showing a strongdependence on burst length may also suggest that the threshold andmagnitude of the disruption depend on the amount of time themicrobubbles interact with the blood vessels during each burst. Pulserepetition frequency may have an influence if the microbubbles arebeing fragmented or destroyed — time may be needed to replenishthem if that is the case [103]. Finally, it appears that the magnitude ofthe disruption can saturate at some level, and increasing the differentparameters has no additional effect.
4.2. Optimal parameters?
Overall, these studies have made it clear that BBB disruption ispossible over a wide range of exposure parameters. Disruption hasbeen demonstrated at frequencies between 28 kHz [104] and 8 MHz[92], burst lengths as low as a few ultrasound cycles [90,91,98] upto 100 ms [77], and over a range of pulse repetition frequencies,
Fig. 1. Contrast-enhanced T1-weighted MRI of the brain of a rhesus macaque showing enhancement at four focal targets in the cingulate cortex after injection of Gd-DTPA. (Left image:Axial; middle: Sagittal; right: Coronal). Enhancement of this MRI contrast agent, which normally does not extravasate into the brain, indicates areas with BBB disruption. Four targetswere sonicated using a 220 kHz clinical MRI-guided FUS system along with an infusion of Definity microbubbles. The dimensions of the disrupted spots were approximately 3 mmwide and4 mm long. Note the leakage of contrast agent into the cingulate sulcus evident in the sagittal image (arrow). These imageswere obtained in a study evaluating passive cavitationmapping during microbubble-enhanced FUS [176] (bar: 1 cm).
4 M. Aryal et al. / Advanced Drug Delivery Reviews xxx (2014) xxx–xxx
Please cite this article as: M. Aryal, et al., Ultrasound-mediated blood–brain barrier disruption for targeted drug delivery in the central nervoussystem, Adv. Drug Deliv. Rev. (2014), http://dx.doi.org/10.1016/j.addr.2014.01.008

microbubble doses, and sonication times. It is not clear what the “opti-mal” parameters are, or what criteria to use to establish them. In ourview, the primary consideration could be to find parameters that
maximize the window in acoustic pressure amplitude where robustBBB disruption is possible without producing vascular damage. It willbe challenging to precisely estimate the pressure amplitude in thehuman brain after transcranial sonication, and having the widest safetymargin possible will be desirable for clinical translation. How close theFUS frequency is to the “resonant size” of the microbubbles may havean impact on the width of this safety window. Additional importantcriteria would be to optimize the frequency and transducer geometryto produce the desired focal spot size, to effectively focus through theskull with minimal distortion, and if a phased array transducer is used,to be able to steer the focal region throughout the brain. It may also bedesirable to find parameters that enable BBB disruption in the shortestpossible sonication time so that multiple targets can be targeted in areasonable amount of time, and tomaintain a safe dose ofmicrobubbles.
4.3. Potential mechanisms
Even though FUS exposures combinedwithmicrobubbles have beeninvestigated to disrupt the BBB in numerous studies, the exact mecha-nism to open BBB still remains unknown. It does appear that twoknown effects that can be induced by FUS, bulk heating and inertialcavitation, are not responsible. Initial studies on the method utilizedMRI-based temperature imaging [77] during the sonications, and nomeasureable heating was observed. Studies that recorded the acousticemissions during the sonications [105–107] have found that BBBdisruption can be achieved without wideband acoustic emission,which is a signature for inertial cavitation [53]. It also may not be thesame mechanism utilized for so-called “sonoporation”, where transientpores in cell membranes created by sonication with microbubblesenable drugs to enter [108]. Those pores are rapidly resolved, whileFUS-induced BBB disruption lasts for several hours.
Fundamentally, we do not know if the FUS/microbubble interactionsphysically modify the vessel walls, or if they are triggering a physiolog-ical response that includes temporary BBB breakdown. As describedbelow, electron microscopy studies have shown delivery of tracersthrough widened tight junctions [78,109], which could be consistentwith a direct physical force pulling themapart, aswell as active transport[78,110]. Other work has shown the sonications can induce vascularspasm [111,112]. While the role of this spasm is not clear, it does makeclear that the sonications can trigger a physiological response.
In the absence of bulk heating and inertial cavitation,we are leftwithmechanical effects induced during the microbubble oscillations in theultrasound field. A number of effects are produced with potential toinduce the observed BBB disruption. Microbubbles tend to move inthe direction of the wave propagation via acoustic radiation force [66],which will bring them in contact with vessel endothelium. Duringoscillation, the shell of the microbubble can break, the bubbles can befragmented into smaller bubbles, and they can grow via rectifieddiffusion. Microstreaming due to microbubble oscillations can inducebiologically-significant shear stresses on the neighboring endothelium,and the oscillations produce inward forces that in extreme cases can
Fig. 2. Demonstration of FUS-induced BBB disruption using contrast enhanced MRI andtrypan blue. (A–C) Contrast-enhanced T1-weighted MRI after BBB disruption at sixvolumes in the cingulate cortex. At each volume, the focal regionwas steered electronicallyin sequence to nine targets in a 3 × 3 grid using a phased array. (A) Low-level enhance-ment observed with gadofosveset trisodium, an MR contrast agent that binds to albuminin the blood (MW of albumin: ~67 kDa); it was administered before sonication.(B) Enhancement after injection of Gd-DTPA (MW: 938 Da). The inset in (B) shows thesame view in T2-weighted imaging. The enhancement patterns correspond to regions ofcortical gray matter visible in T2-weighted imaging. (C) Sagittal view of Gd-DTPAenhancement, which included leakage of agent into a sulcus (arrow). (D–E) VolumetricBBB disruption at three targets centered on the boundary between the cingulate cortexand white matter; from another experimental session in this animal. (D) T1-weightedMRI showing Gd-DTPA extravasation in the cingulate cortex, but not in the white matter.(E) Photograph of formalin-fixed brain showing trypan blue extravasation into both thecingulate cortex and white matter. This differential enhancement between gray andwhite matter presumably reflects differences in vascular density. The white matter com-ponent of two of these targets is shownwith increased image contrast in the inset to bettervisualize low-level trypan blue extravasation. (Scale bars: 1 cm). Reprinted from CancerResearch 2012; 72:3652–3663; © 2012 American Association for Cancer Research. (Forinterpretation of the references to color in this figure legend, the reader is referred to theweb version of this article.)
Table 2Reported effects of different parameters on BBB disruption via FUS and microbubbles.
Parameter Effect on BBB disruption
Pressure amplitude Increase in BBB disruption magnitude as pressure amplitude increases; saturation at some point [82–84]; vascular damage produced at highpressure amplitudes.
Ultrasound frequency Decrease in BBB disruption threshold as frequency decreases; some evidence of improved safety for lower frequencies [85].Burst length For burst lengths less than 10 ms, BBB disruption threshold increases and BBB disruption magnitude decreases as burst length is reduced
[86,90–92]; little or no increase in disruption magnitude for longer bursts [77,81,90].Pulse repetition frequency BBB disruptionmagnitude increases as repetition frequency increases up to a point [90]. Otherworks have observed no effect onBBB disruption
magnitude [86].Ultrasound contrast agent dose Magnitude of BBB disruption increases with dose [83,90,94,188]; other experiments have reported no effect [86].Sonication duration Longer durations [84] or repeated sonication [96,97] increasemagnitude of BBB disruption; damage reportedwith excessive sonication [84,97].Microbubble diameter Threshold for BBB disruption lower for larger microbubbles; disruption magnitude increased with larger microbubbles [87–89].Ultrasound contrast agent Similar outcomes reported forOptison® andDefinity®microbubbles [189]. Sonovue®microbubbles and research agents are also commonly used.
5M. Aryal et al. / Advanced Drug Delivery Reviews xxx (2014) xxx–xxx
Please cite this article as: M. Aryal, et al., Ultrasound-mediated blood–brain barrier disruption for targeted drug delivery in the central nervoussystem, Adv. Drug Deliv. Rev. (2014), http://dx.doi.org/10.1016/j.addr.2014.01.008

pull the vessel wall inward [113]. Clearly, the behavior of a microbubblein an acoustic field is complex, and it can be different in free fluid thanwhen constrained within a capillary [114].
4.4. Bioeffects induced by FUS and microbubbles
The BBB disruption can occur almost immediately with sonication[112] and appears to decay exponentially over several hours thereafter[77,82,96,115]. The amount of agent delivered across the barrierappears to bemuch larger in graymatter than in whitematter, presum-ably due to differences in vascular density [79]. Several studies havefound that the barrier appears to be largely restored in approximately4–6 h [77,82,96,109,115,116]; other experiments have observed low-level disruption at 24 h after sonication or longer [89]. The source ofthis discrepancy is not clear, but it could be simply that more sensitivedetection methods such as high-field MRI combined with large dosesof MRI contrast agent are capable of detecting low-level disruptionmissed in other works. The duration of the opening to different tracersappears to be reduced for larger tracers [115].
This window in timewhere the barrier is open is thought to be goodfor the prospect of delivering even long-circulating drugs, but not solong as to produce concern of toxicity arising from chronic BBB break-down. Indeed, the appearance of the brain after BBB disruption in lightmicroscopy appears to be normal [117], even after repeated weeklysessions [79]. Example histology obtained after BBB disruption isshown in Fig. 3. The only major feature that has been observed inmany studies is the presence of tiny clusters of extravasated red bloodcells (petechiae) [118,119]. It is thought that these petechiae are formedduring inertial cavitation, andexperimentswherenowidebandemissions(a signature for inertial cavitation)were observed, no such extravasationswere observed [105]. Some have suggested that wideband emissionscan be observed without producing such petechiae [106]. While thepresence of these petechiae is undesirable, their impact on the brainmay be minimal. Investigations looking for apoptosis or ischemia,which may be expected if serious vascular damage were occurring,
failed to observe anythingmore thana few individual damagedneurons,and long-term effects have not found evidence of neuronal damagewithsuch sonications [118,120]. At excessive exposure levels, more severevascular damage, parenchymal damage, and neuronal loss can occur[77,121].
Transmission electron microscopy (TEM) investigations havedemonstrated an increase of cytoplasmic vesicles in endothelium andpericytes (suggestive of transcytosis), formation of trans-endothelialfenestrae, widened tight junctions, and transport of serum componentsacross the BBB [78]. The use of a 44 kDa tracer molecule helped eluci-date arterioles as the major sight of trans-endothelial vesicle transport(followed by capillaries then venules), and showed extensive tracerdeposition in the endothelial paracellular space, basement membrane,and surrounding brain parenchyma [110]. Finally, using immunogoldlabeling, the disappearance of tight junction (TJ) proteins occludin,claudin-5, and ZO-1 were shown, along with opened endothelial junc-tions and tracer leakage at 1–4 h post-sonication [109]. The TJ proteinsreappeared at 6 and 24 h. Examples showing tracer penetration acrossthe BBB through widened tight junctions and vesicular transport areshown in Fig. 4. Other work has shown down-regulation of the sameTJ proteins along with their mRNA, and recovery to normal levels at12 h post-sonication [122]. Reorganization of connexin gap junctionproteins have also been reported [123]. An increase of endothelialvesicles in normal [124] and tumor microvessels [125] have also beenobserved on TEM with an up-regulation of caveolin proteins/mRNA,suggesting that caveolae-mediated transcytosis (CMT) as a contributingmechanism for permeability. These researchers also found increasedphosphorylation of Src and caveolin-1/2, noting that Src-induced phos-phorylation of caveolins is a trigger for CMT [126].
Intracellular signaling cascades in response to mechanical stimula-tion by FUS-induced BBB disruption is likely, but has only recentlybeen addressed. Increased phosphorylation of Akt and its downstreammolecule GSK3β has been shown in neurons flanking the BBB disrup-tion at 24 h, well after tight junction reassembly [127]. Akt phosphory-lation has been implicated in neuroprotection after stroke [128], while
Fig. 3. Normal-appearing histology after FUS-induced BBB disruption. This example was obtained after volumetric sonication to induce BBB disruption in the hippocampus and lateralgeniculate nucleus (LGN) in macaque. This target was sonicated approximately 2 h before the animal was sacrificed and in seven prior sessions over several months. (A) Axial contrast-enhanced T1-weighted MRI showing BBB disruption induced by sonicating nine targets in a 3 × 3 grid. Inset: Low-magnification microphotograph showing histology in the hippocam-pus/LGN. (B–C) High-magnification view showing normal-appearing layers in the LGN. (D–E) High-magnification views of hippocampus showing the granular cell layer (D) and the pyr-amid layers (E). (F) Blood vessels in the LGN with a few extravasated red blood cells, presumably from the last sonication session. Only a very small number of such extravasations werefound. (B, F: H&E; C: H&E-Luxol fast blue; D–E: Nissl; scale bars: A: 1 cm, B, D: 1 mm, C, E–F: 200 μm). Reprinted from Cancer Research 2012; 72:3652–3663; © 2012 American Associationfor Cancer Research.
6 M. Aryal et al. / Advanced Drug Delivery Reviews xxx (2014) xxx–xxx
Please cite this article as: M. Aryal, et al., Ultrasound-mediated blood–brain barrier disruption for targeted drug delivery in the central nervoussystem, Adv. Drug Deliv. Rev. (2014), http://dx.doi.org/10.1016/j.addr.2014.01.008

activation of the p38 JNK MAP kinases promotes neuronal apoptosis[129,130]. Alonso et al. showed increased protein ubiquitination inneurons not glia post sonication, no increase in heat shock proteins,and limited neuronal apoptosis at 24 h in areas staining positive forextravasated albumin [131]. Ca2+ signaling has also been suggested asbeing stimulated by FUS-induced BBB disruption. Specifically, tempo-rary disruption of the endothelial plasmamembrane (i.e., sonoporation)can induce immediate transient changes of intracellular Ca2+ concen-tration in cells with direct contact with microbubbles, and delayed fluc-tuations in nearby cells [132]. When factoring in fluid shear induced inan in vitro flow channel (intended tomimic cerebral vessels), themem-brane disruption and Ca2+ transients were much lower [133].
Multiphoton microscopy (MPM) has provided useful insights intothe bioeffects of FUS-induced BBB disruption. Initial work with thistechnique demonstrated arteriolar vasospasm in 14/16 mice lasting upto 5 min (Fig. 5), and interrupted cerebral blood flow [111]. Althoughthis could cause ischemic injury, it has been noted that mice haveenhanced vasomotor excitability over other rodents, such as rats [134].Indeed, a similar study in rats showed vasospasm in only 25% of thevessels examined [112]. Initial work has also noted two forms of vesseldye leakage, rapid focal microdisruptions (3–9 s) that were prevalentat vessel bifurcations and slow disruptions that were observed as agradual increase in extravascular signal intensity [111]. Subsequentwork noted three rather than two leakage types: (1) fast, characterized
Fig. 4.BBB permeability for horseradish peroxidase (HRP). (A) Photomicrograph showing part of a cross-sectionedmicrovessel and the surrounding nerve tissue from a nonsonicated area.No HRP passage to the basement membrane (arrowheads) or the neuropil [NP] can be seen. The lumen [L] appears empty because the tracer was washed out during perfusion fixation.(B) A portion of a microvessel with adjacent nerve tissue from a sample obtained 1 h after sonication. Passage of HRP (black color) through several interendothelial clefts is indicated byarrowheads. The tracer has infiltrated the basement membrane [B] and the interstitial space (arrows) in the neuropil. (C) A portion of longitudinally sectioned capillary in a sampleobtained 2 h after sonication. The tracer is present in the junctional cleft (arrows), the basement membrane [B] and the interstitial spaces (asterisks) between myelinated axons [Ax].(D) Full restoration of the tight junctional barrier function 4 h after sonication. Immersion fixation (instead of perfusion fixation) was used in this brain and permits visualization ofthe tracer (black) filling the lumen [L] and being stopped at thefirst tight-junction (arrow). No penetration can be seen in the rest of the junctional cleft (arrowheads), nor in the basementmembrane [B] or neuropil [NP]. E: endothelial cell cytoplasm; RBC: red blood cell in the lumen. Scale bars: 200 nm.Modified fromUltrasound inMed. & Biol., Vol. 34, No. 7, pp. 1093–1104,2008; Copyright © 2008World Federation for Ultrasound inMedicine & Biology. (E) Electronmicrograph of an arteriole 1 h after sonication at 0.26 MHz. An intense vesicular transport isdemonstrated by the increased number of HRP-positive caveolae (arrows). Significantly fewer vesicles were observed in capillaries and venules. L: lumen.Modified from Ultrasound in Med. & Biol., Vol. 32, No. 9, pp. 1399–1409, 2006; Copyright © 2006 World Federation for Ultrasound in Medicine & Biology.
Fig. 5. Vascular effects observed in real time during FUS-induced BBB disruption using in vivo multiphoton microscopy. Each frame is a 615 × 615 μm image acquired using a mousebefore, during, and approximately 20 min after sonication. Arterioles and veins (determined by dye transit) are marked ‘a’ and ‘v’ respectively, in the first frame. The animal received0.1 mL (2 mg/mL) 10 kDa, dextran-conjugatedAlexa Fluor 488 intravenously ~5 mins before imaging (green in images). Immediately after thefirst framewas taken, a 45-secUSexposurewas initiated and a 0.1 mL bolus (10 mg/mL) of 70 kDa, dextran-conjugated Texas Redwas delivered intravenously (red in images). Almost total occlusion of the large vessel in the centerof the field occurred 12 s after the initiation of US (arrow). Beginning at 60 s and by 305 s, leakage in the green channel is apparent in the lower left of the field, and around the centralvessel. (For interpretation of the references to color in this figure legend, the reader is referred to the web version of this article.)Modified from Journal of Cerebral Blood Flow & Metabolism 2007;27(2):393–403; Copyright © 2006 ISCBFM.
7M. Aryal et al. / Advanced Drug Delivery Reviews xxx (2014) xxx–xxx
Please cite this article as: M. Aryal, et al., Ultrasound-mediated blood–brain barrier disruption for targeted drug delivery in the central nervoussystem, Adv. Drug Deliv. Rev. (2014), http://dx.doi.org/10.1016/j.addr.2014.01.008

by rapid increase to peak intensity and rapid decrease, (2) sustained,described as rapid increase to peak which persisted for up to an hour,and (3) slow, a gradual increase to peak intensity [112]. The authorsnoted that differing vessel calibers have preferences for different leakagetypes, and interestingly, that distinct peak negative pressures also showpreference for leakage types. Continuing work suggested correlationbetween fast leakage, common with high pressure amplitudes, anddetachment of astrocyte endfeet from the vessel walls [135].
4.5. Delivery of imaging/therapeutic agents and tests in animal diseasemodels
One advantage of this method for targeted drug delivery in the brainis that it appears to be “drug neutral” — that is, it appears that manyagents with a wide range of properties can be successfully deliveredacross the BBB and/or the BTB. A large number of imaging tracers(Table 3) and therapeutic agents (Table 4) which normally do notcross the BBB have been delivered to the brain or to brain tumormodelswith FUS and microbubbles. The amount of substance delivered andthe distance from the blood vessels that it penetrates appears to dependon its size. This is evident in the examples shown in Fig. 2, where lessdelivery of an albumin-bound MRI contrast agent (MW: ~67 kDa) wasevident compared to a standard agent (MW: 928 Da) in a macaque.This is even more clear in the example shown in Fig. 6, where deliveryof fluorescent dextrans with different molecular weights was examinedafter sonication in the mouse hippocampus. For 3000 Da dextrans, arelatively uniform fluorescence was observed; for the larger 70 kDa trac-er, itwasmore concentrated near the blood vessels, and a 2000 kDawasfound not to penetrate at all [136]. This result points to a need for closeexamination of how the delivery of large agents occurs— it may not beenough to look for the presence of the agent, but to also investigatewhether it is delivered far enough from the vasculature at a highenough concentration to reach the desired target at a therapeuticlevel. Low-resolution methods such as MRI may not be sufficient forthis purpose. It may be possible, for example, for agents to make itpast the endothelial cells but get trapped at the basement membrane[137].
4.5.1. Delivery of therapeuticsA large number of therapeutic agents have also been delivered to the
brain and to brain tumor models (Table 4). Many of the studies so farhave investigated the delivery of chemotherapy agents, such as BCNU[138], doxorubicin [96], methotrexate [139], cytarabine [140], andtemozolomide [141]. Enhanced delivery of chemotherapy packaged inliposomes [83,142], targeted liposomes [143] and magnetic particles[144–146], which allow for MRI-based tracking and enhanced deliveryvia magnetic targeting, have also been demonstrated (Fig. 7). Other
works have shown Trastuzumab, an antibody-based agent used forHER2-positive breast cancer [147,148], and boronophenylalanine,which is used for boron neutron capture therapy, can be delivered tothe brain and to brain tumor models [149,150]. FUS-induced BBB dis-ruption has also been shown to improve the delivery of natural killercells in a brain tumor model [151]. Finally, a number of experimentshave loaded chemotherapy and other agents into the microbubblesused for the disruption [146,152–155], which offers the possibility ofachieving even higher local payload at the targeted region.
Delivering agents for neurodegenerative diseases, such asAlzheimer's,Huntington's, and Parkinson's disease, have also been an active area ofresearch by several groups. A number of therapies for neurodegenera-tive diseases such as neuroprotective agents [153,156], antibodies[157,158], plasmidDNA [154], and siRNA [135] have all been successfullydelivered across the BBB using FUS and microbubbles. Other investiga-tions have shown that circulating neural progenitor cells [159] or viralvectors for gene therapy [160–162] can be delivered to the sonicatedregions after FUS-induced BBB disruption. An example of delivery ofadeno-associated virus serotype 9 via FUS-induced BBB disruption tothe different cell populations in the mouse brain is shown in Fig. 8.
4.5.2. Disease modelsWhile delivery of these agents is promising, one also needs to dem-
onstrate that the amount of drug delivered – and the drug penetration –
is sufficient to produce a therapeutic response. In some cases it is alsoimportant to demonstrate that the drug reaches the desired target andis active after it is delivered [156]. Several studies have shown thatFUS enhancement of the BTB can slow tumor growth and/or improvesurvival in orthotopic murine models of primary or metastatic braintumors [138,141,142,144,145,148,163].While in some cases the responsehas beenmodest, several of these studies have seen substantial improve-ments. Using multiple treatments may be necessary to achieve a pro-nounced improvement [142]. One factor that has not been investigatedin depth so far is to confirm that drugs can successfully be delivered toinfiltrating tumor cells, which are a major feature in glioma and otherprimary tumors, and to metastatic “seeds”. Both can be protected bythe normal BBB. The orthotopic models investigated so far do generallynot have large infiltrating zones, and the benefit observed in studies sofar may have been primarily due to FUS-enhanced permeability of theBTB. It may be challenging to get therapeutic levels to distant regionsthat are protected by the BBB. Some agents may have neurotoxic effectson the normal brain that may limit this ability.
Beyond brain tumors, a study by Jordão et al. showed that delivery ofantibodies targeted to amyloid plaques can reduce the plaque burden inAlzheimer's disease model mice [158]. While the decrease was modest,with multiple treatment sessions this may be an effective treatmentstrategy. In an intriguing follow-up study, the same group recently
Table 3Example different tracers that have been delivered across the BBB.
Agent Size Use
Lanthanum chloride 139 Da Electron microscopy tracer [109]99mTc-diethylenetriaminepentaacetic pentaacetate 492 Da SPECT agent [190]Omniscan® (Gd-DTPA-BMA) 574 Da MRI contrast agent [89]Magnevist® (Gd-DTPA) 928 Da MRI contrast agent [77]Trypan blue, Evans blue ~67 kDa Tissue dyes (binds to albumin) [79,191]Ablavar® (gadofosveset trisodium) ~67 kDa MRI contrast agent (binds to albumin) [79]Horseradish peroxidase 40 kDa Electron microscopy tracer [78]Dextran 3–70 kDa Fluorescent tracer [136]Immunoglobulin G ~150 kDa Endogenous antibodies [157]pCMV-EGFPa ? Plasmid DNA [192]MION-47 20 nm MRI contrast agent [120]Gold nanoparticles 50 nm Carrier for drugs or imaging [193]Gold nanorods 10 × 40 nm Photoacoustic imaging contrast agent [194]Dotarem, P846, P792, P904, P03680 1–65 nm MRI contrast agents [115]
a Loaded into a microbubble.
8 M. Aryal et al. / Advanced Drug Delivery Reviews xxx (2014) xxx–xxx
Please cite this article as: M. Aryal, et al., Ultrasound-mediated blood–brain barrier disruption for targeted drug delivery in the central nervoussystem, Adv. Drug Deliv. Rev. (2014), http://dx.doi.org/10.1016/j.addr.2014.01.008

showed that FUS-induced BBB disruption alone can reduce the size ofthe plaques, perhaps through the delivery of endogenous antibodies[164]. We anticipate that these studies are only the beginning, andthat FUS has a large potential for Alzheimer's disease and other neuro-degenerative disorders. Issues regarding the feasibility and safety ofdisrupting the BBB in large brain regions (or the whole brain— perhapsrepeatedly) may be need further investigation, however.
4.6. Methods to plan, monitor, and evaluate FUS-induced BBB disruption
As described above, FUS-induced BBB disruption utilizes themechanical interactions between microbubbles oscillating in the ultra-sound field and the vasculature. These interactions critically dependon the exposure parameters as well as the vascular density and perhapsother properties of the vascular bed. The latter, can affect the localconcentration of microbubbles, how they interact with the ultrasoundfield [114], and, more importantly, how much drug will be deliveredto the brain [79]. Unfortunately, many of these parameters are difficultto predict and are expected to vary significantly across different patientsand diseases. Thus, methods are needed to (i) determine what parame-ters to use (treatment planning), (ii) refine them during sonication to
ensure BBB disruption without overexposure (treatment monitoring),and (iii) evaluate the treatment effects (treatment evaluation).
4.6.1. Treatment planningInmost cases, experiments evaluating FUS-induced BBBdisruption in
animal models have used a fixed set of acoustic parameters determinedfrom prior experience and simple, geometrically-focused transducers. Ingeneral, accurate targeting can be achieved with such systems usingstereotactic frames [165] if image-guidance is not available, and fairlyrepeatable results can be obtained with sonication through the thinskull inmice and rats, or in larger animals through a craniotomy.Methodsto avoid standingwaves [81] and that take into account variations in skullthickness [166] can improve repeatability in small animal studies wheretranscranial sonication is used.
Such approaches may be challenging to translate to human subjects,where the thicker skull is complex (a layer of trabecular bonesurrounded by layers of cortical bone) and can vary substantiallybetween individuals (3.5–9.5 mm [167]). The skull, which has a sub-stantially higher acoustic impedance than soft tissue, will reflect mostof the ultrasound beam, and the amount transmitted will dependstrongly on the angle between the bone and the face of the transducer[168]. Its irregular shape can also deflect and distort the beam, and
Table 4Example therapeutic agents that have been delivered across the BBB or BTB.
Therapeutic agent Size Use Delivered to
Temozolomide 194 Da Chemotherapy Glioma model (9L)a [141]1,3-bis(2-chloroethyl)-1-nitrosourea (BCNU)b 214 Da Chemotherapy Glioma model (C6)a [138,152]Cytarabine 243 Da Chemotherapy Normal brain [140]Boronophenylalanine 330 Da Agent for boron neutron capture therapy Glioma models (GBM 8401 [149]; 9L [150])Doxorubicin 540 Da Chemotherapy Normal brain [96]Methotrexate 545 Da Chemotherapy Normal brain [139]siRNA ~13 kDa Huntington's disease therapy Normal brain [135]Glial cell line-derived neurotropic factor (GDNF)b 24 kDa Neuroprotective agent Normal brain [153]Brain-derived neurotropic factor (BDNF) 27 kDa Neuroprotective agent Normal brainc [156]Herceptin (trastuzumab) 148 kDa Anti-cancer antibody Normal brain [147]; breast cancer brain met. model (BT474)a [148]BAM-10 Aβ targeted antibodies ~150 kDa Therapeutic antibody for Alzheimer's disease TgCcrND8 Alzheimer's model micea [158]BCNU-VEGFb ~150 kDa Antiangiogenic-targeted chemotherapy Glioma model (C6)a [155]Plasmid DNA (pBDNF-EGFP)b ~3600 kDad Gene therapy Normal brain [154]Epirubicin in magnetic nanoparticles ~12 nm Magnetic targeted chemotherapy Glioma model (C6)a [144]Doxorubicin in magnetic nanoparticlesb ~6–10 nm Magnetic targeted chemotherapy Glioma model (C6) [146]BCNU in magnetic nanoparticles ~10–20 nm Magnetic targeted chemotherapy Glioma model (C6)a [145]Adeno-associated virus (AAV) ~25 nm Gene therapy vector Normal brain [160–162]Liposomal doxorubicin (Lipo-DOX) 90 nm Chemotherapy Normal brain [83]; Glioma model (9 L)a [142,163]Interleukin-4 receptor targeted Lipo-DOX 100–
120 nmChemotherapy Glioma model (8401) [143]
Neural progenitor cells 7–10 μm Stem cell Normal brain [159]Natural killer cells (NK-92) ~10 μm Cell therapy for brain tumor Breast cancer brain met. model (MDA-MB-231-HER2) [151]
a Also showed improved outcomes with FUS-induced BBB disruption.b Used drug-loaded microbubbles.c Also showed drug activity after delivery.d Assumed 660 Da per base pair (bp), 760 bp for BDNF, and 4700 bp for pEGFP-N1.
Fig. 6. Delivery of fluorescent dextrans with different sizes across the BBB in a mouse using FUS and microbubbles (A: 3 kDa; B: 10 kDa; C: 70 kDa; bar: 1 mm). Diffuse fluorescence re-gions can be observed for all dextrans, whereas spots of high fluorescence are observed only with the 70-kDa dextran.Modified from Proc Natl Acad Sci U S A 2011; 108: 16539–16544; © 2011 by The National Academy of Sciences of the USA.
9M. Aryal et al. / Advanced Drug Delivery Reviews xxx (2014) xxx–xxx
Please cite this article as: M. Aryal, et al., Ultrasound-mediated blood–brain barrier disruption for targeted drug delivery in the central nervoussystem, Adv. Drug Deliv. Rev. (2014), http://dx.doi.org/10.1016/j.addr.2014.01.008

reflections within the skull cavity need to be taken into account. Tocorrect for beam-aberrations introduced by thick skulls, phased arrayscomposed of more than 1000 elements combined with skull aberrationcorrection algorithms that utilize CT data are employed [57,58]. Thesearrays can also be programmed to rapidly steer the beam electronicallytomultiple targets enabling coverage of tissue volumes [79], anddifferentportions of the array can be disabled to reduce internal reflections orexclude certain structures.
While these approaches that use acoustic simulations and CT scansare effective in restoring the focusing of the array after transmissionthrough the skull, clinical experience with them for thermal ablationhave shown that one still needs to correct for small errors (~1–2 mm)in targeting [60,63]. To achieve this correction, one needs to be able tovisualize the focal region at exposure levels that do not induce damageor other unwanted effects. Currently, this can be achieved using MRI-based methods that can visualize low-level (1–2 °C) focal heating[59,169] or map small tissue displacements of a few microns inducedby radiation force [170].
Ensuring accurate targeting will be most important if one aims toprecisely disrupt the BBB at discrete locations. In addition, since thestrength of the total microbubble activity, as well as magnitude of thedisruption will depend on the vascularity of the targeted tissue (grayvs. whitematter, for example [79]), it will be important to know exactlywhere the target is located. It might also be desirable to avoid directsonication on large blood vessels. If one is uncertain about the targetingof the focal region, it may be challenging to understand whether a pooror unexpected result is due to an incorrect exposure level or tomistargeting. Pre-treatment imaging delineating vascularity, perfusion,
or other vascular properties may prove useful for planning the treat-ment. Itmay also be useful to combine thesemeasurementswithmodelsof the microbubble oscillations within the microvasculature [114,171].
Accurate control of the focal pressure is critical to ensure BBBdisrup-tion is produced while preventing inertial cavitation. The thick andcomplex human skull makes accurate focal pressure estimationsextremely challenging.While the acoustic modelingmethods developedfor aberration correction may provide estimates of the focal pressureamplitude, it has not been validated to our knowledge. Itmay be possibleto use the MRI-based methods mentioned above that can visualize focaldisplacements or heating to ensure a predictable focal pressure ampli-tude. Marty et al., for example, usedMR acoustic radiation force imagingto ensure a consistent exposure level between subjects in BBB disruptionexperiments in rats [115]. However, one needs to take the underlyingtissue properties (which may be unknown for tumors or other abnor-malities) into account or test it in proximal normal brain locations.
4.6.2. Treatment monitoring and controlGiven the challenges in predicting the focal pressure amplitude
when sonicating transcranially, we anticipate that effective monitoringof the procedure will be important if this technology is to be translatedto clinical use. Atminimum, suchmonitoring should provide an indicationthat the exposure level is sufficient to induce BBB disruption and alertthe user if inertial cavitation is occurring. One could use MRI methodsfor this purpose. Contrast-enhanced imaging can be used to visualizewhen the disruption occurs, and T2*-weighted or susceptibility-weighted MRI can be used to detect petechiae produced by inertialcavitation [77,119]. These methods could be used now for control overthe procedure in initial clinical tests of FUS-induced BBB disruptionwith experienced users. However, performing multiple MRI acquisi-tions would be time-consuming and might require excessive amountsof both ultrasound and MRI contrast agents. Real-time and, perhaps,more direct methods are likely necessary for widespread clinicalimplementation.
For real-time monitoring and control, a number of studies haveinvestigated the use of piezoelectric receivers operated in passivemode (i.e. only listening) to record and analyze the diverging pressurewaves (i.e. acoustic emissions) emitted by oscillating microbubblesduring FUS-induced BBB disruption [105–107,172,173]. The spectralcontent and strength of the recorded emissions is sufficient to charac-terize and subsequently control the microbubble oscillations. Inertialcavitation is manifested in the frequency domain of the acoustic emis-sion as a broadband signal [53], and has generally been associated withthe production of vascular damage during BBB disruption [105,107],although other studies have suggested that it can occur without damage[106]. Harmonic and/or sub- and ultra-harmonic acoustic emissions inthe absence of broadband signal are indicative of stable volumetricoscillations, which consistently have been associated with safe BBB dis-ruption [105–107]. Therefore, depending on the spectral content andstrength of the emissions the output of the device can be increaseduntil strong harmonic, subharmonic, or ultraharmonic emissions areobserved, and decreased if broadband emissions are detected. O'Reillyet al. demonstrated a closed-loop controller built around the detectionof ultraharmonic emissions to automatically select an acoustic exposurethat could produce BBB disruption with little or no petechiae [173]. Wehave been exploring the strength of the harmonic emissions as a basisfor such a controller, as we have found that we can reliably detect itbefore inertial cavitation occurs and that it is correlated with themagni-tude of the BBB disruption measured via MRI contrast enhancement[105,107]. An example of this correlation observed during transcranialBBB disruption in macaques using a clinical brain FUS system is shownin Fig. 9A.
If one can integrate a large number of receivers into the FUS system,one can use passive reconstructionmethods [174,175] to create two- oreven three-dimensionalmaps of themicrobubble activity to ensure thatit is occurring at the expected location. Examples from experiments in
Fig. 7. Confocal micrographs of tissue from tumor after FUS-induced BTB permeabilizationfollowed by magnetic targeting and contralateral brain regions after delivery of magneticnanoparticles (MNPs) loaded with epirubicin. Dark structures in the phase micrographsshow MNPs (left); fused fluorescence images (right) indicate the presence of epirubicin(red) and DAPI-stained nuclei (blue). Arrows indicate the capillaries; epirubicin occursin the capillary beds but does not penetrate into the brain parenchyma. (For interpretationof the references to color in this figure legend, the reader is referred to the web version ofthis article.)Modified from Proc Natl Acad Sci U S A 2010; 107: 15205–15210; © 2011 by The NationalAcademy of Sciences of the USA.
10 M. Aryal et al. / Advanced Drug Delivery Reviews xxx (2014) xxx–xxx
Please cite this article as: M. Aryal, et al., Ultrasound-mediated blood–brain barrier disruption for targeted drug delivery in the central nervoussystem, Adv. Drug Deliv. Rev. (2014), http://dx.doi.org/10.1016/j.addr.2014.01.008

our laboratory in macaques using a linear receiver array integrated intoa clinical brain FUS system are shown in Fig. 9B–C. In these experiments,we found that the cavitation activity in the passive acoustic maps (redarea in Fig. 9B–C) was co-localized with the resulting BBB disruption[176].
4.6.3. Treatment evaluationAs described above, contrast-enhanced imaging and T2*- or
susceptibility-weighted imaging can be used to verify that BBB disrup-tion has occurred and whether significant vascular damage hasoccurred, respectively. For tumors, it may be necessary to compare thesignal enhancement after contrast injection to measurements obtainedbefore FUS. Other imaging modalities may also be useful [177]. If thecontrast-enhanced imaging is obtained before the therapeutic agent isinjected, one can confirm that the BBB disruption is only occurring atthe targeted locations before administering the drug, providing anotherlevel of control to ensure that drugs are delivered only to desiredregions.
Post-treatment imaging could be more useful if one could use it toestimate drug uptake and penetration in the brain. This can be achieveddirectly by labeling the drug with a contrast agent for MRI or othermodality [146]. It might also be possible to use a standard contrastagent as a surrogate measurement. A number of studies have relatedsignal intensity changes of contrast-enhancedMRI at the end of the son-ication with tissue drug concentrations [83,147,178]. More quantitativeand repeatable techniques, such as estimating contrast agent concentra-tions via T1-mapping [115,179] or vascular transfer coefficients viaanalysis of dynamic contrast-enhanced MRI (DCE-MRI) [180] have
been used to perform spatial and temporal characterization of BBB per-meability. DCE-MRI can also predict the resulting payload of drugs tothe brain [96] and in some cases, in tumors [179]. Examples showingDCE-MRI evaluation of BBB disruption and its subsequent restorationover time, and its relationship to concentrations of doxorubicin areshown in Fig. 10. If one understands the relationship between the con-centrations of the therapeutic and the imaging contrast agent, whichcan perhaps be established in animals, one might be able to titrate thedrug administration to achieve a desired level in the brain. However,this may be challenging in tumors, where the vascular permeabilitycan change over time [179].
5. Going forward
Based on the extensive preclinical experiencedescribed above, alongwith recent studies in non-human primates [79,80] demonstrating thatthemethod can be “scaled up”without producing evident tissue damageor functional deficits even after repeated sessions [79], this method fortargeted drug delivery in the brain is ready in our view for initial safetytests in humans, where it will hopefully reveal its enormous potential.Clinical transcranial MRI-guided FUS systems [60,63] and commercially-available ultrasound contrast agents are available and can be used forthese tests. Given the huge clinical need and the existence of availableapproved anticancer agents that are expected to be effective if theycould be adequately delivered, brain tumors may be an appropriatetarget for these initial tests.
Given MRI's high cost and complexity, coupled with the need inmany cases to administer therapeutics over multiple sessions, it would
Fig. 8. Gene transfer to neurons, astrocytes, and oligodendrocytes after delivery of adeno-associated virus serotype 9 carrying the green fluorescent protein (GFP) to the mouse brainvia FUS-induced BBB disruption. Immunohistochemistry was used to detect GFP expression in hippocampus for (A) NeuN-positive cells (neurons, white arrows), and striatum for(B) GFAP-positive cells (astrocytes, white arrows) and (C) Olig2-positive cells (oligodendrocytes, white arrow).Modified from Human Gene Therapy 23:1144–1155 (November 2012); © 2012 Mary Ann Liebert, Inc.
11M. Aryal et al. / Advanced Drug Delivery Reviews xxx (2014) xxx–xxx
Please cite this article as: M. Aryal, et al., Ultrasound-mediated blood–brain barrier disruption for targeted drug delivery in the central nervoussystem, Adv. Drug Deliv. Rev. (2014), http://dx.doi.org/10.1016/j.addr.2014.01.008

be desirable in the long run to develop systems to provide FUS-inducedBBB outside of theMRI environment. Passive cavitationmonitoring and/or mapping may be the enabling technology for this translation awayfrom MRI guidance. One can envision systems that use pre-treatmentMRI and CT (to delineate different tissue structures and skull density,respectively), along with “frameless” navigation and cavitation moni-toring to provide routine BBB disruption in an outpatient facility. Anumber of technical developments, such as reducing targeting errorduring transcranial sonication, finding methods to easily register theposition of the skull within the FUS device without a stereotacticframe, and developing methods to better quantify acoustic emissionsmeasurements obtained through the thicker human skull, are neededto reach this goal. In our opinion, all of these things are achievable. Itwould also be desirable to remove the need to shave the head, whichis currently needed to allow for acoustic coupling. Attenuation shouldnot prevent this [181].
The potential of this technique to manipulate the amount of drugdelivered to each point in the brain can provide a level of control thatis not readily available with existing technologies. This control can beachieved by modulating the acoustic parameters to control the “level”
of the disruption, by analyzing the post-sonication contrast enhancementbefore injecting the drug and titrating the drug dose, or by repeatingsonication at select areas after some delay to lengthen the time the bar-rier is disrupted [96]. It might even be possible to tailor the sonicationparameters and BBB disruption to the molecular weight of the thera-peutic agent. These methods may enable “dose painting” that can giveclinicians new flexibility in how drugs are used in the CNS to maximizeefficacy and minimizing side effects. Further targeting and control canbe achieved by loading drugs into microbubbles [146,152–155] or byusing magnetic targeting after FUS-induced BBB disruption [144–146].
It will also be important to establish the feasibility and safety oftargeting very large volumes. Many promising applications of this tech-nology (brain tumors, Alzheimer's disease, etc.) will require sonicationover large portions of the brain for greatest effect. This can be achieved
Fig. 9. Comparison of MRI signal enhancement with microbubble acoustic emissions.(A)MRI signal enhancement afterGd-DTPA injection plotted as a function of theharmonicemissions signal strength measured with single-element detectors. A clear relationshipbetween the two measurements was observed with a good fit to an exponential. Theagreement appeared to hold among different animals and in cases where targets withlow-level harmonic emissions were sonicated a second time with either a higher powerlevel or an increased dose of microbubbles. Reprinted from PLoS ONE 7(9): e45783.http://dx.doi.org/10.1371/journal.pone.0045783; © 2012 Arvanitis et al. (B–C) Comparisonbetween MRI signal enhancement and passive cavitation mapping. (B) Map showing theenhancement relative to a pre-contrast image. (C) Fusion of passive acoustic map withthe T1-weighted MRI from (B). The red region shows the pixels in the cavitation mapwithin 95% of themaximumvalue. This region overlappedwith the contrast enhancement.The pixelwith themaximumcavitation activity is notedwith a “+”. The enhancement fromother targets sonicated in the same session is visible. (For interpretation of the references tocolor in this figure legend, the reader is referred to the web version of this article.)Modified from Phys Med Biol 58.14 (2013): 4749–61; © 2013 Institute of Physics andEngineering in Medicine.
Fig. 10.UsingDCE-MRI to evaluate FUS-BBB disruption. (A–B)Mean Ktrans valuesmeasuredvs. time from DCE-MRI in regions of interest at sonicated locations and in correspondingnon-sonicated structures in the contralateral hemisphere. The decay of K, which occurreddue to restoration of the BBB, was fit to an exponential decay (solid line; dotted lines:95% CI). (A) Decay after a single sonication. (B) Time course after two sonications separatedby 120 min. The second sonication increased the amount of time the barrier was disrupted.Values were significantly higher than in control locations in the contralateral hemisphere(**P b 0.01 and *P b 0.05). (C) DOX concentration achieved at the sonicated locations asfunction of Ktrans measured using DCE-MRI 30 min after sonication. The DOX concentrationwas measured approximately 16 h later for brain targets in single sonication (SS), singlesonication with hyperintense spots in T2* weighted image (SS (+T2*)), double sonicationwith 10 min interval (DS 10 min), and double sonication with 120 min interval (DS120 min). The solid line shows a linear regression of the data (slope: 28,824 ng/g DOXper change in Ktrans in min−1; intercept: 377 ng/g DOX; R: 0.7).Modified from Journal of Controlled Release 2012;162:134–142; © 2012 Elsevier B.V.
12 M. Aryal et al. / Advanced Drug Delivery Reviews xxx (2014) xxx–xxx
Please cite this article as: M. Aryal, et al., Ultrasound-mediated blood–brain barrier disruption for targeted drug delivery in the central nervoussystem, Adv. Drug Deliv. Rev. (2014), http://dx.doi.org/10.1016/j.addr.2014.01.008
by systematically focusing the ultrasound beam to a large number ofindividual targets. It should be possible to target the hundreds or thou-sands of focal points needed to achieve such large-scale BBB disruptionin a reasonable amount of time. Given the low duty cycle and minimalacoustic exposure levels needed to induce the effect, many targets canbe sonicated simultaneously. For example, with the low duty cycle need-ed to induce BBB disruption (1% or less), we can target 100 targets ormore with electronic beam steering with a phased array in the sameamount of time it currently takes to disrupt one location with the simplesystemweuse for small animal experiments.While again thiswill requiretechnical improvements and more safety tests, we expect that achievingcontrolled, large volume BBB disruption is achievable.
It would be helpful if the physical and/or physiological mechanismsby which the mechanical effects of FUS and microbubbles induce BBBdisruption were elucidated. Without knowledge of the mechanism,one can only speculate on how one can optimize the procedure, andwe are left with performing time-consuming parametric studies. Giventhe large parameter space in variables that can influence the magnitudeof the BBB disruption, it is possible that we have not stumbled uponparameters that can further improve upon the safe window where BBBdisruption is possible. Multidisciplinary approaches are very likely toprove fruitful and could potentially identify a unique physiologic mecha-nism, perhapswith interesting implications on the structure and functionof the vasculature in the CNS.
Other tissues have barriers similar to the BBB and could benefit fromsimilarmicrobubble-enhanced sonications or prove to be simplermodelsto study the aforementioned interactions. There is data demonstratingthat disruption of the blood–retinal [182] and blood–spinal cord [183]barriers can be disrupted by FUS, and that the glomerular function inthe kidney can be enhanced, presumably through changes in the“blood–urine barrier” [184]. Also, using pressure amplitudes higher thanare needed for FUS-induced BBB disruption, one can use microbubble-enhanced sonications for ablation [185], thrombolysis [186], orradiosensitization [187]. One can potentially combine one of thesemicrobubble-enhanced therapieswith BBBdisruption to produce a syn-ergistic effect or to deliver therapeutics in the surrounding tissues.
The clinical need for new approaches to bypass the BBB in order toincrease the number of drugs that can be used effectively in the CNS istremendous. In addition to CNS disorders such as brain tumors, stroke,trauma, and genetic neurodegenerative disorders, opportunities mayexist for awide range of other applications. Examples include painman-agement, and psychological disorders such as addiction, both of whichmay benefit from a technology that permits drug transport to precisetargets in the brain. Existing drugs for these conditions can have severeside effects that limit their use. With an ever-growing knowledge ofbrain function and dysfunction, precise drug targeting in the CNS mayprove to be particularly important. Technical improvements that areachievable in our view could enable FUS to be used on a wide scale forroutine targeted drug delivery to the CNS.
6. Conclusion
FUS is a unique technology that can induce BBB or BTB perme-abilization that is targeted, noninvasive and transient. Extensive workin preclinical studies has demonstrated that it can enable the deliveryof therapeutics that normally do not reach the brain, and enhancetheir delivery to brain tumors. The sonications do not appear to haveanydeleterious effects on the brain, and themethod is readily repeatable.MRI and acoustic methods to plan, monitor, and evaluate the treatmentoffer the possibility of having control over where drugs are deliveredand in what concentration. Given the availability of clinical FUS devicescapable of focusing ultrasound through the intact human skull, alongwith recent safety studies demonstrating the method can be performedsafely in nonhuman primates, it appears that the method is ready forinitial clinical tests.
References
[1] E.A. Neuwelt, B. Bauer, C. Fahlke, G. Fricker, C. Iadecola, D. Janigro, L. Leybaert, Z.Molnar, M.E. O'Donnell, J.T. Povlishock, N.R. Saunders, F. Sharp, D. Stanimirovic,R.J. Watts, L.R. Drewes, Engaging neuroscience to advance translational researchin brain barrier biology, Nat. Rev. Neurosci. 12 (2011) 169–182.
[2] N.J. Abbott, I.A. Romero, Transporting therapeutics across the blood–brain barrier,Mol. Med. Today 2 (1996) 106–113.
[3] W.M. Pardridge, Molecular biology of the blood–brain barrier, Mol. Biotechnol. 30(2005) 57–70.
[4] A.F. Eichler, E. Chung, D.P. Kodack, J.S. Loeffler, D. Fukumura, R.K. Jain, The biologyof brain metastases—translation to new therapies, Nat. Rev. Clin. Oncol. 8 (2011)344–356.
[5] G. Minniti, D. Amelio, M. Amichetti, M. Salvati, R. Muni, A. Bozzao, G. Lanzetta, S.Scarpino, A. Arcella, R.M. Enrici, Patterns of failure and comparison of differenttarget volume delineations in patients with glioblastoma treated with conformalradiotherapy plus concomitant and adjuvant temozolomide, Radiother. Oncol. 97(2010) 377–381.
[6] M.C. Dobelbower, O.L. Burnett Iii, R.A. Nordal, L.B. Nabors, J.M. Markert, M.D. Hyatt,J.B. Fiveash, Patterns of failure for glioblastoma multiforme following concurrentradiation and temozolomide, J. Med. Imaging Radiat. Oncol. 55 (2011) 77–81.
[7] M.C. Chamberlain, Radiographic patterns of relapse in glioblastoma, J. Neurooncol.101 (2011) 319–323.
[8] D. Fukumura, R.K. Jain, Tumor microenvironment abnormalities: causes, conse-quences, and strategies to normalize, J. Cell. Biochem. 101 (2007) 937–949.
[9] A. Regina, M. Demeule, A. Laplante, J. Jodoin, C. Dagenais, F. Berthelet, A. Moghrabi,R. Beliveau, Multidrug resistance in brain tumors: roles of the blood–brain barrier,Cancer Metastasis Rev. 20 (2001) 13–25.
[10] P.R. Lockman, R.K. Mittapalli, K.S. Taskar, V. Rudraraju, B. Gril, K.A. Bohn, C.E. Adkins,A. Roberts, H.R. Thorsheim, J.A. Gaasch, S. Huang, D. Palmieri, P.S. Steeg, Q.R. Smith,Heterogeneousblood–tumor barrier permeability determines drug efficacy in exper-imental brain metastases of breast cancer, Clin. Cancer Res. 16 (2010) 5664–5678.
[11] D.R. Groothuis, The blood–brain and blood–tumor barriers: a review of strategiesfor increasing drug delivery, Neuro Oncol. 2 (2000) 45–59.
[12] W.M. Pardridge, Blood–brain barrier delivery, DrugDiscov. Today 12 (2007) 54–61.[13] J.P. Blumling Iii, G.A. Silva, Targeting the brain: advances in drug delivery, Curr.
Pharm. Biotechnol. 13 (2012) 2417–2426.[14] T. Tomita, Interstitial chemotherapy for brain tumors: review, J. Neurooncol. 10
(1991) 57–74.[15] R.H. Bobo, D.W. Laske, A. Akbasak, P.F. Morrison, R.L. Dedrick, E.H. Oldfield,
Convection-enhanced delivery of macromolecules in the brain, Proc. Natl. Acad.Sci. U. S. A. 91 (1994) 2076–2080.
[16] C. Guerin, A. Olivi, J.D. Weingart, H.C. Lawson, H. Brem, Recent advances in braintumor therapy: local intracerebral drug delivery by polymers, Invest. New Drugs22 (2004) 27–37.
[17] H. Brem, P. Gabikian, Biodegradable polymer implants to treat brain tumors,J. Control. Release 74 (2001) 63–67.
[18] L.K. Fung, M. Shin, B. Tyler, H. Brem, W.M. Saltzman, Chemotherapeutic drugsreleased from polymers: distribution of 1,3-bis(2-chloroethyl)-1-nitrosourea inthe rat brain, Pharm. Res. 13 (1996) 671–682.
[19] J. Voges, R. Reszka, A. Gossmann, C. Dittmar, R. Richter, G. Garlip, L. Kracht, H.H.Coenen, V. Sturm, K. Wienhard, W.D. Heiss, A.H. Jacobs, Imaging-guided convection-enhanced delivery and gene therapy of glioblastoma, Ann. Neurol. 54 (2003)479–487.
[20] G. Fleischhack, U. Jaehde, U. Bode, Pharmacokinetics following intraventricularadministration of chemotherapy in patients with neoplastic meningitis, Clin.Pharmacokinet. 44 (2005) 1–31.
[21] L. Illum, Nasal drug delivery—possibilities, problems and solutions, J. Control.Release 87 (2003) 187–198.
[22] L. Illum, Nasal drug delivery: new developments and strategies, Drug Discov. Today7 (2002) 1184–1189.
[23] M.I. Ugwoke, R.U. Agu, N. Verbeke, R. Kinget, Nasal mucoadhesive drug delivery:background, applications, trends and future perspectives, Adv. Drug Deliv. Rev.57 (2005) 1640–1665.
[24] A. Pires, A. Fortuna, G. Alves, A. Falcao, Intranasal drug delivery: how, why andwhat for? J. Pharm. Pharm. Sci. 12 (2009) 288–311.
[25] W.H. Oldendorf, S. Hyman, L. Braun, S.Z. Oldendorf, Blood–brain barrier: penetrationof morphine, codeine, heroin, and methadone after carotid injection, Science 178(1972) 984–986.
[26] N.J. Abbott, A.A. Patabendige, D.E. Dolman, S.R. Yusof, D.J. Begley, Structure andfunction of the blood–brain barrier, Neurobiol. Dis. 37 (2010) 13–25.
[27] E.Y. Zhang, G.T. Knipp, S. Ekins, P.W. Swaan, Structural biology and function ofsolute transporters: implications for identifying and designing substrates, DrugMetab. Rev. 34 (2002) 709–750.
[28] W.M. Pardridge, Blood–brain barrier drug targeting: the future of brain drug devel-opment, Mol. Interv. 3 (2003) 90–105(51).
[29] W.M. Pardridge, Drug targeting to the brain, Pharm. Res. 24 (2007) 1733–1744.[30] P. Blasi, S. Giovagnoli, A. Schoubben, M. Ricci, C. Rossi, Solid lipid nanoparticles for
targeted brain drug delivery, Adv. Drug Deliv. Rev. 59 (2007) 454–477.[31] J.C. Olivier, Drug transport to brain with targeted nanoparticles, NeuroRx 2 (2005)
108–119.[32] A. Schnyder, J. Huwyler, Drug transport to brain with targeted liposomes, NeuroRx
2 (2005) 99–107.[33] R.D. Broadwell, B.J. Balin, M. Salcman, Transcytotic pathway for blood-borne
protein through the blood–brain barrier, Proc. Natl. Acad. Sci. U. S. A. 85 (1988)632–636.
13M. Aryal et al. / Advanced Drug Delivery Reviews xxx (2014) xxx–xxx
Please cite this article as: M. Aryal, et al., Ultrasound-mediated blood–brain barrier disruption for targeted drug delivery in the central nervoussystem, Adv. Drug Deliv. Rev. (2014), http://dx.doi.org/10.1016/j.addr.2014.01.008

[34] I. Mellman, Endocytosis andmolecular sorting, Annu. Rev. Cell Dev. Biol. 12 (1996)575–625.
[35] S. Mukherjee, R.N. Ghosh, F.R. Maxfield, Endocytosis, Physiol. Rev. 77 (1997)759–803.
[36] S.I. Rapoport, Effect of concentrated solutions on blood–brain barrier, Am. J.Physiol. 219 (1970) 270–274.
[37] S.I. Rapoport, Advances in osmotic opening of the blood–brain barrier to enhanceCNS chemotherapy, Expert. Opin. Investig. Drugs 10 (2001) 1809–1818.
[38] R.A. Kroll, E.A. Neuwelt, Outwitting the blood–brain barrier for therapeuticpurposes: osmotic opening and othermeans, Neurosurgery 42 (1998) 1083–1099.
[39] M.A. Bellavance, M. Blanchette, D. Fortin, Recent advances in blood–brain barrierdisruption as a CNS delivery strategy, AAPS J. 10 (2008) 166–177.
[40] N.D. Doolittle, M.E. Miner, W.A. Hall, T. Siegal, E. Jerome, E. Osztie, L.D. McAllister,J.S. Bubalo, D.F. Kraemer, D. Fortin, R. Nixon, L.L. Muldoon, E.A. Neuwelt, Safetyand efficacy of amulticenter study using intraarterial chemotherapy in conjunctionwith osmotic opening of the blood–brain barrier for the treatment of patients withmalignant brain tumors, Cancer 88 (2000) 637–647.
[41] W.A. Hall, N.D. Doolittle, M. Daman, P.K. Bruns, L. Muldoon, D. Fortin, E.A. Neuwelt,Osmotic blood–brain barrier disruption chemotherapy for diffuse pontine gliomas,J. Neurooncol. 77 (2006) 279–284.
[42] K. Jahnke,D.F. Kraemer, K.R. Knight, D. Fortin, S. Bell, N.D. Doolittle, L.L.Muldoon, E.A.Neuwelt, Intraarterial chemotherapy andosmotic blood–brain barrier disruption forpatients with embryonal and germ cell tumors of the central nervous system,Cancer 112 (2008) 581–588.
[43] L. Angelov, N.D. Doolittle, D.F. Kraemer, T. Siegal, G.H. Barnett, D.M. Peereboom, G.Stevens, J. McGregor, K. Jahnke, C.A. Lacy, N.A. Hedrick, E. Shalom, S. Ference, S. Bell,L. Sorenson, R.M. Tyson, M. Haluska, E.A. Neuwelt, Blood–brain barrier disruptionand intra-arterial methotrexate-based therapy for newly diagnosed primary CNSlymphoma: a multi-institutional experience, J. Clin. Oncol. 27 (2009) 3503–3509.
[44] J.A. Boockvar, A.J. Tsiouris, C.P. Hofstetter, I. Kovanlikaya, S. Fralin, K. Kesavabhotla,S.M. Seedial, S.C. Pannullo, T.H. Schwartz, P. Stieg, R.D. Zimmerman, J. Knopman,R.J. Scheff, P. Christos, S. Vallabhajosula, H.A. Riina, Safety and maximum tolerateddose of superselective intraarterial cerebral infusion of bevacizumab after osmoticblood–brain barrier disruption for recurrent malignant glioma. Clinical article,J. Neurosurg. 114 (2011) 624–632.
[45] D.J. Guillaume, N.D. Doolittle, S. Gahramanov, N.A. Hedrick, J.B. Delashaw, E.A.Neuwelt, Intra-arterial chemotherapy with osmotic blood–brain barrier disruptionfor aggressive oligodendroglial tumors: results of a phase I study, Neurosurgery 66(2010) 48–58.
[46] T. Inamura, T. Nomura, K. Ikezaki, M. Fukui, G. Pollinger, K.L. Black, Intracarotidhistamine infusion increases blood tumour permeability in RG2 glioma, Neurol.Res. 16 (1994) 125–128.
[47] M. Gutman, R. Laufer, A. Eisenthal, G. Goldman, A. Ravid, M. Inbar, J.M. Klausner,Increased microvascular permeability induced by prolonged interleukin-2 admin-istration is attenuated by the oxygen-free-radical scavenger dimethylthiourea,Cancer Immunol. Immunother. 43 (1996) 240–244.
[48] K.L. Black, C.C. Chio, Increased opening of blood–tumour barrier by leukotriene C4is dependent on size of molecules, Neurol. Res. 14 (1992) 402–404.
[49] H.E. de Vries, M.C. Blom-Roosemalen, M. van Oosten, A.G. de Boer, T.J. van Berkel,D.D. Breimer, J. Kuiper, The influence of cytokines on the integrity of the blood–brain barrier in vitro, J. Neuroimmunol. 64 (1996) 37–43.
[50] J.G. Lynn, T.J. Putnam, Histology of cerebral lesions produced by focused ultra-sound, Am. J. Pathol. 20 (1944) 637–652.
[51] W.J. Fry, F.J. Fry, Fundamental neurological research and human neurosurgeryusing intense ultrasound, IRE Trans. Med. Electron. ME-7 (1960) 166–181.
[52] H.T. Ballantine, E. Bell, J. Manlapaz, Progress and problems in the neurologicalapplications of focused ultrasound, J. Neurosurg. 17 (1960) 858–876.
[53] P.P. Lele, Effects of ultrasound on “solid”mammalian tissues and tumors in vivo, in:M.H. Repacholi, M. Grondolfo, A. Rindi (Eds.), Ultrasound: Medical Applications,Biological Effects and Hazard Potential, Plenum Pub. Corp, New York, 1987,pp. 275–306.
[54] R. Meyers, W.J. Fry, F.J. Fry, L.L. Dreyer, D.F. Shultz, R.F. Noyes, Early experienceswith ultrasonic irradiation of the pallidfugal and nigral complexes in hyperkineticand hypertonic disorders, J. Neurosurg. 16 (1959) 32–54.
[55] R.F. Heimburger, Ultrasound augmentation of central nervous system tumor therapy,Indiana Med. 78 (1985) 469–476.
[56] K.Hynynen, N.McDannold,MRI guided andmonitored focused ultrasound thermalablation methods: a review of progress, Int. J. Hyperthermia 20 (2004) 725–737.
[57] G.T. Clement, K. Hynynen, A non-invasive method for focusing ultrasound throughthe human skull, Phys. Med. Biol. 47 (2002) 1219–1236.
[58] J.F. Aubry, M. Tanter, M. Pernot, J.L. Thomas, M. Fink, Experimental demonstrationof noninvasive transskull adaptive focusing based on prior computed tomographyscans, J. Acoust. Soc. Am. 113 (2003) 84–93.
[59] Y. Ishihara, A. Calderon, H. Watanabe, K. Okamoto, Y. Suzuki, K. Kuroda, A preciseand fast temperature mapping using water proton chemical shift, Magn. Reson.Med. 34 (1995) 814–823.
[60] N. McDannold, G.T. Clement, P. Black, F. Jolesz, K. Hynynen, Transcranial magneticresonance imaging-guided focused ultrasound surgery of brain tumors: initialfindings in 3 patients, Neurosurgery 66 (2010) 323–332.
[61] N. Lipsman, M.L. Schwartz, Y. Huang, L. Lee, T. Sankar, M. Chapman, K. Hynynen,A.M. Lozano, MR-guided focused ultrasound thalamotomy for essential tremor: aproof-of-concept study, Lancet Neurol. 12 (2013) 462–468.
[62] W.J. Elias, D. Huss, T. Voss, J. Loomba, M. Khaled, E. Zadicario, R.C. Frysinger, S.A.Sperling, S. Wylie, S.J. Monteith, J. Druzgal, B.B. Shah, M. Harrison, M.Wintermark, A pilot study of focused ultrasound thalamotomy for essential tremor,N. Engl. J. Med. 369 (2013) 640–648.
[63] E. Martin, D. Jeanmonod, A. Morel, E. Zadicario, B. Werner, High-intensity focusedultrasound for noninvasive functional neurosurgery, Ann. Neurol. 66 (2009)858–861.
[64] W.L. Nyborg, P.L. Carson, E.L. Carstensen, F. Dunn, D.L. Miller, M.W. Miller, H.E.Thompson, M.C. Ziskin, R.E. Apfel, C.C. Church, L.A. Crum, Exposure Criteria forMedical Diagnostic Ultrasound: II. Criteria Based on All Known Mechanisms (NCRPReport No. 140), National Council on Radiation Protection and Measurements,Bethesda, Maryland, 2002.
[65] T.G. Leighton, The Acoustic Bubble, Academic Press Limited, San Diego, CA, 1994.[66] P. Dayton, A. Klibanov, G. Brandenburger, K. Ferrara, Acoustic radiation force
in vivo: a mechanism to assist targeting of microbubbles, Ultrasound Med. Biol.25 (1999) 1195–1201.
[67] D.L. Miller, Particle gathering and microstreaming near ultrasonically activatedgas-filled micropores, J. Acoust. Soc. Am. 84 (1988) 1378–1387.
[68] P.D. Edmonds, K.M. Sancier, Evidence for free radical production by ultrasoniccavitation in biological media, Ultrasound Med. Biol. 9 (1983) 635–639.
[69] H.G. Flynn, Generation of transient cavities in liquids by microsecond pulses ofultrasound, J. Acoust. Soc. Am. 72 (1982) 1926–1932.
[70] R.E. Apfel, Acoustic cavitation: a possible consequence of biomedical uses ofultrasound, Br. J. Cancer Suppl. 45 (1982) 140–146.
[71] L. Bakay, T.F. Hueter, H.T. Ballantine, D. Sosa, Ultrasonically produced changes inthe blood–brain barrier, Arch. Neurol. 76 (1956) 457–467.
[72] N. Vykhodtseva, Effects of high intensity pulsed ultrasound on brain tissues, The5th International Symposium on Ultrasound in Biol Med. Puschino, Russia, 1981,pp. 95–97.
[73] J.T. Patrick, M.N. Nolting, S.A. Goss, K.A. Dines, J.L. Clendenon, M.A. Rea, R.F.Heimburger, Ultrasound and the blood–brain barrier, Adv. Exp. Med. Biol. 267(1990) 369–381.
[74] N.I. Vykhodtseva, K. Hynynen, C. Damianou, Histologic effects of high intensitypulsed ultrasound exposure with subharmonic emission in rabbit brain in vivo,Ultrasound Med. Biol. 21 (1995) 969–979.
[75] A.H. Mesiwala, L. Farrell, H.J. Wenzel, D.L. Silbergeld, L.A. Crum, H.R. Winn, P.D.Mourad, High-intensity focused ultrasound selectively disrupts the blood–brainbarrier in vivo, Ultrasound Med. Biol. 28 (2002) 389–400.
[76] N. McDannold, N. Vykhodtseva, F.A. Jolesz, K. Hynynen, MRI investigation of thethreshold for thermally induced blood–brain barrier disruption and brain tissuedamage in the rabbit brain, Magn. Reson. Med. 51 (2004) 913–923.
[77] K. Hynynen, N. McDannold, N. Vykhodtseva, F.A. Jolesz, Noninvasive MRimaging-guided focal opening of the blood–brain barrier in rabbits, Radiology220 (2001) 640–646.
[78] N. Sheikov, N.McDannold, N. Vykhodtseva, F. Jolesz, K.Hynynen, Cellularmechanismsof the blood–brain barrier opening induced by ultrasound in presence ofmicrobubbles, Ultrasound Med. Biol. 30 (2004) 979–989.
[79] N.McDannold, C.D. Arvanitis, N. Vykhodtseva,M.S. Livingstone, Temporarydisruptionof the blood–brain barrier by use of ultrasound andmicrobubbles: safety and efficacyevaluation in rhesus macaques, Cancer Res. 72 (2012) 3652–3663.
[80] F. Marquet, Y.S. Tung, T. Teichert, V.P. Ferrera, E.E. Konofagou, Noninvasive,transient and selective blood–brain barrier opening in non-human primatesin vivo, PLoS One 6 (2011) e22598.
[81] M.A. O'Reilly, Y. Huang, K. Hynynen, The impact of standing wave effects ontranscranial focused ultrasound disruption of the blood–brain barrier in a ratmodel, Phys. Med. Biol. 55 (2010) 5251–5267.
[82] K. Hynynen, N. McDannold, N.A. Sheikov, F.A. Jolesz, N. Vykhodtseva, Local andreversible blood–brain barrier disruption by noninvasive focused ultrasound atfrequencies suitable for trans-skull sonications, Neuroimage 24 (2005) 12–20.
[83] L.H. Treat, N. McDannold, Y. Zhang, N. Vykhodtseva, K. Hynynen, Targeted deliveryof doxorubicin to the rat brain at therapeutic levels using MRI-guided focusedultrasound, Int. J. Cancer 121 (2007) 901–907.
[84] R. Chopra, N. Vykhodtseva, K. Hynynen, Influence of exposure time and pressureamplitude on blood–brain-barrier openingusing transcranial ultrasound exposures,ACS Chem. Neurosci. 1 (2010) 391–398.
[85] N. McDannold, N. Vykhodtseva, K. Hynynen, Blood–brain barrier disruptioninduced by focused ultrasound and circulating preformed microbubbles appears tobe characterized by themechanical index, UltrasoundMed. Biol. 34 (2008) 834–840.
[86] N. McDannold, N. Vykhodtseva, K. Hynynen, Effects of acoustic parameters andultrasound contrast agent dose on focused-ultrasound induced blood–brain barrierdisruption, Ultrasound Med. Biol. 34 (2008) 930–937.
[87] J.J. Choi, J.A. Feshitan, B. Baseri, S. Wang, Y.S. Tung, M.A. Borden, E.E. Konofagou,Microbubble-size dependence of focused ultrasound-induced blood–brain barrieropening in mice in vivo, IEEE Trans. Biomed. Eng. 57 (2010) 145–154.
[88] F. Vlachos, Y.S. Tung, E. Konofagou, Permeability dependence study of the focusedultrasound-induced blood–brain barrier opening at distinct pressures andmicrobubble diameters using DCE-MRI, Magn. Reson. Med. 66 (2011) 821–830.
[89] G. Samiotaki, F. Vlachos, Y.S. Tung, E.E. Konofagou, A quantitative pressure andmicrobubble-size dependence studyof focusedultrasound-induced blood–brain bar-rier opening reversibility in vivo using MRI, Magn. Reson. Med. 67 (2012) 769–777.
[90] J.J. Choi, K. Selert, Z. Gao, G. Samiotaki, B. Baseri, E.E. Konofagou, Noninvasive andlocalized blood–brain barrier disruption using focused ultrasound can be achievedat short pulse lengths and low pulse repetition frequencies, J. Cereb. Blood FlowMetab. 31 (2011) 725–737.
[91] J.J. Choi, K. Selert, F. Vlachos, A. Wong, E.E. Konofagou, Noninvasive and localizedneuronal delivery using short ultrasonic pulses and microbubbles, Proc. Natl.Acad. Sci. U. S. A. 108 (2011) 16539–16544.
[92] K.F. Bing, G.P. Howles, Y. Qi, M.L. Palmeri, K.R. Nightingale, Blood–brain barrier(BBB) disruption using a diagnostic ultrasound scanner and Definity inmice, Ultra-sound Med. Biol. 35 (2009) 1298–1308.
14 M. Aryal et al. / Advanced Drug Delivery Reviews xxx (2014) xxx–xxx
Please cite this article as: M. Aryal, et al., Ultrasound-mediated blood–brain barrier disruption for targeted drug delivery in the central nervoussystem, Adv. Drug Deliv. Rev. (2014), http://dx.doi.org/10.1016/j.addr.2014.01.008

[93] F.Y. Yang, W.M. Fu, R.S. Yang, H.C. Liou, K.H. Kang, W.L. Lin, Quantitative evaluationof focused ultrasound with a contrast agent on blood–brain barrier disruption,Ultrasound Med. Biol. 33 (2007) 1421–1427.
[94] J.C. Weng, S.K. Wu, W.L. Lin, W.Y. Tseng, Detecting blood–brain barrier disruptionwithin minimal hemorrhage following transcranial focused ultrasound: a correla-tion study with contrast-enhanced MRI, Magn. Reson. Med. 65 (2011) 802–811.
[95] J.C. Weng, S.K. Wu, F.Y. Yang, W.L. Lin, W.Y. Tseng, Pulse sequence and timing ofcontrast-enhancedMRI for assessingblood–brain barrier disruption after transcranialfocused ultrasound in the presence of hemorrhage, J. Magn. Reson. Imaging 31(2010) 1323–1330.
[96] J. Park, Y. Zhang, N. Vykhodtseva, F.A. Jolesz, N.J. McDannold, The kinetics of bloodbrain barrier permeability and targeted doxorubicin delivery into brain induced byfocused ultrasound, J. Control. Release 162 (2012) 134–142.
[97] F.Y. Yang, Y.S. Lin, K.H. Kang, T.K. Chao, Reversible blood–brain barrier disruptionby repeated transcranial focused ultrasound allows enhanced extravasation,J. Control. Release 150 (2011) 111–116.
[98] M.A. O'Reilly, A.C. Waspe, M. Ganguly, K. Hynynen, Focused-ultrasound disruptionof the blood–brain barrier using closely-timed short pulses: influence of sonicationparameters and injection rate, Ultrasound Med. Biol. 37 (2011) 587–594.
[99] N. McDannold, Y. Zhang, N. Vykhodtseva, Blood–brain barrier disruption andvascular damage induced by ultrasound bursts combined with microbubbles canbe influenced by choice of anesthesia protocol, Ultrasound Med. Biol. 37 (2011)1259–1270.
[100] J.E. Wang, Y.H. Liu, L.B. Liu, C.Y. Xia, Z. Zhang, Y.X. Xue, Effects of combining lowfrequency ultrasound irradiation with papaverine on the permeability of theblood–tumor barrier, J. Neurooncol. 102 (2) (2010) 213–224.
[101] Z. Zhang, C. Xia, Y. Xue, Y. Liu, Synergistic effect of low-frequency ultrasound andlow-dose bradykinin on increasing permeability of the blood–tumor barrier byopening tight junction, J. Neurosci. Res. 87 (2009) 2282–2289.
[102] Z. Zhang, Y. Xue, Y. Liu, X. Shang, Additive effect of low-frequency ultrasound andendothelial monocyte-activating polypeptide II on blood–tumor barrier in ratswith brain glioma, Neurosci. Lett. 481 (2010) 21–25.
[103] D.E. Goertz, C. Wright, K. Hynynen, Contrast agent kinetics in the rabbit brainduring exposure to therapeutic ultrasound, Ultrasound Med. Biol. 36 (2010)916–924.
[104] H.L. Liu, C.H. Pan, C.Y. Ting, M.J. Hsiao, Opening of the blood–brain barrier by low-frequency (28-kHz) ultrasound: a novel pinhole-assisted mechanical scanningdevice, Ultrasound Med. Biol. 36 (2010) 325–335.
[105] N. McDannold, N. Vykhodtseva, K. Hynynen, Targeted disruption of the blood–brain barrier with focused ultrasound: association with cavitation activity, Phys.Med. Biol. 51 (2006) 793–807.
[106] Y.S. Tung, F. Vlachos, J.J. Choi, T. Deffieux, K. Selert, E.E. Konofagou, In vivo transcranialcavitation threshold detection during ultrasound-induced blood–brain barrieropening in mice, Phys. Med. Biol. 55 (2010) 6141–6155.
[107] C.D. Arvanitis, M.S. Livingstone, N. Vykhodtseva, N. McDannold, Controlledultrasound-induced blood–brain barrier disruption using passive acoustic emis-sions monitoring, PLoS One 7 (2012) e45783.
[108] C.X. Deng, F. Sieling, H. Pan, J. Cui, Ultrasound-induced cell membrane porosity,Ultrasound Med. Biol. 30 (2004) 519–526.
[109] N. Sheikov, N. McDannold, S. Sharma, K. Hynynen, Effect of focused ultrasoundapplied with an ultrasound contrast agent on the tight junctional integrityof the brain microvascular endothelium, Ultrasound Med. Biol. 34 (2008)1093–1104.
[110] N. Sheikov, N. McDannold, F. Jolesz, Y.Z. Zhang, K. Tam, K. Hynynen, Brain arteriolesshowmore active vesicular transport of blood-borne tracermolecules than capillariesand venules after focused ultrasound-evoked opening of the blood–brain barrier,Ultrasound Med. Biol. 32 (2006) 1399–1409.
[111] S.B. Raymond, J. Skoch, K. Hynynen, B.J. Bacskai, Multiphoton imaging of ultrasound/Optison mediated cerebrovascular effects in vivo, J. Cereb. Blood Flow Metab. 27(2007) 393–403.
[112] E.E. Cho, J. Drazic, M. Ganguly, B. Stefanovic, K. Hynynen, Two-photon fluorescencemicroscopy study of cerebrovascular dynamics in ultrasound-induced blood–brainbarrier opening, J. Cereb. Blood Flow Metab. 31 (2011) 1852–1862.
[113] H. Chen,W. Kreider, A.A. Brayman,M.R. Bailey, T.J.Matula, Blood vessel deformationson microsecond time scales by ultrasonic cavitation, Phys. Rev. Lett. 106 (2011)034301.
[114] E. Sassaroli, K. Hynynen, Resonance frequency of microbubbles in small bloodvessels: a numerical study, Phys. Med. Biol. 50 (2005) 5293–5305.
[115] B. Marty, B. Larrat, M. Van Landeghem, C. Robic, P. Robert, M. Port, D. Le Bihan, M.Pernot, M. Tanter, F. Lethimonnier, S. Meriaux, Dynamic study of blood–brainbarrier closure after its disruption using ultrasound: a quantitative analysis, J. Cereb.Blood Flow Metab. 32 (2012) 1948–1958.
[116] G.P. Howles, K.F. Bing, Y. Qi, S.J. Rosenzweig, K.R. Nightingale, G.A. Johnson,Contrast-enhanced in vivo magnetic resonance microscopy of the mouse brainenabled by noninvasive opening of the blood–brain barrier with ultrasound,Magn. Reson. Med. 64 (2010) 995–1004.
[117] B. Baseri, J.J. Choi, Y.S. Tung, E.E. Konofagou, Multi-modality safety assessment ofblood–brain barrier opening using focused ultrasound and Definity microbubbles:a short-term study, Ultrasound Med. Biol. 36 (2010) 1445–1459.
[118] N. McDannold, N. Vykhodtseva, S. Raymond, F.A. Jolesz, K. Hynynen, MRI-guidedtargeted blood–brain barrier disruption with focused ultrasound: histologicalfindings in rabbits, Ultrasound Med. Biol. 31 (2005) 1527–1537.
[119] H.L. Liu, Y.Y. Wai, W.S. Chen, J.C. Chen, P.H. Hsu, X.Y. Wu, W.C. Huang, T.C. Yen, J.J.Wang, Hemorrhage detection during focused-ultrasound induced blood–brain-barrier opening by using susceptibility-weighted magnetic resonance imaging,Ultrasound Med. Biol. 34 (2008) 598–606.
[120] K. Hynynen, N. McDannold, N. Vykhodtseva, S. Raymond, R. Weissleder, F.A. Jolesz,N. Sheikov, Focal disruption of the blood–brain barrier due to 260-kHz ultrasoundbursts: a method for molecular imaging and targeted drug delivery, J. Neurosurg.105 (2006) 445–454.
[121] H.L. Liu, Y.Y. Wai, P.H. Hsu, L.A. Lyu, J.S. Wu, C.R. Shen, J.C. Chen, T.C. Yen, J.J. Wang,In vivo assessment of macrophage CNS infiltration during disruption of the blood–brain barrier with focused ultrasound: a magnetic resonance imaging study,J. Cereb. Blood Flow Metab. 30 (2010) 674.
[122] X. Shang, P.Wang, Y. Liu, Z. Zhang, Y. Xue,Mechanismof low-frequency ultrasound inopening blood–tumor barrier by tight junction, J. Mol. Neurosci. 43 (2011) 364–369.
[123] A. Alonso, E. Reinz, J.W. Jenne, M. Fatar, H. Schmidt-Glenewinkel, M.G. Hennerici, S.Meairs, Reorganization of gap junctions after focused ultrasound blood–brainbarrier opening in the rat brain, J. Cereb. Blood FlowMetab. 30 (2010) 1394–1402.
[124] J. Deng, Q. Huang, F. Wang, Y. Liu, Z. Wang, Z. Wang, Q. Zhang, B. Lei, Y. Cheng, Therole of caveolin-1 in blood–brain barrier disruption induced by focused ultrasoundcombined with microbubbles, J. Mol. Neurosci. 46 (2012) 677–687.
[125] C.Y. Xia, Y.H. Liu, P.Wang, Y.X. Xue, Low-frequency ultrasound irradiation increasesblood–tumor barrier permeability by transcellular pathway in a rat glioma model,J. Mol. Neurosci. 48 (1) (2012) 281–290.
[126] A.N. Shajahan, C. Tiruppathi, A.V. Smrcka, A.B. Malik, R.D. Minshall, Gbetagammaactivation of Src induces caveolae-mediated endocytosis in endothelial cells,J. Biol. Chem. 279 (2004) 48055–48062.
[127] S. Jalali, Y. Huang, D.J. Dumont, K. Hynynen, Focused ultrasound-mediated BBBdisruption is associated with an increase in activation of Akt: experimental studyin rats, BMC Neurol. 10 (2010) 114.
[128] H. Zhao, R.M. Sapolsky, G.K. Steinberg, Phosphoinositide-3-kinase/Akt survivalsignal pathways are implicated in neuronal survival after stroke, Mol. Neurobiol.34 (2006) 249–270.
[129] R. Nath, K. McGinnis, S. Dutta, B. Shivers, K.K. Wang, Inhibition of p38 kinasemimics survival signal-linked protection against apoptosis in rat cerebellar granuleneurons, Cell. Mol. Biol. Lett. 6 (2001) 173–184.
[130] J. Harada,M. Sugimoto, An inhibitor of p38 and JNKMAPkinases prevents activationof caspase and apoptosis of cultured cerebellar granule neurons, Jpn. J. Pharmacol.79 (1999) 369–378.
[131] A. Alonso, E. Reinz, M. Fatar, J. Jenne, M.G. Hennerici, S. Meairs, Neurons but notglial cells overexpress ubiquitin in the rat brain following focused ultrasound-induced opening of the blood–brain barrier, Neuroscience 169 (2010) 116–124.
[132] J. Park, Z. Fan, R.E. Kumon, M.E. El Sayed, C.X. Deng, Modulation of intracellularCa2+ concentration in brain microvascular endothelial cells in vitro by acousticcavitation, Ultrasound Med. Biol. 36 (2010) 1176–1187.
[133] J. Park, Z. Fan, C.X. Deng, Effects of shear stress cultivation on cell membranedisruption and intracellular calcium concentration in sonoporation of endothelialcells, J. Biomech. 44 (2011) 164–169.
[134] C. Ayata, H.K. Shin, S. Salomone, Y. Ozdemir-Gursoy, D.A. Boas, A.K. Dunn, M.A.Moskowitz, Pronounced hypoperfusion during spreading depression in mousecortex, J. Cereb. Blood Flow Metab. 24 (2004) 1172–1182.
[135] A. Burgess, Y. Huang, W. Querbes, D.W. Sah, K. Hynynen, Focused ultrasound fortargeted delivery of siRNA and efficient knockdown of Htt expression, J. Control.Release 163 (2012) 125–129.
[136] J.J. Choi, S. Wang, Y.S. Tung, B. Morrison III, E.E. Konofagou, Molecules of variouspharmacologically-relevant sizes can cross the ultrasound-induced blood–brainbarrier opening in vivo, Ultrasound Med. Biol. 36 (2010) 58–67.
[137] L.L. Muldoon, M.A. Pagel, R.A. Kroll, S. Roman-Goldstein, R.S. Jones, E.A. Neuwelt, Aphysiological barrier distal to the anatomic blood–brain barrier in a model oftransvascular delivery, AJNR Am. J. Neuroradiol. 20 (1999) 217–222.
[138] H.L. Liu,M.Y. Hua, P.Y. Chen, P.C. Chu, C.H. Pan, H.W. Yang, C.Y. Huang, J.J.Wang, T.C.Yen, K.C. Wei, Blood–brain barrier disruption with focused ultrasound enhancesdelivery of chemotherapeutic drugs for glioblastoma treatment, Radiology 255(2010) 415–425.
[139] J. Mei, Y. Cheng, Y. Song, Y. Yang, F. Wang, Y. Liu, Z. Wang, Experimental study ontargeted methotrexate delivery to the rabbit brain via magnetic resonanceimaging-guided focused ultrasound, J. Ultrasound Med. 28 (2009) 871–880.
[140] H.Q. Zeng, L. Lu, F. Wang, Y. Luo, S.F. Lou, Focused ultrasound-induced blood–brainbarrier disruption enhances the delivery of cytarabine to the rat brain, J. Chemother.24 (2012) 358–363.
[141] K.C. Wei, P.C. Chu, H.Y. Wang, C.Y. Huang, P.Y. Chen, H.C. Tsai, Y.J. Lu, P.Y. Lee, I.C.Tseng, L.Y. Feng, P.W. Hsu, T.C. Yen, H.L. Liu, Focused ultrasound-induced blood–brain barrier opening to enhance temozolomide delivery for glioblastomatreatment: a preclinical study, PLoS One 8 (2013) e58995.
[142] M. Aryal, N. Vykhodtseva, Y.Z. Zhang, J. Park, N. McDannold, Multiple treatmentswith liposomal doxorubicin and ultrasound-induced disruption of blood–tumorand blood–brain barriers improve outcomes in a rat glioma model, J. Control.Release 169 (2013) 103–111.
[143] F.Y. Yang, T.T. Wong, M.C. Teng, R.S. Liu, M. Lu, H.F. Liang, M.C. Wei, Focused ultra-sound and interleukin-4 receptor-targeted liposomal doxorubicin for enhancedtargeted drug delivery and antitumor effect in glioblastoma multiforme, J. Control.Release 160 (3) (2012) 652–658.
[144] H.L. Liu, M.Y. Hua, H.W. Yang, C.Y. Huang, P.C. Chu, J.S. Wu, I.C. Tseng, J.J. Wang, T.C.Yen, P.Y. Chen, K.C. Wei, Magnetic resonance monitoring of focused ultrasound/magnetic nanoparticle targeting delivery of therapeutic agents to the brain, Proc.Natl. Acad. Sci. U. S. A. 107 (2010) 15205–15210.
[145] P.Y. Chen, H.L. Liu,M.Y. Hua, H.W. Yang, C.Y. Huang, P.C. Chu, L.A. Lyu, I.C. Tseng, L.Y.Feng, H.C. Tsai, S.M. Chen, Y.J. Lu, J.J. Wang, T.C. Yen, Y.H. Ma, T. Wu, J.P. Chen, J.I.Chuang, J.W. Shin, C. Hsueh, K.C. Wei, Novel magnetic/ultrasound focusing systemenhances nanoparticle drug delivery for glioma treatment, Neuro Oncol. 12 (2010)1050–1060.
15M. Aryal et al. / Advanced Drug Delivery Reviews xxx (2014) xxx–xxx
Please cite this article as: M. Aryal, et al., Ultrasound-mediated blood–brain barrier disruption for targeted drug delivery in the central nervoussystem, Adv. Drug Deliv. Rev. (2014), http://dx.doi.org/10.1016/j.addr.2014.01.008
[146] C.H. Fan, C.Y. Ting, H.J. Lin, C.H. Wang, H.L. Liu, T.C. Yen, C.K. Yeh, SPIO-conjugated, doxorubicin-loaded microbubbles for concurrent MRI and focused-ultrasound enhanced brain-tumor drug delivery, Biomaterials 34 (2013)3706–3715.
[147] M. Kinoshita, N. McDannold, F.A. Jolesz, K. Hynynen, Noninvasive localizeddelivery of Herceptin to the mouse brain by MRI-guided focused ultrasound-induced blood–brain barrier disruption, Proc. Natl. Acad. Sci. U. S. A. 103 (2006)11719–11723.
[148] E.J. Park, Y.Z. Zhang, N. Vykhodtseva, N. McDannold, Ultrasound-mediated blood–brain/blood–tumor barrier disruption improves outcomes with trastuzumab in abreast cancer brain metastasis model, J. Control. Release (2012), http://dx.doi.org/10.1016/j.jconrel.2012.09.007.
[149] F.Y. Yang, Y.W. Chen, F.I. Chou, S.H. Yen, Y.L. Lin, T.T. Wong, Boron neutron capturetherapy for glioblastomamultiforme: enhanced drug delivery and antitumor effectfollowing blood–brain barrier disruption induced by focused ultrasound, FutureOncol. 8 (2012) 1361–1369.
[150] R.D. Alkins, P.M. Brodersen, R.N. Sodhi, K. Hynynen, Enhancing drug delivery forboron neutron capture therapy of brain tumors with focused ultrasound, NeuroOncol. 15 (9) (2013) 1225–1235.
[151] R. Alkins, A. Burgess, M. Ganguly, G. Francia, R. Kerbel, W.S. Wels, K. Hynynen,Focused ultrasound delivers targeted immune cells to metastatic brain tumors,Cancer Res. 73 (2013) 1892–1899.
[152] C.Y. Ting, C.H. Fan, H.L. Liu, C.Y. Huang, H.Y. Hsieh, T.C. Yen, K.C. Wei, C.K. Yeh,Concurrent blood–brain barrier opening and local drug delivery using drug-carrying microbubbles and focused ultrasound for brain glioma treatment, Bioma-terials 33 (2012) 704–712.
[153] F. Wang, Y. Shi, L. Lu, L. Liu, Y. Cai, H. Zheng, X. Liu, F. Yan, C. Zou, C. Sun, J. Shi, S. Lu,Y. Chen, Targeted delivery of GDNF through the blood–brain barrier byMRI-guidedfocused ultrasound, PLoS One 7 (2012) e52925.
[154] Q. Huang, J. Deng, F. Wang, S. Chen, Y. Liu, Z. Wang, Z. Wang, Y. Cheng, Targetedgene delivery to the mouse brain by MRI-guided focused ultrasound-inducedblood–brain barrier disruption, Exp. Neurol. 233 (2012) 350–356.
[155] C.H. Fan, C.Y. Ting, H.L. Liu, C.Y. Huang, H.Y. Hsieh, T.C. Yen, K.C. Wei, C.K. Yeh,Antiangiogenic-targeting drug-loaded microbubbles combined with focusedultrasound for glioma treatment, Biomaterials 34 (2013) 2142–2155.
[156] B. Baseri, J.J. Choi, T. Deffieux, G. Samiotaki, Y.S. Tung, O. Olumolade, S.A. Small, B.Morrison, E.E. Konofagou, Activation of signaling pathways following localizeddelivery of systemically administered neurotrophic factors across the blood–brain barrier using focused ultrasound and microbubbles, Phys. Med. Biol. 57(2012) N65–N81.
[157] S.B. Raymond, L.H. Treat, J.D. Dewey, N. McDannold, K. Hynynen, B.J. Bacskai,Ultrasound enhanced delivery of molecular imaging and therapeutic agents inAlzheimer's disease mouse models, PLoS One 3 (2008) e2175.
[158] J.F. Jordao, C.A. Ayala-Grosso, K. Markham, Y. Huang, R. Chopra, J. McLaurin, K.Hynynen, I. Aubert, Antibodies targeted to the brain with image-guided focusedultrasound reduces amyloid-beta plaque load in the TgCRND8 mouse model ofAlzheimer's disease, PLoS One 5 (2010) e10549.
[159] A. Burgess, C.A. Ayala-Grosso, M. Ganguly, J.F. Jordao, I. Aubert, K. Hynynen,Targeted delivery of neural stem cells to the brain using MRI-guided focusedultrasound to disrupt the blood–brain barrier, PLoS One 6 (2011) e27877.
[160] E. Thevenot, J.F. Jordao, M.A. O'Reilly, K. Markham, Y.Q. Weng, K.D. Foust, B.K.Kaspar, K. Hynynen, I. Aubert, Targeted delivery of self-complementary adeno-associated virus serotype 9 to the brain, using magnetic resonance imaging-guided focused ultrasound, Hum. Gene Ther. 23 (2012) 1144–1155.
[161] A. Alonso, E. Reinz, B. Leuchs, J. Kleinschmidt, M. Fatar, B. Geers, I. Lentacker, M.G.Hennerici, S.C. de Smedt, S. Meairs, Focal delivery of AAV2/1-transgenes into therat brain by localized ultrasound-induced BBB opening, Mol. Ther. Nucleic Acids2 (2013) e73.
[162] P.H. Hsu, K.C. Wei, C.Y. Huang, C.J. Wen, T.C. Yen, C.L. Liu, Y.T. Lin, J.C. Chen, C.R.Shen, H.L. Liu, Noninvasive and targeted gene delivery into the brain usingmicrobubble-facilitated focused ultrasound, PLoS One 8 (2013) e57682.
[163] L.H. Treat, N. McDannold, Y. Zhang, N. Vykhodtseva, K. Hynynen, Improvedanti-tumor effect of liposomal doxorubicin after targeted blood–brain barrierdisruption by MRI-guided focused ultrasound in rat glioma, Ultrasound Med.Biol. 38 (2012) 1716–1725.
[164] J.F. Jordao, E. Thevenot, K. Markham-Coultes, T. Scarcelli, Y.Q. Weng, K. Xhima, M.O'Reilly, Y. Huang, J.McLaurin,K. Hynynen, I. Aubert, Amyloid-beta plaque reduction,endogenous antibody delivery and glial activation by brain-targeted, transcranialfocused ultrasound, Exp. Neurol. 248 (2013) 16–29.
[165] J.J. Choi, M. Pernot, S.A. Small, E.E. Konofagou, Noninvasive, transcranial and localizedopening of the blood–brain barrier using focused ultrasound in mice, UltrasoundMed. Biol. 33 (2007) 95–104.
[166] M.A. O'Reilly, A. Muller, K. Hynynen, Ultrasound insertion loss of rat parietalbone appears to be proportional to animal mass at submegahertz frequencies,Ultrasound Med. Biol. 37 (2011) 1930–1937.
[167] S. Pichardo, V.W. Sin, K. Hynynen, Multi-frequency characterization of the speed ofsound and attenuation coefficient for longitudinal transmission of freshly excisedhuman skulls, Phys. Med. Biol. 56 (2011) 219–250.
[168] P.J. White, G.T. Clement, K. Hynynen, Longitudinal and shear mode ultrasoundpropagation in human skull bone, Ultrasound Med. Biol. 32 (2006) 1085–1096.
[169] K. Hynynen, N.I. Vykhodtseva, A.H. Chung, V. Sorrentino, V. Colucci, F.A. Jolesz,Thermal effects of focused ultrasound on the brain: determination with MRimaging, Radiology 204 (1997) 247–253.
[170] N. McDannold, S.E. Maier, Magnetic resonance acoustic radiation force imaging,Med. Phys. 35 (2008) 3748–3758.
[171] N. Hosseinkhah, K. Hynynen, A three-dimensional model of an ultrasound contrastagent gas bubble and its mechanical effects on microvessels, Phys. Med. Biol. 57(2012) 785–808.
[172] Y.S. Tung, F.Marquet, T. Teichert, V. Ferrera, E.E. Konofagou, Feasibility of noninvasivecavitation-guided blood–brain barrier opening using focused ultrasound andmicrobubbles in nonhuman primates, Appl. Phys. Lett. 98 (2011) 163704.
[173] M.A. O'Reilly, K. Hynynen, Blood–brain barrier: real-time feedback-controlledfocused ultrasound disruption by using an acoustic emissions-based controller,Radiology 263 (2012) 96–106.
[174] V.A. Salgaonkar, S. Datta, C.K. Holland, T.D. Mast, Passive cavitation imaging withultrasound arrays, J. Acoust. Soc. Am. 126 (2009) 3071–3083.
[175] M. Gyongy, C.C. Coussios, Passive cavitation mapping for localization and trackingof bubble dynamics, J. Acoust. Soc. Am. 128 (2010) EL175–EL180.
[176] C.D. Arvanitis, M.S. Livingstone, N. McDannold, Combined ultrasound and MRimaging to guide focused ultrasound therapies in the brain, Phys. Med. Biol. 58(2013) 4749–4761.
[177] F.Y. Yang, H.E. Wang, G.L. Lin, M.C. Teng, H.H. Lin, T.T. Wong, R.S. Liu, Micro-SPECT/CT-based pharmacokinetic analysis of 99mTc-diethylenetriaminepentaacetic acidin rats with blood–brain barrier disruption induced by focused ultrasound,J. Nucl. Med. 52 (2011) 478–484.
[178] F.Y. Yang, S.C. Horng, Y.S. Lin, Y.H. Kao, Association between contrast-enhancedMRimages and blood–brain barrier disruption following transcranial focused ultrasound,J. Magn. Reson. Imaging 32 (2010) 593–599.
[179] P.C. Chu, W.Y. Chai, H.Y. Hsieh, J.J. Wang, S.P. Wey, C.Y. Huang, K.C. Wei, H.L. Liu,Pharmacodynamic analysis of magnetic resonance imaging-monitored focusedultrasound-induced blood–brain barrier opening for drug delivery to brain tumors,Biomed. Res. Int. 2013 (2013) 627496.
[180] F. Vlachos, Y.S. Tung, E.E. Konofagou, Permeability assessment of the focusedultrasound-induced blood–brain barrier opening using dynamic contrast-enhanced MRI, Phys. Med. Biol. 55 (2010) 5451–5466.
[181] S.B. Raymond, K. Hynynen, Acoustic transmission losses and field alterations dueto human scalp hair, IEEE Trans. Ultrason. Ferroelectr. Freq. Control 52 (2005)1415–1419.
[182] J. Park, Y. Zhang, N. Vykhodtseva, J.D. Akula, N.J. McDannold, Targeted and reversibleblood–retinal barrier disruption via focused ultrasound andmicrobubbles, PLoS One7 (2012) e42754.
[183] J. Wachsmuth, R. Chopra, K. Hynynen, Feasibility of transient image-guided blood–spinal cord barrier disruption, Proceedings of the 8th International Symposium onTherapeutic Ultrasound, Minneapolis, MN, AIP Conf.Proc., 1113, 2008, pp. 256–259.
[184] K. Fischer, N.J. McDannold, Y. Zhang, M. Kardos, A. Szabo, A. Szabo, G.S. Reusz, F.A.Jolesz, Renal ultrafiltration changes induced by focused US, Radiology 253 (2009)697–705.
[185] N.J. McDannold, N.I. Vykhodtseva, K. Hynynen, Microbubble contrast agent withfocused ultrasound to create brain lesions at low power levels: MR imaging andhistologic study in rabbits, Radiology 241 (2006) 95–106.
[186] M.J. Borrelli, W.D. O'Brien Jr., E. Hamilton, M.L. Oelze, J. Wu, L.J. Bernock, S. Tung, H.Rokadia, W.C. Culp, Influences of microbubble diameter and ultrasonic parameterson in vitro sonothrombolysis efficacy, J. Vasc. Interv. Radiol. 23 (2012) 1677–1684.
[187] G.J. Czarnota, R. Karshafian, P.N. Burns, S.Wong, A. Al Mahrouki, J.W. Lee, A. Caissie,W. Tran, C. Kim, M. Furukawa, E. Wong, A. Giles, Tumor radiation responseenhancement by acoustical stimulation of the vasculature, Proc. Natl. Acad. Sci.U. S. A. 109 (2012) E2033–E2041.
[188] F.Y. Yang,W.M. Fu,W.S. Chen,W.L. Yeh,W.L. Lin, Quantitative evaluation of the useof microbubbles with transcranial focused ultrasound on blood–brain-barrierdisruption, Ultrason. Sonochem. 15 (2008) 636–643.
[189] N. McDannold, N. Vykhodtseva, K. Hynynen, Use of ultrasound pulses combinedwith Definity for targeted blood–brain barrier disruption: a feasibility study, Ultra-sound Med. Biol. 33 (2007) 584–590.
[190] K.J. Lin, H.L. Liu, P.H. Hsu, Y.H. Chung, W.C. Huang, J.C. Chen, S.P. Wey, T.C. Yen, I.T.Hsiao, Quantitative micro-SPECT/CT for detecting focused ultrasound-inducedblood–brain barrier opening in the rat, Nucl. Med. Biol. 36 (2009) 853–861.
[191] F.Y. Yang, H.E. Wang, G.L. Lin, H.H. Lin, T.T. Wong, Evaluation of the increase inpermeability of the blood–brain barrier during tumor progression after pulsedfocused ultrasound, Int. J. Nanomedicine 7 (2012) 723–730.
[192] Q. Huang, J. Deng, Z. Xie, F. Wang, S. Chen, B. Lei, P. Liao, N. Huang, Z. Wang, Z.Wang, Y. Cheng, Effective gene transfer into central nervous system followingultrasound-microbubbles-induced opening of the blood–brain barrier, UltrasoundMed. Biol. 38 (2012) 1234–1243.
[193] A.B. Etame, R.J. Diaz, M.A. O'Reilly, C.A. Smith, T.G. Mainprize, K. Hynynen, J.T. Rutka,Enhanced delivery of gold nanoparticles with therapeutic potential into the brainusing MRI-guided focused ultrasound, Nanomedicine 8 (7) (2012) 1133–1142.
[194] P.H. Wang, H.L. Liu, P.H. Hsu, C.Y. Lin, C.R. Wang, P.Y. Chen, K.C. Wei, T.C. Yen, M.L.Li, Gold-nanorod contrast-enhanced photoacoustic micro-imaging of focused-ultrasound induced blood–brain-barrier opening in a rat model, J. Biomed. Opt.17 (2012) 061222.
16 M. Aryal et al. / Advanced Drug Delivery Reviews xxx (2014) xxx–xxx
Please cite this article as: M. Aryal, et al., Ultrasound-mediated blood–brain barrier disruption for targeted drug delivery in the central nervoussystem, Adv. Drug Deliv. Rev. (2014), http://dx.doi.org/10.1016/j.addr.2014.01.008

Appendix II
Multiple treatments with liposomal doxorubicin and ultrasound induced
disruption of blood-tumor and blood-brain barriers improves outcomes in a rat
glioma
Muna Aryal, Natalia Vykhodtseva, Yong-Zhi Zhang, Juyoung Park, Nathan McDannold
J Control Release. 2013 July 10; 169(0): 103–111

Multiple treatmentswith liposomal doxorubicin and ultrasound-induceddisruption of blood–tumor and blood–brain barriers improve outcomesin a rat glioma model☆
Muna Aryal a,b,⁎, Natalia Vykhodtseva b, Yong-Zhi Zhang b, Juyoung Park b, Nathan McDannold b
a Department of Physics, Boston College, Chestnut Hill, USAb Department of Radiology, Brigham & Women's Hospital, Harvard Medical School, Boston, USA
a b s t r a c ta r t i c l e i n f o
Article history:Received 2 January 2013Accepted 10 April 2013Available online 18 April 2013
Keywords:Focused ultrasoundBrainDrug deliveryGliomaBlood–brain barrierChemotherapy
The blood–brain-barrier (BBB) prevents the transport of most anticancer agents to the central nervous sys-tem and restricts delivery to infiltrating brain tumors. The heterogeneous vascular permeability in tumor ves-sels, along with several other factors, creates additional barriers for drug treatment of brain tumors. Focusedultrasound (FUS), when combined with circulating microbubbles, is an emerging noninvasive method totemporarily permeabilize the BBB and the “blood–tumor barrier”. Here, we tested the impact of three weeklysessions of FUS and liposomal doxorubicin (DOX) in 9L rat glioma tumors. Animals that received FUS + DOX(N = 8) had a median survival time that was increased significantly (P b 0.001) compared to animals whoreceived DOX only (N = 6), FUS only (N = 8), or no treatment (N = 7). Median survival for animals thatreceived FUS + DOX was increased by 100% relative to untreated controls, whereas animals who receivedDOX alone had only a 16% improvement. Animals who received only FUS showed no improvement. Notumor cells were found in histology in 4/8 animals in the FUS + DOX group, and in two animals, only afew tumor cells were detected. Adverse events in the treatment group included skin toxicity, impaired activ-ity, damage to surrounding brain tissue, and tissue loss at the tumor site. In one animal, intratumoral hemor-rhage was observed. These events are largely consistent with known side effects of doxorubicin and with anextensive tumor burden. Overall this work demonstrates that multiple sessions using this FUS technique toenhance the delivery of liposomal doxorubicin have a pronounced therapeutic effect in this rat glioma model.
© 2013 Elsevier B.V. All rights reserved.
1. Introduction
The blood–brain barrier (BBB) and other challenges prevent theeffective use of most systemically-administered chemotherapeuticagents in patients with brain tumors. The BBB restricts transport ofpractically all agents to the brain parenchyma due to its selective per-meability, which is based on lipid solubility, molecular size andcharge [1,2]. Infiltrating tumor cells andmetastatic “seeds” in the cen-tral nervous system are protected by the intact BBB and are excludedfrom the therapeutic effects of most drugs. Tumor blood vessels,which often lack an intact BBB, will allow some agent to extravasateand reach the vascular portion of the tumor. However, the permeabil-ity of the tumor vasculature is heterogeneous, and factors such as in-creased interstitial pressure [3] limit how far from the vasculature thedrugs can penetrate. Furthermore, efflux pumps, which are present at
the BBB and in many tumors, extrude cytotoxic drugs that usuallyenter cells by passive diffusion [4]. Methods to overcome these bar-riers to drug delivery are needed if effective brain tumor therapiesare to be developed.
Because of these challenges, the treatment of glioblastomamultiforme (GBM), an aggressive, high-grade brain tumor, is difficult[5]. This tumor is highly infiltrative, and recurrence after localized treat-ments such as conformal radiotherapy or surgery is common. This re-lapse usually occurs within a few cm of the treated region [6–8]. Theintroduction of temozolomide, a small molecule chemotherapy agentthat has some penetration across the BBB, has improved clinical out-comes [9], but this improvement has been modest. A technique thatcan deliver larger agents across the “blood–tumor barrier” (BTB) andthe BBB in the surrounding brain could enable the use of a wide rangeof anticancer agents for GBM and other brain tumors.
The use of focused ultrasound (FUS) combined with a circulatingmicrobubble agent is an emerging technique to disrupt the BBB tempo-rarily in a localized and non-invasive manner [10]. The microbubbles,which are constrained to the vasculature, interact strongly with evenlow-intensity ultrasound, producingmechanical forces on the endothe-lium that result in transient disassembly of tight junctional complexes
Journal of Controlled Release 169 (2013) 103–111
☆ Conflict of interest: The last author holds two patents on the ultrasound techniqueevaluated in this work. The other authors have no conflicts of interest to report.⁎ Corresponding author at: 221 Longwood Avenue, Boston, MA 02115, USA. Tel.: +1
617 732 5920; fax: +1 617 525 7450.E-mail address: [email protected] (M. Aryal).
0168-3659/$ – see front matter © 2013 Elsevier B.V. All rights reserved.http://dx.doi.org/10.1016/j.jconrel.2013.04.007
Contents lists available at SciVerse ScienceDirect
Journal of Controlled Release
j ourna l homepage: www.e lsev ie r .com/ locate / jconre l

and the induction of active transport processes [11,12]. No significantadverse effects have been observed resulting from this temporary BBBdisruption [13–15]. The barrier is restored in a fewhours [10], providinga time-window to deliver even long-circulating agents. Prior work inanimals has demonstrated delivery of awide range of imaging and ther-apeutic agents, even large agents such as antibodies, nanoparticles, andliposomally-encapsulated drugs [16–19]. The method can increase thedelivery of agents to brain tumors [20,21], and several studies haveshown that it can improve outcomes in animal brain tumor models[20,22–24]. These results, along with recent work demonstrating safetyin a large animal model using a clinical brain FUS system [13] make it apromising approach for the treatment of GBM and other brain tumors.Volumetric BBB disruption can be achievedwith such devices by rapidlysteering the ultrasound focal point to different locations [13].
This method has several potential advantages over other ap-proaches tested to overcome the BBB and the BTB [25]. FUS-inducedBBB disruption is a noninvasive and targeted procedure, and the ef-fect can be localized to only desired volumes in the brain. The methodis also compatible with currently-available drugs, removing the needto develop new agents. Importantly, since FUS is noninvasive and canpresumably be applied without general anesthesia, it is expected tobe a relatively benign procedure that can be readily repeated tomatch a patient's drug schedule.
The purpose of this work was to evaluate whether multiple treat-ment sessions can effectively improve the therapeutic effect of liposo-mal doxorubicin in a rat glioma model. Previous work has shown thata single treatment with FUS-enhanced delivery of this agent toorthotopically-implanted 9L rat gliosarcoma model had a modest im-provement in survival and tumor growth [24]. Here we examinedwhether three weekly sessions can provide a more pronounced treat-ment effect in this tumor model. We also utilized low-frequency FUSto better match an existing clinical FUS device [26].
2. Materials and methods
2.1. Sonication system
An air-backed, single element, 690 kHz focused piezoelectrictransducer (diameter/radius of curvature: 100/80 mm) generatedthe ultrasound field. It was driven by an arbitrary waveform genera-tor (model 395, Wavetek) and RF amplifier (240L, ENI); electricpower was measured with a power meter (E4419B, Agilent) and adual-directional coupler (C5948-10, Werlatone). Reported exposurelevels are absolute peak negative pressure amplitudes measured inwater with a membrane hydrophone (Marconi; 0.5 mm diameter).Attenuation by the brain and rat skull is expected to reduce the pres-sure amplitude by ~30% at this frequency [27] with additional uncer-tainty arising from standing waves within the skull and increases inskull thickness as the animal ages [27]. The pressure distribution ofthe transducer was mapped using a 0.2 mm needle hydrophone(Onda, Sunnyvale, CA); its half-maximum diameter and length were2.3 and 12 mm, respectively. The transducer efficiency was measuredusing a radiation force-balance.
2.2. Experimental setup
The sonication system was operated within a clinical 3 T MRI scan-ner (Signa; GE Healthcare). The transducer was immersed in a smalltank of degassed, deionized water and attached to an MRI-compatible,manually-operated positioning system (Fig. 1A). The animal was laidsupine on a tray above this tank, with a water bag providing an acousticpath to the dorsal surface of the head. Images were obtained with a7.5 cm-diameter transmit/receive MRI surface coil. The animal's bodytemperature was maintained with a heated water pad. Before treat-ment, we visualized heating in a silicone phantom using temperature-sensitive MRI to localize the acoustic focal point in the MRI space.
Accurate targeting in vivo was confirmed before the tumor sonicationsin select animals (typically the first animal treated each week) by soni-cating a spot in the brain outside the tumor and checking that theresulting MRI contrast extravasation was at the desired target.
2.3. Animals
The experiments were approved by our institutional animal com-mittee. Tests were performed in 40 male Sprague–Dawley rats(Charles River Laboratories; ~250 g). Before each procedure, the ani-mals were anesthetized via intraperitoneal injections of Ketamine(80 ml/kg/h) and Xylazine (10 ml/kg/h). A catheter was placed inthe tail vein, and the hair on the scalp was removed with clippersand depilatory cream.
9L rat gliosarcoma cells (passage number 3, obtained from theNeurosurgery Tissue Bank at UCSF) were grown in Minimum Essen-tial Medium (1×) with Earle's salts, supplemented with 10% fetal bo-vine serum, 1% L-glutamine, 1% MEM nonessential amino acids, and0.1% gentamicin in a 5% CO2 chamber held at 37 °C. After preparingthe skin, a 5-mm skin incision was made and a 1-mm burr hole wasdrilled into the skull 1 mm anterior to the bregma and 2 mm lateralto the midline. A 4 μl volume of cell suspension (1 × 10⁵ cells) wasinjected into the right caudate putamen at a depth of 3.5 mm relativeto the dural surface using a 10 μl gas-tight syringe (Hamilton). Cellswere injected over five minutes; two minutes later the needle wasretracted slowly over another 5 min, and the skin was sutured. Thesutures were removed 5 days later, and treatment began on day 7or 8, at which point the tumor had an MRI-evident diameter between1 and 3 mm.
The animals were monitored regularly to evaluate the treatment ef-fects on survival and tumor growth. Animals surviving 6 weeks aftertreatment were considered long-term survivors. However, some werefollowed for longer periods for later histological examination, as theyappeared healthy. The animals were euthanized if they exhibited se-verely impaired activity, weight loss exceeding 20% within one week,tumor dimensions exceeding 10–11 mm, or if treatment-related severeadverse events occurred that caused pain or distress and that could notbe ameliorated. The animals were euthanized via transcardial perfusionwith saline followed by 10% phosphate-buffered formalin whileunder deep anesthesia. The brain was removed and immersed in 10%phosphate-buffered formalin for histological preparation. To avoidskin infections that were observed in two animals (see below), animalsreceiving FUS and chemotherapywere treatedwith an antibiotic Baytril(Bayer; 2.5 mg/kg).
2.4. Treatment
The rats were randomly assigned to one of four groups: (1) notreatment (Control) (N = 7), (2) three weekly treatments withFUS-induced BBB/BTB permeabilization (FUS-Only) (N = 8), (3) threeweekly treatments with liposomal doxorubicin (DOX-only) (N = 6),and (4) three weekly treatments with FUS and concurrent chemother-apy (FUS + DOX) (N = 8). After determining the coordinates of thefocal pointwithin theMRI space, treatment planningMRI was acquired,and the focal regionwaspositionedwithin the tumor. Ultrasoundburstswere then applied at multiple points in and around the tumor at pres-sure amplitudes ranging from 0.55 to 0.81 MPa (burst length: 10 ms,pulse repetition frequency: 1 Hz, duration: 60 s). The pressure ampli-tude was initially set based on a prior study in rats with this device[28]. It was increased based on the age and weight of the animals toachieve a consistent level of BBB disruption. This observation wasmade in our initial treatments and is similar to previous reports [27].Before each sonication, ultrasonic contrast agent (DEFINITY, LantheusMedical Imaging; 0.01 ml/kg) was administered intravenously. Tofacilitate the injections of such a small volume, the agent was dilutedto 0.1× normal concentration in PBS. It was injected as a bolus
104 M. Aryal et al. / Journal of Controlled Release 169 (2013) 103–111

approximately 9 s before each sonication, followed by a 0.2 ml salineflush. The sonicationswere delivered at 5 min intervals in a grid pattern(spacing: 1 or 1.5 mm, depending on tumor volume) to 5–20 targetswith the number of locations increasing over the three weeks as thetumor volume increased. We aimed to permeabilize the BTB in the en-tire tumor and the BBB in a surrounding rim of at least 1 mm.
For chemotherapy, 5.67 mg/kg of doxorubicin hydrochloride en-capsulated in long-circulating pegylated liposomes was administered
intravenously. This dosage was selected based on prior work testingthis agent in rats [29]. In our initial experiments (5 rats inDOX-Only group; 5 in FUS + DOX group), we used DOXIL (CentocorOrtho-Biotech). Due to a national shortage of this agent that occurredduring these experiments, we used Lipo-Dox (TTY Biopharm) for theremaining animals (1 rat in the Dox-Only group; 3 in the FUS + DOXgroup). Previous work has shown that doxorubicin can be releasedfrom liposomes by ultrasound if microbubbles are in close vicinity[30], and we speculated that such may occur in these treatments.Thus for the FUS + DOX group, chemotherapy was administeredover multiple slow injections administered just before each sonica-tion. This scheme aimed to ensure a high drug concentration in thebloodstream during every sonication. For the DOX-only group, theagent was administered over 5 slow injections at 5 min intervals.Each injection was followed by a 0.2 ml saline flush.
2.5. Magnetic resonance imaging
T2-Weighted imaging was used to plan the treatments and mea-sure tumor volumes. BBB/BTB disruption was evaluated usingT1-weighted imaging acquired before and after administration ofthe MRI contrast agent gadopentatate dimeglumine (MagnevistGd-DTPA; Bayer Healthcare; 0.25 ml/kg). T2*-Weighted imagingwas used to confirm that petechiae, which are produced by excessiveFUS exposures, did not occur [10] and to evaluate hemorrhagic re-gions in the tumors. Detailed imaging parameters are listed in Supple-mental Methods.
2.6. Image analysis
Non-contrast MRI imaging was performed weekly (±1–3 daysdepending on MRI availability). Tumor boundaries were manually seg-mented in axial T2-weighted images using ImageJ; the volumewas cal-culated by the sum of the areas multiplied by the image thickness. Inweeks 1–2, the tumors appeared as clearly circumscribed volumeswhich were sometimes surrounded by hyperintense regions (presum-ably edema). These boundaries were sometimes not evident at latertimes in the FUS + DOX group, and it was not clear whether MRIabnormalities were residual/recurring tumor or treatment-related ef-fects. To be conservative, such cases were included in the volumecalculations.
2.7. Histology
Representative examples from the Control (4/7 animals) andFUS-Only (5/8 animals) groups were selected for histological examina-tion. The treatment response varied for animals in the DOX-Only andFUS + DOX groups (see below), and all brains from these animalswere examined. Tissue blocks containing the tumor were embedded
Fig. 1. Experimental setup and treatment overview. (A) Schematic of the MRI-guidedfocused ultrasound system used in this work. The function generator, amplifier, andpower meter were located outside the MRI room (B). Axial images acquired before(left) and after (right) the first FUS + DOX treatment showing the signal enhancementin T1-weighted MRI after Gd-DTPA injection. Before FUS, the tumor was a small en-hancing area (arrow). The magnitude and extent of this enhancement were increasedafter FUS. (C) Signal enhancement in this example as a function of time. (D) T2-weightedimaging (T2WI) used for treatment planning, contrast-enhanced T1-weighted imaging(CE-T1WI) used to verify the BBB/BTB permeabilization, and post-FUS T2*-weighted imag-ing (T2*WI) acquiredduring threeweekly FUS+DOX treatments. (D) T2-weighted imaging(T2WI) used for treatment planning, contrast-enhanced T1-weighted imaging (CE-T1WI)used to verify the BBB/BTB permeabilization, and post-FUS T2*-weighted imaging(T2*WI). The location of the tumor in treatment planning is indicated by the solid line,and the extent ofMRI contrast enhancement is indicated by the dotted line. The coordinatesof the sonication targets are also noted (white circles). Two hypointense spots (arrows)were evident after the third treatment in T2*-weighted imaging. The enhancing area evidentin the other hemisphere in (B) and (D) (asterisk) was a location in the brain that was son-icated before the first Gd-DTPA injection to confirm the accurate targeting of the FUS beam.Bars: 5 mm.
105M. Aryal et al. / Journal of Controlled Release 169 (2013) 103–111
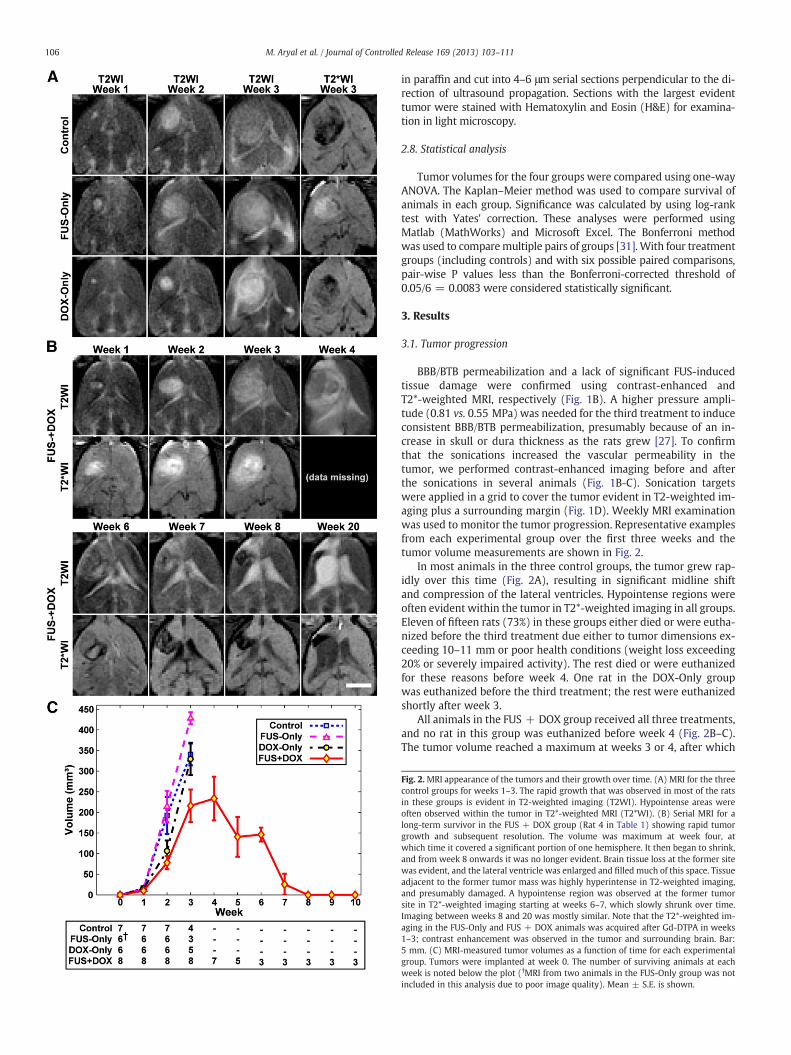
in paraffin and cut into 4–6 μm serial sections perpendicular to the di-rection of ultrasound propagation. Sections with the largest evidenttumor were stained with Hematoxylin and Eosin (H&E) for examina-tion in light microscopy.
2.8. Statistical analysis
Tumor volumes for the four groups were compared using one-wayANOVA. The Kaplan–Meier method was used to compare survival ofanimals in each group. Significance was calculated by using log-ranktest with Yates' correction. These analyses were performed usingMatlab (MathWorks) and Microsoft Excel. The Bonferroni methodwas used to comparemultiple pairs of groups [31]. With four treatmentgroups (including controls) and with six possible paired comparisons,pair-wise P values less than the Bonferroni-corrected threshold of0.05/6 = 0.0083 were considered statistically significant.
3. Results
3.1. Tumor progression
BBB/BTB permeabilization and a lack of significant FUS-inducedtissue damage were confirmed using contrast-enhanced andT2*-weighted MRI, respectively (Fig. 1B). A higher pressure ampli-tude (0.81 vs. 0.55 MPa) was needed for the third treatment to induceconsistent BBB/BTB permeabilization, presumably because of an in-crease in skull or dura thickness as the rats grew [27]. To confirmthat the sonications increased the vascular permeability in thetumor, we performed contrast-enhanced imaging before and afterthe sonications in several animals (Fig. 1B-C). Sonication targetswere applied in a grid to cover the tumor evident in T2-weighted im-aging plus a surrounding margin (Fig. 1D). Weekly MRI examinationwas used to monitor the tumor progression. Representative examplesfrom each experimental group over the first three weeks and thetumor volume measurements are shown in Fig. 2.
In most animals in the three control groups, the tumor grew rap-idly over this time (Fig. 2A), resulting in significant midline shiftand compression of the lateral ventricles. Hypointense regions wereoften evident within the tumor in T2*-weighted imaging in all groups.Eleven of fifteen rats (73%) in these groups either died or were eutha-nized before the third treatment due either to tumor dimensions ex-ceeding 10–11 mm or poor health conditions (weight loss exceeding20% or severely impaired activity). The rest died or were euthanizedfor these reasons before week 4. One rat in the DOX-Only groupwas euthanized before the third treatment; the rest were euthanizedshortly after week 3.
All animals in the FUS + DOX group received all three treatments,and no rat in this group was euthanized before week 4 (Fig. 2B–C).The tumor volume reached a maximum at weeks 3 or 4, after which
Fig. 2. MRI appearance of the tumors and their growth over time. (A) MRI for the threecontrol groups for weeks 1–3. The rapid growth that was observed in most of the ratsin these groups is evident in T2-weighted imaging (T2WI). Hypointense areas wereoften observed within the tumor in T2*-weighted MRI (T2*WI). (B) Serial MRI for along-term survivor in the FUS + DOX group (Rat 4 in Table 1) showing rapid tumorgrowth and subsequent resolution. The volume was maximum at week four, atwhich time it covered a significant portion of one hemisphere. It then began to shrink,and from week 8 onwards it was no longer evident. Brain tissue loss at the former sitewas evident, and the lateral ventricle was enlarged and filled much of this space. Tissueadjacent to the former tumor mass was highly hyperintense in T2-weighted imaging,and presumably damaged. A hypointense region was observed at the former tumorsite in T2*-weighted imaging starting at weeks 6–7, which slowly shrunk over time.Imaging between weeks 8 and 20 was mostly similar. Note that the T2*-weighted im-aging in the FUS-Only and FUS + DOX animals was acquired after Gd-DTPA in weeks1–3; contrast enhancement was observed in the tumor and surrounding brain. Bar:5 mm. (C) MRI-measured tumor volumes as a function of time for each experimentalgroup. Tumors were implanted at week 0. The number of surviving animals at eachweek is noted below the plot (†MRI from two animals in the FUS-Only group was notincluded in this analysis due to poor image quality). Mean ± S.E. is shown.
106 M. Aryal et al. / Journal of Controlled Release 169 (2013) 103–111

they began to shrink. The outcomes for the eight animals in this groupvaried and are summarized in Table 2. The maximum tumor volumevaried substantially, with some tumors reaching volumes similar tothe control group, and others never reaching 100 mm3. The meantumor volume in the FUS + DOX group was less than in the threecontrol groups at weeks 2–3 (Fig. 2C). However the differenceswere not significant.
The first two rats treated in the FUS + DOX group (Rats 1 and 2 inTable 1) exhibited local skin toxicity (inflammation, peeling; minorbleeding) on the scalp and the front and hind paws beginning on orafter week two. These two animals developed a skin infection andwere euthanized at days 34 and 35. In their last imaging session, one ofthese animals had no tumor evident in MRI, and the other had a smalltumor that appeared to be responding to the treatment. Subsequent an-imalswere treated prophylacticallywith antibiotics.While skin irritationor mild inflammation was observed, they did not develop infections.
Three animals (Rats 3, 4 and 8 in Table 1) did not exhibit any ev-ident morbidity. They gained weight and behaved normally. Theseanimals were followed for 9 or more weeks, at which time theywere euthanized for histological examination. One of theselong-term survivors was euthanized at day 66; the other two wereobserved for longer periods (136 and 142 days). Tumors in these an-imals grew to a substantial volume (greater than 300 mm3) beforethey began to resolve. MRI from one of these animals is shown inFig. 2B. After the tumors disappeared, brain tissue loss at the formertumor site was evident in MRI, along with damage in adjacent tissuesand enlarged ventricles. Tissue damage appeared as highlyhyperintense regions in T2-weighted imaging. In some regions, with-in this damaged area, discrete hyperintense zones in both T2* andT2-weighted imaging were seen.
Two animals in the FUS + DOX group (Rats 5 and 7 in Table 1)wereeuthanized due to poor health at days 32 and 36, respectively. At thetime of sacrifice, one of these animals exhibited only a smallhyperintense region in T2-weighted imaging, and no tumor was evi-dent in histology (see below). The other had an extensive hyperintensearea in T2-weighted imaging, but only a small cluster containing a fewtumor cells was found in histology. Finally, in one animal (Rat 6 inTable 1), a large hypointense region was observed in T2*-weighted im-aging at week 4 that was assumed to be intratumoral hemorrhage. Thisanimal also exhibited impaired activity andwas euthanized at this time.
3.2. Histological findings
Tumors in the Control and FUS-Only groups appeared at days 15–23 as solid masses that replaced large amounts of brain tissue(Fig. 3A). The tumor bulk consisted of viable and rapidly dividingspindle-shaped cells interspersed with multiple small necrotic sites.
Microvessels that were necrotic, dilated, and congested with erythro-cytes were observed throughout and were surrounded by necroticzones (Fig. 3B). Small hemorrhagic regions were also found. Bloodcells in these regions and in congested blood vessels were consistentwith the hypointense regions observed in T2*-weighted imaging. Inthe largest tumors, numerous necrotic and hemorrhagic areas accom-panied by cell necrosis and apoptosis were found scattered through-out the tumor mass. Rapid tumor growth and invasion displacedand compressed the surrounding brain tissue, resulting in ischemiaand cell death (infarction) in some adjacent brain regions (Fig. 3C).A narrow (0.5–1 mm) band of invading/infiltrating cells was evidentat the tumor margin (Fig. 3D).
The tumor appearance in the DOX-only group varied. Although viableand dividing cells were generally present, a reduced cellularity comparedto the other control groups, along with unhealthy-appearing tumor cellsand an intensely vacuolated matrix was evident in this group (Fig. 3E).Large regions of necrosis were observed in some cases, but some viabletumor cells were always found within these necrotic areas. Substantialhemorrhage was evident at the periphery of some tumors, accompaniedby infarction in the surrounding brain. Tumor cell invasion alongperivascular tracts and tumor cell clusters were observed at sites as faras 1–2 mm from the edge of the solid tumormass (Fig. 3F). In one animal(euthanized at day 26 due to impaired activity), no tumor cells werefound in histology.
Table 1Outcomes in FUS + DOX group.
Rat Survival(days)
Maximumvol. in MRI(mm3)
Vol. in MRI ateuthanasia(mm3)
Tumorfound inhistology
Outcome
1 34 244 63 Yes Skin infection, euthanized2 35 52 0 No Skin infection, euthanized3 66 358 0 No Long-term survivor4 142 365 0 No Long-term survivor5 32 4242 4242 Yes1 Poor health, euthanized6 31 312 312 Yes Intratumoral hemorrhage,
euthanized7 36 96 40 No Poor health, euthanized8 136 312 0 Yes1 Long-term survivor
1 Only a small cluster containing a few tumor cells was found.2 A well-defined tumor margin was not evident in T2-weighted MRI at weeks 3–4 in
this animal; only a large hyperintense region was observed (see Fig. 4F). The volume ofthis hyperintense region was included in the volume measurements, as we could notdetermine if this region was tumor or edema.
Fig. 3. Appearance of 9L gliosarcoma in the three control groups in histology. Animalsreceiving no treatment or FUS-Only (A–D) all had a similar appearance. The tumorappeared as a solid mass that replaced large volumes of brain tissue (A). The bulk ofthe tumors consisted of viable and rapidly dividing spindle-shaped cells (inset in A).Congested blood vessels were observed throughout, surrounded by necrotic tissue(B). Some regions of adjacent brain tissue were severely damaged, presumably from is-chemia (C). There was a rim of infiltrating cells at the margin (D). Most tumors in theDOX-Only group (E–F) were also large masses of tumor cells with an infiltrating mar-gin (E). However, unlike the other two control groups, they had a lower cellularity, un-healthy tumor cells, and intensely vacuolated matrix (inset in E). Tumor cell invasionsalong perivascular tracts and tumor cell clusters were observed at distant sites up to2 mm from the edge of the solid tumor. The vacuolation evident in the tumor masswas often not observed in the infiltrating margin (* in F).
107M. Aryal et al. / Journal of Controlled Release 169 (2013) 103–111

In contrast to the controls, all but one of the animals in theFUS + DOX group exhibited a strong treatment response, with notumor mass detected in 6/8 animals. However, in two of these ani-mals a few residual or recurrent tumor cells were found in the for-mer tumor site. In one rat, which was euthanized due to skininfection at day 34, a tumor was found to be shrunken comparedto its maximum size in MRI and partly destroyed. The central areacontained a viable tumor mass, and a surrounding rim of tissueappeared to be damaged. Only one animal (Rat 6 in Table 1) had alarge tumor like most rats in the control groups. This animal, inwhich intratumoral bleeding was suspected in MRI, was euthanizedat week 4. Histological examination confirmed hemorrhagic infarc-tion in a region of tumor necrosis. This region was restricted to thetumor mass; no blood was found inside the adjacent ventricularspace.
Example histological findings from the FUS + DOX group areshown in Fig. 4. In the three long-term survivors, where the tumorsgrew to a substantial volume before beginning to resolve, brain tissueloss was evident at the former tumor site (Fig. 4A). The adjacent lat-eral ventricle was significantly enlarged and filled this missing area.A region in the adjacent brain was necrotic, with an appearance con-sistent with infarct (Fig. 4B). A small cyst was observed within thisnecrotic zone. The hypointense regions evident in MRI containedhemosiderin — either in clusters or taken up by macrophages (insetin Fig. 4B). In one long-term survivor, a small cluster of recurring orresidual tumor cells was found.
Findings from two animals from the FUS + DOX group that wereeuthanized for impaired activity are shown in Fig. 4C–H. In one case(euthanized at day 36) only a small necrotic area with macrophageinfiltration was found at the former tumor site (Fig. 4C–E). In the sec-ond animal (euthanized at day 32), a larger necrotic area was found atthe former tumor site, and affected or damaged tissue was observedin the surrounding brain that was hyperintense in T2-weighted MRI(Fig. 4F–H). A tiny cluster of tumor cells was found in this example(inset in Fig. 4G).
3.3. Survival analysis
Kaplan–Meier survival analysis is shown in Fig. 5; the correspond-ing statistical data are summarized in Table 2. The median survivaltime for the animals in both the Control and FUS-Only groupswas about 18 days. For animals in the DOX-only group, it was20.3 days — a 16% improvement over the animals in the Controlgroup. However, this difference was not significant (P = 0.16). Incontrast, the animals in the FUS + DOX group showed a significantsurvival benefit (P b 0.001) compared to the other three groups.The median survival time was 35 days, a 100% and 72% improvementover the Control and DOX-Only groups, respectively. Note that thisanalysis did not censor the two animals euthanized early due toskin infection. If one assumes those animals did not die from theirtumor and censors them, the estimated median survival of theFUS + DOX group would be longer than 142 days, as more than50% of the remaining animals survived until this time.
4. Discussion
Doxorubicin is a commonly-used anticancer drug for treatment ofa wide range of cancers. While its effectiveness against glioma hasbeen shown in vitro [32] and in vivo when injected directly into thetumor [33,34], systemic administration has not been effective clini-cally [35], presumably reflecting insufficient delivery [2]. A numberof drug formulations have been developed to enhance the deliveryof doxorubicin in animal glioma models [36–40] and at least one clin-ical trial is ongoing with such an agent [41]. Here, we demonstratedthat ultrasound and microbubbles can effectively improve outcomesin a rat glioma model using an existing liposomal agent, removing
the need to develop and test new drug formulations. The method isnoninvasive and restricts the drug delivery only to desired brain re-gions. While more work is needed to optimize the treatment and tobetter understand its safety profile, these results are promising forthe development of new treatment options for glioma patients.They join several other studies that showed this FUS method can en-hance drug delivery and improve outcomes in brain tumor models[18,20–24,42].
This study also demonstrates the importance of multiple treat-ments. Previously, a modest survival improvement (24%) comparedto untreated controls was observed with a single treatment in thistumor model [24]. With three weekly treatments, median survival
Fig. 4. Histological appearance of the brain in three of the animals from the FUS + DOXgroup. (A–B) Long-term survivor (see Fig. 2B for MRI). No tumor cells were found.Brain tissue loss at the former tumor site was evident, and the lateral ventricle was en-larged and filled this space. Tissue necrosis (infarct) was observed in the adjacent tissue,presumably from ischemia. Hemosiderin, either in clusters or insidemacrophageswas ob-servedwithin the necrotic area. A small cyst (*)was also observed. (C–E) Example fromananimal, whose tumor was resolved, but the animal was euthanized at day 36 due to poorhealth. (C) T2-weighted MRI showing tumor growth and shrinkage. At week 4, only asmall hyperintense regionwas visible. (D–E) A small necrotic areawithmacrophage infil-trationwas found at the former tumor site. (F–H) Another animal with a strong treatmentresponse, but that was euthanized due to poor health at day 32. In this animal, the tumorgrew to a relatively large size over weeks 1–2. At week 4, an extensive hyperintense areawas observed in T2-weighted imaging (F). A necrotic area with micro-hemorrhages wasfound in histology at the former tumor site (G–H). Damaged or necrotic brain tissue wasevident in the area that was hyperintense in T2-weighted imaging. A small cluster oftumor cells remained (inset in G).
108 M. Aryal et al. / Journal of Controlled Release 169 (2013) 103–111

was increased by 100% compared to the controls, and we observed a72% survival improvement compared to treatment with chemothera-py only. While the drug alone produced some treatment effects, it didnot significantly improve survival or stop tumor proliferation in mostcases. Histological examination of the tumors in this group showed aheterogeneous response to the treatment, with necrotic areas inter-spersed with viable tumor cells — perhaps consistent with heteroge-neous vascular permeability and insufficient drug delivery to someregions. It also appeared that perhaps the drug did not reach the infil-trating tumor cells, as the matrix vacuolation evident in the tumormass was not seen around the tumor cells at the tumor margin. Incontrast, all but one of the tumors in the FUS + DOX group exhibiteda strong treatment effect.
Several adverse events were observed. Three rats with little or notumor evident in histology – one in the DOX-Only group and two inthe FUS + DOX group – were euthanized due to impaired activityafter three treatments. This finding may suggest that we used an ag-gressive treatment schedule that may not be tolerated by all subjects.Doxorubicin, even when encapsulated, has multiple known side ef-fects, some of them severe. Use of medications to reduce the symp-toms of these side effects may help to avoid the impairment weobserved. In one animal (shown in Fig. 4F–H), damaged brain tissuewas evident over a large portion of the treated hemisphere. We alsoobserved brain tissue loss and necrosis in the surrounding brain inthe three long-term survivors in the FUS + DOX group. We do notknow whether these effects were due to the FUS + DOX treatmentor to the extensive tumor burden that could have damaged the sur-rounding brain due to mass effects. While previous work did notfind severe damage after one FUS + DOX treatment in normal ratbrain [19], it is possible that cumulative effects from the three treat-ments, along with known neurotoxic effects of doxorubicin [43,44],produced this damage. If that is the case, attempting to aggressively
target infiltrating tumor cells with this agent may be contraindicated,and it may be necessary to either reduce the dosage delivered to thesurrounding brain or to only target the vascular part of the tumor. Fu-ture work should evaluate the effects of multiple FUS + DOX treat-ments in the brain.
A potentially significant adverse eventwas the extensive intratumoralhemorrhagic area that occurred in one animal one week after the lastFUS + DOX treatment. While we did not observe frank bleeding (suchas into the ventricles), vascular risks associated the treatment should beexamined inmore detail. This hemorrhagemayhave resulted fromnecro-sis of the vessel wall in a large tumor vessel. Others have reported hemor-rhages in this tumor model with different doxorubicin formulations[40,45].We also observed skin toxicity, a finding that may not be surpris-ing since such toxicity, particularly in the hands and feet, is a known sideeffect of doxorubicin [46]. However, it might be prudent to confirm thatthe sonications do not increase drug delivery into the scalp. The focal re-gion of our transducer overlapped the small rat skull, and the intensity onthe scalpmayhavebeen relatively high.While the intensity on the scalp isexpected to be less in humans, this issuemight still be important, as largetumors may require sonication at hundreds of individual targets, and anylow-level effects may accumulate. Reflections from the skull bone can ex-acerbate this effect.
This study had several limitations. First, due to a national short-age of DOXIL, we used a different drug formulation in some animals.While they had similar liposome properties, there may have beendifferences unknown to us that may have impacted our results.The sample size was also relatively small, and more work is neededto better characterize the effectiveness of the treatment and therate of adverse events. More consistent results may be obtainedusing online methods to optimize the exposure levels. While wedid modify the exposure levels based on the animal age and weight,we did not go back and re-treat regions where MRI contrast en-hancement was poor to attempt to achieve a uniform level ofenhancement. We anticipate that monitoring the microbubble dy-namics in real-time using online acoustic emission monitoring[47,48] and re-treating areas with poor contrast enhancement canimprove the local delivery and perhaps allow for a reduced systemicdose. Here, we evaluated only one dose of liposomal doxorubicin.We expect that by utilizing post-treatment MRI contrast imaging,which can be correlated to drug concentrations [19,49], along withonline methods to control the exposures, we can optimize thedrug dose delivered to the tumor and the surrounding brain tissue.Since liposomal doxorubicin has a long circulation time, we can son-icate regions where a higher dose is desired (such as the vascular por-tion of the tumor) repeatedly after a delay to extend the duration ofBBB/BTB permeabilization [49] without increasing the dose to the sur-rounding brain tissue. It would also be interesting to investigate wheth-er the sonications can release the doxorubicin from the liposomes, ashas been observed by others with liposome-coated microbubbles [30].
Another limitation was our tumor model. While the 9L ratgliosarcoma model is highly aggressive and the robust survival im-provement observed here is certainly encouraging, future work isneeded with models that are genetically similar to human GBM andthat have similar growth patterns. The 9L glioma model is not consid-ered to be highly infiltrating [50] and we observed only a relativelynarrow infiltrating zone. The disruption of the BBB in the surroundingbrain tissue may not have played as large a role in our outcomes asmight be anticipated clinically. Targeting infiltration is anticipatedto be critically important with human GBM, and based on clinical pat-terns of recurrence [6–8], a margin extending several centimetersinto the “normal” brain may require BBB disruption for effective ther-apy. Additional work in a more infiltrating tumor model is needed toensure that we can safely and effectively target such regions. Finally,this model has been reported to be immunogenic [50], which mayhave led to more improved outcomes than would be achieved innon-immunogenic tumor model.
Fig. 5. Kaplan–Meier survival curves for the four experimental groups. Three long-termsurvivors, who did not exhibit impaired activity, were euthanized at different times(tick marks). Afterwards they were censored.
Table 2Survival analysis.
Treatmentgroup
Nanimals
Max.survival(days)
Mediansurvival(days)
ISTmedian
(%)Meansurvival ±S.D. (days)
P-Value,hazardratio
Control 7 23 17.5 … 18.6 ± 3 …
FUS-Only 8 21 18.0 2.9 18.9 ± 1 0.85, 1.16DOX-Only 6 27 20.3 16.2 22.5 ± 3 0.16, 1.18FUS + DOX 8 >142 35.0 100.0 64.0 ± 48 0.00031, 5.36
Note — Increase in Survival Time [ISTmedian (%)], P-value, and Hazard ratio are relativeto the Control group.P-Value and Hazard ratio from Log-Rank test between FUS + DOX and Dox-Only groupare 0.00057 and 4.52 respectively.
109M. Aryal et al. / Journal of Controlled Release 169 (2013) 103–111

Despite these limitations, the favorable outcome of these testscontinues to support the development of this drug delivery technolo-gy for brain tumors and confirms the notion that a significant im-provement in outcome can be achieved using multiple treatments.Going forward, we aim to validate these results in an infiltratinghuman GBM line and to integrate advanced methods for treatmentplanning, online monitoring, and post-treatment evaluation to maxi-mize both the treatment efficacy and safety profile.
5. Conclusions
This work demonstrates that multiple sessions using this FUStechnique to enhance the delivery of liposomal doxorubicin to tumorsand the surrounding brain can have a pronounced therapeutic effectin this rat glioma model. A strong treatment effect was observed in7/8 animals in our FUS + DOX group, with no tumor mass found inhistology in six of the animals. Median survival was increased by100% and 72% compared to control animals that received no treat-ment and DOX-Only, respectively. Adverse events, including damageto surrounding brain tissue, impaired activity, skin toxicity, and inone case, an extensively hemorrhagic tumor, were observed alongwith these treatment effects. While these events are consistent withknown side effects of doxorubicin and with an extensive tumor bur-den, future work should be performed to examine the effects of mul-tiple FUS + DOX sessions.
Acknowledgments
Thisworkwas supported byNIH grants P41EB015898, P41RR019703,and R01EB003268 and from a gift from Brudnick family. We are gratefulto Dr. Hao-Li Liu and Dr. Kuo-Chen Wei for supplying us with Lipo-Doxand Chanikarn Power for her technical help on the tumor implantation.
Appendix A. Supplementary data
Supplementary data to this article can be found online at http://dx.doi.org/10.1016/j.jconrel.2013.04.007.
References
[1] W.M. Pardridge, Drug and gene delivery to the brain: the vascular route, Neuron36 (4) (2002) 555–558.
[2] H. vonHolst, E. Knochenhauer, H. Blomgren, V.P. Collins, L. Ehn,M. Lindquist, G. Noren,C. Peterson, Uptake of adriamycin in tumour and surrounding brain tissue in patientswith malignant gliomas, Acta Neurochir. (Wien) 104 (1–2) (1990) 13–16.
[3] D. Fukumura, R.K. Jain, Tumor microenvironment abnormalities: causes, conse-quences, and strategies to normalize, J. Cell. Biochem. 101 (4) (2007) 937–949.
[4] F.M. Kievit, F.Y. Wang, C. Fang, H. Mok, K. Wang, J.R. Silber, R.G. Ellenbogen, M.Zhang, Doxorubicin loaded iron oxide nanoparticles overcome multidrug resis-tance in cancer in vitro, J. Control. Release 152 (1) (2011) 76–83.
[5] T.S. Surawicz, F. Davis, S. Freels, E.R. Laws Jr., H.R. Menck, Brain tumor survival: re-sults from the National Cancer Data Base, J. Neurooncol. 40 (2) (1998) 151–160.
[6] M.C. Chamberlain, Radiographic patterns of relapse in glioblastoma, J. Neurooncol.101 (2) (2011) 319–323.
[7] M.C. Dobelbower, O.L. Burnett Iii, R.A. Nordal, L.B. Nabors, J.M. Markert, M.D. Hyatt,J.B. Fiveash, Patterns of failure for glioblastomamultiforme following concurrent ra-diation and temozolomide, J. Med. Imaging Radiat. Oncol. 55 (1) (2011) 77–81.
[8] G. Minniti, D. Amelio, M. Amichetti, M. Salvati, R. Muni, A. Bozzao, G. Lanzetta, S.Scarpino, A. Arcella, R.M. Enrici, Patterns of failure and comparison of differenttarget volume delineations in patients with glioblastoma treated with conformalradiotherapy plus concomitant and adjuvant temozolomide, Radiother. Oncol. 97(3) (2010) 377–381.
[9] R. Stupp, M.E. Hegi, W.P. Mason, M.J. van den Bent, M.J. Taphoorn, R.C. Janzer, S.K.Ludwin, A. Allgeier, B. Fisher, K. Belanger, P. Hau, A.A. Brandes, J. Gijtenbeek, C.Marosi, C.J. Vecht, K. Mokhtari, P. Wesseling, S. Villa, E. Eisenhauer, T. Gorlia, M.Weller, D. Lacombe, J.G. Cairncross, R.O. Mirimanoff, Effects of radiotherapywith concomitant and adjuvant temozolomide versus radiotherapy alone on sur-vival in glioblastoma in a randomised phase III study: 5-year analysis of theEORTC-NCIC trial, Lancet Oncol. 10 (5) (2009) 459–466.
[10] K. Hynynen, N. McDannold, N. Vykhodtseva, F.A. Jolesz, Noninvasive MRimaging-guided focal opening of the blood–brain barrier in rabbits, Radiology220 (3) (2001) 640–646.
[11] X. Shang, P. Wang, Y. Liu, Z. Zhang, Y. Xue, Mechanism of low-frequency ultra-sound in opening blood–tumor barrier by tight junction, J. Mol. Neurosci. 43 (3)(2011) 364–369.
[12] N. Sheikov, N. McDannold, N. Vykhodtseva, F. Jolesz, K. Hynynen, Cellular mech-anisms of the blood–brain barrier opening induced by ultrasound in presence ofmicrobubbles, Ultrasound Med. Biol. 30 (7) (2004) 979–989.
[13] N. McDannold, C. Arvanitis, N. Vykhodtseva, M. Livingstone, Temporary dis-ruption of the blood–brain barrier by use of ultrasound and microbubbles:safety and efficacy evaluation in rhesus macaques, Cancer Res. 27 (2012)3652–3663.
[14] N. McDannold, N. Vykhodtseva, S. Raymond, F.A. Jolesz, K. Hynynen, MRI-guidedtargeted blood–brain barrier disruption with focused ultrasound: histologicalfindings in rabbits, Ultrasound Med. Biol. 31 (11) (2005) 1527–1537.
[15] Y.S. Tung, F. Vlachos, J.J. Choi, T. Deffieux, K. Selert, E.E. Konofagou, In vivo trans-cranial cavitation threshold detection during ultrasound-induced blood–brainbarrier opening in mice, Phys. Med. Biol. 55 (20) (2010) 6141–6155.
[16] J.F. Jordao, C.A. Ayala-Grosso, K. Markham, Y. Huang, R. Chopra, J. McLaurin, K.Hynynen, I. Aubert, Antibodies targeted to the brain with image-guided focusedultrasound reduces amyloid-beta plaque load in the TgCRND8 mouse model ofAlzheimer's disease, PLoS One 5 (5) (2010) e10549.
[17] M. Kinoshita, N. McDannold, F.A. Jolesz, K. Hynynen, Noninvasive localized deliv-ery of Herceptin to the mouse brain by MRI-guided focused ultrasound-inducedblood–brain barrier disruption, Proc. Natl. Acad. Sci. U. S. A. 103 (31) (2006)11719–11723.
[18] H.L. Liu, M.Y. Hua, H.W. Yang, C.Y. Huang, P.C. Chu, J.S. Wu, I.C. Tseng, J.J. Wang,T.C. Yen, P.Y. Chen, K.C. Wei, Magnetic resonance monitoring of focusedultrasound/magnetic nanoparticle targeting delivery of therapeutic agents tothe brain, Proc. Natl. Acad. Sci. U. S. A. 107 (34) (2010) 15205–15210.
[19] L.H. Treat, N. McDannold, N. Vykhodtseva, Y. Zhang, K. Tam, K. Hynynen, Targeteddelivery of doxorubicin to the rat brain at therapeutic levels using MRI-guided fo-cused ultrasound, Int. J. Cancer 121 (4) (2007) 901–907.
[20] H.L. Liu, M.Y. Hua, P.Y. Chen, P.C. Chu, C.H. Pan, H.W. Yang, C.Y. Huang, J.J. Wang,T.C. Yen, K.C. Wei, Blood–brain barrier disruption with focused ultrasound en-hances delivery of chemotherapeutic drugs for glioblastoma treatment, Radiology255 (2) (2010) 415–425.
[21] J. Mei, Y. Cheng, Y. Song, Y. Yang, F. Wang, Y. Liu, Z. Wang, Experimental study ontargeted methotrexate delivery to the rabbit brain via magnetic resonanceimaging-guided focused ultrasound, J. Ultrasound Med. 28 (7) (2009) 871–880.
[22] P.Y. Chen, H.L. Liu, M.Y. Hua, H.W. Yang, C.Y. Huang, P.C. Chu, L.A. Lyu, I.C. Tseng,L.Y. Feng, H.C. Tsai, S.M. Chen, Y.J. Lu, J.J. Wang, T.C. Yen, Y.H. Ma, T. Wu, J.P. Chen,J.I. Chuang, J.W. Shin, C. Hsueh, K.C. Wei, Novel magnetic/ultrasound focusing sys-tem enhances nanoparticle drug delivery for glioma treatment, Neuro Oncol. 12(10) (2010) 1050–1060.
[23] E.J. Park, Y.Z. Zhang, N. Vykhodtseva, N. McDannold, Ultrasound-mediated blood–brain/blood–tumor barrier disruption improves outcomes with trastuzumab in abreast cancer brain metastasis model, J. Control. Release 163 (3) (2012) 277–284.
[24] L.H. Treat, N. McDannold, Y. Zhang, N. Vykhodtseva, K. Hynynen, Improvedanti-tumor effect of liposomal doxorubicin after targeted blood–brain barrier dis-ruption by MRI-guided focused ultrasound in rat glioma, Ultrasound Med. Biol. 38(10) (2012) 1716–1725.
[25] W. Pardridge, Blood–brain barrier delivery, Drug Discov. Today 12 (2007) 54–61.[26] N. McDannold, G.T. Clement, P. Black, F. Jolesz, K. Hynynen, Transcranial mag-
netic resonance imaging-guided focused ultrasound surgery of brain tumors:initial findings in 3 patients, Neurosurgery 66 (2) (2010) 323–332, (discussion332).
[27] M.A. O'Reilly, A. Muller, K. Hynynen, Ultrasound insertion loss of rat parietal boneappears to be proportional to animal mass at submegahertz frequencies, UltrasoundMed. Biol. 37 (11) (2011) 1930–1937.
[28] M. Pilatou, N. Vykhodtseva, N.J. McDannold, Blood–Brain Barrier Disruption inRats Induced by Focused Ultrasound Under MRI Guidance: A Safety Study,MR-Guided Focused Ultrasound Symposium, Washington, DC, 2008.
[29] Robert D. Arnold, Donald E. Mager, Jeanine E. Slack, Robert M. Straubinger, Effectof repetitive administration of doxorubicin-containing liposomes on plasmapharmacokinetics and drug biodistribution in a rat brain tumor model, Clin. Can-cer Res. 11 (2005) 8856–8865.
[30] B. Geers, I. Lentacker, N.N. Sanders, J. Demeester, S. Meairs, S.C. De Smedt,Self-assembled liposome-loaded microbubbles: the missing link for safe and effi-cient ultrasound triggered drug-delivery, J. Control. Release 152 (2) (2011)249–256.
[31] J.M. Bland, D.G. Altman, Multiple significance tests: the Bonferroni method, BMJ310 (6973) (1995) 170.
[32] A.C. Stan, S. Casares, D. Radu, G.F. Walter, T.D. Brumeanu, Doxorubicin-induced celldeath in highly invasive human gliomas, Anticancer Res. 19 (2A) (1999) 941–950.
[33] K.A. Walter, R.J. Tamargo, A. Olivi, P.C. Burger, H. Brem, Intratumoral chemother-apy, Neurosurgery 37 (6) (1995) 1128–1145.
[34] S. Voulgaris, M. Partheni, M. Karamouzis, P. Dimopoulos, N. Papadakis, H.P.Kalofonos, Intratumoral doxorubicin in patients with malignant brain gliomas,Am. J. Clin. Oncol. 25 (1) (2002) 60–64.
[35] S. Ananda, A.K. Nowak, L. Cher, A. Dowling, C. Brown, J. Simes, M.A. Rosenthal,Phase 2 trial of temozolomide and pegylated liposomal doxorubicin in the treat-ment of patients with glioblastoma multiforme following concurrent radiothera-py and chemotherapy, J. Clin. Neurosci. 18 (11) (2011) 1444–1448.
[36] T. Hekmatara, C. Bernreuther, A.S. Khalansky, A. Theisen, J. Weissenberger, J.Matschke, S. Gelperina, J. Kreuter, M. Glatzel, Efficient systemic therapy of ratglioblastoma by nanoparticle-bound doxorubicin is due to antiangiogenic effects,Clin. Neuropathol. 28 (3) (2009) 153–164.
110 M. Aryal et al. / Journal of Controlled Release 169 (2013) 103–111

[37] T. Siegal, A. Horowitz, A. Gabizon, Doxorubicin encapsulated in sterically stabi-lized liposomes for the treatment of a brain tumor model: biodistribution andtherapeutic efficacy, J. Neurosurg. 83 (6) (1995) 1029–1037.
[38] S.C. Steiniger, J. Kreuter, A.S. Khalansky, I.N. Skidan, A.I. Bobruskin, Z.S. Smirnova,S.E. Severin, R. Uhl, M. Kock, K.D. Geiger, S.E. Gelperina, Chemotherapy of glio-blastoma in rats using doxorubicin-loaded nanoparticles, Int. J. Cancer 109 (5)(2004) 759–767.
[39] S. Wohlfart, A.S. Khalansky, C. Bernreuther, M. Michaelis, J. Cinatl Jr., M. Glatzel, J.Kreuter, Treatment of glioblastoma with poly(isohexyl cyanoacrylate)nanoparticles, Int. J. Pharm. 415 (1–2) (2011) 244–251.
[40] R. Zhou, R. Mazurchuk, R.M. Straubinger, Antivasculature effects of doxorubicin-containing liposomes in an intracranial rat brain tumor model, Cancer Res. 62(9) (2002) 2561–2566.
[41] P. Gaillard, W. Gladdines, C. Appeldoorn, J. Rip, W. Boogerd, J. Beijnen, D. Brandsma,Olaf van Tellingen, Development of glutathione pegylated liposomal doxorubicin(2B3-101) for the treatment of brain cancer, Cancer Res. 72 (8) (2012).
[42] F. Yang, M.-C. Teng, M. Lu, H.-F. Liang, Y.-R. Lee, C.-C. Yen, M.-L. Liang, T.-T. Wong,Treating glioblastoma multiforme with selective high-dose liposomal doxorubi-cin chemotherapy induced by repeated focused ultrasound, Int. J. Nanomedicine7 (2012) 965–974.
[43] E.A. Neuwelt, M. Glasberg, E. Frenkel, P. Barnett, Neurotoxicity of chemothera-peutic agents after blood–brain barrier modification: neuropathological studies,Ann. Neurol. 14 (3) (1983) 316–324.
[44] A. Kondo, T. Inoue, H. Nagara, J. Tateishi, M. Fukui, Neurotoxicity of adriamycinpassed through the transiently disrupted blood–brain barrier by mannitol inthe rat brain, Brain Res. 412 (1) (1987) 73–83.
[45] I. Brigger, J. Morizet, L. Laudani, G. Aubert, M. Appel, V. Velasco, M.J. Terrier-Lacombe, D. Desmaele, J. d'Angelo, P. Couvreur, G. Vassal, Negative preclinicalresults with stealth nanospheres-encapsulated doxorubicin in an orthotopic mu-rine brain tumor model, J. Control. Release 100 (1) (2004) 29–40.
[46] B. Uziely, S. Jeffers, R. Isacson, K. Kutsch, D. Wei-Tsao, Z. Yehoshua, E. Libson, F.M.Muggia, A. Gabizon, Liposomal doxorubicin: antitumor activity and unique toxic-ities during two complementary phase I studies, J. Clin. Oncol. 13 (7) (1995)1777–1785.
[47] N. McDannold, N. Vykhodtseva, K. Hynynen, Targeted disruption of the blood–brain barrier with focused ultrasound: association with cavitation activity, Phys.Med. Biol. 51 (4) (2006) 793–807.
[48] M.A. O'Reilly, K. Hynynen, Blood–brain barrier: real-time feedback-controlledfocused ultrasound disruption by using an acoustic emissions-based controller,Radiology 263 (1) (2012) 96–106.
[49] J. Park, Y. Zhang, N. Vykhodtseva, F.A. Jolesz, N.J. McDannold, The kinetics of bloodbrain barrier permeability and targeted doxorubicin delivery into brain inducedby focused ultrasound, J. Control. Release 162 (1) (2012) 134–142.
[50] R.F. Barth, B. Kaur, Rat brain tumor models in experimental neuro-oncology: theC6, 9L, T9, RG2, F98, BT4C, RT-2 and CNS-1 gliomas, J. Neurooncol. 94 (3) (2009)299–312.
111M. Aryal et al. / Journal of Controlled Release 169 (2013) 103–111