microeconomic impact of remittance on household...
TRANSCRIPT

Microeconomic Impact of Remittance on Household Welfare:
Evidence from Bangladesh
Dr. Syed Naimul WadoodMd. Amzad Hossain
February 20, 2016

Background
• Overseas remittance earnings have become a major source of financial inflow for Bangladesh economy in recent years.
• Remittance earnings, as equivalent to share of Bangladesh’s Gross Domestic Product (GDP), have been consistently on the increase and by 2012 this has reached an equivalent of 12 percent (Bangladesh Bank, 2014).
• It has been argued that this has helped employment generation, reduction of unemployment, increases in the foreign exchange reserves and also immensely contributed to an acceleration of overall national economic development (Ministry of Finance, 2014).
• World Bank (2012) argues that remittances contribute to growth of output in the economy by augmenting consumption and investment demand as well as savings.

Background
• Consequently, the economic impact of migration and remittances has received an increasing interest from both researchers and policy makers
• Some interesting empirical query that merit investigations are ,
whether remittance earnings enhance household well-being.
Whether the impact of Internal and external remittance are different

Background
• A challenge when estimating the causal impact of migration and remittances on household welfare is self-selection.
• In this study, a matching approach will be applied in order to address the possible self-selection issue. Treatment will in this case be whether the household receives remittances, in order to measure the average treatment effect of the treated.
• The advantage with this approach is that it allows us to compare households that receive remittances with otherwise similar households that do not receive remittances in order to mitigate the self-selection bias.

Evidence from Micro Data:
Low or medium skill service sector jobs dominate while only a few professionals are observed
• a total of five job classifications comprise of more than 41 percent observations, and a total of some other 57 job classifications comprise the remaining 59 percent observations (out of a total of 1,337 observations)
• The five job classifications include firstly, chef, cook, hotel boy and other related categories, secondly, unclassified sales worker, thirdly, unclassified service worker categories, fourthly, house caretaker, cleaner and related categories and fifthly, car driver & conductor, auto and manual works.
• Only a few professionals are present within the list of remittance-sending migrant workers whereas mostly service worker, commonly unskilled or semi-skilled and rarely skilled, are present within the list of remittance-senders.

Evidence from Micro Data:Average remittances from major host countries lower compared to other,
non-major host countries
Country Number of
Observations
Average
Remittance Sent
(TK.)
Standard Error
(TK.)
Major Four Country Group (964 Observations)
Major Four
Countries
964 127,500 4,095
Saudi Arabia 478 143,121 6,877
U.A.E. 262 106,752 5,928
Malaysia 132 112,197 6,654
Kuwait 92 127,391 12,717
Other Countries (373 Observations)
Other Countries 373 157,030 17,031
t-test of mean differences t = 2.37 (with degrees of freedom 1,335); p-value= 0.018

Evidence From Micro Data:Remittance amount increases with age of the remittance-senders
Age Group No. of
Observations and
Percent of total
Average
Remittance Sent
(TK.)
Standard Error
Up to 30 years 567 (42.41) 120,900.4 4180.02
Age in between
30 and 40
455 (34.03) 137,053.7 13027.19
Age in between
40 and 50
236 (17.65) 148,540.4 12,890.4
Age above 50
years
79 (5.91) 196,421.5 30,445.8
Total 1,337 (100.00) 135,738.8 5,602

Evidence From Micro data:Educational level matters for remittance amount sent, at least
at the SSC level
Educational
Level Attained
No. of
Observations and
Percent of total
Average
Remittance Sent
(TK.)
Standard Error
Illiterate 128 (9.57) 139,236 18,256
Class 1 to 5 343 (26.65) 114,401 5,777
Class 6 to
SSC/Equivalent
706 (52.80) 138,505 8,460
HSE/Equivalent
and Higher
160 (11.97) 166,480 20,584
Total 1,337 (100.00) 135,738.8 5,602

Methodology and Data
• Remittance-recipient and non-recipient households are likely to differ from each other in many observable and unobservable characteristics that might be correlated with the outcome variables.
• Selectivity issues therefore, complicate studies measuring the impact of remittances.
• Existing studies are mostly non-experimental and do not always use an appropriate method to deal with selection issues.
• Some authors use instrumental variables to overcome this problem; however, it is difficult to determine and test a correct instrument

Methodology and Data
• In order to address potential bias due to unobserved heterogeneity we use propensity matching estimators introduced first by Rosenbaunand Rubin (1983).
• In this type of method each treated observation (remittance-receiving household) is matched to a fixed number of control observations (non-remittance-receiving household) based on a propensity score.
• With this approach we are able to calculate robust estimators in order to determine the effects of remittances on households’ poverty levels.
• Basically, this method makes it possible to construct counterfactuals to find out what would happen to a remittance-receiving household’s poverty level if the household does not receive remittances.

Data
Household Head’s sex
Household Head’s age
Household Head’s
education level
Household Head’s
occupation
No of household
members
Access to electricity
Access to mobile
Land size
Household Usable
Space (Sq. feet)
Source of Drinking
Water
Wall Material
Sanitation type
Rural/Urban dummy
Division Dummies
•We have used Household Income and expenditure Survey to estimate the impact of remittance on household welfare.•Variables that used have been used to estimate Propensity score are listed below

Result of Logit Model for PSM(1) (2) (3)
VARIABLES
Household
received any type
of remittance
Household
received inward
remittance
Household
received foreign
remittance
Household size 0.000235*** 0.000130*** 0.000160***
(5.79e-05) (3.85e-05) (4.81e-05)
mobile 0.662*** 0.153** 1.017***
(0.0512) (0.0598) (0.0776)
telephone -0.0745 -0.000646 -0.0671
(0.132) (0.169) (0.149)
electricity 0.120*** -0.0962* 0.255***
(0.0421) (0.0547) (0.0523)
Sex of HH head -1.381*** -0.785*** -1.312***
(0.0441) (0.0541) (0.0490)
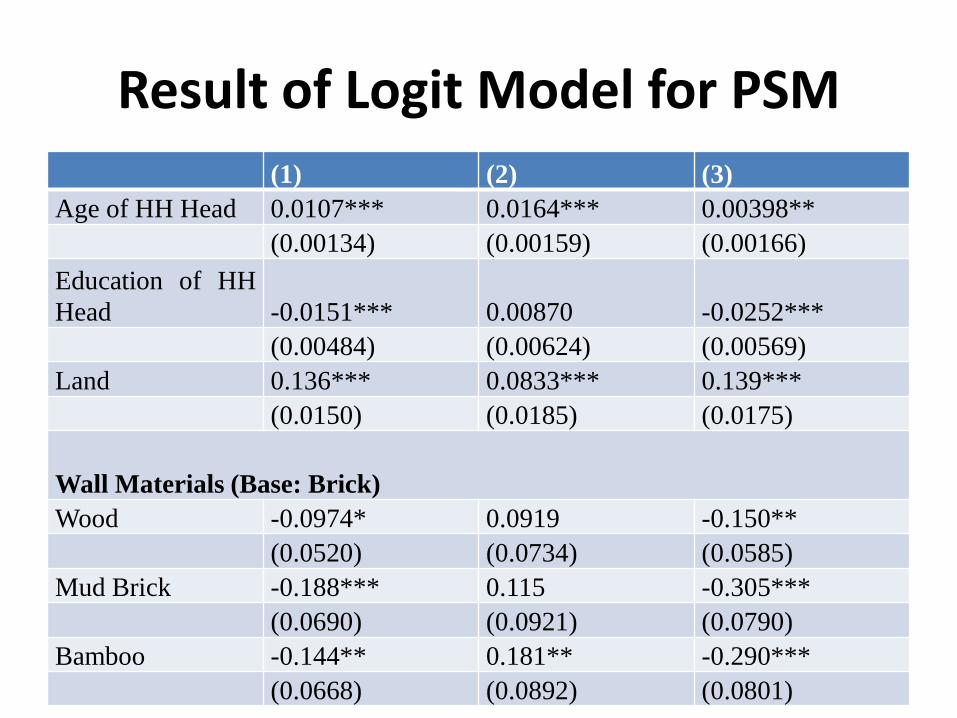
Result of Logit Model for PSM
(1) (2) (3)
Age of HH Head 0.0107*** 0.0164*** 0.00398**
(0.00134) (0.00159) (0.00166)
Education of HH
Head -0.0151*** 0.00870 -0.0252***
(0.00484) (0.00624) (0.00569)
Land 0.136*** 0.0833*** 0.139***
(0.0150) (0.0185) (0.0175)
Wall Materials (Base: Brick)
Wood -0.0974* 0.0919 -0.150**
(0.0520) (0.0734) (0.0585)
Mud Brick -0.188*** 0.115 -0.305***
(0.0690) (0.0921) (0.0790)
Bamboo -0.144** 0.181** -0.290***
(0.0668) (0.0892) (0.0801)

Result of Logit Model for PSM
(1) (2) (3)
Chittagong 0.211*** -0.458*** 0.775***
(0.0671) (0.0822) (0.0934)
Dhaka -0.191*** -0.564*** 0.344***
(0.0636) (0.0732) (0.0908)
Khulna -0.522*** -0.663*** -0.0433
(0.0796) (0.0926) (0.110)
Rajshahi -0.497*** -0.727*** 0.0257
(0.0846) (0.104) (0.113)
Rangpur -0.636*** -0.536*** -0.685***
(0.0982) (0.100) (0.168)
Sylhet -0.226*** -0.933*** 0.431***
(0.0870) (0.133) (0.110)
Constant -1.885*** -2.417*** -2.606***
(0.141) (0.182) (0.172)
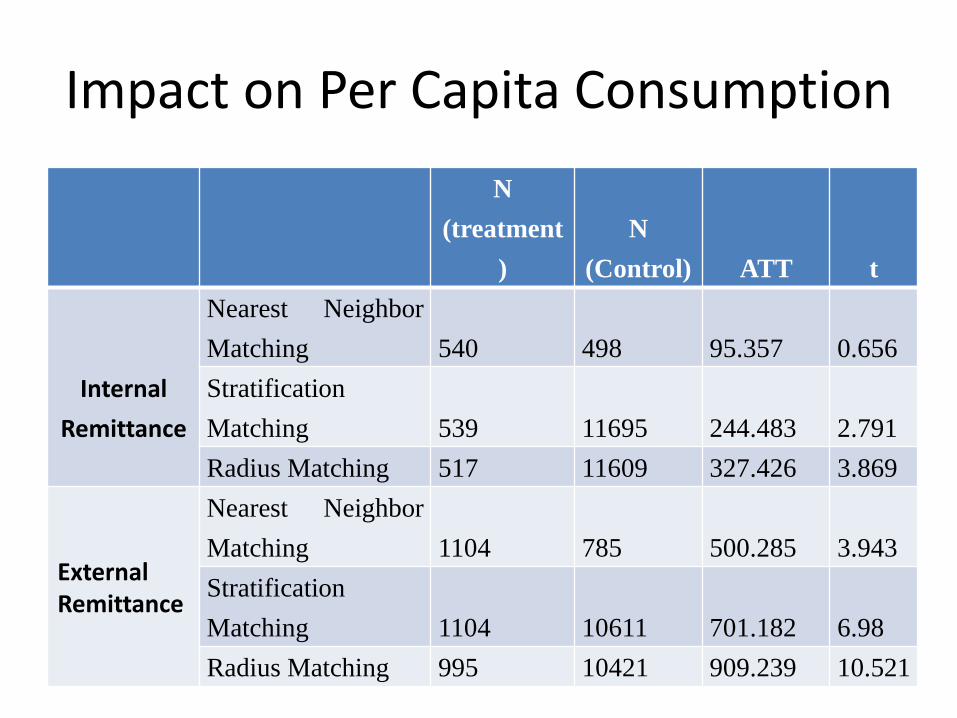
Impact on Per Capita Consumption
N
(treatment
)
N
(Control) ATT t
Internal
Remittance
Nearest Neighbor
Matching 540 498 95.357 0.656
Stratification
Matching 539 11695 244.483 2.791
Radius Matching 517 11609 327.426 3.869
ExternalRemittance
Nearest Neighbor
Matching 1104 785 500.285 3.943
Stratification
Matching 1104 10611 701.182 6.98
Radius Matching 995 10421 909.239 10.521

Impact on Per capita Food Expenditure
N
(treatment
)
N
(Control) ATT t
Internal
Remittance
Nearest Neighbor
Matching 540 498 119.089 2.158
Stratification
Matching 539 11695 140.245 3.467
Radius Matching 517 11609 179.054 4.678
ExternalRemittance
Nearest Neighbor
Matching 1104 785 191.381 4.165
Stratification
Matching 1104 10611 256.75 6.872
Radius Matching 995 10421 333.424 9.667
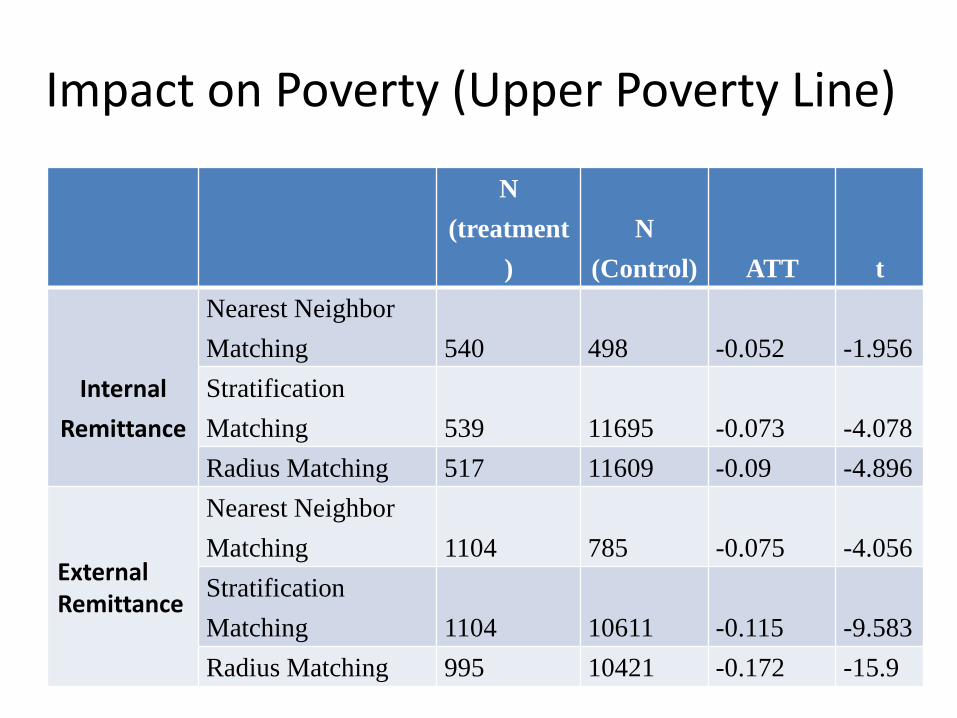
Impact on Poverty (Upper Poverty Line)
N
(treatment
)
N
(Control) ATT t
Internal
Remittance
Nearest Neighbor
Matching 540 498 -0.052 -1.956
Stratification
Matching 539 11695 -0.073 -4.078
Radius Matching 517 11609 -0.09 -4.896
ExternalRemittance
Nearest Neighbor
Matching 1104 785 -0.075 -4.056
Stratification
Matching 1104 10611 -0.115 -9.583
Radius Matching 995 10421 -0.172 -15.9

Impact on Health Expenditure
N
(treatment
)
N
(Control) ATT t
Internal
Remittance
Nearest Neighbor
Matching 540 498 1435.387 2.3
Stratification
Matching 539 11695 802.655 1.52
Radius Matching 517 11609 802.655 1.52
ExternalRemittance
Nearest Neighbor
Matching 1104 785 1919.215 1.659
Stratification
Matching 1104 10611 2714.036 3.39
Radius Matching 995 10421 3086.422 3.776

Impact on Calorie Intake
N
(treatment
)
N
(Control) ATT t
Internal
Remittance
Nearest Neighbor
Matching 540 498 108.126 2.789
Stratification
Matching 539 11695 119.501 4.009
Radius Matching 517 11609 118.35 4.116
ExternalRemittance
Nearest Neighbor
Matching 1104 785 -7.395 -0.236
Stratification
Matching 1104 10611 40.916 1.696
Radius Matching 995 10421 84.11 4.11

Concluding Remarks
• The results of the empirical exercise tend to support the conclusion that remittances have a positive impact on per capita incomes and, crucially, contribute to a decline in poverty status.
• Our empirical results reveal therefore that appropriate policy to explore more foreign employment and more proficient use of remittances would help the well-being of the households.

Policy Suggestions
• First, Competition within the banking sector needs to be encouraged to mitigate the high fees charged by financial institutions and harness a greater number of formal remittances.
• Second, in order to capitalize on the untraditional market effectively the government must promote and empower women in the workforce.

Policy Suggestions
• Third, our study finding echoes the findings of World Bank (2012) such that direct benefits of remittance earning fall disproportionately on the Eastern part of the country, whereas the Western and the Southern part of the country have been largely bypassed.
The government of Bangladesh should proactive measures to increase the number of migrant workers from the Southern and western belt in order to reduce this regional disparity.
Policy Suggestions
• Fourth, the overseas migration in Bangladesh traditionally have been limited to mostly Middle East and only recently in some South-East Asian countries.
• Therefore GOB should take steps to explore new market opportunities not only limited to these ones, but also include other European countries like Federation of Russia, Sweden, Norway, Germany, the Netherlands as well as some South East Asian countries like Brunei, Malaysia, Singapore and Hong Kong.

Policy Suggestions
• Fifth, the amount of illegal migration that still occurs in Bangladesh warrants further attention.
• There should also be increased cooperation between origin countries and countries of destination so that there is a more coordinated and uniform effort in regulation of migration and enforcement of ethical practices and laws.
• Sixth, It is also important that institutions introduce new savings instruments as well as further opportunities whereby migrants can channel their remittance funds into productive sectors of the economy (World Bank 2005)

Policy Suggestions
• Finally, while it is clear that remittances improves welfare, it is the households that are better able to afford the initial cost of the overseas migration that benefit the most (World Bank 2007).
• Policy initiatives such as the expansion of social programs in microfinance and skills development, and the lowering of interest rates on pre-departure loan schemes (World Bank 2005) could provide the necessary help for struggling households not yet meeting the initial cost of migration.

Questions
&
Answers