microgenomics of skeletal muscle ... -...
TRANSCRIPT

Sede Amministrativa: Università degli Studi di Padova
Dipartimento di Biologia
SCUOLA DI DOTTORATO DI RICERCA IN : BIOSCIENZE
INDIRIZZO: GENETICA E BIOLOGIA MOLECOLARE DELLO SVILUPPO
CICLO XIII
MICROGENOMICS OF SKELETAL MUSCLE:
TRANSCRIPTIONAL ANALYSIS OF ISOLATED MURINE MYOFIBERS
Direttore della Scuola : Ch.mo Prof. Giuseppe Zanotti
Coordinatore d’indirizzo: Ch.mo Prof. Paolo Bonaldo
Supervisore :Ch.mo Prof. Gerolamo Lanfranchi
Dottorando : Francesco Chemello

INDEX
Abstract 1
Abstract (Italian) 3
1. Introduction 5
1.1 Myofibers 5
1.1.1 Skeletal muscle 5
1.1.2 Anatomy of myofibers 7
1.1.3 Nomenclature of myofibers 8
1.1.4 Excitation-contaction coupling and Ca2+
homeostasis 10
1.1.5 Molecular composition of sarcomere 12
1.1.6 Myosin 16
1.1.7 Fiber type plasticity in response to nerve activity 19
1.2 DNA microarrays and microgenomics 21
1.2.1 Microarray: an overview 21
1.2.2 Microarray planning 23
1.2.3 Target preparation 26
1.2.4 Hybridization and scanning 28
1.2.5 Data analysis 29
1.2.6 Microgenomics 32
1.3 Microarrays and skeletal muscle 33
1.3.1 Muscling on microarrays 33
1.3.2 Microarrays of fast- and slow-twitch 34
1.3.3 Why microgenomics on skeletal muscle? 35
2. Aims of the experimental project 37
3. Materials and methods 39
3.1 Isolation and characterization of skeletal muscle fibers 39
3.2 RNA purification 40
3.3 RNA amplification and labeling 42
3.4 Microarray hybridization 45
3.5 Data analysis 47
3.2 Quantitative real-time PCR 49
4. Results and discussion 51
4.1 Microgenomics on skeletal muscle 51
4.2 Expression profiles of type 1 and type 2B fibers using Operon
microarrays 53
4.2.1 Experimental design 53
4.2.2 Removal of non-muscle cells and enrichment for muscle
specific genes 56
4.2.3 Molecular signatures of individual slow oxidative and
fast glycolytic myofibers 59
4.2.4 Novel potential markers of fiber types 64
4.3 Expression profiles of fiber types using Agilent microarrays 67
4.3.1 Experimental design 67
4.3.2 Comparison between collagenase treated and not treated muscles 68
4.3.3 Comparison between isolated myofibers and whole muscles 72
4.3.4 Analysis on isolated skeletal muscle fibers 76
5. Conclusions 85
6. References 91
7. Acknowledgments 103
1
ABSTRACT
Background: The complex anatomy of skeletal muscle and the heterogeneity of
myofibers are actually obstacles when gene expression studies are undertaken using
whole muscle samples, as it would be important to precisely identify the actual
contribution of single myofibers to the muscle transcriptional phenotype. To be really
informative on diversity among fiber types, experiments on gene expression should be
carried out at the level of single fibers. The goal of the work was to define the
phenotype of single muscle myofibers in terms of gene expression. I choose the
genomic technology of transcriptome profiling because it allows a wide phenotypic
characterization, and because change in gene expression is the most immediate answer
of muscle fiber to any physiological stimulus.
Materials and methods: I set up experimental procedures aimed to obtain good quality
microarray data from isolated myofibers. Fibers were gently dissociated after enzymatic
treatment with collagenase from soleus and extensor digitorum longus murine muscles.
Each fiber was divided in two fragments: the first was used for myosin heavy chain
isoform classification by SDS-PAGE and the second for microarray experiments.
Microarray data were confirmed by real-time PCR.
Results and discussion: Microgenomic technologies have been successfully applied at
the level of single muscle fibers and this represents a technological advancement in the
field of muscle physiology. Expression profiles of isolated myofibers are free of non-
muscle transcripts. Comparison of fiber types allowed the identification of modules of
co-expressed genes (coding for proteins involved in muscle contraction, metabolism,
and Ca2+
homeostasis) that define physiological properties of skeletal muscle fibers and
would allow a better understanding of the plastic transcriptomic transitions occurring in
myofibers under physiological and pathological conditions.

2

3
ABSTRACT (Italian)
Introduzione: I profili di espressione genica di muscolo risentono della complessa
composizione cellulare del muscolo scheletrico e dell’eterogeneità delle stesse miofibre
che lo compongono. È necessario riuscire a definire come queste singole unità
contrattili contribuiscano al fenotipo trascrizionale del muscolo e dunque, per essere
veramente informativi sulla diversità tra i tipi di fibra, gli esperimenti di espressione
genica dovrebbero essere condotti a livello delle singole fibre. Questo lavoro si pone
come obiettivo la descrizione trascrittomica del fenotipo dei diversi tipi di miofibra. Ho
scelto di utilizzare le tecnologie genomiche per studiare il trascrittoma poiché
permettono una caratterizzazione fenotipica su larga scala e perché i cambiamenti di
espressione genica sono la risposta più immediata delle fibre muscolari ai vari stimoli
fisiologici.
Materiali e metodi: Ho sviluppato una serie di procedure sperimentali volte a ottenere
dati di microarray di buona qualità partendo da miofibre isolate. Le fibre vengono
dissociate dopo trattamento enzimatico con collagenasi dai muscoli di topo soleo ed
extensor digitorum longus. Ciascuna fibra è stata divisa in due parti: la prima è stata
utilizzata per la classificazione dell’isoforma della catena pesante della miosina
attraverso SDS-PAGE e la seconda per gli esperimenti di microarray. I risultati ottenuti
sono stati confermati tramite PCR quantitativa.
Risultati e discussione: Le tecnologie microgenomiche sono state applicate con
successo a livello delle singole fibre muscolari e questo rappresenta un’importante
innovazione tecnologica nel campo della fisiologia del muscolo. Il confronto tra i vari
tipi di fibra ha permesso di individuare moduli di geni co-espressi (codificanti per
proteine coinvolte nella contrazione muscolare, nel metabolismo e nell’omeostasi del
Ca2+
) che definiscono le proprietà fisiologiche delle fibre del muscolo scheletrico e che
permetteranno una maggior comprensione dei cambiamenti plastici del trascrittoma in
diverse condizioni fisiopatologiche.

4

5
1. INTRODUCTION
1.1 Myofibers
1.1.1 Skeletal muscle
Skeletal muscle comprises 40% of the body mass and is a transformer of electrical
energy (from the nerve impulse), through chemical energy (by the breakdown of
adenosine triphosphate) to mechanical energy, supporting movement, respiration, and
biochemical homeostasis (Helliwell TR, 1999).
The basic functional units of skeletal muscle are the muscle fibers (also called
myofibers). These are cylindrical multinucleated cells formed from the fusion of
mononucleated myocytes. Myocytes are the postmitotic daughters of myoblasts, the
stem cells of developing muscle. The multinucleated skeletal muscle cells that originate
from myocyte fusions during embryogenesis are termed myotubes. Two waves of
mononucleated cell proliferation result in the formation of initial or primary myotubes
and later secondary myotubes that share a common basal lamina and are coupled by gap
junctions. During maturation of the myotube, the centrally positioned nuclei move to
the periphery and the primary and secondary myotubes lose their interconnecting
junctions. These myotubes gain their own basal lamina and become independent adult
muscle fibers, each with its own innervation. Neighboring muscle fibers aggregate to
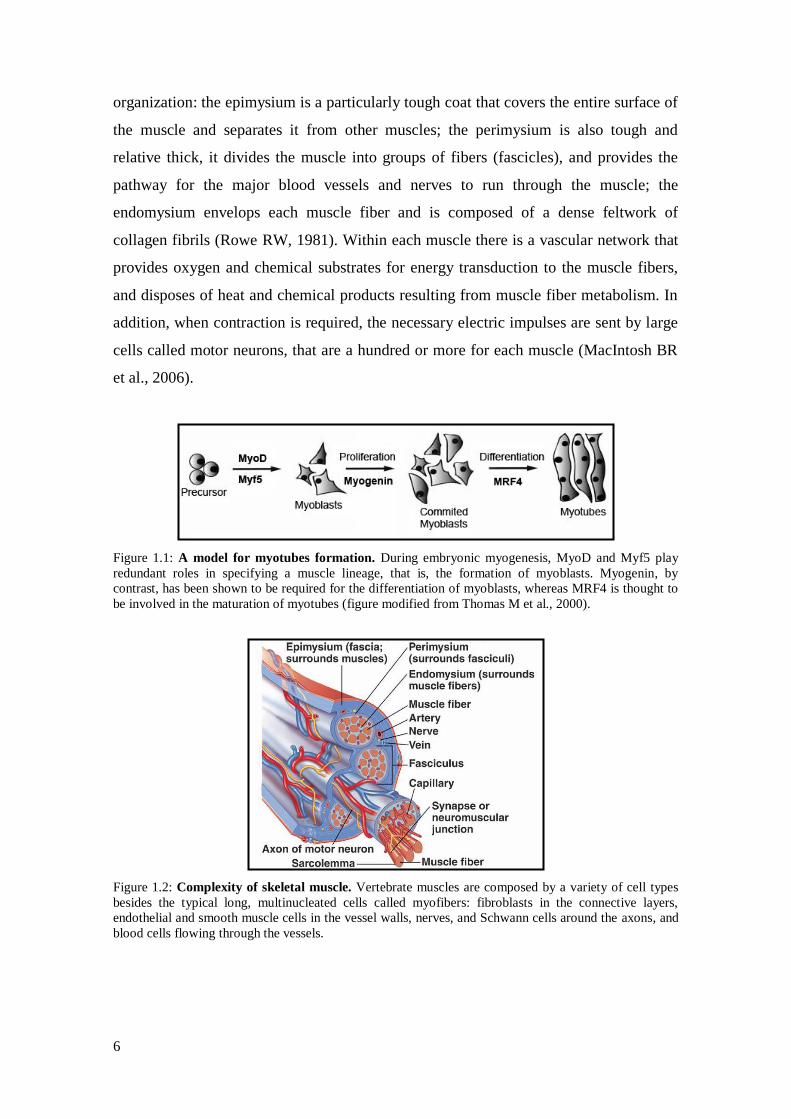
form muscle fascicles (Sanger JW et al., 2003). The four basic helix-loop-helix
myogenic regulatory factors (MRFs) - MyoD, myogenin, Myf5 and MRF4 - act at
multiple points in the skeletal muscle lineage to establish the skeletal muscle phenotype
(Fig. 1.1). The MRFs collaborate with members of the myocyte enhancer binding
factor-2 (MEF2) family to activate muscle structural genes (Molkentin JD & Olson EN,
1996). Moreover, quiescent stem cells (i.e., satellite cells) are associated with muscle
fibers. In response to injury or exercise, mononucleated satellite cells divided and either
fuse with injured fibers or form entirely new myotubes (LaBarge MA & Blau HM,
2002).
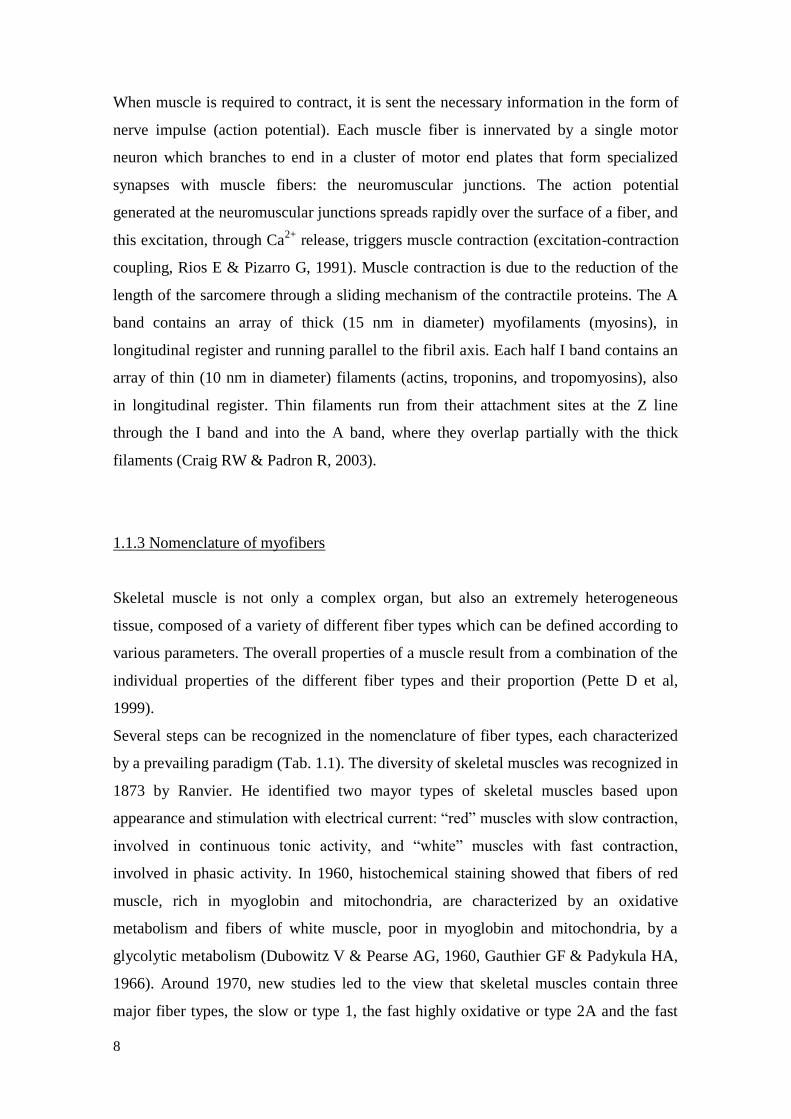
However, skeletal muscle is a complex organ composed by a variety of cell types
besides the myofibers (Fig. 1.2). Each muscle has a general structure that includes
various connective tissue components that contributes to the muscle shape and
6
organization: the epimysium is a particularly tough coat that covers the entire surface of
the muscle and separates it from other muscles; the perimysium is also tough and
relative thick, it divides the muscle into groups of fibers (fascicles), and provides the
pathway for the major blood vessels and nerves to run through the muscle; the
endomysium envelops each muscle fiber and is composed of a dense feltwork of
collagen fibrils (Rowe RW, 1981). Within each muscle there is a vascular network that
provides oxygen and chemical substrates for energy transduction to the muscle fibers,
and disposes of heat and chemical products resulting from muscle fiber metabolism. In
addition, when contraction is required, the necessary electric impulses are sent by large
cells called motor neurons, that are a hundred or more for each muscle (MacIntosh BR
et al., 2006).
Figure 1.1: A model for myotubes formation. During embryonic myogenesis, MyoD and Myf5 play
redundant roles in specifying a muscle lineage, that is, the formation of myoblasts. Myogenin, by
contrast, has been shown to be required for the differentiation of myoblasts, whereas MRF4 is thought to
be involved in the maturation of myotubes (figure modified from Thomas M et al., 2000).
Figure 1.2: Complexity of skeletal muscle. Vertebrate muscles are composed by a variety of cell types
besides the typical long, multinucleated cells called myofibers: fibroblasts in the connective layers,
endothelial and smooth muscle cells in the vessel walls, nerves, and Schwann cells around the axons, and
blood cells flowing through the vessels.

7
1.1.2 Anatomy of myofibers
Vertebrate striated muscle fibers are single, multinucleate, membrane-bounded cells,
typically 10 - 100 µm in diameter and several millimeters long (Fig. 1.3 A). Two types
of nuclei are present within the fibers: the sarcolemmal nuclei, which transcribe mRNAs
for fiber-specific proteins, and satellite cell nuclei, which are the stem cells of muscle,
providing the source of new nuclei for post-natal muscle growth and for muscle
regeneration after damage (Schultz E, 1989). In longitudinal section, the nuclei are
located at the edge of the fiber and the bulk of the cytoplasm is occupied by the
contractile filaments, arranged in a regular manner giving rise to the regular pattern of
traverse stripes that are visible under the light microscope. Myofibers posses an intricate
membrane system: the basement membrane surrounds each muscle fiber; the
sarcolemma is the plasma membrane of the fiber situated immediately beneath the
basement membrane; and the sarcoplasmatic reticulum (SR) is a modified
endoplasmatic reticulum that envelopes the myofibrils, which are the units responsible
for contraction and relaxation of the fiber (Helliwell TR, 1999). Each fiber is packed
with numerous myofibrils, which are themselves striated and are furthermore in register,
thus producing the striated appearance of fiber as a whole. The striation pattern of the
myofibril repeats with a periodicity of about 2 to 3 µm. The repeating unit, known as a
sarcomere, is the fundamental contractile unit of striated muscle (Fig. 1.3 B). The
sarcomere is flanked at each end by a dense, narrow line known as the Z line. Each Z
line bisects a lighter I band, which is shared between adjacent sarcomeres. At the center
of the sarcomere lies the dense A band, dissected by a less dense H zone. In the middle
of H zone is a narrow band of higher density called the M line (Craig RW & Padron R,
2003).
Figure 1.3: Myofiber structure. Myofibers are elongated cells (A). They have multiple nuclei and these
nuclei are located on the periphery of the cell. The typical striated pattern is due to the complex structure
of the sarcomere, the contractile unit of muscle (B).
8
When muscle is required to contract, it is sent the necessary information in the form of
nerve impulse (action potential). Each muscle fiber is innervated by a single motor
neuron which branches to end in a cluster of motor end plates that form specialized
synapses with muscle fibers: the neuromuscular junctions. The action potential
generated at the neuromuscular junctions spreads rapidly over the surface of a fiber, and
this excitation, through Ca2+
release, triggers muscle contraction (excitation-contraction
coupling, Rios E & Pizarro G, 1991). Muscle contraction is due to the reduction of the
length of the sarcomere through a sliding mechanism of the contractile proteins. The A
band contains an array of thick (15 nm in diameter) myofilaments (myosins), in
longitudinal register and running parallel to the fibril axis. Each half I band contains an
array of thin (10 nm in diameter) filaments (actins, troponins, and tropomyosins), also
in longitudinal register. Thin filaments run from their attachment sites at the Z line
through the I band and into the A band, where they overlap partially with the thick
filaments (Craig RW & Padron R, 2003).
1.1.3 Nomenclature of myofibers
Skeletal muscle is not only a complex organ, but also an extremely heterogeneous
tissue, composed of a variety of different fiber types which can be defined according to
various parameters. The overall properties of a muscle result from a combination of the
individual properties of the different fiber types and their proportion (Pette D et al,
1999).
Several steps can be recognized in the nomenclature of fiber types, each characterized
by a prevailing paradigm (Tab. 1.1). The diversity of skeletal muscles was recognized in
1873 by Ranvier. He identified two mayor types of skeletal muscles based upon
appearance and stimulation with electrical current: “red” muscles with slow contraction,
involved in continuous tonic activity, and “white” muscles with fast contraction,
involved in phasic activity. In 1960, histochemical staining showed that fibers of red
muscle, rich in myoglobin and mitochondria, are characterized by an oxidative
metabolism and fibers of white muscle, poor in myoglobin and mitochondria, by a
glycolytic metabolism (Dubowitz V & Pearse AG, 1960, Gauthier GF & Padykula HA,
1966). Around 1970, new studies led to the view that skeletal muscles contain three
major fiber types, the slow or type 1, the fast highly oxidative or type 2A and the fast

9
weakly oxidative or type 2B (Brooke MH & Kaiser KK, 1970, Peter JB et al., 1972,
Schiaffino S, 2010). The next step was the identification of correlations between the
myosin heavy chain (MyHC) isoform expression via electrophoresis and contraction
speed and myosin ATPase activity (Tab. 1.2, Reiser PJ et al., 1985, Staron RS & Pette
D, 1986). Schiaffino S et al.,1989, further described a third possible fiber type in fast
skeletal muscle with the discovery of the 2x MyHC protein. With the advent of
histochemical and immunohistochemical staining of MyHC, fiber types have been
classified on the basis of MyHC isoforms into type 1 “slow-oxidative”, type 2A “fast-
oxidative”, and “fast-glycolytic” was categorized into types 2X and 2B in rodents, while
2X, but not 2B, is expressed in humans (Smerdu V et al., 1994). Baldwin KM &
Haddad F, 2001, suggested that the co-expression of MyHC isoforms within the same
muscle fiber marks a subpopulation of fibers with high adaptive potential, i.e., hybrid
fibers are more suitable to switch phenotype to meet new functional demands.
Prevailing paradigm Selected milestones
Two muscle types Color of muscle (Ranvier, 1873)
Two muscle fiber
types:
Fast white fibers
Slow red fibers
Enzyme histochemistry reveals reciprocal relation between glycolytic and
oxidative enzymes in muscle fibers (Dubowitz V & Pearse AG, 1960).
Three muscle fiber
types:
Slow type 1
Fast type 2A
Fast type 2B
Extensor digitorum longus muscle contains fibers with similar fast-twitch
properties but with different levels of succinate dehydrogenase (Schiaffino
S et al., 1970).
Identification of type 1, 2A and 2B fibers by myosin ATPase histochemical
staining (Brooke MH & Kaiser KK, 1970).
Fast glycolytic, fast oxidative glycolytic and slow oxidative fibers can be
distinguished by enzyme biochemistry (Peter JB et al., 1972).
Four muscle fiber
types:
Slow type 1
Fast type 2A
Fast type 2X
Fast type 2B
Monoclonal antibodies to MyHCs distinguish four MyHC isoforms,
including type 2X, and four corresponding fiber types in rat muscle
(Schiaffino S et al., 1989).
Human muscle fibers classified as type 2B by ATPase histochemistry
contain
2x MyHC (Smerdu V et al., 1994).
Genomic nomenclature?
Table 1.1: Nomenclature of fiber types. The evolution of the notion of skeletal muscle fiber types during
the years. MyHC: myosin heavy chain (table modified from Schiaffino S, 2010).
Unfortunately, it is now clear that the MyHC isoforms are not sufficient to fully classify
fiber types. For example, not all muscle proteins switch in parallel when MyHC isoform
composition is altered (Canepari M et al., 2010) and a recent work demonstrated the

10
discrepancies in the relationship between MyHC composition and Ca2+
kinetics
(Calderon JC et al., 2010). Thus, while a MyHC classification system serves a necessary
role for communication of science, it needs to be emphasized that this system does not
include the underlying protein heterogeneity associated with all the physiological
systems that regulate the multiple functions of skeletal muscle (Spangenburg EE &
Booth FW, 2003). For more than a decade, myofiber classification based on MyHC
isoforms was proved useful in the study of human and animal skeletal muscle.
However, a new nomenclature that prioritizes the cell’s functional, proteomic, genomic
and epigenetic hierarchical organization would be desirable. Recently discovered
microRNAs encoded within myosin genes that regulate muscle gene expression and
performance (Van Rooij et al. 2009) support this need and also the leading role of
myosin in muscle phenotype. Therefore, growing understanding of the complexity of
skeletal muscle signaling and organization is challenging the simple canonical
classification of muscles based on myosin isoforms (Delbono O, 2010).
MyHC isoform Anatomical color Contractile speed Metabolism
Type 1 Red Slow-twitch Oxidative
Type 2a Red Fast-twitch Oxidative
Type 2x White Fast-twitch Glycolytic
Type 2b White Fast-twitch Glycolytic
Table 1.2: Fiber classification based on MyHC isoform expression. The current nomenclature of
myofibers distinguishes four pure types, based on differential expression of distinct MyHC isoforms.
1.1.4 Excitation-contraction coupling and Ca2+
homeostasis
Excitation-contraction (EC) coupling is the function of the muscle fiber in which an
electrical depolarization of the plasma membrane initiates a sequence of reactions that
causes mechanical activation of the contractile myofibrils lying within the membrane
(Sandow A, 1965).
EC coupling starts with the conduction of action potentials along the axons of motor
neurons causing the release of acetylcholine from the nerve terminal at the
neuromuscular junction. This is followed by binding of acetylcholine to nicotinic
acetylcholine receptors on the end-plate of the muscle fiber membrane, increasing
sodium and potassium conductance in the end-plate membrane. End-plate potentials
11
lead to generation of action potentials along the sarcolemmal membrane and into
invaginations of the sarcolemma called transverse tubules (T-tubules). Each T-tubule is
closely bordered by two sac-like formation of the SR called terminal cisternae (Payne
AM & Delbono O, 2006). This tripartite structure is called the triad (Felder E et al.,
2002), and represents the critical subcellular region where membrane depolarization is
translated into intracellular Ca2+
elevations. The concentration of Ca2+
in the sarcoplasm
is the regulator of muscle contraction and relaxation.
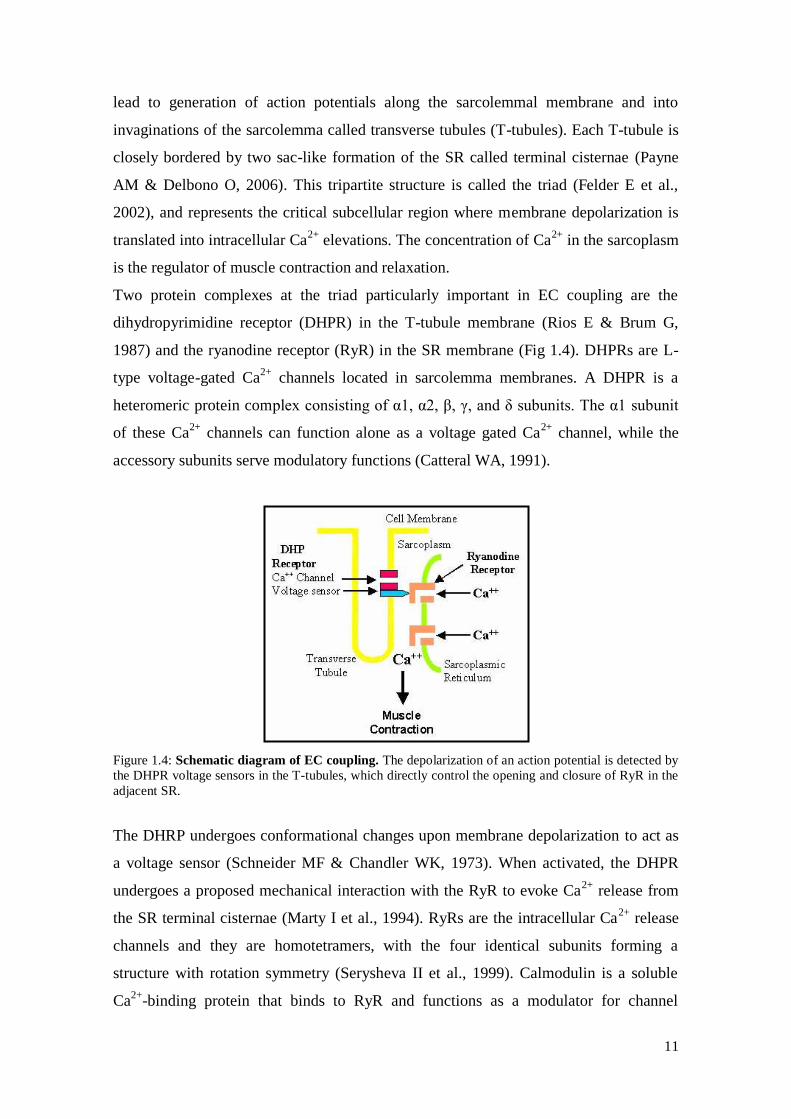
Two protein complexes at the triad particularly important in EC coupling are the
dihydropyrimidine receptor (DHPR) in the T-tubule membrane (Rios E & Brum G,
1987) and the ryanodine receptor (RyR) in the SR membrane (Fig 1.4). DHPRs are L-
type voltage-gated Ca2+
channels located in sarcolemma membranes. A DHPR is a
heteromeric protein complex consisting of α1, α2, β, γ, and δ subunits. The α1 subunit
of these Ca2+
channels can function alone as a voltage gated Ca2+
channel, while the
accessory subunits serve modulatory functions (Catteral WA, 1991).
Figure 1.4: Schematic diagram of EC coupling. The depolarization of an action potential is detected by
the DHPR voltage sensors in the T-tubules, which directly control the opening and closure of RyR in the
adjacent SR.
The DHRP undergoes conformational changes upon membrane depolarization to act as
a voltage sensor (Schneider MF & Chandler WK, 1973). When activated, the DHPR
undergoes a proposed mechanical interaction with the RyR to evoke Ca2+
release from
the SR terminal cisternae (Marty I et al., 1994). RyRs are the intracellular Ca2+
release
channels and they are homotetramers, with the four identical subunits forming a
structure with rotation symmetry (Serysheva II et al., 1999). Calmodulin is a soluble
Ca2+
-binding protein that binds to RyR and functions as a modulator for channel

12
function. The elevation in cytosolic Ca2+
allows Ca2+
to bind troponin C, removing
tropomyosin blockade of actin binding sites. MyHC heads can now bind to actin
binding sites to form cross-bridges and, thus, produce force and active shortening of
muscle fibers (Melzer W et al., 1995, Payne AM & Delbono O, 2006).
In contrast to the passive entry of Ca2+
down its electrochemical gradient, removal of
Ca2+
from the cytoplasm requires the expenditure of chemical energy and has a fixed
stoichiometry of two Ca2+
ions transported per ATP hydrolyzed. The protein that return
Ca2+
released from the terminal cisternae to the lumen of SR is the ATP-dependent Ca2+
ATPase Serca (sarco/endoplasmic reticulum Ca2+
transporting ATPase, Barton KN &
MacLennan DH, 2003). In the 1980s three Serca isoforms and their splice variants were
identified. Serca1a is highly expressed in adult fast-twitch skeletal muscle, while
Serca1b is an alternative splicing variant expressed in fetal and neonatal muscle.
Serca2a is highly expressed in cardiac and slow-twitch muscles and Serca2b is
expressed in smooth muscle and non-muscle tissue. Serca3 and its splicing variants
have a lower Ca2+
affinity and might exert a specialized function in endothelial and
epithelial cells (Lytton J et al., 1992, Wu KD & Lytton J, 1993). Other Ca2+
-binding
proteins of the muscle are differentially expressed between fiber types. Calsequestrin
(Casq) is a protein located in the lumen of the junctional SR and sequesters large
amount of Ca2+
in the vicinity of RyR, where it acts as a storage depot for the Ca2+
released during muscle contraction (MacLennan DH & Wong PT, 1971). It is
interesting that in the SR of slow fibers two isoforms of Casq can be found (Casq1 and
Casq2), whereas only one Casq1 is present in fast fibers (Damiani E & Margreth A,
1994). Parvalbumin is a cytosolic Ca2+
buffer. Binding Ca2+
, it acts as a soluble relaxing
factor. In mammalian muscles parvalbumin is expressed in fast fibers at high
concentrations, whereas it is virtually absent in slow fibers (Gundersen et al., 1988).
1.1.5 Molecular composition of sarcomere
The sarcomere can be viewed as a supramolecular structure of interdigitating thick and
thin filaments and associated titin and nebulin filaments extending between successive
Z-disc. This is a complex structure containing, in vertebrate muscle, at least 28 different
proteins. The different isoforms of these proteins generally show specific tissue
distribution and can be used as markers for fiber types (Tab. 1.3, Schiaffino S &
13
Reggiani C, 1996). The thick and thin myofilaments are both polymers of non-
covalently associated protein molecules. The two proteins responsible for the
transduction of chemical energy into mechanical work when a muscle contracts are
myosin and actin (Craig RW & Padron R, 2003). They together account for more that
70% of myofibrillar proteins (myosin, 54%; actin, 20%, Huxley HE, 1957). Each
myosin head has ATPase activity, which is activated upon interaction with actin. The
motor activity of the myosin heads moves the thin filaments past the thick filaments to
generate force, resulting in muscle contraction (Huxley AF, 2000). The actin-myosin
interaction is tightly controlled in a Ca2+
dependent manner by the regulatory complex
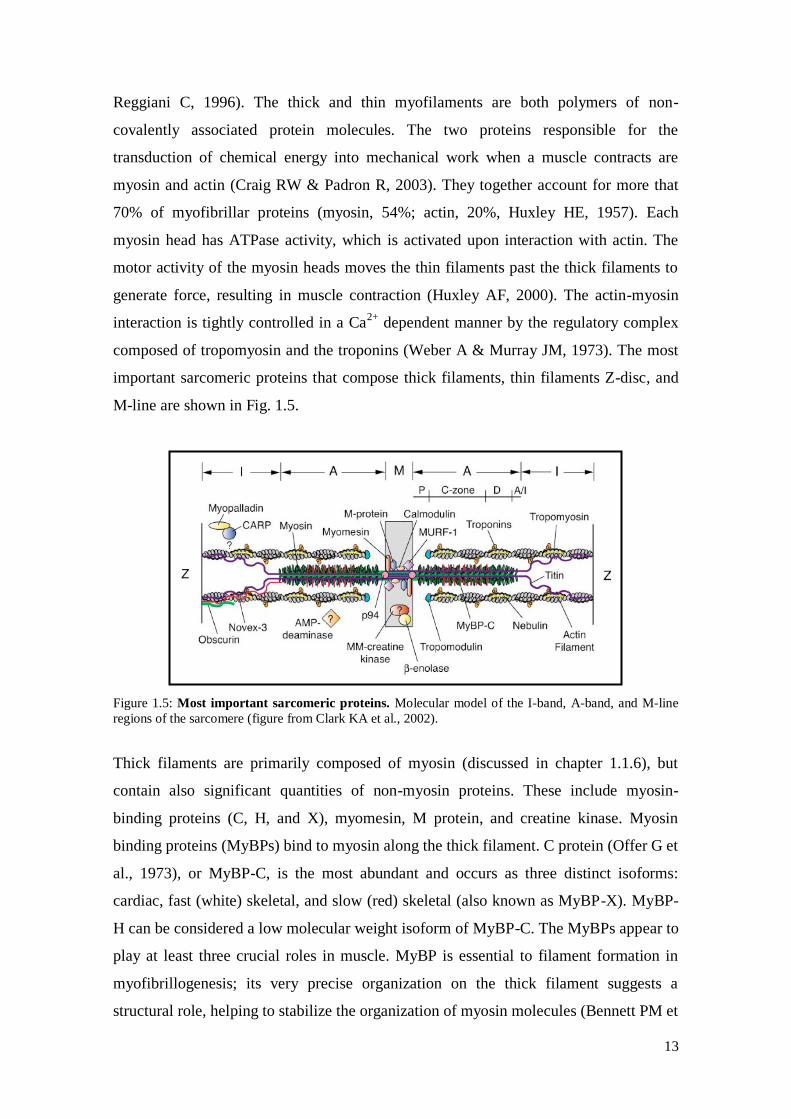
composed of tropomyosin and the troponins (Weber A & Murray JM, 1973). The most
important sarcomeric proteins that compose thick filaments, thin filaments Z-disc, and
M-line are shown in Fig. 1.5.
Figure 1.5: Most important sarcomeric proteins. Molecular model of the I-band, A-band, and M-line
regions of the sarcomere (figure from Clark KA et al., 2002).
Thick filaments are primarily composed of myosin (discussed in chapter 1.1.6), but
contain also significant quantities of non-myosin proteins. These include myosin-
binding proteins (C, H, and X), myomesin, M protein, and creatine kinase. Myosin
binding proteins (MyBPs) bind to myosin along the thick filament. C protein (Offer G et
al., 1973), or MyBP-C, is the most abundant and occurs as three distinct isoforms:
cardiac, fast (white) skeletal, and slow (red) skeletal (also known as MyBP-X). MyBP-
H can be considered a low molecular weight isoform of MyBP-C. The MyBPs appear to
play at least three crucial roles in muscle. MyBP is essential to filament formation in
myofibrillogenesis; its very precise organization on the thick filament suggests a
structural role, helping to stabilize the organization of myosin molecules (Bennett PM et
14
al., 1999); and is involved in modulating contractility, apparently limiting shortening
velocity and restricting the range of movement of some myosin molecules (Hofmann
PA et al., 1991).
Gene Isoform Pattern of expression
Myh7 MyHC-1-(β-slow) Slow skeletal muscle, heart (ventricles)
Myh6 MyHC-α Mandibular and extraocular muscles, heart (atria)
Myh2 MyHC-2a Fast skeletal muscle
Myh1 MyHC-2x Fast skeletal muscle
Myh4 MyHC-2b Fast skeletal muscle
Myh3 MyHC-emb Developing skeletal muscle
Myh8 MyHC-neo Developing skeletal muscle
Myh13 MyHC-eo Extraocular muscle
Myh14 MyHC-eo Extraocular muscle
Myh15 MyHC-eo Extraocular muscle
Myh16 MyHC-m Mandibular muscle
Myl2 RLC-2-s/v Slow skeletal muscle, heart (ventricles)
Mylpf RLC-2f Fast skeletal muscle
Myl5 RLC-2m Mandibular muscle
Myl7 RLC-2a Heart (atria)
Myl6b ELC-1-sa Slow skeletal muscle
Myl3 ELC-1-sb/sv Slow skeletal muscle, heart (ventricles)
Myl1 ELC-1f, MyLC-3f Fast skeletal muscle
Myl4 ELC-1e/a Developing skeletal muscle, heart (atria)
Mybpc3 MyBP-C-cardiac Heart
Mybpc1 MyBP-C-slow Slow skeletal muscle
Mybpc2 MyBP-C-fast Fast skeletal muscle
Tpm1 Tropomyosin α-fast Fast skeletal muscle
Tpm3 Tropomyosin α-slow Slow skeletal muscle
Tpm2 Tropomyosin β Skeletal muscle
Tnnc2 Troponin C-fast Fast skeletal muscle
Tnnc1 Troponin C, slow/cardiac Slow skeletal muscle, heart
Tnni2 Troponin I-fast Fast skeletal muscle
Tnni1 Troponin I-slow Slow skeletal muscle
Tnni3 Troponin I-cardiac Heart
Tnnt1 Troponin T-slow Slow skeletal muscle
Tnnt2 Troponin T-cardiac Heart
Tnnt3 Troponin T-fast Fast skeletal muscle
Actn2 α-actinin 2 Slow skeletal muscle
Actn3 α-actinin 3 Fast skeletal muscle
Myom3 Myomesin 3 Oxidative skeletal muscle - especially type 2A fibers
Myom1 Myomesin 1 Skeletal muscle
Myom2 Myomesin 2 Skeletal muscle
Mybph H protein Skeletal muscle
Actc1 Actin-α-cardiac Skeletal muscle
Acta1 Actin-α-skeletal Skeletal muscle
Obscn Obscurin Skeletal muscle
Neb Nebulin Skeletal muscle
Ttn Titin Skeletal muscle
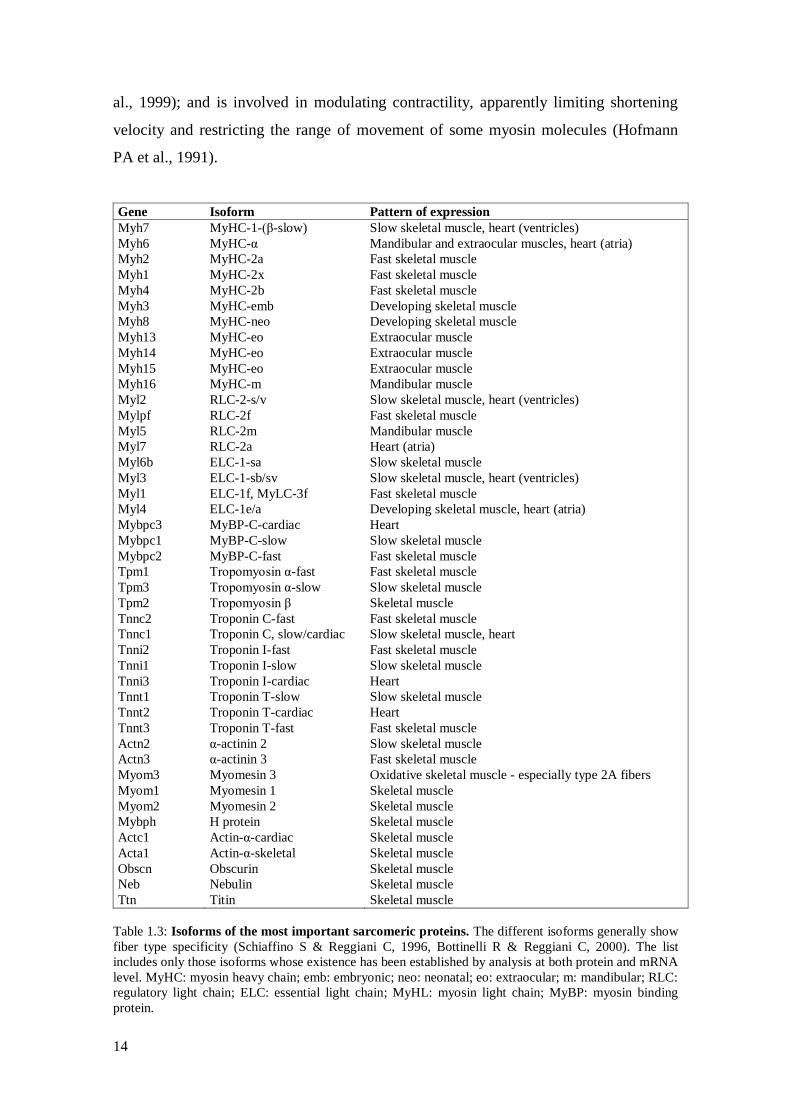
Table 1.3: Isoforms of the most important sarcomeric proteins. The different isoforms generally show
fiber type specificity (Schiaffino S & Reggiani C, 1996, Bottinelli R & Reggiani C, 2000). The list
includes only those isoforms whose existence has been established by analysis at both protein and mRNA
level. MyHC: myosin heavy chain; emb: embryonic; neo: neonatal; eo: extraocular; m: mandibular; RLC:
regulatory light chain; ELC: essential light chain; MyHL: myosin light chain; MyBP: myosin binding
protein.
15
Three additional thick filament associated components, myomesin, M protein, and
creatine kinase, are localized at the level of the M-line. Myomesin and M protein are
both modular proteins. Myomesin is present in both fast and slow fibers. The binding of
this protein to titin and myosin suggests that one of its major roles is to link titin
molecules to the thick filament (Obermann WM et al., 1996). M protein is present only
in fast and skeletal fibers. It interacts with myosin and could provide a link between the
thick filaments to encounter the great stresses (Fürst DO et al., 1999). Creatine kinase
regenerates ATP from ADP produced during contraction (Kushmerick MJ, 1998). The
presence of creatine kinase suggests that M-line has both enzymatic and structural role.
The major components of the thin filament are actin, tropomyosin and the troponin
complex. Actin is the most abundant protein and it is a globular protein (G actin), which
self-associates to form a helical polymer known as the filamentous actin (F actin). The
actin-myosin interaction is tightly controlled in a Ca2+
dependent manner by the
regulatory complex composed of tropomyosin and the troponins. Tropomyosin is an
elongated molecule associated with seven actin monomers, while troponin is a complex
of three subunits that attaches to a specific site of each tropomyosin. Troponin is the
Ca2+
binding component of the complex. In combination with tropomyosin, it regulates
contraction by inhibiting actin-myosin interaction at low Ca2+
levels, causing relaxation.
When Ca2+
concentration increases following muscle stimulation, troponin binds Ca2+
,
releasing the inhibitory effect of troponin-tropomyosin and allowing actin and myosin
to interact (with consequent increase in ATPase activity) and contraction to follow
(Craig RW & Padron R, 2003). The three troponin subunits (TnI, TnC, and TnT) were
named according to their first identified function. TnI is able to inhibit actin-myosin
ATPase, TnC is the Ca2+
binding component of the troponin, while TnT is the
tropomyosin binding component of the troponin (Gordon AM et al., 2000).
Sarcomere comprises also two giant proteins that constitute a third set of filaments:
nebulin and titin. Nebulin filaments are closely associated and coextensive with thin
filaments and appear to function as a molecular ruler fixing precise filament length.
Nebulin could regulate length by matching the number of its superrepeats to an equal
number of helical repeats of actin (Kruger M et al., 1991). Titin filaments are closely
associated with thick filaments. Titin is one of the first myofibrillar protein to assemble
into the nascent myofibril, but its primary function in mature muscle is to act as an
elastic element that maintains sarcomere integrity and filament order in the relaxed and
active states (Horowits R, 1999).
16
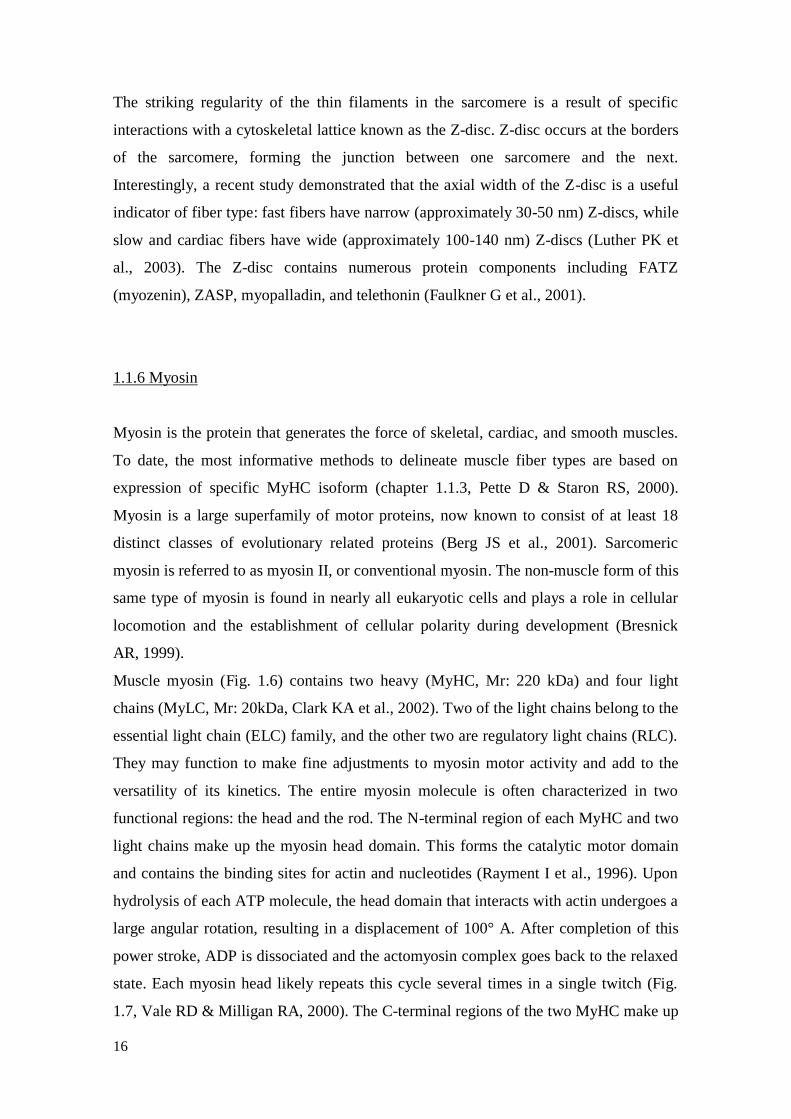
The striking regularity of the thin filaments in the sarcomere is a result of specific
interactions with a cytoskeletal lattice known as the Z-disc. Z-disc occurs at the borders
of the sarcomere, forming the junction between one sarcomere and the next.
Interestingly, a recent study demonstrated that the axial width of the Z-disc is a useful
indicator of fiber type: fast fibers have narrow (approximately 30-50 nm) Z-discs, while
slow and cardiac fibers have wide (approximately 100-140 nm) Z-discs (Luther PK et
al., 2003). The Z-disc contains numerous protein components including FATZ
(myozenin), ZASP, myopalladin, and telethonin (Faulkner G et al., 2001).
1.1.6 Myosin
Myosin is the protein that generates the force of skeletal, cardiac, and smooth muscles.
To date, the most informative methods to delineate muscle fiber types are based on
expression of specific MyHC isoform (chapter 1.1.3, Pette D & Staron RS, 2000).
Myosin is a large superfamily of motor proteins, now known to consist of at least 18
distinct classes of evolutionary related proteins (Berg JS et al., 2001). Sarcomeric
myosin is referred to as myosin II, or conventional myosin. The non-muscle form of this
same type of myosin is found in nearly all eukaryotic cells and plays a role in cellular
locomotion and the establishment of cellular polarity during development (Bresnick
AR, 1999).
Muscle myosin (Fig. 1.6) contains two heavy (MyHC, Mr: 220 kDa) and four light
chains (MyLC, Mr: 20kDa, Clark KA et al., 2002). Two of the light chains belong to the
essential light chain (ELC) family, and the other two are regulatory light chains (RLC).
They may function to make fine adjustments to myosin motor activity and add to the
versatility of its kinetics. The entire myosin molecule is often characterized in two
functional regions: the head and the rod. The N-terminal region of each MyHC and two
light chains make up the myosin head domain. This forms the catalytic motor domain
and contains the binding sites for actin and nucleotides (Rayment I et al., 1996). Upon
hydrolysis of each ATP molecule, the head domain that interacts with actin undergoes a
large angular rotation, resulting in a displacement of 100° A. After completion of this
power stroke, ADP is dissociated and the actomyosin complex goes back to the relaxed
state. Each myosin head likely repeats this cycle several times in a single twitch (Fig.
1.7, Vale RD & Milligan RA, 2000). The C-terminal regions of the two MyHC make up

17
the elongated rod. The C-terminal end of the rod contains coiled-coil domains involved
in myosin polymerization. The other portion of the rod connects the myosin heads to the
thick filament core.
Figure 1.6: Molecular structure of skeletal myosin. In Myosin II the heavy chain exists as a dimmer and
contains two regulatory and two essential light chains bound to each heavy chain.
Figure 1.7: The myosin cross-bridge cycle. (A) ATP binding to a cleft at the “back” of the myosin head
(blue color) causes a conformation which cannot bind actin (red and white color). (B) As the ATP is
hydrolyzed, the head swings back to the “cocked” position, the ADP and Pi remain bound. (C,D) The
force generating stages: when the Pi leaves the myosin, the head binds the actin and the “power stroke” is
released as the head bind actin. ADP is released to continue the cycle. At this stage the head in bound to
actin in the “rigor” or tightly bound state.
Mammalian muscle cells express members of four gene families of myosin II heavy
chains: fast skeletal, cardiac, smooth and non-muscle (Sweeney HL & Houdusse A,
2003). I discuss here only the fast skeletal and cardiac myosin loci, because they contain
the genes coding for the MyHC isoforms used for fiber type classification. All fast
skeletal MyHC genes are found as a part of a multigene locus (Fig. 1.8, A). The fast
skeletal locus is composed of six distinct heavy chain genes. These are embryonic
(Myh3), perinatal (Myh8), fast type 2a (Myh2), fast type 2x or 2d (Myh1), fast type 2b
(Myh4), and extraocular (Myh13). These MyHC isoforms are expressed only in skeletal
muscle. Interestingly, there is no evidence that human muscles ever express the 2b
isoform, which is abundant in rodents. Embryonic and perinatal isoforms are expressed
during muscle development and expressed again in the adult during muscle

18
regeneration. The other heavy chains are expressed in adult muscles. The two cardiac
heavy-chains genes (α and β, Myh6 and Myh7, respectively) are located in tandem in
the same chromosome (Fig. 1.8, B). These are the only two MyHC found in cardiac
muscle cells. The α MyHC isoform was thought to be expressed exclusively in cardiac
muscle; however it was reported to be expressed much less frequently also in skeletal
muscles. The β (also called type 1) MyHC expression is not confined only to cardiac
muscle, but also in embryonic skeletal muscle, and it is the isoform expressed in slow
skeletal muscle fibers (Schiaffino S & Reggiani C, 1996). Just as there are multiple
MyHC isoforms expressed in mammalian muscles, there is also a range of MyLC
isoforms (Collins JH, 1991). Fast skeletal muscle fibers contain two isoforms of
regulatory MyLC: MyLC-1f and MyLC-3f, that originate from a single gene (Myl1) by
alternative utilization of two transcription initiation sites and alternative splicing. Slow
skeletal muscle fibers also contain two isoforms: MyLC-1sa (Myl6b or slow-α), which
is also expressed in smooth muscle and non-muscle tissues and MyLC-1sb (Myl3 or
slow-β), which is also expressed in ventricular myocardium. Regulatory MyLC presents
two isoforms: MyLC-2fast (Mylpf) and MyLC-2slow (Myl2, Schiaffino S & Reggiani
C, 1996).
Figure 1.8: MyHC gene clusters. Skeletal MyHC genes are clustered on chromosome 10 of the rat , and
cardiac MyHC on chromosome 15. This MyHC gene organization, order, head to tail orientation, and
spacing has been conserved through millions of years of evolution and could be of great significance to
the way these genes are regulated in response to various stimuli. Human and mouse cardiac MyHCs are
found on chromosome 14; whereas human skeletal MyHCs are found on chromosome 17, and the mouse
skeletal MyHCs are found on chromosome 11. Distance between genes may vary among species (figure
from Haddad F et al., 2006).

19
1.1.7 Fiber type plasticity in response to nerve activity
The firing pattern of slow and fast motor neurons differs in frequency and duration (Fig.
1.9). Accordingly, the frequency of the action potentials and of Ca2+
release from the
SR is significant different in slow and fast fibers, so mean cytosolic Ca2+
levels are
higher in slow than in fast fibers (Hughes S, 1998). A large number of stimulation
experiments, using impulse patterns mimicking the firing pattern of slow and fast motor
neurons, have shown that the muscle fiber type composition and physiological
properties can be partly changed by electrical activity (Pette D & Staron RS, 2001). The
changes in MyHC gene expression generally follow the sequence MyHC-1 ↔ MyHC-
2A ↔ MyHC-2X ↔ MyHC-2B (Schiaffino S & Reggiani C, 1994).
Figure 1.9: Electrical activity in fast and slow muscles. Diagrammatic view of the effect of distinct
firing patterns of fast and slow motor neurons on Ca2+
concentration. Slow fibers are stimulated at a
continuous low frequency, whereas fast fibers experience bursts of high-frequency firing interspersed
with periods of rest (figure from Hughes S, 1998).
A network of intracellular signals is involved in mediating the effect of nerve activity
on muscle gene regulation. The calcium-calcineurin-nuclear factor of activated T cells
(NFAT) pathway is the nerve activity-dependent signaling pathway that main control
the MyHC switching and fiber type. In addition, some major determinants of the
metabolic oxidative profile of muscle fibers, the peroxisome proliferator activated
receptor-γ coactivator-1α (PGC1α), the peroxisome proliferator activated receptor β/δ
(PPARβ/δ) and the transcription factor myogenin, have been identified (Schiaffino S et
al., 2006).
Calcineurin (Cn) is a Ca2+
/calmodulin-regulated protein phosphatase that acts on the
transcription factors of the NFAT family inducing their translocation to the nucleus. In
skeletal muscle NFAT interacts with MEF2 in the control of the slow gene program
(Wu H et al., 2000). Furthermore, it has been demonstrated that overexpression of

20
activated Cn also induces increased expression of myoglobin and of enzymes
responsible for mitochondrial oxidative phosphorylation and lipid metabolism (Naya FJ
et al., 2000). This effect on the metabolic profile may be due to the upregulation of the
transcription factor PPARβ/δ and of the transcriptional coactivator PGC1α induced by
activated Cn (Fig. 1.10, Long YC et al., 2007). PGC1α is expressed at higher levels in
slow than fast muscles and stimulates mitochondrial biogenesis and oxidative enzymes
by inducing the expression of nuclear respiratory factors (NRF)-1 and -2, which control
the transcription of many mitochondrial genes, and by coactivating the transcriptional
activity of NRF-1 (Terada S et al., 2002). PPARs are members of the nuclear receptor
superfamily that bind DNA as heterodimers. Muscle-specific overexpression of wild-
type or constitutively active PPARβ/δ leads to a more oxidative fiber type profile with
increased mitochondrial DNA, upregulation of some slow contractile protein genes, and
increased resistance to fatigue (Luquet S et al., 2003). These effects appear to be a direct
effect of PPARβ/δ activation, as levels of PGC1α remain unchanged (Wang YX et al.,
2004).
Figure 1.10: Scheme of the signaling pathways and transcriptional factors and coregulators involved
in the control of slow gene program and oxidative gene program. The scheme highlights the major
role of the calcineurin (Cn)-NFAT pathway in the regulation of the slow gene program and the role of
PPARβ/δ and PGC1α in the regulation of the oxidative gene program. Dotted lines indicate less
established pathways (figure from Schiaffino S et al., 2006).

21
1.2 DNA microarrays and microgenomics
1.2.1 Microarray: an overview
After genome sequencing and annotation, the next major branch of genome science is
the analysis of the transcriptome. The transcriptome is defined as the complete set of
transcripts and their relative levels of expression in a particular cell or tissue under
defined conditions. The transcriptome includes the entire set of RNAs transcribed from
the genomic DNA: messenger RNA (mRNA), that serves as template for protein
synthesis; ribosomal RNA (rRNA), that is the RNA component of the ribosome;
transfer RNA (tRNA), useful for protein synthesis; and other non-coding RNAs, that act
as transcriptional regulators (large intergenic non-coding RNA, linc RNA) or post-
transcriptional regulators (small interfering RNA, siRNA, and micro RNA, miRNA).
Several technologies are used for parallel expression analysis of thousands of genes,
among which is the DNA microarrays technology. In 1995 the first work using DNA
microarray was published (Schena M et al., 1995) and ever since this technology
underwent a constant development, due to the largest number of sequenced genomes
and to improvements in DNA spotting and support slides. Now there are a lot of
common applications of DNA microarrays: a) Gene expression microarrays analyze the
differentially expressed genes between two or more messenger RNA (mRNA)
populations; b) Single nucleotide polymorphism (SNP) microarrays are used to detect
sequence variations of genomic DNAs; c) Comparative genomic hybridization (CGH)
microarrays investigate alterations of genomic DNA; d) Exon and tiling microarrays
examine the alternative splicing of mRNAs; e) miRNA microarrays study the
expression of miRNAs. For my experiments I used gene expression microarrays,
focusing my attention on this particular type of microarrays.
The basic procedure of microarray analysis is to deposit a very small amount of DNA
each one corresponding to a member of a collection of thousand genes (the “probes”) on
a solid surface (the array), and then interrogate these probes by hybridization to “target”
mRNA populations that have been labeled with fluorescent dye. The amount of
fluorescent mRNA target that sticks to each probe spot is proportional to the abundance
of the transcript in the sample, and is detected as the intensity of the fluorescent signal.
A change in abundance is measured as an increase or decrease in the signal, relative

22
either to the signal from a control reference sample (“ratio”) or to the signals from the
other probes on the array (“relative intensity”, Gibson G & Muse SV, 2009). Two-color
microarrays are hybridized with cDNA prepared from two samples to be compared and
that are labeled with two different fluorophores (Fig. 1.11 A), in one-color microarrays
the arrays provide intensity data for each probe or probe set indicating a relative level of
hybridization with the labeled target (Fig. 1.11 B). However, they do not truly indicate
abundance levels of a gene but rather relative abundance when compared to other
samples or conditions processed in the same experiment. The advantages of one-color
system is that an aberrant sample cannot affect the raw data derived from other samples
and that data are more easily compared to arrays from different experiments so long as
batch effects have been accounted for.
Figure 1.11: Schematic model for microarray hybridizations. A) Two-color microarray scheme design;
B) One-color microarray scheme design.
The experiment can be thought as comprising a number of stages, from the initial
planning through to the final analysis of the results, but there are four basic steps in all
microarray analysis: microarray planning, target preparation (RNA extraction,
amplification and labeling), hybridization and scanning, and data analysis.

23
1.2.2 Microarray planning
One of the most important stages of any microarray experiment is the initial planning.
This involves factors such as the type of platform, the number of replicates, and the
experimental design.
A central point is deciding the microarray platform that will be used to perform the
experiment. I discuss here cDNA microarrays, long oligonucleotide microarrays and
short oligonucleotide microarrays, with particular attention to OligoTopo Operon and
Agilent platforms that were used for the experiments of this thesis.
In cDNA microarrays, PCR-amplified cDNA fragments (expressed sequence tags,
ESTs) are spotted at high density (10 - 50 spots per mm2) onto a microscope slide or
filter paper, and probed against fluorescently or radioactively labeled target. The
platform is flexible, since users print their own microarrays and are free to add or
subtract probes. cDNA microarrays typically have an upper spatial limit of 15,000
elements (and often include fewer than 5,000 elements), so they are unable to represent
the complete set of genes expressed by higher eukaryotic genomes. Consequently,
arrays have been developed that are specific for a certain developmental stage or tissue.
Printing is performed with a precision robot that picks up samples of DNA from a
microtiter plate and deposits aliquots sequentially onto a slide. Commonly used printing
heads hold 4 to 32 individual printing pins spaced approximately 1 cm apart. cDNA
microarrays are less reproducible and sensitive than other types of microarrays
(Draghici S et al., 2006): it was demonstrated that the correlation between technical
replicates is often very low (Jenssen TK et al., 2002), and that a substantial number of
incorrect probes are present in the arrays (Taylor E et al., 2001).
In microarrays of long oligonucleotides, single stranded DNA molecules of uniform
length (50 - 70 bases) are deposited, affording greater control over hybridization
specificity than PCR products. The oligonucleotides are usually purchased from a
specialize Company and spotting is performed with the same types of robotic arrayers
described above. Modified 5’-amino groups have been used to promote linkage of the
oligonucleotides to aldehyde-coated slides. An example is the OligoTopo platform
produced by MicroCribi of Padua (Italy, www.http://microcribi.cribi.unipd.it), spotting
the Operon collection (Mouse V1.1), that consists of more than 13,000 70mer
oligonucleotides. In the microarrays used for this thesis, each oligonucleotide is spotted
by the robotic station Biorobotics Microgrid II in two replicates on a glass slide.
24
Alternatively, the oligonucleotides can be synthesized in situ on the slide surface. The
new technology of SurePrint G3 of Agilent (www.agilent.com) permits to obtain a
single million feature array per slide (1x1M), but are present also multipack format:
2x400K, 4x180K, and 8x60K. Microarrays are manufactured using a proprietary non-
contact industrial inkjet printing process, in which oligo monomers are deposited
uniformly onto specially-prepared glass slides. This in situ synthesis process prints 60-
mer length oligonucleotide probes, base-by-base, from digital sequence files. Standard
phosphoramidite chemistry used in the reactions allows for very high coupling
efficiencies to be maintained at each step in the synthesis of the full-length
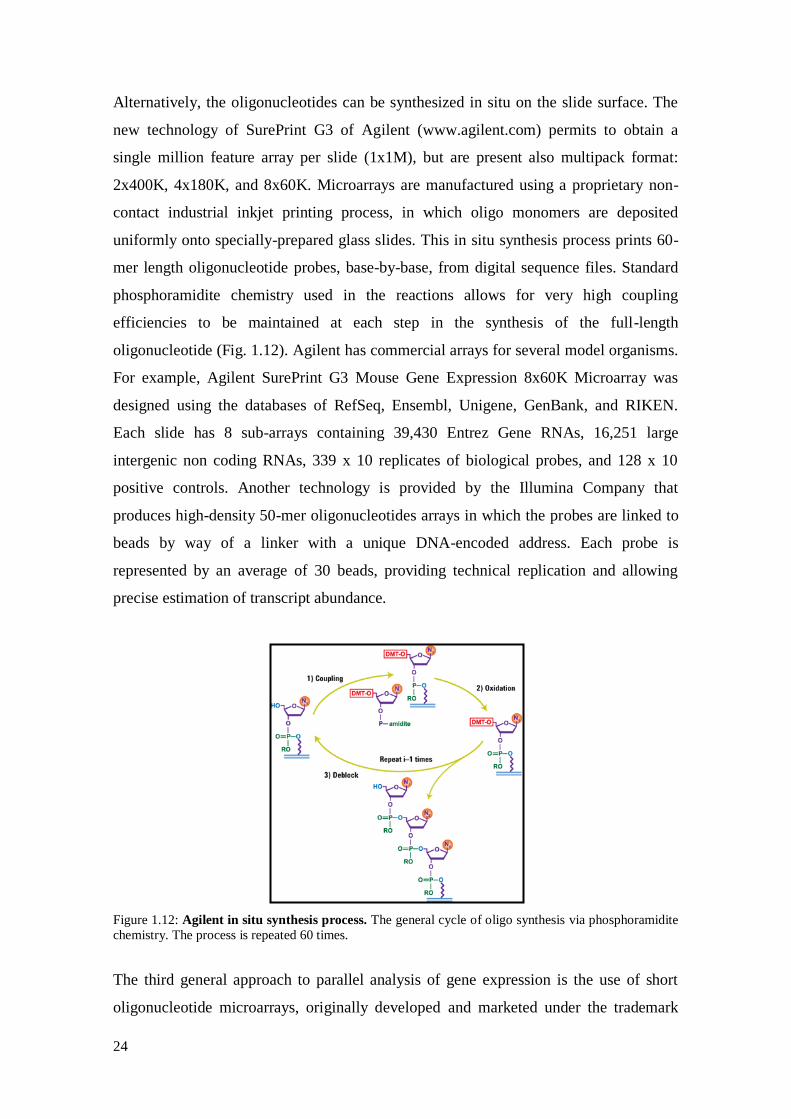
oligonucleotide (Fig. 1.12). Agilent has commercial arrays for several model organisms.
For example, Agilent SurePrint G3 Mouse Gene Expression 8x60K Microarray was
designed using the databases of RefSeq, Ensembl, Unigene, GenBank, and RIKEN.
Each slide has 8 sub-arrays containing 39,430 Entrez Gene RNAs, 16,251 large
intergenic non coding RNAs, 339 x 10 replicates of biological probes, and 128 x 10
positive controls. Another technology is provided by the Illumina Company that
produces high-density 50-mer oligonucleotides arrays in which the probes are linked to
beads by way of a linker with a unique DNA-encoded address. Each probe is
represented by an average of 30 beads, providing technical replication and allowing
precise estimation of transcript abundance.
Figure 1.12: Agilent in situ synthesis process. The general cycle of oligo synthesis via phosphoramidite
chemistry. The process is repeated 60 times.
The third general approach to parallel analysis of gene expression is the use of short
oligonucleotide microarrays, originally developed and marketed under the trademark

25
Affymetrix GeneChip (Lockart DJ et al., 1996). The unit of hybridization is a series of
25-mer oligonucleotide designed by a computer algorithm to represent known or
predicted open reading frames. The possibility of cross-hybridization by similar short
sequences is controlled by including a mismatched control oligonucleotide adjacent to
each nucleotide probe that has a single base change at the center of the oligonucleotide.
High-density short oligonucleotide arrays are constructed on a silicon chip by
photolithography and combinatorial chemistry. Another company, Nimblegen, also
produces short oligonucleotide arrays on glass slides but uses a maskless array synthesis
method, employing miniature mirrors to focus a laser ray on each spot as the
oligonucleotides are built.
Another important experimental variable to be controlled is the level of replication.
Technical replicates are repeated samples of the same biological material, for example
RNA preparations, labeling reactions, and duplicate spots of the same probe on each
array. Biological replicates are instead independent samples of similar material
(Churchill GA, 2002). Because of cost and practicality, it is generally necessary to
choose a balance between affordable costs and experimental objectives. In some cases,
pooling of samples allows the technical or biological source of variation to be included
in the analysis without being measured explicitly.
The last major design issue is which sample contrast in which arrays. For Agilent,
Illumina, and Affymetrix arrays this is not an issue because they are one-color system,
so there is no reference sample and the only major experimental design choices involve
the number of samples and replicates to include in a study. However, most other
microarrays involve competitive hybridizations of two samples labeled with two
different color dyes. In these cases there are three basic types of experimental design
(Fig. 1.13):
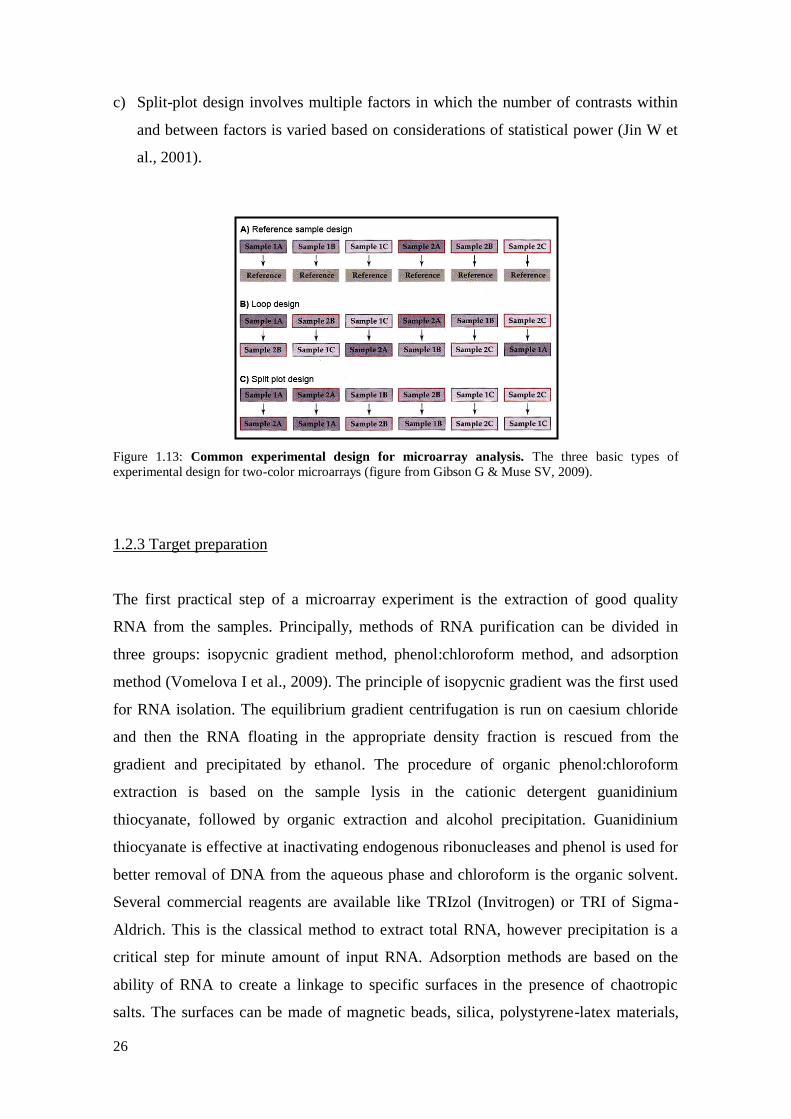
a) Reference sample design contrast each experimental sample against a common
reference sample, which is generally design to include an average or intermediate
level of transcript for every gene on the microarray.
b) Loop designs are optimal where there are multiple biological samples of one or two
treatment class. A simple approach with two replicates of each sample is to contrast
A → B, B → C, C →D,… Z → A.
26
c) Split-plot design involves multiple factors in which the number of contrasts within
and between factors is varied based on considerations of statistical power (Jin W et
al., 2001).
Figure 1.13: Common experimental design for microarray analysis. The three basic types of
experimental design for two-color microarrays (figure from Gibson G & Muse SV, 2009).
1.2.3 Target preparation
The first practical step of a microarray experiment is the extraction of good quality
RNA from the samples. Principally, methods of RNA purification can be divided in
three groups: isopycnic gradient method, phenol:chloroform method, and adsorption
method (Vomelova I et al., 2009). The principle of isopycnic gradient was the first used
for RNA isolation. The equilibrium gradient centrifugation is run on caesium chloride
and then the RNA floating in the appropriate density fraction is rescued from the
gradient and precipitated by ethanol. The procedure of organic phenol:chloroform
extraction is based on the sample lysis in the cationic detergent guanidinium
thiocyanate, followed by organic extraction and alcohol precipitation. Guanidinium
thiocyanate is effective at inactivating endogenous ribonucleases and phenol is used for
better removal of DNA from the aqueous phase and chloroform is the organic solvent.
Several commercial reagents are available like TRIzol (Invitrogen) or TRI of Sigma-
Aldrich. This is the classical method to extract total RNA, however precipitation is a
critical step for minute amount of input RNA. Adsorption methods are based on the
ability of RNA to create a linkage to specific surfaces in the presence of chaotropic
salts. The surfaces can be made of magnetic beads, silica, polystyrene-latex materials,

27
cellulose matrix, or glass fibers. A variation of the protocol is using oligo(dT)
microbeads to isolate only mRNA. A lot of commercial column based kit for RNA
purification are available, some of which were specifically developed for low input
RNA, such as RNeasy micro Kit (Qiagen), PicoPure RNA Isolation (Arcturus), and
µMACS oligo(dT) MicroBeads (Miltenyi Biotec). If the starting material of RNA is
adequate, total RNA can be quantified, and the purity assessed, using the NanoDrop,
while the quality of RNA can be determined using the RNA 6000 Pico/Nano LabChip
on the Agilent 2100 bioanalyzer.
Once the total RNA has been purified, the next step is the production of a labeled
sample that can be hybridized to the microarray. There are three common protocols for
production of labeled target, each of which can be modified in several ways. The first
protocol started with large amounts of total RNA (20-100 µg) and introduced modified
nucleotides with a fluorescent dye (such as cyanine 3 or cyanine 5) incorporated into the
cDNA synthesis reaction. The disadvantages of these methods are that a large amount of
total RNA is required and the direct incorporation of dye-tagged nucleotides into the
growing cDNA chain by the polymerase is inefficient (Elvidge G, 2006). The other two
methods are correlated with the amplification of the RNA. Amplification of the starting
RNA population is used to generate labeled microarray targets, especially from limiting
amount of RNA. Amplification techniques are based on two different approaches: linear
amplification by in vitro transcription of the cDNA and exponential PCR amplification
of the cDNA (Fig. 1.14 A, B). The most commonly used mechanism for linear
amplification is based on T7 RNA polymerase-mediated in vitro transcription (Van
Gelder RN et al., 1990). The dyes can be incorporated as part of the nucleotides, or
attached to an aminoallyl group. One example is the Amino Allyl MessageAmp II
aRNA Amplification Kit (Ambion). Several PCR-based methods of RNA amplification
have been developed. Generally the cDNA is then labeled using nucleotides with
incorporated dyes and Klenow fragment. Two examples are the µMACS SuperAmp Kit
(Miltenyi Biotec) and TranPlex Whole Transcriptome Amplification 2 (Sigma-Aldrich).
PCR has a number of advantages over linear amplification: it is faster, more cost
effective, with an almost unlimited degree of amplification, and it was demonstrated
that it is more reliable for detecting true expression differences between samples
(Subkhankulova T & Livesey FJ, 2006).

28
Figure 1.14: RNA amplification. A) Linear amplification using T7 RNA polymerase (figure from Amino
Allyl MessageAmp II aRNA Amplification Kit, Ambion); B) PCR-base exponential amplification (figure
from TranPlex Whole Transcriptome Amplification 2, Sigma-Aldrich).
1.2.4 Hybridization and scanning
The samples are hybridized to the arrays, normally overnight. Since the aim is to detect
expression of specific transcripts, hybridization and washes are performed under highly
stringent conditions that minimize cross-hybridization between similar transcripts. One
mismatch in 100 nucleotides reduces melting temperature of about 1.5°C, so target-
probe duplexes with an elevated number of mismatches will be separated during post-
hybridization washes. Although short oligonucleotides should theoretically provide the
greatest discrimination between related sequences, it was reported that short surface-
bound oligonucleotides often have poor hybridization properties (Hughes TR et al.,
2001). Initially, hybridizations were performed with the slide covered by a glass and
inserted in a chamber placed in a water bath. However, agitation of the hybridization
solution using micromixer cards in the ArrayBooster (Advalytix) shows a nearly 6-fold
increase of signal intensities in comparison with the cover glass experiments (Toegl A
et al., 2003). Most commercial platforms use a custom hybridization cartridge to ensure
that the labeled sample is distributed evenly around the array. Agilent microarrays are
hybridized in special hybridization chambers that are placed in an oven with a special
rotator rack to provide optimal hybridization performance.

29
The readout from the microarray is captured as an image acquired using a scanner for
fluorescent signal detection via a confocal detector or a charge coupled device (CCD)
camera. The microarray scanners are able to excite the fluorophores adhered to the spots
on the array and acquire data about the intensities of the light emissions from the field
of the microarray. The raw image of a microarray scan is usually a 16 bit TIFF file that
is a digital record of the intensity of fluorescence associated with each pixel in the array.
Higher resolution can be achieved decreasing the pixel size or by storing the data in a
more bit format. The image is usually captured after first performing a pre-scan, both to
confirm that the hybridization worked and to estimate the appropriate gain on the laser
in order to capture as much information as possible without saturating the signal
(Gibson G & Muse SV, 2009). Then, the image is used to extract information describing
the intensity at each point of the array (feature extraction). The localization of the spots
is most simply achieved by laying a grid over the image that places a square or circle
around each spot. Feature extraction is an automatic process for the commercial arrays
using platform specific software with defined spot finding algorithms, background
subtraction methods and selection of poor quality spots (Elvidge G., 2006).
1.2.5 Data analysis
In attempting to obtain biological meaning from microarray data, it is useful to convert
strings of hundreds of thousands of numbers into a simple format. Data analysis of
microarrays comprises three fundamental steps: pre-processing, identification of
differentially expressed genes, and data mining.
Data pre-processing is the first step of data analysis. There are inherent characteristics
of measured raw intensity data that can affect the data analysis. After data collection,
any spot with intensity lower than the background plus two standard deviations should
be excluded (Leung YF & Cavalieri D, 2003). The intensity ratios should also be log-
transformed (generally on the base 2 scale) so that in two-color microarray upregulated
and downregulated values are of the same scale and comparable (Quackenbush J, 2002)
and in one-color microarray the value range is reduced. Many factors in generating
intensity measurements need to be considered prior to data analysis. There are several
experimental variables, such as differences in labeling, hybridization and detection.
Intensity measurements should be adjusted to minimize systematic biases. This

30
adjustment is referred to as normalization (Chen JJ, 2007). Many normalization
methods have been proposed (Steinhoff C & Vingron M, 2006). The common
normalization techniques in use rest assumptions that the majority of genes is not
differentially regulated or the number of up-regulated genes roughly equals the number
of down-regulated. The most common scaling method is global mean normalization,
where all raw intensity values are divided by global mean (Schena M et al., 1995).
Among transformation methods, two techniques are most used: LOWESS and quantile
normalizations. LOWESS regression, or locally weighted least squares regression, is a
technique for fitting a smoothing curve to a dataset. It assumes that the dye biases are
dependent on spot intensity (Yang YH et al., 2002). Quantile normalization aims at
making the distribution of probe intensities for each array in a set of arrays the same by
taking the mean quantile and substituting it as the value of the data item in the original
dataset (Bolstad BM et al., 2003). Choice of appropriate methods for background
correction and normalization are important to the analysis of microarray data.
Generally, the quantile normalization is mainly used for one-color array data, and global
mean and LOWESS normalizations for two-color array data (Do JH & Choi DK, 2006).
Some arrays may have multiple probes that measure the same gene; the intensity from
these probes can be combined to generate a single expression level for the gene. In
conclusion, there are many options and methods for data filtering, local and regional
backgrounds, multiple probes and normalization and transformation, however,
microarray platform manufacturers also provide useful recommended data processing
protocols.
The starting point in finding differentially expressed genes is the assumption that one
knows the classes that are represented in the data. A logical approach to data analysis is
to use the information about the various classes in a supervised fashion to identify those
genes that can be used to distinguish the various groups. Replication of a microarray
experiment is essential to obtain the variation in the gene expression for statistical
calculation. It has been suggested that every microarray experiment should be
performed in triplicate to increase data reliability (Lee ML et al., 2000). Rather than
simply adopting a twofold cutoff, gene expression studies require an assessment of the
statistical significance of the differences between samples. There are a wide variety of
statistical tools that can be brought to identify differentially expressed genes, including
t-tests (for two classes) and analysis of variance (ANOVA; for three or more classes)
that assign P-values to genes based on their ability to distinguish between groups

31
(Quackenbush J, 2006). It should be noted that there are other widely used approaches,
such as Significance Analysis of Microarrays (SAM, Tusher VG et al., 2001) which
uses an adjusted t-test, modified to correct for overestimates arising from small values
in the denominator, along with permutation testing to estimate the False Discovery Rate
(FDR) in any selected significant gene set.
Data mining can be divided in: clustering analysis, gene ontology (GO) classification,
and pathway analysis. Clustering algorithms sort the data and group genes or samples
together on the basis of their separation in expression space. Various clustering
techniques have been applied to the identification of patterns in gene-expression data:
hierarchical and non-hierarchical, such as k-means clustering. Even though the methods
used are objective in the sense that the algorithms are well defined and reproducible,
they are still subjective in the sense that selecting different algorithms, different
normalizations, or different distance metrics, will place different objects into different
clusters (Quackenbush J, 2002).
To shed light on the biological mechanism of differentially expressed genes or cluster of
genes is necessary to perform a GO analysis, which assign genes to one or more
molecular functions, biological processes, and cellular components. However,
translating a list of differentially expressed genes into a list of functional categories
using annotation databases suffers from a few important limitations. The current
approach is limited to looking up existing annotations and cannot discover previously
unknown function for known genes. Another limitation is related to those genes that are
involved in several biological processes. For such genes, GO analysis weights all the
biological process equally and it is not possible to single out the more relevant one by
using the context of the other genes (Khatri P & Draghici S, 2005).
Genes never act alone in a biological system: they are working in a cascade of networks.
As a result, analyzing the microarray data in a pathway perspective could lead to a
higher level of understanding of the system. More advanced analyses attempt to identify
functionally relevant pathways with the aid of pathway databases such as the Kyoto
Encyclopedia of Genes and Genomes (KEGG) and BioCarta. However, also pathway
analysis presents the same limitations of GO analysis.

32
1.2.6 Microgenomics
Microgenomics is the “omics” analysis at single cell level. Multicellular organisms are
complex collections of numerous functionally and phenotypically distinct cell types,
with essentially the same genomic information. Such variation is achieved by
differential gene expression, and therefore, the quantitative measurement of expression
in a small number of cells, ideally single cells, is essential for the understanding of
properties or states of cells in any biological context (Kurimoto K & Saitou M, 2010).
The movement of “omics” into single cell analysis represents a significant shift.
Previous well-established methods for single cell analysis, such as imaging and flow
cytometry, are limited to the examination of a small number of genes, proteins or
metabolites. As a result, these methods can only be used to open narrow windows into
the complexity and dynamics of intracellular pathways. By contrast, single cell “omics”
has the potential to enable systems biology at the level of single cells (Wang D &
Bodovitz S, 2010). At the simplest level, single cell analysis reduces biological noise:
from a complex mixture of cells, it is attempted to infer the probable state of an average
cell in the population. In truth, what it is obtained is an averaged cell. The variation
among the members of the population (that methods average into a mean) generally is
not known. Recent technological advances allow the precise measurement of single-cell
transcriptional states to study this variability more rigorously. As discussed in a review
that collects early microgenomic experiments (Levsky JM & Singer RH, 2003), it is
clear that genes expression could be very different also in a population of homogeneous
cells (Fig. 1.15).
A lot of investigations have been described for “omics” analysis in single cell (Wang D
& Bodovitz S, 2010). Among these, microarray platforms provide major opportunities
for quantitative, genome-wide transcriptional analyses. This technology, however,
usually requires large amounts of starting materials typically obtained from more than
10,000 cells. Owing to this limitation, there is a risk that the methods will fail to detect
differences among individual cells in a population. There are three critical steps in
producing good quality and reliable microarray data from a single cell. First, cell
samples should be collected in the shortest possible time to avoid change in gene
expression due to the collection procedure. Second, RNA extraction should be
performed with great care to avoid degradation of the small amount of RNA during
purification. Finally, the RNA/cDNA amplification (linear or exponential, chapter
33
1.2.3) should introduce as minor bias as possible (Kurimoto K & Saitou M, 2010). Once
amplified, the target should be hybridized in the array and data should be analyzed
using the standard protocols.
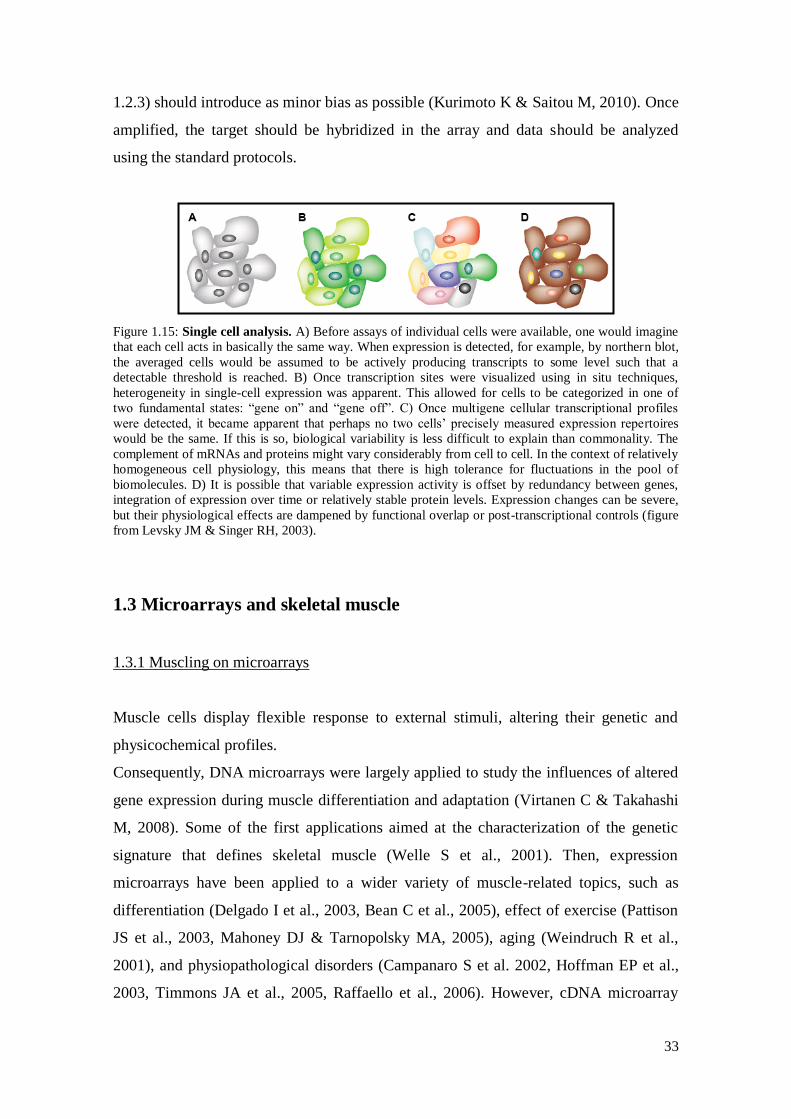
Figure 1.15: Single cell analysis. A) Before assays of individual cells were available, one would imagine
that each cell acts in basically the same way. When expression is detected, for example, by northern blot,
the averaged cells would be assumed to be actively producing transcripts to some level such that a
detectable threshold is reached. B) Once transcription sites were visualized using in situ techniques,
heterogeneity in single-cell expression was apparent. This allowed for cells to be categorized in one of
two fundamental states: “gene on” and “gene off”. C) Once multigene cellular transcriptional profiles
were detected, it became apparent that perhaps no two cells’ precisely measured expression repertoires
would be the same. If this is so, biological variability is less difficult to explain than commonality. The
complement of mRNAs and proteins might vary considerably from cell to cell. In the context of relatively
homogeneous cell physiology, this means that there is high tolerance for fluctuations in the pool of
biomolecules. D) It is possible that variable expression activity is offset by redundancy between genes,
integration of expression over time or relatively stable protein levels. Expression changes can be severe,
but their physiological effects are dampened by functional overlap or post-transcriptional controls (figure
from Levsky JM & Singer RH, 2003).
1.3 Microarrays and skeletal muscle
1.3.1 Muscling on microarrays
Muscle cells display flexible response to external stimuli, altering their genetic and
physicochemical profiles.
Consequently, DNA microarrays were largely applied to study the influences of altered
gene expression during muscle differentiation and adaptation (Virtanen C & Takahashi
M, 2008). Some of the first applications aimed at the characterization of the genetic
signature that defines skeletal muscle (Welle S et al., 2001). Then, expression
microarrays have been applied to a wider variety of muscle-related topics, such as
differentiation (Delgado I et al., 2003, Bean C et al., 2005), effect of exercise (Pattison
JS et al., 2003, Mahoney DJ & Tarnopolsky MA, 2005), aging (Weindruch R et al.,
2001), and physiopathological disorders (Campanaro S et al. 2002, Hoffman EP et al.,
2003, Timmons JA et al., 2005, Raffaello et al., 2006). However, cDNA microarray

34
technology lacks the ability to discern the primary changes in muscles from those that
arise from secondary or tertiary influences. Thus, although these studies provided the
first step in characterizing muscle gene expression at the mRNA level, follow up steps
must be taken to better define genes associated with specific processes.
Recent advances in microarray technology provide some new potential applications for
profiling gene and protein expression in the context of muscle physiology. Chromatin
immunoprecipitation on microarrays analyzes interactions of proteins with DNA. In
skeletal muscle a number of signaling cascades associated with muscle differentiation
and adaptation have been characterized and this technology allows identifying potential
gene targets regulated by these transcriptional factors (Basel-Duby R & Olson EN,
2006, Lluis F et al., 2006). Modifications of the genomic DNA without changes in the
sequence, such as by methylation of cytosine residues, is another important regulatory
mechanism. How the various stimuli should modify DNA in skeletal muscle has yet to
be determined. To answer this question, CpG island microarray was applied to analyze
methylation of DNA near the regulatory elements of genes (Salerno W et al., 2006).
Finally, the application of miRNA microarrays to the characterization of muscle gene
expression regulation has lead to the identification of specific miRNAs that regulate the
process of differentiation (Chen JF et al., 2006) and adaptation (McCarthy JJ & Esser
KA, 2007). In the field of exercise physiology, little is known about the status of non-
coding RNA during exercise. Profiling of miRNA following an exercise stimulus would
be useful to understand the underlying process of gene expression regulation.
1.3.2 Microarrays of fast- and slow- twitch
Different types of myofibers are characterized by specific programs of gene expression.
Almost every protein involved in contraction (MyHC, MyLC, troponin, actin, etc.) has
at least two isoforms differentially expressed in slow and fast fibers and the different
metabolic capacities of oxidative and glycolytic fibers are well known (chapter 1.1.3,
Schiaffino S & Reggiani C, 1996). To identify fiber type-specific genes and signaling
pathways participating in the control of myofiber diversity, several microarray studies
were carried out in the past years using whole muscles (Tab. 1.4).
Campbell et al, 2001, performed a comparison between the white portion of the mouse
quadriceps muscle (white quad, fast muscle, predominantly composed of type 2B fibers)
and the red soleus muscle (slow muscle, predominantly composed of type 1 fibers).

35
Using an Affymetrix array, containing 6,519 genes and ESTs, they identified 49 mRNA
sequences that were differentially expressed between fast and slow muscle. The most
representative functional categories were energy metabolism (29%), transcription factor
(20%), contractile structure (14%), and Ca2+
homeostasis (8%).
In Wu H et al., 2003, a gene expression analysis of soleus and extensor digitorum
longus (EDL, fast muscle, predominantly composed of type 2B fibers) was carried out.
They used a microarray chip containing 12,000 unique genes and ESTs and found 35
transcripts more abundant in soleus and 35 transcripts more abundant in EDL. They
confirmed that genes encoding for structural proteins, Ca2+
channels, transcription
factors metabolic enzymes and mitochondrial components were expressed at
significantly different levels in slow vs. fast muscles.
In a recent work (Li Y et al., 2010), the global gene expression profiling was performed
in longissimus dorsi (predominantly composed of type 2B fibers) and soleus skeletal
muscles of Chinese Meishan pigs using the Affymetrix Porcine Genechip. 323
transcripts were found overexpressed in slow muscle and 227 in fast muscle. The
obtained results indicated distinguishable trends in extracellular matrix structure,
contractile structure and cytoskeleton, collagen, focal adhesion, immune response, and
energy metabolism between the two muscles.
“Fast”
transcripts
“Slow”
transcripts
Total DE
transcripts
Campbell WG et al, 2001 27 22 49
Wu H et al., 2003 35 35 70
Li Y et al., 2010 227 323 550
Table 1.4: Microarray analyses of fast and slow skeletal muscles. Differentially expressed genes
between fast and slow whole skeletal muscles. It should be noted that using up-dated microarray
platforms it is possible to recover a larger number of differentially expressed genes and so more complete
information on differences between slow and fast muscles was retrieved.
1.3.3 Why microgenomics on skeletal muscle?
Skeletal muscle is an extremely complex organ composed not only by myofibers but
also by other cell types like fibroblasts, endothelial and blood cells, nerves, etc (chapter
1.1.1). Even considering only the contractile components, still skeletal muscle appears
as a heterogeneous and versatile tissue since myofibers posses a wide range of
molecular, metabolic, and physiological properties (Tab. 1.5, chapter 1.1.3). The actual
contribution of single myofibers to the muscle transcriptional phenotype may be

36
overshadowed in gene expression studies with whole muscles, because a variety of cell
types contributes to differences in gene expression (Hampson R & Hughes SM, 2001).
Since previous microarray studies on differences between slow and fast phenotypes
used whole muscle as source of RNA, results were influenced by the presence of
transcripts for proteins of the extracellular matrix, focal adhesion, and collagen
(Campbell WG et al., 2000, Wu H et al., 2003, Li Y et al., 2010). Primary myogenic
cultures are another common model to study muscle physiology. The problem of
cellular heterogeneity might affect also this system, because not all myoblasts
differentiate into myotubes and fibroblasts still are a significant fraction of the total cell
population. In addition microarray data produced by a recent work (Raymond F et al.,
2010) demonstrate that due to lack of innervation cultured muscle cells display
reductive metabolic adaptations and activation of atrophy-like processes.
The emerging microgenomic technologies offer fundamental improvements in
experimental design, reflecting the real complexity of heterogeneous tissues (Wang D &
Bodovitz S, 2010, Levsky JM & Singer RH, 2003) and only single fiber analysis can
provide an appreciation of the true complexity of skeletal muscle. Dissociate myofibers
give an accurate culture model for the study of mature skeletal muscle (Ravenscroft G et
al., 2007) and single isolated fibers are largely used for biochemical analysis (Pette D et
al., 1999). Previously, only quantitative real-time PCR (qPCR) has been applied to
analyze the expression of single mRNAs in single fibers (Wacker MJ et al., 2008) and,
due to the large size of myofibers, it is also possible to classify them according to the
expressed MyHC isoform before qPCR experiments (Jemiolo B & Trappe S, 2004).
However, the limit of this approach is that only few individual genes are profiled in
each study. Microarray analysis performed on isolated myofibers should allow
obtaining a virtually complete list of the genes differentially expressed between fast and
slow fibers, removing any background noise (other cell types of muscle or different
fiber types) and identifying new genes pathways useful to better understand muscle
physiology.
MyHC 1 MyHC 2a MyHC 2x MyHC 2b
Soleus 53.6% 31.2% 15.2% 0%
EDL 1.3% 0% 9.3% 86.8%
Table 1.5: Heterogeneity of fiber types in muscles. Percentage of the different myosin heavy chains
(MyHC) in soleus and extensor digitorum longus (EDL) muscles of adult mice (90 days). The relative
abundance of each MyHC was determined by quantitative densitometry of gels (data from Agbulut O et
al., 2003).

37
2. AIMS OF THE EXPERIMENTAL PROJECT
Vertebrate skeletal muscles are complex organs composed by a variety of cell types
besides the typical long, multinucleated cells called myofibers: fibroblasts in the
connective layers; endothelial and smooth muscle cells in the vessel walls; nerves and
Schwann cells around the axons; and blood cells flowing through the vessels. Even
considering only the myofibers, still skeletal muscle appears as a heterogeneous and
versatile tissue since they possess a wide range of molecular, metabolic and
physiological properties, as well as different sizes.
Fibers with glycolytic metabolism, best adapted for rapid activity (fast-glycolytic), and
fibers rich in myoglobin and oxidative enzymes, specialized for continuous activity
(slow-oxidative), are at the extremes of this range. The expression of distinct myosin
heavy chain (MyHC) isoforms defines four groups (type 1, 2A, 2X, and 2B) and
provides the basis for the current nomenclature of fiber types. However, myofibers are
not fixed units but are capable of responding to functional demands by changing the
phenotypic profile. This functional plasticity involves metabolic changes and the
differential expression of MyHC and other myofibrillar proteins, thus allowing fine
tuning of the muscle performance.
The actual contribution of single myofibers to the muscle transcriptional phenotype may
be overshadowed in gene expression studies with whole muscles, just because of the
complex anatomy of skeletal muscle and the heterogeneity of myofibers.
The goal of my work was to demonstrate the feasibility of scaling down the phenotypic
analysis of skeletal muscle by applying transcriptome profiling to the single myofiber
level using microgenomic technologies. This approach will allow a wide phenotypic
characterization of fiber types. Since changes in gene expression are the most
immediate reply of muscle to physiological stimuli, microgenomic studies at single
fiber level would allow also a finer knowledge of muscle tissue plasticity.
In the first part of my project I developed a protocol to obtain good quality microarray
data from isolated and characterized myofibers. These were dissociated by incubation in
collagenase from two murine muscles: the white extensor digitorum longus (EDL, fast-
glycolytic) and the red soleus (slow-oxidative). One portion of these fibers was used for
MyHC isoform classification by SDS-PAGE, and the remaining part was used for RNA
purification, amplification and hybridization on microarrays.

38
Initially, using Operon microarrays I verified that expression profiles of myofibers were
free from non-muscle transcriptional activity, and therefore I performed a comparison
between type 1 and type 2B fiber profiles. Then, to better understand the complexity of
transcriptome among all fiber types, I changed over to the more advanced Agilent
microarray platforms. This is a one-color system, so I tested that collagenase incubation
did not influence microarray results. Again, I was able to confirm that non-muscle
transcripts were not present in myofibers data, and this further result allowed to enlarge
the analysis of single fiber expression profiles to type 1, 2A, 2X, and 2B myofibers.

39
3. MATERIALS AND METHODS
3.1 Isolation and characterization of skeletal muscle fibers
Ethics statement
All aspects of animal care and experimentation were performed in accordance with the
Guide for the Care and Use of Laboratory Animals published by the National Institutes
of Health (NIH Publication No. 85-23, Revised 1996) and Italian regulations (DL
116/92) concerning the care and use of laboratory animals. Experimental procedures
were approved by the local Ethical Committee of the University of Padova.
Animals
Wild-type CD1 mice (Charles River) were housed in a normal environment provided
with food and water. Adult males were killed by rapid cervical dislocation, to minimize
suffering, at three months age (weight: 33 – 35 g).
Enzymatic dissociation of myofibers
Detailed information is available in the mouse soleus and extensor digitorum longus
(EDL) muscles about fiber composition and length (Burkholder TJ et al., 1994, Totsuka
Y et al., 2003, Raffaello A et al., 2006); a single myofiber is supposed to have about a
hundred of nuclei (Bruusgaard JC et al., 2003). I modified published methods for long
fibers isolation (Rosenblatt JD et al., 1995, Shefer G & Yablonka-Reuveni Z, 2005,
Calderon JC et al., 2010), in order to keep the digestion time as short as possible and to
avoid activation of stress response genes. Muscles from both hind limbs of the same
mouse were immediately removed by microdissection, taking care to handle them only
by their tendons to minimize damage to the fibers and grouped together. Digestion
proceeded for 40 – 45 min. at 37°C in 1 ml high-glucose Dulbecco’s modified Eagle
medium (DMEM; Invitrogen-Gibco) containing 10 mg type I collagenase (220 U mg-1
;
Sigma). The collagenase-treated muscles were sequentially rinsed for 2 min. in 3 ml of
DMEM, 3 ml DMEM supplemented with 10% fetal bovine serum (FBS) and 3 ml of
DMEM and finally transferred into 50 mm x 18 mm well containing 3 ml of DMEM
with 10% FBS. All plastic was pre-rinsed with 10% FBS, to prevent sticking. Single
myofibers were liberated by gentle physical trituration with a wide-mouth plastic

40
Pasteur pipette (about 4 mm diameter). The triturating process was repeated several
times until about 100 intact fibers were obtained. After each physical trituration, the
muscles were transferred in a new well, to get rid of collagen wisps and hyper
contracted fibers. Quickly, intact and well isolated fibers were picked under stereo-
microscope and washed first in DMEM and then in phosphate buffered saline (PBS; 137
mM NaCl, 2.7 mM KCl, 10 mM Na2HPO4, 1.76 mM KH2PO4, pH 7.4). About 1/3 of
each fiber was clipped and placed in Laemmli buffer (for fiber typing by SDS-PAGE,
described below); the remaining part of the fiber was dissolved in a solution for RNA
extraction. All samples were collected within 45 min. from the last trituration step.
MyHC isoform identification by SDS-PAGE
Myosin heavy chain (MyHC) isoforms were separated in SDS-PAGE as described by
Talmadge RJ & Roy RR, 1993. About 1/3 of each fiber was solubilized at 90°C for 5
min. in 10 μl of Laemmli buffer (Tris pH 6.8 62.5 mM, glycerol 10%, SDS 2%, β-
mercaptoethanol 5%). After denaturation in SDS and heat, proteins were analyzed on
4% stacking (4% polyacrylamide 50:1, 30% glycerol, 70 mM Tris (pH 6.7), 4 mM
EDTA and 0.4% SDS) and 8% resolving gels (8% polyacrylamide 50:1, 30% glycerol,
0.4% SDS, 0.2 M Tris, and 0.1 M glycine). Slabs were 18 cm wide and 16 cm high.
Electrophoresis was carried out at 4°C for 43 hours, at 100 V for the first 3 hours and at
230 constant V for the remaining time. After silver staining (Bio-Rad Silver stain),
bands of MyHC isoforms appeared separated in the 200 kDa region and were identified
according to their migration rates compared to molecular weight standards. All gels
were scanned, digitally stored and analyzed.
3.2 RNA purification
RNA extraction with TRIzol
A couple of muscles of the same type was removed from mouse hind limbs and quickly
immersed in 1 ml of TRIzol Reagent (Invitrogen). Samples were homogenated using the
ULTRA-TURRAX dispenser (IKA) and incubated at room temperature (RT) for 5 min.
0.2 ml of chloroform were added, and tubes were vigorously shaken by hand for 15 sec.
and then incubated at RT for 5 min. Centrifugation at 12,000 x g for 20 min. at 4°C
41
separated phenol-chloroform phase, interphase, and aqueous phase. RNA was
precipitated from aqueous phase by mixing with an isovolume of isopropyl alcohol,
incubating samples at -20°C for 30 min., and centrifuging at 12,000 x g for 20 min. at
4°C. RNA pellet was washed twice by adding 1 ml of 75% ethanol, vortexing, and
centrifuging at 7,500 x g for 10 min. at 4°C. At the end of the procedure, RNA pellet
was dried and resuspended with 30 µl of RNase free water (Gibco).
RNA purification with RNeasy Micro Kit
Total RNA was extracted from fiber fragments (for microarray experiments) or pools
(for quantitative real-time PCR, qPCR) using the silica membrane technology of
RNeasy Micro Kit (Qiagen). Single fiber was disrupted by adding 75 µl Buffer RLT and
lysate was homogenized by vortexing for 5 min. Washes were performed on the column
as suggested by the manufacturer to remove any contamination. RNA elution was
performed with 14 µl of RNase-free water pre-heated at 37°C and repeated a second
time to avoid loss of RNA in the column. Due to the dead volume of the column, I
recovered about 20 – 24 µl. I estimated that the amount of total RNA purified from a
single fiber was in the range of one to few nanograms.
RNA purification with µMACS SuperAmp Kit
Total RNA was extracted from fiber fragments using the MACS column technology
(Miltenyi Biotec) following the instructions of manufacturer. The same protocol was
applied to whole muscle total RNA extracted with TRIzol to uniform RNA purification
for a better comparison between samples. Single fiber (or dried RNA) was incubated for
10 min. at 45°C followed by 1 min. at 75°C in 5.4 µl of Incubation Buffer. 28 µl of
Incubation Buffer are composed by: 25 µl of Lysis/Binding Buffer, 2 µl tRNA solution,
and 1 µl of Proteinase K solution (5 µg/µl). 5 µl of µMACS SuperAmp Microbeads
Oligo(dT) were applied to the lysed samples and they bound to their target mRNA. The
µ Column was placed in the magnetic field of the thermoMACS Separator and the cell
lysate with µMACS SuperAmp Microbeads was applied on it. Subsequently, the
magnetically labeled mRNA was captured in the column and washed several times with
Wash Buffer. RNA was ready for in-column cDNA synthesis, amplification and
labeling.

42
RNA extraction with TRIzol and purification with RNeasy Micro Kit
Total RNA was extracted from fiber fragments using 250 µl of TRIzol following the
protocol above without RNA precipitation. 70% ethanol was added to the aqueous
phase and RNA was purified using the columns of RNeasy Micro Kit as described
above. RNA elution was performed with 16 µl of RNase-free water.
RNA quantification and quality control
Total RNA extracted from whole muscle was quantified using the NanoDrop 1000
spectrophotometer (Celbio). RNA extracted from single fibers (1/3 of total) and from
whole muscles (200 ng) were analyzed using the RNA 6000 Pico/Nano LabChip on a
2100 Bioanalyzer (Aligent). The sample (1 µl) was separated electrophoretically as
described by the manufacturer and data were displayed as a gel-like image and/or an
electropherogram. All poor quality RNA samples were discarded.
3.3 RNA amplification and labeling
RNA amplification and labeling with Amino Allyl MessageAmp II aRNA Amplification
Kit
For Operon microarrays, RNA samples purified with RNeasy Micro Kit were
lyophilized and amplified twice using the Amino Allyl MessageAmp II aRNA
Amplification Kit (Ambion), in accordance with the manufacturer’s instructions. First
strand synthesis with an engineered reverse transcriptase produces virtually full-length
cDNA, which is the best way to ensure reproducible microarray results. The use of a
modified oligo(dT) primer bearing a T7 promoter allows the next amplification steps
(Van Gelder RN et al., 1990): after second strand synthesis and clean-up, the cDNA
becomes a template for in vitro transcription with T7 RNA polymerase. In vitro
transcription reactions were performed for about 12 hours. By subjecting the antisense
RNA (aRNA) to a second round of amplification I obtained on average about 80 μg
aRNA from type 1 fibers and 45 µg from type 2B fibers. That material was enough to
carry out several array hybridizations. For labeling, about 5 μg aminoallyl-labeled
aRNA were lyophilized and resuspended with 4.5 μl of Coupling Buffer. 2.75 μl of
cyanine 5 (Cy5) or cyanine 3 (Cy3) dyes (GE Healthcare) resuspended in DMSO were
43
added and the solution was incubated at 20°C in the dark for 45 min. (Cy5) or 15 min.
(Cy3). To quench the reaction, 2.25 μl of 4 M hydroxylamine were added and it was
incubated at 20°C in the dark for 15 min. Labeled aRNA was purified on column
(Ambion). For all the samples incorporation rate was in the range of 35 – 50 dye
molecules per 1000 nucleotides.
RNA amplification and labeling with Agilent Quick Amp labeling Kit
1 µg of RNA samples of muscles purified with TRIzol were amplified and labeled using
the One-color Quick Amp labeling Kit (Agilent), following the manufacturer’s
instructions. Agilent spike mix was added to samples. Complementary RNA (cRNA)
was generated using T7 RNA polymerase, which simultaneously amplifies target
material and incorporates Cy3-labeled CTP. In vitro transcription reactions were
performed for about 2 hours at 40°C. For purification of the labeled-amplified cRNA
samples, RNeasy Mini spin columns (Qiagen) were used. On average cRNA yield was
about 20 µg and the specific activity of 12.5 pmol Cy3 per µg cRNA.
RNA amplification and labeling with µMACS SuperAmp Kit
cDNA synthesis and purification were performed in the same MACS column (Miltenyi
Biotec) used for mRNA isolation to avoid loss of material. According to the
manufacturer’s directions, column was rinsed several times with Wash Buffer and then
20 µl of resuspended First-strand cDNA were applied on it. Column was incubated at
42°C for 45 min. and then rinsed with Tailing Wash Buffer. 50 µl of Tailing Mix were
twice applied to the column. Then it was removed from the thermoMACS Separator,
centrifuged in a tube at 300 x g for 10 sec. and the eluate was incubated for 4 min. at
94°C to denaturate mRNA. 20 units of Terminal Deoxynucleotidyl Transferase (MBI
Fermentas) were added and reaction was incubated 60 min at 37°C for the tailing of the
cDNA followed by 5 min. at 70°C to inactivate the enzyme. Lyophilized PCR Mix was
resuspended with 60 µl of Resuspension Buffer and 7 µl of Expand Long Template
Buffer and 3 µl of Expand Long Template PCR System DNA Pol Mix (Roche) were
added. PCR amplification was performed according to standard protocol. After
amplification PCR products were purified using High Pure PCR Product Purification
Kit (Roche) following the manufacturer’s instructions with the modification of
incubating the Elution Buffer on the column for 4 min. at RT before the last
centrifugation step. On average the yield was of 7 µg. 200 ng of the purified PCR
44
product were used for cDNA amplification and Klenow labeling. With the appropriate
buffers 1 nmol of Cy3-dCTP (GE Healthcare) and 20 units of Klenow Fragment (MBI
Fermentas) were added and the reaction was incubated for 2 hours at 37°C in the dark.
Labeled DNA was purified using Illustra CyScribe GFX Purification Kit (GE
Healthcare). Elution was performed with 60 µl 65°C Elution Buffer. On average DNA
yield was about 3 µg and the specific activity of 20 pmol Cy3 per µg dsDNA.
RNA amplification and labeling with TransPlex Whole Transcriptome Amplification 2
Kit
RNA samples purified from single fibers for Agilent microarrays were exponentially
amplified using the TransPlex Whole Transcriptome Amplification 2 (WTA2) Kit
(Sigma-Aldrich). The WTA process involved two steps. In the first step, sample RNA is
reverse transcribed with substantially non-self-complementary primers composed of a
semi-degenerate 3’ end and a universal 5’ end. RNA samples purified from single fiber
fragments in a total volume of about 14 µl were reverse transcribed by adding 2.5 µl of
Library Synthesis Solution, incubating at 70 °C for 5 min., adding 2.5 µl of Library
Synthesis Buffer, 3.9 µl of water and 2 µl of Library Synthesis Enzyme, and incubating
following the parameters suggested by the manufacturer. In the second step, the
resultant Omniplex cDNA library, composed of random, overlapping fragments flanked
by universal end sequence, is amplified by PCR with the universal primer to produce
WTA product. 301 µl of water, 37.5 µl of Amplification Mix, 7.5 µl WTA of dNTP
Mix, and 3.75 µl of Amplification Enzyme were added at the reaction, and then this was
incubated according to the manufacturer’s directions for 18 cycles. Optimal cycle
number was achieved by proceeding few cycles beyond the amplification “plateau”,
observed in a PCR test reaction. To remove the residual primers and nucleotides, PCR
products were purified with GenElute PCR Clean-up Kit (Sigma-Aldrich). On average
the yield was of 9 µg. Labeling was performed following the Enzymatic Labeling
protocol of Array-Based CGH for Genomic DNA Analysis Kit (Agilent). Briefly, 2 µg
of amplified-purified cDNA were concentrated to a final volume of 13 µl using a Speed
Vac. 2.5 µl of Random Primers were added to the reaction and it was incubated at 95°C
for 10 min. and then on ice for 5 min. The reaction was mixed with the Labeling Master
Mix (5.0 µl of Buffer 5X, 2.5 µl of 10X dNTP, 1.5 µl of Cy3-dUTP [1.0 mM], and 0.5
µl of Exo-Klenow fragment) and incubated at 37°C for 2 hours, and then at 65°C for 10
min. Labeled DNA was purified using Illustra CyScribe GFX Purification Kit (GE

45
Healthcare). Elution was performed with 60 µl 65°C Elution Buffer. On average DNA
yield was about 4 µg and the specific activity of 30 pmol Cy3 per µg dsDNA.
RNA quantification and quality control
Amplified RNA or DNA were quantified using the NanoDrop 1000 spectrophotometer
(Celbio), and 200 ng were analyzed using the RNA 6000 Nano or DNA 1000 LabChips
on a 2100 Bioanalyzer (Aligent). The sample (1 µl) was separated electrophoretically as
described by the manufacturer and data were displayed as a gel-like image and/or an
electropherogram. All poor quality RNA samples were discarded.
3.4 Microarray hybridization
Operon microarrays
The Mouse Genome Oligo Set (version 1.1, Operon) consisted of 13,443 70mer
oligonucleotide probes and it was purchased from the Gene Expression Service
available at CRIBI (University of Padova). Each oligo was spotted in two replicates on
MICROMAX SuperChip I glass slides (Perkin-Elmer) using Biorobotics Microgrid II
(Apogent Discoveries). We produced an updated and careful annotation of all sequences
by querying three databases: ENSEMBL (version 56), RefSeq (version 38) and
UniGene (version 183). About 1,500 probes did not find significant hits. The updated
platform (version 2.0) has been submitted to the GEO Database, with Accession
Number GPL10688.
3 µg of labeled targets from single fibers and 3 µg from muscle control were mixed and
ethanol precipitated. After dissolving the pellet in 120 µl of hybridization buffer (5X
SSC, 0.1% SDS, 25% formamide), samples were denatured at 90°C for 2 min and
added to the microarrays. Prehybridization was for 20 hours at 46°C in the presence of
5X SSC, 5X Denhardt, 0.1% SDS, 100 ng/µl ssDNA. Competitive hybridizations were
carried on for 44 hours at 46°C in an ArrayBooster microarray incubator (Advalytix),
followed by a series of post-hybridization washings.
46
Agilent microarrays
Agilent microarrays were printed using Agilent's 60-mer SurePrint technology. Whole
Mouse Genome 4x44K microarrays (Agilent) contained 4 arrays per slide and consisted
of 43,379 60mer oligonucleotide probes for biological features (sourced from UCSC
mRNA known genes, National Institute on Aging, GenBank, UniGene, RefSeq, and
RIKEN databases) and 32 x 10 spike-in control probes. SurePrint G3 Mouse Gene
Expression 8x60K microarrays (Agilent) contained 8 arrays per slide and consisted of
39,430 60mer oligonucleotide probes for Entrez Gene RNAs, 16,251 for lincRNAs, 96
x 10 control probes, and 32 x 10 spike-in control probes. Probe design was based on
RefSeq Build 37, Ensembl Release 55, Unigene Build 176, GenBank (April 2009), and
RIKEN 3 databases.
Due to the different amplification and labeling kits and to the different microarray
platforms used, three different protocols for sample preparation and hybridization were
performed for Agilent microarrays:
1. 1.65 µg of labeled cRNA target amplified with Quick Amp labeling Kit
(Agilent) was mixed with 11 µl of 10X Blocking Agent, 2.2 µl of 25X
Fragmentation Buffer, and water to a final volume of 55 µl. Reaction was
incubated at 60°C for exactly 30 min. to fragment cRNA. Hybridization mix was
composed by fragmented cRNA and 55 µl of 2X GEx Hybridization Buffer HI-
RPM. 100 µl of Hybridization mix were dispensed onto one of the 4 arrays of
the Whole Mouse Genome 4x44K microarray.
2. About 2 µg of labeled dsDNA target amplified with µMACS SuperAmp Kit
(Miltenyi Biotec) were prepared as described above without the Fragmentation
Buffer and the fragmentation step, but adding a denaturation step at 95°C for 2
min. Prepared sample was hybridized on Whole Mouse Genome 4x44K
microarray.
3. 800 ng of labeled dsDNA target amplified with WTA2 Kit (Sigma-Aldrich) was
mixed with 5 µl of 10X Blocking Agent and water to a final volume of 25 µl.
Sample was denaturated at 95°C for 2 min. Hybridization mix was composed by
denaturated dsDNA and 25 µl of 2X GEx Hybridization Buffer HI-RPM. 40 µl
of Hybridization mix were dispensed onto one of the 8 arrays of the SurePrint
G3 Mouse Gene Expression 8x60K microarray.
47
Slide was loaded into the Agilent SureHyb chamber and hybridization was performed in
a hybridization oven at 65°C for 17 hours. Rotation was set at 10 rpm. At the end,
hybridization chamber was disassembled and the slide was washed following the
manufacturer’s instructions.
3.5 Data analysis
Operon microarrays data pre-processing
Scanning: microarray slides were inserted into a VersArray ChipReader dual confocal
laser scanner (Bio-Rad) for fluorescence detection at 5 µm resolution.
Quantification: raw scanner images were processed with ScanArray Express Software
(Perkin-Elmer) for fluorescent quantification. Microarray data is MIAME compliant and
the raw data is available in the GEO database (accession number GSE23244).
Normalization: global mean normalization was performed across element signal
intensity. Visual inspection of MA plots showed that local mean normalization
(LOWESS) was not necessary. Normalized data are Log2 ratio of Channel 2 intensities
divided by Channel 1 intensities (test/reference), after background correction. Positive
values correspond to genes over-expressed in myofibers, whereas negative values refer
to genes over-expressed in whole muscles, and therefore under-expressed in myofibers.
Normalization was performed with MIDAW tool available at http://midaw.cribi.unipd.it
(Romualdi C et al., 2005). Before proceeding with the SAM tests described below, data
were filtered by removing 1,475 probes that were associated to NA spots in more than
60% of experiments.
Agilent microarrays data pre-processing
Scanning: microarray slides were inserted into a GenePix 4000B scanner (Agilent) for
fluorescence detection at 5 µm resolution (for Whole Mouse Genome 4x44K
microarrays) or at 3 µm resolution (for SurePrint G3 Mouse Gene Expression 8x60K
microarrays).
Quantification: information from probes features was extracted from microarray scan
data with the Feature Extraction Software (Agilent). Only arrays with at least 8/9

48
quality control metrics in range were used for the following data analyses. Data are not
yet published.
Normalization: intra-array normalization was performed with the Feature Extraction
Software. Quantile inter-arrays normalization was performed using the Expander
software (Sharan R et al., 2003). Normalized data are Log2 transformed. Before
proceeding with the SAM tests described below, data were filtered by removing probes
with at least 2 not available (NA) values for each category in the comparisons between
muscles treated with collagenase and not treated and between single fiber and whole
muscle, or with at least 5 NA values for comparison among fiber types.
Cluster analysis
Hierarchical cluster analyses were performed by MultiExperiment Viewer (MeV,
v4.5.1), a part of TM4 Microarray Software Suite (Saeed AI et al., 2006). Support trees
were obtained using Pearson Correlation with bootstrapping resampling method.
Differentially expressed genes
Significance Analysis of Microarrays (SAM) is a non-parametric statistical test based
on a permutation approach specifically implemented for microarray data (Tusher VG et
al., 2001). Regarding two-color microarrays (Operon), in one-class SAM analysis, all
myofibers were assigned to a unique class, thus distinguishing two populations of
muscle and non muscle cells. In the unpaired two-class SAM analysis type 1 myofibers
formed one group and type 2B a second group, to find differentially expressed (DE)
genes between the two fiber types. In one-color microarrays (Agilent), unpaired two-
class SAM analyses were performed to find DE genes between muscle treated with
collagenase and not treated, and between single fiber and whole muscle and multi-class
SAM analyses were performed to find DE genes among fiber types.
The threshold level is associated to a False Discovery Rate (FRD) value: the lower
FRD, the less false positives are expected. FDR values minor of 5% are commonly
recognized as highly significant. SAM analyses were performed by MeV.
Functional annotation
For Operon microarray data, Gene Ontology enrichment was performed with the Gene
Ontology Tree Machine tool (GOTM) using a P-value of 0.1 (Zhang B et al., 2004).
Sub-categories were identified using the Functional Annotation Clustering of the
49
Database for Annotation, Visualization and Integrated Discovery (DAVID v6.7, 16).
Gene enrichment in pathways was performed at the DAVID web server (Huang da W et
al., 2009) using a P-value of 0.5, interrogating KEGG database. In all the analyses
platform transcripts were used as background. For Agilent microarray data, Gene
Ontology enrichment was performed using only the Functional Annotation Clustering
of DAVID. The entire mouse genome was used as background.
Analysis of discriminant genes
Supervised class-prediction analyses were performed to Operon microarray data by
applying Prediction Analysis of Microarrays (PAM). This program uses the method of
the nearest shrunken centroids to identify a subgroup of genes that best characterizes a
predefined class (Tibshirani R et al., 2002). PAM analysis was performed with
MIDAW.
3.6 Quantitative real-time PCR
I used quantitative real-time PCR (qPCR) to validate the results obtained from Operon
microarray experiments. RNA was extracted from groups of 10 fibers classified by
SDS-PAGE as belonging to the same type, by adding 350 μl Buffer RLT and then
proceeding with the protocol of RNeasy Micro Kit (Qiagen). The RNA pool contained
finally RNA from 50 individual fibers. 1 µg of aRNA was reverse transcribed using
Superscript III reverse transcriptase (Invitrogen) according to the manufacturer’s
directions. Gene-specific primers were designed using Primer 3 software in order to
amplify fragments of 150 – 250 bp in length, close to the 3’ end of the transcript (Tab.
3.1). To avoid the amplification of contaminant genomic DNA, I selected primers lying
on distinct exons, separated by a long intron (more than 1000 bp), if possible. Gel
electrophoresis and the dissociation curve were used to assess the specificity of the
amplicon. PCR reactions were performed in a 7500 Real-Time PCR System (Applied
Biosystems), using the SYBR Green chemistry (Finnzymes), following the
manufacturer’s instructions. Thermal cycling conditions were as follows: 10 min. at
95°C, followed by 40 cycles of 25 sec. at 95°C and 1 min. at 60°C, and at the end 3
min. at 72°C. Samples from pooled fibers and whole muscles (same RNA control of
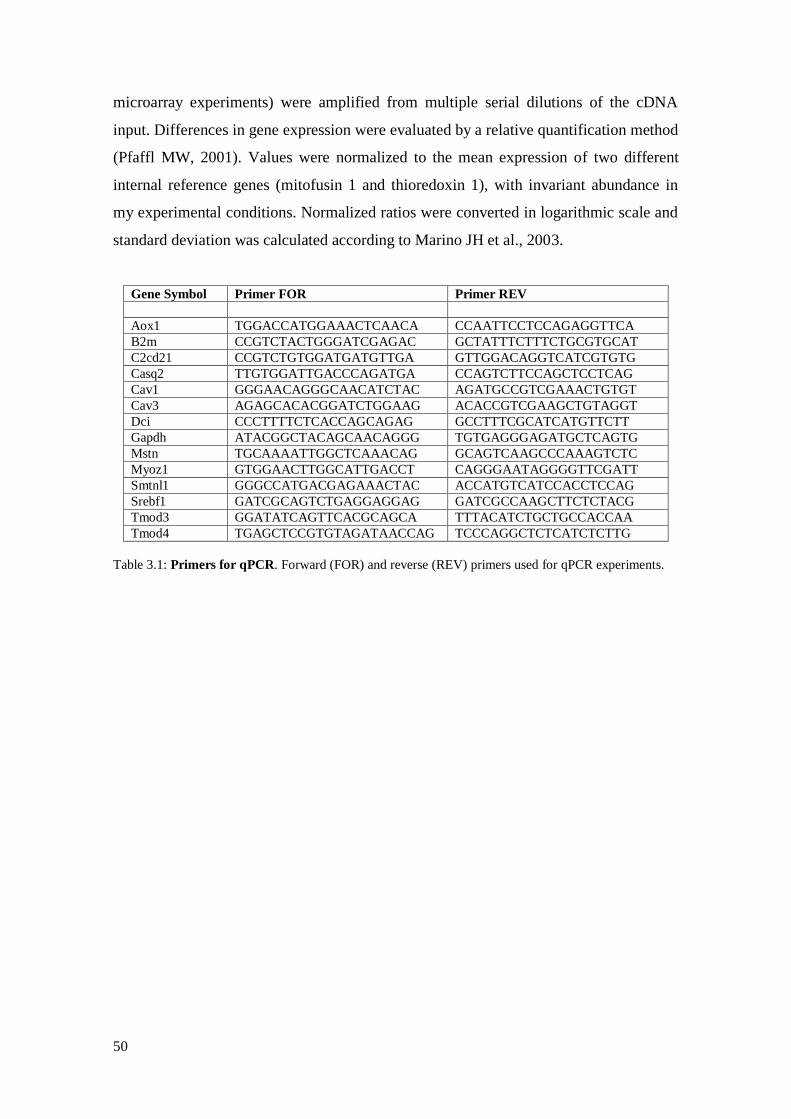
50
microarray experiments) were amplified from multiple serial dilutions of the cDNA
input. Differences in gene expression were evaluated by a relative quantification method
(Pfaffl MW, 2001). Values were normalized to the mean expression of two different
internal reference genes (mitofusin 1 and thioredoxin 1), with invariant abundance in
my experimental conditions. Normalized ratios were converted in logarithmic scale and
standard deviation was calculated according to Marino JH et al., 2003.
Gene Symbol Primer FOR Primer REV
Aox1 TGGACCATGGAAACTCAACA CCAATTCCTCCAGAGGTTCA
B2m CCGTCTACTGGGATCGAGAC GCTATTTCTTTCTGCGTGCAT
C2cd21 CCGTCTGTGGATGATGTTGA GTTGGACAGGTCATCGTGTG
Casq2 TTGTGGATTGACCCAGATGA CCAGTCTTCCAGCTCCTCAG
Cav1 GGGAACAGGGCAACATCTAC AGATGCCGTCGAAACTGTGT
Cav3 AGAGCACACGGATCTGGAAG ACACCGTCGAAGCTGTAGGT
Dci CCCTTTTCTCACCAGCAGAG GCCTTTCGCATCATGTTCTT
Gapdh ATACGGCTACAGCAACAGGG TGTGAGGGAGATGCTCAGTG
Mstn TGCAAAATTGGCTCAAACAG GCAGTCAAGCCCAAAGTCTC
Myoz1 GTGGAACTTGGCATTGACCT CAGGGAATAGGGGTTCGATT
Smtnl1 GGGCCATGACGAGAAACTAC ACCATGTCATCCACCTCCAG
Srebf1 GATCGCAGTCTGAGGAGGAG GATCGCCAAGCTTCTCTACG
Tmod3 GGATATCAGTTCACGCAGCA TTTACATCTGCTGCCACCAA
Tmod4 TGAGCTCCGTGTAGATAACCAG TCCCAGGCTCTCATCTCTTG
Table 3.1: Primers for qPCR. Forward (FOR) and reverse (REV) primers used for qPCR experiments.
51
4. RESULTS AND DISCUSSION
4.1 Microgenomics on skeletal muscle
To obtain undamaged myofibers, I started from protocols developed in mouse, where
the dissociated flexor digitorum brevis (FDB) myofiber culture is a system widely
applied (Ravenscroft G et al., 2007). FBD muscles are first incubated with collagenase
and then gently dissociated into intact, healthy single fibers (Bischoff R, 1986). Results
obtained in the FDB system are favored by the small dimension of the myofibers in this
particular muscle (about 0.35 mm in the mouse). However, a single fiber is typically
much longer, even in the mouse: from 3 - 9 mm in the shortest muscles of the leg to 12 -
17 mm (Burkholder TJ et al., 1994).
The soleus and extensor digitorum longus (EDL) are among the most intensively
studied mammalian muscles and should offer a comprehensive catalog of fiber types.
The mouse EDL muscle is almost entirely composed of type 2B and 2X fibers, vice
versa the soleus mostly contains type 1 and 2A fibers (chapter 1.3.3). Several
laboratories have reported that fibers from both muscles do survive the dissociation
procedure (Rosenblatt JD et al., 1995, Shefer G & Yablonka-Reuveni Z, 2005, Calderon
JC et al., 2010), despite their remarkable length (EDL ~6.2 mm, soleus ~8.1 mm).
I tested a number of experimental parameters, in order to maximize the number of intact
myofibers recovered after enzymatic treatment: a) batch of type I collagenase; b) time,
buffer and temperature of incubation; c) strength of mechanical dissection. The last
point is very important and therefore extreme care had been taken during the trituration
procedure. To minimize change in gene expression, I optimized protocol in order to
incubate muscle at 37°C for the shortest time possible that finally was set at 40 – 45
minutes. Myofibers were characterized before expression profiling experiments (Fig.
4.1). After fiber dissociation, for each muscle preparation about 10 intact, unstrained
myofibers were quickly separated under stereo microscope from hyper-contracted fibers
(Fig. 4.2 A) and divided in two parts. The shortest one (about 1/3) was used for
electrophoretic separation of myosin heavy chain (MyHC) isoforms (Fig. 4.2 B), the
gold-standard method for fiber typing, and the remaining part for RNA purification.
Only fibers expressing pure MyHC isoforms (not hybrid) were further processed.
Several commercial kits for RNA extraction were trialed to verify what was the best one
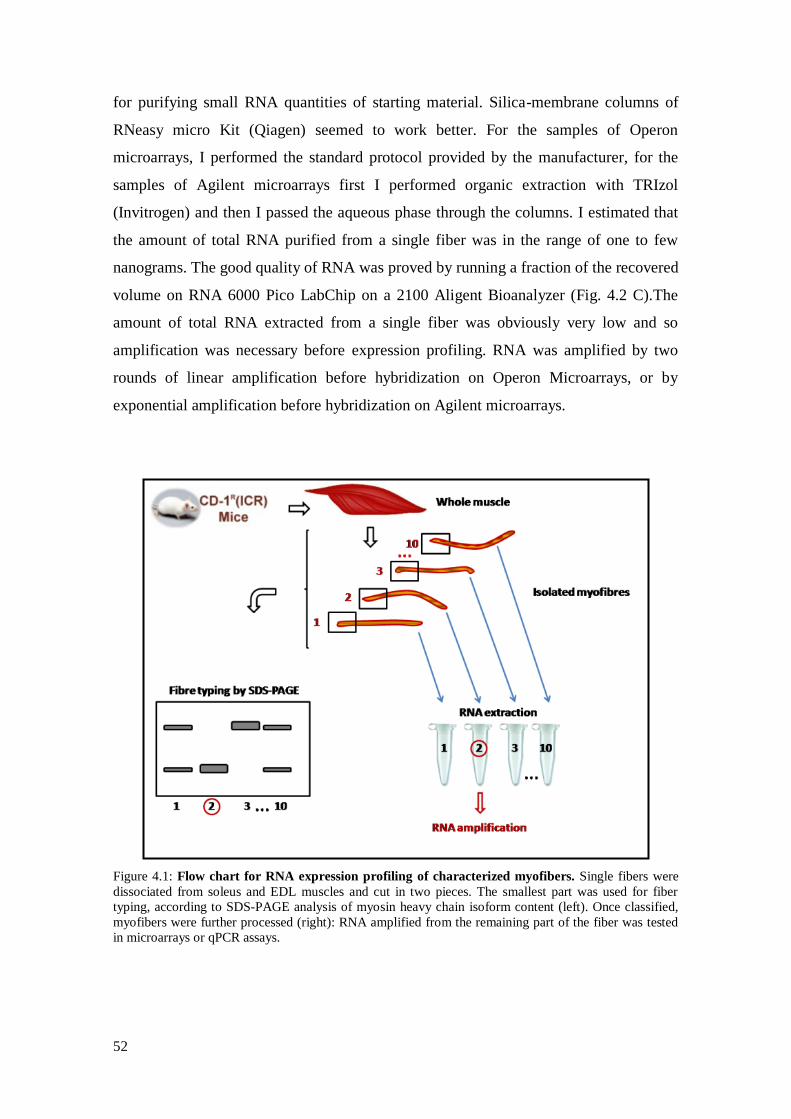
52
for purifying small RNA quantities of starting material. Silica-membrane columns of
RNeasy micro Kit (Qiagen) seemed to work better. For the samples of Operon
microarrays, I performed the standard protocol provided by the manufacturer, for the
samples of Agilent microarrays first I performed organic extraction with TRIzol
(Invitrogen) and then I passed the aqueous phase through the columns. I estimated that
the amount of total RNA purified from a single fiber was in the range of one to few
nanograms. The good quality of RNA was proved by running a fraction of the recovered
volume on RNA 6000 Pico LabChip on a 2100 Aligent Bioanalyzer (Fig. 4.2 C).The
amount of total RNA extracted from a single fiber was obviously very low and so
amplification was necessary before expression profiling. RNA was amplified by two
rounds of linear amplification before hybridization on Operon Microarrays, or by
exponential amplification before hybridization on Agilent microarrays.
Figure 4.1: Flow chart for RNA expression profiling of characterized myofibers. Single fibers were
dissociated from soleus and EDL muscles and cut in two pieces. The smallest part was used for fiber
typing, according to SDS-PAGE analysis of myosin heavy chain isoform content (left). Once classified,
myofibers were further processed (right): RNA amplified from the remaining part of the fiber was tested
in microarrays or qPCR assays.

53
Figure 4.2: Microgenomic approach in skeletal muscle. A) Transmitted light images at 2.5X
magnification of isolated muscle fibers from soleus (top) and EDL (bottom). Intact, unblemished
myofibers appears as translucent cylinders. The inset shows details of the characteristic striated pattern
(magnification 40X). Black scale bars: 250 µm; white scale bars: 25 µm. B) MyHC electrophoretic
characterization of fragments of single fibers from soleus (top) and EDL (below) muscles. A whole
muscle has been used as marker of molecular weight (*). As shown in the examples, type 1 and type 2A
fibers are abundant in the slow soleus muscle; type 2B and hybrid 2X/2B fibers are most frequent in the
fast EDL muscle. C) Electropherogram of total RNA extracted from a single soleus myofiber, analyzed in
the 2100 Agilent Bioanalyzer using a RNA 6000 Pico LabChip. The high quality of total RNA is
confirmed by the presence of ribosomal peaks with no shift to lower fragments (RNA degradation) and no
additional signals (DNA contamination).
4.2 Expression profiles of type 1 and type 2B fibers using Operon
microarrays
4.2.1 Experimental design
In order to study the differences in expression profiles between myofibers and whole
muscle and between type 1 (slow oxidative, SO) and type 2B (fast glycolytic, FG)
fibers, I performed competitive hybridizations on oligonucleotide Mouse Operon
microarrays. In particular, to allow solid statistics of microarray data, I profiled 10 type
1 and 10 type 2B myofibers. 10 myofibers were characterized in SDS-PAGE for each
CD1 sacrificed mouse. Since a single mouse individual contributed with 2 – 3 pure type
1 or type 2B fibers, I sacrificed 8 animals in order to collected 10 type 1 and 10 type 2B
fibers after screening 40 soleus and 40 EDL fibers. Data previously produced in my
laboratory (De Acetis M et al., 2005, Raffaello A et al., 2006) showed that microarray

54
results in mouse are little influenced by individual differences when common laboratory
strains are profiled, so I assumed that each sample of fibers was as an independent
biological replicate. Due to the microarray features, the data structure results quite
simple: 20 independent biological replicates (2 types of fiber, 10 fibers for each type),
with 2 technical replicates (duplicate spots in the microarray slide).
I adopted an experimental design that contrasts each experimental sample against a
common reference sample (chapter 1.1.2). For competitive hybridizations, it was
essential to find a control RNA with a balanced composition of type 1 and type 2B
fibers. An artificial control was created as follows: 3 couples of soleus and EDL
muscles were removed from 3 different mice and treated with type I collagenase as for
myofiber dissociation. By mixing about 1/3 RNA extracted from EDL and 2/3 RNA
extracted from soleus muscles I obtained a balanced contribution of type 1 and type 2B
fibers in the control. RNA was amplified by two rounds of linear amplification from
both single fibers and from the reference preparation. Competitive hybridizations were
carried out between sample and control. Global mean normalization was performed
across element signal intensity and normalized data are Log2 ratio of test intensities
divided by reference intensities (test/reference), after background correction. So,
positive values corresponded to genes over-expressed in myofibers, whereas negative
values referred to genes under-expressed in myofibers, and therefore more expressed in
whole muscles. Unfortunately, competitive hybridizations were afflicted by biased ratio
values, due to saturation of high-intensity spots (Dodd LE et al., 2004). For about two
hundred highly expressed genes, the recorded pixel intensity was truncated when it
reached the maximum value in one or both channels. Significant examples included fast
SR Ca2+
ATPase 1 (Atp2a1, alias Serca1) or glyceraldehyde-3-phosphate
dehydrogenase (Gapdh).
I tested the degree of divergence in gene expression between SO and FG fibers by
performing a bootstrap cluster analysis (Fig. 4.3 A). The results suggested that: a) the
diversity between type 1 and type 2B fibers could be unambiguously identified at
transcriptional level, since all SO fiber data formed a distinct group, clearly separated
from the group of FG fiber data; b) individual donor mice had no effect on formation of
subgroups within fiber types, confirming the initial assumption; c) all experiments were
of good quality, because technical replicates produced consistently similar results.
According to the experimental design, all arrays are independent and all fibers of the
same type form a unique class. One-class SAM analysis, carried out on the results of the

55
competitive hybridization of single fibers vs. reference preparation, revealed genes with
significantly different expression between myofibers and whole muscle. In total, 2,530
up-regulated and 2,488 down-regulated genes were identified using stringent threshold
values to minimize the number of false positives. By running unpaired two-class SAM
analysis I focused on gene expression diversity between the two groups of myofibers. In
total 1,505 non redundant differentially expressed genes were identified in SO type 1 vs.
FG type 2B fibers. In particular, 930 probes were over-expressed in type 1 fibers and
602 in type 2B fibers (Figure 4.3 B).
Figure 4.3: Statistical analysis of microarray data. A) Dendogram obtained by bootstrap hierarchal
clustering of expression data generated by 10 pure fibers expressing MyHC-1 (soleus) and 10 pure fibers
expressing MyHC-2b (EDL). Analysis was performed on the set of 11,964 probes that passed the
normalization and filtering steps, using Pearson correlation distance. Microarrays mRNA expression
profiling permitted a clear distinction between type 1 and type 2B fibers. Furthermore, technical replicas
grouped together within each experiment, confirming the good quality of microarray data. EDL samples
came from mice number 1 (1-2), 2 (3-5), 3 (6-8) and 4 (9-10); soleus samples from mice 5 (1-2), 6 (3-5),
7 (6-7) and 8 (8-10). The letters A, B refer to spot replicates present in each microarray slide: technical
replicas were present in each slide and they were split in two subarrays to check the quality of microarray
data. B) Venn diagram formed by DE genes identified after SAM analyses. Ovals: one-class test; circles,
two-class test. Overlapping areas represent genes positive to both tests. FDR values were 0.15% in the
one-class test and 0.21% in the two-class test.

56
4.2.2 Removal of non-muscle cells and enrichment for muscle specific genes
One-class SAM analysis (FDR below 0.25%) identified 5,018 differentially expressed
(DE) genes: 2,530 up-regulated and 2,488 down-regulated in myofibers with respect to
the whole muscle control. Genes highly expressed in non-muscle cells appeared down-
regulated in the experimental design and I queried biological databases to gain
information about their cellular role. Gene Ontology (GO) enrichment confirmed the
presence of entire families of genes coding for proteins expressed in non-muscle cells
(Tab. 4.1): globins, immunoglobins, chemokines, interleukins, and coagulation factors
of blood cells; collagens, metalloproteases, and proteoglycans occurring in the
connective tissue; and known markers of endothelial cells (endoglin, endothelial cell-
specific adhesion molecule, several gap junction proteins) or Schwann cells (Mog,
Plp1). Selected examples are presented in Figure 4.4 A. I noticed some interesting
discrepancies between profiling experiments carried out with single fibers and whole
muscle specimens. For example, a comparison between murine slow and fast muscles
showed that the extracellular matrix proteins fibromodulin (Fmod) and matrix Gla
protein (Mgp) have higher expression in the soleus than EDL (Campbell WG et al.,
2001). The same genes were found down-regulated in single fibers (Fig 4.4 A), thus
indicating that the difference was not attributable to muscle cells but to a different
contribution in fibroblasts.
A high number of genes up-regulated in myofibers defines the identity of muscle cells.
GO analysis showed the significant enrichment in genes coding for mitochondrial and
cytosolic proteins (Tab. 4.1), as well as for typical muscle structural proteins and
muscle specific isoforms for metabolic enzymes (e.g. creatine kinase, enolase,
phosphofructokinase). Novel findings were the marked expression of different isoforms
in the caveolin, synaptotagmin, and tropomodulin families, suggesting that muscle cells
express specific isoforms for proteins with a broad range of cellular functions.
Quantitative real-time PCR (qPCR) confirmed that indeed Cav3 and Tmod4 are up-
regulated in myofibers, while Cav1 and Tmod3 have preferential expression in non-
muscle cells (Fig 4.4 B). Beside its role in endocytosis, caveolin-3 may help targeting of
phosphofructokinase to the plasma membrane (Sotgia F et al., 2003).
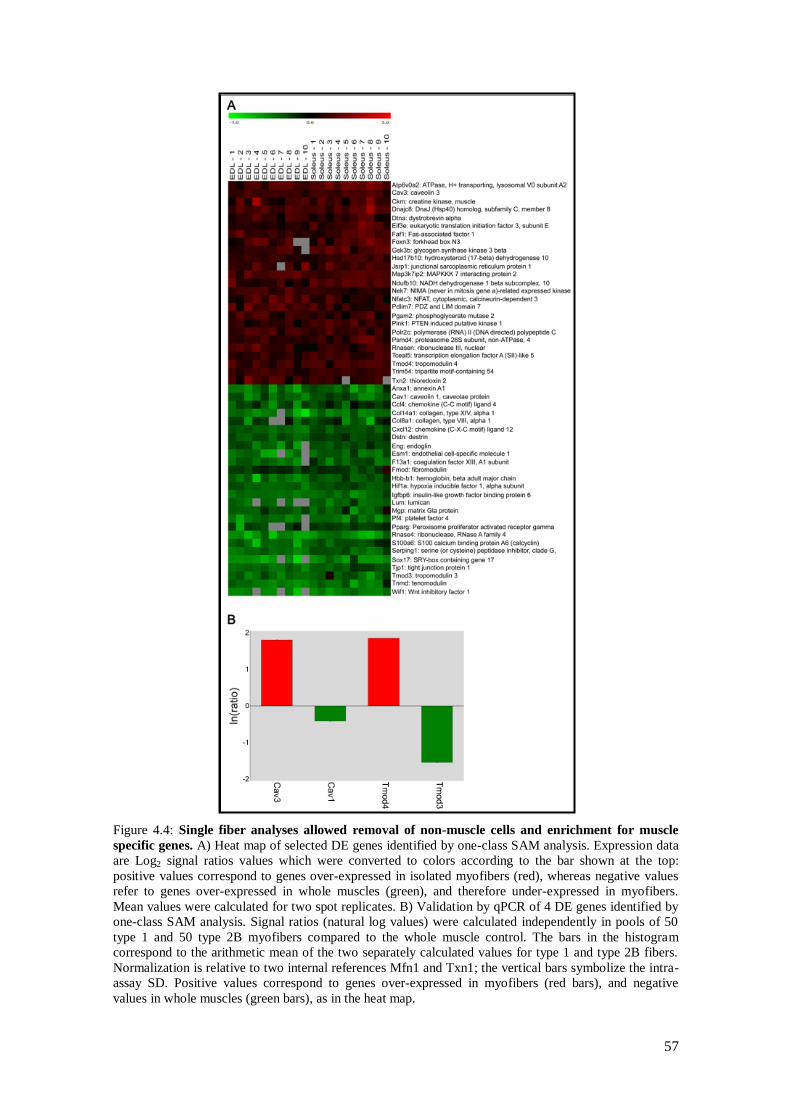
57
Figure 4.4: Single fiber analyses allowed removal of non-muscle cells and enrichment for muscle
specific genes. A) Heat map of selected DE genes identified by one-class SAM analysis. Expression data
are Log2 signal ratios values which were converted to colors according to the bar shown at the top:
positive values correspond to genes over-expressed in isolated myofibers (red), whereas negative values
refer to genes over-expressed in whole muscles (green), and therefore under-expressed in myofibers.
Mean values were calculated for two spot replicates. B) Validation by qPCR of 4 DE genes identified by
one-class SAM analysis. Signal ratios (natural log values) were calculated independently in pools of 50
type 1 and 50 type 2B myofibers compared to the whole muscle control. The bars in the histogram
correspond to the arithmetic mean of the two separately calculated values for type 1 and type 2B fibers.
Normalization is relative to two internal references Mfn1 and Txn1; the vertical bars symbolize the intra-
assay SD. Positive values correspond to genes over-expressed in myofibers (red bars), and negative
values in whole muscles (green bars), as in the heat map.
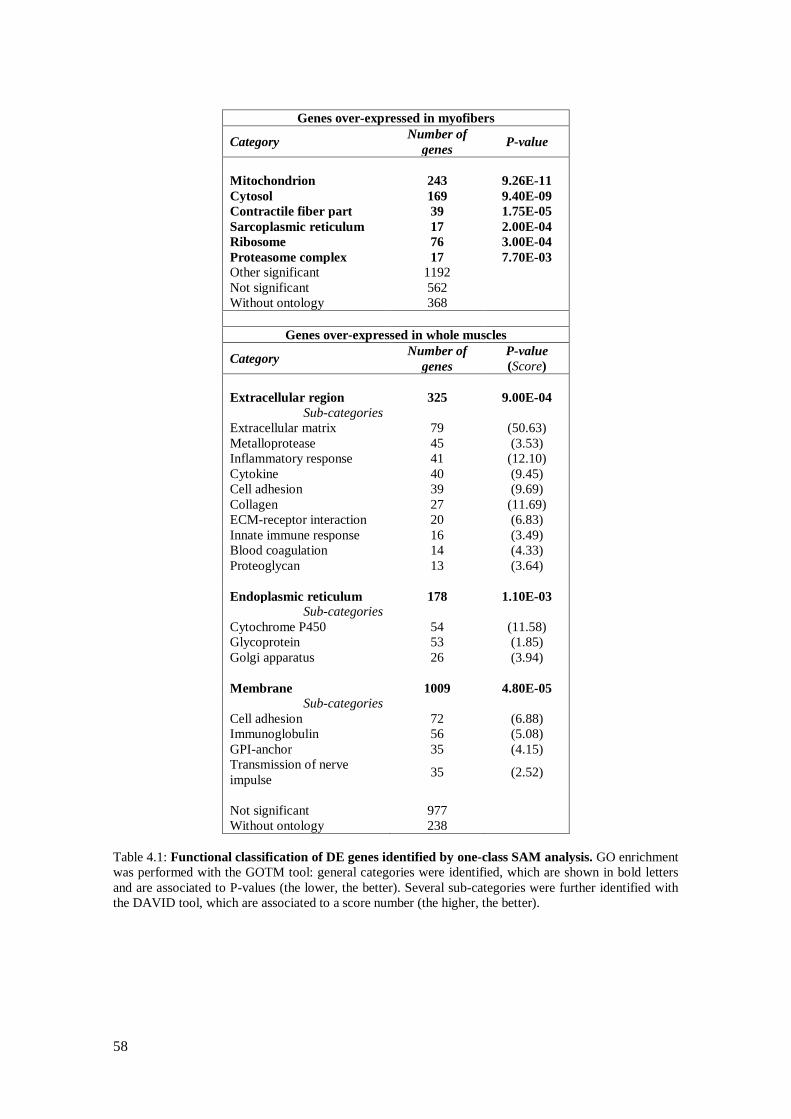
58
Genes over-expressed in myofibers
Category Number of
genes P-value
Mitochondrion 243 9.26E-11
Cytosol 169 9.40E-09
Contractile fiber part 39 1.75E-05
Sarcoplasmic reticulum 17 2.00E-04
Ribosome 76 3.00E-04
Proteasome complex 17 7.70E-03 Other significant 1192
Not significant 562
Without ontology 368
Genes over-expressed in whole muscles
Category Number of
genes
P-value
(Score)
Extracellular region 325 9.00E-04
Sub-categories
Extracellular matrix 79 (50.63)
Metalloprotease 45 (3.53)
Inflammatory response 41 (12.10)
Cytokine 40 (9.45)
Cell adhesion 39 (9.69)
Collagen 27 (11.69)
ECM-receptor interaction 20 (6.83)
Innate immune response 16 (3.49)
Blood coagulation 14 (4.33)
Proteoglycan 13 (3.64)
Endoplasmic reticulum 178 1.10E-03 Sub-categories
Cytochrome P450 54 (11.58)
Glycoprotein 53 (1.85)
Golgi apparatus 26 (3.94)
Membrane 1009 4.80E-05 Sub-categories
Cell adhesion 72 (6.88)
Immunoglobulin 56 (5.08)
GPI-anchor 35 (4.15)
Transmission of nerve
impulse 35 (2.52)
Not significant 977
Without ontology 238
Table 4.1: Functional classification of DE genes identified by one-class SAM analysis. GO enrichment
was performed with the GOTM tool: general categories were identified, which are shown in bold letters
and are associated to P-values (the lower, the better). Several sub-categories were further identified with
the DAVID tool, which are associated to a score number (the higher, the better).

59
4.2.3 Molecular signatures of individual slow oxidative and fast glycolytic myofibers
Two-class SAM analysis (FDR below 0.25%) identified 1,505 non redundant genes DE
between type 1 and type 2B fibers: 930 probes were over-expressed in type 1 fibers and
602 in type 2B fibers. Since this number is higher than those previously observed
comparing whole slow and fast muscles (Campbell WG et al., 2001, Wu H et al., 2003,
Li Y et al., 2010), it is likely that the single fiber strategy reduces biological noise by
subtracting transcripts expressed in a common set of cell types present in whole muscles
(Wang D & Bodovitz S, 2010). In consequence, the signatures produced with this
approach are much richer in muscle-specific and fiber-specific information. A selection
of typical muscle genes is presented in Figure 4.5. I focused my attention to sarcomere
and sarcoplasmic reticulum (SR) structures. The higher resolution of microgenomics is
evident by looking at the number of distinct components of thick or thin filaments
identified with this approach. In type 1 fibers I found as over-expressed the typical slow
isoforms: MyHC-1 (Myh7), Myl2, Myl3, Actn2, Tnnc1, Tnni1, and Tnnt1. Conversely,
in type 2B fibers I identified the characteristic fast isoforms: MyHC-2b (Myh4), Actn3,
Tnnc2, Tnni2, and Tnnt3. The cardiac MyHC-α (Myh6) and the embryonic MyHC were
found more expressed in SO fibers, while neonatal MyHC (Myh8) in FG fibers. In
addition, I confirmed that myozenin 2 (Myoz2) is expressed in oxidative myofibers,
whereas myozenin 1 (Myoz1) is predominantly expressed in fast-twitch fibers (Frey N
& Olson EN, 2002). Of particular interest is the observation that several Z disc proteins
were more expressed in type 1 fibers, in agreement with ultra structural studies showing
that slow muscles typically show wider Z bands (Luther PK, 2009). The development of
the SR requires the increased expression of a medley of different proteins, in part
identified by the one-class test. Further, electron microscopy has shown that EDL fibers
have a more developed SR than soleus fibers (Reggiani C & te Kronnie T, 2006). Thus,
it is remarkable that only a couple of SR genes were found DE in my study.
About genes coding for proteins involved in Ca2+
homeostasis, two-class SAM analysis
recognized Ca2+
ATPase Serca2a (Atp2a2) as significantly over-expressed in type 1
fibers, but did not identified the up-regulation of Serca1a in type 2B fibers, because of
the saturation of signal in the arrays (chapter 4.2.1). Also the two isoforms of
calsequestrin Casq1 and Casq2 were found up-regulated in type 2B and type 1
myofibers respectively, and parvalbumin (Pvalb) was correctly detected only in FG
fibers.
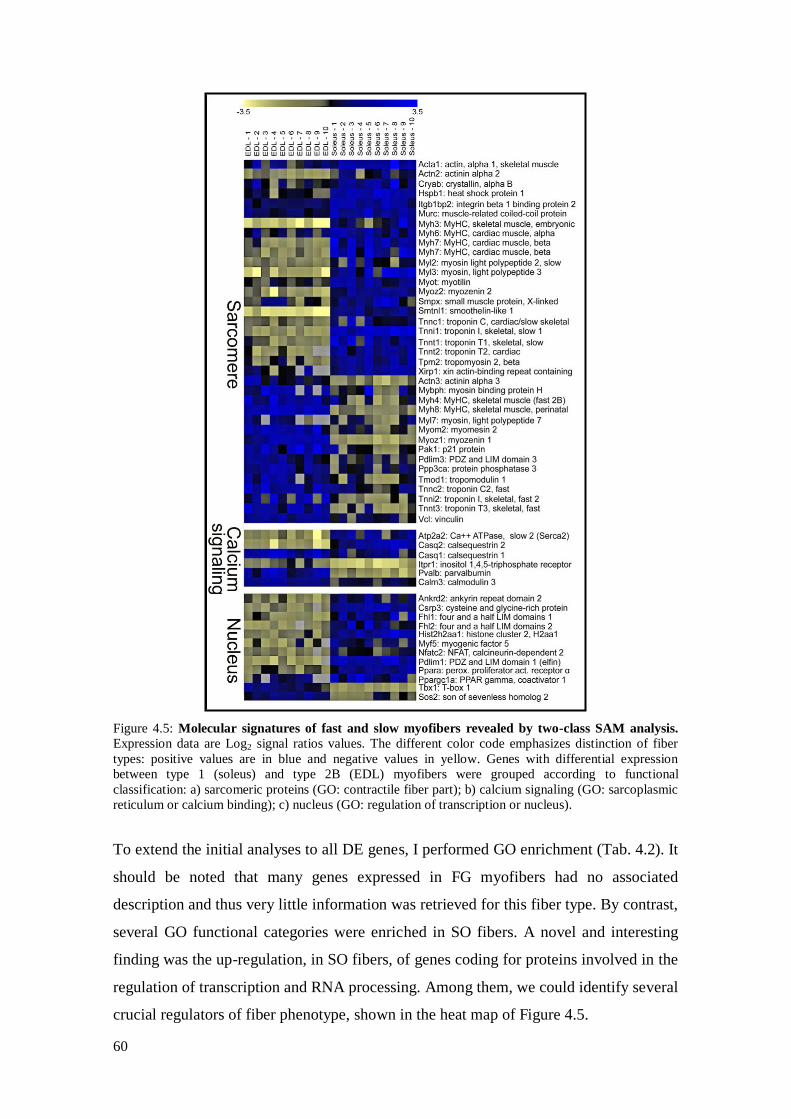
60
Figure 4.5: Molecular signatures of fast and slow myofibers revealed by two-class SAM analysis.
Expression data are Log2 signal ratios values. The different color code emphasizes distinction of fiber
types: positive values are in blue and negative values in yellow. Genes with differential expression
between type 1 (soleus) and type 2B (EDL) myofibers were grouped according to functional
classification: a) sarcomeric proteins (GO: contractile fiber part); b) calcium signaling (GO: sarcoplasmic
reticulum or calcium binding); c) nucleus (GO: regulation of transcription or nucleus).
To extend the initial analyses to all DE genes, I performed GO enrichment (Tab. 4.2). It
should be noted that many genes expressed in FG myofibers had no associated
description and thus very little information was retrieved for this fiber type. By contrast,
several GO functional categories were enriched in SO fibers. A novel and interesting
finding was the up-regulation, in SO fibers, of genes coding for proteins involved in the
regulation of transcription and RNA processing. Among them, we could identify several
crucial regulators of fiber phenotype, shown in the heat map of Figure 4.5.

61
Genes over-expressed in type 1 myofibers
Category Number of
genes P-value
Mitochondrion 102 7.24E-07
Contractile fiber part 26 2.83E-07
Ribosome 34 3.00E-05
Other significant 464
(Score)
Cytoskeleton 98 (6.13)
Protein complex assembly 30 (3.71)
Ubl conjugation 35 (2.78)
Golgi apparatus 38 (2.50)
Regulation of transcription 85 (2.49)
Chromatin organization 22 (1.96)
Protein transport 45 (1.81)
RNA processing 27 (1.80)
Vesicle 27 (1.71)
Nuclear proteins 51 (1.70)
Not significant 129
Without ontology 162
Genes over-expressed in type 2B myofibers
Category Number of
genes (Score)
Glycolysis 20 (1.92)
Zinc finger C2H2 25 (1.75)
Proteolysis 44 (1.38)
Other 20
Not significant 352
Without ontology 310
Table 4.2: Functional classification of DE genes identified by two-class SAM analysis. GO
enrichment was performed with the GOTM tool: general categories were identified, which are shown in
bold letters and are associated to P-values (the lower, the better). Several sub-categories were further
identified with the DAVID tool, which are associated to a score number (the higher, the better).
In good agreement with my findings, it is currently believed that a Ca2+
signaling
pathway, involving calcineurin, calmodulin-dependent kinase, the transcriptional
cofactor peroxisome proliferator-activated receptor-gamma coactivator 1α (Ppargc1a or
PGC1α), and the transcription factor peroxisome proliferator-activated receptor (PPAR)
δ, controls many of the required changes in gene activity that underlie the conversion to
a slow fiber fate (Bassel-Duby R & Olson EN, 2006, Schiaffino S et al., 2007). Three
closely related subtypes of PPARs regulate the expression of genes involved in
respiration and lipid metabolism. PPARα plays a major role in fatty acid oxidation and
lipoprotein metabolism (Yoon M, 2009). Its preferential expression in SO myofibers
fitted well with the finding that 14 genes of fatty acid metabolism pathway were over-
expressed in SO fibers (Tab. 4.3). By contrast, Pparg (PPARγ) was down-regulated in
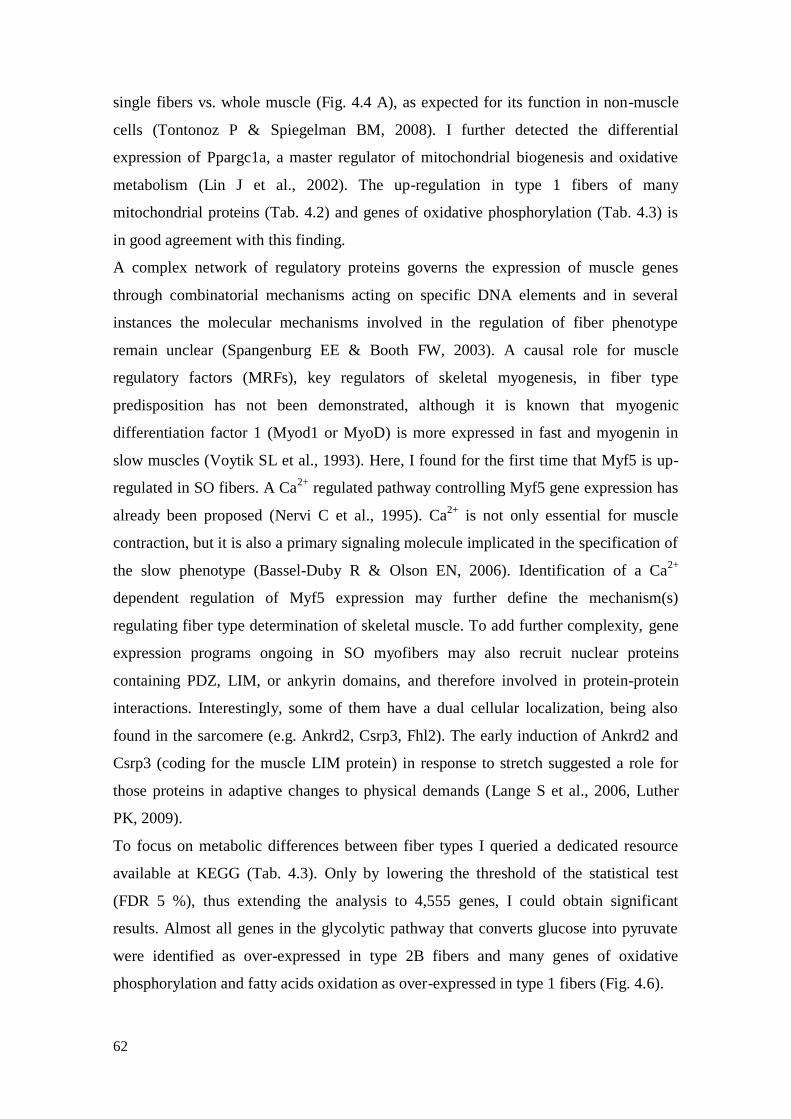
62
single fibers vs. whole muscle (Fig. 4.4 A), as expected for its function in non-muscle
cells (Tontonoz P & Spiegelman BM, 2008). I further detected the differential
expression of Ppargc1a, a master regulator of mitochondrial biogenesis and oxidative
metabolism (Lin J et al., 2002). The up-regulation in type 1 fibers of many
mitochondrial proteins (Tab. 4.2) and genes of oxidative phosphorylation (Tab. 4.3) is
in good agreement with this finding.
A complex network of regulatory proteins governs the expression of muscle genes
through combinatorial mechanisms acting on specific DNA elements and in several
instances the molecular mechanisms involved in the regulation of fiber phenotype
remain unclear (Spangenburg EE & Booth FW, 2003). A causal role for muscle
regulatory factors (MRFs), key regulators of skeletal myogenesis, in fiber type
predisposition has not been demonstrated, although it is known that myogenic
differentiation factor 1 (Myod1 or MyoD) is more expressed in fast and myogenin in
slow muscles (Voytik SL et al., 1993). Here, I found for the first time that Myf5 is up-
regulated in SO fibers. A Ca2+
regulated pathway controlling Myf5 gene expression has
already been proposed (Nervi C et al., 1995). Ca2+
is not only essential for muscle
contraction, but it is also a primary signaling molecule implicated in the specification of
the slow phenotype (Bassel-Duby R & Olson EN, 2006). Identification of a Ca2+
dependent regulation of Myf5 expression may further define the mechanism(s)
regulating fiber type determination of skeletal muscle. To add further complexity, gene
expression programs ongoing in SO myofibers may also recruit nuclear proteins
containing PDZ, LIM, or ankyrin domains, and therefore involved in protein-protein
interactions. Interestingly, some of them have a dual cellular localization, being also
found in the sarcomere (e.g. Ankrd2, Csrp3, Fhl2). The early induction of Ankrd2 and
Csrp3 (coding for the muscle LIM protein) in response to stretch suggested a role for
those proteins in adaptive changes to physical demands (Lange S et al., 2006, Luther
PK, 2009).
To focus on metabolic differences between fiber types I queried a dedicated resource
available at KEGG (Tab. 4.3). Only by lowering the threshold of the statistical test
(FDR 5 %), thus extending the analysis to 4,555 genes, I could obtain significant
results. Almost all genes in the glycolytic pathway that converts glucose into pyruvate
were identified as over-expressed in type 2B fibers and many genes of oxidative
phosphorylation and fatty acids oxidation as over-expressed in type 1 fibers (Fig. 4.6).
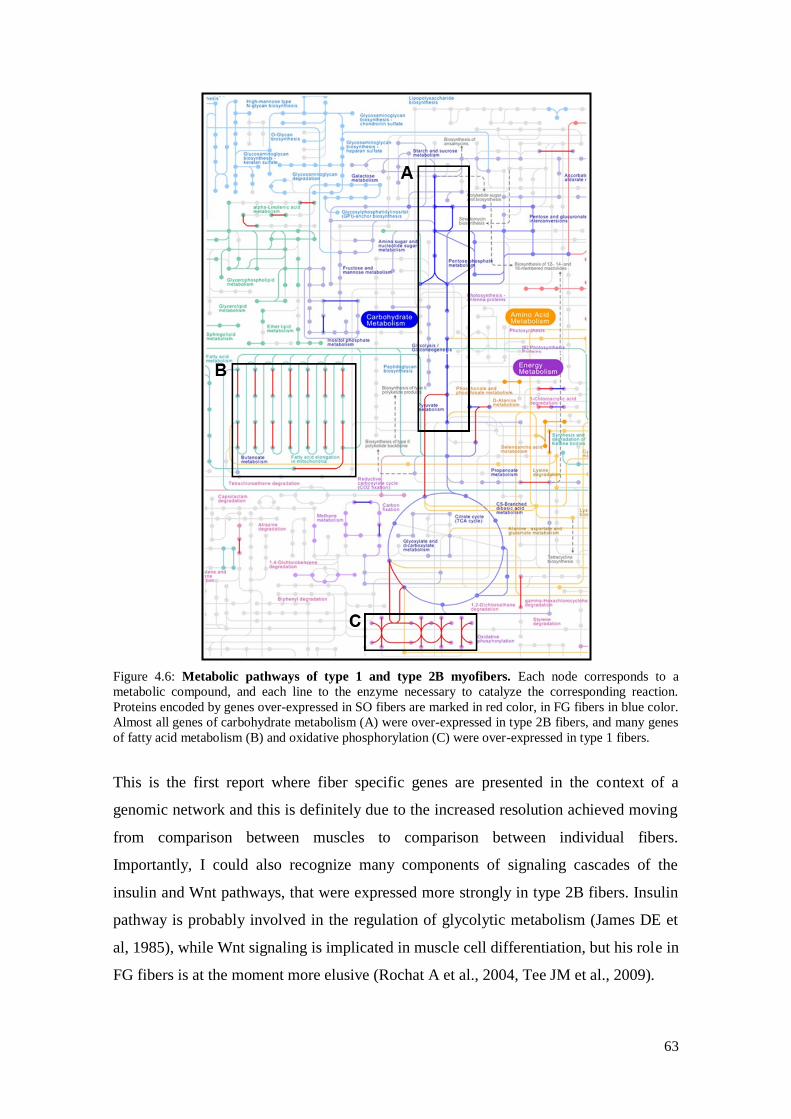
63
Figure 4.6: Metabolic pathways of type 1 and type 2B myofibers. Each node corresponds to a
metabolic compound, and each line to the enzyme necessary to catalyze the corresponding reaction.
Proteins encoded by genes over-expressed in SO fibers are marked in red color, in FG fibers in blue color.
Almost all genes of carbohydrate metabolism (A) were over-expressed in type 2B fibers, and many genes
of fatty acid metabolism (B) and oxidative phosphorylation (C) were over-expressed in type 1 fibers.
This is the first report where fiber specific genes are presented in the context of a
genomic network and this is definitely due to the increased resolution achieved moving
from comparison between muscles to comparison between individual fibers.
Importantly, I could also recognize many components of signaling cascades of the
insulin and Wnt pathways, that were expressed more strongly in type 2B fibers. Insulin
pathway is probably involved in the regulation of glycolytic metabolism (James DE et
al, 1985), while Wnt signaling is implicated in muscle cell differentiation, but his role in
FG fibers is at the moment more elusive (Rochat A et al., 2004, Tee JM et al., 2009).
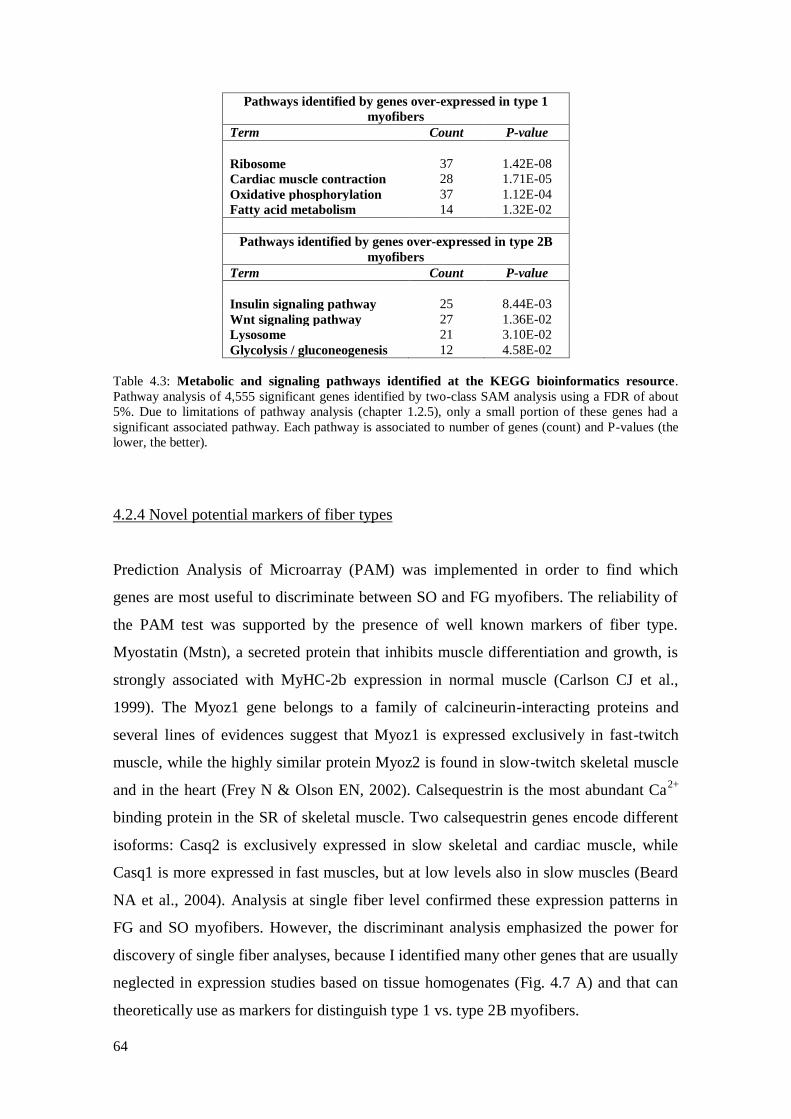
64
Pathways identified by genes over-expressed in type 1
myofibers
Term Count P-value
Ribosome 37 1.42E-08
Cardiac muscle contraction 28 1.71E-05
Oxidative phosphorylation 37 1.12E-04
Fatty acid metabolism 14 1.32E-02
Pathways identified by genes over-expressed in type 2B
myofibers
Term Count P-value
Insulin signaling pathway 25 8.44E-03
Wnt signaling pathway 27 1.36E-02
Lysosome 21 3.10E-02
Glycolysis / gluconeogenesis 12 4.58E-02
Table 4.3: Metabolic and signaling pathways identified at the KEGG bioinformatics resource.
Pathway analysis of 4,555 significant genes identified by two-class SAM analysis using a FDR of about
5%. Due to limitations of pathway analysis (chapter 1.2.5), only a small portion of these genes had a
significant associated pathway. Each pathway is associated to number of genes (count) and P-values (the
lower, the better).
4.2.4 Novel potential markers of fiber types
Prediction Analysis of Microarray (PAM) was implemented in order to find which
genes are most useful to discriminate between SO and FG myofibers. The reliability of
the PAM test was supported by the presence of well known markers of fiber type.
Myostatin (Mstn), a secreted protein that inhibits muscle differentiation and growth, is
strongly associated with MyHC-2b expression in normal muscle (Carlson CJ et al.,
1999). The Myoz1 gene belongs to a family of calcineurin-interacting proteins and
several lines of evidences suggest that Myoz1 is expressed exclusively in fast-twitch
muscle, while the highly similar protein Myoz2 is found in slow-twitch skeletal muscle
and in the heart (Frey N & Olson EN, 2002). Calsequestrin is the most abundant Ca2+
binding protein in the SR of skeletal muscle. Two calsequestrin genes encode different
isoforms: Casq2 is exclusively expressed in slow skeletal and cardiac muscle, while
Casq1 is more expressed in fast muscles, but at low levels also in slow muscles (Beard
NA et al., 2004). Analysis at single fiber level confirmed these expression patterns in
FG and SO myofibers. However, the discriminant analysis emphasized the power for
discovery of single fiber analyses, because I identified many other genes that are usually
neglected in expression studies based on tissue homogenates (Fig. 4.7 A) and that can
theoretically use as markers for distinguish type 1 vs. type 2B myofibers.

65
To validate the microarray results by an independent method I carried out qPCR
experiments on homogeneous pools of 50 fibers. qPCR needs reference genes of
invariant expression as an internal control. Two canonical references were discarded:
glyceraldehyde-3-phosphate dehydrogenase (Gapdh) had a high expression in FG type
2B fibers and beta-2-microglobulin (B2m) in the whole muscle control (Fig. 4.7 B).
Mitofusin 1 (Mfn1) and Thioredoxin 1 (Txn1) instead fulfilled the required criteria in
my experimental conditions. qPCR results indeed confirmed significant differences in
the expression level for most tested genes (Fig. 4.7 B): Aox1, Casq2, Dci, and Smtnl1
were preferentially expressed in SO fibers; C2cd2l, Mstn, Myoz1, and Srebf1 in FG
fibers. While smoothelin-like 1 (Smtnl1) seems a typical slow gene in this study,
immunohistochemical analysis showed that the corresponding protein is more abundant
in fast-oxidative fibers, belonging to the type 2A subgroup (Wooldridge AA et al.,
2008).
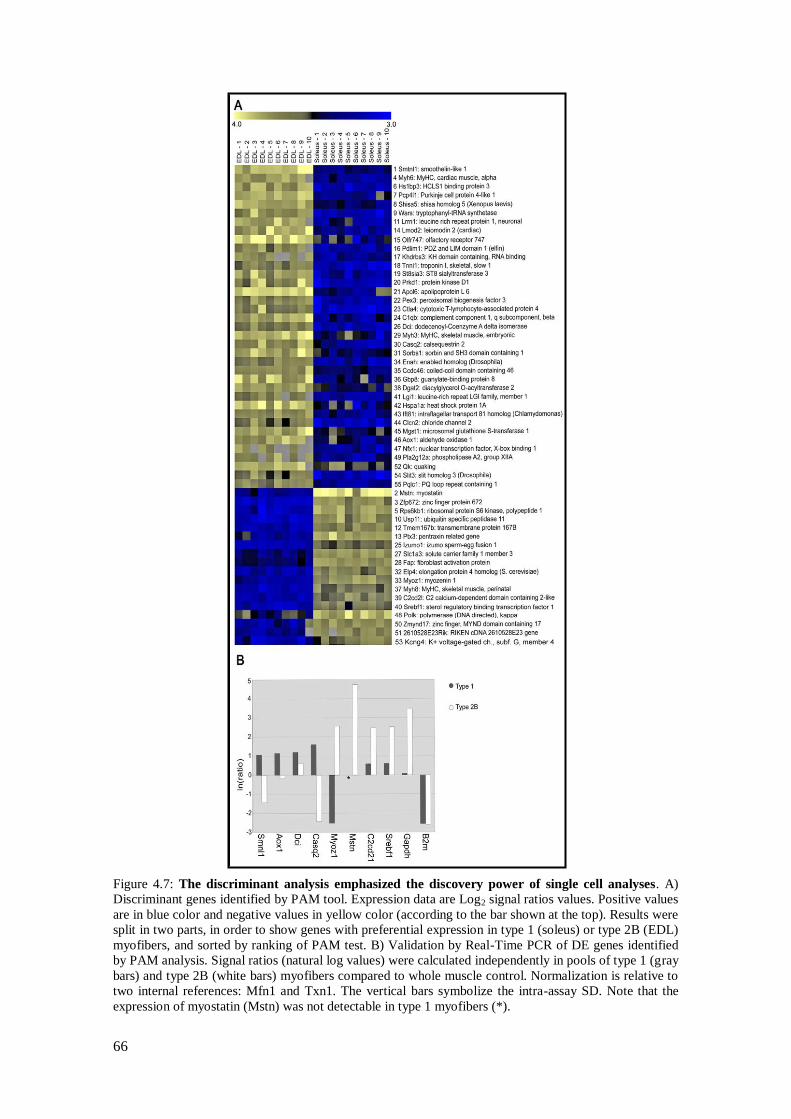
66
Figure 4.7: The discriminant analysis emphasized the discovery power of single cell analyses. A)
Discriminant genes identified by PAM tool. Expression data are Log2 signal ratios values. Positive values
are in blue color and negative values in yellow color (according to the bar shown at the top). Results were
split in two parts, in order to show genes with preferential expression in type 1 (soleus) or type 2B (EDL)
myofibers, and sorted by ranking of PAM test. B) Validation by Real-Time PCR of DE genes identified
by PAM analysis. Signal ratios (natural log values) were calculated independently in pools of type 1 (gray
bars) and type 2B (white bars) myofibers compared to whole muscle control. Normalization is relative to
two internal references: Mfn1 and Txn1. The vertical bars symbolize the intra-assay SD. Note that the
expression of myostatin (Mstn) was not detectable in type 1 myofibers (*).

67
4.3 Expression profiles of fiber types using Agilent microarrays
4.3.1 Experimental design
To obtain a catalogue of DE genes among all the different muscle fiber types (type 1,
2A, 2X, and 2B) I choose to perform new experiments using more updated versions
microarray platforms. Agilent provides two mouse gene expression microarrays build
with long-oligonucleotide probes. The Whole Mouse Genome 4x44K is based on
updated transcriptome databases for mRNA targets (about 40,000 probes), while the
SurePrint G3 Mouse 8x60K array also includes probes for lincRNAs (about 16,000
probes). Unlike Operon microarrays, Agilent platforms were optimized for one-color
hybridization, so reference control was not necessary. I carried out three groups of
experiments (Fig. 4.8): a) comparison between muscles subjected and not subjected to
collagenase treatment, b) comparison between isolated myofibers and whole muscles,
and c) comparison among the 4 different fiber types indicated above.
To obtain isolated myofibers soleus and EDL muscles were incubated for a period of
about 45 min. in collagenase. The first set of experiments was performed in order to
evaluate whether enzymatic treatment could cause variation in gene expression, with
particular attention to muscular genes. Microarray comparison was applied on 3
biological replicates of treated or not treated soleus and EDL muscles (total samples =
6), using Whole Mouse Genome 4x44K platform. Linear amplification and labeling of
RNA were carried out applying the standard Agilent protocol by T7 polymerase. For
each sample, starting from 1 µg of total RNA, I obtained 20 µg of amplified RNA on
average with a specific activity of about 13 pmol cyanine 3 (Cy3) per µg RNA.
The differences between whole muscles and isolated myofibers were detected using as
dataset 3 biological replicates of soleus, EDL, type 1 isolated myofiber, and type 2B
isolated myofiber (total samples = 12). Microarray experiments were carried out by
Whole Mouse Genome 4x44K platform. Myofiber RNA populations were purified and
exponentially amplified using the µMACS SuperAmp Kit (Miltenyi Biotec), and
subsequently labeled using nucleotides with incorporated Cy3 dyes and Klenow
fragment, since standard Agilent amplification kit required a larger amount of starting
RNA. On overage about 3 µg of amplified-labeled RNA were obtained from a single
fiber with a specific activity of 20 pmol Cy3 per µg dsDNA.

68
Expression profiles of the different fiber types were obtained performing microarray
experiments on 4 biological replicates for each fiber type: type 1, type 2A, type 2X and
type 2B myofibers (total samples = 16). Total RNA was extracted using TRIzol
extraction (Invitrogen) following by purification with RNeasy mini columns (Quiagen)
and then exponentially amplified using the TranPlex Whole Transcriptome
Amplification 2 (Sigma-Aldrich). Labeling was carried out using incorporated Cy3 dyes
and Klenow fragment. On overage about 4 µg of amplified-labeled RNA were obtained
from a single fiber with a specific activity of 30 pmol Cy3 per µg dsDNA.
Fig 4.8: Microgenomics in skeletal muscle using Agilent microarrays. Schematic experimental design
used for studying differences in gene expression a) between muscles subjected and not subjected to
collagenase treatment, b) of isolated myofibers and whole muscles, and c) among the different fiber types.
In order to optimize protocol, each comparison has a different microarray platform or target preparation.
4.3.2 Comparison between collagenase treated and not treated muscles
During isolation of myofibers, muscles were incubated in collagenase for about 45 min.
It was necessary to evaluate if this step introduces variations in gene expression,
especially in muscular genes. So, expression profiles of muscles subjected to the same
treatment as isolated myofibers (collagenase treated) and muscles without any treatment
(not collagenase treated) were compared. Experiments were performed on 3 biological
replicates with soleus and EDL muscles for each condition.
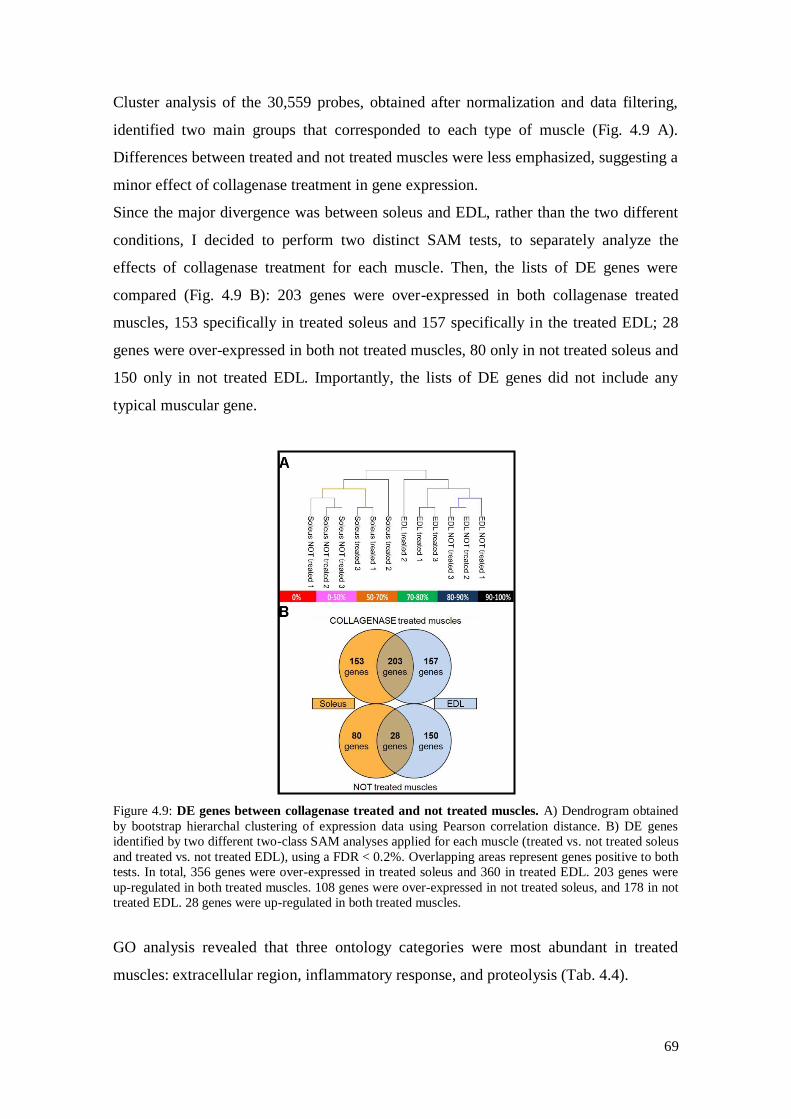
69
Cluster analysis of the 30,559 probes, obtained after normalization and data filtering,
identified two main groups that corresponded to each type of muscle (Fig. 4.9 A).
Differences between treated and not treated muscles were less emphasized, suggesting a
minor effect of collagenase treatment in gene expression.
Since the major divergence was between soleus and EDL, rather than the two different
conditions, I decided to perform two distinct SAM tests, to separately analyze the
effects of collagenase treatment for each muscle. Then, the lists of DE genes were
compared (Fig. 4.9 B): 203 genes were over-expressed in both collagenase treated
muscles, 153 specifically in treated soleus and 157 specifically in the treated EDL; 28
genes were over-expressed in both not treated muscles, 80 only in not treated soleus and
150 only in not treated EDL. Importantly, the lists of DE genes did not include any
typical muscular gene.
Figure 4.9: DE genes between collagenase treated and not treated muscles. A) Dendrogram obtained
by bootstrap hierarchal clustering of expression data using Pearson correlation distance. B) DE genes
identified by two different two-class SAM analyses applied for each muscle (treated vs. not treated soleus
and treated vs. not treated EDL), using a FDR < 0.2%. Overlapping areas represent genes positive to both
tests. In total, 356 genes were over-expressed in treated soleus and 360 in treated EDL. 203 genes were
up-regulated in both treated muscles. 108 genes were over-expressed in not treated soleus, and 178 in not
treated EDL. 28 genes were up-regulated in both treated muscles.
GO analysis revealed that three ontology categories were most abundant in treated
muscles: extracellular region, inflammatory response, and proteolysis (Tab. 4.4).
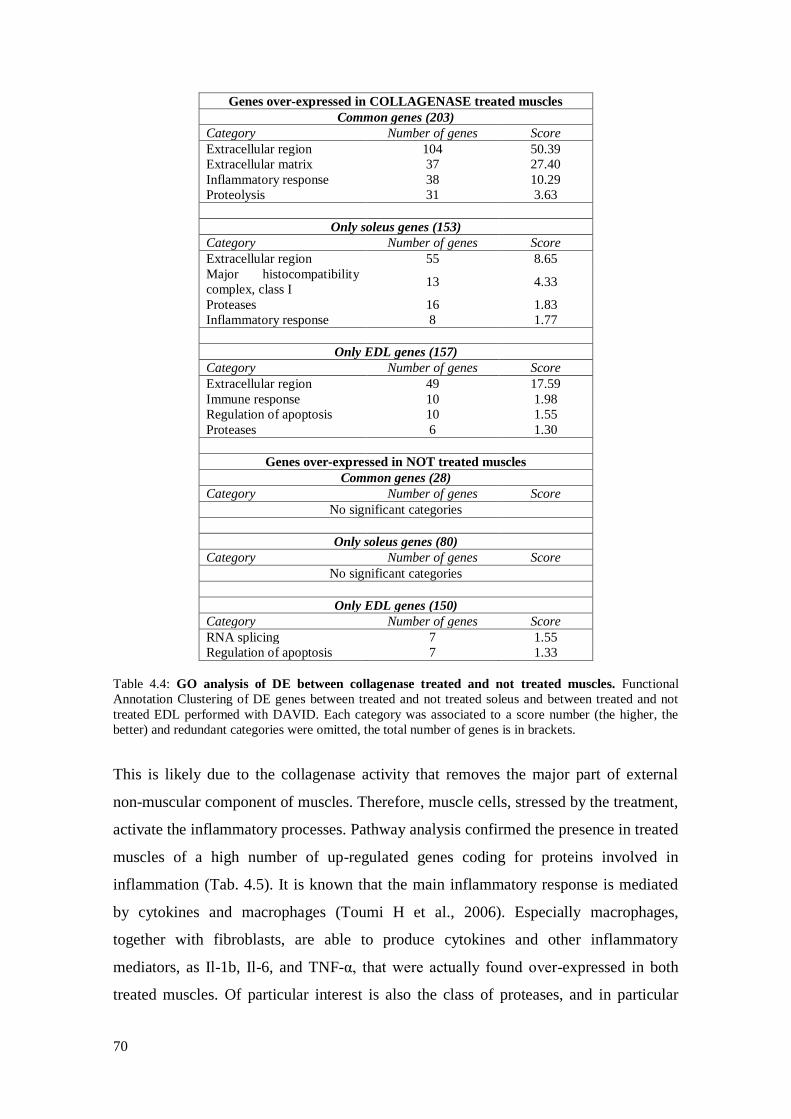
70
Genes over-expressed in COLLAGENASE treated muscles
Common genes (203)
Category Number of genes Score
Extracellular region 104 50.39
Extracellular matrix 37 27.40
Inflammatory response 38 10.29
Proteolysis 31 3.63
Only soleus genes (153)
Category Number of genes Score
Extracellular region 55 8.65
Major histocompatibility
complex, class I 13 4.33
Proteases 16 1.83
Inflammatory response 8 1.77
Only EDL genes (157)
Category Number of genes Score
Extracellular region 49 17.59
Immune response 10 1.98
Regulation of apoptosis 10 1.55
Proteases 6 1.30
Genes over-expressed in NOT treated muscles
Common genes (28)
Category Number of genes Score
No significant categories
Only soleus genes (80)
Category Number of genes Score
No significant categories
Only EDL genes (150)
Category Number of genes Score
RNA splicing 7 1.55
Regulation of apoptosis 7 1.33
Table 4.4: GO analysis of DE between collagenase treated and not treated muscles. Functional
Annotation Clustering of DE genes between treated and not treated soleus and between treated and not
treated EDL performed with DAVID. Each category was associated to a score number (the higher, the
better) and redundant categories were omitted, the total number of genes is in brackets.
This is likely due to the collagenase activity that removes the major part of external
non-muscular component of muscles. Therefore, muscle cells, stressed by the treatment,
activate the inflammatory processes. Pathway analysis confirmed the presence in treated
muscles of a high number of up-regulated genes coding for proteins involved in
inflammation (Tab. 4.5). It is known that the main inflammatory response is mediated
by cytokines and macrophages (Toumi H et al., 2006). Especially macrophages,
together with fibroblasts, are able to produce cytokines and other inflammatory
mediators, as Il-1b, Il-6, and TNF-α, that were actually found over-expressed in both
treated muscles. Of particular interest is also the class of proteases, and in particular

71
metalloproteases. They have important physiological functions in maintenance of the
integrity and homeostasis of the extracellular matrix and so they play a fundamental role
in muscle tissue repair (Carmeli E et al., 2004). In addition, the collagenase treatment
was too brief to activate satellite cells, because I did not find any DE genes involved in
the regulation of cell cycle. Evidences suggest that satellite cells become activated one
day after muscle damage (Ciciliot S & Schiaffino S, 2010).
Since the lists of DE genes did not include any typical muscular gene and GO and
pathway analyses revealed enrichment especially in inflammatory process and
extracellular matrix, I concluded that protocol I used for collagenase incubation
minimally influences microarray data produced from isolated myofibers.
Pathway activated in COLLAGENASE treated muscles
Common genes (203)
Category Number of genes P-value
ECM-receptor interaction 14 3.39E-11
Complement and
coagulation cascades 11 3.77E-08
Cytokine-cytokine receptor
interaction 14 1.51E-05
Toll-like receptor signaling 9 4.24E-05
Chemokine signaling 10 6.07E-04
TGF-beta signaling 5 0.028
Only soleus genes (153)
Category Number of genes P-value
Antigen processing and
presentation 8 6.47E-06
Endocytosis 8 0.001
Cell adhesion molecules 7 0.0013
Arachidonic acid
metabolism 5 0.0042
Only EDL genes (157)
Category Number of genes P-value
Cell adhesion molecules 7 0.0023
ECM-receptor interaction 5 0.0061
Cytokine-cytokine receptor
interaction 7 0.026
TGF-beta signaling 4 0.042
Antigen processing and
presentation 4 0.047
Table 4.5: Pathway analysis of up-regulated genes in collagenase treated muscles. Due to limitations
of pathway analysis (chapter 1.2.5), only a small portion of these genes had a significant associated
pathway. Each pathway is associated to number of genes and P-values (the lower, the better). Only
categories with a P-value ≤ 0.05 were considered significant. The total number of genes is in brackets.
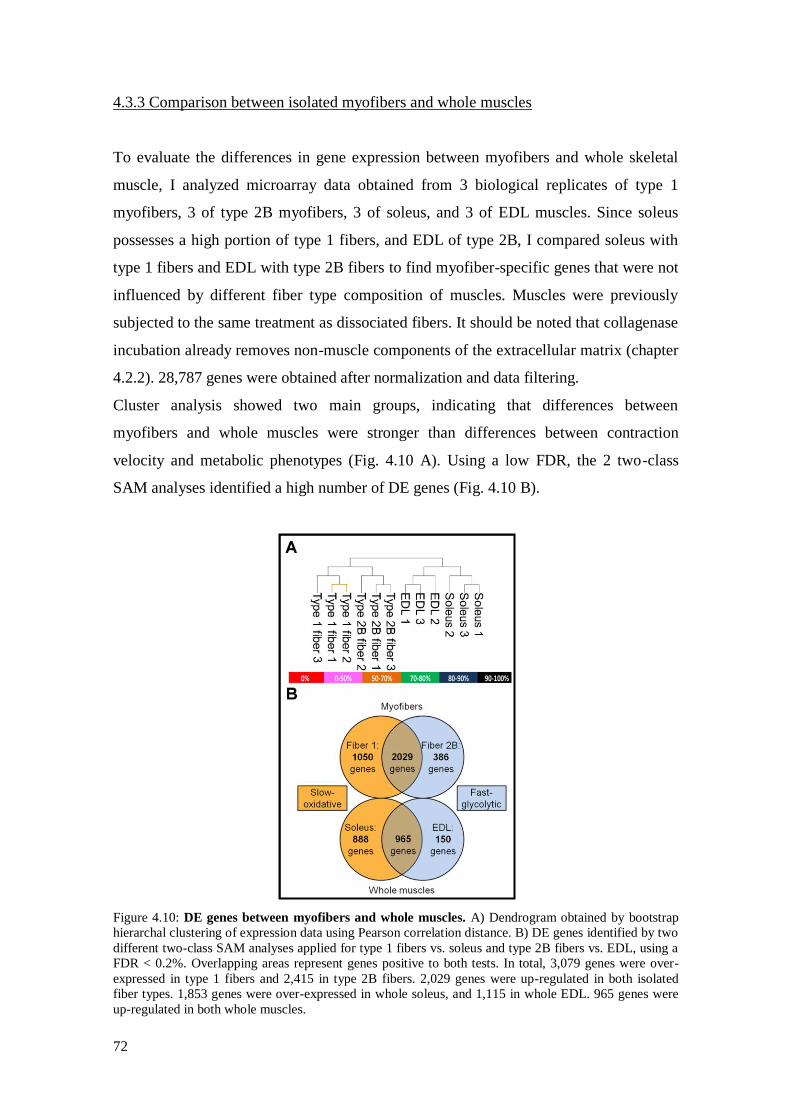
72
4.3.3 Comparison between isolated myofibers and whole muscles
To evaluate the differences in gene expression between myofibers and whole skeletal
muscle, I analyzed microarray data obtained from 3 biological replicates of type 1
myofibers, 3 of type 2B myofibers, 3 of soleus, and 3 of EDL muscles. Since soleus
possesses a high portion of type 1 fibers, and EDL of type 2B, I compared soleus with
type 1 fibers and EDL with type 2B fibers to find myofiber-specific genes that were not
influenced by different fiber type composition of muscles. Muscles were previously
subjected to the same treatment as dissociated fibers. It should be noted that collagenase
incubation already removes non-muscle components of the extracellular matrix (chapter
4.2.2). 28,787 genes were obtained after normalization and data filtering.
Cluster analysis showed two main groups, indicating that differences between
myofibers and whole muscles were stronger than differences between contraction
velocity and metabolic phenotypes (Fig. 4.10 A). Using a low FDR, the 2 two-class
SAM analyses identified a high number of DE genes (Fig. 4.10 B).
Figure 4.10: DE genes between myofibers and whole muscles. A) Dendrogram obtained by bootstrap
hierarchal clustering of expression data using Pearson correlation distance. B) DE genes identified by two
different two-class SAM analyses applied for type 1 fibers vs. soleus and type 2B fibers vs. EDL, using a
FDR < 0.2%. Overlapping areas represent genes positive to both tests. In total, 3,079 genes were over-
expressed in type 1 fibers and 2,415 in type 2B fibers. 2,029 genes were up-regulated in both isolated
fiber types. 1,853 genes were over-expressed in whole soleus, and 1,115 in whole EDL. 965 genes were
up-regulated in both whole muscles.

73
These investigations permitted to distinguish myofiber-specific genes from genes of the
non-muscular components. Obviously, myofiber-specific genes were active also in
whole organs, but the expression levels are lower, because they are mediated with those
of the genes of the non-muscular cells. Conversely, non-muscular genes showed weak
expression in myofibers. Figure 4.11 illustrates some selected examples of most DE and
significant genes.
Figure 4.11: Heat map of selected genes DE between myofibers and whole muscles. Expression data
are Log2 of intensity values which were converted to colors according to the bar shown at the top.
Production of new proteins plays a major role in maintaining skeletal muscle fiber mass
and functional integrity (Sandri M, 2008). Among myofiber-specific genes, I identified
genes coding for proteins involved in protein synthesis, like translation initiation
factors, Eif3s12 and Eif4e3, or crystallin chaperone proteins, Cryab and Crybb3. To
respond quickly to the need for doing work, myofibers have more mitochondria than
other cell types, so, not surprisingly, I found as over-expressed in fibers mitochondrial

74
genes, as the ATP synthase Atp5j2 and the mitochondrial ribosomal protein Mrps5.
Sarcoglycan zeta (Scgz) and myozenin 3 (Myoz3) are typical structural proteins of
muscle fibers. Also some transcriptional factors involved in expression of muscular
genes were up-regulated in myofibers. Two examples are Myod1/MyoD, that is one of
the most important myogenic differentiation factors, and myoneurin (Mynn). This is a
member of BTB/POZ-zinc finger transcriptional factor family (Alliel PM et al., 2000)
and is expressed at high level in muscle tissue. In myofibers, the protein is localized in
the nuclear region neighboring the motor endplate (Cifuentes-Diaz C et al, 2004).
Interestingly, microarray analysis identified also still not characterized transcripts
(RIKEN cDNA) that could be significant for a more exhaustive analysis.
Non-muscular genes were expressed at high levels in muscle cells different from
myofibers. This is an evidence that microgenomic approach allowed the removing of
non-muscular components of the whole organ. Among genes of the connective tissue, I
found laminin (Lama2) and various isoforms of collagen (Col), but also genes coding
for protein involved in the determination of the mature collagen fibril structural
phenotype, like fibromodulin (Fmod) and lumican (Lum, Ezura Y et al., 2000). Thbs2
and Pcp4 are expressed in nerve cells, proving that collagenase treatment dissociated
myofibers from afferent neurons. Also blood vessels and erythrocytes were removed: in
whole muscles I identified as over-expressed endoglin (Eng), a marker of vascular
endothelial cells, genes coding for hemoglobin chains (Hba-a1 and Hbb-b1), and the
antigen CD36, found on platelets, erythrocytes, and monocytes. Furthermore, it is
interesting to note the expression in whole muscles of the typical non-muscle isoforms
of caveolin (Cav1 and Cav2, Williams TM & Lisanti MP, 2004).
Importantly, microgenomic analysis on characterized myofibers permitted the removal
of signals of the different fiber types present in fast and slow muscles. Myh2,
corresponding to the MyHC-2a isoform, was up-regulated in whole muscles, but not in
isolated myofibers. Myh1, corresponding to the MyHC-2x isoform, was over-expressed
in soleus and EDL muscles, but not in type 1 myofibers. Also in type 2B myofibers
Myh1 transcript was expressed at high levels, however it is known that especially for
type 2X and type 2B myofibers the match between mRNA levels and protein content is
not precise (Zhang MY et al., 2010).
To extend the initial analysis to all DE genes, I performed GO analysis for both
myofiber-specific genes and non-muscular genes (Tab. 4.6). In myofibers the class of
nerve impulse (transmission of nerve impulse and neuromuscular junction) was

75
especially up-regulated. There was also a high number of nuclear genes coding for
proteins involved in transcription process and, in particular, in regulation of
transcription, mRNA processing, and chromatin organization. 19 genes were involved
in myofiber differentiation. All these data suggest that, at transcriptional level, the
genetic programs of myofibers are very different from those of non-muscular
components. Another enriched category of type 1 fiber was the ribosome: it is known
that in muscle the transcription of ribosomal genes is activated by calcineurin (Torgan
CE & Daniels MP, 2006), which is a typical transcriptional factor of the slow program
(chapter 1.1.7).
Genes over-expressed in ISOLATED MYOFIBERS
Common genes (2029)
Category Number of genes Score
Transmission of nerve
impulse 39 4.97
Regulation of transcription 199 3.07
Nuclear localization 320 3.01
Spliceosome 16 1.85
mRNA processing 38 1.60
Chromatin organization 30 1.50
Myofiber differentiation 19 1.41
Only type 1 fiber genes (1050)
Category Number of genes Score
Transcription factors 20 2.26
PDZ domain 14 1.84
Nuclear localization 51 1.49
Ribosome 30 1.30
Only type 2B fiber genes (386)
Category Number of genes Score
Neuromuscular junction 13 1.44
Sterol metabolism 6 1.40
Genes over-expressed in WHOLE MUSCLES
Common genes (965)
Category Number of genes Score
Extracellular matrix 262 16.19
Cell adhesion 72 7.92
Blood vessel development 47 5.66
Collagen 20 5.18
EFG-like domain 38 4.52
PDZ domain 21 3.75
Muscle development 22 2.82
Myosin complex 10 2.27
Immune response 19 1.77
Apoptosis 38 1.75
Blood coagulation 14 1.54

76
Only whole soleus genes (888)
Category Number of genes Score
Platelets 22 2.34
Extracellular matrix 144 1.98
Nuclear localization 183 1.67
Immune response 15 1.43
Only whole EDL genes (150)
Category Number of genes Score
Cytoskeleton organization 15 2.29
LIM domain 7 2.24
Ca2+
binding 11 1.70
Apoptosis 8 1.36
Platelets 14 1.35
Table 4.6: GO analysis of DE between isolated myofibers and whole muscles. Functional Annotation
Clustering of DE genes of isolated type 1 fibers vs. soleus muscle and isolated type 2B fibers vs. EDL
performed with DAVID. Each category was associated to a score number (the higher, the better) and
redundant categories were omitted, the total number of genes is in brackets.
The GO analysis performed on genes over-expressed in whole muscles confirmed that
microarrays analysis of isolated myofibers increases the resolution of gene expression
profiles, removing the non-muscular components of the whole muscles. A lot of
categories of connective tissue were identified, including extracellular matrix, collagen,
and genes coding for proteins with the EGF-like domains. I found also categories
involved in circulatory system: blood vessel development, blood coagulation, platelets,
and immune response. It is possible to note also genes involved in muscle development
and myosin complex: perhaps in this there is a contribution of myofibers different from
type 1 or type 2B.
4.3.4 Analysis on isolated skeletal muscle fibers
Differences of gene expression among fiber types were studied by profiling 4 type 1, 4
type 2A, 4 type 2X, and 4 type 2B myofibers, using the SurePrint G3 Mouse 8x60K
Agilent microarray platform. The 4 type 1 and type 2A myofibers were obtained from
soleus, whereas the 4 type 2B myofibers were obtained from EDL. Regarding type 2X
myofibers, 3 were isolated from soleus and 1 from EDL. Although the number of
biological replicates was not elevated, these experiments permitted to shed light on the
complexity of fiber type transcriptional profiles.
Surprisingly, cluster analysis initially grouped fibers by muscle provenance (Fig. 4.12
A). The 5 fibers of EDL formed a group clearly separated from the 11 fibers of soleus,
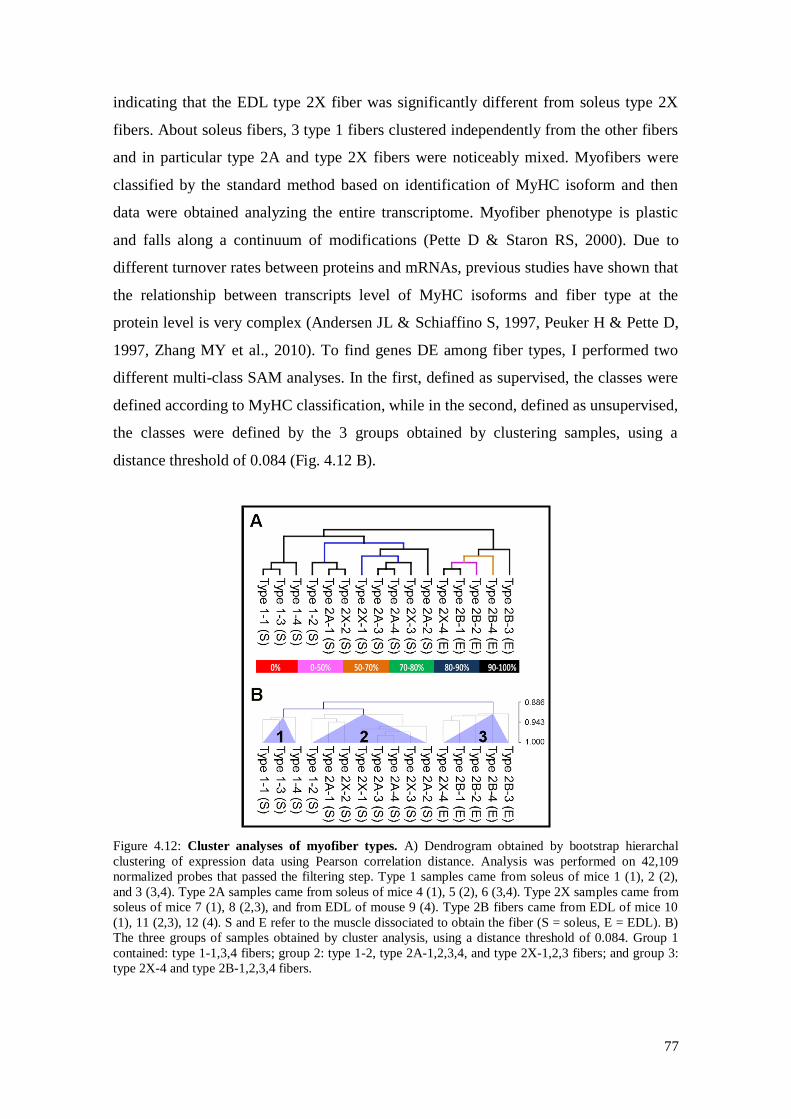
77
indicating that the EDL type 2X fiber was significantly different from soleus type 2X
fibers. About soleus fibers, 3 type 1 fibers clustered independently from the other fibers
and in particular type 2A and type 2X fibers were noticeably mixed. Myofibers were
classified by the standard method based on identification of MyHC isoform and then
data were obtained analyzing the entire transcriptome. Myofiber phenotype is plastic
and falls along a continuum of modifications (Pette D & Staron RS, 2000). Due to
different turnover rates between proteins and mRNAs, previous studies have shown that
the relationship between transcripts level of MyHC isoforms and fiber type at the
protein level is very complex (Andersen JL & Schiaffino S, 1997, Peuker H & Pette D,
1997, Zhang MY et al., 2010). To find genes DE among fiber types, I performed two
different multi-class SAM analyses. In the first, defined as supervised, the classes were
defined according to MyHC classification, while in the second, defined as unsupervised,
the classes were defined by the 3 groups obtained by clustering samples, using a
distance threshold of 0.084 (Fig. 4.12 B).
Figure 4.12: Cluster analyses of myofiber types. A) Dendrogram obtained by bootstrap hierarchal
clustering of expression data using Pearson correlation distance. Analysis was performed on 42,109
normalized probes that passed the filtering step. Type 1 samples came from soleus of mice 1 (1), 2 (2),
and 3 (3,4). Type 2A samples came from soleus of mice 4 (1), 5 (2), 6 (3,4). Type 2X samples came from
soleus of mice 7 (1), 8 (2,3), and from EDL of mouse 9 (4). Type 2B fibers came from EDL of mice 10
(1), 11 (2,3), 12 (4). S and E refer to the muscle dissociated to obtain the fiber (S = soleus, E = EDL). B)
The three groups of samples obtained by cluster analysis, using a distance threshold of 0.084. Group 1
contained: type 1-1,3,4 fibers; group 2: type 1-2, type 2A-1,2,3,4, and type 2X-1,2,3 fibers; and group 3:
type 2X-4 and type 2B-1,2,3,4 fibers.

78
In supervised cluster analysis, I was able to identify 1,067 genes significantly similar for
expression level in the same fiber type and DE among fiber types, classified by MyHC
isoform (Fig. 4.13).
Figure 4.13: DE genes identified by supervised multi-class SAM analysis. Heat map of the 1,067 DE
genes identified by multi-class SAM analysis performed according to MyHC classification and using a
FDR < 0.2%. Expression data are Log2 of intensity values which were converted to colors according to
the bar shown at the top. Sample clustering and gene clustering were performed using Pearson
correlation. Blue triangles on the left and numbers on the right correspond to gene clusters identified
using a distance threshold of 0.368.
Once more, sample cluster analysis on significant genes demonstrated that there is a
strong association of EDL type 2X fiber with the other EDL fibers and that soleus type
2A and type 2X fibers were mixed. On the contrary, type 1 fibers clustered together.

79
DE genes identified by SUPERVISED multi-class SAM analysis
Cluster 1 (78)
Selected genes: Myl2, Myom2, Myoz1, Myoz3, Smtnl2, Tnni2, Tnnt3
Cluster 2 (62)
Category Number of genes Score
Glycolysis 6 2.44
Ca2+
homeostasis 7 1.33
Selected genes: Myl2, Pvalb
Cluster 3 (62)
Category Number of genes Score
Muscle contraction 4 3.39
Selected genes: Actn3, Ankrd1, Camk2a, Myh4
Cluster 5 (78)
Category Number of genes Score
Muscle contraction 6 2.60
Myofibril assembly 3 1.83
Ca2+
homeostasis 5 1.60
Selected genes: Atp2a2, Homer2, Myh6, Myh7, Myl2, Myl7, Tpm3,
Tnnt1
Cluster 6 (213)
Category Number of genes Score
Muscle contraction 7 3.84
LIM domain 5 2.37
Mitochondrion 20 1.45
Fatty acid metabolism 5 1.45
Selected genes: Ankrd2, Casq2, Csrp3, Fhl1, Myh2, Myl3, Myom3,
Myoz2, Ppara, Smtnl1
Cluster 8 (104)
Category Number of genes Score
Oxidative phosphorylation 8 2.27
Mitochondrion 13 1.59
Cluster 9 (426)
Category Number of genes Score
Regulation of transcription 13 1.54
Glycoprotein 57 1.49
Skeletal system
development 6 1.46
Table 4.7: GO analysis of DE genes identified by supervised multi-class SAM analysis. Functional
Annotation Clustering of chosen clusters of DE genes identified by multi-class SAM analysis performed
according to MyHC classification. To better understand physiological meaning selected genes were
reported. Each category was associated to a score number (the higher, the better) and redundant categories
were omitted, the total number of genes is in brackets.
Gene cluster analysis identified 9 main clusters of gene expression (Tab. 4.7). Mainly,
genes clustered by speed of contraction or metabolic phenotypes. In the first 4 groups,
clearly separated from the other 5 groups, there were genes coding for proteins of FG
phenotype: cluster 1 and cluster 3 contained the fast isoforms of structural proteins of
muscle, whereas cluster 2 contained the glycolytic enzymes. Interestingly, MyHC-2b
(Myh4, cluster 3) was not in the same group of the typical fast isoforms of MyLC and
troponin I and T (Myl1, Tnni2, Tnnt3), but was in the same cluster of and
Ca2+
/calmodulin-dependent protein kinase-II (Camk2a). Parvalbumin (Pvalb), another

80
Ca2+
binding protein of fast fibers, clustered with the enzyme of the glycolytic
metabolism. The genes of the other 5 groups defined the SO phenotype. Cluster 5
contained the slow isoforms of structural proteins of muscle: MyHC-1 (Myh7), slow
MyLC (Myl2), tropomyosin (Tpm3), troponin T (Tnnt1) and genes coding for slow
isoforms involved in Ca2+
homeostasis, like Serca2 (Atp2a2) and Homer2. There are
also cardiac isoforms of myosin chains: Myh6 and Myl7. Also in cluster 6 I found slow
isoforms, as Ankrd2, Myl3, and Casq2, but it was predominantly enriched of type 2A
isoforms. Type 2A fibers have been defined as fast-oxidative (FO), because they have a
mainly oxidative metabolism with a fast speed of contraction. In literature only few
isoforms specific for this fiber type are known. Here I identified in the same gene
cluster three of these isoforms: the MyHC-2A (Myh2), the myomesin (Myom3) and
Smtnl1 (Wooldridge AA et al., 2008). Furthermore, there were the classes of
mitochondrion, lipid metabolism, which included Ppara, a master regulator of fatty acid
oxidation and lipoprotein metabolism (Yoon M, 2009), and LIM domain, which
included Fhl1 that regulates oxidative fiber-type switch (Cowling BS et al., 2008). Also
in cluster 8 I found genes involved in oxidative phosphorylation. Cluster 9 was
composed by many genes with a preferential expression in type 2A and type 2X
myofibers, but the correlation of the significant functional classes with these fiber types
is less clear.
Unsupervised cluster analysis identified 1,582 genes DE among the 3 classes defined by
sample clustering (Fig. 4.14). Class 1 contained 3 type 1 fibers, class 2 contained 1 type
1, 4 type 2A and 3 type 2X fibers, and class 3 contained all fibers dissociated from EDL
(1 type 2X and 4 type 2B). Differently from cluster obtained by supervised analysis,
sample cluster of significant genes proved the high similarity of fibers of the same class.
Furthermore, the score numbers of the GO categories were generally higher than those
observed in GO analysis of supervised analysis (Tab. 4.8). This suggests that at
transcriptome level grouping fibers in this way permitted a better comprehension of
physiological and metabolic differences among fibers than grouping by MyHC isoform
expression. Gene cluster was essentially separated in two parts: in the first 4 clusters
genes were up-regulated in myofibers of soleus (class 1 and 2), whereas in the other
clusters there were genes up-regulated in myofibers of EDL (class 3, clusters 5, 8, 9) or
more expressed exclusively in class 1 (clusters 6, 7). The first 4 clusters underlined the
oxidative metabolism of soleus myofibers and contained some typical slow isoforms of
muscle contraction. An elevated number of genes belonging to mitochondrion and

81
oxidative phosphorylation classes were found in clusters 1, 2, and 4. In addition, in
cluster 4 there were slow isoforms of sarcomeric proteins (Myl2, Myl3, Actn2, and
Ankrd2), genes involved in fatty acid metabolism (included Ppara), genes coding for
protein with LIM domains (Csrp3, Fhl1, Fhl2), and Casq2. Also cluster 3 contained
slow isoforms of genes coding for contractile proteins, like Tnni1 and Tnnt2, and for
slow protein of Ca2+
homeostasis, like Serca2 and Homer2, while cluster 2 seemed to be
more correlated with a FO phenotype (Myh2 and Smtnl1). Interestingly, in these
clusters I did not found MyHC-1 (Myh7): this isoforms was found in cluster 7 instead.
Cluster 6 and 7 contained the genes over-expressed only in class 1 myofibers that was
the class of 3 type 1 fibers, indicating that Myh7 (but also the slow isoforms Tpm3 and
Tnnc1 and the cardiac Myh6) was not expressed in one of the 4 myofibers previously
classified as type 1. The remaining gene clusters (5, 8, and 9) included genes that define
glycolytic metabolism and fast-twitch contraction. In cluster 5 there are genes highly
expressed in the class of EDL myofibers (class 3) and with very low levels of
expression in the other classes. Among these genes it was possible to recognize MyHC-
2b (Mhy4), Actn3, Casq1, and Ankrd1. Genes of cluster 8 were highly expressed in
class 3, moderately in class 2 and weakly in class 1. Here are genes of glycolytic
metabolism, of Ca2+
homeostasis (like Pvalb), and the fast myosin binding protein C
(Mybpc2). Cluster 9 contained genes weakly expressed in class 1 and highly in class 2
and 3, like Gapdh, and also typical fast isoforms: Myl1, Mylpf, Tnnc2, Tnni2, and
Tnnt3.
Strangely, no cluster contained MyHC-2x (Myh1) and Serca1 (Atp2a1). Myh1 was not
found because intensity signal was too different among fiber of the same type (in
particular it was very low in EDL type 2X fiber compared to the other type 2X fibers),
conversely fast Serca1 was not identified because intensity signal was very similar
among fiber types.
Moreover, these data should permit to associate a phenotype to isoforms that were not
considered DE among fiber types. For example, Myom2, Myoz3, Smtnl2, and Ankrd1
seemed to be more involved in fast- than slow-twitch, and proteins with LIM domain
seemed to have a central role in oxidative and lipid metabolism.
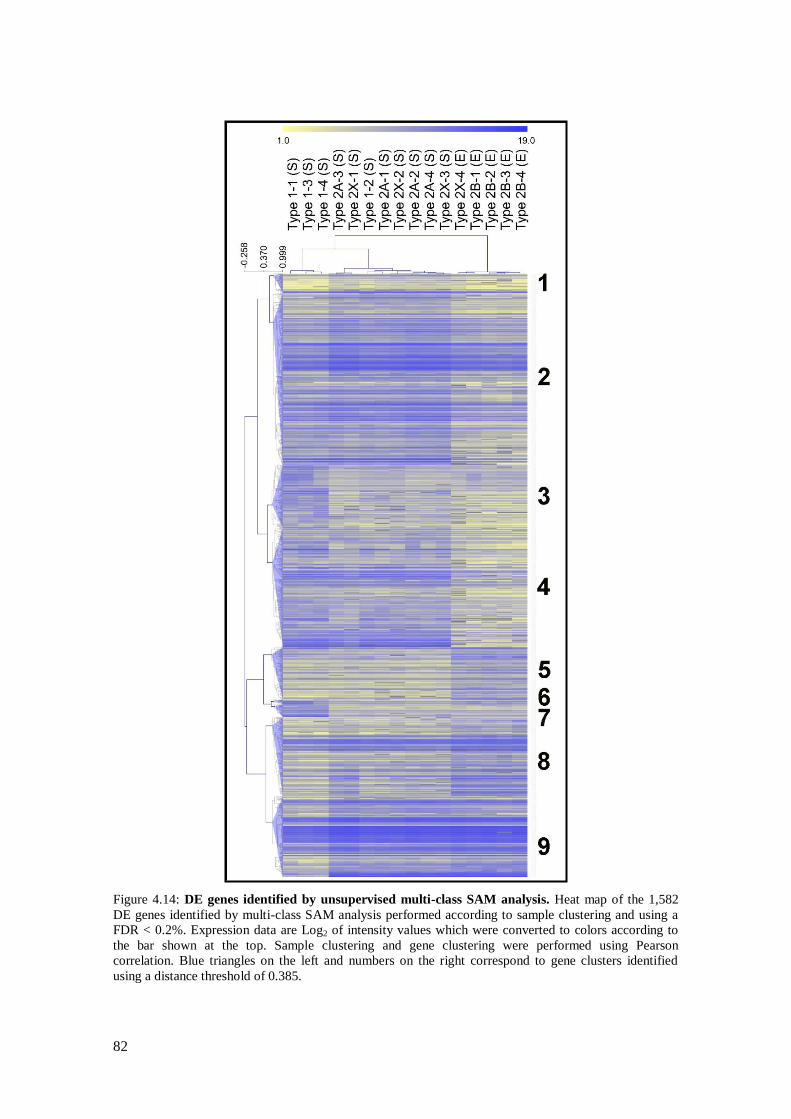
82
Figure 4.14: DE genes identified by unsupervised multi-class SAM analysis. Heat map of the 1,582
DE genes identified by multi-class SAM analysis performed according to sample clustering and using a
FDR < 0.2%. Expression data are Log2 of intensity values which were converted to colors according to
the bar shown at the top. Sample clustering and gene clustering were performed using Pearson
correlation. Blue triangles on the left and numbers on the right correspond to gene clusters identified
using a distance threshold of 0.385.
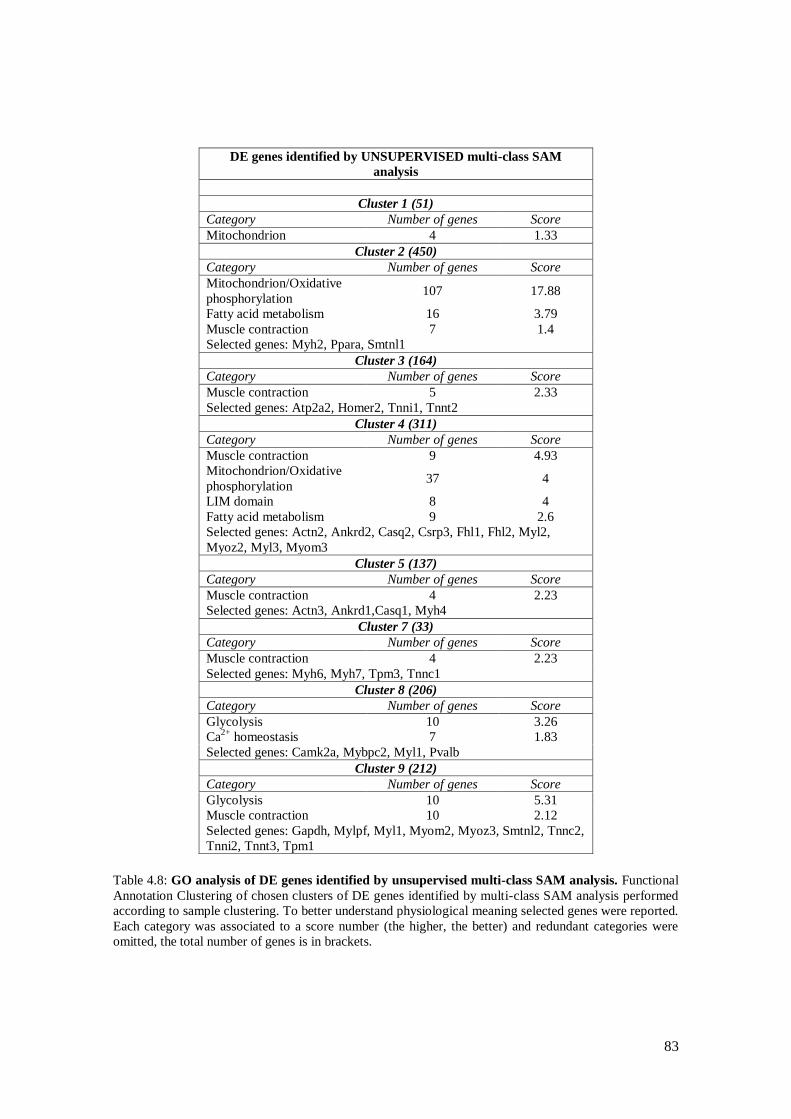
83
DE genes identified by UNSUPERVISED multi-class SAM
analysis
Cluster 1 (51)
Category Number of genes Score
Mitochondrion 4 1.33
Cluster 2 (450)
Category Number of genes Score
Mitochondrion/Oxidative
phosphorylation 107 17.88
Fatty acid metabolism 16 3.79
Muscle contraction 7 1.4
Selected genes: Myh2, Ppara, Smtnl1
Cluster 3 (164)
Category Number of genes Score
Muscle contraction 5 2.33
Selected genes: Atp2a2, Homer2, Tnni1, Tnnt2
Cluster 4 (311)
Category Number of genes Score
Muscle contraction 9 4.93
Mitochondrion/Oxidative
phosphorylation 37 4
LIM domain 8 4
Fatty acid metabolism 9 2.6
Selected genes: Actn2, Ankrd2, Casq2, Csrp3, Fhl1, Fhl2, Myl2,
Myoz2, Myl3, Myom3
Cluster 5 (137)
Category Number of genes Score
Muscle contraction 4 2.23
Selected genes: Actn3, Ankrd1,Casq1, Myh4
Cluster 7 (33)
Category Number of genes Score
Muscle contraction 4 2.23
Selected genes: Myh6, Myh7, Tpm3, Tnnc1
Cluster 8 (206)
Category Number of genes Score
Glycolysis 10 3.26
Ca2+
homeostasis 7 1.83
Selected genes: Camk2a, Mybpc2, Myl1, Pvalb
Cluster 9 (212)
Category Number of genes Score
Glycolysis 10 5.31
Muscle contraction 10 2.12
Selected genes: Gapdh, Mylpf, Myl1, Myom2, Myoz3, Smtnl2, Tnnc2,
Tnni2, Tnnt3, Tpm1
Table 4.8: GO analysis of DE genes identified by unsupervised multi-class SAM analysis. Functional
Annotation Clustering of chosen clusters of DE genes identified by multi-class SAM analysis performed
according to sample clustering. To better understand physiological meaning selected genes were reported.
Each category was associated to a score number (the higher, the better) and redundant categories were
omitted, the total number of genes is in brackets.

84

85
5. CONCLUSIONS
Skeletal muscle is a complex organ composed by a variety of cell types. Even focusing
the picture to the contractile components, the myofibers, still skeletal muscle appears as
an extremely various tissue, since they possess a wide range of molecular, metabolic,
and physiological properties. Although a number of methods have been applied to
investigate muscle fiber heterogeneity (Pette D et al., 1999), the list of genes involved in
the molecular and cellular processes associated to muscle properties still needs to be
clarified and completed. The emerging possibility of applying wide genomic approaches
to the level of single cell (microgenomics) providing fundamental improvements in
experimental design, may shed brighter light in the real complexity of a heterogeneous
tissue like skeletal muscle (Wang D & Bodovitz S, 2010, Levsky JM & Singer RH,
2003). In skeletal muscle, the multinucleate myofibers are easily distinguished from the
other cell types and I took advantage from the large cell size to classify them according
to the expressed myosin heavy chain (MyHC) isoform. Primary myoblast culture is
another common model to study muscle physiology and pathology. The problem of
cellular heterogeneity affects also this system, as not all myoblasts differentiate into
myotubes and fibroblasts still represent a significant fraction of the total cells present in
a primary myogenic culture. Furthermore, in vitro differentiation of primary myoblasts
fails to convert myotubes to mature muscle fibers. Due to inappropriate stimuli (i.e. lack
of innervation), cultured muscle cells display reductive metabolic adaptations and
activation of atrophy-like processes (Raymond F et al., 2010). By contrast, dissociated
myofibers are a more relevant and accurate culture technique for the study of mature
skeletal muscle, as showed for many years in the mouse flexor digitorum brevis muscle
(Ravenscroft G et al., 2007). During my project, I developed a protocol to dissociate
intact and living myofibers from soleus and extensor digitorum longus (EDL) muscles
as quickly as possible. Microarray experiments demonstrated that collagenase treatment
did not influence expression profiling data (chapter 4.3.2). As verified (chapters 4.2.2
and 4.3.3), single fiber profiles were virtually free from non-muscle transcriptional
activity that was detected in standard muscle homogenates. Gene Ontology (GO)
analyses clearly demonstrated the removal of transcripts specific of fibroblast, nerve
cells, and blood vessels. In addition, microgenomic analysis on characterized myofibers
demonstrates the elimination of signals from different fiber types present in whole

86
muscles. This in turn allows to increase the resolution level of analysis and a better
comprehension of differences of fiber types.
Experiments performed with Operon microarrays generated the first wide catalogue of
gene expression in slow-oxidative (SO) and fast-glycolytic (FG) purified fibers (chapter
4.2.3, Chemello F et al., 2011). Type 1 and type 2B fibers are at the extremes of the
range of variation of myofiber types, so a great number of genes were found
differentially expressed between the two classes and in good agreement with MyHC
classification. From the results obtained, I hypothesized the following functional units
in SO fibers: a) genes of fatty acid metabolism regulated by PPARα; b) slow isoforms
of contractile proteins controlled by NFATs; c) genes of oxidative metabolism
promoted by PGC-1α. Genetic programs in FG fibers were more elusive. FG fiber
phenotype seemed more difficult to examine for technical limitations of different nature.
Principally, more than half of differentially expressed genes had no associated GO
description. Although the ontology vocabulary has been recently enriched with new
terms to describe specific muscle structures and biological processes (Feltrin E et al.,
2009), many gene products are still waiting for annotation. A better functional
annotation exists for genes implicated in heart diseases (Lovering RC et al., 2009) that
in many instances are also expressed in slow skeletal muscles. A central issue in single
cell biology is that assays of individual cells are expected to produce a high degree of
expression repertoires, even in a context of relatively homogeneous cell population
(Levsky JM & Singer RH, 2003).
Figure 5.1: Differential expression among individual fast fibers. Expression levels among individual
type 2B fibers of three selected genes (JunB, Fos, RRad). Expression data are Log2 signal ratios values
which were converted to colors according to the bar shown at the top: positive values correspond to genes
over-expressed in isolated myofibers (red), whereas negative values refer to genes over-expressed in
whole muscles (green), and therefore under-expressed in myofibers.
Within this study I indeed found some genes that were expressed in a different fashion
between fibers expressing the same MyHC isoform. Noticeably, the expression of the

87
transcription factors JunB, Fos and RRrad (Ras-Related Associated with Diabetes), that
are correlated within the insulin pathway in muscle (Coletta DK et al., 2008), was
clearly down regulated only in a small group of type 2B fibers (Fig. 5.1). These results
confirmed the high resolution power of expression profiles and suggested that genomic
data may lead to novel classification systems at the transcriptional level, by discovering
subpopulations of genes whose expressions are altered to modify and maintain specific
myofiber phenotypes.
More intricacy was added by profiling all the four fiber types (chapter 4.3.4).
Surprisingly, expression profiles only partially concurred with MyHC isoform and
fibers were initially grouped by muscle origin. Since the two muscles have different
innervations (slow-twitch for soleus and fast-twitch for EDL), it was coherent that EDL
type 2X fiber transcriptome was more similar to those of type 2B fibers, and that soleus
type 2X fibers were more similar to the other fibers of soleus. In addition, type 2A and
type 2X fibers dissociated from soleus were similar and did not separate in two distinct
groups.
Unsupervised SAM analysis, performed according to sample clustering, permitted to
retrieve a higher number of genes that were more significantly associated with GO
categories than supervised analysis, performed according to MyHC classification. The
functional categories that better describe the features of myofibers are contractile
properties, metabolism, and Ca2+
homeostasis. These are not fixed categories but their
composition is varying among the continuum range of fiber types. Clusters of genes that
share common expression patterns form sub-categories (or modules of genes) that
would be useful to better describe a fiber and its adaptive potential. For example, it is
already known that studies on Ca2+
homeostasis showed that there was a continuum
from pure type 1 to pure 2B fibers and that type 2A behave more like 2X and 2B fibers
regarding Ca2+
release but closer to type 1 fibers regarding Ca2+
clearance (Calderon JC
et al., 2010). Here I found that, at transcriptomic level, also contractile isoforms and
metabolic genes only partially fitted with MyHC expression and are grouped in modules
of genes that define myofiber with a higher accuracy than the simple fast/slow or
glycolytic/oxidative nomenclature. A high number of expression profiles will be
necessary to better define these modules.
In conclusion, these data confirm that MyHC classification can only partially explain
the complexity of myofibers (Delbono O, 2010) and therefore that this classification
system, even though well informative and necessary for communication, is for MyHC

88
isoforms, not for fiber types classification system because not all muscle proteins switch
in parallel when MyHC isoform composition is altered (Spangenburg EE & Booth FW,
2003). The shift from comparison between muscles to comparison between individual
fibers has made possible an increased resolution analysis of muscle specific genes and a
better definition of the concept of myofiber type and the modules of genes that are
differentially expressed. Since change in gene expression is the most immediate reply of
muscle to various physiological stimuli, it is likely that the microgenomic approach will
become more and more attractive for studies on myofibers heterogeneity, plasticity and
diseases.

89

90

91
6. REFERENCES
Agbulut, O., P. Noirez, F. Beaumont, and G. Butler-Browne. 2003. Myosin heavy chain isoforms in
postnatal muscle development of mice. Biol.Cell. 95:399-406.
Alliel, P.M., N. Seddiqi, D. Goudou, C. Cifuentes-Diaz, N. Romero, E. Velasco, F. Rieger, and J.P. Perin.
2000. Myoneurin, a novel member of the BTB/POZ-zinc finger family highly expressed in human
muscle. Biochem.Biophys.Res.Commun. 273:385-391.
Andersen, J.L., and S. Schiaffino. 1997. Mismatch between myosin heavy chain mRNA and protein
distribution in human skeletal muscle fibers. Am.J.Physiol. 272:C1881-9.
Baldwin, K.M., and F. Haddad. 2001. Effects of different activity and inactivity paradigms on myosin
heavy chain gene expression in striated muscle. J.Appl.Physiol. 90:345-357.
Barton, K.N., and D.H. MacLennan. 2003. The Proteins of the Sarcotubular System. In Miology. A.G.
Engel and C. Franzini-Armstrong, editors. Mc Graw Hill, United States of America. 307-323.
Bassel-Duby, R., and E.N. Olson. 2006. Signaling pathways in skeletal muscle remodeling.
Annu.Rev.Biochem. 75:19-37.
Bean, C., M. Salamon, A. Raffaello, S. Campanaro, A. Pallavicini, and G. Lanfranchi. 2005. The Ankrd2,
Cdkn1c and calcyclin genes are under the control of MyoD during myogenic differentiation. J.Mol.Biol.
349:349-366.
Beard, N.A., D.R. Laver, and A.F. Dulhunty. 2004. Calsequestrin and the calcium release channel of
skeletal and cardiac muscle. Prog.Biophys.Mol.Biol. 85:33-69.
Bennett, P.M., D.O. Furst, and M. Gautel. 1999. The C-protein (myosin binding protein C) family:
regulators of contraction and sarcomere formation? Rev.Physiol.Biochem.Pharmacol. 138:203-234.
Berg, J.S., B.C. Powell, and R.E. Cheney. 2001. A millennial myosin census. Mol.Biol.Cell. 12:780-794.
Bischoff, R. 1986. Proliferation of muscle satellite cells on intact myofibers in culture. Dev.Biol. 115:129-
139.
Bolstad, B.M., R.A. Irizarry, M. Astrand, and T.P. Speed. 2003. A comparison of normalization methods
for high density oligonucleotide array data based on variance and bias. Bioinformatics. 19:185-193.
Bottinelli, R., and C. Reggiani. 2000. Human skeletal muscle fibres: molecular and functional diversity. Prog Biophys Mol Biol. 73:195-262.
Bresnick, A.R. 1999. Molecular mechanisms of nonmuscle myosin-II regulation. Curr.Opin.Cell Biol.
11:26-33.
Brooke, M.H., and K.K. Kaiser. 1970. Three human myosin ATPase systems and their importance in
muscle pathology. Neurology. 20:404-405.
Bruusgaard, J.C., K. Liestol, M. Ekmark, K. Kollstad, and K. Gundersen. 2003. Number and spatial
distribution of nuclei in the muscle fibres of normal mice studied in vivo. J.Physiol. 551:467-478.
Burkholder, T.J., B. Fingado, S. Baron, and R.L. Lieber. 1994. Relationship between muscle fiber types
and sizes and muscle architectural properties in the mouse hindlimb. J.Morphol. 221:177-190.
92
Calderon, J.C., P. Bolanos, and C. Caputo. 2010. Myosin heavy chain isoform composition and Ca(2+)
transients in fibres from enzymatically dissociated murine soleus and extensor digitorum longus muscles.
J.Physiol. 588:267-279.
Campanaro, S., C. Romualdi, M. Fanin, B. Celegato, B. Pacchioni, S. Trevisan, P. Laveder, C. De Pitta,
E. Pegoraro, Y.K. Hayashi, G. Valle, C. Angelini, and G. Lanfranchi. 2002. Gene expression profiling in
dysferlinopathies using a dedicated muscle microarray. Hum.Mol.Genet. 11:3283-3298.
Campbell, W.G., S.E. Gordon, C.J. Carlson, J.S. Pattison, M.T. Hamilton, and F.W. Booth. 2001.
Differential global gene expression in red and white skeletal muscle. Am.J.Physiol.Cell.Physiol.
280:C763-8.
Canepari, M., M.A. Pellegrino, G. D'Antona, and R. Bottinelli. 2010. Single muscle fiber properties in
aging and disuse. Scand.J.Med.Sci.Sports. 20:10-19.
Carlson, C.J., F.W. Booth, and S.E. Gordon. 1999. Skeletal muscle myostatin mRNA expression is fiber-
type specific and increases during hindlimb unloading. Am.J.Physiol. 277:R601-6.
Carmeli, E., M. Moas, A.Z. Reznick, and R. Coleman. 2004. Matrix metalloproteinases and skeletal
muscle: a brief review. Muscle Nerve. 29:191-197.
Catterall, W.A. 1991. Functional subunit structure of voltage-gated calcium channels. Science. 253:1499-
1500.
Chemello, F., C. Bean, P. Cancellara, P. Laveder, C. Reggiani, and G. Lanfranchi. 2011. Microgenomic
analysis in skeletal muscle: expression signatures of individual fast and slow myofibers. Accepted for
publication in PLoS One.
Chen, J.F., E.M. Mandel, J.M. Thomson, Q. Wu, T.E. Callis, S.M. Hammond, F.L. Conlon, and D.Z.
Wang. 2006. The role of microRNA-1 and microRNA-133 in skeletal muscle proliferation and
differentiation. Nat Genet. 38:228-233.
Chen, J.J. 2007. Key aspects of analyzing microarray gene-expression data. Pharmacogenomics. 8:473-
482.
Churchill, G.A. 2002. Fundamentals of experimental design for cDNA microarrays. Nat.Genet. 32
Suppl:490-495.
Ciciliot, S., and S. Schiaffino. 2010. Regeneration of mammalian skeletal muscle. Basic mechanisms and
clinical implications. Curr.Pharm.Des. 16:906-914.
Cifuentes-Diaz, C., M. Bitoun, D. Goudou, N. Seddiqi, N. Romero, F. Rieger, J.P. Perin, and P.M. Alliel.
2004. Neuromuscular expression of the BTB/POZ and zinc finger protein myoneurin. Muscle Nerve.
29:59-65.
Clark, K.A., A.S. McElhinny, M.C. Beckerle, and C.C. Gregorio. 2002. Striated muscle cytoarchitecture:
an intricate web of form and function. Annu.Rev.Cell Dev.Biol. 18:637-706.
Coletta, D.K., B. Balas, A.O. Chavez, M. Baig, M. Abdul-Ghani, S.R. Kashyap, F. Folli, D. Tripathy, L.J.
Mandarino, J.E. Cornell, R.A. Defronzo, and C.P. Jenkinson. 2008. Effect of acute physiological
hyperinsulinemia on gene expression in human skeletal muscle in vivo. Am.J.Physiol.Endocrinol.Metab.
294:E910-7.
Collins, J.H. 1991. Myosin light chains and troponin C: structural and evolutionary relationships revealed
by amino acid sequence comparisons. J.Muscle Res.Cell.Motil. 12:3-25.

93
Cowling, B.S., M.J. McGrath, M.A. Nguyen, D.L. Cottle, A.J. Kee, S. Brown, J. Schessl, Y. Zou, J. Joya,
C.G. Bonnemann, E.C. Hardeman, and C.A. Mitchell. 2008. Identification of FHL1 as a regulator of
skeletal muscle mass: implications for human myopathy. J.Cell Biol. 183:1033-1048.
Craig, R.W., and R. Padròn. 2003. Molecular Structure of the Sarcomere. In Miology. A.G. Engel and C.
Franzini-Armstrong, editors. Mc Graw Hill, United States of America. 129-166.
Damiani, E., and A. Margreth. 1994. Characterization study of the ryanodine receptor and of
calsequestrin isoforms of mammalian skeletal muscles in relation to fibre types. J.Muscle Res.Cell.Motil.
15:86-101.
De Acetis, M., A. Notte, F. Accornero, G. Selvetella, M. Brancaccio, C. Vecchione, M. Sbroggio, F.
Collino, B. Pacchioni, G. Lanfranchi, A. Aretini, R. Ferretti, A. Maffei, F. Altruda, L. Silengo, G. Tarone,
and G. Lembo. 2005. Cardiac overexpression of melusin protects from dilated cardiomyopathy due to
long-standing pressure overload. Circ.Res. 96:1087-1094.
Delbono, O. 2010. Myosin - still a good reference for skeletal muscle fibre classification? J.Physiol.
588:9.
Delgado, I., X. Huang, S. Jones, L. Zhang, R. Hatcher, B. Gao, and P. Zhang. 2003. Dynamic gene
expression during the onset of myoblast differentiation in vitro. Genomics. 82:109-121.
Do, J.H., and D.K. Choi. 2006. Normalization of microarray data: single-labeled and dual-labeled arrays.
Mol.Cells. 22:254-261.
Dodd, L.E., E.L. Korn, L.M. McShane, G.V. Chandramouli, and E.Y. Chuang. 2004. Correcting log
ratios for signal saturation in cDNA microarrays. Bioinformatics. 20:2685-2693.
Draghici, S., P. Khatri, A.C. Eklund, and Z. Szallasi. 2006. Reliability and reproducibility issues in DNA
microarray measurements. Trends Genet. 22:101-109.
Dubowitz, V., and A.G. Pearse. 1960. Reciprocal relationship of phosphorylase and oxidative enzymes in
skeletal muscle. Nature. 185:701-702.
Elvidge, G. 2006. Microarray expression technology: from start to finish. Pharmacogenomics. 7:123-134.
Ezura, Y., S. Chakravarti, A. Oldberg, I. Chervoneva, and D.E. Birk. 2000. Differential expression of
lumican and fibromodulin regulate collagen fibrillogenesis in developing mouse tendons. J.Cell Biol.
151:779-788.
Faulkner, G., G. Lanfranchi, and G. Valle. 2001. Telethonin and other new proteins of the Z-disc of
skeletal muscle. IUBMB Life. 51:275-282.
Felder, E., F. Protasi, R. Hirsch, C. Franzini-Armstrong, and P.D. Allen. 2002. Morphology and
molecular composition of sarcoplasmic reticulum surface junctions in the absence of DHPR and RyR in
mouse skeletal muscle. Biophys.J. 82:3144-3149.
Feltrin, E., S. Campanaro, A.D. Diehl, E. Ehler, G. Faulkner, J. Fordham, C. Gardin, M. Harris, D. Hill,
R. Knoell, P. Laveder, L. Mittempergher, A. Nori, C. Reggiani, V. Sorrentino, P. Volpe, I. Zara, G. Valle,
and J. Deegan. 2009. Muscle Research and Gene Ontology: New standards for improved data integration.
BMC Med.Genomics. 2:6.
Frey, N., and E.N. Olson. 2002. Calsarcin-3, a novel skeletal muscle-specific member of the calsarcin
family, interacts with multiple Z-disc proteins. J.Biol.Chem. 277:13998-14004.
Furst, D.O., W.M. Obermann, and P.F. van der Ven. 1999. Structure and assembly of the sarcomeric M
band. Rev.Physiol.Biochem.Pharmacol. 138:163-202.

94
Gauthier, G.F., and H.A. Padykula. 1966. Cytological studies of fiber types in skeletal muscle. A
comparative study of the mammalian diaphragm. J.Cell Biol. 28:333-354.
Gibson, G., and S.V. Muse. 2009. A Primer of Genome Science. Sinauer Associates, Sunderland, MA.
344 pp.
Gordon, A.M., E. Homsher, and M. Regnier. 2000. Regulation of contraction in striated muscle.
Physiol.Rev. 80:853-924.
Gundersen, K., E. Leberer, T. Lomo, D. Pette, and R.S. Staron. 1988. Fibre types, calcium-sequestering
proteins and metabolic enzymes in denervated and chronically stimulated muscles of the rat. J.Physiol.
398:177-189.
Haddad, F., C.E. Pandorf, J.M. Giger, and K.M. Baldwin. 2006. Striated Muscle Plasticity: Regulation of
the Myosin Heavy Chain Genes. In Skeletal Muscle Plasticity in Health and Disease: From Genes to
Whole Muscle. R. Bottinelli and C. Reggiani, editors. Springer, Dordrecht, The Netherlands. 55-89.
Hampson, R., and S.M. Hughes. 2001. Muscular expressions: profiling genes in complex tissues. Genome
Biol. 2:REVIEWS1033.
Helliwell, T.R. 1999. Muscle: Part 1 - Normal structure and function. Current Orthopaedics. 13:33-41.
Hoffman, E.P., K.J. Brown, and E. Eccleston. 2003. New molecular research technologies in the study of
muscle disease. Curr.Opin.Rheumatol. 15:698-707.
Hofmann, P.A., M.L. Greaser, and R.L. Moss. 1991. C-protein limits shortening velocity of rabbit
skeletal muscle fibres at low levels of Ca2+ activation. J.Physiol. 439:701-715.
Horowits, R. 1999. The physiological role of titin in striated muscle. Rev.Physiol.Biochem.Pharmacol.
138:57-96.
Huang da, W., B.T. Sherman, and R.A. Lempicki. 2009. Systematic and integrative analysis of large gene
lists using DAVID bioinformatics resources. Nat.Protoc. 4:44-57.
Hughes, S.M. 1998. Muscle development: electrical control of gene expression. Curr.Biol. 8:R892-4.
Hughes, T.R., M. Mao, A.R. Jones, J. Burchard, M.J. Marton, K.W. Shannon, S.M. Lefkowitz, M. Ziman,
J.M. Schelter, M.R. Meyer, S. Kobayashi, C. Davis, H. Dai, Y.D. He, S.B. Stephaniants, G. Cavet, W.L.
Walker, A. West, E. Coffey, D.D. Shoemaker, R. Stoughton, A.P. Blanchard, S.H. Friend, and P.S.
Linsley. 2001. Expression profiling using microarrays fabricated by an ink-jet oligonucleotide
synthesizer. Nat.Biotechnol. 19:342-347.
Huxley, A.F. 2000. Mechanics and models of the myosin motor. Philos.Trans.R.Soc.Lond.B.Biol.Sci.
355:433-440.
Huxley, H.E. 1957. The double array of filaments in cross-striated muscle. J.Biophys.Biochem.Cytol.
3:631-648.
James, D.E., A.B. Jenkins, and E.W. Kraegen. 1985. Heterogeneity of insulin action in individual muscles
in vivo: euglycemic clamp studies in rats. Am.J.Physiol. 248:E567-74.
Jemiolo, B., and S. Trappe. 2004. Single muscle fiber gene expression in human skeletal muscle:
validation of internal control with exercise. Biochem.Biophys.Res.Commun. 320:1043-1050.
Jenssen, T.K., M. Langaas, W.P. Kuo, B. Smith-Sorensen, O. Myklebost, and E. Hovig. 2002. Analysis
of repeatability in spotted cDNA microarrays. Nucleic Acids Res. 30:3235-3244.
95
Jin, W., R.M. Riley, R.D. Wolfinger, K.P. White, G. Passador-Gurgel, and G. Gibson. 2001. The
contributions of sex, genotype and age to transcriptional variance in Drosophila melanogaster. Nat.Genet.
29:389-395.
Khatri, P., and S. Draghici. 2005. Ontological analysis of gene expression data: current tools, limitations,
and open problems. Bioinformatics. 21:3587-3595.
Kruger, M., J. Wright, and K. Wang. 1991. Nebulin as a length regulator of thin filaments of vertebrate
skeletal muscles: correlation of thin filament length, nebulin size, and epitope profile. J.Cell Biol. 115:97-
107.
Kurimoto, K., and M. Saitou. 2010. Single-cell cDNA microarray profiling of complex biological
processes of differentiation. Curr.Opin.Genet.Dev. 20:470-477.
Kushmerick, M.J. 1998. Energy balance in muscle activity: simulations of ATPase coupled to oxidative
phosphorylation and to creatine kinase. Comp.Biochem.Physiol.B.Biochem.Mol.Biol. 120:109-123.
LaBarge, M.A., and H.M. Blau. 2002. Biological progression from adult bone marrow to mononucleate
muscle stem cell to multinucleate muscle fiber in response to injury. Cell. 111:589-601.
Lange, S., E. Ehler, and M. Gautel. 2006. From A to Z and back? Multicompartment proteins in the
sarcomere. Trends Cell Biol. 16:11-18.
Lee, M.L., F.C. Kuo, G.A. Whitmore, and J. Sklar. 2000. Importance of replication in microarray gene
expression studies: statistical methods and evidence from repetitive cDNA hybridizations.
Proc.Natl.Acad.Sci.U.S.A. 97:9834-9839.
Leung, Y.F., and D. Cavalieri. 2003. Fundamentals of cDNA microarray data analysis. Trends Genet.
19:649-659.
Levsky, J.M., and R.H. Singer. 2003. Gene expression and the myth of the average cell. Trends Cell Biol.
13:4-6.
Li, Y., Z. Xu, H. Li, Y. Xiong, and B. Zuo. 2010. Differential transcriptional analysis between red and
white skeletal muscle of Chinese Meishan pigs. Int.J.Biol.Sci. 6:350-360.
Lin, J., H. Wu, P.T. Tarr, C.Y. Zhang, Z. Wu, O. Boss, L.F. Michael, P. Puigserver, E. Isotani, E.N.
Olson, B.B. Lowell, R. Bassel-Duby, and B.M. Spiegelman. 2002. Transcriptional co-activator PGC-1
alpha drives the formation of slow-twitch muscle fibres. Nature. 418:797-801.
Lluis, F., E. Perdiguero, A.R. Nebreda, and P. Munoz-Canoves. 2006. Regulation of skeletal muscle gene
expression by p38 MAP kinases. Trends Cell Biol. 16:36-44.
Lockhart, D.J., H. Dong, M.C. Byrne, M.T. Follettie, M.V. Gallo, M.S. Chee, M. Mittmann, C. Wang, M.
Kobayashi, H. Horton, and E.L. Brown. 1996. Expression monitoring by hybridization to high-density
oligonucleotide arrays. Nat.Biotechnol. 14:1675-1680.
Long, Y.C., S. Glund, P.M. Garcia-Roves, and J.R. Zierath. 2007. Calcineurin regulates skeletal muscle
metabolism via coordinated changes in gene expression. J.Biol.Chem. 282:1607-1614.
Lovering, R.C., E.C. Dimmer, and P.J. Talmud. 2009. Improvements to cardiovascular gene ontology.
Atherosclerosis. 205:9-14.
Luquet, S., J. Lopez-Soriano, D. Holst, A. Fredenrich, J. Melki, M. Rassoulzadegan, and P.A. Grimaldi.
2003. Peroxisome proliferator-activated receptor delta controls muscle development and oxidative
capability. FASEB J. 17:2299-2301.

96
Luther, P.K., R. Padron, S. Ritter, R. Craig, and J.M. Squire. 2003. Heterogeneity of Z-band structure
within a single muscle sarcomere: implications for sarcomere assembly. J.Mol.Biol. 332:161-169.
Luther, P.K. 2009. The vertebrate muscle Z-disc: sarcomere anchor for structure and signalling. J.Muscle
Res.Cell.Motil. 30:171-185.
Lytton, J., M. Westlin, S.E. Burk, G.E. Shull, and D.H. MacLennan. 1992. Functional comparisons
between isoforms of the sarcoplasmic or endoplasmic reticulum family of calcium pumps. J.Biol.Chem.
267:14483-14489.
MacIntosh, B.R., P.F. Gardiner, and A.J. McComas. 2006. Skeletal Muscle: Form and Function. Human
Kinetics, United States of America. 425 pp.
MacLennan, D.H., and P.T. Wong. 1971. Isolation of a calcium-sequestering protein from sarcoplasmic
reticulum. Proc.Natl.Acad.Sci.U.S.A. 68:1231-1235.
Mahoney, D.J., and M.A. Tarnopolsky. 2005. Understanding skeletal muscle adaptation to exercise
training in humans: contributions from microarray studies. Phys.Med.Rehabil.Clin.N.Am. 16:859-73, vii.
Marino, J.H., P. Cook, and K.S. Miller. 2003. Accurate and statistically verified quantification of relative
mRNA abundances using SYBR Green I and real-time RT-PCR. J.Immunol.Methods. 283:291-306.
Marty, I., M. Robert, M. Villaz, K. De Jongh, Y. Lai, W.A. Catterall, and M. Ronjat. 1994. Biochemical
evidence for a complex involving dihydropyridine receptor and ryanodine receptor in triad junctions of
skeletal muscle. Proc.Natl.Acad.Sci.U.S.A. 91:2270-2274.
McCarthy, J.J., and K.A. Esser. 2007. MicroRNA-1 and microRNA-133a expression are decreased during
skeletal muscle hypertrophy. J.Appl.Physiol. 102:306-313.
Melzer, W., A. Herrmann-Frank, and H.C. Luttgau. 1995. The role of Ca2+ ions in excitation-contraction
coupling of skeletal muscle fibres. Biochim.Biophys.Acta. 1241:59-116.
Molkentin, J.D., and E.N. Olson. 1996. Defining the regulatory networks for muscle development.
Curr.Opin.Genet.Dev. 6:445-453.
Naya, F.J., B. Mercer, J. Shelton, J.A. Richardson, R.S. Williams, and E.N. Olson. 2000. Stimulation of
slow skeletal muscle fiber gene expression by calcineurin in vivo. J.Biol.Chem. 275:4545-4548.
Nervi, C., L. Benedetti, A. Minasi, M. Molinaro, and S. Adamo. 1995. Arginine-vasopressin induces
differentiation of skeletal myogenic cells and up-regulation of myogenin and Myf-5. Cell Growth Differ.
6:81-89.
Obermann, W.M., M. Gautel, F. Steiner, P.F. van der Ven, K. Weber, and D.O. Furst. 1996. The structure
of the sarcomeric M band: localization of defined domains of myomesin, M-protein, and the 250-kD
carboxy-terminal region of titin by immunoelectron microscopy. J.Cell Biol. 134:1441-1453.
Offer, G., C. Moos, and R. Starr. 1973. A new protein of the thick filaments of vertebrate skeletal
myofibrils. Extractions, purification and characterization. J.Mol.Biol. 74:653-676.
Pattison, J.S., L.C. Folk, R.W. Madsen, T.E. Childs, E.E. Spangenburg, and F.W. Booth. 2003.
Expression profiling identifies dysregulation of myosin heavy chains IIb and IIx during limb
immobilization in the soleus muscles of old rats. J.Physiol. 553:357-368.
Payne, A.M., and O. Delbono. 2006. Plasticity of Excitation-Contraction Coupling in Skeletal Muscle. In
Skeletal Muscle Plasticity in Health and Disease: From Genes to Whole Muscle. R. Bottinelli and C.
Reggiani, editors. Springer, Dordrecht, The Netherlands. 173-211.

97
Peter, J.B., R.J. Barnard, V.R. Edgerton, C.A. Gillespie, and K.E. Stempel. 1972. Metabolic profiles of
three fiber types of skeletal muscle in guinea pigs and rabbits. Biochemistry. 11:2627-2633.
Pette, D., H. Peuker, and R.S. Staron. 1999. The impact of biochemical methods for single muscle fibre
analysis. Acta Physiol.Scand. 166:261-277.
Pette, D., and R.S. Staron. 2000. Myosin isoforms, muscle fiber types, and transitions. Microsc.Res.Tech.
50:500-509.
Pette, D., and R.S. Staron. 2001. Transitions of muscle fiber phenotypic profiles. Histochem.Cell Biol.
115:359-372.
Peuker, H., and D. Pette. 1997. Quantitative analyses of myosin heavy-chain mRNA and protein isoforms
in single fibers reveal a pronounced fiber heterogeneity in normal rabbit muscles. Eur.J.Biochem. 247:30-
36.
Pfaffl, M.W. 2001. A new mathematical model for relative quantification in real-time RT-PCR. Nucleic
Acids Res. 29:e45.
Quackenbush, J. 2002. Microarray data normalization and transformation. Nat.Genet. 32 Suppl:496-501.
Quackenbush, J. 2006. Computational approaches to analysis of DNA microarray data.
Yearb.Med.Inform.:91-103.
Raffaello, A., P. Laveder, C. Romualdi, C. Bean, L. Toniolo, E. Germinario, A. Megighian, D. Danieli-
Betto, C. Reggiani, and G. Lanfranchi. 2006. Denervation in murine fast-twitch muscle: short-term
physiological changes and temporal expression profiling. Physiol.Genomics. 25:60-74.
Ravenscroft, G., K.J. Nowak, C. Jackaman, S. Clement, M.A. Lyons, S. Gallagher, A.J. Bakker, and N.G.
Laing. 2007. Dissociated flexor digitorum brevis myofiber culture system--a more mature muscle culture
system. Cell Motil.Cytoskeleton. 64:727-738.
Rayment, I., C. Smith, and R.G. Yount. 1996. The active site of myosin. Annu.Rev.Physiol. 58:671-702.
Raymond, F., S. Metairon, M. Kussmann, J. Colomer, A. Nascimento, E. Mormeneo, C. Garcia-Martinez,
and A.M. Gomez-Foix. 2010. Comparative gene expression profiling between human cultured myotubes
and skeletal muscle tissue. BMC Genomics. 11:125.
Reggiani, C., and T. te Kronnie. 2006. RyR isoforms and fibre type-specific expression of proteins
controlling intracellular calcium concentration in skeletal muscles. J.Muscle Res.Cell.Motil. 27:327-335.
Reiser, P.J., R.L. Moss, G.G. Giulian, and M.L. Greaser. 1985. Shortening velocity in single fibers from
adult rabbit soleus muscles is correlated with myosin heavy chain composition. J.Biol.Chem. 260:9077-
9080.
Rios, E., and G. Brum. 1987. Involvement of dihydropyridine receptors in excitation-contraction coupling
in skeletal muscle. Nature. 325:717-720.
Rios, E., and G. Pizarro. 1991. Voltage sensor of excitation-contraction coupling in skeletal muscle.
Physiol.Rev. 71:849-908.
Rochat, A., A. Fernandez, M. Vandromme, J.P. Moles, T. Bouschet, G. Carnac, and N.J. Lamb. 2004.
Insulin and wnt1 pathways cooperate to induce reserve cell activation in differentiation and myotube
hypertrophy. Mol.Biol.Cell. 15:4544-4555.
Romualdi, C., N. Vitulo, M. Del Favero, and G. Lanfranchi. 2005. MIDAW: a web tool for statistical
analysis of microarray data. Nucleic Acids Res. 33:W644-9.

98
Rosenblatt, J.D., A.I. Lunt, D.J. Parry, and T.A. Partridge. 1995. Culturing satellite cells from living
single muscle fiber explants. In Vitro Cell.Dev.Biol.Anim. 31:773-779.
Rowe, R.W. 1981. Morphology of perimysial and endomysial connective tissue in skeletal muscle. Tissue
Cell. 13:681-690.
Saeed, A.I., N.K. Bhagabati, J.C. Braisted, W. Liang, V. Sharov, E.A. Howe, J. Li, M. Thiagarajan, J.A.
White, and J. Quackenbush. 2006. TM4 microarray software suite. Methods Enzymol. 411:134-193.
Salerno, W., P. Havlak, and J. Miller. 2006. Scale-invariant structure of strongly conserved sequence in
genomic intersections and alignments. Proc.Natl.Acad.Sci.U.S.A. 103:13121-13125.
Sandow, A. 1965. Excitation-contraction coupling in skeletal muscle. Pharmacol.Rev. 17:265-320.
Sandri, M. 2008. Signaling in muscle atrophy and hypertrophy. Physiology (Bethesda). 23:160-170.
Sanger, J.W., J.M. Sanger, and C. Franzini-Armstrong. 2003. Assembly of Skeletal Muscle Cell. In
Miology. A.G. Engel and C. Franzini-Armstrong, editors. Mc Graw Hill, United States of America. 45-
65.
Schena, M., D. Shalon, R.W. Davis, and P.O. Brown. 1995. Quantitative monitoring of gene expression
patterns with a complementary DNA microarray. Science. 270:467-470.
Schiaffino, S., V. Hanzlikova, and S. Pierobon. 1970. Relations between structure and function in rat
skeletal muscle fibers. J Cell Biol 47: 107-119.
Schiaffino, S., L. Gorza, S. Sartore, L. Saggin, S. Ausoni, M. Vianello, K. Gundersen, and T. Lomo.
1989. Three myosin heavy chain isoforms in type 2 skeletal muscle fibres. J.Muscle Res.Cell.Motil.
10:197-205.
Schiaffino, S., and C. Reggiani. 1994. Myosin isoforms in mammalian skeletal muscle. J Appl Physiol.
77:493-501.
Schiaffino, S., and C. Reggiani. 1996. Molecular diversity of myofibrillar proteins: gene regulation and
functional significance. Physiol.Rev. 76:371-423.
Schiaffino, S., M. Sandri, and M. Murgia. 2006. Signaling Pathways Controlling Muscle Fiber Size and
Type in Response to Nerve Activity. In Skeletal Muscle Plasticity in Health and Disease: From Genes to
Whole Muscle. R. Bottinelli and C. Reggiani, editors. Springer, Dordrecht, The Netherlands. 91-119.
Schiaffino, S., M. Sandri, and M. Murgia. 2007. Activity-dependent signaling pathways controlling
muscle diversity and plasticity. Physiology (Bethesda). 22:269-278.
Schiaffino, S. 2010. Fibre types in skeletal muscle: a personal account. Acta Physiol.(Oxf). 199:451-463.
Schneider, M.F., and W.K. Chandler. 1973. Voltage dependent charge movement of skeletal muscle: a
possible step in excitation-contraction coupling. Nature. 242:244-246.
Schultz, E. 1989. Satellite cell behavior during skeletal muscle growth and regeneration. Med.Sci.Sports
Exerc. 21:S181-6.
Serysheva, I.I., M. Schatz, M. van Heel, W. Chiu, and S.L. Hamilton. 1999. Structure of the skeletal
muscle calcium release channel activated with Ca2+ and AMP-PCP. Biophys.J. 77:1936-1944.
Sharan, R., A. Maron-Katz, and R. Shamir. 2003. CLICK and EXPANDER: a system for clustering and
visualizing gene expression data. Bioinformatics. 19:1787-1799.

99
Shefer, G., and Z. Yablonka-Reuveni. 2005. Isolation and culture of skeletal muscle myofibers as a means
to analyze satellite cells. Methods Mol.Biol. 290:281-304.
Smerdu, V., I. Karsch-Mizrachi, M. Campione, L. Leinwand, and S. Schiaffino. 1994. Type IIx myosin
heavy chain transcripts are expressed in type IIb fibers of human skeletal muscle. Am.J.Physiol.
267:C1723-8.
Sotgia, F., G. Bonuccelli, C. Minetti, S.E. Woodman, F. Capozza, R.G. Kemp, P.E. Scherer, and M.P.
Lisanti. 2003. Phosphofructokinase muscle-specific isoform requires caveolin-3 expression for plasma
membrane recruitment and caveolar targeting: implications for the pathogenesis of caveolin-related
muscle diseases. Am.J.Pathol. 163:2619-2634.
Spangenburg, E.E., and F.W. Booth. 2003. Molecular regulation of individual skeletal muscle fibre types.
Acta Physiol.Scand. 178:413-424.
Staron, R.S., and D. Pette. 1986. Correlation between myofibrillar ATPase activity and myosin heavy
chain composition in rabbit muscle fibers. Histochemistry. 86:19-23.
Steinhoff, C., and M. Vingron. 2006. Normalization and quantification of differential expression in gene
expression microarrays. Brief Bioinform. 7:166-177.
Subkhankulova, T., and F.J. Livesey. 2006. Comparative evaluation of linear and exponential
amplification techniques for expression profiling at the single-cell level. Genome Biol. 7:R18.
Sweeney, H.L., and A. Houdusse. 2003. Mammalian Muscle Myosin. In Miology. A.G. Engel and C.
Franzini-Armstrong, editors. Mc Graw Hill, United States of America. 167-186.
Talmadge, R.J., and R.R. Roy. 1993. Electrophoretic separation of rat skeletal muscle myosin heavy-
chain isoforms. J.Appl.Physiol. 75:2337-2340.
Taylor, E., D. Cogdell, K. Coombes, L. Hu, L. Ramdas, A. Tabor, S. Hamilton, and W. Zhang. 2001.
Sequence verification as quality-control step for production of cDNA microarrays. BioTechniques. 31:62-
65.
Tee, J.M., C. van Rooijen, R. Boonen, and D. Zivkovic. 2009. Regulation of slow and fast muscle
myofibrillogenesis by Wnt/beta-catenin and myostatin signaling. PLoS One. 4:e5880.
Terada, S., M. Goto, M. Kato, K. Kawanaka, T. Shimokawa, and I. Tabata. 2002. Effects of low-intensity
prolonged exercise on PGC-1 mRNA expression in rat epitrochlearis muscle.
Biochem.Biophys.Res.Commun. 296:350-354.
Thomas, M., B. Langley, C. Berry, M. Sharma, S. Kirk, J. Bass, and R. Kambadur. 2000. Myostatin, a
negative regulator of muscle growth, functions by inhibiting myoblast proliferation. J.Biol.Chem.
275:40235-40243.
Tibshirani, R., T. Hastie, B. Narasimhan, and G. Chu. 2002. Diagnosis of multiple cancer types by
shrunken centroids of gene expression. Proc.Natl.Acad.Sci.U.S.A. 99:6567-6572.
Timmons, J.A., O. Larsson, E. Jansson, H. Fischer, T. Gustafsson, P.L. Greenhaff, J. Ridden, J. Rachman,
M. Peyrard-Janvid, C. Wahlestedt, and C.J. Sundberg. 2005. Human muscle gene expression responses to
endurance training provide a novel perspective on Duchenne muscular dystrophy. FASEB J. 19:750-760.
Toegl, A., R. Kirchner, C. Gauer, and A. Wixforth. 2003. Enhancing results of microarray hybridizations
through microagitation. J.Biomol.Tech. 14:197-204.
Tontonoz, P., and B.M. Spiegelman. 2008. Fat and beyond: the diverse biology of PPARgamma.
Annu.Rev.Biochem. 77:289-312.
100
Torgan, C.E., and M.P. Daniels. 2006. Calcineurin localization in skeletal muscle offers insights into
potential new targets. J.Histochem.Cytochem. 54:119-128.
Totsuka, Y., Y. Nagao, T. Horii, H. Yonekawa, H. Imai, H. Hatta, Y. Izaike, T. Tokunaga, and Y. Atomi.
2003. Physical performance and soleus muscle fiber composition in wild-derived and laboratory inbred
mouse strains. J.Appl.Physiol. 95:720-727.
Toumi, H., S. F'guyer, and T.M. Best. 2006. The role of neutrophils in injury and repair following muscle
stretch. J.Anat. 208:459-470.
Tusher, V.G., R. Tibshirani, and G. Chu. 2001. Significance analysis of microarrays applied to the
ionizing radiation response. Proc.Natl.Acad.Sci.U.S.A. 98:5116-5121.
Vale, R.D., and R.A. Milligan. 2000. The way things move: looking under the hood of molecular motor
proteins. Science. 288:88-95.
Van Gelder, R.N., M.E. von Zastrow, A. Yool, W.C. Dement, J.D. Barchas, and J.H. Eberwine. 1990.
Amplified RNA synthesized from limited quantities of heterogeneous cDNA. Proc.Natl.Acad.Sci.U.S.A.
87:1663-1667.
van Rooij, E., D. Quiat, B.A. Johnson, L.B. Sutherland, X. Qi, J.A. Richardson, R.J. Kelm Jr, and E.N.
Olson. 2009. A family of microRNAs encoded by myosin genes governs myosin expression and muscle
performance. Dev.Cell. 17:662-673.
Virtanen, C., and M. Takahashi. 2008. Muscling in on microarrays. Appl.Physiol.Nutr.Metab. 33:124-
129.
Vomelova, I., Z. Vanickova, and A. Sedo. 2009. Methods of RNA purification. All ways (should) lead to
Rome. Folia Biol.(Praha). 55:243-251.
Voytik, S.L., M. Przyborski, S.F. Badylak, and S.F. Konieczny. 1993. Differential expression of muscle
regulatory factor genes in normal and denervated adult rat hindlimb muscles. Dev.Dyn. 198:214-224.
Wacker, M.J., M.M. Tehel, and P.M. Gallagher. 2008. Technique for quantitative RT-PCR analysis
directly from single muscle fibers. J Appl Physiol. 105:308-15.
Wang, D., and S. Bodovitz. 2010. Single cell analysis: the new frontier in 'omics'. Trends Biotechnol.
28:281-290.
Wang, Y.X., C.L. Zhang, R.T. Yu, H.K. Cho, M.C. Nelson, C.R. Bayuga-Ocampo, J. Ham, H. Kang, and
R.M. Evans. 2004. Regulation of muscle fiber type and running endurance by PPARdelta. PLoS Biol.
2:e294.
Weber, A., and J.M. Murray. 1973. Molecular control mechanisms in muscle contraction. Physiol.Rev.
53:612-673.
Weindruch, R., T. Kayo, C.K. Lee, and T.A. Prolla. 2001. Microarray profiling of gene expression in
aging and its alteration by caloric restriction in mice. J.Nutr. 131:918S-923S.
Welle, S., A. Brooks, and C.A. Thornton. 2001. Senescence-related changes in gene expression in
muscle: similarities and differences between mice and men. Physiol.Genomics. 5:67-73.
Williams, T.M., and M.P. Lisanti. 2004. The caveolin proteins. Genome Biol. 5:214.
Wooldridge, A.A., C.N. Fortner, B. Lontay, T. Akimoto, R.L. Neppl, C. Facemire, M.B. Datto, A. Kwon,
E. McCook, P. Li, S. Wang, R.J. Thresher, S.E. Miller, J.C. Perriard, T.P. Gavin, R.C. Hickner, T.M.
Coffman, A.V. Somlyo, Z. Yan, and T.A. Haystead. 2008. Deletion of the protein kinase A/protein kinase

101
G target SMTNL1 promotes an exercise-adapted phenotype in vascular smooth muscle. J.Biol.Chem.
283:11850-11859.
Wu, H., F.J. Naya, T.A. McKinsey, B. Mercer, J.M. Shelton, E.R. Chin, A.R. Simard, R.N. Michel, R.
Bassel-Duby, E.N. Olson, and R.S. Williams. 2000. MEF2 responds to multiple calcium-regulated signals
in the control of skeletal muscle fiber type. EMBO J. 19:1963-1973.
Wu, H., T. Gallardo, E.N. Olson, R.S. Williams, and R.V. Shohet. 2003. Transcriptional analysis of
mouse skeletal myofiber diversity and adaptation to endurance exercise. J.Muscle Res.Cell.Motil. 24:587-
592.
Wu, K.D., and J. Lytton. 1993. Molecular cloning and quantification of sarcoplasmic reticulum Ca(2+)-
ATPase isoforms in rat muscles. Am.J.Physiol. 264:C333-41.
Yang, Y.H., S. Dudoit, P. Luu, D.M. Lin, V. Peng, J. Ngai, and T.P. Speed. 2002. Normalization for
cDNA microarray data: a robust composite method addressing single and multiple slide systematic
variation. Nucleic Acids Res. 30:e15.
Yoon, M. 2009. The role of PPARalpha in lipid metabolism and obesity: focusing on the effects of
estrogen on PPARalpha actions. Pharmacol.Res. 60:151-159.
Zhang, B., D. Schmoyer, S. Kirov, and J. Snoddy. 2004. GOTree Machine (GOTM): a web-based
platform for interpreting sets of interesting genes using Gene Ontology hierarchies. BMC Bioinformatics.
5:16.
Zhang, M.Y., W.J. Zhang, and S. Medler. 2010. The continuum of hybrid IIX/IIB fibers in normal mouse
muscles: MHC isoform proportions and spatial distribution within single fibers.
Am.J.Physiol.Regul.Integr.Comp.Physiol. 299:R1582-91.

102

103
7. ACKNOWLEDGMENTS
Firstly, I would like to thank Prof. Gerolamo Lanfranchi for giving me an opportunity to
work in his lab, and for his supervision and support. I specifically thank Camilla Bean
and Paolo Laveder for their constant guidance, encouragement, and discussions in day-
to-day life in the lab. Many thanks go out to all those people who helped me a lot in the
lab during these years, in particular the personnel of the MicroCribi Microarray Service
(http://microcribi.cribi.unipd.it) for their assistance in microarray experiments and
Francesco Martinati for data analysis. I wish also to thank Professor Carlo Reggiani for
his helpful suggestions and Lina Cancellara for myofibers characterization.