microsatellite marker development and parentage assignment in
TRANSCRIPT
MICROSATELLITE MARKER DEVELOPMENT AND
PARENTAGE ASSIGNMENT IN HALIOTIS MIDAE
BY
NICOL-CANDICE VAN DEN BERG
A thesis submitted in partial fulfilment of the requirements for the degree of Master of
Science at the University of Stellenbosch
March 2008

ii
Declaration
I, the undersigned, hereby declare that the work contained in this thesis is my own original work
and that I have not previously in its entirety or in part submitted it at any university for a degree.
Signature: ________________________________________________________________
Date: ________________________________________________________________
Copyright©2008 Stellenbosch University
All rights reserved
Stellenbosch University http://scholar.sun.ac.za
iii
Abstract
The five leading abalone producers in South Africa have initiated a genetic enhancement
program for Haliotis midae in a collaborative effort to improve economically valuable traits.
Several independent objective-specific studies were initiated, including the establishment of a
Performance Recording Scheme (PRS), utilised in this study, and necessary to monitor the
ongoing performance of individuals as the move from mass-selection to marker assisted
selection (MAS) is implemented.
The primary objective of this study was parentage assignment of F1 offspring mass-selected
for size at approximately one year and allocated to either a “faster” or a “slower” growth group.
Nine microsatellite markers were used to genotype juveniles and potential parents, with
assignment completed using CERVUS 2.0.
Average growth results for Abagold and HIK were comparable for both growth groups. Slight
environmental effects, although not statistically significant, were evident as growth advantages
for juveniles within the faster growth group at two of the five locations and for juveniles within
the slower growth group at one of the five rearing locations. Despite measures to standardise
environmental influences, variables are difficult to control within the reality of a production
environment; and potential genotype x environment interactions may require further
investigation and factoring into future breeding programs.
The additional costs associated with MAS often make the technology prohibitive to most
aquaculture operations, despite the significant genetic gains to be realised from its
implementation. Cost-optimising routine processes such as DNA extractions may be one
approach to reduce these additional costs. Chelex®100 appears to be a suitable alternative to the
CTAB method – being quick and cost-effective to perform. Applying this method in
combination with the high throughput of a robotic platform warrants further evaluation.
For the microsatellite development, 50% of positive recombinant clones contained inserts.
Sequencing of these clones produced 16% perfect repeats and 47% imperfect repeats for which
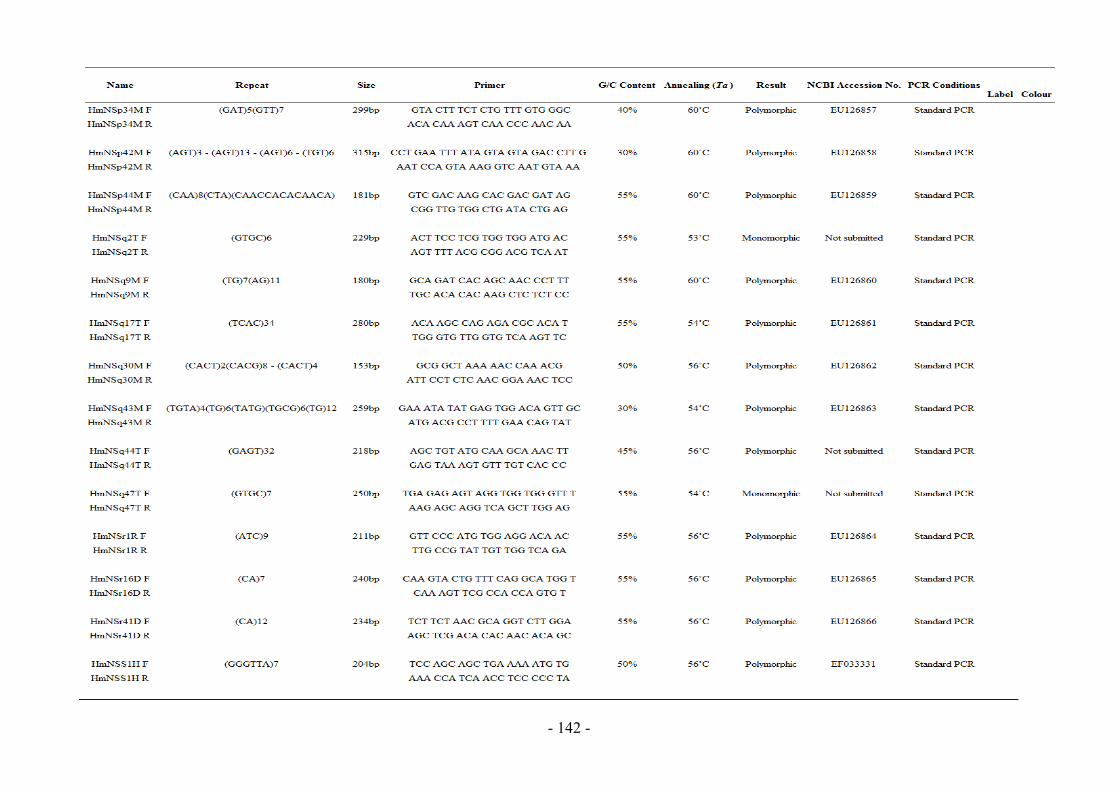
52 primer sets were designed and tested. In total, 31 polymorphic microsatellite loci of different
motifs and composition were developed. Sixty-one percent of sequenced clones were deemed
redundant and pre-screening for both uniqueness and the presence of microsatellites would
reduce unnecessary sequencing thus improving the efficiency of the FIASCO method and
reducing costs.
Stellenbosch University http://scholar.sun.ac.za

iv
Nine loci were selected for parentage assignments. Null alleles were present for all the
selected markers; however, frequencies were below the critical level of 5%.
Parentage yielded 91% and 90% successful assignment for Abagold and HIK respectively;
however, observations indicate that a measure of relatedness may exist between breeders.
Recommendations with regards to future family breeding include, for both Abagold and HIK,
retaining selected breeders based on their respective contributions to the F1 progeny while
reassessing the potential of remaining breeding stock under more controlled breeding conditions.
No obvious trends were observed for growth with most individuals producing both faster and
slower growing offspring. Juveniles will be reassessed at two years to determine whether the size
advantage or disadvantages were maintained and to ascertain whether growth
advantages/disadvantages may be gender specific.
Stellenbosch University http://scholar.sun.ac.za
v
Opsomming
Die vyf mees toonaangewende perlemoen produseerders in Suid Afrika het „n genetiese
verbeteringsprogram vir Haliotis midae geinisieer in „n gesamentlike poging om ekonomiese
belangrike eienskappe te verbeter. Verskeie onafhanklike fokus-spesifieke studies is geinisieer,
insluitend die totstandkoming van „n groeiprestasie aantekenstelsel, soos gebruik in hierdie
studie, en wat noodsaaklik is om die aaneenlopende prestasie van individue te moniteer soos
daar beweeg word van massa seleksie tot merker bemiddelde seleksie.
Die primêre fokus van hierdie studie was die ouerskapsbepaling van F1 nageslag wat massa
geselekteer is op ouderdom 1 jaar vir grootte en as of “vinniger” of “stadiger” groeiers
geklassifiseer is. Nege mikrosatelliet merkers is gebruik om jong perlemoen individue en
moontlike ouers te genotipeer, met die ouerskapstoekenning bereken deur CERVUS 2.0.
Groei resultate vir Abagold en HIK was vergelykbaar vir beide groei groepe op drie van die
lokaliteite. Geringe omgewingseffekte, alhoewel nie statisties betekenisvol nie, was sigbaar as „n
groei voordeel vir jong individue op twee van die vyf lokaliteite. Ongeag maatstawe om
omgewingsinvloede te standardiseer, is varieerbares moeilik om te beheer in die produksie
omgewing en genotipe x omgewings interaksies mag verdere navorsing vereis en behoort in ag
geneem te word in toekomstige telingsprogramme.
Die onkoste wat met merker bemiddelde seleksie geassosieer word, maak die tegniek soms
onaantreklik vir die meeste akwakultuur operasies; nie teen staande die genetiese voordele wat
die gebruik daarvan veroorsaak. Die koste-optimiseering van roetine prosesse, soos byvoorbeeld,
DNA ekstraksies, is dalk een aanslag om die addisionele koste te verminder. Chelex®100 blyk
„n geskikte alternatief tot die CTAB metode te wees – die tegniek is vinnig en koste-effektief om
uit te voer. Die gebruik van hierdie metode in kombinasie met die hoë deurvloei van ‟n robotiese
sisteem behoort verder ondersoek te word.
Vir die mikrosatelliet ontwikkeling het slegs 50% van die positiewe rekombinante klone
invoegings bevat. Nukleotiedvolgorde bepaling van hierdie klone het 16% perfekte herhalings en
47% onderbroke herhalings bevat waaruit 52 inleierstelle ontwikkel en getoets is. In totaal is 31
polimorfiese mikrosatelliet loki van verskillende motiewe en samestelling ontwikkel. Een-en-
sestig persent van die volgorde bepaalde klone is oortollig geag en vooraf sifting vir beide
uniekheid en die teenwoordigheid van mikrosatelliete sal onnodige volgorde bepaling verhoed,
die effektiwiteit van die FIASCO tegniek verhoog sowel as addisionele koste verminder.
Stellenbosch University http://scholar.sun.ac.za

vi
Nege loki is geselekteer vir ouerskapsbepaling. Nul allele was teenwoordig vir al die
geselekteerde merkers, maar die frekwensies was egter laer as die 5% kritieke waarde.
Ouerskap is 91% en 90% suksesvol bepaal vir Abagold en HIK onderskeidelik. Waarnemings
dui egter daarop dat daar verwantskappe mag wees tussen van die broeidiere.
Voorstelle in terme van toekomstige familie teling sluit is, vir beide Abagold en HIK, om
geselekteerde broei diere te behou gebaseer op hulle onderskeie bydraes tot die F1 nageslag asook
die herevaluaring van die potensiaal van die oorblywende broei diere onder meer beheerde teling
toestande.
Geen voor-die-handliggende tendense is waargeneem vir groei nie met die meeste individue wat
beide vinniger en stadiger groeiende nageslag geproduseer het. Jong individue moet geherevalueer
word op tweejarige ouderdom om te bepaal of die groei voordeel of nadele behou is en om te bepaal
om groei voordele/nadele geslagspesifiek is.
Stellenbosch University http://scholar.sun.ac.za

vii
Stellenbosch University
Supervisor: Dr Rouvay Roodt-Wilding
Department of Genetics
Division of Aquaculture
Signature: ____________________________________________________________________
Date: ____________________________________________________________________
Project Leader: Professor Danie Brink
Department of Genetics
Division of Aquaculture
Signature: ____________________________________________________________________
Date: ______________________________________________________________________
Stellenbosch University http://scholar.sun.ac.za

viii
Acknowledgements
I would like to express my deepest gratitude to all those who were instrumental in the
completion of this study with special thanks to the following people and companies:
Professor Danie Brink and Dr Rouvay Roodt-Wilding for my acceptance onto the Masters
program and into their research group; for providing the educational and financial support needed to
enable me to complete my studies and move towards a career in molecular genetics. For their
advice, guidance and generous giving of their time over the last two years, I will always be
extremely grateful. Thank you.
The Innovation Fund and the Industry Consortium, without whom, this opportunity to improve
the genetic status of South African abalone would not have been possible. The support and
hospitality we received at the farms made the tasks of regular sample collection, assessments and
tagging, an efficient, rewarding and enjoyable process. Special thanks to: Louise Jansen, Adri
Claasen, Stephen Ashlin, Lize Schoonbee, and Rudi Barnardo.
To Irvin and Johnson (Pty) Ltd for providing financial support in my first year of study and for
the opportunity to spend a few occasions helping out at the farm and learning more regarding the
practical aspects of abalone production. Special thanks to Nick Loubser and Lize Schoonbee for
accommodating me in their busy schedules and for giving of their time and their experience.
Ruhan Slabbert, for sharing his knowledge and experience and for helping me to master the
techniques required to complete this study with some measure of success; for his input into the
running and interpretation of my results, his friendship and company on the cycle trail. I wish him
all the best in his own studies going forward.
My friends and colleagues in the lab for being there throughout; for sharing their space, their
suggestions, their sense of humour and the odd glass of wine on a Friday afternoon.
To Gloudi and Carel at the DNA Sequencing Facility; for your continuous support,
knowledgeable suggestions, extreme patience and extra hours spent getting things through for me
when time was tight. I appreciate both your assistance and your friendship. Thank you.
Stellenbosch University http://scholar.sun.ac.za

ix
To my family, who have always encouraged me to follow my dreams; you have taught me to
value, love and challenge myself continuously and to always reach further than I believed possible.
I am eternally indebted to you for helping me become the person I am today. Thank you for your
unconditional love; for encouraging me to be an independent thinker and to have the confidence to
take on new pursuits which inspire me and give my life purpose. I love you always.
And last but not least, I wish to express my love, thanks and appreciation to my husband, Rob;
without whose continuous support, understanding and belief in my abilities, I would never have had
the courage to step back in order to move forward. For your encouragement, patience and
unwavering love, I will always be grateful. Your sense of humour has seen me though the tough
times and your love has made my life complete. Thank you for teaching me to see the beauty
around me; to always expect more out of life but to give something back and to never ever give up.
I love and respect you with all my heart.
Stellenbosch University http://scholar.sun.ac.za
“How inappropriate to call this planet Earth, when it is clearly Ocean”
Arthur C. Clarke
(Quoted in Beaumont and Hoare 2003)
Stellenbosch University http://scholar.sun.ac.za

xi
Table of Contents
Declaration ........................................................................................................................................... ii
Abstract ...............................................................................................................................................iii
Opsomming .......................................................................................................................................... v
Stellenbosch University ..................................................................................................................... vii
Acknowledgements ...........................................................................................................................viii
Table of Contents ................................................................................................................................ xi
List of Figures ................................................................................................................................... xvi
List of Tables ..................................................................................................................................... xx
List of Appendices ........................................................................................................................... xxii
Abbreviations, Acronyms, Formulae and Symbols ........................................................................xxiii
List of Unit Abbreviations ............................................................................................................... xxv
Chapter One .................................................................................................................................. - 1 -
1.1 Introduction .................................................................................................................. - 2 -
1.2 Project Objectives ......................................................................................................... - 3 -
1.3 Study Objectives ........................................................................................................... - 4 -
Chapter Two .................................................................................................................................. - 7 -
2.1 Background on Abalone .............................................................................................. - 8 -
2.1.1 Classification ............................................................................................................... - 8 -
2.1.2 Biological Characteristics ............................................................................................ - 8 -
2.1.3 Abalone in the Natural Environment ........................................................................... - 9 -
2.1.4 Abalone Feeding in the Wild and in Captivity ............................................................ - 9 -
2.1.5 Global Distribution of Haliotids .................................................................................. - 9 -
2.2 Haliotis midae (South African Abalone) ................................................................... - 10 -
2.2.1 Natural Populations ................................................................................................... - 10 -
2.2.2 Commercial Threats and Predation ........................................................................... - 11 -
2.2.3 Legal Catch and Policy Control................................................................................. - 12 -
2.3 A Snapshot of the International and the Local Abalone Market ............................... - 13 -
2.3.1 World Market Opportunities and Commercial Value ............................................... - 13 -
2.3.2 Abalone Production and Marketing in Southern Africa ............................................ - 14 -
2.4 Gaining a Competitive Advantage in a Dynamic International Market .................... - 16 -
2.4.1 Genetic Improvement ................................................................................................ - 16 -
2.4.2 Commercially Important Traits ................................................................................. - 16 -
2.4.3 The Potential of Genetic Improvement Programs within Aquaculture ..................... - 17 -
Stellenbosch University http://scholar.sun.ac.za
xii
2.4.4 The Key to Unlock What Lies Beneath ..................................................................... - 17 -
2.5 Molecular Markers - Tools to Deliver Genetic Improvement Programs ................... - 18 -
2.5.1 Genetic Variation and DNA Molecular Markers in General ..................................... - 18 -
2.5.2 Choosing the Right Molecular Marker and Technique ............................................. - 18 -
2.5.3 Types and Usefulness of Molecular Markers ............................................................ - 19 -
2.5.4 Pros and Cons of Molecular Markers ........................................................................ - 20 -
2.5.5 Application of Molecular Markers in Aquaculture ................................................... - 22 -
2.6 Microsatellites - The Molecular Marker of Choice? ................................................. - 23 -
2.6.1 Microsatellite Markers and their Distribution in the Genome ................................... - 23 -
2.6.2 The Importance and Application of Microsatellite Markers in Genetics .................. - 23 -
2.6.3 Microsatellite Multiplexing: Increased Productivity - Reduced Genotyping ............ - 24 -
2.7 Genotyping Errors and Artefacts Associated with Microsatellite PCR .................... - 25 -
2.7.1 Common Sources of Error ......................................................................................... - 25 -
2.7.2 PCR Slippage and Stutter Profiles ............................................................................. - 25 -
2.7.3 Microsatellite Null Alleles ......................................................................................... - 26 -
2.8 Parentage Assignments .............................................................................................. - 27 -
2.8.1 Assignment of Individuals to Families and Populations ........................................... - 27 -
2.8.2 Software for Parentage Assignment - An Overview ................................................. - 28 -
2.8.2.1 Deciding Which Method is Best .................................................................................. - 28 -
2.8.2.2 Exclusion-Based Methods of Assignment .................................................................. - 29 -
2.8.2.3 Likelihood-Based Methods of Assignment ................................................................. - 29 -
2.8.2.4 Pros and Cons of Available Software Programs ......................................................... - 30 -
2.10 What of the Future? ................................................................................................... - 31 -
2.10.1 Linkage Mapping in Haliotis midae ........................................................................... - 31 -
2.10.2 Quantitative Trait Loci (QTL) and QTL Mapping ..................................................... - 32 -
2.10.3 Marker Assisted Selection (MAS) .............................................................................. - 33 -
2.10.4 Pedigree Records versus Mass Selection .................................................................... - 33 -
2.10.5 Walk-back and Optimum Contribution Selection Schemes ....................................... - 34 -
Chapter Three ............................................................................................................................. - 36 -
Abstract .................................................................................................................................... - 37 -
3.1 Introduction ............................................................................................................... - 37 -
3.2 Materials and Method ................................................................................................ - 38 -
3.2.1 Breeding Stock Information ...................................................................................... - 38 -
3.2.1.1 Abagold (Pty) Ltd ........................................................................................................ - 38 -
3.2.1.2 HIK Abalone (Pty) Ltd ................................................................................................ - 39 -
Stellenbosch University http://scholar.sun.ac.za
xiii
3.2.2 Performance Recording Scheme (PRS) ...................................................................... - 39 -
3.2.2.1 Background ................................................................................................................. - 39 -
3.2.2.2 Structure of the Performance Recording Scheme ....................................................... - 40 -
3.2.2.3 Production Traits to be Measured or Assessed ........................................................... - 41 -
3.2.2.4 Collection of Offspring Data and Tagging .................................................................. - 42 -
3.2.3 Collection of Abalone Tissue Samples ....................................................................... - 42 -
3.2.3.1 Tissue Sampling of Abalone Breeding Stock.............................................................. - 42 -
3.2.3.2 Tissue Sampling of Abalone Offspring ....................................................................... - 43 -
3.2.4 Genomic DNA Extractions ......................................................................................... - 43 -
3.2.4.1 Genomic DNA Isolation from Abalone Breeding Stock Tissue ................................. - 43 -
3.2.4.2 Genomic DNA Isolation from Abalone Offspring Tissue .......................................... - 44 -
3.2.4.3 Comparison between Extraction Methods and PCR Results ...................................... - 45 -
3.2.4.4 Quantification of Isolated Genomic DNA................................................................... - 46 -
3.2.4.5 Preparation of Genomic DNA Dilutions ..................................................................... - 46 -
3.3 Results ....................................................................................................................... - 47 -
3.3.1 Performance Recording Scheme (PRS) ..................................................................... - 47 -
3.3.1.1 Background .................................................................................................................. - 47 -
3.3.1.2 Production Traits Measured or Assessed .................................................................... - 47 -
3.3.1.3 Collection of Offspring Data and Tagging .................................................................. - 47 -
3.3.1.4 Offspring Data for Abagold ........................................................................................ - 48 -
3.3.1.5 Offspring Data for HIK Abalone................................................................................. - 49 -
3.3.3 Collection of Abalone Tissue Samples ....................................................................... - 50 -
3.3.3.1 Tissue Sampling of Abalone Breeding Stock.............................................................. - 50 -
3.3.3.2 Tissue Sampling of Abalone Offspring ....................................................................... - 50 -
3.3.4 Genomic DNA Extractions ......................................................................................... - 50 -
3.3.4.1 Genomic DNA Isolation and Quantification of Abalone Breeding Stock .................. - 50 -
3.3.4.2 Genomic DNA Isolation and Quantification of Abalone Offspring ........................... - 50 -
3.3.4.3 Comparison between Extraction Methods and PCR Results ...................................... - 50 -
3.3.5 Shortcomings and Sources of Error ............................................................................ - 53 -
3.4 Discussion ................................................................................................................... - 53 -
Chapter Four ............................................................................................................................... - 59 -
Abstract .................................................................................................................................... - 60 -
4.1 Introduction ............................................................................................................... - 60 -
4.2 Materials and Methods .............................................................................................. - 61 -
4.2.1 Microsatellite Isolation .............................................................................................. - 61 -
Stellenbosch University http://scholar.sun.ac.za
xiv
4.2.1.1 Genomic DNA from Wild Abalone Populations ........................................................ - 61 -
4.2.1.2 Buffer Stock Solutions for FIASCO Protocol (Zane et al. 2002) ............................... - 62 -
4.2.1.3 Digestion and Ligation of Genomic DNA followed by PCR Amplification .............. - 62 -
4.2.1.4 Enrichment through Hybridization with Biotinylated Probes ..................................... - 62 -
4.2.1.5 Selective Capturing of DNA-Probe Hybrids and PCR Amplification ........................ - 63 -
4.2.1.6 Cloning through Ligation and Transformation of PCR Products................................ - 64 -
4.2.2 Microsatellite Screening ............................................................................................. - 65 -
4.2.2.1 Direct Amplification of Positive Clones through Colony PCR .................................. - 66 -
4.2.2.2 Automated Direct Sequencing of Selected PCR Fragments ....................................... - 66 -
4.2.3 Primer Development ................................................................................................... - 67 -
4.2.3.1 Design of PCR Primers ............................................................................................... - 67 -
4.2.3.2 Primer Testing for Detection of DNA Polymorphisms and Optimization .................. - 67 -
4.2.3.3 Polyacrylamide Gel Electrophoresis ........................................................................... - 68 -
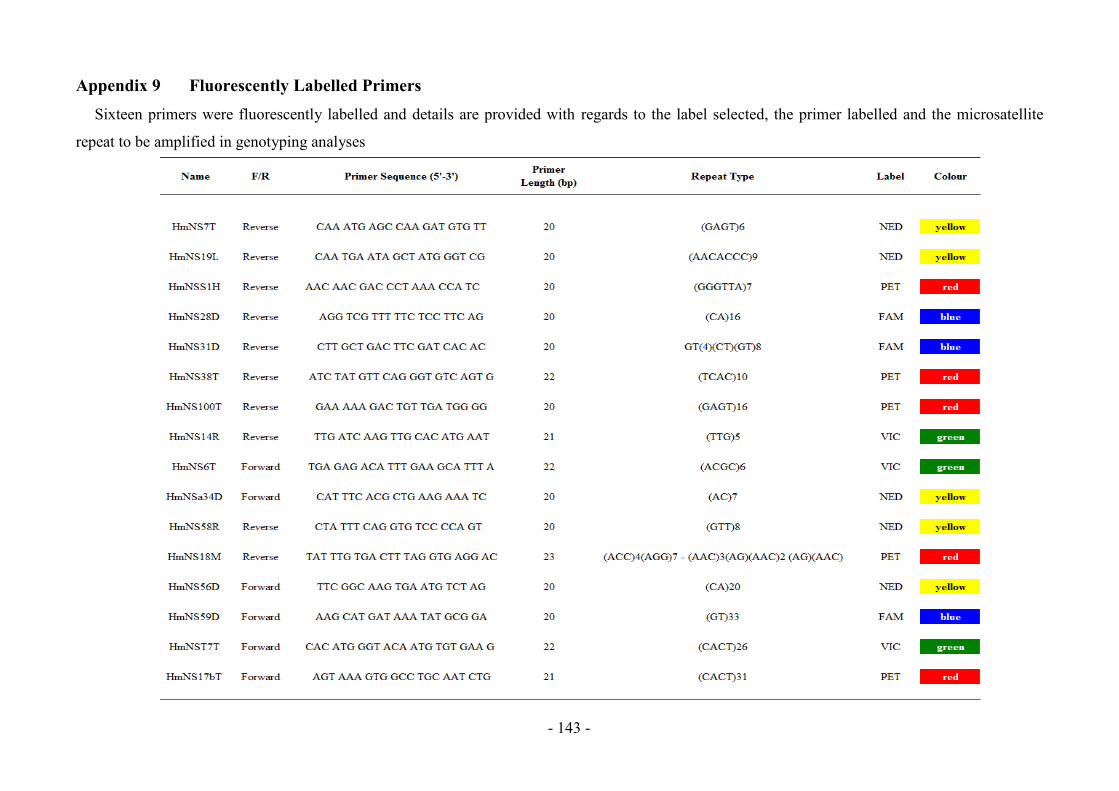
4.2.3.4 Fluorescent Labelling of Selected Primers .................................................................. - 69 -
4.2.3.5 Optimization Process of Labelled Polymorphic Primers for Genotyping ................... - 69 -
4.2.4 Black Rock Abalone Population and Selection of Primers ........................................ - 70 -
4.2.4.1 Preparation of Black Rock Genomic DNA samples ................................................... - 70 -
4.2.4.2 Genotyping of Individuals using Polymorphic Primers .............................................. - 70 -
4.2.4.3 Optimization of Multiplexed Reactions for Genotyping ............................................. - 72 -
4.2.4.4 Analysis and Primer Selection .................................................................................... - 72 -
4.3 Results ........................................................................................................................ - 73 -
4.3.1 Microsatellite Isolation ............................................................................................... - 73 -
4.3.1.1 Genomic DNA from Wild Abalone Populations ........................................................ - 73 -
4.3.1.2 Digestion and Ligation of Genomic DNA followed by PCR Amplification .............. - 73 -
4.3.1.3 Selective Capturing of DNA-Probe Hybrids and PCR Amplification ........................ - 74 -
4.3.1.4 Cloning through Ligation and Transformation of PCR Products................................ - 75 -
4.3.2 Microsatellite Screening ............................................................................................. - 76 -
4.3.2.1 Direct Amplification of Positive Clones through Colony PCR .................................. - 76 -
4.3.3.2 Automated Direct Sequencing of Selected PCR Fragments ....................................... - 77 -
4.3.3 Primer Development ................................................................................................... - 78 -
4.3.3.1 Design of PCR Primers ............................................................................................... - 78 -
4.3.3.2 Primer Testing for Detection of DNA Polymorphisms ............................................... - 78 -
4.3.3.3 Fluorescent Labelling of Selected Primers .................................................................. - 79 -
4.3.3.4 Optimization Process of Labelled Polymorphic Primer Sets for Genotyping............. - 80 -
4.3.4 Black Rock Abalone Population and Selection of Primers ........................................ - 81 -
Stellenbosch University http://scholar.sun.ac.za
xv
4.3.4.1 Preparation of Genomic DNA samples ....................................................................... - 81 -
4.3.4.2 Genotyping of Individuals using Labelled Polymorphic Primer Sets ......................... - 81 -
4.3.4.3. Optimization of Multiplexed Reactions for Genotyping ............................................. - 82 -
4.3.4.4 Statistical Results and Selected Polymorphic Primers for Parentage Assignment ..... - 82 -
4.3.5 Shortcomings and Sources of Error ........................................................................... - 83 -
4.4 Discussion .................................................................................................................. - 84 -
Chapter Five ................................................................................................................................ - 90 -
Abstract .................................................................................................................................... - 91 -
5.1 Introduction ............................................................................................................... - 91 -
5.2 Materials and Methods .............................................................................................. - 92 -
5.2.1 Genotyping of Abalone Adults and Juveniles from the PRS .................................... - 92 -
5.2.1.1 Genotyping of Performance Recording Scheme Individuals ...................................... - 92 -
5.2.1.2 Multiplexing of Polymorphic Primers for Parentage Assignment .............................. - 92 -
5.2.1.3 Optimization of Multiplexes for Parentage Assignment ............................................. - 94 -
5.2.2 Parentage Assignment ................................................................................................ - 94 -
5.2.2.1 Software Overview ...................................................................................................... - 94 -
5.2.2.2 Statistical Analysis ...................................................................................................... - 94 -
5.3 Results ....................................................................................................................... - 96 -
5.3.1 Genotyping of Performance Recording Scheme Individuals .................................... - 96 -
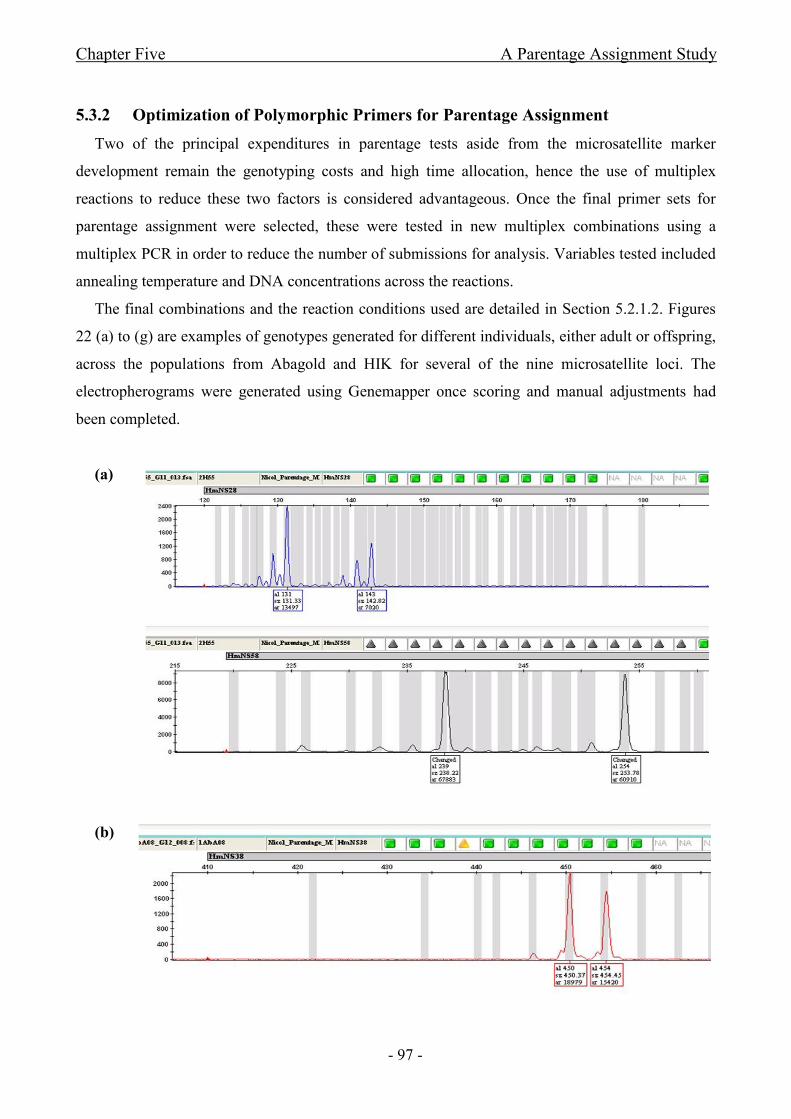
5.3.2 Optimization of Polymorphic Primers for Parentage Assignment ............................ - 97 -
5.3.2 Parentage Assignment ............................................................................................. - 100 -
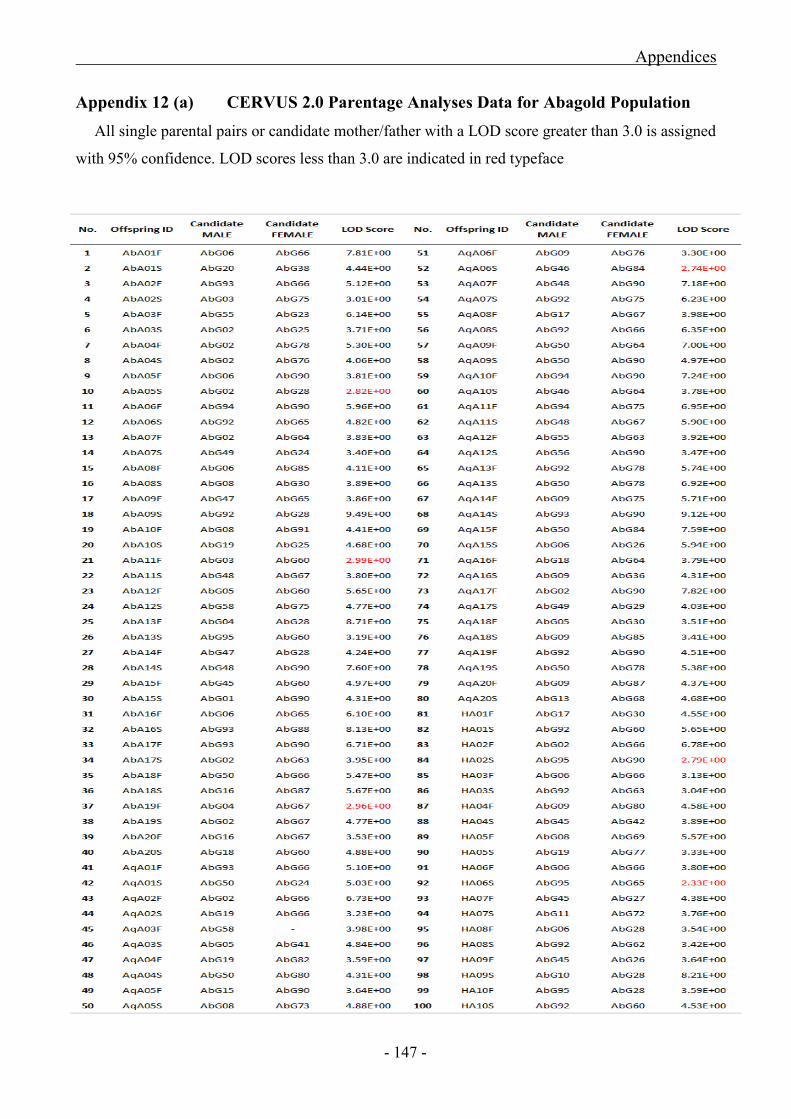
5.3.2.1 Statistical Results of Abagold Parentage Analyses ................................................... - 100 -
5.3.2.3 Statistical Results of HIK Parentage Analyses.......................................................... - 107 -
5.3.3 Shortcomings and Sources of Error .......................................................................... - 113 -
5.4 Discussion ................................................................................................................ - 114 -
Chapter Six ................................................................................................................................ - 121 -
Appendices .................................................................................................................................. - 126 -
References ................................................................................................................................... - 151 -
Addendum A ............................................................................................................................... - 161 -
Stellenbosch University http://scholar.sun.ac.za

xvi
List of Figures
Figure 1 Abstract outline of the research design and methodology adopted in this study....- 6 -
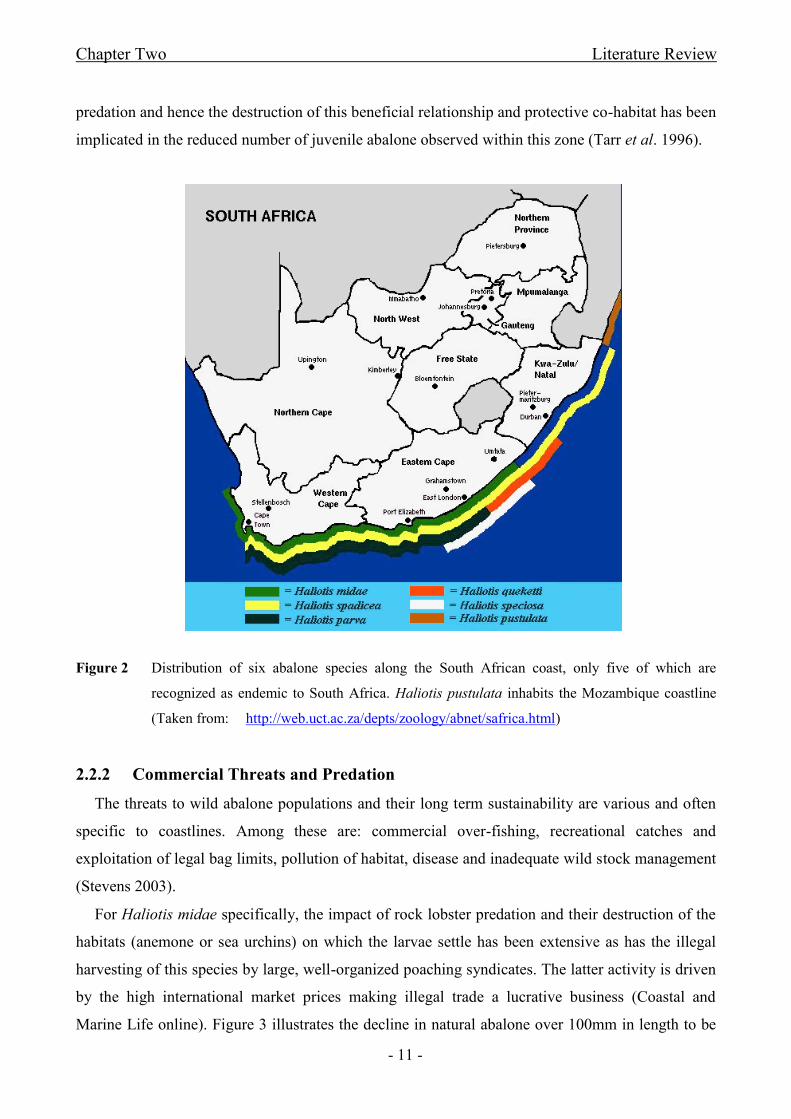
Figure 2 Distribution of six abalone species along the South African coast, only five of
which are recognized as endemic to South Africa. Haliotis pustulata inhabits the Mozambique
coastline.........................................................................................................................................- 11 -
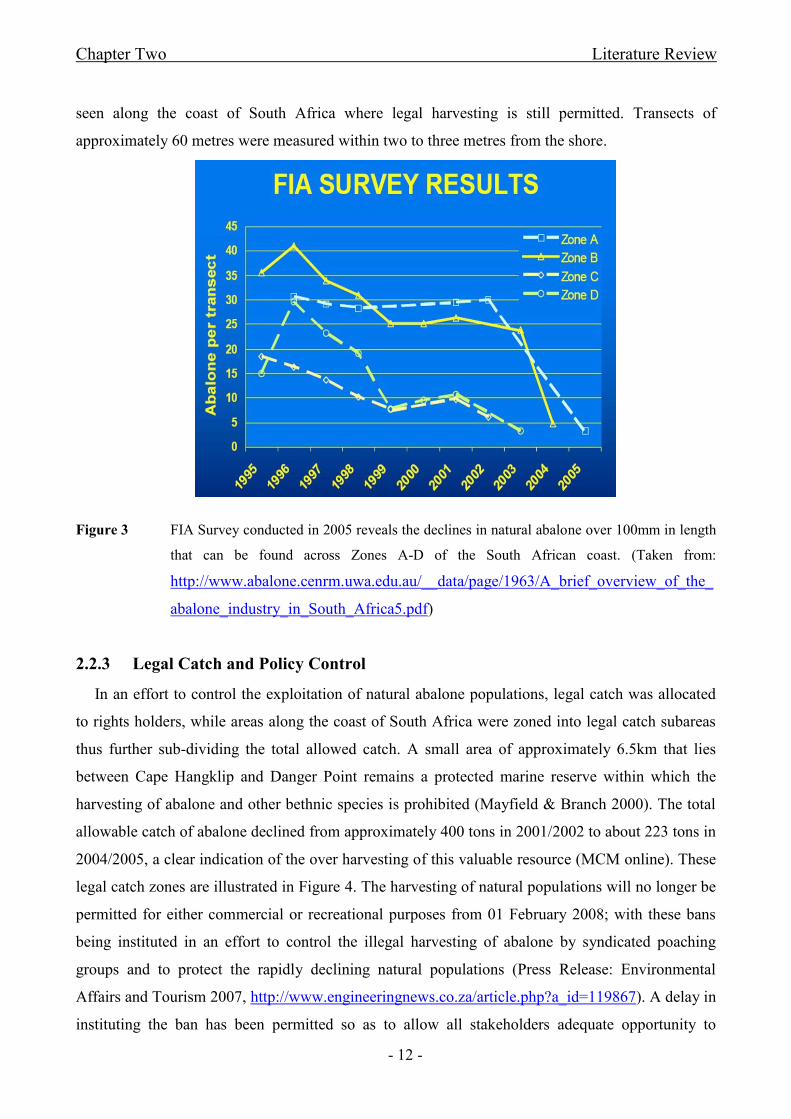
Figure 3 FIA Survey conducted in 2005 reveals the declines in natural abalone over 100mm
in length that can be found across Zones A-D of the South African coast....................................- 12 -
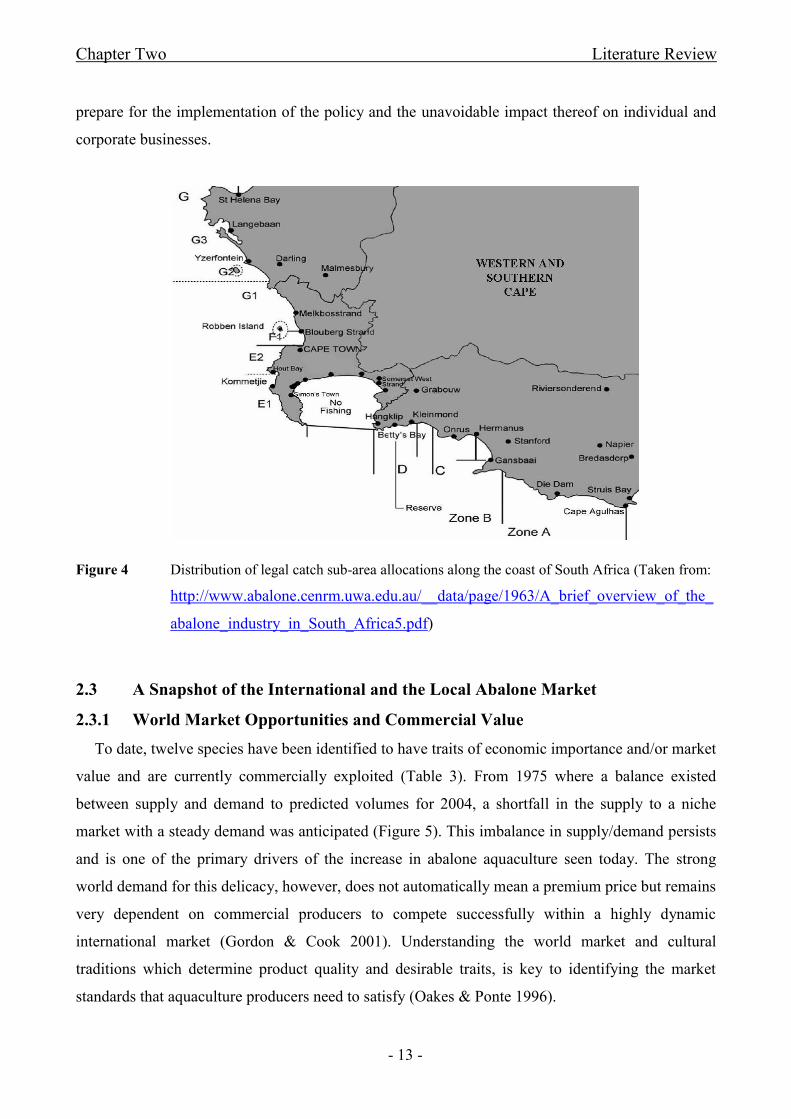
Figure 4 Distribution of legal catch sub-area allocations along the coast of South Africa - 13 -
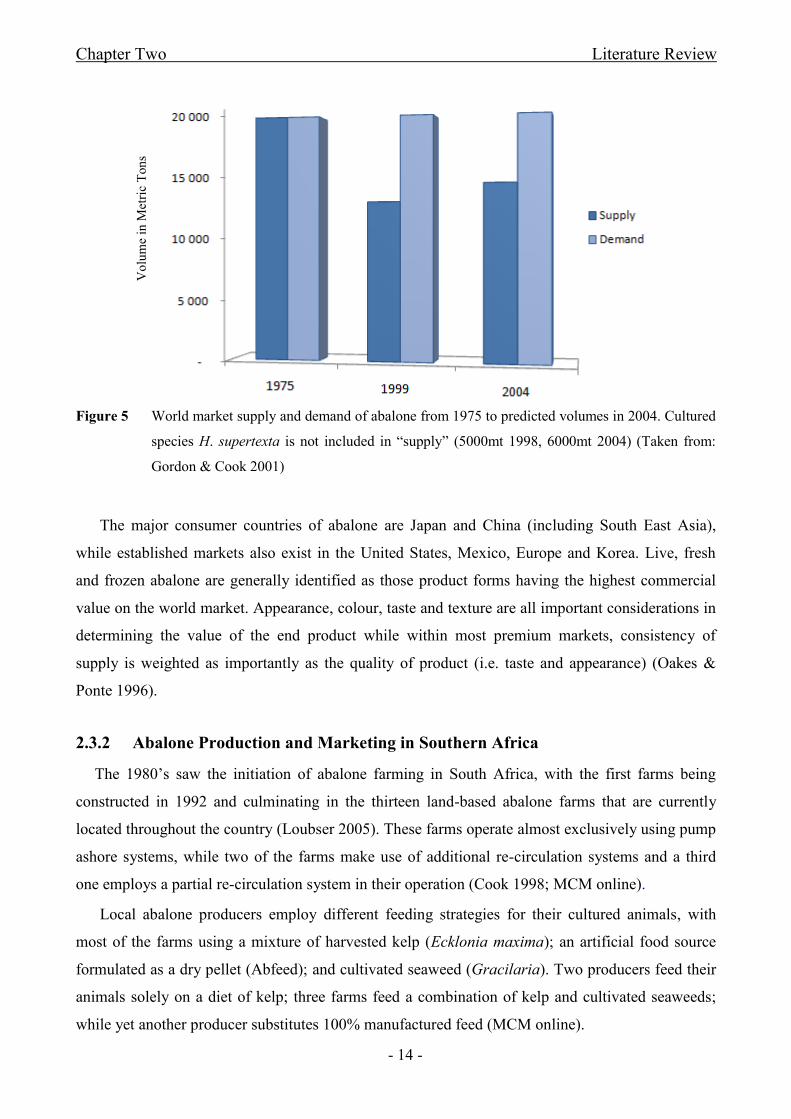
Figure 5 World market supply and demand of abalone from 1975 to predicted volumes in
2004. Cultured species H. supertexta is not included in “supply”................................................- 14 -
Figure 6 Thirteen abalone producers are distributed along the South African coast. The
majority of these farms are located along the West Coast while two are situated in the Eastern
Cape...............................................................................................................................................- 15 -
Figure 7 Annual volume growth in tons per annum of farm produced abalone in South Africa
with a predicted volume of twelve hundred tons in 2010..............................................................- 16 -
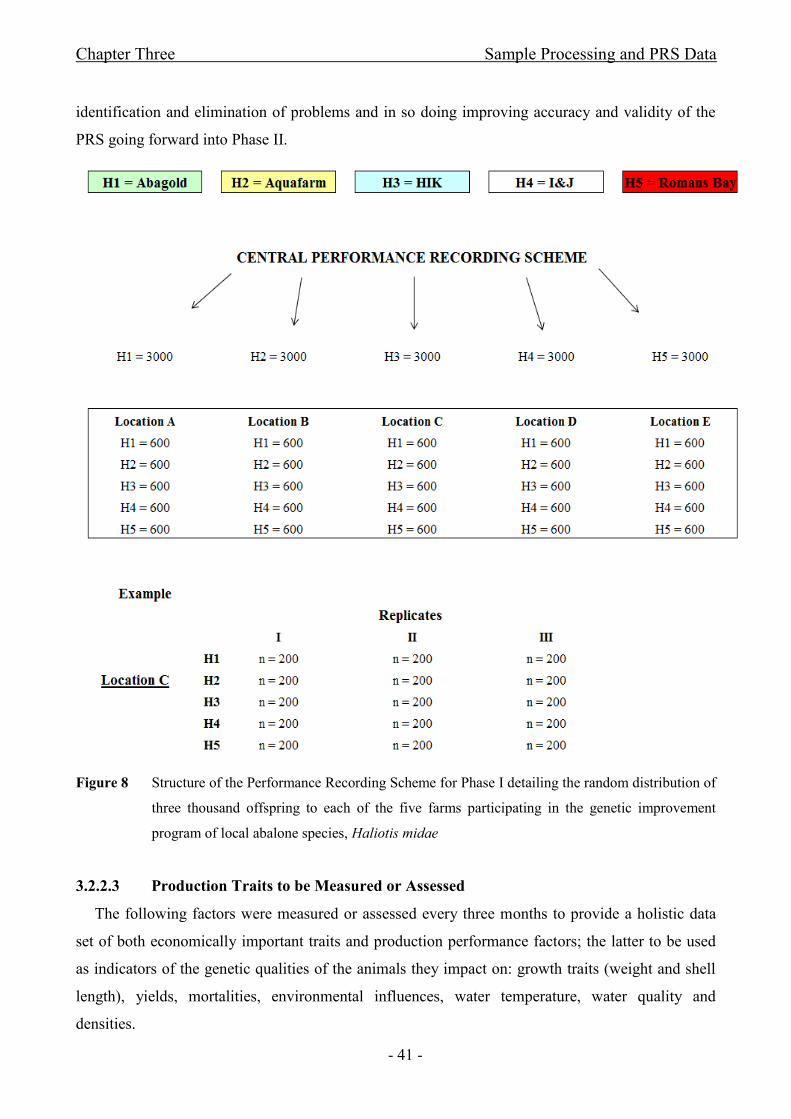
Figure 8 Structure of the Performance Recording Scheme for Phase I detailing the random
distribution of three thousand offspring to each of the five farms participating in the genetic
improvement program of local abalone species, Haliotis midae...................................................- 41 -
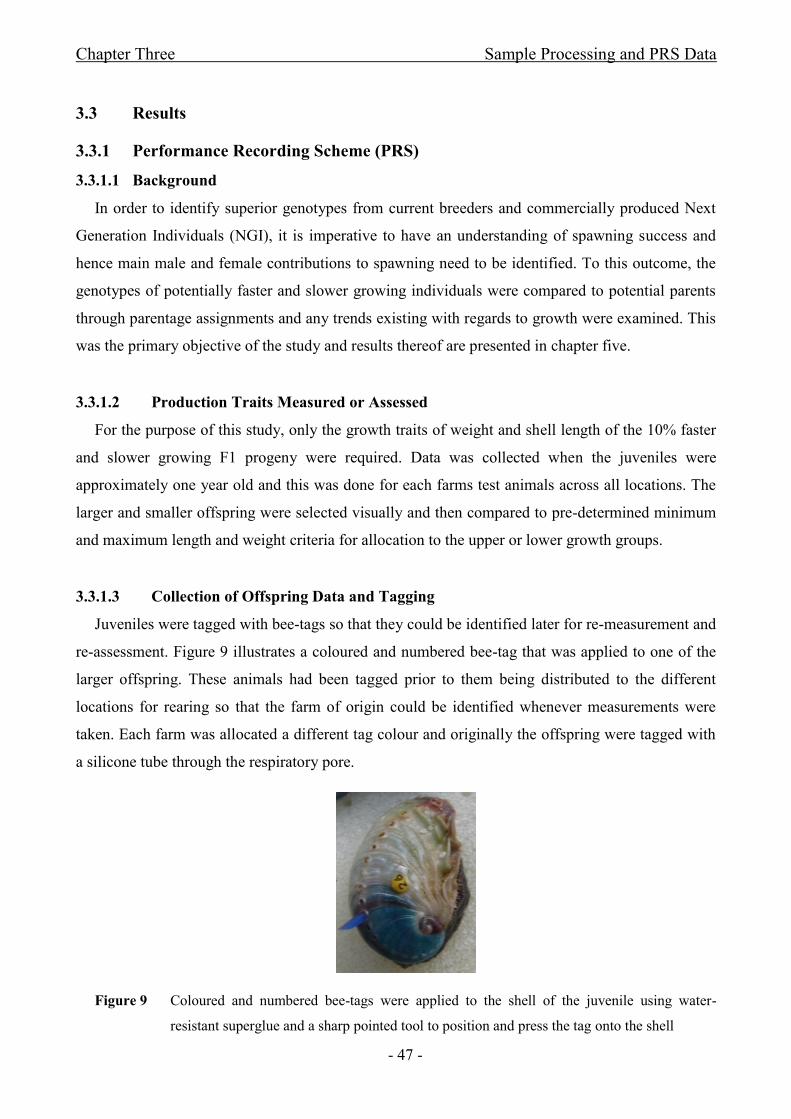
Figure 9 Coloured and numbered bee-tags were applied to the shell of the juvenile using
water-resistant superglue and a sharp pointed tool to position and press the tag onto the shell...- 47 -
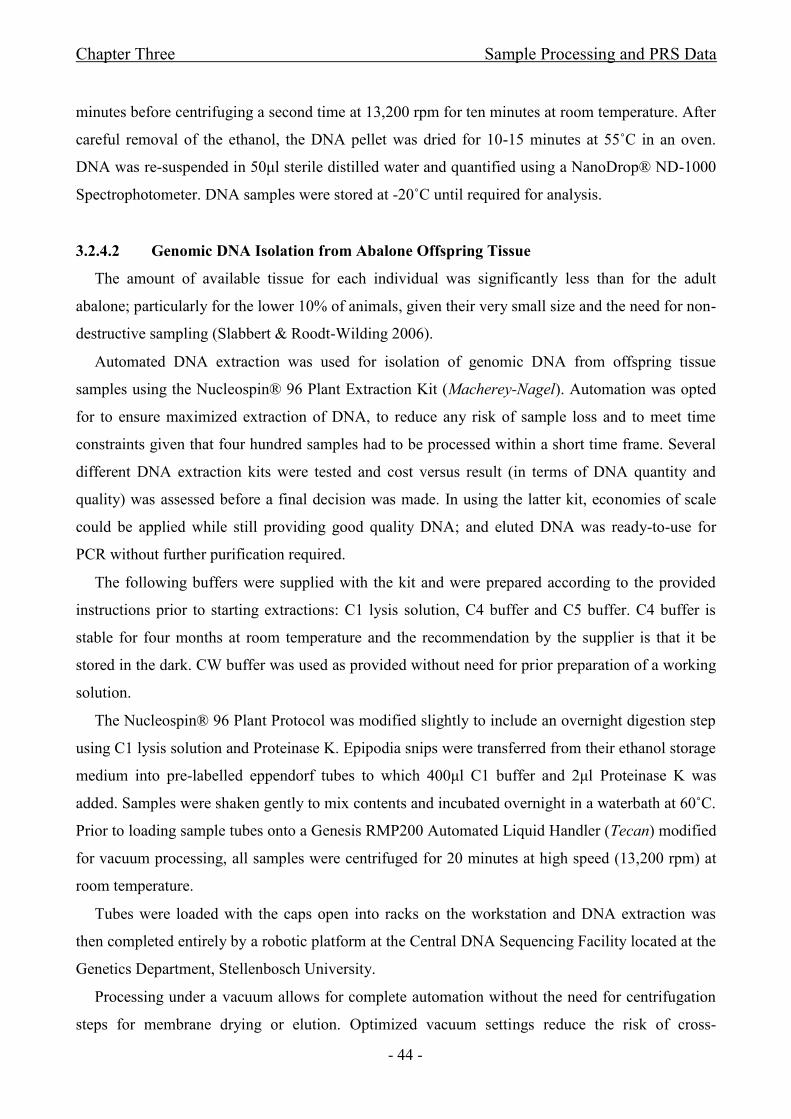
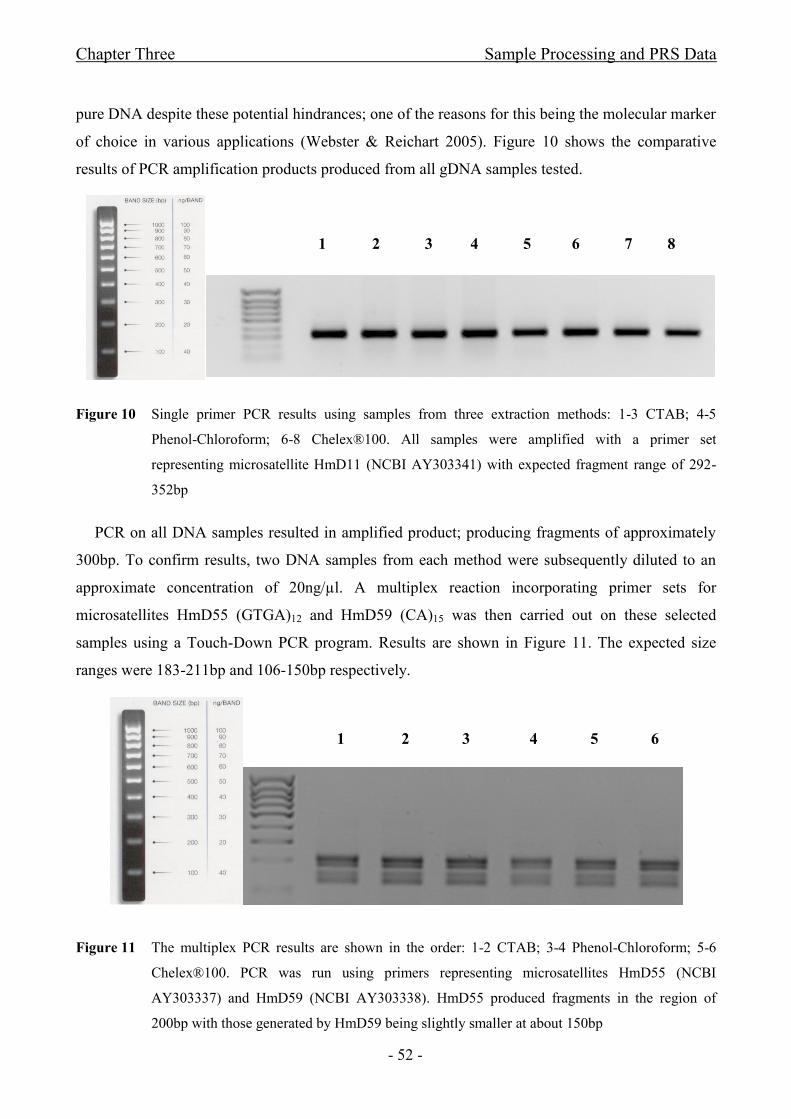
Figure 10 Single primer PCR results using samples from three extraction methods: 1-3
CTAB; 4-5 Phenol-Chloroform; 6-8 Chelex®100. All samples were amplified with a primer set
representing microsatellite HmD11 (NCBI AY303341) with expected fragment range of 292-
352bp.............................................................................................................................................- 52 -
Stellenbosch University http://scholar.sun.ac.za
xvii
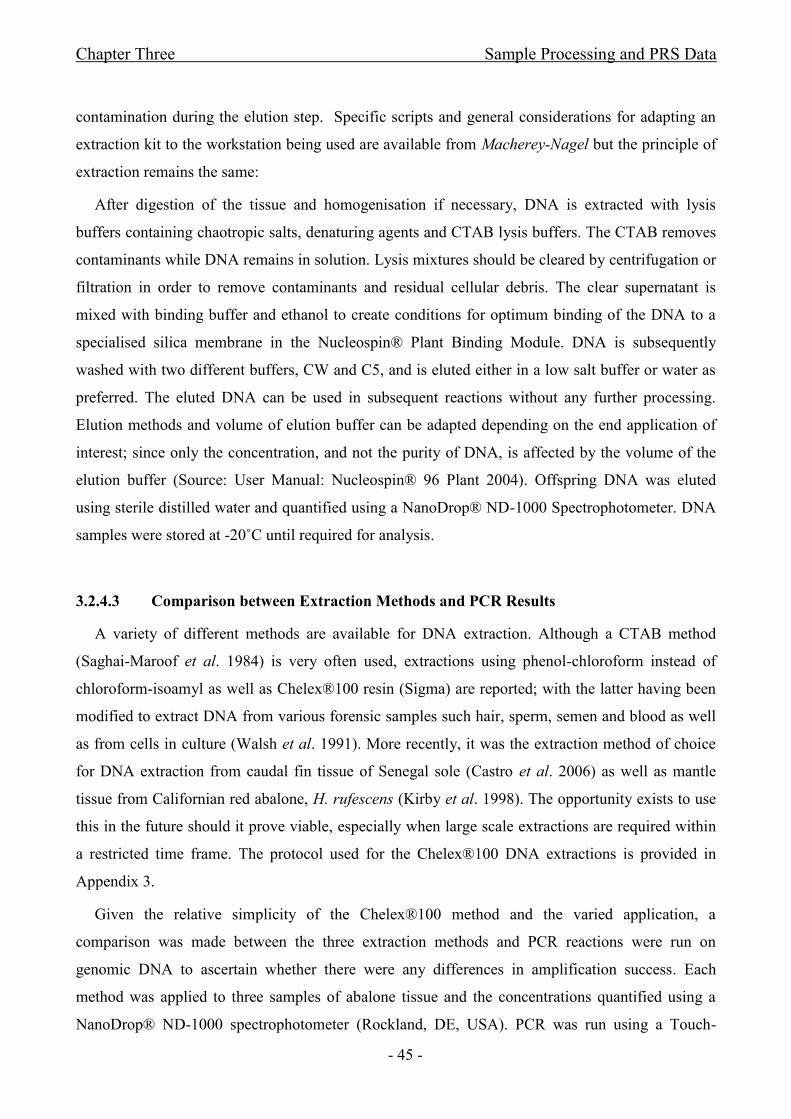
Figure 11 The multiplex PCR results are shown in the order: 1-2 CTAB; 3-4 Phenol-
Chloroform; 5-6 Chelex®100. PCR was run using primers representing microsatellites HmD55
(NCBI AY303337) and HmD59 (NCBI AY303338). HmD55 produced fragments in the region of
200bp with those generated by HmD59 being slightly smaller at about 150bp............................- 52 -
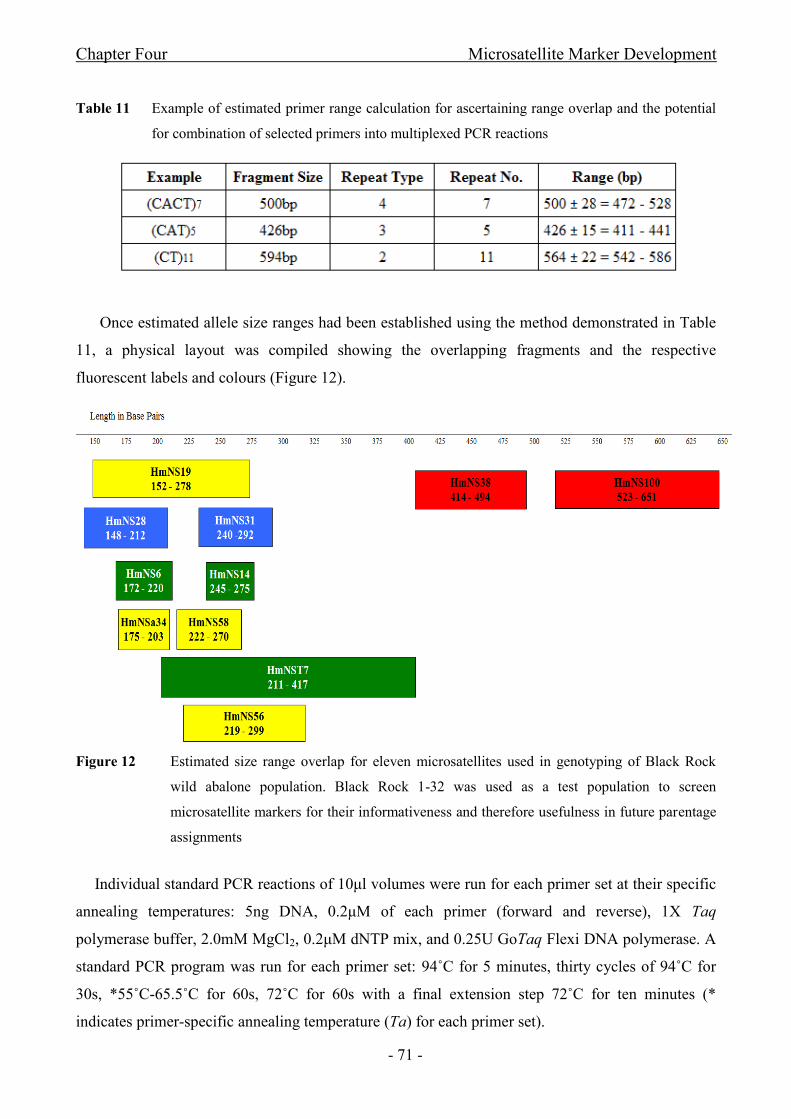
Figure 12 Estimated size range overlap for eleven microsatellites used in genotyping of Black
Rock wild abalone population. Black Rock 1-32 was used as a test population to screen
microsatellite markers for their informativeness and therefore usefulness in future parentage
assignments....................................................................................................................................- 71 -
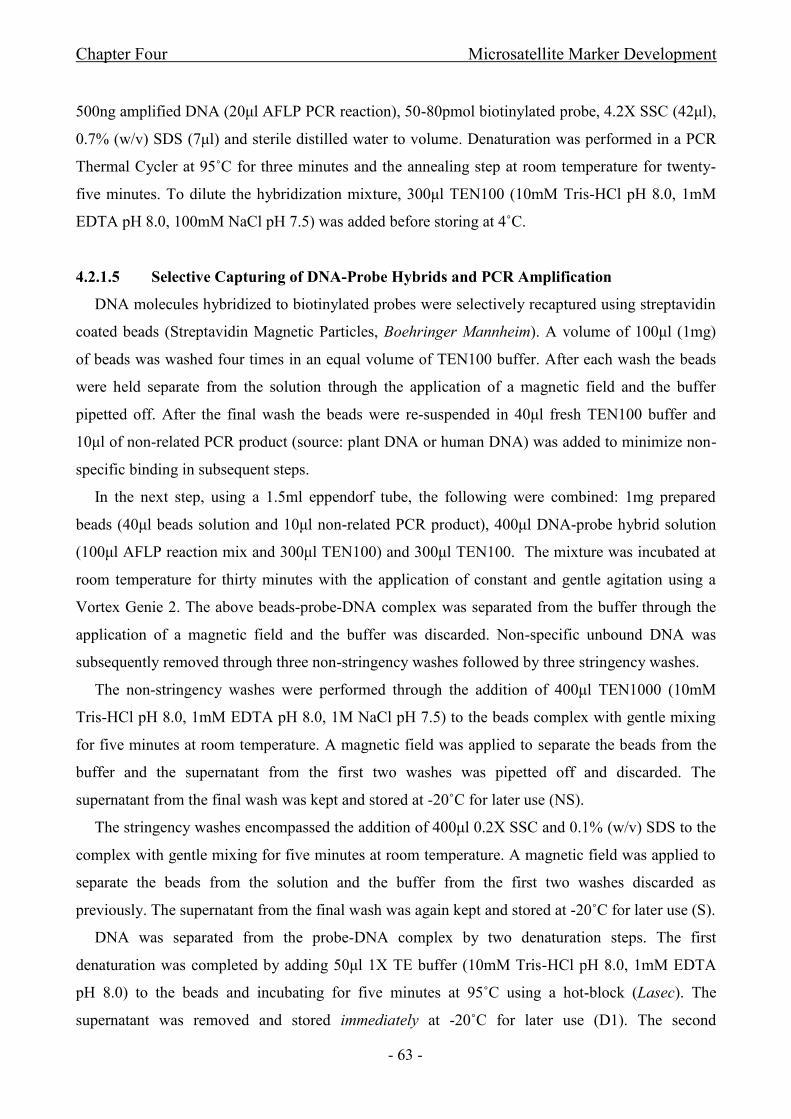
Figure 13 Genomic DNA from Individuals 9 and 37 collected from Gansbaai (2003) digested
with restriction enzyme MseI and ligated with MseI-adaptors. PCR was completed using a MseI-N
primer cocktail...............................................................................................................................- 74 -
Figure 14 Supernatants NS, S, D1 and D2 amplified by PCR using MseI-N primers. Genomic
DNA of individual 21 collected at Witsand (2004) was enriched for a trinucleotide (CAA)-n.
Hyperladder IV indicates that the fragments are greater than 200bp............................................- 74 -
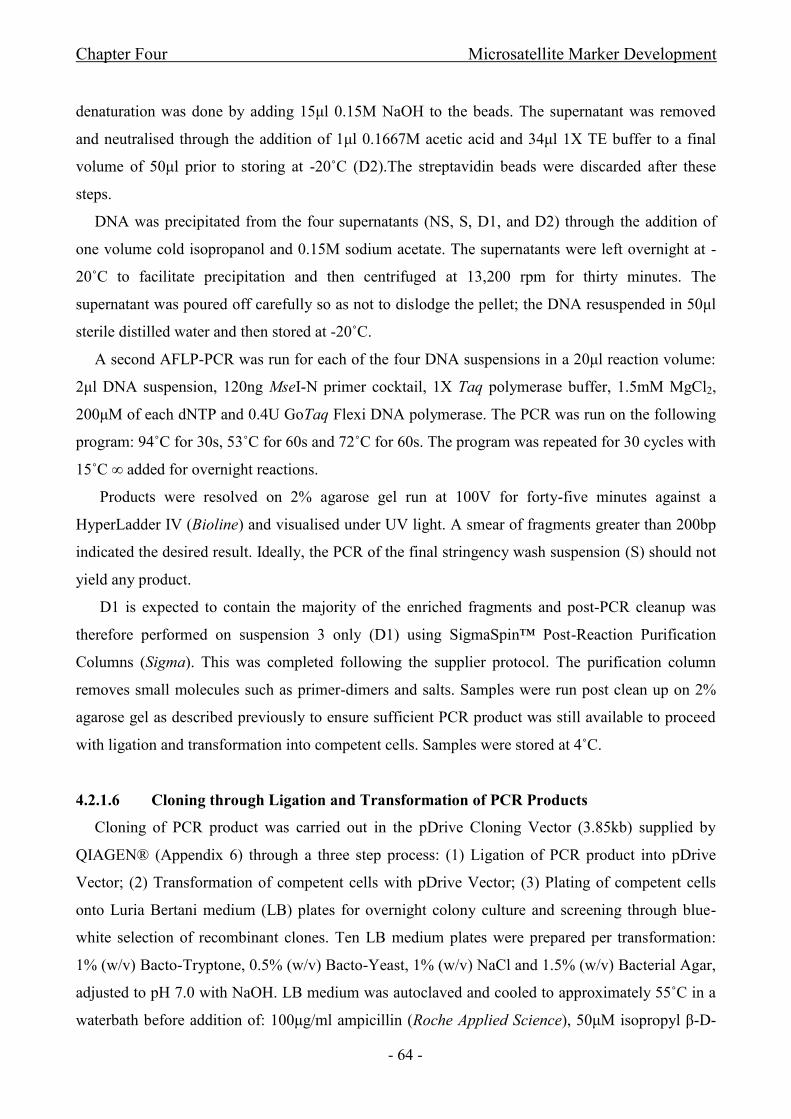
Figure 15 Blue-white selection for recombinant clones. An extra incubation at 4˚C was
applied to increase the intensity of the blue colour thus aiding the identification of positive (white)
clones given the low density of recombinants...............................................................................- 75 -
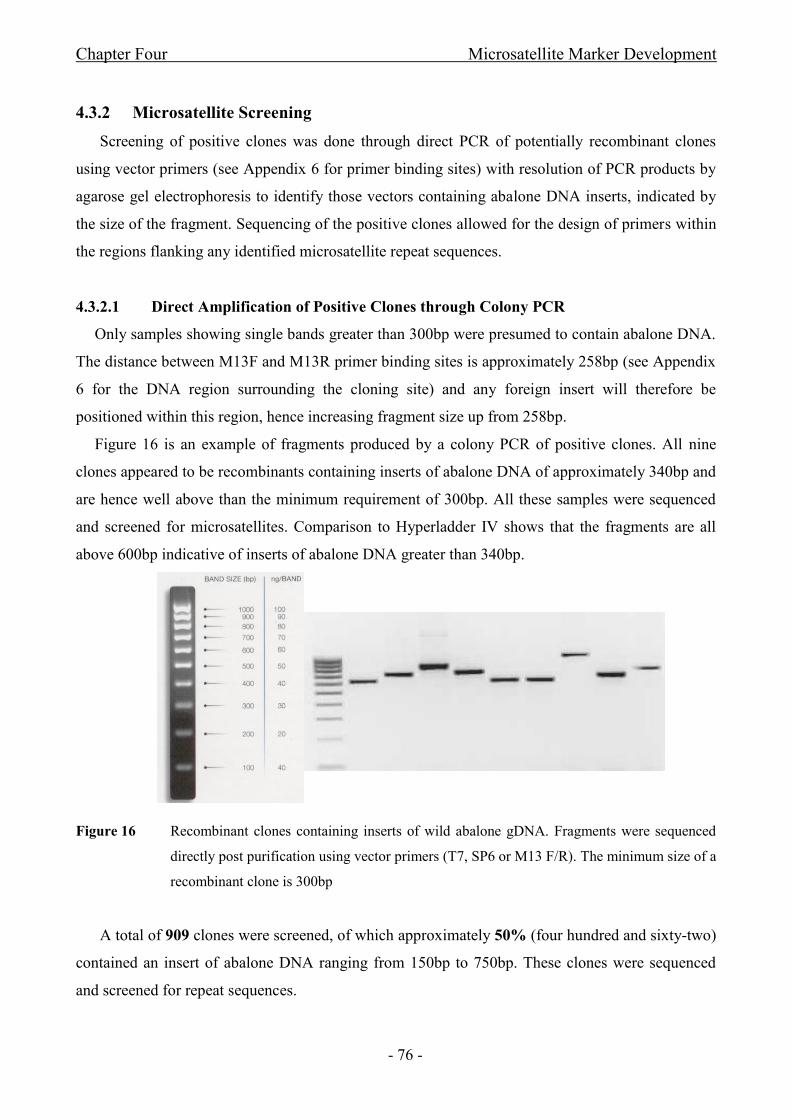
Figure 16 Recombinant clones containing inserts of wild abalone gDNA. Fragments were
sequenced directly post purification using vector primers (T7, SP6 or M13 F/R). The minimum size
of a recombinant clone is 300bp....................................................................................................- 76 -
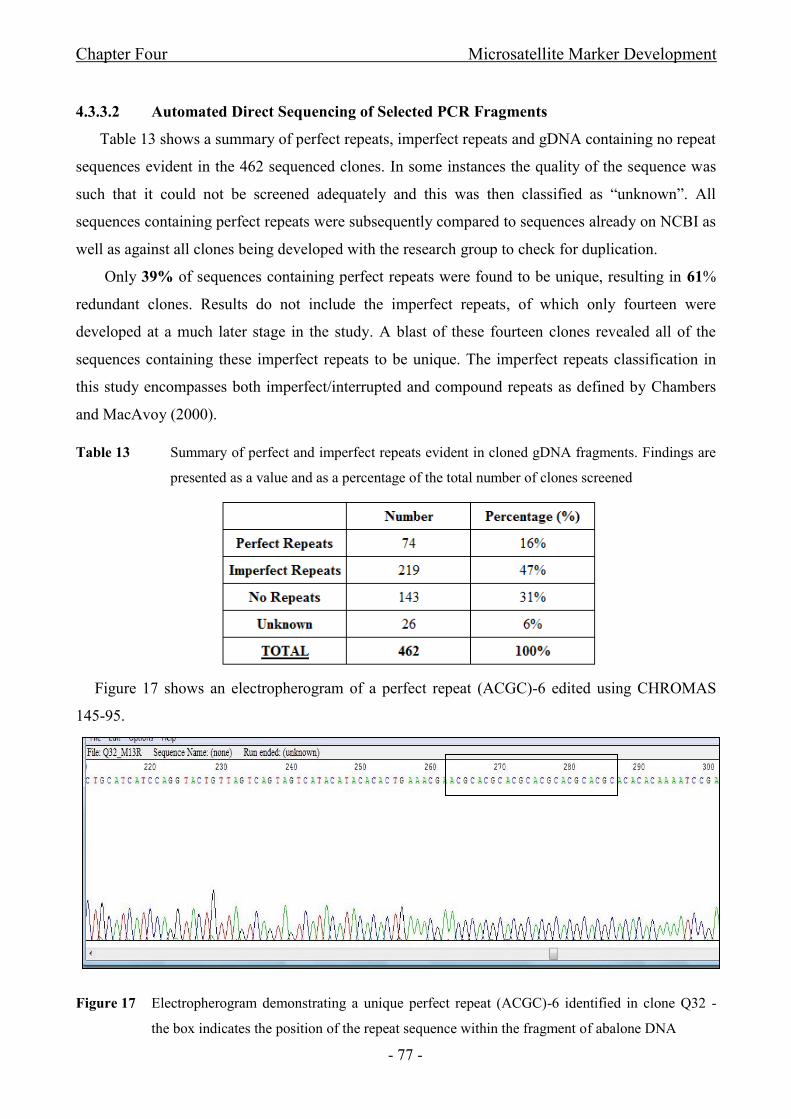
Figure 17 Electropherogram demonstrating a unique perfect repeat (ACGC)-6 identified in
clone Q32 - the box indicates the position of the repeat sequence within the fragment of abalone
DNA...............................................................................................................................................- 77 -
Figure 18 PCR products generated for Black Rock individuals 1-8 by (a) monomorphic
marker HmNS26R (GTA)-6 and (b) polymorphic marker HmNS6T (ACGC)-6..........................- 79 -
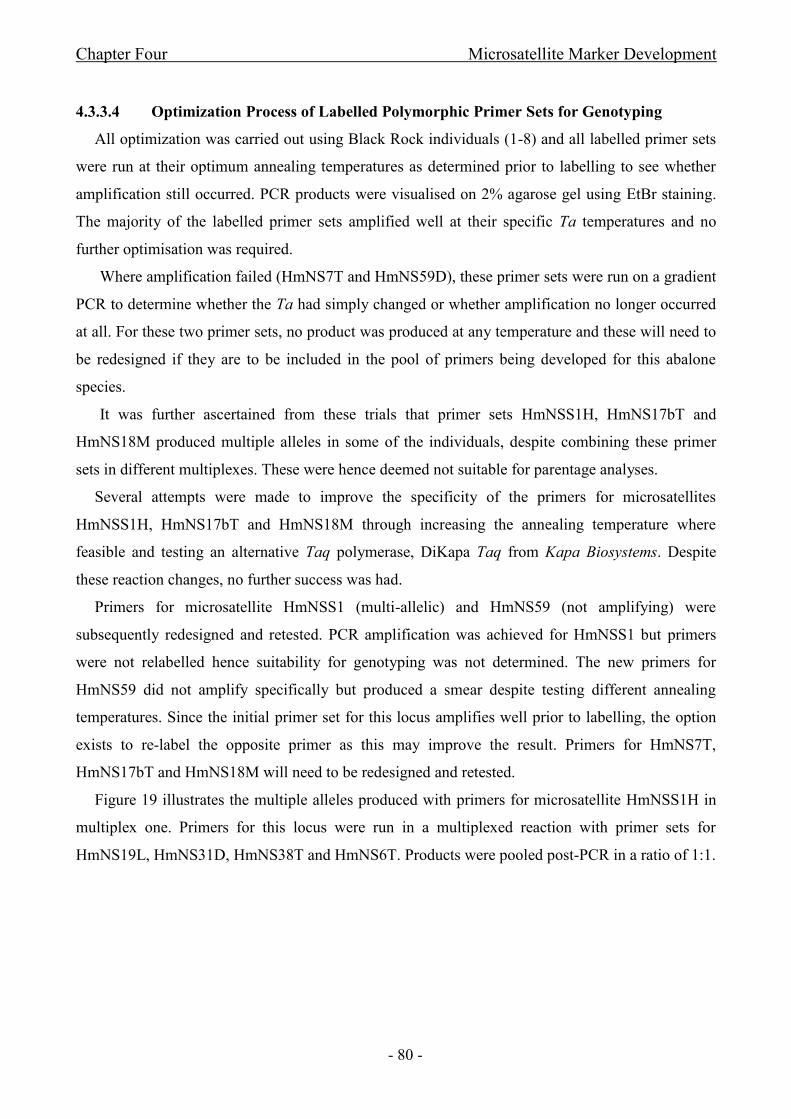
Figure 19 Multiple alleles for microsatellite HmNSS1H. Panels indicate Black Rock
individuals 1-4 with the multiple alleles indicated by means of red circles - 81 -
Stellenbosch University http://scholar.sun.ac.za
xviii
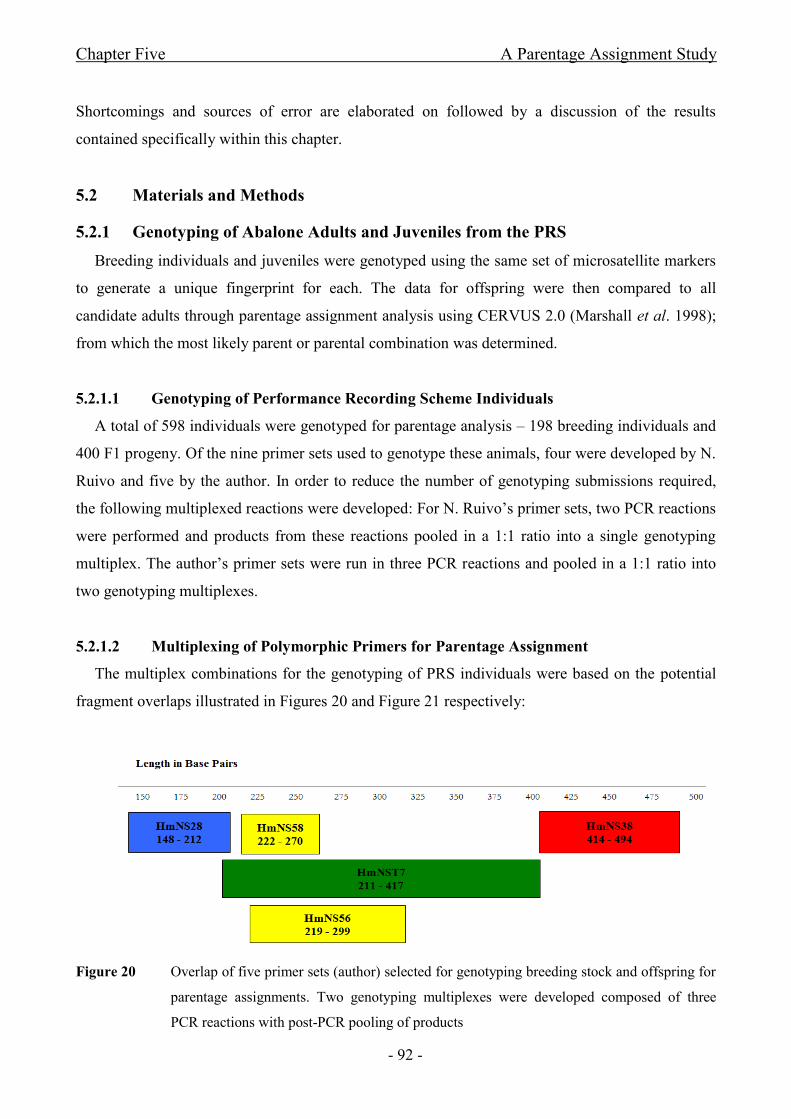
Figure 20 Overlap of five primer sets (author) selected for genotyping breeding stock and
offspring for parentage assignments. Two genotyping multiplexes were developed composed of
three PCR reactions with post-PCR pooling of products..............................................................- 92 -
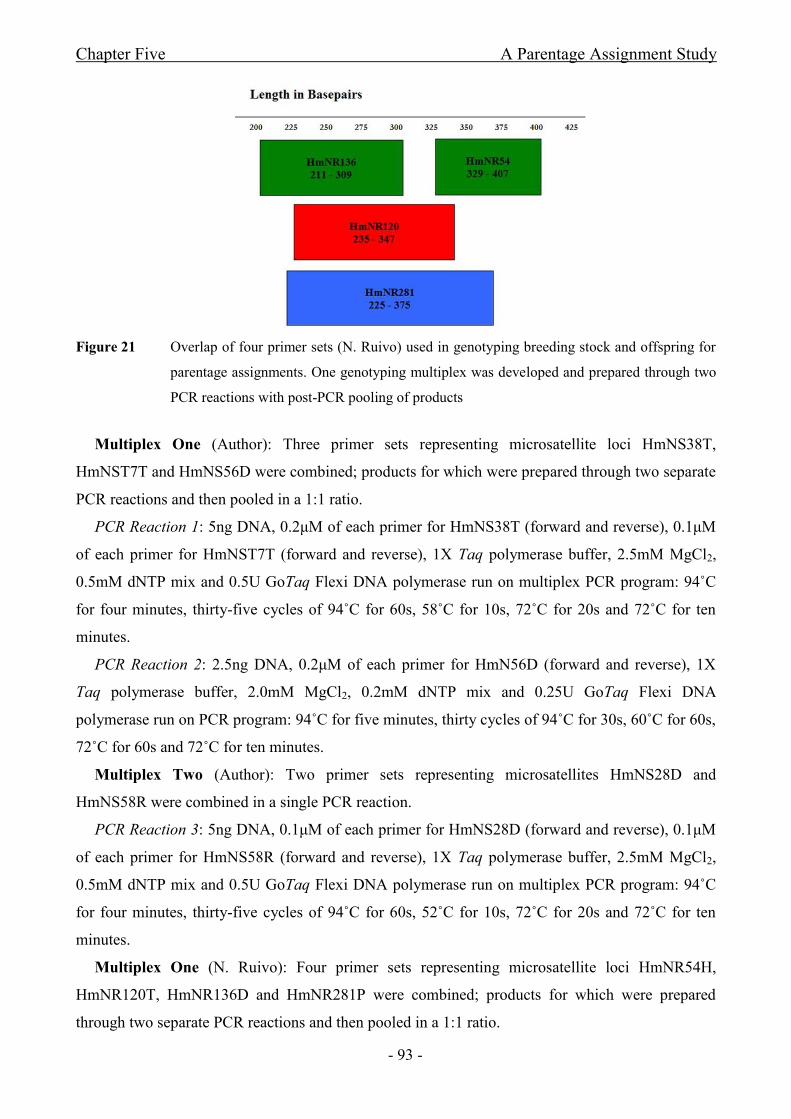
Figure 21 Overlap of four primer sets (N. Ruivo) used in genotyping breeding stock and
offspring for parentage assignments. One genotyping multiplex was developed and prepared
through two PCR reactions with post-PCR pooling of products...................................................- 93 -
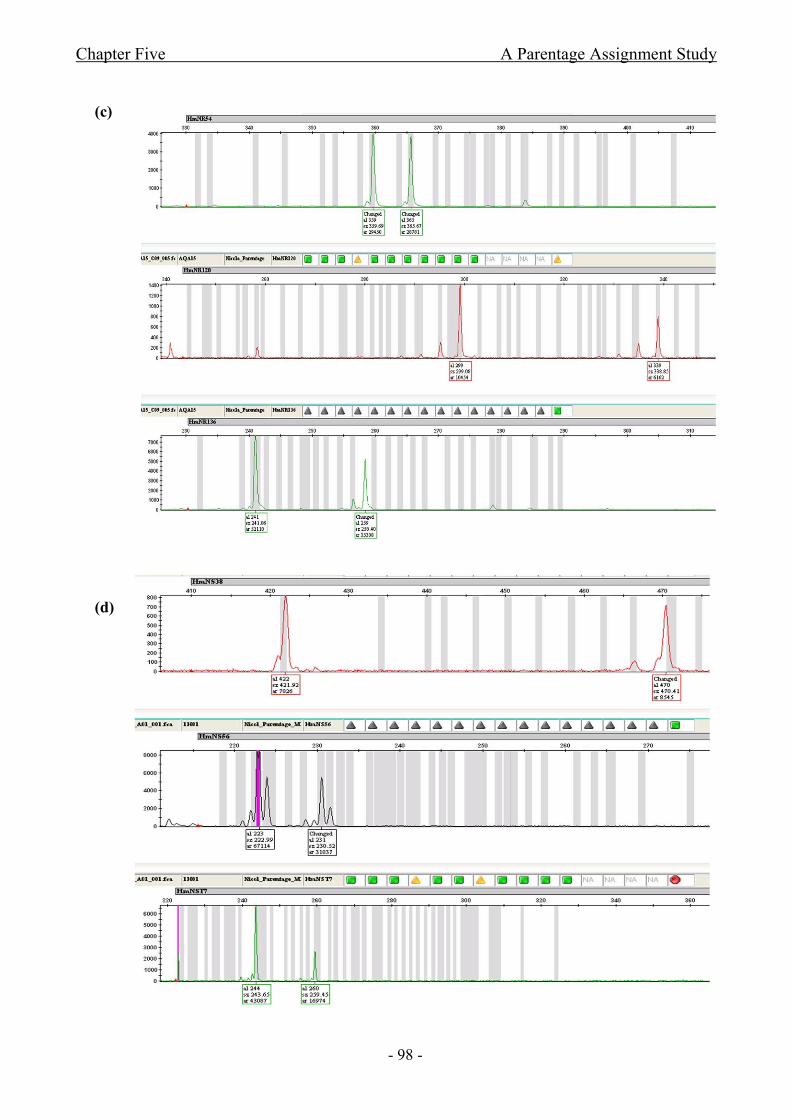
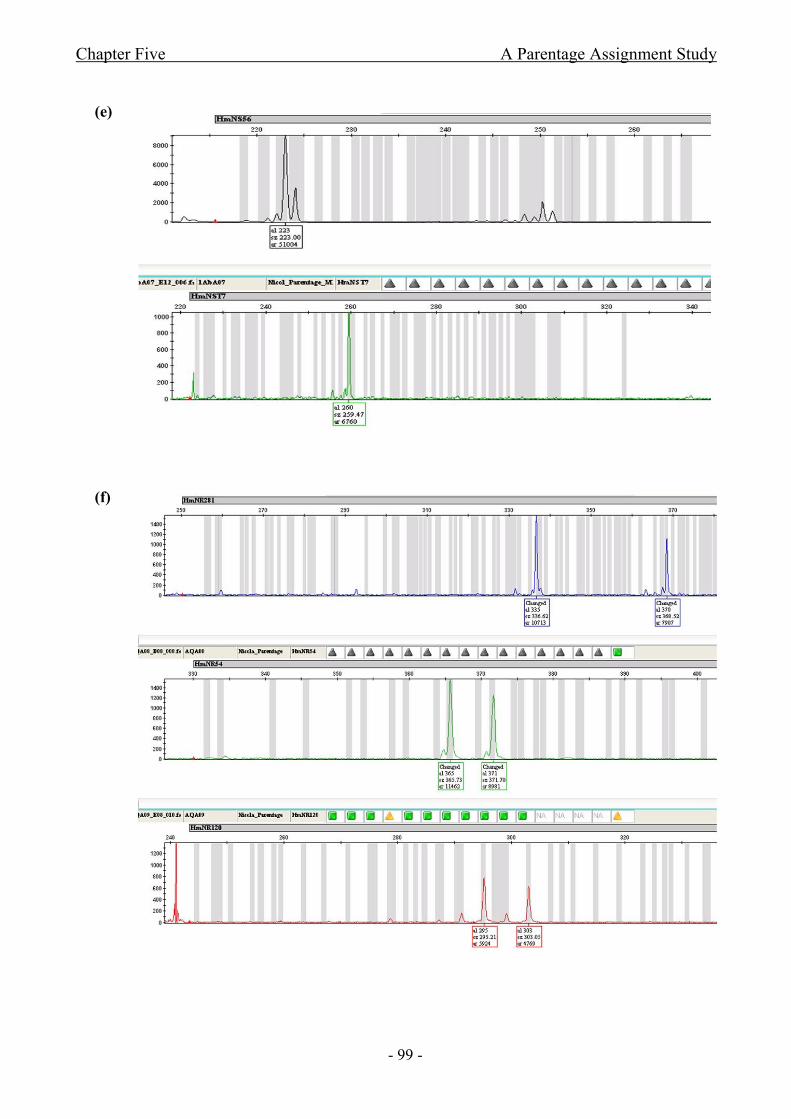
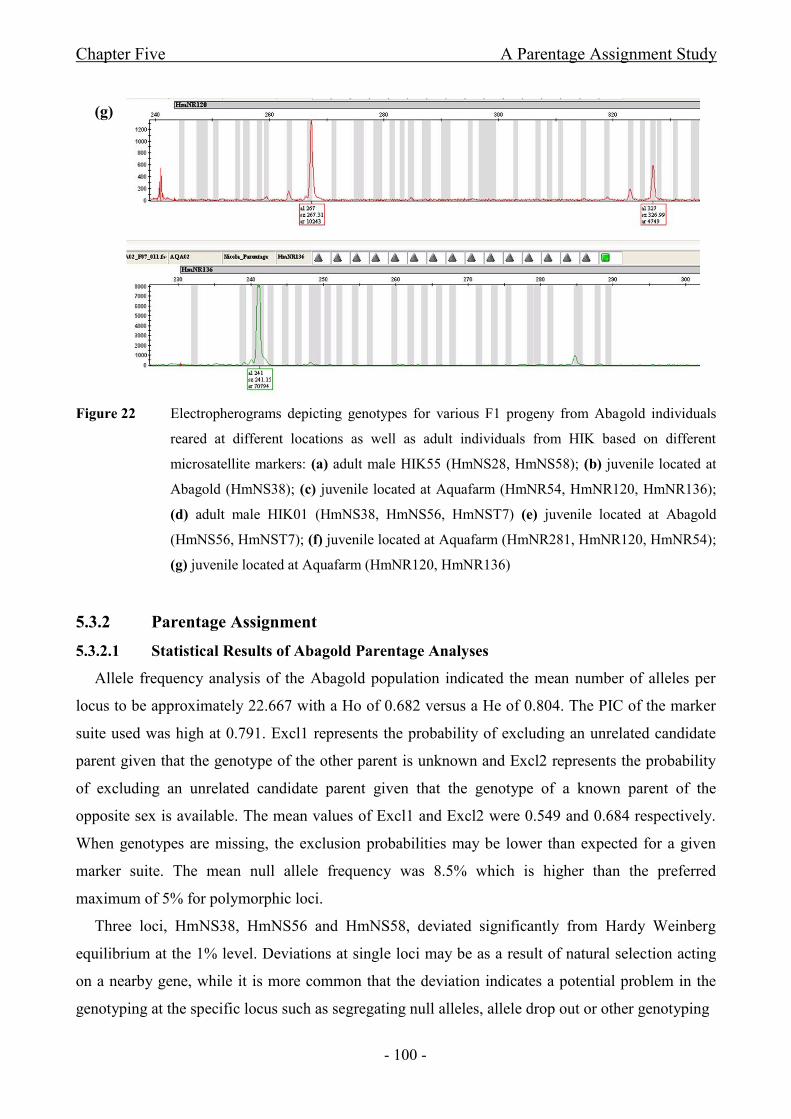
Figure 22 Electropherograms depicting genotypes for various F1 progeny from Abagold
individuals reared at different locations as well as adult individuals from HIK based on different
microsatellite markers: (a) Adult male HIK55; (b) Juvenile located at Abagold; (c) Juvenile located
at Aquafarm; (d) Adult male HIK01 (e) Juvenile located at Abagold; (f) Juvenile located at
Aquafarm; (g) Juvenile located at Aquafarm..............................................................................- 100 -
Figure 23 Percentage of F1 progeny (Abagold) assigned either to a single parent pair, a
mother only or a father only while the remaining individuals remained unassigned. Assignment was
completed at a genotyping error rate of 1%.................................................................................- 102 -
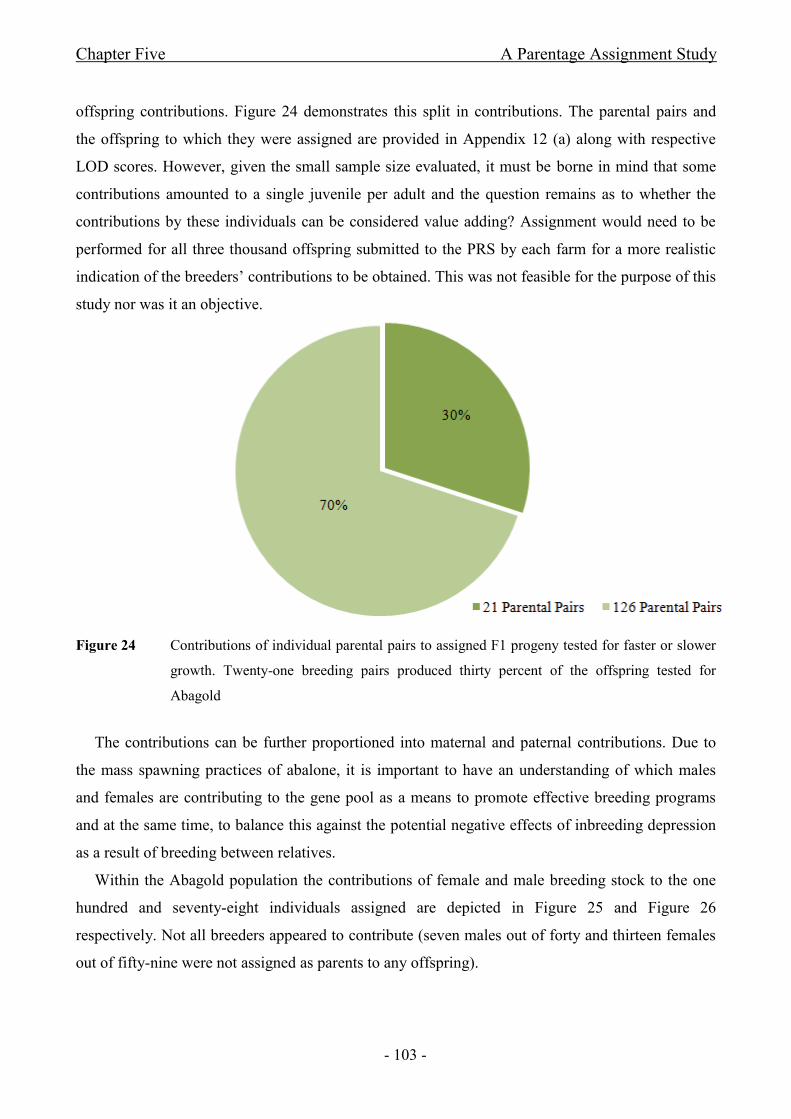
Figure 24 Contributions of individual parental pairs to assigned F1 progeny tested for faster or
slower growth. Twenty-one breeding pairs produced thirty percent of the offspring tested for
Abagold........................................................................................................................................- 103 -
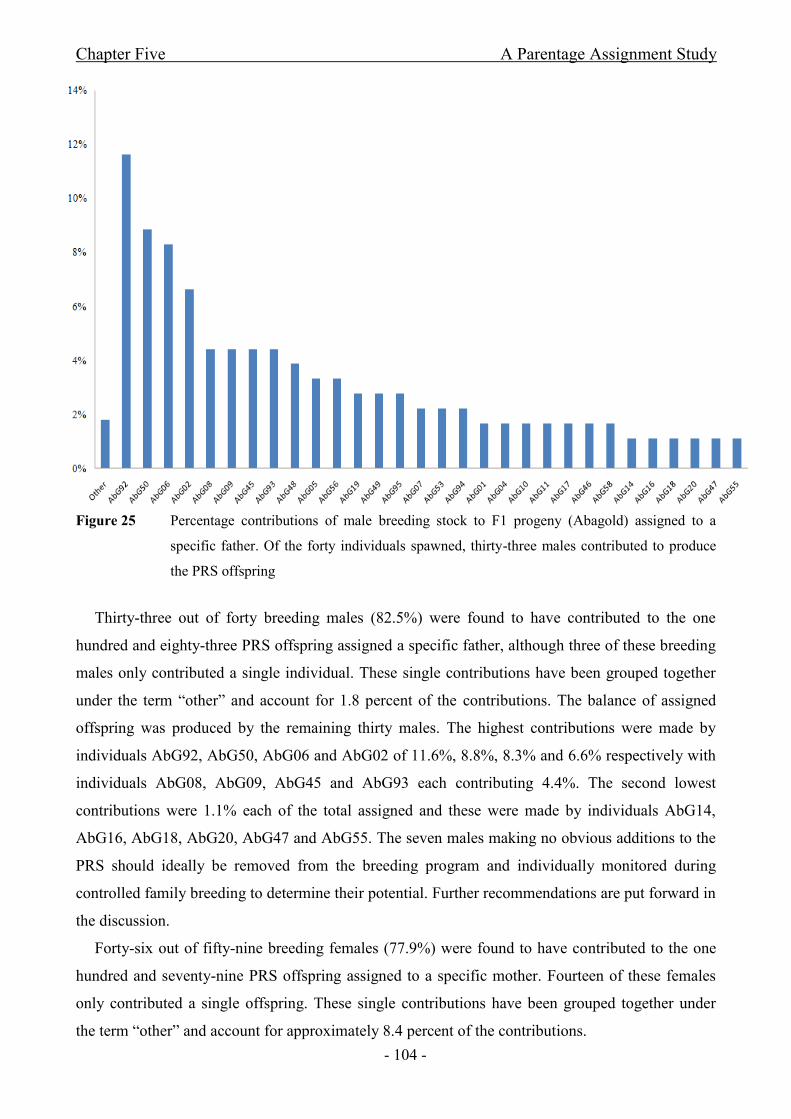
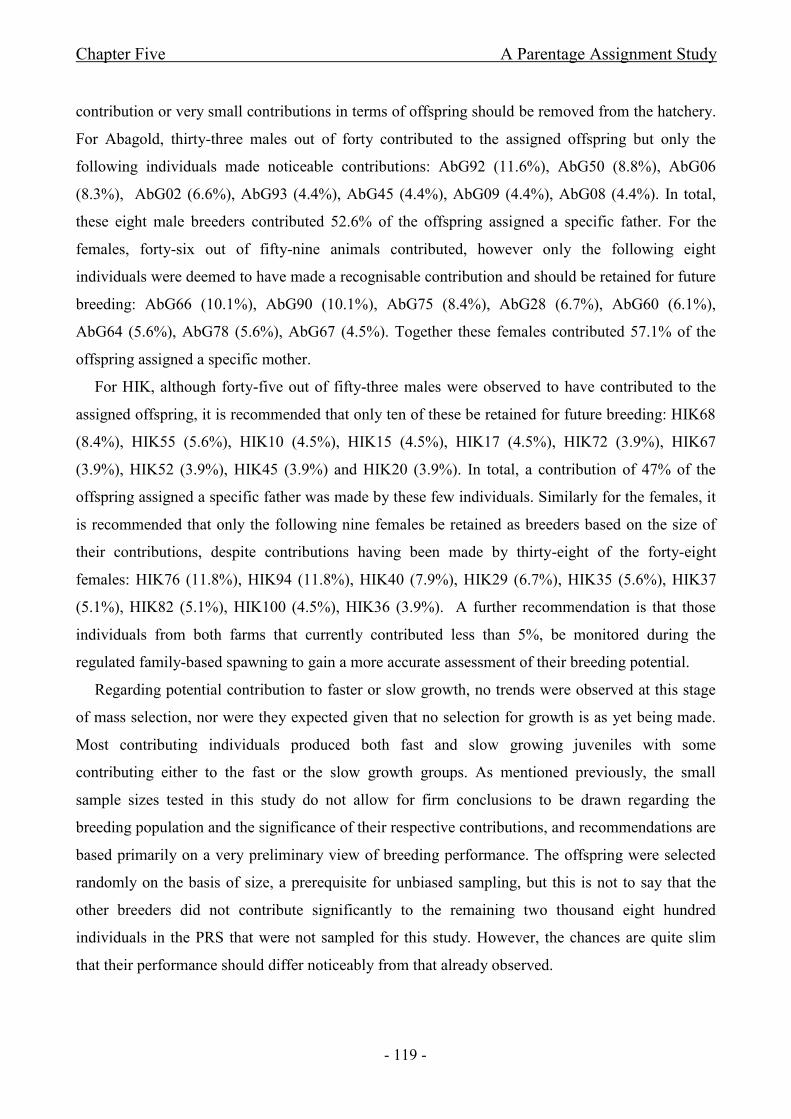
Figure 25 Percentage contributions of male breeding stock to F1 progeny (Abagold)
assigned to a specific father. Of the forty individuals spawned, thirty-three males contributed to
produce the PRS offspring...........................................................................................................- 104 -
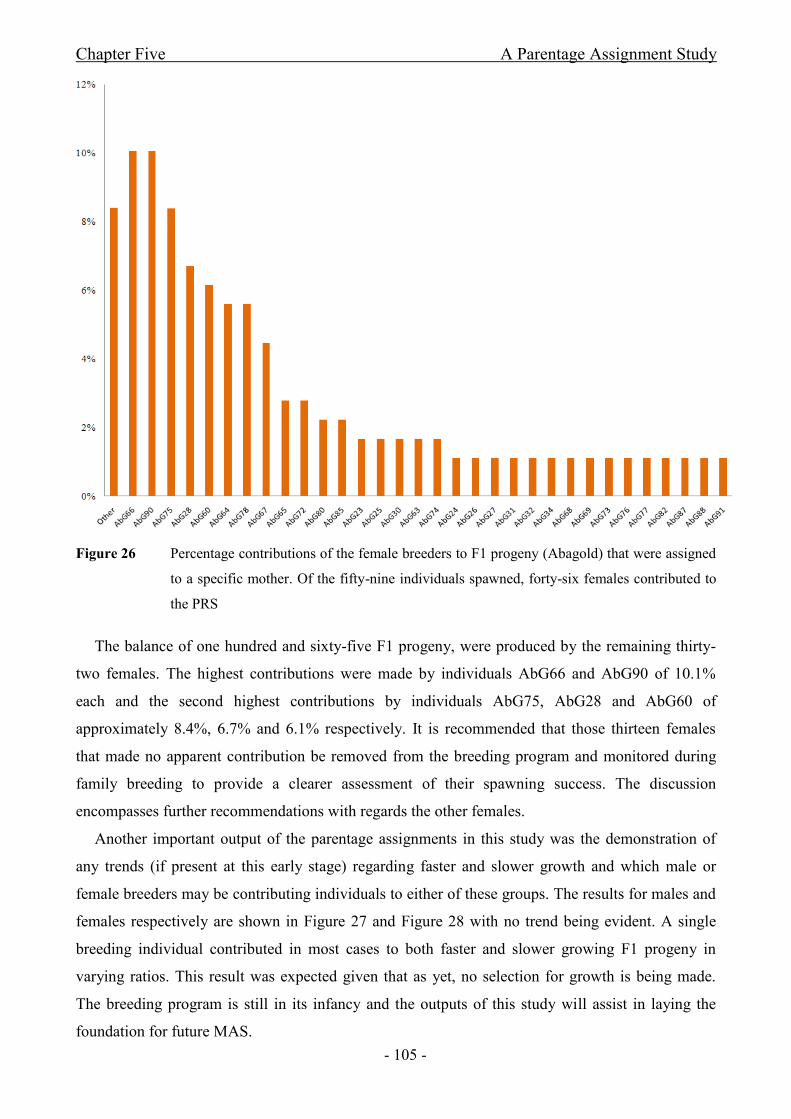
Figure 26 Percentage contributions of the female breeders to F1 progeny (Abagold) that were
assigned to a specific mother. Of the fifty-nine individuals spawned, forty-six females contributed
to the PRS....................................................................................................................................- 105 -
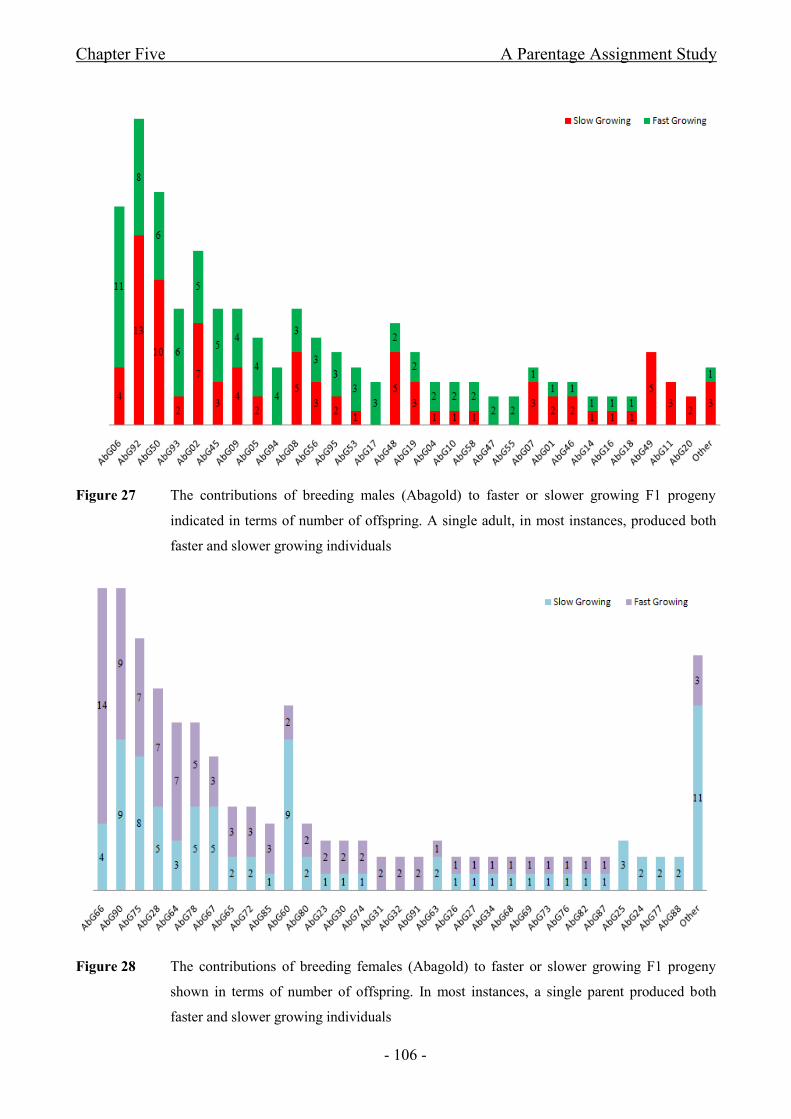
Figure 27 The contributions of breeding males (Abagold) to faster or slower growing F1
progeny indicated in terms of number of offspring. A single adult, in most instances, produced both
faster and slower growing individuals.........................................................................................- 106 -
Stellenbosch University http://scholar.sun.ac.za
xix
Figure 28 The contributions of breeding females (Abagold) to faster or slower growing F1
progeny shown in terms of number of offspring. In most instances, a single parent produced both
faster and slower growing individuals.........................................................................................- 106 -
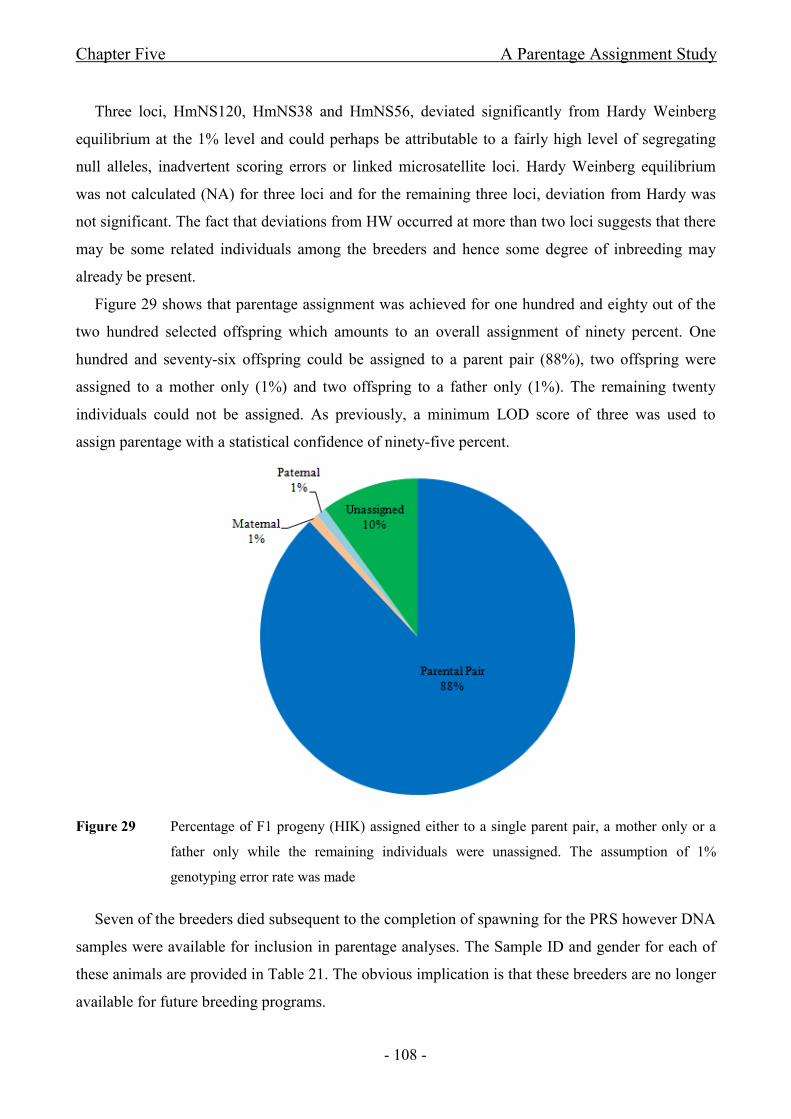
Figure 29 Percentage of F1 progeny (HIK) assigned either to a single parent pair, a mother
only or a father only while the remaining individuals were unassigned. The assumption of 1%
genotyping error rate was made...................................................................................................- 108 -
Figure 30 Contributions of individual parental pairs to assigned F1 progeny (HIK) selected for
faster or slower growth. Twenty-one breeding pairs produced just over twenty-eight percent of the
offspring tested for HIK...............................................................................................................- 110 -
Figure 31 Percentage contributions of male breeding stock (HIK) to the F1 progeny assigned
to a specific father. Of the fifty-three individuals spawned, forty-five males contributed to produce
the PRS offspring.........................................................................................................................- 110 -
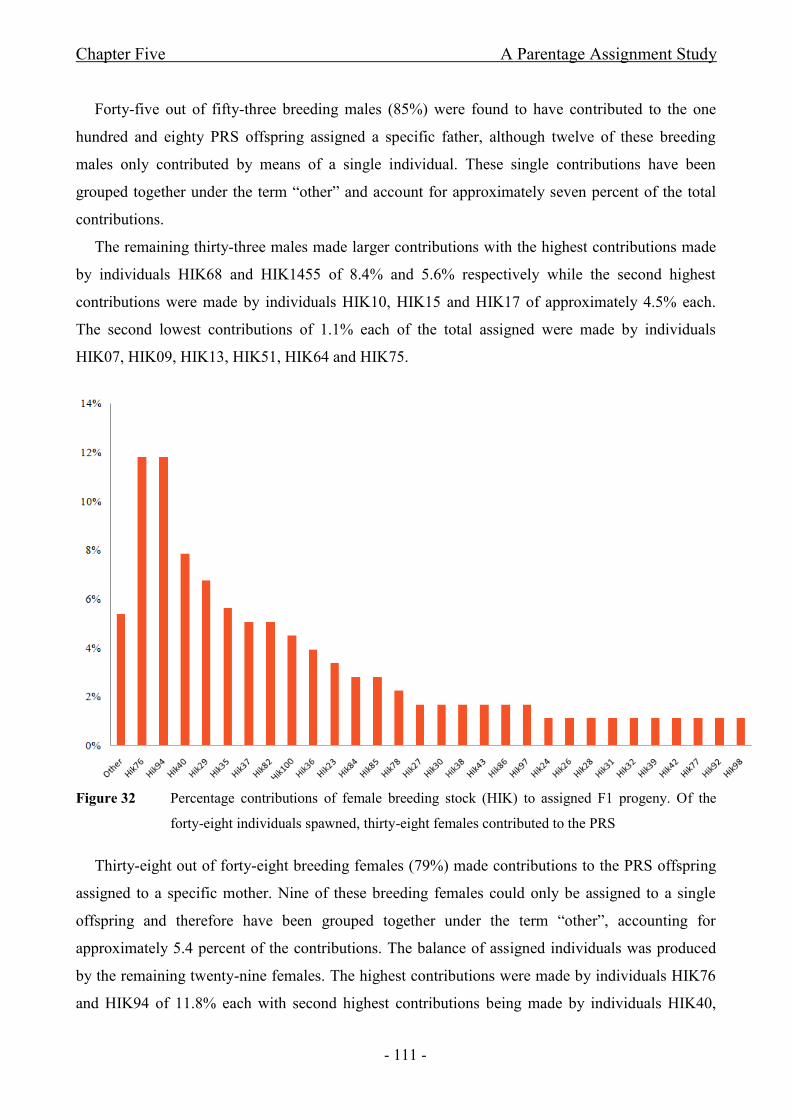
Figure 32 Percentage contributions of female breeding stock (HIK) to assigned F1 progeny.
Of the forty-eight individuals spawned, thirty-eight females contributed to the PRS.................- 111 -
Figure 33 Contributions of breeding males (HIK) to faster or slower growing offspring
indicated in terms of number of offspring. In the majority, both faster and slower growing
individuals were produced by a single adult................................................................................- 112 -
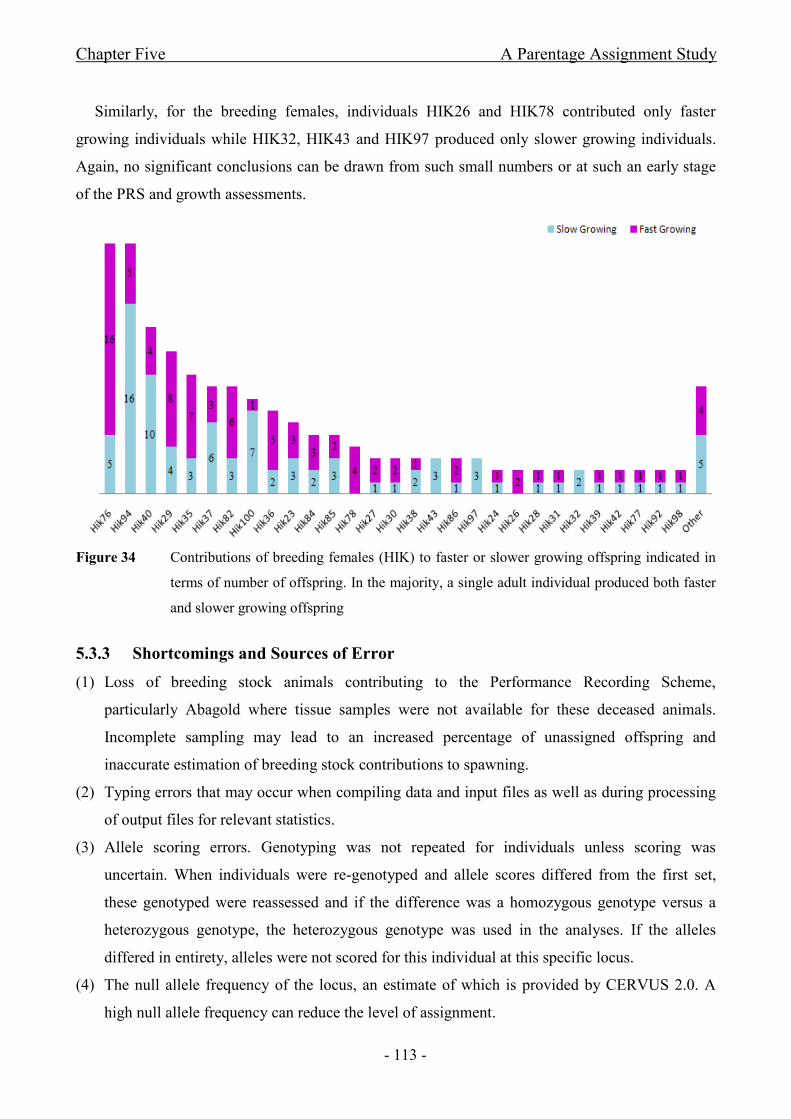
Figure 34 Contributions of breeding females (HIK) to faster or slower growing offspring
indicated in terms of number of offspring. In the majority, a single adult individual produced both
faster and slower growing offspring..............................................................................................- 113
-
Stellenbosch University http://scholar.sun.ac.za

xx
List of Tables
Table 1 Summary of the status of genetic improvement of Haliotis midae in relation to aquaculture in
general as well as to other abalone species around the world ....................................................................... - 3 -
Table 2 Taxonomic classification of Haliotis midae ........................................................................ - 8 -
Table 3 Twelve commercially cultivated Haliotid species occur throughout the world and are listed
with the species names (scientific and common) and origins ..................................................................... - 10 -
Table 4 Basic properties of molecular markers and their major applications ................................ - 19 -
Table 5 Distribution of male and female adults across Spawning Groups: 1, 2 and 3 .................... - 39 -
Table 6 Distribution of male and female adults across Spawning Groups: B and C ....................... - 39 -
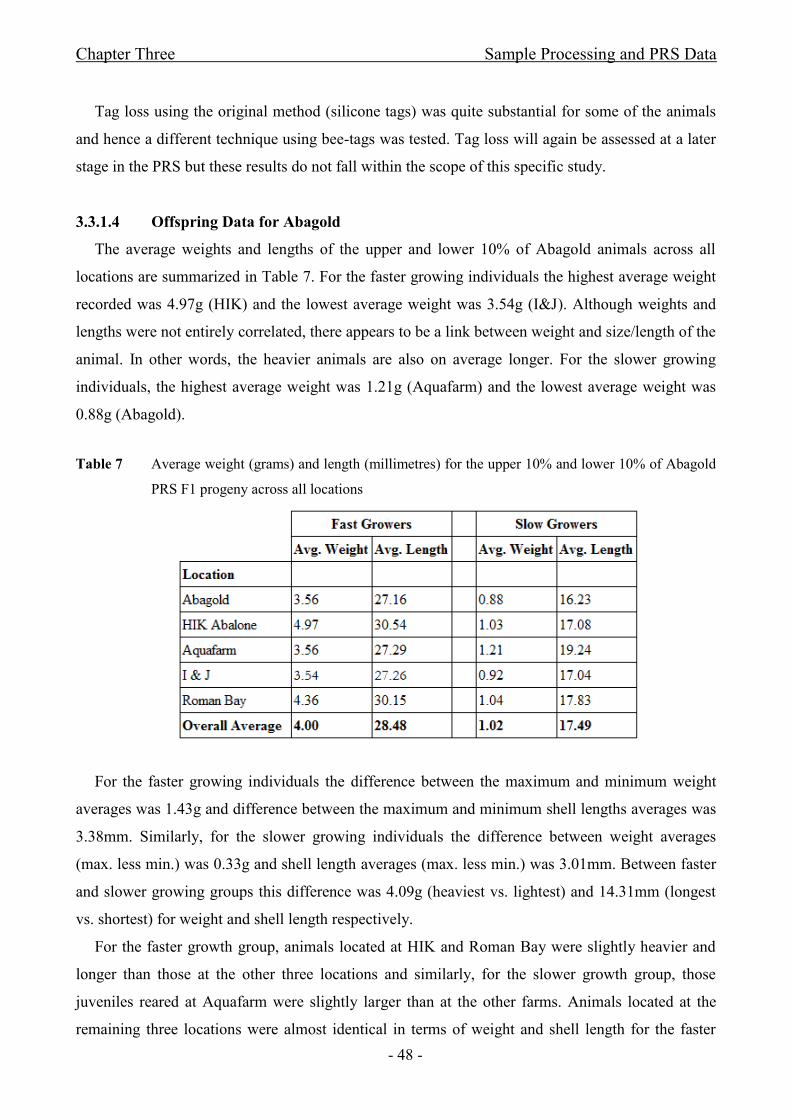
Table 7 Average weight and length for the upper 10% and lower 10% of Abagold PRS F1 progeny
across all locations....................................................................................................................................... - 48 -
Table 8 Average weight and length for the upper 10% and lower 10% of HIK PRS F1 progeny across
all locations..................... ............................................................................................................................. - 49 -
Table 9 Concentration and genomic DNA purity comparison of three extraction methods tested..- 51 -
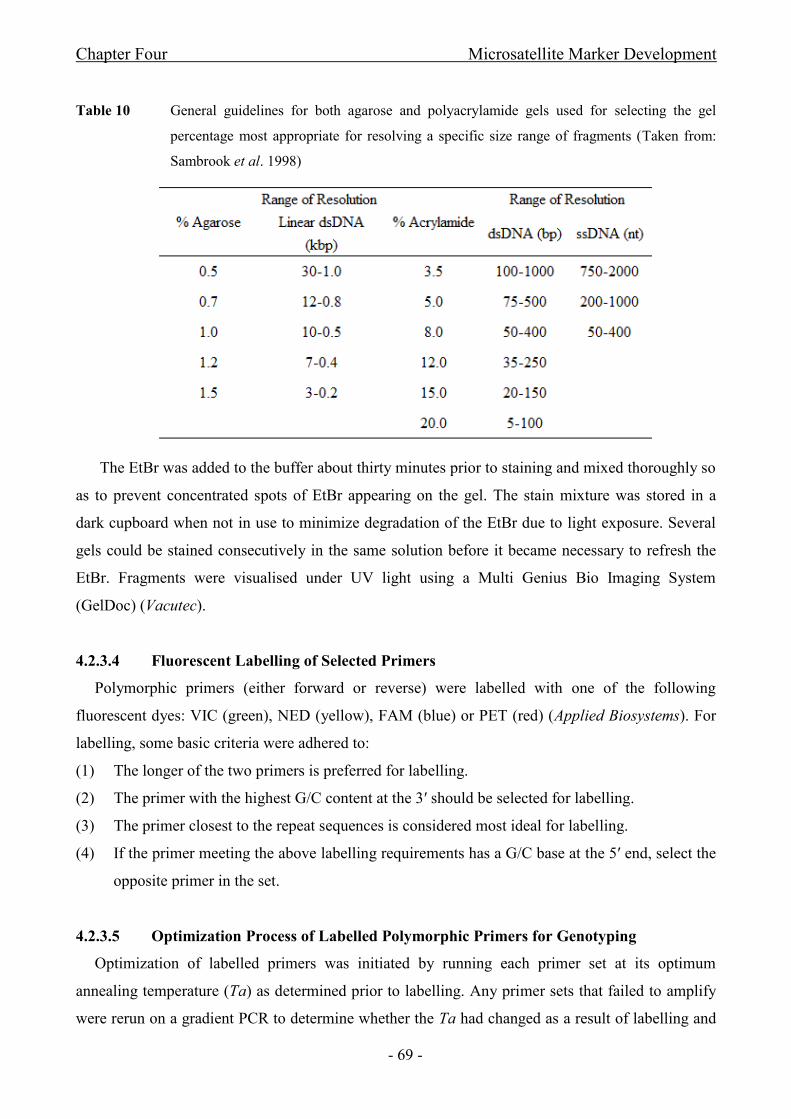
Table 10 General guidelines for both agarose and polyacrylamide gels used for selecting the gel
percentage most appropriate for resolving a specific size range of fragments............................................- 69 -
Table 11 Example of primer range calculation for ascertaining range overlap and the potential for
combination of selected primers into multiplexed PCR reactions .............................................................. - 71 -
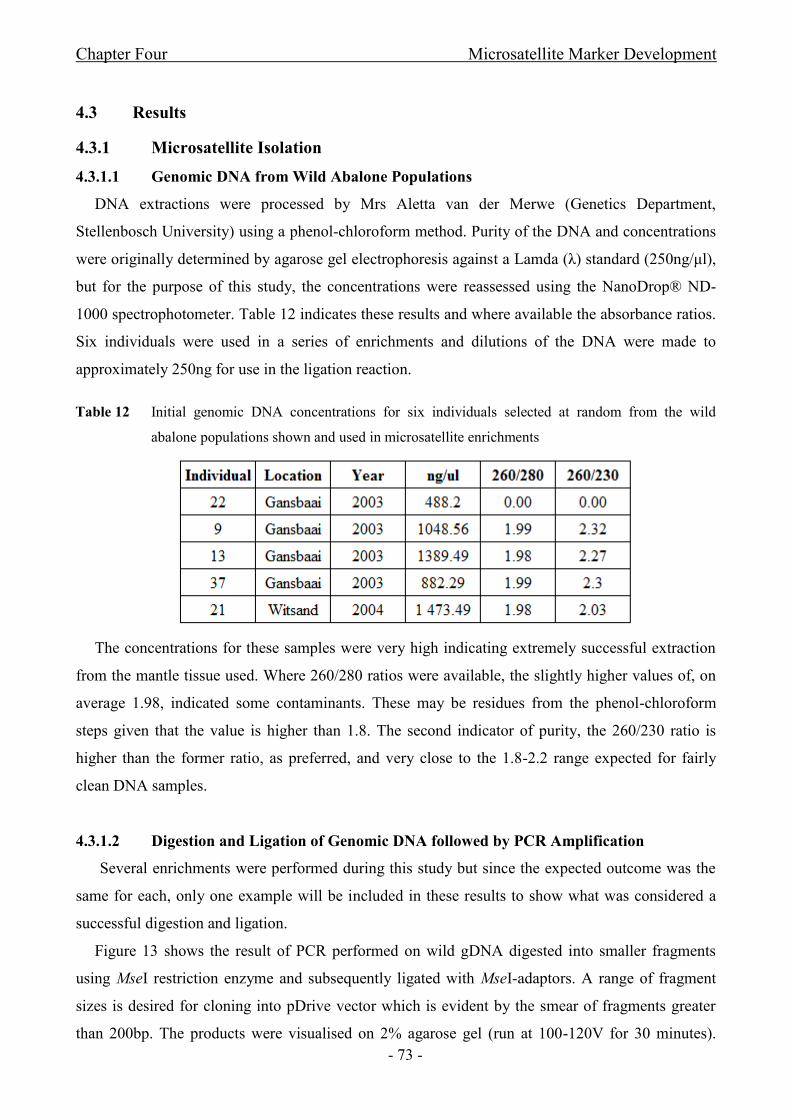
Table 12 Initial genomic DNA concentrations for six individuals selected at random from the wild
abalone populations shown and used in microsatellite enrichments ........................................................... - 73 -
Table 13 Summary of perfect and imperfect repeats evident in cloned gDNA fragments. Findings are
presented as a value and as a percentage of the total number of clones screened ....................................... - 77 -
Stellenbosch University http://scholar.sun.ac.za

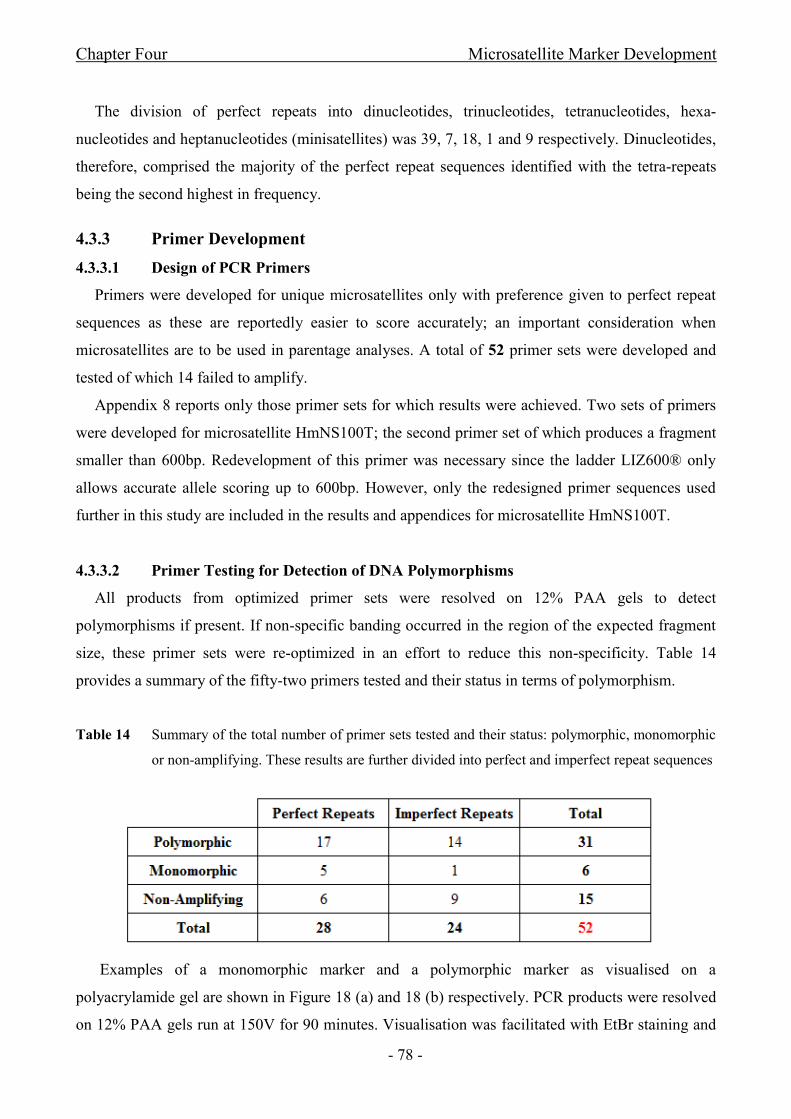
xxi
Table 14 Summary of the total number of primer sets tested and their status: polymorphic,
monomorphic or non-amplifying. These results are further divided into perfect and imperfect repeat
sequences............................... ...................................................................................................................... - 78 -
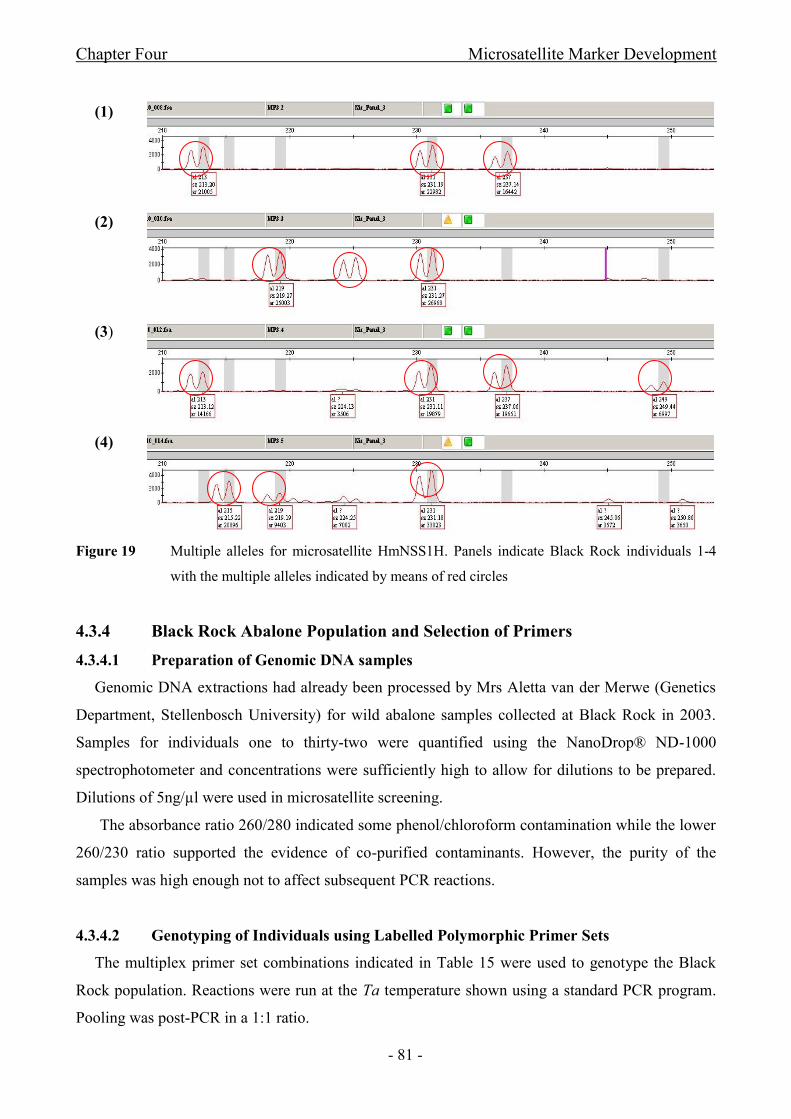
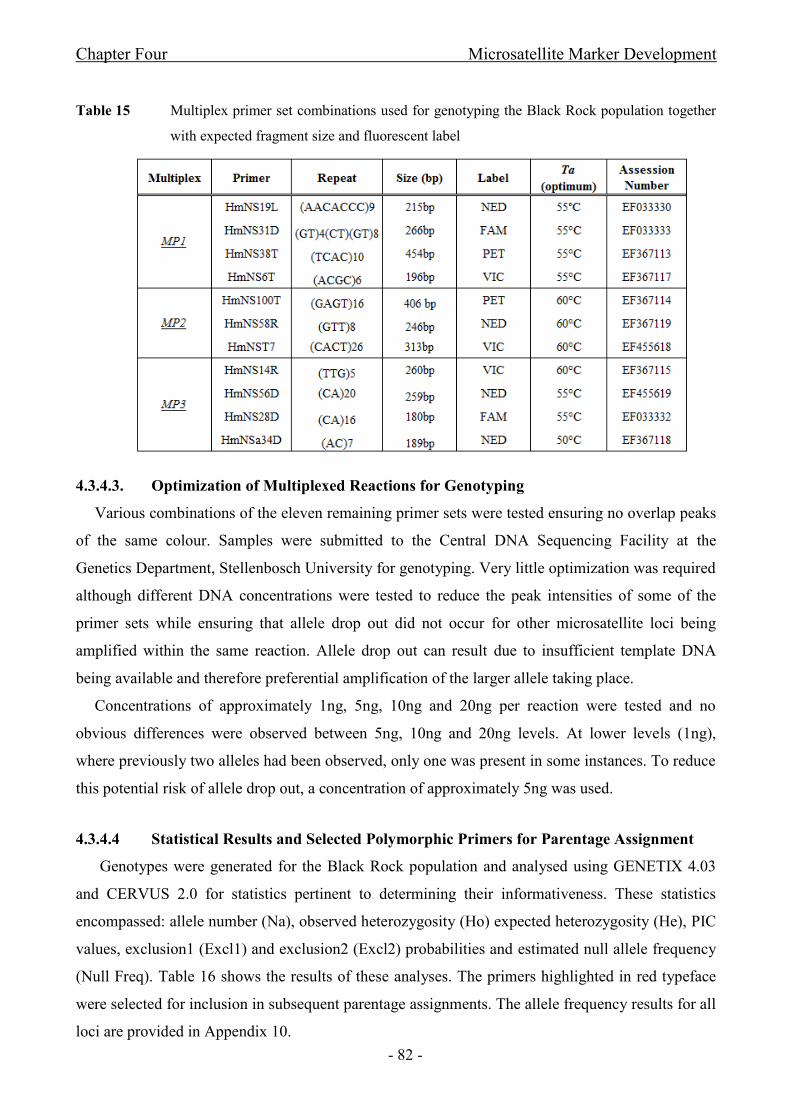
Table 15 Multiplex primer set combinations used for genotyping the Black Rock population together
with expected fragment size and fluorescent label ...................................................................................... - 82 -
Table 16 Statistical results from GENETIX 4.03 and CERVUS 2.0 based on genotype input files for
Black Rock individuals 1-32 ....................................................................................................................... - 83 -
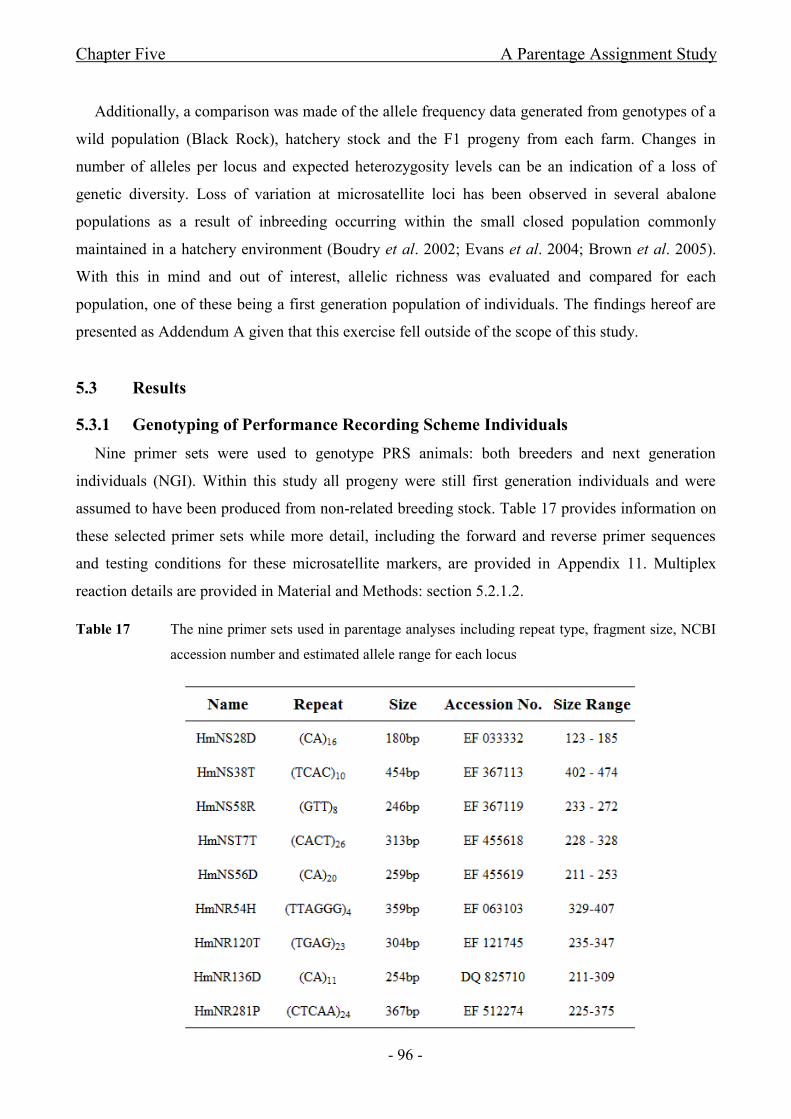
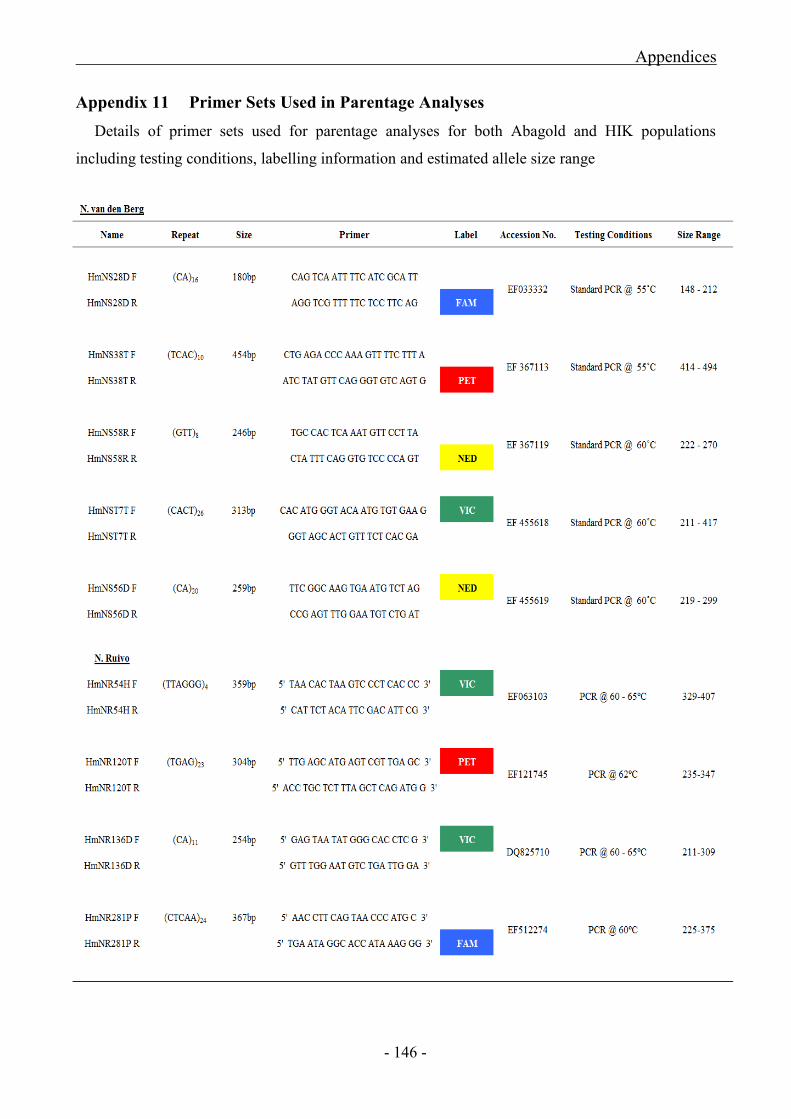
Table 17 The nine primer sets used in parentage analyses including repeat type, fragment size, NCBI
accession number and allele range for each locus ....................................................................................... - 96 -
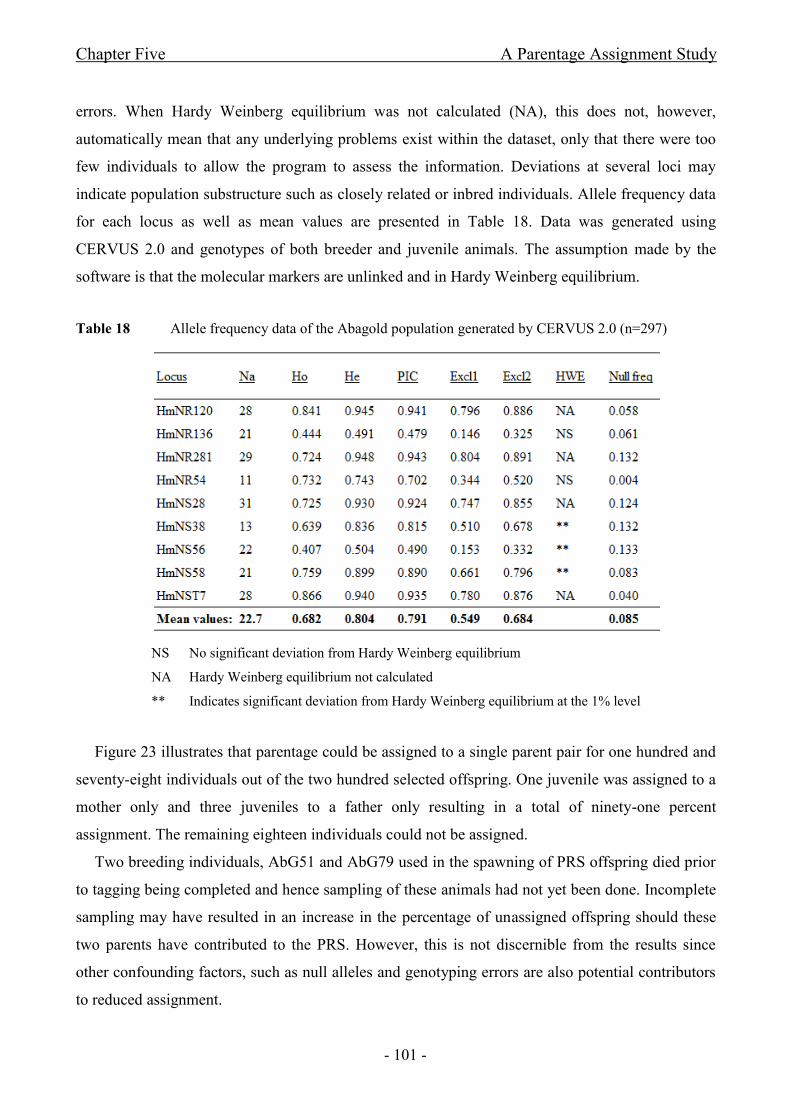
Table 18 Allele frequency data of the Abagold population generated by CERVUS 2.0 ............ - 101 -
Table 19 The minimum, maximum and average LOD scores determined for each level of parentage
assignment for Abagold ............................................................................................................................. - 102 -
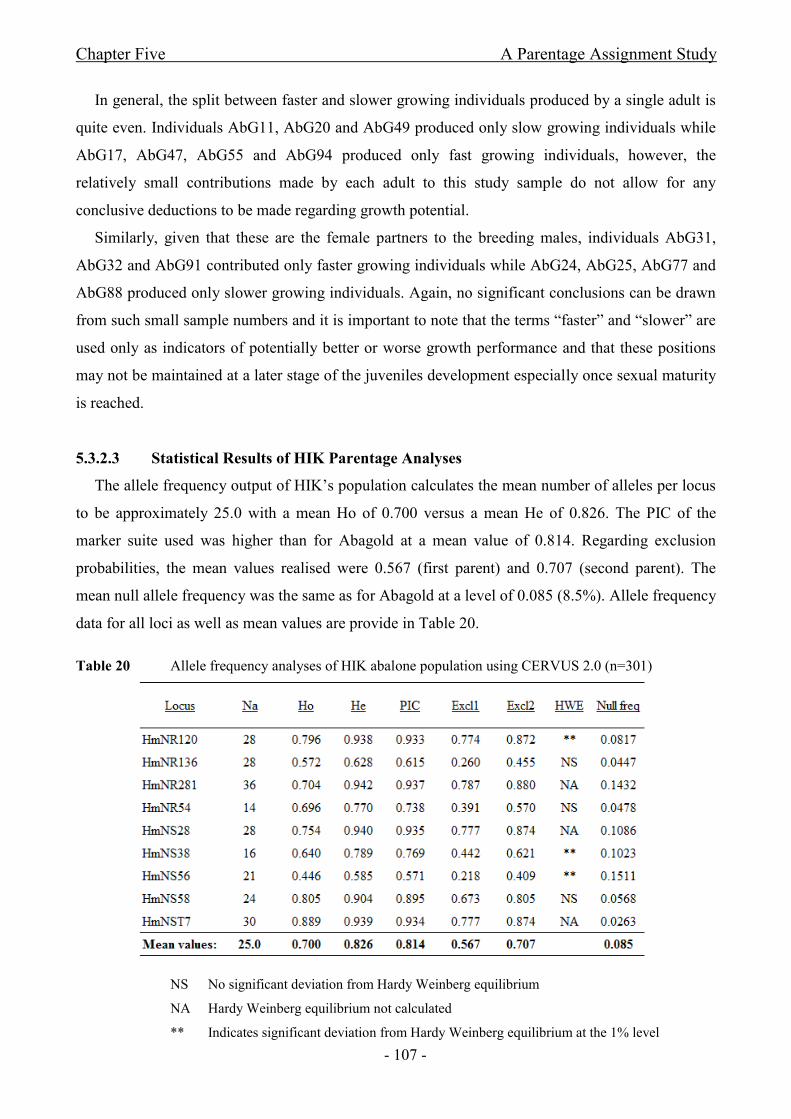
Table 20 Allele frequency analyses of HIK abalone population using CERVUS 2.0 ................ - 107 -
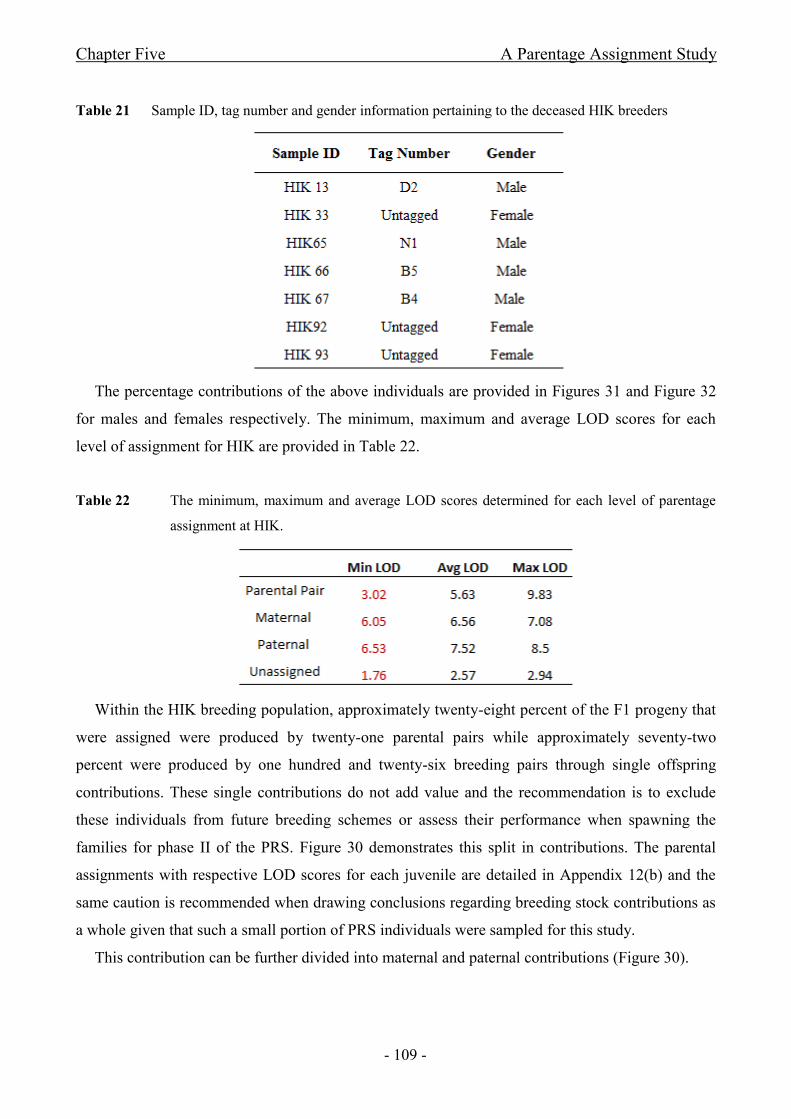
Table 21 Sample ID, tag number and gender information pertaining to the deceased HIK
breeders.................................................. .................................................................................................... - 109 -
Table 22 The minimum, maximum and average LOD scores determined for each level of parentage
assignment at HIK. .................................................................................................................................... - 109 -
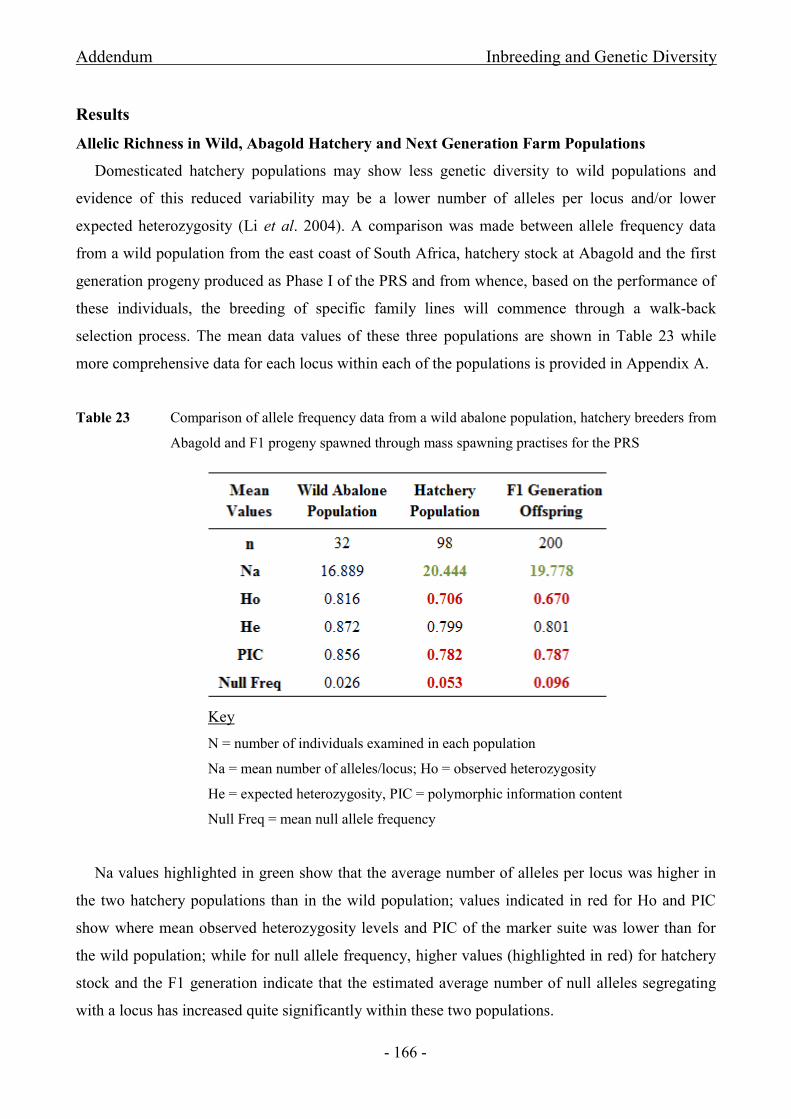
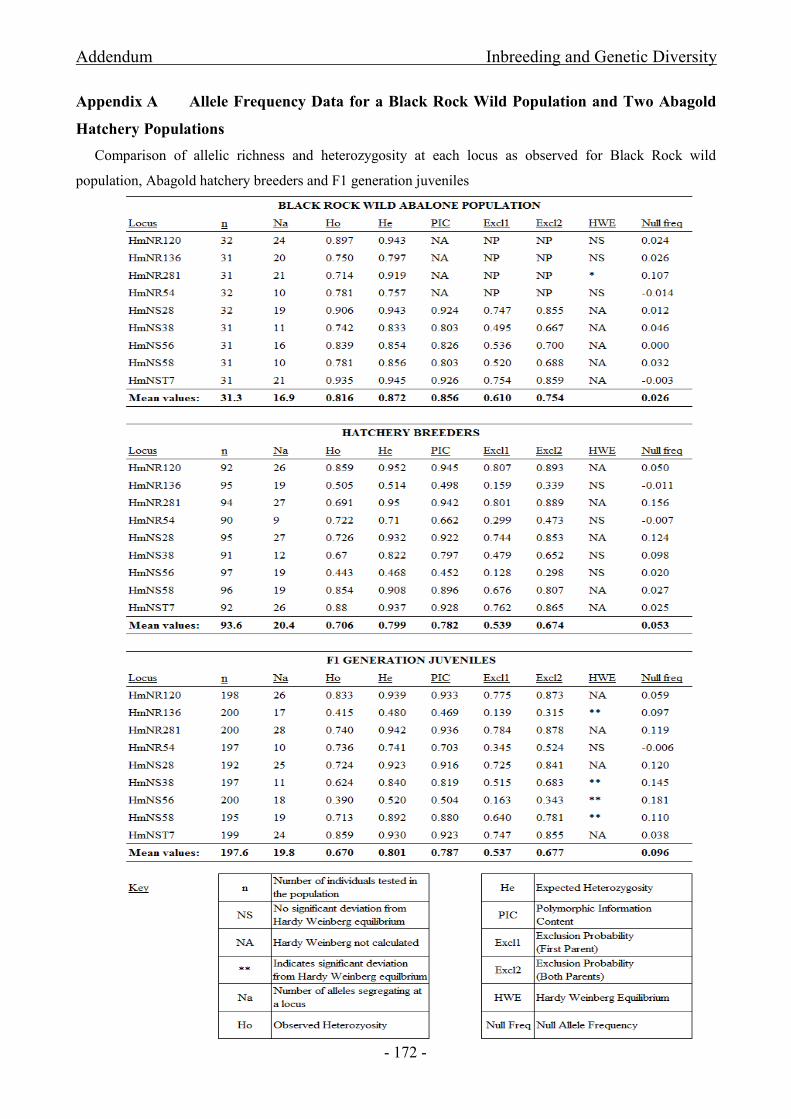
Table 23 Comparison of allele frequency data from a wild abalone population, hatchery breeders
from Abagold and F1 progeny spawned through mass spawning practises for the PRS .......................... - 166 -
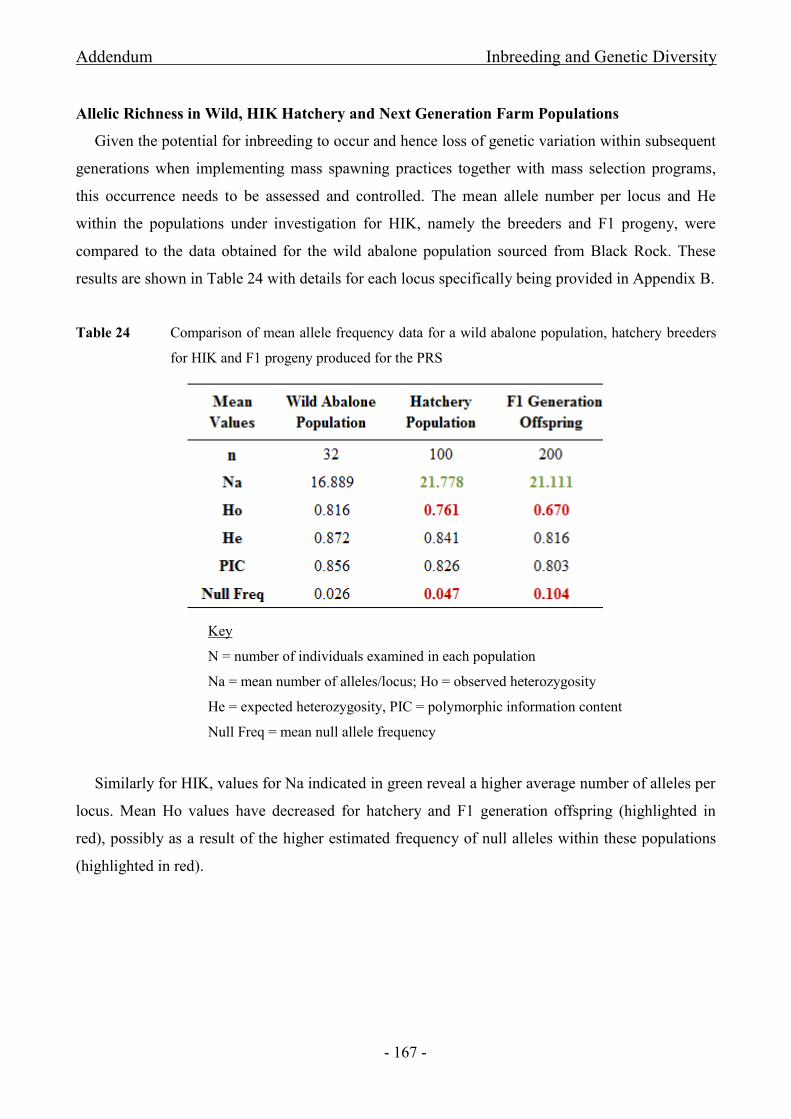
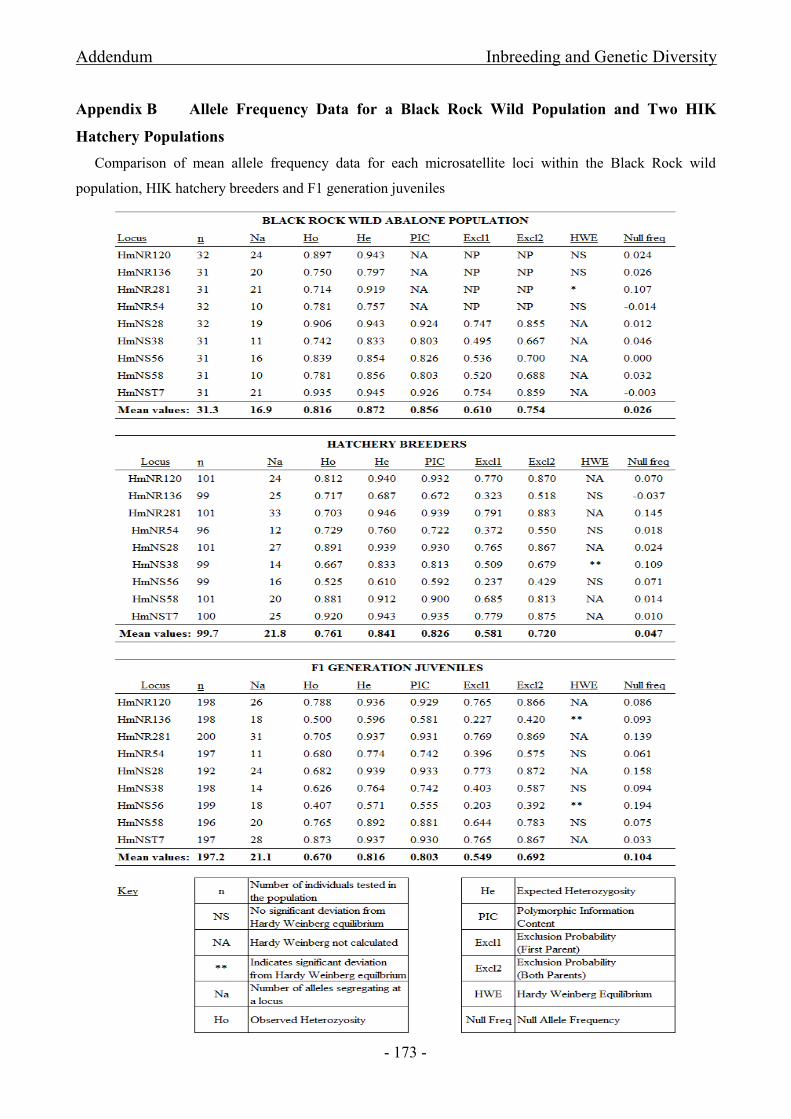
Table 24 Comparison of mean allele frequency data for a wild abalone population, hatchery breeders
for HIK and F1 progeny produced for the PRS ......................................................................................... - 167 -
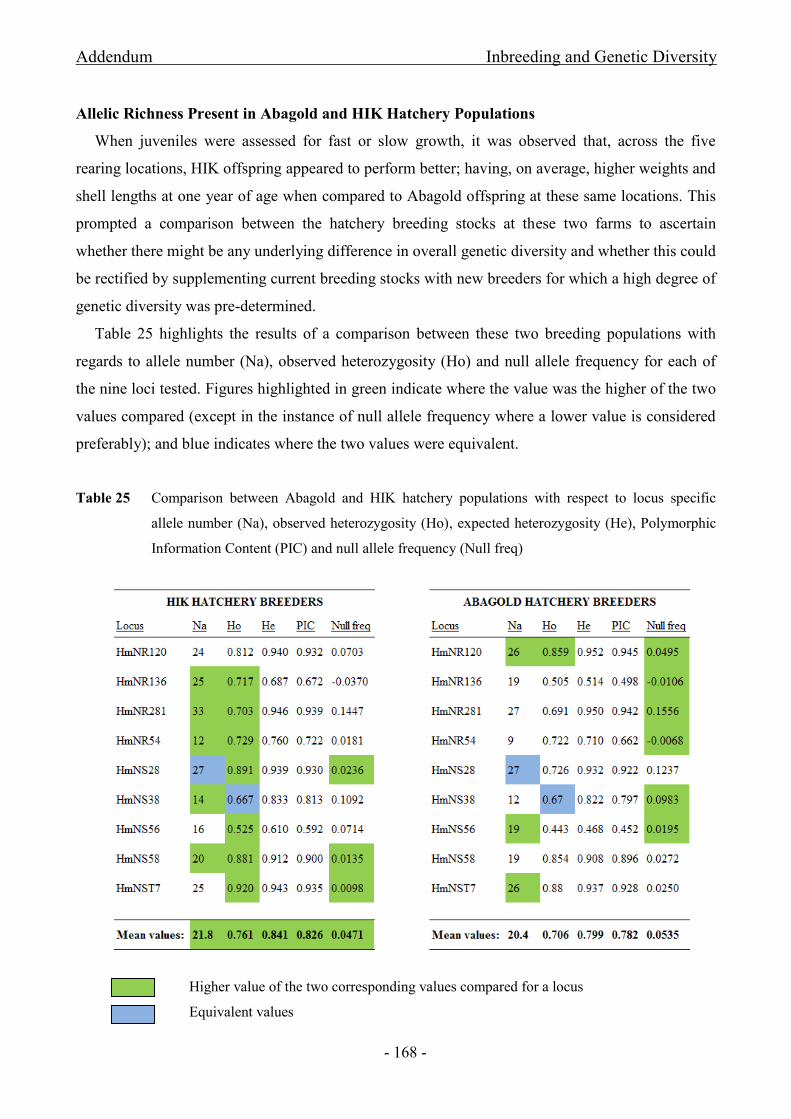
Table 25 Comparison between Abagold and HIK hatchery populations with respect to locus specific
allele number (Na), observed heterozygosity (Ho) and null allele frequency (Null freq) ......................... - 168 -
Stellenbosch University http://scholar.sun.ac.za
xxii
List of Appendices
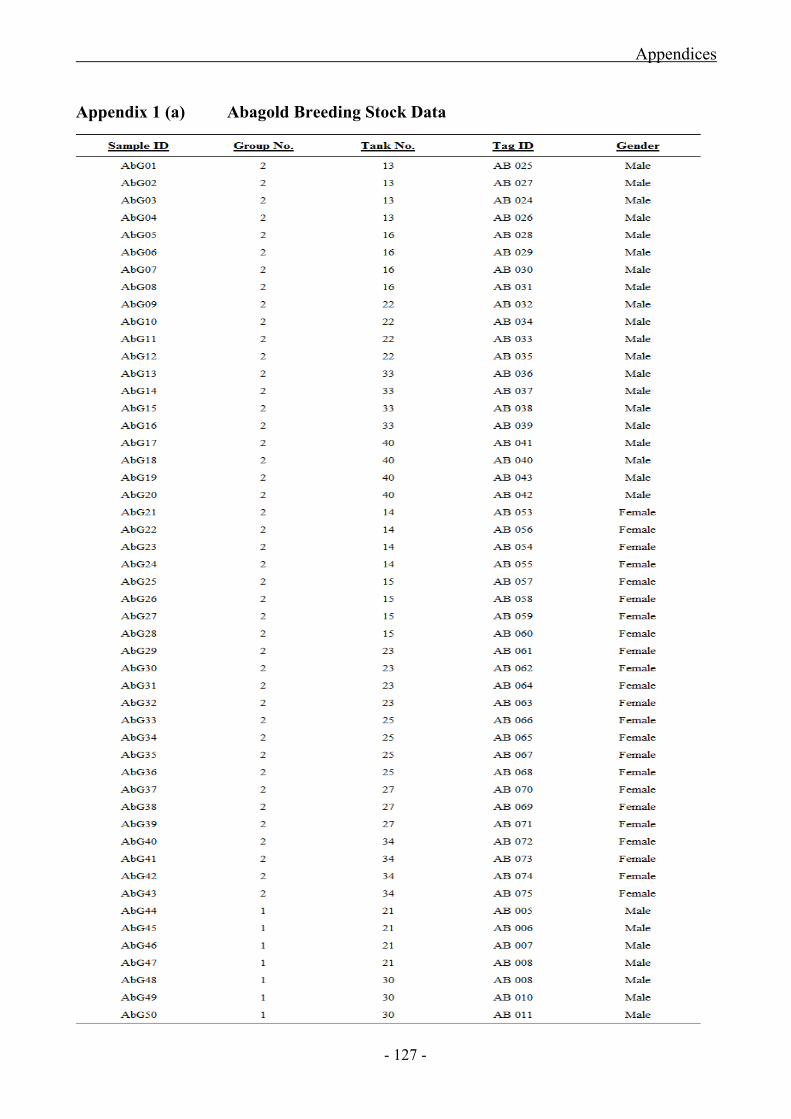
Appendix 1 (a) Abagold Breeding Stock Data
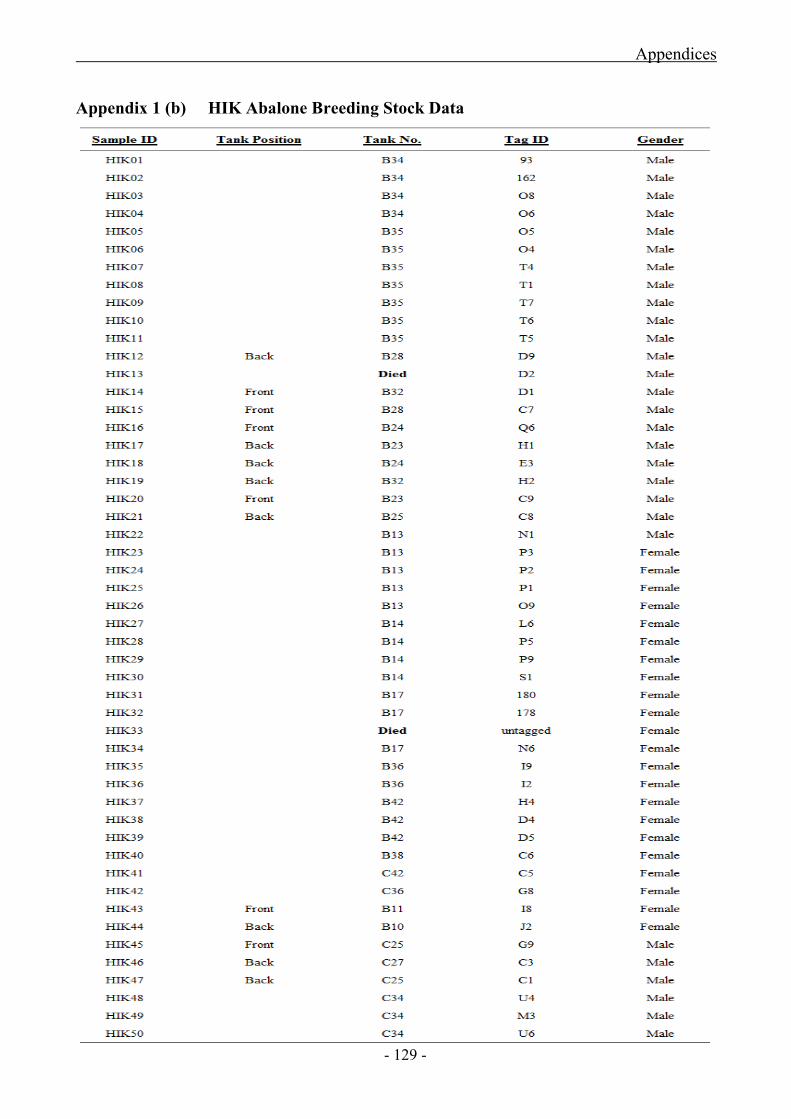
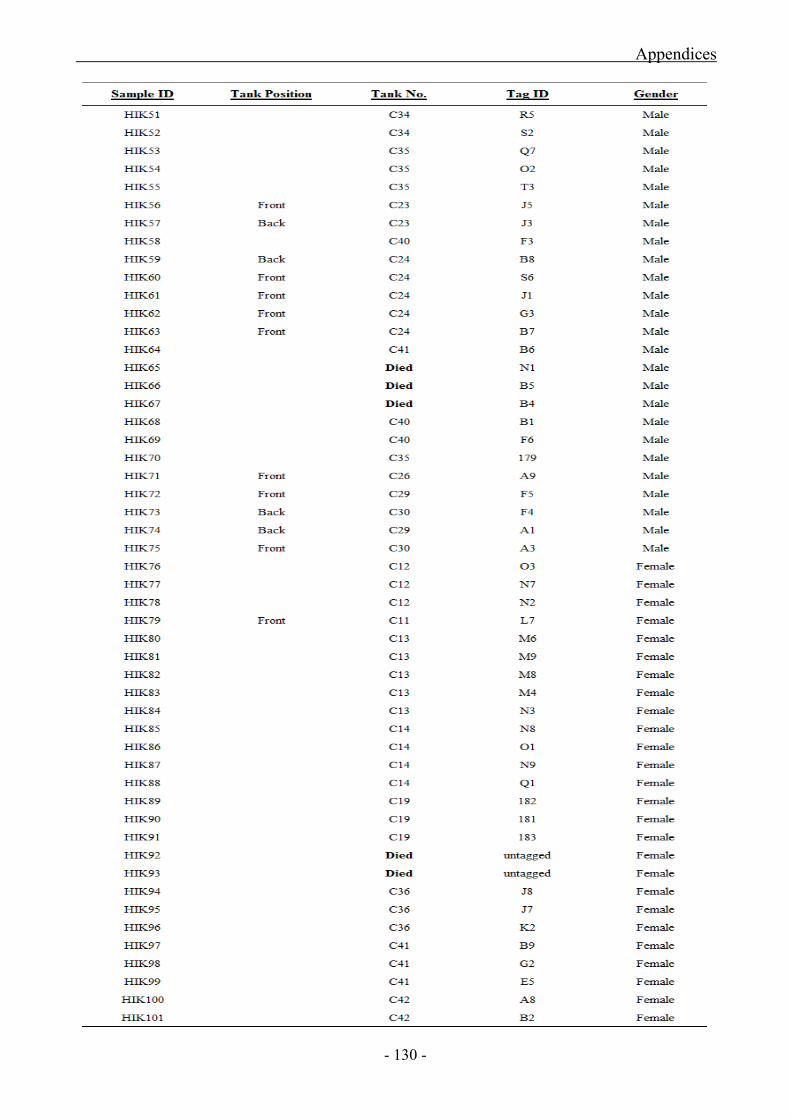
Appendix 1 (b) HIK Abalone Breeding Stock Data
Appendix 2 Size Ranges for Assessment of PRS Juveniles for Fast or Slow Growth
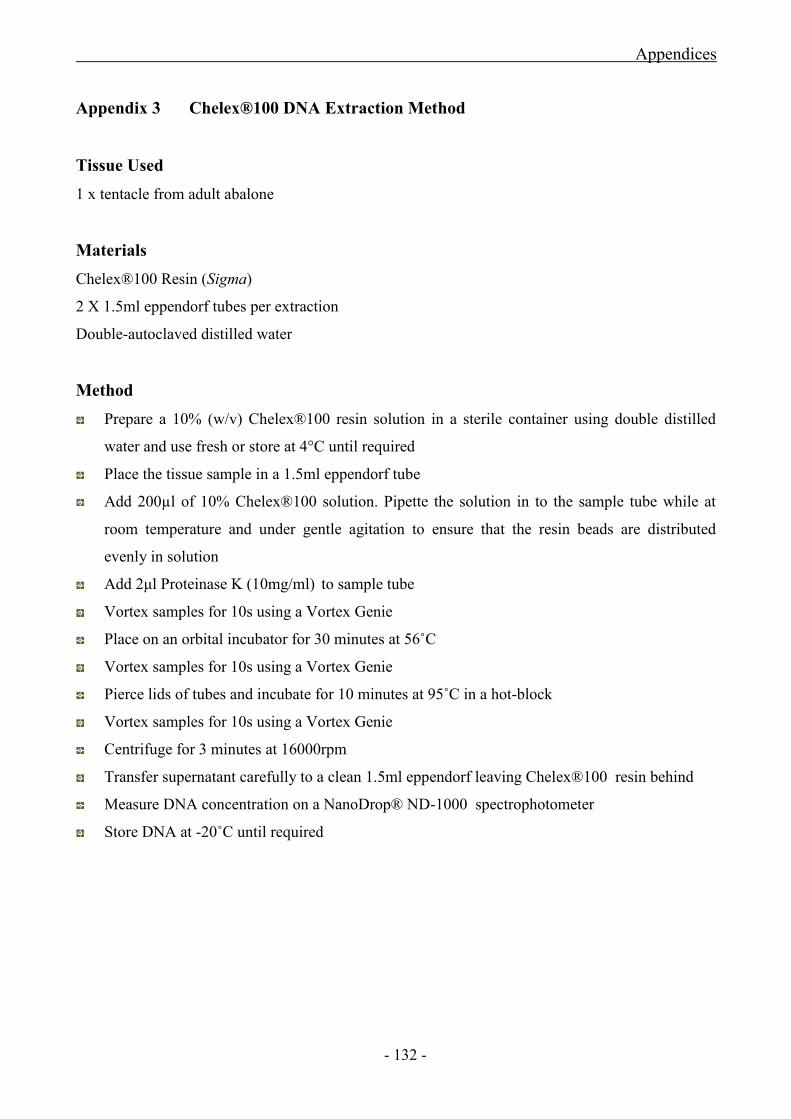
Appendix 3 Chelex®100 DNA Extraction Protocol
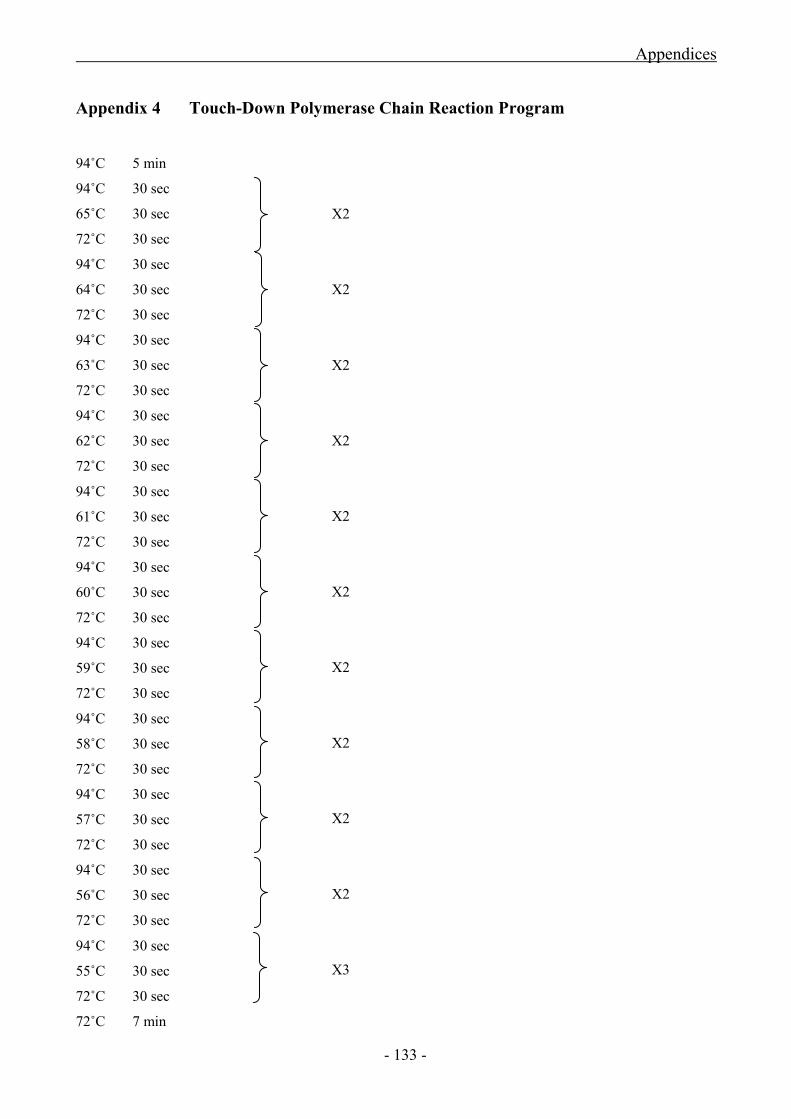
Appendix 4 Touch Down Polymerase Chase Reaction Program
Appendix 5 Stock Solutions Required for Microsatellite Enrichment and Isolation
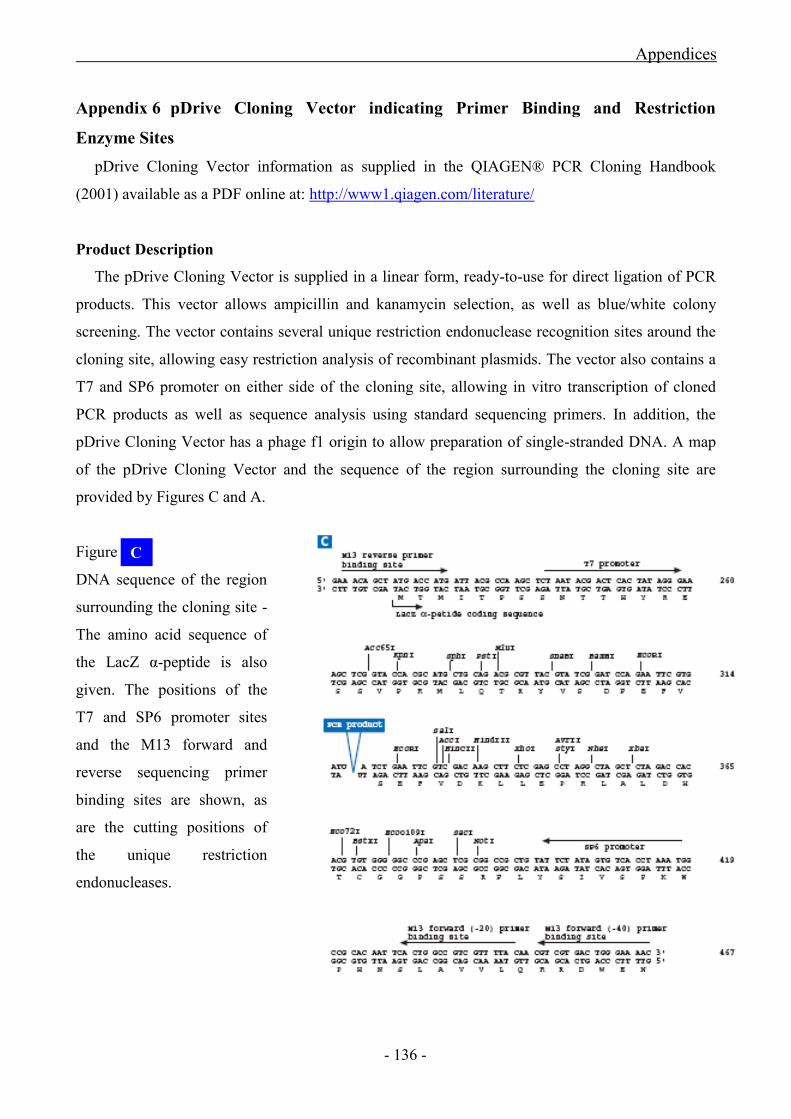
Appendix 6 pDrive Cloning Vector indicating Primer Binding and Restriction Enzyme
Sites
Appendix 7 PCR Primer Design Guidelines
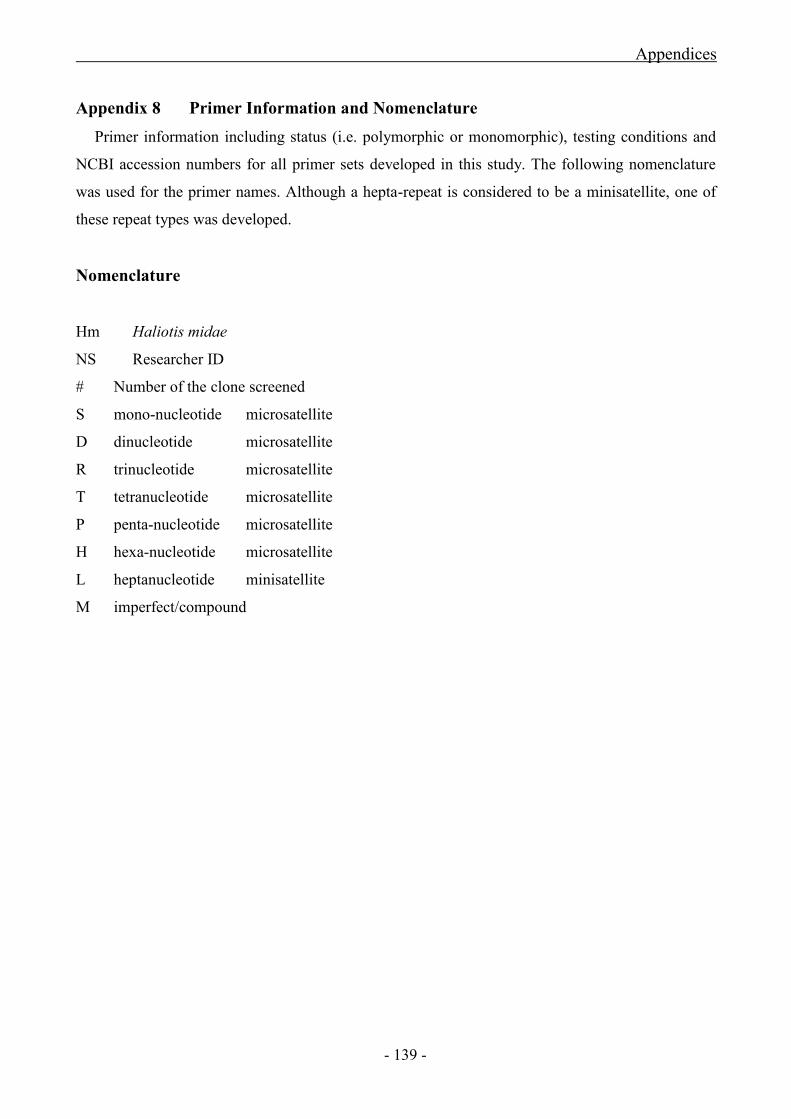
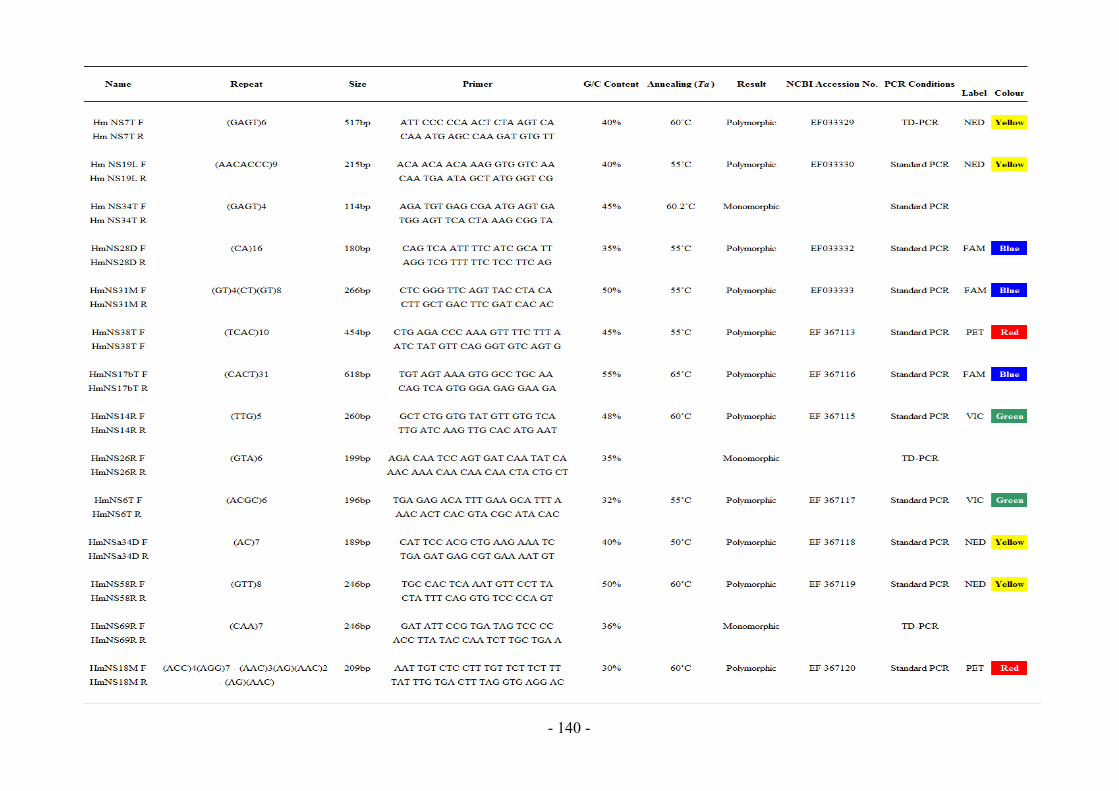
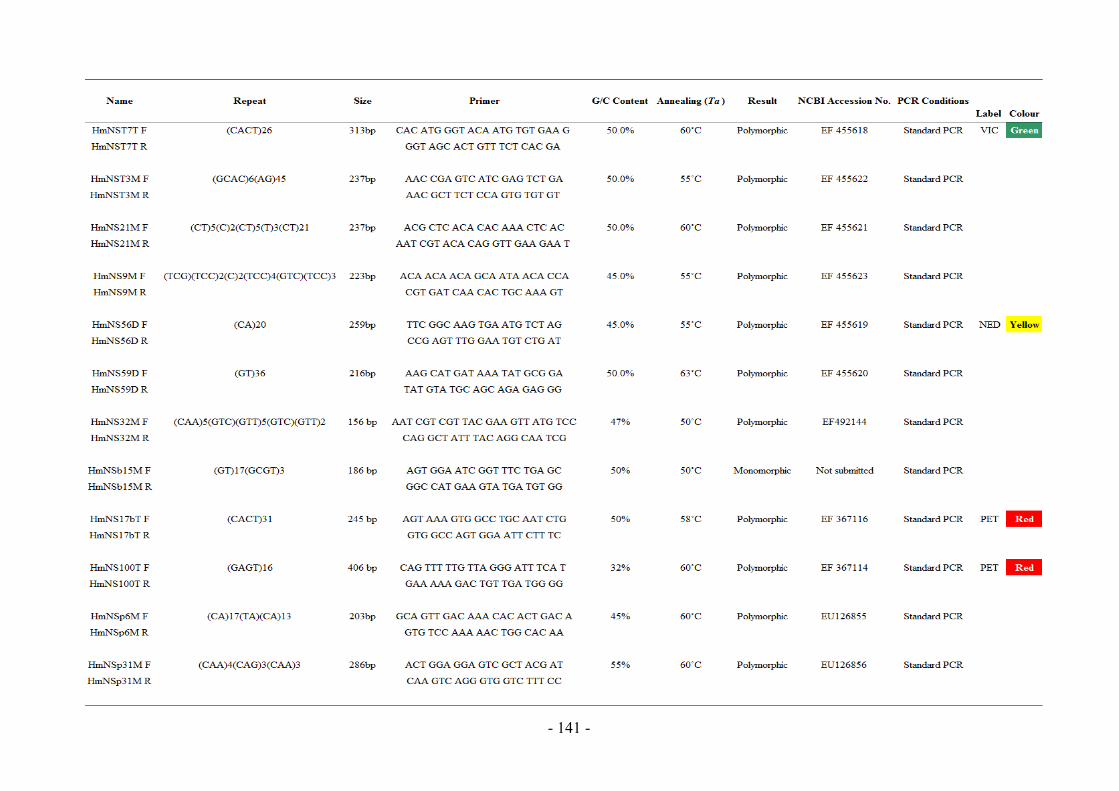
Appendix 8 Primer Information and Nomenclature
Appendix 9 Fluorescently Labelled Primers
Appendix 10 Allele Frequency Analysis of Black Rock Wild Abalone Population
Appendix 11 Primer Sets used in Parentage Analyses
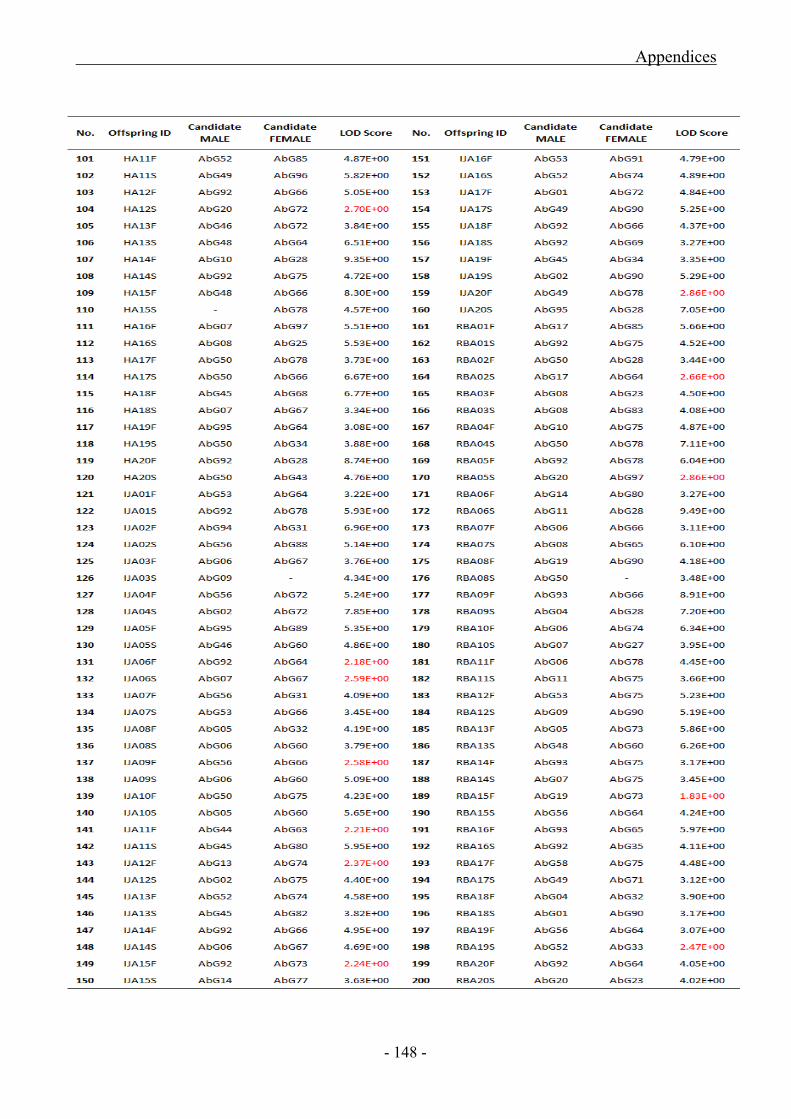
Appendix 12 (a) CERVUS 2.0 Parentage Analyses Data for Abagold Populations
Appendix 12 (b) CERVUS 2.0 Parentage Analyses Data for HIK Populations
Stellenbosch University http://scholar.sun.ac.za
xxiii
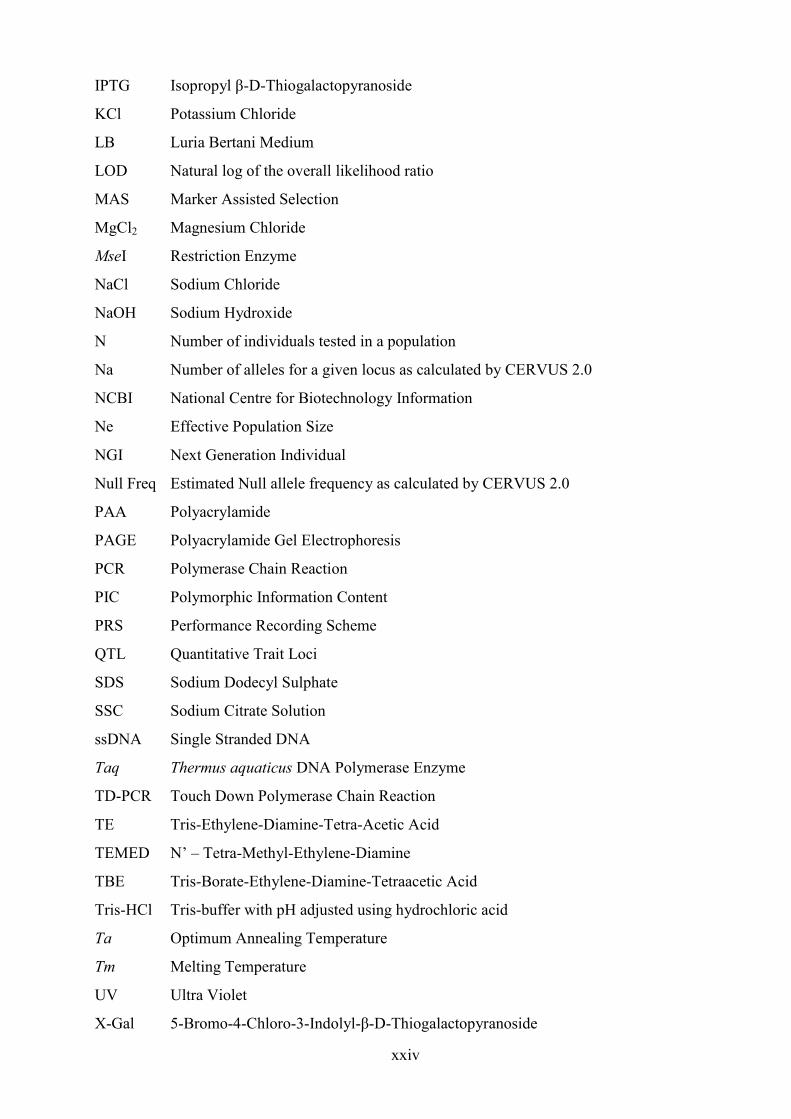
Abbreviations, Acronyms, Formulae and Symbols
AA Acrylamide
AbG Abagold (Pty) Ltd
ABI Applied Biosystems Incorporated
AFLP Amplified Fragment Length Polymorphism
APS Ammonium Persulphate
ATP Adenine Tri-Phosphate
AMP Ampicillin
BAA Bisacrylamide
Kb Kilo Base Pairs
BR Black Rock Wild Abalone Population
BSA Bovine Serum Albumin
CTAB Cetyl Trimethyl Ammonium Bromide
dNTP Dinucleotide Triphosphate
DNA Deoxyribonucleic Acid
dsDNA Double Stranded DNA
DTT Di-Thio-Threitol
EDTA Ethylene-Diamine-Tetra-Acetate
eSNP Expressed Single Nucleotide Polymorphism
EST Expressed Sequence Tag
EtBr Ethidium Bromide
Excl1 Probability of excluding an unrelated individual when first parent is known
Excl2 Probability of excluding an unrelated individual when neither parent is known
F1 First Generation Offspring Individual
FCE Feed Conversion Efficiency
FIASCO Fast Isolation by AFLP of Sequences Containing Repeats
gDNA Genomic DNA
GelDoc Multi Genius Bio Imaging System
He Expected Heterozygosity
Ho Observed Heterozygosity
HWE Hardy Weinberg Equilibrium
IDT Integrated DNA Technologies
IF Innovation Fund
Stellenbosch University http://scholar.sun.ac.za
xxiv
IPTG Isopropyl β-D-Thiogalactopyranoside
KCl Potassium Chloride
LB Luria Bertani Medium
LOD Natural log of the overall likelihood ratio
MAS Marker Assisted Selection
MgCl2 Magnesium Chloride
MseI Restriction Enzyme
NaCl Sodium Chloride
NaOH Sodium Hydroxide
N Number of individuals tested in a population
Na Number of alleles for a given locus as calculated by CERVUS 2.0
NCBI National Centre for Biotechnology Information
Ne Effective Population Size
NGI Next Generation Individual
Null Freq Estimated Null allele frequency as calculated by CERVUS 2.0
PAA Polyacrylamide
PAGE Polyacrylamide Gel Electrophoresis
PCR Polymerase Chain Reaction
PIC Polymorphic Information Content
PRS Performance Recording Scheme
QTL Quantitative Trait Loci
SDS Sodium Dodecyl Sulphate
SSC Sodium Citrate Solution
ssDNA Single Stranded DNA
Taq Thermus aquaticus DNA Polymerase Enzyme
TD-PCR Touch Down Polymerase Chain Reaction
TE Tris-Ethylene-Diamine-Tetra-Acetic Acid
TEMED N‟ – Tetra-Methyl-Ethylene-Diamine
TBE Tris-Borate-Ethylene-Diamine-Tetraacetic Acid
Tris-HCl Tris-buffer with pH adjusted using hydrochloric acid
Ta Optimum Annealing Temperature
Tm Melting Temperature
UV Ultra Violet
X-Gal 5-Bromo-4-Chloro-3-Indolyl-β-D-Thiogalactopyranoside
Stellenbosch University http://scholar.sun.ac.za
xxv
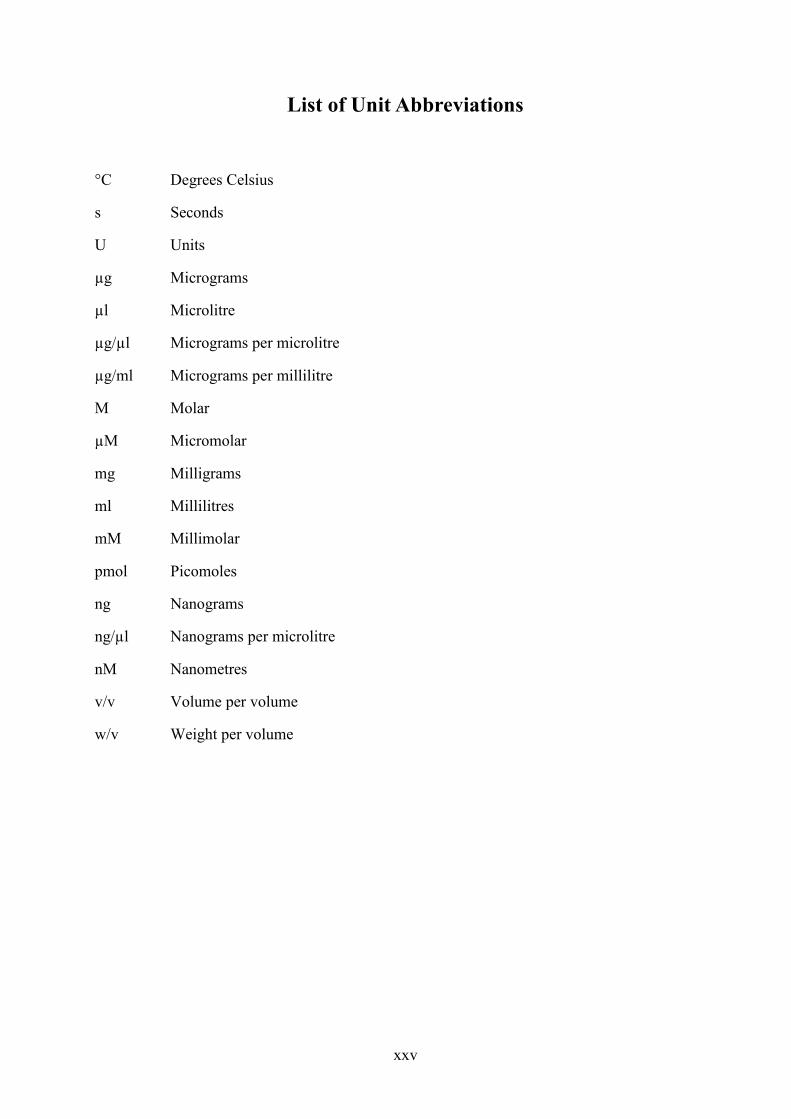
List of Unit Abbreviations
°C Degrees Celsius
s Seconds
U Units
µg Micrograms
µl Microlitre
µg/µl Micrograms per microlitre
µg/ml Micrograms per millilitre
M Molar
µM Micromolar
mg Milligrams
ml Millilitres
mM Millimolar
pmol Picomoles
ng Nanograms
ng/µl Nanograms per microlitre
nM Nanometres
v/v Volume per volume
w/v Weight per volume
Stellenbosch University http://scholar.sun.ac.za

Chapter One
Project Overview and Study Objectives
Stellenbosch University http://scholar.sun.ac.za
Chapter One Project Overview and Study Objectives
- 2 -
1.1 Introduction
Natural resources of South African abalone are under threat from a combination of
environmental factors, intensive fishing pressures as well as illegal and highly organized poaching
groups. An evaluation of these threats has lead to the speculation that commercial harvests of wild
stocks will become unsustainable in the very near future (http://www.mcm-
deat.gov.za/press/2007/10042007.html). This decline in natural resources and high international
market prices has resulted in extensive interest in abalone culture in many countries, including
South Africa, and currently over twenty species worldwide are either, at present, commercially
cultivated (see Table 3 Chapter 2) or under investigation for market value and hence their potential
for cultivation (Elliot 2000). With the world‟s supply from natural fishing being unable to meet the
steadily increasing global demands, the abalone aquaculture industry both locally and
internationally, has developed into a reliable year round source of high quality abalone products
cultured to meet specific market needs (Oakes & Ponte 1996). Within a cultured environment, the
lifecycle is a closed one and the main focus for farms has been on optimizing the surroundings of
the animal i.e. culture techniques; nutrition and tank design (Elliot 2000).
Currently, two areas require the focus of the local abalone industry: Firstly, understanding and
fully exploiting international market opportunities through establishing the traits or characteristics
that the different markets (specific country to which the product is being exported) consider
important or preferable; and secondly, the establishment of a genetic improvement program so as to
exploit the biological potential of the commercial species Haliotis midae (Elliot 2000). For other
aquaculture species within genetic improvement programmes, production gains of between 5% and
15% per generation have been recorded and computer modelling has shown that the implementation
of marker assisted selection by the industry could lead to significantly higher rates of genetic gain
than would be expected in response to phenotypic selection alone (Bentsen & Olesen 2002).
A significant amount of research on abalone aquaculture and genetic improvement programs is
being conducted around the world culminating in the recent publications of linkage maps for Pacific
abalone, H. discus hannai (Liu et al. 2006; Sekino & Hara 2006) and Blacklip abalone, H. rubra
(Baranski et al. 2006).
For South African abalone farms to remain competitive and sustainable and in order to increase
the quantity and quality of their supply to a highly competitive global market, the adoption of
advanced management strategies and innovative biotechnologies, including genetic improvement
programmes, has become necessary (Roodt-Wilding & Slabbert 2006). Table 1 illustrates the status
of genetic improvement of the indigenous, commercially exploited abalone species, Haliotis midae,
in comparison to aquaculture species as a whole and to other abalone species around the world.
Stellenbosch University http://scholar.sun.ac.za
Chapter One Project Overview and Study Objectives
- 3 -
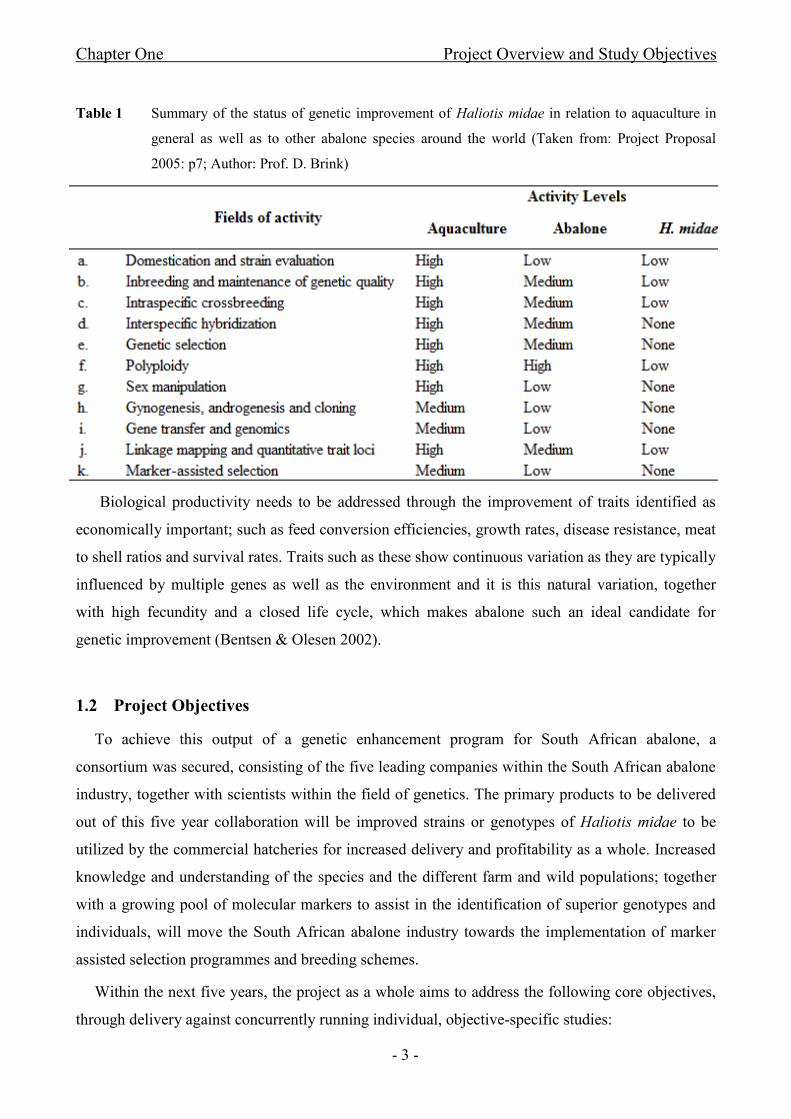
Table 1 Summary of the status of genetic improvement of Haliotis midae in relation to aquaculture in
general as well as to other abalone species around the world (Taken from: Project Proposal
2005: p7; Author: Prof. D. Brink)
Biological productivity needs to be addressed through the improvement of traits identified as
economically important; such as feed conversion efficiencies, growth rates, disease resistance, meat
to shell ratios and survival rates. Traits such as these show continuous variation as they are typically
influenced by multiple genes as well as the environment and it is this natural variation, together
with high fecundity and a closed life cycle, which makes abalone such an ideal candidate for
genetic improvement (Bentsen & Olesen 2002).
1.2 Project Objectives
To achieve this output of a genetic enhancement program for South African abalone, a
consortium was secured, consisting of the five leading companies within the South African abalone
industry, together with scientists within the field of genetics. The primary products to be delivered
out of this five year collaboration will be improved strains or genotypes of Haliotis midae to be
utilized by the commercial hatcheries for increased delivery and profitability as a whole. Increased
knowledge and understanding of the species and the different farm and wild populations; together
with a growing pool of molecular markers to assist in the identification of superior genotypes and
individuals, will move the South African abalone industry towards the implementation of marker
assisted selection programmes and breeding schemes.
Within the next five years, the project as a whole aims to address the following core objectives,
through delivery against concurrently running individual, objective-specific studies:
Stellenbosch University http://scholar.sun.ac.za

Chapter One Project Overview and Study Objectives
- 4 -
(1) To develop and implement innovative technologies directed towards the long term genetic
improvement of the South African abalone species, Haliotis midae for competitive advantage
within international markets.
(2) To produce novel/improved strains or genotypes with enhanced productivity thus improving
the profitability of the industry as a whole and creating opportunities for economic
development.
(3) To overcome specific scientific and technological barriers currently associated with the
indigenous species: lack of knowledge pertaining to the genome of Haliotis midae and the
absence of genetic characterisation; application of existing technologies while continuously
evolving through the implementation of new and improved techniques; resolving issues
related to biosafety and environmental risk assessments.
(4) To establish a collaborative network that will form the basis of a sustainable Aquatic
Biotechnology Platform (ABP) for abalone aquaculture in South Africa.
(5) To develop human resources that will help secure the future development and application of
key genetic and biotechnologies to advance aquaculture development in South Africa.
1.3 Study Objectives
This particular study aims to address the preliminary requirements of the project through the
utilisation of a Performance Recording Scheme (PRS) to aid the identification of individuals with
potentially superior genetic qualities. Current breeding stock and offspring for five abalone farms
were evaluated using a set of nine molecular markers to assign parentage and assess breeding stock
contributions or in other words, the spawning success of the breeders involved. Since the scope of
this work was too large to be conducted singularly, it was divided into two separate yet linked
studies of microsatellite marker development and parentage.
The primary objective of this study was to assign parentage to offspring produced by two of
the participating farms: Abagold (Pty) Ltd and HIK Abalone (Pty) Ltd. The offspring were
identified as either superior or inferior in terms of growth through an initial visual assessment
followed by measurement of shell length and body weight as appraised against pre-determined size
ranges. The assignment results that ensued were used to make recommendations regarding the
inclusion or exclusion of the contributing breeding stock from future breeding programs.
The specific objectives designed to assist in the completion of the primary objective are
indicated below and form part of the larger set of project objectives. The results and outcomes will
aid in the delivery against the project‟s targets as a whole:
Stellenbosch University http://scholar.sun.ac.za

Chapter One Project Overview and Study Objectives
- 5 -
(1) To isolate and develop species-specific polymorphic microsatellite markers for the indigenous
abalone species, Haliotis midae.
(2) To genotype all current breeding stock for Abagold and HIK as well as specific offspring
selected from the PRS on the basis of growth performance; namely faster and slower growth
groups.
(3) To assign parentage for offspring exhibiting either faster or slower growth rates for use in, or
exclusion from, future MAS breeding programs.
A brief overview of the research design and methodology is outlined in the flow diagram
(Figure 1). Each specific area of research is documented in a separate chapter, these following the
introductory chapter and literature review. In turn, each chapter is structured to include the specific
research methodology employed (presented as materials and methods), related results and
discussion.
Stellenbosch University http://scholar.sun.ac.za

Chapter One Project Overview and Study Objectives
- 6 -
Phase I of PRS Phase I of PRS Microsatellite Marker
Development
Enrichment of Wild
Abalone DNA for
Repeats
Transformation and
Cloning into Vector
Screening of
Recombinants
Identification of
Microsatellite Repeats
Primer Design and
Testing
Screening of Black
Rock Wild Abalone
Population
Selection of Primers for
Parentage
Spawning of Juveniles
Division of Juveniles
into Rearing Groups
Tagging of Juveniles
Distribution of Juvenile
Populations to Farms
for Rearing
Rearing of Juvenile
Population at Five
Locations
Tagging of Adults
Adult Tissue Sampling
Adult Genomic DNA
Extractions
Juvenile Growth
Assessment Study
Weighing and
Measuring of Juveniles
Juvenile Tissue
Sampling
Tagging of Juveniles
Genomic DNA
Extractions
Adult and Juvenile
Genotyping
Parental Assignment
(Based on Pedigree
Information)
Breeding Stock Recommendations Based on Findings
Parentage Assignment
Study
Figure 1 Abstract outline of the research design and methodology adopted in this study
Stellenbosch University http://scholar.sun.ac.za
Chapter Two
Literature Review
Stellenbosch University http://scholar.sun.ac.za
Chapter Two Literature Review
- 8 -
2.1 Background on Abalone
2.1.1 Classification
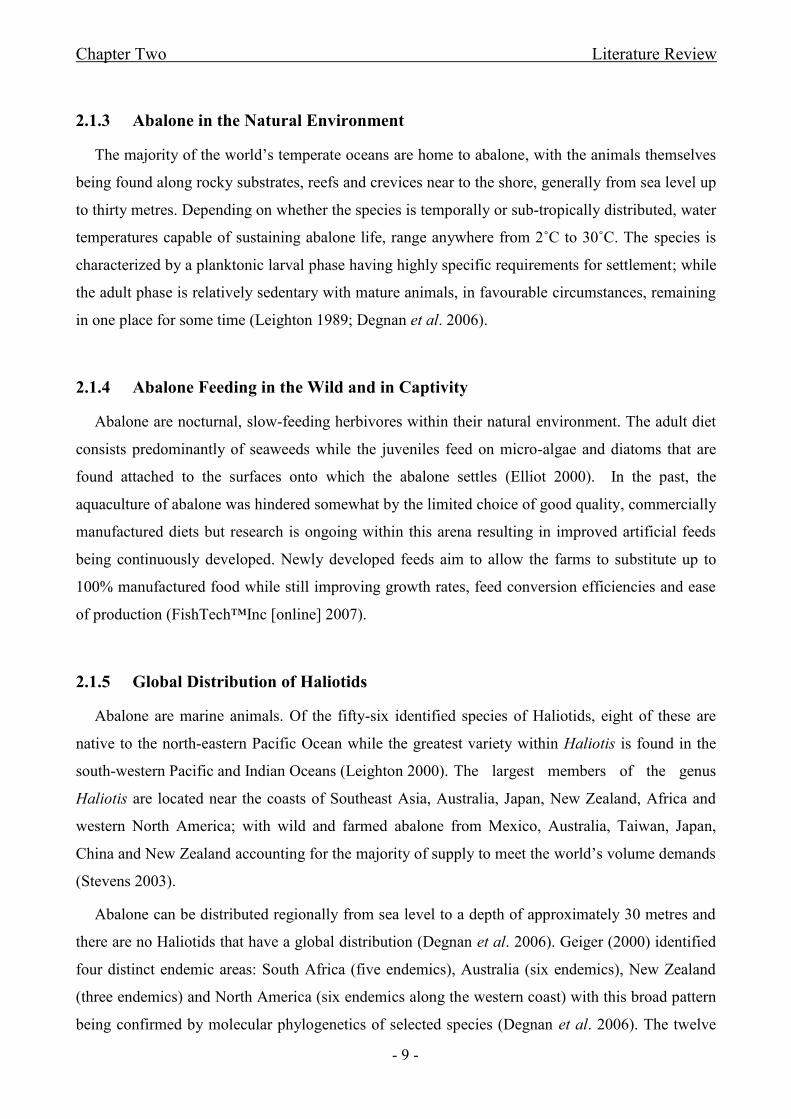
Abalone are classified as single-shelled (univalve) marine vetigastropod molluscs from the
family Haliotidae with a worldwide distribution of fifty-six species in both temperate and tropical
waters (Geiger 2000; Stevens 2003; Degnan et al. 2006). Table 2 provides a detailed classification
of one of South Africa‟s endemic species, Haliotis midae, and the species under investigation
within this study.
Table 2 Taxonomic classification of Haliotis midae
(Marine and Coastal Management/MCM [online], Hahn 1989)
2.1.2 Biological Characteristics
Abalone are mass spawners and both male and female alike release their gametes into the
surrounding water for external fertilization to occur. Few mechanisms (except temperature-related
events) have been identified which may lead to synchronized spawning within the wild while
spawning within a captive environment is artificially induced (Leighton 1989). Most temperate
species have an annual reproductive cycle although the periodicity and duration of spawning was
found to vary both intra- and inter-specifically (McShane 1992).
Fecundity for abalone may be high but at the same time so is mortality due to predation, larval
viability and unfavourable end destinations on ocean currents (Leighton 1989); while further studies
have revealed that large variations in longevity and growth rates exist between different species
(Day & Fleming 1992).
Stellenbosch University http://scholar.sun.ac.za
Chapter Two Literature Review
- 9 -
2.1.3 Abalone in the Natural Environment
The majority of the world‟s temperate oceans are home to abalone, with the animals themselves
being found along rocky substrates, reefs and crevices near to the shore, generally from sea level up
to thirty metres. Depending on whether the species is temporally or sub-tropically distributed, water
temperatures capable of sustaining abalone life, range anywhere from 2˚C to 30˚C. The species is
characterized by a planktonic larval phase having highly specific requirements for settlement; while
the adult phase is relatively sedentary with mature animals, in favourable circumstances, remaining
in one place for some time (Leighton 1989; Degnan et al. 2006).
2.1.4 Abalone Feeding in the Wild and in Captivity
Abalone are nocturnal, slow-feeding herbivores within their natural environment. The adult diet
consists predominantly of seaweeds while the juveniles feed on micro-algae and diatoms that are
found attached to the surfaces onto which the abalone settles (Elliot 2000). In the past, the
aquaculture of abalone was hindered somewhat by the limited choice of good quality, commercially
manufactured diets but research is ongoing within this arena resulting in improved artificial feeds
being continuously developed. Newly developed feeds aim to allow the farms to substitute up to
100% manufactured food while still improving growth rates, feed conversion efficiencies and ease
of production (FishTech™Inc [online] 2007).
2.1.5 Global Distribution of Haliotids
Abalone are marine animals. Of the fifty-six identified species of Haliotids, eight of these are
native to the north-eastern Pacific Ocean while the greatest variety within Haliotis is found in the
south-western Pacific and Indian Oceans (Leighton 2000). The largest members of the genus
Haliotis are located near the coasts of Southeast Asia, Australia, Japan, New Zealand, Africa and
western North America; with wild and farmed abalone from Mexico, Australia, Taiwan, Japan,
China and New Zealand accounting for the majority of supply to meet the world‟s volume demands
(Stevens 2003).
Abalone can be distributed regionally from sea level to a depth of approximately 30 metres and
there are no Haliotids that have a global distribution (Degnan et al. 2006). Geiger (2000) identified
four distinct endemic areas: South Africa (five endemics), Australia (six endemics), New Zealand
(three endemics) and North America (six endemics along the western coast) with this broad pattern
being confirmed by molecular phylogenetics of selected species (Degnan et al. 2006). The twelve
Stellenbosch University http://scholar.sun.ac.za
Chapter Two Literature Review
- 10 -
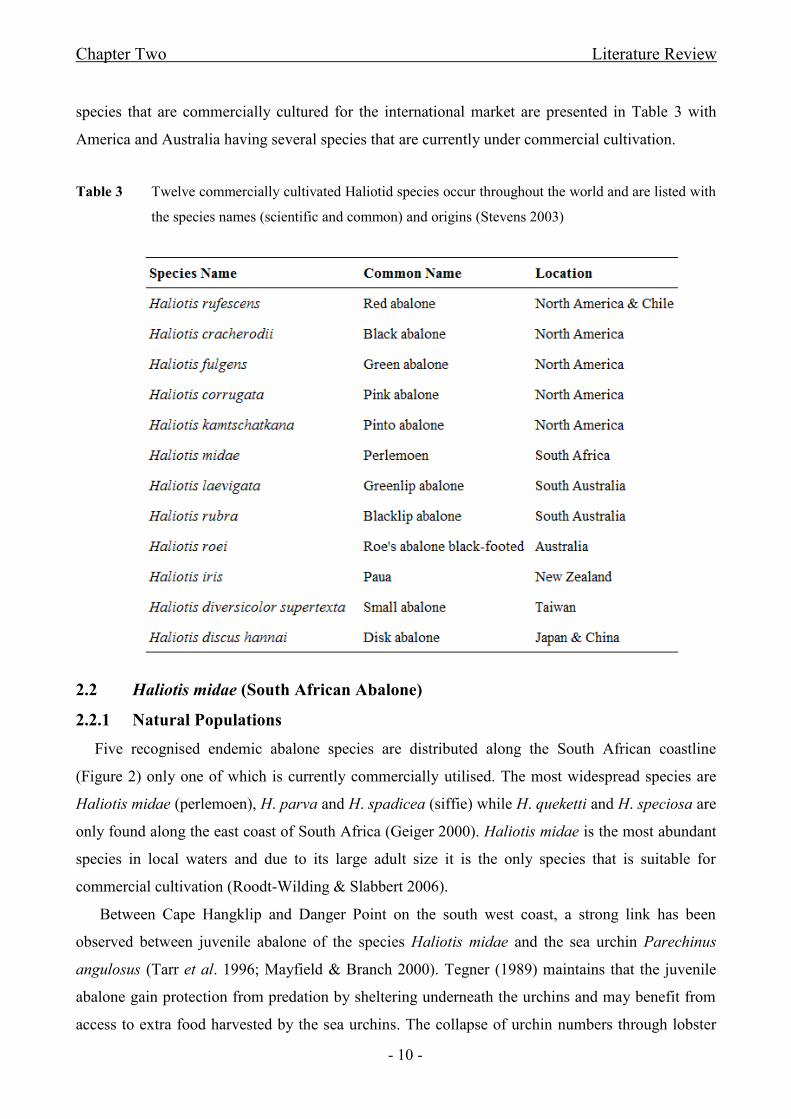
species that are commercially cultured for the international market are presented in Table 3 with
America and Australia having several species that are currently under commercial cultivation.
Table 3 Twelve commercially cultivated Haliotid species occur throughout the world and are listed with
the species names (scientific and common) and origins (Stevens 2003)
2.2 Haliotis midae (South African Abalone)
2.2.1 Natural Populations
Five recognised endemic abalone species are distributed along the South African coastline
(Figure 2) only one of which is currently commercially utilised. The most widespread species are
Haliotis midae (perlemoen), H. parva and H. spadicea (siffie) while H. queketti and H. speciosa are
only found along the east coast of South Africa (Geiger 2000). Haliotis midae is the most abundant
species in local waters and due to its large adult size it is the only species that is suitable for
commercial cultivation (Roodt-Wilding & Slabbert 2006).
Between Cape Hangklip and Danger Point on the south west coast, a strong link has been
observed between juvenile abalone of the species Haliotis midae and the sea urchin Parechinus
angulosus (Tarr et al. 1996; Mayfield & Branch 2000). Tegner (1989) maintains that the juvenile
abalone gain protection from predation by sheltering underneath the urchins and may benefit from
access to extra food harvested by the sea urchins. The collapse of urchin numbers through lobster
Stellenbosch University http://scholar.sun.ac.za
Chapter Two Literature Review
- 11 -
predation and hence the destruction of this beneficial relationship and protective co-habitat has been
implicated in the reduced number of juvenile abalone observed within this zone (Tarr et al. 1996).
Figure 2 Distribution of six abalone species along the South African coast, only five of which are
recognized as endemic to South Africa. Haliotis pustulata inhabits the Mozambique coastline
(Taken from: http://web.uct.ac.za/depts/zoology/abnet/safrica.html)
2.2.2 Commercial Threats and Predation
The threats to wild abalone populations and their long term sustainability are various and often
specific to coastlines. Among these are: commercial over-fishing, recreational catches and
exploitation of legal bag limits, pollution of habitat, disease and inadequate wild stock management
(Stevens 2003).
For Haliotis midae specifically, the impact of rock lobster predation and their destruction of the
habitats (anemone or sea urchins) on which the larvae settle has been extensive as has the illegal
harvesting of this species by large, well-organized poaching syndicates. The latter activity is driven
by the high international market prices making illegal trade a lucrative business (Coastal and
Marine Life online). Figure 3 illustrates the decline in natural abalone over 100mm in length to be
Stellenbosch University http://scholar.sun.ac.za
Chapter Two Literature Review
- 12 -
seen along the coast of South Africa where legal harvesting is still permitted. Transects of
approximately 60 metres were measured within two to three metres from the shore.
Figure 3 FIA Survey conducted in 2005 reveals the declines in natural abalone over 100mm in length
that can be found across Zones A-D of the South African coast. (Taken from:
http://www.abalone.cenrm.uwa.edu.au/__data/page/1963/A_brief_overview_of_the_
abalone_industry_in_South_Africa5.pdf)
2.2.3 Legal Catch and Policy Control
In an effort to control the exploitation of natural abalone populations, legal catch was allocated
to rights holders, while areas along the coast of South Africa were zoned into legal catch subareas
thus further sub-dividing the total allowed catch. A small area of approximately 6.5km that lies
between Cape Hangklip and Danger Point remains a protected marine reserve within which the
harvesting of abalone and other bethnic species is prohibited (Mayfield & Branch 2000). The total
allowable catch of abalone declined from approximately 400 tons in 2001/2002 to about 223 tons in
2004/2005, a clear indication of the over harvesting of this valuable resource (MCM online). These
legal catch zones are illustrated in Figure 4. The harvesting of natural populations will no longer be
permitted for either commercial or recreational purposes from 01 February 2008; with these bans
being instituted in an effort to control the illegal harvesting of abalone by syndicated poaching
groups and to protect the rapidly declining natural populations (Press Release: Environmental
Affairs and Tourism 2007, http://www.engineeringnews.co.za/article.php?a_id=119867). A delay in
instituting the ban has been permitted so as to allow all stakeholders adequate opportunity to
Stellenbosch University http://scholar.sun.ac.za
Chapter Two Literature Review
- 13 -
prepare for the implementation of the policy and the unavoidable impact thereof on individual and
corporate businesses.
Figure 4 Distribution of legal catch sub-area allocations along the coast of South Africa (Taken from:
http://www.abalone.cenrm.uwa.edu.au/__data/page/1963/A_brief_overview_of_the_
abalone_industry_in_South_Africa5.pdf)
2.3 A Snapshot of the International and the Local Abalone Market
2.3.1 World Market Opportunities and Commercial Value
To date, twelve species have been identified to have traits of economic importance and/or market
value and are currently commercially exploited (Table 3). From 1975 where a balance existed
between supply and demand to predicted volumes for 2004, a shortfall in the supply to a niche
market with a steady demand was anticipated (Figure 5). This imbalance in supply/demand persists
and is one of the primary drivers of the increase in abalone aquaculture seen today. The strong
world demand for this delicacy, however, does not automatically mean a premium price but remains
very dependent on commercial producers to compete successfully within a highly dynamic
international market (Gordon & Cook 2001). Understanding the world market and cultural
traditions which determine product quality and desirable traits, is key to identifying the market
standards that aquaculture producers need to satisfy (Oakes & Ponte 1996).
Stellenbosch University http://scholar.sun.ac.za
Chapter Two Literature Review
- 14 -
Figure 5 World market supply and demand of abalone from 1975 to predicted volumes in 2004. Cultured
species H. supertexta is not included in “supply” (5000mt 1998, 6000mt 2004) (Taken from:
Gordon & Cook 2001)
The major consumer countries of abalone are Japan and China (including South East Asia),
while established markets also exist in the United States, Mexico, Europe and Korea. Live, fresh
and frozen abalone are generally identified as those product forms having the highest commercial
value on the world market. Appearance, colour, taste and texture are all important considerations in
determining the value of the end product while within most premium markets, consistency of
supply is weighted as importantly as the quality of product (i.e. taste and appearance) (Oakes &
Ponte 1996).
2.3.2 Abalone Production and Marketing in Southern Africa
The 1980‟s saw the initiation of abalone farming in South Africa, with the first farms being
constructed in 1992 and culminating in the thirteen land-based abalone farms that are currently
located throughout the country (Loubser 2005). These farms operate almost exclusively using pump
ashore systems, while two of the farms make use of additional re-circulation systems and a third
one employs a partial re-circulation system in their operation (Cook 1998; MCM online).
Local abalone producers employ different feeding strategies for their cultured animals, with
most of the farms using a mixture of harvested kelp (Ecklonia maxima); an artificial food source
formulated as a dry pellet (Abfeed); and cultivated seaweed (Gracilaria). Two producers feed their
animals solely on a diet of kelp; three farms feed a combination of kelp and cultivated seaweeds;
while yet another producer substitutes 100% manufactured feed (MCM online).
Vo
lum
e in
Met
ric
Ton
s
Stellenbosch University http://scholar.sun.ac.za
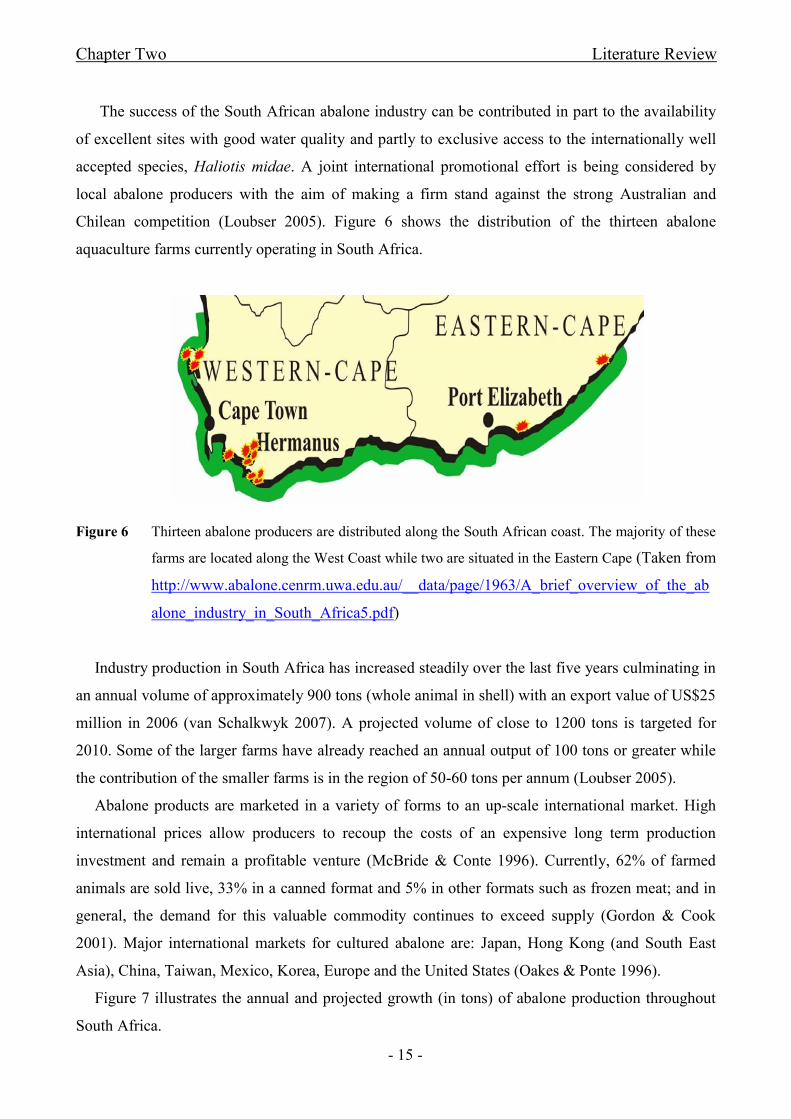
Chapter Two Literature Review
- 15 -
The success of the South African abalone industry can be contributed in part to the availability
of excellent sites with good water quality and partly to exclusive access to the internationally well
accepted species, Haliotis midae. A joint international promotional effort is being considered by
local abalone producers with the aim of making a firm stand against the strong Australian and
Chilean competition (Loubser 2005). Figure 6 shows the distribution of the thirteen abalone
aquaculture farms currently operating in South Africa.
Figure 6 Thirteen abalone producers are distributed along the South African coast. The majority of these
farms are located along the West Coast while two are situated in the Eastern Cape (Taken from
http://www.abalone.cenrm.uwa.edu.au/__data/page/1963/A_brief_overview_of_the_ab
alone_industry_in_South_Africa5.pdf)
Industry production in South Africa has increased steadily over the last five years culminating in
an annual volume of approximately 900 tons (whole animal in shell) with an export value of US$25
million in 2006 (van Schalkwyk 2007). A projected volume of close to 1200 tons is targeted for
2010. Some of the larger farms have already reached an annual output of 100 tons or greater while
the contribution of the smaller farms is in the region of 50-60 tons per annum (Loubser 2005).
Abalone products are marketed in a variety of forms to an up-scale international market. High
international prices allow producers to recoup the costs of an expensive long term production
investment and remain a profitable venture (McBride & Conte 1996). Currently, 62% of farmed
animals are sold live, 33% in a canned format and 5% in other formats such as frozen meat; and in
general, the demand for this valuable commodity continues to exceed supply (Gordon & Cook
2001). Major international markets for cultured abalone are: Japan, Hong Kong (and South East
Asia), China, Taiwan, Mexico, Korea, Europe and the United States (Oakes & Ponte 1996).
Figure 7 illustrates the annual and projected growth (in tons) of abalone production throughout
South Africa.
Stellenbosch University http://scholar.sun.ac.za
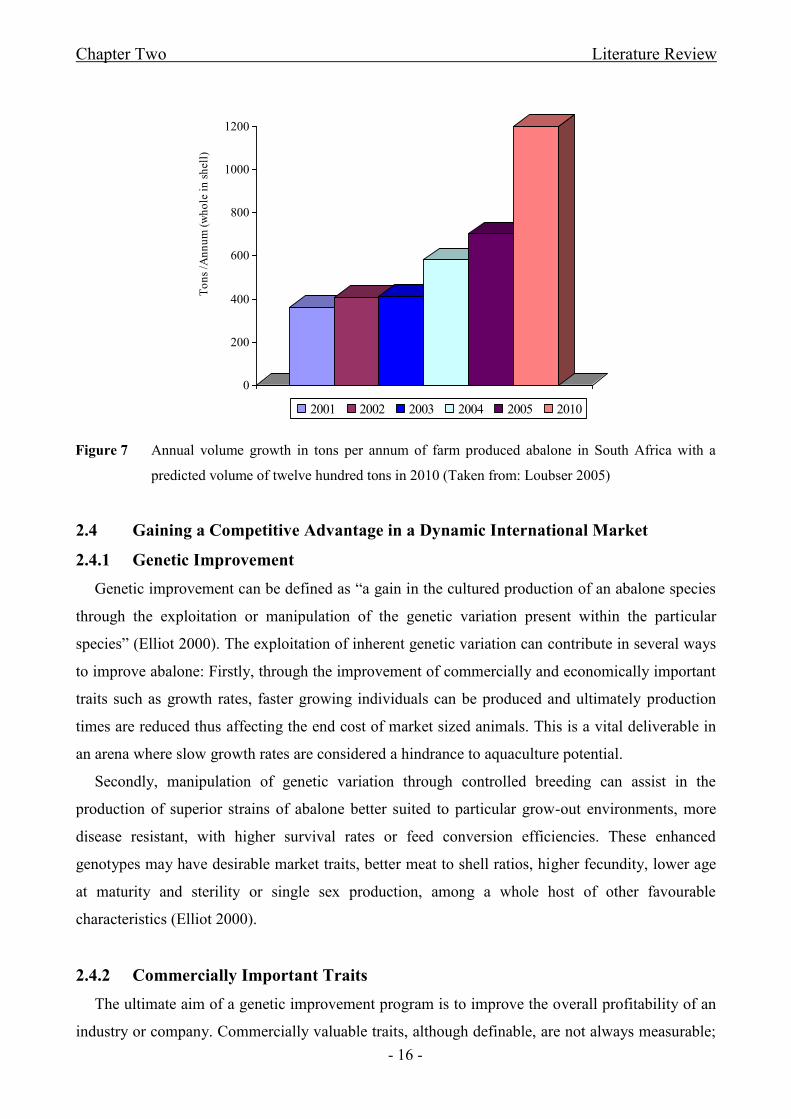
Chapter Two Literature Review
- 16 -
Figure 7 Annual volume growth in tons per annum of farm produced abalone in South Africa with a
predicted volume of twelve hundred tons in 2010 (Taken from: Loubser 2005)
2.4 Gaining a Competitive Advantage in a Dynamic International Market
2.4.1 Genetic Improvement
Genetic improvement can be defined as “a gain in the cultured production of an abalone species
through the exploitation or manipulation of the genetic variation present within the particular
species” (Elliot 2000). The exploitation of inherent genetic variation can contribute in several ways
to improve abalone: Firstly, through the improvement of commercially and economically important
traits such as growth rates, faster growing individuals can be produced and ultimately production
times are reduced thus affecting the end cost of market sized animals. This is a vital deliverable in
an arena where slow growth rates are considered a hindrance to aquaculture potential.
Secondly, manipulation of genetic variation through controlled breeding can assist in the
production of superior strains of abalone better suited to particular grow-out environments, more
disease resistant, with higher survival rates or feed conversion efficiencies. These enhanced
genotypes may have desirable market traits, better meat to shell ratios, higher fecundity, lower age
at maturity and sterility or single sex production, among a whole host of other favourable
characteristics (Elliot 2000).
2.4.2 Commercially Important Traits
The ultimate aim of a genetic improvement program is to improve the overall profitability of an
industry or company. Commercially valuable traits, although definable, are not always measurable;
0
200
400
600
800
1000
1200
To
ns
/An
nu
m (
wh
ole
in
sh
ell
)
2001 2002 2003 2004 2005 2010
Stellenbosch University http://scholar.sun.ac.za
Chapter Two Literature Review
- 17 -
therefore, traits that are known to have some genetic relationship with the commercial trait of
interest are used as selection criteria. These selection traits will be used to measure the outputs or
gains of the genetic improvement program and therefore need to fulfil certain criteria: they need to
be inexpensive to measure, they need to be heritable and most importantly, they must be genetically
linked to the trait of interest (Anne 2006).
2.4.3 The Potential of Genetic Improvement Programs within Aquaculture
Biotechnology is defined as: “Any technique that uses living organisms to make or modify a
product, to improve plants or animals or to develop microorganisms for specific uses” (US
Congress Office of Technology Assessment as cited in Diaz & Neira 2005). Biotechnology has
been one of the most significant contributors to the advancement seen in aquaculture over the last
five decades; particularly in areas such as reproduction, pathology, nutrition and health and the
genetic improvement of cultured species (Diaz & Neira 2005). Genetic improvement at the hand of
biotechnology, however, should not be seen as a stand-alone answer to increasing the performance
of a species but should be addressed together with other practical aspects of marketing, nutrition,
health and husbandry practices (Holst 1999).
Genetic enhancement programs within aquaculture have the potential to deliver collectively and
sustainably to the worldwide requirements of increased food production and food quality; the
unearthing and the progression of new natural resources; as well as awareness and maintenance of
both declining biodiversity and a severely challenged environment at the hands of modern day
society (Davis & Hetzel 2000; Melamed et al. 2002). Beyond these deliverables, financial gain for
the industries and aquaculture companies is a key requirement if delivery is to be sustainable and
motivating (Davis & Hetzel 2000).
2.4.4 The Key to Unlock What Lies Beneath
Genomics is loosely defined as the “study of genes and their functions” and is an area of
research that impacts on numerous avenues of everyday life ranging from reproduction, food safety
and health care to law enforcement to name a few (Anne 2006). With the coming together of three
key components, the power held within molecular data can today be accessed and otherwise
unobtainable information revealed and studied: Firstly, the availability of efficient molecular
techniques for examining specific areas of DNA; secondly, ongoing development of appropriate
statistical methods and models for analyzing DNA data and thirdly, the design and availability of
user-friendly computer packages (Tarr 2000).
Stellenbosch University http://scholar.sun.ac.za
Chapter Two Literature Review
- 18 -
2.5 Molecular Markers - Tools to Deliver Genetic Improvement Programs
2.5.1 Genetic Variation and DNA Molecular Markers in General
Genetic variation exists within and among individuals, species and higher taxonomic groups as a
result of a combination of factors: mutations, interactions with the environment, fitness selection
and genetic drift. Various types of mutations accumulate over time and the degree and number of
mutations that exist, serve to define the variation or polymorphism within a given species. For
genetic variation to be useful, it needs to be inheritable and discernable either phenotypically or
genetically through molecular techniques (Jones et al. 2001). Genetic diversity can be estimated
through the application of various molecular techniques and to date a series of different genetic
markers have been explored and developed (Sekino & Hara 2006). Molecular genetic markers are
comprised of two elements: the inheritable DNA region to be screened (locus) and the technique to
be used to reveal the variation (alleles) inherent at each region (Sunnucks 2000).
Varying degrees of variation are required depending on the study being completed and this
variation within a population can be measured through an assessment of gene diversity and allelic
richness (Aho et al. 2006; Anne 2006). Intra-population studies such as parentage analyses require
high to very high levels of variation at the DNA level. Choosing the right molecular marker for a
study relies to a large extent on our understanding of the evolutionary forces that either create or
remove variability; for example, repetitive sequences such as microsatellite loci, are highly mutable
and provide highly variable markers (Anne 2006).
2.5.2 Choosing the Right Molecular Marker and Technique
The choice of genetic marker depends on several criteria: firstly, the level of variability of the
DNA region being investigated; secondly, the nature of the information (e.g. dominance,
codominance, ploidy etc) that needs to be determined in order to answer the biological question
being posed and thirdly, practical aspects such as which molecular techniques are feasible given the
laboratory equipment and facilities available as well as the level of experience of the scientists
involved (Sunnucks 2000).
Techniques for molecular marker analysis describe the various methods employed in the
detection of variation at DNA level and encompass processes such as: initial template production,
PCR and electrophoresis; through to sequencing and genotyping if the study requires this level of
detail. Several techniques are currently available for analysing different molecular markers; with no
single molecular technique being universally ideal and each of those currently available possessing
both strengths and weaknesses. Ultimately, the choice of technique relies on a compromise between
the same criteria considered when choosing the type of molecular marker most applicable to an area
Stellenbosch University http://scholar.sun.ac.za
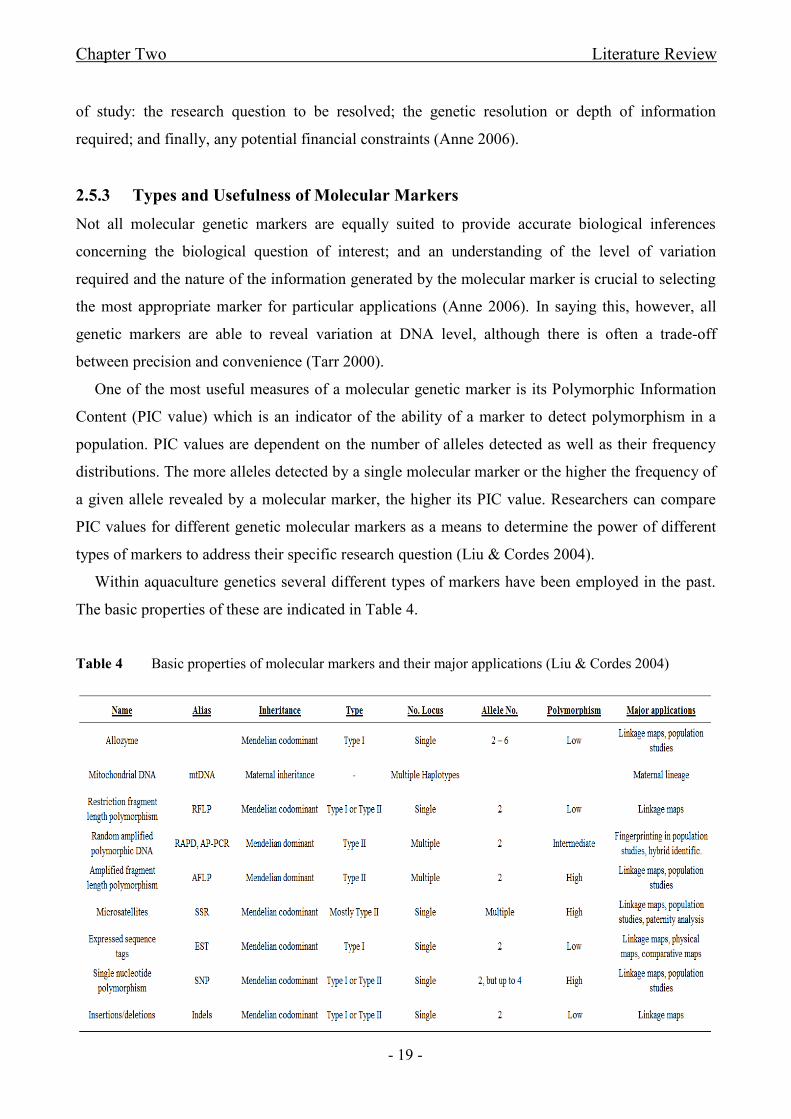
Chapter Two Literature Review
- 19 -
of study: the research question to be resolved; the genetic resolution or depth of information
required; and finally, any potential financial constraints (Anne 2006).
2.5.3 Types and Usefulness of Molecular Markers
Not all molecular genetic markers are equally suited to provide accurate biological inferences
concerning the biological question of interest; and an understanding of the level of variation
required and the nature of the information generated by the molecular marker is crucial to selecting
the most appropriate marker for particular applications (Anne 2006). In saying this, however, all
genetic markers are able to reveal variation at DNA level, although there is often a trade-off
between precision and convenience (Tarr 2000).
One of the most useful measures of a molecular genetic marker is its Polymorphic Information
Content (PIC value) which is an indicator of the ability of a marker to detect polymorphism in a
population. PIC values are dependent on the number of alleles detected as well as their frequency
distributions. The more alleles detected by a single molecular marker or the higher the frequency of
a given allele revealed by a molecular marker, the higher its PIC value. Researchers can compare
PIC values for different genetic molecular markers as a means to determine the power of different
types of markers to address their specific research question (Liu & Cordes 2004).
Within aquaculture genetics several different types of markers have been employed in the past.
The basic properties of these are indicated in Table 4.
Table 4 Basic properties of molecular markers and their major applications (Liu & Cordes 2004)
Stellenbosch University http://scholar.sun.ac.za
Chapter Two Literature Review
- 20 -
Molecular markers can be categorized into two types: Type I markers are associated with genes
of known function, while Type II markers are associated with unknown genomic sequences (Liu &
Cordes 2004). Type II genetic markers are able to provide information in one of two ways: through
a molecular phenotype as evidenced by the presence/absence of given fragments (dominant) or by
means of a genotype wherein both alleles of a diploid individual are revealed (codominant) (Anne
2006).
2.5.4 Pros and Cons of Molecular Markers
The first tools used to assess diversity and differentiation were morphological traits, followed
by allozymes (protein products of genes) and at the DNA level, restriction fragment length
polymorphism (RFLP). These methods have, however, since been surpassed by newer, PCR driven
techniques (Gaudeul et al. 2004). Liu and Furnier (1993: as cited in Huang et al. 2000) established
that although allozymes analysis is the most cost-effective method, it is very often less informative
than DNA based methods.
Maternally inherited mitochondrial DNA (mtDNA) was and is still used extensively in the
analysis of stock structure and population differentiation but the molecule is considered a single
locus due to its non-Mendelian mode of inheritance. PIC values for this marker, although higher
than for allozymes are lower than for RAPD, AFLP, microsatellite repeats (SSR) and Single
Nucleotide Polymorphisms (SNPs). mtDNA is also subject to the same problems, such as back
mutations, that affect other DNA-based markers (Liu & Cordes 2004; Gilbey et al. 2005).
RFLP markers on the other hand, are codominant markers that are relatively easy to score;
however, the low level of polymorphism observed for RFLP and the difficulties in developing such
markers from a poorly understood genome or one where molecular information is limited, makes
these DNA markers a less than ideal choice for many applications (Liu & Cordes 2004).
RAPD analysis is a fairly simple test to perform using dominant Mendelian markers, has high
ability to detect polymorphisms and PCR primers can be designed without prior knowledge of DNA
sequences. On the down side for these loci, allele scoring can be time-consuming, tricky and
difficult to reproduce; while PIC values fall below those obtained for AFLP, microsatellites and
SNPs, indicating that these molecular markers may not be as informative as the latter three options
(Huang et al. 2000; Liu & Cordes 2004).
Mueller and Wolfenbarger (1999) advocate that the difficulty in the precise identification of
alleles using AFLP-PCR is more than offset by the fact that this is a fast, reliable, cost-effective
PCR based method with which to generate a large number of high resolution markers. As a result,
AFLP has been found useful in biodiversity surveys, population and conservation genetics,
Stellenbosch University http://scholar.sun.ac.za
Chapter Two Literature Review
- 21 -
fingerprinting and kinship analyses and QTL mapping. These authors suggest that a combination of
dominant AFLP and codominant microsatellite marker information, together with sequencing
information, are likely to become the primary tools in the study of genetic variation (Mueller &
Wolfenbarger 1999). In a parentage study by Gerber et al. (2000), AFLP was also shown to provide
encouraging results, with the conclusion that 100 to 200 dominant loci (AFLP) or less than 10
highly polymorphic codominant loci (microsatellites) would be adequate to assign parentage.
Development costs would be a driving factor in the decision as to which marker to select for a
study, as would the biological question under consideration. Microsatellite development requires
cloning, sequencing, identification of repeats followed by primer design and testing. It is therefore
time consuming, costly and shown to be very species-specific but it presents the advantages of
multi-allelic and codominant markers which are numerous throughout the genome. AFLP, in
contrast, is more transferable across species and has lower initial development costs; however,
lower informativeness requires that more AFLP markers are required to achieve a comparable level
of assignment when employed in parentage analyses (Gerber et al. 2000; Gaudeul et al. 2004). In
an individual-based population assignment study involving whitefish, Coregonus clupeaformis,
Campbell et al. (2003) show that within a weakly structured population, AFLP provides a suitable
alternative to the logistical issue of screening the large numbers of microsatellite loci required to
provide enough statistical power to be considered useful.
In contrast to applications in parentage analyses, Bernatchez and Duchesne (2000) reveal that
within population assignments, increasing the number of loci (dominant AFLP), is considerably
more important that increasing the number of alleles (codominant microsatellites). For research
projects that aim at large-scale understanding and description of the population structure, the long
term benefits of microsatellite development would need to be considered over the immediate cost
benefits of AFLP development (Campbell et al. 2003).
Microsatellite markers, however, are still considered the marker of choice when these loci are
available and are generally preferred when investigating genetic structure. AFLP are mostly
employed when quick, reliable, large scale, cost-effective surveys are required. However, a
combination of different kinds of molecular markers, when practical, will always prove to be the
most enlightening; especially when each exhibit different characteristics in the form of mutation
rates, segregation or response to evolutionary influences (Gaudeul et al. 2004).
SNPs, a more recent development, describe different alleles containing point mutations at a
given base within a locus and are becoming a focus within molecular marker development for
several reasons: (1) they are the most frequently occurring polymorphism within any organism; (2)
SNPs have significantly lower mutation rates than microsatellites and are hence considered stable
Stellenbosch University http://scholar.sun.ac.za
Chapter Two Literature Review
- 22 -
molecular markers, an essential criteria in evolutionary studies, population biology and pedigree
studies such as parentage analyses; (3) unlike microsatellites, which occur primarily in non-coding
sequences within the genome, SNPs are often found in coding regions thereby having the potential
to affect protein function and expression and consequently are subject to selection forces; (4) they
are amenable to automation and can often reveal hidden polymorphisms undetectable through other
methods (Li et al. 2004; Morin et al. 2004; Rengmark et al. 2005). Both SNPs and microsatellites
have wide scale prospective applications for the long term management of farmed and wild
aquaculture populations (Rengmark et al. 2005).
2.5.5 Application of Molecular Markers in Aquaculture
Rapid advances in the application of molecular genetics in aquaculture investigations has
allowed for studies into genetic variation, ongoing monitoring and control of inbreeding, parentage
assignment studies, strain and species differentiation, hybridisation and cross-breeding of species
(Davis & Hetzel 2000; Jones et al. 2001; Anne 2006). The full spectrum of currently available
molecular markers have been widely utilised and assessed through a variety of studies for the
aquaculture industry. These technologies encompass the following: allozymes, RFLP, mDNA,
RAPD, AFLP, microsatellite markers and more recently SNPs (Liu & Cordes 2004).
Well-designed studies using these markers singularly or in combination, have allowed for a
greater understanding of various aquaculture species; culminating in the construction of high
resolution genetic linkage maps for some (Coimbra et al. 2003; Baranski et al. 2006; Liu et al.
2006; Sekino & Hara 2006). The rapidly expanding wealth of information within the field of
aquaculture will further hasten the identification of quantitative genes involved in controlling trait
loci and the subsequent application of the QTL in marker assisted selection and genomics (Liu &
Cordes 2004).
However, despite all the recent advances, the widespread application of genetic typing as
routine within management practices is still restricted by cost, technical complexity and speed of
existing methods. The use of more than one type of genetic marker in combination or the prudent
selection of the appropriate marker (type and minimum requirement) to answer the biological
question of interest may help to overcome some of these restrictions; producing fast, accurate and
robust results (Gilbey et al. 2005).
Stellenbosch University http://scholar.sun.ac.za
Chapter Two Literature Review
- 23 -
2.6 Microsatellites - The Molecular Marker of Choice?
2.6.1 Microsatellite Markers and their Distribution in the Genome
Microsatellites are simple sequence repeat loci, consisting of two to six nucleotides repeated in
tandem and they represent codominant genetic loci; meaning that heterozygous genotypes are
distinguishable from homozygous genotypes (Chistiakov et al. 2005; Webster & Reichart 2005).
Microsatellite markers are found with relative abundance throughout the entire genome of almost
all living organisms (Sekino & Hara 2006). Lagercrantz et al. (1993) and Ross et al. (2003) found
that the frequency, mutation rate and motif of these repeat sequences varies considerably across
genomes of different species; with recent evidence indicating that their distribution may, indeed,
not be random. Additionally, Kruglyak et al. (1998: as cited in Cruz et al. 2005) found that an
inverse relationship exists between relative abundance and repeat motif; most likely explained by
the higher rates of slippage experienced by shorter motifs (mono and dinucleotides) when compared
to longer ones.
Microsatellites, consisting of the dinucleotide repeat (CA)n, are the most frequently found in
most genomes with high levels of heterozygosity evident. Trinucleotide and tetranucleotide occur
less frequently and with lower heterozygosity levels (Mueller & Wolfenbarger 1999; Chambers &
MacAvoy al. 2000). According to Primmer et al. (1997), there appears to be a propensity for the
density and length of microsatellites to increase as genome size increases whereas in contrast, Deka
et al. (1999) suggest that the genomic frequency of microsatellites is most probably not directly
related to genome size but rather a result of species-specific recombination rates and/or mutation or
repair rates acting within the species under investigation.
It has been further suggested that the number of recombinant clones recovered from species-
specific genomic libraries is an indirect indication of the microsatellite richness within the species
as was observed in related species of bivalve molluscs (Cruz et al. 2005).
2.6.2 The Importance and Application of Microsatellite Markers in Genetics
The increasing interest in microsatellite markers as the marker of choice in applications across
many different fields is motivated by their high degree of polymorphism and relative ease of
scoring. One of the major drawbacks, however, is the need to isolate de novo from species in the
initial stages of examination (Zane et al. 2002).
The size differences between alleles as a result of a varying number of repeat units at a given
microsatellite locus, is the basis for this molecular markers polymorphism (Lui & Cordes 2004).
The jury is still out as to the origin of these length differences but two likely models are presented.
The first model by Schlötterer and Tautz (1992) suggests that microsatellites evolve through
Stellenbosch University http://scholar.sun.ac.za
Chapter Two Literature Review
- 24 -
frameshift mutations resulting from slippage events during DNA replication or repair; while
Richards and Sutherland (1994) present a scenario of unequal recombination. The former model is
likely to represent the principal mutational mechanism for this particular molecular marker.
Microsatellite markers can, in the majority, be classified as Type II markers unless, like
Expressed Sequence Tags (EST) or expressed Single Nucleotide Polymorphisms (eSNP), they are
associated with genes of known function (Jones et al. 2001). The establishment of tight linkage of a
marker to a gene of interest and from which it is then possible to infer the presence of the gene
from the presence of the marker, forms the basis of marker assisted selection (MAS). Breeding
programs can then be used to track the inheritance of this gene and the availability of a clearly
identifiable and quantifiable phenotypic trait/s associated with this same gene and marker is crucial
in the successful implementation of MAS (Chistiakov et al. 2005).
To date, these loci have been adopted for a variety of biological applications: as inheritable
genetic markers in breeding stock selection, characterisation of breeding stocks through parentage
and genotyping analyses, breeding behaviour and population studies, DNA profiling in forensic
investigations and the construction of high density linkage maps mapping economically valuable
traits (QTL) for application in marker assisted breeding, to name but a few (Chambers & MacAvoy.
2000; Chistiakov et al. 2005). Ultimately, the effective use of microsatellite markers relies on good
statistical theories and associated methods for the analysis of the data they produce (Chambers &
MacAvoy 2000).
2.6.3 Microsatellite Multiplexing: Increased Productivity - Reduced Genotyping
The implementation of multiplex PCR, whereby the amplification of several loci within a single
PCR reaction is carried out, is revolutionising DNA laboratories all over the world. Microsatellite
multiplexing is a commanding technique that will allow productivity of genetic studies to be
increased while simultaneously reducing costs (Neff et al. 2000a; Buckleton & Triggs 2006;
Wesmajervi et al. 2006). An optimised multiplex protocol can provide high fidelity and band
resolution and several protocols have been published for both fluorescently labelled primers using
automated detection methods as well as for radioisotope labelling (Neff et al. 2000a; Wesmajervi
2006). Yet despite the clear advantages, many laboratories continue to use single PCR reactions.
This is likely due to the lack of suitable automation required to reduce the complexity of analyses as
well as concern regarding the consistency of genotyping output (Neff et al. 2000a).
As the number of available microsatellite markers rises and the number of loci pooled into one
reaction expands, so does the flexibility to create various combinations of markers. However, as a
result, the chance increases that some loci occur on the same chromosome, with these loci being
Stellenbosch University http://scholar.sun.ac.za

Chapter Two Literature Review
- 25 -
sufficiently close in some instances to complicate parentage and pedigree analyses (Buckleton &
Triggs 2006). Linkage mapping will prove useful in distinguishing which loci may be linked and
proposed multiplexes adjusted accordingly.
An extension to current multiplexing strategies has been reported where the DNA of all the
individuals under investigation within a populations are pooled and simultaneously screened with
primers flanking a microsatellite locus. Only one PCR is employed thereby significantly reducing
the amount of genotyping required. This technique of “selective sweeping” has been proposed as an
approach to identify genes involved in adaption and the result is a complex pattern of peaks
faithfully reflecting the combined pattern of individual alleles (Thomas et al. 2007) Schlötterer
(2003: as cited in Thomas et al. 2007) claims that this systematic scanning could allow population-
specific and locus-specific loss of variation to be traced.
2.7 Genotyping Errors and Artefacts Associated with Microsatellite PCR
2.7.1 Common Sources of Error
Microsatellite genotyping errors will occur in all except the smallest of data sets; and their
potential to weaken downstream analyses reinforces the need to make allowance for these errors
within analysis techniques and software programs (Hoffman & Amos 2005). In reality, genotyping
errors may occur frequently even under optimized PCR conditions and with high quality template
DNA. This is especially true for data where repeat typing is limited or not feasible as a result of cost
or time constraints or limited DNA (Wang 2004).
The most common sources of error are: PCR slippage mutations producing stutter bands which
lead to erroneous allele calling; allele drop-out or null alleles; “misprinting” where amplification
products are generated and incorrectly interpreted as alleles; as well as data entry errors (Hoffman
& Amos 2005; Wang 2005). Hoffman and Amos (2005) found scoring errors to be the most
prevailing source of genotyping errors and also found a positive correlation between locus
polymorphism and/or product size and PCR failure rates and/or allele drop-out rates. They suggest
that primers should either be designed to amplify smaller fragments or to avoid loci producing large
products sizes as a mean to controlling the impact of this phenomenon.
2.7.2 PCR Slippage and Stutter Profiles
Talbot et al. (1995: as cited in Wang 2004) report the mutation rates observed for microsatellite
loci to be as high as 1.4 x 10‾² per generation. Mutational slippage results from polymerase slippage
during DNA replication and leads to a change in the number of repeat units (Miller & Yuan 1997).
Lai and Sun (2004) propose that slippage mutations within repeat sequences dominate over point
Stellenbosch University http://scholar.sun.ac.za

Chapter Two Literature Review
- 26 -
mutations in non-repetitive sequences and that a linear relationship exists between the number of
repeat units and microsatellite slippage mutation rate. Lai and Sun (2003) further found that when
PCR slippage occurs, the probability for contraction of the repeat was higher than the probability
for the repeat to expand and that a threshold repeat number exists under which the mutation rate
becomes too small to be observed. The assumption from their observations in these two studies was
that each repeat unit within a microsatellite mutates independently.
A complication occurring during the analysis of microsatellite data is the appearance of
secondary or shadow bands resulting in extended banding patterns known as stutter patterns or
stutter profiles (Miller & Yuan 1997; Mueller & Wolfenbarger 1999). These extra bands are the
products of PCR slippage and are often a hindrance to assigning alleles correctly in microsatellite
genotyping since they may overlap in heterozygous alleles. The combined intensity forms a skewed
composite pattern leading to possible misinterpretation of the data as a homozygous pattern
(Mueller & Wolfenbarger 1999).
The problem of stutter profiles is observed to be most acute where dinucleotide repeats are
concerned while greatly reduced in tri and tetranucleotide repeats; with further evidence reporting
that longer microsatellite repeats are more prone to producing stutter than shorter microsatellites
(Mueller & Wolfenbarger 1999). The latter observation was made during studies in which mutation
rates for microsatellite slippage extensions and contractions was modelled as a linear function of
repeat unit number (Miller &Yuan 1997). Stutter bands can be reduced and sometimes eliminated
through the optimization of individual PCR conditions and through the use of “hot start” PCR
(Mueller & Wolfenbarger 1999).
2.7.3 Microsatellite Null Alleles
Null alleles continue to pose persistent challenges in populations genetic studies. A
microsatellite null allele is, by definition, any allele at a microsatellite locus that repeatedly fails to
amplify to detectable levels via PCR (Dakin & Avise 2004). Three processes are currently
identified as potentially leading to null alleles at microsatellite loci:
One of the causes of null alleles recurring is point mutations at primer sites resulting in poor
primer annealing. In addition, null alleles can be generated by preferential amplification of allele
size variants due to the competitive nature of PCR and the more efficient amplification of shorter
alleles. The larger allele is reported to “drop-out” and a null allele resulting from this preferential
amplification is sometimes referred to as a “partial null”. Loading more of the sample or adjusting
contrast may, in some cases, allow this partial null to be observed. A final cause of null alleles, and
one which can be controlled to some extent, involves inconsistent PCR failure as a result of poor
Stellenbosch University http://scholar.sun.ac.za
Chapter Two Literature Review
- 27 -
DNA quality or low DNA quantity. The unpredictability of PCR amplification due to poor DNA
quality makes it difficult to identify when this is indeed the cause of the null allele (Dakin & Avise
2004).
Since the presence of null alleles can severely bias estimations of allele and genotype
frequencies, it is important to accurately identify them as the source of homozygous excess and
estimate their occurrence (van Oosterhout et al. 2006). Chakraborty et al. (1992: as cited in Dakin
& Avise 2004) reflect that it is important to recognise, however, that populations that are out of
Hardy Weinberg equilibrium and the subsequent heterozygote deficiency associated with this
occurrence, may not always be as a result of null alleles but could also be due to other biological
factors such as: population substructure, inbreeding, selection occurring at or near the locus or sex
linkage. Marshall et al. (1998) recommend that any loci with a null allele frequency greater than
0.05 (5%) should be excluded from future analyses.
Solutions presented to alleviate non-amplifying alleles encompass the lowering of PCR
stringency conditions to allow for base pair mismatches or to redesign primers further away from
the microsatellite where it is proposed that mutations more readily accumulate (Pemberton et al.
1995). In a study by Dakin and Avise (2004), approximately ninety percent of reported studies were
found to include loci with null alleles at a frequency less than p < 0.40 and usually less than p <
0.20, but that only a very small portion of these studies integrated statistical corrections to
accommodate the effects thereof. Many software programs designed to analyse microsatellite data
for various end applications, take cognisance of and factor in the presence of null alleles into their
calculations while providing an estimation of the frequency thereof in the data set under analysis.
Examples include CERVUS 2.0 (Marshall et al. 1998), the program used in the parentage
assignment analyses within this study.
2.8 Parentage Assignments
2.8.1 Assignment of Individuals to Families and Populations
Genetic breeding programs incorporate information for selection candidates as well as relatives
in an effort to increase the accuracy of selection and hence the subsequent genetic gain (Villanueva
2002). One of the difficulties encountered with the implementation of effective breeding programs
is the establishment and maintenance of pedigree information. The rearing of families in isolation
until animals are large enough to be physically tagged is impractical and introduces confounding
environmental effects which may mask the genetic effects under study (Norris et al. 2000).
The effective tracing of individuals to both families and populations has a powerful application
within an aquaculture environment where the species are highly prolific and minimising inbreeding
Stellenbosch University http://scholar.sun.ac.za
Chapter Two Literature Review
- 28 -
as a means to maximising response to artificial selection is an important goal (Norris et al. 2000;
Jerry et al. 2004). As a result, the use of genetic tags as opposed to physical tracking and the
establishment of pedigrees and parentage using codominant molecular markers are finding
increasing application within aquaculture genetic breeding programs (Norris et al. 2000; Selvamani
et al. 2001). The use of genetic tags in aquaculture enhancement programs allows the reproductive
potential of hatchery based breeding stock to be assessed. However, the successful advancement of
genetic gain is affected by factors such as the number, quality and variability of the molecular
markers used, the completeness of sampling of all candidate animals to be used in pedigree analyses
and assignments, the number of potential parents and the heritability of the trait of interest
(Selvamani et al. 2001; Dodds et al. 2005). The most significant benefit of DNA parentage
assignments is that the technique is non-invasive and can be applied in retrospect, once the growth
of the animals has been evaluated (Jerry et al. 2004).
Not all microsatellite markers that are developed are suitable for assigning parentage and a
thorough assessment should be conducted prior to including them in analyses. Many loci have
segregating null alleles, are difficult to score reproducibly or do not amplify reliably. The
inheritance of all markers should be tested against known parent-offspring relationships and any
problematic markers should be excluded from future assignments (Jerry et al. 2004).
2.8.2 Software for Parentage Assignment - An Overview
2.8.2.1 Deciding Which Method is Best
Analysing the genetic diversity inherent in every living species is crucial in our understanding of
the evolutionary process at both population and genome level (Excoffier & Heckel 2006). To fully
comprehend the genetic variation present for numerous economically valuable traits, family lines
need to be established and evaluated through the use of pedigree information of mass-spawned
offspring (Elliot 2000). A barrage of statistical approaches and related software packages for the
analysis of parentage within natural and experimental populations has followed in the wake of the
DNA molecular marker boom and the details and implementation of the various techniques differ in
ways that can influence the final output (Jones & Ardren 2003; Taggart 2007). The available
programs offer both standard and more complex analyses; however, they rely to a large extent on
assumptions that are fundamental to the correct interpretation of results (Excoffier & Heckel 2006).
When evaluating a potential software program, the underlying algorithm and its ability to
handle null alleles, genotyping errors and weak linkage between loci, are important criteria against
which to assess the prospective program‟s suitability to address the research problem at hand. It has
further been suggested that the analysis of a data set using of a number of different statistical
Stellenbosch University http://scholar.sun.ac.za