microscale magnetic field modulation ...nanolitesystems.org/wp-content/...microscalemodul.pdf ·...
TRANSCRIPT

Microscale Magnetic Field Modulationfor Enhanced Capture and Distribution ofRare Circulating Tumor CellsPeng Chen1, Yu-Yen Huang3, Kazunori Hoshino2 & John X. J. Zhang3
1Department of Biomedical Engineering, University of Texas at Austin, Austin, TX 78712, USA, 2Department of BiomedicalEngineering, University of Connecticut, Storrs, CT 06269, USA, 3Thayer School of Engineering, Dartmouth College, NH 03755,USA.
Immunomagnetic assay combines the powers of the magnetic separation and biomarker recognition andhas been an effective tool to perform rare Circulating Tumor Cells detection. Key factors associated withimmunomagnetic assay include the capture rate, which indicates the sensitivity of the system, anddistributions of target cells after capture, which impact the cell integrity and other biological properties thatare critical to downstream analyses. Here we present a theoretical framework and technical approach toimplement a microscale magnetic immunoassay through modulating local magnetic field towards enhancedcapture and distribution of rare cancer cells. Through the design of a two-dimensional micromagnet array,we characterize the magnetic field generation and quantify the impact of the micromagnets on rare cellseparation. Good agreement is achieved between the theory and experiments using a human colon cancercell line (COLO205) as the capture targets.
Rare cell separation has been an important emerging process towards early diagnosis of diseases such ascancer1. In particular, Circulating Tumor Cells (CTCs), referring to the cells that have shed into thevasculature from a primary tumor site, and circulate in the bloodstream, have been demonstrated to be
clinically significant due to its values in cancer diagnosis, prognosis and treatment monitoring2–4. The detectionprocess usually involves the enrichment of the CTCs from interfering background hematocyte cells, beforecarrying on subsequent analyses5. To overcome the challenges of the natural rareness, a variety of approacheshave been investigated towards efficient separation based on mechanisms such as adhesion6, filtration7, dielec-trophoretic separation8, hydrodynamic manipulation9,10, and magnetic attraction11,12. Among these popularmethods, the magnetic activated system in combination with immunoassay (also known as ‘immunomagneticassay’) shows great potential, especially in its low detection limit, high sensitivity, specificity and throughput,which are all necessary for effective clinical applications12.
Immunomagnetic assay usually works by selectively labeling the target cells with magnetic tags through specificbiomarkers, and using magnetic force generated by permanent magnets to drive the cells for separation. It hasbeen widely used for cell detecting, sorting and manipulating13–16, as summarized in previous review17. However,in traditional immunomagnetic assays, the efficacy of the magnetic field generated by permanent magnets(usually in the scales of centimeter or millimeter) is limited by the low value of magnetic field gradient andthe low density of traps. Consequently, the target cells and magnetic tags tend to be captured and aggregated in aconfined area. The aggregation may directly impact the structural integrity or quench the fluorescent signals fromthe target cells, all of which may interfere with cell imaging, identifying and weaken the strength of this approach.We propose a potential solution to the aggregation issue by modulating the in-channel magnetic field throughimplementing microscale magnetic structures – ‘micromagnets’, which are designed to generate localized strongmagnetic field gradient upon magnetization and create multiple distributed capture sites.
Modulating magnetic field is critical in a variety of applications, such as cell proliferation regulating18, magneticparticle trapping and manipulating19–21, and chemical kinetic modulation22,23. It usually associates with preciseconfinement of the magnitude and distribution of the magnetic field and gradient. As for separation purposes,several early studies have been reported on the integration of micromagnets with microfluidic systems. Forexample, nickel micro-strips have been fabricated to separate leukocytes from whole human blood as magnetictracks24. Arrays of nickel posts are used in a microfiltration device to separate magnetic beads from non-magneticbeads25. Shrink-induced magnetic traps are used to extract DNA samples for qPCR studies26. Thermomagnetically
OPEN
SUBJECT AREAS:
ISOLATION, SEPARATIONAND PURIFICATION
LAB-ON-A-CHIP
Received9 July 2014
Accepted2 February 2015
Published4 March 2015
Correspondence andrequests for materials
should be addressed toX.J.Z. (john.zhang@
dartmouth.edu)
SCIENTIFIC REPORTS | 5 : 8745 | DOI: 10.1038/srep08745 1
patterned micromagnets are used to separate magnetic and non-magnetic micro-particles from a mixed solution27,28.
However, for rare cancer cell studies, the aforementioned micro-magnet structures might not serve the purpose. Since the cancer cellsare rather fragile29, the relatively large thickness (.5 mm) of theprevious structures might cause physical damages to the cells dueto collisions. Therefore, we pursue an ultra-thin structure with sub-micrometer thickness to minimize possible damages to the cells.Additionally, in the demonstrated applications using aforemen-tioned micromagnets to sort targets with large sub-populations, suchas white/red blood cells24, magnetic/non-magnetic microbeads27,28,separation efficiency is the major key parameter that matters.However, when it comes to rare cell studies, each captured target cellneeds to be individually addressable, structurally distinguishable,fluorescently visible, and potentially retrievable to facilitate down-stream analyses. It posts extra requirements on avoiding cell aggrega-tion. Therefore, we adopt an array design, anticipating the arraycaptures cells discretely and provide a promising tool to generatebetter distribution of the captured CTCs.
In the proposed device, we take a multi-dimensional approach –using permanent magnets for a long-range attraction, and usingthin-film micromagnets for short-range retaining. Since magneticfield gradient increases as the size of the magnetic source downscaled,the interactions between target cells and magnetic field can be sig-nificantly enhanced on the channel substrate due to the ferromag-netic micromagnets. The patterned thin-film micromagnet approachis also appealing in that the magnetic field enhancement can berealized at ultimately single cell resolution, and can be well controlledby adjusting the geometries, materials, and distributions of themicromagnets during the design and fabrication stages. More impor-tantly, considering the small size of the micromagnets, they can beeasily implemented into most of the current immunomagnetic assaysseamlessly without affecting other functional components or sacrifi-cing the system throughput.
In this paper, we demonstrate the enhanced capture and distri-bution for CTCs detection by modulating the surface magnetic fieldwith low-profile microscale magnetic structures. We first present thetheoretical framework and analytical models to describe the physicsof the thin-film micromagnet array implementation. The model isdescribed with more details below in the Methods section. Briefly, atwo-dimensional micromagnet array model is taken to characterizethe magnetic field generated by the micromagnet elements, whichalso helps define key parameters such as the effective range. In addi-tion, we build a two-dimensional model simulating the immuno-magnetic assay, and investigate the impact of the micromagnets onrare CTCs detection with primary focus on altering the cell distri-bution. Then, to validate our models, we perform screening experi-ments using thin film micromagnets for the enrichment of COLO205cells (a type of human colorectal cancer cell line) from whole bloodsamples. Previous studies have revealed the similarities between cul-tured cancer cells and CTCs from patients in terms of morphology30
and biomarker5. Therefore, cultured cancer cells have been widelyused to demonstrate CTC detection system, including PC3, SKBR-3,T-24, MCF-7, and COLO2055,6,31–33. Here we choose a colorectalcancer cell line (COLO205) as our separation target.
ResultsThin-film micromagnet design, magnetization and integra-tion with immunomagnetic assay. The concept of the thin-filmmicromagnet integrated with a microfluidic based immuno-magnetic assay is illustrated in Figure 1(a), where ferromagneticthin films are patterned on the substrate of a microchannel. TargetCTCs are labeled with magnetic nanoparticles based on cancer specificantibodies. When the blood sample flows through the microchannel,CTCs are attracted by the permanent magnets, which are placedoutside the channel, and trapped by the thin film micromagnets on
the channel substrate while normal blood cells are unaffected and flowout of the channel. It is noteworthy that during the experiments, themicrochannel is placed in an inverted orientation to take advantage ofthe gravity in separating the CTCs from blood cells34.
Specifically, the geometries and layouts of the micromagnet arraycan be defined using microfabrication techniques such as photolitho-graphy. The entire device is placed on top of a permanent magnetsarray. After being magnetized by the external magnetic field, theferromagnetic element generates strong localized field to increasethe magnetic force applied on the target cells, as shown in Figure 1(b).
The magnetization process of soft magnetic materials has been wellestablished using the concept of magnetic anisotropy and demagnet-izing field, as shown in Figure 1(c)35. Briefly, upon application of an
external magnetic field Hext��!
with an angle to the net magnetization M!
of the sample, M!
is rotated by the torque exerted by Hext��!
with anangle h from the equilibrium direction, which is usually the long axis.In a permanent magnet analysis, for magnetic structure with largeaspect ratio (our case 20 mm5200 nm 5 10051), shape inducedanisotropy plays a dominate role in the magnetization process.Therefore, the assumption h 5 0 is made to simplify the calculation,only magnetization parallel to the long axis is considered. We incorp-orate the magnetic anisotropy theory to describe the magnetizationprocess induced by the in-plane component of the external magneticfield, which is parallel to the micromagnets.
Magnetic field and effective range characterization of the thin-film micromagnets. We first calculate the magnetic field generatedby a single micromagnet element. In our system, the micromagnetsare made with nickel (Ni). The dimension of each micromagnet is20 mm (width) 3 200 nm (thickness). The saturation magnetizationof nickel is found to be 55.1 emu/g36 (can be converted to volumemagnetization of Mes 5 4.9 3 105 A?m21). We plot the distribution ofboth X and Y components of the magnetic field along horizontal lines(240 mm , x , 40 mm), at three different heights (h 5 5 mm,10 mm and 15 mm) on top of the micromagnet.
The results can be seen in Figure 2 ((a) Bx (b) By), in which themicromagnet is shown as a gray box to indicate the position (size isnot to scale). The magnetic field curves are shape-coded according tothe heights of the plotting. The magnetic field generated by themicromagnet decays fast in both vertical and horizontal directions.Since the value of magnetic force is largely dependent on the prop-erties of the targets, we study the gradient +B2 as an indirect butobjective measurement of the magnetic force. We plot the magneticfield gradient (+B2) at the same heights. The results are presented inFigure 2(c) (+B2
x) and Figure 2(d) (+B2y). The negative values of the
gradient in Y direction indicate that the micromagnet generatesattractive force towards the micromagnet that helps retaining the cells.
To calibrate the strength of the micromagnets, we define the effec-tive range of a micromagnet element as the distance where magneticforce acting on the cells is equivalent to the gravitational force. Asshown in Figure 1(a), when the cells are on the bottom, they aredriven by the magnetic forces from the permanent magnets (Fm,p)and micromagnets (Fm,m), and the gravitational force (Fg). To sim-plify the calculation, friction force between the cells and the channelsurface is neglected37. The magnetic force generated by the perman-ent magnets overweighs the other two, and dominates the motion ofthe cancer cells34. Therefore, to investigate the effect of the micro-magnets solely, we make the comparison between the gravitationalforce and the magnetic force provided by the micromagnets.According to our previous calculations, the gravitational force on asingle cancer cell is Fg 5 1.3 3 10212[N]34, and an equivalent mag-netic force determines the threshold magnetic gradient to be+B2~0:3 T2
�m. Therefore, the vertical effective range (in Y dir-
ection) is determined to be 15 mm. As for the lateral range (in Xdirection), we make the decision by examining the gradient at
www.nature.com/scientificreports
SCIENTIFIC REPORTS | 5 : 8745 | DOI: 10.1038/srep08745 2

10 mm on top of the micromagnets, which corresponds to the centerof the CTCs when trapped on the surface (typical diameter of CTCs is,20 mm)7. The lateral range is found to be 615 mm. The fact that theeffective capture range of the micromagnet is comparable to the sizeof a single cancer cell indicates that only a few cells can interact fullywith each micromagnet through its magnetic field. It helps distributecell populations across the substrate covered by the network ofmicromagnet elements.
CTC clusters were discovered in the blood of cancer patients,which might be clinically important, but the mechanism behind ithas not been fully understood38. Compared to single cell, a cluster iseasier to capture (refer to the derivation for the cell cluster motion inthe Methods section), and may cause errors in cell identification andcounting. To break the cell clusters, the cell suspension is mixed andincubated with trypsin, which works by cleaving bonding proteins,until over 90% of the cells are individually dispersed. Then the cellsuspension is spiked into the blood sample.
In addition, we perform calculations for micromagnet array (anarray of 3 elements linearly aligned is used as an example), with themagnetization along the horizontal direction. The dimensions ofeach micromagnet are consistent with the single element study(20 mm 3 200 nm), and the edge-to-edge distance between adjacentmicromagnets is 100 mm. The magnetic field (X/Y components)
along a horizontal line 10 mm on top of the micromagnet array isshown in Figure 3(a). The X/Y components of the gradient are shownin Figure 3(b). The magnetic field and gradient generated by micro-magnet array exhibits the same characteristics as single element, withthe profiles being spatial repetition of single micromagnet.
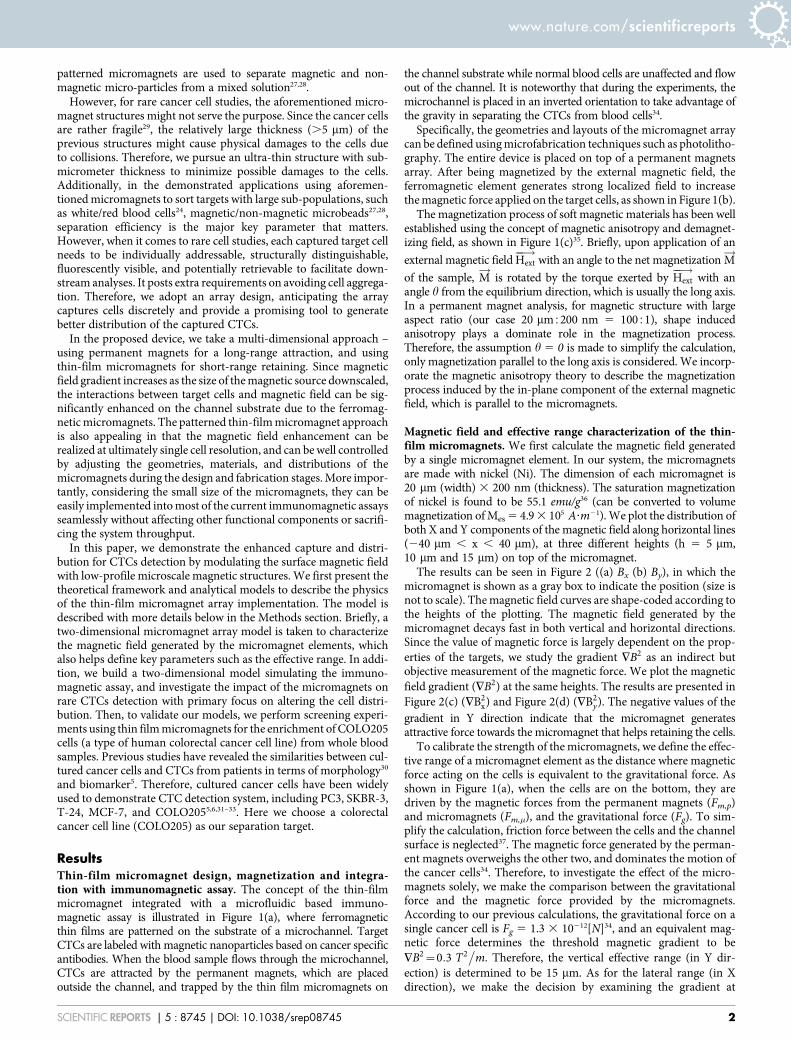
Impact of the micromagnet array on the rare CTC separation. Toinvestigate the impacts of the thin-film micromagnet array on rareCTCs separation, we incorporate the micromagnets into a two-dimensional theoretical model simulating a microchip basedimmunomagnetic assay and trace the movements of the targetcells. Key design parameters of the microchip, and detailedintroduction are included in the Methods section. We divide themotion of the target cells into two stages - (i) in free space and (ii)on solid surface after hitting the channel substrate to obtain the finallocations of the captured cancer/target cells. More details about thecell tracking algorithm can be found in the Methods section. In thefirst stage, the cells are attracted by the permanent magnets andgradually move towards the substrate as they flow through thechannel. In the second stage, cells continue moving under thecombined influence of the permanent magnets and micromagnets.The calculated histograms of the final positions of the captured cellsare shown in Figure 4(a), (b) for micromagnet and plain slide
Figure 1 | Schematic of the patterned thin-film micromagnet integration, design and magnetization process. (a) Schematic of the microchip based
immunomagnetic assay integrated with micromagnets, and the major forces applied on the cells when they are on the substrate. (b) Concept of the
micromagnet design - after being magnetized by the external magnetic field, the ferromagnetic micromagnets generate strong localized field to increase
the magnetic force applied on the target cells. (c) Magnetization process of the soft-magnetic micromagnets using the theory of magnetic anisotropy and
demagnetizing field.
www.nature.com/scientificreports
SCIENTIFIC REPORTS | 5 : 8745 | DOI: 10.1038/srep08745 3

(standard glass slide) separately. On plain slide, most of the cells arecaptured and aggregated in a confined area, where the front edge ofthe permanent magnet lies (refer to the paragraph about theimmunomagnetic assay model in the Methods section for theposition of the permanent magnet). In contrast, micromagnet slideexhibits a broader cell distribution spectrum from the inlet to thefront edge of the permanent magnets as expected. We calculate theaverage distance of all the captured cells to the inlet, and make thecomparison between the plain slides and micromagnet slides. Basedon the simulation data, the average distance on plain slide is 9.2 6
0.7 mm (n 5 150), and 7.9 6 2.5 mm (n 5 150) on micromagnetslides. Compared to the plain slides, the micromagnets change theaverage distance. The simulation results indicate that the micromagnetarray re-arranges the magnetic field inside the microchannel andimproves the distribution patterns of the captured CTCs.
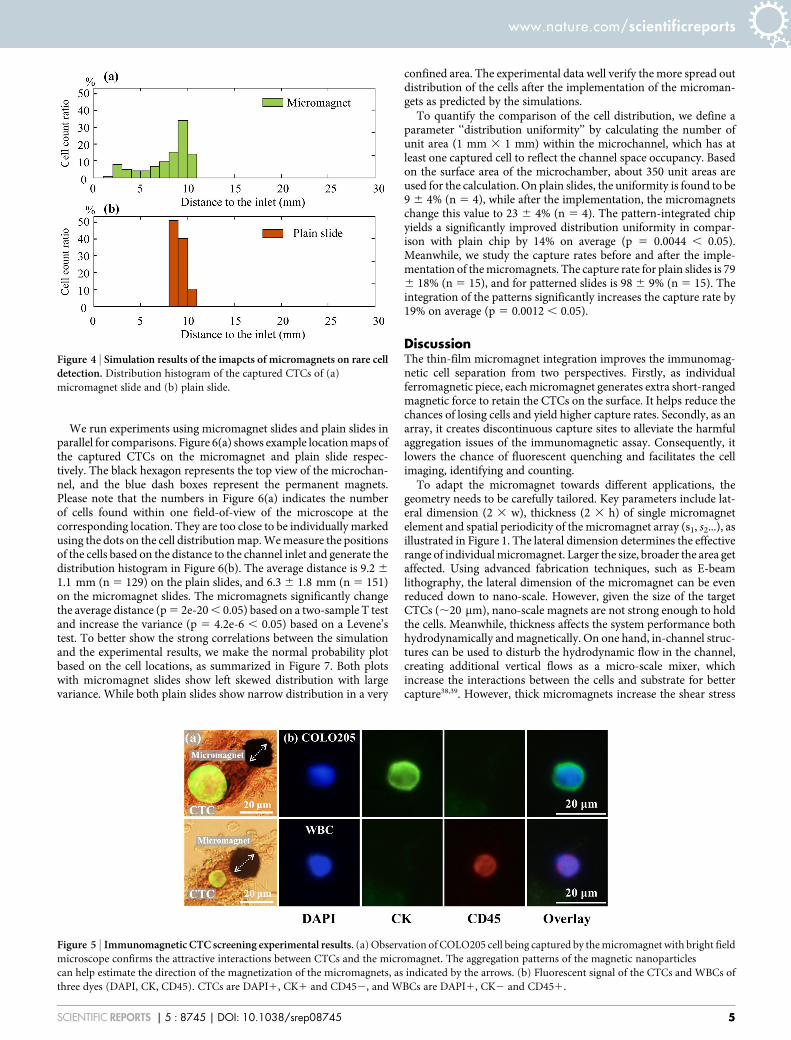
Experimental results of separating CTCs from blood samples. Toverify the simulation results, we carry out screening experiments toseparate cultured COLO205 cells (human colorectal cancer cell line)from blood samples. After the screening process, the experimentalslides are stained with three fluorescent dyes (DAPI, anti-cytokeratinand anti-CD45) targeting different cellular components foridentification. Details of the experimental protocol are reported inthe Methods section. We could directly observe the target cells beingcaptured by the micromagnets under bright field microscope, asshown in Figure 5(a), which confirms the magnetic attractiveinteractions between the micromagnets and the CTCs. InFigure 5(a), we could observe some roughness at the edges of themicromagnets. These small structures could further increase themagnetic field gradient nearby. However, considering their smallsize (,2 mm) compared to the size of a cancer cell or a micro-magnet, the effect of the roughness on the cell separation can beneglected. In addition, we could observe the aggregation of themagnetic nanoparticles around the micromagnets, as is shown inthe ‘‘brown stains’’ in Figure 5(a). The directional aggregationpattern provides a simple clue to estimate the direction of themagnetization of the micromagnets, as shown by the arrows inFigure 5(a). Besides, the aggregated nanoparticles, as magneticmaterials themselves, can potentially increase the effective range ofthe micromagnets. Figure 5(b) shows the fluorescent images of acaptured COLO205 cells (DAPI1, CK1 and CD452) and onewhite blood cell (DAPI1, CK2 and CD451) for comparison.
Figure 3 | Magnetic field (a) and magnetic field gradient (b) of a linear array of three micromagnets. Figures are plotted 10 mm on top of the
micromagnet array.
Figure 2 | Magnetic field and gradient calculated for a singlemicromagnet element (a) Bx, (b) By, and the magnetic field gradient(c) +B2
x and (d) +B2y . The gray box indicates the positions of the
micromagnet. The curves are plotted along horizontal lines (from 240 mm
to 40 mm) with different heights (h 5 5 mm, 10 mm and 15 mm) on top of
the micromagnet.
www.nature.com/scientificreports
SCIENTIFIC REPORTS | 5 : 8745 | DOI: 10.1038/srep08745 4
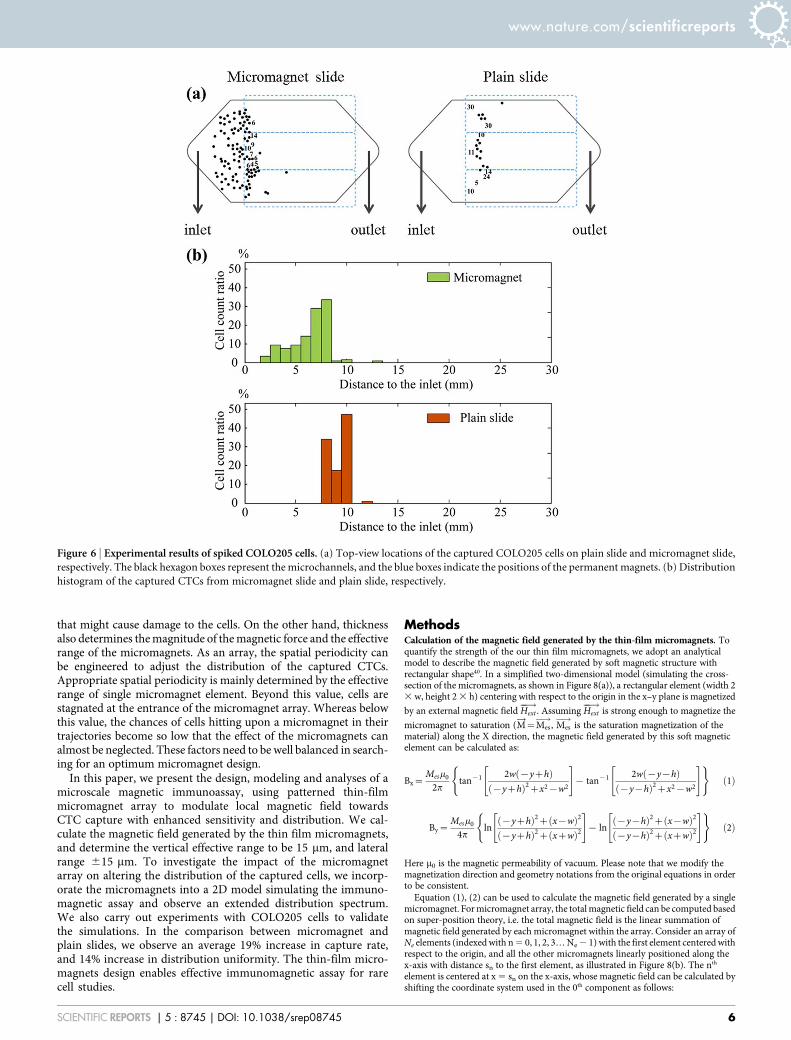
We run experiments using micromagnet slides and plain slides inparallel for comparisons. Figure 6(a) shows example location maps ofthe captured CTCs on the micromagnet and plain slide respec-tively. The black hexagon represents the top view of the microchan-nel, and the blue dash boxes represent the permanent magnets.Please note that the numbers in Figure 6(a) indicates the numberof cells found within one field-of-view of the microscope at thecorresponding location. They are too close to be individually markedusing the dots on the cell distribution map. We measure the positionsof the cells based on the distance to the channel inlet and generate thedistribution histogram in Figure 6(b). The average distance is 9.2 6
1.1 mm (n 5 129) on the plain slides, and 6.3 6 1.8 mm (n 5 151)on the micromagnet slides. The micromagnets significantly changethe average distance (p 5 2e-20 , 0.05) based on a two-sample T testand increase the variance (p 5 4.2e-6 , 0.05) based on a Levene’stest. To better show the strong correlations between the simulationand the experimental results, we make the normal probability plotbased on the cell locations, as summarized in Figure 7. Both plotswith micromagnet slides show left skewed distribution with largevariance. While both plain slides show narrow distribution in a very
confined area. The experimental data well verify the more spread outdistribution of the cells after the implementation of the microman-gets as predicted by the simulations.
To quantify the comparison of the cell distribution, we define aparameter ‘‘distribution uniformity’’ by calculating the number ofunit area (1 mm 3 1 mm) within the microchannel, which has atleast one captured cell to reflect the channel space occupancy. Basedon the surface area of the microchamber, about 350 unit areas areused for the calculation. On plain slides, the uniformity is found to be9 6 4% (n 5 4), while after the implementation, the micromagnetschange this value to 23 6 4% (n 5 4). The pattern-integrated chipyields a significantly improved distribution uniformity in compar-ison with plain chip by 14% on average (p 5 0.0044 , 0.05).Meanwhile, we study the capture rates before and after the imple-mentation of the micromagnets. The capture rate for plain slides is 796 18% (n 5 15), and for patterned slides is 98 6 9% (n 5 15). Theintegration of the patterns significantly increases the capture rate by19% on average (p 5 0.0012 , 0.05).
DiscussionThe thin-film micromagnet integration improves the immunomag-netic cell separation from two perspectives. Firstly, as individualferromagnetic piece, each micromagnet generates extra short-rangedmagnetic force to retain the CTCs on the surface. It helps reduce thechances of losing cells and yield higher capture rates. Secondly, as anarray, it creates discontinuous capture sites to alleviate the harmfulaggregation issues of the immunomagnetic assay. Consequently, itlowers the chance of fluorescent quenching and facilitates the cellimaging, identifying and counting.
To adapt the micromagnet towards different applications, thegeometry needs to be carefully tailored. Key parameters include lat-eral dimension (2 3 w), thickness (2 3 h) of single micromagnetelement and spatial periodicity of the micromagnet array (s1, s2...), asillustrated in Figure 1. The lateral dimension determines the effectiverange of individual micromagnet. Larger the size, broader the area getaffected. Using advanced fabrication techniques, such as E-beamlithography, the lateral dimension of the micromagnet can be evenreduced down to nano-scale. However, given the size of the targetCTCs (,20 mm), nano-scale magnets are not strong enough to holdthe cells. Meanwhile, thickness affects the system performance bothhydrodynamically and magnetically. On one hand, in-channel struc-tures can be used to disturb the hydrodynamic flow in the channel,creating additional vertical flows as a micro-scale mixer, whichincrease the interactions between the cells and substrate for bettercapture38,39. However, thick micromagnets increase the shear stress
Figure 4 | Simulation results of the imapcts of micromagnets on rare celldetection. Distribution histogram of the captured CTCs of (a)
micromagnet slide and (b) plain slide.
Figure 5 | Immunomagnetic CTC screening experimental results. (a) Observation of COLO205 cell being captured by the micromagnet with bright field
microscope confirms the attractive interactions between CTCs and the micromagnet. The aggregation patterns of the magnetic nanoparticles
can help estimate the direction of the magnetization of the micromagnets, as indicated by the arrows. (b) Fluorescent signal of the CTCs and WBCs of
three dyes (DAPI, CK, CD45). CTCs are DAPI1, CK1 and CD452, and WBCs are DAPI1, CK2 and CD451.
www.nature.com/scientificreports
SCIENTIFIC REPORTS | 5 : 8745 | DOI: 10.1038/srep08745 5
that might cause damage to the cells. On the other hand, thicknessalso determines the magnitude of the magnetic force and the effectiverange of the micromagnets. As an array, the spatial periodicity canbe engineered to adjust the distribution of the captured CTCs.Appropriate spatial periodicity is mainly determined by the effectiverange of single micromagnet element. Beyond this value, cells arestagnated at the entrance of the micromagnet array. Whereas belowthis value, the chances of cells hitting upon a micromagnet in theirtrajectories become so low that the effect of the micromagnets canalmost be neglected. These factors need to be well balanced in search-ing for an optimum micromagnet design.
In this paper, we present the design, modeling and analyses of amicroscale magnetic immunoassay, using patterned thin-filmmicromagnet array to modulate local magnetic field towardsCTC capture with enhanced sensitivity and distribution. We cal-culate the magnetic field generated by the thin film micromagnets,and determine the vertical effective range to be 15 mm, and lateralrange 615 mm. To investigate the impact of the micromagnetarray on altering the distribution of the captured cells, we incorp-orate the micromagnets into a 2D model simulating the immuno-magnetic assay and observe an extended distribution spectrum.We also carry out experiments with COLO205 cells to validatethe simulations. In the comparison between micromagnet andplain slides, we observe an average 19% increase in capture rate,and 14% increase in distribution uniformity. The thin-film micro-magnets design enables effective immunomagnetic assay for rarecell studies.
MethodsCalculation of the magnetic field generated by the thin-film micromagnets. Toquantify the strength of the our thin film micromagnets, we adopt an analyticalmodel to describe the magnetic field generated by soft magnetic structure withrectangular shape40. In a simplified two-dimensional model (simulating the cross-section of the micromagnets, as shown in Figure 8(a)), a rectangular element (width 23 w, height 2 3 h) centering with respect to the origin in the x–y plane is magnetized
by an external magnetic field Hext��!
. Assuming Hext��!
is strong enough to magnetize the
micromagnet to saturation (M!
~Mes�!
, Mes�!
is the saturation magnetization of thematerial) along the X direction, the magnetic field generated by this soft magneticelement can be calculated as:
Bx~Mesm0
2ptan{1 2w {yzhð Þ
{yzhð Þ2zx2{w2
" #{ tan{1 2w {y{hð Þ
{y{hð Þ2zx2{w2
" #( )ð1Þ
By~Mesm0
4pln
{yzhð Þ2z x{wð Þ2
{yzhð Þ2z xzwð Þ2
" #{ ln
{y{hð Þ2z x{wð Þ2
{y{hð Þ2z xzwð Þ2
" #( )ð2Þ
Here m0 is the magnetic permeability of vacuum. Please note that we modify themagnetization direction and geometry notations from the original equations in orderto be consistent.
Equation (1), (2) can be used to calculate the magnetic field generated by a singlemicromagnet. For micromagnet array, the total magnetic field can be computed basedon super-position theory, i.e. the total magnetic field is the linear summation ofmagnetic field generated by each micromagnet within the array. Consider an array ofNe elements (indexed with n 5 0, 1, 2, 3… Ne 2 1) with the first element centered withrespect to the origin, and all the other micromagnets linearly positioned along thex-axis with distance sn to the first element, as illustrated in Figure 8(b). The nth
element is centered at x 5 sn on the x-axis, whose magnetic field can be calculated byshifting the coordinate system used in the 0th component as follows:
Figure 6 | Experimental results of spiked COLO205 cells. (a) Top-view locations of the captured COLO205 cells on plain slide and micromagnet slide,
respectively. The black hexagon boxes represent the microchannels, and the blue boxes indicate the positions of the permanent magnets. (b) Distribution
histogram of the captured CTCs from micromagnet slide and plain slide, respectively.
www.nature.com/scientificreports
SCIENTIFIC REPORTS | 5 : 8745 | DOI: 10.1038/srep08745 6

B nð Þx x,yð Þ~B 0ð Þ
x x{sn,yð Þ ð3Þ B nð Þy x,yð Þ~B 0ð Þ
y x{sn,yð Þ ð4Þ
Please note that Figure 8(b) is essentially the cross-section shown in Figure 1(b).Eventually, the total field of the element array can be obtained by adding up the fieldcomponents from all the micromagnet elements,
Bx x,yð Þ~XNe{1
n~0
Bx x{sn,yð Þ ð5Þ
By x,yð Þ~XNe{1
n~0
By x{sn,yð Þ ð6Þ
Magnetic separation and cell tracking algorithm. In order to investigate theinfluence of the micromagnets on the separation of rare cells, we build a theoreticalmodel to trace the target cells. We divide the motion of the target cells into two stages -(i) in free space and (ii) on solid surface after hitting the channel substrate. In the firststage, permanent magnets provide the primary long-range attraction. Motions of asingle cell is determined by the magnetic force (Fm,cell) and the drag force (Fd,cell), eachcan be calculated as13,34:
Fm,cell~VDxc
2m0+B2 ð7Þ
Fd,cell~6pgRcDvcell ð8Þ
Figure 7 | Normal probability plots of the cumulative probability of finding cells at certain locations from micromagnet and plain slides, respectively.(a), (c) are the plots with micromagnet slides, both showing a left skewed distribution with larger variance. (b), (d) are the plots with plain slides,
showing a narrow distribution in a confined area.
Figure 8 | Analytical models to calculate the magnetic field generated bythe thin-film micromagnets. (a) a single micromagnet element
magnetized along the x axis. (b) an array of micromagnet elements aligned
linearly on the substrate, with certain periodicity.
www.nature.com/scientificreports
SCIENTIFIC REPORTS | 5 : 8745 | DOI: 10.1038/srep08745 7

Here g is the medium viscosity, Rc is the radius of the cells, Dvcell is the relative cellvelocity to the medium, m0 is the magnetic permeability of vacuum, B is the magneticfield intensity, and Dxc is the effective magnetic susceptibility of the cells, which isgiven by
Dxc~NR3
p
R3cDxp ð9Þ
Here Rp is the radius of the magnetic nanoparticles used to label the cells, Dxp is themagnetic susceptibility of the nanoparticle, and N is the number of nanoparticles percell. Assuming the cells are in quasi-static motion, which equates the drag force to themagnetic force (Fd,cell 5 Fm,cell), the relative velocity of a single cell can be representedas:
Dvcell~NR3
pDxp
9m0gRc+B2 ð10Þ
The final velocity of a single cell is the vector addition of the flow velocity (vflow) andthe relative velocity:
vc!~vflow
��!zvcell�! ð11Þ
In the second stage, cells are already on the substrate of the microchannel andcontinue moving. To determine the final capture locations, we set up the criteria thatif the value of the velocity perpendicular to the substrate vy
!�� �� became larger than thecomponent parallel to the substrate vx
!�� �� with a factor l (Equation (12)), the cells arefully stopped because the forces on the cells tend to stop them more than pushingforward.
vy!�� ��wl: vx
!�� �� ð12Þ
Otherwise, the cells keep moving on the substrate until the condition in Equation (12)is met24. Therefore, the short-range retaining force provided by the micromagnetsessentially increases the value of vy
!�� ��, creating additional sites that meet these criteriafor a firm capture.
Motion of the cell cluster. Considering a cell cluster contains n single cells, themagnetic force applied Fm,cluster on the cluster is:
Fm,cluster~n:Fm,cell~n:VDxc
2m0+B2 ð13Þ
The drag force is dependent on the effective hydrodynamic size of the cluster, and canbe computed as:
Fd,cluster~6pgRclusterDvcluster ð14Þ
Under the same quasi-static motion assumption (Fd,cluster 5 Fm,cluster), the relativevelocity of the cluster is:
Dvcluster~nNR3
pDxp
9m0gRcluster+B2 ð15Þ
Based on the relation between a cluster and a single cell in their effective sizes Rcluster ,
n ? Rc, the relative velocity of the cluster is always larger than the value of a single cell:
DvclusterwDvcell ð16Þ
Equation (16) indicates that the cell cluster is more responsive to the magneticattraction and is expected to be captured more easily.
Parameters used in the calculations are: Dxp~5 SIð Þ, Rp 5 50 nm, Rc 5 7.5 mm, g
5 1023 kg?m21?s21, m0 5 4p 3 1027 T?m?A21, flow rate Q 5 2.5 ml/hr, the number ofparticles per cell N 5 2500 , 3500. For the stopping factor, we first find l 5 1.2 tomatch the theoretical and experimental results of the plain slides, and then the samevalue is used for the micromagnet patterned slides.
Immunomagnetic assay model. The two-dimensional model representing cross-section of the microchip based immunomagnetic assay is shown in Figure 9(a). Thedimensions of the model are identical to those of the real device (channel height 5
500 mm, length 5 30 mm). Cells are released from left side of the channel, with initialpositions uniformly aligned from the bottom to the top of the microchannel. The cellcount is set to be 150 to match the value in the spiked experiments. The flow rate isselected to match the experiment condition 2.5 ml/hr. Flow field inside themicrochannel follows a standard parabolic flow profile. In Figure 9(a), the gray boxrepresents the permanent magnets, with a length of 18 mm. The normalizedmagnetic flux density generated by the permanent magnets inside the microchannelis calculated using FEM simulation software, and is shown in Figure 9(b). Themagnetic field is getting stronger when it is close to the permanent magnets, especiallythe edges of the permanent magnets.
Micromagnet fabrication. The micromagnets can be easily fabricated using standardmicrofabrication techniques. Firstly, the photoresist is spin-coated onto the standardglass slide. Patterns of the micromagnets are then defined on photoresist by selectiveexposure to UV light through a photo-mask. Next, chromium layer is deposited as theadhesion layer, after which the nickel layer is deposited to form the micromagnet
structure. In the final step, lift-off technique is used to remove the photoresist andleaving behind the micromagnets array. Detailed fabrication process of themicromagnets is introduced in our previous report41. Based on the total surfacearea of the microchamber and the periodicity of the micromagnet array, the totalnumber of micromagnet element on one chip is estimated to be ,8750, about 25elements per mm2.
Cell screening experiment protocol. The COLO205 cell suspension is first mixedand incubated with trypsin (0.05% Trypsin-EDTA (1X), Phenol Red, LifeTechnology) for 5 minutes to break the cell clusters and ensure the cells flow throughthe microchannel individually. Observe the cells under the microscope until over 90%of the cells are individually dispersed, otherwise increase the incubation time a fewmore minutes, and check for dissociation every 30 seconds. Then same amount of cellculture medium (RPMI 1640 with 5% fetal bovine serum) is added to the suspensionto neutralize the trypsin. A cell suspension (10 , 20 mL) containing approximately,150 cells is spiked into 2.5 mL aliquot of blood sample acquired from healthydonors. Then, magnetic nanoparticles (FerrofluidTM, Janssen Diagnostic, LLC), whichare functionalized with cancer specific antibodies anti-EpCAM, are added to theblood samples to label the COLO205 cells. The typical diameter of this particle isaround 100 nm. PBS is used to fill the microchannel before introducing the bloodsample to eject air bubbles at the flow rate of 5 ml/hr. The blood sample is then driventhrough the microchannel at a flow rate of 2.5 ml/hr with a syringe pump. After thescreening, PBS is introduced to wash the remaining blood and to remove unwantedcells. After flushing, 1 mL of ice-cold acetone is introduced at the flow rate of 2.5 mL/hr to the channel to fix cancer cells onto the substrate. The sample slide is thendisassembled and dried and stored in fridge (4uC) before staining. Detailedintroduction of the experimental and fluorescent staining protocols can be found inour previous reports11.
Blood specimen collection. Blood samples are drawn from multiple healthy donorsafter obtaining informed consent under an IRB-approved protocol. Written informedconsents were obtained from all participants. This study was approved by theInstitutional Biosafety Committee (IBC) and the Advisory Committee on HumanResearch at the University of Texas at Austin. All experiments were performed inaccordance with the declaration of Helsinki. All specimens are collected and stored inCellSave tubes (Veridex, Janssen Diagnostic, J&J).
Capture rate. The capture rate is defined as follows: when preparing the cellsuspension for the spiked sample, the same amount of cell suspension is dropped ontwo glass slides and used as control samples. The capture rate is calculated by dividingthe number of cells found from the spiked samples by the average number of cellsfound on the control slides. Since the number of cells in each aliquot cannot be veryaccurately known, chances are that more cells are spiked into the blood samples than
Figure 9 | Analytical model of the microchip based immunomagneticassay. (a) 2D model represents the microchip for rare cells detection.
Liquid flow inside the channel follows standard parabolic profile. Cells are
released from one side of the channel with uniform initial positions. (b)
Magnetic field inside the microchannel generated by the permanent
magnets. The area displayed is corresponding to the space inside the
microchannel (30 mm 3 500 mm).
www.nature.com/scientificreports
SCIENTIFIC REPORTS | 5 : 8745 | DOI: 10.1038/srep08745 8

the control slides, which could result in a nominal over 100% capture rate. One cannormalize the data to 100%, but we choose to present the original data forcomparison.
Statistical analysis. Data are reported as mean 6 standard deviation of the mean asnoted. Assuming groups have a normal distribution and homogenous variances, thegroup means are compared by an independent two sample T-test, and the variancesare compared using a Levene’s test. Differences are considered significant at the 95%confidence level (p , 0.05).
1. Turner, N. et al. Can biomarker assessment on circulating tumor cells help directtherapy in metastatic breast cancer? Cancers. 6, 684–707 (2014).
2. Gupta, G. P. & Massague, J. Cancer Metastasis: Building a Framework. Cell. 127,679–695 (2006).
3. Bidard, F.-C. et al. Clinical application of circulating tumor cells in breast cancer:overview of the current interventional trials. Cancer. Metast. Rev. 32, 179–188(2013).
4. Yu, M. et al. Circulating Breast Tumor Cells Exhibit Dynamic Changes inEpithelial and Mesenchymal Composition. Science. 339, 580–584 (2013).
5. Powell, A. A. et al. Single Cell Profiling of Circulating Tumor Cells:Transcriptional Heterogeneity and Diversity from Breast Cancer Cell Lines. PLOSONE. 7, e33788 (2012).
6. Nagrath, S. et al. Isolation of rare circulating tumour cells in cancer patients bymicrochip technology. Nature. 450, 1235–1239 (2007).
7. Hosokawa, M. et al. Size-Selective Microcavity Array for Rapid and EfficientDetection of Circulating Tumor Cells. Anal. Chem. 82, 6629–6635 (2010).
8. Shim, S., Gascoyne, P., Noshari, J. & Stemke Hale, K. Dynamic physical propertiesof dissociated tumor cells revealed by dielectrophoretic field-flow fractionation.Integr. Biol. 3, 850–862 (2011).
9. Gossett, D. et al. Label-free cell separation and sorting in microfluidic systems.Anal. Bioanal. Chem. 397, 3249–3267 (2010).
10. Gossett, D. R. et al. Inertial Manipulation and Transfer of Microparticles AcrossLaminar Fluid Streams. Small. 8, 2757–2764 (2012).
11. Hoshino, K. et al. Microchip-based immunomagnetic detection of circulatingtumor cells. Lab Chip. 11, 3449–3457 (2011).
12. Huang, Y.-Y. et al. Immunomagnetic nanoscreening of circulating tumor cellswith a motion controlled microfluidic system. Biomed. Microdevices. 15, 673–681(2013).
13. Zborowski, M., Fuh, C. B., Green, R., Sun, L. & Chalmers, J. J. Analyticalmagnetapheresis of ferritin-labeled lymphocytes. Anal. Chem. 67, 3702–3712(1995).
14. Liang, L., Zhang, C. & Xuan, X. Enhanced separation of magnetic and diamagneticparticles in a dilute ferrofluid. Appl. Phys. Lett. 102, 234101–234104 (2013).
15. Probst, C. E., Zrazhevskiy, P. & Gao, X. Rapid Multitarget ImmunomagneticSeparation through Programmable DNA Linker Displacement. J. Am. Chem. Soc.133, 17126–17129 (2011).
16. Zhu, T. et al. Continuous-flow ferrohydrodynamic sorting of particles and cells inmicrofluidic devices. Microfluid. Nanofluid. 13, 645–654 (2012).
17. Chen, P., Huang, Y.-Y., Hoshino, K. & Zhang, X. Multiscale immunomagneticenrichment of circulating tumor cells: from tubes to microchips. Lab Chip. 14,446–458 (2014).
18. Fanelli, C. et al. Magnetic fields increase cell survival by inhibiting apoptosis viamodulation of Ca21 influx. FASEB J. 13, 95–102 (1999).
19. Kimura, T., Yamato, M. & Nara, A. Particle trapping and undulation of a liquidsurface using a microscopically modulated magnetic field. Langmuir. 20, 572–574(2004).
20. Lee, C., Lee, H. & Westervelt, R. Microelectromagnets for the control of magneticnanoparticles. Appl. Phys. Lett. 79, 3308–3310 (2001).
21. Lee, H., Purdon, A. & Westervelt, R. Manipulation of biological cells using amicroelectromagnet matrix. Appl. Phys. Lett. 85, 1063–1065 (2004).
22. Hsieh, D., Langer, R. & Folkman, J. Magnetic modulation of release ofmacromolecules from polymers. Proc. Natl. Acad. Sci. 78, 1863–1867 (1981).
23. Steiner, U. E. & Ulrich, T. Magnetic field effects in chemical kinetics and relatedphenomena. Chem. Rev. 89, 51–147 (1989).
24. Inglis, D. W., Riehn, R., Austin, R. H. & Sturm, J. C. Continuous microfluidicimmunomagnetic cell separation. Appl. Phys. Lett. 85, 5093–5095 (2004).
25. Deng, T., Prentiss, M. & Whitesides, G. M. Fabrication of magnetic microfiltrationsystems using soft lithography. Appl. Phys. Lett. 80, 461–463 (2002).
26. Nawarathna, D. et al. Shrink-induced sorting using integrated nanoscale magnetictraps. Appl. Phys. Lett. 102, 063504-063504-063505 (2013).
27. Dumas-Bouchiat, F. et al. Thermomagnetically patterned micromagnets. Appl.Phys. Lett. 96, 102511-102511-102513 (2010).
28. Zanini, L. F., Dempsey, N. M., Givord, D., Reyne, G. & Dumas-Bouchiat, F.Autonomous micro-magnet based systems for highly efficient magneticseparation. Appl. Phys. Lett. 99, 232504-232504-232503 (2011).
29. Zheng, S. et al. 3D microfilter device for viable circulating tumor cell (CTC)enrichment from blood. Biomed. Microdevices. 13, 203–213 (2011).
30. Park, S. et al. Morphological Differences between Circulating Tumor Cells fromProstate Cancer Patients and Cultured Prostate Cancer Cells. PLOS ONE. 9,e85264 (2014).
31. Wu, C.-H. et al. Versatile immunomagnetic nanocarrier platform for capturingcancer cells. ACS nano 7, 8816–8823 (2013).
32. Wang, S. et al. Highly efficient capture of circulating tumor cells by usingnanostructured silicon substrates with integrated chaotic micromixers. Angew.Chem. Int. Ed. 50, 3084–3088 (2011).
33. Mitchell, M. J., Wayne, E., Rana, K., Schaffer, C. B. & King, M. R. TRAIL-coatedleukocytes that kill cancer cells in the circulation. Proc. Natl. Acad. Sci. 111,930–935 (2014).
34. Hoshino, K., Chen, P., Huang, Y.-Y. & Zhang, X. Computational Analysis ofMicrofluidic Immunomagnetic Rare Cell Separation from a Particulate BloodFlow. Anal. Chem. 84, 4292–4299 (2012).
35. Judy, J. W. & Muller, R. S. Magnetic microactuation of torsional polysiliconstructures. Sens. Actuators, A. 53, 392–397 (1996).
36. Crangle, J. & Goodman, G. M. The Magnetization of Pure Iron and Nickel. Proc. R.Soc. London, Ser. A. 321, 477–491 (1971).
37. Suresh, S. Biomechanics and biophysics of cancer cells. Acta Mater. 55, 3989–4014(2007).
38. Stott, S. L. et al. Isolation of circulating tumor cells using a microvortex-generatingherringbone-chip. Proc. Natl. Acad. Sci. 107, 18392–18397 (2010).
39. Stroock, A. D. et al. Chaotic mixer for microchannels. Science. 295, 647–651(2002).
40. Furlani, E. P. & Sahoo, Y. Analytical model for the magnetic field and force in amagnetophoretic microsystem. J. Phys. D: Appl. Phys. 39, 1724 (2006).
41. Huang, Y.-Y. et al. Patterned nanomagnets on-chip for screening circulatingtumor cells in blood. Proceedings of MicroTAS. 2, 1117–1119 (2012).
AcknowledgmentsWe thank our collaborator Professor Konstantin V. Sokolov at the University of Texas MDAnderson Cancer Center and Dr. Zhigang Li at the Geisel School of Medicine at Dartmouthfor the supports in validating the presented results. We thank Ms. Nancy Lane and Drs.Michael Huebschman, Jonathan W. Uhr, and Eugene P. Frenkel of the University of TexasSouthwestern Medical Center for their invaluable suggestions on the experiment design.We are grateful for the financial support from the National Institute of Health (NIH)National Cancer Institute (NCI) Cancer Diagnosis Program under grant 1R01CA139070.
Author contributionsX.J.Z. and K.H. initiated the concept and design of microchip immunomagnetic assay ofCTCs. P.C. designed the micromagnets and conducted the theoretical studies. Y.-Y.H.performed the experimental studies. P.C., Y.-Y.H., K.H. and X.J.Z. analyzed the results. Allauthors participated in the writing and revisions of the manuscript.
Additional informationCompeting financial interests: The authors declare no competing financial interests.
How to cite this article: Chen, P., Huang, Y.-Y., Hoshino, K. & Zhang, X. MicroscaleMagnetic Field Modulation for Enhanced Capture and Distribution of Rare CirculatingTumor Cells. Sci. Rep. 5, 8745; DOI:10.1038/srep08745 (2015).
This work is licensed under a Creative Commons Attribution 4.0 InternationalLicense. The images or other third party material in this article are included in thearticle’s Creative Commons license, unless indicated otherwise in the credit line; ifthe material is not included under the Creative Commons license, users will needto obtain permission from the license holder in order to reproduce the material. Toview a copy of this license, visit http://creativecommons.org/licenses/by/4.0/
www.nature.com/scientificreports
SCIENTIFIC REPORTS | 5 : 8745 | DOI: 10.1038/srep08745 9