microseismic monitoring of the oyu tolgoi hugo north lift 1 · microseismic monitoring of the oyu...
TRANSCRIPT

Caving 2018 – Y Potvin and J Jakubec (eds) © 2018 Australian Centre for Geomechanics, Perth, ISBN 978-0-9924810-9-4
Caving 2018, Vancouver, Canada 823
Microseismic monitoring of the Oyu Tolgoi Hugo North Lift 1
J-P Mercier Rio Tinto, Mongolia
A van As Rio Tinto, Australia
C Carlson Rio Tinto, Mongolia
B Tumur-Ochir Rio Tinto, Mongolia
Abstract
Oyu Tolgoi is a copper–gold mine in the South Gobi region of Mongolia located approximately 550 km south of the capital Ulaanbaatar, near the Chinese border. The Oyu Tolgoi mine is expanding underground to exploit the Hugo North deposit, one of several large-scale orebodies of the Oyu Tolgoi complex. The Hugo North deposit extends over 900 m vertically, from 500 to -400 MASL (670 m below the surface to 1,570 m below the surface), and is approximately 1,800 m long and 500 m wide. Mining of the Hugo North deposit will be done in stages using block caving. In the first stage, referred to as Lift 1, the top 400 m of the orebody will be mined.
A microseismic monitoring system comprising 128 triaxial sensors is currently being commissioned to cover the Hugo North Lift 1 cave and the critical infrastructure underground. The purpose of the microseismic system is to provide information on the cave growth, and monitor and evaluate the seismic risk around the mine. The cave area is, to a large extent, covered by an array of 90 triaxial sensors installed and grouted in 15 deep boreholes that surround the orebody. The boreholes are drilled from surface and vary in length between approximately 80 and 1,250 m. Additional sensors are deployed underground in a series of short boreholes.
The commissioning and the operation of the Hugo North Lift 1 microseismic monitoring system pose significant challenges. Installing seismic sensors in 127 mm diameter (PQ) boreholes of more than 1,000 m is not trivial, and had, as far as we know, never been achieved before in a mining context.
Keywords: microseismic, monitoring, geotechnical, block caving, drilling, sensor installation
1 Introduction
Oyu Tolgoi is a copper–gold mine in the South Gobi region of Mongolia, approximately 550 km south of the capital Ulaanbaatar. It holds one of the largest undeveloped high-grade copper deposits in the world. Oyu Tolgoi consists of a series of orebodies containing copper, gold, silver and molybdenum. The known extent of the mineralised zone at Oyu Tolgoi stretches over 12 km. Hugo Dummett, also referred to as Hugo, is the largest of the orebodies and is divided into Hugo North and Hugo South. Hugo North will be exploited during the first phase of underground mining. Hugo North extends horizontally over an area of approximately 2.5 km by 400 m and over 400 to 800 m vertically.
The construction of the surface and underground infrastructure required to exploit the Hugo North deposit is underway. This orebody will be mined using the block caving mining method. Block caves are complex systems driven by both large structures and microscopic defects in the rock mass (Vyazmensky et al. 2010). Albeit, the physics of block caving is relatively simple and well understood, it is very difficult to model all the subtleties of the caving process. Significant deviations from the predicted/modelled behaviour are usually observed during the mining of a block cave (Laubscher 1994). The observed variations can be attributed in part to the execution of the mining (e.g. Rahal et al. 2003) and in part to deviation in rock mass properties and small-scale features in the rock fabric from the model. Pierce (2010) shows, for instance, that the rock mass properties have a direct influence on the cave behaviour. The efficient and safe
https://papers.acg.uwa.edu.au/p/1815_65_Mercier/

Microseismic monitoring of the Oyu Tolgoi Hugo North Lift 1 J-P Mercier et al.
824 Caving 2018, Vancouver, Canada
management of mining operations in a block cave cannot solely rely on models, and requires that the cave be closely monitored.
At Oyu Tolgoi, several systems will be deployed to collect information during mining of the Hugo North Lift 1. The microseismic system will allow the monitoring of the seismic activity around the mine, track the cave progression (Hudyma et al. 2007), image the cave geometry (Westman 2012; Mercier et al. 2015; Olivier et al. 2015), and measure stress change in the rock mass (Olivier et al. 2015). To provide a holistic view of the effect of mining, the information collected by the microseismic monitoring system will be used in conjunction with a series of other systems and methods, i.e. Elexon cave tracking system, open hole measurements, dislocation monitoring (time domain reflectometry), subsidence monitoring (InSAR), convergence monitoring (MPBX, convergence station), and stress measurements. For instance, the data provided by the cave tracking system, open holes, and dislocation measurement will be used to constrain the cave model derived from the seismic data. Direct displacement and stress change measurements will also complement the seismic data in the assessment of the seismic hazard underground.
Commissioning of the systems will involve the deployment of more than 100 sensors in and around the cave and near other critical areas of the mine. Because the geometry of the mining horizon is nearly planar, and the main excavations and developments are located at a depth of approximately 1,300 m below the surface, it is necessary to install a large proportion of sensors in long boreholes varying in length between approximately 800 to 1,250 m, drilled from the surface.
The installation of sensors in such long boreholes poses significant challenges both with respect to installation and the acquisition of data. The difficulties were overcome by carefully selecting the sensors and the design of a robust installation procedure. At the time of writing this paper, the installation of the sensors in long boreholes from surface was successfully completed without any major incident, and the system is collecting data, allowing the detection of small high-frequency events down to a moment magnitude of approximately -2.2.
2 System design
The objectives of the microseismic monitoring at Oyu Tolgoi are as follows:
Capture the seismic response of the rock mass to undercutting and caving.
Monitor the fracturing of the rock mass around and inside the caving orebody.
Measure changes in stress redistribution around the cave and sensitive infrastructure.
Monitor large or local-scale structures.
Provide sufficient information to manage the seismic risk underground.
To achieve these objectives, the system was designed to be sensitive to events of moment magnitude down to at least -1 everywhere within the volume of interest and provide a location accuracy varying between 10 and 20 m. Care was also taken for the array to be amenable to advance analyses such as moment tensor inversion (Baig & Urbancic 2010), passive source tomography (Mercier et al. 2015) and ambient noise tomography (Olivier et al. 2015). For moment tensor inversion, the coverage of the focal sphere was estimated for a series of events located within the monitoring volume. Coverage of focal sphere at a particular location is assessed using the ray geometry (take-off angle and azimuth) given the location of the sensors with respect to the event position. For tomographic inversion, simulations were carried out to assess the resolution of the velocity inversion for a series of scenarios.
Several options were considered for the design of the seismic system at Oyu Tolgoi. The first option, which was adopted, is similar to what has been implemented at other block cave mines (e.g. Northparkes — White et al. 2004; Ridgeway — Hudyma & Potvin 2008; Palabora — Glazer 2016). This design comprises a series of sensors deployed from underground and sensors deployed above and around the cave. Initially, this option was considered risky and costly due to the length and recommended size of boreholes

Poster papers
Caving 2018, Vancouver, Canada 825
(>150 mm). Also, it was less than certain that the long interconnections would allow the high frequencies required to capture small events to be recorded by the system. Through engagement with suppliers, we found, however, that by bundling the sensors together on a single slimline string for every hole enabled us to drill smaller, less expensive holes (127 mm) and design an installation procedure that mitigated most of the risk. A careful design of the geophone arrangement along the string allowed us to limit the loss of high-frequency events for the deeper sensors. Figures 1 and 2 present an overview of the system being deployed at Oyu Tolgoi.
Figure 1 Plan view showing the location of the seismic sensors. In yellow and red, the seismic sensors
installed from surface and from underground, respectively
Figure 2 View looking west at the seismic system. Inversed yellow cones and red spheres represent
sensors installed from surface and underground, respectively
Microseismic monitoring of the Oyu Tolgoi Hugo North Lift 1 J-P Mercier et al.
826 Caving 2018, Vancouver, Canada
The second option that was considered consisted of a two-layer array where the 15 long boreholes of option one were replaced by a series of several short boreholes (~100–200 m) also drilled from surface. Several configurations were studied, each with a different combination of sensor density and array aperture. For each configuration, simulations were performed to assess the system sensitivity, location accuracy and the imaging capabilities (tomography). Coverage of the focal sphere was also assessed by looking at the azimuthal coverage for locations above the footprint and around critical excavations. The two-layer, or sandwich, array was found ideal for source parameter calculations and moment tensor inversion, because of the excellent sampling of the focal sphere such geometry provides. The two-layer array was also ideal for ambient noise tomography. Location accuracy and system sensitivity for the design considered were, however, poorer for the two-layer array compared with the more traditional option.
In the case of Oyu Tolgoi, it made more sense both from an economical and technical perspective to adopt the traditional design of option one. However, this may not be the case for larger projects currently being planned such as the Resolution Copper mine in Arizona. Note that at the Resolution Copper mine, the extraction level is located more than 2,000 m below the surface; about 700 m deeper than the Oyu Tolgoi Hugo North Lift 1 extraction level.
3 Surface deployment
3.1 Location of seismic station on surface
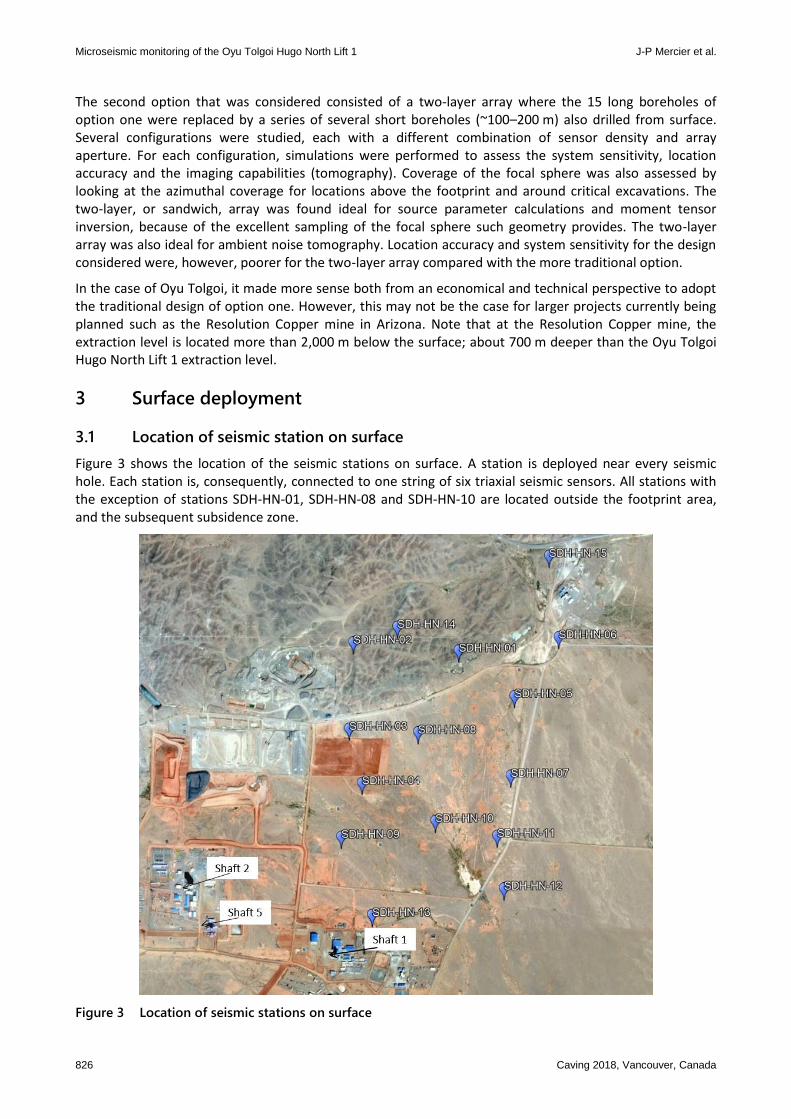
Figure 3 shows the location of the seismic stations on surface. A station is deployed near every seismic hole. Each station is, consequently, connected to one string of six triaxial seismic sensors. All stations with the exception of stations SDH-HN-01, SDH-HN-08 and SDH-HN-10 are located outside the footprint area, and the subsequent subsidence zone.
Figure 3 Location of seismic stations on surface
Poster papers
Caving 2018, Vancouver, Canada 827
3.2 Surface seismic sensors
Sensors for the surface deployment were built by Avalon Sciences in the UK. Avalon provided 15 seismic sensor strings, each comprising six triaxial sensors. The length and the position of the sensors along the string were customised to match the design. The sensors are housed in 670 mm long, 54 mm diameter cylindrical pods made of stainless steel. The electrical cables used to make the string are 10.5 mm in diameter and contain 18 pairs of conductors. These strings are very light compared to other products available on the market. The longest and heaviest string weighs only approximately 200 kg; that is about 5–10 times less than options proposed by other suppliers that were approached to provide sensor strings for this project.
The use of these lighter seismic sensor strings contributed to considerably reducing the complexity of the installation. It also eliminated the potential for human error leading to uncertainty in the sensor location, as the spacing between the sensors along the strings is predefined and immutable. Once the sensors were deployed in the hole, measuring the length of cable remaining outside the hole sufficed to determine the position of all the sensors. Because the sensor strings are light, the installation could be performed without having to resort to mechanical devices, other than a winch to hold the wireline. The orientation of the sensors was not controlled during the installation process. Note that, as discussed later, the sensor orientations have been calculated using seismic events recorded by the seismic system.
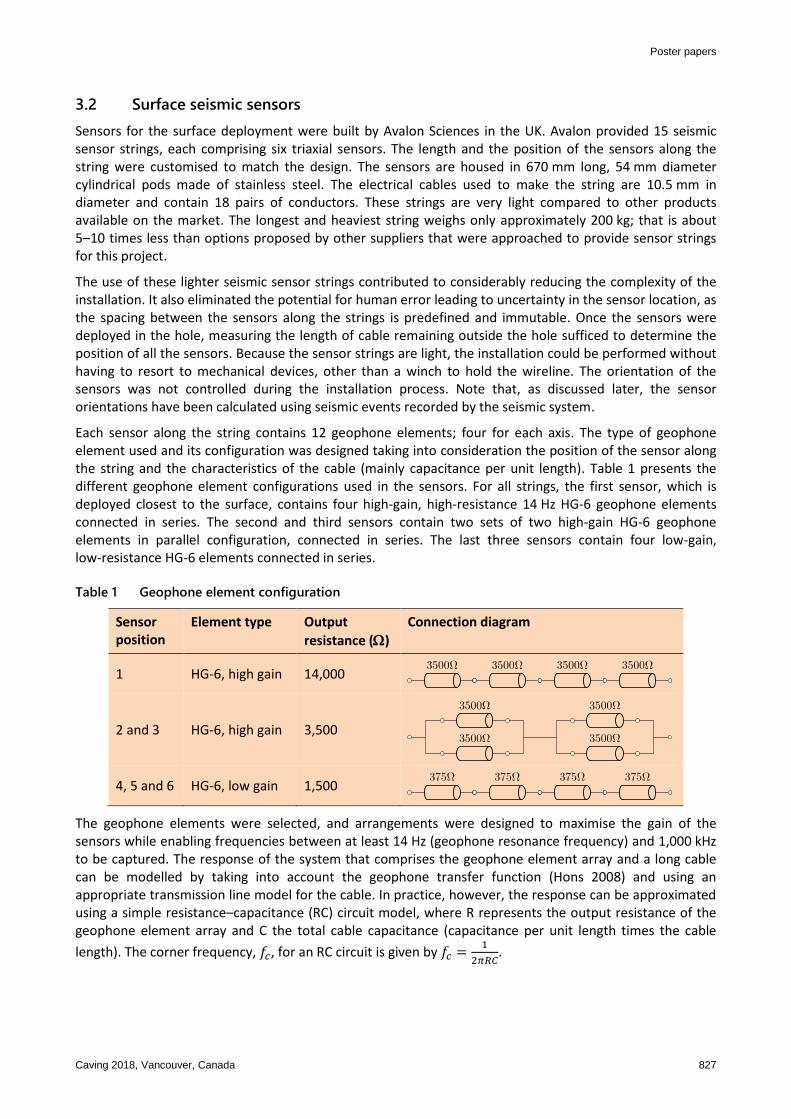
Each sensor along the string contains 12 geophone elements; four for each axis. The type of geophone element used and its configuration was designed taking into consideration the position of the sensor along the string and the characteristics of the cable (mainly capacitance per unit length). Table 1 presents the different geophone element configurations used in the sensors. For all strings, the first sensor, which is deployed closest to the surface, contains four high-gain, high-resistance 14 Hz HG-6 geophone elements connected in series. The second and third sensors contain two sets of two high-gain HG-6 geophone elements in parallel configuration, connected in series. The last three sensors contain four low-gain, low-resistance HG-6 elements connected in series.
Table 1 Geophone element configuration
Sensor position
Element type Output
resistance ()
Connection diagram
1 HG-6, high gain 14,000
2 and 3 HG-6, high gain 3,500
4, 5 and 6 HG-6, low gain 1,500
The geophone elements were selected, and arrangements were designed to maximise the gain of the sensors while enabling frequencies between at least 14 Hz (geophone resonance frequency) and 1,000 kHz to be captured. The response of the system that comprises the geophone element array and a long cable can be modelled by taking into account the geophone transfer function (Hons 2008) and using an appropriate transmission line model for the cable. In practice, however, the response can be approximated using a simple resistance–capacitance (RC) circuit model, where R represents the output resistance of the geophone element array and C the total cable capacitance (capacitance per unit length times the cable
length). The corner frequency, 𝑓𝑐, for an RC circuit is given by 𝑓𝑐 =1
2𝜋𝑅𝐶.

Microseismic monitoring of the Oyu Tolgoi Hugo North Lift 1 J-P Mercier et al.
828 Caving 2018, Vancouver, Canada
3.3 Sensor installation
The installation of the seismic sensors was simplified by using a light-weight seismic sensor string, installing the sensors in cased holes, and using the casing as grout pipe.
The installation procedure can be summarised as follows:
Drill PQ hole.
Install HQ casing inside the PQ casing, upon hole completion.
Remove PQ casing leaving the HQ casing inside the hole.
Install the seismic sensor string in the HQ casing.
Grout the hole through the HQ casing.
The designed procedure afforded several advantages. The risk of damaging the sensor or having the hole collapse during this installation was considerably reduced by sacrificing the HQ rod. Besides de-risking the installation, the HQ casing served as a grout pipe. To allow the grout to flow in the hole, the bottom 30 m of casing was perforated. The grout was pumped through a manifold from the top of the borehole, flowing down the inside of the casing and coming back up on the outside of the pipe between the casing and the borehole wall. To ensure the whole column was filled with good-quality grout, the grouting process continued until the density of the grout coming back along the side of the casing was similar to the density of the grout poured down the hole.
To grout the holes, a 20 MPa grout retarded for 12 hours was used. When a hole was in poor condition, a fluidiser was also added to the mix. The specific gravity, or density relative to water, of the grout varied between 1.68 and 1.72. Grouting the hole allows the coupling between the sensors and the ground to be optimal, and potential harmonics resulting from the vibration of the casing are suppressed. Note that the presence of the casing does not have any measurable effect on the signal quality.
3.4 Communication, power and timing
Figure 4 shows a picture of one of the solar bases deployed on surface. Each of the 15 solar bases can accommodate up to five solar panels (only four were installed), four large enclosures, two battery boxes big enough for eight large batteries, and a communication mast.
Figure 4 Sunrise at seismic station 10. In the background, a drill rig on seismic hole 11
Poster papers
Caving 2018, Vancouver, Canada 829
The stations are powered using a set of four 235 W solar panels. The solar panels have been installed at a fixed angle of around 45°. This angle is very close to the angle of 44° (as measured from horizontal) that maximises the year-round minimum power production at Oyu Tolgoi, which was obtained considering the irradiance (insulation) for the nearby town of Dalanzadgad (Boxwell 2010). A steeper angle, closer to horizontal, would provide more power during the summer months but yield lower output during the winter months. Conversely, a shallower angle would be optimal for winter but not for summer. It was decided to opt for a fixed angle for the solar panel rather than a variable angle, despite the loss in overall efficiency. Having a fixed angle rather than a variable angle simplified the design of the solar base, reduced the risk of breakage and does not require people to continuously change the angle of the panel.
It has been estimated that one station can produce at least approximately 5,500 Wh daily, accommodating a continuous power consumption of 265 W. Data on power consumption shows that the system utilises between 2,100 and 2,300 Wh per day, which represents 40% of the total station capacity.
Solar power is very reliable at Oyu Tolgoi. Solar data for Dalanzadgad, which is located approximately 200 km west of the Oyu Tolgoi mine and experiences a similar climate, shows that average sunshine hours per day vary approximately from seven hours in the winter to 10 hours in the summer. Notwithstanding that, to ensure the reliability of the system, each station is equipped with eight 265 Ah batteries providing backup power for about 10 days. The large storage capacity of the stations also helps to extend the battery life by keeping the depth of discharge at a very low level.
The stations contain only low-voltage DC power. This increases the efficiency and reliability, eliminates (or at least significantly reduces) the 50 Hz noise in the seismic signal, and allows geotechnical engineers to service the station without having to rely on electricians.
A point to multipoint wireless network is utilised to transmit the data from the seismic stations to a centralised server. Four access points are being deployed. Two access points have already been deployed on a 10 m high communication pole in the Shaft 1 area and two additional access points will be deployed on top of Shaft 2. Shaft 2 is the tallest structure onsite, with a height of more than 100 m, and is ideal for communication, providing unobstructed line-of-sight connection with all 15 seismic stations. The traffic is divided evenly between the access points. Each seismic station includes two subscriber modules, one already connected to an access point on Shaft 1 and one pointing to Shaft 2 which will eventually be connected to one of the access points there. Two access points are used at every station to provide redundancy, improving the tolerance of the communication system to faults. Each access point operates on a different channel (frequency band) and can theoretically accommodate a data rate of 40–50 Mbps. This is sufficient to enable the continuous data generated by all the stations to be transmitted through only one of the four access points if required.
The surface stations are synchronised to GPS time using a GPS antenna mounted on the seismic stations.
4 Underground deployment
Seismic sensors are deployed underground to expand the sensor network deployed from surface providing better depth coverage and wider aperture. The surface network alone would provide a good coverage above the footprint and around the cave, but would not provide the accuracy and sensitivity to detect and locate seismic events at depth near underground infrastructure. At the time of writing this paper, around 20 sensors were installed underground (about 10 are online) and we are planning to install 20 more within the next two years.
The vast majority of the sensors that have been deployed underground so far are 14 Hz Institute of Mine Seismology (IMS) geophones. Four 2.3 kHz IMS accelerometers have also been installed. We found the 14 Hz geophones to perform better at Oyu Tolgoi than accelerometers. The accelerometers are more sensitive to very small local events (approximately moment magnitude -2 and below), but on average trigger one less event than the 14 Hz geophones, and generally the data collected by those sensors has a
Microseismic monitoring of the Oyu Tolgoi Hugo North Lift 1 J-P Mercier et al.
830 Caving 2018, Vancouver, Canada
poorer signal to noise ratio. Given the performance of the Avalon sensor on surface, we have purchased a few geophones from this company with the intent to test them underground.
For the most part, one data acquisition station is used for every sensor. They are, with only few exceptions, deployed in cuddies located near the borehole collar where the seismic sensors are installed. This minimises the length of the seismic sensor cable and contributes to improving the signal quality and reducing interference. The stations are connected to communication substations that provide Ethernet communication and power. Note that the seismic stations underground are not equipped with batteries. Backup power is provided by UPSs deployed in communication substations.
Time synchronisation of the seismic stations is achieved using the IEEE1588 precise time protocol (PTP). All the underground stations are synchronised to GPS time through one of the two PTP grandmaster clocks located on surface. As for surface, the stations underground record and transmit continuous ground motion to the central server.
5 System calibration
5.1 Velocity calibration
Velocity calibration is crucial for a seismic system to provide accurate information on seismic event location and source parameters (moment magnitude, energy, static stress drop, etc.). The calibration of the Oyu Tolgoi seismic system was performed by IMS using a set of 135 development blasts recorded by the seismic system from early December 2017 to late January 2018. Locations of the blasts were provided by the mining team. It is important to note that only between 15 and 35 sensors, representing a small fraction of the total number of sensors, were online when the calibration was performed.
The blasts produced clear P- and S-wave arrivals that were manually picked yielding a dataset comprising approximately 4,500 P- and S-wave picks. Several different velocity models were calculated and tested. It is beyond the scope of this paper to present all the different velocity models that were produced and tested and to discuss the inversion procedure.
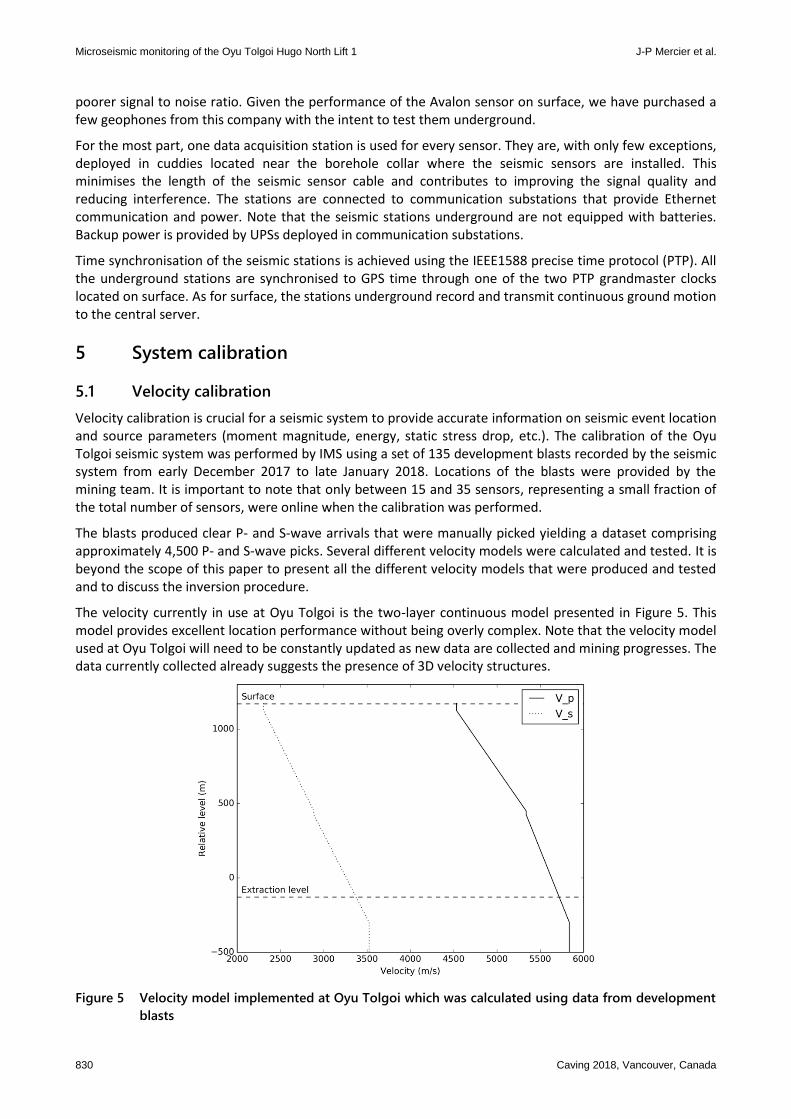
The velocity currently in use at Oyu Tolgoi is the two-layer continuous model presented in Figure 5. This model provides excellent location performance without being overly complex. Note that the velocity model used at Oyu Tolgoi will need to be constantly updated as new data are collected and mining progresses. The data currently collected already suggests the presence of 3D velocity structures.
Figure 5 Velocity model implemented at Oyu Tolgoi which was calculated using data from development
blasts

Poster papers
Caving 2018, Vancouver, Canada 831
5.2 Sensor orientation
Some advanced analysis, such as focal mechanism and moment tensor inversions, require that the orientation of the sensor components be known. It is quite straightforward to determine the orientation of the vertical component of a sensor, sometimes also referred to as the Z component, as it is usually oriented along the borehole axis. The orientation of the two horizontal components (or X and Y components) can usually not be determined so easily, as the sensors rotate around the cable axis as they are lowered down the hole. The newest sensors from IMS contain circuitry allowing the orientation of the horizontal axes to be estimated. Most of the sensors installed at Oyu Tolgoi were provided by Avalon and are not equipped with such circuitry. It is, however, not too difficult to estimate the sensor orientation using waveforms from well-located seismic events and blasts.
To find the orientation of the sensors’ horizontal components, we used 20,795 seismograms from 510 seismic events and blasts recorded between 1 April 2018 and 30 June 2018. The following procedure was followed to calculate the orientation of the two horizontal components for each sensor:
The direction of the incident’s P-wave at the sensor location was found. In arbitrarily complex heterogeneous media this can be determined by following the direction of the steepest descent in the travel time grids from the event location to the sensor location (Rawlinson et al. 2008). The travel time grids were calculated for each sensor location solving the eikonal equation using the fast marching method (Sethian 1999).
A window around the P-wave arrival was extracted from the seismograms.
Grid search to find the orientation for horizontal components that allow an optimal separation between the P- and S-wave when the wavefield was rotated into the ray coordinate system (P, SV, SH) was performed, knowing that:
The sensor vertical component is oriented along the borehole axis.
The horizontal component is in the plan perpendicular to the vertical component.
The two horizontal components are perpendicular to each other.
The three components form a right-handed coordinate system.
The reliability of the calculated sensor orientation can be tested by rotating seismograms into ray coordinates. A reliable sensor orientation should allow the separation of the P- SV- and SH-waves. Figure 6 shows an example of a seismogram rotated into the ray coordinate system (P, SV, SH) using the sensor orientation found applying the procedure previously described.
Figure 6 Comparison of original seismogram (grey) and seismogram rotated into P, SV, and SH
Microseismic monitoring of the Oyu Tolgoi Hugo North Lift 1 J-P Mercier et al.
832 Caving 2018, Vancouver, Canada
6 System performance
At the time of writing this paper (June 2018), the deployment system is approximately 75% complete and about 100 sensors are recording data. The system is still in construction and sensors are being added to the system every week. Performance of the system is constantly evolving and it is likely that numbers presented in the following sections will be outdated when this paper is published.
6.1 Location accuracy
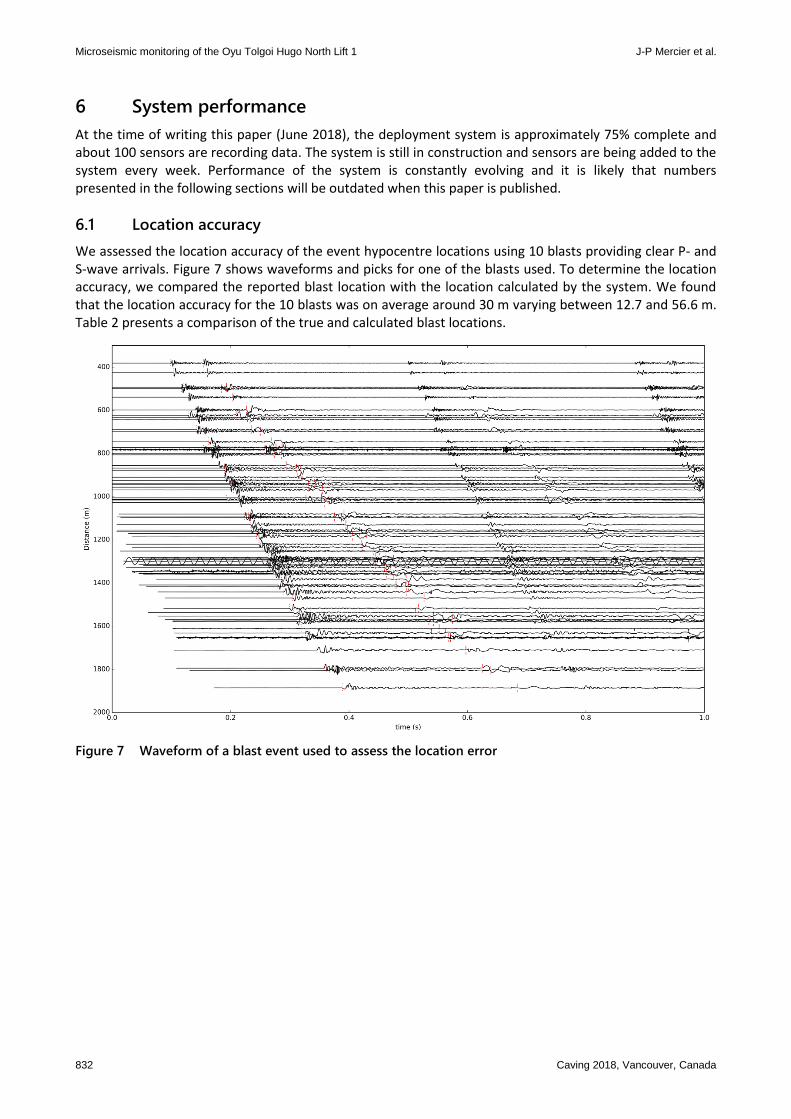
We assessed the location accuracy of the event hypocentre locations using 10 blasts providing clear P- and S-wave arrivals. Figure 7 shows waveforms and picks for one of the blasts used. To determine the location accuracy, we compared the reported blast location with the location calculated by the system. We found that the location accuracy for the 10 blasts was on average around 30 m varying between 12.7 and 56.6 m. Table 2 presents a comparison of the true and calculated blast locations.
Figure 7 Waveform of a blast event used to assess the location error
Poster papers
Caving 2018, Vancouver, Canada 833
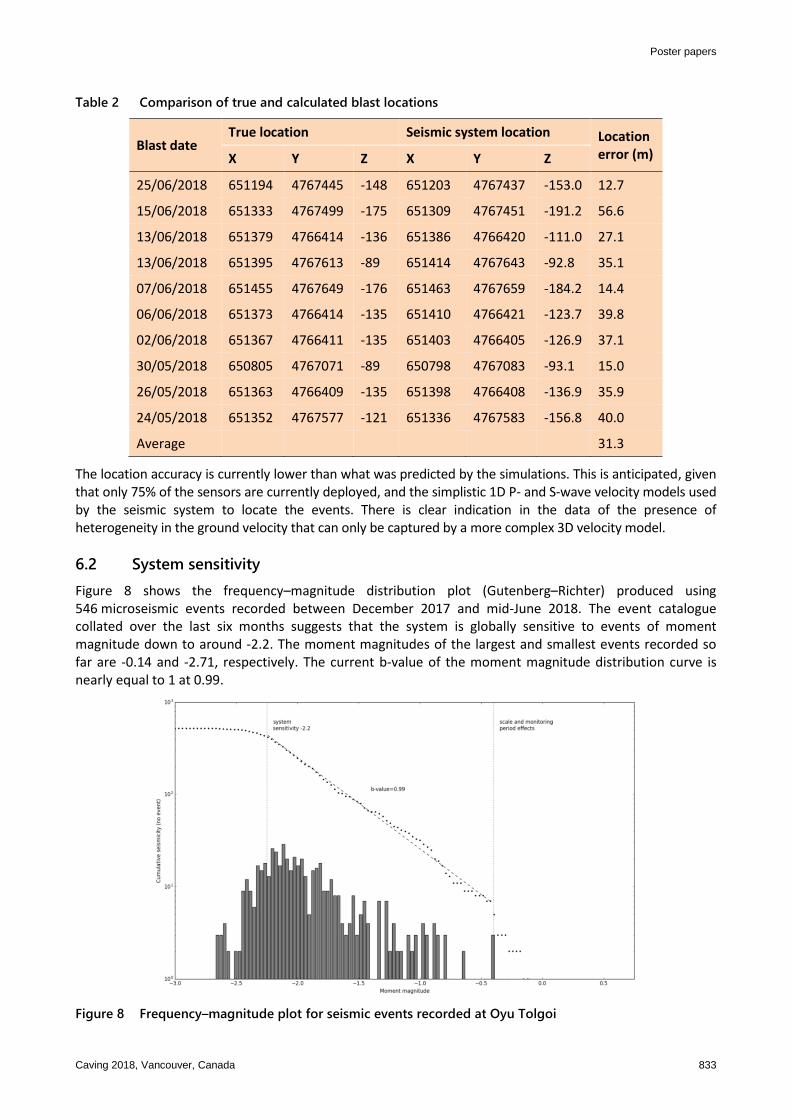
Table 2 Comparison of true and calculated blast locations
Blast date True location Seismic system location Location
error (m) X Y Z X Y Z
25/06/2018 651194 4767445 -148 651203 4767437 -153.0 12.7
15/06/2018 651333 4767499 -175 651309 4767451 -191.2 56.6
13/06/2018 651379 4766414 -136 651386 4766420 -111.0 27.1
13/06/2018 651395 4767613 -89 651414 4767643 -92.8 35.1
07/06/2018 651455 4767649 -176 651463 4767659 -184.2 14.4
06/06/2018 651373 4766414 -135 651410 4766421 -123.7 39.8
02/06/2018 651367 4766411 -135 651403 4766405 -126.9 37.1
30/05/2018 650805 4767071 -89 650798 4767083 -93.1 15.0
26/05/2018 651363 4766409 -135 651398 4766408 -136.9 35.9
24/05/2018 651352 4767577 -121 651336 4767583 -156.8 40.0
Average 31.3
The location accuracy is currently lower than what was predicted by the simulations. This is anticipated, given that only 75% of the sensors are currently deployed, and the simplistic 1D P- and S-wave velocity models used by the seismic system to locate the events. There is clear indication in the data of the presence of heterogeneity in the ground velocity that can only be captured by a more complex 3D velocity model.
6.2 System sensitivity
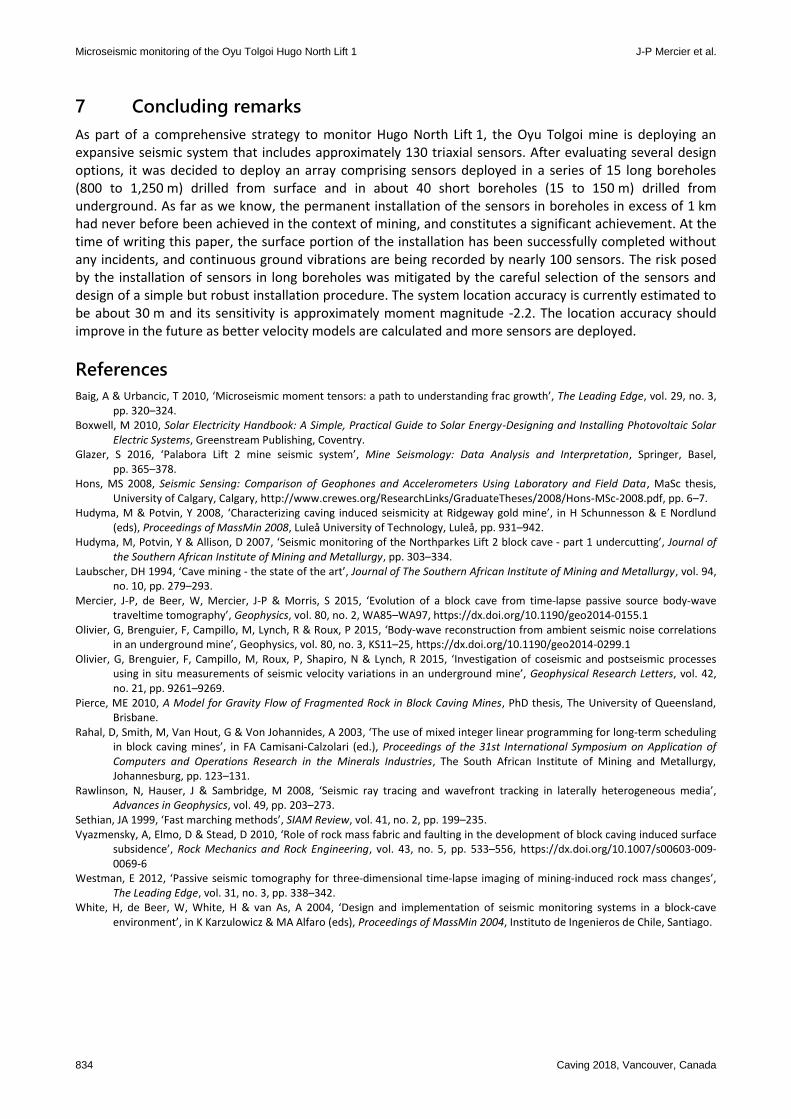
Figure 8 shows the frequency–magnitude distribution plot (Gutenberg–Richter) produced using 546 microseismic events recorded between December 2017 and mid-June 2018. The event catalogue collated over the last six months suggests that the system is globally sensitive to events of moment magnitude down to around -2.2. The moment magnitudes of the largest and smallest events recorded so far are -0.14 and -2.71, respectively. The current b-value of the moment magnitude distribution curve is nearly equal to 1 at 0.99.
Figure 8 Frequency–magnitude plot for seismic events recorded at Oyu Tolgoi
Microseismic monitoring of the Oyu Tolgoi Hugo North Lift 1 J-P Mercier et al.
834 Caving 2018, Vancouver, Canada
7 Concluding remarks
As part of a comprehensive strategy to monitor Hugo North Lift 1, the Oyu Tolgoi mine is deploying an expansive seismic system that includes approximately 130 triaxial sensors. After evaluating several design options, it was decided to deploy an array comprising sensors deployed in a series of 15 long boreholes (800 to 1,250 m) drilled from surface and in about 40 short boreholes (15 to 150 m) drilled from underground. As far as we know, the permanent installation of the sensors in boreholes in excess of 1 km had never before been achieved in the context of mining, and constitutes a significant achievement. At the time of writing this paper, the surface portion of the installation has been successfully completed without any incidents, and continuous ground vibrations are being recorded by nearly 100 sensors. The risk posed by the installation of sensors in long boreholes was mitigated by the careful selection of the sensors and design of a simple but robust installation procedure. The system location accuracy is currently estimated to be about 30 m and its sensitivity is approximately moment magnitude -2.2. The location accuracy should improve in the future as better velocity models are calculated and more sensors are deployed.
References
Baig, A & Urbancic, T 2010, ‘Microseismic moment tensors: a path to understanding frac growth’, The Leading Edge, vol. 29, no. 3, pp. 320–324.
Boxwell, M 2010, Solar Electricity Handbook: A Simple, Practical Guide to Solar Energy-Designing and Installing Photovoltaic Solar Electric Systems, Greenstream Publishing, Coventry.
Glazer, S 2016, ‘Palabora Lift 2 mine seismic system’, Mine Seismology: Data Analysis and Interpretation, Springer, Basel, pp. 365–378.
Hons, MS 2008, Seismic Sensing: Comparison of Geophones and Accelerometers Using Laboratory and Field Data, MaSc thesis, University of Calgary, Calgary, http://www.crewes.org/ResearchLinks/GraduateTheses/2008/Hons-MSc-2008.pdf, pp. 6–7.
Hudyma, M & Potvin, Y 2008, ‘Characterizing caving induced seismicity at Ridgeway gold mine’, in H Schunnesson & E Nordlund (eds), Proceedings of MassMin 2008, Luleå University of Technology, Luleå, pp. 931–942.
Hudyma, M, Potvin, Y & Allison, D 2007, ‘Seismic monitoring of the Northparkes Lift 2 block cave - part 1 undercutting’, Journal of the Southern African Institute of Mining and Metallurgy, pp. 303–334.
Laubscher, DH 1994, ‘Cave mining - the state of the art’, Journal of The Southern African Institute of Mining and Metallurgy, vol. 94, no. 10, pp. 279–293.
Mercier, J-P, de Beer, W, Mercier, J-P & Morris, S 2015, ‘Evolution of a block cave from time-lapse passive source body-wave traveltime tomography’, Geophysics, vol. 80, no. 2, WA85–WA97, https://dx.doi.org/10.1190/geo2014-0155.1
Olivier, G, Brenguier, F, Campillo, M, Lynch, R & Roux, P 2015, ‘Body-wave reconstruction from ambient seismic noise correlations in an underground mine’, Geophysics, vol. 80, no. 3, KS11–25, https://dx.doi.org/10.1190/geo2014-0299.1
Olivier, G, Brenguier, F, Campillo, M, Roux, P, Shapiro, N & Lynch, R 2015, ‘Investigation of coseismic and postseismic processes using in situ measurements of seismic velocity variations in an underground mine’, Geophysical Research Letters, vol. 42, no. 21, pp. 9261–9269.
Pierce, ME 2010, A Model for Gravity Flow of Fragmented Rock in Block Caving Mines, PhD thesis, The University of Queensland, Brisbane.
Rahal, D, Smith, M, Van Hout, G & Von Johannides, A 2003, ‘The use of mixed integer linear programming for long-term scheduling in block caving mines’, in FA Camisani-Calzolari (ed.), Proceedings of the 31st International Symposium on Application of Computers and Operations Research in the Minerals Industries, The South African Institute of Mining and Metallurgy, Johannesburg, pp. 123–131.
Rawlinson, N, Hauser, J & Sambridge, M 2008, ‘Seismic ray tracing and wavefront tracking in laterally heterogeneous media’, Advances in Geophysics, vol. 49, pp. 203–273.
Sethian, JA 1999, ‘Fast marching methods’, SIAM Review, vol. 41, no. 2, pp. 199–235. Vyazmensky, A, Elmo, D & Stead, D 2010, ‘Role of rock mass fabric and faulting in the development of block caving induced surface
subsidence’, Rock Mechanics and Rock Engineering, vol. 43, no. 5, pp. 533–556, https://dx.doi.org/10.1007/s00603-009-0069-6
Westman, E 2012, ‘Passive seismic tomography for three-dimensional time-lapse imaging of mining-induced rock mass changes’, The Leading Edge, vol. 31, no. 3, pp. 338–342.
White, H, de Beer, W, White, H & van As, A 2004, ‘Design and implementation of seismic monitoring systems in a block-cave environment’, in K Karzulowicz & MA Alfaro (eds), Proceedings of MassMin 2004, Instituto de Ingenieros de Chile, Santiago.