microsemi corp -...
TRANSCRIPT
FORM 10-Q
MICROSEMI CORP
(Quarterly Report)
Filed 8/12/2005 For Period Ending 7/3/2005
Address 2381 MORSE AVENUE
IRVINE, California 92614
Telephone 714-979-8220
CIK 0000310568
Industry Semiconductors
Sector Technology
Fiscal Year 09/30

Table of Contents
UNITED STATES
SECURITIES AND EXCHANGE COMMISSION
Washington, D.C. 20549
FORM 10-Q
For the Quarterly Period Ended July 3, 2005
or
For the transition period from to
Commission File No. 0-8866
MICROSEMI CORPORATION
(Exact name of registrant as specified in its charter)
(949) 221-7100
(Registrant’s telephone number, including area code) Indicate by check mark whether the registrant (1) has filed all reports required to be filed by Section 13 or 15(d) of the Securities Exchange Act of 1934 during the preceding 12 months (or for such shorter period that the registrant was required to file such reports), and (2) has been subject to such filing requirements for the past 90 days. Yes No � Indicate by check mark whether the registrant is an accelerated filer (as defined in Rule 12b-2 of the Exchange Act). Yes No � The number of shares of the issuer’s Common Stock, $0.20 par value, outstanding on July 28, 2005 was 62,683,284.
Quarterly Report Pursuant to Section 13 or 15(d) of the Securities Exchange Act of 1934
���� Transition Report Pursuant to Section 13 or 15(d) of the Securities Exchange Act of 1934
Delaware 95-2110371 (State or other jurisdiction of
incorporation or organization) (I.R.S. Employer
Identification No.)
2381 Morse Avenue, Irvine, California 92614 (Address of principal executive offices) (Zip Code)

Table of Contents
Table of Contents
2
Reference
Page
PART I. FINANCIAL INFORMATION
ITEM 1. Financial Statements
Unaudited Consolidated Balance Sheets as of September 26, 2004 and July 3, 2005 4
Unaudited Consolidated Income Statements for the Quarters and Nine Months Ended June 27, 2004 and July 3, 2005 5
Unaudited Consolidated Statements of Cash Flows for the Nine Months Ended June 27, 2004 and July 3, 2005 7
Notes to Unaudited Consolidated Financial Statements 8
ITEM 2. Management’s Discussion and Analysis of Financial Condition and Results of Operations 16
ITEM 3. Quantitative and Qualitative Disclosures about Market Risk 37
ITEM 4. Controls and Procedures 38
PART II. OTHER INFORMATION
ITEM 1. Legal Proceedings 39
ITEM 2. Unregistered Sales of Equity Securities and Use of Proceeds 39
ITEM 3. Default upon Senior Securities 39
ITEM 4. Submission of Matters to a Vote of Security Holders 39
ITEM 5. Other Information 39
ITEM 6. Exhibits 39

Table of Contents
PART I - FINANCIAL INFORMATION
Item 1. FINANCIAL STATEMENTS
The unaudited consolidated income statements for the quarter and nine months ended July 3, 2005 of Microsemi Corporation and Subsidiaries (which we herein sometimes refer to collectively as “Microsemi”, “the Company”, “we”, “our”, “ours” or “us”), the unaudited consolidated statements of cash flows for the nine months ended July 3, 2005, and the comparative unaudited consolidated financial information for the corresponding periods of the prior year, together with the unaudited balance sheets as of September 26, 2004 and July 3, 2005 are included herein.
3
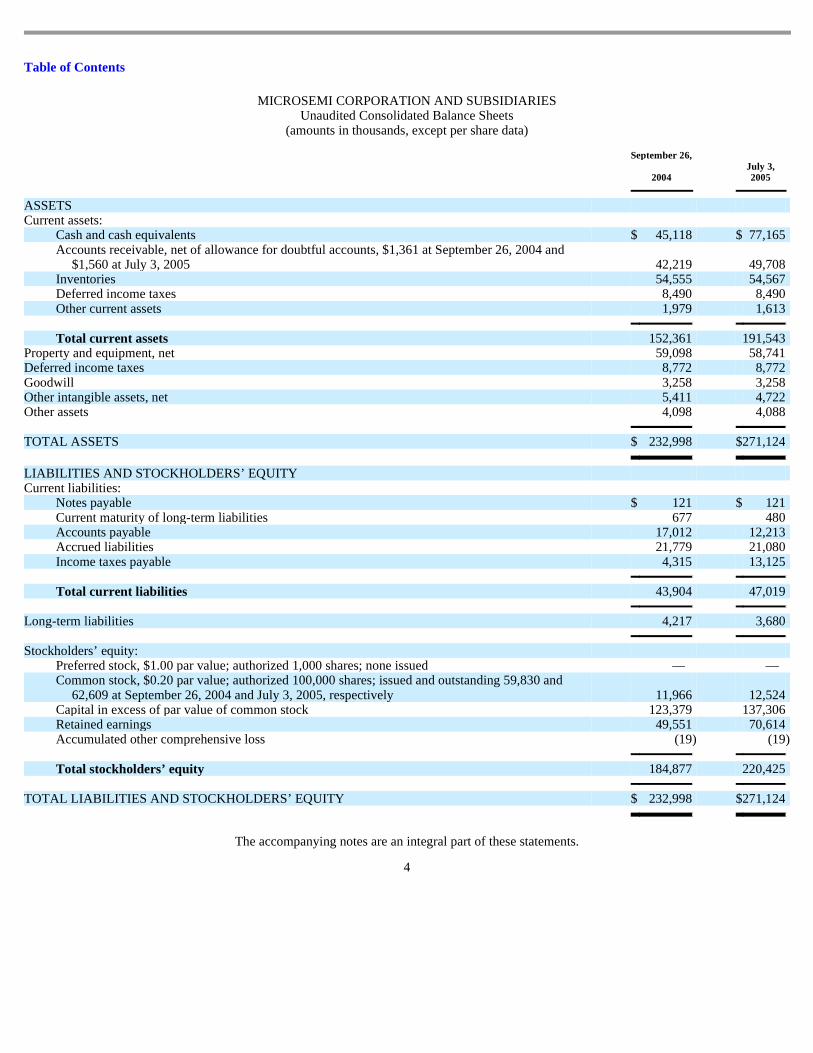
Table of Contents
MICROSEMI CORPORATION AND SUBSIDIARIES Unaudited Consolidated Balance Sheets
(amounts in thousands, except per share data)
The accompanying notes are an integral part of these statements.
4
September 26,
2004
July 3, 2005
ASSETS
Current assets:
Cash and cash equivalents $ 45,118 $ 77,165 Accounts receivable, net of allowance for doubtful accounts, $1,361 at September 26, 2004 and
$1,560 at July 3, 2005 42,219 49,708 Inventories 54,555 54,567 Deferred income taxes 8,490 8,490 Other current assets 1,979 1,613
Total current assets 152,361 191,543 Property and equipment, net 59,098 58,741 Deferred income taxes 8,772 8,772 Goodwill 3,258 3,258 Other intangible assets, net 5,411 4,722 Other assets 4,098 4,088
TOTAL ASSETS $ 232,998 $ 271,124
LIABILITIES AND STOCKHOLDERS’ EQUITY
Current liabilities:
Notes payable $ 121 $ 121 Current maturity of long-term liabilities 677 480 Accounts payable 17,012 12,213 Accrued liabilities 21,779 21,080 Income taxes payable 4,315 13,125
Total current liabilities 43,904 47,019
Long-term liabilities 4,217 3,680
Stockholders’ equity:
Preferred stock, $1.00 par value; authorized 1,000 shares; none issued — — Common stock, $0.20 par value; authorized 100,000 shares; issued and outstanding 59,830 and
62,609 at September 26, 2004 and July 3, 2005, respectively 11,966 12,524 Capital in excess of par value of common stock 123,379 137,306 Retained earnings 49,551 70,614 Accumulated other comprehensive loss (19 ) (19 )
Total stockholders’ equity 184,877 220,425
TOTAL LIABILITIES AND STOCKHOLDERS’ EQUITY $ 232,998 $ 271,124
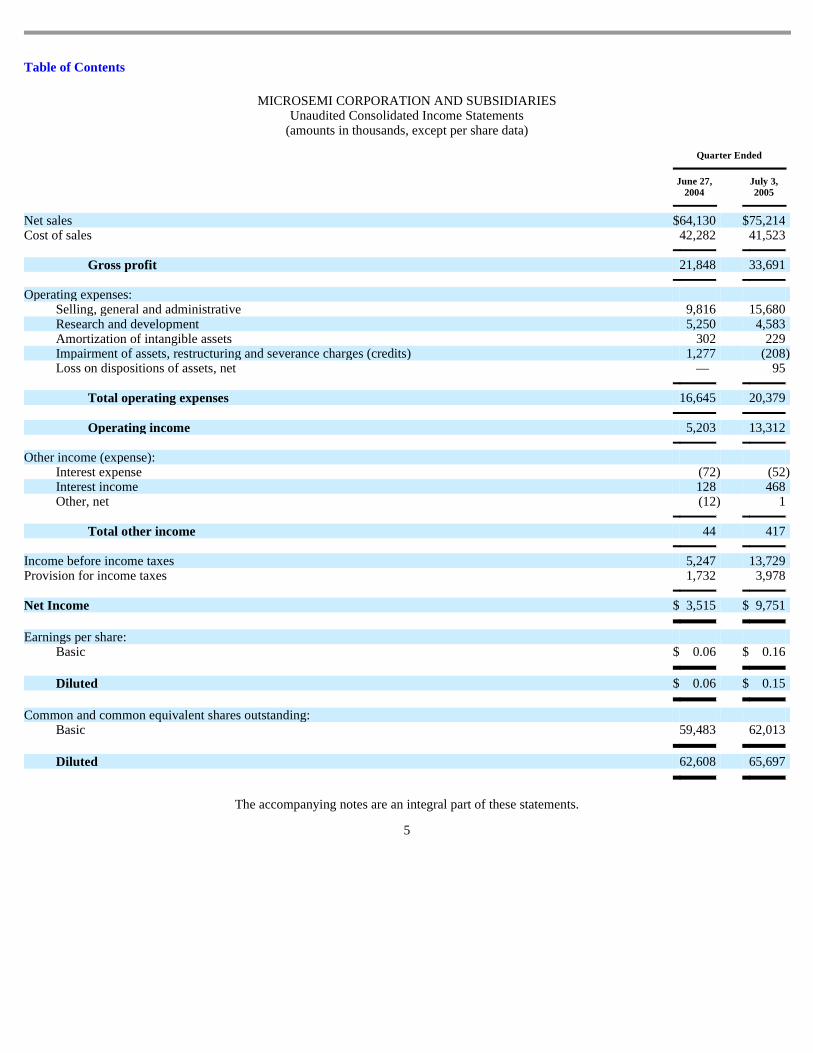
Table of Contents
MICROSEMI CORPORATION AND SUBSIDIARIES Unaudited Consolidated Income Statements
(amounts in thousands, except per share data)
The accompanying notes are an integral part of these statements.
5
Quarter Ended
June 27, 2004
July 3, 2005
Net sales $ 64,130 $ 75,214 Cost of sales 42,282 41,523
Gross profit 21,848 33,691
Operating expenses:
Selling, general and administrative 9,816 15,680 Research and development 5,250 4,583 Amortization of intangible assets 302 229 Impairment of assets, restructuring and severance charges (credits) 1,277 (208 ) Loss on dispositions of assets, net — 95
Total operating expenses 16,645 20,379
Operating income 5,203 13,312
Other income (expense):
Interest expense (72 ) (52 ) Interest income 128 468 Other, net (12 ) 1
Total other income 44 417
Income before income taxes 5,247 13,729 Provision for income taxes 1,732 3,978
Net Income $ 3,515 $ 9,751
Earnings per share:
Basic $ 0.06 $ 0.16
Diluted $ 0.06 $ 0.15
Common and common equivalent shares outstanding:
Basic 59,483 62,013
Diluted 62,608 65,697
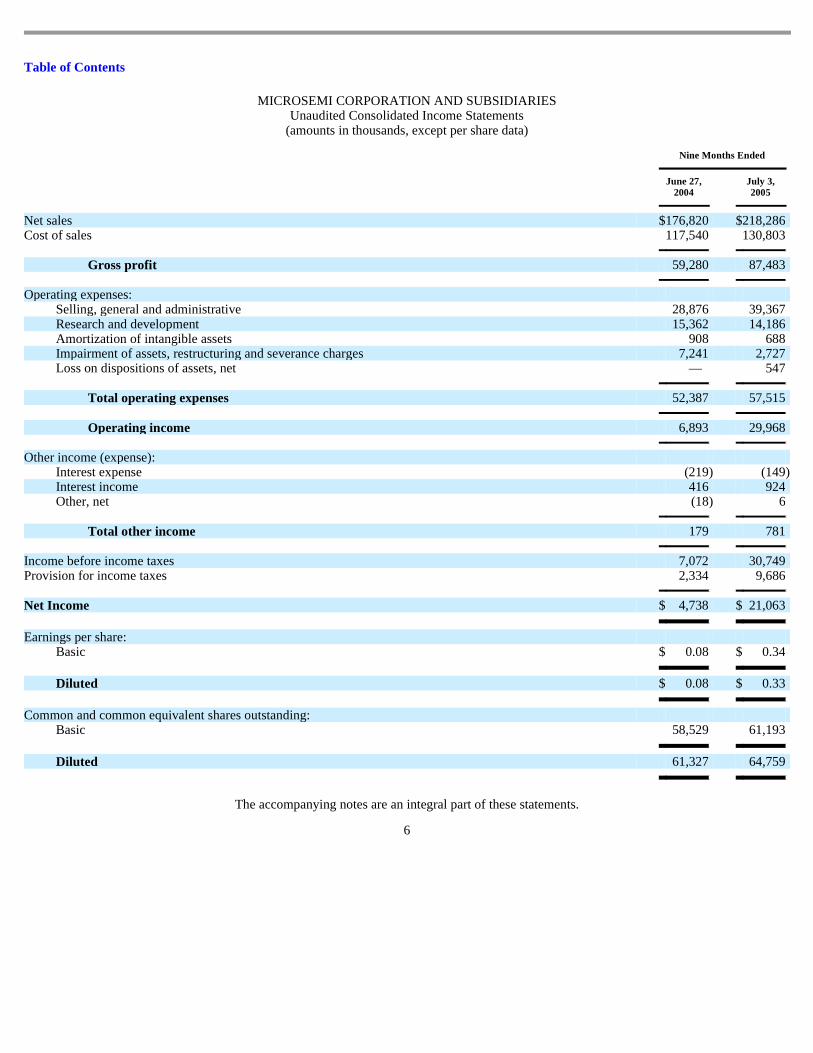
Table of Contents
MICROSEMI CORPORATION AND SUBSIDIARIES Unaudited Consolidated Income Statements
(amounts in thousands, except per share data)
The accompanying notes are an integral part of these statements.
6
Nine Months Ended
June 27, 2004
July 3, 2005
Net sales $ 176,820 $ 218,286 Cost of sales 117,540 130,803
Gross profit 59,280 87,483
Operating expenses:
Selling, general and administrative 28,876 39,367 Research and development 15,362 14,186 Amortization of intangible assets 908 688 Impairment of assets, restructuring and severance charges 7,241 2,727 Loss on dispositions of assets, net — 547
Total operating expenses 52,387 57,515
Operating income 6,893 29,968
Other income (expense):
Interest expense (219 ) (149 ) Interest income 416 924 Other, net (18 ) 6
Total other income 179 781
Income before income taxes 7,072 30,749 Provision for income taxes 2,334 9,686
Net Income $ 4,738 $ 21,063
Earnings per share:
Basic $ 0.08 $ 0.34
Diluted $ 0.08 $ 0.33
Common and common equivalent shares outstanding:
Basic 58,529 61,193
Diluted 61,327 64,759

Table of Contents
MICROSEMI CORPORATION AND SUBSIDIARIES Unaudited Consolidated Statements of Cash Flows
(amounts in thousands, except per share data)
The accompanying notes are an integral part of these statements.
7
Nine Months Ended
June 27, 2004
July 3, 2005
Cash flows from operating activities:
Net income $ 4,738 $ 21,063 Adjustments to reconcile net income to net cash provided by operating activities:
Depreciation and amortization 9,065 9,177 Provision for doubtful accounts 65 253 Loss on dispositions and retirements of assets — 547 Changes in assets and liabilities:
Accounts receivable (5,036 ) (7,742 ) Inventories (4,876 ) (12 ) Other current assets (250 ) 366 Accounts payable 2,371 (4,799 ) Accrued liabilities 7,464 (516 ) Income taxes payable 1,662 8,810 Other long-term liabilities (191 ) (154 )
Net cash provided by operating activities 15,012 26,993
Cash flows from investing activities:
Purchases of property and equipment (8,137 ) (8,861 ) Changes in other assets (5 ) 10
Net cash used in investing activities (8,142 ) (8,851 )
Cash flows from financing activities:
Payments of long-term liabilities (43 ) (580 ) Exercise of employee stock options 4,989 14,485
Net cash provided by financing activities 4,946 13,905
Effect of exchange rate changes on cash (9 ) — Net increase in cash and cash equivalents 11,807 32,047 Cash and cash equivalents at beginning of period 29,353 45,118
Cash and cash equivalents at end of period $ 41,160 $ 77,165

Table of Contents
MICROSEMI CORPORATION AND SUBSIDIARIES NOTES TO UNAUDITED CONSOLIDATED FINANCIAL STATEMENTS
July 3, 2005
1. PRESENTATION OF FINANCIAL INFORMATION
The unaudited consolidated financial statements include the accounts of Microsemi Corporation and its subsidiaries (which we herein sometimes refer to collectively as “Microsemi”, “the Company”, “we”, “our”, “ours” or “us”). Intercompany transactions have been eliminated in consolidation. The financial information furnished herein is unaudited, but in the opinion of our management, includes all adjustments (all of which are normal, recurring adjustments) necessary for a fair statement of the results of operations for the periods indicated. The results of operations for the first nine months ended July 3, 2005 of the current fiscal year are not necessarily indicative of the results to be expected for the full year. The accompanying unaudited consolidated financial statements have been prepared in accordance with the instructions to Form 10-Q, and therefore do not include all information and note disclosures necessary for a fair presentation of financial position, results of operations and cash flows in conformity with generally accepted accounting principles. The unaudited consolidated financial statements and notes should be read in conjunction with the consolidated financial statements and notes thereto in the Annual Report on Form 10-K for the fiscal year ended September 26, 2004. Critical Accounting Policies and Estimates The unaudited consolidated financial statements have been prepared in accordance with accounting principles generally accepted in the United States that require us to make estimates and assumptions that materially affect the reported amounts of assets and liabilities at the date of the unaudited consolidated financial statements and revenues and expenses during the periods reported. Actual results could differ from those estimates.
2. INVENTORIES
Inventories used in the computation of cost of goods sold were (amounts in thousands):
September 26,
2004
July 3, 2005
Raw Materials $ 13,289 $ 14,438 Work in Progress 28,244 24,020 Finished Goods 13,022 16,109 $ 54,555 $ 54,567
3. CONTINGENCY
In Broomfield, Colorado, the owner of a property located adjacent to a manufacturing facility owned by Microsemi Corp. - Colorado (“the Subsidiary”) had notified the subsidiary and other parties, of a claim that contaminants migrated to his property, thereby diminishing its value. In August 1995, the subsidiary, together with Coors Porcelain Company, FMC Corporation and Siemens Microelectronics, Inc. (former owners of the manufacturing facility), agreed to settle the claim and to indemnify the owner of the adjacent property for remediation costs. Although TCE and other contaminants previously used by former owners at the facility are present in soil and groundwater on the subsidiary’s property, we vigorously contest any assertion that the subsidiary caused the contamination. In November 1998, we signed an agreement with the three former owners of this facility whereby they have 1) reimbursed us for $530,000 of past costs, 2) assumed responsibility for 90% of all future clean-up costs, and 3) promised to indemnify and protect us against any and all third-party claims relating to the contamination of the facility. An Integrated Corrective Action Plan was submitted to the State of Colorado. Sampling and management plans were prepared for the Colorado Department of Public Health & Environment. State and local agencies in Colorado are reviewing current data and considering study and cleanup options. The most recent forecast estimated
8

Table of Contents
that the total project cost, up to the year 2020, would be approximately $5,300,000; accordingly, by assuming that this amount is accurate and that the indemnifying parties will pay 90% of this amount as agreed without need for us to incur material costs to enforce that agreement, we reserved for this contingency by recording a one-time charge of $530,000 for the life of this project in fiscal year 2003. There has not been any significant development since September 28, 2003. On October 7, 2004, we filed a complaint in the United States District Court for the Central District of California entitled Microsemi Corporation v. Monolithic Power Systems, Inc., Case Number SACV04-1174 CJC (Anx). The Complaint alleges infringement of Microsemi patents and seeks an injunction, actual damages, treble damages, declaratory relief and attorneys’ fees. The defendant filed a cross-claim for declaratory relief and attorneys’ fees. We are in the early stage of this litigation and unable to assess the possible outcome of this litigation. We are involved in other normal litigation matters, arising out of the ordinary routine conduct of our business, including from time to time litigation relating to commercial transactions, contracts, and environmental matters. In the opinion of management, the final outcome of these matters will not have a material adverse effect on our financial position, results of operations or cash flows.
4. COMPREHENSIVE INCOME
Comprehensive income is defined as the change in equity (net assets) of a business enterprise during the period from transactions and other events and circumstances from non-owner sources. Our comprehensive income consists of net income and the change of the cumulative foreign currency translation adjustment. Accumulated other comprehensive loss consists of the cumulative foreign currency translation adjustment. Total comprehensive income for the quarters and nine months ended June 27, 2004 and July 3, 2005 were calculated as follows (amounts in 000’s):
Quarters Ended
Nine Months Ended
June 27, 2004
July 3, 2005
June 27, 2004
July 3, 2005
Net income $ 3,515 $ 9,751 $ 4,738 $ 21,063 Translation adjustment — — (9 ) —
Comprehensive income $ 3,515 $ 9,751 $ 4,729 $ 21,063
5. EARNINGS PER SHARE
Basic earnings per share have been computed based upon the weighted average number of common shares outstanding during the respective periods. Diluted earnings per share have been computed, when the result is dilutive, using the treasury stock method for stock options outstanding during the respective periods. On February 23, 2004, we effected a 2-for-1 stock split of shares of our common stock by means of a stock dividend. This stock split has been reflected in the following calculation of earnings per share for all periods presented (see Note 10).
9

Table of Contents
Earnings per share (“EPS”) for the respective quarters and respective nine months ended June 27, 2004 and July 3, 2005 were calculated as follows (amounts in thousands, except per share data):
Approximately 540,000 and 8,000 options were not included in the computation of diluted EPS in the third quarters of fiscal years 2004 and 2005, respectively, and 361,000 and 65,000 options were not included in the computation of diluted EPS in the first nine months of fiscal years 2004 and 2005, respectively, as they would have been antidilutive.
Quarters Ended
Nine Months Ended
June 27, 2004
July 3, 2005
June 27, 2004
July 3, 2005
BASIC
Net income $ 3,515 $ 9,751 $ 4,738 $ 21,063
Weighted-average common shares outstanding 59,483 62,013 58,529 61,193
Basic earnings per share $ 0.06 $ 0.16 $ 0.08 $ 0.34
DILUTED
Net income $ 3,515 $ 9,751 $ 4,738 $ 21,063
Weighted-average common shares outstanding 59,483 62,013 58,529 61,193
Dilutive effect of stock options 3,125 3,684 2,798 3,566
Weighted-average common shares outstanding on a diluted basis 62,608 65,697 61,327 64,759
Diluted earnings per share $ 0.06 $ 0.15 $ 0.08 $ 0.33
6. RECENTLY ISSUED ACCOUNTING STANDARDS
Statement of Financial Accounting Standards No. 123 (revised 2004) There is more than one way under generally accepted accounting principles to account for the economic consequences of granting options or other equity compensation, and many accounting experts believe that charging earnings pursuant to the Financial Accounting Standards Board, or FASB, Statement 123 (“FAS 123”), as amended by FASB Statement 148 (“FAS 148”), would account better for the economic consequences of granting an option or other equity compensation than APB Opinion No. 25 (“APB 25”) would. We use APB 25 to account for equity compensation, which does not require a charge to earnings for the economic consequences of granting options or other equity compensation. We have disclosed an estimate of stock option expense in the Notes to our financial statements, but have not deducted this amount from our earnings as reported in the financial statements. We will be required to do so when we begin to account for equity compensation, which includes employee stock options, under FASB Statement 123R “Share-Based Payment” (“FAS 123R”), commencing prospectively with our first quarter of fiscal year 2006, which will require all companies to record compensation costs for all share-based payments, at fair value. We have not determined the transition method to be used in adopting FAS 123R. The effects of the adoption of FAS 123R may be material but the effects are currently not estimable. (See Note 7).
10

Table of Contents
Statement of Financial Accounting Standards No. 151 In November 2004, the Financial Accounting Standards Board issued FAS No. 151, “Inventory costs, an amendment of ARB No. 43 Chapter 4”. This Statement amends the guidance in ARB No. 43, Chapter 4, “Inventory Pricing,” to clarify the accounting for abnormal amounts of idle facility expense, freight, handling costs, and wasted material (spoilage). It requires that those items be recognized as current-period charges regardless of whether they meet the criteria in the earlier guidance of “so abnormal”. In addition, this Statement requires that allocation of fixed production overheads to the costs of conversion be based on the normal capacity of the production facilities. The provisions of this statement shall be applied prospectively for inventory costs incurred during fiscal years beginning after June 15, 2005 (our fiscal year 2006). We do not expect the adoption of this statement will have a material impact on our results of operations, financial position or cash flow. Statement of Financial Accounting Standards No. 153 In December 2004, the Financial Accounting Standards Board issued FAS No. 153, “Exchanges of Nonmonetary Assets – an amendment of APB Opinion No. 29”. The guidance in APB Opinion No. 29, Accounting for Nonmonetary Transactions, is based on the principle that exchanges of nonmonetary assets should be measured based on the fair value of the assets exchanged. The guidance in that Opinion, however, included certain exceptions to that principle. This Statement amends Opinion 29 to eliminate the exception for nonmonetary exchanges of similar productive assets and replaces it with a general exception for exchanges of nonmonetary assets that do not have commercial substance. A nonmonetary exchange has commercial substance only if the future cash flows of the entity are expected to change significantly as a result of the exchange. This statement is effective for nonmonetary asset exchanges occurring in fiscal periods beginning after June 15, 2005. We do not expect the adoption of this statement will have a material impact on our results of operations, financial position or cash flow. Statement of Financial Accounting Standards No. 154 In June 2005, the Financial Accounting Standards Board issued FAS No. 154, “Accounting Changes and Error Corrections – a replacement of APB Opinion No. 20 and FASB Statement No. 3”. This Statement generally requires retrospective application to prior periods’ financial statements of changes in accounting principle. Previously, Opinion No. 20 required that most voluntary changes in accounting principle were recognized by including the cumulative effect of changing to the new accounting principle in net income of the period of the change. FAS 154 applies to all voluntary changes in accounting principle. It also applies to changes required by an accounting pronouncement in the unusual instance that the pronouncement does not include specific transition provisions. When a pronouncement includes specific transition provisions, those provisions should be followed. This Statement shall be effective for accounting changes and corrections of errors made in fiscal years beginning after December 15, 2005 (our fiscal year 2007). We do not expect the adoption of this statement will have a material impact on our results of operations, financial position or cash flow.
7. STOCK-BASED COMPENSATION
In our fiscal year 2005, Statement of Financial Accounting Standards No. 123, “Accounting for Stock-Based Compensation” (SFAS 123) provides an alternative to APB 25 in accounting for stock-based compensation issued to employees. SFAS 123 provides for a fair value based method of accounting for employee stock options and similar equity instruments. However, companies that continue to account for stock-based compensation arrangements under APB 25 are required by SFAS 123 to disclose, in the notes to financial statements, the pro forma effects on net income (loss) and net income (loss) per share as if the fair value based method prescribed by SFAS 123 had been applied. We account for stock-based compensation using the provisions of APB 25 and present the pro forma information required by SFAS 123 as amended by Statement of Financial Accounting Standards No. 148, “Accounting for Stock-Based Compensation-Transition and Disclosure” (SFAS 148).
11

Table of Contents
The following table illustrates the effects on net income (loss) and earnings (loss) per share as if the fair value based method had been applied to all outstanding awards in each period (amounts in thousands, except earnings (loss) per share):
Quarters Ended
Nine Months Ended
June 27, 2004
July 3, 2005
June 27, 2004
July 3, 2005
Net income, as reported $ 3,515 $ 9,751 $ 4,738 $ 21,063 Deduct: Total stock-based employee compensation expense determined under fair value
based method for all awards, net of related tax effects (2,002 ) (2,555 ) (6,548 ) (7,594 )
Pro forma net income (loss) $ 1,513 $ 7,196 $ (1,810 ) $ 13,469
Earnings (loss) per share:
Basic - as reported $ 0.06 $ 0.16 $ 0.08 $ 0.34
Basic - pro forma $ 0.03 $ 0.12 $ (0.03 ) $ 0.22
Diluted - as reported $ 0.06 $ 0.15 $ 0.08 $ 0.33
Diluted - pro forma $ 0.02 $ 0.11 $ (0.03 ) $ 0.21
8. GEOGRAPHICAL INFORMATION
We operate in a single industry segment as a manufacturer of semiconductors in different geographic areas, including the United States, Europe and Asia. Financial information by the originating geographic areas is as follows (amounts in thousands):
12
Nine Months Ended
June 27, 2004
July 3, 2005
Net sales to external customers:
United States $ 152,980 $ 190,200 Europe 22,505 25,270 Asia 1,335 2,816
Total $ 176,820 $ 218,286
September 26,
2004
July 3, 2005
Long lived assets:
United States $ 57,782 $ 57,330 Europe 774 913 Asia 542 498
Total $ 59,098 $ 58,741
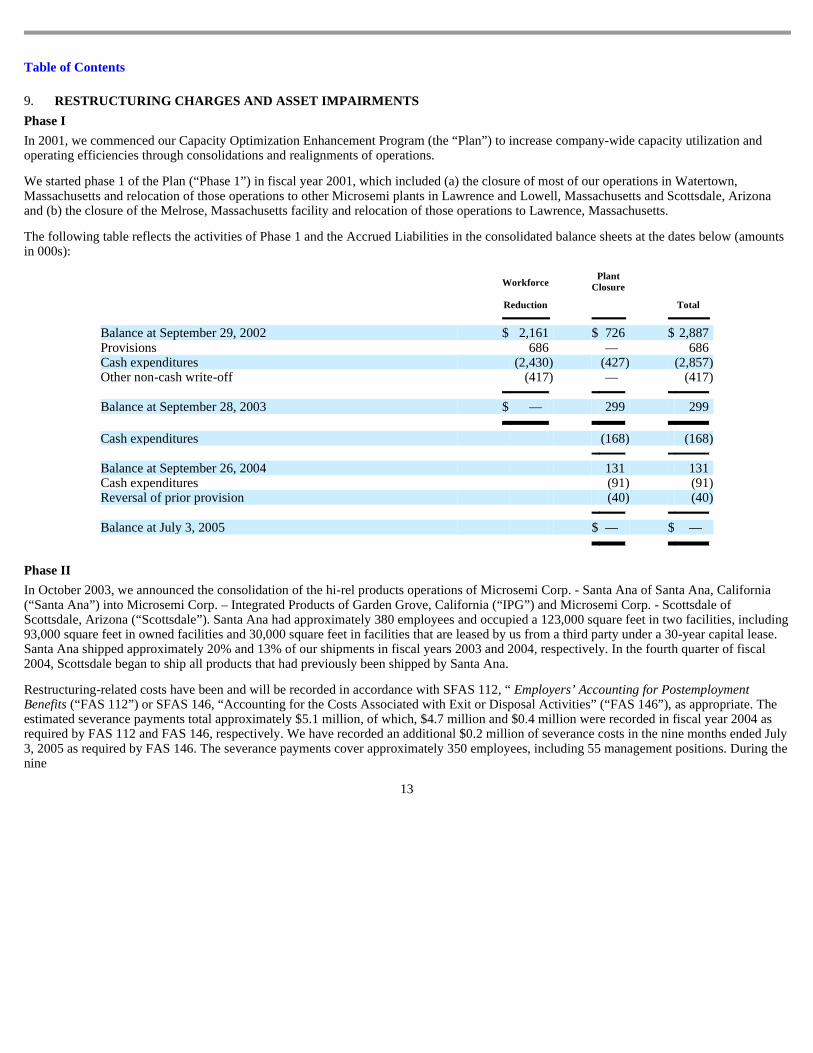
Table of Contents
9. RESTRUCTURING CHARGES AND ASSET IMPAIRMENTS
Phase I In 2001, we commenced our Capacity Optimization Enhancement Program (the “Plan”) to increase company-wide capacity utilization and operating efficiencies through consolidations and realignments of operations. We started phase 1 of the Plan (“Phase 1”) in fiscal year 2001, which included (a) the closure of most of our operations in Watertown, Massachusetts and relocation of those operations to other Microsemi plants in Lawrence and Lowell, Massachusetts and Scottsdale, Arizona and (b) the closure of the Melrose, Massachusetts facility and relocation of those operations to Lawrence, Massachusetts. The following table reflects the activities of Phase 1 and the Accrued Liabilities in the consolidated balance sheets at the dates below (amounts in 000s):
Phase II
Workforce
Reduction
Plant Closure
Total
Balance at September 29, 2002 $ 2,161 $ 726 $ 2,887 Provisions 686 — 686 Cash expenditures (2,430 ) (427 ) (2,857 ) Other non-cash write-off (417 ) — (417 )
Balance at September 28, 2003 $ — 299 299
Cash expenditures (168 ) (168 )
Balance at September 26, 2004 131 131 Cash expenditures (91 ) (91 ) Reversal of prior provision (40 ) (40 )
Balance at July 3, 2005 $ — $ —
In October 2003, we announced the consolidation of the hi-rel products operations of Microsemi Corp. - Santa Ana of Santa Ana, California (“Santa Ana”) into Microsemi Corp. – Integrated Products of Garden Grove, California (“IPG”) and Microsemi Corp. - Scottsdale of Scottsdale, Arizona (“Scottsdale”). Santa Ana had approximately 380 employees and occupied a 123,000 square feet in two facilities, including 93,000 square feet in owned facilities and 30,000 square feet in facilities that are leased by us from a third party under a 30-year capital lease. Santa Ana shipped approximately 20% and 13% of our shipments in fiscal years 2003 and 2004, respectively. In the fourth quarter of fiscal 2004, Scottsdale began to ship all products that had previously been shipped by Santa Ana. Restructuring-related costs have been and will be recorded in accordance with SFAS 112, “ Employers’ Accounting for Postemployment Benefits (“FAS 112”) or SFAS 146, “Accounting for the Costs Associated with Exit or Disposal Activities” (“FAS 146”), as appropriate. The estimated severance payments total approximately $5.1 million, of which, $4.7 million and $0.4 million were recorded in fiscal year 2004 as required by FAS 112 and FAS 146, respectively. We have recorded an additional $0.2 million of severance costs in the nine months ended July 3, 2005 as required by FAS 146. The severance payments cover approximately 350 employees, including 55 management positions. During the nine
13

Table of Contents
months ended July 3, 2005, we have reduced our estimated accrual for severance by $0.8 million due to lower employee benefits than previously estimated and employees that were transferred to other operations of Microsemi. Approximately 30 employees have been transferred to other Microsemi operations. In the nine months ended July 3, 2005 we recorded $0.3 million for other restructuring related expenses. We have not incurred any material charge for cancellations of operating leases. Any other change of estimate will be recognized as an adjustment to the accrued liabilities in the period of change. Production in Santa Ana ceased in the third quarter of fiscal year 2005. The following table reflects the activities related to the consolidation of Santa Ana and the accrued liabilities in the consolidated balance sheets at the dates below (amounts in 000s):
In the second quarter of fiscal year 2004, we started to consolidate the remainder of our operations in Watertown, Massachusetts (“Watertown”). We moved production to our facilities in Scottsdale and Lowell, Massachusetts (“Lowell”). Restructuring-related costs have been recorded in accordance with FAS 112 or FAS 146, as appropriate. The estimated severance payments total approximately $0.7 million, of which, $0.5 million and $0.2 million were recorded in fiscal year 2004 as required by FAS 112 and FAS 146, respectively. The severance payments cover approximately 30 employees, including 4 management positions. We also recorded $1.5 million for impairment of fixed assets in fiscal year 2004. We did not incur any other material charge. The consolidation of the Watertown operations was completed in December 2004. The following table reflects the activities of the final phase of the consolidation in Watertown and the liabilities included in accrued liabilities in the consolidated balance sheets at the dates below (amounts in 000s):
In the first quarter of fiscal year 2005, we recorded $0.3 million severance for 22 employees of Microsemi Corp. – Colorado of Broomfield, Colorado (“Colorado”), including 1 management position, in accordance with FAS 112. This severance amount was paid by the end of the third quarter of fiscal year 2005.
14
Employee
Severance
Other Related
Costs
Total
Provisions $ 5,132 $ 466 $ 5,598 Cash expenditures (1,263 ) (466 ) (1,729 )
Balance at September 26, 2004 3,869 — 3,869 Provisions 176 288 464 Reduction of benefits (821 ) — (821 ) Cash expenditures (1,632 ) (288 ) (1,920 )
Balance at July 3, 2005 $ 1,592 $ — $ 1,592
Employee
Severance
Other Related
Costs
Total
Provisions $ 739 $ 518 $ 1,257 Cash expenditures (278 ) (518 ) (796 )
Balance at September 26, 2004 461 — 461 Provisions 15 97 112 Cash expenditures (372 ) (97 ) (469 )
Balance at July 3, 2005 $ 104 $ — $ 104
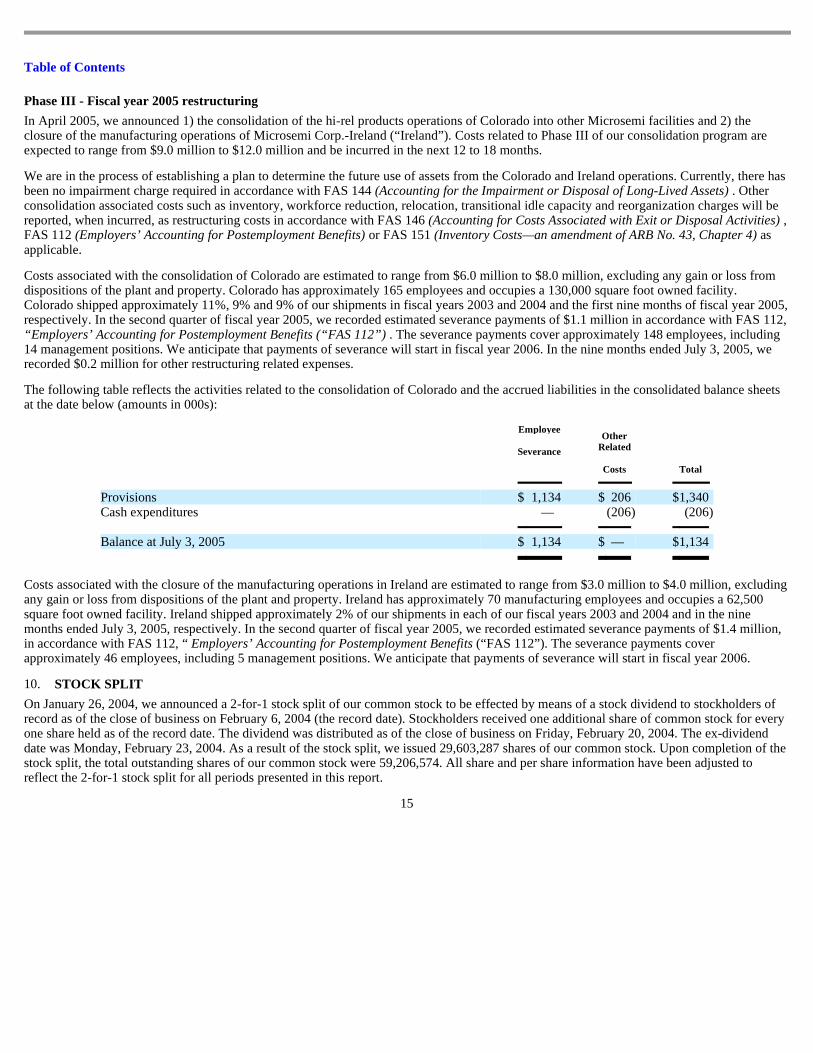
Table of Contents
Phase III - Fiscal year 2005 restructuring In April 2005, we announced 1) the consolidation of the hi-rel products operations of Colorado into other Microsemi facilities and 2) the closure of the manufacturing operations of Microsemi Corp.-Ireland (“Ireland”). Costs related to Phase III of our consolidation program are expected to range from $9.0 million to $12.0 million and be incurred in the next 12 to 18 months. We are in the process of establishing a plan to determine the future use of assets from the Colorado and Ireland operations. Currently, there has been no impairment charge required in accordance with FAS 144 (Accounting for the Impairment or Disposal of Long-Lived Assets) . Other consolidation associated costs such as inventory, workforce reduction, relocation, transitional idle capacity and reorganization charges will be reported, when incurred, as restructuring costs in accordance with FAS 146 (Accounting for Costs Associated with Exit or Disposal Activities) , FAS 112 (Employers’ Accounting for Postemployment Benefits) or FAS 151 (Inventory Costs—an amendment of ARB No. 43, Chapter 4) as applicable. Costs associated with the consolidation of Colorado are estimated to range from $6.0 million to $8.0 million, excluding any gain or loss from dispositions of the plant and property. Colorado has approximately 165 employees and occupies a 130,000 square foot owned facility. Colorado shipped approximately 11%, 9% and 9% of our shipments in fiscal years 2003 and 2004 and the first nine months of fiscal year 2005, respectively. In the second quarter of fiscal year 2005, we recorded estimated severance payments of $1.1 million in accordance with FAS 112, “Employers’ Accounting for Postemployment Benefits (“FAS 112”) . The severance payments cover approximately 148 employees, including 14 management positions. We anticipate that payments of severance will start in fiscal year 2006. In the nine months ended July 3, 2005, we recorded $0.2 million for other restructuring related expenses. The following table reflects the activities related to the consolidation of Colorado and the accrued liabilities in the consolidated balance sheets at the date below (amounts in 000s):
Costs associated with the closure of the manufacturing operations in Ireland are estimated to range from $3.0 million to $4.0 million, excluding any gain or loss from dispositions of the plant and property. Ireland has approximately 70 manufacturing employees and occupies a 62,500 square foot owned facility. Ireland shipped approximately 2% of our shipments in each of our fiscal years 2003 and 2004 and in the nine months ended July 3, 2005, respectively. In the second quarter of fiscal year 2005, we recorded estimated severance payments of $1.4 million, in accordance with FAS 112, “ Employers’ Accounting for Postemployment Benefits (“FAS 112”). The severance payments cover approximately 46 employees, including 5 management positions. We anticipate that payments of severance will start in fiscal year 2006.
Employee
Severance
Other Related
Costs
Total
Provisions $ 1,134 $ 206 $ 1,340 Cash expenditures — (206 ) (206 )
Balance at July 3, 2005 $ 1,134 $ — $ 1,134
10. STOCK SPLIT
On January 26, 2004, we announced a 2-for-1 stock split of our common stock to be effected by means of a stock dividend to stockholders of record as of the close of business on February 6, 2004 (the record date). Stockholders received one additional share of common stock for every one share held as of the record date. The dividend was distributed as of the close of business on Friday, February 20, 2004. The ex-dividend date was Monday, February 23, 2004. As a result of the stock split, we issued 29,603,287 shares of our common stock. Upon completion of the stock split, the total outstanding shares of our common stock were 59,206,574. All share and per share information have been adjusted to reflect the 2-for-1 stock split for all periods presented in this report.
15

Table of Contents
11. SUBSEQUENT EVENT
In August 2005, we announced that we will accelerate the vesting of certain unvested stock options, all previously awarded to eligible participants under our 1987 Stock Plan, as amended. Upon our planned adoption of FASB Statement No. 123R, “Share-Based Payment,” effective for fiscal year 2006, vesting of unvested options will add to our compensation expense. Therefore, we accelerated vesting into fiscal year 2005 before the new accounting rule takes effect. We have imposed substantial restrictions on all shares issued under the accelerated options. These restrictions prevent the selling of any shares acquired upon the exercise of accelerated options (except as necessary to cover the exercise price and satisfy Federal and State withholding taxes) until the date on which such options would have vested under their original vesting schedule. As a result of this vesting acceleration, options to purchase approximately 5.1 million shares of common stock shall become fully vested on or about September 27, 2005, including approximately 1.3 million shares held by officers. Based on the August 10, 2005, closing market price of Microsemi common stock, which was $21.97, the intrinsic value of the accelerated options is estimated to be approximately $56.3 million to $62.3 million, of which $14.7 million to $16.2 million relate to options held by officers. Compensation expense that would have been recorded absent the accelerated vesting, is approximately $36.0 million of which approximately $15.8 million would have been in fiscal year 2006. We expect a non-cash compensation charge as a result of the accelerated vesting of approximately $3.9 million to $4.3 million in the fourth quarter of fiscal year 2005 related to the excess of the intrinsic value over the fair market value of the Company’s stock on the acceleration date of those options that would have been forfeited had the vesting not been accelerated. In determining the forfeiture rates, the Company reviewed the impact of divisions that were previously sold or consolidated, one-time events that are not expected to recur and whether options were held by officers of the Company. The compensation charge will be adjusted in future periods as actual forfeitures are realized.
Item 2. MANAGEMENT’S DISCUSSION AND ANALYSIS OF FIN ANCIAL CONDITION AND RESULTS OF OPERATIONS
Overview This Quarterly Report on Form 10-Q includes current beliefs, expectations and other forward looking statements, the realization of which may be adversely impacted by any of the factors discussed or referenced under the heading “Important Factors Related to Forward-Looking Statements and Associated Risks,” found in this section. This “Management’s Discussion and Analysis of Financial Condition and Results of Operations” and the accompanying unaudited consolidated financial statements and notes should be read in conjunction with the “Management’s Discussion and Analysis of Financial Condition and Results of Operations” and the consolidated financial statements and notes thereto in the Annual Report on Form 10-K for the fiscal year ended September 26, 2004. Microsemi is a leading designer, manufacturer and marketer of high performance analog and mixed-signal integrated circuits and high reliability semiconductors. Our semiconductors manage and control or regulate power, protect against transient voltage spikes and transmit, receive and amplify signals. Our products include individual components as well as integrated circuit solutions that enhance customer designs by reducing size, protecting circuits, or improving performance, reliability and battery optimization. The principal markets we serve include implanted medical, defense/aerospace and satellite, notebook computer, monitors, and LCD TV’s, automotive and mobile connectivity applications. We currently serve a broad group of customers. None of our customers accounted for more than 6% of our total net sales in the first nine months of fiscal year 2005. The following were our major customers during that period: Seagate Technology (6%), VLSIP Technologies Inc. (3%), Honeywell (3%), Medtronic Incorporated (3%), Lockheed Martin Corporation (2%), Raytheon Co. (2%), St. Jude Medical (2%), and The Boeing Co. (2%). The percentage amounts in parentheses are the approximate sales to each of the respective customers as a percentage of our total net sales in the nine months ended July 3, 2005.
16

Table of Contents
Capacity Optimization Enhancement Program Phase I In 2001, we commenced our Capacity Optimization Enhancement Program (the “Plan”) to increase company-wide capacity utilization and operating efficiencies through consolidations and realignments of operations. We started phase 1 of the Plan (“Phase 1”) in fiscal year 2001, which included (a) the closure of most of our operations in Watertown, Massachusetts and relocation of those operations to other Microsemi plants in Lawrence and Lowell, Massachusetts and Scottsdale, Arizona and (b) the closure of the, Melrose, Massachusetts facility and relocation of those operations to Lawrence, Massachusetts. The following table reflects the activities of Phase 1 and the Accrued Liabilities in the consolidated balance sheets at the dates below (amounts in 000s):
Phase II
Workforce
Reduction
Plant Closure
Total
Balance at September 29, 2002 $ 2,161 $ 726 $ 2,887 Provisions 686 — 686 Cash expenditures (2,430 ) (427 ) (2,857 ) Other non-cash write-off (417 ) — (417 )
Balance at September 28, 2003 $ — 299 299
Cash expenditures (168 ) (168 )
Balance at September 26, 2004 131 131 Cash expenditures (91 ) (91 ) Reversal of prior provision (40 ) (40 )
Balance at July 3, 2005 $ — $ —
In October 2003, we announced the consolidation of the hi-rel products operations of Microsemi Corp. - Santa Ana of Santa Ana, California (“Santa Ana”) into Microsemi Corp. – Integrated Products of Garden Grove, California (“IPG”) and Microsemi Corp. - Scottsdale of Scottsdale, Arizona (“Scottsdale”). Santa Ana had approximately 380 employees and occupied a 123,000 square feet in two facilities, including 93,000 square feet in owned facilities and 30,000 square feet in facilities that are leased by us from a third party under a 30-year capital lease. Santa Ana shipped approximately 20% and 13% of our shipments in fiscal years 2003 and 2004, respectively. In the fourth quarter of fiscal 2004, Scottsdale began to ship all products that had previously been shipped by Santa Ana. Restructuring-related costs have been and will be recorded in accordance with SFAS 112, “ Employers’ Accounting for Postemployment Benefits (“FAS 112”) or SFAS 146, “Accounting for the Costs Associated with Exit or Disposal Activities” (“FAS 146”), as appropriate. The estimated severance payments total approximately $5.1 million, of which, $4.7 million and $0.4 million were recorded in fiscal year 2004 as required by FAS 112 and FAS 146, respectively. We have recorded an additional $0.2 million of severance costs in the nine months ended July 3, 2005 as required by FAS 146. The severance payments cover approximately 350 employees, including 55 management positions. During the nine months ended July 3, 2005, we have reduced our estimated accrual for severance by $0.8 million due to lower employee benefits than previously estimated and employees that were transferred to other operations of Microsemi. Approximately 30 employees have been transferred to other Microsemi
17

Table of Contents
operations. In the nine months ended July 3, 2005 we recorded $0.3 million for other restructuring related expenses. We have not incurred any material charge for cancellations of operating leases. Any other change of estimate will be recognized as an adjustment to the accrued liabilities in the period of change. Production in Santa Ana ceased in the third quarter of fiscal year 2005. The following table reflects the activities related to the consolidation of Santa Ana and the accrued liabilities in the consolidated balance sheets at the dates below (amounts in 000s):
The consolidation of Santa Ana is expected to result, subsequent to its completion, in annual cost savings of $8 million to $12 million from the elimination of redundant facilities and related expenses and employee reductions. Further, we own a substantial portion of the plant and the real estate it occupies in Santa Ana, California, and we expect to offer the owned property for sale at the prevailing market price which is expected to exceed book value. In the second quarter of fiscal year 2004, we started to consolidate the remainder of our operations in Watertown, Massachusetts (“Watertown”). We moved production to our facilities in Scottsdale and Lowell, Massachusetts (“Lowell”). Restructuring-related costs have been recorded in accordance with FAS 112 or FAS 146, as appropriate. The estimated severance payments total approximately $0.7 million, of which, $0.5 million and $0.2 million were recorded in fiscal year 2004 as required by FAS 112 and FAS 146, respectively. The severance payments cover approximately 30 employees, including 4 management positions. We also recorded $1.5 million for impairment of fixed assets in fiscal year 2004. We did not incur any other material charge on account of this consolidation. We completed the consolidation of the Watertown operations in December 2004.
18
Employee
Severance
Other Related
Costs
Total
Provisions $ 5,132 $ 466 $ 5,598 Cash expenditures (1,263 ) (466 ) (1,729 )
Balance at September 26, 2004 3,869 — 3,869 Provisions 176 288 464 Reduction of benefits (821 ) — (821 ) Cash expenditures (1,632 ) (288 ) (1,920 )
Balance at July 3, 2005 $ 1,592 $ — $ 1,592

Table of Contents
The following table reflects the activities of the final phase of the consolidation in Watertown and the liabilities included in accrued liabilities in the consolidated balance sheets at the dates below (amounts in 000s):
In the first quarter of fiscal year 2005, we recorded $0.3 million severance for 22 employees of Microsemi Corp. – Colorado of Broomfield, Colorado (“Colorado”), including 1 management position, in accordance with FAS 112. This severance amount was paid by the end of the third quarter of fiscal year 2005. Phase III - Fiscal year 2005 restructuring
Employee
Severance
Other Related
Costs
Total
Provisions $ 739 $ 518 $ 1,257 Cash expenditures (278 ) (518 ) (796 )
Balance at September 26, 2004 461 — 461 Provisions 15 97 112 Cash expenditures (372 ) (97 ) (469 )
Balance at July 3, 2005 $ 104 $ — $ 104
In April 2005, we announced 1) the consolidation of the hi-rel products operations of Colorado into other Microsemi facilities and 2) the closure of the manufacturing operations of Microsemi Corp.-Ireland (“Ireland”). Costs related to Phase III of our consolidation program are expected to range from $9.0 million to $12.0 million and be incurred in the next 12 to 18 months. We are in the process of establishing a plan to determine the future use of assets from the Colorado and Ireland operations. Currently, there has been no impairment charge required in accordance with FAS 144 (Accounting for the Impairment or Disposal of Long-Lived Assets ). Other consolidation associated costs such as inventory, workforce reduction, relocation, transitional idle capacity and reorganization charges will be reported, when incurred, as restructuring costs in accordance with FAS 146 ( Accounting for Costs Associated with Exit or Disposal Activities ), FAS 112 ( Employers’ Accounting for Postemployment Benefits ) or FAS 151 ( Inventory Costs—an amendment of ARB No. 43, Chapter 4 ) as applicable. Costs associated with the consolidation of Colorado are estimated to range from $6.0 million to $8.0 million, excluding any gain or loss from dispositions of the plant and property. Colorado has approximately 165 employees and occupies a 130,000 square foot owned facility. Colorado shipped approximately 11%, 9% and 9% of our shipments in fiscal years 2003 and 2004 and the first nine months of fiscal year 2005, respectively. In the second quarter of fiscal year 2005, we recorded estimated severance payments of $1.1 million in accordance with FAS 112, “Employers’ Accounting for Postemployment Benefits (“FAS 112”) . The severance payments cover approximately 148 employees, including 14 management positions. We anticipate that payments of severance will start in fiscal year 2006. In the nine months ended July 3, 2005 we recorded $0.2 million for other restructuring related expenses. The consolidation of Colorado is expected to result, subsequent to its completion, in annual cost savings of $5.0 million to $7.0 million from the elimination of redundant facilities and related expenses and employee reductions.
19

Table of Contents
The following table reflects the activities related to the consolidation of Colorado and the accrued liabilities in the consolidated balance sheets at the date below (amounts in 000s):
Costs associated with the closure of the manufacturing operations in Ireland are estimated to range from $3.0 million to $4.0 million, excluding any gain or loss from dispositions of the plant and property. Ireland has approximately 70 manufacturing employees and occupies a 62,500 square foot owned facility. Ireland shipped approximately 2% of our annual shipments in each of our fiscal years 2003 and 2004 and in the nine months ended July 3, 2005, respectively. In the second quarter of fiscal year 2005, we recorded estimated severance payments of $1.4 million, in accordance with FAS 112, “ Employers’ Accounting for Postemployment Benefits (“FAS 112”). The severance payments cover approximately 46 employees, including 5 management positions. We anticipate that payments of severance will start in fiscal year 2006. The closure of the manufacturing operations in Ireland is expected to result, subsequent to its completion, in annual cost savings of $1.0 million to $3.0 million from the elimination of redundant facilities and related expenses and employee reductions. RESULTS OF OPERATIONS FOR THE QUARTER ENDED JUNE 27, 2004 COMPARED TO THE QUARTER ENDED JULY 3, 2005.
Employee
Severance
Other Related
Costs
Total
Provisions $ 1,134 $ 206 $ 1,340 Cash expenditures — (206 ) (206 )
Balance at July 3, 2005 $ 1,134 $ — $ 1,134
Net sales increased $11.1 million or 17% from $64.1 million for the third quarter of fiscal year 2004 (“Q3 2004”) to $75.2 million for the third quarter of fiscal year 2005 (“Q3 2005”), primarily due to improved pricing for certain hi-rel products and higher volume of shipments for certain commercial products. The increase included approximately $6.0 million, $3.5 million, $0.9 million and $0.8 million, of higher sales for defense and aerospace, notebook computers, monitors and LCD TV’s, and medical products, respectively, offset by decreases of approximately $0.1 million in shipments of other products. On July 28, 2005, we announced that we expected our sales for the fourth quarter of fiscal year 2005 to increase by three to five percent compared to Q3 2005. We are expecting that the strong demand for our products for defense/aerospace, medical, notebooks, monitors, and LCD TV’s will continue. Sales to OEM customers (which excludes sales to distributors) represented approximately 60% of our revenues for Q3 2004 and Q3 2005. The breakout of net sales to OEM customers in Q3 2004 and Q3 2005 were as follows:
Gross profit increased $11.9 million, from $21.8 million (34.1% of sales) for Q3 2004 to $33.7 million (44.8% of sales) for Q3 2005. The improvement in gross profit in the third quarter was favorably affected
20
Q3 2004
Q3 2005
Defense/Aerospace 41 % 44 % Medical 17 % 20 % Notebooks/Monitors/LCD Televisions 11 % 16 % Mobile Connectivity 13 % 8 % Automotive 9 % 6 % Others 9 % 6 %

Table of Contents
by: 1) improved factory utilization from our Phase I and Phase II consolidations; 2) increased shipments and 3) higher margin products. Costs of sales included $2.2 million and $1.3 million related to transitional idle capacity and inventory abandonments in Q3 2004 and Q3 2005, respectively. Selling, general and administrative expenses increased $5.9 million, from $9.8 million for Q3 2004 to $15.7 million for Q3 2005, primarily due to costs for enhancement of information systems, costs associated with implementation of the provisions of Section 404 of the Sarbanes-Oxley Act, legal expenses, and higher commissions and other selling expenses, all of which are expected to continue at a similar rate in the remainder of fiscal year 2005. Research and development expenses decreased $0.7 million, primarily due to the consolidation of Santa Ana. In Q3 2005, restructuring amounts netted to $(0.2) million and were related to the consolidations of Santa Ana, Colorado and Watertown as follows (amounts in thousands):
In Q3 2005, we reduced our estimated severance accrual by $0.6 million due to lower employee benefits than previously estimated. We also recognized $0.4 million in other consolidation expenses primarily related to the planning for and relocation of manufacturing equipment, travel, and other costs incurred to plan and prepare a facility for shutdown. In Q3 2005, we recorded approximately $0.1 million for abandoned assets in Santa Ana. We had lower average balances of debt and more cash in short-term investments in Q3 2005, compared to Q3 2004; consequently, we had $0.4 million higher net interest income in Q3 2005 compared to Q3 2004. The effective tax rates were 33.0% for Q3 2004 and 29.0% for Q3 2005. The lower effective tax rate in Q3 2005 was due to return to provision adjustments related to fiscal year 2004, a greater percentage of income being sourced and taxed in the United States and the release of certain tax contingencies as a result of more recent information related to prior tax years. These items had a 4.0% impact on our effective rate for Q3 2005. RESULTS OF OPERATIONS FOR THE NINE MONTHS ENDED JUNE 27, 2004 COMPARED TO THE NINE MONTHS ENDED JULY 3, 2005.
Santa Ana
Colorado
Watertown
Total
Severance expense $ 42 $ — $ — $ 42 Reduction of accrued severance (585 ) — — (585 ) Other consolidation related expenses 169 206 — 375 Reversal of prior provision — — (40 ) (40 )
Total $ (374 ) $ 206 $ (40 ) $ (208 )
Net sales increased $41.5 million or 23% from $176.8 million for the first nine months of fiscal year 2004 (“2004 YTD”) to $218.3 million for the first nine months of fiscal year 2005 (“2005 YTD”) primarily due to better pricing for certain hi-rel products and higher volume of shipments for certain commercial products. The increase included approximately $24.0 million, $7.4 million, $7.1 million, $4.9 million of higher sales for defense and aerospace, medical products, notebook computers, monitors and LCD TV’s and mobile connectivity, respectively, partially offset by decreases of approximately $1.5 million and $0.4 million in shipments of automotive and other products, respectively.
21

Table of Contents
Sales to OEM customers (which excludes sales to distributors) represented approximately 60% of our revenues for 2004 YTD and 2005 YTD, respectively. The breakout of net sales to OEM customers for 2004 YTD and 2005 YTD were as follows:
Gross profit increased $28.2 million, from $59.3 million (33.5% of sales) for 2004 YTD to $87.5 million (40.1% of sales) for 2005 YTD. The improvement in gross profit in 2005 YTD was the combined result of: 1) higher gross margins on new products; 2) improved factory utilization; 3) cost savings resulting from Phase I and Phase II of our Capacity Optimization Enhancement Program; and 4) increased revenues. Costs of sales included $4.9 million and $9.0 million related to transitional idle capacity and inventory abandonments in 2004 YTD and 2005 YTD, respectively. Selling, general and administrative expenses increased $10.5 million, from $28.9 million for 2004 YTD to $39.4 million for the 2005 YTD, primarily due to higher commissions and other selling expenses associated with higher sales, costs of enhancements of information systems, certain costs associated with implementation of the provisions of Section 404 of the Sarbanes-Oxley Act, and legal costs, all of which are expected to continue at a similar rate in the remainder of fiscal year 2005. Research and development decreased $1.2 million, primarily due to the abandonment of the LED product line in Watertown and the consolidation of Santa Ana. In 2005 YTD, restructuring charges of $2.7 million included expenses related to the consolidation in Santa Ana, Colorado, Ireland and Watertown, and were as follows (amounts in thousands):
In 2005 YTD, we reduced our estimated accrual for severance by $0.8 million due to lower employee benefits than previously estimated and employees that were transferred to other operations of Microsemi. We also recognized $0.5 in other consolidation expenses primarily related to the planning for and relocation of manufacturing equipment, travel and other costs incurred to plan and prepare a facility for shutdown. In 2005 YTD, we recorded approximately $0.5 million for abandoned assets in Santa Ana. We had lower balances of debt and more cash for short term investments in 2005 YTD compared to 2004 YTD; consequently, we had $0.1 million in interest expense in 2005 YTD compared with $0.2 million in 2004 YTD and $0.9 million of interest income in 2005 YTD compared to $0.4 million in 2004 YTD. The effective tax rates were 33.0% for 2004 YTD and 31.5% for 2005 YTD. The lower effective tax rate was due to return to provision adjustments related to fiscal year 2004, a greater percentage of income being sourced and taxed in the United States and the release of certain tax contingencies as a result of more recent information related to prior tax years. These items had a 1.5% impact on our effective rate for 2005 YTD.
22
2004 YTD
2005 YTD
Defense/Aerospace 41 % 44 % Medical 17 % 17 % Notebooks/Monitors/LCD Televisions 12 % 13 % Mobile Connectivity 12 % 12 % Automotive 9 % 7 % Others 9 % 7 %
Santa Ana
Colorado
Ireland
Watertown
Total
Severance expense $ 176 $ 1,401 $ 1,405 $ 15 $ 2,997 Reduction of accrued severance (821 ) — — — (821 ) Other consolidation related expenses 288 206 — 57 551
Total $ (357 ) $ 1,607 $ 1,405 $ 72 $ 2,727

Table of Contents
CAPITAL RESOURCES AND LIQUIDITY In 2005 YTD, we financed our operations with cash from operations. Net cash provided by operating activities was $15.0 million, and $27.0 million for 2004 YTD and 2005 YTD respectively. The $12.0 million increase in cash flow was primarily a result of the increase in revenue and income, partially offset by the combined effect of non-cash items included in income or expense, such as depreciation and amortization, accounts receivable, accounts payable, accrued liabilities and income tax payable. Timing of payments of invoices was also a factor in reducing cash flow from operations because 2004 YTD ended on June 27, 2004, and 2005 YTD ended after a calendar month end, on July 3, 2005. Accounts receivable increased from $42.2 million at September 26, 2004 to $49.7 million at July 3, 2005. The increase in accounts receivable was primarily due to higher sales in Q3 2005 compared with sales in the last quarter of fiscal year 2004 as well as minor delays in payments by several large customers in Q3 2005. The Days Sales Outstanding (“DSO”) was 56 days and 59 days at September 26, 2004 and at July 3, 2005, respectively. The 3-day increase in DSO at the current quarter end compared to the end of fiscal year 2004 was due to a timing shift of shipments closer to the end of the quarter compared to the prior year end as well as minor delays this quarter in payments by several large customers. At July 3, 2005, we had $47.0 million of current liabilities, an increase of $3.1 million from $43.9 million at September 26, 2004. The increase was primarily due to an increase in income taxes payable partially offset by a decrease in accounts payable due to timing of payments of invoices. Net cash used in investing activities was $8.1 million and $8.9 million in 2004 YTD and 2005 YTD, respectively, primarily for capital equipment. Net cash provided by financing activities was $4.9 million and $13.9 million 2004 YTD and 2005 YTD, respectively. We received approximately $5.0 million and $14.5 million from exercises of employee stock options in 2004 YTD and 2005 YTD, respectively. We had $45.1 million and $77.2 million in cash and cash equivalents at September 26, 2004 and July 3, 2005, respectively. Current ratios were 3.5 to 1 and 4.1 to 1 at September 26, 2004 and July 3, 2005, respectively. We have a $30.0 million credit line with a bank, which expires in March 2007 and includes a facility to issue letters of credit. As of July 3, 2005, $0.4 million was outstanding in the form of a letter of credit; consequently, $29.6 million was available under this credit facility. As of July 3, 2005, we were in compliance with the covenants required by our credit facility. Upon completion, the estimated cost to consolidate the Santa Ana plant will be between $14.0 million to $18.0 million, including $1.5 million to $3.5 million in future expenditures to complete this project. The estimated cost to consolidate the Colorado and Ireland plants will be between $6.0 million to $8.0 million and $3.0 million to $4.0 million, respectively, with substantial expenditures not expected to be incurred until fiscal year 2006. We anticipate that our cash and cash equivalents balances will be our primary source for paying such expenditures. As of July 3, 2005, we had no other material commitments for capital expenditures. Any proceeds from sales of Company-owned buildings in Santa Ana, California; Ennis, Ireland; and Broomfield, Colorado should enhance our cash position; however, we believe we can meet our cash requirements without the receipt of such proceeds. We have been incurring costs associated with the implementation of Section 404 of the Sarbanes-Oxley Act. Based on the amounts incurred thus far, we believe that the total costs for the first year of implementation (fiscal year 2005) will be approximately 2% of annual revenue and such costs could decrease to approximately one-half of one percent (1/2%) to 1% of annual revenue in subsequent years. These costs could have a material impact on our results.
23

Table of Contents
The following table summarizes our contractual payment obligations and commitments as of July 3, 2005:
Based upon information currently available to us, we believe that we can meet our cash requirements and capital commitments in the foreseeable future with cash balances, internally generated funds from ongoing operations and, if necessary, from the available line of credit. RECENTLY ISSUED ACCOUNTING STANDARDS
Payments due by period (in 000’s)
Total
Less than 1 year
1-3 years
3-5 years
More than
5 years
Imputed Interest
Capital leases $ 3,177 $ 77 $ 592 $ 586 $ 5,627 $ (3,705 ) Operating leases 12,723 903 5,125 3,549 3,146 — Purchase obligations 5,595 1,865 3,280 450 — — Other long-term liabilities 968 16 323 132 497 —
Total $ 22,463 $ 2,861 $ 9,320 $ 4,717 $ 9,270 $ (3,705 )
Statement of Financial Accounting Standards No. 123 (revised 2004) There is more than one way under generally accepted accounting principles to account for the economic consequences of granting options or other equity compensation, and many accounting experts believe that charging earnings pursuant to the Financial Accounting Standards Board, or FASB, Statement 123 (“FAS 123”), as amended by FASB Statement 148 (“FAS 148”), would account better for the economic consequences of granting an option or other equity compensation than APB Opinion No. 25 (“APB 25”) would. We use APB 25 to account for equity compensation, which does not require a charge to earnings for the economic consequences of granting options or other equity compensation. We have disclosed an estimate of stock option expense in the Notes to our financial statements, but have not deducted this amount from our earnings as reported in the financial statements. We will be required to do so when we begin to account for equity compensation, which includes employee stock options, under FASB Statement 123R “Share-Based Payment” (“FAS 123R”), commencing prospectively with our first quarter of fiscal year 2006, which will require all companies to record compensation costs for all share-based payments, at fair value. We have not determined the transition method to be used in adopting FAS 123R. The effects of the adoption of FAS 123R may be material but the effects are currently not estimable. (See Note 7). Our estimated expense for stock options in accordance with FAS 123 might provide at least some indication of the impact of adoption of FAS 123R, but the actual effects may be different by a substantial but unknown amount due to changes in the amounts of stock options granted in future periods and changes in the other factors that are included in the calculation of stock option expense. We will study and may react differently to the revised rule than we did the prior rule. Also, there are differences in assumptions that affect the outcome, and we may reexamine our assumptions at any time before our required prospective adoption of the rule. Statement of Financial Accounting Standards No. 151 In November 2004, the Financial Accounting Standards Board issued SFAS No. 151, “Inventory costs, an amendment of ARB No. 43 Chapter 4”. This Statement amends the guidance in ARB No. 43, Chapter 4, “Inventory Pricing,” to clarify the accounting for abnormal amounts of idle facility expense, freight, handling costs, and wasted material (spoilage). It requires that those items be recognized as current-period charges regardless of whether they meet the criteria in the earlier guidance of “so abnormal.”. In addition, this Statement requires that allocation of fixed production overheads to the costs of conversion be based on the normal capacity of the production facilities. The provisions of this statement shall be applied prospectively for inventory costs incurred during fiscal years beginning after June 15, 2005 (our fiscal year 2006). We do not expect the adoption of this statement would have a material impact on our results of operations, financial position or cash flow.
24

Table of Contents
Statement of Financial Accounting Standards No. 153 In December 2004, the Financial Accounting Standards Board issued SFAS No. 153, “Exchanges of Nonmonetary Assets – an amendment of APB Opinion No. 29”. The guidance in APB Opinion No. 29, Accounting for Nonmonetary Transactions, is based on the principle that exchanges of nonmonetary assets should be measured based on the fair value of the assets exchanged. The guidance in that Opinion, however, included certain exceptions to that principle. This Statement amends Opinion 29 to eliminate the exception for nonmonetary exchanges of similar productive assets and replaces it with a general exception for exchanges of nonmonetary assets that do not have commercial substance. A nonmonetary exchange has commercial substance only if the future cash flows of the entity are expected to change significantly as a result of the exchange. This statement is effective for nonmonetary asset exchanges occurring in fiscal periods beginning after June 15, 2005 (our fourth quarter of fiscal year 2005). We do not expect the adoption of this statement would have a material impact on our results of operations, financial position or cash flow. Statement of Financial Accounting Standards No. 154 In June 2005, the Financial Accounting Standards Board issued FAS No. 154, “Accounting Changes and Error Corrections – a replacement of APB Opinion No. 20 and FASB Statement No. 3”. This Statement generally requires retrospective application to prior periods’ financial statements of changes in accounting principle. Previously, Opinion No. 20 required that most voluntary changes in accounting principle were recognized by including the cumulative effect of changing to the new accounting principle in net income of the period of the change. FAS 154 applies to all voluntary changes in accounting principle. It also applies to changes required by an accounting pronouncement in the unusual instance that the pronouncement does not include specific transition provisions. When a pronouncement includes specific transition provisions, those provisions should be followed. This Statement shall be effective for accounting changes and corrections of errors made in fiscal years beginning after December 15, 2005 (our fiscal year 2007). We do not expect the adoption of this statement will have a material impact on our results of operations, financial position or cash flow. ACCOUNTING FOR INCOME TAXES On October 4, 2004, President Bush signed into Law the Working Families Tax Relief Act of 2004 (the “2004 Act”). The 2004 Act retroactively extended the expiration date of the research tax credit from June 30, 2004 to December 31, 2005. Since the credit was reinstated after September 26, 2004, the Company recognized credit only through June 30, 2004. The credit retroactively reinstated from July 1, 2004 through September 26, 2004 has been recognized in the first quarter of the fiscal year ending October 2005. On October 22, 2004, the American Jobs Creation Act of 2004 (“AJCA”) was signed into law. The AJCA provides several incentives for U.S. multinational corporations and U.S. manufacturers, subject to certain limitations. The incentives include an 85% dividends received deduction for certain dividends from controlled foreign corporations that repatriate accumulated income abroad, and a deduction for domestic qualified production activities taxable income, which will be phased in from 2005 through 2010. Both deductions are subject to a number of limitations and, as of today, uncertainty remains as to how to interpret numerous provisions in the Act. As such, we are not yet in a position to decide on whether, and to what extent, we might benefit from these provisions. We expect to be in a position to finalize our assessment by the end of the current fiscal year. WE ARE INCURRING ADDITIONAL EXPENSES TO DOCUMENT OU R INTERNAL CONTROL OVER FINANCIAL REPORTING AS CONTEMPLATED IN SARBANES -OXLEY SECTION 404. Section 404 of the Sarbanes-Oxley Act of 2002 requires that we undertake, in fiscal year 2005, a thorough examination of our internal control over financial reporting. We also are required to document and test our systems. Ultimately, our management will be responsible to report to our stockholders in the fiscal year 2005 annual report about the condition of our internal controls over financial reporting as measured against the standards promulgated under the Sarbanes-Oxley Act and interpretations thereof by relevant organizations, such as PCAOB, IT Governance Institute or others, and our auditors will be requested to attest to that report. The independent registered public accounting firm that audits our financial statements will audit our internal controls over financial reporting for weaknesses and comment on any identified material weaknesses, using the standards promulgated under the Sarbanes-Oxley Act.
25
Table of Contents
We are uncertain about the total costs we will incur, although we roughly estimate that the costs in fiscal year 2005 could be approximately two percent of current revenues. There is great demand for consultants in the relevant area, and their fees reflect the short supply, which was caused by thousands of companies concurrently dealing with the requirement. (Section 404 applies to most public companies, although implementation dates vary from company to company.) The consultants will charge based on hours worked, and the actual work may materially exceed the estimates we have received from the consultants. Unforeseen challenges could be encountered that require additional work or that could delay us. In order to meet our deadlines, we may incur material expenses and costs for overtime and additional consulting fees and charges. Our filing of our fiscal year 2005 annual report on a timely basis will depend upon our timely completion of these tasks and our independent registered public accounting firm’s timely completion of the audit of our internal control over financial reporting. A late annual report could have material adverse effects on us. Any discovery of any material irremediable weakness in our internal control over financial reporting could have material adverse effects on us as we would need to conclude that our internal controls over financial reporting are ineffective. Such result could have material adverse effects on us. CRITICAL ACCOUNTING POLICIES AND ESTIMATES The consolidated financial statements have been prepared in accordance with accounting principles generally accepted in the United States that require us to make estimates and assumptions that affect the reported amounts of assets and liabilities at the date of the consolidated financial statements and revenues and expenses during the periods reported. Actual results could differ from those estimates. Information with respect to our critical accounting policies which we believe could have the most significant effect on our reported results and require subjective or complex judgments is contained in Item 7, Management’s Discussion and Analysis of Financial Condition and Results of Operations, of our Annual Report on Form 10-K for the fiscal year ended September 26, 2004. IMPORTANT FACTORS RELATED TO FORWARD -LOOKING STATEMENTS AND ASSOCIATED RISKS Some of the statements in this report or incorporated by reference are forward-looking, including, without limitation, the statements under the caption “Management’s Discussion and Analysis of Financial Condition and Results of Operations”. Forward-looking statements include all those statements that contain words like “may,” “will,” “could,” “should,” “project,” “believe,” “anticipate,” “expect,” “plan,” “estimate,” “forecast,” “potential,” “intend,” “maintain,” “continue” and variations of these words or comparable words. In addition, all of the information herein that does not state an historical fact is forward-looking, including any statement or implication about an estimate or a judgment, an expectation as to a future time, future result or other future circumstance. For various reasons, actual results may differ substantially from the results that the forward-looking statements suggest. Therefore, forward-looking statements are not a guarantee of future performance and involve risks and uncertainties. These forward-looking statements are made only as of the date of this report. We do not undertake to update or revise the forward-looking statements, whether as a result of new information, future events or otherwise. The forward-looking statements included in this report are based on, among other items, current assumptions that we will be able to meet our current operating cash and debt service requirements, that we will be able to successfully complete announced and to-be-announced plant consolidations on the anticipated schedules and without unanticipated costs or expenses, that we will continue to retain the full-time services of all of our present executive officers and key employees, that we will be able to successfully resolve any disputes and other business matters as anticipated, that competitive conditions within the analog, mixed signal and discrete semiconductor, integrated circuit or custom component assembly industries will not affect us adversely, that our customers will not cancel orders or terminate or renegotiate their purchasing relationships with us, that we will retain existing key personnel, that our forecasts will reasonably anticipate market demand for our products, and that there will be no other material adverse changes in our operations or business. Other factors that could cause results to vary materially from current expectations are referred to elsewhere in this report. Assumptions relating to the foregoing involve judgments that are difficult to make and future circumstances that are difficult to predict accurately or correctly. Forecasting and other management decisions are subjective in many respects and thus susceptible to interpretations and periodic revisions based on historic experience and business
26

Table of Contents
developments, the impact of which may cause us to alter our internal forecasts, which may in turn affect our subsequent expectations and our future results. We do not undertake to announce publicly the changes that may occur in our expectations. Readers are cautioned against giving undue weight to any of the forward-looking statements. Adverse changes to our results could result from any number of factors, including but not limited to fluctuations in economic conditions, potential effects of inflation, lack of earnings visibility, dependence upon certain customers or markets, dependence upon suppliers, future capital needs, rapid technological changes, difficulties in integrating acquired businesses, ability to realize cost savings or productivity gains, potential cost increases, dependence on key personnel, difficulties regarding hiring and retaining qualified personnel in a competitive labor market, risks of doing business in international markets, and problems of third parties upon whom we rely in our business or operations. The inclusion of forward-looking information should not be regarded as a representation by us or any other person that all of our estimates shall necessarily prove correct or that all of our objectives or plans shall necessarily be achieved. We are setting out some of the relevant risk factors below in full for the convenience of the readers. The readers may also refer to the risk factors in our previous and future filings, for further information of interest, as well as detailed factual descriptions of or related to risks and uncertainties in the Notes to our financial statements accompanying this report. Downturns in the highly cyclical semiconductor industry have adversely affected the operating results and the value of our business. The semiconductor industry is highly cyclical, and the value of our business has declined during the “down” portion of these cycles. During recent years, we as well as many others in our industry, experienced significant declines in the pricing of, as well as demand for, products. The market for semiconductors has experienced severe and prolonged downturns. In the future, these downturns may prove to be as, or possibly more, severe. The markets for our products depend on continued demand in the mobile connectivity, automotive, telecommunications, computers/peripherals, defense and aerospace, space/satellite, industrial/commercial and medical markets, and these end-markets have experienced changes in demand that have adversely affected our operating results and financial condition. Concentration of the factories in the semiconductor industry. Relevant portions of the semiconductor industry, and those that serve or supply this industry, tend somewhat to be concentrated in certain areas of the world, and therefore, the semiconductor industry has from time to time been, and may from time to time be adversely affected by natural disasters in various locales, epidemics and health advisories such as those related to Sudden Acute Respiratory Syndrome. The semiconductor business is highly competitive and increased competition could reduce our value. The semiconductor industry, including the areas in which we do business, is highly competitive. We expect intensified competition from existing competitors and new entrants. Competition is based on price, product performance, product availability, quality, reliability and customer service. Pricing pressures may emerge. For instance, competitors may attempt to gain a greater market share by lowering prices. The market for commercial products is characterized by declining selling prices. We anticipate that our average selling prices will decrease in future periods, although the timing and amount of these decreases cannot be predicted with any certainty. The pricing pressure in the semiconductor industry in recent years has been due primarily to the Asian currency crisis, industry-wide excess manufacturing capacity, weak economic growth, the slowdown in capital spending that followed the “dot-com” collapse, the reduction in capital spending by telecom companies and satellite companies, and certain effects of the tragic events of terrorism on September 11, 2001. We compete in various markets with companies of various sizes, many of which are larger and have greater resources than we have, and thus may be better able to penetrate new markets or pursue acquisition candidates and to withstand adverse economic or market conditions. In addition, companies not currently in direct competition with us may introduce competing products in the future. We have numerous competitors. Some of our current major competitors are Motorola, Inc., National Semiconductor Corporation, Texas Instruments, Inc., Philips Electronics, ON Semiconductor,
27

Table of Contents
L.L.C., Fairchild Semiconductor Corporation, Micrel Incorporated, International Rectifier Corporation, Semtech Corporation, Linear Technology Corp., Maxim Integrated Products, Inc., Skyworks Solutions, Inc., Diodes, Inc., Vishay Intertechnology, Inc. and its subsidiary Siliconix Incorporated. Some of our competitors in developing markets are Triquint Semiconductor, Inc., Mitel Corporation, RF Micro Devices, Inc., Conexant Systems, Inc., Anadigics, Inc. and Skyworks Solutions, Inc. We may not be able to compete successfully in the future or competitive pressures may harm our financial condition, operating results or cash flows. New technologies could result in the development of competing products and a decrease in demand for our products. Our financial performance depends on our ability to design, develop, manufacture, assemble, test, market and support new products and enhancements on a timely and cost-effective basis. Our failure to develop new technologies or to react to changes in existing technologies could materially delay our development of new products, which could result in product obsolescence, decreased revenues and/or a loss of our market share to competitors. Rapidly changing technologies and industry standards, along with frequent new product introductions, characterize much of the semiconductor industry. A fundamental shift in technologies in our product markets could have material adverse effects on our competitive position within the industry. For instance, presently we are challenged to develop new products for use with various alternative wireless LAN standards, such as 802.11a, 802.11b, 802.11g and 802.11N and combinations thereof. Although this development has already resulted in design wins related to 802.11a, 802.11g, and 802.11N the solutions related to the other standards and the combination of all of the standards are still in development and are in constant change. The success of products using various standards is subject to rapid changes in market preferences and advancements in competing technologies. Failure to protect our proprietary technologies or maintain the right to use certain technologies may negatively affect our ability to compete. We rely heavily on our proprietary technologies. Our future success and competitive position may depend in part upon our ability to obtain or maintain protection of certain proprietary technologies used in our principal products. We do not have significant patent protection on many aspects of our technology. Our reliance upon protection of some of our technology as “trade secrets” will not necessarily protect us from the use by other persons of our technology, or their use of technology that is similar or superior to that which is embodied in our trade secrets. Others may be able to independently duplicate or exceed our technology in whole or in part. We may not be successful in maintaining the confidentiality of our technology, dissemination of which could have material adverse effects on our business. In addition, litigation may be necessary to determine the scope and validity of our proprietary rights. In the instances in which we hold patents or patent licenses, such as with respect to some circuit components for notebook computers and LCD TV’s, any patents held by us may be challenged, invalidated or circumvented, or the rights granted under any patents may not provide us with competitive advantages. Patents often provide only narrow protection and require public disclosure of information that may otherwise be subject to trade secret protection. Also patents expire and are not renewable. Obtaining or protecting our proprietary rights may require us to defend claims of intellectual property infringement by our competitors. We could become subject to lawsuits in which it is alleged that we have infringed or are infringing upon the intellectual property rights of others with or without our prior awareness of the existence of those third-party rights, if any. If any infringements, real or imagined, happen to exist, arise or are claimed in the future, we may be exposed to substantial liability for damages and may need to obtain licenses from the patent owners, discontinue or change our processes or products or expend significant resources to develop or acquire non-infringing technologies. We may not be successful in such efforts or such licenses may not be available under reasonable terms. Our failure to develop or acquire non-infringing technologies or to obtain licenses on acceptable terms or the occurrence of related litigation itself could have material adverse effects on our operating results, financial condition and cash flows.
28

Table of Contents
We are also involved in certain patent litigation (see Legal Proceedings in our most recently filed Form 10-K) to protect our patents and patent rights, which could cause legal costs to increase above normal levels over the next several years. It is not possible to estimate the exact amounts of these costs, but it is possible that these costs could have a negative effect on our future results. Production delays related to new compound semiconductors could adversely affect our future results. We utilize process technology to manufacture compound semiconductors such as gallium arsenide (GaAs), indium gallium phosphide (InGaP), silicon germanium (SiGe), and indium gallium arsenide phosphide (InGaAsP) primarily to manufacture semiconductor components. We are pursuing this development effort internally as well as with third party foundries. Our efforts sometimes may not result in commercially successful products. Certain of our competitors offer this capability and our customers may purchase our competitors’ products. The third party foundries that we use may delay or fail to deliver technology and products to us. Our business and prospects could be materially and adversely affected by delay or by our failure to produce these products. Compound semiconductor products may not successfully compete with silicon-based products. Our choices of technologies for development and future implementation may not reflect future market demand. The production of GaAs, InGaP, SiGe, InGaAsP or SiC integrated circuits is more costly than the production of silicon circuits, and we believe it will continue in the future to be more costly. The costs differ because of higher costs of raw materials, lower production yields and higher unit costs associated with lower production volumes. Silicon semiconductor technologies are widely used in process technologies for integrated circuits, and these technologies continue to improve in performance. As a result, we must offer compound semiconductor products that provide vastly superior performance to that of silicon for specific applications in order for them to be competitive with silicon products. If we do not offer compound semiconductor products that provide sufficiently superior performance to offset the cost differential and otherwise successfully compete with silicon-based products, our operating results may be materially and adversely affected. In addition, other alternatives exist and are being developed, and may have superior performance or lower cost. We may not be able to develop new products to satisfy changes in demand. We may be unsuccessful in our efforts to identify new product opportunities and develop and bring products to market in a timely and cost-effective manner. Products or technologies developed by others may render our products or technologies obsolete or non-competitive. In addition, to remain competitive, we must continue to reduce package sizes, improve manufacturing yields and expand sales. We may not be able to accomplish these goals. Designs that we have introduced recently include primarily integrated circuits and subsystems such as class D audio subsystems for newly-introduced home theatre DVD players supporting surround sound, PDA backlighting subsystems, backlight control and power management solutions for the automotive notebook computer, monitors and the LCD TV market, LED driver solutions and power amplifiers for certain wireless LAN components. Their success will be subject to various risks and uncertainties. We must commit resources to research and development, design, and production prior to receipt of purchase commitments and could lose some or all of the associated investment. We sell products primarily pursuant to purchase orders for current delivery, rather than pursuant to long-term supply contracts. Many of these purchase orders may be revised or cancelled without penalty. As a result, we must commit resources to the research, design and production of products without any advance purchase commitments from customers. Any inability to sell a product after we devote significant resources to it could have material adverse effects on our business, financial condition, results of operations and cash flows. Variability of our manufacturing yields may affect our gross margins and profits. Our manufacturing yields vary significantly among products, depending on the complexity of a particular product’s design and our experience in manufacturing that type of product. We have in the past experienced difficulties in achieving planned yields, which have adversely affected our gross margins and profits.
29

Table of Contents
The fabrication of semiconductor products is a highly complex and precise process. Problems in the fabrication process can cause a substantial percentage of wafers to be rejected or numerous circuits on each wafer to be non-functional, thereby reducing yields. These difficulties include:
• Defects in masks, which are used to transfer circuit patterns onto our wafers;
• Impurities in the materials used;
• Contamination of the manufacturing environment; and
Because a large portion of our costs of manufacturing is relatively fixed, and average selling prices for our products tend to decline over time, it is critical for us to improve the number of shippable circuits per wafer and increase the production volume of wafers in order to maintain and improve our results of operations. Yield decreases can result in substantially higher unit costs, which could materially and adversely affect our operating results and have done so in the past. Moreover, our process technologies have primarily utilized standard silicon semiconductor manufacturing equipment, and production yields of compound integrated circuits have been relatively low compared with silicon circuit devices. We may be unable to continue to improve yields in the future, and we may suffer periodic yield problems, particularly during the early production of new products or introduction of new process technologies. In either case, our results of operations could be materially and adversely affected. International operations and sales expose us to material risks.
• Equipment failure.
Revenues from foreign markets represent a significant portion of total revenues. We maintain facilities or contracts with entities in Korea, Japan, China, Ireland, Thailand, the Philippines, and Taiwan. There are risks inherent in doing business internationally, including:
• Legislative or regulatory requirements, including tax laws in the United States and in the countries in which we manufacture or sell
our products;
• Trade restrictions;
• Transportation delays;
• Communication interruptions;
• Work stoppages;
• Economic and political instability;
• Terrorist activities;
• Changes in import/export regulations, tariffs and freight rates;
• Difficulties in collecting receivables and enforcing contracts generally; and
In addition, the laws of certain foreign countries may not protect our products, assets or intellectual property rights to the same extent as do U.S. laws. Therefore, the risk of piracy of our technology and products may be greater in those foreign countries. We may experience material adverse effects to our financial condition, operating results and cash flows in the future. Delays in beginning production, implementing production techniques, resolving problems associated with technical equipment malfunctions, or issues related to government or customer qualification of facilities could adversely affect our manufacturing efficiencies and our ability to realize cost savings.
• Currency exchange rate fluctuations.
Our manufacturing efficiency will be an important factor in our future profitability, and we may be unsuccessful in our efforts to maintain or increase our manufacturing efficiency. Our manufacturing processes are highly complex, require advanced and costly equipment and are continually being modified in an effort to improve yields and product performance. We have from time to time experienced difficulty in beginning production at new facilities or in effecting transitions to new facilities or new manufacturing processes. As a consequence, we have at times experienced delays in product deliveries and reduced yields. We may experience manufacturing problems in achieving acceptable yields or experience product delivery delays in the future as a result of, among other things, capacity constraints, construction delays, upgrading or expanding existing facilities or changing our process technologies, any of which could result in a loss of future revenues. Although thus far our Capacity Optimization Enhancement Program has proceeded on schedule, our operating results also could be adversely affected by increased costs and
30

Table of Contents
expenses related to relocation of production between our facilities if we encounter difficulties or delays or a technical or regulatory nature, including any issues related to government or customer qualification of our other facilities and production lines for the production of hi-rel products. Interruptions, delays or cost increases affecting our materials, parts, equipment or subcontractors may impair our competitive position. Our manufacturing operations, and the outside manufacturing operations, which we use increasingly, depend upon obtaining, in some instances, a governmental qualification of the manufacturing process, and in all instances, adequate supplies of materials, parts and equipment, including silicon, mold compounds and lead frames, on a timely basis from third parties. Some of the outside manufacturing operations we use are based in foreign countries. Our results of operations could be adversely affected if we are unable to obtain adequate supplies of materials, parts and equipment in a timely manner or if the costs of materials, parts or equipment increase significantly. From time to time, suppliers may extend lead times, limit supplies or increase prices due to capacity constraints or other factors. Although we generally use materials, parts and equipment available from multiple suppliers, we have a limited number of suppliers for some materials, parts and equipment. While we believe that alternate suppliers for these materials, parts and equipment are available, an interruption could adversely affect our operations. Some of our products are manufactured, assembled and tested by third-party subcontractors. Some of these contractors are based in foreign countries. We generally do not have any long-term agreements with these subcontractors. As a result, we may not have direct control over product delivery schedules or product quality. Outside manufacturers generally will have longer lead times for delivery of products as compared with our internal manufacturing, and therefore, when ordering from these suppliers, we will be required to make longer-term estimates of our customers’ current demand for products, and these estimates are difficult to make. Also, due to the amount of time typically required to qualify assemblers and testers, we could experience delays in the shipment of our products if we are forced to find alternate third parties to assemble or test our products. Any product delivery delays in the future could have material adverse effects on our operating results, financial condition and cash flows. Our operations and ability to satisfy customer obligations could be adversely affected if our relationships with these subcontractors were disrupted or terminated. We depend on third party subcontractors in Asia for assembly and packaging of a portion of our products. The packaging of our products is performed by a limited group of subcontractors and some of the raw materials included in our products are obtained from a limited group of suppliers. Although we seek to reduce our dependence on sole or limited source suppliers, disruption or termination of any of these sources could occur and such disruptions or terminations could harm our business and operating results. In the event that any of our subcontractors were to experience financial, operational, production or quality assurance difficulties resulting in a reduction or interruption in supply to us, our operating results could suffer at least until alternate qualified subcontractors, if any, were to become available and active. We anticipate that many of our next-generation products may be manufactured by third party subcontractors in Asia, and to the extent that such potential manufacturing relationships develop, they may be with a limited group of subcontractors. Therefore, any disruptions or terminations of manufacturing could harm our business and operating results. Also these subcontractors must be qualified by the U.S. government or customer for hi-rel processes. Historically DCSC has rarely qualified any foreign manufacturing or assembly lines for reasons of national security; therefore, our ability to move certain manufacturing offshore may be limited or delayed. Fixed costs may reduce operating results if our sales fall below expectations. Our expense levels are based, in part, on our expectations for future sales. Many of our expenses, particularly those relating to capital equipment and manufacturing overhead, are relatively fixed. We might be unable to reduce spending quickly enough to compensate for reductions in sales. Accordingly, shortfalls in sales could materially and adversely affect our operating results. This challenge could be made even more difficult if lead times between orders and shipments are shortening.
31

Table of Contents
Reliance on government contracts for a portion of our sales could have material adverse effects on results of operations. Some of our sales are derived from customers whose principal sales are to the United States Government. If we experience significant reductions or delays in procurements of our products by the United States Government or terminations of government contracts or subcontracts, our operating results could be materially and adversely affected. Generally, the United States Government and its contractors and subcontractors may terminate their contracts with us for cause or for convenience. We have in the past experienced one termination of a contract due to the termination of the underlying government contracts. All government contracts are also subject to price renegotiation in accordance with U.S. Government Renegotiation Act. By reference to such contracts, all of the purchase orders we receive that are related to government contracts are subject to these possible events. There is no guarantee that we will not experience contract terminations or price renegotiations of government contracts in the future. A significant portion of our sales are to defense and aerospace markets, which are subject to the uncertainties of governmental appropriations and national defense policies and priorities. These sales are derived from direct and indirect business with the U.S. Department of Defense, or DOD, and other U.S. government agencies. From time to time, we have experienced declining defense-related sales, primarily as a result of contract award delays and reduced defense program funding. Defense-related business is anticipated to continue to increase for us; however, the actual timing and amount of an increase is uncertain. In the past, expected increases in defense related spending has occurred at a rate that has been slower than expected. The effects of defense spending increases are difficult to estimate and subject to many sources of delay. Our prospects for additional defense-related sales may be adversely affected in a material manner by numerous events or actions outside our control. There may be unanticipated costs associated with adding to or supplementing our manufacturing capacity. We anticipate that future growth of our business could require increased manufacturing capacity on our part and on the part of certain outside foundries, assembly shops, or testing for some of our integrated circuit products or other products. Expansion activities are subject to a number of risks, including:
• Unavailability or late delivery of the advanced, and often customized, equipment used in the production of our specialized products;
• Delays in bringing new production equipment on-line;
• Delays in supplying satisfactory designs or products to our existing customers; and
These and other risks may affect the ultimate cost and timing of any expansion of our capacity. Our future success depends, in part, upon our ability to continue to attract and retain the services of our executive officers or other key management personnel.
• Unforeseen environmental, engineering or manufacturing qualification problems relating to existing or new facilities.
We could potentially lose the services of any of our senior management personnel at any time due to possible reasons that could include death, incapacity, calamity, military service, retirement, resignation or competing employers. Our execution of current plans could be adversely affected by such a loss. We may fail to attract and retain qualified technical, sales, marketing and managerial personnel required to continue to operate our business successfully. Personnel with the necessary expertise are scarce and competition for personnel with proper skills is intense. Also, attrition in personnel can result from, among other things, changes related to acquisitions, as well as retirement or disability. We may not be able to retain existing key technical, sales, marketing and managerial employees or be successful in attracting, assimilating or retaining other highly qualified technical, sales, marketing and managerial personnel, particularly at such times in the future as we may need to do so to fill a key position. If we are unable to continue to retain existing executive officers or other key employees or are unsuccessful in attracting new highly qualified employees, our business, financial condition and results of operations could be materially and adversely affected. Failure to manage consolidation of operations effectively could adversely affect our margins and earnings. Our ability to successfully offer and sell our products requires effective planning and management processes. Our Capacity Optimization Enhancement Program, with consolidations and realignments of operations, and expected future growth, may place a significant strain on our management systems and
32

Table of Contents
resources, including our financial and managerial controls, reporting systems, procedures and information technology. In addition, we will need to continue to train and manage our workforce worldwide. Any unmet challenges in that regard could negatively affect our results of operations. We may engage in future acquisitions that dilute the ownership interests of our stockholders and cause us to incur debt or to assume contingent liabilities. As a part of our business strategy, we expect to review acquisition prospects that would complement our current product offerings, enhance our design capability or offer other growth opportunities. We may acquire businesses, products or technologies in the future. In the event of future acquisitions, we could:
• Use a significant portion of our available cash;
• Issue equity securities, which would dilute current stockholders’ percentage ownership;
• Incur substantial debt;
• Incur or assume contingent liabilities, known or unknown;
• Incur impairment charges related to goodwill or other intangibles; and
Such actions by us could impact our operating results and/or the price of our common stock potentially. We have no current binding agreements or definite plans to make any particular material acquisitions. We have acquired and may acquire other companies and may be unable successfully to integrate such companies with existing operations.
• Incur large, immediate accounting write-offs.
We have in the past acquired a number of businesses or companies, and additional product lines and assets. We may continue to expand and diversify our operations with additional acquisitions. If we are unsuccessful in integrating these companies or product lines with existing operations, or if integration is more difficult or more costly than anticipated, we may experience disruptions that could have material adverse effects on our business, financial condition and results of operations. Some of the risks that may affect our ability to integrate or realize any anticipated benefits from the acquired companies, businesses or assets include those associated with:
• Unexpected losses of key employees or customers of the acquired company;
• Conforming the acquired company’s standards, processes, procedures and controls with our operations;
• Coordinating new product and process development;
• Hiring additional management and other critical personnel;
• Increasing the scope, geographic diversity and complexity of our operations;
• Difficulties in consolidating facilities and transferring processes and know-how;
• Other difficulties in the assimilation of acquired operations, technologies or products;
• Diversion of management’s attention from other business concerns; and
We have closed, combined, sold or disposed of certain subsidiaries or divisions, which in the past has reduced our sales volume and resulted in restructuring costs.
• Adverse effects on existing business relationships with customers.
In October 2003, we announced the consolidation of the manufacturing operations of Microsemi Corp. - Santa Ana, of Santa Ana, California (“Santa Ana”) into some of our other facilities. Santa Ana, whose manufacturing represented approximately 20% and 13% of our annual revenues in fiscal years 2003 and 2004, had approximately 380 employees and occupied 123,000 square feet. The consolidation of Santa Ana has had, as currently estimated minimal adverse impact on revenues. In April 2005, we announced the consolidation of the hi-rel products operations of Microsemi Corp. – Colorado of Bloomfield, Colorado into some of our other facilities and the closure of the manufacturing operations of Microsemi Corp. – Ireland of Ennis, Ireland. Colorado represents approximately 12% of our annual revenues, has approximately 165 employees and occupies a 130,000 square foot owned facility. Ireland represents less than 5% of our annual revenues, has approximately 70 manufacturing employees and occupies a 62,500 square foot owned facility. In the second quarter of fiscal year 2005, we recorded estimated severance payments of $1.1 million and $1.4 million for Colorado and Ireland, respectively.
33

Table of Contents
We may make further specific determinations to consolidate, close or sell additional facilities, which could be announced at any time. Possible adverse consequences resulting from or related to such announcement may include various accounting charges such as for idle capacity, an inventory buildup in preparation for the transition of manufacturing, disposition costs, severance costs, impairments of goodwill and possibly an immediate loss of revenues, and other items in addition to normal or attendant risks and uncertainties. We may be unsuccessful in any of our current or future efforts to consolidate our business into a fewer number of facilities. Our plans to minimize or eliminate any loss of revenues during consolidation may not be achieved. We have major technical challenges in regard to transferring component manufacturing between locations. First we must be finished qualifying the new facility appropriately with the U.S. governmental agencies or the customers concerned. While we plan generally to retain all of our revenues and income of those operations by transferring the manufacturing elsewhere within Microsemi’s subsidiaries, our plans may change at any time based on reassessment of the alternatives and consequences. While we hope to benefit overall from increased gross margins and increased capacity utilization rates at remaining operations, the remaining operations will need to bear the corporate administrative and overhead costs, which are charges to income that had been allocated to the discontinued business units. Moreover, delays in effecting our consolidations could result in greater than anticipated costs incurred to achieve the hoped for longer-range savings. Our products may be found to be defective or hazardous and we may not have sufficient liability insurance. One or more of our products may be found to be defective or to contain, without the customer’s knowledge, certain prohibited hazardous chemicals after we have already shipped the products in volume, requiring a product replacement or recall. We may be subject to product returns that could impose substantial costs and have a material and adverse effect on our business, financial condition and results of operations. Our aerospace (including aircraft), defense, medical and satellite businesses in particular expose us to potential liability risks that are inherent in the manufacturing and marketing of high reliability electronic components for critical applications. Production of many of these products is sensitive to minute impurities, which can be introduced inadvertently in manufacture. Any production mistakes can result in large and unanticipated product returns, product liability and warranty liability. New environmental regulations have imposed on us a new burden of determining the chemical contents of supplies we buy and use and to inform in turn our customers about our each of our finished goods’ chemical contents. Mistakes in this information gathering process could have material adverse effects on us, and the management and execution of this process is very challenging. We may be subject to product liability claims with respect to our products. Our product liability insurance coverage may be insufficient to pay all such claims. Product liability insurance may become too costly for us or may become unavailable to us in the future. We may not have sufficient resources to satisfy any product liability claims not covered by insurance which would materially and adversely affect our financial position. Environmental liabilities could adversely impact our financial position. Federal, state and local laws and regulations impose various restrictions and controls on the discharge of materials, chemicals and gases used in our semiconductor manufacturing processes or in our finished goods. Under new environmental regulations, we will be responsible to determine whether certain toxic metals or certain other toxic chemicals are present in any given components we purchase and in each given product we sell. These environmental regulations have required us to expend a portion of our resources and capital on relevant compliance programs. In addition, under other laws and regulations, we could be held financially responsible for remedial measures if our current or former properties are contaminated or if we send waste to a landfill or recycling facility that becomes contaminated, even if we did not cause the contamination. Also, we may be subject to additional common law claims if we release substances that damage or harm third parties. Further, future changes in environmental laws or regulations may require additional investments in capital equipment or the implementation of additional compliance programs in the future. Any failure to comply with environmental laws or regulations, old or new could subject us to significant liabilities and could have material adverse effects on our operating results, cash flows and financial condition.
34

Table of Contents
In the conduct of our manufacturing operations, we have handled and do handle materials that are considered hazardous, toxic or volatile under federal, state and local laws. The risk of accidental release of such materials cannot be completely eliminated. In addition, we operate or own facilities located on or near real property that was formerly owned and operated by others. These properties were used in ways that involved hazardous materials. Contaminants may migrate from or within or through property. These risks may give rise to claims. Where third parties are responsible for contamination, the third parties may not have funds, or not make funds available when needed, to pay remediation costs imposed upon us under environmental laws and regulations. In Broomfield, Colorado, the owner of a property located adjacent to a manufacturing facility owned by a subsidiary of ours had notified the subsidiary and other parties, of a claim that contaminants migrated to his property, thereby diminishing its value. In August 1995, the subsidiary, together with Coors Porcelain Company, FMC Corporation and Siemens Microelectronics, Inc. (former owners of the manufacturing facility), agreed to settle the claim and to indemnify the owner of the adjacent property for remediation costs. Although TCE and other contaminants previously used by former owners at the facility are present in soil and groundwater on the subsidiary’s property, we vigorously contest any assertion that the subsidiary caused the contamination. In November 1998, we signed an agreement with the three former owners of this facility whereby they have 1) reimbursed us for $530,000 of past costs, 2) assumed responsibility for 90% of all future clean-up costs, and 3) promised to indemnify and protect us against any and all third-party claims relating to the contamination of the facility. An Integrated Corrective Action Plan was submitted to the State of Colorado. Sampling and management plans were prepared for the Colorado Department of Public Health & Environment. State and local agencies in Colorado are reviewing current data and considering study and cleanup options. The most recent forecast estimated that the total project cost, up to the year 2020, would be approximately $5,300,000; accordingly, we recorded a one-time charge of $530,000 for this project in fiscal year 2003. There has not been any significant development since September 28, 2003. We are involved in various pending litigation matters, arising out of the ordinary routine conduct of our business, including from time to time litigation relating to commercial transactions, contracts, and environmental matters. In the opinion of management, the final outcome of these matters will not have a material adverse effect on our financial position, results of operations or cash flows. Some of our facilities are located near major earthquake fault lines. Our headquarters, our major operating facilities, and certain other critical business operations are located near known earthquake fault lines. We presently do not have earthquake insurance. We could be materially and adversely affected in the event of a major earthquake. Delaware law and our charter documents contain provisions that could discourage or prevent a potential takeover of Microsemi that might otherwise result in our stockholders receiving a premium over the market price for their shares. Provisions of Delaware law and our certificate of incorporation and bylaws could make the acquisition more difficult by means of a tender offer, a proxy contest, or otherwise, and the removal of incumbent officers and directors. These provisions include:
• The Shareholder Rights Plan, which provides that an acquisition of 20% or more of the outstanding shares without our Board’s approval or ratification results in the exercisability of the Right accompanying each share of Common Stock, thereby entitling the holder to purchase 1/4,000 th of a share of Series A Junior Participating Preferred Stock for $100, resulting in dilution to the acquiror because each Right entitles the holder upon exercise to receive securities or assets valued at $200;
35
• Section 203 of the Delaware General Corporation Law, which prohibits a merger with a 15%-or-greater stockholder, such as a party
that has completed a successful tender offer, without board approval until three years after that party became a 15%-or-greater stockholder; and
• The authorization in the certificate of incorporation of undesignated preferred stock, which could be issued without stockholder
approval in a manner designed to prevent or discourage a takeover or in a way that may dilute an investment in the Common Stock.

Table of Contents
In connection with our Shareholder Rights Plan, each share of Common Stock, par value $0.20, also entitles the holder to one redeemable and cancellable Right (not presently exercisable), as adjusted from time to time, to a given fraction of a share of Series A Junior Participating Preferred Stock, at a given exercise price, as adjusted from time to time under the terms and conditions as set forth in a Shareholder Rights Agreement. The existence of the Rights may make more difficult or impracticable for hostile change of control of us, which therefore may affect the anticipated return on an investor’s investment in the Common Stock. We may have increasing difficulty to attract and to continue retaining qualified outside Board members. The directors and management of publicly traded corporations are increasingly concerned with the extent of their personal exposure to lawsuits and shareholder claims, as well as governmental and creditor claims which may be made against them in connection with their positions with publicly-held companies. Outside directors are becoming increasingly concerned with the availability of directors and officer’s liability insurance to pay on a timely basis the costs incurred in defending shareholder claims. Directors and officers liability insurance has recently become much more expensive and difficult to obtain than it had been. Concurrently, the SEC and the Nasdaq Stock Market have imposed higher independence standards and certain special requirements on directors of public companies. Accordingly, it has become increasingly difficult to attract and retain qualified outside directors to serve on our Board. The volatility of our stock price could affect the value of an investment in our stock and our future financial position. The market price of our stock has fluctuated widely. Between July 3, 2004 and July 3, 2005, the closing sale price of our common stock ranged between a low of $9.63 and a high of $20.85, experiencing greater volatility over that time than most of the market did. The historic market price of our common stock may not be indicative of future market prices. We may not be able to sustain or increase the value of our common stock. Declines in the market price of our stock could adversely affect our ability to retain personnel with stock incentives, to acquire businesses or assets in exchange for stock and/or to conduct future financing activities with or involving our common stock. We may not make the sales that are suggested by order rates or our book-to-bill ratio and our book-to-bill ratio may be affected by product mix. Prospective investors should not place undue reliance on our book-to-bill ratios or changes in book-to-bill ratios. We determine bookings based on orders that are scheduled for delivery within 12 months. However, lead times for the release of purchase orders depend upon the scheduling practices of individual customers, and delivery times of new or non-standard products can be affected by scheduling factors and other manufacturing considerations. The rate of booking new orders can vary significantly from month to month. Customers frequently change their delivery schedules or cancel orders. For these reasons, our book-to-bill ratio may not be an indication of future sales. The percentage of our business represented by space/satellite and defense products may decline. If and when this occurs, we anticipate that our book-to-bill ratio will decline. On the other hand, the percentage of our business represented by space/satellite and defense products may increase. If and when this occurs, we anticipate that our book-to-bill ratio will increase disproportionately to our total expected revenues. Our space/satellite business is characterized by long lead times; however, our other end markets tend to place orders with short lead times. There may be some potential effects of system outages. Risks are presented by electrical or telecommunications outages, computer hacking or other general system failure. We rely heavily on our internal information and communications systems and on systems or support services from third parties to manage our operations efficiently and effectively. Any of these are subject to failure. System-wide or local failures that affect our information processing could have material adverse effects on our business, financial condition, results of operations and cash flows. In addition, insurance coverage does not generally protect from normal wear and tear, which can affect system performance. Any applicable insurance coverage for an occurrence could prove to be inadequate. Coverage may be or become unavailable or inapplicable to any risks then prevalent. We are upgrading
36

Table of Contents
and integrating, and have plans to upgrade and integrate further our enterprise information systems, and these efforts may cause additional strains on personnel and system resources or may result in potential system outages. The integration efforts generally concern our goal of strengthening or documenting our internal controls for the purposes contemplated in Section 404 of the Sarbanes-Oxley Act. Our accounting policies and estimates have a material effect on the financial results we report. Significant accounting policies and estimates have material effects on our calculations and estimations of amounts in our financial statements. Our operating results and balance sheets may be adversely affected either to the extent that actual results prove to be adversely different from previous accounting estimates or to the extent that accounting estimates are revised adversely. We base our critical accounting policies, including our policies regarding revenue recognition, reserves for returns, rebates, price protections, and bad debt and inventory valuation, on various estimates and subjective judgments that we may make from time to time. The judgments made can significantly affect net income and our balance sheets. We are required to make significant judgments concerning inventory, and whether it becomes obsolete or excess, and concerning impairments of long-lived assets and also of goodwill. Our judgments, estimates and assumptions are subject to change at any time. In addition, our accounting policies may change at any time as a result of changes in GAAP as it applies to us or changes in other circumstances affecting us. Changes in accounting policy have affected and could further affect, in each case materially and adversely, our results of operations or financial position.
Item 3. QUANTITATIVE AND QUALITATIVE DISCLOSURES ABOUT MARK ET RISK
Market risk is the potential loss arising from adverse changes in foreign currency exchange rates, interest rates, or the stock market. We are exposed to various market risks, which are related to changes in certain foreign currency exchange rates and changes in certain interest rates. We conduct business in a number of foreign currencies, principally those of Europe and Asia, directly or through our foreign operations. We may receive some revenues in foreign currencies and purchase some inventory and services in foreign currencies. Accordingly, we are exposed to transaction gains and losses that could result from changes in exchange rates of these foreign currencies relative to the U.S. dollar. Transactions in foreign currencies have represented a relatively small portion of our business and these currencies have been relatively stable against the U.S. dollar for the past several years. As a result, foreign currency fluctuations have not had a material impact historically on our revenues or results of operations. Nonetheless, foreign currency fluctuations relative to the U.S. dollar have tended to increase in recent years. There can be no assurance that those currencies will remain stable relative to the U.S. dollar or that future fluctuations in the value of foreign currencies will not have material adverse effects on our results of operations, cash flows or financial condition. Our largest foreign currency exposure results from activity in British pounds and the European Union Euro. We have not conducted a foreign currency hedging program thus far. We have considered and may continue to consider the adoption of a foreign currency hedging program. We did not enter into derivative financial instruments and did not enter into any other financial instruments for trading or speculative purposes or to hedge exposure to interest rate risks. Our other financial instruments consist primarily of cash, accounts receivable, accounts payable and long-term obligations. Our exposure to market risk for changes in interest rates relates primarily to our short-term investments and short-term obligations. As a result, we do not expect fluctuations in interest rates to have a material impact on the fair value of these instruments. Accordingly, we have not engaged in transactions intended to hedge our exposure to changes in interest rates. We currently have a $30,000,000 revolving line of credit, which expires in March 2007. At July 3, 2005, $400,000 was utilized for a letter of credit; consequently, $29,600,000 was available under this line of credit. It bears interest at the bank’s prime rate plus 0.75% to 1.5% per annum or, at our option, at the Eurodollar rate plus 1.75% to 2.5% per annum. The interest rate is determined by the ratio of total funded debt to Earnings Before Interest, Taxes, Depreciation and Amortization (“EBITDA”). For instance, if we were to borrow presently the entire $30,000,000 from this credit line, a one-percent increase in the interest rate would result in an additional $300,000 of pre-tax interest expense annually. Market forces recently have been tending to increase short-term interest rates, although the prime rate and the Eurodollar rate move independently of the Federal Funds Rate. The ratio of funded debt to EBITDA also would increase
37

Table of Contents
as amounts are borrowed under the line of credit. These factors could have the effect of potentially increasing the effective interest rate on future incremental borrowings. Item 4. CONTROLS AND PROCEDURES (a) Evaluation of disclosure controls and procedures. Our Chief Executive Officer and Chief Financial Officer, with the assistance of other management, conducted an evaluation of our disclosure controls and procedures as of the end of the period covered by this Report. Based on this evaluation, our Chief Executive Officer and Chief Financial Officer concluded that our disclosure controls and procedures are effective. (b) Changes in internal control over financial reporting. During our second fiscal quarter of fiscal year 2005, there have been no changes in our internal control over financial reporting that have materially affected, or are reasonably likely to materially affect, our internal control over financial reporting.
38

Table of Contents
PART II - OTHER INFORMATION
Item 1. LEGAL PROCEEDINGS
In our most recent Form 10-K as filed with the SEC on December 10, 2004, we previously reported litigation in which we are involved, and no material changes in such litigation occurred during the fiscal period that is the subject of this Report on Form 10-Q, except as set forth below.
On February 18, 2005, Permlight Products, Inc. filed suit against Microsemi in the Orange County Superior Court under Case No. 05CC03337. Permlight alleges breach of warranty, among other claims, arising from Microsemi’s sale to Permlight of allegedly defective LED’s. Permlight seeks compensatory damages, including lost profits, and alleges damages in an amount not less than $1 million. Microsemi has cross-complained for, among other things, breach of contract based on Permlight’s failure to pay for the goods. We are in the early stage of this litigation; therefore, we are unable to assess the possible outcome of this litigation.
We are also involved from time to time in ordinary routine litigation incidental to our business, none of which, individually or collectively, involves claims for damages that would be material to our financial condition.
Item 2. UNREGISTERED SALES OF EQUITY SECURITIES AND USE OF PROCEEDS
Inapplicable
Item 3. DEFAULTS UPON SENIOR SECURITIES
Inapplicable
Item 4. SUBMISSION OF MATTERS TO A VOTE OF SECURITY HOLDERS
None
Item 5. OTHER INFORMATION
None
SIGNATURES
Item 6. EXHIBITS
31 Certifications pursuant to Exchange Act Rule 13a-14(a)
32 Certifications pursuant to Exchange Act Rule 13a-14(b) and 18 U.S.C. 1350
Pursuant to the requirements of the Securities Exchange Act of 1934, as amended, the registrant has duly caused this report to be signed on its behalf by the undersigned thereunto duly authorized.
39
MICROSEMI CORPORATION
DATED: August 11, 2005 By: /s/ David R. Sonksen David R. Sonksen
Executive Vice President and Chief Financial Officer (Principal Financial Officer and Chief Accounting Officer and duly authorized to sign on behalf of the Registrant)

Table of Contents
EXHIBIT INDEX
40
Exhibit 31
CERTIFICATIONS I, James J. Peterson, certify that:
Ex. No.
Exhibit Description
31 Certifications pursuant to Exchange Act Rule 13a-14(a)
32 Certifications pursuant to Exchange Act Rule 13a-14(b) and 18 U.S.C. 1350
1. I have reviewed this quarterly report on Form 10-Q of Microsemi Corporation; 2. Based on my knowledge, this report does not contain any untrue statement of a material fact or omit to state a material fact necessary to make the statements made, in light of the circumstances under which such statements were made, not misleading with respect to the period covered by this report; 3. Based on my knowledge, the financial statements, and other financial information included in this report, fairly present in all material respects the financial condition, results of operations and cash flows of the registrant as of, and for, the periods presented in this report; 4. The registrant’s other certifying officer(s) and I are responsible for establishing and maintaining disclosure controls and procedures (as defined in Exchange Act Rules 13a-15(e) and 15d-15(e)) for the registrant and have:
(a) Designed such disclosure controls and procedures, or caused such disclosure controls and procedures to be designed under our supervision, to ensure that material information relating to the registrant, including its consolidated subsidiaries, is made known to us by others within those entities, particularly during the period in which this report is being prepared;
(b) Evaluated the effectiveness of the registrant’s disclosure controls and procedures and presented in this report our conclusions about the effectiveness of the disclosure controls and procedures, as of the end of the period covered by this report based on such evaluation; and
(c) Disclosed in this report any change in the registrant’s internal control over financial reporting that occurred during the registrant’s most recent fiscal quarter (the registrant’s fourth fiscal quarter in the case of an annual report) that has materially affected, or is reasonably likely to materially affect, the registrant’s internal control over financial reporting; and 5. The registrant’s other certifying officer(s) and I have disclosed, based on our most recent evaluation of internal control over financial reporting, to the registrant’s auditors and the audit committee of the registrant’s board of directors (or persons performing the equivalent functions):
(a) All significant deficiencies and material weaknesses in the design or operation of internal control over financial reporting which are reasonably likely to adversely affect the registrant’s ability to record, process, summarize and report financial information; and
(b) Any fraud, whether or not material, that involves management or other employees who have a significant role in the registrant’s internal control over financial reporting. Date: August 11, 2005
/s/James J. Peterson James J. Peterson Chief Executive Officer and President

I, David R. Sonksen, certify that: 1. I have reviewed this quarterly report on Form 10-Q of Microsemi Corporation; 2. Based on my knowledge, this report does not contain any untrue statement of a material fact or omit to state a material fact necessary to make the statements made, in light of the circumstances under which such statements were made, not misleading with respect to the period covered by this report; 3. Based on my knowledge, the financial statements, and other financial information included in this report, fairly present in all material respects the financial condition, results of operations and cash flows of the registrant as of, and for, the periods presented in this report; 4. The registrant’s other certifying officer(s) and I are responsible for establishing and maintaining disclosure controls and procedures (as defined in Exchange Act Rules 13a-15(e) and 15d-15(e)) for the registrant and have:
(a) Designed such disclosure controls and procedures, or caused such disclosure controls and procedures to be designed under our supervision, to ensure that material information relating to the registrant, including its consolidated subsidiaries, is made known to us by others within those entities, particularly during the period in which this report is being prepared;
(b) Evaluated the effectiveness of the registrant’s disclosure controls and procedures and presented in this report our conclusions about the effectiveness of the disclosure controls and procedures, as of the end of the period covered by this report based on such evaluation; and
(c) Disclosed in this report any change in the registrant’s internal control over financial reporting that occurred during the registrant’s most recent fiscal quarter (the registrant’s fourth fiscal quarter in the case of an annual report) that has materially affected, or is reasonably likely to materially affect, the registrant’s internal control over financial reporting; and 5. The registrant’s other certifying officer(s) and I have disclosed, based on our most recent evaluation of internal control over financial reporting, to the registrant’s auditors and the audit committee of the registrant’s board of directors (or persons performing the equivalent functions):
(a) All significant deficiencies and material weaknesses in the design or operation of internal control over financial reporting which are reasonably likely to adversely affect the registrant’s ability to record, process, summarize and report financial information; and
(b) Any fraud, whether or not material, that involves management or other employees who have a significant role in the registrant’s internal control over financial reporting. Date: August 11, 2005
Exhibit 32
CERTIFIED WRITTEN STATEMENT ACCOMPANYING PERIODIC FINANCIAL REPORTS
(Pursuant to 18 U.S.C. 1350)
The undersigned, James J. Peterson, Chief Executive Officer, and David R. Sonksen, Chief Financial Officer, of Microsemi Corporation, a Delaware corporation (the ”Company”), each hereby certifies, pursuant to 18 U.S.C. Section 1350, as adopted pursuant to Section 906 of the Sarbanes-Oxley Act of 2002, that—
/s/ David R. Sonksen David R. Sonksen Executive Vice President, Chief Financial Officer, Treasurer and Secretary
(1) the accompanying periodic report containing financial statements filed by the Company with the Securities and Exchange
Commission (the “Report”) fully complies with the requirements of Section 13(a) of the Securities Exchange Act of 1934 (15 U.S.C. 78m(a)); and
IN WITNESS WHEREOF, the undersigned have executed this certificate which accompanies the Company’s Quarterly Report on Form 10-Q for the quarterly period ended July 3, 2005.
(2) information contained in the Report fairly presents, in all material respects, the financial condition and results of operations of the
Company.
Dated: August 11, 2005 /s/ James J. Peterson
James J. Peterson, Chief Executive Officer and President
Dated: August 11, 2005 /s/ David R. Sonksen
David R. Sonksen, Executive Vice President,

End of Filing
© 2005 | EDGAR Online, Inc.
Chief Financial Officer, Treasurer and Secretary