microsoft project presentation by corey johnson 10/11/00
TRANSCRIPT
Microsoft Project Presentation
By Corey Johnson
10/11/00
What is a Gantt Chart?
• A Gantt Chart is a visual tool to help Plan,
Manage, and Track a project or projects.
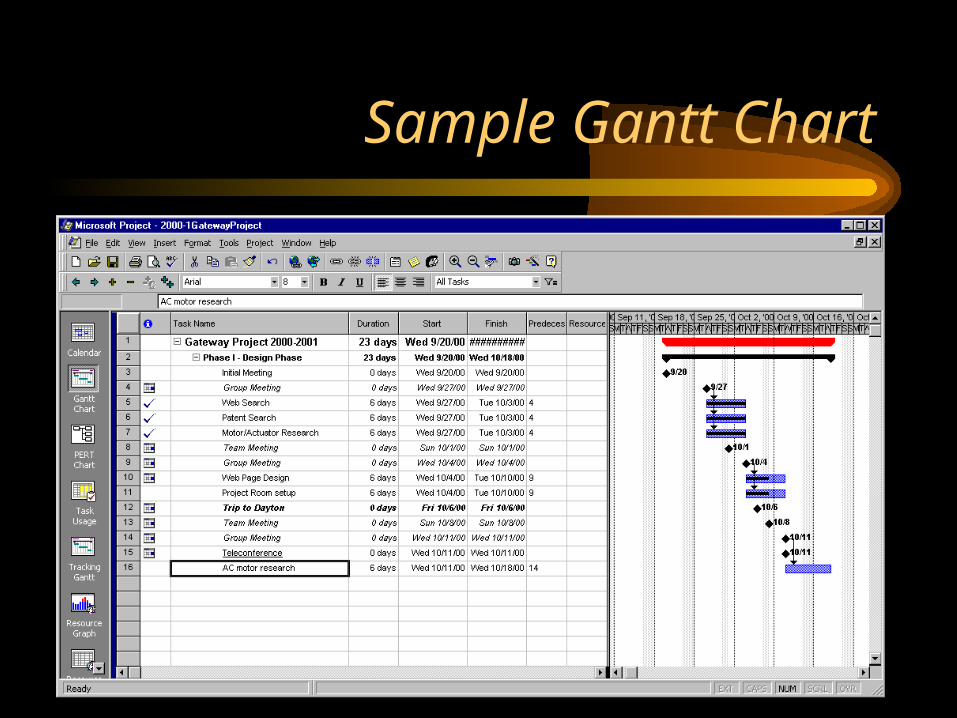
Sample Gantt Chart
Planning a Project
• Define Goals
• Develop Tasks
• Establish Timeframes
• Resource Availability?
• Organize
Managing and Tracking a Project
• Track Progress – Are the tasks being completed on time?– Is one task holding up the whole project?
• Manage Finances– Is the project going to stay within the budget?
Using MS Project
• Define the Project
• Build the Plan– Set a start date– Enter tasks/durations– Assign resources– Link tasks– Fine tune the plan
Using MS Project (cont’d)
• Track and Manage– Set a baseline– Enter actuals– Adjust plan
• Close Project
Defining the Project
• The objective of the project should be defined by the person/group that is going to manage the project.
• Tasks, start times, and deadlines should be clearly established.
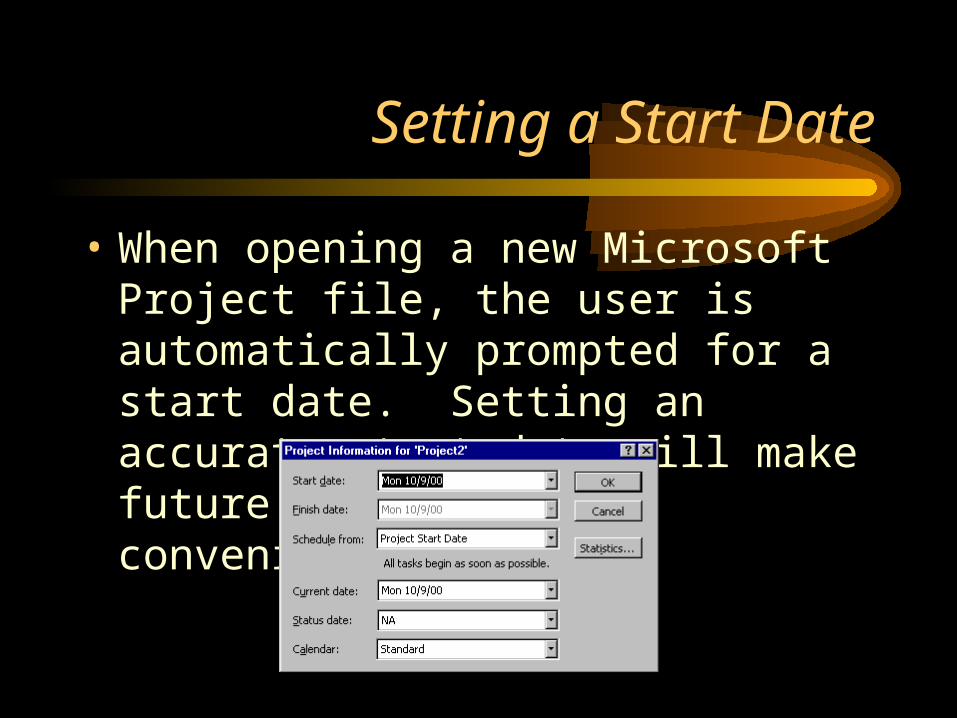
Setting a Start Date
• When opening a new Microsoft Project file, the user is automatically prompted for a start date. Setting an accurate start date will make future entries more convenient.
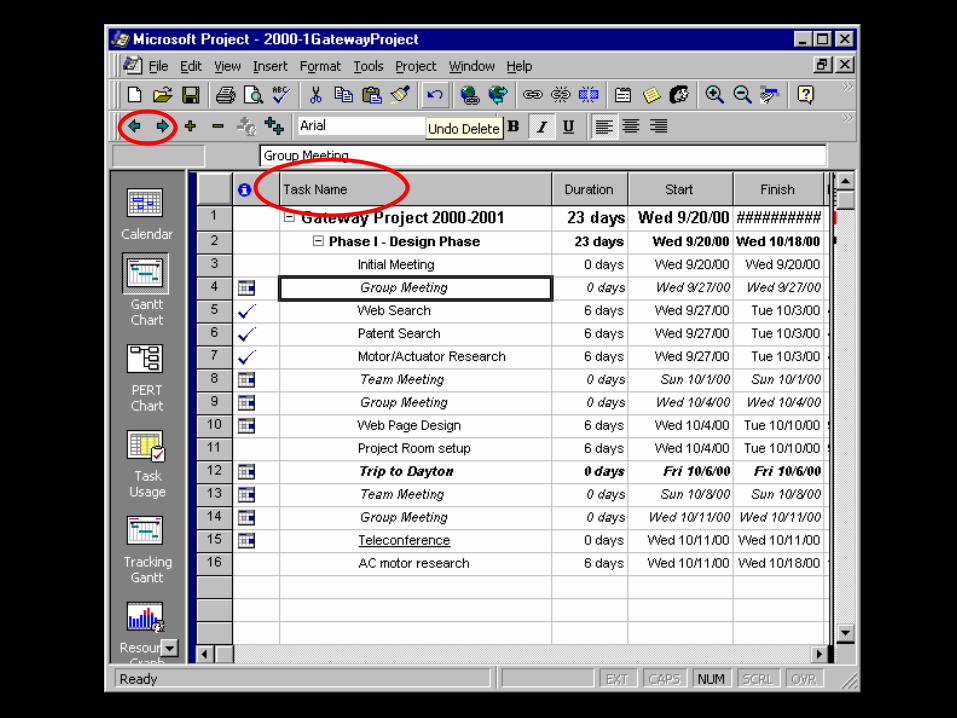
Entering Tasks and Durations
• Tasks are entered in the “Task Name” column
• Subtasks are created by indenting a task.
• Durations may be entered in number of working days or start and finish dates may be used
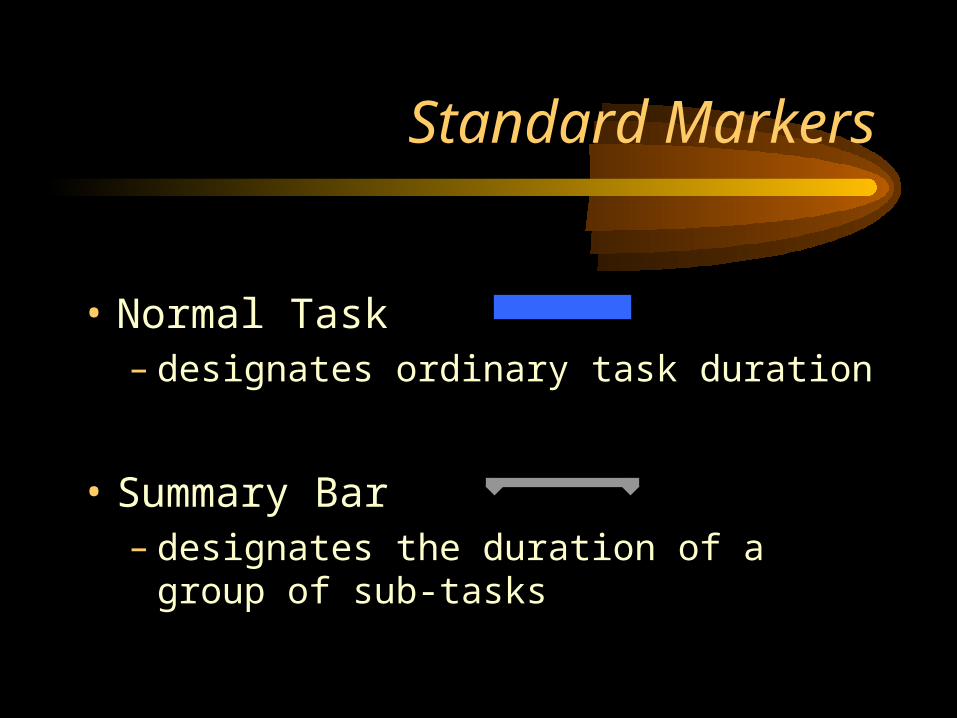
Standard Markers
• Normal Task– designates ordinary task duration
• Summary Bar– designates the duration of a group of sub-tasks
Special Markers
• Milestones– A reference point marking a major event in a
project and used to monitor the project's progress
– To create a milestone, Enter “0” in the duration field
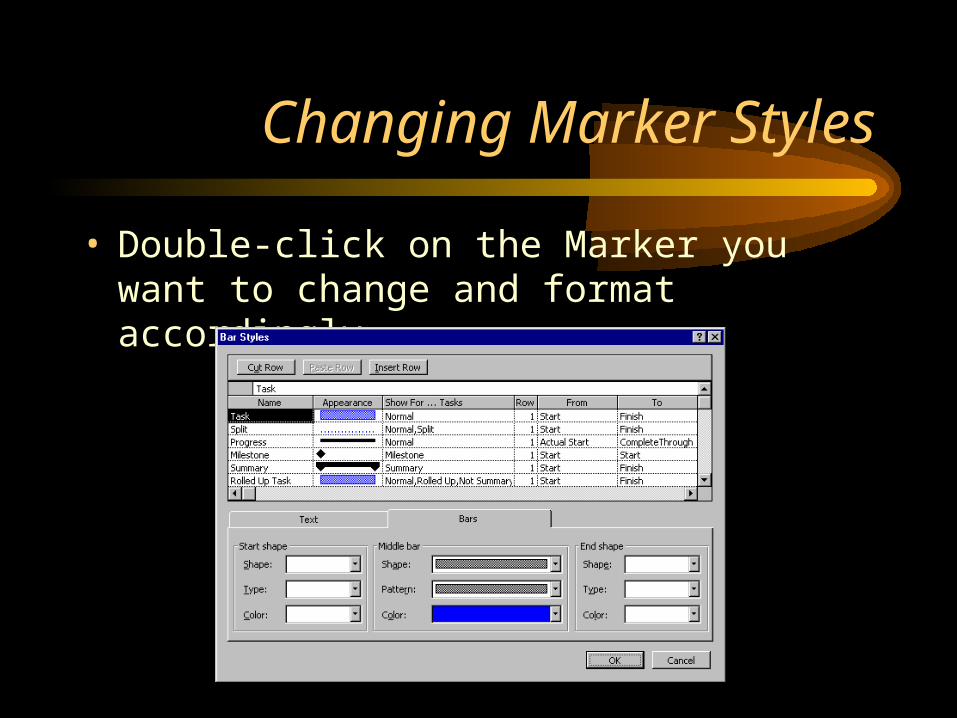
Changing Marker Styles
• Double-click on the Marker you want to change and format accordingly
Assigning Resources
• A resource can be a single person, a piece of equipment, or it can represent a group, such as Plumbers
• Information on resources include Availability, Costs, and Working Time
• Resources are very important in accurate scheduling
Assigning Resources
• To Assign a Resource:– Select the task to which you want to assign the
resource – Click the Assign Resources button on the
toolbar
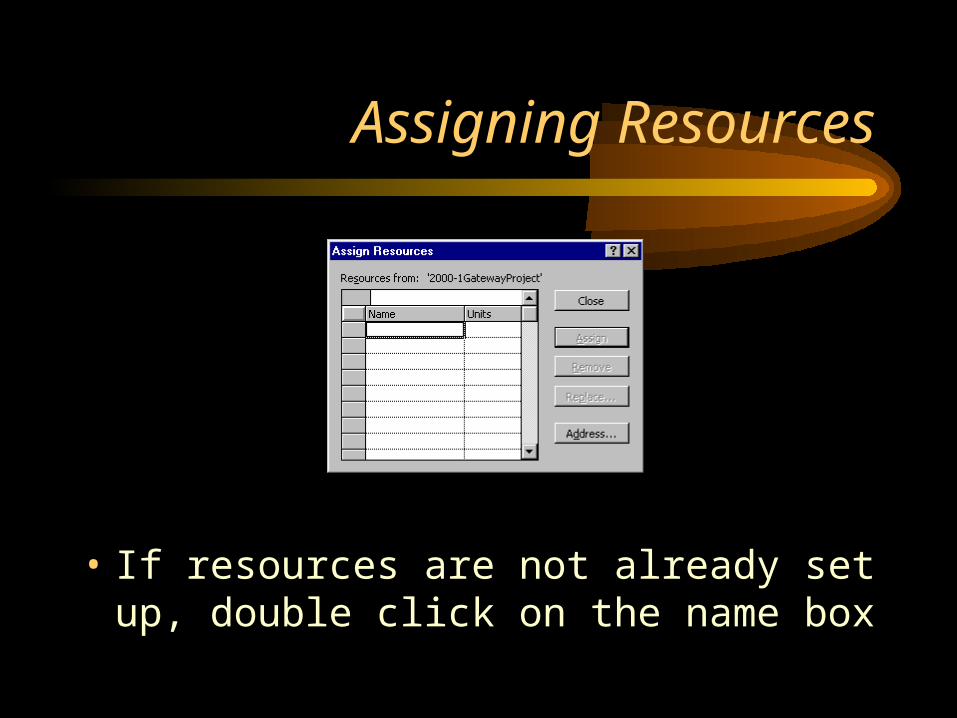
Assigning Resources
• If resources are not already set up, double click on the name box
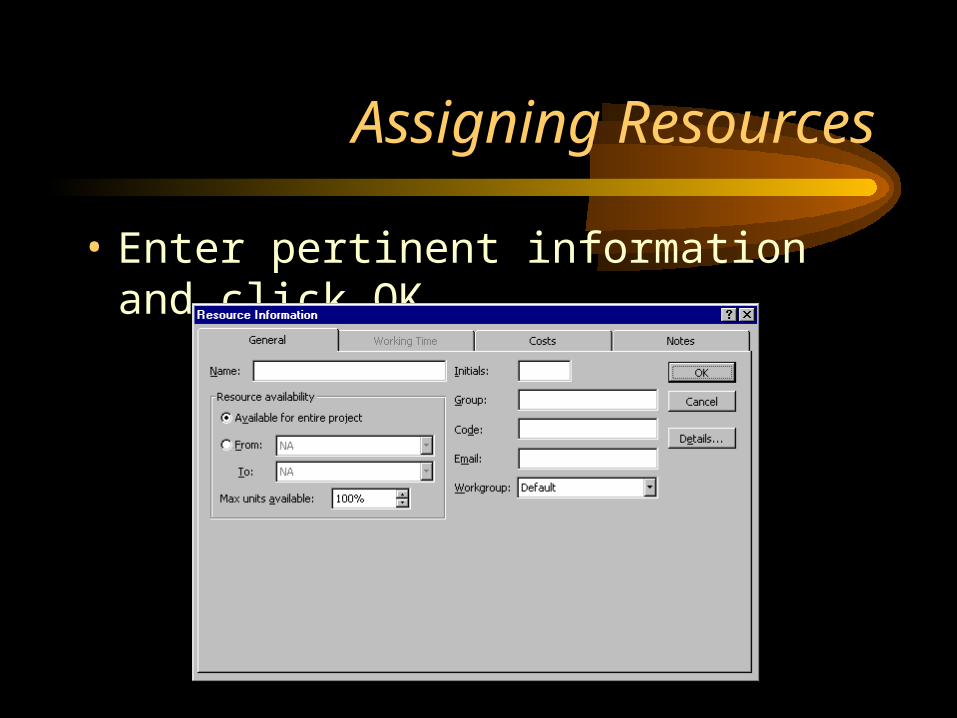
Assigning Resources
• Enter pertinent information and click OK.
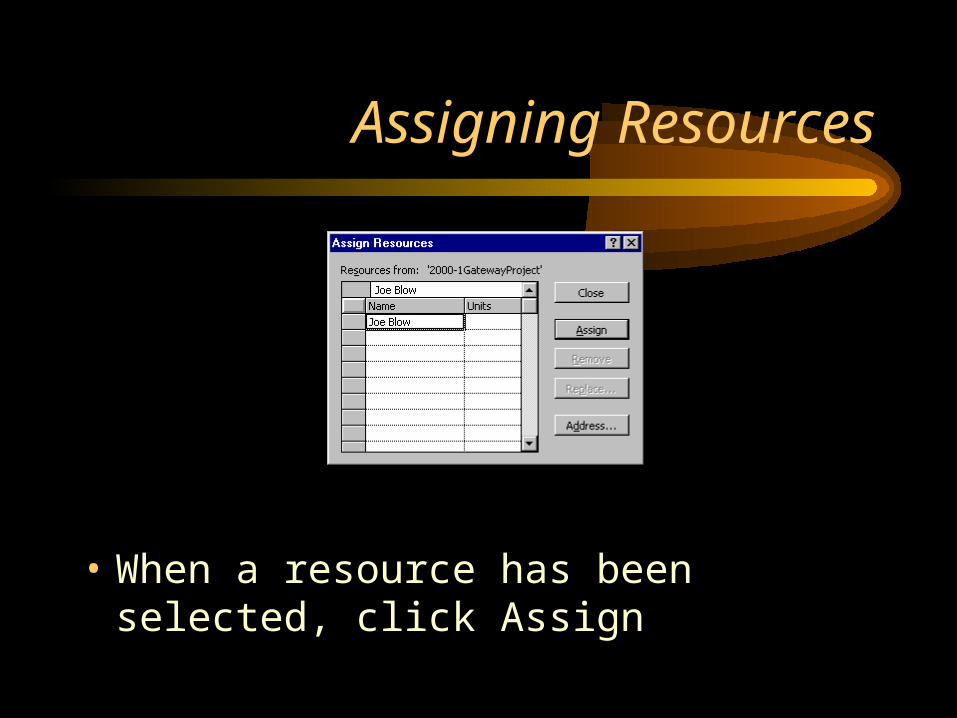
Assigning Resources
• When a resource has been selected, click Assign
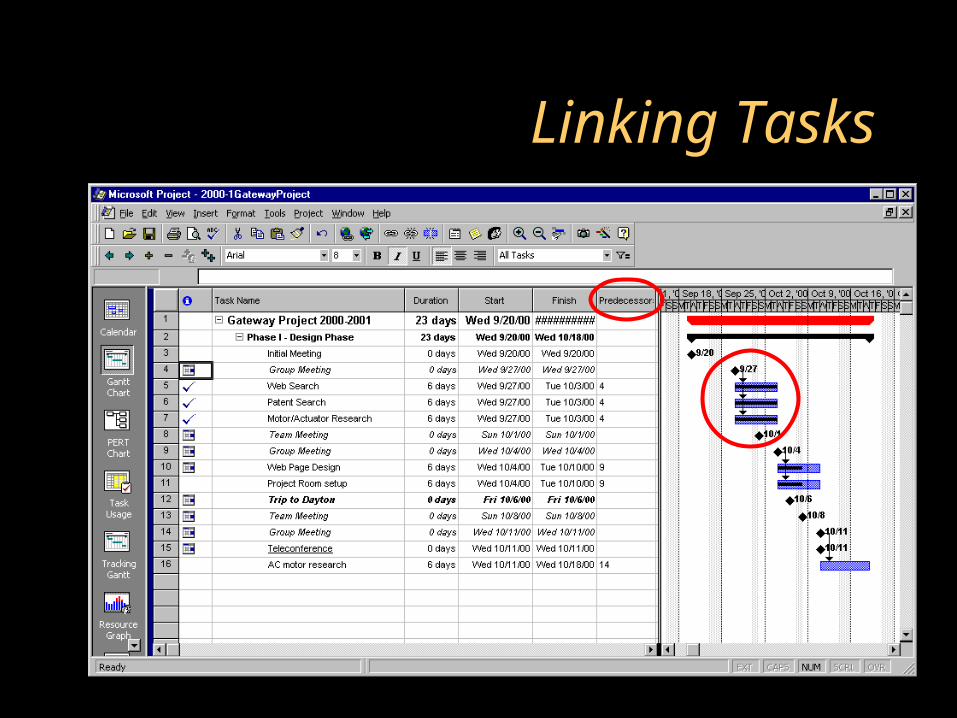
Linking Tasks
• Some tasks require that another task be completed before it can begin. These tasks must be linked.
• Tasks and subtasks are linked by assigning Predecessors.
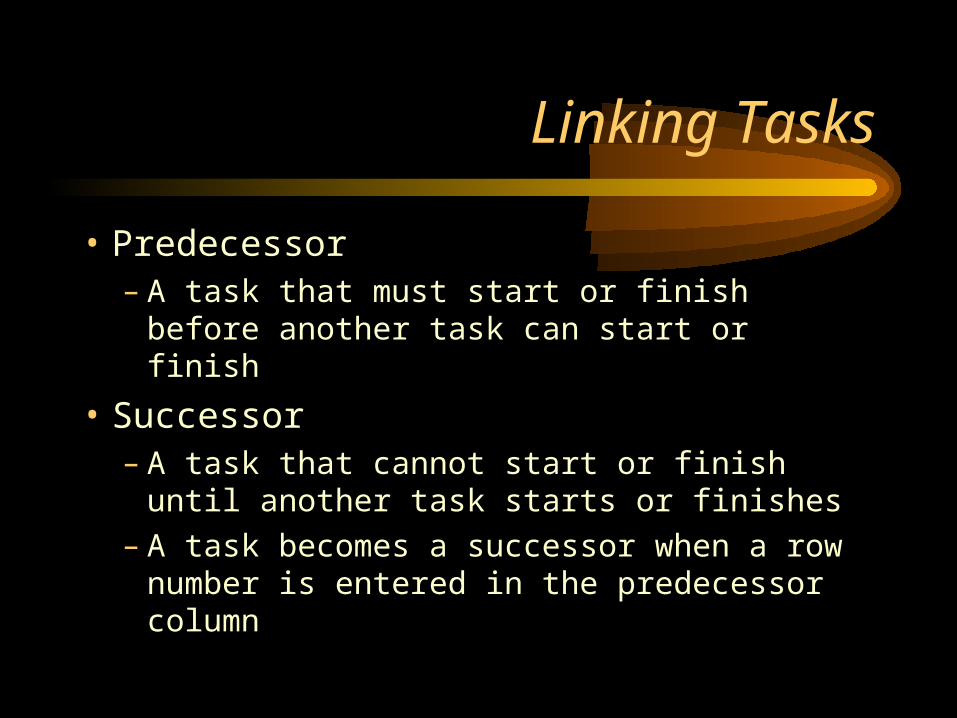
Linking Tasks
• Predecessor– A task that must start or finish before another
task can start or finish
• Successor– A task that cannot start or finish until another
task starts or finishes– A task becomes a successor when a row
number is entered in the predecessor column
Linking Tasks
Fine Tune the Plan
• When all resources have been assigned and appropriate tasks are linked, the original Gantt chart will be complete
• Check to make sure tasks have been linked correctly and task durations are correct
• The project is now ready to begin
Set a Baseline
• A baseline compares your original plan for the project with the actual course of the project.
• You can see which tasks started earlier or later than planned, exceeded their original budget, took longer than planned, and so on.
Set a Baseline
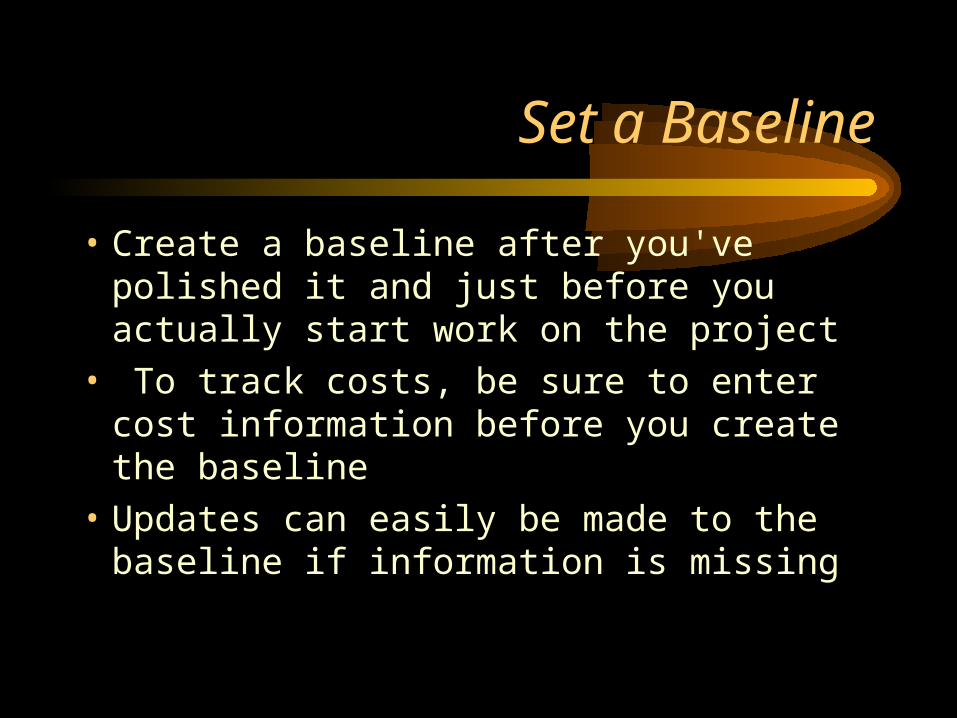
• Create a baseline after you've polished it and just before you actually start work on the project
• To track costs, be sure to enter cost information before you create the baseline
• Updates can easily be made to the baseline if information is missing
Set a Baseline
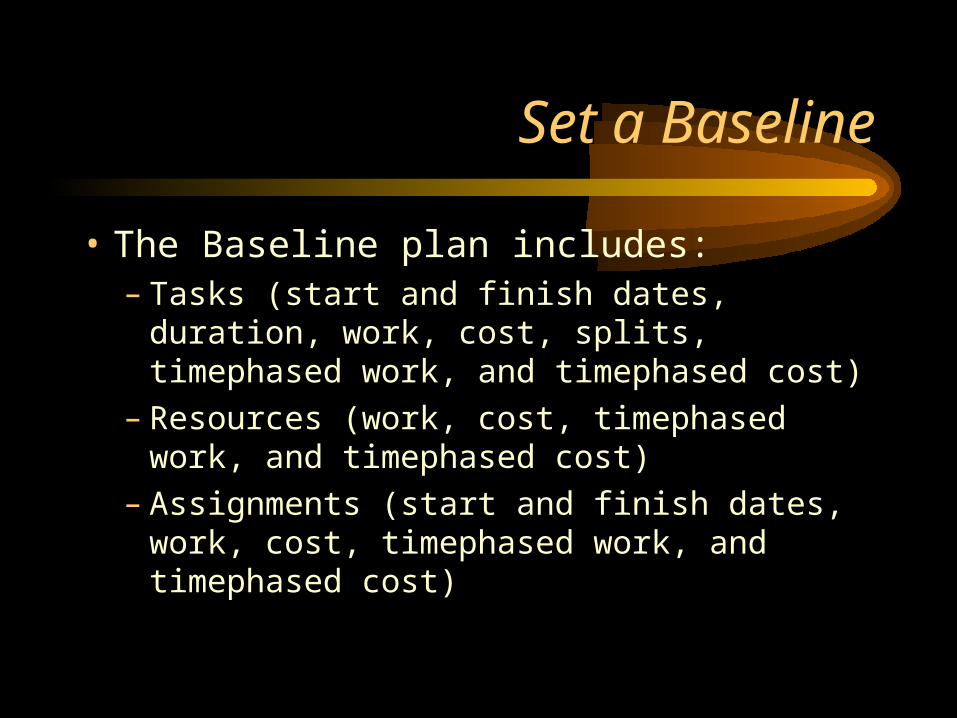
• The Baseline plan includes:– Tasks (start and finish dates, duration, work,
cost, splits, timephased work, and timephased cost)
– Resources (work, cost, timephased work, and timephased cost)
– Assignments (start and finish dates, work, cost, timephased work, and timephased cost)
Set a Baseline
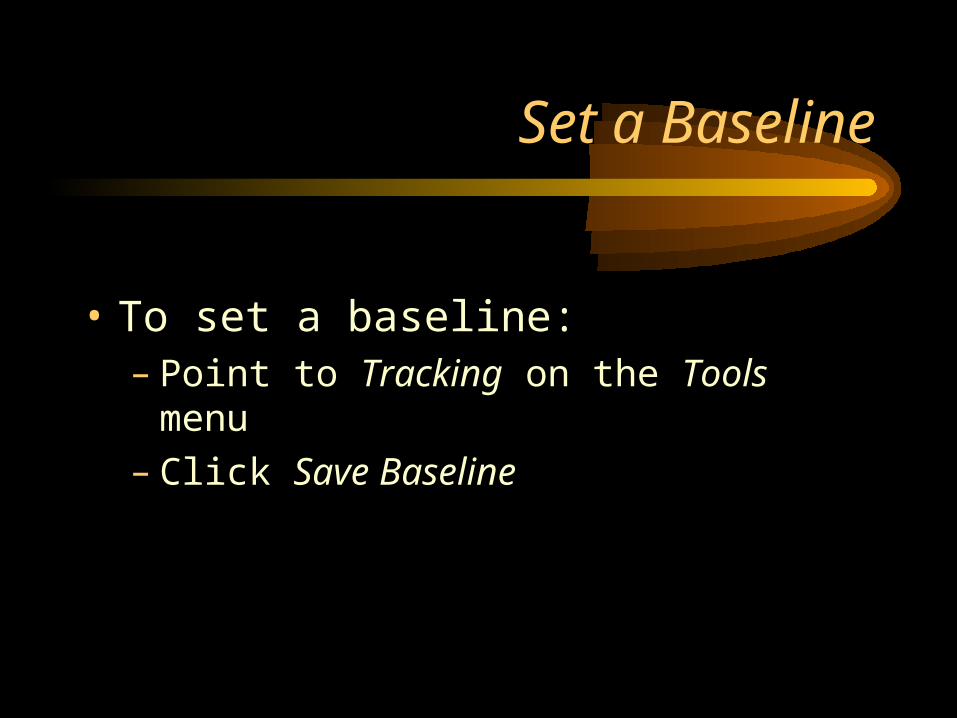
• To set a baseline:– Point to Tracking on the Tools menu– Click Save Baseline
Entering Progress
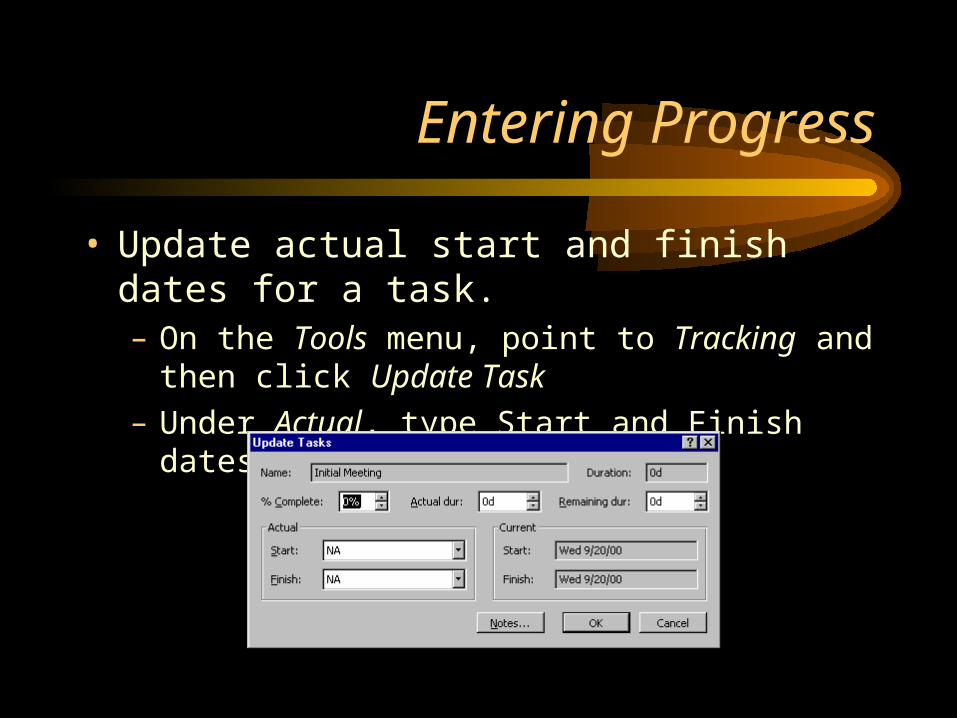
• Update actual start and finish dates for a task.– On the Tools menu, point to Tracking and then click
Update Task
– Under Actual, type Start and Finish dates
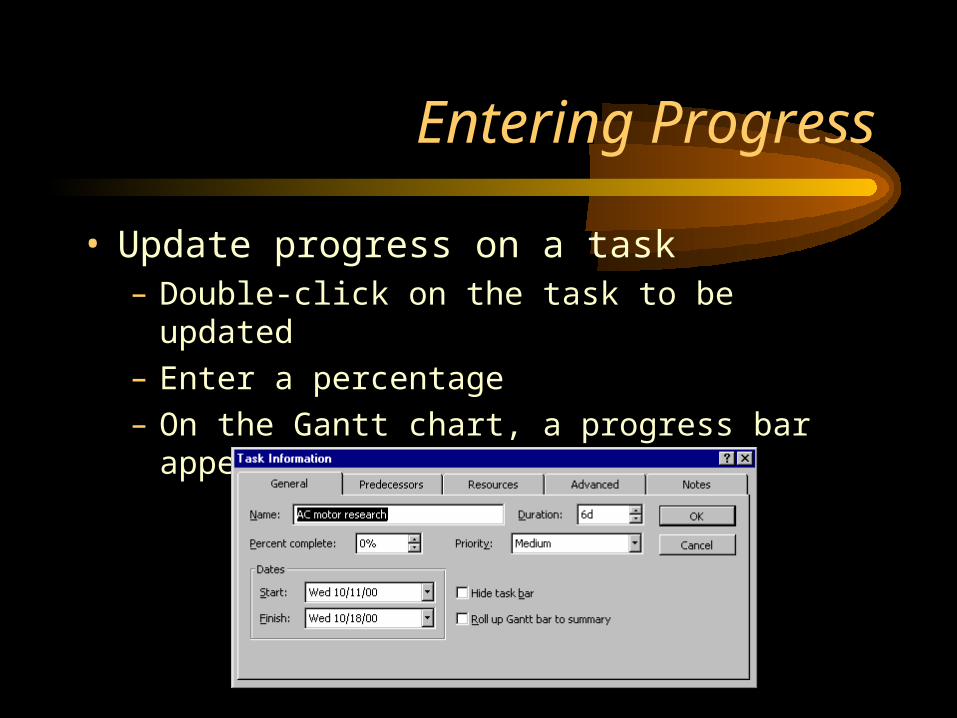
Entering Progress
• Update progress on a task– Double-click on the task to be updated
– Enter a percentage
– On the Gantt chart, a progress bar appears in the task bar
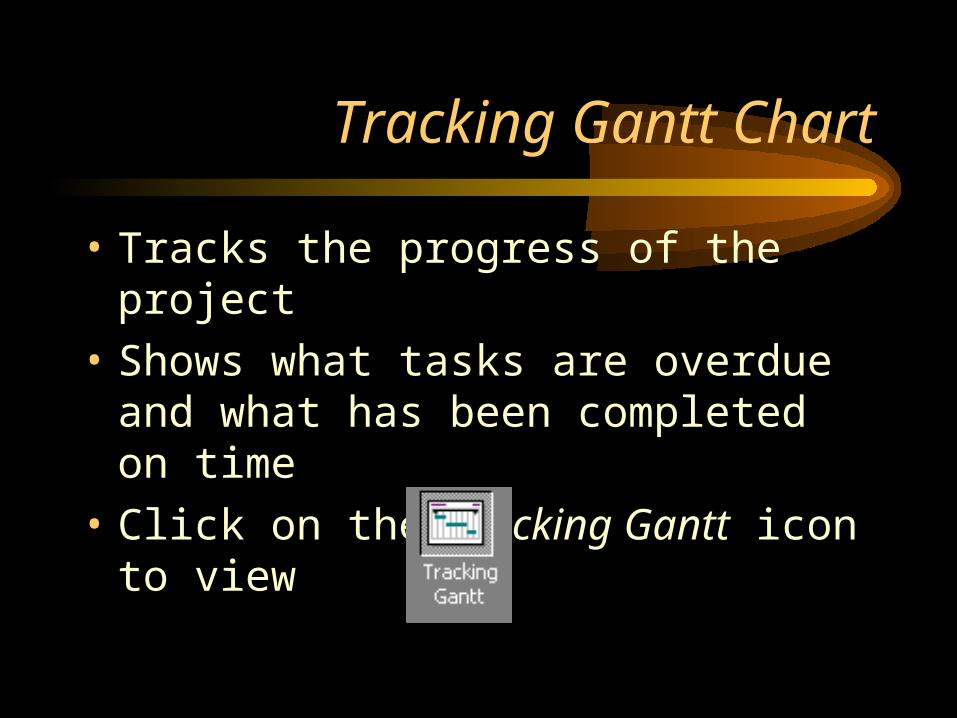
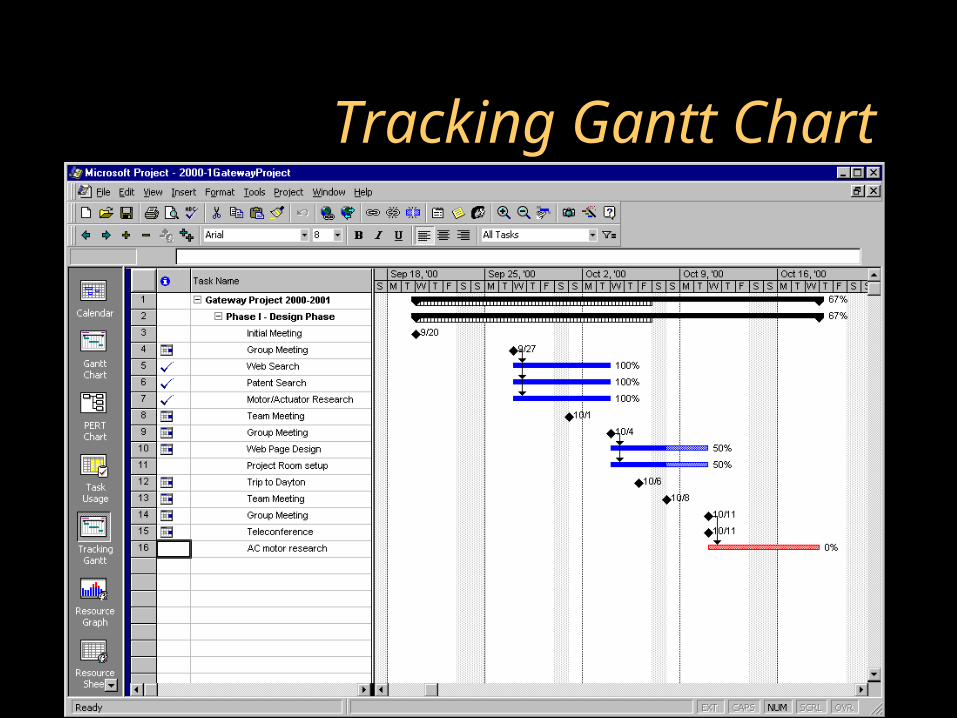
Tracking Gantt Chart
• Tracks the progress of the project
• Shows what tasks are overdue and what has been completed on time
• Click on the Tracking Gantt icon to view
Tracking Gantt Chart
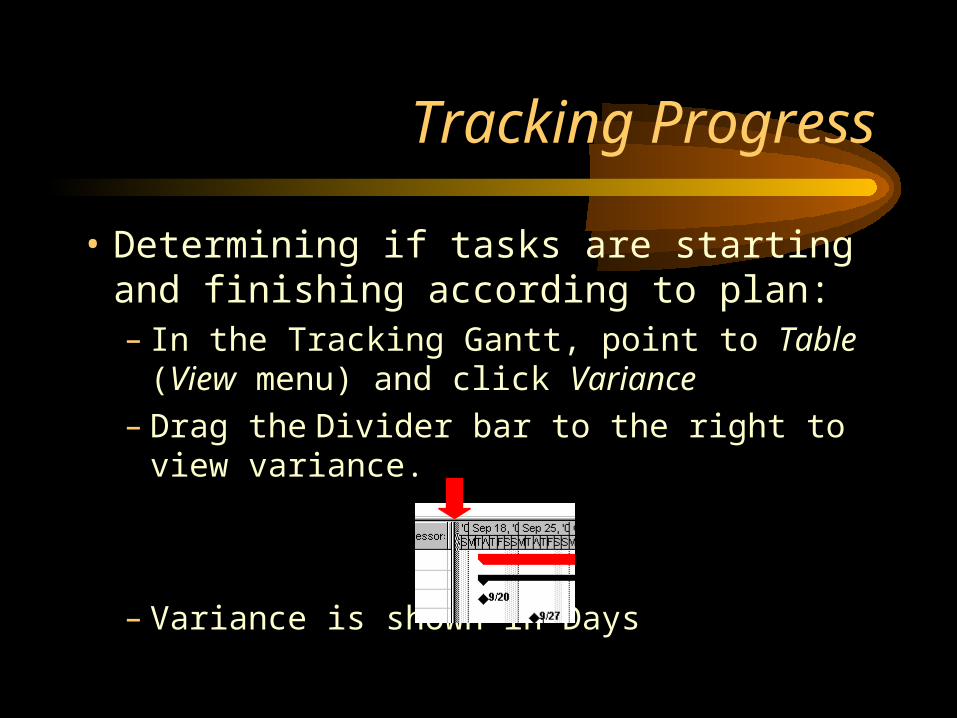
Tracking Progress
• Determining if tasks are starting and finishing according to plan:– In the Tracking Gantt, point to Table (View menu)
and click Variance– Drag the Divider bar to the right to view variance.
– Variance is shown in Days
Tracking Progress
• Determine if tasks cost more or less than budgeted– In the Tracking Gantt, point to Table (View
menu) and click Cost– Drag the Divider bar to the right to view Total
Cost and Baseline fields
PERT Chart
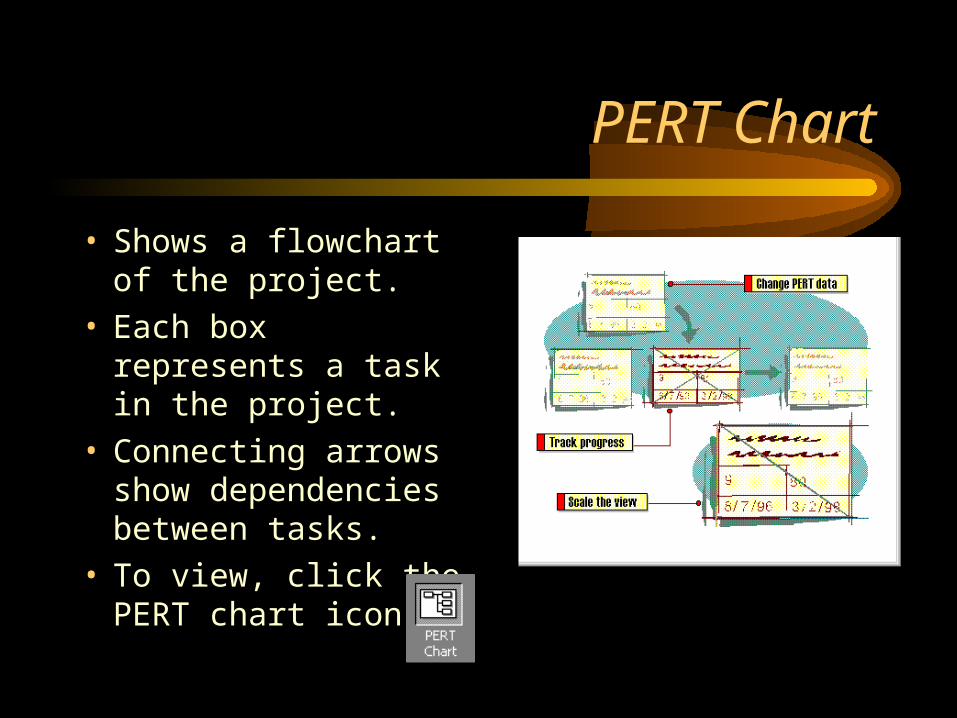
• Shows a flowchart of the project.
• Each box represents a task in the project.
• Connecting arrows show dependencies between tasks.
• To view, click the PERT chart icon
Calendar View
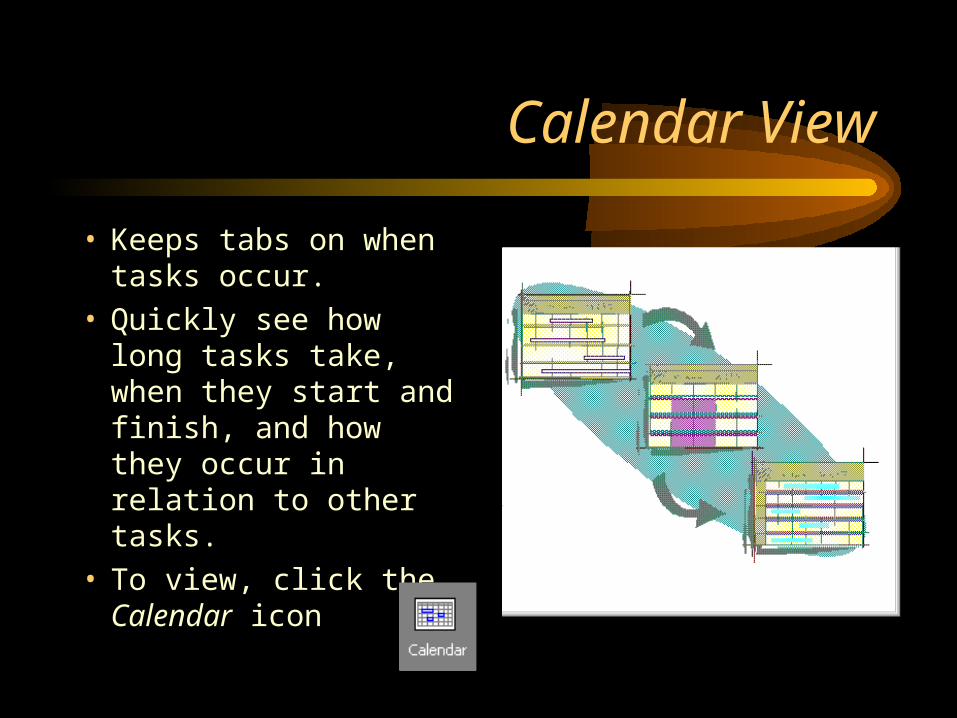
• Keeps tabs on when tasks occur.
• Quickly see how long tasks take, when they start and finish, and how they occur in relation to other tasks.
• To view, click the Calendar icon
Task Usage View
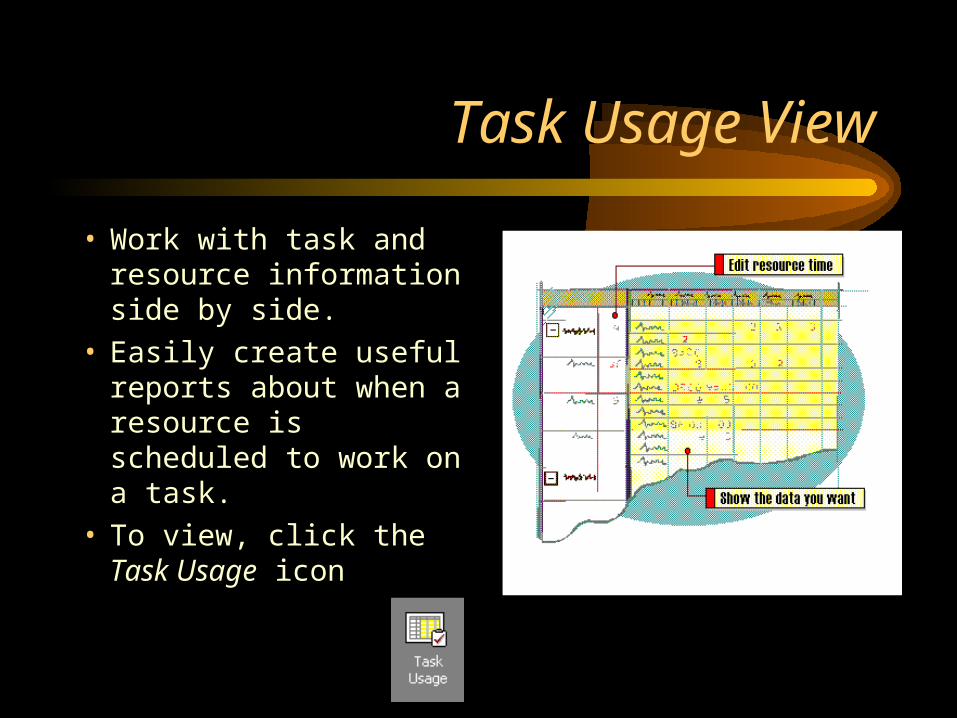
• Work with task and resource information side by side.
• Easily create useful reports about when a resource is scheduled to work on a task.
• To view, click the Task Usage icon
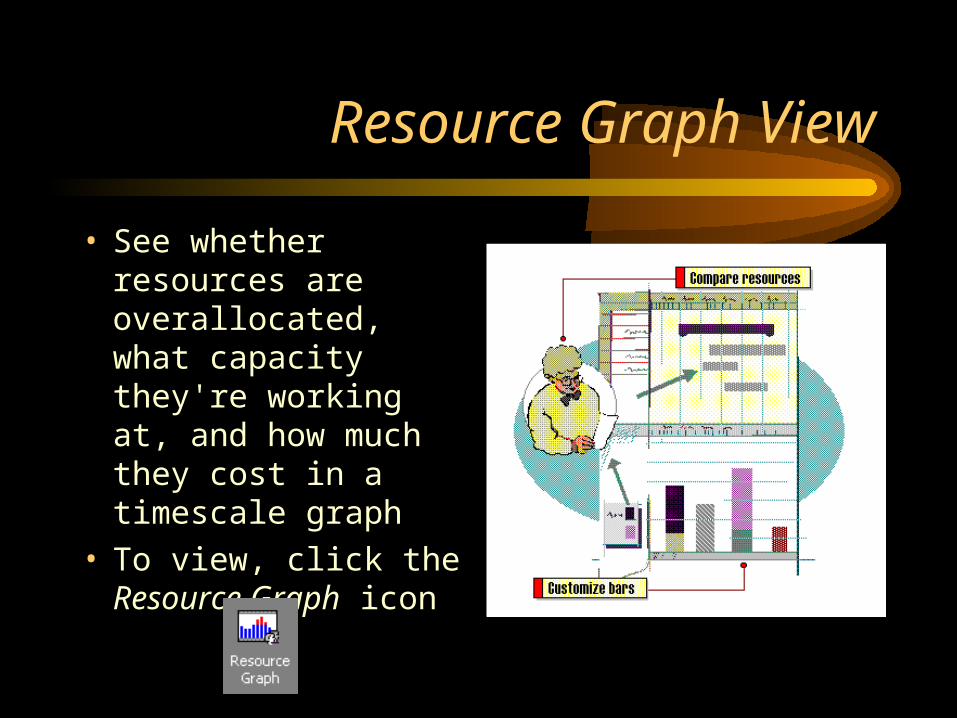
Resource Graph View
• See whether resources are overallocated, what capacity they're working at, and how much they cost in a timescale graph
• To view, click the Resource Graph icon
More Views
• Resource Sheet View– Easy way to review, add, edit data about
resources
• Resource Usage View– Work with resource and task information side
by side
The Project is Now Complete !!
• MS Project is a very powerful tool if it is used correctly
• This program can save a lot of time for engineers who are interested in time, cost, etc.
• Automatically keeps your project organized.
Thank you !!
Please feel free to ask any questions