microsoft security intelligence...
TRANSCRIPT

Microsoft Security
Intelligence Report Volume 21 | January through June, 2016
Key Findings Summary This document is for informational purposes only. MICROSOFT MAKES NO WARRANTIES, EXPRESS, IMPLIED, OR
STATUTORY, AS TO THE INFORMATION IN THIS DOCUMENT.
This document is provided “as-is.” Information and views expressed in this document, including URL and other Internet
website references, may change without notice. You bear the risk of using it.
Copyright © 2016 Microsoft Corporation. All rights reserved.
The names of actual companies and products mentioned herein may be the trademarks of their respective owners.

2 KEY FINDINGS SUMMARY

MICROSOFT SECURITY INTELLIGENCE REPORT, VOLUME 21, JANUARY–JUNE 2016 3
Vulnerabilities Vulnerability disclosures across the industry decreased 9.8 percent between
2H15 and 1H16, to just above 3,000.1 Disclosures have trended generally
upward over the past three years, with the exception of a spike in 2H14 caused
by a CERT/CC research project involving SSL vulnerabilities in Android
applications.
Figure 1. Trends for vulnerability (CVE) severity, vulnerability complexity, disclosures by type, and disclosures for Microsoft and non-
Microsoft products, across the entire software industry, 2H13–1H16
1 Throughout the report, half-yearly and quarterly time periods are referenced using the nHyy or nQyy
formats, where yy indicates the calendar year and n indicates the half or quarter.
0
500
1,000
1,500
2,000
2,500
3,000
3,500
2H13 1H14 2H14 1H15 2H15 1H16
Ind
ust
ryw
ide v
uln
era
bili
ty d
iscl
osu
res
Medium (4–6.9)
Low (0–3.9)
High (7–10)
0
500
1,000
1,500
2,000
2,500
3,000
2H13 1H14 2H14 1H15 2H15 1H16
Ind
ust
ryw
ide v
uln
era
bili
ty d
iscl
osu
res
Medium complexity
(medium risk)
High complexity
(lowest risk)
Low complexity
(highest risk)
0
500
1,000
1,500
2,000
2,500
3,000
3,500
2H13 1H14 2H14 1H15 2H15 1H16
Ind
ust
ryw
ide v
uln
era
bili
ty d
iscl
osu
res
Core operating
system
Web browsers
Operating
system
applications
Other
applications
0
500
1,000
1,500
2,000
2,500
3,000
3,500
4,000
4,500
5,000
2H13 1H14 2H14 1H15 2H15 1H16
Ind
ust
ryw
ide v
uln
era
bili
ty d
iscl
osu
res
Non-Microsoft
Microsoft

4 KEY FINDINGS SUMMARY
Exploits Figure 2 shows the prevalence of different types of exploits detected by
Microsoft antimalware products each quarter from 3Q15 to 2Q16, by encounter
rate. Encounter rate is the percentage of computers running Microsoft real-
time security products that report a malware encounter.
Figure 2. Encounter rates for different types of exploit attempts, 3Q15-2Q16
Computers that report more than one type of exploit are counted for each type detected. * Figures for exploit kits, Java, and
Adobe Flash Player exploits are affected by IExtensionValidation in Internet Explorer, which blocks many threats before they are
encountered. See the full report for more information.
After increasing significantly between 3Q15 and 4Q15, encounters with
exploit kits decreased by more than a third from 4Q15 to 1Q16. They
remained the most commonly encountered type of exploit in the second
half of the year, with an encounter rate more than four times that of the
0.0%
0.2%
0.4%
0.6%
0.8%
1.0%
1.2%
3Q15 4Q15 1Q16 2Q16
Enco
unte
r ra
te (p
erc
ent
of all
rep
ort
ing
co
mp
ute
rs)
Exploit kits*
Operating system
HTML/ JavaScript
Documents
Browser
Adobe Flash
Player*
Java*
Other

MICROSOFT SECURITY INTELLIGENCE REPORT, VOLUME 21, JANUARY–JUNE 2016 5
next most common type of exploit. See the full report for more information
about these exploits.
Exploit attempts involving Adobe Flash Player increased significantly in
1Q16 with the appearance of SWF/Netis, then returned to much lower
levels in 2Q16 as Netis encounters decreased.
The number of encounters with exploits that target operating systems
decreased slightly during both quarters in 1H16, but ended the period in
second place as Flash exploits receded. See the full report for more
information.
Encounters with Java exploits, HTML/JavaScript exploits, and other types of
exploits each accounted for less than 0.1 percent of all malware encounters
in 1H16. See the remainder of this section for more information about these
exploits.
Exploit families
Figure 3 lists the exploit-related malware families that were detected most
often during the first half of 2016.
6 KEY FINDINGS SUMMARY
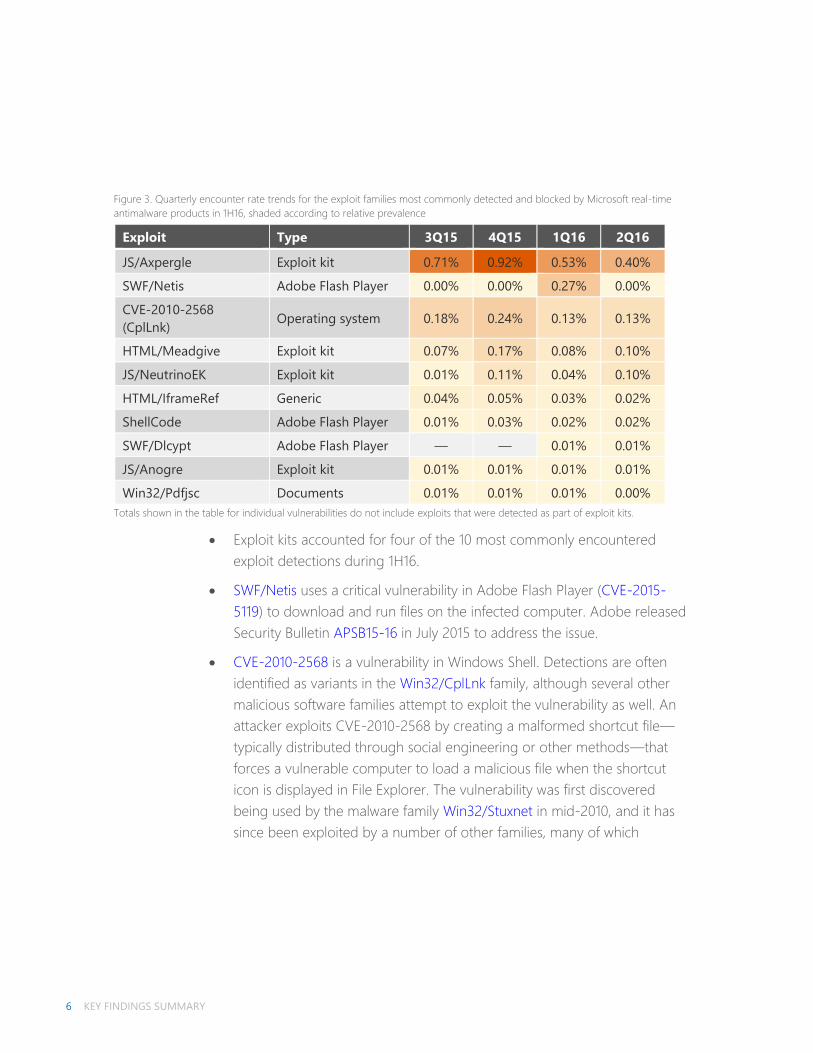
Figure 3. Quarterly encounter rate trends for the exploit families most commonly detected and blocked by Microsoft real-time
antimalware products in 1H16, shaded according to relative prevalence
Exploit Type 3Q15 4Q15 1Q16 2Q16
JS/Axpergle Exploit kit 0.71% 0.92% 0.53% 0.40%
SWF/Netis Adobe Flash Player 0.00% 0.00% 0.27% 0.00%
CVE-2010-2568
(CplLnk) Operating system 0.18% 0.24% 0.13% 0.13%
HTML/Meadgive Exploit kit 0.07% 0.17% 0.08% 0.10%
JS/NeutrinoEK Exploit kit 0.01% 0.11% 0.04% 0.10%
HTML/IframeRef Generic 0.04% 0.05% 0.03% 0.02%
ShellCode Adobe Flash Player 0.01% 0.03% 0.02% 0.02%
SWF/Dlcypt Adobe Flash Player — — 0.01% 0.01%
JS/Anogre Exploit kit 0.01% 0.01% 0.01% 0.01%
Win32/Pdfjsc Documents 0.01% 0.01% 0.01% 0.00%
Totals shown in the table for individual vulnerabilities do not include exploits that were detected as part of exploit kits.
Exploit kits accounted for four of the 10 most commonly encountered
exploit detections during 1H16.
SWF/Netis uses a critical vulnerability in Adobe Flash Player (CVE-2015-
5119) to download and run files on the infected computer. Adobe released
Security Bulletin APSB15-16 in July 2015 to address the issue.
CVE-2010-2568 is a vulnerability in Windows Shell. Detections are often
identified as variants in the Win32/CplLnk family, although several other
malicious software families attempt to exploit the vulnerability as well. An
attacker exploits CVE-2010-2568 by creating a malformed shortcut file—
typically distributed through social engineering or other methods—that
forces a vulnerable computer to load a malicious file when the shortcut
icon is displayed in File Explorer. The vulnerability was first discovered
being used by the malware family Win32/Stuxnet in mid-2010, and it has
since been exploited by a number of other families, many of which

MICROSOFT SECURITY INTELLIGENCE REPORT, VOLUME 21, JANUARY–JUNE 2016 7
predated the disclosure of the vulnerability and were subsequently adapted
to attempt to exploit it. Microsoft published Security Bulletin MS10-046 in
August 2010 to address the issue. Windows 8 and subsequently released
versions of Windows have never been vulnerable to exploits of CVE-2010-
2568.
HTML/IframeRef is a generic detection for specially formed HTML inline
frame (IFrame) tags that redirect to remote websites that contain malicious
content. More properly considered exploit downloaders than true exploits,
these malicious pages use a variety of techniques to exploit vulnerabilities
in browsers and plug-ins. The only commonality is that the attacker uses an
inline frame to deliver the exploits to users. The exact exploit delivered and
detected by one of these inline frames might be changed frequently.
SWF/Dlcypt is an Adobe Flash Player file that may be used by attackers to
decrypt and execute encrypted JavaScript files. It is configured to a run with
a frame size of zero by zero pixels, which allows it to run without being
noticed.
Exploit detection with Internet Explorer and IExtensionValidation
IExtensionValidation is an interface introduced in Internet Explorer 11 that real-
time security software can implement to block ActiveX controls from loading
on malicious pages. (Microsoft Edge, the newest Microsoft web browser and
the default browser in Windows 10, does not support ActiveX plug-ins at all,
and therefore does not use IExtensionValidation.) When Internet Explorer loads
a webpage that includes ActiveX controls, if the security software has
implemented IExtensionValidation, the browser calls the security software to
scan the HTML and script content on the page before loading the controls
themselves. If the security software determines that the page is malicious (for
example, if it identifies the page as an exploit kit landing page), it can direct
Internet Explorer to prevent individual controls or the entire page from loading.

8 KEY FINDINGS SUMMARY
Figure 4 shows the types of ActiveX controls identified on malicious webpages
in Internet Explorer 11 for each quarter from 3Q15 to 2Q16.
Figure 4. ActiveX controls detected on malicious webpages through IExtensionValidation, 3Q15–2Q16, by control type
Adobe Flash Player objects were the most commonly detected type of
object hosted on malicious pages in each of the past four quarters,
reaching a high of 99.2 percent in 4Q15 before declining to 69.3
percent in 2Q16.
Pages hosting malicious Silverlight objects increased in 1H16 as several
exploit kits added exploits for two recently disclosed Silverlight
vulnerabilities, CVE-2015-1671 and CVE-2016-0034. Microsoft published
Security Bulletins MS15-044 in May 2015 and MS16-006 in January 2016,
respectively, to address the vulnerabilities.
0%
10%
20%
30%
40%
50%
60%
70%
80%
90%
100%
3Q15 4Q15 1Q16 2Q16
Perc
ent
of IE
xtensi
onV
alid
atio
n d
ete
ctio
ns
Adobe Flash Silverlight Adobe Reader Java Other

MICROSOFT SECURITY INTELLIGENCE REPORT, VOLUME 21, JANUARY–JUNE 2016 9
Malware and unwanted
software Microsoft uses two different metrics to measure malware and unwanted
software prevalence:2
Encounter rate is simply the percentage of computers running Microsoft
real-time security products that report a malware encounter.3 Only
computers whose users have opted in to provide data to Microsoft are
considered when calculating encounter rates.
Computers cleaned per mille, or CCM, is an infection rate metric that is
defined as the number of computers cleaned for every 1,000 unique
computers that run the Malicious Software Removal Tool (MSRT), a free
tool distributed through Microsoft update services that removes more than
200 highly prevalent or serious threats from computers. Because it is not a
real-time tool, the MSRT only detects and removes threats that are already
present on the computer; it does not block infection attempts as they
happen.
Figure 5 illustrates the difference between these two metrics.
2 Encounter and infection rate figures do not include the Brantall, Rotbrow, and Filcout families. See the full
report for more information. 3 Encounter rate does not include threats that are blocked by a web browser before being detected by
antimalware software. In particular, IExtensionValidation in Internet Explorer 11 enables security software to
block pages containing exploits from loading. (See the full report for more information.) For this reason,
encounter rate figures may not fully reflect all of the threats encountered by computer users.

10 KEY FINDINGS SUMMARY
Figure 5. Worldwide encounter and infection rates, 3Q15–2Q16, by quarter
On average, about 20.6 percent of reporting computers worldwide
encountered threats over the past four quarters. At the same time, the MSRT
removed threats from about 10.1 out of every 1,000 computers, or 1.01 percent.
0
50
100
150
200
250
0%
5%
10%
15%
20%
25%
3Q15 4Q15 1Q16 2Q16
Co
mp
ute
rs c
leaned
per
1,000 s
canned
(C
CM
)
Enco
unte
r ra
te (p
erc
ent
of all
rep
ort
ing
co
mp
ute
rs)
Encounter rate Infect ion rate

MICROSOFT SECURITY INTELLIGENCE REPORT, VOLUME 21, JANUARY–JUNE 2016 11
Malware and unwanted software worldwide
Figure 6 shows the infection and encounter rates for locations around the
world in 2Q16.
Figure 6. Encounter rates (top) and infection rates (bottom) by country/region in 2Q16
12 KEY FINDINGS SUMMARY
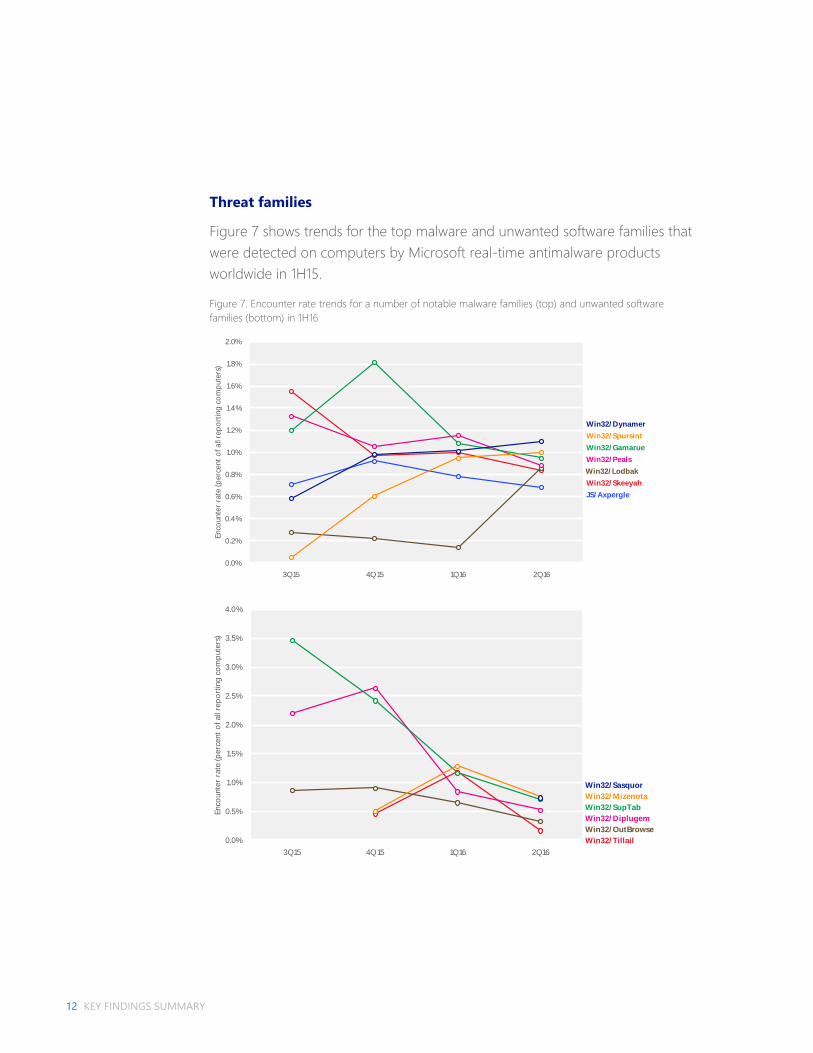
Threat families
Figure 7 shows trends for the top malware and unwanted software families that
were detected on computers by Microsoft real-time antimalware products
worldwide in 1H15.
Figure 7. Encounter rate trends for a number of notable malware families (top) and unwanted software
families (bottom) in 1H16
0.0%
0.2%
0.4%
0.6%
0.8%
1.0%
1.2%
1.4%
1.6%
1.8%
2.0%
3Q15 4Q15 1Q16 2Q16
Enco
unte
r ra
te (p
erc
ent
of all
rep
ort
ing
co
mp
ute
rs)
Win32/ Gamarue
JS/ Axpergle
Win32/ Lodbak
Win32/ Spursint
Win32/ Peals
Win32/ Skeeyah
Win32/ Dynamer
0.0%
0.5%
1.0%
1.5%
2.0%
2.5%
3.0%
3.5%
4.0%
3Q15 4Q15 1Q16 2Q16
Enco
unte
r ra
te (p
erc
ent
of all
rep
ort
ing
co
mp
ute
rs)
Win32/ OutBrowse
Win32/ Diplugem
Win32/ Tillail
Win32/ Sasquor
Win32/ Mizenota
Win32/ SupTab

MICROSOFT SECURITY INTELLIGENCE REPORT, VOLUME 21, JANUARY–JUNE 2016 13
Win32/Dynamer, Win32/Peals, and Win32/Skeeyah are generic detections
for a variety of threats that share certain characteristics.
Win32/Gamarue, the most commonly encountered non-generic threat in
1H16, is a worm that is commonly distributed via exploit kits and social
engineering.
Ransomware
Ransomware is a type of malware that is designed to render a computer or its
files unusable until the computer user pays a certain amount of money to the
attacker or takes other actions.
Figure 8. Encounter rates for ransomware families by country/region in 2Q16
The location with the highest ransomware encounter rate in 2Q16 was Italy
(0.82 percent), followed by Bulgaria (0.74 percent) and Taiwan (0.67 percent).

14 KEY FINDINGS SUMMARY
Security software use
Recent releases of the MSRT collect and report details about the state of real-
time antimalware software on a computer. Figure 9 shows the percentage of
computers worldwide that the MSRT found to be running up-to-date real-time
security software each quarter in 2H15 and 1H16.
Figure 9. Average monthly percentage of computers reporting security software enabled, 3Q15–2Q16
More than 80 percent of computers reported having real-time security
software enabled during each of the past four quarters, increasing to 88
percent by 2Q16. Much of the increase corresponds to increased adoption
of Windows 10, which comes with Windows Defender installed and
automatically enabled if no other security software is present, replacing
installations of older versions of Windows that did not have this feature.
Protection rates can also vary by operating system, as shown in Figure 10.
0%
10%
20%
30%
40%
50%
60%
70%
80%
90%
100%
3Q15 4Q15 1Q16 2Q16
Perc
ent of
com
pute
rs r
unni
ng th
e M
SRT
repo
rtin
g as
pro
tect
ed

MICROSOFT SECURITY INTELLIGENCE REPORT, VOLUME 21, JANUARY–JUNE 2016 15
Figure 10. Average monthly security software protection state for supported client versions of Windows in 1H16, by quarter
* Includes Windows 8.1
In general, computers running newer versions of Windows tended to
report being unprotected less often than computers running older versions.
The high rate of protection with Windows 10 is primarily because of a
change in the way Windows Defender operates. To provide Windows 10
users with protection from malware out of the box, Windows Defender is
automatically activated upon installation of Windows 10 if no other real-
time security product is installed, as opposed to a few days after installation
in Windows 8 and Windows 8.1.
0%
5%
10%
15%
20%
25%
30%
Windows Vista Windows 7 Windows 8* Windows 10 TH1 Windows 10 TH2
Perc
ent
of co
mp
ute
rs r
ep
ort
ing
as
unp
rote
cted

16 KEY FINDINGS SUMMARY
Malicious websites Phishing sites
Microsoft gathers information about phishing sites and impressions from
phishing impressions tracked by SmartScreen Filter in Microsoft Edge and
Internet Explorer. A phishing impression is a single instance of a user
attempting to visit a known phishing site with SmartScreen Filter enabled and
being warned.
Figure 11. Phishing sites and impressions reported by SmartScreen Filter each month in 1H16, relative to the monthly average for
each
Phishing sites that targeted online services received the largest share of
impressions during the period, and accounted for the largest number of active
phishing URLs.
0%
20%
40%
60%
80%
100%
120%
January February March April May June
Perc
ent
of m
onth
ly a
vera
ge
Sites
Impressions
Average

MICROSOFT SECURITY INTELLIGENCE REPORT, VOLUME 21, JANUARY–JUNE 2016 17
Figure 12. Phishing sites and impressions reported by SmartScreen Filter for each type of phishing site in 1H16
Malware hosting sites
SmartScreen Filter also helps provide protection against sites that are known to
host malware. Figure 13 compares the volume of active malware hosting sites in
the Microsoft database each month with the volume of malware impressions
tracked.
0%
5%
10%
15%
20%
25%
30%
35%
40%
45%
50%
Online Services Financial Sites E-Commerce Social Networking Gaming
Perc
ent
of to
tal im
pre
ssio
ns/
site
s
Sites
Impressions

18 KEY FINDINGS SUMMARY
Figure 13. Malware hosting sites and impressions tracked each month in 1H16, relative to the monthly average for each
Monthly malware impressions more than tripled from January to June due to
several factors, including aggressive campaigns by attackers and improved
detection and classification by SmartScreen Filter. In 2015, the MMPC updated
its malware evaluation criteria to include ads that are deceptive and misleading,
which are now classified as malware by SmartScreen Filter and blocked. Over
the past year, the volume of ads that meet these criteria has increased,
including an emerging subset designed to take advantage of users seeking
technical support.
Drive-by download sites
A drive-by download site is a website that hosts one or more exploits that
target vulnerabilities in web browsers and browser add-ons. Users with
vulnerable computers can be infected with malware simply by visiting such a
website, even without attempting to download anything. Figure 14 shows the
0%
20%
40%
60%
80%
100%
120%
140%
160%
180%
January February March April May June
Perc
ent
of m
onth
ly a
vera
ge
Sites
Impressions
Average

MICROSOFT SECURITY INTELLIGENCE REPORT, VOLUME 21, JANUARY–JUNE 2016 19
concentration of drive-by download pages in countries and regions throughout
the world at the end of 2Q16.
Figure 14. Drive-by download pages indexed by Bing at the end of 2Q16 per 1,000 URLs in each country/region
Significant locations with high concentrations of drive-by download URLs in
both quarters include Taiwan, with 7.4 drive-by URLs for every 1,000 URLs
tracked by Bing at the end of 2Q16; Mongolia, with 3.1; and Iran, with 2.6.
This document summarizes the key findings of the report. Visit
www.microsoft.com/sir to download the full version, which
includes in-depth analysis of the findings summarized here. It
also includes security data and analysis for more than 100
individual countries and regions, along with featured
intelligence reports on a number of important security topics.