microsoft word - dvan smartlines on tradestation - · web viewauthor: dyer kennedy created...
TRANSCRIPT

DVAN SmartLines on TradeStation – User Guide
DVAN SmartLines on TradeStation
This document is intended as an introduction and user guide to the apps available to Divergence Analysis users on TradeStation. For more information, please contact [email protected]
The DVAN SmartLines apps on TradeStation consist of algorithm driven indicators, ShowMe studies, and other customized studies for‐ securities trading and analysis. All apps are applicable to all asset classes, including equities, indices, derivatives/commodities, currencies, and fixed income, and are equally suited to any trading time frame. An overview of each app and various app combinations/packages is provided in the following pages.
Methodology All DVAN SmartLines apps are driven by proprietary algorithms owned and created by Divergence Analysis Inc. Divergence Analysis was founded in 1989 and has operated continuously since then licensing its models to institutional clients around the world. DVAN’s algorithmic process is different from other methodologies because it uses a proprietary velocity algorithm as the driver to its models, rather than prices. DVAN’s methodology measures force in an underlying security using its 25 year process of mass times ‐acceleration (f=ma.)
DVAN SmartLines apps create transparency from this chaotic input data (pictured above), producing timely analysis of markets and a decision oriented framework for trading. DVAN SmartLines’ app studies can be applied to any asset on any time frame to make more ‐precise trading decisions while managing risk. DVAN SmartLines Apps (Apps are designed to be used separately or combined, depending on your specific trading approach)
1) DVAN SmartLines Package (3) 2) DVAN SmartLines 3) DVAN Short Term Cycles 4) DVAN Trending 5) DVAN Velocity Signals 6) DVAN Long Term Bias

DVAN SmartLines on TradeStation – User Guide
7) DVAN Pressure
DVAN SmartLines Package combines 3 separate DVAN apps into one package DVAN SmartLines app overlays price bars and shows buy cycles and sell cycles, support and resistance levels, and points of trend change in the underlying security.
• Green shading indicates a buy cycle • Red shading indicates a sell cycle • The upper and lower boundaries of the SmartLines show support and resistance levels for position management and the
middle line (pivot line) shows the price point at which trend change occurs • In a buy cycle the upper line is the Trend, and the trailing line is the Stop. The Stop line also shows the buy cycle either
contracting or expanding, and leads to the convergence into a sell cycle. • In a sell cycle the lower line is the Trend, and the trailing line is the Stop. The Stop line also shows the sell cycle either
contracting or expanding, and leads to the convergence into a buy cycle. DVAN Short Term Cycle app indicates shorter term trend direction for quicker entry/exit and swing trading‐
Green histogram indicates a positive short term trend‐ Red histogram indicates a negative short term trend‐ The leading line (blue line) shows the leading force and indicates more prominent short term changes when crossing zero‐
DVAN Long Term Bias is a cumulative velocity indicator showing the inflection points where longer term bullish/bearish bias changes in ‐the underlying security. The blue line is the “hedge line” and the green line is the cumulative algo.
• Green above blue indicates a bullish bias • Green below blue indicates a bearish bias
Minute ‐ 60 S&P Daily S&P
Package SmartLines DVAN

DVAN SmartLines on TradeStation – User Guide
DVAN SmartLines
S&P Daily S&P 5 Minute ‐ DVAN SmartLines app overlays price bars and shows buy cycles and sell cycles, support and resistance levels, and points of trend change in the underlying security.
• Green shading indicates a buy cycle • Red shading indicates a sell cycle • The upper and lower boundaries of the SmartLines show support and resistance levels for position
management and the middle line (pivot line) shows the price point at which trend change occurs • In a buy cycle the upper line is the Trend, and the trailing line is the Stop. The Stop line also shows the
buy cycle either contracting or expanding, and leads to the convergence into a sell cycle. • In a sell cycle the lower line is the Trend, and the trailing line is the Stop. The Stop line also shows the
sell cycle either contracting or expanding, and leads to the convergence into a buy cycle.

DVAN SmartLines on TradeStation – User Guide
DVAN Short Term Cycles
S&P Daily S&P 60 Minute ‐ DVAN Short Term Cycle app indicates shorter term trend direction for quicker entry/exit and swing trading‐
Green histogram indicates a positive short term trend‐ Red histogram indicates a negative short term trend‐ The leading line (blue line) shows the leading force and indicates more prominent short term changes ‐
when crossing zero

DVAN SmartLines on TradeStation – User Guide
DVAN Trending
S&P Daily S&P Weekly
DVAN Trending app measures momentum in the underlying security and indicates periods of trending and points of momentum change.
• Green dots on price bars indicate the asset is trending upward and represents a confidence level for position management of long trades, enabling a trader to hold a position longer
• Red dots on price bars indicate the asset is trending downward and represents a confidence level for position management of short trades, enabling a trader to hold a position longer
• A Blue dot shows the bar where a change in momentum from negative to positive occurs
• A Purple dot shows the bar where a change in momentum from positive to negative occurs

DVAN SmartLines on TradeStation – User Guide
DVAN Velocity Signals
S&P Daily S&P 5 Minute ‐DVAN Velocity Signals app is a study driven by DVAN’s proprietary velocity algorithm that shows buy and sell signals in the security. The dots appear on the bar immediately if the condition exists.
• Green dots indicate a buying opportunity • Red dots indicate a selling/shorting opportunity

DVAN SmartLines on TradeStation – User Guide
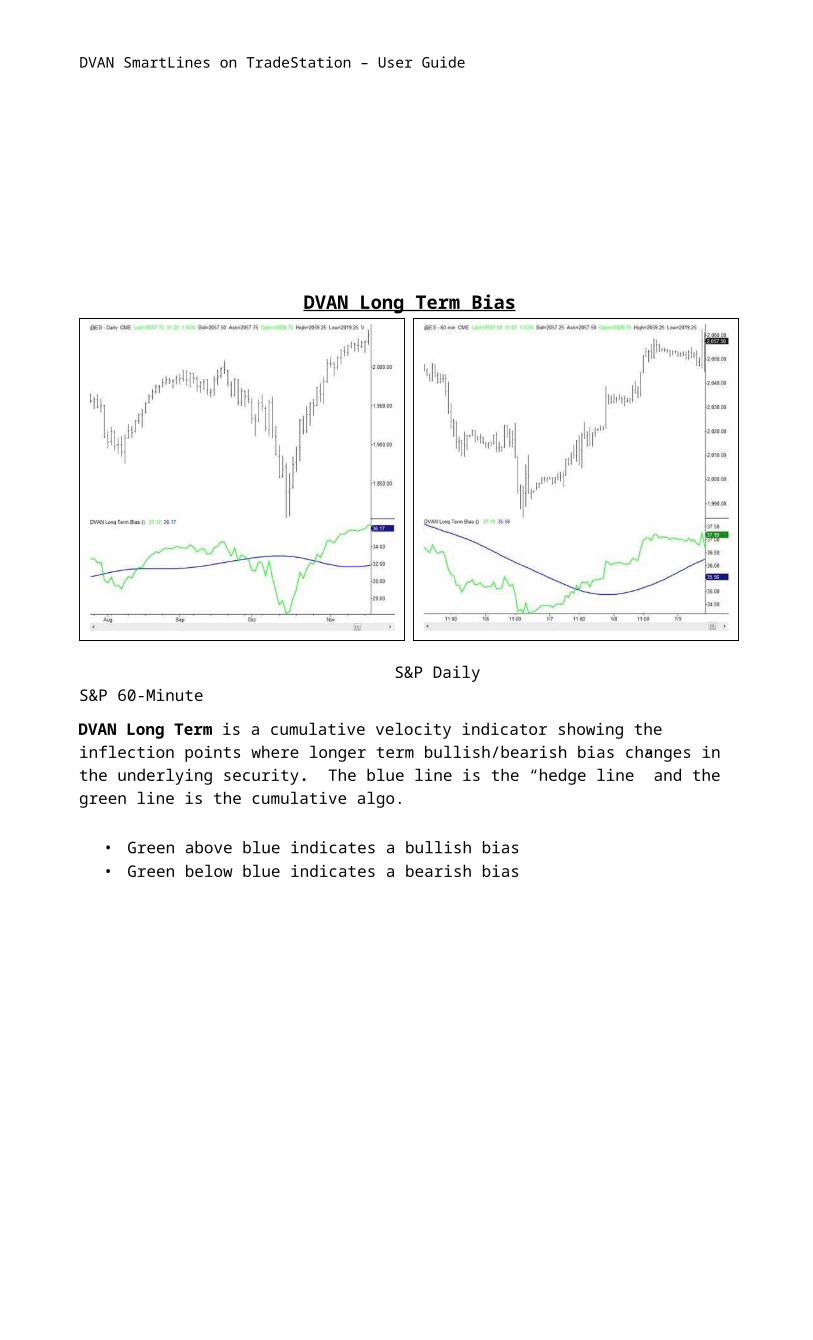
DVAN Long Term Bias
S&P Daily S&P 60 Minute ‐DVAN Long Term is a cumulative velocity indicator showing the inflection points where longer term bullish/bearish bias changes in the underlying security. The blue line is the “hedge line” and the green line is the cumulative algo.
• Green above blue indicates a bullish bias • Green below blue indicates a bearish bias
DVAN SmartLines on TradeStation – User Guide
DVAN Pressure
S&P Daily S&P 5 Minute ‐
DVAN Pressure colors the price bar green or red to indicate buying or selling pressure dominance in the underlying security. This is very useful at tops and bottoms of buy or sell cycles, to see when buyers turn to sellers and sellers turn to buyers.
• Green price bars mean buying pressure is dominant • Red price bar mean selling pressure is dominant

DVAN SmartLines on TradeStation – User Guide
Risk Disclosures
Risks of Trading Day trading generally is not appropriate for someone of limited resources and limited investment or trading experience and low risk tolerance. Day trading requires in-depth knowledge of the securities markets and trading techniques and strategies. Divergence Analysis Inc or its products make no actual projections of performance or state, and do not suggest or imply that past performance (simulated or actual) is indicative of future results.
Hypothetical Results and Systems There are risks associated with utilizing a trading system including, but not limited to, the failure of hardware, software, and internet connection, and the malfunction of algorithms or code driving an indicator-based strategy. The information provided herein and made available on the TradeStation TradingApp Store via Divergence Analysis Inc should only be used by investors who are aware of the risks inherent in securities trading. TradeStation and Divergence Analysis Inc accept no liability for loss arising from the use of its products or the information provided therein.