microstructural characterization of aluminum-lithium alloys … · below-20°c.a potentialof 12+iv...
TRANSCRIPT
NASA / CR-1998-206914
Microstructural Characterization of
Aluminum-Lithium Alloys 1.460 and 2195
Z. M. Wang and R. N. Shenoy
Analytical Services & Materials, Inc., Hampton, Virginia
National Aeronautics and
Space Administration
Langley Research Center
Hampton, Virginia 23681-2199
February 1998
Prepared for Langley Research Centerunder Contract NAS1-96014
https://ntrs.nasa.gov/search.jsp?R=19980017087 2018-12-05T09:09:28+00:00Z
Available from the following:
NASA Center for AeroSpace Information (CASI)
800 Elkridge Landing Road
Linthicum Heights, MD 21090-2934
(301) 621-0390
National Technical Information Service (NTIS)
5285 Port Royal Road
Springfield, VA 22161-2171
(703) 487-4650

TABLE OF CONTENTS
Table of Contents
List of Tables
List of Figures
Abstract
1. Introduction
2. Experimental Procedure
3. Results and Discussion
3.1 TEM Evaluation
3.1.1 Alloys 1460 and 2090
3.1.2 Alloy 2195
3.2 DSC Evaluation
3.2.1 Alloys 1460 and 2090
a. Identification of the _5'endotherm
b. Volume fraction of _5'
c. Effects of aging time on _i' in alloy 1460
d. Kinetics of 5' dissolution in alloy 1460
3.2.2 Alloy 2195
3.3 Overview of strength and toughness of alloys 1460 and 2195
3.3.1 Alloy 1460
3.3.2 Alloy 2195
4. Summary
Acknowledgments
References
111
iv
V
1
2
3
4
4
4
6
6
7
7
7
8
9
10
11
11
12
12
13
13
i
iii

LIST OF TABLES
Table No.
Table I
Table 2
Table 3
Table 4
Caption Page
Room temperature fracture toughness and yield strength of near-net- 3
shape extruded A1-Li panels.
Chemical compositions of alloys 2090, 1460 and 2195 (wt%). 3
Heat treatment conditions for TEM samples of alloys 2090, 1460 3
and 2195.
Descriptions of various phases in A1-Li-Cu alloys. 5
iv
Figure No.
Figure I
Figure 2
Figure 3.1
Figure 3.2
Figure 3.3
Figure 4
Figure 5
Figure 6
Figure 7
Figure 8
Figure 9
LIST OF FIGURES
Caption
TEM micrographs illustrating grain morphology and orientation
relative to short and long transverse directions (extrusion direction
is normal to micrograph), aged for 20h at 160°C. (a) 1460; (b)2090.
SAD patterns, [001], [101]
contributions of 6', T1, 0' and
160°C. (a)1460; (b)2090.
and [112] zone axes; showing
_2 precipitates, aged for 20h at
Schematic of SAD patterns from major zone axes in A1-Li-Cu
alloys: (a) The A1 matrix; (b) The A1 matrix plus L12 precipitates.
Schematic of SAD patterns from major zone axes in A1-Li-Cu
alloys: (c) The Al-matrix plus 0' precipitate; (d) The Al-matrix plus
T1 precipitate.
Schematic of SAD patterns from major zone axes in A1-Li-Cu
alloys: (e) The Al-matrix plus £2 precipitate; (f) The Al-matrix plus
S' precipitate.
_'-CDF images from (100) superlattice spots, aged for 20h at
160°C. (a) 1460; (b) 2090.
T1 - CDF images of alloys (a) 1460 and (b) 2090 with g=[-111]
close to B=[101], illustrating the particle size distribution and
number density of one variant of T1 after aging for 20h at 160°C.
TEM micrographs illustrating grain morphology and orientation
relative to short and long transverse directions (extrusion direction
is normal to micrograph), 2195, aged for 15h at 149°C.
SAD patterns, [001], [101] and [112] zone axes of alloy 2195, agedfor 15h at 149°C.
TEM images showing distribution of T1 precipitates within the
matrix, and on a subgrain boundary in alloy 2195, aged for 15h at
149°C. (a) BF; (b) T1 - CDF
DSC signatures of alloys 1460 (aged for 24 h at 160°C) and 2090
aged for 30 h at 160°C), at 20°C/min scanning rate.
V
Page
16
17
18
19
20
21
22
23
24
25
26
Figure 10 27
Figure 11
Figure 12
Figure 13
Figure 14
Figure 15
Figure 16
Figure 17
Figure 18
Figure 19
Figure 20
_5' - CDF images of samples DSC scanned up to 245°C and liquid
N2 quenched. (a) 1460, initially aged for 24h at 160°C; (b) 2090,
initially aged for 30h at 160°C.
Area under the curve and peak temperature of 5' dissolution
endotherm in alloy 1460, as a function of time at 160°C.
Kissinger plot for 5' dissolution in alloy 1460, aged for 24h at
160°C.
DSC signature of alloy 2195, aged for 20h at 149°C, at 20°C/min
scanning rate.
TEM micrographs of 2195, initially aged for 20 h at 149 °C, DSC
scanned up to 210°C and liquid N2 quenched. (a) T1 -CDF; (b) 0' -
CDF.
TEM BF images of 2195, aged for 15h at 149°C, DSC scanned up
to 300°C and liquid Ne quenched. (a) g=[-111], near B=[101]; (b)
B=[101].
[001], [101] and [112] SAD patterns of alloy 2195, aged for 15 h at
149°C. Quenched in liquid N2 after DSC scans up to: (a) 210°C;
(b) 230°C; (c) 300°C.
5" - CDF image of a thin foil from a fractured tensile sample of
alloy 1460, aged for 20h at 160°C. The double arrow indicates the
direction of tensile stress c_.
Weak-beam dark-field image of a thin foil from a fractured tensile
sample of alloy 1460, aged for 20h at 160°C.
T1 - CDF image of a thin foil from a fractured tensile sample of
alloy 1460, aged for 20h at 160°C. T1 plates at the boundary are
bent and a few small T1 plates near the boundary are sheared by
dislocations (indicated by arrowheads). The double arrow indicates
the direction of tensile stress c.
TEM micrographs of alloy 1460, aged for 20h at 160°C, illustrating
_5"/A13Sc composite particles (indicated by arrowheads) pinning a
grain boundary. (a)BF (b) _i'- CDF.
28
29
3O
31
32
33
34
35
36
37
vi
Microstructural Characterization of Aluminum-Lithium
Alloys 1460 and 2195 *
Z.M. Wang and R.N. Shenoy
Analytical Services & Materials, Inc., 107 Research Dr., Hampton, VA 23666
Abstract
Transmission electron microscopy (TEM) and differential scanning calorimetry
(DSC) techniques were employed to characterize the precipitate distributions in lithium-
containing aluminum alloys 1460 and 2195 in the T8 condition. TEM examinations
revealed _i' and T1 as the primary strengthening precipitates in alloys 1460 and 2195
respectively. TEM results showed a close similarity of the Russian alloy 1460 to the U.S.
alloy 2090, which has a similar composition and heat treatment schedule. DSC analyses
also indicate a comparable 8' volume fraction. TEM study of a fractured tensile sample of
alloy 1460 showed that 5' precipitates are sheared by dislocations during plastic
deformation and that intense stress fields arise at grain boundaries due to planar slip.
Differences in fracture toughness of alloys 1460 and 2195 are rationalized on the basis of
a literature review and observations from the present study.
* This work was performed under contract with NASA Langley Research Center
(contract No.: NAS 1-96014).

1.Introduction
Aluminum-Lithium alloys 1460 and 2195 have beneficial combinationsof high
strengthand low densityand arebeing consideredfor cryogenictank applicationson
future launchvehicles.Theimprovedspecificpropertiesof thesealloyswith respectto
more conventionalmaterialssuch as alloy 2219 offer the potential for considerable
vehicle weight reduction.Cryogenictanks are typically integrally stiffened structures
produced by costly machining operationsfrom plate. Recently, there has been
considerable interest in the use of near-net-shapeextrusions as an economical
replacementfor machinedplates.Structure-propertystudiesof candidatealloys in these
productforms areneededfor designevaluations.
In the presentinvestigation,theskin portionsof the integrallystiffenedextrusionsof
the alloys 1460 and 2195 have been evaluated in the T8 condition (artificial aging after
3% stretching). Alloy 1460, especially in the T8 temper, exhibits much lower levels of
toughness and yield strength as compared to alloy 2195. Alloy 1460 is very similar to the
well-studied alloy 2090 [ 1,2,3,4] in both mechanical behavior and chemical composition
(Table 1) except for a minor alloy addition of Sc to alloy 1460. In view of this, a
microstructural characterization of alloy 2090 (artificial aging after 6% stretching) was
included for comparison. Fracture toughness and yield strength data for the three alloys
are listed in Table 2 [5].
Sc in alloy 1460 increases the number density of 5' precipitates and improves the
uniformity of their distribution [6]. Also, Sc has been claimed [7,8] to be very effective in
improving the mechanical properties of Al alloys through precipitation of A13Sc (L12)
phase [9]. The Al3Sc dispersion of fine spherical particles increases strength, strongly
stabilizes the substructure, and inhibits recrystallization [10, 11, 12].
The aim of the present work is to describe the type, distribution and precipitation
sequences of the strengthening phases in these alloys by TEM and DSC analyses; and to
2
apply this understandingto the interpretationof fracturetoughnesscharacteristics.The
strengtheningmechanismsin the alloys will be discussedin relation to the existing
literatureaswell astheresultsfromthepresentstudy.
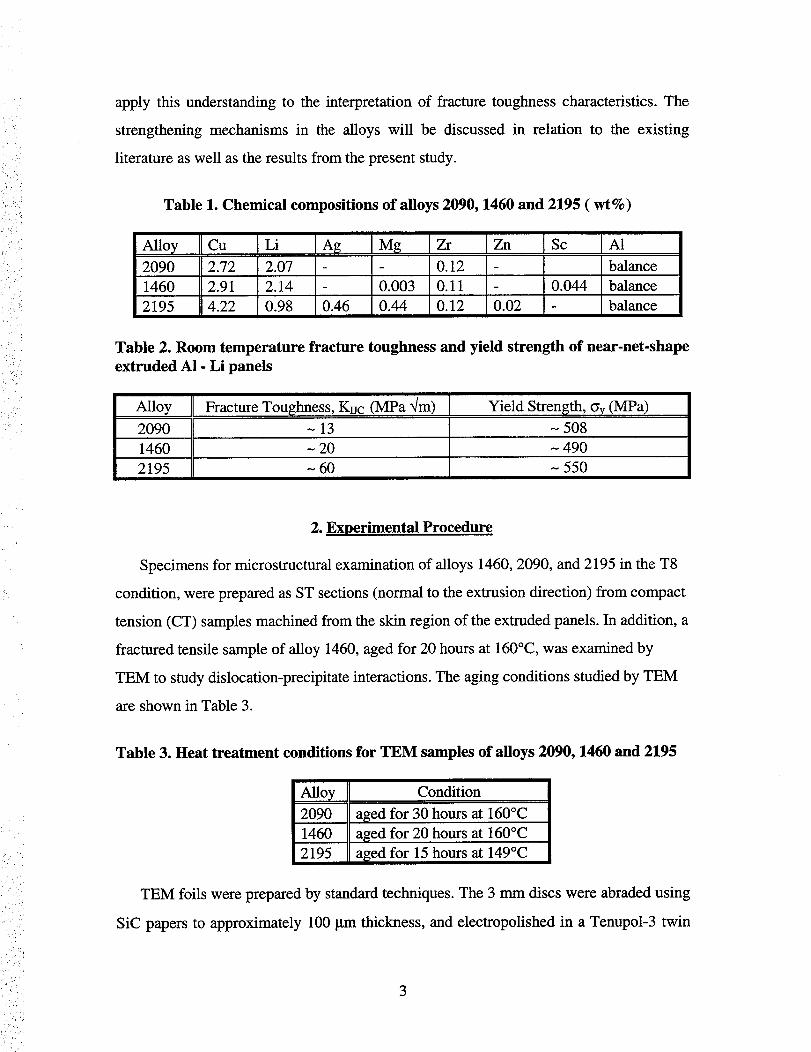
Table 1. Chemical compositions of alloys 2090, 1460 and 2195 (wt%)
I Cu I Li Ag Mg Zr Zn Sc AlAlloy
2090 2.72 2.07 - - 0.12 - balance
1460 2.91 2.14 - 0.003 0.11 - 0.044 balance
2195 4.22 0.98 0.46 0.44 0.12 0.02 balance
Table 2. Room temperature fracture toughness and yield strength of near-net-shape
extruded AI - Li panels
Alloy Fracture Toughness, KIJC (MPa "4m) Yield Strength, cry (MPa)
2090 ~ 13 - 508
1460 - 20 - 490
2195 - 60 - 550
i!i_
:, i,;ii_:_
,i _ ,,
2. Experimental Procedure
Specimens for microstructural examination of alloys 1460, 2090, and 2195 in the T8
condition, were prepared as ST sections (normal to the extrusion direction) from compact
tension (CT) samples machined from the skin region of the extruded panels. In addition, a
fractured tensile sample of alloy 1460, aged for 20 hours at 160°C, was examined by
TEM to study dislocation-precipitate interactions. The aging conditions studied by TEM
are shown in Table 3.
Table 3. Heat treatment conditions for TEM samples of alloys 2090, 1460 and 2195
AHoyII2090
1460
2195
Condition
aged for 30 hours at 160°C
aged for 20 hours at 160°C
aged for 15 hours _ 149°C
TEM foils were prepared by standard techniques. The 3 mm discs were abraded using
SiC papers to approximately 100 gm thickness, and electropolished in a Tenupol-3 twin
3

jet electropolisherwith a 3:1 methanol:nitricacid electrolytecooled to a temperature
below-20°C.A potentialof 12+IV was used. All foils were examined in a Philips EM-
420T transmission electron microscope. The 8' and T1 precipitates were examined using
centered dark-field (CDF) imaging from (100) superlattice reflections for 5' and
reflections intermediate to multiples of Al (111) reflections for T1.
DSC analyses were performed on the alloy samples (- 4.5 mm square, 1.5 mm thick
and weighing -80 mg ) in flowing dry N2, using a Thermal Analysis Instruments 2910
apparatus. Alloy conditions for DSC analyses were as follows: alloy 2090 (aged at 160°C
for 30 hours); alloy 1460 (aged at 160°C for 16, 20, and 24 hours); and alloy 2195 (aged
at 149°C for 10, 15, and 20 hours). Scanning rates of 5, 10, and 20°C/rain were employed
to examine the kinetics of phase transitions.
3. Results and Discussion
Experimental results from the current study are presented, discussed and compared
with previously reported results from the open literature in the following pages. Section
3.1 presents a TEM study of the microstructure and precipitate phases of alloys 1460,
2090 and 2195. Section 3.2 pertains to DSC characterization to define microstructural
evolution with aging. Section 3.3 provides a discussion of the toughness behavior of
alloys 1460 and 2195 in relation to the microstructural evolution and the influence of
precipitate types on the deformation modes.
3.1. TEM Evaluation
3.1.1. Alloys 1460 and 2090
Figures 1 (a) and (b) are low magnification bright field (BF) images of the alloys
1460 and 2090, showing grain shapes and their relative orientation with respect to the
short (S) and long transverse (L) directions. Both alloys have comparable grain sizes and
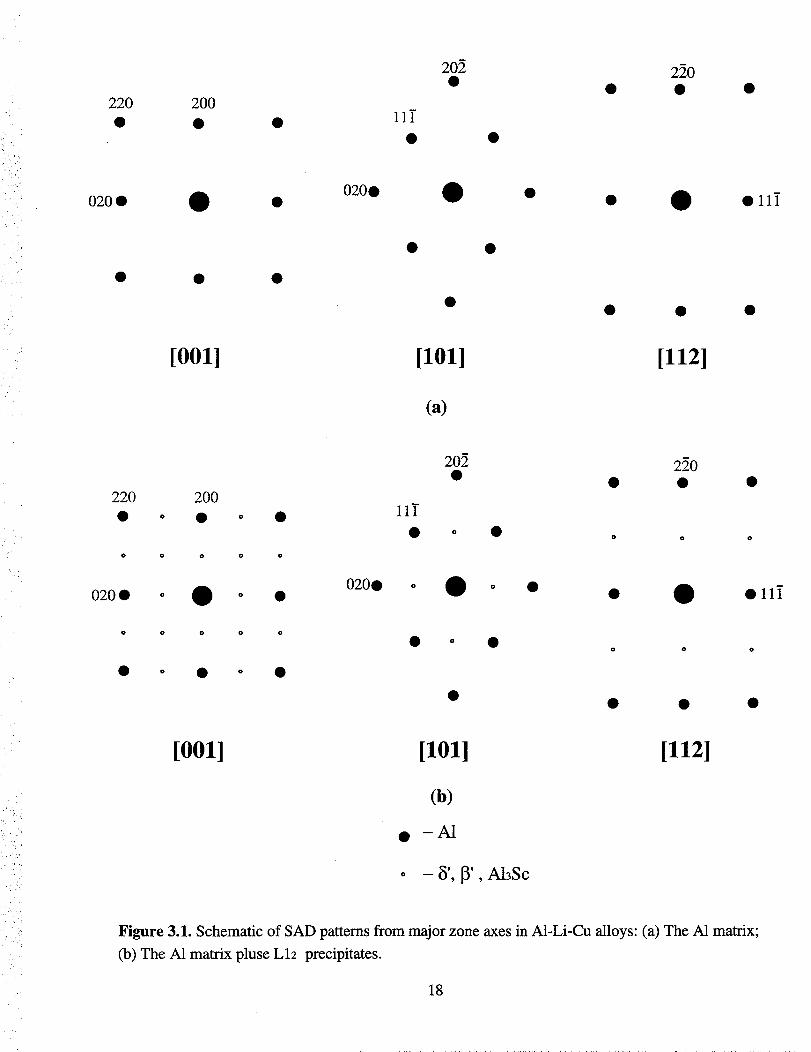
primarily unrecrystaUized grain structures. The selected area diffraction (SAD) patterns
for [001], [101] and [112] zone axes, shown in Figure 2, reveal the presence of 5' (Al3Li),
4
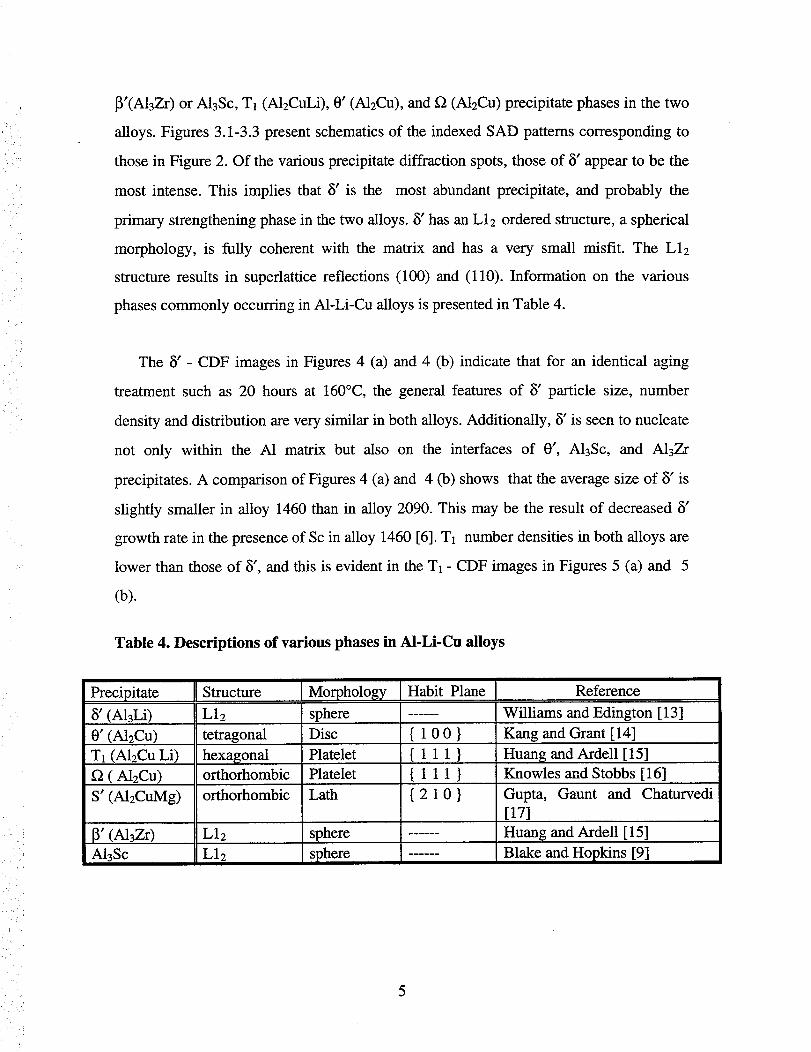
_'(A13Zr)or A13Sc,T1(A12CuLi),0' (A12Cu), and f_ (A12Cu) precipitate phases in the two
alloys. Figures 3.1-3.3 present schematics of the indexed SAD patterns corresponding to
those in Figure 2. Of the various precipitate diffraction spots, those of 5' appear to be the
most intense. This implies that 5' is the most abundant precipitate, and probably the
primary strengthening phase in the two alloys. 5' has an L12 ordered structure, a spherical
morphology, is fully coherent with the matrix and has a very small misfit. The L12
structure results in supeflattice reflections (100) and (110). Information on the various
phases commonly occurring in A1-Li-Cu alloys is presented in Table 4.
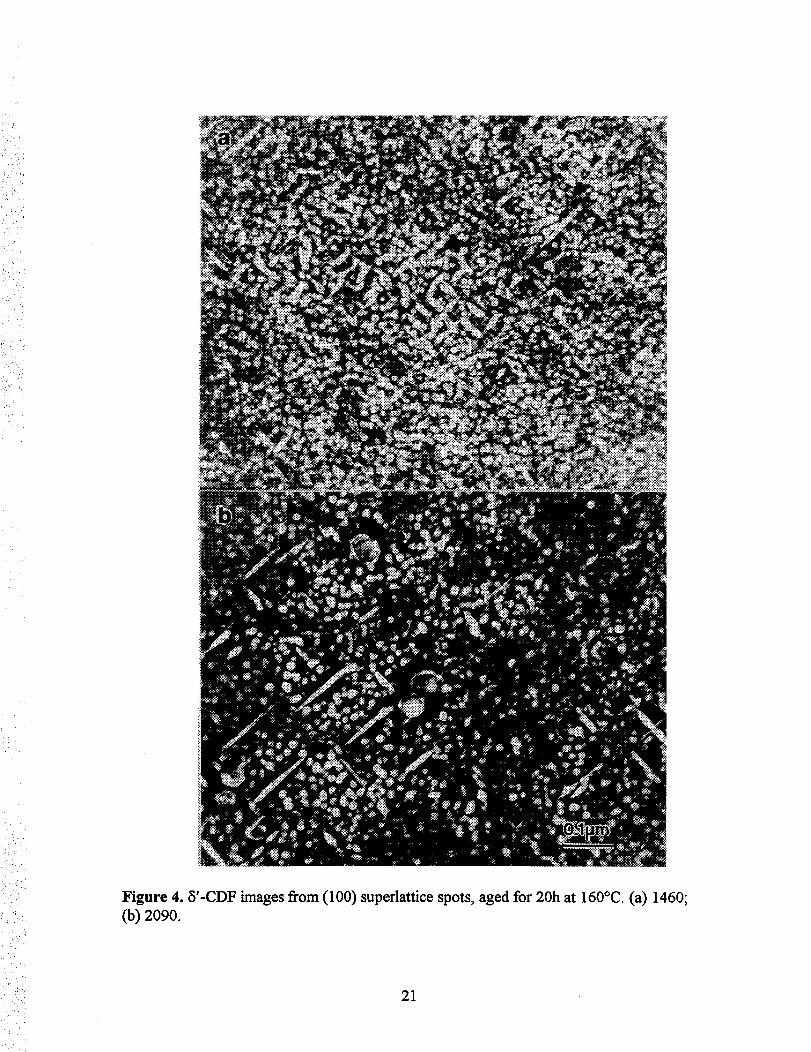
The 5' - CDF images in Figures 4 (a) and 4 (b) indicate that for an identical aging
treatment such as 20 hours at 160°C, the general features of 5' particle size, number
density and distribution are very similar in both alloys. Additionally, 5' is seen to nucleate
not only within the A1 matrix but also on the interfaces of 0', A13Sc, and A13Zr
precipitates. A comparison of Figures 4 (a) and 4 (b) shows that the average size of 5' is
slightly smaller in alloy 1460 than in alloy 2090. This may be the result of decreased 5'
growth rate in the presence of Sc in alloy 1460 [6]. T1 number densities in both alloys are
lower than those of 5', and this is evident in the T1 - CDF images in Figures 5 (a) and 5
(b).
Table 4. Descriptions of various phases in AI-Li-Cu alloys
Precipitate Structure
5' (AlaLi)
0' (A12Cu)T1 (A12Cu Li)
(A12Cu)
S' (A12CuMg)
(AhZr)A138c
L12
tetragonal
hexagonalorthorhombic
orthorhombic
L12
L12
Morphology
sphere
Disc
Platelet
Platelet
Lath
sphere
sphere
Habit Plane
{100}
(111}
{111}
{210}
Reference
Williams and Edington [13]
Kang and Grant [14]
Huang and Ardell [15]
Knowles and Stobbs [16]
Gupta, Gaunt and Chaturvedi
[17]
Huang and Ardell [ 15]
Blake and Hopkins [9]

3.1.2Alloy 2195
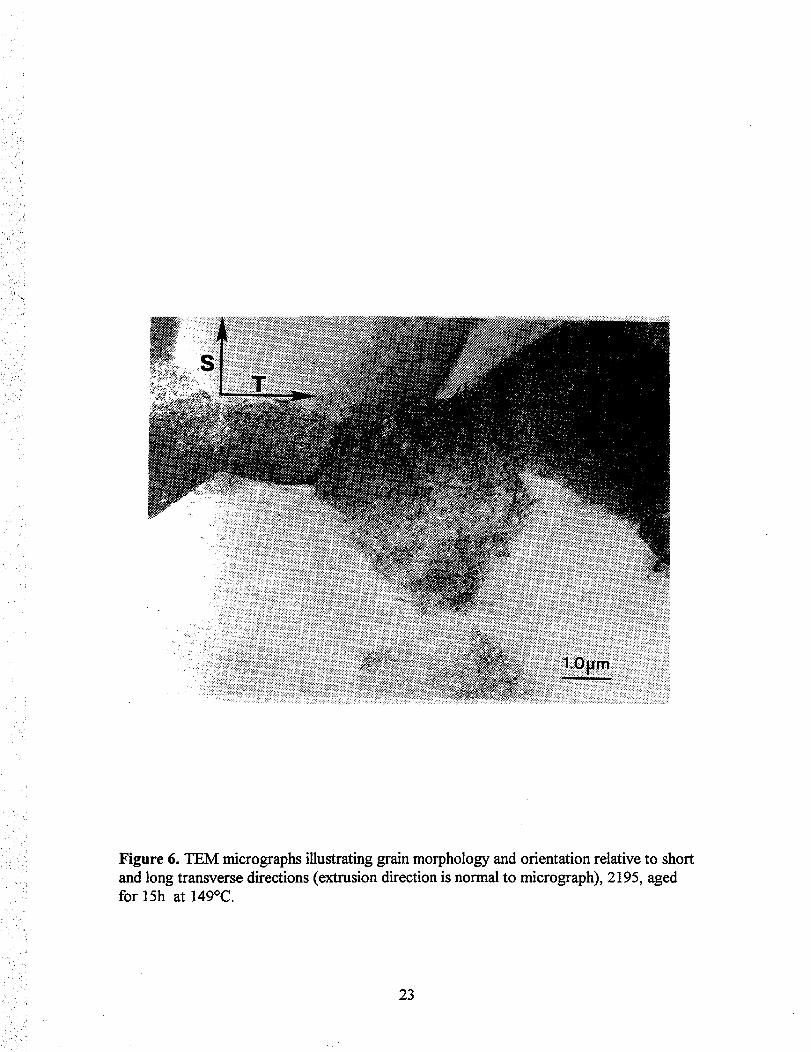
Figure 6 is a low magnification BF image of alloy 2195 where a primarily
unrecrystallized grain structure is observed. It is apparent that the average grain/subgrain
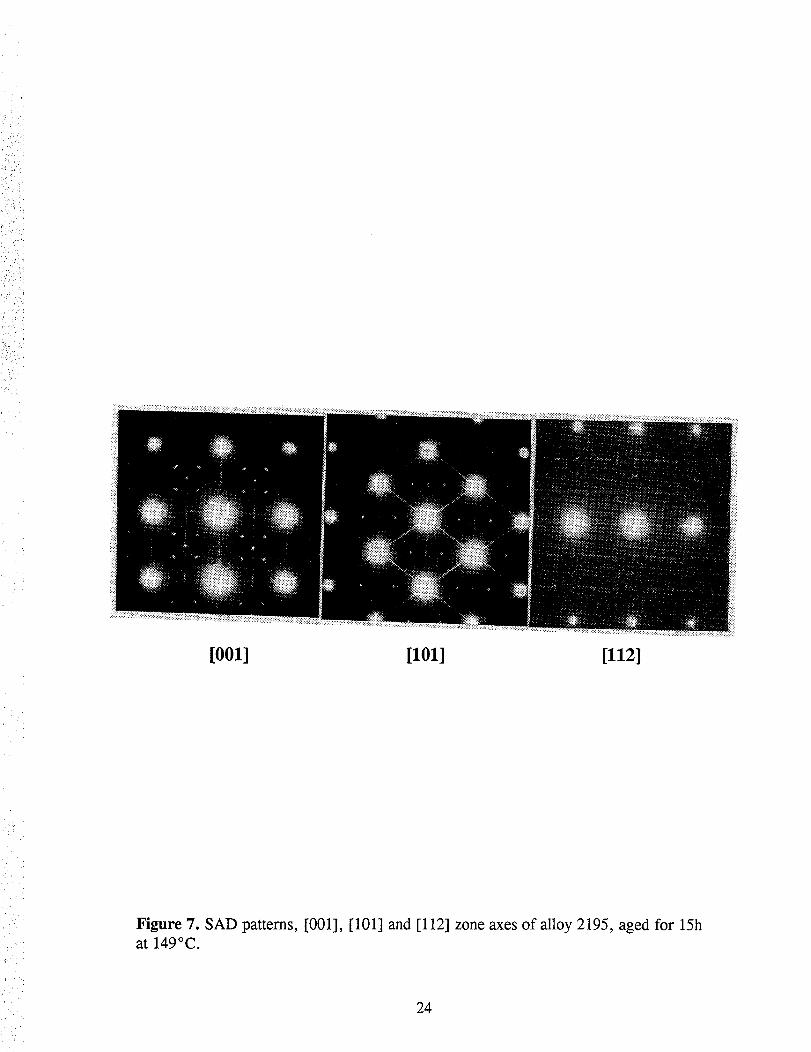
size is larger in 2195 than in the other alloys (see Figures 1 (a) and 1 (b)). The [100],
[101] and [112] SAD patterns shown in Figure 7 clearly reveal the presence of 8'(A13Li),
_'(A13Zr), T1 (AI2CuLi) and 0' (A12Cu) phases, and the possible presence of f2 (A12Cu)
and S' (A12CuMg) phases. Schematics of the indexed SAD patterns indicating the
presence of the above phases were shown in Figures 3.1-3.3. T1 is the predominant
precipitate phase and produces the strongest reflection spots or streaks (Figure 7).
According to previous work [18,19], T1 has a hexagonal crystal structure with an
orientation relationship of (0001)T1 II {111}_ and <1010>T1 II <ll0>_a and a platelet
morphology. There are four variants of the T1 phase which produce four spots in the [001]
zone SAD pattern at 1/2[110], 3/2[110], 1/2[-110], and 3/2 [-110]. In the [101] zone
SAD pattern, two variants of T1 are inclined to the zone axis and produce spots at
1/31220] and 2/3[220]; the other two variants are parallel to the zone axis and produce
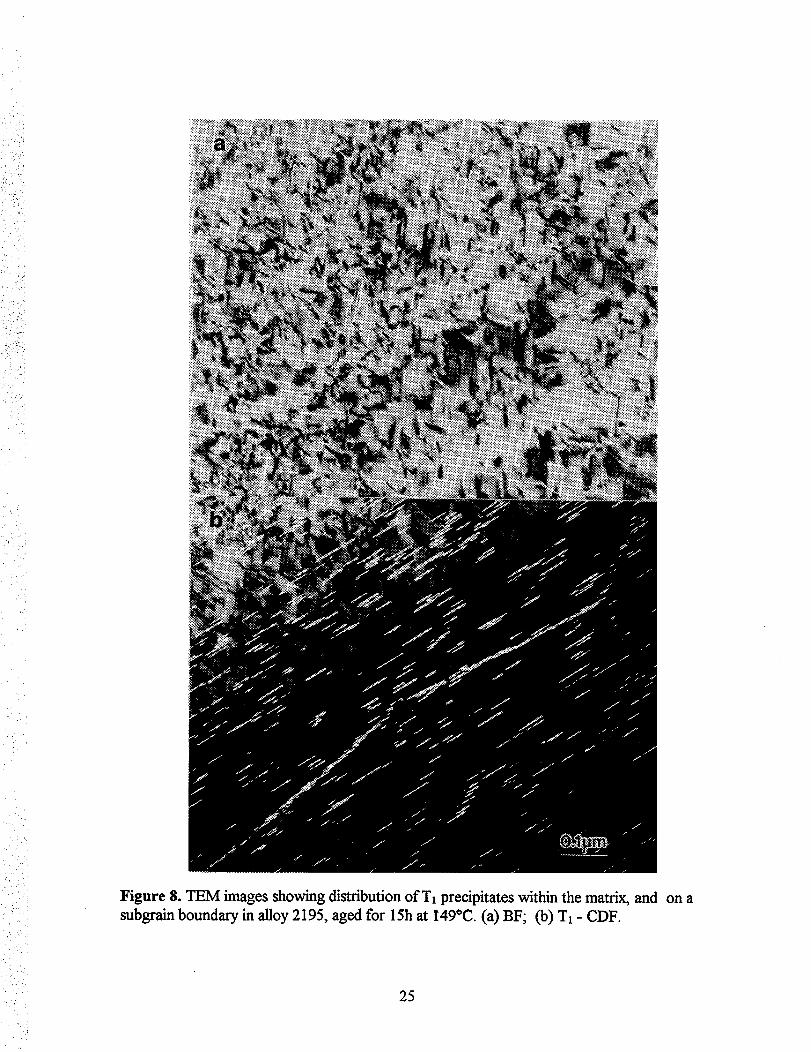
streaks along the [111] direction. Figures 8 (a) and 8 (b) are BF and CDF images showing
a uniform distribution of T1 within the A1 matrix. Precipitation of T1 on a sub-boundary
can also be seen. It is also apparent that TI is finer in alloy 2195 than in alloys 1460 or
2090 (see Figure 5). The [001] SAD pattern in Figure 7 showing streaking along the
[200] direction reveals the presence of only one variant of 0", which is indicative of
strong texturing in the extruded product form [26].
3.2. DSC Evaluation
Differential scanning calorimetry (DSC) is a widely used thermoanalytical tool for
microstructural characterization of age hardenable aluminum alloys [20]. The scope of DSC
pertinent to the present study includes correlation of microstructural evolution with heat
treatment practices; quantitation of precipitate volume fraction and particle size; and
analyses of precipitation and dissolution reaction kinetics. The use of DSC, in conjunction
6
: :i/i?!
)
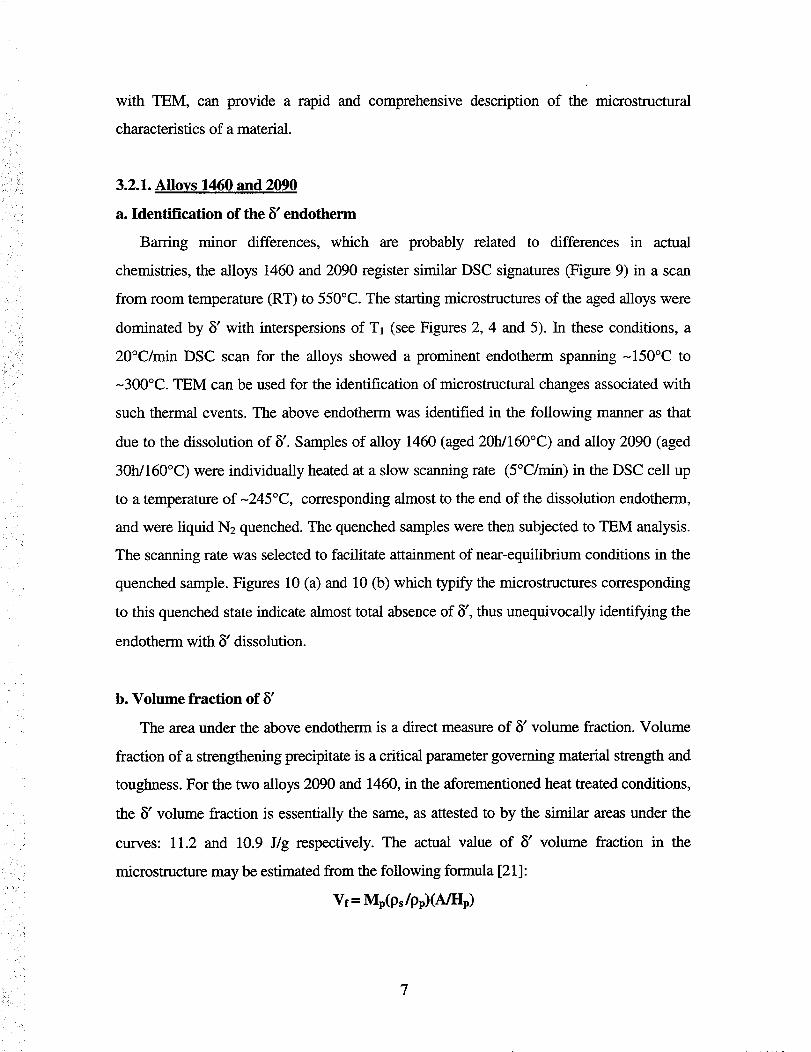
with TEM, can provide a rapid and comprehensive description of the microstructural
characteristics of a material.
3.2.1. Alloys 1460 and 2090
a. Identification of the 5' endotherm
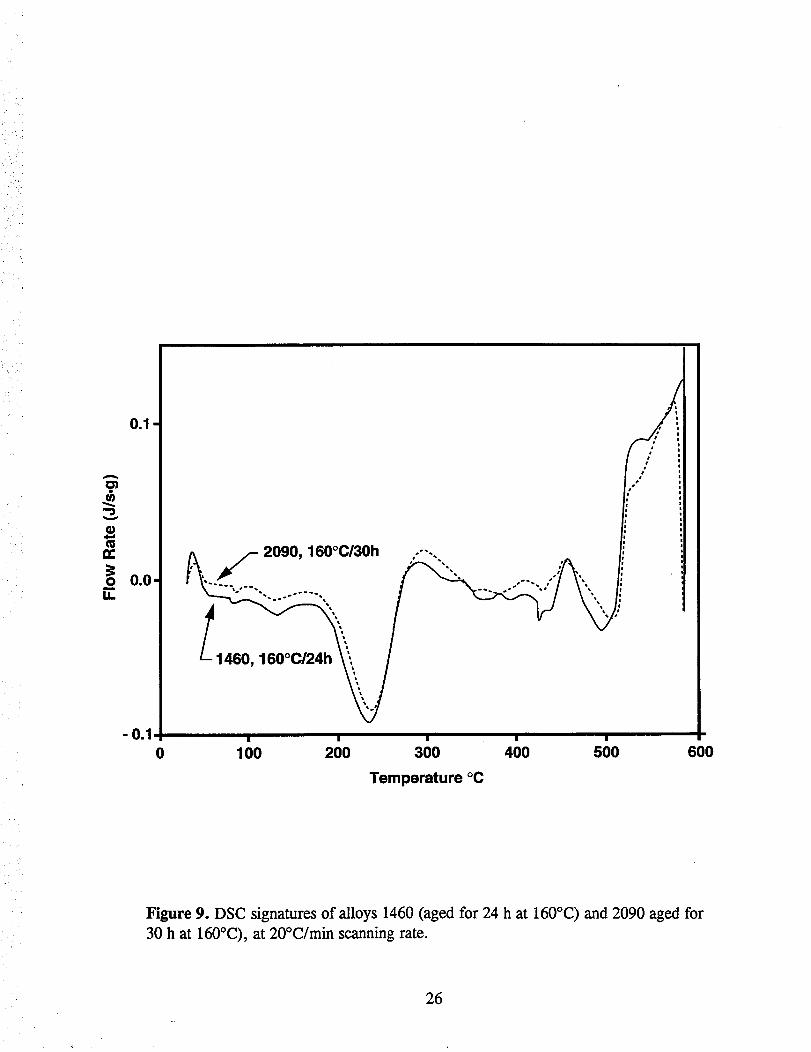
Barring minor differences, which are probably related to differences in actual
chemistries, the alloys 1460 and 2090 register similar DSC signatures (Figure 9) in a scan
from room temperature (RT) to 550°C. The starting microstructures of the aged alloys were
dominated by 5' with interspersions of T1 (see Figures 2, 4 and 5). In these conditions, a
20°C/min DSC scan for the alloys showed a prominent endotherm spanning -150°C to
-300°C. TEM can be used for the identification of microstructural changes associated with
such thermal events. The above endotherm was identified in the following manner as that
due to the dissolution of 5'. Samples of alloy 1460 (aged 20h/1600C) and alloy 2090 (aged
30h/160°C) were individually heated at a slow scanning rate (5°C/rain) in the DSC cell up
to a temperature of -245°C, corresponding almost to the end of the dissolution endotherm,
and were liquid N2 quenched. The quenched samples were then subjected to TEM analysis.
The scanning rate was selected to facilitate attainment of near-equilibrium conditions in the
quenched sample. Figures 10 (a) and 10 (b) which typify the microstructures corresponding
to this quenched state indicate almost total absence of _', thus unequivocally identifying the
endotherm with 5" dissolution.
• i
':, j
b. Volume fraction of 5'
The area under the above endotherm is a direct measure of _5' volume fraction. Volume
fraction of a strengthening precipitate is a critical parameter governing material strength and
toughness. For the two alloys 2090 and 1460, in the aforementioned heat treated conditions,
the 5' volume fraction is essentially the same, as attested to by the similar areas under the
curves: 11.2 and 10.9 J/g respectively. The actual value of 5' volume fraction in the
microstructure may be estimated from the following formula [21]:
Vf = Mp(Ps/pp)(A]Hp)
Where Vf= volume fraction of _5'; Nip = gram molecular weight of _5'; Ps and pp are densities
of alloy and _5' respectively [g/cm3]; A = area under the curve, [J/g]; Hp = molar enthalpy of
5' dissolution, [J].
For a sample calculation, substituting values such as, Mp = 87.885 g/mol; Ps = 2.7 to
2.8 g/cm3; pp = 2.26 g/cm3; A= '11.2 J/g; and Hp = 11.3 kJ/mol [22], to the above equation
gives Vf= 10.6 + 0.2%. Furthermore, a mass balance calculation indicates that if all the Li
in the alloy forms 8', Vf = 31.3%. This clearly implies that Li in excess of that necessary to
form 10.6% 5' in the alloy, is available for forming a mixture of Li-rich solid solution and
T1 precipitate. Such calculations provide volume fraction estimations of precipitates, and
thus provide a check on the accuracy of any subsequent TEM quantitative analyses of these
phases. For example, TEM quantitative analysis of 5' volume fraction in the present study
yields Vf of 7.2% for alloy 2090 and 7.9% for alloy 1460, values which are slightly lower
than the DSC-derived value of 10.6%. The lower estimates from TEM analysis stem from
the fact that the overlapping 5' particles in the foil samples are difficult to account for.
Similar TEM estimation errors have been reported earlier for alloy 8090 [23].
c. Effects of aging time on 5' in alloy 1460
Figure 11 shows the effects of aging time at 160°C on the area under the curve and the
peak temperature of the _5' endotherm. The peak temperature corresponds to the maximum
reaction rate, and is a sensitive measure of average precipitate size. The coarser the 5'
resulting from a given aging treatment, the higher the peak temperature.
Little differences exist in volume fraction and average _5' precipitate size for the aging
times of 16 and 20 hours. For example, while the start and end temperatures of the _5'
endotherm for both 16 and 20 hours aging conditions are 157°C and 262°C, respectively,
the peak temperatures are 228°C and 229°C. Concomitantly, volume fraction (as measured
by area under the _5' endotherm) is essentially constant at 10.9 J/g. The start temperature of
the endotherm corresponds to the dissolution of very fine _5' precipitates; and the end
8
temperatureto the coarse5'. Theabovevaluesof start,peak,andendtemperaturesimply
the size distribution of 5' precipitatesis substantiallyunalteredwhile the aging time is
increasedfrom 16 hoursto 20 hours.For the 24 hoursagingcondition,however,there
appearsto be measurablecoarseningof 5' without a changein volumefraction. This is
indicatedby start, peak, and end temperaturesrising to 163°C,234.2°C,and 266°C
respectively,with thevolumefractionstayingconstantwith theareaunderthe5"endotherm
=10.9 J/g.The 5' coarseningduring the progressionof aging from 20 to 24 hours thus
representsOstwaldripening.
Theaboveanalysisof the effects of aging time on particle size and volume fraction of 5'
indicates that optimum strengthening should occur during 16 to 20 hours of aging at 160°C.
Aging for longer times is expected to lead to appreciable 5' coarsening and consequent
property degradation.
d. Kinetics of 5' dissolution in alloy 1460
In view of almost one-to-one correspondence between the DSC traces for the aging
conditions of 24h at 160°C for 1460 and 30h at 160°C for 2090 (see Figure 9), it was
deemed appropriate to gather kinetics information on the 5' dissolution for only one of the
alloys, namely 1460. Dependence of the 5' endothermic peak temperature on the imposed
heating rate in the DSC was documented for three different scanning rates: 5,10, and
20°C/rain. Figure 12 is a Kissinger plot [24] of In (TreE/_) versus 1/Tm, where Tm = peak
temperature [K] and d_ = heating rate [°C/s ]. The slope of the straight line in this plot is a
measure of activation energy for 5' dissolution (122.6 kJ/mol); and the intercept is a
measure of the rate constant of the reaction (8.33 × 10¹⁰ s-l). The activation energy for a
diffusion process involving migration of solute (such as Li or Cu) between the precipitate
and the matrix can often be described by the empirical activation energy obtained from
Kissinger plots, e.g. in Figure 12.
9

3.2.2.Alloy 2195
Figure 13 is a DSC thermogram of alloy 2195 (aged at 149°C for 20 hours) scanned at
20°C/min up to 400°C. The precipitation and dissolution reactions important for alloy
temper, thermal stability and precipitate distribution considerations in aluminum alloys
occur in the RT-350°C range [25]. In Figure 13, there is an endotherm spanning ~ 150 to
-250°C; an exotherm in the -250 to 290°C range; and an exotherm in the 290 to - 330°C.
Three samples of alloy 2195 (aged 149°C/20hrs) were individually DSC scanned to
temperatures of 210, 230, and 300°C; liquid N2 quenched, and subsequently analyzed in
TEM. These temperatures in the 5°C/min scan correspond to the endotherm and the two
exotherms occurring in the 150 to 290°C range in a 20°C/rain scan (see Figure 13). Figure
14 (a) and (b) are CDF micrographs of the 210°C quenched sample; Figure 15 (a) and (b)
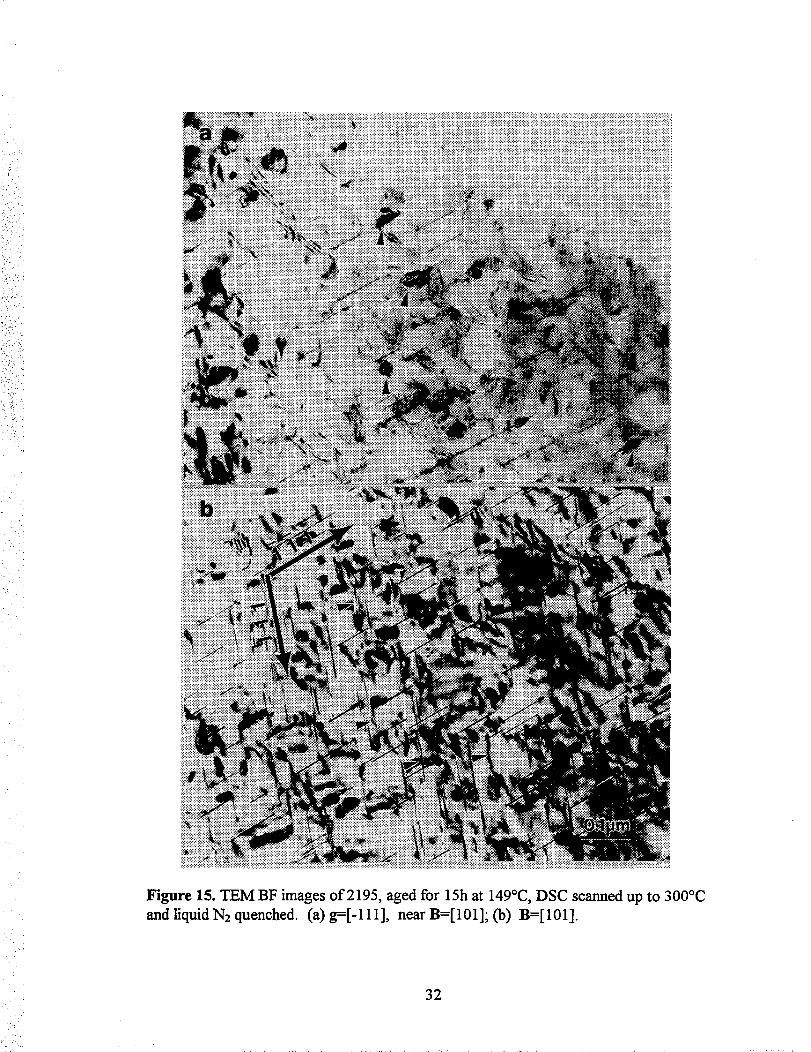
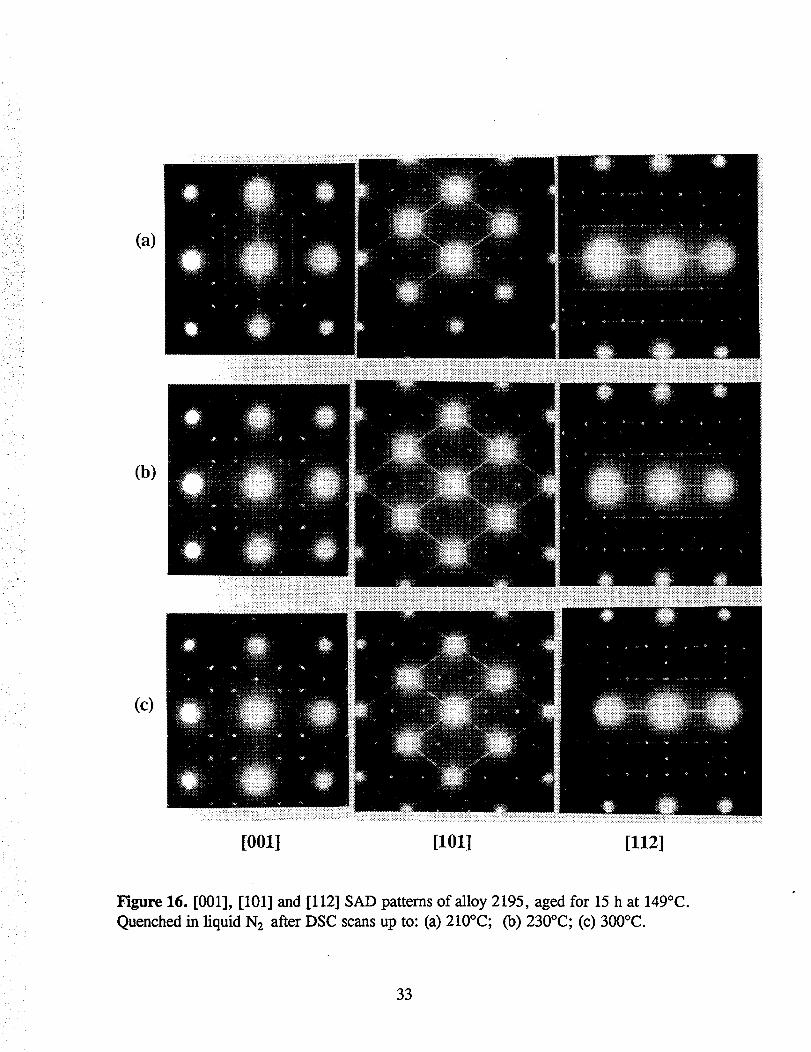
are the BF micrographs of the 300°C quenched sample. Figures 16 (a), (b) and (c) are
respectively the [001], [101], and [112] zone axes SAD patterns for the three DSC scanned
and quenched samples. An analysis of these micrographs and SAD patterns reveals that the
thermal events occurring in the temperature range of 150 to 290°C (in a 20°C/min scan) are
complex. The complexity stems from simultaneous dissolution and precipitation reactions
which may involve several phases (T1, 8' and 0'). The following is a summary of the
microstructural evolution in the 150-290°C range, based on the TEM analysis.
The microstructure prior to the DSC scan (see Figures 7 and 8) is comprised largely of
T1 with interspersions of small amounts of 0'. The endotherm spanning -150 to 250°C is
largely a result of the dissolution of an appreciable amount of T1 as can be observed by
comparison of Figures 8 and 14(a). In addition, a reduction in intensity of T1 reflections was
observed in the SAD pattems. The exotherm spanning -250 to 290°C corresponds to re-
precipitation of T1. The re-precipitated T1 is appreciably coarser as seen in Figure 15 and as
also evidenced in Figure 16 by the appearance of three spots along the <111> streaks. Re-
precipitation phenomenon under dynamic heating conditions in DSC has been previously
reported for under-aged A1-Li alloys [26, 27]. The exotherm spanning 290 to -330°C
appears to be a result of the on-going T1 dissolution (endothermic reaction) and the
simultaneous precipitation of 0' (exothermic reaction). This description of the 290 to
10
N330°Cexothermis basedontheDSCcharacterizationof anA1-Cu-Lialloy [25], similar in
chemical composition and heat treatment to the alloy 2195 in the present study. The strong
T1 re-precipitation observed in alloy 2195 suggests that the T8 condition still has
appreciable supersaturation.
3.3. Overview of strength and toughness of alloys 1460 and 2195
An extensive microstructural characterization of the alloys was presented in the
previous sections. A discussion of the influence of the precipitate phases 5' and T1 on
mechanical behavior is presented below.
3.3.1. Alloy 1460
5' is the dominant strengthening precipitate in alloy 1460. The actual degree of
strengthening contributed by 5' is a function of the volume fraction and the size
distribution of the particles [28]. During plastic deformation, 5' particles are sheared by
dislocations. As 5' has an L12 structure and is fully coherent with the matrix, the
strengthening associated with 5' shearing is largely attributed to order hardening [29].
Strength increases as the resistance to dislocation shearing of 5' increases. However, this
mode of deformation can further result in slip localization. Once slip has occurred on a
given plane, continued slip on that plane becomes energetically favorable compared to
activating slip on an alternate slip system. Persistent planar slip leads to the localization
of deformation strains into intense slip bands. Failure may occur by either slip-band
fracture, or grain boundary fracture at the intersection of grain boundaries and slip bands
due to stress concentrations caused by dislocation pile-ups [29]. As illustrated by the 5'-
CDF image in Figure 17, 5' precipitates and, apparently, 5'/A13Sc or 5'/A13Zr composite
particles, are sheared by dislocations during plastic deformation (indicated by arrow
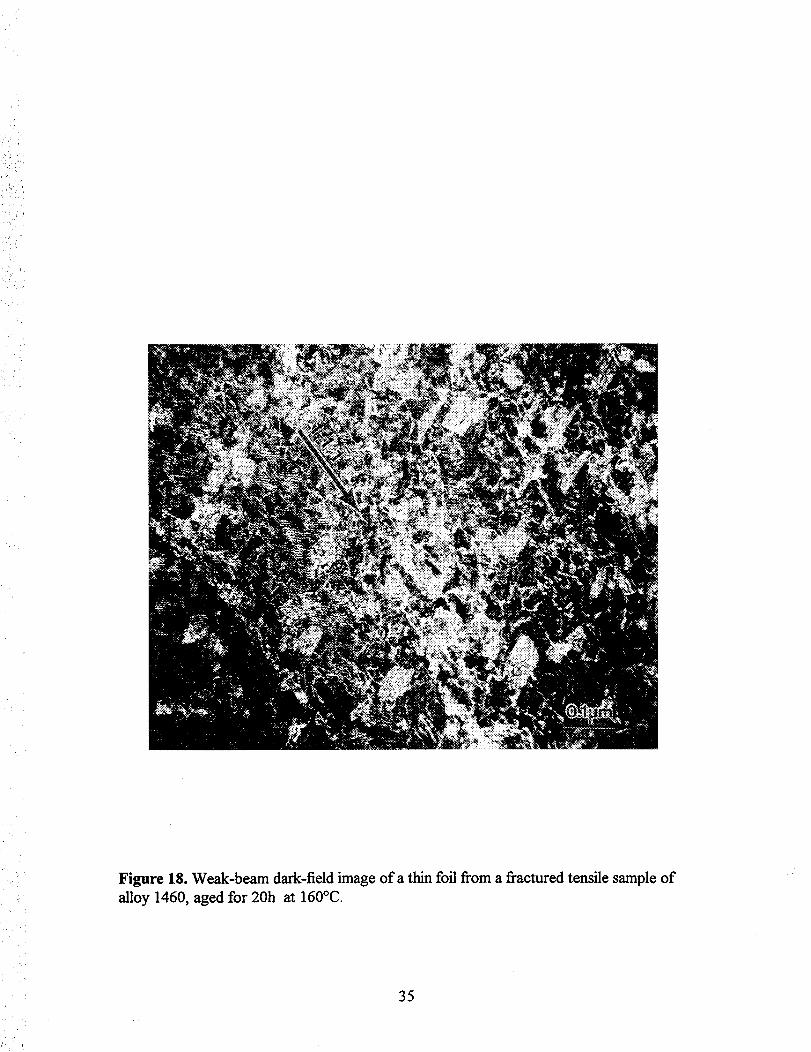
heads). The weak beam dark field (WDF) image in Figure 18 shows a large strain contrast
which is indicative of a high dislocation density along slip directions on {111 } planes.
Similarly, the T1 -CDF image in Figure 19 shows appreciable strain contrast associated
with the intense dislocation activity (see the background) at a grain boundary. The
11

relativelylargeT1precipitatesattheboundaryarebentanda few smallT1precipitatesare
shearedby dislocations (indicated by arrowheads).These observations,which are
consistentwith behaviorreportedfor other8' strengthenedalloys, suggestthat the low
toughnessin alloy 1460is associatedwith the formationof planarslip bands[29]. The
grainboundarypinning actionof 8'/A13Sccompositeparticlesis evidentin Figure 20. In
the presentstudy,no grainboundary8' precipitatefree zones(PFZ)wereobserved(see
Figure20) in the alloy 1460.
3.3.2.Alloy 2195
In alloy 2195, T1 is the dominant strengthening phase. Unlike the ordered, shearable
8' precipitates in alloy 1460 that lead to slip localization, T1 particles, above a critical size,
act as non-shearable obstacles to dislocation motion (relatively small T1 particles are
shearable, as shown in Figure 19) and promote slip homogenization [30]. T1 exhibits a
strong tendency to nucleate heterogeneously on dislocations and low angle grain
boundaries. Heterogeneous nucleation sites within a grain are induced by cold work prior
to artificial aging, which is used to promote a uniform distribution of heterogeneously
nucleated T1 precipitates. The distributions of Tl precipitates in the T8 condition are
considered responsible for improvements in strength and fracture toughness [31].
4. Summary
A summary of the salient findings on the microstructural characterization of A1-Li
alloys 1460 and 2195 is presented here.
* The dominant strengthening precipitates in alloys 1460 and 2195 in the T8 condition
are 8" and T1 respectively.
* Shearable 8' precipitates and extensive slip planarity is associated with poor toughness
in many aluminum-lithium alloys and is characteristic of alloy 1460. In contrast, the more
homogeneous deformation mode of the T1 strengthened 2195 may contribute to its
superior strength and toughness.
* The alloys 1460 and 2090 have very similar composition and rnicrostructures with
12

similaritiesin 5' sizedistributionsandvolumefractions.The two alloysappearto have
the maximum allowable 5' volume fraction, with no indication of remnant
supersaturation.It is thereforeunlikely that furtherstrengthimprovementsin them could
beeffectedvia alternativeheattreatmentprocedures.
* The alloy 2195 in the T8 condition still hasappreciablesupersaturation.A pre-age
strainingtreatmentwhichproducesa higherdensityof heterogeneousnucleationsitesmay
resultin strengthincreases.
Acknowledgments
This work was performed under NASA Contract NAS1-96014 at NAsA Langley
Research Center. The authors sincerely thank Dr. R. Crooks of Analytical Services &
Materials Inc. for his constructive suggestions. Helpful comments of Dr. S.J. Hales, Mr.
John Wagner and Ms. Marcia Domack of NASA Langley Research Center and Dr. S.
Sankaran of Analytical Services & Materials Inc. are gratefully acknowledged.
References
1. J.T. Staley, Aluminum Alloys - Contemporary Research and Applications (edited by
A.K. Vasudevan and R.D. Doherty, Academic Press, Inc.), 31, p.11 (1989).
2. P. E. Bretz and R.R. Sawtell, Aluminum-Lithium Alloys III (edited by C. Baker,
P.J. Gregson, S.J. Harris, and C.J. Peel, Inst. of Metals, London), p.47 (1986).
3. P. E. Bretz and R. G. Gilliland, LightMetalAge, 445, p.7 (1987).
4. W.D. Pollock and S.J. Hales, The 4th International Conference on Aluminum
Alloys, p.358 (1994).
5. M.S. Domack, C.L. Lach, and J.A. Wagner, Presentation in AeroMat'96, (June 6,
1996).
6. X. J. Jiang, Q.H. Gui, Y.Y. Li, L.M. Ma, G.J. Liang, and C.X. Shi, Scripta.
Metall. Mater., 29, p.211 (1993).
7. I. N. Fridlyander, A.M. Dritz and T.V. Krymova, Conference Proceedings of the
Aluminium-Lithium- Conference in Garmisch, p. 1245, ( 1991).
8. I.N. Fridlyander,A.G. Bratukhin,V.G. Davydov,Conference Proceedings of the
Aluminium-Lithium-Conference in Garmisch, p.35 ( 1991).
9. N. Blake and M.A. Hopkins, J. Mater. Sci., 20, p. 2861 (1985).
10. L. A. Willey, United States Patent No. 3,619, p.181 (1971).
11. M.D. Drits, L.S. Toropova, and Yu. G. Bykov: Metalloved. Term. Obbrab. Met.,
7, P.60 (1983).
12. V. I. Elagin, V.V. Zakharov, and T.D. Rostova, Metalloved. Term. Obbrab. Met.,
7, P. 57 (1983).
13. D.B. Williams and J. W. Edingtion, Met. Sci., 9, p.529 (1975).
14. S. Kang and N.J. Grant, Metall. Trans., 18A, p.2037 (1987).
15. J.C. Huang and A.J. Ardell, Mat. Sci. and Tech., 3, p.176 (1987).
16. K.M. Knowles and W.M. Stobbs, Acta Cryst., B44, p.207 (1988).
17. A.K. Gupta, P. Gaunt and M.S. Chaturvedi, Phil. Mag., 55A, p.375 (1987).
18. I.J. Polmear, Trans. Metall. Soc. A.I.M.E. 230, p.1331 (1964).
19. S. Kerry and V. D. Scott, Metal Sci., 18, p.478 (1978).
20. J. M. Papazian, Metall. Trans., 13A, p.761 (1982).
21. R. DeIasi and P. N. Adler, MetaU. Trans., 8A, p.1177 (1977).
22. S.W. Chen, C. H. Jan, J. C. Lin, and Y. A. Chang, MetaIl. Trans., 20A, p. 2247
(1989).
23. Tsung-Rong Chen, Guan-Jye Peng, and J.C. Huang, Metall. Trans., 27A, p.2923
(1996).
24. L.V. Meisel and P.C. Cote, Acta Metall., 31, p.1053 (1983).
25. R.N. Shenoy and J. M. Howe, ScriptaMetall. Mater., 33, p.651 (1995).
26. E.S. Balmuth, Scripta Metall., 18, p.301 (1984).
27. R. Nozato and G. Nakai, Trans. JIM, 18, p.679 (1977).
14
• •i •
28. E. A. Starke, Jr., Aluminum Alloys - Contemporary Research and Applications
(edited by A.K. Vasudevan and R.D. Doherty, Academic Press, Inc.), 31, p.35
(1989).
29. J.W. Martin, Micromechanisms in particle-hardened alloys, (edited by R.W. Cahn,
M.W. Thompson and I.M. Ward, Cambridge University Press, Cambridge, U.K.),
p.56 (1980).
30. W.E. Quist and G.H. Narayanan, Aluminum Alloys - Contemporary Research and
Applications (edited by A.K. Vasudevan and R.D. Doherty, Academic Press, Inc.),
31, p.219 (1989).
?
15
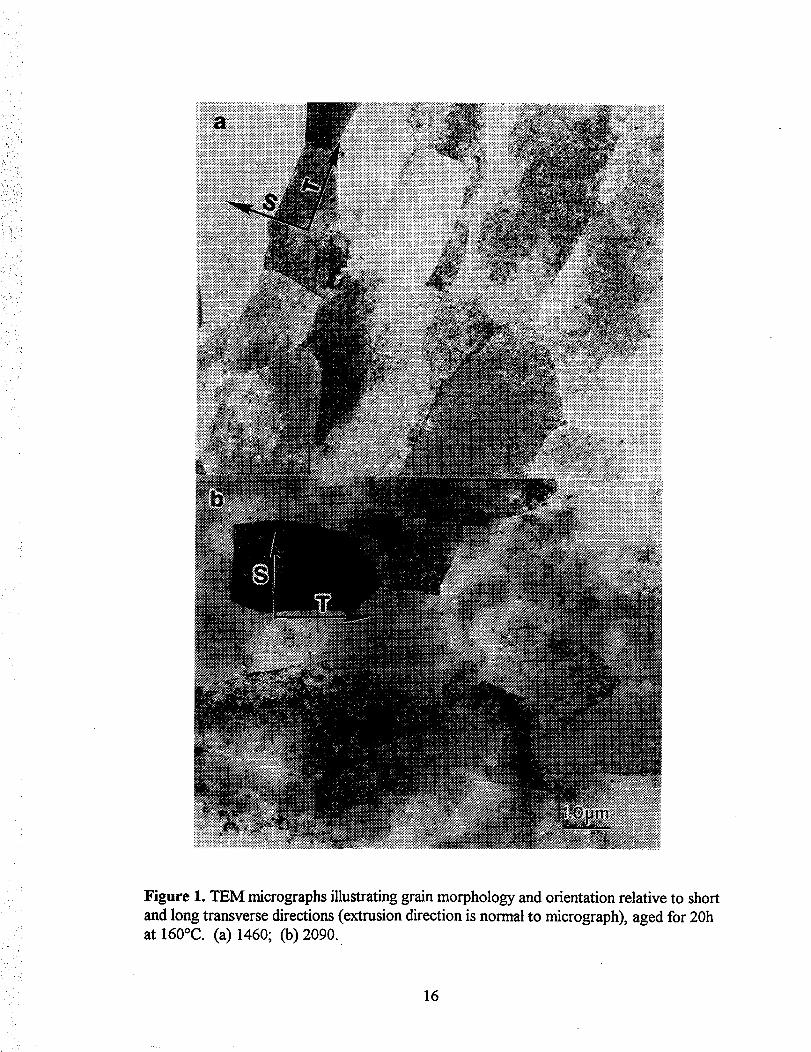
Figure 1. TEM micrographs illustrating grain morphology and orientation relative to short
and long transverse directions (extrusion direction is normal to micrograph), aged for 20h
at 160°C. (a) 1460; (b) 2090.
16

_/ i I
[OOl]
• /
i i
[101]
i ¸ .
[112]
(a) Co)
Figure 2. SAD patterns, [001], [101] and [112] zone axes; showing contributions of 6',
T1, 0' and f2 precipitates, aged for 20h at 160°C. (a)1460; (b) 2090.
17
220
020•
200
[OOll
020•
11]"
202
[lOll
2'20
[1121
OllT
(a)
220 200
• . •
0 o 0 0 o
02000200
11i
20,2
0 0
220
• lit
[OOll [lOll 11121
(b)
• -AI
o - 5', fl', A13Sc
Figure 3.1. Schematic of SAD patterns from major zone axes in A1-Li-Cu alloys: (a) The A1 matrix;
(b) The A1 matrix pluse L12 precipitates.
18

220 200O-............ • ............ O
020,!- ........... O ........... li ,i ii it
i it
t i
,i-............• ............1,
20+_
lli
0200 ........... _1- .......... -•
............ O
2"_o
qD
• • •
[OOll [1121
011_
(c)
220 200
• • •
X X X X
X X X X
0200 •
X X X X
X X X X
202 220
o, _ ---o-- •/ \
lli/ × _ /__\_ _1 ___
/_' ×__/)'x, --'--1-- _ -4 -
0201( ",_ • •- • 11i
\× / \x /
_•/ x )11/ --/--\-- -4 _ -
\ / --k--l-- --4-/- -
, ,
/,i ....
i! ', i
,,'':
[0011 [101] [1121
(cl)
X -- T1
Figure 3.2 Schematic of SAD pattems from major zone axes in A1-Li-Cu alloys: (c) The Al-matrix
plus 0' precipitate; (d) The Al-matrix plus T1 precipitate.
- 19b

220 200
• • •
0200
11i
20_
020• • • • 11 T
• • •
[0011 11011
(e)
11121
0200
220 200
• • •
• • •
2o_
0200 •
[0011 11011 [1121
(f)
° -£2• -A1
- S'
Figure 3.3. Schematic of SAD patterns from major zone axes in A1-Li-Cu alloys: (e) The Al-matrix
plus f_ precipitate; (f) The Al-matrix plus S' precipitate.
20
• ,! S
i'_i : i!_
? :i:_
"_i i_
Figure 4. 6'-CDF images from (100) superlattice spots, aged for 20h at 160°C. (a) 1460;
(b) 2090.
21

Figure 5. TI - CDF images of alloys (a) 1460 and (b) 2090 with g=[-111] close to
B=[101], illustrating the particle size distribution and number density of one variant of T1
aider aging for 20h at 160°C.
22
, i_i_ i,_i
_i • _
?
_ i_
, i'¸
i ¸¸ ." •
Figure 6. TEM micrographs illustrating grain morphology and orientation relative to short
and long transverse directions (extrusion direction is normal to micrograph), 2195, aged
for 15h at 149°C.
23
ii(ii__
[001] [1011 [112]
_ i _
Figure 7. SAD patterns, [001], [101] and [112] zone axes of alloy 2195, aged for 15hat 149°C.
24
_ii_!iii¸
i ;i i
'_i _ i
• i_ .
Figure 8. TEM images showing distribution ofT1 precipitates within the matrix, and
subgrain boundary in alloy 2195, aged for 15h at I49°C. (a) BF; (b) T1 - CDF.
25
on a
0.1
re
o 0.0M.
-0.1
f 2090, 160°C/30h
1460, 160°C/24h
I I I l l
0 1O0 200 300 400 500 600
Temperature °C
Figure 9. DSC signatures of alloys 1460 (aged for 24 h at 160°C) and 2090 aged for
30 h at 160°C), at 20°C/rain scanning rate.
26

Figure 10. 5' - CDF images of samples DSC scanned up to 245°C and liquid N2
quenched. (a) 1460, initially aged for 24h at 160°C; (b) 2090, initially aged for 30h at160°C.
27

• • i L, _
A
O'1t._
C
CO
mm
O
im
15
10
H m
m
mt e __
236
oo
i
5 A", , , I , , , , 228
15 20 25
Aging time (hour)
A
234
232 _
E
230 _
Figure 11, Area under the curve and peak temperature of 8' dissolution enothermin alloy 1460, as a function of aging time at the aging temperature of 160 °C.
28

A
O4
Ek--
m
15.0
14.5
14.0
J/mol
_/' A=8.33 x 10 l° s-1;" f i I , i i , I iI I I I I I I I I _ T13.5 -,
0.00195 0.00200 0.00205 0.00210
I/Tm(K "1)
, ii :¸ •
Figure 12. Kissinger plot for 5' dissolution in alloy 1460, aged for 24 h at 160°C.
L 29

i
0.04
°_ 0.00,'r
-0.04
0 1O0 200 300 400
Temperature
Figure 13. DSC signature of alloy 2195, aged for 20h at 149°C, at 20°C/min scanningrate.
30

Figure 14. TEM micrographs of 2195, initially aged for 20 h at 149 °C, DSC scanned up
to 210°C and liquid N2 quenched. (a) T1 -CDF; (b) 0' - CDF.
4
31
!-.
i_:̧ _
_ I_I i_
i
Figure 15. TEM BF images of 2195, aged for 15h at 149°C, DSC scanned up to 300°C
and liquid N2 quenched. (a) g=[-111], near B=[101]; (b) B=[101].
32
iii_I
_: iii_.
ii ii,__
• _+i_+ ,+
_ +_7:1
+
i:i
)
(a)
_)
(c)
[0011 [101] [112]
Figure 16. [001], [101] and [112] SAD pattems of aUoy 2195, aged for 15 h at 149°C.
Quenched in liquid N2 after DSC scans up to: (a) 210°C; Co) 230°C; (c) 300°C.
33

i,_ i _J
Figure 17. 8' - CDF image of a thin foil from a fractured tensile sample of alloy 1460,
aged for 20h at 160°C. The double arrow indicates the direction of tensile stress c.
34
'_ i ¸
Figure 18. Weak-beam dark-field image of a thin foil from a fractured tensile sample of
alloy 1460, aged for 20h at 160°C.
35

i ,
Figure 19. T1 - CDF image of a thin foil from a fractured tensile sample of alloy 1460,
aged for 20h at 160°C. T_ plates at the boundary are bent and a few small Tx plates near
the boundary are sheared by dislocations (indicated by arrowheads). The double arrow
indicates the direction of tensile stress or.
36

.:%
i _ •
I Form ApprovedREPORT DOCUMENTATION PAGE OMBNo.07704-0188
Public reporting burden for this collection of information is estimated to average 1 hour per response, including the time for reviewing instructions, searching existing data sources,
gathering and maintaining the data needed, and completing and reviewing the collection of information. Send comments regarding this burden estimate or any other aspect of this
collection of information, including suggestions for reducing this burden, to Washington Headquarters Services, Directorate for information Operations and Reports, 1215 Jefferson
Davis Highway, Suite 1204, Arlington, VA 22202-4302, and to the Office of Management and Budget, Paperwork Reduction Project (0704-0188), Washington, DC 20503.
1. AGENCY USE ONLY (Leave blank) 2. REPORT DATE 3. REPORTTYPE AND DATES COVERED
February 1998 Contractor Report
4. TITLE AND SUBTITLE 5. FUNDING NUMBERS
Microstructural Characterization of Aluminum-Lithium Alloys 1460 and2195
6. AUTHOR(S)
Z. M. Wang and R. N. Shenoy
7. PERFORMING ORGANIZATION NAME(S) AND ADDRESS(ES)Analytical Services & Materials, Inc.
Hampton, VA 23666
9. SPONSORING/MONITORING AGENCY NAME(S) AND ADDRESStES)
National Aeronautics and Space Administration
Langley Research Center
Hampton, VA 23681-2199
NAS1-96014
WU 242-20-05-05
8. PERFORMING ORGANIZATIONREPORT NUMBER
i
10. SPONSORING/MONITORINGAGENCY REPORT NUMBER
NASA/CR-1998-206914
11. SUPPLEMENTARYNOTES
Langley Technical Monitor: John Wagner
12a. DISTRIBUTION/AVAILABILITYSTATEMENT
Unclassified-Unlimited
Subject Category 26 Distribution: Standard
Availability: NASA CASI (301) 621-0390
12b. DISTRIBUTION CODE
13. ABSTRACT (Maximum 200 words)
Transmission electron microscopy (TEM) and differential scanning calorimetry (DSC) techniques were employed
to characterize the precipitate distributions in lithium-containing aluminum alloys 1460 and 2195 in the T8 condi-
tion. TEM examinations revealed delta prime and T1 as the primary strengthening precipitates in alloys 1460 and
2195 respectively. TEM results showed a close similarity of the Russian alloy 1460 to the U.S. alloy 2090, which
has a similar composition and heat treatment schedule. DSC analyses also indicate a comparable delta prime vol-
ume fraction. TEM study of a fractured tensile sample of alloy 1460 showed that delta prime precipitates are
sheared by dislocations during plastic deformation and that intense stress fields arise at grain boundaries due to pla-
nar slip. Differences in fracture toughness of alloys 1460 and 2195 are rationalized on the basis of a literature
review and observations from the present study.
14. SUBJECT TERMSA1-Cu-Li Alloys, Transmission electron microscopy (TEM)
Differential scanning calorimetric (DSC), microstructure
17. SECURITY CLASSIFICATIONOF REPORT
Unclassified
NSN 7540-01-280-5500
18. SECURITY CLASSIFICATIONOF THIS PAGE
Unclassified
15. NUMBER OF PAGES46
16. PRICE CODE
A0319. SECURITY CLASSIFICATION 20. LIMITATION
OF ABSTRACT OF ABSTRACTUnclassified
Standard Form 298 (Rev.2-89)PrescribedbyANSIStd.Z39-18298-102

i
Figure 20. TEM micrographs of alloy 1460, aged for 20h at 160°C, illustrating 8'/A13Sc
composite particles (indicated by arrowheads) pinning a grain boundary. (a) BF (b) 8' -CDF.
37