microtubules soften due to cross- sectional flattening · tual buckling, an effect first described...
TRANSCRIPT

*For correspondence:
†These authors contributed
equally to this work
Competing interests: The
authors declare that no
competing interests exist.
Funding: See page 18
Received: 06 February 2018
Accepted: 01 June 2018
Published: 01 June 2018
Reviewing editor: Manuel
Thery, CEA, France
Copyright Memet et al. This
article is distributed under the
terms of the Creative Commons
Attribution License, which
permits unrestricted use and
redistribution provided that the
original author and source are
credited.
Microtubules soften due to cross-sectional flatteningEdvin Memet1†, Feodor Hilitski2†, Margaret A Morris2, Walter J Schwenger2,Zvonimir Dogic2,3, L Mahadevan1,4,5*
1Department of Physics, Harvard University, Cambridge, United States;2Department of Physics, Brandeis University, Waltham, United States; 3Departmentof Physics, University of California, Santa Barbara, Santa Barbara, United States;4Paulson School of Engineering and Applied Sciences, Harvard University,Cambridge, United States; 5Kavli Institute for Nano-Bio Science and Technology,Harvard University, Cambridge, United States
Abstract We use optical trapping to continuously bend an isolated microtubule while
simultaneously measuring the applied force and the resulting filament strain, thus allowing us to
determine its elastic properties over a wide range of applied strains. We find that, while in the low-
strain regime, microtubules may be quantitatively described in terms of the classical Euler-Bernoulli
elastic filament, above a critical strain they deviate from this simple elastic model, showing a
softening response with increasingdeformations. A three-dimensional thin-shell model, in which the
increased mechanical compliance is caused by flattening and eventual buckling of the filament
cross-section, captures this softening effect in the high strain regime and yields quantitative values
of the effective mechanical properties of microtubules. Our results demonstrate that properties of
microtubules are highly dependent on the magnitude of the applied strain and offer a new
interpretation for the large variety in microtubule mechanical data measured by different methods.
DOI: https://doi.org/10.7554/eLife.34695.001
IntroductionMicrotubules (MTs) are long slender hollow cylindrical filaments with an approximate inner and outer
diameter of 15 nm and 25 nm (Nogales et al., 1999). They are an indispensable structural element
in biology, and their mechanical properties play an critical role in defining the shape and functionali-
ties of various cellular architectures including neuronal axons, cilia and flagella, centrioles as well as
the mitotic spindle (Howard, 2001). Therefore, a quantitative understanding of their mechanical
properties is essential for elucidating the properties of various biological structures and functions
(Schaedel et al., 2015; Wells and Aksimentiev, 2010; Schaap et al., 2006). A number of experi-
mental studies have measured either the flexural rigidity (EI) or persistence length (lP) of MTs, two
closely related quantities that determine a filament’s resistance to bending (see Hawkins et al.,
2010). However, there is a considerable disagreement between different reported values of MT elas-
tic moduli (Mickey and Howard, 1995), the dependence of the elastic moduli on the presence of
stabilizing agents (taxol and GMPCPP), as well as a possible length-dependence of flexural rigidity
(Pampaloni et al., 2006; Kis et al., 2002).
In principle, the properties of microtubules can be measured by either visualizing their intrinsic
thermal fluctuations (Gittes et al., 1993; Mickey and Howard, 1995; Pampaloni et al., 2006;
Brangwynne et al., 2007; Janson and Dogterom, 2004; Cassimeris et al., 2001) or by applying an
external force through optical trapping or hydrodynamic flow experiments (Kikumoto et al., 2006;
van Mameren et al., 2009; Van den Heuvel et al., 2008; Venier et al., 1994; Felgner et al., 1996;
Kurachi et al., 1995; Dye et al., 1993). Because of significant rigidity of MTs these two types of
Memet et al. eLife 2018;7:e34695. DOI: https://doi.org/10.7554/eLife.34695 1 of 22
RESEARCH ARTICLE

measurements typically probe different deformation (strain) regimes. Thermally induced fluctuations
only induce small strain deformations, while methods that use external forces are more suited to
probe the high-strain regime. The existing measurements of microtubule mechanics have been
extensively reviewed iteHawkins2010. Careful review of this data shows that the majority of measure-
ments that rely on the filament fluctuations in the low strain regime yield values of microtubule flex-
ural rigidity around , while measurements at high strains, tend to be for similarly prepared MTs
(Supplementary file 2).
Here we describe experiments that comprehensively probe the mechanical response of GMPCPP
stabilized microtubules across a wide range of imposed strains. Using optical trapping, we attach
micron-sized silica beads at different points along a single filament and subject it to tensile and com-
pressive forces. This allows us to construct a force-strain relationship for an individual filament that
connects the low and high strain regimes that were probed separately in previous experiments. In
the compression region, which corresponds to microtubule bending, the buckling force increases lin-
early in the initial (low strain) region, but quickly deviates from this trend and saturates at some criti-
cal strain, and it gradually decreases at high strain values. Such behavior indicates softening of MTs,
an outcome that cannot be captured by the ideal Euler-Bernoulli model. We show that the mechani-
cal response of MTs is well-captured by an anisotropic elastic shell model with three coarse grained
elastic parameters (oneshear, and two stretching moduli). Our numerical simulations demonstrate
that the softening in the high strain regime can be ascribed to cross-sectional ovalization and even-
tual buckling, an effect first described for macroscopic hollow cylinders by Brazier (Brazier, 1927;
Calladine, 1983). For microtubule filaments in particular, cross-sectional flattening and buckling in
response to compressive radial strains has also been described (Kononova et al., 2014).
To test the validity of our method we calibrate our experiments and theory using a different bio-
logical filament - the bacterial flagellum. Similar to microtubules, flagella are long-filamentous cylin-
drical biopolymers with an outer diameter of ~ 24 nm (Yonekura et al., 2003). Furthermore, like
microtubules flagella have a hollow core; however, their core diameter is only 2 nm. Therefore fla-
gella should effectively behave as solid cylinders. Most wild-type flagella have a characteristic helical
superstructure. We use flagellin monomers isolated from Salmonella typhimurium, strain SJW1660,
which have a point mutation in their amino-acid sequence that causes them to assemble into straight
filaments (Kamiya et al., 1980). A simple model based on Euler-Bernoullibeams quantitatively
describes the measured force curve in all strain regimes. Such measurements validate our experi-
mental method while also providing an estimate of the elastic properties of flagellar filaments that
are in reasonable agreement with thefew existing measurements (Louzon et al., 2017; Darnton and
Berg, 2007; Fujime et al., 1972).
Results
Optical tweezers buckle microtubulesOptical trapping techniques have been used to manipulate and characterize diverse biological sys-
tems, including individual biological filaments and their assemblages (van Mameren et al., 2009;
Hilitski et al., 2015; Wang et al., 1997; Darnton and Berg, 2007). We use independently con-
trolled optical traps to attach a pair of neutravidin-coated silica beads (D ¼ 1�m) to a single, seg-
mented partially biotinylated MT filament (Figure 1A). One of the traps - the detection trap - is held
stationary and used as a force detector by measuring the displacement of its captured bead with
back focal- plane interferometry (see Video 1 of the experiments in supplementary information). The
second optical trap - the manipulation trap - is moved in increments of 2–20 nm in order to exert a
force on the filament, which connects the two beads. Our instrumentation allows us to simulta-
neously apply an external force with optical tweezers and visualize the filament configuration
(Figure 1B). Strain � is defined as:
�¼ db �Lð Þ=L: (1)
where db is the bead separation once the MT has been deformed, and L is the distance between
the beads when there is no force on the MT. The measured force-strain curve exhibits an unex-
pected feature (Figure 2B). For small deformations, the force increases linearly as a function of the
applied strain. Surprisingly, above a critical applied strain (�~ � 0:1) the force-compression curve
Memet et al. eLife 2018;7:e34695. DOI: https://doi.org/10.7554/eLife.34695 2 of 22
Research article Cell Biology Structural Biology and Molecular Biophysics
exhibits a qualitatively different behavior. In this regime the applied force remains flat or in some
cases it even declines slightly, even as the strain changes from �0.1 to �0.5. Filaments subjected to
repeated cycles of compression/extension do not seem to exhibit any aging (Figure 2B, inset).
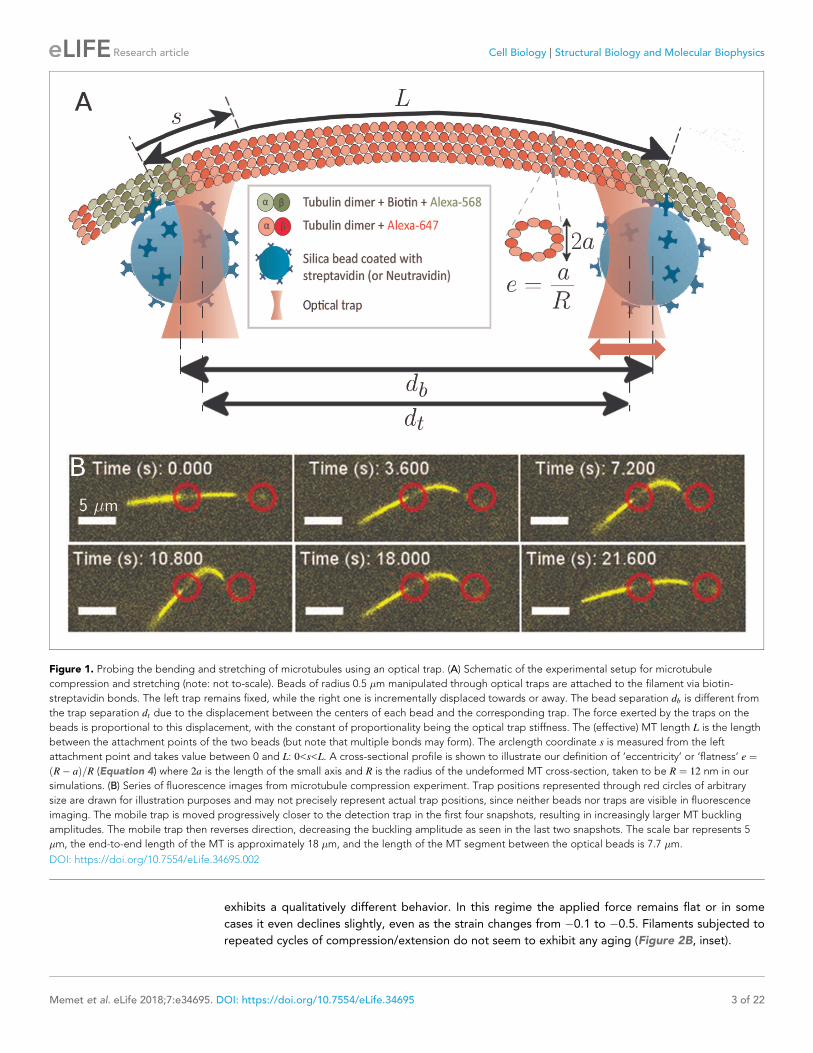
Figure 1. Probing the bending and stretching of microtubules using an optical trap. (A) Schematic of the experimental setup for microtubule
compression and stretching (note: not to-scale). Beads of radius 0.5 �m manipulated through optical traps are attached to the filament via biotin-
streptavidin bonds. The left trap remains fixed, while the right one is incrementally displaced towards or away. The bead separation db is different from
the trap separation dt due to the displacement between the centers of each bead and the corresponding trap. The force exerted by the traps on the
beads is proportional to this displacement, with the constant of proportionality being the optical trap stiffness. The (effective) MT length L is the length
between the attachment points of the two beads (but note that multiple bonds may form). The arclength coordinate s is measured from the left
attachment point and takes value between 0 and L: 0<s<L. A cross-sectional profile is shown to illustrate our definition of ‘eccentricity’ or ‘flatness’ e ¼R� að Þ=R (Equation 4) where 2a is the length of the small axis and R is the radius of the undeformed MT cross-section, taken to be R ¼ 12 nm in our
simulations. (B) Series of fluorescence images from microtubule compression experiment. Trap positions represented through red circles of arbitrary
size are drawn for illustration purposes and may not precisely represent actual trap positions, since neither beads nor traps are visible in fluorescence
imaging. The mobile trap is moved progressively closer to the detection trap in the first four snapshots, resulting in increasingly larger MT buckling
amplitudes. The mobile trap then reverses direction, decreasing the buckling amplitude as seen in the last two snapshots. The scale bar represents 5
�m, the end-to-end length of the MT is approximately 18 �m, and the length of the MT segment between the optical beads is 7.7 �m.
DOI: https://doi.org/10.7554/eLife.34695.002
Memet et al. eLife 2018;7:e34695. DOI: https://doi.org/10.7554/eLife.34695 3 of 22
Research article Cell Biology Structural Biology and Molecular Biophysics

Flagellar filaments exhibit noanomalous softening at high strainsThe softening of microtubules at high-strains is
not predicted by simple elastic filament models
of microtubule elasticity. A plausible hypothesis is
that the hollow core of the microtubules signifi-
cantly changes the effective elastic properties of
the filament. To examine this hypothesis and
quantitatively test our experimental method we
measured the force-strain curve of bacterial fla-
gellar filaments. As mentioned previously, the
hollow core of flagellar filaments is only 2 nm.
Therefore, we expect theywill exhibit classical
slender-rod-like behavior that should be captured
by a one-dimensional filament model.
The measured strain-force curve of a flagellar
filament is qualitatively different from that
observed for microtubules (Figure 3B). In both the compression and extension regime, the force
monotonically increases. For classical buckling, the amplitude of thedeformed beam scales asffiffiffiffiffiffiffiffiffiffiffiffiffiffi
F � Fc
p, where Fc ¼ p2B=L2 is the classical buckling force (Timoshenko and Gere, 2012). For small
deflections, since the strain goes like the square of the amplitude, the force-displacement curve
should be roughly linear with strain, starting at Fc (albeit growing very slowly). However, for the clas-
sical buckling analysis, the compressive force is assumed to apply directly along the centerline of the
beam. Experimentally, this is not the case, since the force is exerted on the filament through trapped
micron-sized beads, which displace the force contact points away from the beam’s long axis. There-
fore to quantitatively compare experiments to theory we numerically solved a more realistic problem
that accounts for the entire filament-bead configuration. We also note that the slope in the exten-
sion region is higher than that in the compression region. Because the force is not applied along the
filament centerline, in response to extensional forces the filament bends in the proximity of the bead
attachments point. It is more difficult to bend the filament into such a configuration, hence the larger
slope of the extensional regime.
By tuning a single parameter, flexural rigidity B, the force-strain curve obtained from simulations
of a 1D filament model can be quantitatively fitted to the experimental data (Figure 3B). In the com-
pressive regime, the data is well fitted by simulationsin which the bending rigidity B ¼ 4pN� �m2.
Note that the agreement extends to very large strains approaching �0.7. The fitting procedure was
repeated for eight distinct flagella filaments, yielding flexural rigidity that ranges from 3.2 to 5.25
pN� �m2, with a mean around 4:1� 0:6 pN� �m2,. Interestingly, this value is close to the value of
Video 1. Microtubule buckling experiment, showing
two ‘back-and-forth’ cycles. The microtubule is labeled
with fluorescent dye Alexa-647 and is actively kept in
the focal plane. The scale bar represents 5 �m.
Approximate positions of the optical traps are shown
by red circles of arbitrary size.
DOI: https://doi.org/10.7554/eLife.34695.003
Video 2. Flagellum buckling experiment. (left)
Simulation of microtubule buckling experiment shown
in Figure 4, first panel. The length of the microtubule
between the optical bead attachment points is 3.6 �m
while the size of the optical beads is 0.5 mum. The
shape of the cross-section located halfway along the
microtubule is also shown. (right) Force-strain curves
from experiment (blue) and simulation (red). The
simulation curve is synchronized with the visualization
on the left.
DOI: https://doi.org/10.7554/eLife.34695.004
Video 3. Flagellum buckling experiment, showing
three ‘back-and-forth’ cycles. The scale bar represents
5 �m. Approximate positions of the optical traps are
shown by green circles of arbitrary size. Measured force
vector and magnitude are also indicated.
DOI: https://doi.org/10.7554/eLife.34695.005
Memet et al. eLife 2018;7:e34695. DOI: https://doi.org/10.7554/eLife.34695 4 of 22
Research article Cell Biology Structural Biology and Molecular Biophysics

3:5pN� �m2 and 2:9pN� �m2 reported, respectively for the coiled and straight forms of flagella
(Louzon et al., 2017; Darnton and Berg, 2007). The magnitude of B suggests that Young’s modulus
for the straight flagellum is GPa.
3d model explains microtubule softeningQuantitative agreement between experimentally measured force-strain curves of flagellar filaments
and simulation results validate our experimental technique, while also demonstrating that the flagel-
lar filaments behave as simple elastic filaments. However, the same one-dimensional model is not
capable of reproducing the more complex elastic behavior observed in microtubule filaments. At
most, it can describe the low strain regime of the force-compression curve (Figure 2B, green dashed
curve). To explain theelastic behavior of microtubules over the entire strain regime we developed a
more comprehensive 3D model of microtubules that explicitly accounts for their hollow center. We
model the microtubule as a 3D orthogonal network of springs wrapped into a cylinder (Figure 2A).
All interactions between particles are defined in terms of a stretching energy Vstretch k; l; l0ð Þ or a
bending energy Vbend k;f;f0ð Þ, where l is the distance between a particle pair, f is the angle defined
by a triplet, and the subscript’ zero’ denotes the separation that minimizes particle interaction
energy. Explicitly,
Vstretch k; l; l0ð Þ ¼ 1
2k l� l0ð Þ2; (2)
Vbend k;f;f0ð Þ ¼ 1
2k f�f0ð Þ2: (3)
Neighboring triplets in the axial and azimuthal directions encode bending energies (Table 1)
through the parameters ka (Figure 2A, dark blue), respectively kc (Figure 2A, dark green) and equi-
librium angles of p, respectively 144p=180. Shearing is encoded by the same type of energy function
as bending (Table 1), but with parameter ks (Figure 2A, brown) and rest angle p=2:
Vshear ks;fsð Þ ¼ Vbend ks;fs;p=2ð Þ. The shearing interaction is defined for any triplet of neighbors that
are not all along the axial or azimuthal directions. The microtubule-optical bead contact is modeled
via parameters kb and kb, which are made sufficiently large to enforce the constraints of inextensibil-
ity and fixed attachment point. The relationship between these microscopic parameters and the
macroscopic parameters Ea, Ec, and G (axial Young’s modulus, circumferential Young’s modulus, and
shear modulus) can be derived based on the planar spring-network model and the orthotropic elas-
tic shell model (Sim and Sept, 2013; Wang et al., 2006) and are shown in Table 1.
The 3D microtubule model quantitatively explains the softening that is observed in experimentally
measured force-strain curves of microtubules. Overall we investigated the properties of 10 different
filaments with lengths between 3 and 15 �m (Figure 4) and fitted 10 different force-strain curves to
our theoretical model. Fitting each measurement curve yields independent yet consistent estimates
of the Young’s modulus in axial and circumferential directions, Ea, Ec, as well as the shear modulus,
G. We obtain Ec that varies between 3–10 MPa, and Ea between 0.6–1.1 GPa, which is in reasonable
agreement with values reported in the literature (see Discussion). This observation confirms that
microtubules are highly anisotropic materials. Interestingly, our values for shear modulus, G, are in
the GPa range (Table 2), which is significantly higher than the largest values reported in the litera-
ture. This likely indicates that the microtubule deformations in our experiments are large enough to
reach the point of deforming the tubulin units themselves rather than the bonds between them (see
Discussion).
Cross-sections flatten and eventually buckleWith quantitative agreement between experiments and theory we are in a position to elucidate the
microscopic origin of the microtubule softening at high strains. The decrease in the buckling force is
directly associated with ovalisation of the microtubulecross-section. Plotting the microtubule cross-
section at different deformation strains effectively demonstrates this effect. Figure 5A show the
force-strain data for a microtubule of length 8.3 �m. The point labeled a is close to the boundary of
the region where the 1D model (Figure 5A, green dashed line) fails, while points b and c are both
inside the high-strain non-classical regime. The large inset shows a snapshot of the
Memet et al. eLife 2018;7:e34695. DOI: https://doi.org/10.7554/eLife.34695 5 of 22
Research article Cell Biology Structural Biology and Molecular Biophysics

simulatedmicrotubule corresponding to point c and smaller insets show cross-sectional profiles at
Figure 2. Discrete mechanical network model of microtubule. (A) Schematic of spring network model of microtubule. Red particles discretize the
filament while yellow particles represent the optical beads. Top inset: closeup of a region of the microtubule model, showing the 3D arrangement of
the particles. Right inset: further closeup of the region, showing the defined interactions between particles. In the circumferential direction, ten particles
are arranged in a circle of radius R ¼ 12 nm, (only three particles are shown in the inset) with neighboring pairs connected by springs of stiffness kc and
rest length p (light green). Neighboring triplets in the circumferential direction form an angle fc and are characterized by a bending energy interaction
with parameter kc (dark green). In the axial direction, cross-sections are connected by springs of stiffness ka (light blue) running between pairs of
corresponding particles. Bending in the axial direction is characterized by a parameter ka and the angle fa formed by neighboring triplets (dark blue).
All other triplets of connected particles that do not run exclusively in the axial or circumferential direction encode a shearing interaction with energy
given by Vbend ks;fs;p=2ð Þ (Table 1) with parameters ks and fs (yellow), where the stress-free shear angle is p=2. (B) Force-strain curve for a microtubule
of length 7.1 �m from experiment (blue) and simulation using a 1D model (green, dashed) or a 3D model (red). Arrows on the red curve indicate
forward or backward directions in the compressive regime. The bending rigidity for the 1D model fit is B ¼ 12pN�m2. The fit parameters for the 3D
model are Ea ¼ 0:6 GPa, Ec ¼ 3 MPa, and G ¼ 1:5 GPa. Errorbars are obtained by binning data spatially as well asaveraging over multiple runs. Inset:
Raw data from individual ‘forward’ (green) and ‘backward’ (yellow) runs.
DOI: https://doi.org/10.7554/eLife.34695.006
Memet et al. eLife 2018;7:e34695. DOI: https://doi.org/10.7554/eLife.34695 6 of 22
Research article Cell Biology Structural Biology and Molecular Biophysics

indicated locations. While cross-sectional deformations vanish at the endpoints (i.e. at the locations
of the optical beads, shown in blue), deformations in the interior are considerable.
To quantify the cross-sectional deformation profiles more explicitly, we define a measure of
cross-sectional eccentricity as:
e¼ R� a
R; (4)
where a is semi-minor axis (Figure 1A) and R¼ 12 nm is the radius of the undeformed microtu-
bule cross-section. e¼ 0 corresponds to a circular cross-section, while larger values of e correspond
to increasingly flatter cross-sections. The cross-sectional profile of a buckled filament in the low-
strain regime (point a in Figure 5A) has e»0 almost everywhere (Figure 5B, green line), reflecting
the fact that the simplified 1D model (Figure 5A, green dashed line) semi-quantitatively predicts the
applied force. Point b in Figure 5A marks the onset of the high-strain regime. Here the flatness e
measurably deviates from its undeformed value. Noticeably, e also varies along the filament contour
length, attaining largest distortions at the filament midpoint (Figure 5B, blue line line). The signifi-
cant cross-sectional deformations in the high-strain regime demonstrate that the non-classical behav-
ior of force with compressive strain in microtubules isindeed due to cross-sectional flattening. The
location of the force plateau is highly sensitive on the circumferential Young’s modulus, Ec, and sig-
nificantly less on the other parameters. Increasing Ec shifts the onset of the plateau towards larger
compressive strains, eventually leading to its disappearance.
It is well-established that local cross-sectional buckling (kinking) can occur in a thin-walled tube
because of cross-sectional ovalization (Huang et al., 2017). This is indeed what we observe - the
cross-section is circular (Figure 5B, green and blue curves) until a critical bending moment is
reached. The blue curve in Figure 5B represents the profile right before the local buckling transition;
afterwards, a sharp increase in e takes place at the middle, representing the development of a kink.
With further compression, subsequent kinks can develop - one at a time - in its vicinity. The red curve
in Figure 5B, for example, shows five kinks (visible as spikes in the flatness profile) in the microtubule
configuration corresponding to the point labeled esc in Figure 5A. The inset in Figure 5B shows
that the corresponding curvature profiles effectively mirror the flatness profiles in the main figure.
Thus, discontinuities in the curvature profile of a filament signal the existence of cross-sectional ovali-
zation and eventual kinking. In simulations, the formation of kinks can be identified directly from the
force-strain plots as a small drop in the buckling force (Figure 5A, red). Indeed, hysteresis associated
with forward and backward compressionis observed in simulations in which the filament forms kinks.
The often observed persistence of hysteresis at very low strains, as seen in Figures 2B, 4 and 5, is
likely a simulation artefact, due to the lattice getting trapped in a local minimum; the addition of
Table 1. List of microscopic parameters for the 3D model, their physical significance, the energy
functional associated with them (Equation2 or Equation 3), and their connection to the relevant
macroscopic elastic parameter.
Parameters, angles, and lengths are highlighted in Figure 2A. where h» 2:7 nm and h0 » 1:6 nm are
the microtubule’s thickness and effective thickness (see Materials and methods), respectively and fac-
tors involving the Poisson ratios na and nc are neglected.
Microscopic Physical Associated Relation to
Parameter Significance Energy Macroscopic moduli
ka Axial stretching 1
2ka la � dð Þ2 Eahp
d
ka Axial bending 1
2ka fa � pð Þ2 1
6
Eah3
0p
d
kc Circumferential stretching 1
2kc lc � pð Þ2 Echd
p
kc Circumferential bending 1
2kc fc � 144p=180ð Þ2 1
6Ech
3
0d=p
ks Shearing 1
2ks fs � p=2ð Þ2 2Ghpd
DOI: https://doi.org/10.7554/eLife.34695.008
Memet et al. eLife 2018;7:e34695. DOI: https://doi.org/10.7554/eLife.34695 7 of 22
Research article Cell Biology Structural Biology and Molecular Biophysics

Figure 3. Discrete mechanical model of bacterial flagellum. (A) Schematic of spring network model for bacterial flagellum. Green particles discretize
the flagellum while blue particles represent the optical beads. Right inset: closeup of a region of the filament, showing that neighboring masses are
connected by linear springs of stiffness k which give rise to a stretching energy Vstretch k; l; l0ð Þ according to Equation 2, where l0 is the stress-free length
of the springs. In addition, each triplet of neighbors determines an angle f which dictates the bending energy of the unit: Vbend k;f;pð Þ (Equation 3).
Figure 3 continued on next page
Memet et al. eLife 2018;7:e34695. DOI: https://doi.org/10.7554/eLife.34695 8 of 22
Research article Cell Biology Structural Biology and Molecular Biophysics

thermal noise either eliminates hysteresis or eliminates its low-strain persistence. Experimental data
is too noisy to draw any conclusions regarding the presence or absence of hysteresis.
Critical curvature is relatively smallThe critical bending moment MB at which a hollow tube becomes unstable, leading to local collapse
and kinking, is given by (Brazier, 1927):
MB »2
ffiffiffi
2p
p
9h2RE; (5)
Figure 3 continued
Left inset: closeup of the region where the bead connects to the flagellum. The bead particle is connected to a single particle of the flagellum by a very
stiff spring kb of stress-free length b corresponding to radius of the optical bead. In addition, there is a bending interaction Vbend kb;fb;p=2ð Þ, where fb
is the angle determined by the bead, its connecting particle on the flagellum, and the latter’s left neighbor. (B) Force-strain curve from experiment
(blue) and simulation (yellow) for a flagellum of length L ¼ 4.1 �m. Errorbars are obtained by binning data spatially as well as averaging over multiple
runs. The bending rigidity obtained from the fit is B ¼ 4 pN � �m2. The classical buckling force for a rod of the same length and bending rigidity with
pinned boundary conditions is Fc » 2:3pN.
DOI: https://doi.org/10.7554/eLife.34695.007
Figure 4. Plots of force F as a function of strain � (Equation 1) for microtubules ranging in length from 3:6 to 11:1�m (blue). Best-fit curves from
simulation of the 3D model (red) and fit parameters (top) are shown for each plot. Arrows on the red curves indicate forward or backward directions in
the compressive regime.
DOI: https://doi.org/10.7554/eLife.34695.009
Memet et al. eLife 2018;7:e34695. DOI: https://doi.org/10.7554/eLife.34695 9 of 22
Research article Cell Biology Structural Biology and Molecular Biophysics
where h is the tube thickness, R is the radius, and E is its elastic modulus. Brazier’s result applies
to isotropic, infinitely long tubes. It has been extended to orthotropic materials (Huang et al., 2017)
by replacing E with the geometric mean of Ea and Ec and to finite-length tubes by including a
numerical correction factor (Takano, 2013), so that we expect the following scaling for MB:
MB ~h2R
ffiffiffiffiffiffiffiffiffiffiffiffiffiffiffiffiffi
EaEc
1� nanc
r
~h2Rffiffiffiffiffiffiffiffiffiffi
EaEc
p: (6)
To understand this result, we first carry out simulations after subtracting the energy due to shear
deformations and compute a ‘modified’ force as the derivative of all energies except for the shear
energy. This modified force is then used to calculatea modified, shear-agnostic, critical bending
moment. Multiplying force computed this way by the maximum vertical displacement of the filament
yields the value of MB observed in simulation (Figure 6, vertical axis), which we compare to values of
MBcomputed according to Equstion 6 using a numerical factor of unity (Figure 6, horizontal axis).
We confirmed the scaling predicted in Equation 6 by running additional simulations, varying the
length of the microtubule L, their elastic moduli Ea, Ec, and G, and the size of the trapped bead
beyond the typical range of our experiments (see Figure 6).
Our experimental results (Figure 6, stars) suggest that the critical bending moment is generally in
the range MB »1000–2000 pN nm. This approximate range of the critical bending moment enables
us to estimate the critical curvature at which softening occurs (as curvatures may be more easily
extracted from experiments). Upon Brazier buckling, the curvature profile spikes at the location of
the kink(s), just like the flatness profile (Figure 5B, inset), showing the correspondence betweencriti-
cal curvature and critical bending moment. Values of MB of around 1000–2000 pN nm imply a critical
curvature for the onset of softening on the order of 0.1 rad / �m, given a bending rigidity B of ~ 10–
20 pN ��m2. This estimate is confirmed by simulations, which show that the critical curvature at the
onset of the Brazier buckling is close to 0.2 rad / �mfor seven of eight experimental datasets (and
0.3 for the other dataset). Such values are small enough that they are likely reached and exceeded
at least in some systems both in vivo, as in the beating flagella of Chlamydomonas (Sartori et al.,
2016; Geyer et al., 2016) and in vitro, as in microtubule rings observed in gliding assays (Liu et al.,
2011).
DiscussionUsing optical trapping we have determined the mechanical properties of microtubules by measuring
how the strain changes with an applied extensile/compressive force. We found that the force
required to buckle the filament levels off or decreases with increasing compressive strain, demon-
strating that microtubules significantly soften above a critical strain. Such non-classical behaviors are
quantitatively captured by overdamped molecular dynamics simulations of an orthotropic cylindrical
shell model. The simulations reveal that microtubule softening is a consequence of cross-sectional
deformations enabled by a small circumferential Young’s modulus of a few MPa.
MT softening could explain large variation of bending rigidity resultsWhile it is known that MTs do not behave as isotropic Euler-Bernoulli slender rods - since, for
instance, lateral bonds between adjacent protofilaments are much weaker than longitudinal bonds
along protofilaments (Nogales et al., 1999; VanBuren et al., 2002; Huang et al., 2008) -many
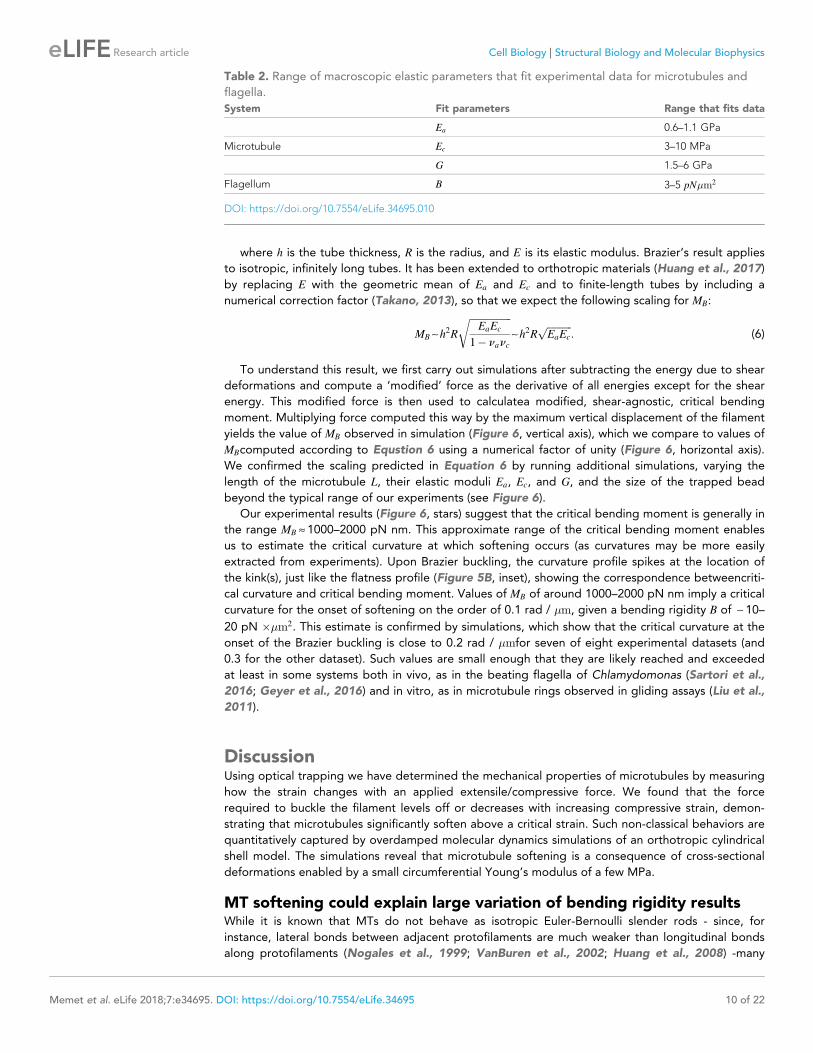
Table 2. Range of macroscopic elastic parameters that fit experimental data for microtubules and
flagella.
System Fit parameters Range that fits data
Ea 0.6–1.1 GPa
Microtubule Ec 3–10 MPa
G 1.5–6 GPa
Flagellum B 3–5 pN�m2
DOI: https://doi.org/10.7554/eLife.34695.010
Memet et al. eLife 2018;7:e34695. DOI: https://doi.org/10.7554/eLife.34695 10 of 22
Research article Cell Biology Structural Biology and Molecular Biophysics

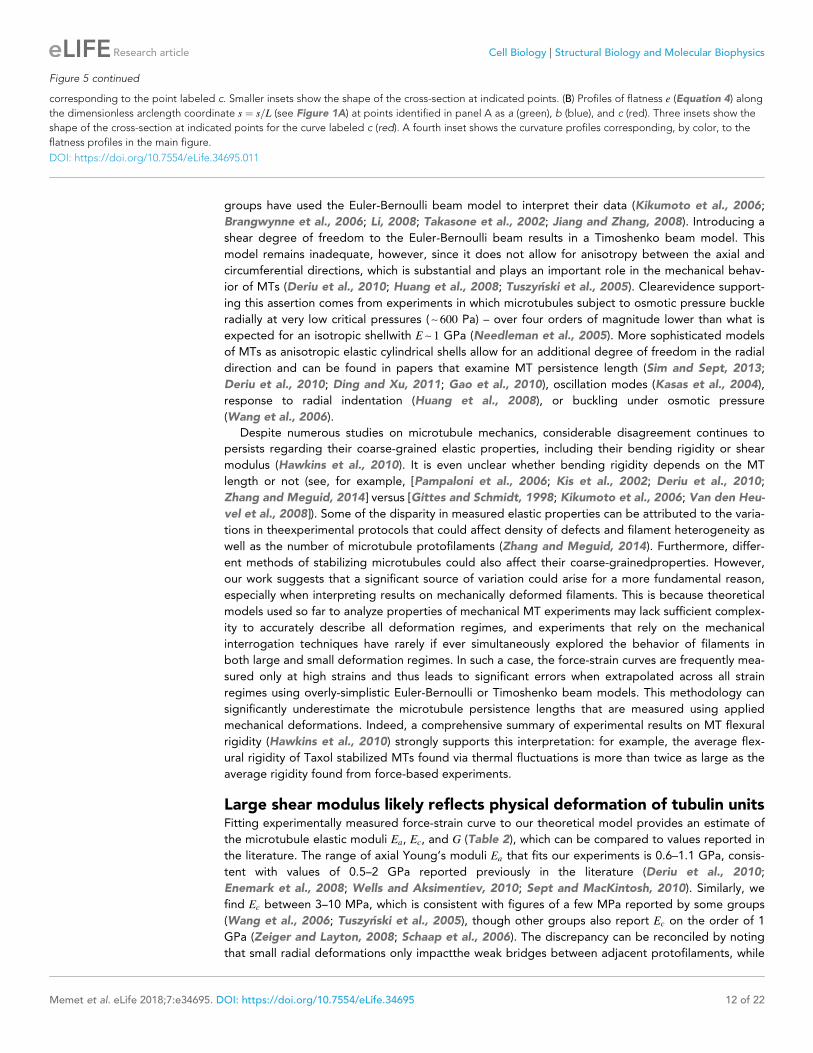
Figure 5. (A) Force-strain curve for a microtubule of length 8.3 �m from experiment (blue) and simulation using a 1D model (green, dashed) or a 3D
model (red). Arrows on the red curve indicate forward or backward directions in the compressive regime. Errorbars are obtained by binning data
spatially as well as averaging over multiple runs. The fit parameters for the 3D model are Ea ¼ 0:9 GPa, Ec ¼ 4 MPa, and G ¼ 4 GPa. The bending
rigidity for the 1D model fit is B ¼ 23pN�m2. Labels a, b, and c indicate specific points in the 3D simulation model. (inset) Snapshot from simulation
Figure 5 continued on next page
Memet et al. eLife 2018;7:e34695. DOI: https://doi.org/10.7554/eLife.34695 11 of 22
Research article Cell Biology Structural Biology and Molecular Biophysics
groups have used the Euler-Bernoulli beam model to interpret their data (Kikumoto et al., 2006;
Brangwynne et al., 2006; Li, 2008; Takasone et al., 2002; Jiang and Zhang, 2008). Introducing a
shear degree of freedom to the Euler-Bernoulli beam results in a Timoshenko beam model. This
model remains inadequate, however, since it does not allow for anisotropy between the axial and
circumferential directions, which is substantial and plays an important role in the mechanical behav-
ior of MTs (Deriu et al., 2010; Huang et al., 2008; Tuszynski et al., 2005). Clearevidence support-
ing this assertion comes from experiments in which microtubules subject to osmotic pressure buckle
radially at very low critical pressures (~ 600 Pa) – over four orders of magnitude lower than what is
expected for an isotropic shellwith E ~ 1 GPa (Needleman et al., 2005). More sophisticated models
of MTs as anisotropic elastic cylindrical shells allow for an additional degree of freedom in the radial
direction and can be found in papers that examine MT persistence length (Sim and Sept, 2013;
Deriu et al., 2010; Ding and Xu, 2011; Gao et al., 2010), oscillation modes (Kasas et al., 2004),
response to radial indentation (Huang et al., 2008), or buckling under osmotic pressure
(Wang et al., 2006).
Despite numerous studies on microtubule mechanics, considerable disagreement continues to
persists regarding their coarse-grained elastic properties, including their bending rigidity or shear
modulus (Hawkins et al., 2010). It is even unclear whether bending rigidity depends on the MT
length or not (see, for example, [Pampaloni et al., 2006; Kis et al., 2002; Deriu et al., 2010;
Zhang and Meguid, 2014] versus [Gittes and Schmidt, 1998; Kikumoto et al., 2006; Van den Heu-
vel et al., 2008]). Some of the disparity in measured elastic properties can be attributed to the varia-
tions in theexperimental protocols that could affect density of defects and filament heterogeneity as
well as the number of microtubule protofilaments (Zhang and Meguid, 2014). Furthermore, differ-
ent methods of stabilizing microtubules could also affect their coarse-grainedproperties. However,
our work suggests that a significant source of variation could arise for a more fundamental reason,
especially when interpreting results on mechanically deformed filaments. This is because theoretical
models used so far to analyze properties of mechanical MT experiments may lack sufficient complex-
ity to accurately describe all deformation regimes, and experiments that rely on the mechanical
interrogation techniques have rarely if ever simultaneously explored the behavior of filaments in
both large and small deformation regimes. In such a case, the force-strain curves are frequently mea-
sured only at high strains and thus leads to significant errors when extrapolated across all strain
regimes using overly-simplistic Euler-Bernoulli or Timoshenko beam models. This methodology can
significantly underestimate the microtubule persistence lengths that are measured using applied
mechanical deformations. Indeed, a comprehensive summary of experimental results on MT flexural
rigidity (Hawkins et al., 2010) strongly supports this interpretation: for example, the average flex-
ural rigidity of Taxol stabilized MTs found via thermal fluctuations is more than twice as large as the
average rigidity found from force-based experiments.
Large shear modulus likely reflects physical deformation of tubulin unitsFitting experimentally measured force-strain curve to our theoretical model provides an estimate of
the microtubule elastic moduli Ea, Ec, and G (Table 2), which can be compared to values reported in
the literature. The range of axial Young’s moduli Ea that fits our experiments is 0.6–1.1 GPa, consis-
tent with values of 0.5–2 GPa reported previously in the literature (Deriu et al., 2010;
Enemark et al., 2008; Wells and Aksimentiev, 2010; Sept and MacKintosh, 2010). Similarly, we
find Ec between 3–10 MPa, which is consistent with figures of a few MPa reported by some groups
(Wang et al., 2006; Tuszynski et al., 2005), though other groups also report Ec on the order of 1
GPa (Zeiger and Layton, 2008; Schaap et al., 2006). The discrepancy can be reconciled by noting
that small radial deformations only impactthe weak bridges between adjacent protofilaments, while
Figure 5 continued
corresponding to the point labeled c. Smaller insets show the shape of the cross-section at indicated points. (B) Profiles of flatness e (Equation 4) along
the dimensionless arclength coordinate s ¼ s=L (see Figure 1A) at points identified in panel A as a (green), b (blue), and c (red). Three insets show the
shape of the cross-section at indicated points for the curve labeled c (red). A fourth inset shows the curvature profiles corresponding, by color, to the
flatness profiles in the main figure.
DOI: https://doi.org/10.7554/eLife.34695.011
Memet et al. eLife 2018;7:e34695. DOI: https://doi.org/10.7554/eLife.34695 12 of 22
Research article Cell Biology Structural Biology and Molecular Biophysics

Figure 6. (bottom) Expected (Equation 6, with a numerical factor of unity) versus observed critical bending moments MB of simulated microtubules of
various lengths, elastic moduli, and optical bead sizes. Data points that correspond to actual experimental parameters are marked with stars, while the
rest are marked with black circles. The shaded region is zoomed-in on (top), to show that most experimental points fall in the range about 1000–2000
pN� nm.
Figure 6 continued on next page
Memet et al. eLife 2018;7:e34695. DOI: https://doi.org/10.7554/eLife.34695 13 of 22
Research article Cell Biology Structural Biology and Molecular Biophysics

larger ones may deform the tubulin dimers, which, like typical proteins, have a high stiffness in the
GPa range (Huang et al., 2008; Pampaloni et al., 2006; Needleman et al., 2005).
We also extract the microtubule shear modulus G, which assumes values of a few GPa (Table 2),
which is significantly larger than values reported in the literature (which can vary by as much as five
orders of magnitude) from around 1 (Pampaloni et al., 2006), to 1 MPa (Kis et al., 2002), up to 100
MPa (Deriu et al., 2010; Ding and Xu, 2011; Sept and MacKintosh, 2010). This is surprising, since
it is well-established that microtubule lateral bonds are very compliant; a small shear modulus is
believed to potentially help the microtubule correct defects in assembly by shifting the offset
between protofilaments during the nucleation phase (Sim and Sept, 2013). However, inter-protofila-
ment bonds may be very compliant for small deformations (on the 0.2 nm scale), while larger devia-
tions may approach the limit of physically deforming the tubulin units (Pampaloni et al., 2006).
Following estimates in (Pampaloni et al., 2006), a strain on the order of �0.01 would lead to defor-
mations on the 0.2 nm scale, while our experiments routinely go up to much larger strains around
�0.2. Therefore, it’s likely that the large values we obtained for shear modulus are due to large shear
deformations that surpass the elastic limits of inter-protofilament bonds.
Notably, sufficiently large deformations can induce (reversible) breaking of lateral contacts
between protofilaments and eventually even of longitudinal contacts between subunits in a protofila-
ment as observed in radial indentation simulations (Kononova et al., 2014; Jiang et al., 2017) and
corroborated with scanning force microscopy experiments (Schaap et al., 2004). Therefore, contact
breaking may constitute an alternate or co-occurring reason for the large shear modulus obtained
from fitting our experimental data. Thisis supported by comparable values of bending rigidity
emerging from radial indentation simulations in (Kononova et al., 2014) (25 pN ��m2) and from the
current paper (10–20 pN ��m2 where flattening and buckling become noticeable).
Softening may occur in parameter ranges typical of typical biologicalsystemsOur experimentally measured force-strain curves imply that the critical curvature for the onset of Bra-
zier buckling is relatively small, around 0.2 rad /�m. Such curvatures are frequently observed in both
in vitro and in vivo systems. For example, long-lived arcs and rings observed in microtubule gliding
assays (Liu et al., 2011; Bourdieu et al., 1995) have curvatures between 0.4–2 rad /�m. From a dif-
ferent perspective, microtubules are the essential structural motif of diverse non-equilibrium materi-
als including active isotropic gels, nematic liquid crystals, motile emulsions and deformable vesicles
(Sanchez et al., 2012; Keber et al., 2014). The rich dynamics of all these systems is driven by the
buckling instability of microtubule bundles that is driven by internal active stress generated by kine-
sin motors. In some systems the curvature associated with this buckling instability is large enough for
microtubule softening to be relevant.
In living organisms, the static curvatures of the quiescent eukaryotic flagella, such as those found
in Chlamydomonas Reinhardtii, are about 0.25 rad /�m (Sartori et al., 2016) while the oscillating
dynamic component can increase the curvature up to about 0.6 rad /�m (Geyer et al., 2016),
although presence of numerous microtubule associated proteins could significantly alter filament’s
mechanical properties. Furthermore, diverse active processes within a cellular cytoskeleton are also
capable of generating highly curved microtubule configurations (Brangwynne et al., 2006). We may
thus speculate about the biological significance of MT softening, with one hypothesis being that it
decreases MT susceptibility to mechanical failure or depolymerization (Mohrbach et al., 2012).
The majority of other previous experiments have only examined the properties of stabilized
microtubules which do not polymerize/depolymerize on relevant timescales. In comparison, a recent
significant advance examined mechanical properties of dynamical microtubules that coexist with a
background suspension of tubulin dimers (Schaedel et al., 2015). In particular, this study demon-
strated that repeated large-scale deformations locally damage microtubules, which leads to effec-
tively softer filaments. This damageis accompanied by a loss of tubulin monomers. Furthermore,
after the external force ceases the damaged filaments effectively self-repair, as the tubulin
Figure 6 continued
DOI: https://doi.org/10.7554/eLife.34695.012
Memet et al. eLife 2018;7:e34695. DOI: https://doi.org/10.7554/eLife.34695 14 of 22
Research article Cell Biology Structural Biology and Molecular Biophysics

monomers from the background suspensions incorporate back into the damaged regions. In com-
parison, here we study stabilized filaments that do not show any aging phenomena. However, it
seems plausible that the ovalization and the formation of kinks is also relevant to dynamical microtu-
bules, and the regions of high strain might be the location where monomers preferentially dissociate
from filament.
It is also worth noting that the softening of microtubules we observe is analogous to phenomena
that have already been observed and quantified in carbon nanotubes (e.g. see reviews by
[Thostenson et al., 2001; Wang et al., 2007]). In particular, experiments demonstrate the formation
of a single kink, followed by a multiple kink pattern upon further bending (Iijima et al., 1996), while
simulations predict a reduction in effective nanotube stiffness, as the buckling force drops and
remains almost constant after kinking eYakobson1996. Hysteresis due to plastic deformations trig-
gered by kinking events has also been observed, at least in the case of multi-walled carbon nano-
tubes (Jensen et al., 2007). Stiffness variations of carbon nanotubes arise from deformation modes
which cannot be explained by simple Euler-Bernoulli or Timoshenko rod models.
In conclusion, we have found that micron-long microtubules subject to buckling forces of a few
pN become more mechanically compliant at relatively low strains due to significant cross-sectional
deformations and subsequent buckling. This result seems biologically relevant, as the critical curva-
tures for the softening transition are surpassed, for instance, in the beating of Chlamydomonas fla-
gella. Additionally, the softening of MTs with increasing strain provides an explanation for the
discrepancy between values of flexural rigidity inferred by passive (thermal fluctuations) versus active
methods, since the latter typically access higher strains and thus infer effectively lower rigidities.
Despite the complex nature of microtubules, we found that their mechanical properties - at least as
concerning buckling experiments via optical trapping - can be quantitatively summarized by three
elastic moduli, even for very large strains, and need to be accounted for to explain observations that
arise naturally in many biological systems.
Materials and methods
Tubulin and microtubule polymerizationTubulin was purified from bovine brain tissue according to the established protocol (Castoldi and
Popov, 2003). We conjugated two fluorescent dyes: Alexa Flour 568 NHS Ester (Life Technologies,
A-20006), Alexa Flour 647 NHS Ester (Life Technologies, A-20003) orbiotin-PEG-NHS (Thermo Scien-
ti1c, 20217) to tubulin as described previously (Hyman et al., 1991). We prepared NEM-modified
tubulin by incubation of unmodified dimers at a concentration of 13 mg/ml with 1 mM NEM (N-Eth-
ylmaleimide, Sigma, E3876) and 0.5 mM GMPCPP (Jena Bioscience, NU-405S) on ice for 10 min and
then quenching the reaction with 8 mM beta-mercapthoethanol (Sigma, M6250) for another 10 mins
(Hyman et al., 1991). All labeled and unlabeled tubulin monomers were stored at �80�C.
Bead functionalizationCarboxyl silica microspheres (d = 0.97 �m, Bangs Labs SC04N/9895) were coated with NeutrAvidin-
DyLight488 conjugate (Thermo Scientific, 22832) by incubating the mixture of beads and protein at
pH = 8.0 in presence of N-Hydroxysuccinimide (NHS, Sigma, 130672) and N-(3-Dimethylamino-
propyl)-N’-ethylcarbodiimide hydrochloride (EDC, Sigma, E6383). The use of fluorescently labeled
protein allows the bead to be imaged with fluorescence microscopy in order to verify Neutravidin
presence on the surface. However, this is not always desirable. We have tested the protocol with a
number of Neutravidin and Streptavidin proteins from various suppliers (Sigma, Thermo Fisher) and
concluded that the protein attachment to the surface is reliable and reproducible.
Buffer solutionsMicrotubules (MTs) were polymerized in the M2B buffer that contained 80 mM PIPES (Sigma,
P6757), 2 mM MgCl 2, 1 mM EGTA (Sigma, E3889) and was titrated to pH = 6.8 with KOH. As a
result of titration with potassium hydroxide, the buffer contained 140 mM of K + ions. In order to
extend the range of accessible ionic strength in the solution, we used M2B- 20 buffer that contained
20 mM PIPES, 2 mM MgCl 2, 1 mM EGTA and was titrated to pH = 6.8 with KOH. As a result of
titration with potassium hydroxide, the buffer contained ~35 mM of K + ions. Oxygen scavenger
Memet et al. eLife 2018;7:e34695. DOI: https://doi.org/10.7554/eLife.34695 15 of 22
Research article Cell Biology Structural Biology and Molecular Biophysics
solution was prepared immediately before use by combining equal volumes of solutions of glucose
(Sigma, G7528), glucose oxidase (Sigma, G2133) and catalase (Sigma, C40). Resulting mixture was
dilutedinto the final sample in order to achieve the following concentrations: 40 mM Glucose, 250
nM glucose oxidase, 60 nM catalase (Gell et al., 2010).
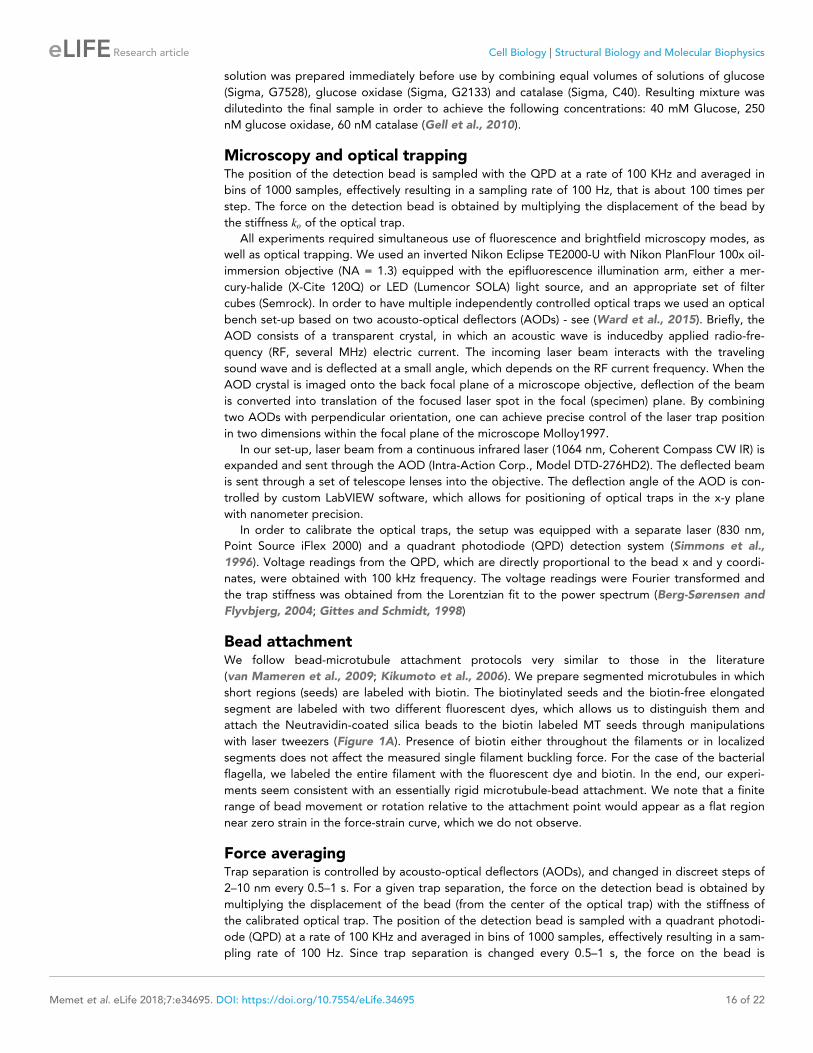
Microscopy and optical trappingThe position of the detection bead is sampled with the QPD at a rate of 100 KHz and averaged in
bins of 1000 samples, effectively resulting in a sampling rate of 100 Hz, that is about 100 times per
step. The force on the detection bead is obtained by multiplying the displacement of the bead by
the stiffness ko of the optical trap.
All experiments required simultaneous use of fluorescence and brightfield microscopy modes, as
well as optical trapping. We used an inverted Nikon Eclipse TE2000-U with Nikon PlanFlour 100x oil-
immersion objective (NA = 1.3) equipped with the epifluorescence illumination arm, either a mer-
cury-halide (X-Cite 120Q) or LED (Lumencor SOLA) light source, and an appropriate set of filter
cubes (Semrock). In order to have multiple independently controlled optical traps we used an optical
bench set-up based on two acousto-optical deflectors (AODs) - see (Ward et al., 2015). Briefly, the
AOD consists of a transparent crystal, in which an acoustic wave is inducedby applied radio-fre-
quency (RF, several MHz) electric current. The incoming laser beam interacts with the traveling
sound wave and is deflected at a small angle, which depends on the RF current frequency. When the
AOD crystal is imaged onto the back focal plane of a microscope objective, deflection of the beam
is converted into translation of the focused laser spot in the focal (specimen) plane. By combining
two AODs with perpendicular orientation, one can achieve precise control of the laser trap position
in two dimensions within the focal plane of the microscope Molloy1997.
In our set-up, laser beam from a continuous infrared laser (1064 nm, Coherent Compass CW IR) is
expanded and sent through the AOD (Intra-Action Corp., Model DTD-276HD2). The deflected beam
is sent through a set of telescope lenses into the objective. The deflection angle of the AOD is con-
trolled by custom LabVIEW software, which allows for positioning of optical traps in the x-y plane
with nanometer precision.
In order to calibrate the optical traps, the setup was equipped with a separate laser (830 nm,
Point Source iFlex 2000) and a quadrant photodiode (QPD) detection system (Simmons et al.,
1996). Voltage readings from the QPD, which are directly proportional to the bead x and y coordi-
nates, were obtained with 100 kHz frequency. The voltage readings were Fourier transformed and
the trap stiffness was obtained from the Lorentzian fit to the power spectrum (Berg-Sørensen and
Flyvbjerg, 2004; Gittes and Schmidt, 1998)
Bead attachmentWe follow bead-microtubule attachment protocols very similar to those in the literature
(van Mameren et al., 2009; Kikumoto et al., 2006). We prepare segmented microtubules in which
short regions (seeds) are labeled with biotin. The biotinylated seeds and the biotin-free elongated
segment are labeled with two different fluorescent dyes, which allows us to distinguish them and
attach the Neutravidin-coated silica beads to the biotin labeled MT seeds through manipulations
with laser tweezers (Figure 1A). Presence of biotin either throughout the filaments or in localized
segments does not affect the measured single filament buckling force. For the case of the bacterial
flagella, we labeled the entire filament with the fluorescent dye and biotin. In the end, our experi-
ments seem consistent with an essentially rigid microtubule-bead attachment. We note that a finite
range of bead movement or rotation relative to the attachment point would appear as a flat region
near zero strain in the force-strain curve, which we do not observe.
Force averagingTrap separation is controlled by acousto-optical deflectors (AODs), and changed in discreet steps of
2–10 nm every 0.5–1 s. For a given trap separation, the force on the detection bead is obtained by
multiplying the displacement of the bead (from the center of the optical trap) with the stiffness of
the calibrated optical trap. The position of the detection bead is sampled with a quadrant photodi-
ode (QPD) at a rate of 100 KHz and averaged in bins of 1000 samples, effectively resulting in a sam-
pling rate of 100 Hz. Since trap separation is changed every 0.5–1 s, the force on the bead is
Memet et al. eLife 2018;7:e34695. DOI: https://doi.org/10.7554/eLife.34695 16 of 22
Research article Cell Biology Structural Biology and Molecular Biophysics
measured 50–100 times at a given distance. Several cycles of buckling and extension (”back-and-
forth runs’) are performed for a given filament so that in the end, the raw force data is binned by
trap separation and the average and standard deviation of the force in each bin are computed.
Notably, then, force is averaged both over time and over multiple runs.
The minimum in the force-displacement curve separates the tensile and the compressive regimes
and allows us to determine the equilibrium bead separation of the beads, that is the effective length
L of the filament segment being actively stretched or buckled. Due to thermal fluctuations and other
noise, experimentally measured forces fluctuate in direction (and magnitude). Since fluctuations in
the direction perpendicular to the line connecting the optical traps average out to zero, the forces
reported in our manuscript are the parallel components. In the manuscript, we present force - aver-
aged and projected as explained - in terms of strain corresponding to bead separation, rather than
optical trap separation (the schematic in Figure 1A illustrates the distinction). We compute bead
separation from trap separation, measured force, and optical trap stiffness.
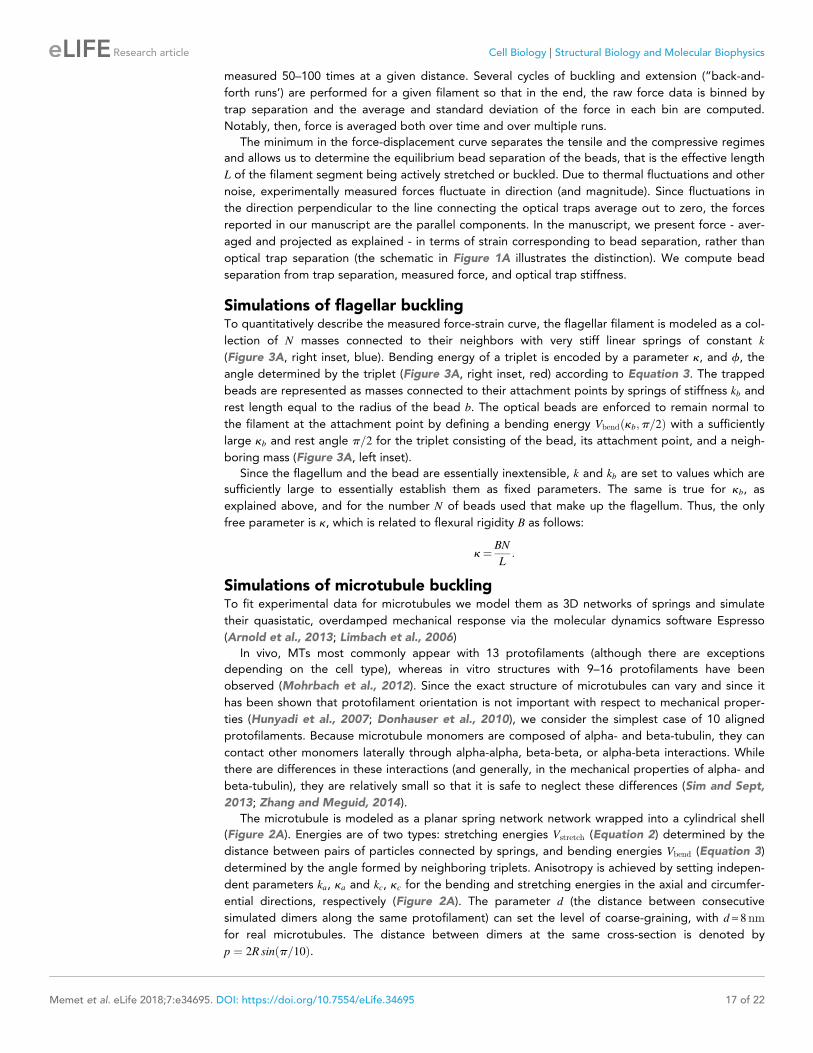
Simulations of flagellar bucklingTo quantitatively describe the measured force-strain curve, the flagellar filament is modeled as a col-
lection of N masses connected to their neighbors with very stiff linear springs of constant k
(Figure 3A, right inset, blue). Bending energy of a triplet is encoded by a parameter k, and f, the
angle determined by the triplet (Figure 3A, right inset, red) according to Equation 3. The trapped
beads are represented as masses connected to their attachment points by springs of stiffness kb and
rest length equal to the radius of the bead b. The optical beads are enforced to remain normal to
the filament at the attachment point by defining a bending energy Vbend kb;p=2ð Þ with a sufficiently
large kb and rest angle p=2 for the triplet consisting of the bead, its attachment point, and a neigh-
boring mass (Figure 3A, left inset).
Since the flagellum and the bead are essentially inextensible, k and kb are set to values which are
sufficiently large to essentially establish them as fixed parameters. The same is true for kb, as
explained above, and for the number N of beads used that make up the flagellum. Thus, the only
free parameter is k, which is related to flexural rigidity B as follows:
k¼ BN
L:
Simulations of microtubule bucklingTo fit experimental data for microtubules we model them as 3D networks of springs and simulate
their quasistatic, overdamped mechanical response via the molecular dynamics software Espresso
(Arnold et al., 2013; Limbach et al., 2006)
In vivo, MTs most commonly appear with 13 protofilaments (although there are exceptions
depending on the cell type), whereas in vitro structures with 9–16 protofilaments have been
observed (Mohrbach et al., 2012). Since the exact structure of microtubules can vary and since it
has been shown that protofilament orientation is not important with respect to mechanical proper-
ties (Hunyadi et al., 2007; Donhauser et al., 2010), we consider the simplest case of 10 aligned
protofilaments. Because microtubule monomers are composed of alpha- and beta-tubulin, they can
contact other monomers laterally through alpha-alpha, beta-beta, or alpha-beta interactions. While
there are differences in these interactions (and generally, in the mechanical properties of alpha- and
beta-tubulin), they are relatively small so that it is safe to neglect these differences (Sim and Sept,
2013; Zhang and Meguid, 2014).
The microtubule is modeled as a planar spring network network wrapped into a cylindrical shell
(Figure 2A). Energies are of two types: stretching energies Vstretch (Equation 2) determined by the
distance between pairs of particles connected by springs, and bending energies Vbend (Equation 3)
determined by the angle formed by neighboring triplets. Anisotropy is achieved by setting indepen-
dent parameters ka, ka and kc, kc for the bending and stretching energies in the axial and circumfer-
ential directions, respectively (Figure 2A). The parameter d (the distance between consecutive
simulated dimers along the same protofilament) can set the level of coarse-graining, with d » 8nm
for real microtubules. The distance between dimers at the same cross-section is denoted by
p ¼ 2R sin p=10ð Þ.
Memet et al. eLife 2018;7:e34695. DOI: https://doi.org/10.7554/eLife.34695 17 of 22
Research article Cell Biology Structural Biology and Molecular Biophysics
Table 1 shows the relationship between the microscopic parameters of the model and the three
corresponding macroscopic elastic constants Ea, Ec and G. The formulas are based on the ortho-
thropic elastic shell model and involve an ‘equivalent’ thickness h and a ‘effective’ thickness for
bending h0. The reason for this duality is that the actual thickness of the cross section of a microtu-
bule varies periodically along the circumferential direction, between a minimum of about 1.1 nm (the
‘bridge’ thickness) and a maximum of about 4–5 nm (Huang et al., 2008). When modeled as a shell
of uniform thickness, the actual cross section of a microtubule is replaced by an annular cross section
with equivalent thickness h » 2:7 nm (de Pablo et al., 2003). However, the effective bending stiffness
is different; since most of the strain is localized to the bridges between the protofilaments
(Schaap et al., 2006), the effective bending stiffness is closer to the bridge thickness. According to
(de Pablo et al., 2003; Schaap et al., 2006), h0 » 1:6 nm.
It must be noted that microtubules are not exactly thin shells, while the formulas shown in Table 1
apply in that limit. As a consequence, the numerical factors in the formulas are not precisely correct.
Because of this, the formulas need to be adjusted by numerical factors; we do so by considering, for
instance, a basic shear deformation, computing its elastic strain energy and adjusting the numerical
factor to ensure agreement between the energy computed in the simulation and the theoretical
energy. Interestingly, the orthotropic shell model does not contain an energy penalty for cross-sec-
tional shearing. In simulations, this leads to an unphysical instability which can be resolved, for
instance, by running the simulation at very high damping (which would, however, greatly increase
the runtime). A faster way of resolving this artifact is to stabilize the microtubule in the lateral direc-
tion, effectively not allowing its centerline to break lateral symmetry by going out of plane.
Each optical bead is represented by a particle connected to a single particle on the microtubule
by a very stiff spring as well as a very stiff angle interaction aimed at keeping the ‘bead’ perpendicu-
lar to the attachment point. The left bead is fixed, while the right one is free to move. Starting with
the filament unstretched, we move the mobile bead in small increments dx. After each move, we fix
the position of the bead and allow the system to relax. The relaxation time is (Gittes et al., 1993):
trelax ~gL4
B;
where g is the friction coefficient. The parameter g determines both how fast the system relaxes
(smaller g leads to faster relaxation) and how fast its kinetic energy decays (larger g leads to faster
decay). Sufficiently large values of g correspond to overdamped kinetics, but the trade-off between
relaxation and decay of kinetic energy implies that intermediate values of g optimize computation
time. Such values of g are still acceptable, as theywill lead to the same results provided kinetic
energy has dissipated sufficiently and that there are no instabilities. To check that the value of g and
the relaxation timescales are adequate, the system can be run forwards then backwards - if there is
no hysteresis, then the parameters are adequate. This only holds until the system undergoes a kink-
ing transition; once kinking takes place, hysteresis will occur even in the truly overdamped limit.
AcknowledgementsThe experimental portion of this work was primarily supported by the U.S. Department of Energy,
Office of Basic Energy Sciences, through award DE-SC0010432TDD (FH and ZD) while the theoreti-
cal portion was supported by Harvard MRSEC through grant NSF DMR 14-20570. Experiments on
bacterial flagella were supported by National Science Foundationthrough grant NSF-MCB-1329623
and NSF- DMR-1420382. We also acknowledge use of the Brandeis Materials Research Science and
Engineering Center (MRSEC) optical and biosynthesis facilities supported by NSF-MRSEC-1420382
Additional information
Funding
Funder Grant reference number Author
U.S. Department of Energy DE-SC0010432TDD Feodor HilitskZvonimir Dogic
Memet et al. eLife 2018;7:e34695. DOI: https://doi.org/10.7554/eLife.34695 18 of 22
Research article Cell Biology Structural Biology and Molecular Biophysics

National Science Foundation NSF-MCB-1329623 Zvonimir Dogic
National Science Foundation DMR-1420382 Zvonimir Dogic
Harvard MRSEC NSF DMR 14-20570 Edvin MemetL Mahadevan
The funders had no role in study design, data collection and interpretation, or the
decision to submit the work for publication.
Author contributions
Edvin Memet, Conceptualization, Software, Formal analysis, Investigation, Visualization, Methodol-
ogy, Writing—original draft, Writing—review and editing; Feodor Hilitski, Data curation, Software,
Validation, Investigation, Methodology, Writing—review and editing; Margaret A Morris, Formal
analysis, Investigation; Walter J Schwenger, Data curation, Software, Formal analysis; Zvonimir
Dogic, Formal analysis, Funding acquisition, Project administration, Writing—review and editing; L
Mahadevan, Conceptualization, Formal analysis, Supervision, Funding acquisition, Methodology,
Project administration, Writing—review and editing
Author ORCIDs
Edvin Memet http://orcid.org/0000-0001-9414-597X
Feodor Hilitski https://orcid.org/0000-0001-5629-1407
Zvonimir Dogic http://orcid.org/0000-0003-0142-1838
L Mahadevan http://orcid.org/0000-0002-5114-0519
Decision letter and Author response
Decision letter https://doi.org/10.7554/eLife.34695.022
Author response https://doi.org/10.7554/eLife.34695.023
Additional filesSupplementary files. Source Code 1. Source code files and source data for Figure 6 and source code files along with
instructions for generating the data in Figure 2.
DOI: https://doi.org/10.7554/eLife.34695.013
. Supplementary file 1. List of parameters used in the paper.
DOI: https://doi.org/10.7554/eLife.34695.014
. Supplementary file 2. (left) Summary of previous experiments examining microtubule stiffness,
adapted from (Hawkins et al., 2010). (right) Box plot comparing bending stiffness values obtained
via thermal fluctuations and mechanicalbending for microtubules stabilized with GDP
Tubulin + Taxol (orange), GMPCPP Tubulin (green), and GDP Tubulin (blue)
DOI: https://doi.org/10.7554/eLife.34695.015
. Transparent reporting form
DOI: https://doi.org/10.7554/eLife.34695.016
Data availability
Source data has been provided for Figure 6 along with source code files. Source code files have
been provided for Figure 2 along with instructions for generating the data.
The following previously published dataset was used:
Author(s) Year Dataset title Dataset URL
Database, license,and accessibilityinformation
Hawkins T, MirigianM, Yasar MS, RossJL
2010 Flexural Rigidity of SingleMicrotubules.
https://doi.org/10.1016/j.jbiomech.2009.09.005
The data used isavailable in thefigures and tables ofthe manuscript
Memet et al. eLife 2018;7:e34695. DOI: https://doi.org/10.7554/eLife.34695 19 of 22
Research article Cell Biology Structural Biology and Molecular Biophysics

ReferencesArnold A, Lenz O, Kesselheim S, Weeber R, Fahrenberger F, Roehm D, Kosovan P, Holm C. 2013. ESPResSo 3.1— Molecular Dynamics Software for Coarse-Grained Models. In: Griebel M, Schweitzer M. A (Eds). MeshfreeMethods for Partial Differential Equations VI. 89 Springer. p. 1–23 . DOI: https://doi.org/10.1007/978-3-642-32979-1_1
Berg-Sørensen K, Flyvbjerg H. 2004. Power spectrum analysis for optical tweezers. Review of ScientificInstruments 75:594–612. DOI: https://doi.org/10.1063/1.1645654
Bourdieu L, Duke T, Elowitz MB, Winkelmann DA, Leibler S, Libchaber A. 1995. Spiral defects in motility assays:A measure of motor protein force. Physical Review Letters 75:176–179. DOI: https://doi.org/10.1103/PhysRevLett.75.176, PMID: 10059144
Brangwynne CP, Koenderink GH, Barry E, Dogic Z, MacKintosh FC, Weitz DA. 2007. Bending dynamics offluctuating biopolymers probed by automated high-resolution filament tracking. Biophysical Journal 93:346–359. DOI: https://doi.org/10.1529/biophysj.106.096966, PMID: 17416612
Brangwynne CP, MacKintosh FC, Kumar S, Geisse NA, Talbot J, Mahadevan L, Parker KK, Ingber DE, Weitz DA.2006. Microtubules can bear enhanced compressive loads in living cells because of lateral reinforcement. TheJournal of Cell Biology 173:733–741. DOI: https://doi.org/10.1083/jcb.200601060, PMID: 16754957
Brazier LG. 1927. On the flexure of thin cylindrical shells and other "Thin" Sections. Proceedings of the RoyalSociety A: Mathematical, Physical and Engineering Sciences 116:104–114. DOI: https://doi.org/10.1098/rspa.1927.0125
Calladine CR. 1983. Theory of Shell Structures. Cambridge University Press.Cassimeris L, Gard D, Tran PT, Erickson HP. 2001. XMAP215 is a long thin molecule that does not increasemicrotubule stiffness. Journal of Cell Science 114:3025–3033. PMID: 11686305
Castoldi M, Popov AV. 2003. Purification of brain tubulin through two cycles of polymerization-depolymerizationin a high-molarity buffer. Protein Expression and Purification 32:83–88. DOI: https://doi.org/10.1016/S1046-5928(03)00218-3, PMID: 14680943
Darnton NC, Berg HC. 2007. Force-extension measurements on bacterial flagella: triggering polymorphictransformations. Biophysical Journal 92:2230–2236. DOI: https://doi.org/10.1529/biophysj.106.094037,PMID: 17172309
de Pablo PJ, Schaap IA, MacKintosh FC, Schmidt CF. 2003. Deformation and collapse of microtubules on thenanometer scale. Physical Review Letters 91:098101. DOI: https://doi.org/10.1103/PhysRevLett.91.098101,PMID: 14525215
Deriu MA, Soncini M, Orsi M, Patel M, Essex JW, Montevecchi FM, Redaelli A. 2010. Anisotropic elastic networkmodeling of entire microtubules. Biophysical Journal 99:2190–2199. DOI: https://doi.org/10.1016/j.bpj.2010.06.070, PMID: 20923653
Ding Y, Xu Z. 2011. Mechanics of microtubules from a coarse-grained model. BioNanoScience 1:173–182.DOI: https://doi.org/10.1007/s12668-011-0027-0
Donhauser ZJ, Jobs WB, Binka EC. 2010. Mechanics of microtubules: effects of protofilament orientation.Biophysical Journal 99:1668–1675. DOI: https://doi.org/10.1016/j.bpj.2010.06.065, PMID: 20816081
Dye RB, Fink SP, Williams RC. 1993. Taxol-induced flexibility of microtubules and its reversal by MAP-2 and tau.The Journal of Biological Chemistry 268:6847–6850. PMID: 8096507
Enemark S, Deriu MA, Soncini M, Redaelli A. 2008. Mechanical model of the tubulin dimer based on moleculardynamics simulations. Journal of Biomechanical Engineering 130:041008. DOI: https://doi.org/10.1115/1.2913330, PMID: 18601450
Felgner H, Frank R, Schliwa M. 1996. Flexural rigidity of microtubules measured with the use of optical tweezers.Journal of Cell Science 109:509–516. PMID: 8838674
Fujime S, Maruyama M, Asakura S. 1972. Flexural rigidity of bacterial flagella studied by quasielastic scattering oflaser light. Journal of Molecular Biology. 68:347–359. DOI: https://doi.org/10.1016/0022-2836(72)90217-3,PMID: 5069792
Gao Y, Wang J, Gao H. 2010. Persistence length of microtubules based on a continuum anisotropic shell model.Journal of Computational and Theoretical Nanoscience 7:1227–1237. DOI: https://doi.org/10.1166/jctn.2010.1476
Gell C, Bormuth V, Brouhard GJ, Cohen DN, Diez S, Friel CT, Helenius J, Nitzsche B, Petzold H, Ribbe J, SchafferE, Stear JH, Trushko A, Varga V, Widlund PO, Zanic M, Howard J. 2010. Microtubule dynamics reconstituted invitro and imaged by single-molecule fluorescence microscopy. Methods in Cell Biology 95:221–245.DOI: https://doi.org/10.1016/S0091-679X(10)95013-9, PMID: 20466138
Geyer VF, Sartori P, Friedrich BM, Julicher F, Howard J. 2016. Independent control of the static and dynamiccomponents of the chlamydomonas flagellar beat. Current Biology 26:1098–1103. DOI: https://doi.org/10.1016/j.cub.2016.02.053, PMID: 27040779
Gittes F, Mickey B, Nettleton J, Howard J. 1993. Flexural rigidity of microtubules and actin filaments measuredfrom thermal fluctuations in shape. The Journal of Cell Biology 120:923–934. DOI: https://doi.org/10.1083/jcb.120.4.923, PMID: 8432732
Gittes F, Schmidt CF. 1998. Signals and noise in micromechanical measurements. Methods in Cell Biology 55:129–156 . DOI: https://doi.org/10.1016/S0091-679X(08)60406-9, PMID: 9352515
Hawkins T, Mirigian M, Selcuk Yasar M, Ross JL. 2010. Mechanics of microtubules. Journal of Biomechanics 43:23–30. DOI: https://doi.org/10.1016/j.jbiomech.2009.09.005, PMID: 19815217
Memet et al. eLife 2018;7:e34695. DOI: https://doi.org/10.7554/eLife.34695 20 of 22
Research article Cell Biology Structural Biology and Molecular Biophysics

Hilitski F, Ward AR, Cajamarca L, Hagan MF, Grason GM, Dogic Z. 2015. Measuring cohesion betweenmacromolecular filaments one pair at a time: depletion-induced microtubule bundling. Physical Review Letters114:138102. DOI: https://doi.org/10.1103/PhysRevLett.114.138102, PMID: 25884139
Howard J. 2001. Mechanics of Motor Proteins and the Cytoskeleton. Sinauer Associates.Huang GY, Mai YW, Ru CQ, Cq R. 2008. Surface deflection of a microtubule loaded by a concentrated radialforce. Nanotechnology 19:125101. DOI: https://doi.org/10.1088/0957-4484/19/12/125101, PMID: 21817720
Huang YS, Hsu FL, Lee CM, Juang JY. 2017. Failure mechanism of hollow tree trunks due to cross-sectionalflattening. Royal Society Open Science 4:160972. DOI: https://doi.org/10.1098/rsos.160972, PMID: 28484616
Hunyadi V, Chretien D, Flyvbjerg H, Janosi IM. 2007. Why is the microtubule lattice helical? Biology of the Cell99:117–128. DOI: https://doi.org/10.1042/BC20060059, PMID: 17222084
Hyman A, Drechsel D, Kellogg D, Salser S, Sawin K, Steffen P, Wordeman L, Mitchison T. 1991. Preparation ofmodified tubulins. Methods in Enzymology 196:478–485 . DOI: https://doi.org/10.1016/0076-6879(91)96041-O,PMID: 2034137
Iijima S, Brabec C, Maiti A, Bernholc J. 1996. Structural flexibility of carbon nanotubes. The Journal of ChemicalPhysics 104:2089–2092. DOI: https://doi.org/10.1063/1.470966
Janson ME, Dogterom M. 2004. A bending mode analysis for growing microtubules: evidence for a velocity-dependent rigidity. Biophysical Journal 87:2723–2736. DOI: https://doi.org/10.1529/biophysj.103.038877,PMID: 15454464
Jensen K, Mickelson W, Kis A, Zettl A. 2007. Buckling and kinking force measurements on individual multiwalledcarbon nanotubes. Physical Review B 76:195436. DOI: https://doi.org/10.1103/PhysRevB.76.195436
Jiang H, Zhang J. 2008. Mechanics of microtubule buckling supported by cytoplasm. Journal of AppliedMechanics 75:061019. DOI: https://doi.org/10.1115/1.2966216
Jiang N, Bailey ME, Burke J, Ross JL, Dima RI. 2017. Modeling the effects of lattice defects on microtubulebreaking and healing. Cytoskeleton 74:3–17. DOI: https://doi.org/10.1002/cm.21346, PMID: 27935245
Kamiya R, Asakura S, Yamaguchi S. 1980. Formation of helical filaments by copolymerization of two types of’straight’ flagellins. Nature 286:628–630. DOI: https://doi.org/10.1038/286628a0, PMID: 7402342
Kasas S, Cibert C, Kis A, De Los Rios P, Riederer BM, Forro L, Dietler G, Catsicas S. 2004. Oscillation modes ofmicrotubules. Biology of the Cell 96:697–700. DOI: https://doi.org/10.1016/j.biolcel.2004.09.002,PMID: 15567524
Keber FC, Loiseau E, Sanchez T, DeCamp SJ, Giomi L, Bowick MJ, Marchetti MC, Dogic Z, Bausch AR. 2014.Topology and dynamics of active nematic vesicles. Science 345:1135–1139. DOI: https://doi.org/10.1126/science.1254784, PMID: 25190790
Kikumoto M, Kurachi M, Tosa V, Tashiro H. 2006. Flexural rigidity of individual microtubules measured by abuckling force with optical traps. Biophysical Journal 90:1687–1696. DOI: https://doi.org/10.1529/biophysj.104.055483, PMID: 16339879
Kis A, Kasas S, Babic B, Kulik AJ, Benoıt W, Briggs GA, Schonenberger C, Catsicas S, Forro L. 2002.Nanomechanics of microtubules. Physical Review Letters 89:248101. DOI: https://doi.org/10.1103/PhysRevLett.89.248101, PMID: 12484982
Kononova O, Kholodov Y, Theisen KE, Marx KA, Dima RI, Ataullakhanov FI, Grishchuk EL, Barsegov V. 2014.Tubulin bond energies and microtubule biomechanics determined from nanoindentation in silico. Journal of theAmerican Chemical Society 136:17036–17045. DOI: https://doi.org/10.1021/ja506385p, PMID: 25389565
Kurachi M, Hoshi M, Tashiro H. 1995. Buckling of a single microtubule by optical trapping forces: directmeasurement of microtubule rigidity. Cell Motility and the Cytoskeleton 30:221–228. DOI: https://doi.org/10.1002/cm.970300306, PMID: 7758138
Li T. 2008. A mechanics model of microtubule buckling in living cells. Journal of Biomechanics 41:1722–1729.DOI: https://doi.org/10.1016/j.jbiomech.2008.03.003, PMID: 18433758
Limbach HJ, Arnold A, Mann BA, Holm C. 2006. ESPResSo—an extensible simulation package for research onsoft matter systems. Computer Physics Communications. 174:704–727. DOI: https://doi.org/10.1016/j.cpc.2005.10.005
Liu L, Tuzel E, Ross JL. 2011. Loop formation of microtubules during gliding at high density. Journal of Physics:Condensed Matter 23:374104. DOI: https://doi.org/10.1088/0953-8984/23/37/374104, PMID: 21862840
Louzon D, Ginsburg A, Schwenger W, Dvir T, Dogic Z, Raviv U. 2017. Structure and intermolecular interactionsbetween l-type straight flagellar filaments. Biophysical Journal 112:2184–2195. DOI: https://doi.org/10.1016/j.bpj.2017.02.038, PMID: 28538155
Mickey B, Howard J. 1995. Rigidity of microtubules is increased by stabilizing agents. The Journal of Cell Biology130:909–917. DOI: https://doi.org/10.1083/jcb.130.4.909, PMID: 7642706
Mohrbach H, Johner A, Kulic IM. 2012. Cooperative lattice dynamics and anomalous fluctuations ofmicrotubules. European Biophysics Journal 41:217–239. DOI: https://doi.org/10.1007/s00249-011-0778-0,PMID: 22173449
Needleman DJ, Ojeda-Lopez MA, Raviv U, Ewert K, Miller HP, Wilson L, Safinya CR. 2005. Radial compression ofmicrotubules and the mechanism of action of taxol and associated proteins. Biophysical Journal 89:3410–3423.DOI: https://doi.org/10.1529/biophysj.104.057679, PMID: 16100275
Nogales E, Whittaker M, Milligan RA, Downing KH. 1999. High-resolution model of the microtubule. Cell 96:79–88. DOI: https://doi.org/10.1016/S0092-8674(00)80961-7, PMID: 9989499
Pampaloni F, Lattanzi G, Jonas A, Surrey T, Frey E, Florin EL. 2006. Thermal fluctuations of grafted microtubulesprovide evidence of a length-dependent persistence length. PNAS 103:10248–10253. DOI: https://doi.org/10.1073/pnas.0603931103, PMID: 16801537
Memet et al. eLife 2018;7:e34695. DOI: https://doi.org/10.7554/eLife.34695 21 of 22
Research article Cell Biology Structural Biology and Molecular Biophysics
Sanchez T, Chen DT, DeCamp SJ, Heymann M, Dogic Z. 2012. Spontaneous motion in hierarchically assembledactive matter. Nature 491:431–434. DOI: https://doi.org/10.1038/nature11591, PMID: 23135402
Sartori P, Geyer VF, Scholich A, Julicher F, Howard J. 2016. Dynamic curvature regulation accounts for thesymmetric and asymmetric beats of Chlamydomonas flagella. eLife. 5:e13258. DOI: https://doi.org/10.7554/eLife.13258, PMID: 27166516
Schaap IA, Carrasco C, de Pablo PJ, MacKintosh FC, Schmidt CF, Response E. 2006. Elastic response, buckling,and instability of microtubules under radial indentation. Biophysical Journal 91:1521–1531. DOI: https://doi.org/10.1529/biophysj.105.077826, PMID: 16731557
Schaap IA, de Pablo PJ, Schmidt CF. 2004. Resolving the molecular structure of microtubules under physiologicalconditions with scanning force microscopy. European Biophysics Journal 33:462–467. DOI: https://doi.org/10.1007/s00249-003-0386-8, PMID: 14762705
Schaedel L, John K, Gaillard J, Nachury MV, Blanchoin L, Thery M. 2015. Microtubules self-repair in response tomechanical stress. Nature Materials 14:1156–1163. DOI: https://doi.org/10.1038/nmat4396, PMID: 26343914
Sept D, MacKintosh FC. 2010. Microtubule elasticity: connecting all-atom simulations with continuum mechanics.Physical Review Letters 104. DOI: https://doi.org/10.1103/PhysRevLett.104.018101, PMID: 20366396
Sim H, Sept D. 2013. Properties of microtubules with isotropic and anisotropic mechanics. Cellular and MolecularBioengineering 6:361–368. DOI: https://doi.org/10.1007/s12195-013-0302-y
Simmons RM, Finer JT, Chu S, Spudich JA. 1996. Quantitative measurements of force and displacement using anoptical trap. Biophysical Journal 70:1813–1822. DOI: https://doi.org/10.1016/S0006-3495(96)79746-1
Takano A. 2013. Interaction between euler buckling and brazier instability. Journal of Solid Mechanics andMaterials Engineering 7:92–101. DOI: https://doi.org/10.1299/jmmp.7.92
Takasone T, Juodkazis S, Kawagishi Y, Yamaguchi A, Matsuo S, Sakakibara H, Nakayama H, Misawa H. 2002.Flexural rigidity of a single microtubule. Japanese Journal of Applied Physics 41:3015–3019. DOI: https://doi.org/10.1143/JJAP.41.3015
Thostenson ET, Ren Z, Chou T-W. 2001. Advances in the science and technology of carbon nanotubes and theircomposites: a review. Composites Science and Technology. 61:1899–1912. DOI: https://doi.org/10.1016/S0266-3538(01)00094-X
Timoshenko SP, Gere JM. 2012. Theory of Elastic Stability. Dover Publications.Tuszynski JA, Luchko T, Portet S, Dixon JM. 2005. Anisotropic elastic properties of microtubules. The EuropeanPhysical Journal. E, Soft Matter 17:29–35. DOI: https://doi.org/10.1140/epje/i2004-10102-5, PMID: 15864724
Van den Heuvel MG, de Graaff MP, Dekker C. 2008. Microtubule curvatures under perpendicular electric forcesreveal a low persistence length. PNAS 105:7941–7946. DOI: https://doi.org/10.1073/pnas.0704169105,PMID: 18359849
van Mameren J, Vermeulen KC, Gittes F, Schmidt CF. 2009. Leveraging single protein polymers to measureflexural rigidity. The Journal of Physical Chemistry B 113:3837–3844. DOI: https://doi.org/10.1021/jp808328a,PMID: 19673071
VanBuren V, Odde DJ, Cassimeris L. 2002. Estimates of lateral and longitudinal bond energies within themicrotubule lattice. PNAS 99:6035–6040. DOI: https://doi.org/10.1073/pnas.092504999, PMID: 11983898
Venier P, Maggs AC, Carlier MF, Pantaloni D. 1994. Analysis of microtubule rigidity using hydrodynamic flow andthermal fluctuations. The Journal of Biological Chemistry 269:13353–13360. PMID: 7909808
Wang CY, Ru CQ, Mioduchowski A. 2006. Orthotropic elastic shell model for buckling of microtubules. PhysicalReview E 74. DOI: https://doi.org/10.1103/PhysRevE.74.052901
Wang CY, Zhang YY, Wang CM, Tan VB, Vbc T. 2007. Buckling of carbon nanotubes: a literature survey. Journalof Nanoscience and Nanotechnology 7:4221–4247. DOI: https://doi.org/10.1166/jnn.2007.924, PMID: 18283798
Wang MD, Yin H, Landick R, Gelles J, Block SM. 1997. Stretching DNA with optical tweezers. BiophysicalJournal. 72:1335–1346. DOI: https://doi.org/10.1016/S0006-3495(97)78780-0, PMID: 9138579
Ward A, Hilitski F, Schwenger W, Welch D, Lau AW, Vitelli V, Mahadevan L, Dogic Z. 2015. Solid friction betweensoft filaments. Nature Materials 14:583–588. DOI: https://doi.org/10.1038/nmat4222, PMID: 25730393
Wells DB, Aksimentiev A. 2010. Mechanical properties of a complete microtubule revealed through moleculardynamics simulation. Biophysical Journal 99:629–637. DOI: https://doi.org/10.1016/j.bpj.2010.04.038,PMID: 20643083
Yakobson BI, Brabec CJ, Berhnolc J. 1996. Nanomechanics of carbon tubes: Instabilities beyond linear response.Physical Review Letters 76:2511–2514. DOI: https://doi.org/10.1103/PhysRevLett.76.2511, PMID: 10060718
Yonekura K, Maki-Yonekura S, Namba K. 2003. Complete atomic model of the bacterial flagellar filament byelectron cryomicroscopy. Nature 424:643–650. DOI: https://doi.org/10.1038/nature01830, PMID: 12904785
Zeiger AS, Layton BE. 2008. Molecular modeling of the axial and circumferential elastic moduli of tubulin.Biophysical Journal 95:3606–3618. DOI: https://doi.org/10.1529/biophysj.108.131359, PMID: 18621829
Zhang J, Meguid SA. 2014. Buckling of microtubules: An insight by molecular and continuum mechanics. AppliedPhysics Letters 105:173704. DOI: https://doi.org/10.1063/1.4900943
Memet et al. eLife 2018;7:e34695. DOI: https://doi.org/10.7554/eLife.34695 22 of 22
Research article Cell Biology Structural Biology and Molecular Biophysics