mid-year investment outlook 2021 - j.p. morgan
TRANSCRIPT

MARKET INSIGHTS
AUTHORS
Karen WardChief Market Strategist for EMEA
Michael BellGlobal Market Strategist
Hugh GimberGlobal Market Strategist
Ambrose CroftonGlobal Market Strategist
Jai MalhiGlobal Market Strategist
Max McKechnieMarket Analyst
Mid-Year Investment Outlook 2021Still up, but bumpier June 2021
I N B R I E F
• The second half of the year looks set to be bumpier, but we still expect equity markets to continue their upward path.
• Inflation worries are likely to contribute to the jitters, but it will take a lot of bad news to shift the central banks towards a more rapid withdrawal of easy money.
• Value stocks have significantly outperformed growth stocks so far this year, and the rotation still has room to run.
• The structural case for Asia remains intact, despite reduced enthusiasm for the region at the moment due to worries over policy tightening, vaccine progress and regulation in China.
• Given the increased will to tackle climate change, the 2021 United Nations Climate Change Conference in November is likely to produce a raft of policy, regulation and investment announcements, creating winners and losers within portfolios.
• The role of fixed income in a portfolio is challenged. In our view, investors shouldn’t discard bonds but should seek global bond diversification and look to alternative markets for solutions.
MID-YEAR INVESTMENT OUTLOOK FOR 2021
2 STILL UP, BUT BUMPIER
Developed economies are expected to continue their strong post-lockdown bounceback in the second half of the year. Vaccine rollout is well advanced in the US and UK, and continental Europe is quickly catching up. Despite recent spending, we estimate that households still have considerable excess savings as we head into the second half of the year, amounting to about 12% of GDP in the US, 7% in the eurozone and 10% in the UK.
Not all sectors of the economy are returning to normality: travel restrictions are likely to remain in place until governments are more confident that vaccination levels can cope with new strains of the virus. However, consumers are spending where they can and tourism’s loss appears to be home renovation and construction’s gain. Housing markets are booming in much of the developed world.
For now, it is rising consumer prices, rather than house prices, that central banks are monitoring. After over a year of pandemic-related disruptions, supply is struggling to keep pace with surging demand. Alongside soaring global commodity prices, input costs are on the up, with many companies passing cost increases on to end consumers. US CPI inflation is likely to remain above 3% into next year, and eurozone and UK inflation also looks set to rise in the coming months (see On the Minds of Investors: Monetary and fiscal coordination and the inflation risks).
Central banks believe these inflationary pressures will prove transitory. Whether this turns out to be the case depends in large part on the behaviour of labour markets. If workers are able to bargain for higher pay, inflationary pressures will become more entrenched.
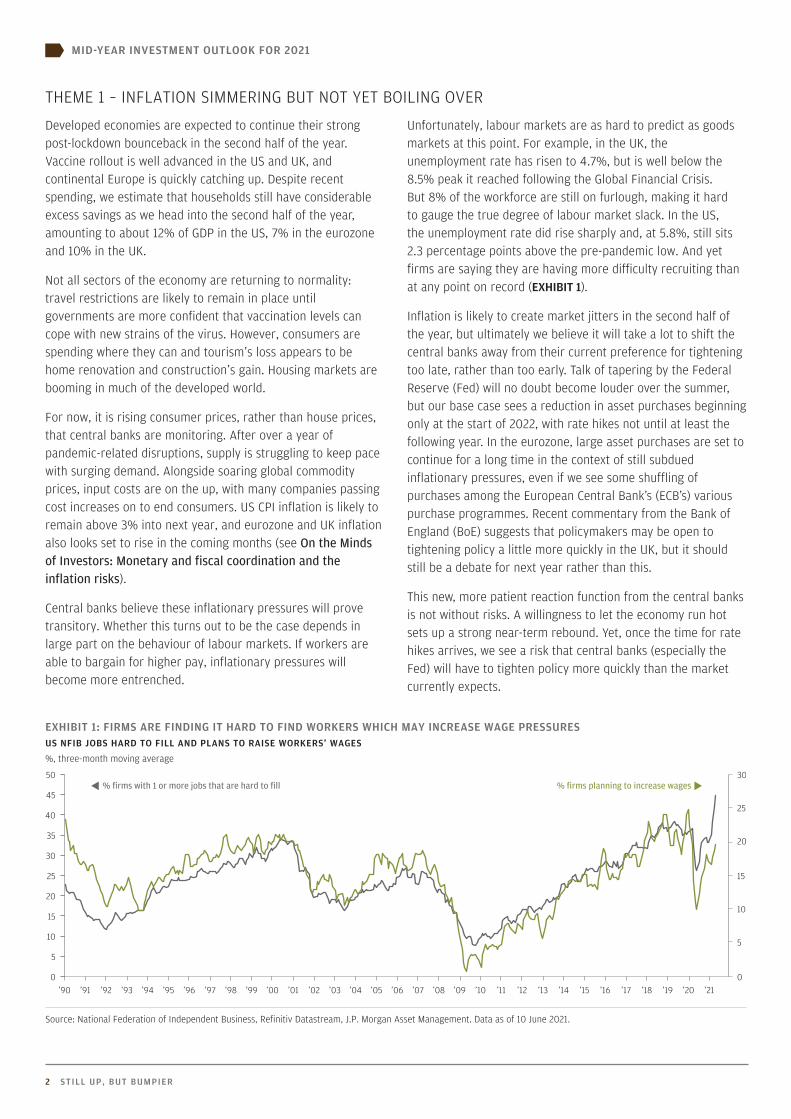
Unfortunately, labour markets are as hard to predict as goods markets at this point. For example, in the UK, the unemployment rate has risen to 4.7%, but is well below the 8.5% peak it reached following the Global Financial Crisis. But 8% of the workforce are still on furlough, making it hard to gauge the true degree of labour market slack. In the US, the unemployment rate did rise sharply and, at 5.8%, still sits 2.3 percentage points above the pre-pandemic low. And yet firms are saying they are having more difficulty recruiting than at any point on record (EXHIBIT 1).
Inflation is likely to create market jitters in the second half of the year, but ultimately we believe it will take a lot to shift the central banks away from their current preference for tightening too late, rather than too early. Talk of tapering by the Federal Reserve (Fed) will no doubt become louder over the summer, but our base case sees a reduction in asset purchases beginning only at the start of 2022, with rate hikes not until at least the following year. In the eurozone, large asset purchases are set to continue for a long time in the context of still subdued inflationary pressures, even if we see some shuffling of purchases among the European Central Bank’s (ECB’s) various purchase programmes. Recent commentary from the Bank of England (BoE) suggests that policymakers may be open to tightening policy a little more quickly in the UK, but it should still be a debate for next year rather than this.
This new, more patient reaction function from the central banks is not without risks. A willingness to let the economy run hot sets up a strong near-term rebound. Yet, once the time for rate hikes arrives, we see a risk that central banks (especially the Fed) will have to tighten policy more quickly than the market currently expects.
EXHIBIT 1: FIRMS ARE FINDING IT HARD TO FIND WORKERS WHICH MAY INCREASE WAGE PRESSURESUS NFIB JOBS HARD TO FILL AND PLANS TO RAISE WORKERS’ WAGES
%, three-month moving average
0
5
10
15
20
25
30
0
5
10
15
20
25
30
35
40
45
50
’90 ’91 ’92 ’93 ’94 ’95 ’96 ’97 ’98 ’99 ’00 ’01 ’02 ’03 ’04 ’05 ’06 ’07 ’08 ’09 ’10 ’11 ’12 ’13 ’14 ’15 ’16 ’17 ’18 ’19 ’20 ’21
% firms with 1 or more jobs that are hard to fill % firms planning to increase wages
Source: National Federation of Independent Business, Refinitiv Datastream, J.P. Morgan Asset Management. Data as of 10 June 2021.
THEME 1 – INFLATION SIMMERING BUT NOT YET BOILING OVER
MID-YEAR INVESTMENT OUTLOOK FOR 2021
J .P. MORGAN ASSET MANAGEMENT 3
Supportive policy from developed world central banks will help emerging economies catch up. While some economies, such as China, came through the pandemic relatively quickly, others are still struggling to contain the virus. However, we expect the vaccine delay in key parts of the emerging world to be a matter of quarters rather than years, and believe economic activity should prove relatively resilient given the strength of global goods demand and commodity prices.
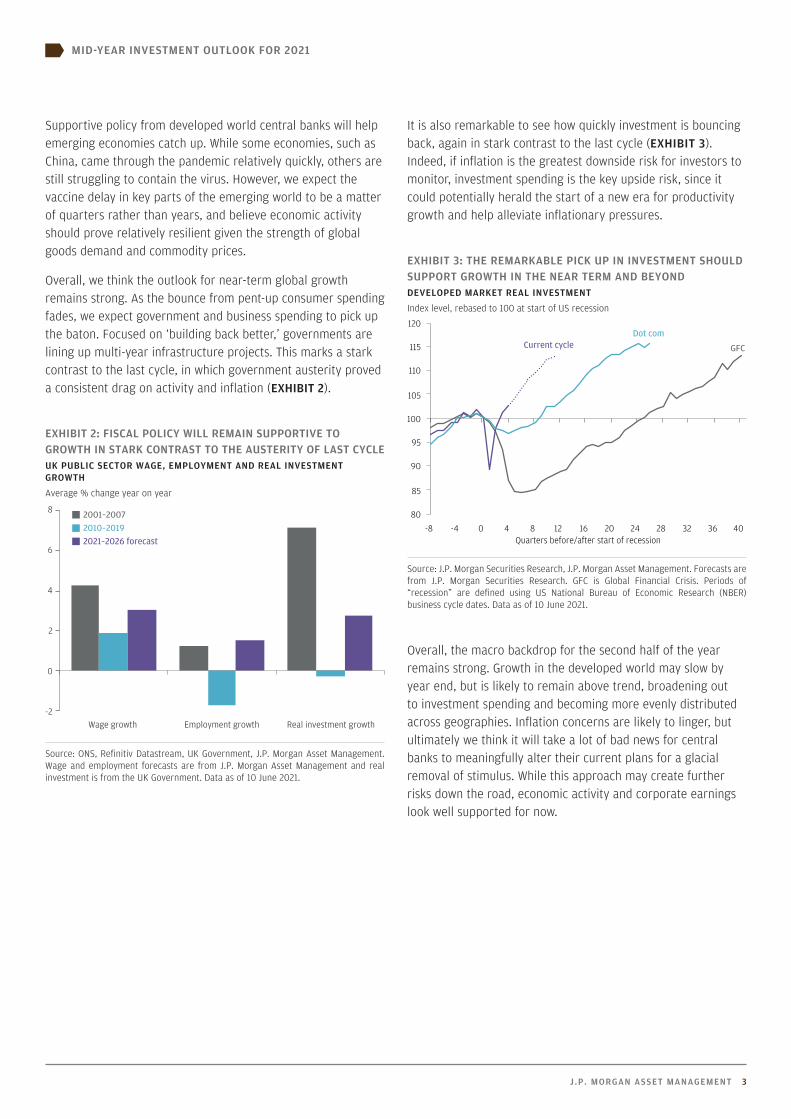
Overall, we think the outlook for near-term global growth remains strong. As the bounce from pent-up consumer spending fades, we expect government and business spending to pick up the baton. Focused on ‘building back better,’ governments are lining up multi-year infrastructure projects. This marks a stark contrast to the last cycle, in which government austerity proved a consistent drag on activity and inflation (EXHIBIT 2).
EXHIBIT 2: FISCAL POLICY WILL REMAIN SUPPORTIVE TO GROWTH IN STARK CONTRAST TO THE AUSTERITY OF LAST CYCLEUK PUBLIC SECTOR WAGE, EMPLOYMENT AND REAL INVESTMENT GROWTH
Average % change year on year
-2
0
2
4
6
8
Wage growth Employment growth Real investment growth
2001–20072010–20192021–2026 forecast
Source: ONS, Refinitiv Datastream, UK Government, J.P. Morgan Asset Management. Wage and employment forecasts are from J.P. Morgan Asset Management and real investment is from the UK Government. Data as of 10 June 2021.
It is also remarkable to see how quickly investment is bouncing back, again in stark contrast to the last cycle (EXHIBIT 3). Indeed, if inflation is the greatest downside risk for investors to monitor, investment spending is the key upside risk, since it could potentially herald the start of a new era for productivity growth and help alleviate inflationary pressures.
EXHIBIT 3: THE REMARKABLE PICK UP IN INVESTMENT SHOULD SUPPORT GROWTH IN THE NEAR TERM AND BEYONDDEVELOPED MARKET REAL INVESTMENT
Index level, rebased to 100 at start of US recession
80
85
90
95
100
105
110
115
120
-8 -4 0 4 8 12 16 20 24 28 32 36 40
Current cycleDot com
GFC
Quarters before/after start of recession
Source: J.P. Morgan Securities Research, J.P. Morgan Asset Management. Forecasts are from J.P. Morgan Securities Research. GFC is Global Financial Crisis. Periods of “recession” are defined using US National Bureau of Economic Research (NBER) business cycle dates. Data as of 10 June 2021.
Overall, the macro backdrop for the second half of the year remains strong. Growth in the developed world may slow by year end, but is likely to remain above trend, broadening out to investment spending and becoming more evenly distributed across geographies. Inflation concerns are likely to linger, but ultimately we think it will take a lot of bad news for central banks to meaningfully alter their current plans for a glacial removal of stimulus. While this approach may create further risks down the road, economic activity and corporate earnings look well supported for now.

MID-YEAR INVESTMENT OUTLOOK FOR 2021
4 STILL UP, BUT BUMPIER
The key question for equity investors is how moderately higher inflation and bond yields will affect corporate profits and valuations. Given significant pent-up consumer savings and elevated capex intentions, sales growth will likely be strong. When sales are strong, profits tend to rise, even if input costs are rising.
Higher bond yields could raise borrowing costs but this can also be offset by higher sales, while higher wages tend to boost sales as well as costs. Meanwhile, any additional taxes that hit the corporate sector are likely to be at least partially offset by the demand boost from additional government spending.
So, against the current economic backdrop, it seems unlikely that rising costs will fully offset the anticipated benefit from strong sales growth. Higher inflation is therefore likely to coincide with higher profits, as is normally the case (EXHIBIT 4).
The bigger concern for investors is whether higher bond yields will hurt equity valuations, since it raises the discount rate on companies’ future earnings. However if bond yields are rising because growth expectations are rising, then valuations don’t have to decline. Indeed, it is common for valuations to rise (and fall) at the same time as bond yields. Even if rising bond yields do lead to lower valuations, then as long as profits rise by more than valuations decline, stocks can still rise. Our base case is that rising corporate profits, driven by strong demand, will offset any decline in valuations for most stocks.
EXHIBIT 4: MODERATELY HIGHER INFLATION TENDS TO BE GOOD FOR PROFITS AND STOCKSUS INFLATION AND S&P 500 TRAILING EARNINGS
% change year on year, earnings are last twelve months’ earnings per share
-40
-30
-20
-10
0
10
20
30
40
50
-3
-2
-1
0
1
2
3
4
5
6
7
’86 ’90 ’94 ’98 ’02 ’06 ’10 ’14 ’18
US headline inflation S&P 500 trailing earnings per share
Source: BLS, IBES, Refinitiv Datastream, Standard & Poor’s, J.P. Morgan Asset Management. Data as of 10 June 2021.
THEME 2 – STICK WITH ROTATION INTO VALUE
MID-YEAR INVESTMENT OUTLOOK FOR 2021
J .P. MORGAN ASSET MANAGEMENT 5
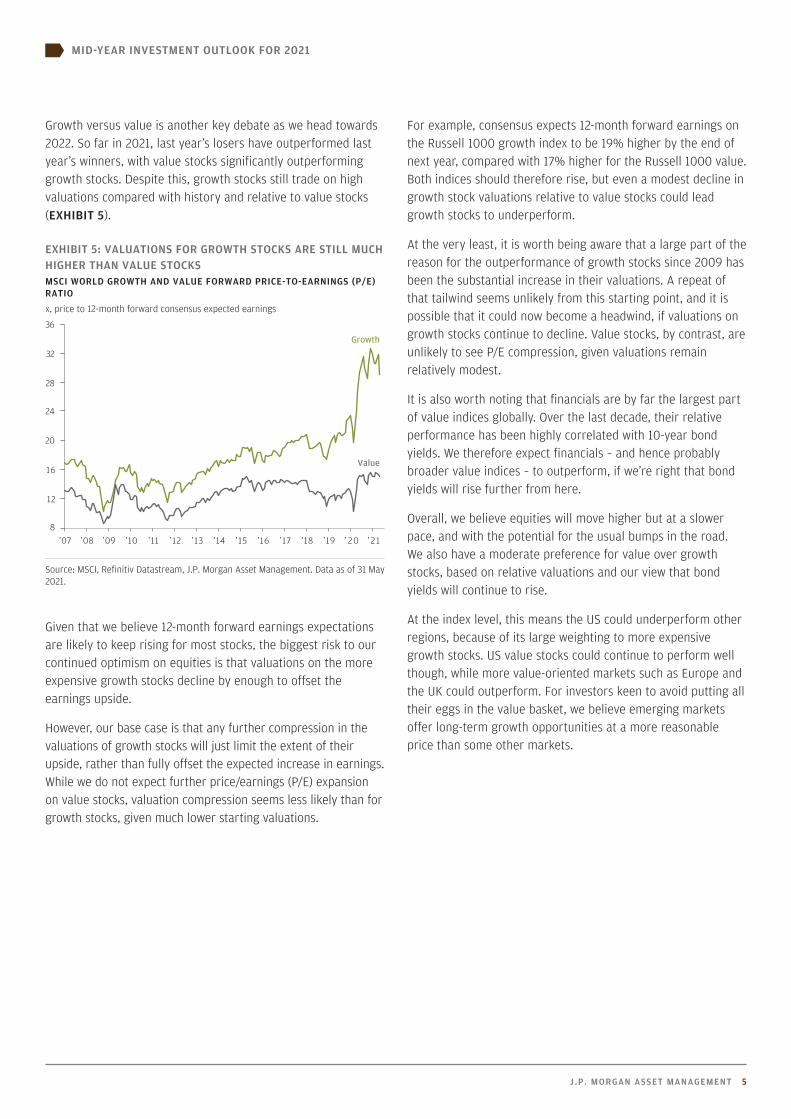
Growth versus value is another key debate as we head towards 2022. So far in 2021, last year’s losers have outperformed last year’s winners, with value stocks significantly outperforming growth stocks. Despite this, growth stocks still trade on high valuations compared with history and relative to value stocks (EXHIBIT 5).
EXHIBIT 5: VALUATIONS FOR GROWTH STOCKS ARE STILL MUCH HIGHER THAN VALUE STOCKSMSCI WORLD GROWTH AND VALUE FORWARD PRICE-TO-EARNINGS (P/E) RATIO
x, price to 12-month forward consensus expected earnings
8
12
16
20
24
28
32
36
’07 ’08 ’09 ’10 ’11 ’12 ’13 ’14 ’15 ’16 ’17 ’18 ’19 ’20 ’21
Growth
Value
Source: MSCI, Refinitiv Datastream, J.P. Morgan Asset Management. Data as of 31 May 2021.
Given that we believe 12-month forward earnings expectations are likely to keep rising for most stocks, the biggest risk to our continued optimism on equities is that valuations on the more expensive growth stocks decline by enough to offset the earnings upside.
However, our base case is that any further compression in the valuations of growth stocks will just limit the extent of their upside, rather than fully offset the expected increase in earnings. While we do not expect further price/earnings (P/E) expansion on value stocks, valuation compression seems less likely than for growth stocks, given much lower starting valuations.
For example, consensus expects 12-month forward earnings on the Russell 1000 growth index to be 19% higher by the end of next year, compared with 17% higher for the Russell 1000 value. Both indices should therefore rise, but even a modest decline in growth stock valuations relative to value stocks could lead growth stocks to underperform.
At the very least, it is worth being aware that a large part of the reason for the outperformance of growth stocks since 2009 has been the substantial increase in their valuations. A repeat of that tailwind seems unlikely from this starting point, and it is possible that it could now become a headwind, if valuations on growth stocks continue to decline. Value stocks, by contrast, are unlikely to see P/E compression, given valuations remain relatively modest.
It is also worth noting that financials are by far the largest part of value indices globally. Over the last decade, their relative performance has been highly correlated with 10-year bond yields. We therefore expect financials – and hence probably broader value indices – to outperform, if we’re right that bond yields will rise further from here.
Overall, we believe equities will move higher but at a slower pace, and with the potential for the usual bumps in the road. We also have a moderate preference for value over growth stocks, based on relative valuations and our view that bond yields will continue to rise.
At the index level, this means the US could underperform other regions, because of its large weighting to more expensive growth stocks. US value stocks could continue to perform well though, while more value-oriented markets such as Europe and the UK could outperform. For investors keen to avoid putting all their eggs in the value basket, we believe emerging markets offer long-term growth opportunities at a more reasonable price than some other markets.

MID-YEAR INVESTMENT OUTLOOK FOR 2021
6 STILL UP, BUT BUMPIER
Asian equities began 2021 with a lot of promise. Favourable long-term trends in demographics and technology, in combination with better containment of the pandemic, provided a strong tailwind for the region (see On the Minds of Investors: Asia’s decade: Getting ahead of the growth opportunity).
Since February, it seems that the tide has turned. Absolute performance stalled, while US and European equities stormed ahead. While part of the story relates to better developed market prospects following President Biden’s massive fiscal stimulus, the relatively poor performance of China since February has been a significant source of the underperformance of Asian equities.
This may seem surprising given that China’s economic outlook for the year appears compelling. Due to its early success in containing the pandemic, China looks on track to achieve more than 8% GDP growth in 2021.
However, three near-term challenges have investors concerned. First, Beijing has begun tightening policy after an expansion during the crisis amounting to growth in credit stock of over 30% of GDP. Second, a number of new announcements about tech regulation have generated worries about Beijing’s reform agenda. And third, in Asia the vaccination programme has been slower than those of many developed economies leading to lingering virus concerns.
We are not overly worried that these headwinds will provide a lasting drag on either economic or market performance. Any tightening of credit will be gradual and measured. Consumer inflation is currently contained, giving China’s central bank little reason to raise policy rates in the coming months. Therefore, current policy measures should be understood as normalising and not as outright tightening (EXHIBIT 6).
EXHIBIT 6: BEIJING IS NORMALISING CREDIT GROWTH RATHER THAN OUTRIGHT TIGHTENINGCHINA CREDIT GROWTH
% of nominal GDP
15
20
25
30
35
40
45
’07 ’08 ’09 ’10 ’11 ’12 ’13 ’14 ’15 ’16 ’17 ’18 ’19 ’20 ’21
Source: People’s Bank of China (PBoC), J.P. Morgan Asset Management. Credit growth is the 12-month change in the credit stock to the real economy as a percent of nominal GDP. Data as of 10 June 2021.
While not overly worried about tightening, neither do we believe China’s reform efforts should deter international investors. Faced with monopoly concerns, worries about financial stability and changing public sentiment, regulators are taking a more hawkish approach towards leading tech and financial companies. Recent high-profile fines for companies breaking competition laws, as well as the closing of regulatory loopholes, may signal the end of the highly supportive environment that these firms have enjoyed in recent history.
Given the weight these firms have in both Chinese and broader Asian indices, their underperformance has had a significant impact on overall returns. While the market leaders might be constrained by potential new rules in the short term, we believe their long-term growth outlook remains compelling, and valuations are now more attractive.
And on vaccinations, China is now making significant headway in catching up on vaccinating its population (EXHIBIT 7). In India, meanwhile, only 19% of the population are over the age of 50, so while the current outbreak is taking a heavy toll, it shouldn’t be too long before the most vulnerable have been vaccinated. In some smaller Asian countries, the slower pace of vaccine rollout may lead to ongoing problems with local outbreaks, delaying a full economic recovery this year.
EXHIBIT 7: CHINA’S VACCINE ROLLOUT IS ACCELERATING BUT PROGRESS IS SLOW ELSEWHERE VACCINE ROLLOUT
Cumulative doses per 100 people
0
10
20
30
40
50
60
70
80
90
100
Jan ’21 Feb ’21 Mar ’21 May ’21 Jun ’21Apr ’21
US
India
SouthKorea
MalaysiaIndonesia
China
Source: Our World in Data, J.P. Morgan Asset Management. Includes both first and second doses. Data as of 10 June 2021.
THEME 3 – RETAIN FOCUS ON ASIA’S DECADE

MID-YEAR INVESTMENT OUTLOOK FOR 2021
J .P. MORGAN ASSET MANAGEMENT 7
In summary, while we acknowledge that President Biden’s stimulus has provided a near-term turbo boost to the US economy, we do not think developed market outperformance will last over the medium term. US and European policymakers will soon face the very same tough questions as their Chinese counterparts today – when and how to normalise the enormous amount of stimulus. So in 2022 and the following years, dynamics are likely to change as the distortions in corporate earnings caused by the pandemic and the policy responses recede. In this environment of more moderate growth, structural themes such as rising household incomes and technology adoption in Asia should gain importance relative to the cyclical stories that dominate today’s market performance. Since we are already in the middle of the year, it will be just a matter of time before investors shift their focus to the earnings outlook for next year, which should be beneficial for Chinese as well as broad Asian equities.
In the second half of the year, the outlook for Chinese local bond markets continues to be compelling. Moderate consumer inflation, solid corporate earnings and a low probability of rate hikes are supportive for the asset class. However, after the 10% appreciation of the renminbi in the past 12 months, we think that investors should expect a reduced tailwind from currency effects.
MID-YEAR INVESTMENT OUTLOOK FOR 2021
8 STILL UP, BUT BUMPIER
In early November, major nations will reconvene to discuss global plans to tackle climate change. COP26 (the 26th UN Climate Change Conference of Parties) will see leaders revisit the commitments that were made under the Paris Agreement in 2015, assess the progress to date and set a roadmap for the future. The legally-binding commitment made in 2015 was to limit global warming to well below two degrees Celsius, compared to pre-industrial levels, by the end of the century.
What is different about this annual meeting is that the US is back at the table, providing renewed momentum. Top of the agenda will be to compare national greenhouse gas emissions outcomes to those planned, and assess whether they are sufficient to achieve global climate objectives.
The conclusion is likely to be that greater efforts are required – though many governments have already accelerated their plans. The EU plans to reduce its emissions by 55% by 2030, while achieving net zero emissions by 2050 has recently become the new benchmark. In 2020, the UK and France were the first major economies to write their net zero emissions targets into law, and many other countries, including the US, are now following their example. China has given itself an additional decade with net zero emissions targeted for 2060.
The realignment of the US with global climate initiatives is a gamechanger. Having organised a global climate summit on Earth Day and supported a G7 announcement to end fossil fuel subsidies by 2025, the US will probably support a new Grand Climate Accord during COP26.
With the major economies already aligning behind the goal, reaching net zero emissions may well become the new official global target. This will require dramatic changes to the global economy, and we expect a wave of new policy and major investments in green infrastructure to be announced at COP26. However, to reach net zero emissions, policymakers will also need to increase private sector incentives to reduce carbon emissions, so carbon pricing initiatives such as emissions trading schemes (ETS), and carbon taxes are also likely to be key topics of conversation at COP26 (see On the Minds of Investors: The implications of carbon pricing initiatives for investors).
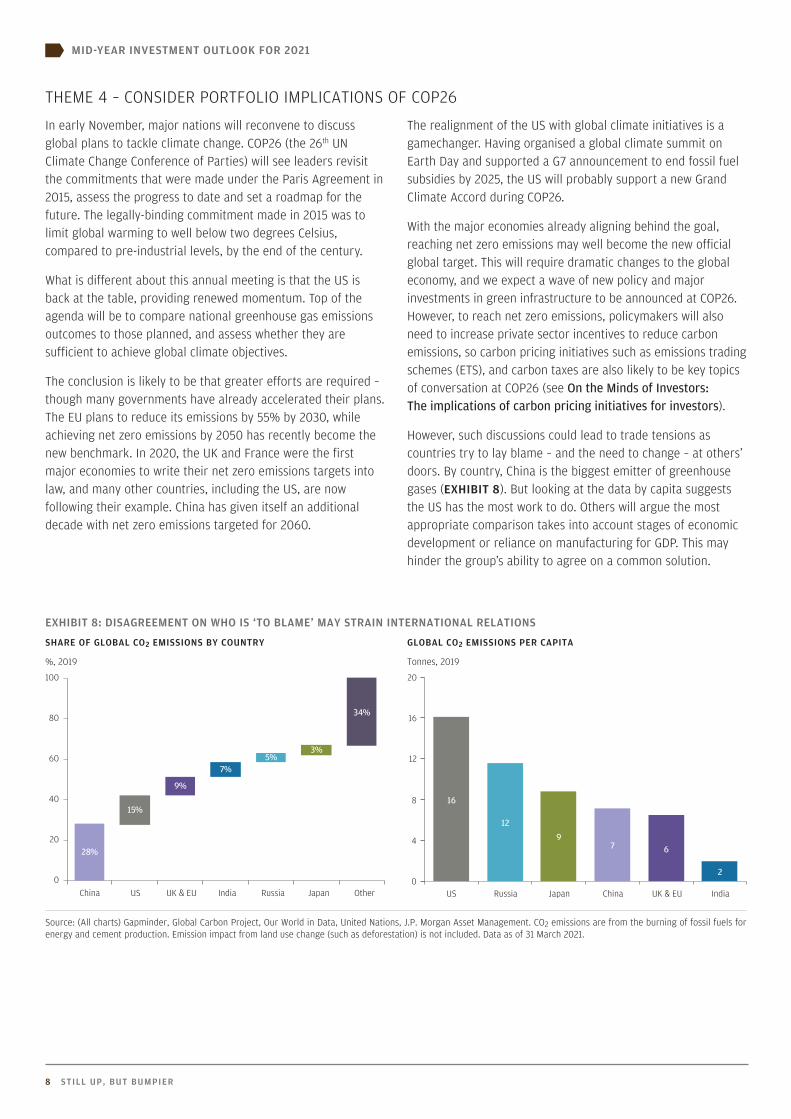
However, such discussions could lead to trade tensions as countries try to lay blame – and the need to change – at others’ doors. By country, China is the biggest emitter of greenhouse gases (EXHIBIT 8). But looking at the data by capita suggests the US has the most work to do. Others will argue the most appropriate comparison takes into account stages of economic development or reliance on manufacturing for GDP. This may hinder the group’s ability to agree on a common solution.
EXHIBIT 8: DISAGREEMENT ON WHO IS ‘TO BLAME’ MAY STRAIN INTERNATIONAL RELATIONS
SHARE OF GLOBAL CO2 EMISSIONS BY COUNTRY GLOBAL CO2 EMISSIONS PER CAPITA
%, 2019 Tonnes, 2019
28%
15%
9%
7%5%
3%
34%
0
20
40
60
80
100
China US UK & EU India Russia Japan Other
16
12
97 6
20
4
8
12
16
20
US Russia Japan China UK & EU India
Source: (All charts) Gapminder, Global Carbon Project, Our World in Data, United Nations, J.P. Morgan Asset Management. CO2 emissions are from the burning of fossil fuels for energy and cement production. Emission impact from land use change (such as deforestation) is not included. Data as of 31 March 2021.
THEME 4 – CONSIDER PORTFOLIO IMPLICATIONS OF COP26

MID-YEAR INVESTMENT OUTLOOK FOR 2021
J .P. MORGAN ASSET MANAGEMENT 9
Obstacles to progress may prove particularly frustrating for Europe, which is far more advanced in this area, and keen to ensure that its own high regulatory standards are matched elsewhere, so that measures such as higher carbon prices in the EU don’t damage the profitability or competitiveness of the region’s companies (EXHIBIT 9). If the EU, China and the US cannot agree on a path towards a common carbon price, the EU may need to find a short-term solution to ensure that its climate efforts do not disadvantage European businesses.
One solution that appears to be growing in appeal in Europe is a carbon border adjustment mechanism (CBAM). This import tariff would be designed to ensure that the environmental footprint of a product was priced the same whether it was manufactured locally or imported.
Investors should be aware of how announcements at and after COP26 might influence their portfolios. Some companies will benefit from new green infrastructure investments, or from being relatively well prepared for the transition compared with their peers. Others may lose out – particularly firms that will face higher costs due to higher carbon prices, and especially if they are unable to pass these costs on in higher prices.
EXHIBIT 9: THE EU WILL BE KEEN TO SEE OTHERS RAISE THEIR CARBON PRICEEMISSIONS TRADING SYSTEM PRICES
USD per tonnes of CO2 equivalent
0
10
20
30
40
50
60
’15 ’16 ’17 ’18 ’19 ’20 ’21
EUSouth KoreaChina
Source: International Carbon Action Partnership, J.P. Morgan Asset Management. China ETS price is based on the average of Beijing, Chongqing, Guangdong, Hubei, Shanghai, Shenzhen and Tianjin ETS prices. CO2 equivalent tonnes standardise emissions to allow for comparison between gases. One equivalent tonne has the same warming effect as one tonne of CO2 over 100 years. Data as of 31 March 2021.
MID-YEAR INVESTMENT OUTLOOK FOR 2021
10 STILL UP, BUT BUMPIER
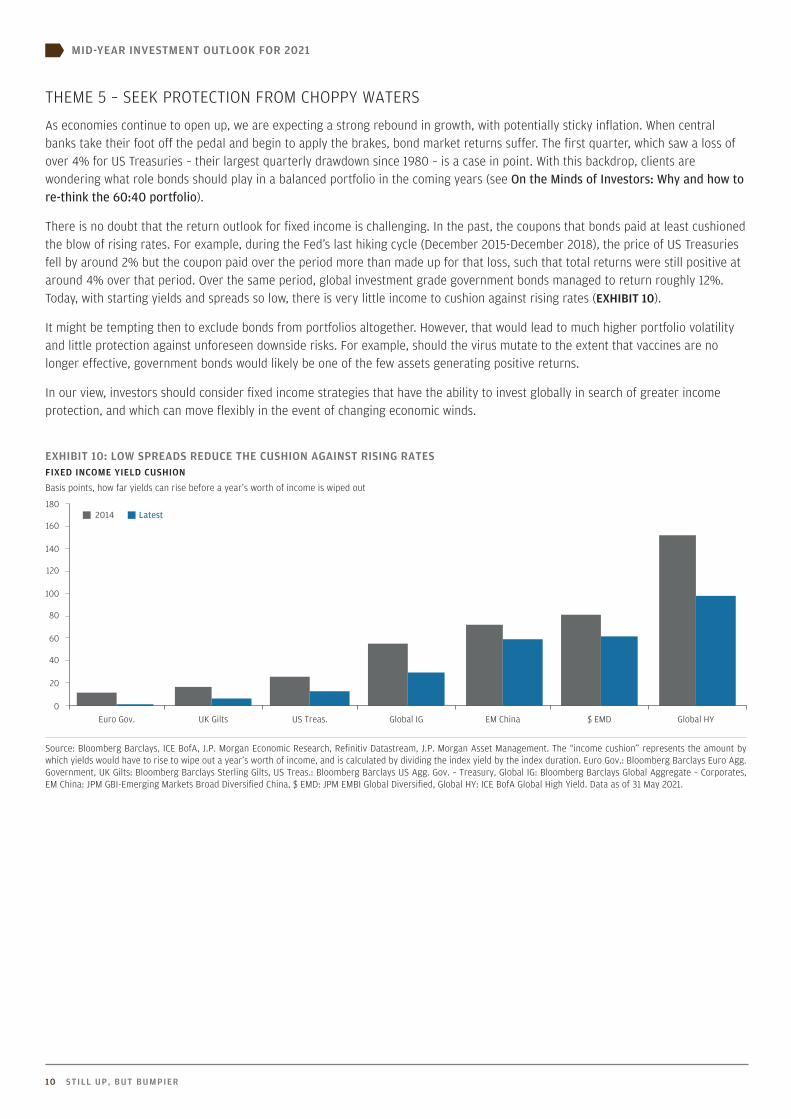
As economies continue to open up, we are expecting a strong rebound in growth, with potentially sticky inflation. When central banks take their foot off the pedal and begin to apply the brakes, bond market returns suffer. The first quarter, which saw a loss of over 4% for US Treasuries – their largest quarterly drawdown since 1980 – is a case in point. With this backdrop, clients are wondering what role bonds should play in a balanced portfolio in the coming years (see On the Minds of Investors: Why and how to re-think the 60:40 portfolio).
There is no doubt that the return outlook for fixed income is challenging. In the past, the coupons that bonds paid at least cushioned the blow of rising rates. For example, during the Fed’s last hiking cycle (December 2015-December 2018), the price of US Treasuries fell by around 2% but the coupon paid over the period more than made up for that loss, such that total returns were still positive at around 4% over that period. Over the same period, global investment grade government bonds managed to return roughly 12%. Today, with starting yields and spreads so low, there is very little income to cushion against rising rates (EXHIBIT 10).
It might be tempting then to exclude bonds from portfolios altogether. However, that would lead to much higher portfolio volatility and little protection against unforeseen downside risks. For example, should the virus mutate to the extent that vaccines are no longer effective, government bonds would likely be one of the few assets generating positive returns.
In our view, investors should consider fixed income strategies that have the ability to invest globally in search of greater income protection, and which can move flexibly in the event of changing economic winds.
EXHIBIT 10: LOW SPREADS REDUCE THE CUSHION AGAINST RISING RATESFIXED INCOME YIELD CUSHION
Basis points, how far yields can rise before a year’s worth of income is wiped out
0
20
40
60
80
100
120
140
160
180
Euro Gov. UK Gilts US Treas. Global IG EM China $ EMD Global HY
2014 Latest
Source: Bloomberg Barclays, ICE BofA, J.P. Morgan Economic Research, Refinitiv Datastream, J.P. Morgan Asset Management. The “income cushion” represents the amount by which yields would have to rise to wipe out a year’s worth of income, and is calculated by dividing the index yield by the index duration. Euro Gov.: Bloomberg Barclays Euro Agg. Government, UK Gilts: Bloomberg Barclays Sterling Gilts, US Treas.: Bloomberg Barclays US Agg. Gov. – Treasury, Global IG: Bloomberg Barclays Global Aggregate – Corporates, EM China: JPM GBI-Emerging Markets Broad Diversified China, $ EMD: JPM EMBI Global Diversified, Global HY: ICE BofA Global High Yield. Data as of 31 May 2021.
THEME 5 – SEEK PROTECTION FROM CHOPPY WATERS
MID-YEAR INVESTMENT OUTLOOK FOR 2021
J .P. MORGAN ASSET MANAGEMENT 11
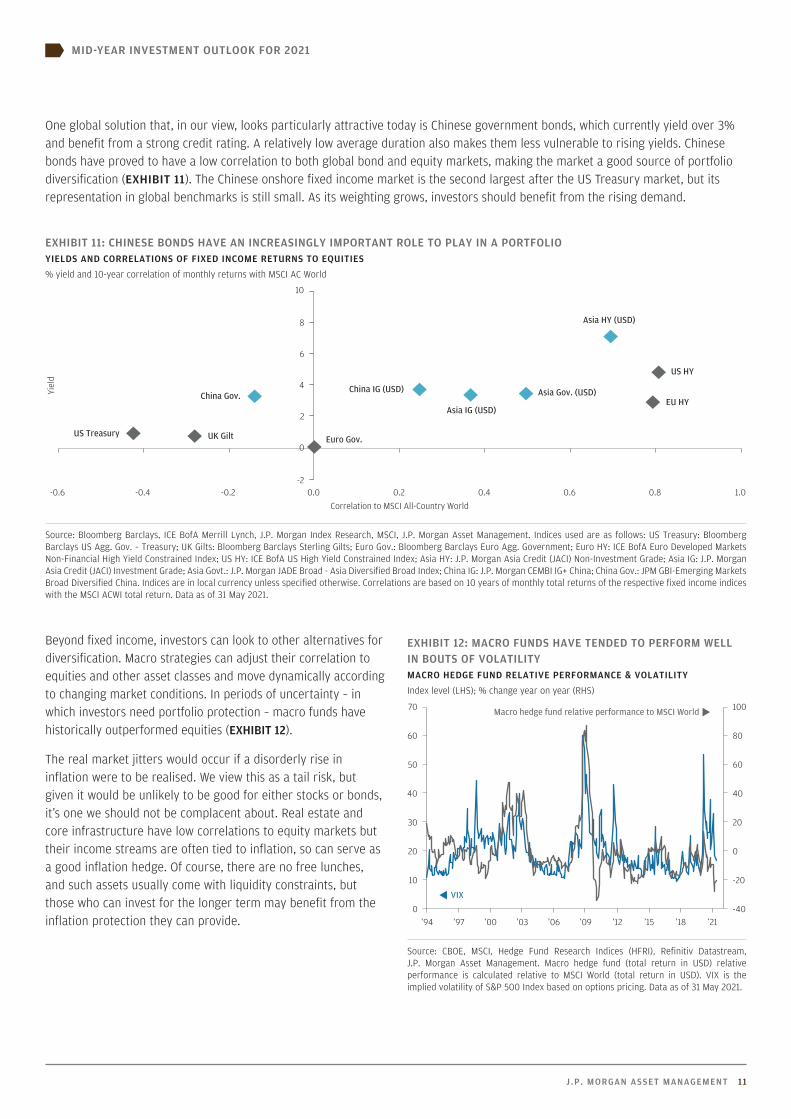
One global solution that, in our view, looks particularly attractive today is Chinese government bonds, which currently yield over 3% and benefit from a strong credit rating. A relatively low average duration also makes them less vulnerable to rising yields. Chinese bonds have proved to have a low correlation to both global bond and equity markets, making the market a good source of portfolio diversification (EXHIBIT 11). The Chinese onshore fixed income market is the second largest after the US Treasury market, but its representation in global benchmarks is still small. As its weighting grows, investors should benefit from the rising demand.
EXHIBIT 11: CHINESE BONDS HAVE AN INCREASINGLY IMPORTANT ROLE TO PLAY IN A PORTFOLIOYIELDS AND CORRELATIONS OF FIXED INCOME RETURNS TO EQUITIES
% yield and 10-year correlation of monthly returns with MSCI AC World
US Treasury UK Gilt Euro Gov.
US HY
EU HYAsia Gov. (USD)
Asia IG (USD)
Asia HY (USD)
China Gov.China IG (USD)
-2
0
2
4
6
8
10
-0.6 -0.4 -0.2 0.0 0.2 0.4 0.6 0.8 1.0
Yiel
d
Correlation to MSCI All-Country World
Source: Bloomberg Barclays, ICE BofA Merrill Lynch, J.P. Morgan Index Research, MSCI, J.P. Morgan Asset Management. Indices used are as follows: US Treasury: Bloomberg Barclays US Agg. Gov. – Treasury; UK Gilts: Bloomberg Barclays Sterling Gilts; Euro Gov.: Bloomberg Barclays Euro Agg. Government; Euro HY: ICE BofA Euro Developed Markets Non-Financial High Yield Constrained Index; US HY: ICE BofA US High Yield Constrained Index; Asia HY: J.P. Morgan Asia Credit (JACI) Non-Investment Grade; Asia IG: J.P. Morgan Asia Credit (JACI) Investment Grade; Asia Govt.: J.P. Morgan JADE Broad - Asia Diversified Broad Index; China IG: J.P. Morgan CEMBI IG+ China; China Gov.: JPM GBI-Emerging Markets Broad Diversified China. Indices are in local currency unless specified otherwise. Correlations are based on 10 years of monthly total returns of the respective fixed income indices with the MSCI ACWI total return. Data as of 31 May 2021.
Beyond fixed income, investors can look to other alternatives for diversification. Macro strategies can adjust their correlation to equities and other asset classes and move dynamically according to changing market conditions. In periods of uncertainty – in which investors need portfolio protection – macro funds have historically outperformed equities (EXHIBIT 12).
The real market jitters would occur if a disorderly rise in inflation were to be realised. We view this as a tail risk, but given it would be unlikely to be good for either stocks or bonds, it’s one we should not be complacent about. Real estate and core infrastructure have low correlations to equity markets but their income streams are often tied to inflation, so can serve as a good inflation hedge. Of course, there are no free lunches, and such assets usually come with liquidity constraints, but those who can invest for the longer term may benefit from the inflation protection they can provide.
EXHIBIT 12: MACRO FUNDS HAVE TENDED TO PERFORM WELL IN BOUTS OF VOLATILITYMACRO HEDGE FUND RELATIVE PERFORMANCE & VOLATILITY
Index level (LHS); % change year on year (RHS)
-40
-20
0
20
40
60
80
100
0
10
20
30
40
50
60
70
’94 ’97 ’00 ’03 ’06 ’09 ’12 ’15 ’18 ’21
VIX
Macro hedge fund relative performance to MSCI World
Source: CBOE, MSCI, Hedge Fund Research Indices (HFRI), Refinitiv Datastream, J.P. Morgan Asset Management. Macro hedge fund (total return in USD) relative performance is calculated relative to MSCI World (total return in USD). VIX is the implied volatility of S&P 500 Index based on options pricing. Data as of 31 May 2021.
MID-YEAR INVESTMENT OUTLOOK FOR 2021
12 STILL UP, BUT BUMPIER
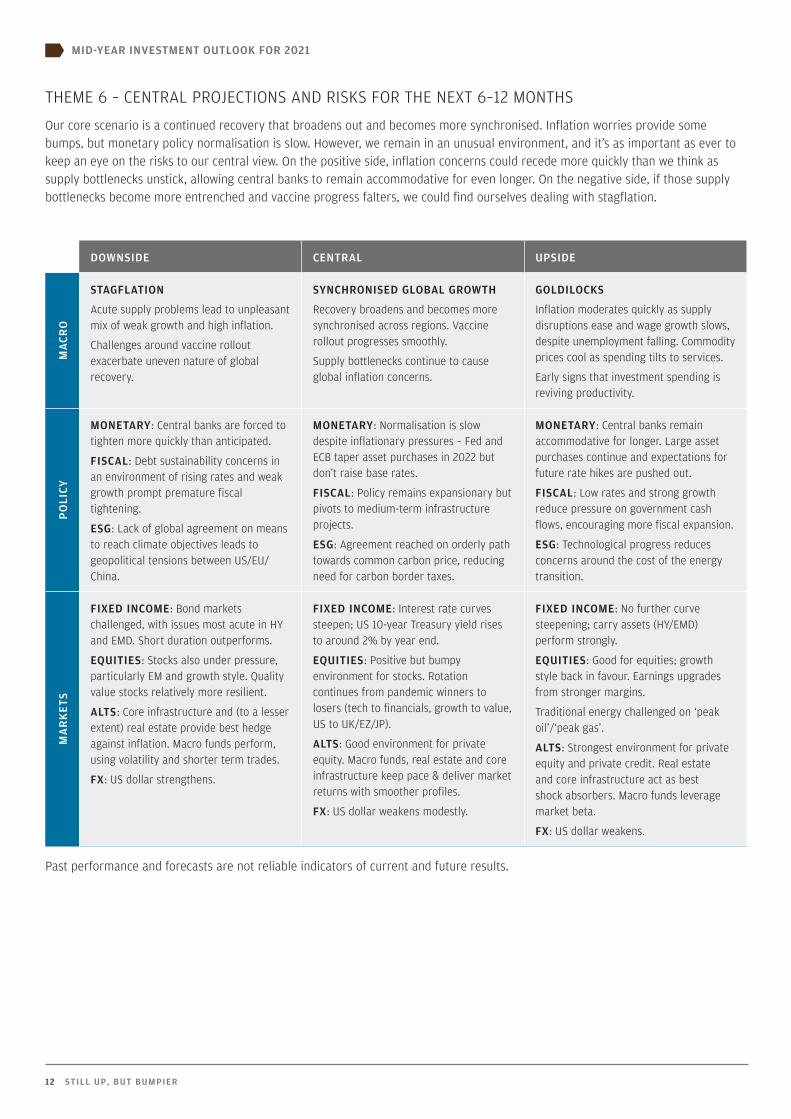
Our core scenario is a continued recovery that broadens out and becomes more synchronised. Inflation worries provide some bumps, but monetary policy normalisation is slow. However, we remain in an unusual environment, and it’s as important as ever to keep an eye on the risks to our central view. On the positive side, inflation concerns could recede more quickly than we think as supply bottlenecks unstick, allowing central banks to remain accommodative for even longer. On the negative side, if those supply bottlenecks become more entrenched and vaccine progress falters, we could find ourselves dealing with stagflation.
DOWNSIDE CENTRAL UPSIDE
MA
CRO
STAGFLATION
Acute supply problems lead to unpleasant mix of weak growth and high inflation.
Challenges around vaccine rollout exacerbate uneven nature of global recovery.
SYNCHRONISED GLOBAL GROWTH
Recovery broadens and becomes more synchronised across regions. Vaccine rollout progresses smoothly.
Supply bottlenecks continue to cause global inflation concerns.
GOLDILOCKS
Inflation moderates quickly as supply disruptions ease and wage growth slows, despite unemployment falling. Commodity prices cool as spending tilts to services.
Early signs that investment spending is reviving productivity.
PO
LICY
MONETARY: Central banks are forced to tighten more quickly than anticipated.
FISCAL: Debt sustainability concerns in an environment of rising rates and weak growth prompt premature fiscal tightening.
ESG: Lack of global agreement on means to reach climate objectives leads to geopolitical tensions between US/EU/China.
MONETARY: Normalisation is slow despite inflationary pressures – Fed and ECB taper asset purchases in 2022 but don’t raise base rates.
FISCAL: Policy remains expansionary but pivots to medium-term infrastructure projects.
ESG: Agreement reached on orderly path towards common carbon price, reducing need for carbon border taxes.
MONETARY: Central banks remain accommodative for longer. Large asset purchases continue and expectations for future rate hikes are pushed out.
FISCAL: Low rates and strong growth reduce pressure on government cash flows, encouraging more fiscal expansion.
ESG: Technological progress reduces concerns around the cost of the energy transition.
MA
RK
ETS
FIXED INCOME: Bond markets challenged, with issues most acute in HY and EMD. Short duration outperforms.
EQUITIES: Stocks also under pressure, particularly EM and growth style. Quality value stocks relatively more resilient.
ALTS: Core infrastructure and (to a lesser extent) real estate provide best hedge against inflation. Macro funds perform, using volatility and shorter term trades.
FX: US dollar strengthens.
FIXED INCOME: Interest rate curves steepen; US 10-year Treasury yield rises to around 2% by year end.
EQUITIES: Positive but bumpy environment for stocks. Rotation continues from pandemic winners to losers (tech to financials, growth to value, US to UK/EZ/JP).
ALTS: Good environment for private equity. Macro funds, real estate and core infrastructure keep pace & deliver market returns with smoother profiles.
FX: US dollar weakens modestly.
FIXED INCOME: No further curve steepening; carry assets (HY/EMD) perform strongly.
EQUITIES: Good for equities; growth style back in favour. Earnings upgrades from stronger margins.
Traditional energy challenged on ‘peak oil’/‘peak gas’.
ALTS: Strongest environment for private equity and private credit. Real estate and core infrastructure act as best shock absorbers. Macro funds leverage market beta.
FX: US dollar weakens.
Past performance and forecasts are not reliable indicators of current and future results.
THEME 6 – CENTRAL PROJECTIONS AND RISKS FOR THE NEXT 6–12 MONTHS

The Market Insights programme provides comprehensive data and commentary on global markets without reference to products. Designed as a tool to help clients understand the markets and support investment decision-making, the programme explores the implications of current economic data and changing market conditions. For the purposes of MiFID II, the JPM Market Insights and Portfolio Insights programmes are marketing communications and are not in scope for any MiFID II / MiFIR requirements specifically related to investment research. Furthermore, the J.P. Morgan Asset Management Market Insights and Portfolio Insights programmes, as non-independent research, have not been prepared in accordance with legal requirements designed to promote the independence of investment research, nor are they subject to any prohibition on dealing ahead of the dissemination of investment research.This document is a general communication being provided for informational purposes only. It is educational in nature and not designed to be taken as advice or a recommendation for any specific investment product, strategy, plan feature or other purpose in any jurisdiction, nor is it a commitment from J.P. Morgan Asset Management or any of its subsidiaries to participate in any of the transactions mentioned herein. Any examples used are generic, hypothetical and for illustration purposes only. This material does not contain sufficient information to support an investment decision and it should not be relied upon by you in evaluating the merits of investing in any securities or products. In addition, users should make an independent assessment of the legal, regulatory, tax, credit, and accounting implications and determine, together with their own professional advisers, if any investment mentioned herein is believed to be suitable to their personal goals. Investors should ensure that they obtain all available relevant information before making any investment. Any forecasts, figures, opinions or investment techniques and strategies set out are for information purposes only, based on certain assumptions and current market conditions and are subject to change without prior notice. All information presented herein is considered to be accurate at the time of production, but no warranty of accuracy is given and no liability in respect of any error or omission is accepted. It should be noted that investment involves risks, the value of investments and the income from them may fluctuate in accordance with market conditions and taxation agreements and investors may not get back the full amount invested. Both past performance and yields are not a reliable indicator of current and future results. J.P. Morgan Asset Management is the brand name for the asset management business of JPMorgan Chase & Co. and its affiliates worldwide. To the extent permitted by applicable law, we may record telephone calls and monitor electronic communications to comply with our legal and regulatory obligations and internal policies. Personal data will be collected, stored and processed by J.P. Morgan Asset Management in accordance with our EMEA Privacy Policy www.jpmorgan.com/emea-privacy-policy. This communication is issued in Europe (excluding UK) by JPMorgan Asset Management (Europe) S.à r.l., 6 route de Trèves, L-2633 Senningerberg, Grand Duchy of Luxembourg, R.C.S. Luxembourg B27900, corporate capital EUR 10.000.000. This communication is issued in the UK by JPMorgan Asset Management (UK) Limited, which is authorised and regulated by the Financial Conduct Authority. Registered in England No. 01161446. Registered address: 25 Bank Street, Canary Wharf, London E14 5JP.
Copyright 2021 JPMorgan Chase & Co. All rights reserved.
All illustrations are property of JPMorgan Chase & Co. unless otherwise stated.
LV–JPM53241 | UK | 06/21 | 0903c02a82b29fc7