middle distillate hydrotreatment zeolite...
TRANSCRIPT
MIDDLE DISTILLATE HYDROTREATMENT ZEOLITE CATALYSTS
CONTAINING Pt/Pd OR Ni
A Dissertation
by
CELIA MARIN-ROSAS
Submitted to the Office of Graduate Studies of
Texas A&M University in partial fulfillment of the requirements for the degree of
DOCTOR OF PHILOSOPHY
December 2006
Major Subject: Chemical Engineering
MIDDLE DISTILLATE HYDROTREATMENT ZEOLITE CATALYSTS
CONTAINING Pt/Pd OR Ni
A Dissertation
by
CELIA MARIN-ROSAS
Submitted to the Office of Graduate Studies of Texas A&M University
in partial fulfillment of the requirements for the degree of
DOCTOR OF PHILOSOPHY Approved by: Co-Chairs of Committee, Committee Members,
Gilbert F. Froment Rayford G. Anthony Kenneth R. Hall Abraham Clearfield
Head of Department, N.K. Anand
December 2006
Major Subject: Chemical Engineering
iii
ABSTRACT
Middle Distillate Hydrotreatment Zeolite Catalysts Containing Pt/Pd or Ni.
(December 2006)
Celia Marin-Rosas, B.S., Universidad Nacional Autonoma de Mexico, Mexico;
M.S., Instituto Politecnico Nacional, Mexico
Co-Chairs of Advisory Committee: Dr. Gilbert F. Froment Dr. Rayford G. Anthony
A study on middle distillate hydrotreatment zeolite catalysts containing Pt/Pd and/or
Ni was performed. The effect of the addition of the corresponding CoMo, CoMoPd,
CoMoPtPd and CoMoNi in PdNiPt-zeolite, Pt-zeolite, Ni-zeolite, and PdPt-zeolite was
studied. The catalysts were characterized physically and chemically by methods and
techniques such as Brunauer-Emmett-Teller (BET), Barret-Joyner-Hallenda (BJH), and
neutron activation analysis. The structures of the Ni and Pt containing zeolite were
studied by X-ray Photoelectron Spectroscopy (XPS).
An experimental apparatus was constructed to investigate the activity of the
experimental catalysts. The catalysts activity measured in terms of conversion of
dibenzothiophene (DBT), substituted dibenzothiophenes (sDBT) and phenanthrene as
well as molar-averaged conversion was evaluated in a continuous flow Robinson
Mahoney reactor with stationary basket in the hydrodesulfurization and hydrogenation
of heavy gas oil which contains sulphur refractory compounds such as 4-
methyldibenzotiophene (4-MDBT) and 4,6- dimethyldibenzothiophene (4,6-DMDBT).
DBT, 4-MDBT, 3-MDBT, 1-EDBT, 3-EDBT, 4,6-DMDBT, 3,6-DMDBT, 2,8-
DMDBT and 4-methylnaphtho[2,1-b]thiophene were selected to calculate the molar-
averaged conversion.
The conversions of the sulfur containing compounds and phenanthrene were
determined as a function of the operating variables: space time (W/FoDBT), temperature,
H2/HC mol ratio and pressure. The Conversions of DBT and 4,6-DMDBT into their
iv
reaction products such as Biphenyl (BPH), Cyclohexylbenzene (CHB), Bicyclohexyl
(BCH) and 3,4-Dimethylbiyphenyl (3,4-DMBPH) were determined only as a function of
space time in the interval of 4000-6000 kgcath/kmol.
The results of this work showed that Pt-HY and PdPt-HY are good noble metals
catalysts for the hydrodesulfurization of heavy gas oil. Moreover, this study showed that
CoMoPd/Pt-HY and CoMoNi/PdPt-HY catalysts are good candidates for deep HDS and
hydrogenation of heavy gas oil. It was found that the conversions of sulfur compounds
were higher than the conversions provided by the conventional CoMo/Al2O3 catalyst.
Also higher hydrogenation of phenanthrene was observed. Deactivation of the catalysts
was not observed during the operation.
Finally, the study not only contributed to define the technical bases for the
preparation of the noble metal catalysts for hydrodesulfurization of heavy gas oil at pilot
scale, but also provided technical information for developing the kinetic modeling of the
hydrodesulfurization of heavy gas oil with the noble metal catalysts.
v
DEDICATION
This dissertation is dedicated to my husband, Luis Carlos, for his unending
support and love during these difficult years. His patience and many sacrifices were
essential to my study and research.
Also this dissertation is dedicated to everyone in my family, especially my
parents, brothers, sisters, nephews and nieces whose love and encouragement have
enabled me to succeed and achieve my dream.
Furthermore, this dissertation is dedicated to the memories of my brother,
Ricardo, grandmothers, Sabas and Micaela, my grandfather Pedro and my in-laws, Maria
and Esteban. They all will be remembered in our hearts.
vi
ACKNOWLEDGMENTS
I would like to express my gratitude to my research advisor, Dr. Gilbert F. Froment,
for his guidance, support and patience throughout the course of this research at Texas
A&M University. I would also like to thank Dr. Rayford G. Anthony, Dr. Kenneth R.
Hall, Dr. Abraham Clearfield for their advice, suggestions, and service as my committee
members. I thank Dr. Perla B. Balbuena from the Department of Chemical Engineering,
who kindly served as a committee member substitute. I am grateful to Mr. Charles
Isdale for his advice, suggestions and analytical instrumentation for use in the setup.
Without this equipment the setup would have not been possible.
I would like to thank Dr. William D. James from Elemental Analysis Laboratory for
his suggestions and analysis of metal contents of the catalysts and Dr. Jose Sericano for
your valuable advice and suggestions for the GC-MS analysis. I am thankful to Linh
Dinh, Dr. Abraham Clearfield, Dr. Sharath Kirumakki and Yulia Vasilyeva for their help
in the characterization of the metal-zeolite catalyts by XPS. A special thanks goes to Dr.
Xianchun Wu, Dr. Sung-Hyun Kim and Dr. C.V. Phillip for their help and suggestions in
the laboratory. I am grateful to our chemical engineering shop technician, Mr. Randy
Marek for his help in fixing many things.
I also thank my former and current fellow graduate students in my group; Dr.
Ammar Alkhawaldeh, Dr. Saeed Al-Wahabi, Dr. Jagannathan, Govindhakannan, Dr. Bo.
Wang, Dr. Won Jae Lee, Dr. Rogelio Sotelo, Dr. Hans Kumar Gupta, Nicolas Rouckout,
Luis Carlos Castaneda, Bradley Atkinson, Pedro Rojas and also Dr. Bedri Bozkurt,
TEES Research Engineer, and Dr. Swades K. Chaudhuri, TEES Asst. Research Scientist,
for their help and company that made my life in the lab and office more enjoyable.
For this degree, mostly, I was financially supported by Instituto Mexicano del
Petroleo, Mexico. As a scholarship student, I would like to thank all managers for their
help and services. The support provided by Dr. Kenneth Hall in the final step of my
research when he was the department head is greatly acknowledged.
vii
I am thankful to the Artie McFerrin Department of Chemical Engineering at Texas
A&M University and its staff for offering me the opportunity to pursue my PhD.
I would like to thank all my friends in College Station for their friendship and
support that made my life in College Station enjoyable and relaxing. They are Benny,
Sam, Isdale, Francis, Utermark, Patricia, Bruno, Miguel, Monse, Alberto, Zully and Luis
Carlos V.
The almost 20 year-friendship and encouragement from my friends Tere Cortez,
Florentino Murrieta, Jose Manuel Dominguez, Jorge Munoz and Amalia Tobon is
appreciated and will always be remembered.
Finally, I am thankful to my husband, Luis Carlos, and everyone in my family: my
parents, Pablo and Celia; my sisters and brothers, Hortencia, Rosa, Patricia, Maria de los
Angeles, Maria Elena, Leticia, Lourdes, Veronica, Pablo, Jorge and Luis Alberto; my
nephews, Pablo and Miguel; and my nieces Deyanira, Karina and Vanessa. Everything
good in my life would not possibly have happened without them.
viii
TABLE OF CONTENTS
Page
ABSTRACT………………………………………………………..……………….. DEDICATION……………………………………………………...……………….
ACKNOWLEDGMENTS…………………………………………..……………….
TABLE OF CONTENTS…………………………………………..…………….….
LIST OF FIGURES……………………………………………….…………………
LIST OF TABLES…………………………………………………..……………….
CHAPTER
I INTRODUCTION……………………………………...…………….……
1.1 Motivation and Significance of Research…………………….……...... 1.2 Scope of Research ………………………..………………………...….
II LITERATURE REVIEW..………………………...…..…………………...
2.1 Hydrotreating Processes………………………………………...…..…
2.1.1 Process Chemistry………………………………………………. 2.1.2 Sulfur Compounds in Raw Oil Materials……………………….. 2.1.3 Compositional Features of Distillate Fuel Oil…………...………
2.2 Hydrodesulfurization Process………………………………...….…… 2.2.1 Chemical Concepts ……………………………………..…...….. 2.2.2 Hydrodesulfurization Network of Dibenzothiophene ………...... 2.2.3 Hydrodesulfurization Network of 4-Methyldibenzothiophene
and 4,6-Dimethyldibenzothiophene………………………..…… 2.2.4 Thermodynamics …………………………………………….…. 2.2.5 Reactivities …………………………………………………...…
2.2.5.1 Reactivities Based on the Strength of C-S Bonds…..…...
iii
v
vi
viii
xiv
xxxii
1
2 3
6
6 6 9 10 12 14 16
17 20 21 21
ix
CHAPTER
2.2.5.2 Reactivities Based on the Steric Hindrance……...……… 2.3 Effect of H2S on Hydroprocessing Reactions………………..……….. 2.4 Poisons of the Hydrodesulfurization Catalyst………………...……….
2.4.1 Effect of Sodium on Catalyst Performance…………..…….…… 2.4.2 Effect of Arsenic on Catalyst Performance…………..……...…..
2.5 Catalyst Formulations…………………………………….…..….….… 2.6 Structure of Active Phase…………………………………….…..……
2.6.1 Monolayer Model………………………………..……..….......... 2.6.2 Intercalation Model……………………………..……..…..…….
2.7. Zeolites……………………………………………………..…….…... 2.7.1 Introduction……………………………………….…..……….... 2.7.2 Shape-selectivity……………………………….……………...… 2.7.3 “Y” Zeolite (Faujasite) as Support of HDS Catalysts...…………
III SYNTHESIS AND CHARACTERIZATION OF THE CATALYSTS...............................................................................................
3.1 Raw Chemicals…………….………………………………..…...…..... 3.1.1 Ultrastable Y Faujasite………………..………………….……... 3.1.2 Chemicals………………..…………………………..…….....….
3.2 Synthesis of the Catalysts………….…………………….……....……. 3.2.1 Synthesis of Catalysts Containing USY-12……………..…….....
3.2.1.1 CoMoPtPd/HY (HDS-1)………..………………..........… 3.2.2 Synthesis of Catalysts Containing Ni-USY………...……............
3.2.2.1 Synthesis of CoMoPtPd/Ni-HY (HDS-3) Catalyst…...…. 3.2.3 Synthesis of Catalysts Containing Pt-USY…………....................
3.2.3.1 Synthesis of CoMoPd/Pt-HY (HDS-5) Catalyst……...…. 3.2.3.2 Synthesis of CoMo/PdNiPt-HY (HDS-8) Catalyst……… 3.2.3.3 Synthesis of CoMoNi/PdPt-HY (HDS-10) Catalyst….....
3.3 Characterization of the Catalysts……….…...……………………..….. 3.3.1 Analytical Techniques………………….………..………….…...
3.3.1.1 Neutron Activation Analysis………………...………..… 3.3.1.2 Adsorption-Desorption Isotherms of Nitrogen………….. 3.3.1.3 X-ray Photoelectron Spectroscopy Technique (XPS)…...
3.4 Results and Discussion ……………………………..…………...…..... 3.4.1 Characterization of Ni-HY and Pt-HY………………..…...….....
3.4.1.1 Metal Contents……………..……………………...…….. 3.4.1.2 Textures………….……………………….……...…….... 3.4.1.3 X-ray Photoelectron Spectroscopy (XPS)…..…...……....
Page
23 24 26 26 28 30 32 33 33 34 34 36 36
39
39 39 40 41 41 41 43 44 47 48 50 52 54 55 55 56 58 60 61 61 61 64
x
CHAPTER
3.4.2 Characterization of CoMoPtPd/HY (HDS-1), CoMoPtPd/Ni-HY(HDS-3) and CoMoPd/Pt-HY (HDS-5) Catalysts……........
3.4.2.1 Metal Contents…………………………………………... 3.4.2.2 Textures………………….……………………...…...…..
3.4.3 Characterization of CoMo/PdNiPt-HY (HDS-8) and CoMoNi/PdPt-HY (HDS-10) Catalysts………………...……...
3.4.3.1 Metal Contents………………………...…..……….……. 3.4.3.2 Textures…………………………………...……………..
3.5 Concluding Remarks ………………………………..….....…………..
IV EXPERIMENTAL SET UP AND METHODS FOR THE ACTIVITY TEST OF THE CATALYSTS…………………………………..…….…...
4.1 Description of the Setup ……………………………..……….………. 4.2 Analysis of Product…………….………………………….….………..
4.2.1 Gaseous Product……..……………………………....………….. 4.2.2 Liquid Product…………….……………………....….….………
4.3 GC-MS Data Processing………………………………..……...…….... 4.4 Catalysts Activation……………………………………………………
4.4.1 Description of the Sulphiding Procedure ………..……...……… 4.5 Catalysts Testing for HDS of Real Feedstock…………...……..……...
V CHARACTERIZATION OF FEEDSTOCK AND REACTION PRODUCTS………………………………………………………….........
5.1 Characterization of Heavy Gas Oil and Light Cycle Oil by GC-MS…. 5.2 Characterization of HDS Reaction Products…………..………….…...
VI TEST OF THE CATALYSTS….……………………………..……...….
6.1 Sulphiding……………………………………………….……..……… 6.2 Activity test of CoMo/Al2O3 and the Zeolite Catalysts in the HDS of
Heavy Gas oil…………….…….…………………….……….…….. 6.2.1 CoMo/Al2O3 Catalyst (HDS-0)……………………………….....
6.2.1.1 Effect of Space Time at Molar H2/HC Ratio of 2.8……... 6.2.1.2 Effect of Space Time at Molar H2/HC Ratio of 7.2……... 6.2.1.3 Effect of Space Time and Molar Hydrogen/Hydrocarbon
Ratio at 330 oC……………………………………...……
Page
67 68 69
74 74 75 79
81
81 84 84 86 87 94 96 96
99
99 111
115
116
119 119 120 122
126
xi
CHAPTER
6.2.2 CoMoPtPd/HY Catalyst (HDS-1) ………………………………. 6.2.2.1 Effect of Space Time and Temperature…………...…….. 6.2.2.2 Effect of the Molar Hydrogen/Hydrocarbon Ratio for the
CoMoPtPd/HY Catalyst at 65 and 75 Bar………..……... 6.2.3 CoMo/PdNiPt-HY (HDS-8) Catalyst.…………………..……….
6.2.3.1 Effect of the Space Time at 330 and 310 oC under Molar H2/HC Ratio of 7.2………………………….……….…..
6.2.3.2 Effect of the Space Time at 310 oC and Molar H2/HC Ratio of 11.2………..…………………………................
6.2.3.3 Effect of the Molar Hydrogen/Hydrocarbon Ratio at 310 oC and 65-75 bar ……………………………….…...
6.2.4 CoMoNi/PdPt-HY (HDS-10) Catalyst ………………………..... 6.2.4.1 Effect of the Space Time at 330 oC and 310 oC under
Molar H2/HC Ratio of 7.2………………………….….… 6.2.4.2 Effect of the Space Time at 310 oC under Molar H2/HC
Ratio of 11.2…………………………………………….. 6.2.4.3 Effect of the Molar Hydrogen/Hydrocarbon Ratio at 310
oC under 65-75 Bar ……………………….………….…. 6.2.5 CoMoPtPd/Ni-HY (HDS-3) Catalyst.…………….………….….
6.2.5.1 Effect of the Space Time at 310 oC under Molar H2/HC Ratio of 7.2……………...………………..………….…..
6.2.5.2 Effect of the Molar Hydrogen/Hydrocarbon Ratio at 310 oC under 65 Bar …………..………………………..........
6.2.6 CoMoPd/Pt-HY (HDS-5) Catalyst …………………..…………. 6.2.6.1 Effect of the Space Time at 310 oC under Molar H2/HC
Ratio of 7.2………………...………………….………… 6.2.6.2 Effect of the Molar Hydrogen/Hydrocarbon Ratio at 310
oC and 65 Bar…………………………………………..... 6.3 Concluding Remarks...……………………………………..…………
VII COMPARISON OF THE ACTIVITY IN TERMS OF CONVERSION OF DBT AND REFRACTORY SULFUR SPECIES…………..........……
7.1 Effect of Space Time at Molar H2/HC Ratio of 7.2…………..………. 7.1.1 HDS of Heavy Gas Oil over Conventional CoMo/Al2O3
Catalyst, CoMoPtPd/HY and CoMoPd/Pt-HY Catalysts……...... 7.1.2 HDS of Heavy Gas Oil over CoMoPtPd/HY, CoMoPtPd/Ni-HY
and CoMoPd/Pt-HY Catalysts……………………………….…. 7.1.3 HDS of Heavy Gas Oil over CoMo/PdNiPt-HY, CoMoNi/PdPt-
HY, and CoMoPtPd/Ni-HY Catalysts…………………….….….
Page
129 129
132 136
137
140
142 144
145
147
149 152
152
154 156
157
159 160
161
161
161
165
169
xii
. CHAPTER
7.1.4 HDS of Heavy Gas Oil over CoMo/PdNiPt-HY, CoMoNi/PdPt-HY, and CoMoPd/Pt-HY Catalysts………………..………….....
7.2 Effect of the Molar H2/HC Ratio at Space Time of 6000 kgcath/kmol…………………………………………………………..… 7.2.1 HDS of Heavy Gas Oil over CoMoPtPd/HY, CoMoPtPd/Ni-
HY, and CoMoPd/Pt-HY Catalysts……………..…………….… 7.2.2 HDS of Heavy Gas Oil over CoMo/PdNiPt-HY, CoMoNi/PdPt-
HY, and CoMoPtPd/Ni-HY Catalysts……………………...….... 7.2.3 HDS of Heavy Gas Oil over CoMo/PdNiPt-HY, CoMoNi/PdPt-
HY, and CoMoPd/Pt-HY Catalysts……………..…….……….... 7.3 Concluding Remarks……………………………………..…...……….
VIII COMPARISON OF ACTIVITY IN TERMS OF CONVERSION OF DBT AND 4,6-DMDBT INTO THEIR REACTION PRODUCTS…........
8.1 Effect of Space Time at 310 oC and Molar H2/HC Ratio of 7.2………. 8.1.1 Commercial CoMo/Al2O3 (HDS-0) Catalyst……………..….…..
8.1.1.1 Conversion of DBT in HDS of Heavy Gas Oil……….… 8.1.1.2 Conversion of 4,6-DMDBT in HDS of Heavy Gas Oil…
8.1.2 CoMoPtPd/HY (HDS-1) Catalyst…………………………...…... 8.1.2.1 Conversion of DBT in HDS of Heavy Gas Oil……...….. 8.1.2.2 Conversion of 4,6-DMDBT in HDS of Heavy Gas Oil
8.1.3 CoMoPd/Pt-HY (HDS-5) Catalyst………………………..…….. 8.1.3.1 Conversion of DBT in HDS of Heavy Gas Oil……...….. 8.1.3.2 Conversion of 4,6-DMDBT in HDS of Heavy Gas Oil…
8.1.4 CoMoPtPd/Ni-HY (HDS-3) Catalyst……………………..……. 8.1.4.1 Conversion of DBT in HDS of Heavy Gas Oil……...….. 8.1.4.2 Conversion of 4,6-DMDBT in HDS of Heavy Gas Oil…
8.1.5 CoMo/PdNiPt-HY (HDS-8) Catalyst………………………...…. 8.1.5.1 Conversion of DBT in HDS of Heavy Gas Oil……...….. 8.1.5.2 Conversion of 4,6-DMDBT in HDS of Heavy Gas Oil…
8.1.6 CoMoNi/PdPt-HY (HDS-10) Catalyst………………………….. 8.1.6.1 Conversion of DBT in HDS of Heavy Gas Oil……...….. 8.1.6.2 Conversion of 4,6-DMDBT in HDS of Heavy Gas Oil…
8.2 Concluding Remarks ………….………………………………..……..
IX CONCLUSIONS…………………………………………………..………
Page
173
177
178
182
186 190
191
191 191 191 193 194 195 196 197 197 199 201 201 202 204 204 205 207 207 209 211
212
xiii
LITERATURE CITED………………………………………………..………….….
APPENDIX A TEXTURES OF HY AND BOUND ZEOLITE……………….…..
VITA………………………………………………… ……………..………….…….
Page
214
221
226
xiv
LIST OF FIGURES
FIGURE
Page
2.1 Some examples of hydrotreating reactions………………………...
7
2.2 Scheme of a typical desulfurizer unit……………………………....
13
2.3 Proposed reaction network for the HDS of DBT by Houalla et al. (1978)..……………………………………………………………..
17
2.4 Reaction scheme for the HDS of 4-MeDBT……………………….
18
2.5 Reaction scheme for the HDS of 4,6-DMDBT…………………….
18
2.6 Reaction pathway of 4,6-DMDBT over zeolite containing CoMo/Al2O3 catalyst……………………………………………….
19
2.7 Multiphase reaction network proposed for the HDS of 4,6-dimethyldibenzothiophene…………………………………………
20
2.8 Effect of recycle gas H2S content on the temperature……………...
26
2.9 Effect of the sodium content on catalysts on the activity relative to fresh catalyst. ………………………………………………………
27
2.10 Effect of arsenic on relative volumetric activity…………………...
29
2.11 HDS activities as a function of the calculated metal-sulfur bond energies……………………………………………………………..
31
2.12 Schematic representation of the monolayer model………………...
33
2.13 Locations of the promoter atoms in the MoS2 structure proposed by the intercalation and psudo-intercalation models……………….
34
xv
FIGURE
Page
2.14 The structure of Y-type zeolite or Faujasite (USY)………………..
38
3.1 Preparation of CoMoPtPd/HY (HDS-1) catalyst. Introduction of PtPd and CoMo into USY zeolite………………………………….
42
3.2 Schematic presentation of the preparation of CoMoPtPd/HY (HDS-1) catalyst. Introduction of Pt, Pd, Co and Mo into zeolite…
43
3.3 Schematic presentation of ion exchange procedure with an aqueous nickel solution…………………………………………….
45
3.4 Preparation of CoMoPtPd/Ni-HY (HDS-3) catalyst. Introduction of PtPd and CoMo into Ni-USY zeolite…………………………....
46
3.5 Schematic presentation of the preparation of (CoMoPtPd/Ni-HY (HDS-3) catalyst. Introduction of Pt, Pd, Co, and Mo into zeolite...
46
3.6 Schematic procedure of platinum containing zeolite………………
47
3.7 Preparation of CoMoPd/Pt-HY (HDS-5) catalyst. Introduction of Pd and CoMo into Pt-USY zeolite…………………………………
48
3.8 Schematic presentation of the preparation of CoMoPd/Pt-HY (HDS-5) catalyst. Introduction of Pd and CoMo into zeolite……...
49
3.9 Preparation of CoMo/PdNiPt-HY (HDS-8) catalyst. Introduction of Pd, Ni and CoMo into Pt-USY zeolite………………………….
50
3.10 Schematic presentation of the preparation of CoMo/PdNiPt-HY (HDS-8) catalyst. Introduction of Ni, Pd, Pt and CoMo into zeolite. ……………………………………………………………..
51
3.11 Preparation of CoMoNi/PdPt-HY (HDS-10) catalyst. Introduction of Pd, NiMo and CoMo into Pt-USY zeolite……………………....
52
xvi
FIGURE
Page
3.12 Schematic presentation of the preparation of CoMoNi/PtPd-HY (HDS-10) catalyst. Introduction of Pd, Ni and CoMo into zeolite...
53
3.13 Micromeritics BET machine Model ASAP 2010 …………………
57
3.14 X-ray photoelectron spectroscopy machine model Kratos AxisIHIs……………………………………………………………
59
3.15 Texture of HY, Ni-loaded zeolite, and Pt-loaded zeolite pressed at 3 and 4.5 Ton/cm2. (a) Surface area (BET), (b) Total pore volume (BJH desorption)…………………………………………………...
63
3.16 Textures of HY, Ni loaded zeolite and Pt-loaded zeolite pressed at 3 and 4.5 Ton/cm2. (a) Micropore area, (b) Micropore volume…..
63
3.17 Pore size distribution of HY, Ni-loaded zeolite and Pt-loaded zeolite pressed at 3 and 4.5 Ton/cm2……………………………….
64
3.18 XPS spectrum of Pt 4d of the sample Pt-HY with 0.73 wt% of Pt...
65
3.19 Ni 2p core level XPS spectrum of calcined Ni-HY zeolite………
66
3.20 Surface area of HY, CoMoPtPd/HY (HDS-1), CoMoPdPt/Ni-HY (HDS-3) and CoMoPd/Pt-HY (HDS-5) pressed at 3 and 4.5 Ton/cm2…………………………………………………………….
71
3.21 Micropore area of HY, CoMoPtPd/HY (HDS-1), CoMoPdPt/Ni-HY (HDS-3) and CoMoPd/Pt-HY (HDS-5) pressed at 3 and 4.5 Ton/cm2...…………………………………………………………..
71
3.22 Total pore volumes (BJH desorption) of HY, CoMoPtPd/HY (HDS-1), CoMoPdPt/Ni-HY (HDS-3) and CoMoPd/Pt-HY (HDS-5) pressed at 3 and 4.5 Ton/cm2…………………………………....
72
xvii
FIGURE
Page
3.23 Micropore volume of HY, CoMoPtPd/HY (HDS-1), CoMoPdPt/Ni-HY (HDS-3) and CoMoPd/Pt-HY (HDS-5) pressed at 3 and 4.5 Ton/cm2……………………………………………….
72
3.24 Pore size distribution of HY, CoMoPtPd/HY (HDS-1), CoMoPdPt/Ni-HY (HDS-3) and CoMoPd/Pt-HY (HDS-5) pressed at 3 and 4.5 Ton/cm2……………………………………………….
73
3.25 Surface area of HY, CoMoPtPd/HY (HDS-1), CoMo/PdNiPt-HY (HDS-8) and CoMoNi/PdPt-HY (HDS-10) catalysts pressed at 3 and 4.5 Ton/cm2……………………………………………………
77
3.26 Total pore volumes (BJH desorption) of HY, CoMoPtPd/HY (HDS-1), CoMo/PdNiPt-HY (HDS-8) and CoMoNi/PdPt-HY (HDS-10) catalysts pressed at 3 and 4.5 Ton/cm2………………….
77
3.27 Micropore area of HY, CoMoPtPd/HY (HDS-1), CoMo/PdNiPt-HY (HDS-8) and CoMoNi/PdPt-HY (HDS-10) catalysts pressed at 3 and 4.5 Ton/cm2. ………………………………………………...
78
3.28 Micropore volume of HY, CoMoPtPd/HY (HDS-1), CoMo/PdNiPt-HY (HDS-8) and CoMoNi/PdPt-HY (HDS-10) catalysts pressed at 3 and 4.5 Ton/cm2……………………………..
78
3.29 Pore distribution of HY, CoMoPtPd/HY (HDS-1), CoMo/PdNiPt-HY (HDS-8) and CoMoNi/PdPt-HY (HDS-10) catalysts pressed at 3 and 4.5 Ton/cm2……………………………………………...…..
79
4.1 Schematic representation of the Robinson-Mahoney catalyst testing reactor……………………………………………...……….
81
4.2 Schematic of high pressure experimental setup for the hydrodesulfurization of heavy gas oil……………………………...
82
4.3 Stainless steel Catalyst Basket modified by the Chemical Engineering workshop at A&M University………………………..
83
xviii
FIGURE
Page
4.4 Schematic representation of the configuration on Shimadzu 17A GC-TCD in load position (loading sample and backflush)………...
85
4.5 Schematic representation of the configuration on Shimadzu 17A GC-TCD in inject position (analysis online and manual injection)……………………………………………………………
85
4.6 Total ion chromatogram of heavy gas oil………….………………
88
4.7 Total ion chromatogram of one product obtained in the hydrodesulfurization of heavy gas oil……………………………...
88
4.8 Molecular structures of the sulfur compounds present in heavy gas oil.…………..………………………………………………………
89
4.9 Molecular structures of 2,8-dimethyldibenzothiophene and 3,6-dimethyldibenzothiophene present in heavy gas oil……………….
90
4.10 Molecular structures of the aromatic compounds present in heavy gas oil. ……………………………………………………...……
90
4.11 Molecular structures of the reactions products of DBT and 4,6-DMDBT…………………………………………………………....
91
4.12 Diagram of the procedure carried out for activating the experimental zeolite containing catalysts, reaction-activity test and shut down. …………………………………………………………
97
5.1 Typical total chromatogram of light cycle oil (LCO) using GC-MS………………………………………………………………….
101
5.2 Typical total chromatogram of heavy gas oil (HGO) using GC-MS……..…………………………………………………….……..
102
xix
FIGURE
Page
5.3 Part of the total ion chromatogram of the HGO and the LCO showing part of the peaks with retention times in the interval of 12-26 min…………………………………………………………..
103
5.4 Part of the total ion chromatogram of the HGO and the LCO showing part of the peaks with retention times in the interval of 25-38 min…………………………………………………………..
104
5.5 Part of the total ion chromatogram of the HGO and the LCO showing part of the peaks with retention times in the interval of 44-60 min. …………………………………………………………
105
5.6 Part of the total ion chromatogram of the HGO and the LCO showing part of the peaks with retention times in the interval of 60-67 min. …………………………………………………………
106
5.7 Part of the total ion chromatogram of the HGO and the LCO showing part of the peaks with retention times in the interval of 79-83.5 min. ……………………………………………….………
107
5.8 Part of the total ion chromatogram of the HGO and the LCO showing part of the peaks with retention times in the interval of 99-104.5 min. ………………………………………………...……
108
5.9 Part of the total ion chromatogram of the HGO and the LCO showing part of the peaks with retention times in the interval of 106-114 min. ………………………………………………………
109
5.10 Part of the total ion chromatogram of the HGO and the LCO showing part of the peaks with retention times in the interval of 114-121 min. ………………………………………………………
110
5.11 Fluorene hydrogenation network (From Lapinas et al., (1991)). ….
112
xx
FIGURE
Page
5.12 Part of the total ion chromatogram of a typical HDS product and the HGO showing the peaks of the reaction products of HDS of DBT…….…………………………………………………………..
113
5.13 Part of the total ion chromatogram of a typical HDS product and the HGO showing the peaks of fluorene and reaction products of HDS of 4,6-DMDBT. ………………………………………..……
114
6.1 Evolution of temperature with time obtained during the activation of the CoMoPtPd/HY (HDS-1) catalyst…………………………...
116
6.2 Evolution of temperature with time obtained during the activation of the CoMo/Al2O3 (HDS-0) catalyst…………….….……………..
117
6.3 Concentration of H2S in the gas phase during the activation of the CoMo/Al2O3 (HDS-0) catalyst. P= 1 atm, T=330°C……………………………………………………………
118
6.4 Concentration of H2S in the gas phase during the activation of the CoMoPtPd/HY (HDS-1) catalyst. P= 1 atm, T=330°C……………………………………………………………
118
6.5 Conversions of DBT, MDBT’s and phenanthrene as a function of space time (W/FoDBT) for the commercial CoMo/Al2O3 (HDS-0) catalyst. Reaction conditions were 65 bar, 330 oC and 2.8 molar H2/HGO ratio. Feed: Heavy Gas Oil……………………………….
121
6.6 Molar-averaged conversions as a function of space time (W/FoDBT)
and temperature for the commercial CoMo/Al2O3 (HDS-0) catalyst. Reaction conditions were 65 bar, and 2.8 molar H2/HGO ratio. Feed: Heavy Gas Oil………………………………………....
121
6.7 Conversions of DBT, MDBT’s and phenanthrene as a function of space time (W/FoDBT) for the commercial CoMo/Al2O3 (HDS-0) catalyst. Reaction conditions were 65 bar, 330 oC and 7.2 molar H2/HGO ratio. Feed: Heavy Gas Oil……………………………….
123
xxi
FIGURE
Page
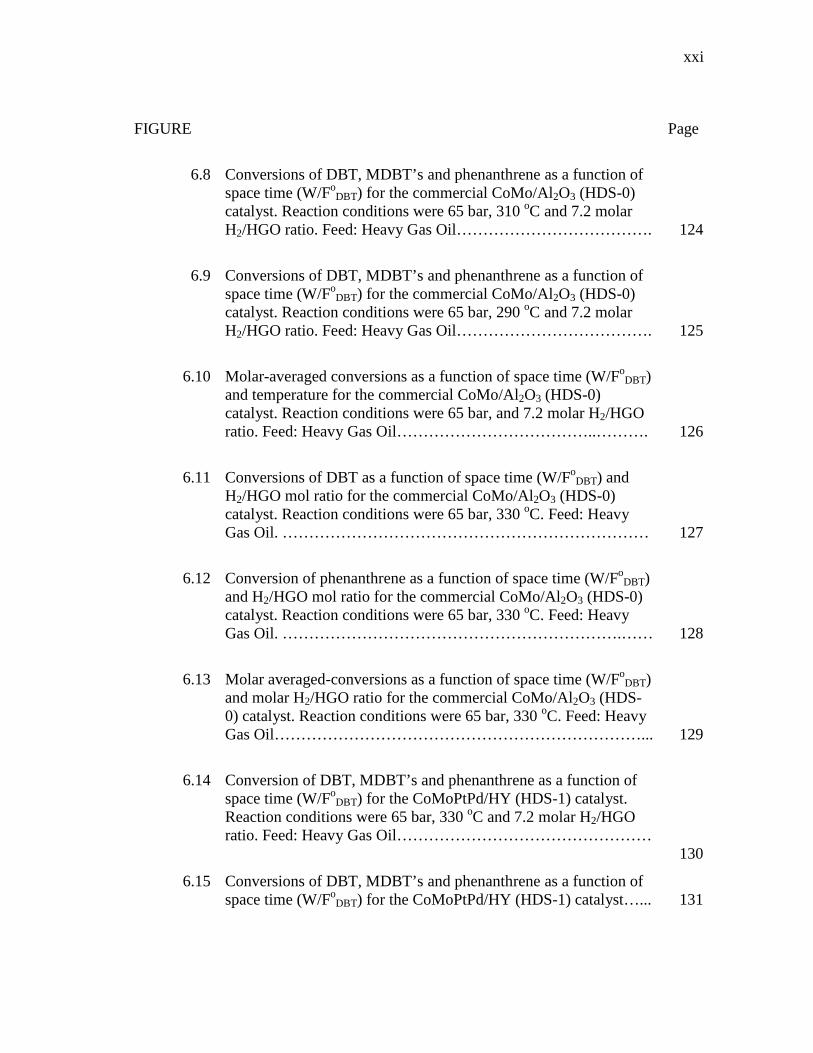
6.8 Conversions of DBT, MDBT’s and phenanthrene as a function of space time (W/FoDBT) for the commercial CoMo/Al2O3 (HDS-0) catalyst. Reaction conditions were 65 bar, 310 oC and 7.2 molar H2/HGO ratio. Feed: Heavy Gas Oil……………………………….
124
6.9 Conversions of DBT, MDBT’s and phenanthrene as a function of space time (W/FoDBT) for the commercial CoMo/Al2O3 (HDS-0) catalyst. Reaction conditions were 65 bar, 290 oC and 7.2 molar H2/HGO ratio. Feed: Heavy Gas Oil……………………………….
125
6.10 Molar-averaged conversions as a function of space time (W/FoDBT)
and temperature for the commercial CoMo/Al2O3 (HDS-0) catalyst. Reaction conditions were 65 bar, and 7.2 molar H2/HGO ratio. Feed: Heavy Gas Oil………………………………..……….
126
6.11 Conversions of DBT as a function of space time (W/FoDBT) and
H2/HGO mol ratio for the commercial CoMo/Al2O3 (HDS-0) catalyst. Reaction conditions were 65 bar, 330 oC. Feed: Heavy Gas Oil. ……………………………………………………………
127
6.12 Conversion of phenanthrene as a function of space time (W/FoDBT)
and H2/HGO mol ratio for the commercial CoMo/Al2O3 (HDS-0) catalyst. Reaction conditions were 65 bar, 330 oC. Feed: Heavy Gas Oil. ……………………………………………………….……
128
6.13 Molar averaged-conversions as a function of space time (W/FoDBT)
and molar H2/HGO ratio for the commercial CoMo/Al2O3 (HDS-0) catalyst. Reaction conditions were 65 bar, 330 oC. Feed: Heavy Gas Oil……………………………………………………………...
129
6.14 Conversion of DBT, MDBT’s and phenanthrene as a function of space time (W/FoDBT) for the CoMoPtPd/HY (HDS-1) catalyst. Reaction conditions were 65 bar, 330 oC and 7.2 molar H2/HGO ratio. Feed: Heavy Gas Oil…………………………………………
130
6.15 Conversions of DBT, MDBT’s and phenanthrene as a function of space time (W/FoDBT) for the CoMoPtPd/HY (HDS-1) catalyst…...
131
xxii
FIGURE
Page
6.16 Molar-averaged conversion as a function of space time (W/FoDBT)
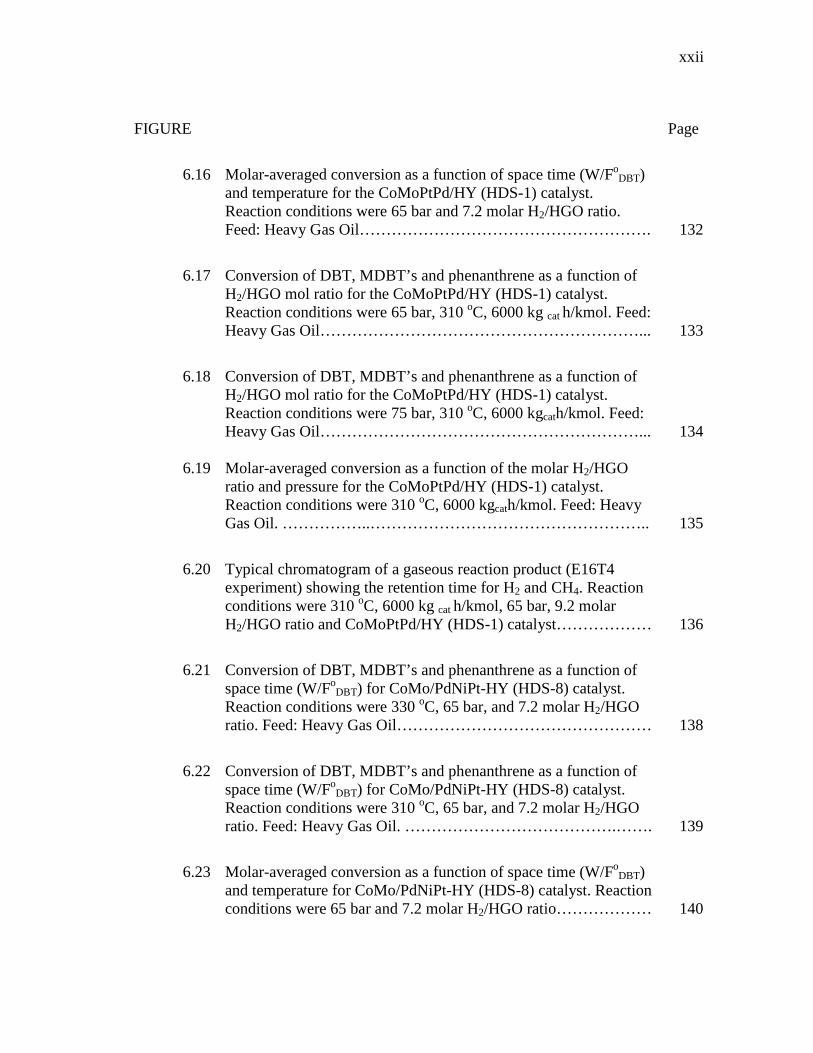
and temperature for the CoMoPtPd/HY (HDS-1) catalyst. Reaction conditions were 65 bar and 7.2 molar H2/HGO ratio. Feed: Heavy Gas Oil……………………………………………….
132
6.17 Conversion of DBT, MDBT’s and phenanthrene as a function of H2/HGO mol ratio for the CoMoPtPd/HY (HDS-1) catalyst. Reaction conditions were 65 bar, 310 oC, 6000 kg cat h/kmol. Feed: Heavy Gas Oil……………………………………………………...
133
6.18 Conversion of DBT, MDBT’s and phenanthrene as a function of H2/HGO mol ratio for the CoMoPtPd/HY (HDS-1) catalyst. Reaction conditions were 75 bar, 310 oC, 6000 kgcath/kmol. Feed: Heavy Gas Oil……………………………………………………...
134
6.19 Molar-averaged conversion as a function of the molar H2/HGO ratio and pressure for the CoMoPtPd/HY (HDS-1) catalyst. Reaction conditions were 310 oC, 6000 kgcath/kmol. Feed: Heavy Gas Oil. ……………..……………………………………………..
135
6.20 Typical chromatogram of a gaseous reaction product (E16T4 experiment) showing the retention time for H2 and CH4. Reaction conditions were 310 oC, 6000 kg cat h/kmol, 65 bar, 9.2 molar H2/HGO ratio and CoMoPtPd/HY (HDS-1) catalyst………………
136
6.21 Conversion of DBT, MDBT’s and phenanthrene as a function of space time (W/FoDBT) for CoMo/PdNiPt-HY (HDS-8) catalyst. Reaction conditions were 330 oC, 65 bar, and 7.2 molar H2/HGO ratio. Feed: Heavy Gas Oil…………………………………………
138
6.22 Conversion of DBT, MDBT’s and phenanthrene as a function of space time (W/FoDBT) for CoMo/PdNiPt-HY (HDS-8) catalyst. Reaction conditions were 310 oC, 65 bar, and 7.2 molar H2/HGO ratio. Feed: Heavy Gas Oil. ………………………………….…….
139
6.23 Molar-averaged conversion as a function of space time (W/FoDBT)
and temperature for CoMo/PdNiPt-HY (HDS-8) catalyst. Reaction conditions were 65 bar and 7.2 molar H2/HGO ratio………………
140
xxiii
FIGURE
Page
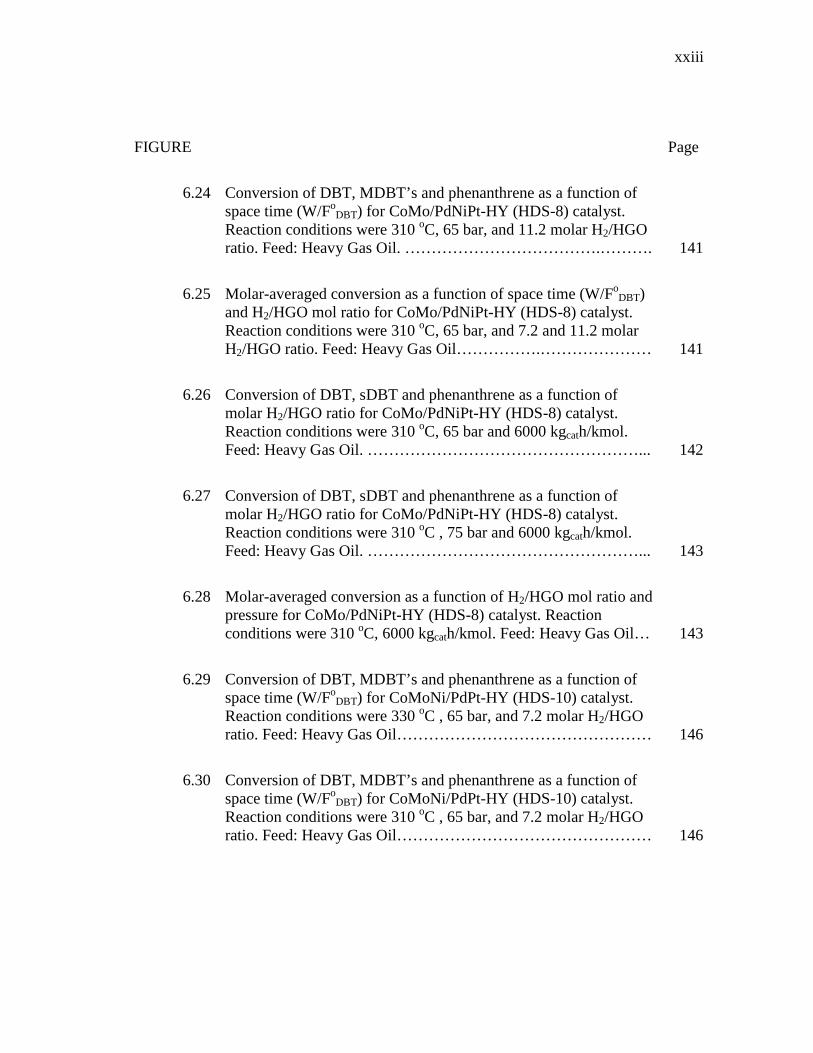
6.24 Conversion of DBT, MDBT’s and phenanthrene as a function of space time (W/FoDBT) for CoMo/PdNiPt-HY (HDS-8) catalyst. Reaction conditions were 310 oC, 65 bar, and 11.2 molar H2/HGO ratio. Feed: Heavy Gas Oil. ……………………………….……….
141
6.25 Molar-averaged conversion as a function of space time (W/FoDBT)
and H2/HGO mol ratio for CoMo/PdNiPt-HY (HDS-8) catalyst. Reaction conditions were 310 oC, 65 bar, and 7.2 and 11.2 molar H2/HGO ratio. Feed: Heavy Gas Oil…………….…………………
141
6.26 Conversion of DBT, sDBT and phenanthrene as a function of molar H2/HGO ratio for CoMo/PdNiPt-HY (HDS-8) catalyst. Reaction conditions were 310 oC, 65 bar and 6000 kgcath/kmol. Feed: Heavy Gas Oil. ……………………………………………...
142
6.27 Conversion of DBT, sDBT and phenanthrene as a function of molar H2/HGO ratio for CoMo/PdNiPt-HY (HDS-8) catalyst. Reaction conditions were 310 oC , 75 bar and 6000 kgcath/kmol. Feed: Heavy Gas Oil. ……………………………………………...
143
6.28 Molar-averaged conversion as a function of H2/HGO mol ratio and pressure for CoMo/PdNiPt-HY (HDS-8) catalyst. Reaction conditions were 310 oC, 6000 kgcath/kmol. Feed: Heavy Gas Oil…
143
6.29 Conversion of DBT, MDBT’s and phenanthrene as a function of space time (W/FoDBT) for CoMoNi/PdPt-HY (HDS-10) catalyst. Reaction conditions were 330 oC , 65 bar, and 7.2 molar H2/HGO ratio. Feed: Heavy Gas Oil…………………………………………
146
6.30 Conversion of DBT, MDBT’s and phenanthrene as a function of space time (W/FoDBT) for CoMoNi/PdPt-HY (HDS-10) catalyst. Reaction conditions were 310 oC , 65 bar, and 7.2 molar H2/HGO ratio. Feed: Heavy Gas Oil…………………………………………
146
xxiv
FIGURE
Page
6.31 Molar-averaged conversion as a function of space time (W/FoDBT)
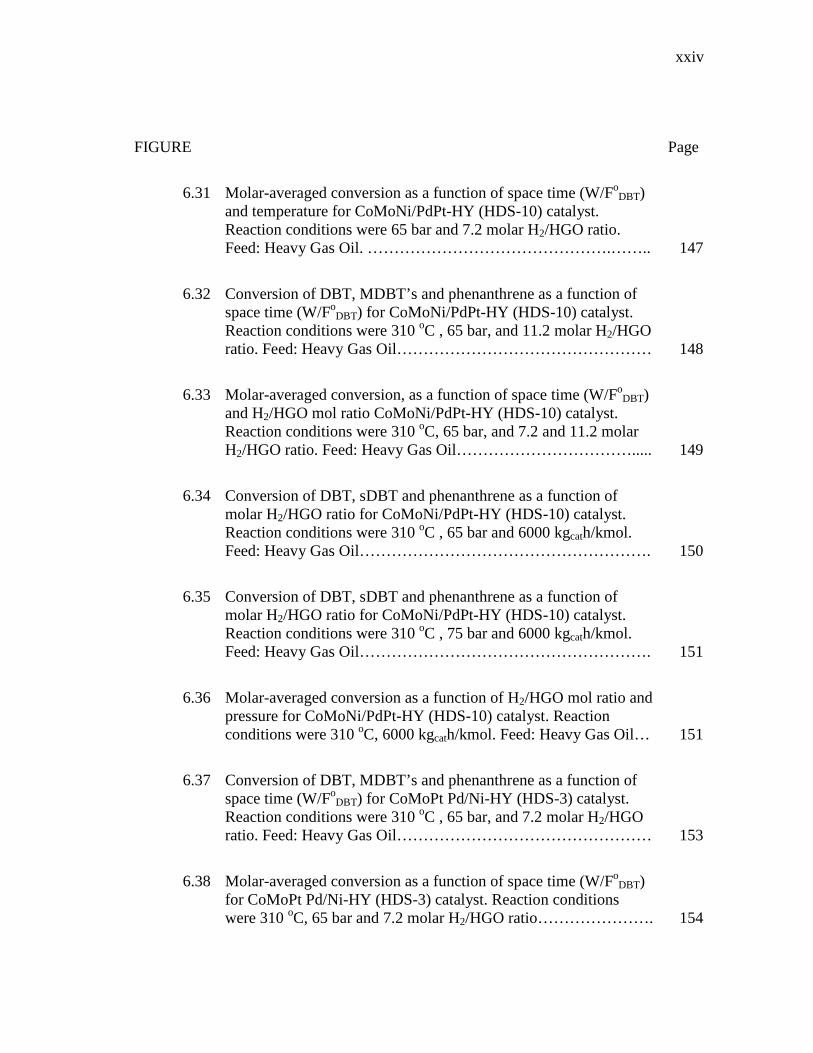
and temperature for CoMoNi/PdPt-HY (HDS-10) catalyst. Reaction conditions were 65 bar and 7.2 molar H2/HGO ratio. Feed: Heavy Gas Oil. ……………………………………….……..
147
6.32 Conversion of DBT, MDBT’s and phenanthrene as a function of space time (W/FoDBT) for CoMoNi/PdPt-HY (HDS-10) catalyst. Reaction conditions were 310 oC , 65 bar, and 11.2 molar H2/HGO ratio. Feed: Heavy Gas Oil…………………………………………
148
6.33 Molar-averaged conversion, as a function of space time (W/FoDBT)
and H2/HGO mol ratio CoMoNi/PdPt-HY (HDS-10) catalyst. Reaction conditions were 310 oC, 65 bar, and 7.2 and 11.2 molar H2/HGO ratio. Feed: Heavy Gas Oil…………………………….....
149
6.34 Conversion of DBT, sDBT and phenanthrene as a function of molar H2/HGO ratio for CoMoNi/PdPt-HY (HDS-10) catalyst. Reaction conditions were 310 oC , 65 bar and 6000 kgcath/kmol. Feed: Heavy Gas Oil……………………………………………….
150
6.35 Conversion of DBT, sDBT and phenanthrene as a function of molar H2/HGO ratio for CoMoNi/PdPt-HY (HDS-10) catalyst. Reaction conditions were 310 oC , 75 bar and 6000 kgcath/kmol. Feed: Heavy Gas Oil……………………………………………….
151
6.36 Molar-averaged conversion as a function of H2/HGO mol ratio and pressure for CoMoNi/PdPt-HY (HDS-10) catalyst. Reaction conditions were 310 oC, 6000 kgcath/kmol. Feed: Heavy Gas Oil…
151
6.37 Conversion of DBT, MDBT’s and phenanthrene as a function of space time (W/FoDBT) for CoMoPt Pd/Ni-HY (HDS-3) catalyst. Reaction conditions were 310 oC , 65 bar, and 7.2 molar H2/HGO ratio. Feed: Heavy Gas Oil…………………………………………
153
6.38 Molar-averaged conversion as a function of space time (W/FoDBT)
for CoMoPt Pd/Ni-HY (HDS-3) catalyst. Reaction conditions were 310 oC, 65 bar and 7.2 molar H2/HGO ratio………………….
154
xxv
FIGURE
Page
6.39 Conversion of DBT, sDBT and phenanthrene as a function of molar H2/HGO ratio for CoMoPt Pd/Ni-HY (HDS-3) catalyst. Reaction conditions were 310 oC , 65 bar and 6000 kgcath/kmol. Feed: Heavy Gas Oil……………………………………………….
155
6.40 Molar-averaged conversion as a function of H2/HGO mol ratio for CoMoPt Pd/Ni-HY (HDS-3) catalyst. Reaction conditions were 310 oC, 65 bar, 6000 kgcath/kmol. Feed: Heavy Gas Oil……….…..
156
6.41 Conversion of DBT, sDBT and phenanthrene as a function of space time (W/FoDBT) for CoMoPd/Pt-HY (HDS-5) catalyst. Reaction conditions were 310 oC , 65 bar, and 7.2 molar H2/HGO ratio. Feed: Heavy Gas Oil…………………………………………
158
6.42 Molar-averaged conversion as a function of space time (W/FoDBT)
for CoMoPd/Pt-HY (HDS-5) catalyst. Reaction conditions were 310 oC, 65 bar and 7.2 molar H2/HGO ratio. Feed: Heavy Gas Oil..
158
6.43 Conversion of DBT, sDBT and phenanthrene as a function of molar H2/HGO ratio for CoMoPd/Pt-HY (HDS-5) catalyst. Reaction conditions were 310 oC , 65 bar and 6000 kgcath/kmol. Feed: Heavy Gas Oil……………………………………………….
159
6.44 Molar-averaged conversion as a function of H2/HGO mol ratio for CoMoPd/Pt-HY (HDS-5) catalyst. Reaction conditions were 310 oC, 65 bar, 6000 kgcath/kmol……………………………………….
160
7.1 Hydrodesulfurization conversions of dibenzothiophene (DBT) in heavy gas oil over CoMo/Al2O3, CoMoPtPd/HY, and CoMoPd/Pt-HY catalysts. (65 bar, 310 oC, 7.2 molar H2/HGO ratio)…………..
163
7.2 Hydrodesulfurization conversions of 4-methyldibenzothiophene (4-MDBT) in heavy gas oil over CoMo/Al2O3, CoMoPtPd/HY, and CoMoPd/Pt-HY catalysts. (65 bar, 310 oC, 7.2 molar H2/HGO ratio)………………………………………………………………..
163
xxvi
FIGURE
Page
7.3 Hydrodesulfurization conversions of 4,6-dimethyldibenzothiophene (4,6-DMDBT) in heavy gas oil over CoMo/Al2O3, CoMoPtPd/HY, and CoMoPd/Pt-HY catalysts. (65 bar, 310 oC, 7.2 molar H2/HGO ratio)……………………………...
164
7.4 Hydrogenation conversions of phenanthrene in heavy gas oil over CoMo/Al2O3, CoMoPtPd/HY, and CoMoPd/Pt-HY catalysts. (65 bar, 310 oC, 7.2 molar H2/HGO ratio)……………………..…..…..
164
7.5 Molar-averaged conversions in heavy gas oil over CoMo/Al 2O3, CoMoPtPd/HY, and CoMoPd/Pt-HY catalysts. (65 bar, 310 oC, 7.2 molar H2/HGO ratio)…………………………………………..
165
7.6 Hydrodesulfurization conversions of dibenzothiophene (DBT) in heavy gas oil over CoMoPtPd/HY, CoMoPtPd/Ni-HY and CoMoPd/Pt-HY catalysts. (65 bar, 310 oC, 7.2 molar H2/HGO ratio). …………………………..…………………………………..
167
7.7 Hydrodesulfurization conversions of 4-methyldibenzothiophene (4-MDBT) in heavy gas oil over CoMoPtPd/HY, CoMoPtPd/Ni-HY and CoMoPd/Pt-HY catalysts. (65 bar, 310 oC, 7.2 molar H2/HGO ratio)……………………………………………………...
167
7.8 Hydrodesulfurization conversions of 4,6-dimethyldibenzothiophene (4,6-DMDBT) in heavy gas oil over CoMoPtPd/HY, CoMoPtPd/Ni-HY and CoMoPd/Pt-HY catalysts. (65 bar, 310 oC, 7.2 molar H2/HGO ratio)…………………………
168
7.9 Hydrodesulfurization conversions of phenanthrene in heavy gas oil over CoMoPtPd/HY, CoMoPtPd/Ni-HY and CoMoPd/Pt-HY catalysts. (65 bar, 310 oC, 7.2 molar H2/HGO ratio)……..………..
168
7.10 Molar-averaged conversions in heavy gas oil over CoMoPtPd/HY, CoMoPtPd/Ni-HY and CoMoPd/Pt-HY catalysts. (65 bar, 310 oC, 7.2 molar H2/HGO ratio)………………………………………..…
169
xxvii
FIGURE
Page
7.11 Hydrodesulfurization conversions of dibenzothiophene (DBT) in heavy gas oil over CoMo/PdNiPt-HY, CoMoNi/PdPt-HY and CoMoPtPd/Ni-HY catalysts. (65 bar, 310 oC, 7.2 molar H2/HGO ratio). ………………………………………………………………
171
7.12 Hydrodesulfurization conversions of 4-methyldibenzothiophene (4-MDBT) in heavy gas oil over CoMo/PdNiPt-HY, CoMoNi/PdPt-HY and CoMoPtPd/Ni-HY catalysts. (65 bar, 310 oC, 7.2 molar H2/HGO ratio)……………………………………….
171
7.13 Hydrodesulfurization conversions of 4,6-dimethyldibenzothiophene (4,6-DMDBT) in heavy gas oil over CoMo/PdNiPt-HY, CoMoNi/PdPt-HY and CoMoPtPd/Ni-HY catalysts. (65 bar, 310 oC, 7.2 molar H2/HGO ratio)……………….
172
7.14 Hydrogenation conversions of phenanthrene in heavy gas oil over CoMo/PdNiPt-HY, CoMoNi/PdPt-HY and CoMoPtPd/Ni-HY catalysts. (65 bar, 310 oC, 7.2 molar H2/HGO ratio)………………
172
7.15 Molar-averaged conversions in heavy gas oil over CoMo/PdNiPt-HY, CoMoNi/PdPt-HY and CoMoPtPd/Ni-HY catalysts. (65 bar, 310 oC, 7.2 molar H2/HGO ratio)…………………………………..
173
7.16 Hydrodesulfurization conversions of dibenzothiophene (DBT) in heavy gas oil over CoMo/PdNiPt-HY, CoMoNi/PdPt-HY and CoMoPd/Pt-HY catalysts. (65 bar, 310 oC, 7.2 molar H2/HGO ratio).. ……………………………………………………….……..
175
7.17 Hydrodesulfurization conversions of 4-methyldibenzothiophene (4-MDBT) in heavy gas oil over CoMo/PdNiPt-HY, CoMoNi/PdPt-HY and CoMoPd/Pt-HY catalysts. (65 bar, 310 oC, 7.2 molar H2/HGO ratio)…………………………………………...
175
7.18 Hydrodesulfurization conversions of 4,6-dimethyldibenzothio-phene (4,6-DMDBT) in heavy gas oil over CoMo/PdNiPt-HY, CoMoNi/PdPt-HY and CoMoPd/Pt-HY catalysts. (65 bar, 310 oC, 7.2 molar H2/HGO ratio)………………………………………..….
176
xxviii
FIGURE
Page
7.19 Hydrodesulfurization conversions of phenanthrene in heavy gas oil over CoMo/PdNiPt-HY, CoMoNi/PdPt-HY and CoMoPd/Pt-HY catalysts. (65 bar, 310 oC, 7.2 molar H2/HGO ratio)………………………………………………………………..
176
7.20 Molar-averaged conversions in heavy gas oil over CoMo/PdNiPt-HY, CoMoNi/PdPt-HY and CoMoPd/Pt-HY catalysts. (65 bar, 310 oC, 7.2 molar H2/HGO ratio)……………………………….….
177
7.21 Hydrodesulfurization conversions of dibenzothiophene (DBT) in heavy gas oil over CoMoPtPd/HY, CoMoPtPd/Ni-HY and CoMoPd/Pt-HY catalysts. (65 bar, 310 oC, and space time of 6000 kgcath/kmol). ………………………………….……………………
179
7.22 Hydrodesulfurization conversions of 4-methyldibenzothiophene (4-MDBT) in heavy gas oil over CoMoPtPd/HY, CoMoPtPd/Ni-HY and CoMoPd/Pt-HY catalysts. (65 bar, 310 oC, and space time of 6000 kgcath/kmol)………………………………………………..
180
7.23 Hydrodesulfurization conversions of 4,6-dimethyldibenzothio-phene (4,6-DMDBT) in heavy gas oil over CoMoPtPd/HY, CoMoPtPd/Ni-HY and CoMoPd/Pt-HY catalysts. (65 bar, 310 oC, and space time of 6000 kgcath/kmol)……………………………..
180
7.24 Hydrodesulfurization conversions of phenanthrene in heavy gas oil over CoMoPtPd/HY, CoMoPtPd/Ni-HY and CoMoPd/Pt-HY catalysts. (65 bar, 310 oC, and space time of 6000 kgcath/kmol)……...…………………………………………………
181
7.25 Molar-averaged conversions in heavy gas oil over CoMoPtPd/HY, CoMoPtPd/Ni-HY and CoMoPd/Pt-HY catalysts. (65 bar, 310 oC, and space time of 6000 kgcath/kmol)……………..
181
7.26 Hydrodesulfurization conversions of dibenzothiophene (DBT) in heavy gas oil over CoMo/PdNiPt-HY, CoMoNi/PdPt-HY and CoMoPtPd/Ni-HY catalysts. (65 bar, 310 oC, and space time of 6000 kgcath/kmol)…………………………………………………..
183
xxix
FIGURE
Page
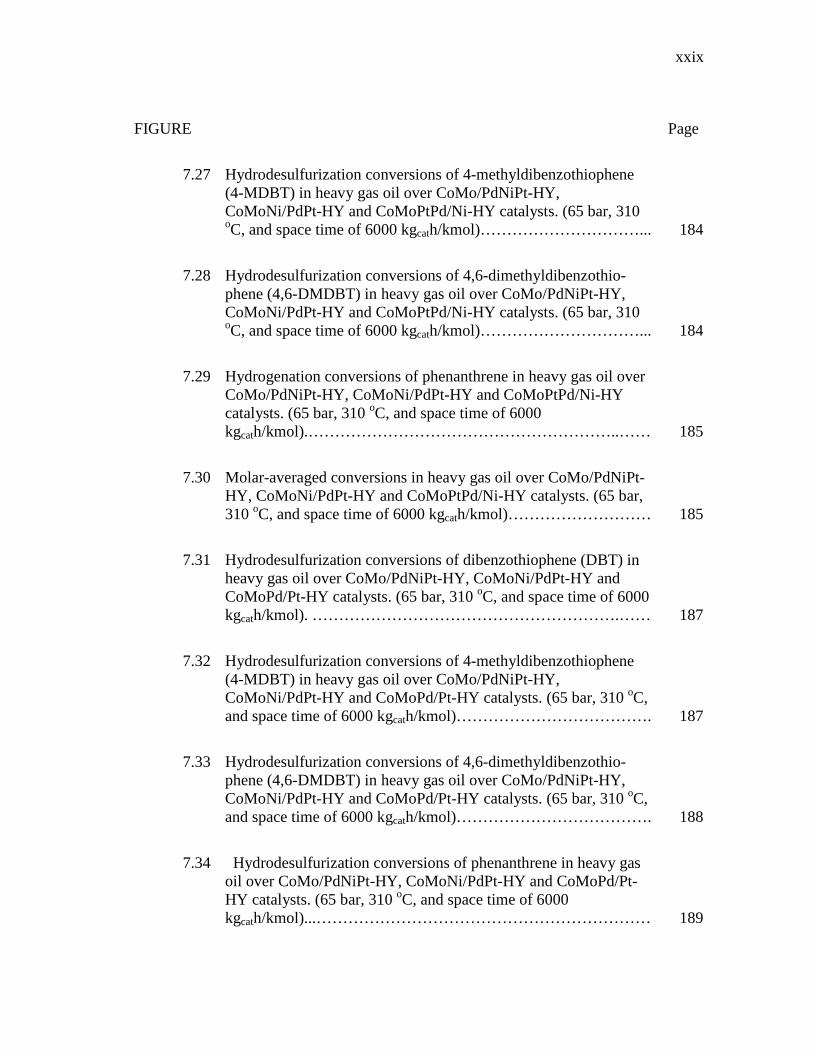
7.27 Hydrodesulfurization conversions of 4-methyldibenzothiophene (4-MDBT) in heavy gas oil over CoMo/PdNiPt-HY, CoMoNi/PdPt-HY and CoMoPtPd/Ni-HY catalysts. (65 bar, 310 oC, and space time of 6000 kgcath/kmol)…………………………...
184
7.28 Hydrodesulfurization conversions of 4,6-dimethyldibenzothio-phene (4,6-DMDBT) in heavy gas oil over CoMo/PdNiPt-HY, CoMoNi/PdPt-HY and CoMoPtPd/Ni-HY catalysts. (65 bar, 310 oC, and space time of 6000 kgcath/kmol)…………………………...
184
7.29 Hydrogenation conversions of phenanthrene in heavy gas oil over CoMo/PdNiPt-HY, CoMoNi/PdPt-HY and CoMoPtPd/Ni-HY catalysts. (65 bar, 310 oC, and space time of 6000 kgcath/kmol).…………………………………………………..……
185
7.30 Molar-averaged conversions in heavy gas oil over CoMo/PdNiPt-HY, CoMoNi/PdPt-HY and CoMoPtPd/Ni-HY catalysts. (65 bar, 310 oC, and space time of 6000 kgcath/kmol)………………………
185
7.31 Hydrodesulfurization conversions of dibenzothiophene (DBT) in heavy gas oil over CoMo/PdNiPt-HY, CoMoNi/PdPt-HY and CoMoPd/Pt-HY catalysts. (65 bar, 310 oC, and space time of 6000 kgcath/kmol). ………………………………………………….……
187
7.32 Hydrodesulfurization conversions of 4-methyldibenzothiophene (4-MDBT) in heavy gas oil over CoMo/PdNiPt-HY, CoMoNi/PdPt-HY and CoMoPd/Pt-HY catalysts. (65 bar, 310 oC, and space time of 6000 kgcath/kmol)……………………………….
187
7.33 Hydrodesulfurization conversions of 4,6-dimethyldibenzothio-phene (4,6-DMDBT) in heavy gas oil over CoMo/PdNiPt-HY, CoMoNi/PdPt-HY and CoMoPd/Pt-HY catalysts. (65 bar, 310 oC, and space time of 6000 kgcath/kmol)……………………………….
188
7.34 Hydrodesulfurization conversions of phenanthrene in heavy gas oil over CoMo/PdNiPt-HY, CoMoNi/PdPt-HY and CoMoPd/Pt-HY catalysts. (65 bar, 310 oC, and space time of 6000 kgcath/kmol)...………………………………………………………
189
xxx
FIGURE
Page
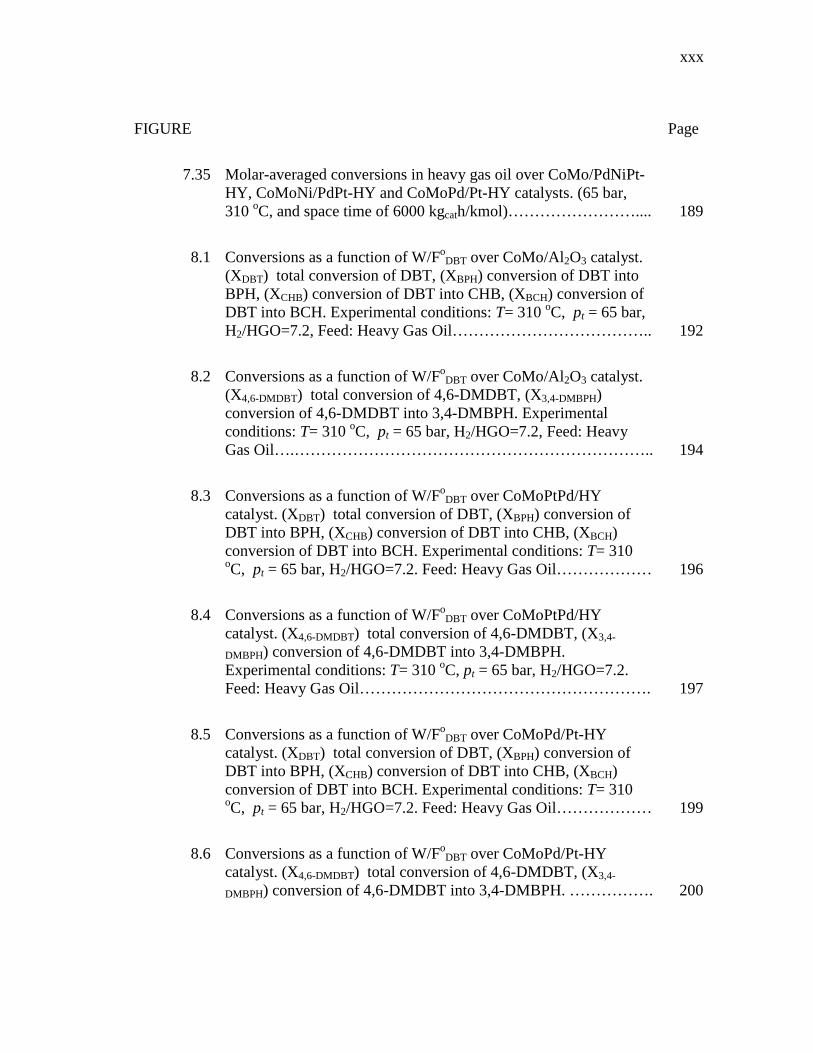
7.35 Molar-averaged conversions in heavy gas oil over CoMo/PdNiPt-HY, CoMoNi/PdPt-HY and CoMoPd/Pt-HY catalysts. (65 bar, 310 oC, and space time of 6000 kgcath/kmol)……………………....
189
8.1 Conversions as a function of W/FoDBT over CoMo/Al2O3 catalyst.
(XDBT) total conversion of DBT, (XBPH) conversion of DBT into BPH, (XCHB) conversion of DBT into CHB, (XBCH) conversion of DBT into BCH. Experimental conditions: T= 310 oC, pt = 65 bar, H2/HGO=7.2, Feed: Heavy Gas Oil………………………………..
192
8.2 Conversions as a function of W/FoDBT over CoMo/Al2O3 catalyst.
(X4,6-DMDBT) total conversion of 4,6-DMDBT, (X3,4-DMBPH) conversion of 4,6-DMDBT into 3,4-DMBPH. Experimental conditions: T= 310 oC, pt = 65 bar, H2/HGO=7.2, Feed: Heavy Gas Oil….…………………………………………………………..
194
8.3 Conversions as a function of W/FoDBT over CoMoPtPd/HY
catalyst. (XDBT) total conversion of DBT, (XBPH) conversion of DBT into BPH, (XCHB) conversion of DBT into CHB, (XBCH) conversion of DBT into BCH. Experimental conditions: T= 310 oC, pt = 65 bar, H2/HGO=7.2. Feed: Heavy Gas Oil………………
196
8.4 Conversions as a function of W/FoDBT over CoMoPtPd/HY
catalyst. (X4,6-DMDBT) total conversion of 4,6-DMDBT, (X3,4-
DMBPH) conversion of 4,6-DMDBT into 3,4-DMBPH. Experimental conditions: T= 310 oC, pt = 65 bar, H2/HGO=7.2. Feed: Heavy Gas Oil……………………………………………….
197
8.5 Conversions as a function of W/FoDBT over CoMoPd/Pt-HY
catalyst. (XDBT) total conversion of DBT, (XBPH) conversion of DBT into BPH, (XCHB) conversion of DBT into CHB, (XBCH) conversion of DBT into BCH. Experimental conditions: T= 310 oC, pt = 65 bar, H2/HGO=7.2. Feed: Heavy Gas Oil………………
199
8.6 Conversions as a function of W/FoDBT over CoMoPd/Pt-HY
catalyst. (X4,6-DMDBT) total conversion of 4,6-DMDBT, (X3,4-
DMBPH) conversion of 4,6-DMDBT into 3,4-DMBPH. …………….
200
xxxi
FIGURE
Page
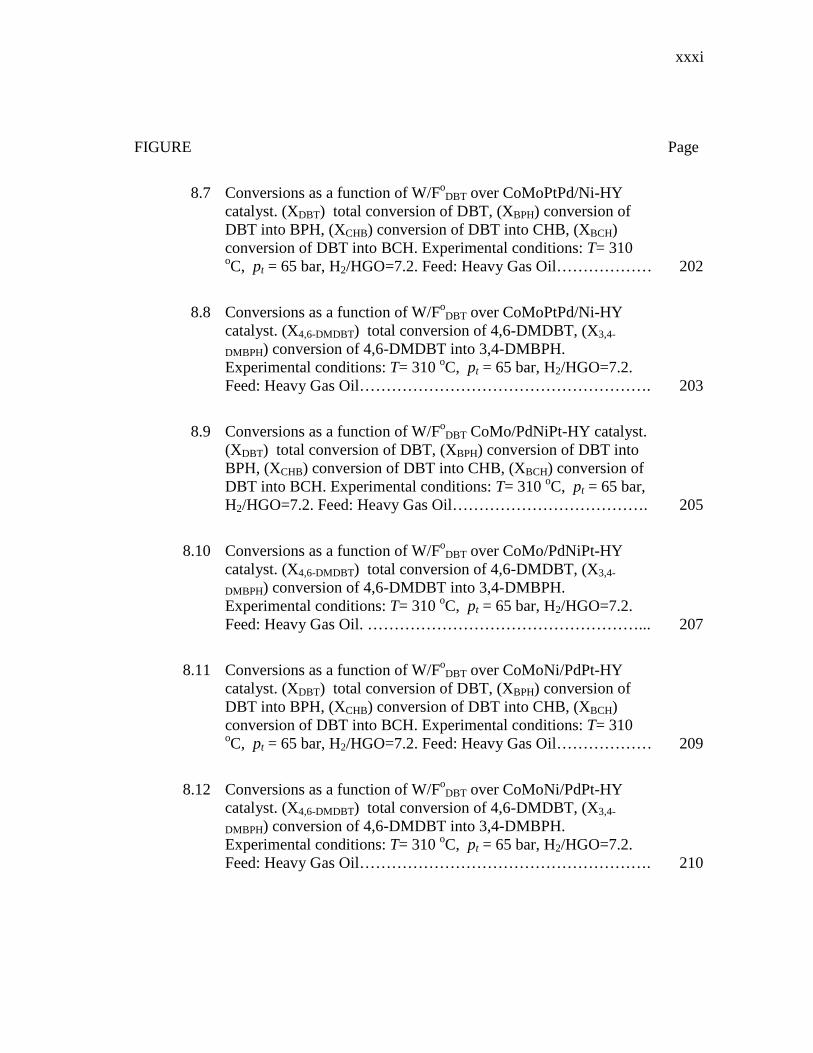
8.7 Conversions as a function of W/FoDBT over CoMoPtPd/Ni-HY
catalyst. (XDBT) total conversion of DBT, (XBPH) conversion of DBT into BPH, (XCHB) conversion of DBT into CHB, (XBCH) conversion of DBT into BCH. Experimental conditions: T= 310 oC, pt = 65 bar, H2/HGO=7.2. Feed: Heavy Gas Oil………………
202
8.8 Conversions as a function of W/FoDBT over CoMoPtPd/Ni-HY
catalyst. (X4,6-DMDBT) total conversion of 4,6-DMDBT, (X3,4-
DMBPH) conversion of 4,6-DMDBT into 3,4-DMBPH. Experimental conditions: T= 310 oC, pt = 65 bar, H2/HGO=7.2. Feed: Heavy Gas Oil……………………………………………….
203
8.9 Conversions as a function of W/FoDBT CoMo/PdNiPt-HY catalyst.
(XDBT) total conversion of DBT, (XBPH) conversion of DBT into BPH, (XCHB) conversion of DBT into CHB, (XBCH) conversion of DBT into BCH. Experimental conditions: T= 310 oC, pt = 65 bar, H2/HGO=7.2. Feed: Heavy Gas Oil……………………………….
205
8.10 Conversions as a function of W/FoDBT over CoMo/PdNiPt-HY
catalyst. (X4,6-DMDBT) total conversion of 4,6-DMDBT, (X3,4-
DMBPH) conversion of 4,6-DMDBT into 3,4-DMBPH. Experimental conditions: T= 310 oC, pt = 65 bar, H2/HGO=7.2. Feed: Heavy Gas Oil. ……………………………………………...
207
8.11 Conversions as a function of W/FoDBT over CoMoNi/PdPt-HY
catalyst. (XDBT) total conversion of DBT, (XBPH) conversion of DBT into BPH, (XCHB) conversion of DBT into CHB, (XBCH) conversion of DBT into BCH. Experimental conditions: T= 310 oC, pt = 65 bar, H2/HGO=7.2. Feed: Heavy Gas Oil………………
209
8.12 Conversions as a function of W/FoDBT over CoMoNi/PdPt-HY
catalyst. (X4,6-DMDBT) total conversion of 4,6-DMDBT, (X3,4-
DMBPH) conversion of 4,6-DMDBT into 3,4-DMBPH. Experimental conditions: T= 310 oC, pt = 65 bar, H2/HGO=7.2. Feed: Heavy Gas Oil……………………………………………….
210
xxxii
LIST OF TABLES TABLE
Page
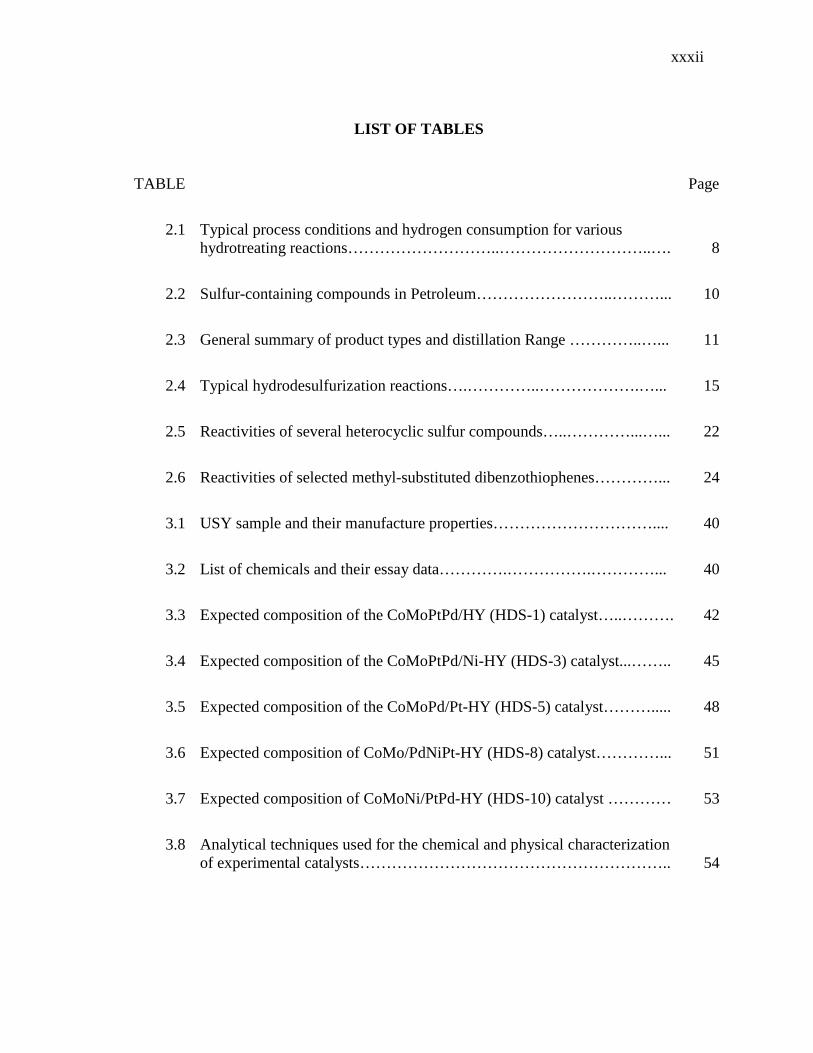
2.1 Typical process conditions and hydrogen consumption for various hydrotreating reactions………………………..………………………..….
8
2.2 Sulfur-containing compounds in Petroleum……………………..………...
10
2.3 General summary of product types and distillation Range …………..…...
11
2.4 Typical hydrodesulfurization reactions….…………..……………….…...
15
2.5 Reactivities of several heterocyclic sulfur compounds…..…………...…...
22
2.6 Reactivities of selected methyl-substituted dibenzothiophenes…………...
24
3.1 USY sample and their manufacture properties…………………………....
40
3.2 List of chemicals and their essay data………….…………….…………...
40
3.3 Expected composition of the CoMoPtPd/HY (HDS-1) catalyst…..……….
42
3.4 Expected composition of the CoMoPtPd/Ni-HY (HDS-3) catalyst...……..
45
3.5 Expected composition of the CoMoPd/Pt-HY (HDS-5) catalyst……….....
48
3.6 Expected composition of CoMo/PdNiPt-HY (HDS-8) catalyst…………...
51
3.7 Expected composition of CoMoNi/PtPd-HY (HDS-10) catalyst …………
53
3.8 Analytical techniques used for the chemical and physical characterization of experimental catalysts…………………………………………………..
54
xxxiii
TABLE
Page
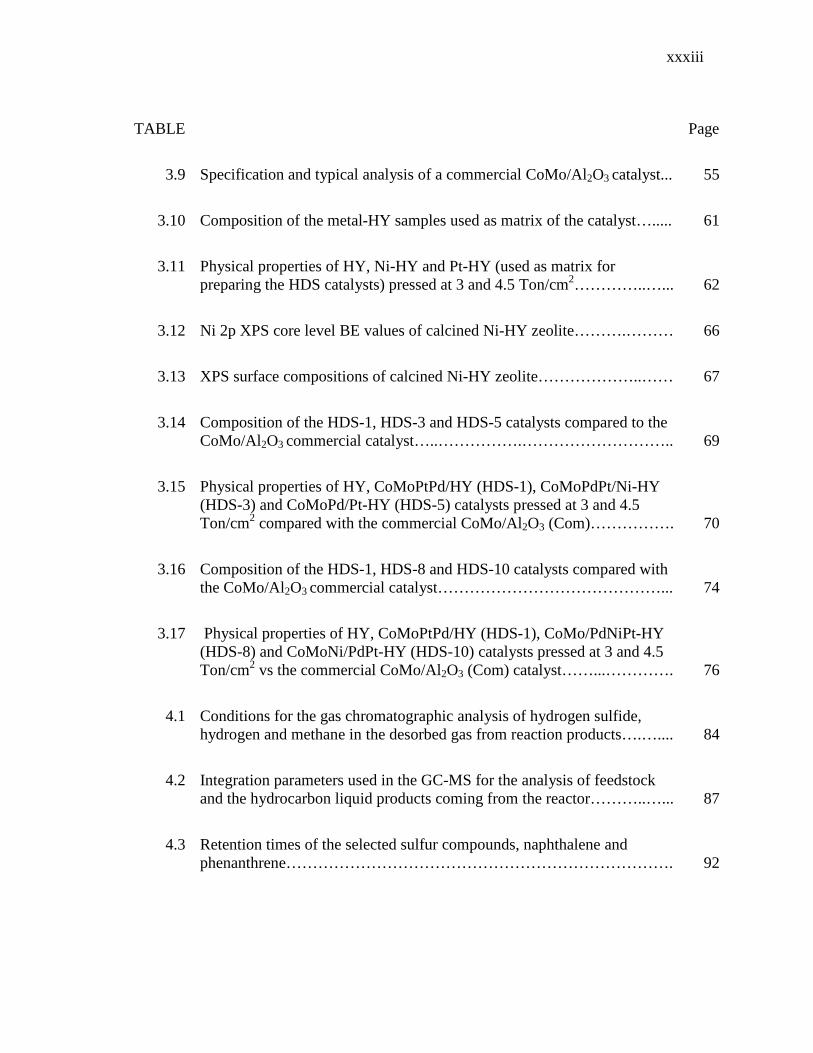
3.9 Specification and typical analysis of a commercial CoMo/Al2O3 catalyst...
55
3.10 Composition of the metal-HY samples used as matrix of the catalyst….....
61
3.11 Physical properties of HY, Ni-HY and Pt-HY (used as matrix for preparing the HDS catalysts) pressed at 3 and 4.5 Ton/cm2…………..…...
62
3.12 Ni 2p XPS core level BE values of calcined Ni-HY zeolite……….………
66
3.13 XPS surface compositions of calcined Ni-HY zeolite………………..……
67
3.14 Composition of the HDS-1, HDS-3 and HDS-5 catalysts compared to the CoMo/Al2O3 commercial catalyst…..…………….………………………..
69
3.15 Physical properties of HY, CoMoPtPd/HY (HDS-1), CoMoPdPt/Ni-HY (HDS-3) and CoMoPd/Pt-HY (HDS-5) catalysts pressed at 3 and 4.5 Ton/cm2 compared with the commercial CoMo/Al2O3 (Com)…………….
70
3.16 Composition of the HDS-1, HDS-8 and HDS-10 catalysts compared with the CoMo/Al2O3 commercial catalyst……………………………………...
74
3.17 Physical properties of HY, CoMoPtPd/HY (HDS-1), CoMo/PdNiPt-HY (HDS-8) and CoMoNi/PdPt-HY (HDS-10) catalysts pressed at 3 and 4.5 Ton/cm2 vs the commercial CoMo/Al2O3 (Com) catalyst……...………….
76
4.1 Conditions for the gas chromatographic analysis of hydrogen sulfide, hydrogen and methane in the desorbed gas from reaction products….…....
84
4.2 Integration parameters used in the GC-MS for the analysis of feedstock and the hydrocarbon liquid products coming from the reactor………..…...
87
4.3 Retention times of the selected sulfur compounds, naphthalene and phenanthrene……………………………………………………………….
92
xxxiv
TABLE
Page
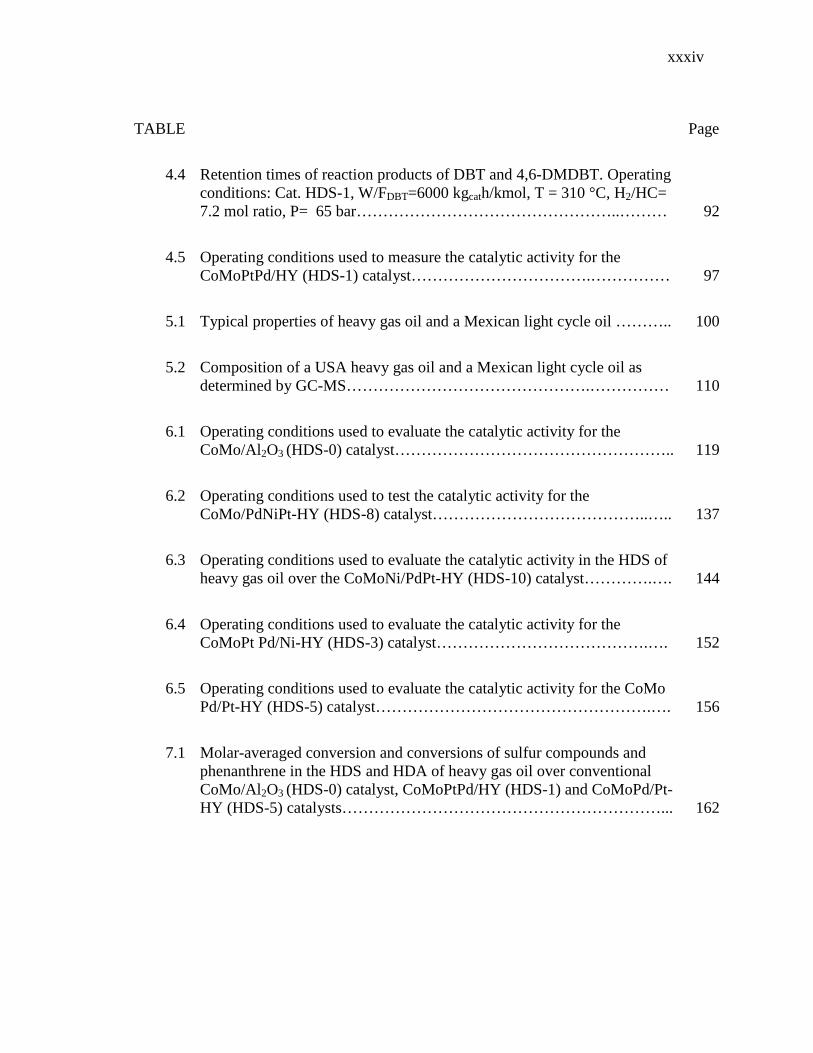
4.4 Retention times of reaction products of DBT and 4,6-DMDBT. Operating conditions: Cat. HDS-1, W/FDBT=6000 kgcath/kmol, T = 310 °C, H2/HC= 7.2 mol ratio, P= 65 bar…………………………………………..………
92
4.5 Operating conditions used to measure the catalytic activity for the CoMoPtPd/HY (HDS-1) catalyst…………………………….……………
97
5.1 Typical properties of heavy gas oil and a Mexican light cycle oil ………..
100
5.2 Composition of a USA heavy gas oil and a Mexican light cycle oil as determined by GC-MS……………………………………….……………
110
6.1 Operating conditions used to evaluate the catalytic activity for the CoMo/Al2O3 (HDS-0) catalyst……………………………………………..
119
6.2 Operating conditions used to test the catalytic activity for the CoMo/PdNiPt-HY (HDS-8) catalyst…………………………………..…..
137
6.3 Operating conditions used to evaluate the catalytic activity in the HDS of heavy gas oil over the CoMoNi/PdPt-HY (HDS-10) catalyst………….….
144
6.4 Operating conditions used to evaluate the catalytic activity for the CoMoPt Pd/Ni-HY (HDS-3) catalyst………………………………….….
152
6.5 Operating conditions used to evaluate the catalytic activity for the CoMo Pd/Pt-HY (HDS-5) catalyst…………………………………………….….
156
7.1 Molar-averaged conversion and conversions of sulfur compounds and phenanthrene in the HDS and HDA of heavy gas oil over conventional CoMo/Al2O3 (HDS-0) catalyst, CoMoPtPd/HY (HDS-1) and CoMoPd/Pt-HY (HDS-5) catalysts……………………………………………………...
162
xxxv
TABLE
Page
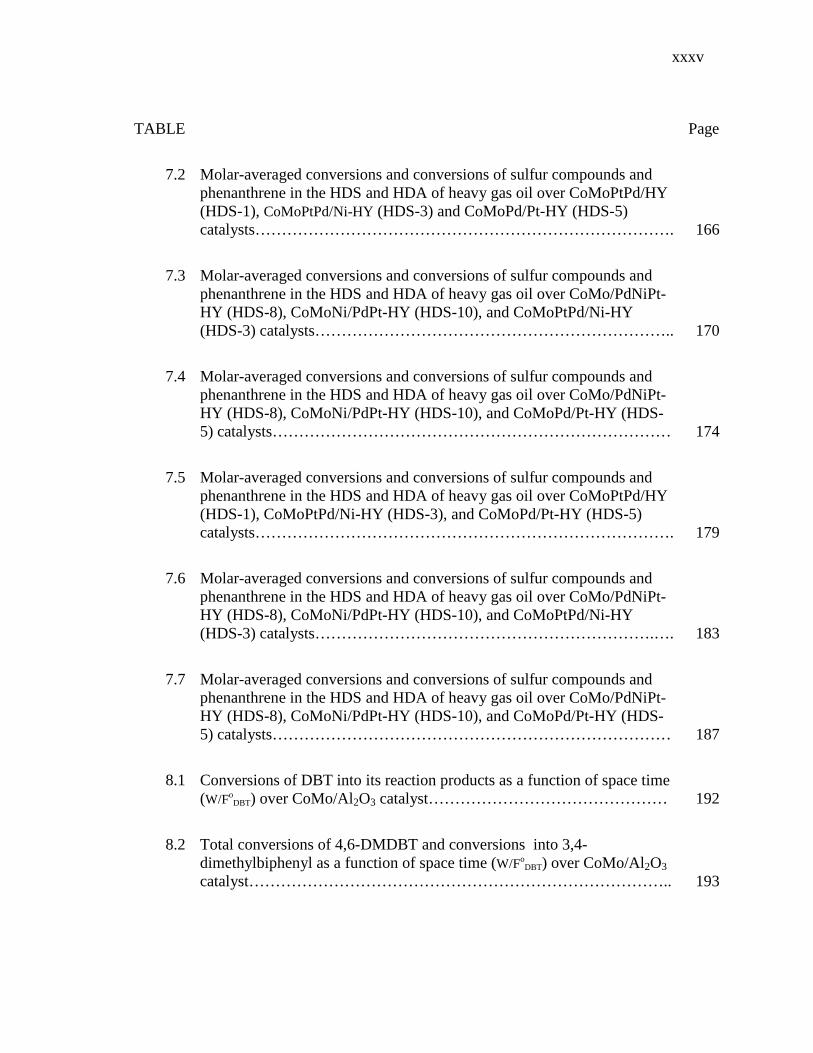
7.2 Molar-averaged conversions and conversions of sulfur compounds and phenanthrene in the HDS and HDA of heavy gas oil over CoMoPtPd/HY (HDS-1), CoMoPtPd/Ni-HY (HDS-3) and CoMoPd/Pt-HY (HDS-5) catalysts…………………………………………………………………….
166
7.3 Molar-averaged conversions and conversions of sulfur compounds and phenanthrene in the HDS and HDA of heavy gas oil over CoMo/PdNiPt-HY (HDS-8), CoMoNi/PdPt-HY (HDS-10), and CoMoPtPd/Ni-HY (HDS-3) catalysts…………………………………………………………..
170
7.4 Molar-averaged conversions and conversions of sulfur compounds and phenanthrene in the HDS and HDA of heavy gas oil over CoMo/PdNiPt-HY (HDS-8), CoMoNi/PdPt-HY (HDS-10), and CoMoPd/Pt-HY (HDS-5) catalysts…………………………………………………………………
174
7.5 Molar-averaged conversions and conversions of sulfur compounds and phenanthrene in the HDS and HDA of heavy gas oil over CoMoPtPd/HY (HDS-1), CoMoPtPd/Ni-HY (HDS-3), and CoMoPd/Pt-HY (HDS-5) catalysts…………………………………………………………………….
179
7.6 Molar-averaged conversions and conversions of sulfur compounds and phenanthrene in the HDS and HDA of heavy gas oil over CoMo/PdNiPt-HY (HDS-8), CoMoNi/PdPt-HY (HDS-10), and CoMoPtPd/Ni-HY (HDS-3) catalysts……………………………………………………….….
183
7.7 Molar-averaged conversions and conversions of sulfur compounds and phenanthrene in the HDS and HDA of heavy gas oil over CoMo/PdNiPt-HY (HDS-8), CoMoNi/PdPt-HY (HDS-10), and CoMoPd/Pt-HY (HDS-5) catalysts…………………………………………………………………
187
8.1 Conversions of DBT into its reaction products as a function of space time (W/Fo
DBT) over CoMo/Al2O3 catalyst………………………………………
192
8.2 Total conversions of 4,6-DMDBT and conversions into 3,4- dimethylbiphenyl as a function of space time (W/Fo
DBT) over CoMo/Al2O3 catalyst……………………………………………………………………..
193
xxxvi
TABLE
Page
8.3 Conversions of DBT into their reaction products as a function of space time (W/Fo
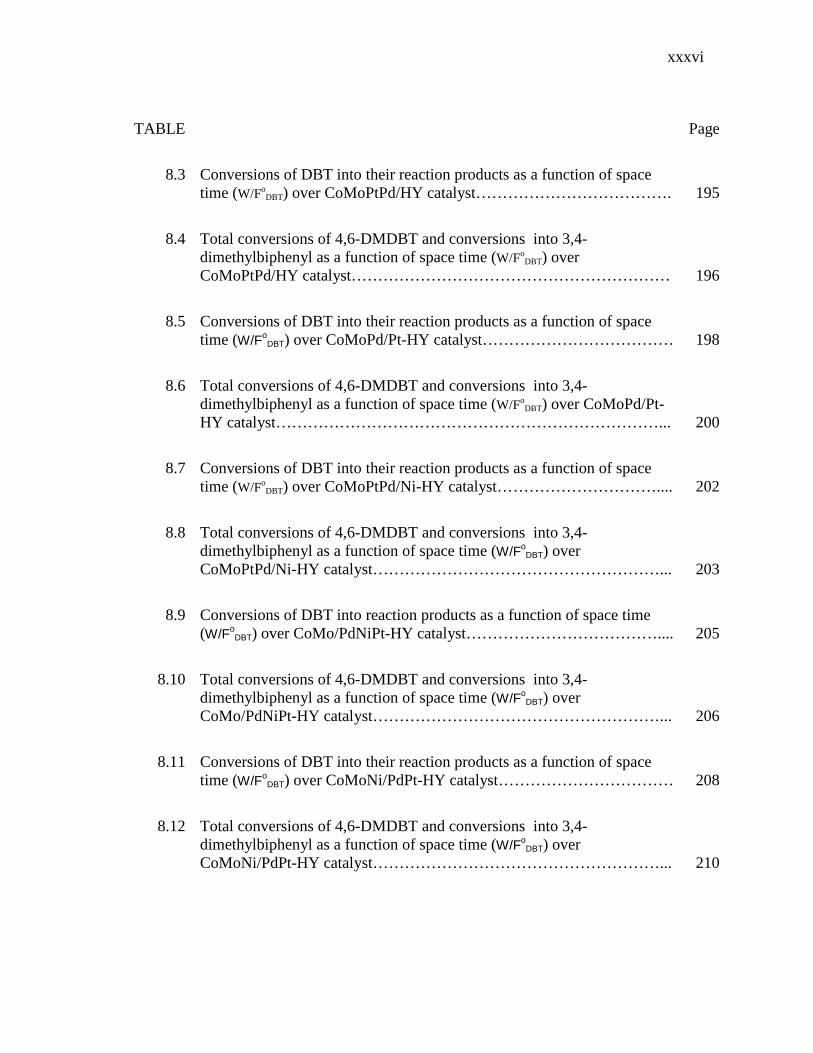
DBT) over CoMoPtPd/HY catalyst……………………………….
195
8.4 Total conversions of 4,6-DMDBT and conversions into 3,4-dimethylbiphenyl as a function of space time (W/Fo
DBT) over CoMoPtPd/HY catalyst……………………………………………………
196
8.5 Conversions of DBT into their reaction products as a function of space time (W/Fo
DBT) over CoMoPd/Pt-HY catalyst………………………………
198
8.6 Total conversions of 4,6-DMDBT and conversions into 3,4- dimethylbiphenyl as a function of space time (W/Fo
DBT) over CoMoPd/Pt-HY catalyst………………………………………………………………...
200
8.7 Conversions of DBT into their reaction products as a function of space time (W/Fo
DBT) over CoMoPtPd/Ni-HY catalyst…………………………....
202
8.8 Total conversions of 4,6-DMDBT and conversions into 3,4- dimethylbiphenyl as a function of space time (W/Fo
DBT) over CoMoPtPd/Ni-HY catalyst………………………………………………...
203
8.9 Conversions of DBT into reaction products as a function of space time (W/Fo
DBT) over CoMo/PdNiPt-HY catalyst………………………………....
205
8.10 Total conversions of 4,6-DMDBT and conversions into 3,4- dimethylbiphenyl as a function of space time (W/Fo
DBT) over CoMo/PdNiPt-HY catalyst………………………………………………...
206
8.11 Conversions of DBT into their reaction products as a function of space time (W/Fo
DBT) over CoMoNi/PdPt-HY catalyst……………………………
208
8.12 Total conversions of 4,6-DMDBT and conversions into 3,4- dimethylbiphenyl as a function of space time (W/Fo
DBT) over CoMoNi/PdPt-HY catalyst………………………………………………...
210
1
CHAPTER I
INTRODUCTION
Hydrodesulfurization (HDS) of petroleum fractions is one of the most important
processes in the petroleum industry to produce clean fuels. In particular, sulfur removal
in diesel fuels is now strongly desirable for environmental and technical reasons. For
instance, HDS is used to prevent atmospheric pollution by sulfur oxides produced during
the combustion of petroleum-based fuels, to prevent poisoning of sulfur-sensitive metal
catalysts used in subsequent reforming reactions and in the catalytic converter for
exhaust emission treatment, finally, to avoid corrosion problems in engines.
The European Union has limited the sulfur content in diesel to 0.005 wt% since 2005
(Song, 2000). In the United States the sulfur content in diesel is limited to 0.050 wt%
since 1993. For June 2006 the maximum sulfur content will be 0.0015 wt%. While the
Japanese official legislation has proposed <10-ppm sulfur content in diesel for 2007,
most Japanese refiners voluntarily began <10-ppm sulfur diesel before January 2005 and
many other countries are planning to begin implementing ultra-low sulfur diesel fuel
(ULSD) with a content of <10-ppm to supply in the near future. In view of the demands
for USLD fuels, the development of technology for ultra-deep hydrodesulfurization to
remove most of the sulfur compounds in the diesel fractions will become extremely
important.
Removal of sulfur content is possible by using modified operating conditions for
hydrotreaters with respect to the reaction temperature and space time. However, higher
reaction temperature results in coke formation on the catalyst and rapid catalytic
deactivation, and higher space time results in reduced hydrotreating efficiency, thus,
requiring additional reactors or larger reactor replacement. Consequently, the best way
This dissertation follows the format of Industrial And Engineering Chemistry Research.
2
of achieving the ultra-deep HDS without changing the operating conditions and in a
cost-effective manner is to develop a catalyst having a super high HDS and a high
hydrodearomatization (HDA) activity.
A catalyst with these properties could be formulated using new active phases such as
noble metals (Pt, Pd, Rh, Ru) in combination with basic metals such as CoMo or NiMo
supported in zeolites. However, although noble metals show activity for hydrogenation
at low temperatures, their use as catalysts will become attractive only if their sulfur
resistance can be greatly enhanced.
1.1 Motivation and Significance of Research
This work is motivated by the necessity of getting novel sulfur-resistant noble metal
catalysts for more efficient hydrotreating of sulfur-containing middle distillates. Middle
distillates are petroleum products boiling between the kerosene (C8-C18, 126-258 oC) and
the lubricating oil fraction (>C20, >343 oC).
Properties of middle distillates depend on the nature of the original crude oil and the
refining processes by which the fuel is produced. In the case of Diesel fuel, “PEMEX-
Refinación” in Mexico has considered the refinery reconfiguration integrating streams
from other processes to increase diesel fuel production with low sulfur content. These
streams could come from visbreaking, coker, FCC, etc, and they have a higher amount
of sulfur and unsaturated compounds than straight run gas oil because they could come
from crude with high Maya/Istmo volume ratio (>60).
The sulfur-containing compounds in Middle Distillates such as Diesel, Light Cycle
Oil (LCO), and Heavy Gas oil (HGO), etc, are complex molecules of alkyl-aromatics
and substituted alkyl aromatics which are called refractory compounds because of the
difficulty to remove the S heteroatom.
The conventional catalysts for hydrotreating of middle distillates are basically
formulated with CoMo/Al2O3 and NiMo/Al2O3. However, although they have high
3
activity for HDS, they are insufficient to guarantee a diesel production with low sulfur
content (deep HDS, <50 ppm). In order to address this demand of deep HDS a catalyst
with high activity towards the hydrogenolysis (rupture of the C-S bond) and
hydrogenation of aromatics is required. The combination of active elements such as
CoMo is excellent for HDS but is somewhat less active for hydrogenation of aromatics.
Metals like Pt, Pd or Ni, on the other hand, are very good for hydrogenation, but their
use in HDS catalysts will become attractive only if their sulfur resistance is enhanced.
Related with this, it has been reported that the HDA activity of Pt-Pd catalysts greatly
depends on the kind of supports (Yasuda et al., 1999, Shimada and Yoshimura, 2003,
Song and Schmitz, 1997). On the other hand, it has been accepted that metal-zeolite
catalysts have high possibility as new hydrodesulfurization catalysts for petroleum
fractions (Laniecki and Zmierczak, 1991; Okamoto, 1997; Sugioka, 1996). In this
context, noble-metal catalysts on acidic supports, such as HY zeolite, have been reported
as high sulfur-tolerant aromatic hydrogenation catalysts.
1.2 Scope of Research
In this work, a study of Middle Distillate Hydrotreatment Zeolite Catalysts
containing Pt/Pd or Ni is proposed. The study is mainly aimed at examining the potential
of zeolite-supported Pd, Pt, Ni, Co and Mo catalysts for removing refractory sulfur
compounds such as 4,6-dimethyldibenzothiophene (4,6-DMDBT) and 4-
methyldibenzothiophene (4-MDBT) of middle distillates. The specific purposes of this
research are as follow:
(i) Synthesis and characterization of Pt-HY and Ni-HY as matrix of the deep
hydrodesulfurization catalysts.
(ii) Synthesis and characterization of zeolite catalysts containing metal combinations
of basic metals, such as Co, Mo, Ni, and noble metals, such as Pt, Pd, supported on HY,
Ni-HY and Pt-HY
4
(iii) Determine the activity of the prepared catalysts for the deep HDS of heavy gas
oil, under the effect of the operating conditions: temperature, space time,
hydrogen/hydrocarbon mol ratio and pressure.
(iv) Determine the conversions of DBT, 4-MDBT and 4,6-DMDBT in the HDS of
heavy gas oil over CoMoPtPd/HY, CoMoPtPd/Ni-HY, CoMoPd/Pt-HY, CoMo/PdNiPt-
HY and CoMoNi/PdPt-HY catalysts.
(v) Generate the technical bases for the future development of a catalyst and process
for deep hydrodesulfurization of heavy gas oil with sulfur levels according to European
International regulation of < 50 ppm (2005-2006) and/or <15 ppm for 2010 year.
Some aspects considered in the development of this project were: zeolites have
acidity and shape-selectivity properties for their use as catalysts in hydrocarbon
hydrotreating reactions. In particular, ultra stable Y zeolite (USY) has homogeneous
large pores and supercages window diameters interconnected in three dimensions and
they are stable in thermal as well as hydrothermal operation.
The hydrodesulfurization of refractory 4-methyl- and 4,6-
dimethyldibenzothiophene is essential to achieve the sulfur level of gas oil requested by
current regulation. Their direct hydrodesulfurization through the interaction of their
sulfur atom with the catalysts surface is sterically hindered by neighboring methyl
groups. The steric hindrance can be reduced by destruction of the planar configuration
through hydrogenation. According to Isoda et al. (1996) the hydrogenation of one of two
phenyl rings breaks the coplanarity of the dibenzothiophene skeleton, moderating the
steric hindrance of the methyl groups. Furthermore, the hydrogenation of the
neighboring phenyl ring increases the electron density of the sulfur atom to enhance its
elimination through electron donation to the active site.
4,6-DMDBT must compete for the hydrogenation active sites with other aromatic
hydrocarbons in gas oil, such as naphthalene and tetralin, which compete for hydrogen
and they competitively adsorb on the hydrogenation sites, thus slowing down the desired
hydrogenation. There are two possible approaches for efficient desulfurization of 4,6-
DMDBT: the selective hydrogenation of 4,6-DMDBT in the dominant aromatic
5
compounds and the hydrodesulfurization (HDS) reaction after the migration of
substituted methyl groups. Basic and noble metals such as Ni and Pt favor the aromatic
hydrogenation, and zeolites are good promoters for isomerization. So a combination of
noble metals and zeolite could improve the HDS of 4,6-DMDBT. Moreover, the
catalysts based on Pt-Pd alloys supported on zeolites enhance the sulfur resistance of the
supported Pt catalysts. The formation of Pt-Pd alloys depends on the method of catalyst
preparation, precursors and pretreatment conditions of the catalysts. Fast Fourier
transform infrared (FFT-IR) spectroscopy, characterizing CO adsorbed on a Pt-Pd/Al2O3
catalyst sample has been used by Jan et al. (1996) to examine the formation of bimetallic
interactions. The results indicated that Pd–Pt catalysts made from Pd(II) and Pt(II)
acetate without calcination pretreatment presented more Pd-Pt bimetallic interaction than
catalysts made from Palladium (II) acetate with calcinations at 450 oC in air and from
palladium amine. The bimetallic interactions were formed from the catalytic reduction of
Pt as inferred from the FFT-IR monitoring of the decomposition of carboxylate ligands
of [Pd(OAc)2]. The decrease of electron density on Pt induced by such bimetallic
interactions enhances the sulfur resistance of the catalysts, leading to relatively high
activities for aromatics hydrogenation.
For this reason it is considered of great interest to study catalysts based on PtPd
and/or Ni containing USY zeolites and its application in CoMo and/or NiMo
formulations for deep HDS of middle distillates, suggesting that the rate of the
hydrogenation route could be increased by Pt or Ni containing zeolite. Thus, these
catalysts could be good candidates for the application of deep hydrodesulfurization with
good aromatics hydrogenation.
6
CHAPTER II
LITERATURE REVIEW
2.1 Hydrotreating Processes
The hydrotreating processes (HDT) of oil-derived middle distillates have deserved
much attention during recent years because of more stringent environmental regulations
that restrict heteroatoms (S, N, O, etc.) and aromatic compounds content. Hydrotreating
or hydroprocessing refers to a variety of catalytic hydrogenation processes that covers
desulfurization (HDS), denitrogenation (HDN), aromatics saturation (HDA),
hydrodeoxigenation (HDO), hydrocracking (HDC), and metals removal (HDM) of
different petroleum streams in a refinery. These processes represent some of the most
important catalytic processes and the annual sales of hydrotreating catalysts represent
close to 10% of the total world market for catalysts (Anderson and Boudart, 1996).
Hydrotreating also plays an essential role in pretreating streams for other refinery
processes such as catalytic reforming, fluid catalytic cracking (FCC) and is used
extensively for conversion of heavy feedstock and for improving the quality of final
products.
2.1.1 Process Chemistry
Hydrotreating imply small changes in overall molecular structure, but hydrocracking
reactions often occur simultaneously. The hydrotreating process is conducted in the
presence of excess hydrogen over a catalyst at elevated temperature and pressure. The
consumption of hydrogen is especially high when treating heavier feeds. The
hydrotreating consists mainly of HDS and hydrogenation. All reactions are exothermic,
so the control of temperature in the reactor, especially the catalyst bed, is very important
in the practical operation (Kabe et al., 1999). Although equilibrium constants decrease at
higher temperatures, the heteroatom removal reactions are favored under practical
7
operating conditions: temperature of 320-440 oC and pressure of 10-150 atm.
Hydrogenation of aromatics, however, is limited by thermodynamics at high temperature
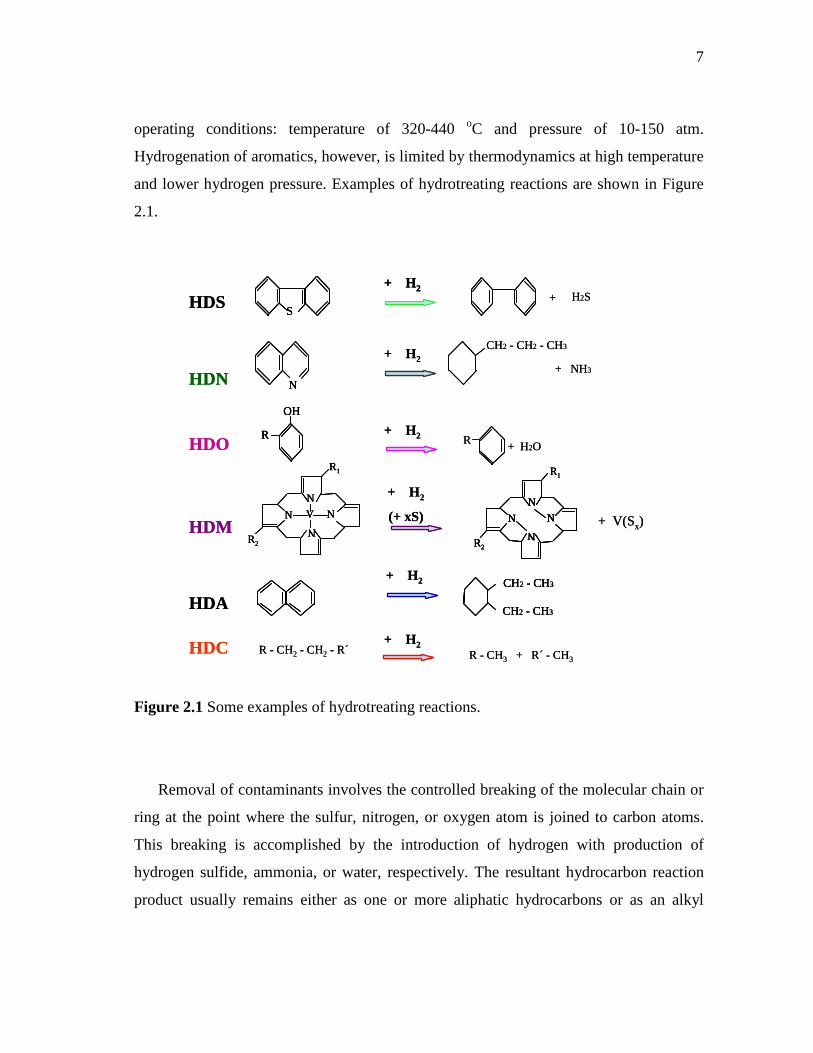
and lower hydrogen pressure. Examples of hydrotreating reactions are shown in Figure
2.1.
Figure 2.1 Some examples of hydrotreating reactions.
Removal of contaminants involves the controlled breaking of the molecular chain or
ring at the point where the sulfur, nitrogen, or oxygen atom is joined to carbon atoms.
This breaking is accomplished by the introduction of hydrogen with production of
hydrogen sulfide, ammonia, or water, respectively. The resultant hydrocarbon reaction
product usually remains either as one or more aliphatic hydrocarbons or as an alkyl
S
N
OH
R+ H2OR
R - CH2 - CH2 - R´ R - CH3 + R´ - CH3
CH2 - CH2 - CH3
+ NH3
HDS
HDN
HDO
HDC
H2S++ H2
+ H2
+ H2
CH2 - CH3
CH2 - CH3HDA
+ H2
+ H2
N
NNN V
R1
R2
HDM
NN
NN
R2
R1
+ H2
(+ xS) + V(Sx)
SS
NN
OH
R
OH
R+ H2OR
R - CH2 - CH2 - R´ R - CH3 + R´ - CH3
CH2 - CH2 - CH3
+ NH3
HDS
HDN
HDO
HDC
H2S++ H2+ H2
+ H2
+ H2
CH2 - CH3
CH2 - CH3
CH2 - CH3
CH2 - CH3HDA
+ H2
+ H2
N
NNN V
R1
R2
N
NNN V
R1
R2
HDM
NN
NN
R2
R1
NN
NN
R2
NN
NN
R2
R1
+ H2
(+ xS) + V(Sx)
8
group on an aromatic or naphthenic hydrocarbon. These hydrocarbon reaction products
usually have larger liquid molecular volumes than do the parent sulfur-, nitrogen-, or
oxygen-containing reactants. Owing to the fact that only a small amount of cracking of
carbon-to-carbon bonds occurs and that olefins and some aromatics are hydrogenated,
yields of liquids from most hydrotreating operations are in excess of 100 volume percent
of the charge stock. (Meyers, 1986)
The degree of hydrotreating required on petroleum fractions generally will depend
entirely on the feed and the refiner’s need to meet the specific requirements related to
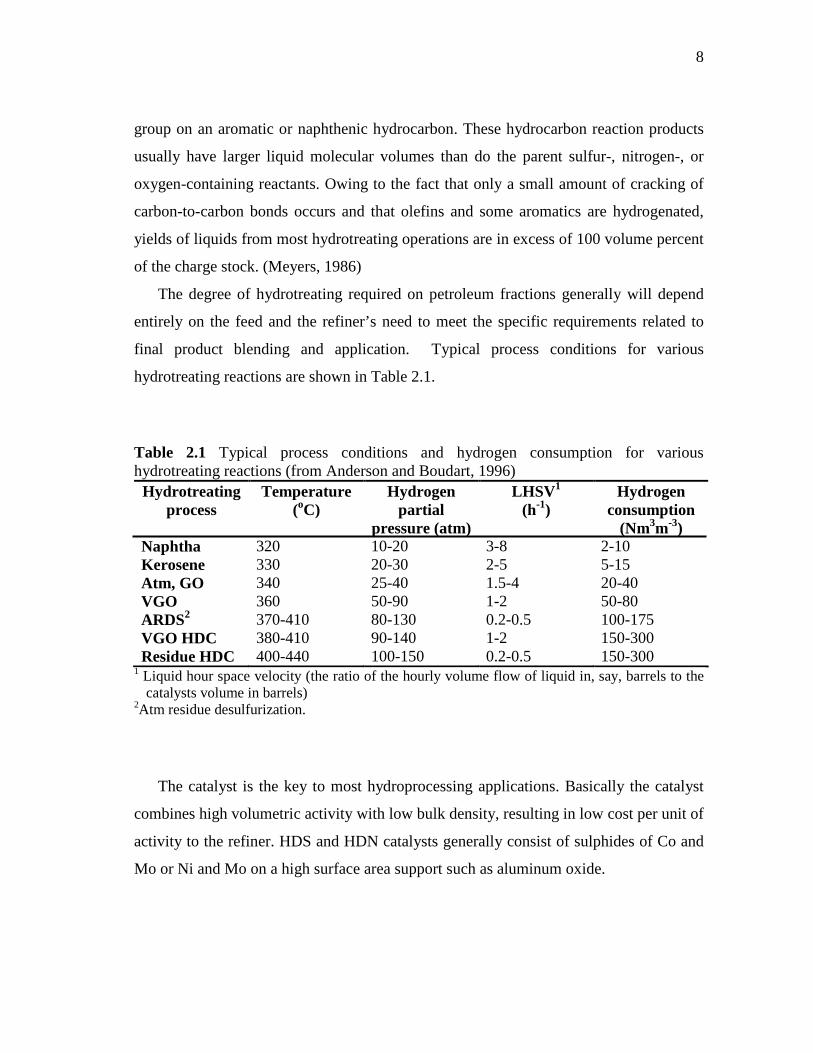
final product blending and application. Typical process conditions for various
hydrotreating reactions are shown in Table 2.1.
Table 2.1 Typical process conditions and hydrogen consumption for various hydrotreating reactions (from Anderson and Boudart, 1996) Hydrotreating
process Temperature
(oC) Hydrogen
partial pressure (atm)
LHSV1 (h-1)
Hydrogen consumption
(Nm3m-3) Naphtha 320 10-20 3-8 2-10 Kerosene 330 20-30 2-5 5-15 Atm, GO 340 25-40 1.5-4 20-40 VGO 360 50-90 1-2 50-80 ARDS2 370-410 80-130 0.2-0.5 100-175 VGO HDC 380-410 90-140 1-2 150-300 Residue HDC 400-440 100-150 0.2-0.5 150-300
1 Liquid hour space velocity (the ratio of the hourly volume flow of liquid in, say, barrels to the catalysts volume in barrels)
2Atm residue desulfurization.
The catalyst is the key to most hydroprocessing applications. Basically the catalyst
combines high volumetric activity with low bulk density, resulting in low cost per unit of
activity to the refiner. HDS and HDN catalysts generally consist of sulphides of Co and
Mo or Ni and Mo on a high surface area support such as aluminum oxide.
9
2.1.2 Sulfur Compounds in Raw Oil Materials
Sulfur compounds are among the most important heteroatomic constituents of
petroleum. They are generally classified into one of two types: heterocycles or
nonheterocycles (Kabe, 1999). The latter comprises thiols, sulfides and disulfides.
Heterocycles are mainly composed of thiophenes with one to several rings and their
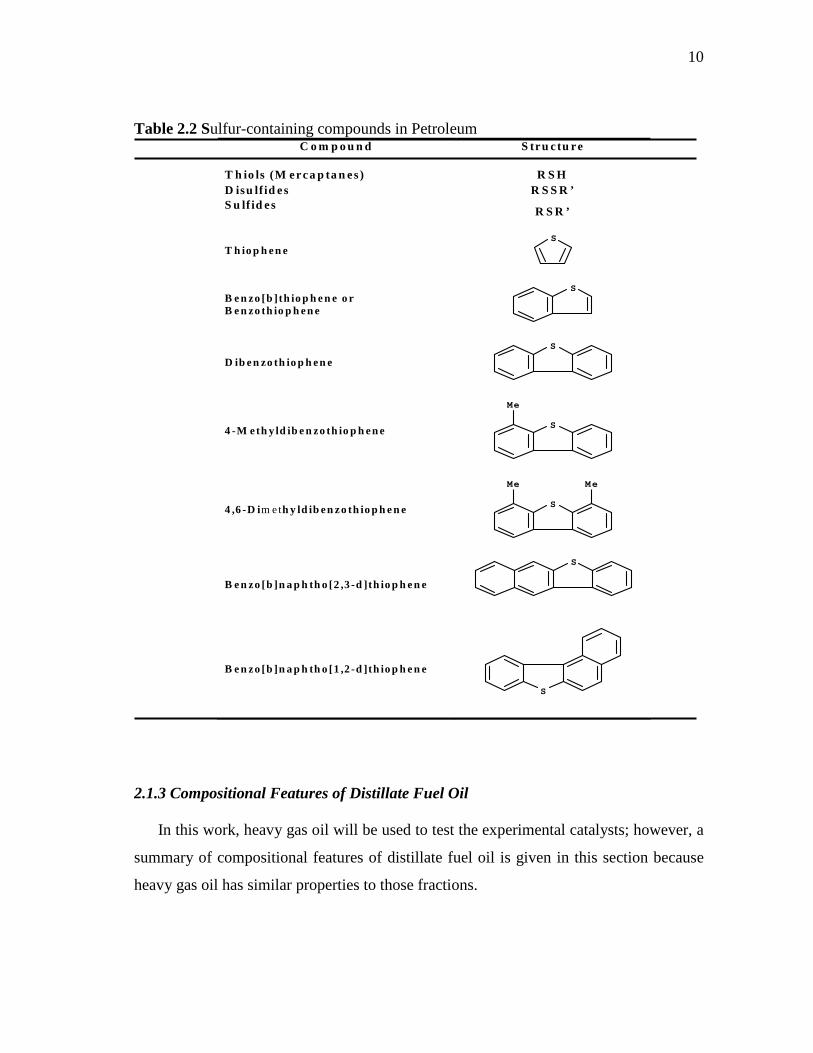
alkyl or aryl substituents. Examples of sulfur compounds are shown in Table 2.2.
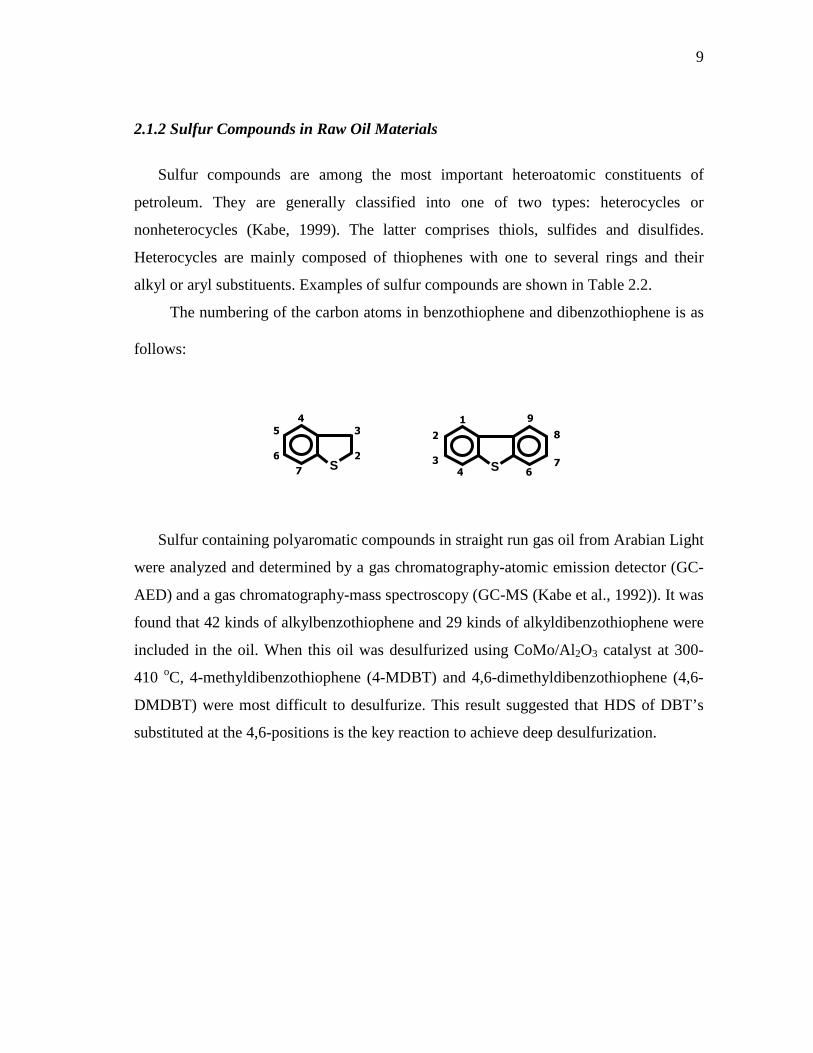
The numbering of the carbon atoms in benzothiophene and dibenzothiophene is as
follows:
Sulfur containing polyaromatic compounds in straight run gas oil from Arabian Light
were analyzed and determined by a gas chromatography-atomic emission detector (GC-
AED) and a gas chromatography-mass spectroscopy (GC-MS (Kabe et al., 1992)). It was
found that 42 kinds of alkylbenzothiophene and 29 kinds of alkyldibenzothiophene were
included in the oil. When this oil was desulfurized using CoMo/Al2O3 catalyst at 300-
410 oC, 4-methyldibenzothiophene (4-MDBT) and 4,6-dimethyldibenzothiophene (4,6-
DMDBT) were most difficult to desulfurize. This result suggested that HDS of DBT’s
substituted at the 4,6-positions is the key reaction to achieve deep desulfurization.
S 6 4
1 9
8
7 3
2
S 2
3
7
4
6
5
10
Table 2.2 Sulfur-containing compounds in Petroleum C o m p o u n d
S tru c tu re
T h io ls (M erca p ta n es) R S H D isu lf id es R S S R ’ S u lf id es
R S R ’
T h io p h en e S
B e n zo [b ] th io p h e n e o r B e n zo th io p h en e
S
D ib en zo th io p h en e
S
4 -M eth y ld ib e n zo th io p h en e
Me
S
4 ,6 -D im eth y ld ib en zo th io p h e n e
Me Me
S
B e n zo [b ]n a p h th o [2 ,3 -d ]th io p h e n e
S
B e n zo [b ]n a p h th o [1 ,2 -d ]th io p h e n e
S
2.1.3 Compositional Features of Distillate Fuel Oil
In this work, heavy gas oil will be used to test the experimental catalysts; however, a
summary of compositional features of distillate fuel oil is given in this section because
heavy gas oil has similar properties to those fractions.
11
The term “fuel oil” is sometimes used to refer to the light, amber-colored middle
distillates or gas oils that are distinguished from the residual fuel oil by being
characterized as distillated fuel oil (ASTM-D-396). In this specification the No. 1 grade
fuel oil is a kerosene type used in vaporizing pot-type burners whereas the No. 2 fuel oil
is a distillate oil (gas oil) used for general-purpose domestic heating. Kerosene may also
be included in this definition.
Distillate fuel oils are vaporized and condensed during a distillation process and thus
have a definite boiling range and do not contain high-boiling oils or asphaltic
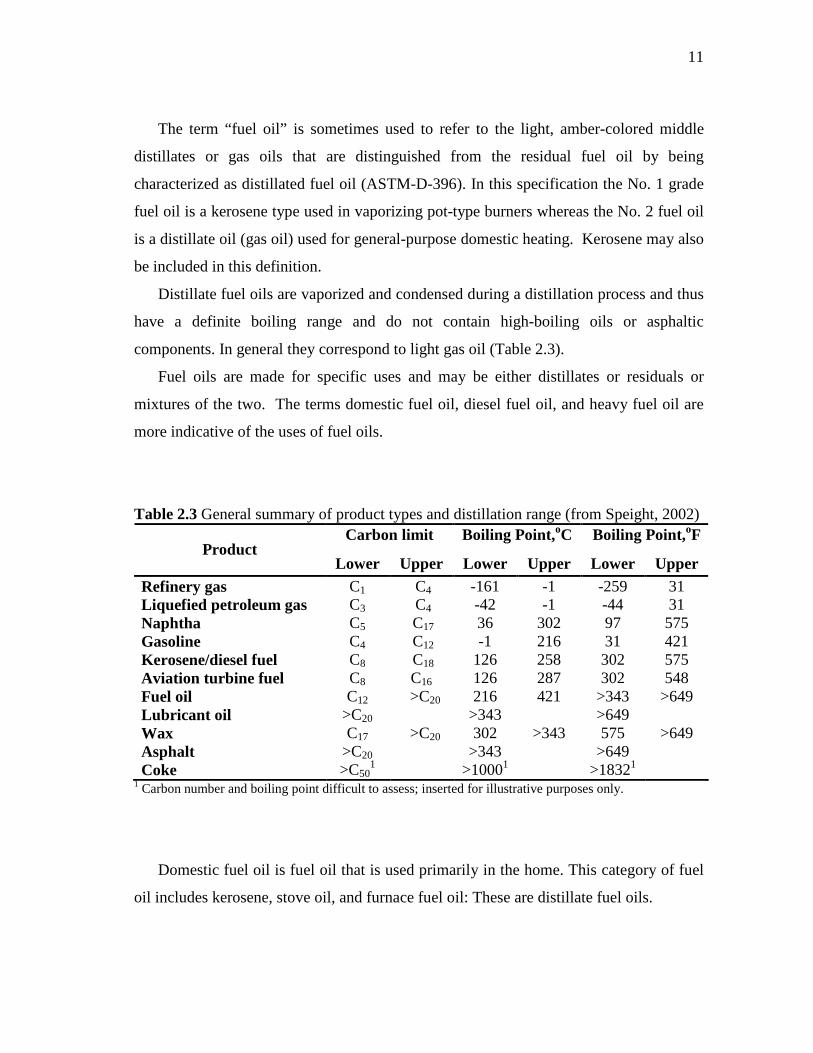
components. In general they correspond to light gas oil (Table 2.3).
Fuel oils are made for specific uses and may be either distillates or residuals or
mixtures of the two. The terms domestic fuel oil, diesel fuel oil, and heavy fuel oil are
more indicative of the uses of fuel oils.
Table 2.3 General summary of product types and distillation range (from Speight, 2002) Carbon limit Boiling Point, oC Boiling Point,oF
Product Lower Upper Lower Upper Lower Upper
Refinery gas C1 C4 -161 -1 -259 31 Liquefied petroleum gas C3 C4 -42 -1 -44 31 Naphtha C5 C17 36 302 97 575 Gasoline C4 C12 -1 216 31 421 Kerosene/diesel fuel C8 C18 126 258 302 575 Aviation turbine fuel C8 C16 126 287 302 548 Fuel oil C12 >C20 216 421 >343 >649 Lubricant oil >C20 >343 >649 Wax C17 >C20 302 >343 575 >649 Asphalt >C20 >343 >649 Coke >C50
1 >10001 >18321 1 Carbon number and boiling point difficult to assess; inserted for illustrative purposes only.
Domestic fuel oil is fuel oil that is used primarily in the home. This category of fuel
oil includes kerosene, stove oil, and furnace fuel oil: These are distillate fuel oils.
12
Diesel fuel oil is also a distillate fuel oil, but residual oil has been successfully used
to power marine diesel engines, and mixtures of distillate fuel oil and residual fuel oil
have been used in locomotive diesel engines.
Heavy fuel oils include a variety of oils ranging from distillates to residual oils that
must be heated to 260 oC (500 oF) or more before they can be used. In general heavy fuel
oils consist of residual oils blended with distillates to suit specific needs. Included
among heavy fuel oils are called bunker oils.
Because the boiling ranges, sulfur contents, and other properties of even the same
fraction vary from crude oil to crude oil and with the way the crude oil is processed, it is
difficult to specify which fractions are blended to produce specific fuel oils. In general,
however, furnace fuel oil is a blend of straight-run gas oil and cracked gas oil to produce
a product boiling in the 175-345 oC (350-650oF) range.
Heavy fuel oils usually contain cracked residua, reduced crude, or cracking coil
heavy product that is mixed to a specified viscosity with cracked gas oils and
fractionator bottoms. For some industrial purposes in which flames or flue gases contact
the product (ceramics, glass, heat treating, and open-hearth furnaces) fuel oils must be
blended to contain minimum sulfur content, and hence low-sulfur residues are preferable
for these fuels.
Straight run-gas oil fraction is usually blended with the appropriate boiling-range
material from catalytic cracking processing. The components are suitably treated before
final blending, and additives may be added to further assist in the stabilization of the
finished product.
2.2 Hydrodesulfurization Process
Hydrotreating for sulfur removal is called hydrodesulfurization.
Hydrodesulfurization is a catalytic process whereby an oil fraction is flowing with
hydrogen over or through a catalyst bed at elevated temperatures (315°-425°C) and
pressures (up to 68 bar).
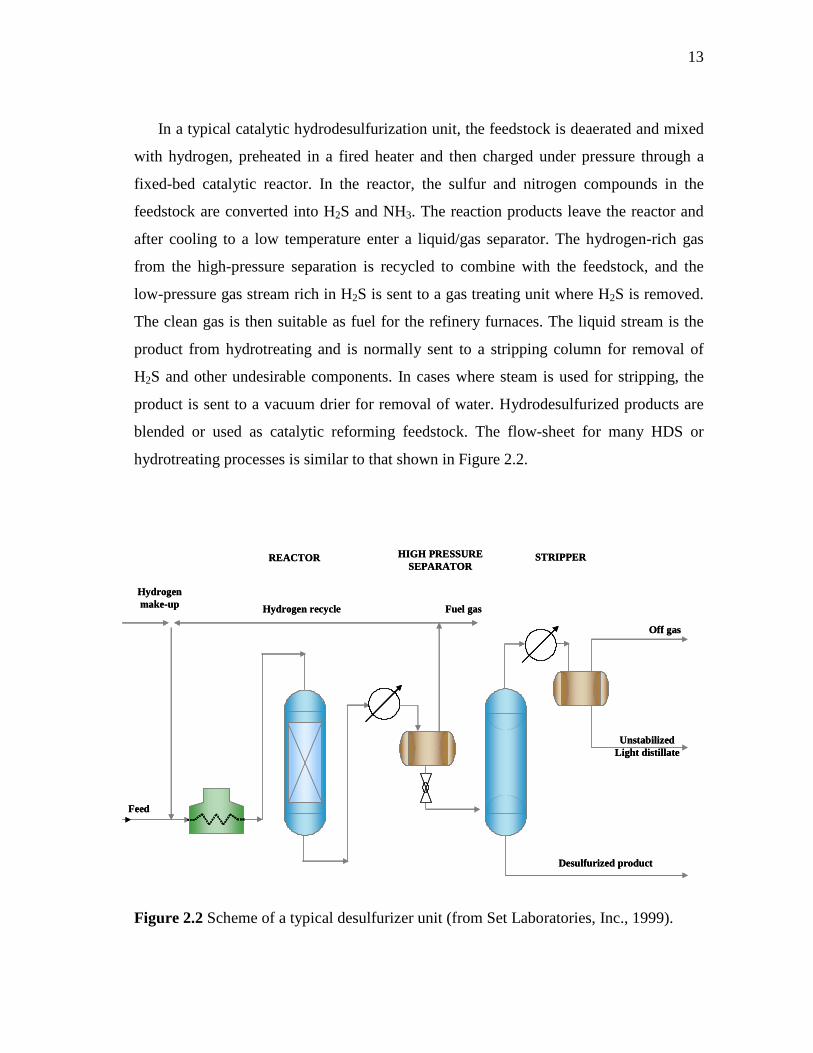
13
In a typical catalytic hydrodesulfurization unit, the feedstock is deaerated and mixed
with hydrogen, preheated in a fired heater and then charged under pressure through a
fixed-bed catalytic reactor. In the reactor, the sulfur and nitrogen compounds in the
feedstock are converted into H2S and NH3. The reaction products leave the reactor and
after cooling to a low temperature enter a liquid/gas separator. The hydrogen-rich gas
from the high-pressure separation is recycled to combine with the feedstock, and the
low-pressure gas stream rich in H2S is sent to a gas treating unit where H2S is removed.
The clean gas is then suitable as fuel for the refinery furnaces. The liquid stream is the
product from hydrotreating and is normally sent to a stripping column for removal of
H2S and other undesirable components. In cases where steam is used for stripping, the
product is sent to a vacuum drier for removal of water. Hydrodesulfurized products are
blended or used as catalytic reforming feedstock. The flow-sheet for many HDS or
hydrotreating processes is similar to that shown in Figure 2.2.
Figure 2.2 Scheme of a typical desulfurizer unit (from Set Laboratories, Inc., 1999).
Hydrogen make-up Hydrogen recycle
REACTOR
Fuel gas
Feed
STRIPPER
Desulfurized product
Off gas
UnstabilizedLight distillate
HIGH PRESSURE SEPARATOR
Hydrogen make-up Hydrogen recycle
REACTOR
Fuel gas
Feed
STRIPPER
Desulfurized product
Off gas
UnstabilizedLight distillate
HIGH PRESSURE SEPARATOR
14
The use of a recycle gas from the top of the high pressure separator minimizes the
loss of valuable hydrogen, the consumption of which is especially high when treating
heavier feeds.
2.2.1 Chemical Concepts
The basic chemical concept of the hydrodesulfurization process is to convert the
organic sulfur in the feedstock to hydrogen sulfide. Hydrogenation processes for the
conversion of crude oil fractions and products may be classified as nondestructive and
destructive (Speight, 1981). Although the definition of the two processes is purely
arbitrary, it is generally assumed that destructive hydrogenation (which is characterized
by the cleavage of carbon-to-carbon linkages and is accompanied by hydrogen saturation
of the fragments to produced lower-boiling products) requires temperatures in excess of
350 oC (660 oF). However nondestructive hydrogenation is more generally used for the
purpose of improving product quality without any appreciable alteration of the boiling
range. Mild processing conditions (temperatures below 350 oC or 660 oF) are employed
so that only the more unstable materials are attacked and the sulfur, nitrogen, and
oxygen compounds undergo hydrogenolysis to split out hydrogen sulfide, ammonia, and
water respectively. Table 2.4 shows the various reactions that result in the removal of
sulfur from the organic feedstock under the usual commercial hydrodesulfurization
conditions (elevated temperatures and pressures, high hydrogen-to-feedstock ratios, and
the presence of a catalyst).
Thiols and open-chain and cyclic sulfides are converted to saturated and/or aromatic
compounds-depending, of course, on the nature of the particular sulfur compound
involved. Benzothiophenes are converted to alkyl aromatics, while dibenzothiophenes
are usually converted to biphenyl derivatives. In fact, the major reactions that occur as
part of the hydrodesulfurization process involve carbon-sulfur bond rupture and
saturation of the reactive fragments (as well as saturation of olefinic material) (Speight,
2000). HDS is accompanied by a certain amount of hydrogenation of aromatics.
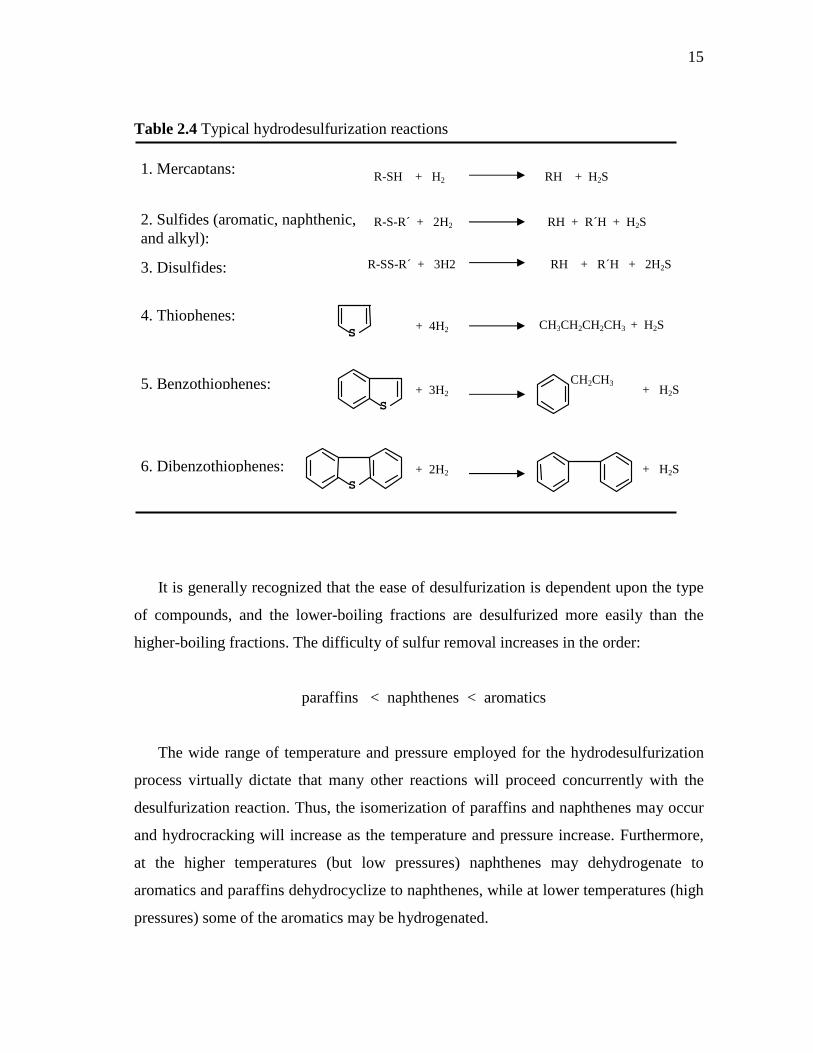
15
Table 2.4 Typical hydrodesulfurization reactions
It is generally recognized that the ease of desulfurization is dependent upon the type
of compounds, and the lower-boiling fractions are desulfurized more easily than the
higher-boiling fractions. The difficulty of sulfur removal increases in the order:
paraffins < naphthenes < aromatics
The wide range of temperature and pressure employed for the hydrodesulfurization
process virtually dictate that many other reactions will proceed concurrently with the
desulfurization reaction. Thus, the isomerization of paraffins and naphthenes may occur
and hydrocracking will increase as the temperature and pressure increase. Furthermore,
at the higher temperatures (but low pressures) naphthenes may dehydrogenate to
aromatics and paraffins dehydrocyclize to naphthenes, while at lower temperatures (high
pressures) some of the aromatics may be hydrogenated.
+ 4H2 CH3CH2CH2CH3 + H2S S
+ 3H2 + H2S
S
CH2CH3
+ 2H2 + H2S
S
R-SS-R´ + 3H2 RH + R´H + 2H2S
R-S-R´ + 2H2 RH + R´H + H2S
R-SH + H2 RH + H2S 1. Mercaptans:
2. Sulfides (aromatic, naphthenic, and alkyl):
3. Disulfides:
4. Thiophenes:
5. Benzothiophenes:
6. Dibenzothiophenes:
16
These reactions do not all occur equally which is due, to some extent, to the nature of
the catalyst. The judicious choice of a catalyst will lead to the elimination of sulfur (and
other heteroatoms nitrogen and oxygen) and, although some hydrogenation and
hydrocracking may occur, the extent of the denitrogenation, deoxygenation and
hydrocracking reactions may be relatively minor.
The hydrodesulfurization process is a very complex sequence of reactions, due, no
doubt, to the complexity of the feedstock; so, this work is limited to the sulfur removal.
2.2.2 Hydrodesulfurization Network of Dibenzothiophene
A detailed network for the hydrodesulfurization of dibenzothiophene (DBT) has
been proposed by Houalla et al. (1978, 1980) (Figure 2.3). As Vanrysselberghe and
Froment (1996, 2003) reported, dibenzothiophene reacts along two parallel path-ways:
hydrogenolysis of DBT into biphenyl (BPH) and H2S, and partial hydrogenation of the
aromatics ring system into tetrahydrodibenzothiophene (THDBT) and
hexahydrodibenzothiophene (HHDBT), which are rapidly converted into
cyclohexylbenzene (CHB) and H2S. Each of the hydrogenated dibenzothiophenes was
rapidly converted into the other. Biphenyl is further hydrogenated to give
cyclohexylbenzene and then bicyclohexyl (BCH).
The hydrogenation reaction of dibenzothiophene was about 1000 times slower
than the hydrogenolysis reaction, but the hydrogenation became relatively fast as H2S
was added to the reactant mixture or as methyl groups were present in the 4 and/or 6
position(s) in dibenzothiophene. The experiments were carried out on a CoMo/γ-Al 2O3
catalyst. The catalyst particles were crushed to a size between 149 and 178 µm so as to
ensure the absence of diffusional limitations.
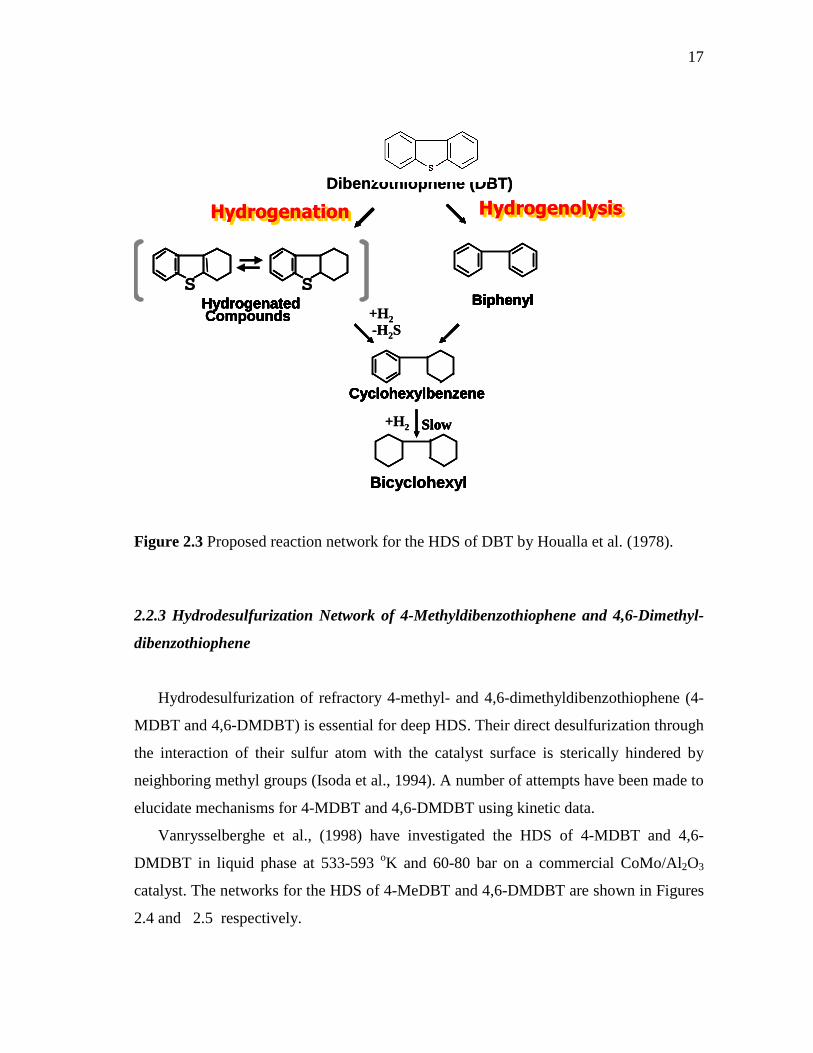
17
Figure 2.3 Proposed reaction network for the HDS of DBT by Houalla et al. (1978).
2.2.3 Hydrodesulfurization Network of 4-Methyldibenzothiophene and 4,6-Dimethyl-
dibenzothiophene
Hydrodesulfurization of refractory 4-methyl- and 4,6-dimethyldibenzothiophene (4-
MDBT and 4,6-DMDBT) is essential for deep HDS. Their direct desulfurization through
the interaction of their sulfur atom with the catalyst surface is sterically hindered by
neighboring methyl groups (Isoda et al., 1994). A number of attempts have been made to
elucidate mechanisms for 4-MDBT and 4,6-DMDBT using kinetic data.
Vanrysselberghe et al., (1998) have investigated the HDS of 4-MDBT and 4,6-
DMDBT in liquid phase at 533-593 oK and 60-80 bar on a commercial CoMo/Al2O3
catalyst. The networks for the HDS of 4-MeDBT and 4,6-DMDBT are shown in Figures
2.4 and 2.5 respectively.
HydrogenolysisHydrogenolysis
Hydrogenated Compounds
Cyclohexylbenzene
BiphenylHydrogenated Compounds
Cyclohexylbenzene
Biphenyl
Bicyclohexyl
-H2S
+H2 Slow
Dibenzothiophene (DBT)
Hydrogenated
Cyclohexylbenzene
BiphenylHydrogenated
Cyclohexylbenzene
Biphenyl
Bicyclohexyl
+H2
Slow
HydrogenationHydrogenation
S S
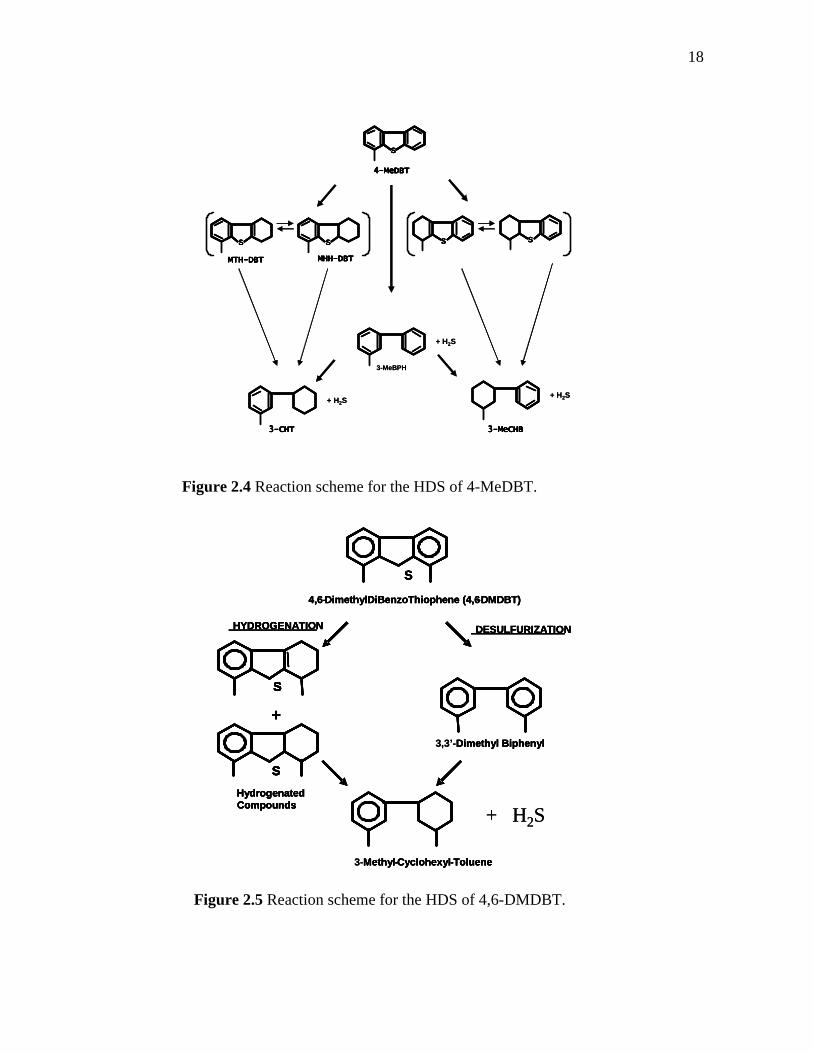
18
Figure 2.4 Reaction scheme for the HDS of 4-MeDBT.
Figure 2.5 Reaction scheme for the HDS of 4,6-DMDBT.
+ H2S
+ H2S+ H2S
S
SS S S
4444----MeDBTMeDBTMeDBTMeDBT
3-MeBPH
3333----MeCHBMeCHBMeCHBMeCHB3333----CHTCHTCHTCHT
MTHMTHMTHMTH----DBTDBTDBTDBT MHHMHHMHHMHH----DBTDBTDBTDBT
+ H2S
+ H2S+ H2S
SSSS
SSSSSS SSS SSS
4444----MeDBTMeDBTMeDBTMeDBT
3-MeBPH
3333----MeCHBMeCHBMeCHBMeCHB3333----CHTCHTCHTCHT
MTHMTHMTHMTH----DBTDBTDBTDBT MHHMHHMHHMHH----DBTDBTDBTDBT
+
4,6-DimethylDiBenzoThiophene (4,6-DMDBT)
HYDROGENATION
Hydrogenated Compounds
Methyl-Cyclohexyl-Toluene
Dimethyl Biphenyl
DESULFURIZATION
S
S
S
+
4,6-DimethylDiBenzoThiophene (4,6-DMDBT)
HYDROGENATION
Hydrogenated Compounds
3-Methyl-Cyclohexyl-Toluene
3,3’-Dimethyl Biphenyl
DESULFURIZATION
SS
SSS
SSS
+ H2S
+
4,6-DimethylDiBenzoThiophene (4,6-DMDBT)
HYDROGENATION
Hydrogenated Compounds
Methyl-Cyclohexyl-Toluene
Dimethyl Biphenyl
DESULFURIZATION
S
S
S
+
4,6-DimethylDiBenzoThiophene (4,6-DMDBT)
HYDROGENATION
Hydrogenated Compounds
3-Methyl-Cyclohexyl-Toluene
3,3’-Dimethyl Biphenyl
DESULFURIZATION
SS
SSS
SSS
+ H2S
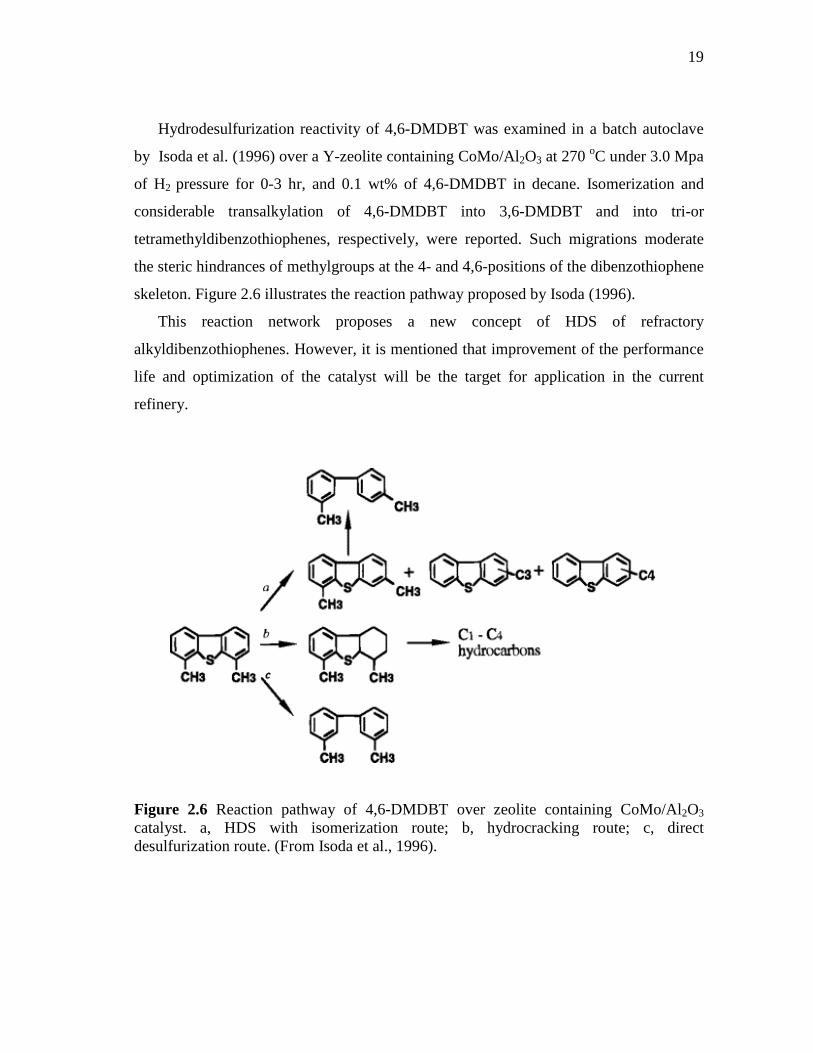
19
Hydrodesulfurization reactivity of 4,6-DMDBT was examined in a batch autoclave
by Isoda et al. (1996) over a Y-zeolite containing CoMo/Al2O3 at 270 oC under 3.0 Mpa
of H2 pressure for 0-3 hr, and 0.1 wt% of 4,6-DMDBT in decane. Isomerization and
considerable transalkylation of 4,6-DMDBT into 3,6-DMDBT and into tri-or
tetramethyldibenzothiophenes, respectively, were reported. Such migrations moderate
the steric hindrances of methylgroups at the 4- and 4,6-positions of the dibenzothiophene
skeleton. Figure 2.6 illustrates the reaction pathway proposed by Isoda (1996).
This reaction network proposes a new concept of HDS of refractory
alkyldibenzothiophenes. However, it is mentioned that improvement of the performance
life and optimization of the catalyst will be the target for application in the current
refinery.
Figure 2.6 Reaction pathway of 4,6-DMDBT over zeolite containing CoMo/Al2O3 catalyst. a, HDS with isomerization route; b, hydrocracking route; c, direct desulfurization route. (From Isoda et al., 1996).
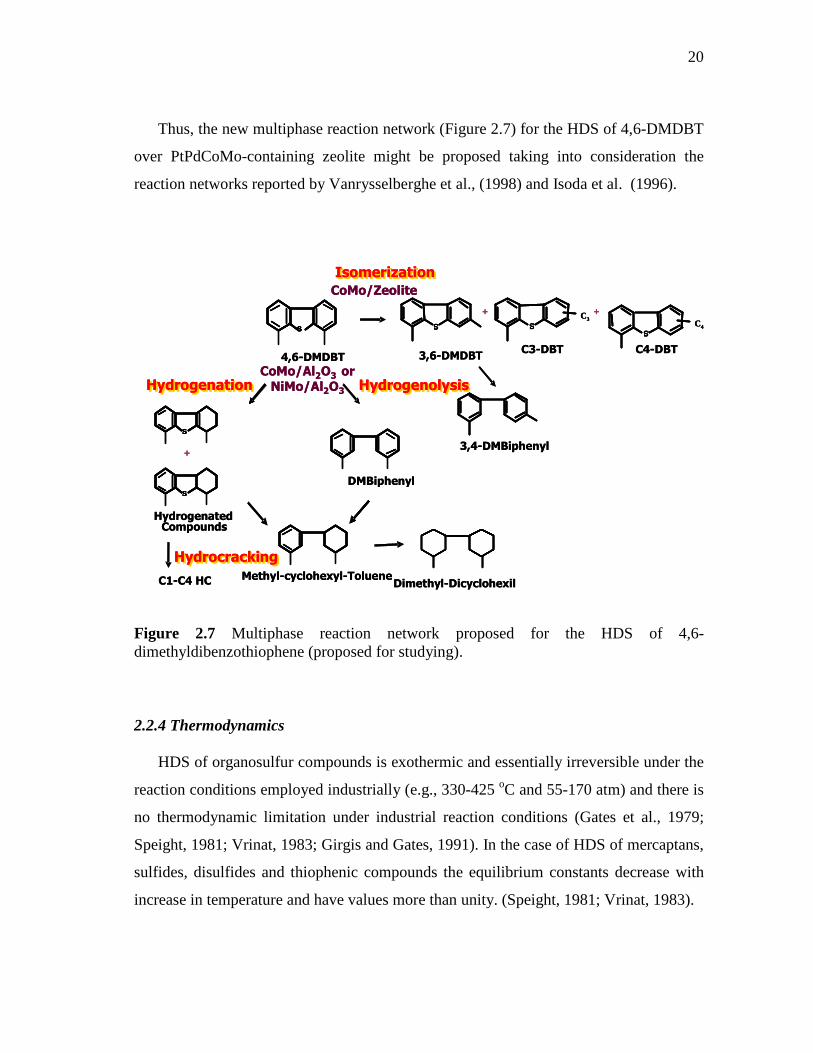
20
Thus, the new multiphase reaction network (Figure 2.7) for the HDS of 4,6-DMDBT
over PtPdCoMo-containing zeolite might be proposed taking into consideration the
reaction networks reported by Vanrysselberghe et al., (1998) and Isoda et al. (1996).
Figure 2.7 Multiphase reaction network proposed for the HDS of 4,6-dimethyldibenzothiophene (proposed for studying).
2.2.4 Thermodynamics
HDS of organosulfur compounds is exothermic and essentially irreversible under the
reaction conditions employed industrially (e.g., 330-425 oC and 55-170 atm) and there is
no thermodynamic limitation under industrial reaction conditions (Gates et al., 1979;
Speight, 1981; Vrinat, 1983; Girgis and Gates, 1991). In the case of HDS of mercaptans,
sulfides, disulfides and thiophenic compounds the equilibrium constants decrease with
increase in temperature and have values more than unity. (Speight, 1981; Vrinat, 1983).
C1-C4 HC
+ +
3,6-DMDBTC3-DBT C4-DBT
IsomerizationIsomerization
4,6-DMDBT
S S C3
S C4
S
S
Hydrogenated Compounds
DMBiphenyl
+
HydrocrackingHydrocracking
3,4-DMBiphenyl
Methyl-cyclohexyl-TolueneDimethyl-Dicyclohexil
HydrogenationHydrogenation HydrogenolysisHydrogenolysis
S
CoMo/Al2O3 or
NiMo/Al2O3
CoMo/Zeolite
C1-C4 HC
+ +
3,6-DMDBTC3-DBT C4-DBT
IsomerizationIsomerization
4,6-DMDBT
SS S C3S C3
S C4S C4
SSSS
SSSS
Hydrogenated Compounds
DMBiphenyl
+
HydrocrackingHydrocracking
3,4-DMBiphenyl
Methyl-cyclohexyl-TolueneDimethyl-Dicyclohexil
HydrogenationHydrogenation HydrogenolysisHydrogenolysis
SSSS
CoMo/Al2O3 or
NiMo/Al2O3
CoMo/Zeolite
21
Thermodynamic data for organosulfur compounds present in higher boiling fractions
(i.e., multiring hetorocyclics) are unavailable, except for recent data for
dibenzothiophene HDS (Vrinat, 1983). The later results indicate that dibenzothiophene
HDS to give biphenyl is also favored thermodynamically under practical HDS
conditions and is exothermic (∆Ho = -11 kcal/mol). Extrapolation of the latter results
suggests that the HDS of higher molecular weight orgnosulfur compounds (e.g.,
benzonaphthothiophenes) is also favored.
As was shown in Figure 2.5, sulfur removal occurs along two parallel pathways,
hydrogenolysis and hydrogenation (Froment, 2004). The pathways involving prior
hydrogenation of the ring can be affected by thermodynamics because hydrogenation of
the sulfur-containing rings of organosulfur compounds is equilibrium-limited at practical
HDS temperatures. For example, the equilibrium constant for hydrogenation of
thiophene to give tetrahydrothiophene is less than unity at temperatures above 350 oC
(Vrinat, 1983), indicating that sulfur-removal pathways via hydrogenated organosulfur
intermediates may be inhibited at lower pressures and high temperatures because of the
low equilibrium concentration of the latter species.
2.2.5 Reactivities
The reactivities of heterocyclic sulfur compounds in HDS are governed basically by
the types of C-S bonds and the position of alkyl substituents (Kabe et al., 1999). The first
factor is related to the strength of C-S bonds, and the second is related to the steric
hindrance as well as the electron density on the sulfur atom.
2.2.5.1 Reactivities Based on the Strength of C-S Bonds
There are a large number of reports on HDS of thiophene (T), benzothiophene
(BT) and dibenzothiophene (DBT) because they are among the simplest compounds in
model reactions for petroleum refineries. Nag et al., (1979) reported the reactivities of
typical thiophenic compounds as shown in Table 2.5. The rate constants decreased in the
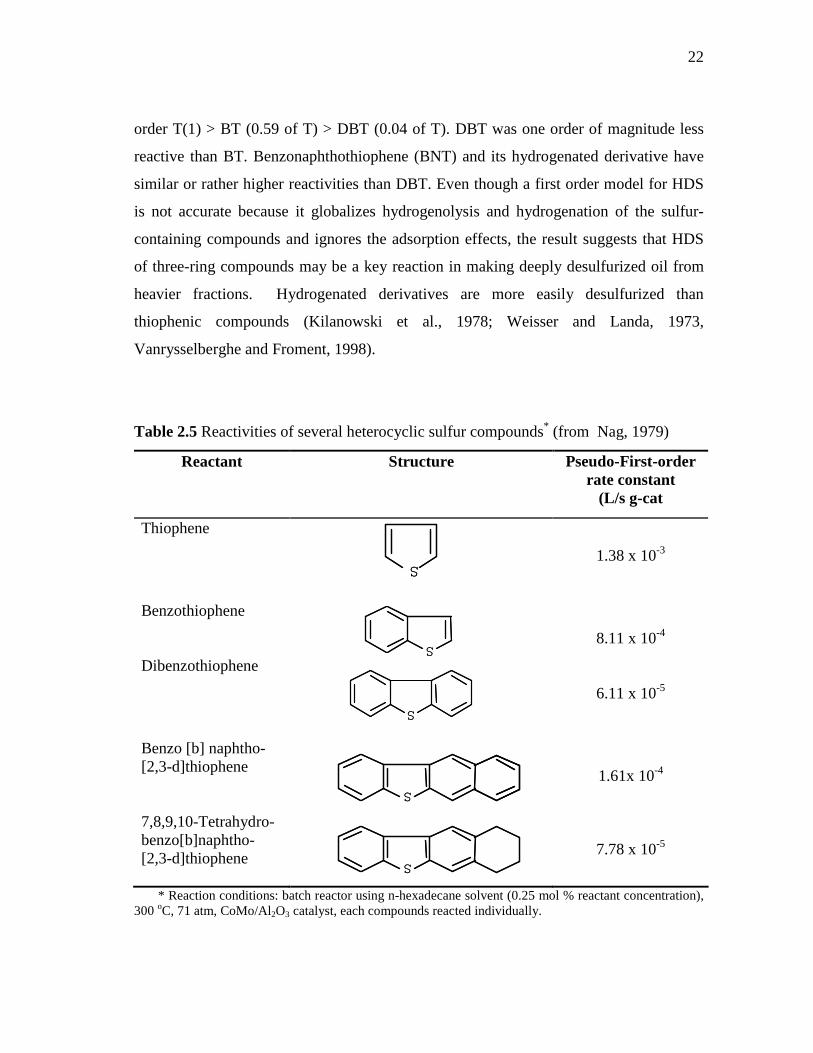
22
order T(1) > BT (0.59 of T) > DBT (0.04 of T). DBT was one order of magnitude less
reactive than BT. Benzonaphthothiophene (BNT) and its hydrogenated derivative have
similar or rather higher reactivities than DBT. Even though a first order model for HDS
is not accurate because it globalizes hydrogenolysis and hydrogenation of the sulfur-
containing compounds and ignores the adsorption effects, the result suggests that HDS
of three-ring compounds may be a key reaction in making deeply desulfurized oil from
heavier fractions. Hydrogenated derivatives are more easily desulfurized than
thiophenic compounds (Kilanowski et al., 1978; Weisser and Landa, 1973,
Vanrysselberghe and Froment, 1998).
Table 2.5 Reactivities of several heterocyclic sulfur compounds* (from Nag, 1979)
Reactant Structure Pseudo-First-order rate constant
(L/s g-cat
Thiophene
1.38 x 10⁻³
Benzothiophene
8.11 x 10⁻⁴
Dibenzothiophene
6.11 x 10⁻⁵
Benzo [b] naphtho- [2,3-d]thiophene
1.61x 10⁻⁴
7,8,9,10-Tetrahydro-benzo[b]naphtho- [2,3-d]thiophene
7.78 x 10⁻⁵
* Reaction conditions: batch reactor using n-hexadecane solvent (0.25 mol % reactant concentration), 300 oC, 71 atm, CoMo/Al2O3 catalyst, each compounds reacted individually.
SS
SS
SS
SS
SS
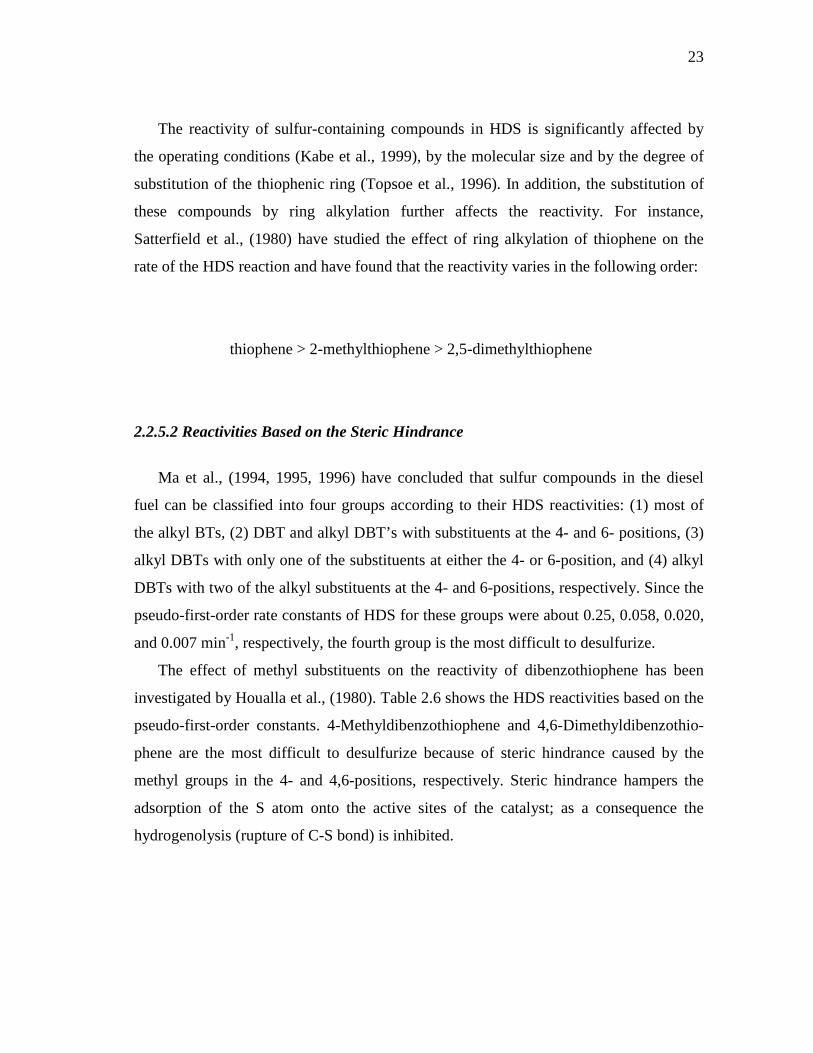
23
The reactivity of sulfur-containing compounds in HDS is significantly affected by
the operating conditions (Kabe et al., 1999), by the molecular size and by the degree of
substitution of the thiophenic ring (Topsoe et al., 1996). In addition, the substitution of
these compounds by ring alkylation further affects the reactivity. For instance,
Satterfield et al., (1980) have studied the effect of ring alkylation of thiophene on the
rate of the HDS reaction and have found that the reactivity varies in the following order:
thiophene > 2-methylthiophene > 2,5-dimethylthiophene
2.2.5.2 Reactivities Based on the Steric Hindrance
Ma et al., (1994, 1995, 1996) have concluded that sulfur compounds in the diesel
fuel can be classified into four groups according to their HDS reactivities: (1) most of
the alkyl BTs, (2) DBT and alkyl DBT’s with substituents at the 4- and 6- positions, (3)
alkyl DBTs with only one of the substituents at either the 4- or 6-position, and (4) alkyl
DBTs with two of the alkyl substituents at the 4- and 6-positions, respectively. Since the
pseudo-first-order rate constants of HDS for these groups were about 0.25, 0.058, 0.020,
and 0.007 min-1, respectively, the fourth group is the most difficult to desulfurize.
The effect of methyl substituents on the reactivity of dibenzothiophene has been
investigated by Houalla et al., (1980). Table 2.6 shows the HDS reactivities based on the
pseudo-first-order constants. 4-Methyldibenzothiophene and 4,6-Dimethyldibenzothio-
phene are the most difficult to desulfurize because of steric hindrance caused by the
methyl groups in the 4- and 4,6-positions, respectively. Steric hindrance hampers the
adsorption of the S atom onto the active sites of the catalyst; as a consequence the
hydrogenolysis (rupture of C-S bond) is inhibited.
24
Table 2.6 Reactivities of selected methyl-substituted dibenzothiophenes*
Reactant Structure Pseudo-First-order rate constant
(L/s g-cat
Dibenzothiophene
7.38 x 10⁻⁵
2,8-dimethyldibenzo-
thiophene
6.72 x 10⁻⁵
3,7-dimethyldibenzo-
thiophene
3.53 x 10⁻⁵
4,6-dimethyldibenzo-
thiophene
4.92 x 10⁻⁶
4-methyldibenzo-
thiophene
6.64 x 10⁻⁶
*Reaction conditions: flow reactor, n-hexadecane carrier oil, each reactant allowed to react individually at 300 oC at 102 atm in the presence of a CoMo/Al2O3 catalyst.
Vanrysselberghe et al., (1998) have reported that methyl-substituted dibenzothiophes
have a higher rate of hydrogenation than dibenzothiophenes itself. The experiments with
the model components 4-MeDBT and 4,6-DMDBT demonstrated that methyl groups
increase both the adsorption equilibrium constant on the active sites and the rate
coefficient for the hydrogenation surface reaction.
2.3 Effect of H2S on Hydroprocessing Reactions
H2S in hydrotreater recycle gas is an activity depressant for hydroprocessing
reactions (Albermarle Catalysts, 2003). The presence of H2S inhibits the rate of reaction
of hydrocarbon molecules with active sites on the catalyst surface. In addition, H2S
SS
SS
SS
SS
SS
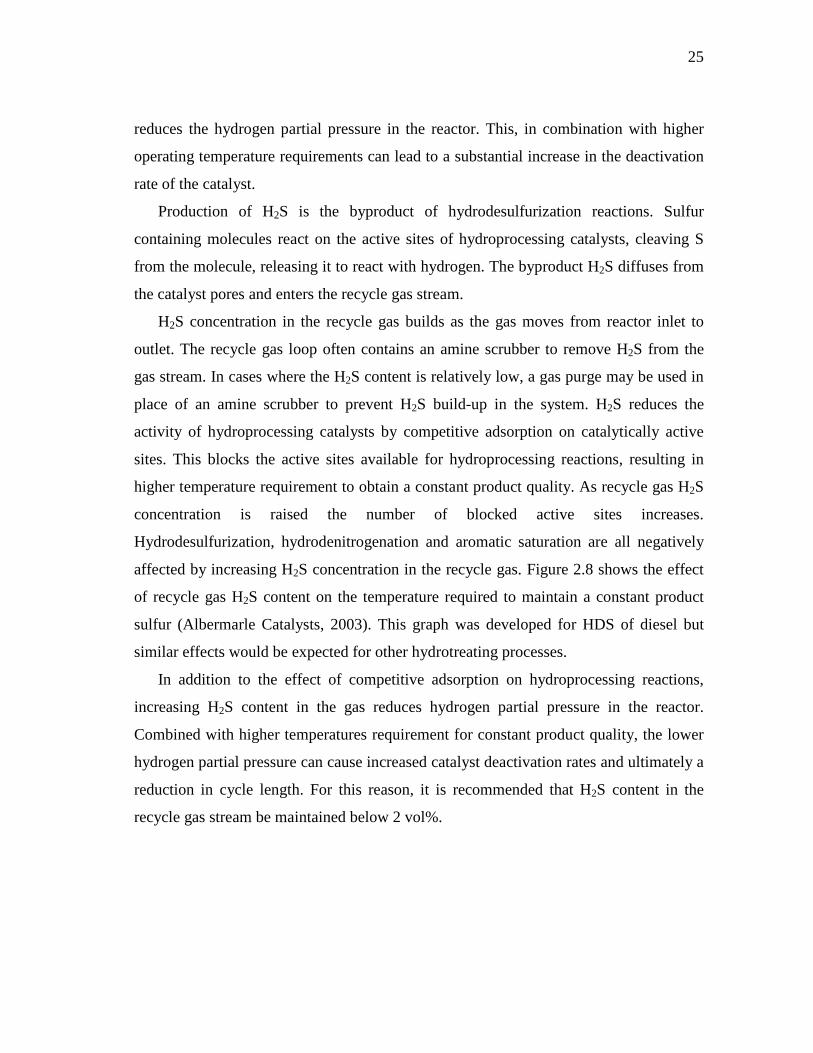
25
reduces the hydrogen partial pressure in the reactor. This, in combination with higher
operating temperature requirements can lead to a substantial increase in the deactivation
rate of the catalyst.
Production of H2S is the byproduct of hydrodesulfurization reactions. Sulfur
containing molecules react on the active sites of hydroprocessing catalysts, cleaving S
from the molecule, releasing it to react with hydrogen. The byproduct H2S diffuses from
the catalyst pores and enters the recycle gas stream.
H2S concentration in the recycle gas builds as the gas moves from reactor inlet to
outlet. The recycle gas loop often contains an amine scrubber to remove H2S from the
gas stream. In cases where the H2S content is relatively low, a gas purge may be used in
place of an amine scrubber to prevent H2S build-up in the system. H2S reduces the
activity of hydroprocessing catalysts by competitive adsorption on catalytically active
sites. This blocks the active sites available for hydroprocessing reactions, resulting in
higher temperature requirement to obtain a constant product quality. As recycle gas H2S
concentration is raised the number of blocked active sites increases.
Hydrodesulfurization, hydrodenitrogenation and aromatic saturation are all negatively
affected by increasing H2S concentration in the recycle gas. Figure 2.8 shows the effect
of recycle gas H2S content on the temperature required to maintain a constant product
sulfur (Albermarle Catalysts, 2003). This graph was developed for HDS of diesel but
similar effects would be expected for other hydrotreating processes.
In addition to the effect of competitive adsorption on hydroprocessing reactions,
increasing H2S content in the gas reduces hydrogen partial pressure in the reactor.
Combined with higher temperatures requirement for constant product quality, the lower
hydrogen partial pressure can cause increased catalyst deactivation rates and ultimately a
reduction in cycle length. For this reason, it is recommended that H2S content in the
recycle gas stream be maintained below 2 vol%.
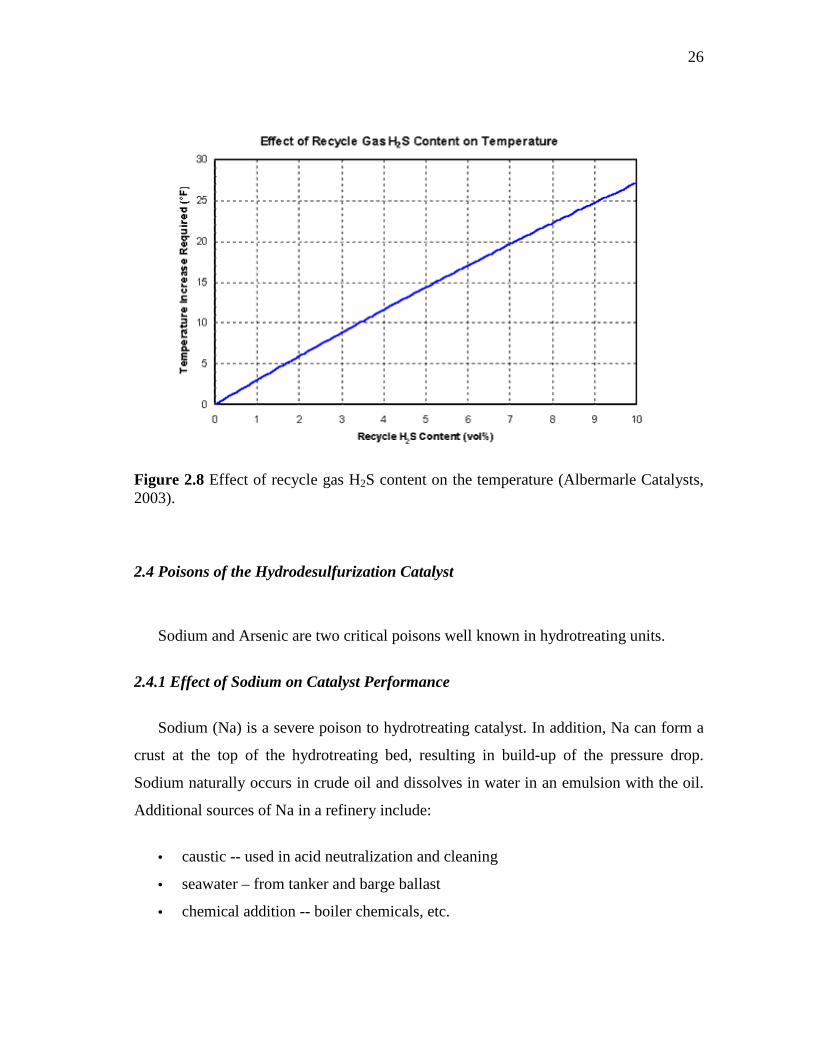
26
Figure 2.8 Effect of recycle gas H2S content on the temperature (Albermarle Catalysts, 2003).
2.4 Poisons of the Hydrodesulfurization Catalyst
Sodium and Arsenic are two critical poisons well known in hydrotreating units.
2.4.1 Effect of Sodium on Catalyst Performance
Sodium (Na) is a severe poison to hydrotreating catalyst. In addition, Na can form a
crust at the top of the hydrotreating bed, resulting in build-up of the pressure drop.
Sodium naturally occurs in crude oil and dissolves in water in an emulsion with the oil.
Additional sources of Na in a refinery include:
• caustic -- used in acid neutralization and cleaning
• seawater – from tanker and barge ballast
• chemical addition -- boiler chemicals, etc.
27
Desalting is used to control Na content of the feed and mitigate the effects on
catalyst and unit performance. However, poor desalting or Na from another source can
result in the contaminant being present in the feed to a hydrotreater, causing short cycles
and poor performance. In this report the effect of sodium on hydrotreating catalyst is
described below.
Sodium is a severe poison to hydrotreating catalyst, as can be seen in the Figure 2.9
(Albermarle catalysts, 2003). While Na affects activity within the cycle in which it is
deposited, it has a more severe effect during catalyst regeneration. At the elevated
temperatures of regeneration, Na sinters the catalyst surface, causing acid sites to be
destroyed, a reduction in surface area and a reduction of active sites. Na also becomes
mobile at elevated temperatures so a high concentration of Na on the outer edges of the
spent material can move inward. For these reasons, regeneration is not recommended for
spent catalysts containing more than 0.25 wt% Na.
Figure 2.9 Effect of the sodium content on catalysts on the activity relative to fresh catalyst (from Albermarle Catalysts, 2003).
28
The majority of sodium is carried into hydrotreating units by water in emulsion with
the feed. For this reason, Na tends to deposit in the upper portion of the catalyst bed.
High concentration of Na in the feed results in the formation of a crust at the top of the
hydrotreater. If not controlled (through size grading or other means) the crust causes a
rapid build-up in pressure drop and eventual unit shutdown. Fortunately, the crust can
usually be removed by skimming. Depending upon unit severity and throughput,
downstream catalyst activity may not be seriously affected.
Prevention is the only effective means of control for Na poisoning. Ensure effective
desalting unit performance and careful monitoring of chemical additions to prevent
pressure drop build-up in the current cycle. Avoid regenerated catalyst with Na content
greater than 0.25 wt%.
2.4.2 Effect of Arsenic on Catalyst Performance
Arsenic (As) is a very severe poison to hydrotreating catalyst. It is naturally
occurring in crude oil, with the concentration highly dependent upon the crude source.
Arsenic poisoning is primarily observed in distillate and VGO hydrotreating but is
occasionally observed in lighter feedstocks. Due to the severe impact on catalyst
activity, it is preferred to capture as much arsenic as possible in the upper portion of the
catalyst bed. The arsenic has a more damaging effect on unit performance if it spreads
out over a significant portion of the total catalyst bed. This work describes the effect of
arsenic on hydrotreating catalyst and a means of mitigating these effects.
Arsenic (As) is a very severe poison to hydrotreating catalyst, as can be seen in
the Figure 2.10 (Albermarle catalysts, 2003). Even 0.5 wt% As on catalyst results in
more than 30% reduction in activity as compared to fresh! Arsenic poisons by blocking
access to catalytically active sites on the pore surface. In general, it is not recommended
to regenerate or to use regenerated catalyst containing more than 3000 ppm As.
However, arsenic does not deposit uniformly in a catalyst bed. If an entire catalyst bed is
discharged together, it is possible for the catalyst to have an average arsenic content in
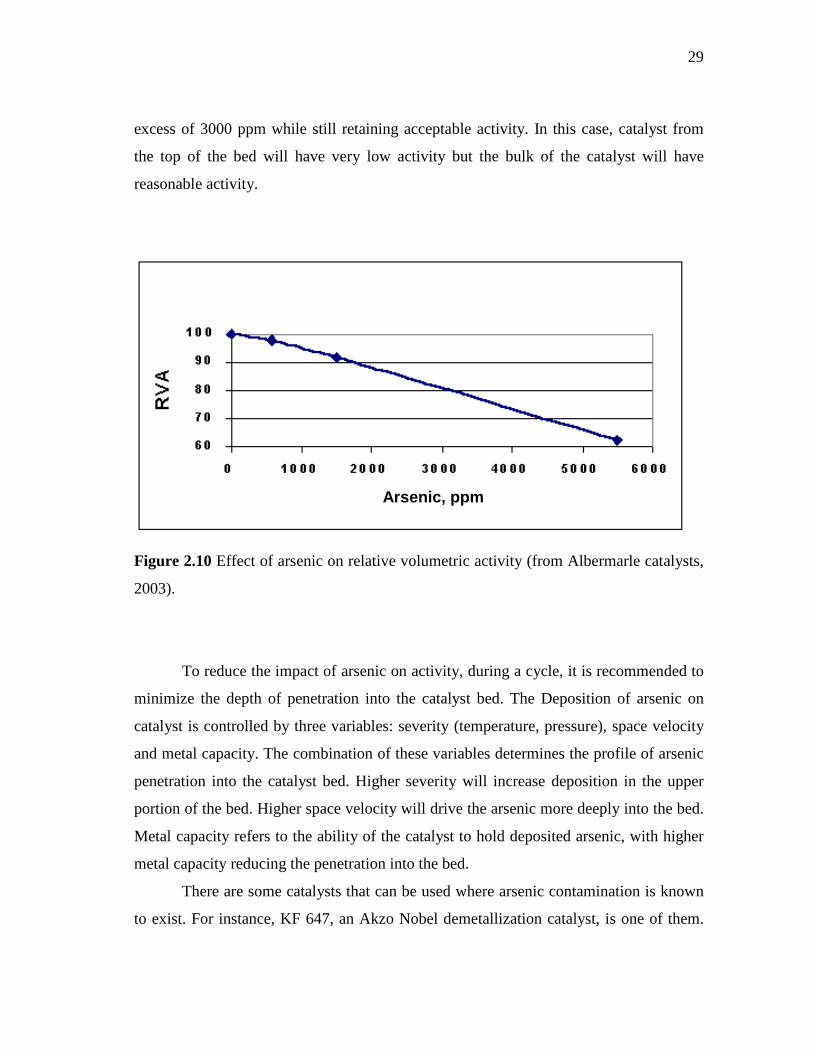
29
excess of 3000 ppm while still retaining acceptable activity. In this case, catalyst from
the top of the bed will have very low activity but the bulk of the catalyst will have
reasonable activity.
Arsenic, ppm
Figure 2.10 Effect of arsenic on relative volumetric activity (from Albermarle catalysts,
2003).
To reduce the impact of arsenic on activity, during a cycle, it is recommended to
minimize the depth of penetration into the catalyst bed. The Deposition of arsenic on
catalyst is controlled by three variables: severity (temperature, pressure), space velocity
and metal capacity. The combination of these variables determines the profile of arsenic
penetration into the catalyst bed. Higher severity will increase deposition in the upper
portion of the bed. Higher space velocity will drive the arsenic more deeply into the bed.
Metal capacity refers to the ability of the catalyst to hold deposited arsenic, with higher
metal capacity reducing the penetration into the bed.
There are some catalysts that can be used where arsenic contamination is known
to exist. For instance, KF 647, an Akzo Nobel demetallization catalyst, is one of them.
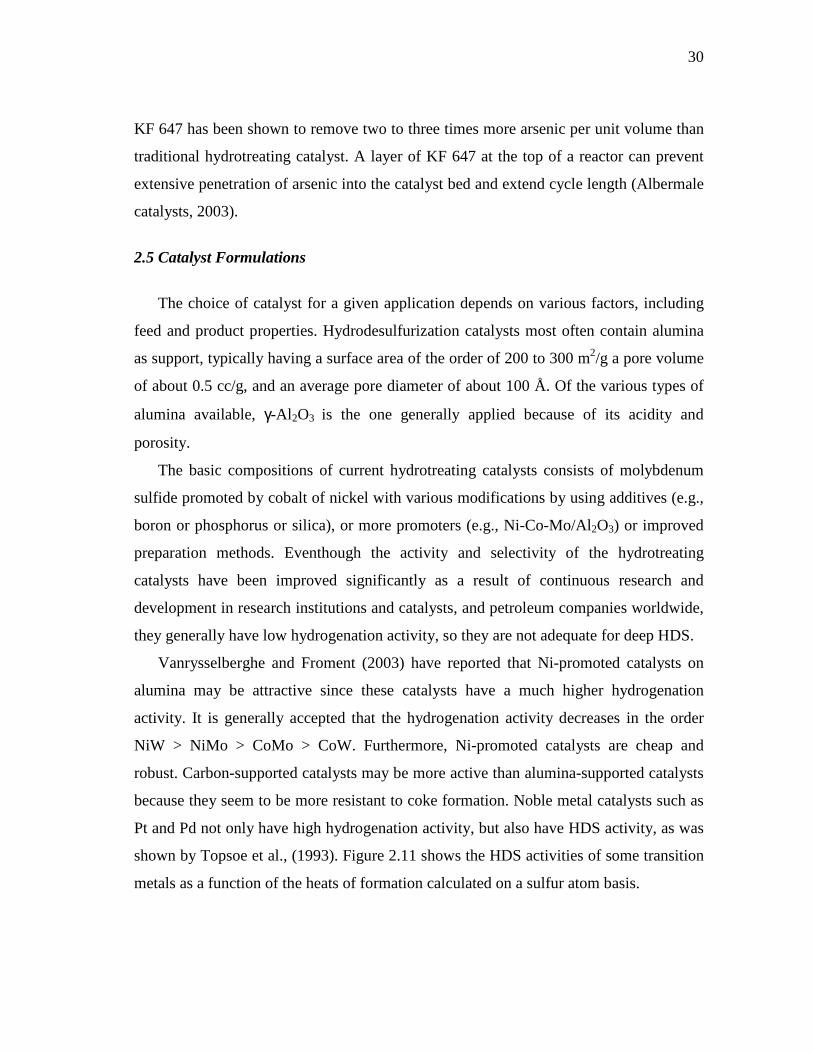
30
KF 647 has been shown to remove two to three times more arsenic per unit volume than
traditional hydrotreating catalyst. A layer of KF 647 at the top of a reactor can prevent
extensive penetration of arsenic into the catalyst bed and extend cycle length (Albermale
catalysts, 2003).
2.5 Catalyst Formulations
The choice of catalyst for a given application depends on various factors, including
feed and product properties. Hydrodesulfurization catalysts most often contain alumina
as support, typically having a surface area of the order of 200 to 300 m2/g a pore volume
of about 0.5 cc/g, and an average pore diameter of about 100 Å. Of the various types of
alumina available, γ-Al 2O3 is the one generally applied because of its acidity and
porosity.
The basic compositions of current hydrotreating catalysts consists of molybdenum
sulfide promoted by cobalt of nickel with various modifications by using additives (e.g.,
boron or phosphorus or silica), or more promoters (e.g., Ni-Co-Mo/Al2O3) or improved
preparation methods. Eventhough the activity and selectivity of the hydrotreating
catalysts have been improved significantly as a result of continuous research and
development in research institutions and catalysts, and petroleum companies worldwide,
they generally have low hydrogenation activity, so they are not adequate for deep HDS.
Vanrysselberghe and Froment (2003) have reported that Ni-promoted catalysts on
alumina may be attractive since these catalysts have a much higher hydrogenation
activity. It is generally accepted that the hydrogenation activity decreases in the order
NiW > NiMo > CoMo > CoW. Furthermore, Ni-promoted catalysts are cheap and
robust. Carbon-supported catalysts may be more active than alumina-supported catalysts
because they seem to be more resistant to coke formation. Noble metal catalysts such as
Pt and Pd not only have high hydrogenation activity, but also have HDS activity, as was
shown by Topsoe et al., (1993). Figure 2.11 shows the HDS activities of some transition
metals as a function of the heats of formation calculated on a sulfur atom basis.
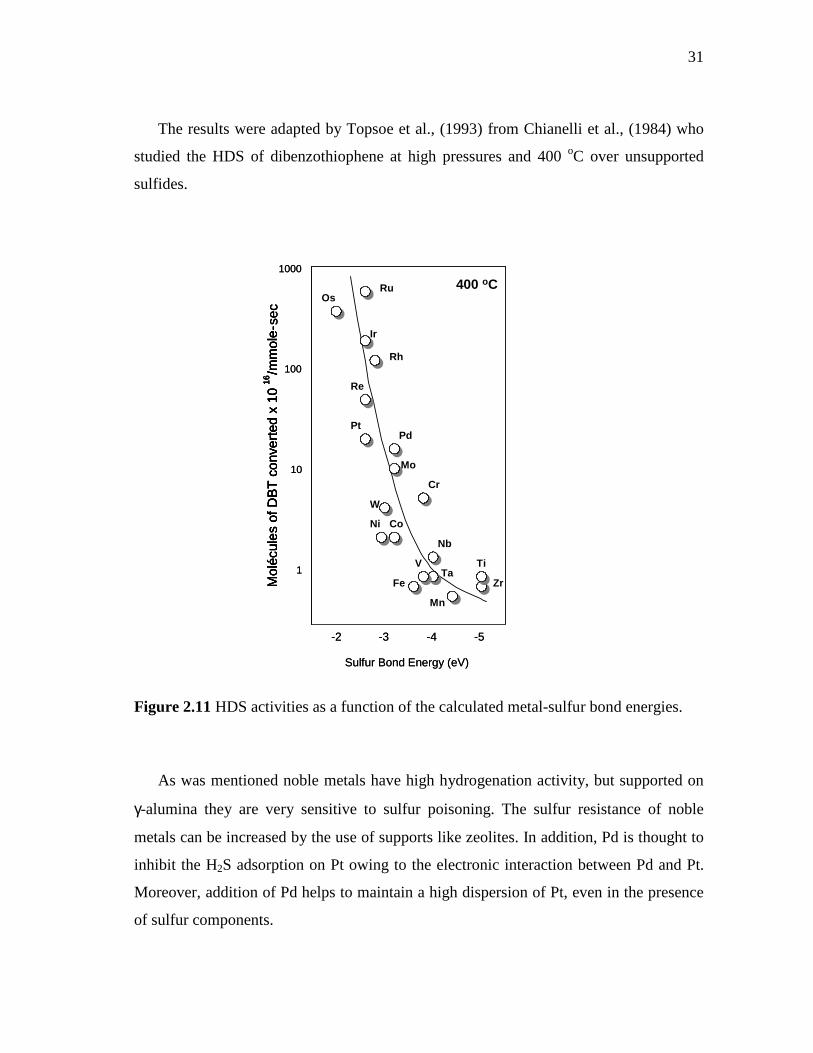
31
The results were adapted by Topsoe et al., (1993) from Chianelli et al., (1984) who
studied the HDS of dibenzothiophene at high pressures and 400 oC over unsupported
sulfides.
Figure 2.11 HDS activities as a function of the calculated metal-sulfur bond energies.
As was mentioned noble metals have high hydrogenation activity, but supported on
γ-alumina they are very sensitive to sulfur poisoning. The sulfur resistance of noble
metals can be increased by the use of supports like zeolites. In addition, Pd is thought to
inhibit the H2S adsorption on Pt owing to the electronic interaction between Pd and Pt.
Moreover, addition of Pd helps to maintain a high dispersion of Pt, even in the presence
of sulfur components.
RuOs
Ir
Rh
Re
PtPd
Mo
Cr
W
CoNi
Nb
Ti
ZrTa
V
Fe
Mn
-2 -3 -4 -5
Mol
écul
esof
DB
T c
onve
rted
x 1
016
/mm
ole-
sec
1000
100
10
1
Sulfur Bond Energy (eV)
400 oCRuOs
Ir
Rh
Re
PtPd
Mo
Cr
W
CoNi
Nb
Ti
ZrTa
V
Fe
Mn
-2 -3 -4 -5
Mol
écul
esof
DB
T c
onve
rted
x 1
016
/mm
ole-
sec
Mol
écul
esof
DB
T c
onve
rted
x 1
016
/mm
ole-
Mol
écul
esof
DB
T c
onve
rted
x 1
016
/mm
ole-
sec
1000
100
10
1
Sulfur Bond Energy (eV)
400 oC
32
The development of new HDS technologies of catalysts is aiming for the production
of 10-ppm sulfur content for diesel. The genesis of the active phase of cobalt and
molybdenum is controlled in such way that the desulfurization of refractory sulfur
compounds is promoted. In this context, Criterion Co. (2003) has considered two aspects
for the catalysts manufacturing process for ultra deep desulfurization: better dispersion,
and hence utilization, of the promoter metals, and greater conversion of the promoter
metal oxide sites to metal sulfides (active state). A consequence of the Criterion novel
manufacturing process used for the CENTINEL catalysts, metal complexes, MXn,
physically adsorbed on the surface react directly with sulfur compounds to form highly
dispersed metal sulfide species, M-Sx. These highly dispersed metal sulfide crystallites
are “locked in place” during the activation process. This results in the active sulfide
phase of the catalyst, MSy. As a result, all metals placed on the catalyst are fully sulfided
while maintaining high dispersion and better metals utilization than conventional
catalysts.
2.6 Structure of Active Phase
In order to have a firm basis for understanding properties of hydrotreating catalysts,
it is highly desirable to obtain a complete description of both the structures and the sites
where the catalysis takes place, i.e. the “active sites”. Structural information on
hydrotreating catalysts has in many instances been interpreted in terms of several models
(i.e.., the monolayer model, the intercalation model, the contact synergy model, and the
Co-Mo-S model), which have been proposed in the literature.
The exact nature of active sites in Co-Mo or Ni-Mo catalysts is still a subject of
debate, but the Co-Mo-S model (or Ni-Mo-S) model is currently the one most widely
accepted Topsoe et al., (1996) and Prins (2001).
For this report, a brief description of the monolayer and intercalation models is
presented.
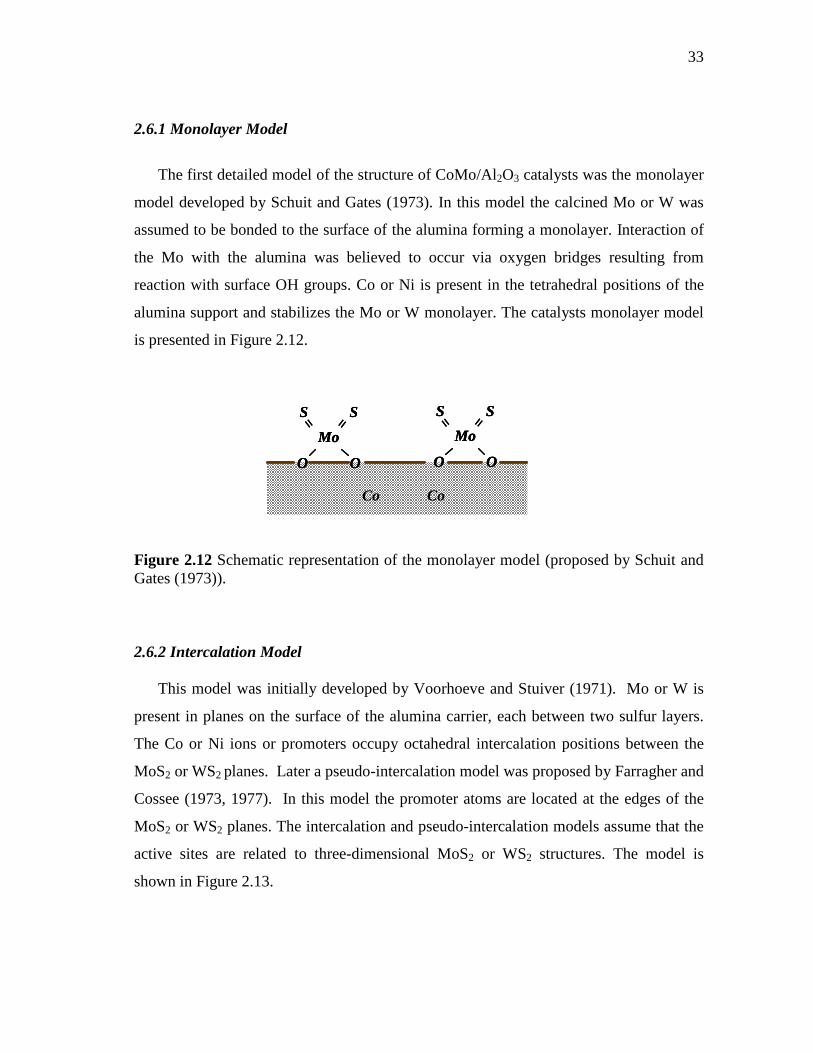
33
2.6.1 Monolayer Model
The first detailed model of the structure of CoMo/Al2O3 catalysts was the monolayer
model developed by Schuit and Gates (1973). In this model the calcined Mo or W was
assumed to be bonded to the surface of the alumina forming a monolayer. Interaction of
the Mo with the alumina was believed to occur via oxygen bridges resulting from
reaction with surface OH groups. Co or Ni is present in the tetrahedral positions of the
alumina support and stabilizes the Mo or W monolayer. The catalysts monolayer model
is presented in Figure 2.12.
Figure 2.12 Schematic representation of the monolayer model (proposed by Schuit and Gates (1973)). 2.6.2 Intercalation Model
This model was initially developed by Voorhoeve and Stuiver (1971). Mo or W is
present in planes on the surface of the alumina carrier, each between two sulfur layers.
The Co or Ni ions or promoters occupy octahedral intercalation positions between the
MoS2 or WS2 planes. Later a pseudo-intercalation model was proposed by Farragher and
Cossee (1973, 1977). In this model the promoter atoms are located at the edges of the
MoS2 or WS2 planes. The intercalation and pseudo-intercalation models assume that the
active sites are related to three-dimensional MoS2 or WS2 structures. The model is
shown in Figure 2.13.
Co
O O
Mo
==S S
O O
Mo
==S S
CoCo
O O
Mo
==S S
O O
Mo
==S S
O O
Mo
==S S
O O
Mo
==S S
Co
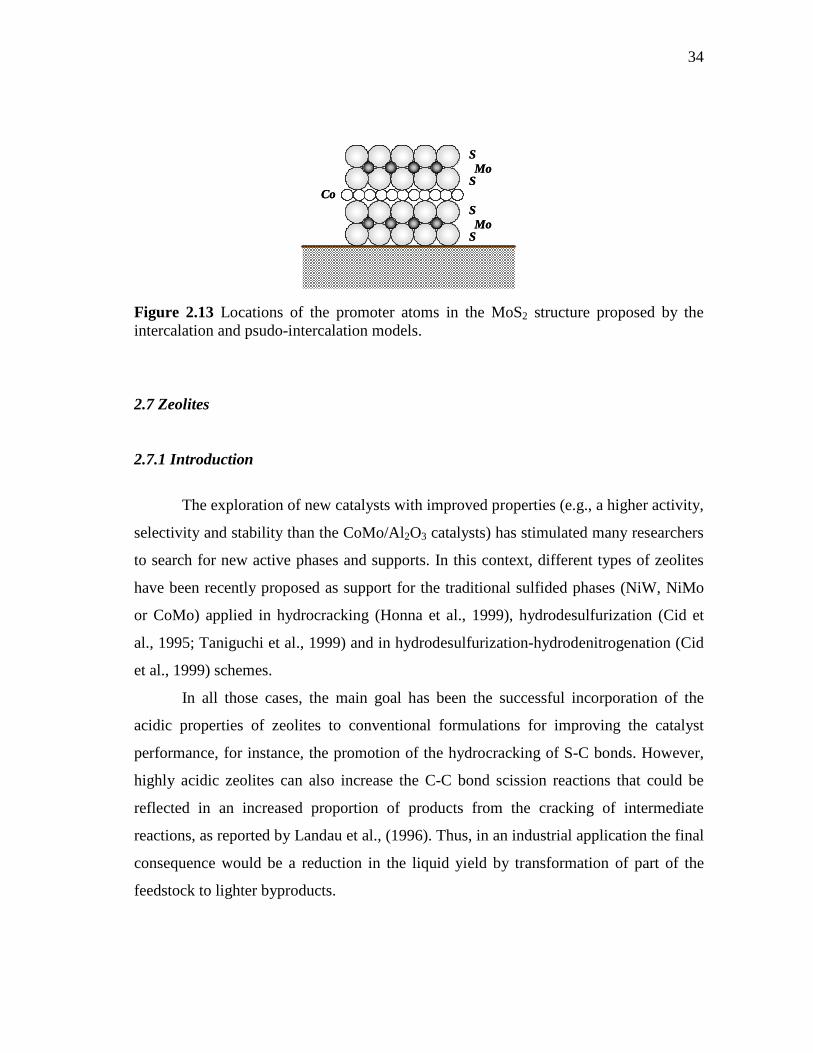
34
Figure 2.13 Locations of the promoter atoms in the MoS2 structure proposed by the intercalation and psudo-intercalation models.
2.7 Zeolites
2.7.1 Introduction
The exploration of new catalysts with improved properties (e.g., a higher activity,
selectivity and stability than the CoMo/Al2O3 catalysts) has stimulated many researchers
to search for new active phases and supports. In this context, different types of zeolites
have been recently proposed as support for the traditional sulfided phases (NiW, NiMo
or CoMo) applied in hydrocracking (Honna et al., 1999), hydrodesulfurization (Cid et
al., 1995; Taniguchi et al., 1999) and in hydrodesulfurization-hydrodenitrogenation (Cid
et al., 1999) schemes.
In all those cases, the main goal has been the successful incorporation of the
acidic properties of zeolites to conventional formulations for improving the catalyst
performance, for instance, the promotion of the hydrocracking of S-C bonds. However,
highly acidic zeolites can also increase the C-C bond scission reactions that could be
reflected in an increased proportion of products from the cracking of intermediate
reactions, as reported by Landau et al., (1996). Thus, in an industrial application the final
consequence would be a reduction in the liquid yield by transformation of part of the
feedstock to lighter byproducts.
CoS
SMo
S
SMo
CoS
SMo
S
SMo
35
Through careful control of acidic properties of the support cracking could be
avoided taking advantage of the ability of the acid sites of medium strength to isomerize
the methyl groups of very refractory heterocompounds (as 4,6-DMDBT) to positions of
decreased steric hindrance, then facilitating sulfur removal (Isoda et al., 2000).
Faujasite-type Y zeolites seem to be especially suitable for this application. It has
been reported (Li et al., 1999a; Li et al., 1999b; Li et al., 2000) that the relatively large
pores of Y zeolite, the strong surface Brønsted acidity and high dispersion of the
supported sulfided NiMo phase increases the HDS activity. Another approach is the
modification of the alumina support by the introduction of zeolitic materials (Zanibelli et
al., 1999). In this context, an improved performance in the hydrodesulfurization of
dibenzothiophene is observed when a zeolite is added to the conventional NiMo
supported on Al2O3 formulation (Li et al., 1999).
A successful application of HY zeolite to CoMoP/Al2O3 catalysts has resulted
because of the industrial development of the C603A catalyst (patented by Cosmo Oil
Company). The catalyst exhibited considerably higher HDS activity and stability than
the conventional sulfided CoMo/alumina catalyst in the hydrotreatment of straight run
gas oil (Fujikawa et al., 1998).
A proposal for designing sulfur resistant noble metal hydrotreating catalyst based on
the concept of use of zeolites as support and on the roles of shape selectivity, hydrogen
spillover and type of sulfur resistance has been reported (Song, 1999). Although the
concept is not yet fully established, this is a promising direction of research for
developing new catalysts for low-temperature hydrogenation and desulfurization of
distillate fuels.
On the other hand, zeolite supports can be used to prepare bimodal distributions of
noble-metal particles. Some metals are located in small pore openings (<5 Å), whereas
others will be contained in large pore openings (>6 Å). Studies performed in the
University of Pennsylvania (Song, 1999) have shown that “diffusion of organosulfur
compounds (as thiophenic molecules) into the small pores would be inhibited by size
(shape-selective exclusion). The large pores would preferentially allow fast diffusion and
36
reaction of bulky polycyclic aromatic and sulfur compounds. The thiophenic molecules
could enter the large pores, but not the small pores. However, hydrogen molecules can
readily enter both sizes of pores, dissociatively adsorb on metal contained within, and be
transported between pore systems by spillover. When the metal in the large pores
becomes inactivated by adsorbed sulfur, spillover hydrogen could recover the poisoned
metal sites by eliminating of R-S-R and R-SH compounds.
2.7.2 Shape-selectivity
Zeolites have the ability to act as catalysts for chemical reactions which take place
within the internal cavities. An important class of reactions is that catalyzed by
hydrogen-exchanged zeolites, whose framework-bound protons give rise to very high
acidity. This is exploited in many organic reactions, including cracking of crude oil
fractions, isomerisation and fuel synthesis.
Behind all these types of reaction is the unique microporous nature of zeolites, where
the shape and size of a particular pore system exerts a steric influence on the reaction,
controlling the access of reactants and products. Thus zeolites are often said to act as
shape-selective catalysts.
2.7.3 “Y” Zeolite (Faujasite) as Support of HDS Catalysts
Support materials used for hydrotreatment catalyst are alumina, silica-alumina, silica
and zeolites. The combination used depends on its application and desired
activity/selectivity. Generally zeolites and/or amorphous silica-alumina’s supply acidic
functions for cracking. Applying metal particles in acidic zeolites provides the
opportunity to combine the HDS and cracking functions in one catalyst when a HDN
function is present to prevent poisoning of the acidic sites present. In view of the above,
an important point here is the possibility to prepare catalysts containing metal particles
inside the zeolite cavities (e.g. the supercage of zeolite Y).
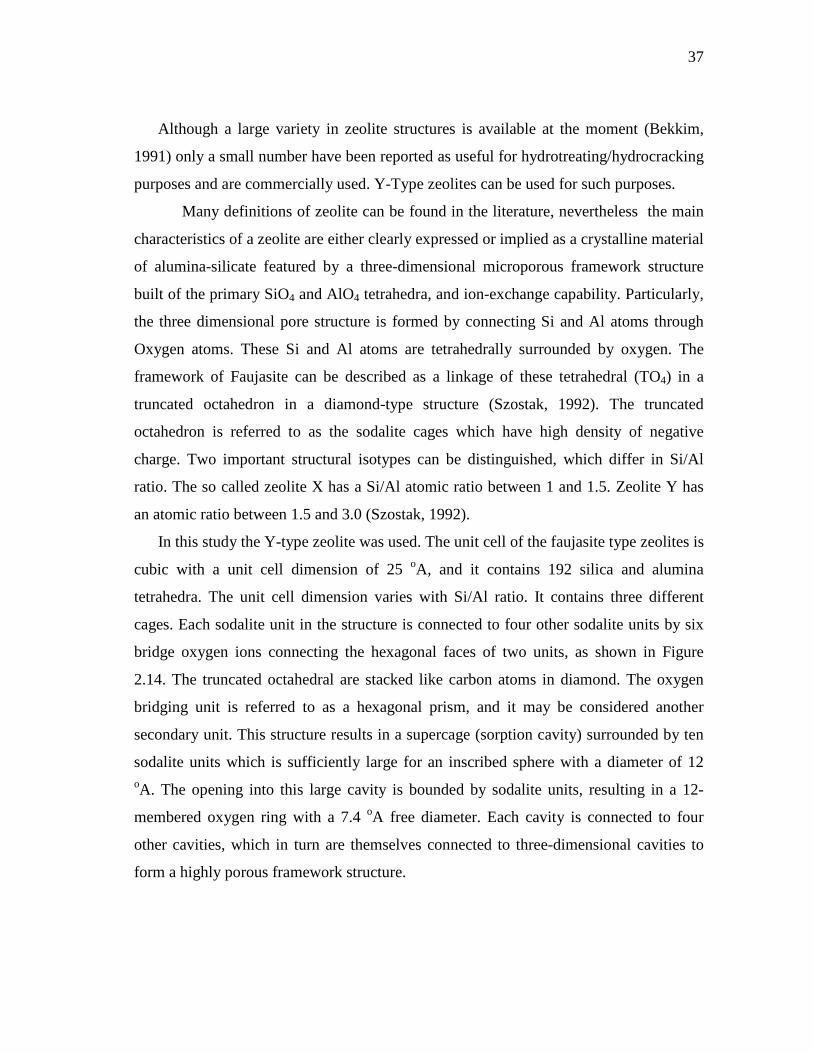
37
Although a large variety in zeolite structures is available at the moment (Bekkim,
1991) only a small number have been reported as useful for hydrotreating/hydrocracking
purposes and are commercially used. Y-Type zeolites can be used for such purposes.
Many definitions of zeolite can be found in the literature, nevertheless the main
characteristics of a zeolite are either clearly expressed or implied as a crystalline material
of alumina-silicate featured by a three-dimensional microporous framework structure
built of the primary SiO4 and AlO4 tetrahedra, and ion-exchange capability. Particularly,
the three dimensional pore structure is formed by connecting Si and Al atoms through
Oxygen atoms. These Si and Al atoms are tetrahedrally surrounded by oxygen. The
framework of Faujasite can be described as a linkage of these tetrahedral (TO4) in a
truncated octahedron in a diamond-type structure (Szostak, 1992). The truncated
octahedron is referred to as the sodalite cages which have high density of negative
charge. Two important structural isotypes can be distinguished, which differ in Si/Al
ratio. The so called zeolite X has a Si/Al atomic ratio between 1 and 1.5. Zeolite Y has
an atomic ratio between 1.5 and 3.0 (Szostak, 1992).
In this study the Y-type zeolite was used. The unit cell of the faujasite type zeolites is
cubic with a unit cell dimension of 25 oA, and it contains 192 silica and alumina
tetrahedra. The unit cell dimension varies with Si/Al ratio. It contains three different
cages. Each sodalite unit in the structure is connected to four other sodalite units by six
bridge oxygen ions connecting the hexagonal faces of two units, as shown in Figure
2.14. The truncated octahedral are stacked like carbon atoms in diamond. The oxygen
bridging unit is referred to as a hexagonal prism, and it may be considered another
secondary unit. This structure results in a supercage (sorption cavity) surrounded by ten
sodalite units which is sufficiently large for an inscribed sphere with a diameter of 12 oA. The opening into this large cavity is bounded by sodalite units, resulting in a 12-
membered oxygen ring with a 7.4 oA free diameter. Each cavity is connected to four
other cavities, which in turn are themselves connected to three-dimensional cavities to
form a highly porous framework structure.
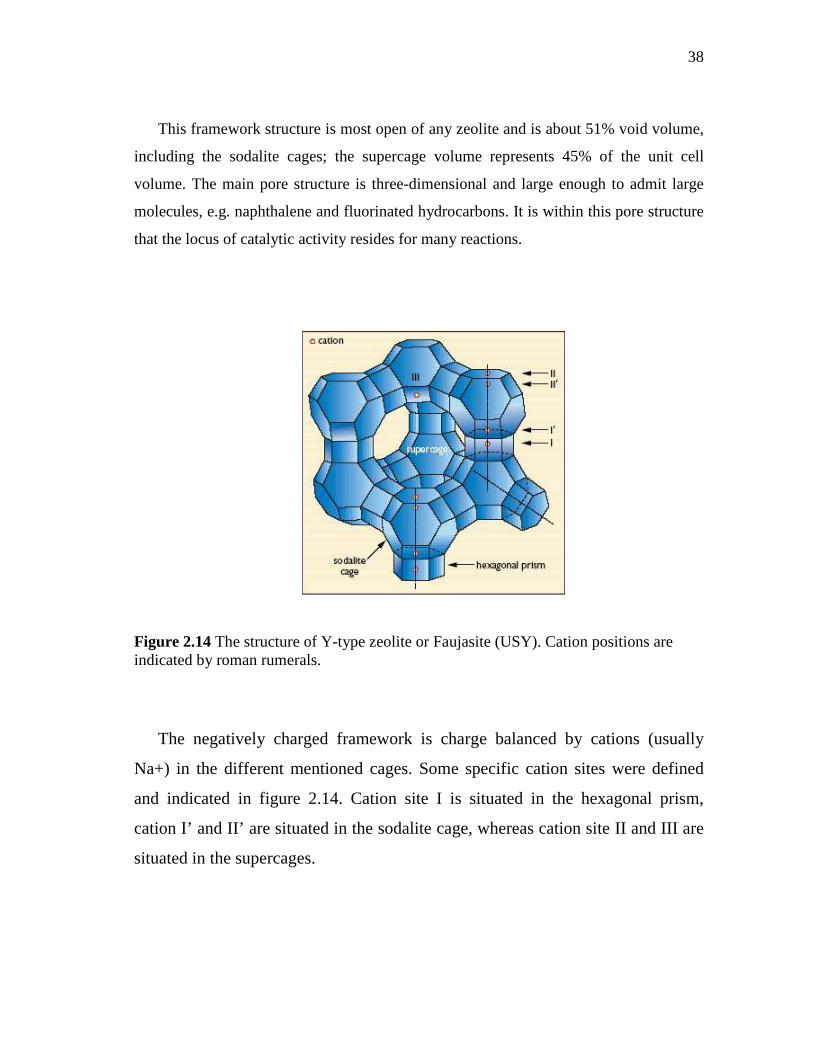
38
This framework structure is most open of any zeolite and is about 51% void volume,
including the sodalite cages; the supercage volume represents 45% of the unit cell
volume. The main pore structure is three-dimensional and large enough to admit large
molecules, e.g. naphthalene and fluorinated hydrocarbons. It is within this pore structure
that the locus of catalytic activity resides for many reactions.
Figure 2.14 The structure of Y-type zeolite or Faujasite (USY). Cation positions are indicated by roman rumerals.
The negatively charged framework is charge balanced by cations (usually
Na+) in the different mentioned cages. Some specific cation sites were defined
and indicated in figure 2.14. Cation site I is situated in the hexagonal prism,
cation I’ and II’ are situated in the sodalite cage, whereas cation site II and III are
situated in the supercages.
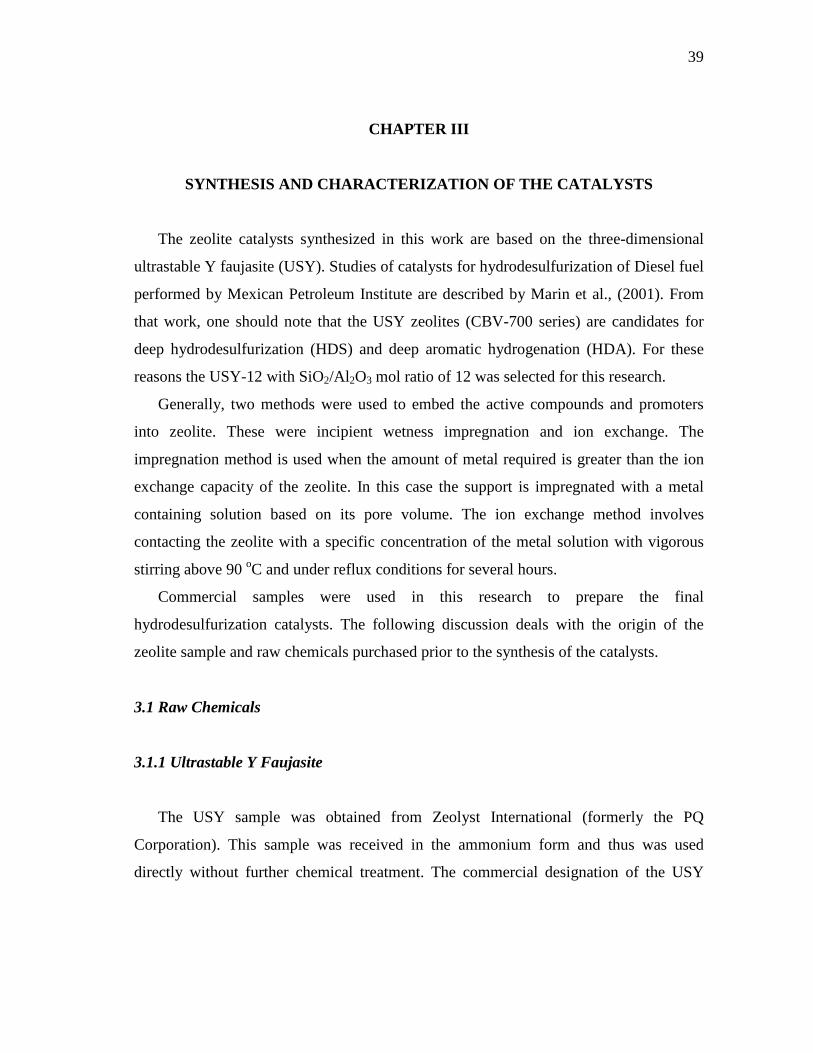
39
CHAPTER III
SYNTHESIS AND CHARACTERIZATION OF THE CATALYSTS
The zeolite catalysts synthesized in this work are based on the three-dimensional
ultrastable Y faujasite (USY). Studies of catalysts for hydrodesulfurization of Diesel fuel
performed by Mexican Petroleum Institute are described by Marin et al., (2001). From
that work, one should note that the USY zeolites (CBV-700 series) are candidates for
deep hydrodesulfurization (HDS) and deep aromatic hydrogenation (HDA). For these
reasons the USY-12 with SiO2/Al2O3 mol ratio of 12 was selected for this research.
Generally, two methods were used to embed the active compounds and promoters
into zeolite. These were incipient wetness impregnation and ion exchange. The
impregnation method is used when the amount of metal required is greater than the ion
exchange capacity of the zeolite. In this case the support is impregnated with a metal
containing solution based on its pore volume. The ion exchange method involves
contacting the zeolite with a specific concentration of the metal solution with vigorous
stirring above 90 oC and under reflux conditions for several hours.
Commercial samples were used in this research to prepare the final
hydrodesulfurization catalysts. The following discussion deals with the origin of the
zeolite sample and raw chemicals purchased prior to the synthesis of the catalysts.
3.1 Raw Chemicals
3.1.1 Ultrastable Y Faujasite
The USY sample was obtained from Zeolyst International (formerly the PQ
Corporation). This sample was received in the ammonium form and thus was used
directly without further chemical treatment. The commercial designation of the USY
40
sample and its properties are listed in Table 3.1 along with the nomenclature used in this
work.
Table 3.1 USY sample and their manufacture properties Commercial Name given by Zeolyst Intl. CBV-712 Sample Name used in this Study USY-12 Nominal Cation form Ammonium SiO2/Al2O3, mole ratio 12 Na2O weight % 0.05 Unit Cell Size, Å 24.35 Surface Area m2/g 730 3.1.2 Chemicals
All chemicals used as active compounds and promoters in the preparations of
catalyst were of A.C.S reagent grade. The trade name of these compounds and the purity
is listed in Table 3.2.
Table 3.2 List of chemicals and their assay data Trade name Formula Purity Brand
Tetraammineplatinum (II) chloride hydrate
Pt(NH3)4Cl2.H2O 98% ALDRICH 27,590-5
Tetraamminepaladium (II) chloride monohydrate
Pd(NH3)4Cl2.H2O 98% ALDRICH 20,582-6
Nickel (II) carbonate hydroxide tetrahidrate
2NiCO3·3Ni(OH)2·XH2O 100 ALDRICH 33,977-6
Nickel (II) acetate tetrahydrate
Ni(CH3CO2)2·4H2O 98% ALDRICH 24,406-6
Cobalt (II) acetate tetrahydrate
Co(CH3CO2)2·4H2O 100 ALDRICH 20,839-6
Molybdenum (VI) oxide MoO3 99.5+% ALDRICH 26,785-6 Ammonium hydroxide NH4OH 28-30%
asNH3 CEM, AX1303P-1
Citric Acid anhydrous HOC(CO2H)(CH2CO2H)2 100 J.T. Baker, O122-01 Phosphoric acid H3PO4 85%p CEM, PX0995-14
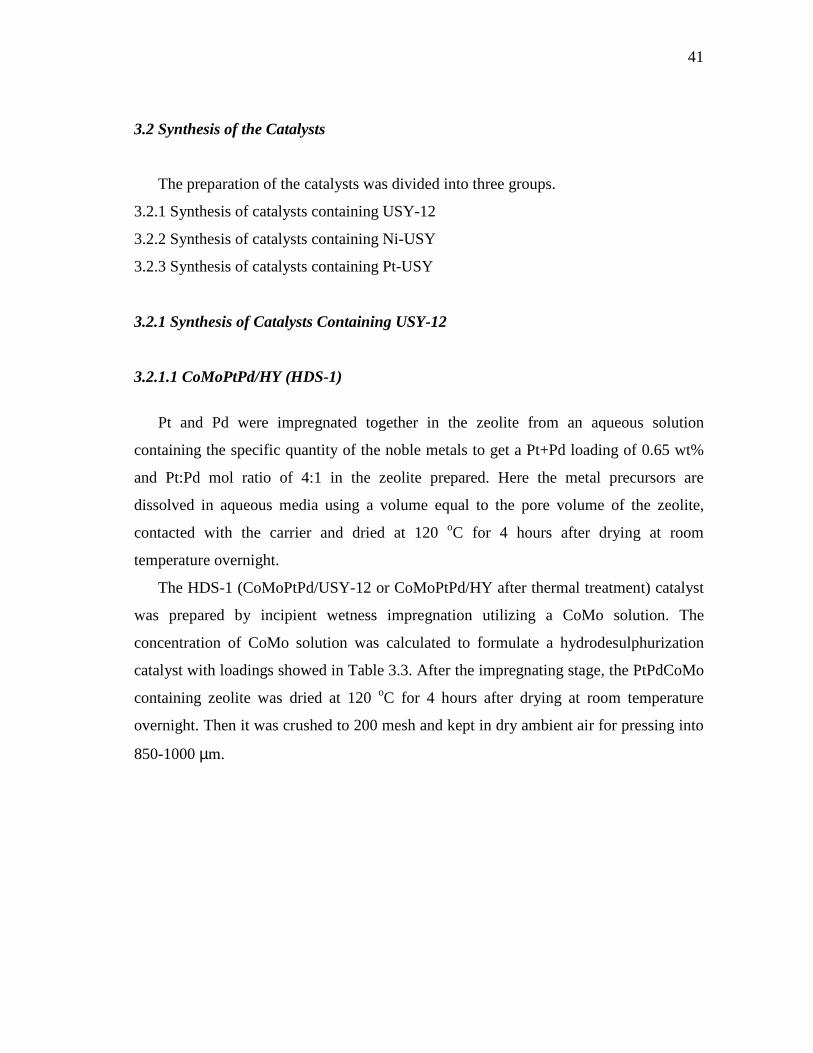
41
3.2 Synthesis of the Catalysts
The preparation of the catalysts was divided into three groups.
3.2.1 Synthesis of catalysts containing USY-12
3.2.2 Synthesis of catalysts containing Ni-USY
3.2.3 Synthesis of catalysts containing Pt-USY
3.2.1 Synthesis of Catalysts Containing USY-12
3.2.1.1 CoMoPtPd/HY (HDS-1)
Pt and Pd were impregnated together in the zeolite from an aqueous solution
containing the specific quantity of the noble metals to get a Pt+Pd loading of 0.65 wt%
and Pt:Pd mol ratio of 4:1 in the zeolite prepared. Here the metal precursors are
dissolved in aqueous media using a volume equal to the pore volume of the zeolite,
contacted with the carrier and dried at 120 oC for 4 hours after drying at room
temperature overnight.
The HDS-1 (CoMoPtPd/USY-12 or CoMoPtPd/HY after thermal treatment) catalyst
was prepared by incipient wetness impregnation utilizing a CoMo solution. The
concentration of CoMo solution was calculated to formulate a hydrodesulphurization
catalyst with loadings showed in Table 3.3. After the impregnating stage, the PtPdCoMo
containing zeolite was dried at 120 oC for 4 hours after drying at room temperature
overnight. Then it was crushed to 200 mesh and kept in dry ambient air for pressing into
850-1000 µm.
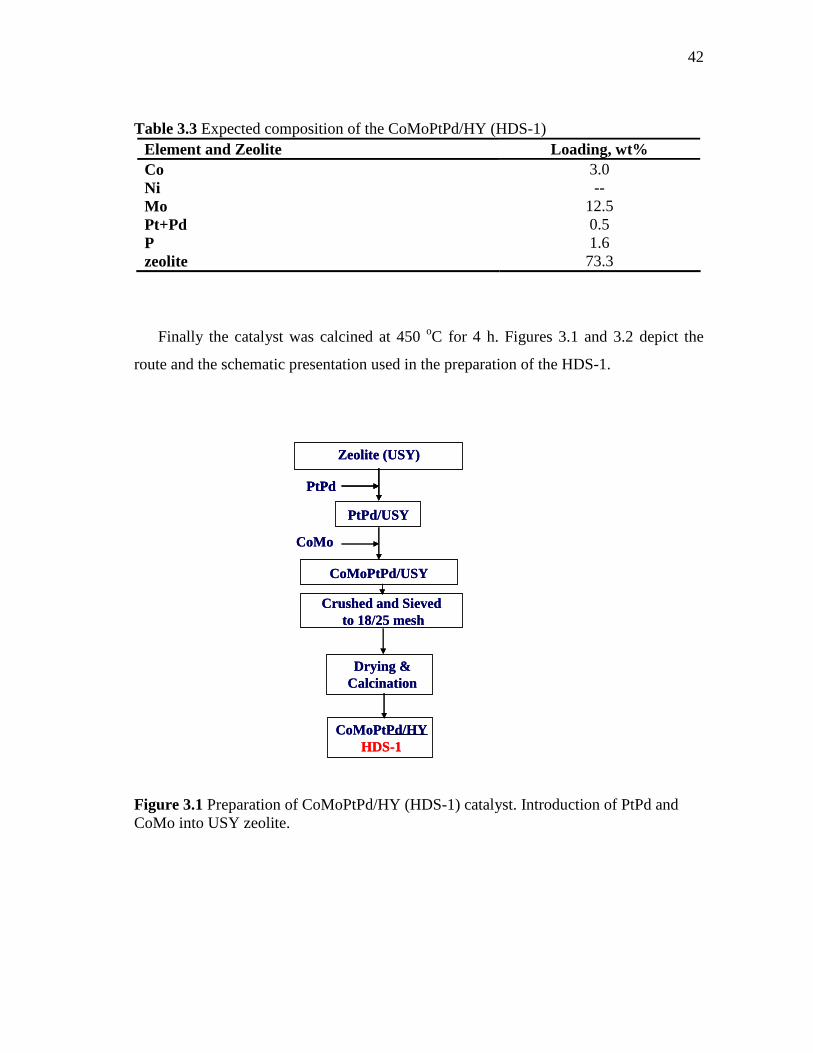
42
Table 3.3 Expected composition of the CoMoPtPd/HY (HDS-1) Element and Zeolite Loading, wt% Co 3.0 Ni -- Mo 12.5 Pt+Pd 0.5 P 1.6 zeolite 73.3
Finally the catalyst was calcined at 450 oC for 4 h. Figures 3.1 and 3.2 depict the
route and the schematic presentation used in the preparation of the HDS-1.
Figure 3.1 Preparation of CoMoPtPd/HY (HDS-1) catalyst. Introduction of PtPd and CoMo into USY zeolite.
PtPd/USY
CoMoPtPd/USY
Drying & Calcination
Crushed and Sievedto 18/25 mesh
Zeolite (USY)
PtPd
CoMo
CoMoPtPd/HYHDS-1
PtPd/USY
CoMoPtPd/USY
Drying & Calcination
Crushed and Sievedto 18/25 mesh
Zeolite (USY)
PtPdPtPd
CoMo
CoMoPtPd/HYHDS-1
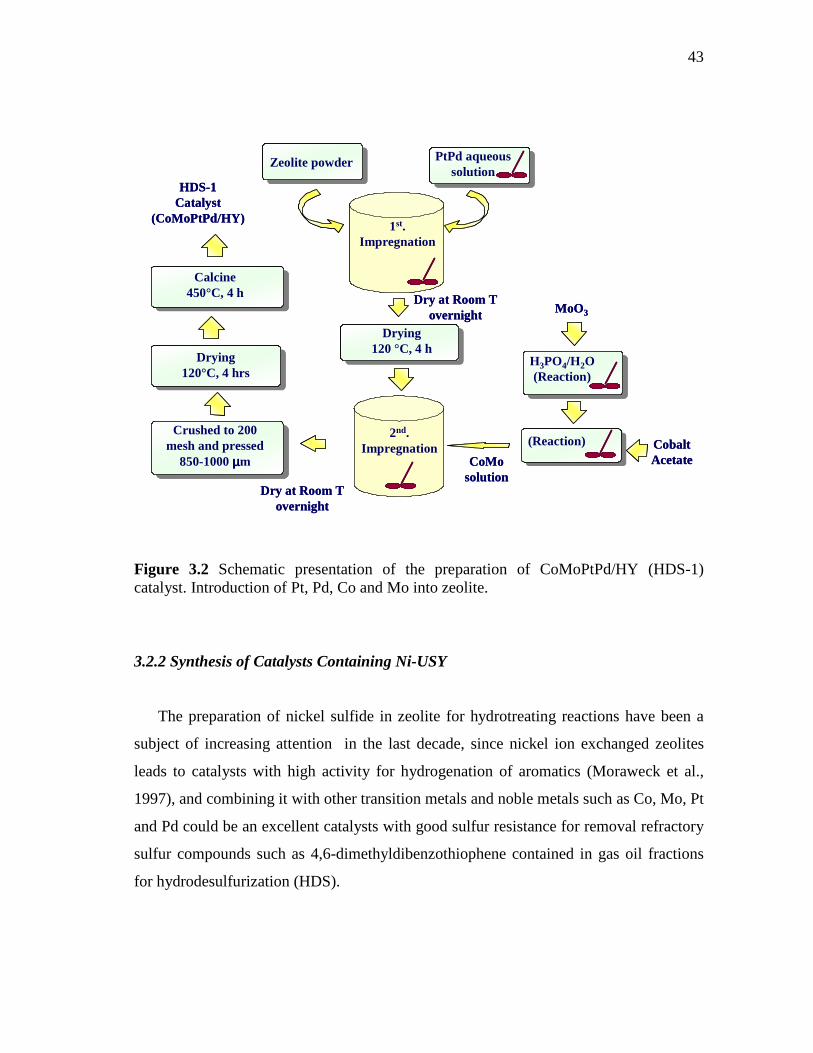
43
Figure 3.2 Schematic presentation of the preparation of CoMoPtPd/HY (HDS-1) catalyst. Introduction of Pt, Pd, Co and Mo into zeolite.
3.2.2 Synthesis of Catalysts Containing Ni-USY
The preparation of nickel sulfide in zeolite for hydrotreating reactions have been a
subject of increasing attention in the last decade, since nickel ion exchanged zeolites
leads to catalysts with high activity for hydrogenation of aromatics (Moraweck et al.,
1997), and combining it with other transition metals and noble metals such as Co, Mo, Pt
and Pd could be an excellent catalysts with good sulfur resistance for removal refractory
sulfur compounds such as 4,6-dimethyldibenzothiophene contained in gas oil fractions
for hydrodesulfurization (HDS).
(Reaction)
H3PO4/H2O (Reaction)
MoO3
CobaltAcetate
Crushed to 200 mesh and pressed
850-1000 µµµµm
Drying120°C, 4 hrs
PtPd aqueoussolution
1st. Impregnation
Drying120 °C, 4 h
2nd. Impregnation
Calcine450°C, 4 h Dry at Room T
overnight
HDS-1Catalyst
(CoMoPtPd/HY)
CoMo solution
Dry at Room T overnight
Zeolite powder
44
In this section, Ni containing zeolite (Ni-USY) was prepared by ion exchange using
the ammonium-zeolite USY-12 with SiO2/Al 2O3 mole ratio of 12 as template. The USY-
12 zeolite was modified in the laboratory. The modification involved ion exchange of
the as received zeolite in order to obtain a sample with Nickel and different acidic
properties. The ion exchange using a nickel salt was performed on the USY zeolite
sample prior to introduce Pt, Pd, Co and Mo. The nickel salt used in the ion exchange
was Nickel (II) acetate tetrahydrate (Ni(CH3CO2)2·4H2O), herein referred to as Nickel
acetate. The ion exchange procedure involved the addition of the zeolite to a solution of
nickel acetate with the appropriate concentration. The zeolite was left in contact with the
aqueous solution for 66 hr at 98 oC with stirring and under reflux conditions. The pH
was of 4.3. Following the ion exchange, the Ni-USY was dried at 120 oC for 4 hr and
kept in dry ambient conditions after drying at room temperature overnight. Figure 3.3
illustrates the ion exchange procedure
Two samples of the Ni-USY were taken for characterization. The first sample was
calcined in air at 450 oC during 4 h for analysis of metals content. The second sample,
which was pressed and crushed into 850-1000 µm before calcination, was used for the
characterization of its physical properties.
3.2.2.1 Synthesis of CoMoPtPd/Ni-HY (HDS-3) Catalyst
To prepare the HDS-3 catalyst a combination of ion exchange with incipient wetness
impregnation method was used.
Because the Ni-USY zeolite contained around 13.6 wt % Ni (according to
calculation), PtPd were introduced by incipient wetness impregnation of a quantity
(82%) of fresh USY-12 before the impregnation of CoMo solution. The solutions of
PtPd and CoMo were calculated to get the composition shown in Table 3.4.
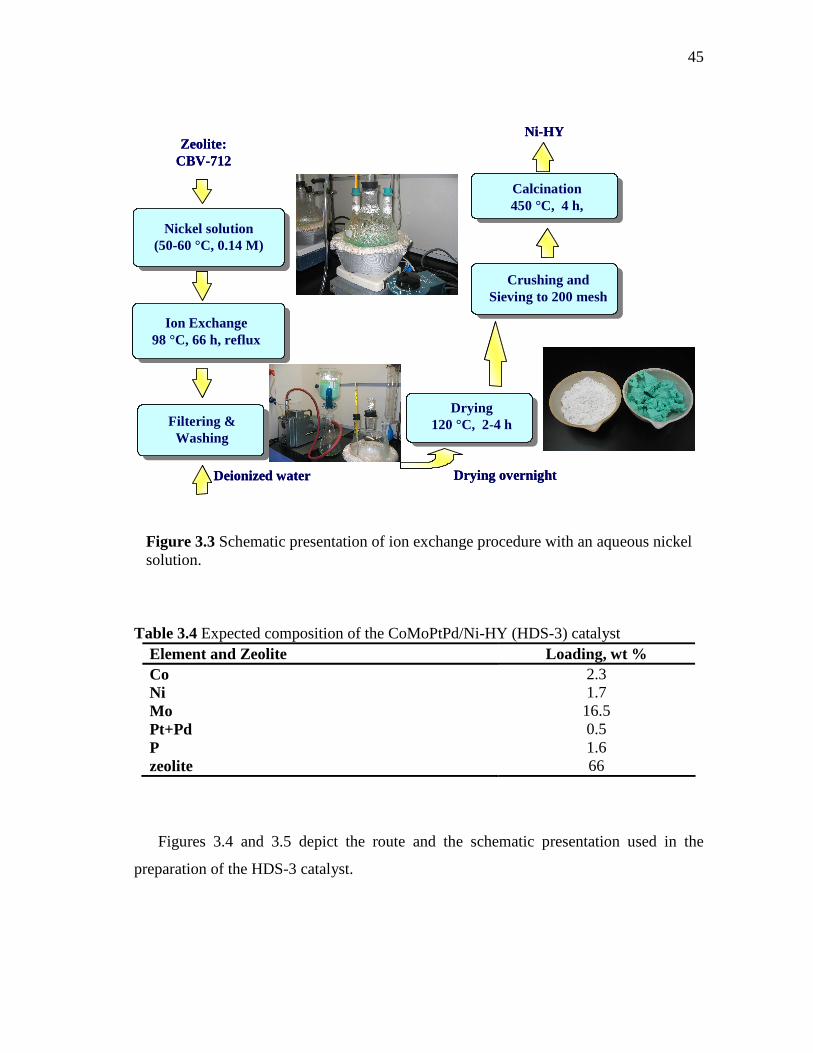
45
Figure 3.3 Schematic presentation of ion exchange procedure with an aqueous nickel solution.
Table 3.4 Expected composition of the CoMoPtPd/Ni-HY (HDS-3) catalyst Element and Zeolite Loading, wt % Co 2.3 Ni 1.7 Mo 16.5 Pt+Pd 0.5 P 1.6 zeolite 66
Figures 3.4 and 3.5 depict the route and the schematic presentation used in the
preparation of the HDS-3 catalyst.
Ion Exchange98 °C, 66 h, reflux
Nickel solution(50-60 °C, 0.14 M)
Zeolite: CBV-712
Drying120 °C, 2-4 h
Crushing and Sieving to 200 mesh
Filtering & Washing
Deionized water
Calcination450 °C, 4 h,
Drying overnight
Ni-HY
Ion Exchange98 °C, 66 h, reflux
Nickel solution(50-60 °C, 0.14 M)
Zeolite: CBV-712
Drying120 °C, 2-4 h
Crushing and Sieving to 200 mesh
Filtering & Washing
Deionized water
Calcination450 °C, 4 h,
Drying overnight
Ni-HY
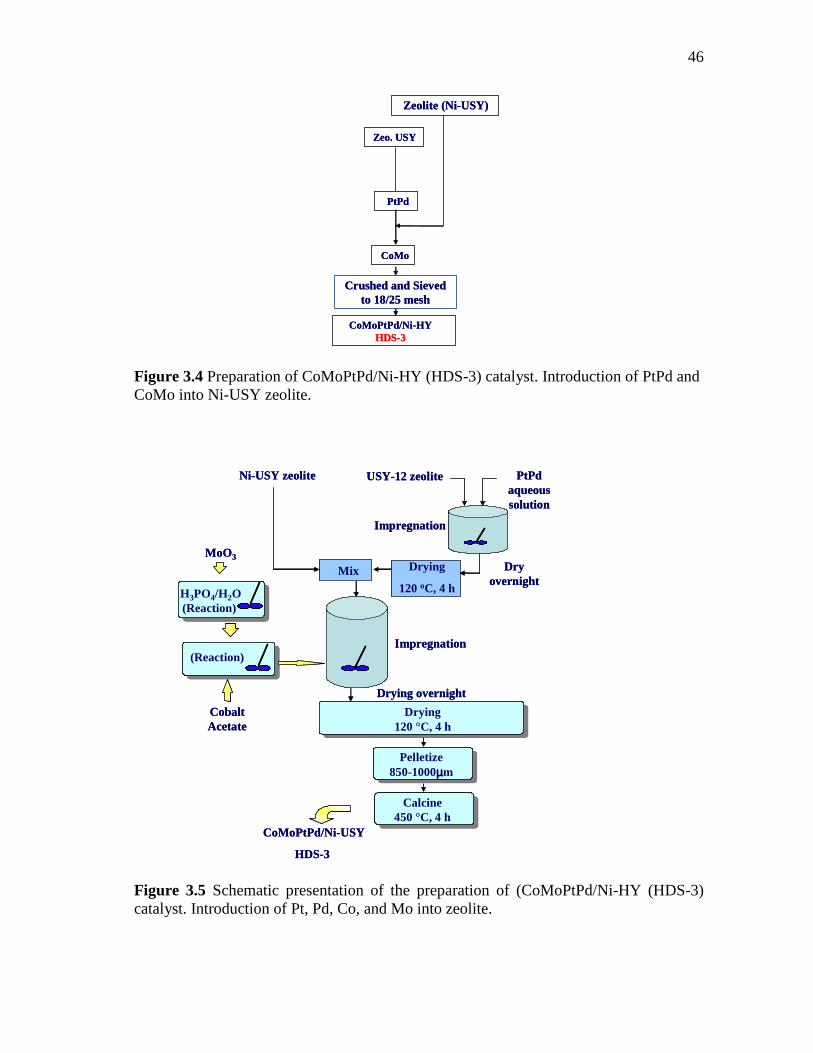
46
Figure 3.4 Preparation of CoMoPtPd/Ni-HY (HDS-3) catalyst. Introduction of PtPd and CoMo into Ni-USY zeolite. Figure 3.5 Schematic presentation of the preparation of (CoMoPtPd/Ni-HY (HDS-3) catalyst. Introduction of Pt, Pd, Co, and Mo into zeolite.
PtPd
CoMo
CoMoPtPd/Ni-HYHDS-3
Zeolite (Ni-USY)
Zeo. USY
Crushed and Sieved to 18/25 mesh
PtPd
CoMo
CoMoPtPd/Ni-HYHDS-3
Zeolite (Ni-USY)
Zeo. USY
Crushed and Sieved to 18/25 mesh
Ni-USY zeolite USY-12 zeolite PtPdaqueous solution
Impregnation
Dryovernight
Drying
120 oC, 4 hMix
Drying120 °C, 4 h
Pelletize850-1000µµµµm
Calcine450 °C, 4 h
Drying overnight
(Reaction)
H3PO4/H2O(Reaction)
MoO3
Impregnation
CobaltAcetate
CoMoPtPd/Ni-USY
HDS-3
Ni-USY zeolite USY-12 zeolite PtPdaqueous solution
Impregnation
Dryovernight
Drying
120 oC, 4 hMix
Drying120 °C, 4 h
Pelletize850-1000µµµµm
Calcine450 °C, 4 h
Drying overnight
(Reaction)
H3PO4/H2O(Reaction)
MoO3
Impregnation
CobaltAcetate
CoMoPtPd/Ni-USY
HDS-3
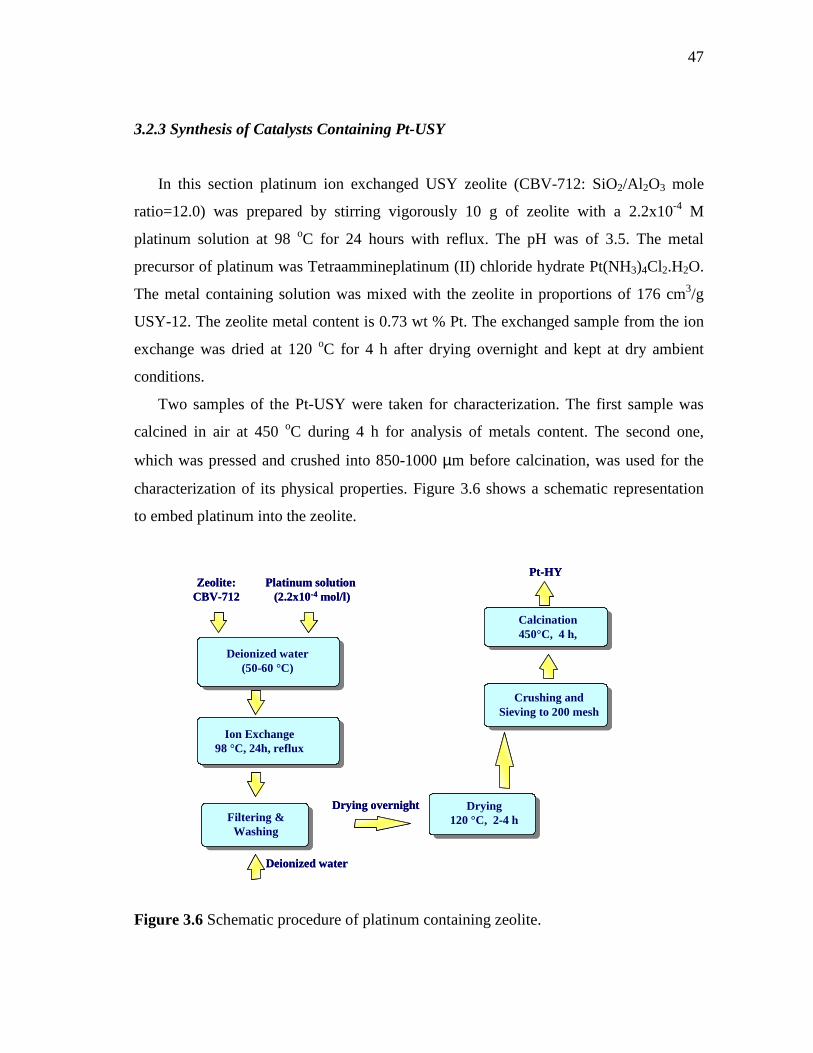
47
3.2.3 Synthesis of Catalysts Containing Pt-USY
In this section platinum ion exchanged USY zeolite (CBV-712: SiO2/Al 2O3 mole
ratio=12.0) was prepared by stirring vigorously 10 g of zeolite with a 2.2x10⁻⁴ M
platinum solution at 98 oC for 24 hours with reflux. The pH was of 3.5. The metal
precursor of platinum was Tetraammineplatinum (II) chloride hydrate Pt(NH3)4Cl2.H2O.
The metal containing solution was mixed with the zeolite in proportions of 176 cm3/g
USY-12. The zeolite metal content is 0.73 wt % Pt. The exchanged sample from the ion
exchange was dried at 120 oC for 4 h after drying overnight and kept at dry ambient
conditions.
Two samples of the Pt-USY were taken for characterization. The first sample was
calcined in air at 450 oC during 4 h for analysis of metals content. The second one,
which was pressed and crushed into 850-1000 µm before calcination, was used for the
characterization of its physical properties. Figure 3.6 shows a schematic representation
to embed platinum into the zeolite.
Figure 3.6 Schematic procedure of platinum containing zeolite.
Ion Exchange98 °C, 24h, reflux
Deionized water(50-60 °C)
Zeolite: CBV-712
Drying120 °C, 2-4 h
Crushing and Sieving to 200 mesh
Filtering & Washing
Deionized water
Calcination450°C, 4 h,
Drying overnight
Platinum solution(2.2x10⁻⁴ mol/l)
Pt-HY
Ion Exchange98 °C, 24h, reflux
Deionized water(50-60 °C)
Zeolite: CBV-712
Drying120 °C, 2-4 h
Crushing and Sieving to 200 mesh
Filtering & Washing
Deionized water
Calcination450°C, 4 h,
Drying overnight
Platinum solution(2.2x10⁻⁴ mol/l)
Pt-HY
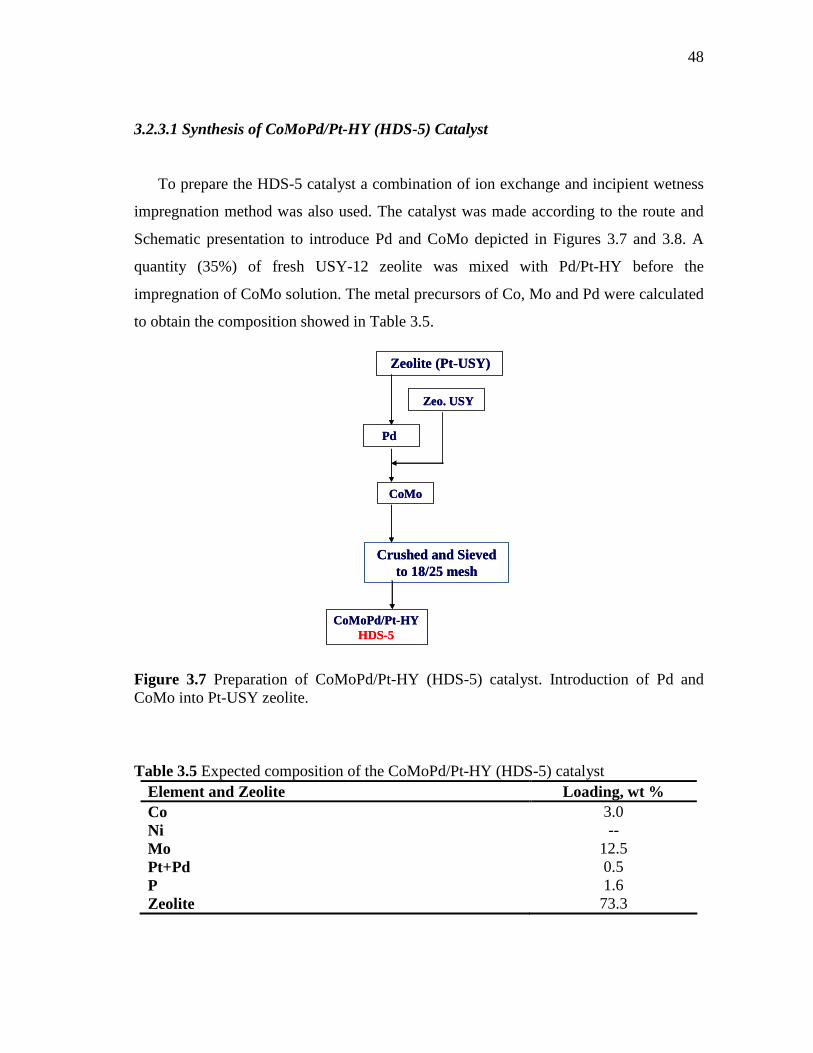
48
3.2.3.1 Synthesis of CoMoPd/Pt-HY (HDS-5) Catalyst
To prepare the HDS-5 catalyst a combination of ion exchange and incipient wetness
impregnation method was also used. The catalyst was made according to the route and
Schematic presentation to introduce Pd and CoMo depicted in Figures 3.7 and 3.8. A
quantity (35%) of fresh USY-12 zeolite was mixed with Pd/Pt-HY before the
impregnation of CoMo solution. The metal precursors of Co, Mo and Pd were calculated
to obtain the composition showed in Table 3.5.
Figure 3.7 Preparation of CoMoPd/Pt-HY (HDS-5) catalyst. Introduction of Pd and CoMo into Pt-USY zeolite.
Table 3.5 Expected composition of the CoMoPd/Pt-HY (HDS-5) catalyst Element and Zeolite Loading, wt % Co 3.0 Ni -- Mo 12.5 Pt+Pd 0.5 P 1.6 Zeolite 73.3
Pd
CoMo
CoMoPd/Pt-HYHDS-5
Zeolite (Pt-USY)
Zeo. USY
Crushed and Sieved to 18/25 mesh
Pd
CoMo
CoMoPd/Pt-HYHDS-5
Zeolite (Pt-USY)
Zeo. USY
Crushed and Sieved to 18/25 mesh
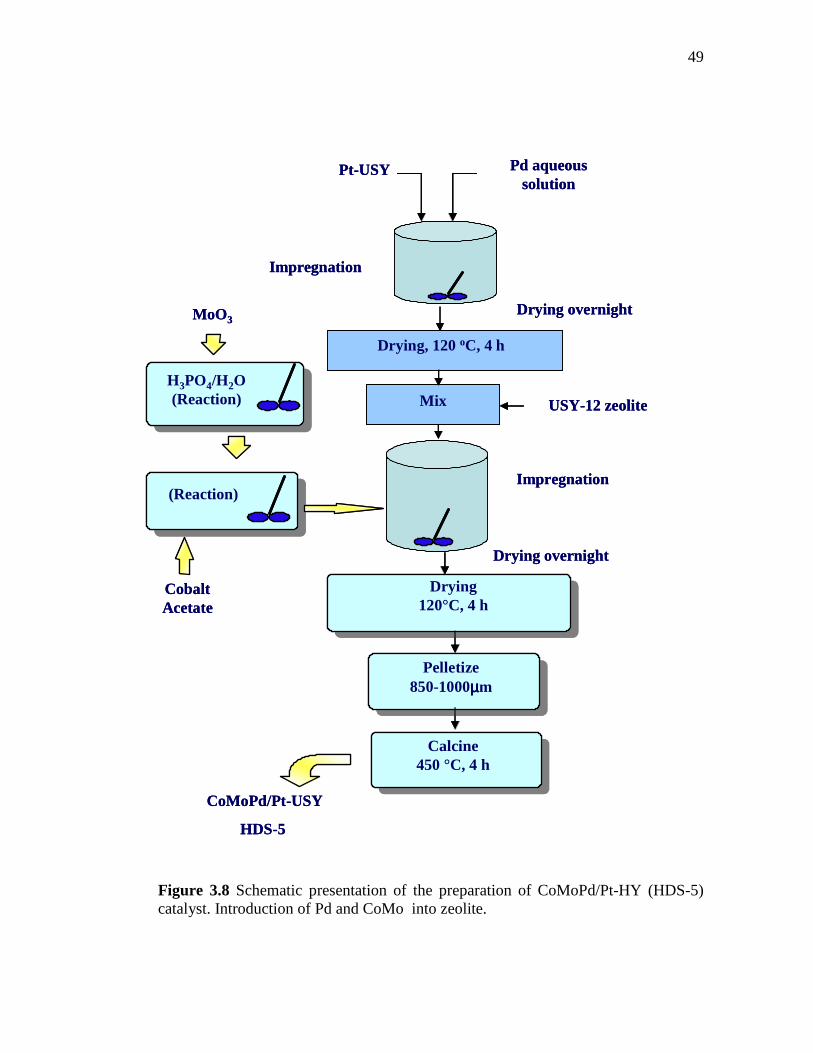
49
Figure 3.8 Schematic presentation of the preparation of CoMoPd/Pt-HY (HDS-5) catalyst. Introduction of Pd and CoMo into zeolite.
Pt-USY Pd aqueous solution
Impregnation
Drying overnight
Drying, 120 oC, 4 h
Drying120°C, 4 h
Pelletize850-1000µµµµm
Calcine450 °C, 4 h
Drying overnight
(Reaction)
H3PO4/H2O(Reaction)
MoO3
Impregnation
CobaltAcetate
CoMoPd/Pt-USY
HDS-5
Mix USY-12 zeolite
Pt-USY Pd aqueous solution
Impregnation
Drying overnight
Drying, 120 oC, 4 h
Drying120°C, 4 h
Pelletize850-1000µµµµm
Calcine450 °C, 4 h
Drying overnight
(Reaction)
H3PO4/H2O(Reaction)
MoO3
Impregnation
CobaltAcetate
CoMoPd/Pt-USY
HDS-5
Mix USY-12 zeolite
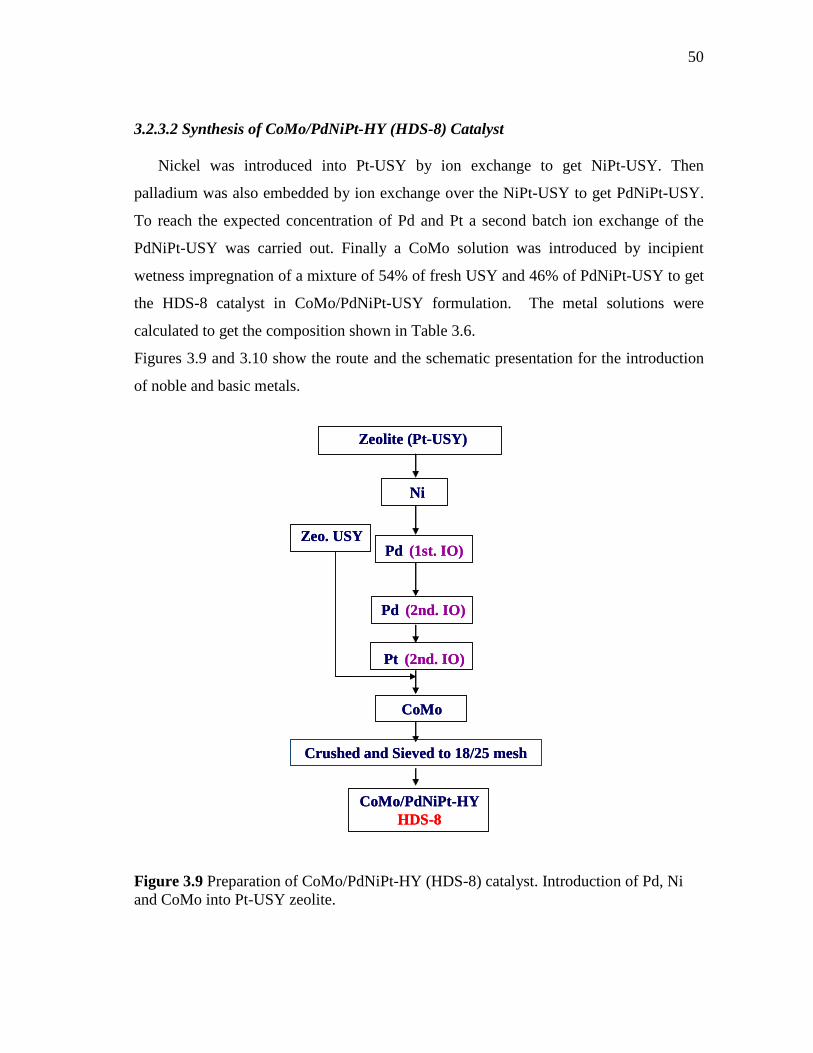
50
3.2.3.2 Synthesis of CoMo/PdNiPt-HY (HDS-8) Catalyst Nickel was introduced into Pt-USY by ion exchange to get NiPt-USY. Then
palladium was also embedded by ion exchange over the NiPt-USY to get PdNiPt-USY.
To reach the expected concentration of Pd and Pt a second batch ion exchange of the
PdNiPt-USY was carried out. Finally a CoMo solution was introduced by incipient
wetness impregnation of a mixture of 54% of fresh USY and 46% of PdNiPt-USY to get
the HDS-8 catalyst in CoMo/PdNiPt-USY formulation. The metal solutions were
calculated to get the composition shown in Table 3.6.
Figures 3.9 and 3.10 show the route and the schematic presentation for the introduction
of noble and basic metals.
Figure 3.9 Preparation of CoMo/PdNiPt-HY (HDS-8) catalyst. Introduction of Pd, Ni and CoMo into Pt-USY zeolite.
Pd (1st. IO)
CoMo
CoMo/PdNiPt-HYHDS-8
Zeolite (Pt-USY)
Crushed and Sieved to 18/25 mesh
Ni
Pd (2nd. IO)
Pt (2nd. IO)
Zeo. USYPd (1st. IO)
CoMo
CoMo/PdNiPt-HYHDS-8
Zeolite (Pt-USY)
Crushed and Sieved to 18/25 mesh
Ni
Pd (2nd. IO)
Pt (2nd. IO)
Zeo. USY
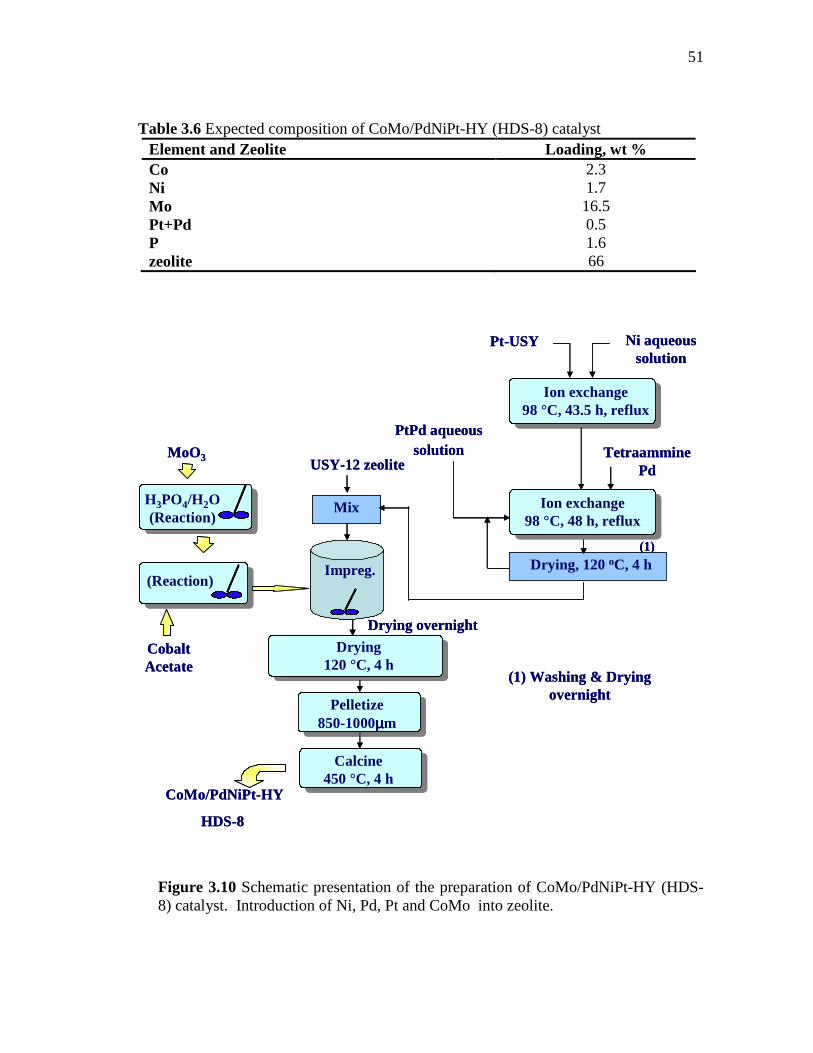
51
Table 3.6 Expected composition of CoMo/PdNiPt-HY (HDS-8) catalyst Element and Zeolite Loading, wt % Co 2.3 Ni 1.7 Mo 16.5 Pt+Pd 0.5 P 1.6 zeolite 66
Figure 3.10 Schematic presentation of the preparation of CoMo/PdNiPt-HY (HDS-8) catalyst. Introduction of Ni, Pd, Pt and CoMo into zeolite.
Pt-USY Ni aqueous solution
(1) Washing & Dryingovernight
Drying120 °C, 4 h
Pelletize850-1000µµµµm
Calcine450 °C, 4 h
Drying overnight
(Reaction)
H3PO4/H2O(Reaction)
MoO3
Impreg.
CobaltAcetate
CoMo/PdNiPt-HY
HDS-8
USY-12 zeolite
Ion exchange98 °C, 43.5 h, reflux
(1)Drying, 120 oC, 4 h
Ion exchange98 °C, 48 h, reflux
TetraamminePd
PtPd aqueoussolution
Mix
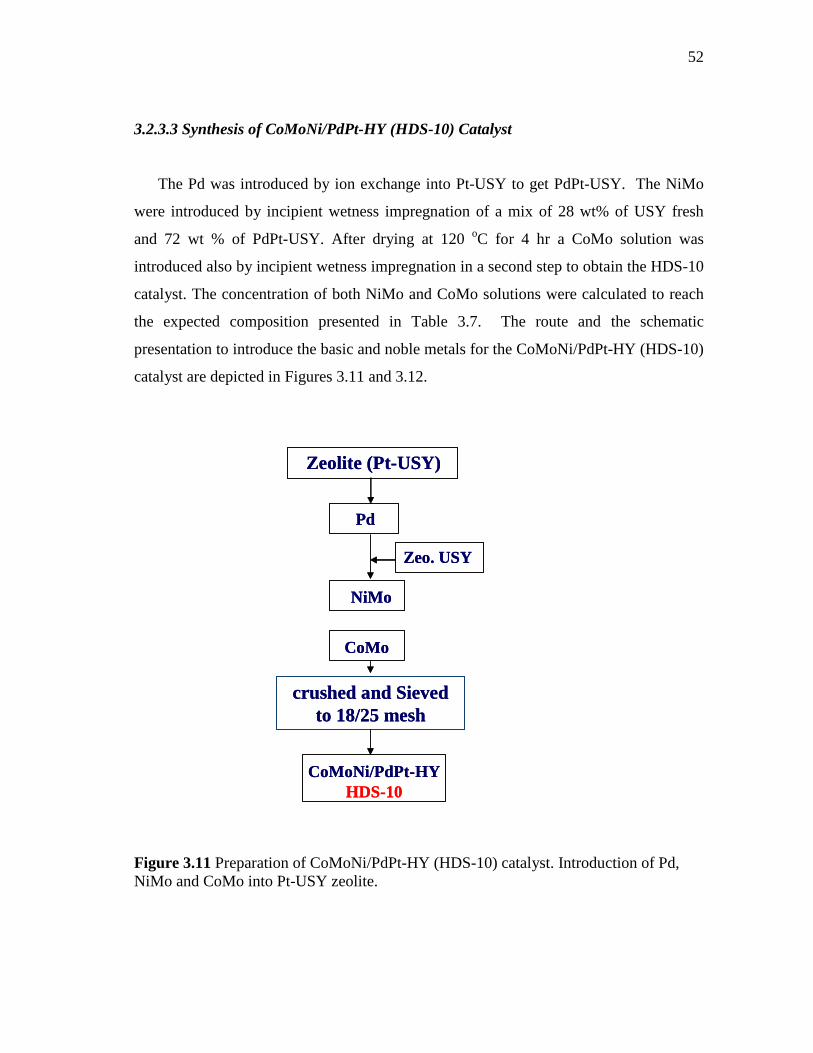
52
3.2.3.3 Synthesis of CoMoNi/PdPt-HY (HDS-10) Catalyst
The Pd was introduced by ion exchange into Pt-USY to get PdPt-USY. The NiMo
were introduced by incipient wetness impregnation of a mix of 28 wt% of USY fresh
and 72 wt % of PdPt-USY. After drying at 120 oC for 4 hr a CoMo solution was
introduced also by incipient wetness impregnation in a second step to obtain the HDS-10
catalyst. The concentration of both NiMo and CoMo solutions were calculated to reach
the expected composition presented in Table 3.7. The route and the schematic
presentation to introduce the basic and noble metals for the CoMoNi/PdPt-HY (HDS-10)
catalyst are depicted in Figures 3.11 and 3.12.
Figure 3.11 Preparation of CoMoNi/PdPt-HY (HDS-10) catalyst. Introduction of Pd, NiMo and CoMo into Pt-USY zeolite.
CoMo
CoMoNi/PdPt-HYHDS-10
Zeolite (Pt-USY)
crushed and Sieved to 18/25 mesh
NiMo
Pd
Zeo. USY
CoMo
CoMoNi/PdPt-HYHDS-10
Zeolite (Pt-USY)
crushed and Sieved to 18/25 mesh
NiMo
Pd
Zeo. USY
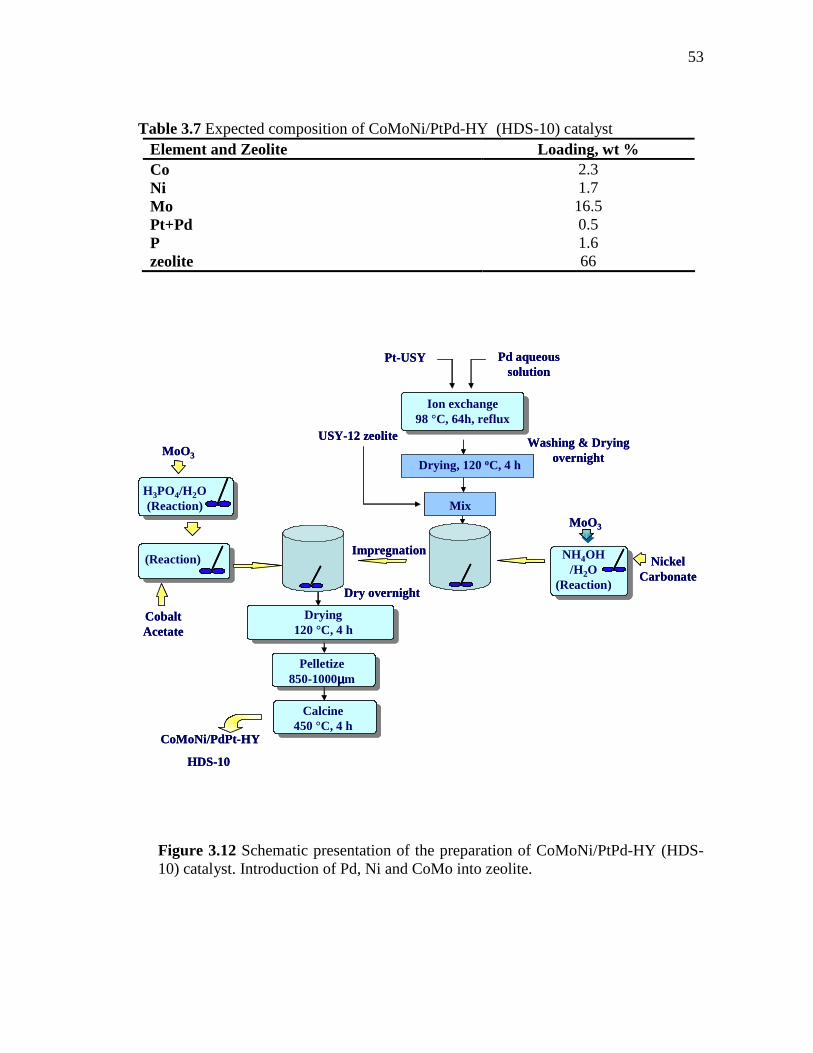
53
Table 3.7 Expected composition of CoMoNi/PtPd-HY (HDS-10) catalyst Element and Zeolite Loading, wt % Co 2.3 Ni 1.7 Mo 16.5 Pt+Pd 0.5 P 1.6 zeolite 66
Figure 3.12 Schematic presentation of the preparation of CoMoNi/PtPd-HY (HDS-10) catalyst. Introduction of Pd, Ni and CoMo into zeolite.
Pt-USY Pd aqueous solution
Washing & Dryingovernight
Drying, 120 oC, 4 h
Drying120 °C, 4 h
Pelletize850-1000µµµµm
Calcine450 °C, 4 h
Dry overnight
(Reaction)
H3PO4/H2O(Reaction)
MoO3
Impregnation
CobaltAcetate
CoMoNi/PdPt-HY
HDS-10
NickelCarbonate
NH4OH /H2O
(Reaction)
MoO3
USY-12 zeolite
Mix
Ion exchange98 °C, 64h, reflux
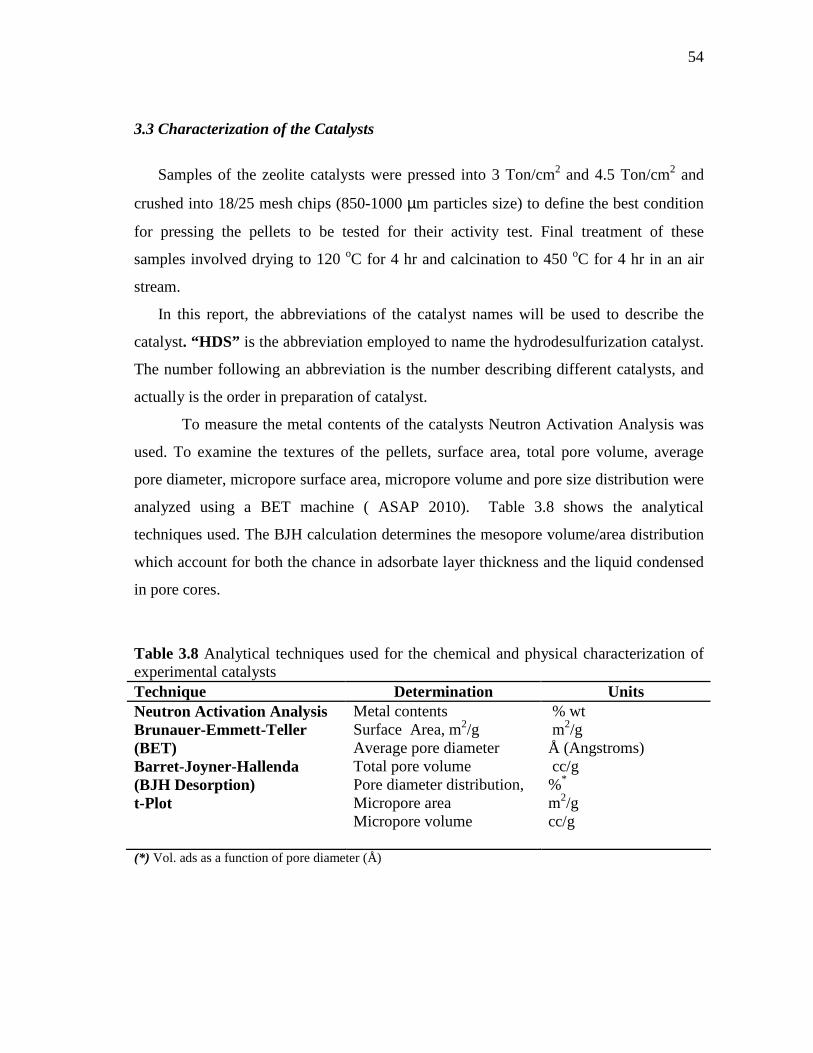
54
3.3 Characterization of the Catalysts
Samples of the zeolite catalysts were pressed into 3 Ton/cm2 and 4.5 Ton/cm2 and
crushed into 18/25 mesh chips (850-1000 µm particles size) to define the best condition
for pressing the pellets to be tested for their activity test. Final treatment of these
samples involved drying to 120 oC for 4 hr and calcination to 450 oC for 4 hr in an air
stream.
In this report, the abbreviations of the catalyst names will be used to describe the
catalyst. “HDS” is the abbreviation employed to name the hydrodesulfurization catalyst.
The number following an abbreviation is the number describing different catalysts, and
actually is the order in preparation of catalyst.
To measure the metal contents of the catalysts Neutron Activation Analysis was
used. To examine the textures of the pellets, surface area, total pore volume, average
pore diameter, micropore surface area, micropore volume and pore size distribution were
analyzed using a BET machine ( ASAP 2010). Table 3.8 shows the analytical
techniques used. The BJH calculation determines the mesopore volume/area distribution
which account for both the chance in adsorbate layer thickness and the liquid condensed
in pore cores.
Table 3.8 Analytical techniques used for the chemical and physical characterization of experimental catalysts Technique Determination Units Neutron Activation Analysis Metal contents % wt Brunauer-Emmett-Teller (BET)
Surface Area, m2/g Average pore diameter
m2/g Å (Angstroms)
Barret-Joyner-Hallenda (BJH Desorption)
Total pore volume Pore diameter distribution,
cc/g %*
t-Plot Micropore area Micropore volume
m2/g cc/g
(*) Vol. ads as a function of pore diameter (Å)
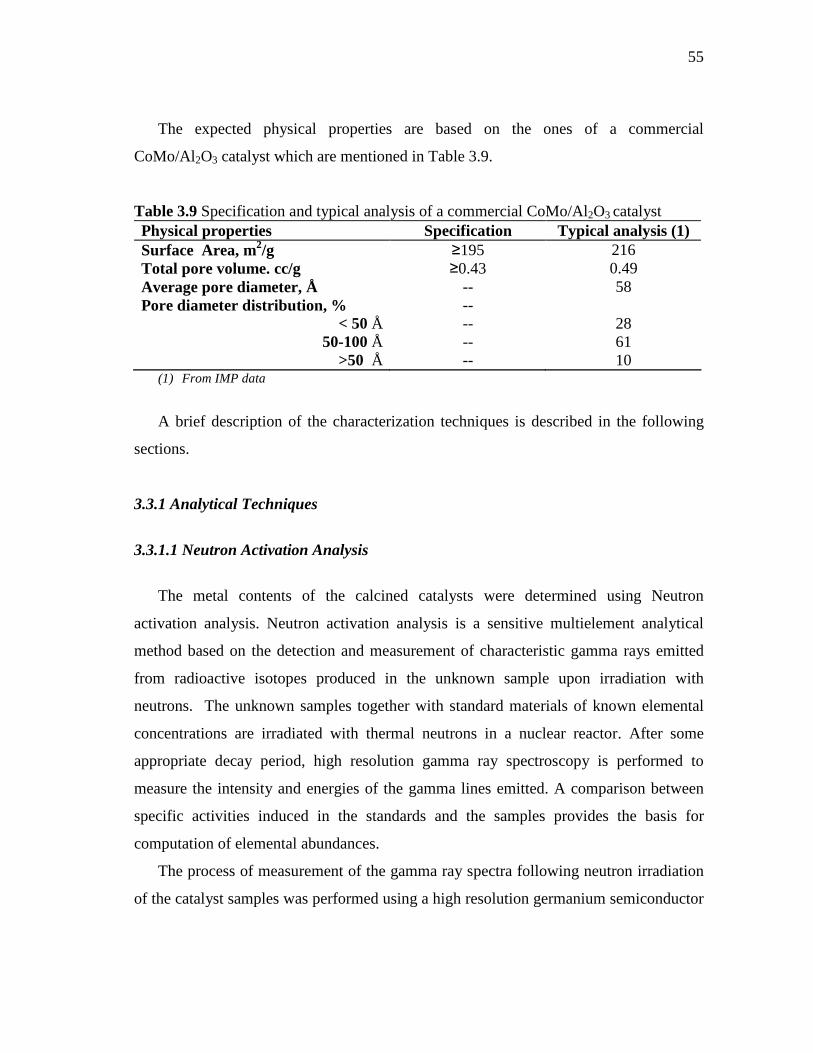
55
The expected physical properties are based on the ones of a commercial
CoMo/Al2O3 catalyst which are mentioned in Table 3.9.
Table 3.9 Specification and typical analysis of a commercial CoMo/Al2O3 catalyst Physical properties Specification Typical analysis (1) Surface Area, m2/g ≥195 216 Total pore volume. cc/g ≥0.43 0.49 Average pore diameter, Å -- 58 Pore diameter distribution, % --
< 50 Å -- 28 50-100 Å -- 61
>50 Å -- 10 (1) From IMP data
A brief description of the characterization techniques is described in the following
sections.
3.3.1 Analytical Techniques
3.3.1.1 Neutron Activation Analysis
The metal contents of the calcined catalysts were determined using Neutron
activation analysis. Neutron activation analysis is a sensitive multielement analytical
method based on the detection and measurement of characteristic gamma rays emitted
from radioactive isotopes produced in the unknown sample upon irradiation with
neutrons. The unknown samples together with standard materials of known elemental
concentrations are irradiated with thermal neutrons in a nuclear reactor. After some
appropriate decay period, high resolution gamma ray spectroscopy is performed to
measure the intensity and energies of the gamma lines emitted. A comparison between
specific activities induced in the standards and the samples provides the basis for
computation of elemental abundances.
The process of measurement of the gamma ray spectra following neutron irradiation
of the catalyst samples was performed using a high resolution germanium semiconductor
56
detector. This device provided sufficient resolution to differentiate between most all
commonly occurring gamma lines. An EG&G Ortec detector was operated. The signals
produced from this detector were refined with various electronic modules to amplify and
shape the pulses prior to input to a high speed analog to digital converter (ADC). A
gamma spectroscopy system physically housed at the Nuclear Science Center was used.
The irradiated samples were returned to the counting lab in a matter of a few seconds.
This system was used for determination of those elements which undergo neutron
activation reactions with relatively short half-lives (from seconds to a few hours).
Spectral data of this particular system was accumulated on a personal computer version
of Canberra's Genie, the Genie2000. Files containing the data as well as various sample
parameter information were transferred via Ethernet back to the Alpha system for
analysis.
3.3.1.2 Adsorption-Desorption Isotherms of Nitrogen
The texture of the calcined catalysts were evaluated using adsorption-desorption
isotherms of nitrogen. The isotherms were obtained on an ASAP 2010 Micromeritics
unit shown in Figure 3.13. Nitrogen Adsorption-Desorption isotherms were measured at
liquid nitrogen temperature of -196 °C after degassing the samples below 300 mmHg at
250 °C overnight to eliminate water and volatile substances. The volumetric BET
(Brunauer-Emmet-Teller) method was used to determine the specific surface area of
each catalyst using adsorption data in the relative pressure range of 0.01 to 0.67. The
pore size distribution was obtained by analyzing the adsorption data of the nitrogen
isotherm using the Barret-Joyner-Hallenda (BJH Desorption) method.
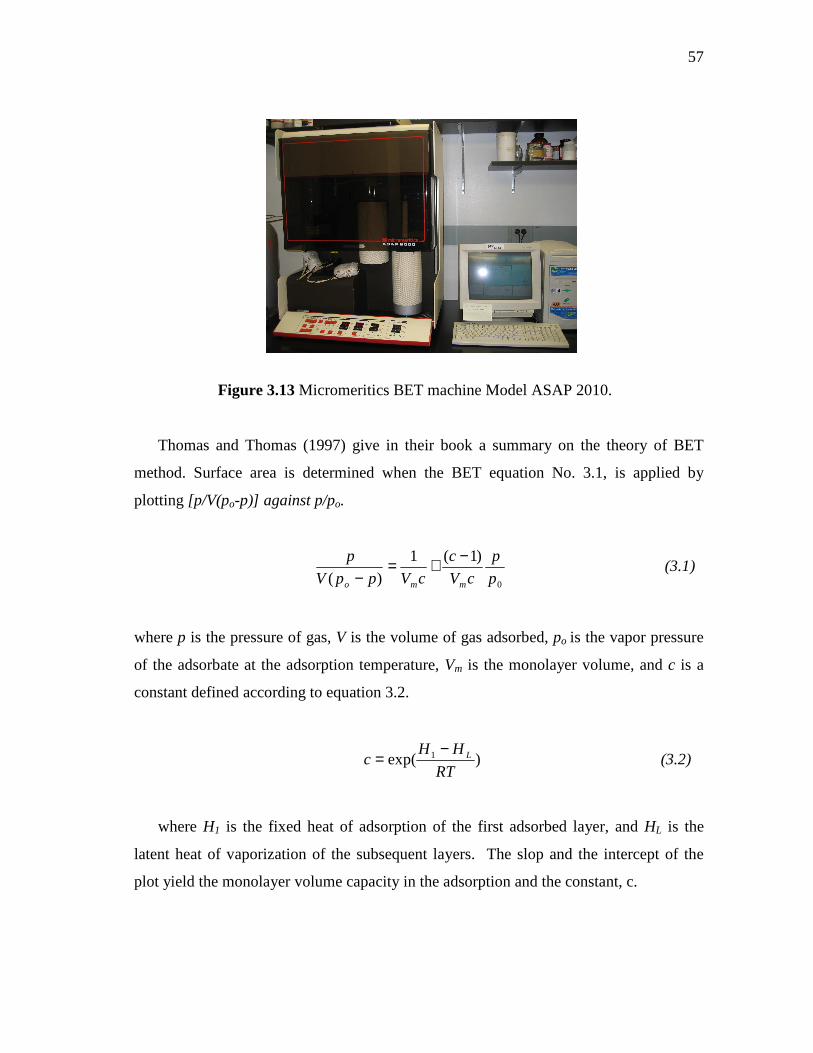
57
Figure 3.13 Micromeritics BET machine Model ASAP 2010.
Thomas and Thomas (1997) give in their book a summary on the theory of BET
method. Surface area is determined when the BET equation No. 3.1, is applied by
plotting [p/V(po-p)] against p/po.
0
)1(1
)( p
p
cV
c
cVppV
p
mmo
−+=−
(3.1)
where p is the pressure of gas, V is the volume of gas adsorbed, po is the vapor pressure
of the adsorbate at the adsorption temperature, Vm is the monolayer volume, and c is a
constant defined according to equation 3.2.
)exp( 1
RT
HHc L−
= (3.2)
where H1 is the fixed heat of adsorption of the first adsorbed layer, and HL is the
latent heat of vaporization of the subsequent layers. The slop and the intercept of the
plot yield the monolayer volume capacity in the adsorption and the constant, c.
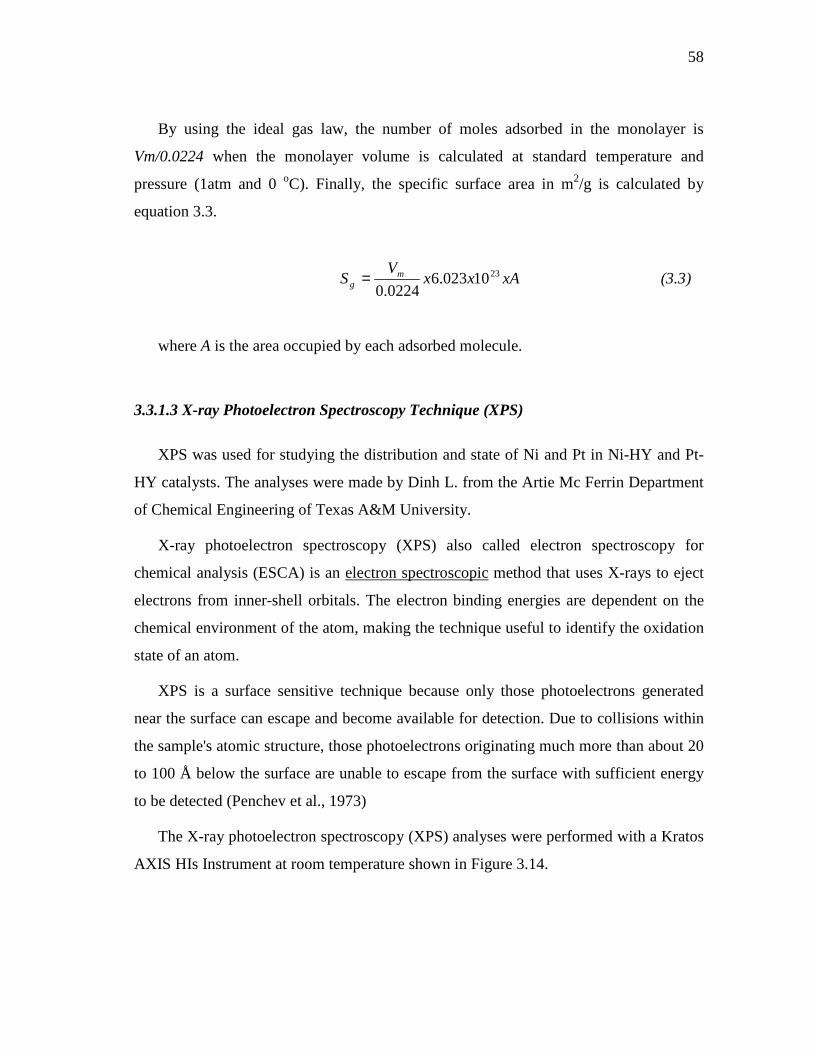
58
By using the ideal gas law, the number of moles adsorbed in the monolayer is
Vm/0.0224 when the monolayer volume is calculated at standard temperature and
pressure (1atm and 0 oC). Finally, the specific surface area in m2/g is calculated by
equation 3.3.
xAxxV
S mg
2310023.60224.0
= (3.3)
where A is the area occupied by each adsorbed molecule.
3.3.1.3 X-ray Photoelectron Spectroscopy Technique (XPS)
XPS was used for studying the distribution and state of Ni and Pt in Ni-HY and Pt-
HY catalysts. The analyses were made by Dinh L. from the Artie Mc Ferrin Department
of Chemical Engineering of Texas A&M University.
X-ray photoelectron spectroscopy (XPS) also called electron spectroscopy for
chemical analysis (ESCA) is an electron spectroscopic method that uses X-rays to eject
electrons from inner-shell orbitals. The electron binding energies are dependent on the
chemical environment of the atom, making the technique useful to identify the oxidation
state of an atom.
XPS is a surface sensitive technique because only those photoelectrons generated
near the surface can escape and become available for detection. Due to collisions within
the sample's atomic structure, those photoelectrons originating much more than about 20
to 100 Å below the surface are unable to escape from the surface with sufficient energy
to be detected (Penchev et al., 1973)
The X-ray photoelectron spectroscopy (XPS) analyses were performed with a Kratos
AXIS HIs Instrument at room temperature shown in Figure 3.14.
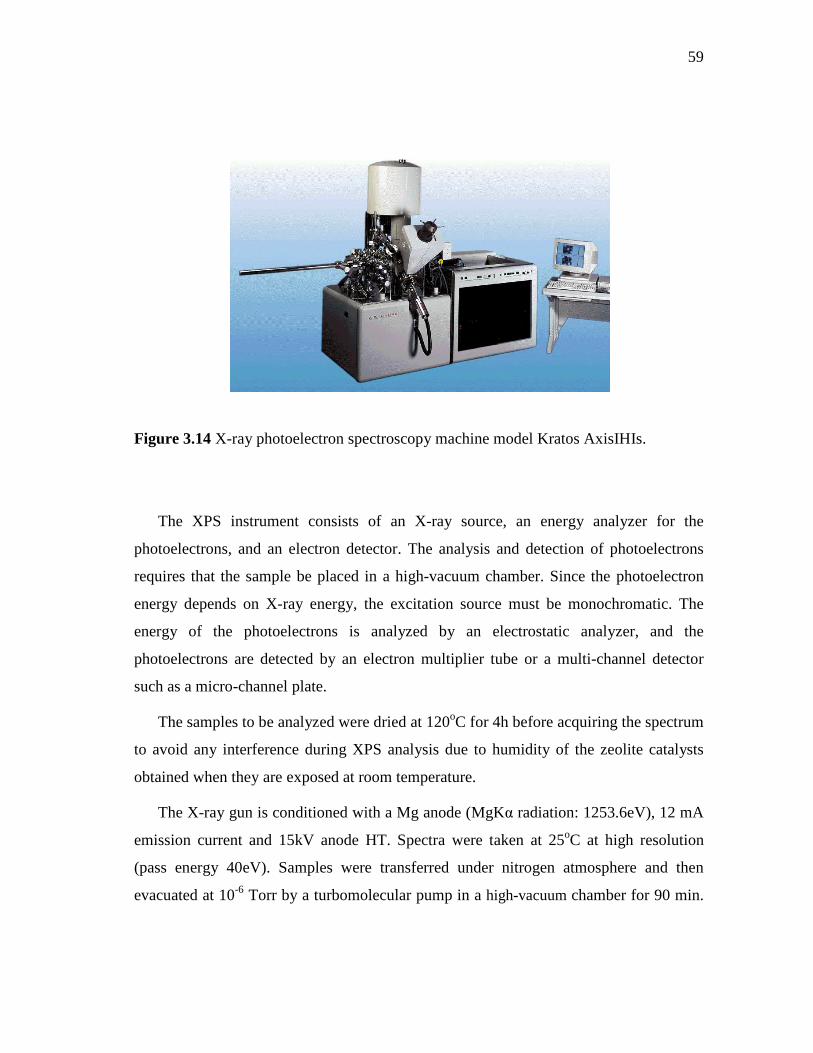
59
Figure 3.14 X-ray photoelectron spectroscopy machine model Kratos AxisIHIs.
The XPS instrument consists of an X-ray source, an energy analyzer for the
photoelectrons, and an electron detector. The analysis and detection of photoelectrons
requires that the sample be placed in a high-vacuum chamber. Since the photoelectron
energy depends on X-ray energy, the excitation source must be monochromatic. The
energy of the photoelectrons is analyzed by an electrostatic analyzer, and the
photoelectrons are detected by an electron multiplier tube or a multi-channel detector
such as a micro-channel plate.
The samples to be analyzed were dried at 120oC for 4h before acquiring the spectrum
to avoid any interference during XPS analysis due to humidity of the zeolite catalysts
obtained when they are exposed at room temperature.
The X-ray gun is conditioned with a Mg anode (MgKα radiation: 1253.6eV), 12 mA
emission current and 15kV anode HT. Spectra were taken at 25oC at high resolution
(pass energy 40eV). Samples were transferred under nitrogen atmosphere and then
evacuated at 10-6 Torr by a turbomolecular pump in a high-vacuum chamber for 90 min.
60
During the spectra acquisition the pressure of the analysis chamber was maintained at
1×10⁻⁷ Torr.
C1s spectra have been used as a reference with a binding energy value of 284.6 eV.
Atomic concentrations were determined from integrated peak areas normalized by
atomic sensitivity factors. The atomic concentration ratio on the surface of catalysts was
calculated using equation No. 3.4.
ABBAB
A SISIn
n/= (3.4)
where ni is the atomic number of species i ( A or B). Ii is the integrated intensity of
species i, and Si is the sensitivity factor determined by XPS measurement (Kerkhof and
Moulijn, 1979). The sensitivity factor not only depends on the photoionization cross
section (σi ) but also depends on exciting X-ray energy, detector efficiency, and kinetic
energy of the measured peaks.
3.4 Results and Discussion
In this section, the characterization results and discussion of the metal contents and
textures of the calcined catalysts prepared by several methods are reported. Each section
is dedicated to each category of comparisons on catalyst properties. First, the
comparison among the Pt-HY and Ni-HY catalysts prepared by ion exchange are
presented in section 3.4.1. In section 3.4.2, the comparison among the catalyst prepared
with USY-12 zeolite by wetness impregnation (HDS-1) and the catalysts prepared from
the Ni-USY (HDS-3) and Pt-USY (HDS-5) by combining the incipient wetness
impregnation with ion exchange method is reviewed. Finally, the comparison among
catalysts prepared with PdPt-USY (HDS-10) and PdNiPt-USY (HDS-8) by incipient
wetness impregnation and ion exchange are discussed in section 3.4.3.
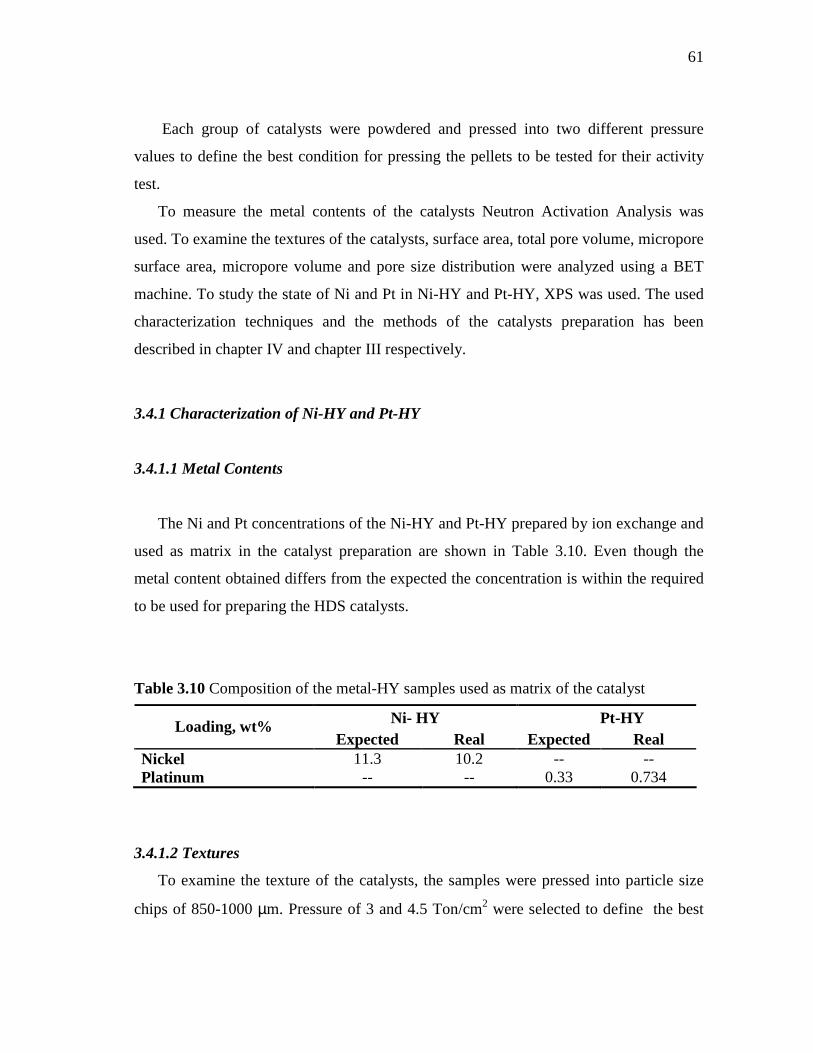
61
Each group of catalysts were powdered and pressed into two different pressure
values to define the best condition for pressing the pellets to be tested for their activity
test.
To measure the metal contents of the catalysts Neutron Activation Analysis was
used. To examine the textures of the catalysts, surface area, total pore volume, micropore
surface area, micropore volume and pore size distribution were analyzed using a BET
machine. To study the state of Ni and Pt in Ni-HY and Pt-HY, XPS was used. The used
characterization techniques and the methods of the catalysts preparation has been
described in chapter IV and chapter III respectively.
3.4.1 Characterization of Ni-HY and Pt-HY
3.4.1.1 Metal Contents
The Ni and Pt concentrations of the Ni-HY and Pt-HY prepared by ion exchange and
used as matrix in the catalyst preparation are shown in Table 3.10. Even though the
metal content obtained differs from the expected the concentration is within the required
to be used for preparing the HDS catalysts.
Table 3.10 Composition of the metal-HY samples used as matrix of the catalyst
Ni- HY Pt-HY Loading, wt% Expected Real Expected Real
Nickel 11.3 10.2 -- -- Platinum -- -- 0.33 0.734
3.4.1.2 Textures
To examine the texture of the catalysts, the samples were pressed into particle size
chips of 850-1000 µm. Pressure of 3 and 4.5 Ton/cm2 were selected to define the best
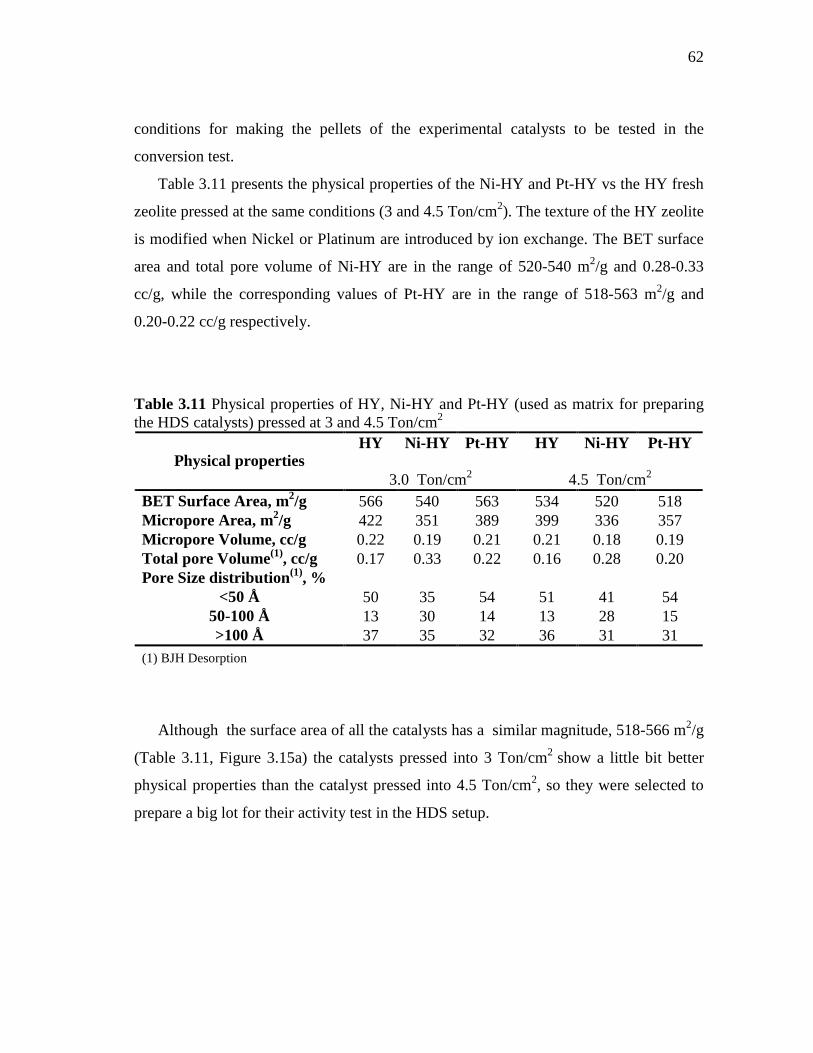
62
conditions for making the pellets of the experimental catalysts to be tested in the
conversion test.
Table 3.11 presents the physical properties of the Ni-HY and Pt-HY vs the HY fresh
zeolite pressed at the same conditions (3 and 4.5 Ton/cm2). The texture of the HY zeolite
is modified when Nickel or Platinum are introduced by ion exchange. The BET surface
area and total pore volume of Ni-HY are in the range of 520-540 m2/g and 0.28-0.33
cc/g, while the corresponding values of Pt-HY are in the range of 518-563 m2/g and
0.20-0.22 cc/g respectively.
Table 3.11 Physical properties of HY, Ni-HY and Pt-HY (used as matrix for preparing the HDS catalysts) pressed at 3 and 4.5 Ton/cm2
HY
Ni-HY
Pt-HY
HY
Ni-HY
Pt-HY Physical properties
3.0 Ton/cm2 4.5 Ton/cm2 BET Surface Area, m2/g 566 540 563 534 520 518 Micropore Area, m2/g 422 351 389 399 336 357 Micropore Volume, cc/g 0.22 0.19 0.21 0.21 0.18 0.19 Total pore Volume(1), cc/g 0.17 0.33 0.22 0.16 0.28 0.20 Pore Size distribution(1), %
<50 Å 50 35 54 51 41 54 50-100 Å 13 30 14 13 28 15 >100 Å 37 35 32 36 31 31
(1) BJH Desorption
Although the surface area of all the catalysts has a similar magnitude, 518-566 m2/g
(Table 3.11, Figure 3.15a) the catalysts pressed into 3 Ton/cm2 show a little bit better
physical properties than the catalyst pressed into 4.5 Ton/cm2, so they were selected to
prepare a big lot for their activity test in the HDS setup.
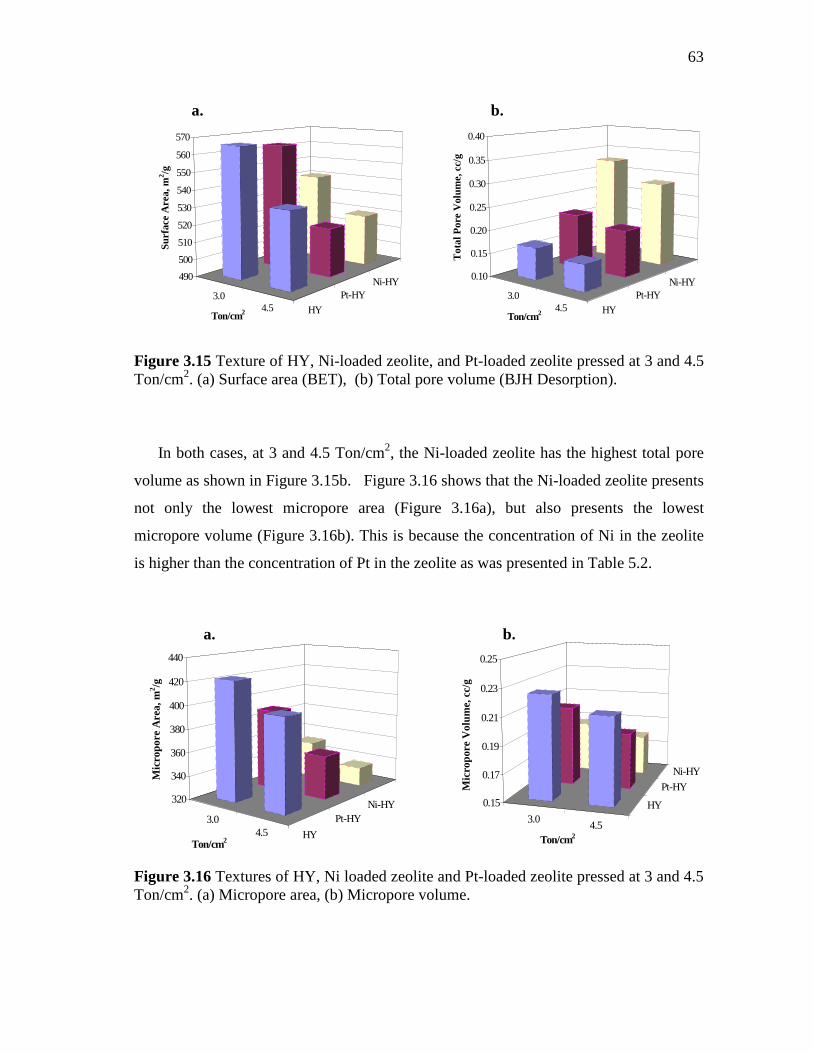
63
3.04.5 HY
Pt-HYNi-HY490
500
510
520
530
540
550
560
570
Sur
face
Are
a, m
2 /g
Ton/cm2
3.04.5 HY
Pt-HYNi-HY
0.10
0.15
0.20
0.25
0.30
0.35
0.40
Tot
al P
ore
Vol
ume,
cc/
g
Ton/cm2
Figure 3.15 Texture of HY, Ni-loaded zeolite, and Pt-loaded zeolite pressed at 3 and 4.5 Ton/cm2. (a) Surface area (BET), (b) Total pore volume (BJH Desorption).
In both cases, at 3 and 4.5 Ton/cm2, the Ni-loaded zeolite has the highest total pore
volume as shown in Figure 3.15b. Figure 3.16 shows that the Ni-loaded zeolite presents
not only the lowest micropore area (Figure 3.16a), but also presents the lowest
micropore volume (Figure 3.16b). This is because the concentration of Ni in the zeolite
is higher than the concentration of Pt in the zeolite as was presented in Table 5.2.
3.04.5
HY
Pt-HY
Ni-HY
0.15
0.17
0.19
0.21
0.23
0.25
Mic
ropo
re V
olum
e, c
c/g
Ton/cm2
3.04.5 HY
Pt-HYNi-HY320
340
360
380
400
420
440
Mic
ropo
re A
rea,
m2 /g
Ton/cm2
Figure 3.16 Textures of HY, Ni loaded zeolite and Pt-loaded zeolite pressed at 3 and 4.5 Ton/cm2. (a) Micropore area, (b) Micropore volume.
a. b.
a. b.
64
Figure 3.17 shows the pore size distribution in the mesopore size range when
catalysts were pressed into 3 and 4.5 Ton/cm2. The Ni-loaded zeolite (Ni-HY) shows
highest pore size distribution in the range of 50 to 100 Å of pore size (>27 %) as was
shown in Table 5.3.
0.0
0.2
0.4
0.6
0.8
1.0
1.2
1.4
1.6
25 50 75 100 125Pore Diameter, °A
Por
e V
olum
e, c
c/g
HY Ni-HY Pt-HY
Pressed : 3.0 Ton/cm2
0.0
0.2
0.4
0.6
0.8
1.0
1.2
1.4
1.6
1.8
25 50 75 100 125Pore Diameter, °A
Por
e V
olum
e, c
c/g
HY Ni-HY Pt-HY
Pressed : 4.5 Ton/cm2
Figure 3.17 Pore size distribution of HY, Ni-loaded zeolite and Pt-loaded zeolite pressed at 3 and 4.5 Ton/cm2.
The structure of “Y” zeolite consists of a supercage with a diameter of 12 Å and it is
surrounded by 10 sodalite units of 7.4 Å free diameter. So, the pore size distribution
measured in all zeolite catalysts does not represent the pore size distribution of the
zeolite, but represents the size distribution of the “pores” between the pressed zeolite
particles. Textures of the powdered HY, Pt-HY and Ni-HY zeolites are reported in
Appendix A. The corresponding adsorption and desorption isotherms are also included
in this Appendix.
3.4.1.3 X-ray Photoelectron Spectroscopy (XPS)
XPS analyses were made by Dinh L. in the Center Integrated Microchemical
System of Texas A & M University.
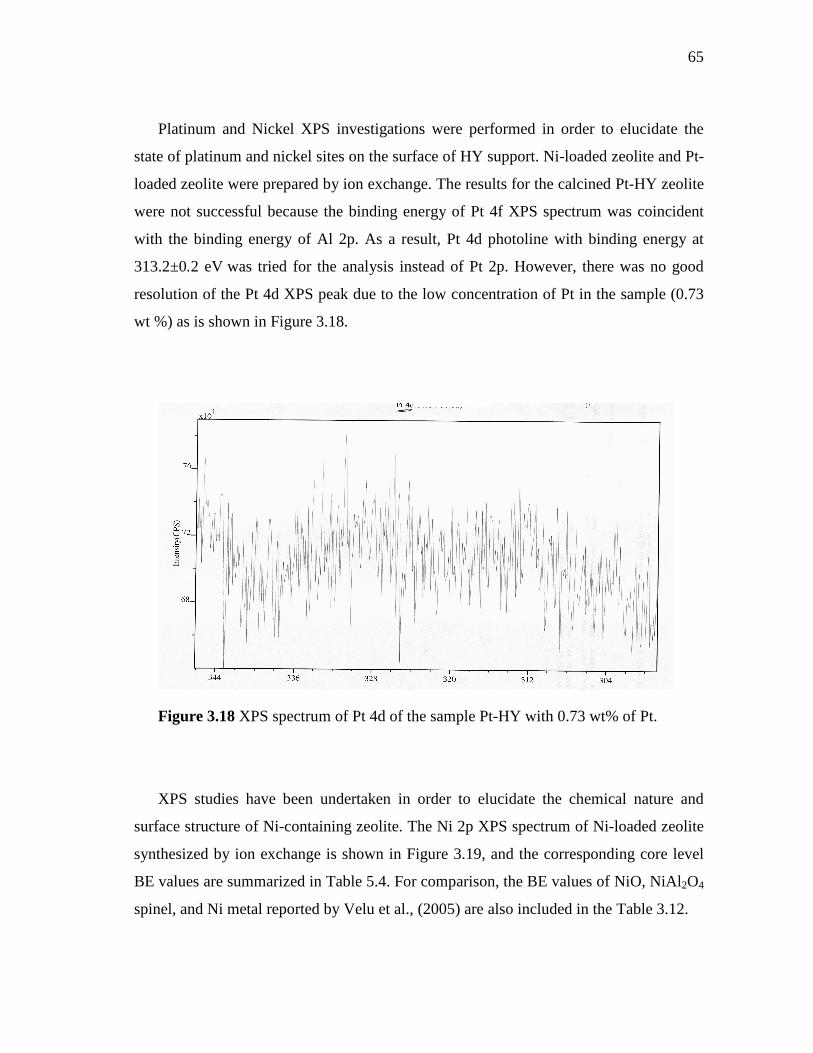
65
Platinum and Nickel XPS investigations were performed in order to elucidate the
state of platinum and nickel sites on the surface of HY support. Ni-loaded zeolite and Pt-
loaded zeolite were prepared by ion exchange. The results for the calcined Pt-HY zeolite
were not successful because the binding energy of Pt 4f XPS spectrum was coincident
with the binding energy of Al 2p. As a result, Pt 4d photoline with binding energy at
313.2±0.2 eV was tried for the analysis instead of Pt 2p. However, there was no good
resolution of the Pt 4d XPS peak due to the low concentration of Pt in the sample (0.73
wt %) as is shown in Figure 3.18.
Figure 3.18 XPS spectrum of Pt 4d of the sample Pt-HY with 0.73 wt% of Pt.
XPS studies have been undertaken in order to elucidate the chemical nature and
surface structure of Ni-containing zeolite. The Ni 2p XPS spectrum of Ni-loaded zeolite
synthesized by ion exchange is shown in Figure 3.19, and the corresponding core level
BE values are summarized in Table 5.4. For comparison, the BE values of NiO, NiAl2O4
spinel, and Ni metal reported by Velu et al., (2005) are also included in the Table 3.12.
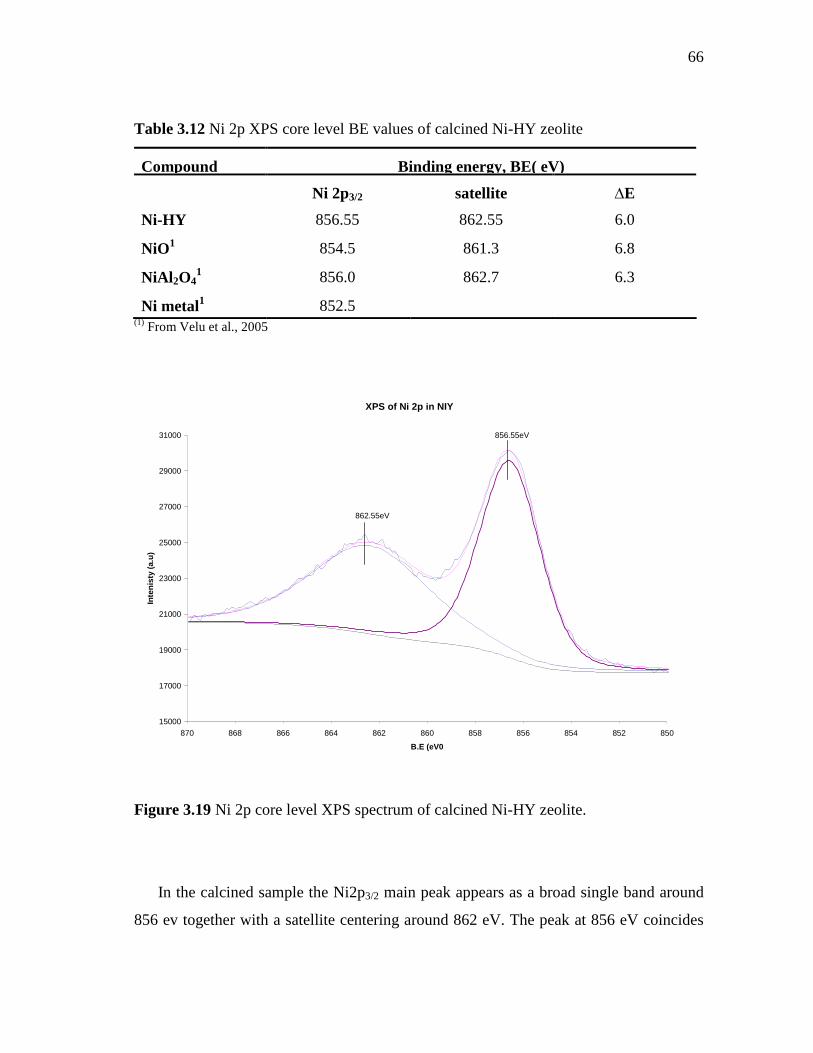
66
Table 3.12 Ni 2p XPS core level BE values of calcined Ni-HY zeolite
Compound Binding energy, BE( eV)
Ni 2p3/2 satellite ∆E
Ni-HY 856.55 862.55 6.0
NiO1 854.5 861.3 6.8
NiAl 2O41 856.0 862.7 6.3
Ni metal1 852.5 (1) From Velu et al., 2005
XPS of Ni 2p in NIY
15000
17000
19000
21000
23000
25000
27000
29000
31000
850852854856858860862864866868870
B.E (eV0
Inte
nist
y (a
.u)
856.55eV
862.55eV
Figure 3.19 Ni 2p core level XPS spectrum of calcined Ni-HY zeolite.
In the calcined sample the Ni2p3/2 main peak appears as a broad single band around
856 ev together with a satellite centering around 862 eV. The peak at 856 eV coincides
67
with the BE of NiAl2O4 (Table 12), indicating that NiAl2O4-like species are present at
the surface of Ni-containing zeolite. No peak appears at 854 eV, so NiO-like species are
not present at the surface of Ni-HY. Moreover, no peak appears at 852 eV,
demonstrating that the Ni2+ ions are present in the zeolite matrix instead of metal Ni.
This result is really true because the samples were not reduced for this analysis. On the
other hand, It is interesting to note that the signal intensity of Ni-HY is high. This
indicates that the dispersion of Ni at the surface is good. It is also interesting to note that,
although the Ni loading in Ni-HY is only 11.3 wt%, the sample exhibits high XPS signal
intensity, because the sample was prepared by ion exchange rather than impregnation.
Those observations are in agreement with those reported by Velu (2005) for Ni-
containing zeolite.
Because the XPS spectral intensity is directly proportional to the surface
concentrations, the same has been calculated by taking into account the atomic
sensitivity factors of the elements, and the data are summarized in Table 3.13.
Table 3.13 XPS surface compositions of calcined Ni-HY zeolite
Surface composition (atom %) Sample
(calcined) Ni Si Al Ni/Si atomic ratio
Ni/HY 30.81 29.25 39.94 1.053
As can be seen, the surface Ni concentration is high and very close to the surface
concentration of Si giving a Ni/Si ratio of 1.05. This value demonstrates that surface
exposure of Si is similar to the surface exposure by Ni.
3.4.2 Characterization of CoMoPtPd/HY (HDS-1), CoMoPtPd/Ni-HY (HDS-3) and
CoMoPd/Pt-HY (HDS-5) Catalysts
Preparation parameters, such as: a) procedure to introduce metals; b) metal loading;
c) calcinations temperature; d) activation procedure; and e) presence of additives, may
68
strongly affect the structure, morphology and chemical state of the resulting CoMo or
NiMo sulfided species in the HDS catalysts. In this context metals content and texture
were determined for the experimental catalysts prepared by different methods of
introducing metals. The catalysts did not contain any additive and the calcination
temperature and activation procedures were the same in all of them.
3.4.2.1 Metal Contents
It is well known that the structures and their relative proportion in sulfided Mo and
CoMo are very dependent on the loading of both active compounds (Mo) and promotes
(Co) to obtained active catalysts for HDS. The loading of the metals is consequently one
of the more important parameters in optimizing commercial hydrotreating catalysts.
The loading used in industrial applications are usually governed by the desire to
achieve as high an activity as possible with as small amount of the expensive metals as
possible. In this work a concentration of 0.5 wt% of noble metals was considered. The
composition of the CoMoPtPd/HY (HDS-1), CoMoPtPd/Ni-HY (HDS-3) and
CoMoPd/Pt-HY (HDS-5) is compared with the commercial CoMo/Al2O3 catalysts as is
shown in Table 3.14 As it was described in the section 3.2.1, the HDS-1
(CoMoPtPd/HY) catalyst was prepared by incipient wetness impregnation of the USY-
12 zeolite. The CoMoPtPd/Ni-HY (HDS-3) and CoMoPd/Pt-HY (HDS-5) were prepared
combining both ion exchange and incipient wetness impregnation methods.
The metal content of the HDS-1 catalyst was almost as expected having a Co+Pt/Mo
atomic ratio (0.38) similar to the Co/Mo atomic ratio specified for the commercial
CoMo/Al2O3 catalyst (0.39).
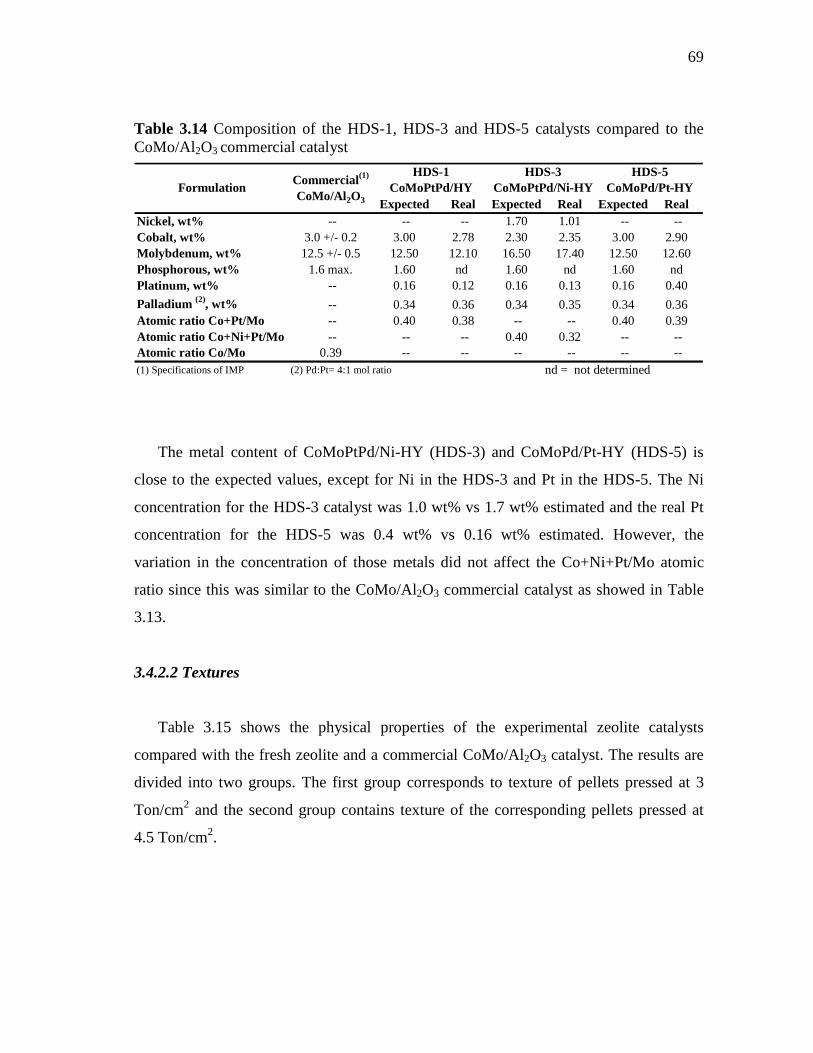
69
Table 3.14 Composition of the HDS-1, HDS-3 and HDS-5 catalysts compared to the CoMo/Al2O3 commercial catalyst
Expected Real Expected Real Expected RealNickel, wt% -- -- -- 1.70 1.01 -- --Cobalt, wt% 3.0 +/- 0.2 3.00 2.78 2.30 2.35 3.00 2.90Molybdenum, wt% 12.5 +/- 0.5 12.50 12.10 16.50 17.40 12.50 12.60Phosphorous, wt% 1.6 max. 1.60 nd 1.60 nd 1.60 ndPlatinum, wt% -- 0.16 0.12 0.16 0.13 0.16 0.40
Palladium (2), wt% -- 0.34 0.36 0.34 0.35 0.34 0.36Atomic ratio Co+Pt/Mo -- 0.40 0.38 -- -- 0.40 0.39Atomic ratio Co+Ni+Pt/Mo -- -- -- 0.40 0.32 -- --Atomic ratio Co/Mo 0.39 -- -- -- -- -- --(1) Specifications of IMP (2) Pd:Pt= 4:1 mol ratio nd = not determined
HDS-5 CoMoPd/Pt-HYFormulation
Commercial(1)
CoMo/Al 2O3
HDS-1 CoMoPtPd/HY
HDS-3 CoMoPtPd/Ni-HY
The metal content of CoMoPtPd/Ni-HY (HDS-3) and CoMoPd/Pt-HY (HDS-5) is
close to the expected values, except for Ni in the HDS-3 and Pt in the HDS-5. The Ni
concentration for the HDS-3 catalyst was 1.0 wt% vs 1.7 wt% estimated and the real Pt
concentration for the HDS-5 was 0.4 wt% vs 0.16 wt% estimated. However, the
variation in the concentration of those metals did not affect the Co+Ni+Pt/Mo atomic
ratio since this was similar to the CoMo/Al2O3 commercial catalyst as showed in Table
3.13.
3.4.2.2 Textures
Table 3.15 shows the physical properties of the experimental zeolite catalysts
compared with the fresh zeolite and a commercial CoMo/Al 2O3 catalyst. The results are
divided into two groups. The first group corresponds to texture of pellets pressed at 3
Ton/cm2 and the second group contains texture of the corresponding pellets pressed at
4.5 Ton/cm2.
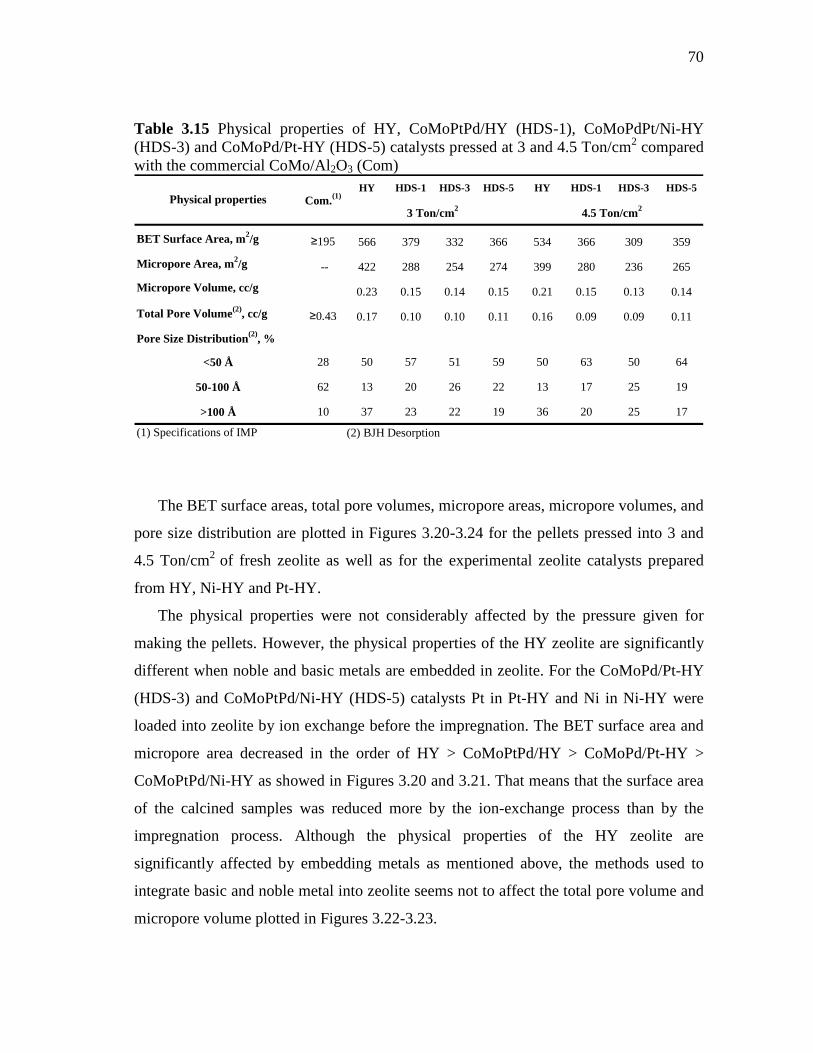
70
Table 3.15 Physical properties of HY, CoMoPtPd/HY (HDS-1), CoMoPdPt/Ni-HY (HDS-3) and CoMoPd/Pt-HY (HDS-5) catalysts pressed at 3 and 4.5 Ton/cm2 compared with the commercial CoMo/Al2O3 (Com)
HY HDS-1 HDS-3 HDS-5 HY HDS-1 HDS-3 HDS-5
BET Surface Area, m2/g ≥195 566 379 332 366 534 366 309 359
Micropore Area, m2/g -- 422 288 254 274 399 280 236 265
Micropore Volume, cc/g 0.23 0.15 0.14 0.15 0.21 0.15 0.13 0.14
Total Pore Volume(2), cc/g ≥0.43 0.17 0.10 0.10 0.11 0.16 0.09 0.09 0.11
Pore Size Distribution(2), %
<50 Å 28 50 57 51 59 50 63 50 64
50-100 Å 62 13 20 26 22 13 17 25 19
>100 Å 10 37 23 22 19 36 20 25 17
(1) Specifications of IMP (2) BJH Desorption
Physical properties Com.(1)
3 Ton/cm2 4.5 Ton/cm2
The BET surface areas, total pore volumes, micropore areas, micropore volumes, and
pore size distribution are plotted in Figures 3.20-3.24 for the pellets pressed into 3 and
4.5 Ton/cm2 of fresh zeolite as well as for the experimental zeolite catalysts prepared
from HY, Ni-HY and Pt-HY.
The physical properties were not considerably affected by the pressure given for
making the pellets. However, the physical properties of the HY zeolite are significantly
different when noble and basic metals are embedded in zeolite. For the CoMoPd/Pt-HY
(HDS-3) and CoMoPtPd/Ni-HY (HDS-5) catalysts Pt in Pt-HY and Ni in Ni-HY were
loaded into zeolite by ion exchange before the impregnation. The BET surface area and
micropore area decreased in the order of HY > CoMoPtPd/HY > CoMoPd/Pt-HY >
CoMoPtPd/Ni-HY as showed in Figures 3.20 and 3.21. That means that the surface area
of the calcined samples was reduced more by the ion-exchange process than by the
impregnation process. Although the physical properties of the HY zeolite are
significantly affected by embedding metals as mentioned above, the methods used to
integrate basic and noble metal into zeolite seems not to affect the total pore volume and
micropore volume plotted in Figures 3.22-3.23.
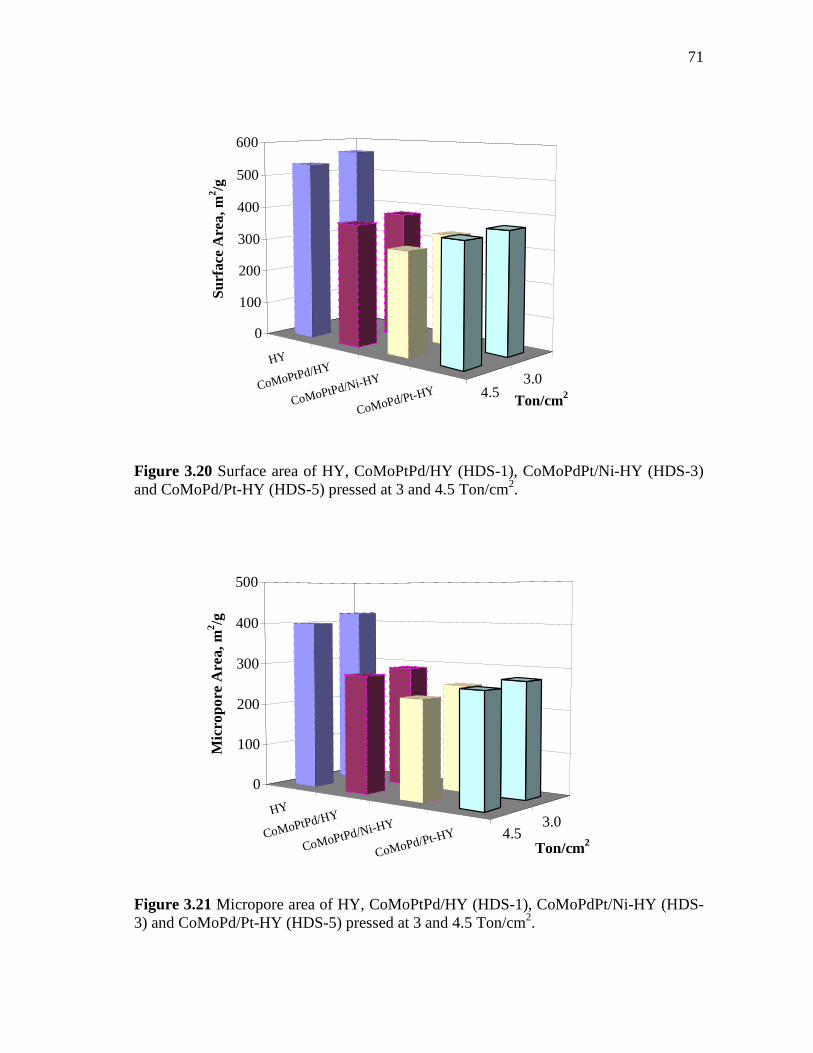
71
3.04.5
HY
CoMoPtPd/HY
CoMoPtPd/Ni-HY
CoMoPd/Pt-HY
0
100
200
300
400
500
600
Sur
face
Are
a, m
2 /g
Ton/cm2
Figure 3.20 Surface area of HY, CoMoPtPd/HY (HDS-1), CoMoPdPt/Ni-HY (HDS-3) and CoMoPd/Pt-HY (HDS-5) pressed at 3 and 4.5 Ton/cm2.
3.04.5
HY
CoMoPtPd/HY
CoMoPtPd/Ni-HY
CoMoPd/Pt-HY
0
100
200
300
400
500
Mic
ropo
re A
rea,
m2 /g
Ton/cm2
Figure 3.21 Micropore area of HY, CoMoPtPd/HY (HDS-1), CoMoPdPt/Ni-HY (HDS-3) and CoMoPd/Pt-HY (HDS-5) pressed at 3 and 4.5 Ton/cm2.
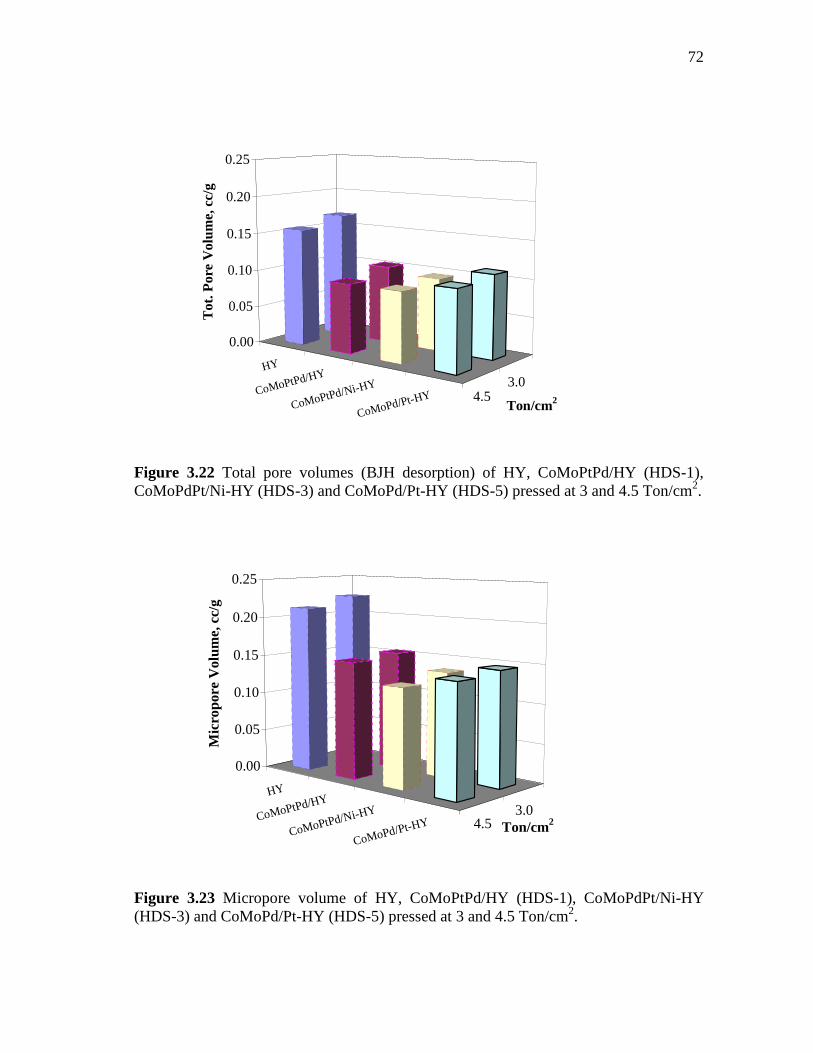
72
3.04.5
HY
CoMoPtPd/HY
CoMoPtPd/Ni-HY
CoMoPd/Pt-HY
0.00
0.05
0.10
0.15
0.20
0.25
Tot
. Por
e V
olum
e, c
c/g
Ton/cm2
Figure 3.22 Total pore volumes (BJH desorption) of HY, CoMoPtPd/HY (HDS-1), CoMoPdPt/Ni-HY (HDS-3) and CoMoPd/Pt-HY (HDS-5) pressed at 3 and 4.5 Ton/cm2.
3.04.5
HY
CoMoPtPd/HY
CoMoPtPd/Ni-HY
CoMoPd/Pt-HY
0.00
0.05
0.10
0.15
0.20
0.25
Mic
ropo
re V
olum
e, c
c/g
Ton/cm2
Figure 3.23 Micropore volume of HY, CoMoPtPd/HY (HDS-1), CoMoPdPt/Ni-HY (HDS-3) and CoMoPd/Pt-HY (HDS-5) pressed at 3 and 4.5 Ton/cm2.
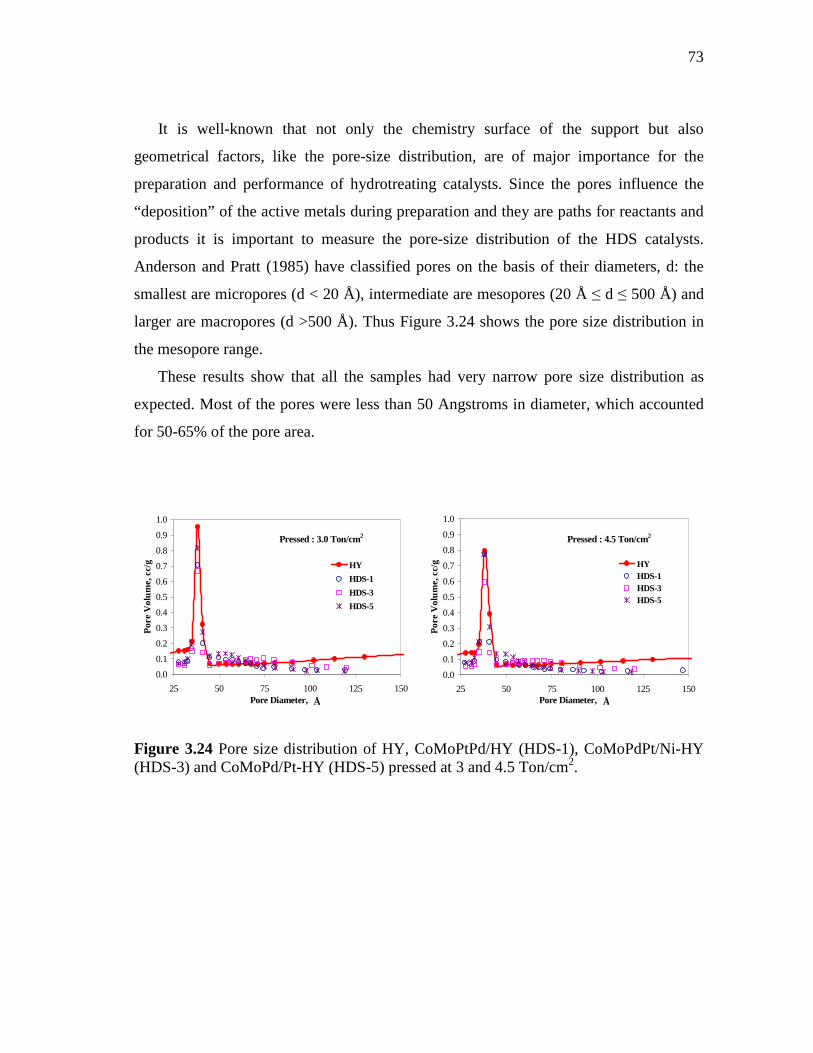
73
It is well-known that not only the chemistry surface of the support but also
geometrical factors, like the pore-size distribution, are of major importance for the
preparation and performance of hydrotreating catalysts. Since the pores influence the
“deposition” of the active metals during preparation and they are paths for reactants and
products it is important to measure the pore-size distribution of the HDS catalysts.
Anderson and Pratt (1985) have classified pores on the basis of their diameters, d: the
smallest are micropores (d < 20 Å), intermediate are mesopores (20 Å ≤ d ≤ 500 Å) and
larger are macropores (d >500 Å). Thus Figure 3.24 shows the pore size distribution in
the mesopore range.
These results show that all the samples had very narrow pore size distribution as
expected. Most of the pores were less than 50 Angstroms in diameter, which accounted
for 50-65% of the pore area.
0.0
0.1
0.2
0.3
0.4
0.5
0.6
0.7
0.8
0.9
1.0
25 50 75 100 125 150Pore Diameter,
Por
e V
olum
e, c
c/g
HY
HDS-1
HDS-3
HDS-5
Pressed : 3.0 Ton/cm2
0.0
0.1
0.2
0.3
0.4
0.5
0.6
0.7
0.8
0.9
1.0
25 50 75 100 125 150Pore Diameter,
Por
e V
olum
e, c
c/g
HYHDS-1HDS-3HDS-5
Pressed : 4.5 Ton/cm2
Å Å
Figure 3.24 Pore size distribution of HY, CoMoPtPd/HY (HDS-1), CoMoPdPt/Ni-HY (HDS-3) and CoMoPd/Pt-HY (HDS-5) pressed at 3 and 4.5 Ton/cm2.
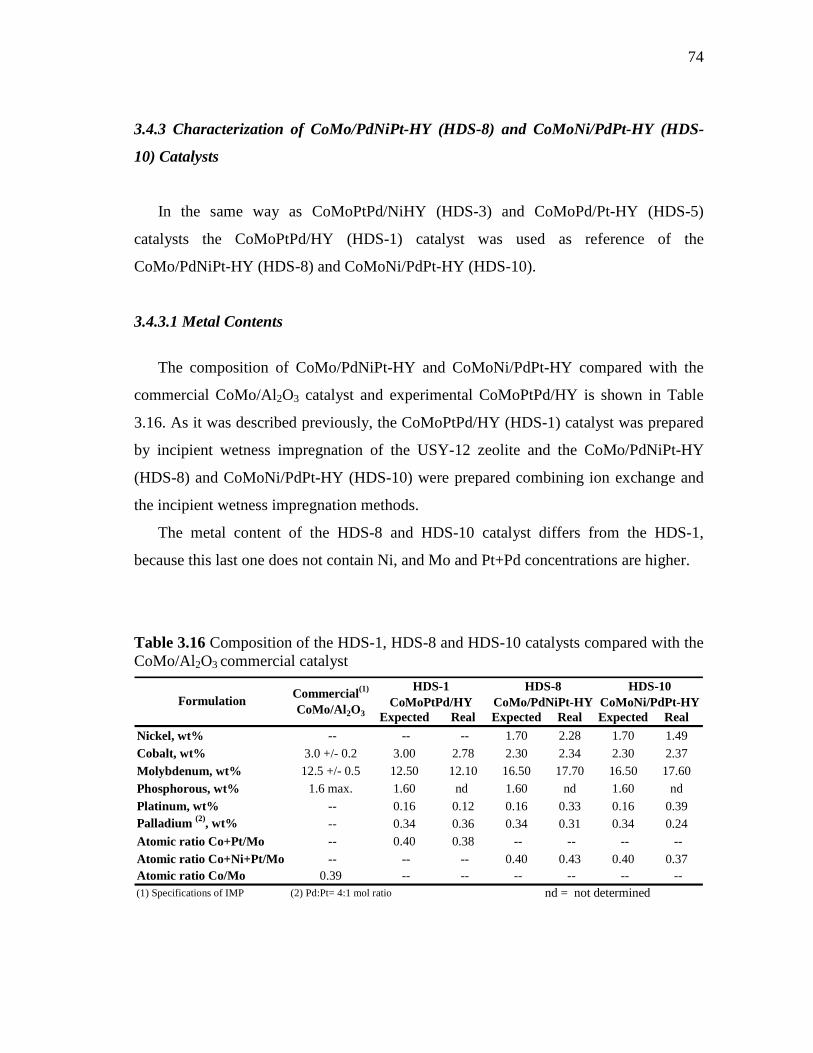
74
3.4.3 Characterization of CoMo/PdNiPt-HY (HDS-8) and CoMoNi/PdPt-HY (HDS-
10) Catalysts
In the same way as CoMoPtPd/NiHY (HDS-3) and CoMoPd/Pt-HY (HDS-5)
catalysts the CoMoPtPd/HY (HDS-1) catalyst was used as reference of the
CoMo/PdNiPt-HY (HDS-8) and CoMoNi/PdPt-HY (HDS-10).
3.4.3.1 Metal Contents
The composition of CoMo/PdNiPt-HY and CoMoNi/PdPt-HY compared with the
commercial CoMo/Al2O3 catalyst and experimental CoMoPtPd/HY is shown in Table
3.16. As it was described previously, the CoMoPtPd/HY (HDS-1) catalyst was prepared
by incipient wetness impregnation of the USY-12 zeolite and the CoMo/PdNiPt-HY
(HDS-8) and CoMoNi/PdPt-HY (HDS-10) were prepared combining ion exchange and
the incipient wetness impregnation methods.
The metal content of the HDS-8 and HDS-10 catalyst differs from the HDS-1,
because this last one does not contain Ni, and Mo and Pt+Pd concentrations are higher.
Table 3.16 Composition of the HDS-1, HDS-8 and HDS-10 catalysts compared with the CoMo/Al2O3 commercial catalyst
Expected Real Expected Real Expected Real
Nickel, wt% -- -- -- 1.70 2.28 1.70 1.49
Cobalt, wt% 3.0 +/- 0.2 3.00 2.78 2.30 2.34 2.30 2.37
Molybdenum, wt% 12.5 +/- 0.5 12.50 12.10 16.50 17.70 16.50 17.60
Phosphorous, wt% 1.6 max. 1.60 nd 1.60 nd 1.60 nd
Platinum, wt% -- 0.16 0.12 0.16 0.33 0.16 0.39Palladium (2), wt% -- 0.34 0.36 0.34 0.31 0.34 0.24
Atomic ratio Co+Pt/Mo -- 0.40 0.38 -- -- -- --
Atomic ratio Co+Ni+Pt/Mo -- -- -- 0.40 0.43 0.40 0.37Atomic ratio Co/Mo 0.39 -- -- -- -- -- --(1) Specifications of IMP (2) Pd:Pt= 4:1 mol ratio nd = not determined
FormulationCommercial(1)
CoMo/Al 2O3
HDS-1 CoMoPtPd/HY
HDS-8 CoMo/PdNiPt-HY
HDS-10 CoMoNi/PdPt-HY
75
Although the metal concentration of the CoMo/PdNiPt-HY (HDS-8) and
CoMoNi/PdPt-HY (HDS-10) catalysts is higher than CoMoPtPd/HY and CoMo/Al2O3
commercial catalyst, the atomic ratio, expressed as promoters/active compounds ratio
(Co+Ni+Pt/Mo), is similar. This means that the HDS-8 and HDS-10 catalysts might be
good candidates for deep hydrodesulfurization and high hydrogenation. It is important to
remember that the Co, Ni and Pt act as promoters and the Mo is the active component.
Moreover, the sulfides of Co, Ni and Mo are the active phases for HDS and metal Pt is
the active phase for the aromatic hydrogenation reactions. It is known that the function
of Pd in combination with Pt enhances the sulfur tolerance of the noble metals when
supported in zeolite due to electron transfer.
3.4.3.2 Textures
A sample of the powder of the CoMoPtPd/HY (HDS-1), CoMo/PdNiPt-HY (HDS-8)
and CoMoNi/PdPt-HY (HDS-10) catalysts was pressed at 3.0 and 4.5 Ton/cm2 to define
the best condition of the pellets to be tested for their activity test. Table 3.17 shows the
physical properties compared with a CoMo/Al2O3 commercial catalyst. The properties of
the HY fresh zeolite pressed at the same conditions as the other catalysts are included
also.
The physical properties of the HY zeolite are significantly different when noble or
basic metals are introduced by ion exchange. Figures 3.25-3.29 show the comparison of
the experimental catalysts prepared by incipient wetness impregnation and by combining
of incipient wetness impregnation and ion exchange when pressed into 3 and 4.5
Ton/cm2. The HY fresh zeolite pressed at the same conditions is also presented. The
CoMoNi/PdPt-HY (HDS-10) catalyst shows the lowest BET surface area (SA), total
pore volume (TPV), micropore area (MA), and micropore volume (MV) as is shown in
Figures 3.25, 3.26, 3.27 and 3.28 respectivelly.
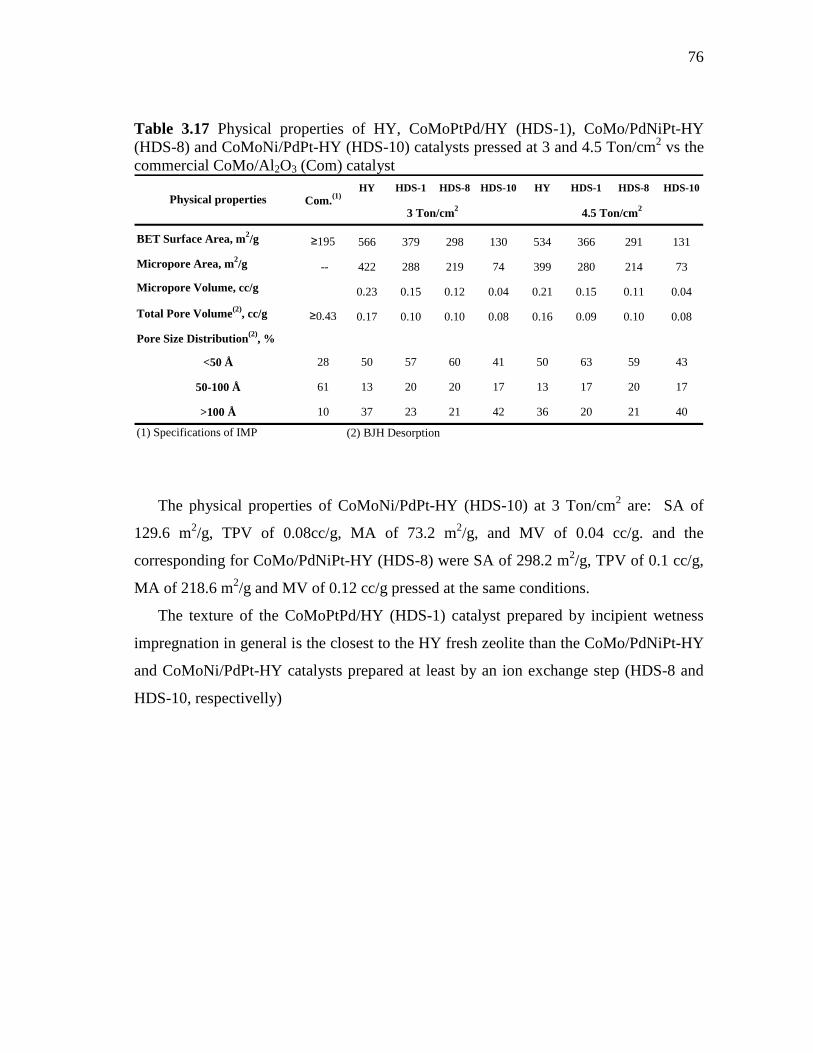
76
Table 3.17 Physical properties of HY, CoMoPtPd/HY (HDS-1), CoMo/PdNiPt-HY (HDS-8) and CoMoNi/PdPt-HY (HDS-10) catalysts pressed at 3 and 4.5 Ton/cm2 vs the commercial CoMo/Al2O3 (Com) catalyst
HY HDS-1 HDS-8 HDS-10 HY HDS-1 HDS-8 HDS-10
BET Surface Area, m2/g ≥195 566 379 298 130 534 366 291 131
Micropore Area, m2/g -- 422 288 219 74 399 280 214 73
Micropore Volume, cc/g 0.23 0.15 0.12 0.04 0.21 0.15 0.11 0.04
Total Pore Volume(2), cc/g ≥0.43 0.17 0.10 0.10 0.08 0.16 0.09 0.10 0.08
Pore Size Distribution(2), %
<50 Å 28 50 57 60 41 50 63 59 43
50-100 Å 61 13 20 20 17 13 17 20 17
>100 Å 10 37 23 21 42 36 20 21 40
(1) Specifications of IMP (2) BJH Desorption
4.5 Ton/cm23 Ton/cm2Physical properties Com.(1)
The physical properties of CoMoNi/PdPt-HY (HDS-10) at 3 Ton/cm2 are: SA of
129.6 m2/g, TPV of 0.08cc/g, MA of 73.2 m2/g, and MV of 0.04 cc/g. and the
corresponding for CoMo/PdNiPt-HY (HDS-8) were SA of 298.2 m2/g, TPV of 0.1 cc/g,
MA of 218.6 m2/g and MV of 0.12 cc/g pressed at the same conditions.
The texture of the CoMoPtPd/HY (HDS-1) catalyst prepared by incipient wetness
impregnation in general is the closest to the HY fresh zeolite than the CoMo/PdNiPt-HY
and CoMoNi/PdPt-HY catalysts prepared at least by an ion exchange step (HDS-8 and
HDS-10, respectivelly)
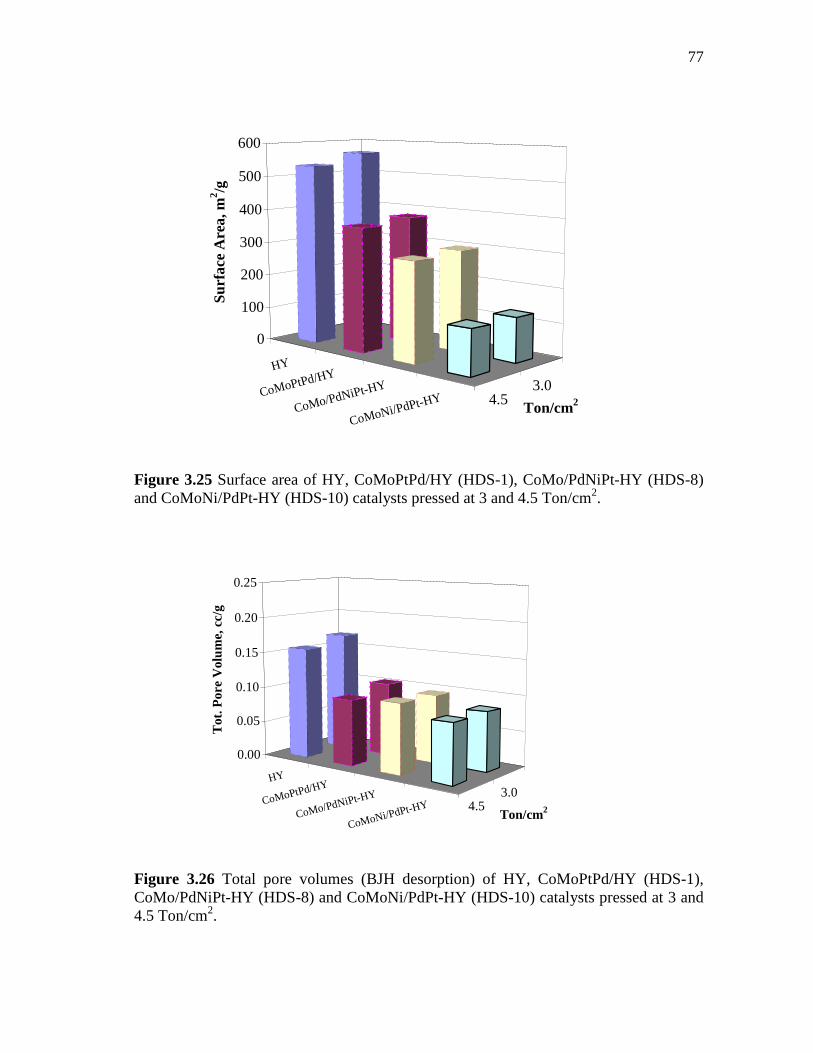
77
3.04.5
HY
CoMoPtPd/HY
CoMo/PdNiPt-HY
CoMoNi/PdPt-HY
0
100
200
300
400
500
600
Sur
face
Are
a, m
2 /g
Ton/cm2
Figure 3.25 Surface area of HY, CoMoPtPd/HY (HDS-1), CoMo/PdNiPt-HY (HDS-8) and CoMoNi/PdPt-HY (HDS-10) catalysts pressed at 3 and 4.5 Ton/cm2.
3.04.5
HY
CoMoPtPd/HY
CoMo/PdNiPt-HY
CoMoNi/PdPt-HY
0.00
0.05
0.10
0.15
0.20
0.25
Tot
. Por
e V
olum
e, c
c/g
Ton/cm2
Figure 3.26 Total pore volumes (BJH desorption) of HY, CoMoPtPd/HY (HDS-1), CoMo/PdNiPt-HY (HDS-8) and CoMoNi/PdPt-HY (HDS-10) catalysts pressed at 3 and 4.5 Ton/cm2.
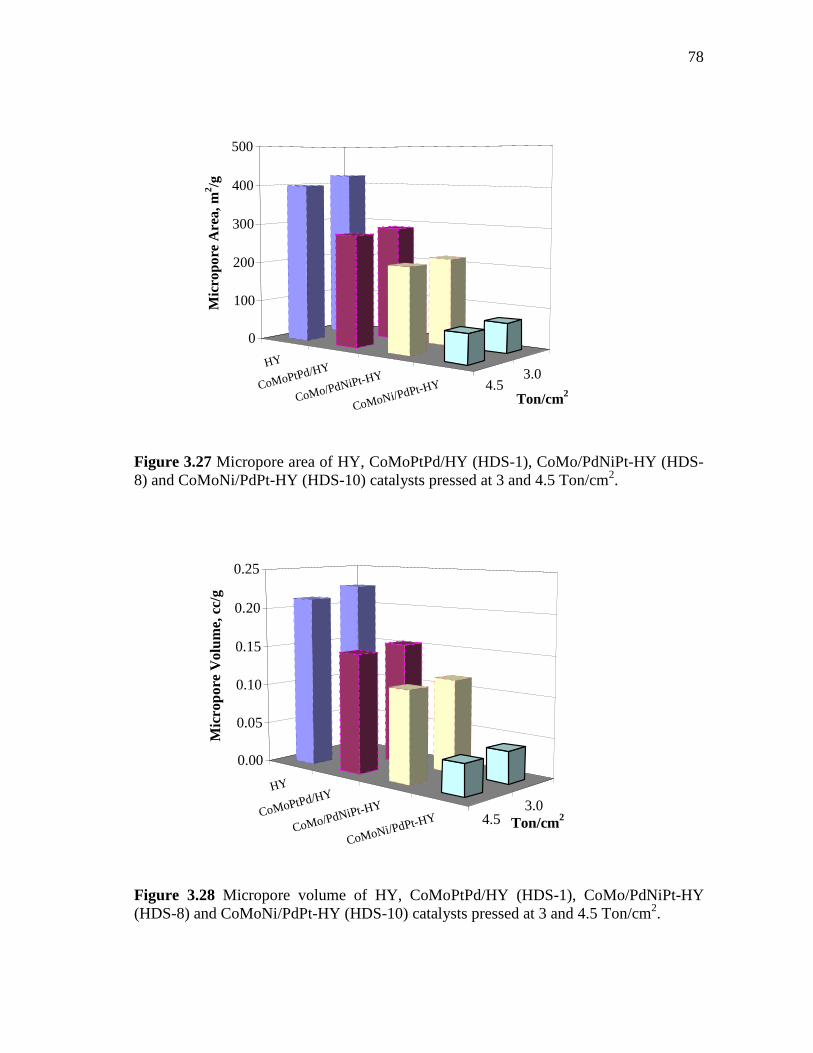
78
3.04.5
HY
CoMoPtPd/HY
CoMo/PdNiPt-HY
CoMoNi/PdPt-HY
0
100
200
300
400
500
Mic
ropo
re A
rea,
m2 /g
Ton/cm2
Figure 3.27 Micropore area of HY, CoMoPtPd/HY (HDS-1), CoMo/PdNiPt-HY (HDS-8) and CoMoNi/PdPt-HY (HDS-10) catalysts pressed at 3 and 4.5 Ton/cm2.
3.04.5
HY
CoMoPtPd/HY
CoMo/PdNiPt-HY
CoMoNi/PdPt-HY
0.00
0.05
0.10
0.15
0.20
0.25
Mic
ropo
re V
olum
e, c
c/g
Ton/cm2
Figure 3.28 Micropore volume of HY, CoMoPtPd/HY (HDS-1), CoMo/PdNiPt-HY (HDS-8) and CoMoNi/PdPt-HY (HDS-10) catalysts pressed at 3 and 4.5 Ton/cm2.
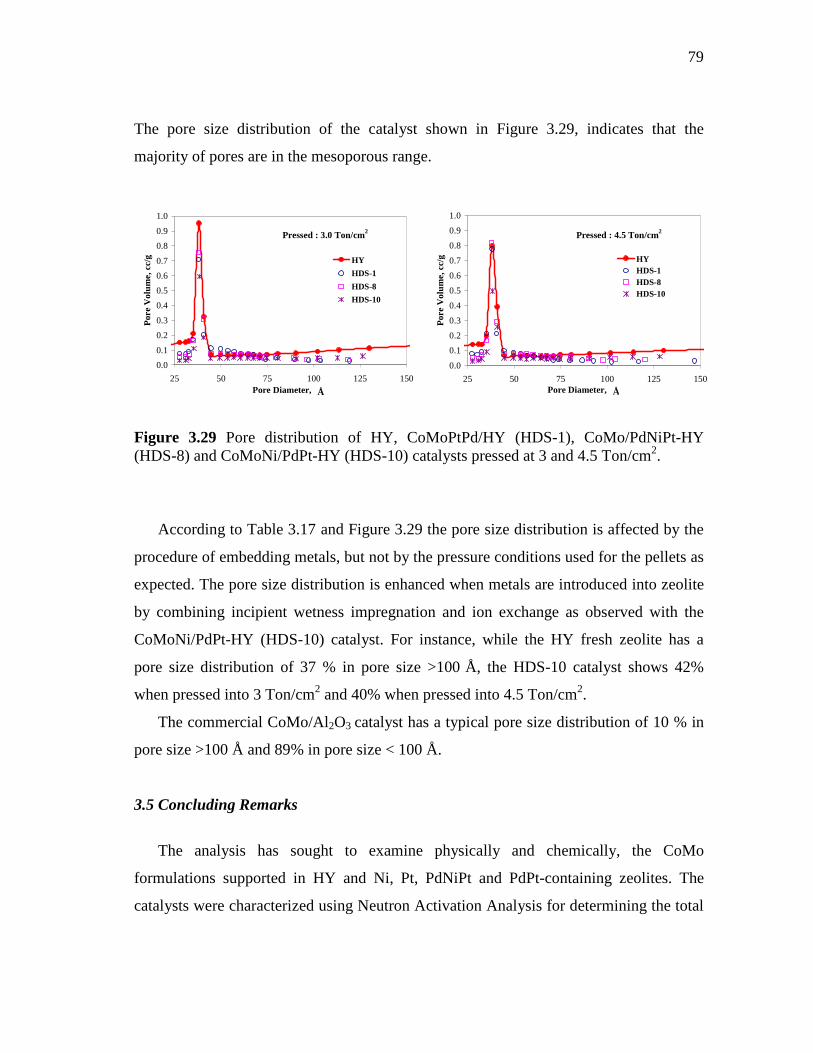
79
The pore size distribution of the catalyst shown in Figure 3.29, indicates that the
majority of pores are in the mesoporous range.
0.0
0.1
0.2
0.3
0.4
0.5
0.6
0.7
0.8
0.9
1.0
25 50 75 100 125 150Pore Diameter,
Por
e V
olum
e, c
c/g
HY
HDS-1
HDS-8
HDS-10
Pressed : 3.0 Ton/cm2
0.0
0.1
0.2
0.3
0.4
0.5
0.6
0.7
0.8
0.9
1.0
25 50 75 100 125 150Pore Diameter,
Por
e V
olum
e, c
c/g
HYHDS-1HDS-8HDS-10
Pressed : 4.5 Ton/cm2
Å Å
Figure 3.29 Pore distribution of HY, CoMoPtPd/HY (HDS-1), CoMo/PdNiPt-HY (HDS-8) and CoMoNi/PdPt-HY (HDS-10) catalysts pressed at 3 and 4.5 Ton/cm2.
According to Table 3.17 and Figure 3.29 the pore size distribution is affected by the
procedure of embedding metals, but not by the pressure conditions used for the pellets as
expected. The pore size distribution is enhanced when metals are introduced into zeolite
by combining incipient wetness impregnation and ion exchange as observed with the
CoMoNi/PdPt-HY (HDS-10) catalyst. For instance, while the HY fresh zeolite has a
pore size distribution of 37 % in pore size >100 Å, the HDS-10 catalyst shows 42%
when pressed into 3 Ton/cm2 and 40% when pressed into 4.5 Ton/cm2.
The commercial CoMo/Al2O3 catalyst has a typical pore size distribution of 10 % in
pore size >100 Å and 89% in pore size < 100 Å.
3.5 Concluding Remarks
The analysis has sought to examine physically and chemically, the CoMo
formulations supported in HY and Ni, Pt, PdNiPt and PdPt-containing zeolites. The
catalysts were characterized using Neutron Activation Analysis for determining the total
80
metal loading. Based on the BET method, surface area, pore volume, pore size
distribution, micropore area and micropore volume, all catalysts were also analyzed.
The CoMoNi/PdPt-HY (HDS-10) and CoMoPd/Pt-HY (HDS-5) catalysts prepared
from the PdPt-HY show good metal contents with a pore size distribution greater than
40% in pore size >50 Å. The noble metal concentration (Pt+Pd) was greater than 0.6
wt%. So, it is believed that these catalysts could have good performance not only in the
hydrodesulfurization reactions, but also in the hydrogenation reactions.
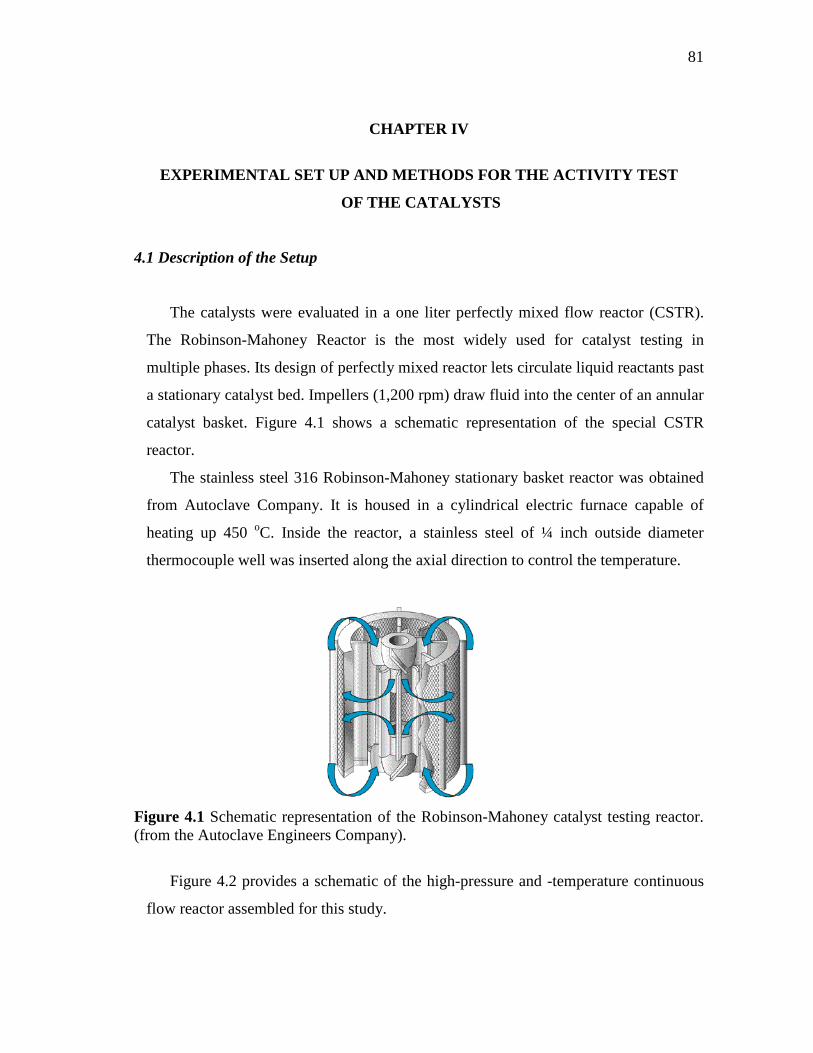
81
CHAPTER IV
EXPERIMENTAL SET UP AND METHODS FOR THE ACTIVITY TE ST
OF THE CATALYSTS
4.1 Description of the Setup
The catalysts were evaluated in a one liter perfectly mixed flow reactor (CSTR).
The Robinson-Mahoney Reactor is the most widely used for catalyst testing in
multiple phases. Its design of perfectly mixed reactor lets circulate liquid reactants past
a stationary catalyst bed. Impellers (1,200 rpm) draw fluid into the center of an annular
catalyst basket. Figure 4.1 shows a schematic representation of the special CSTR
reactor.
The stainless steel 316 Robinson-Mahoney stationary basket reactor was obtained
from Autoclave Company. It is housed in a cylindrical electric furnace capable of
heating up 450 oC. Inside the reactor, a stainless steel of ¼ inch outside diameter
thermocouple well was inserted along the axial direction to control the temperature.
Figure 4.1 Schematic representation of the Robinson-Mahoney catalyst testing reactor. (from the Autoclave Engineers Company).
Figure 4.2 provides a schematic of the high-pressure and -temperature continuous
flow reactor assembled for this study.
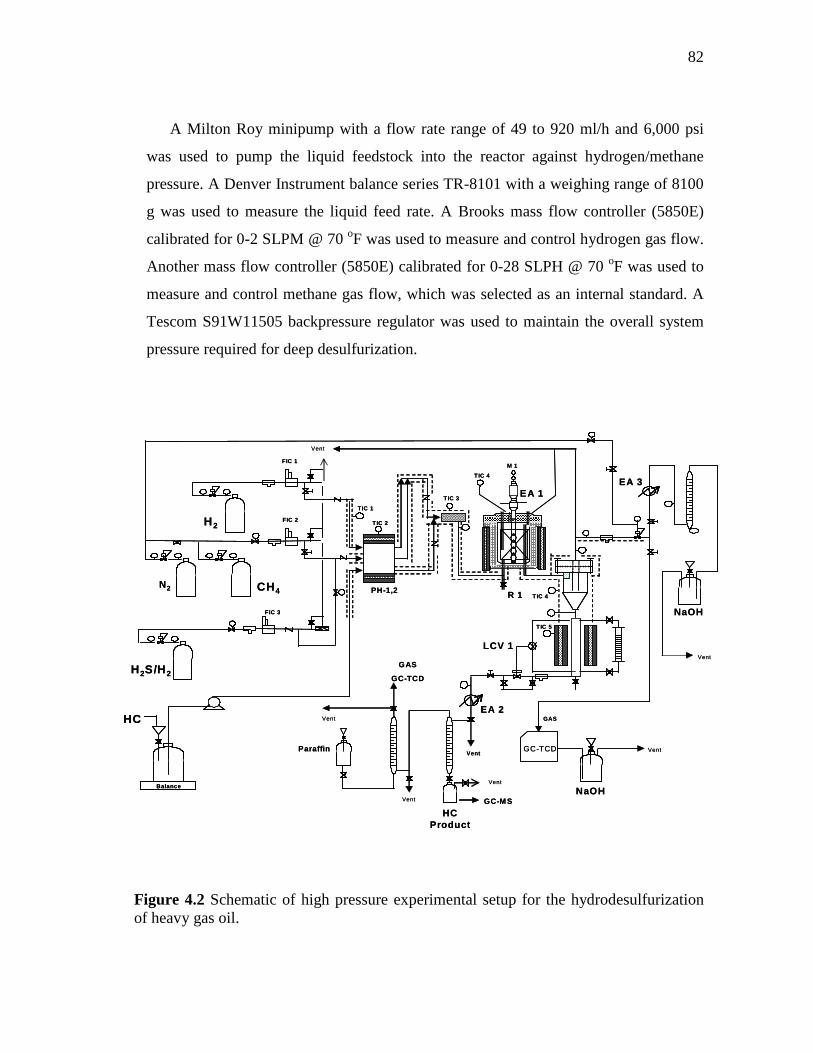
82
A Milton Roy minipump with a flow rate range of 49 to 920 ml/h and 6,000 psi
was used to pump the liquid feedstock into the reactor against hydrogen/methane
pressure. A Denver Instrument balance series TR-8101 with a weighing range of 8100
g was used to measure the liquid feed rate. A Brooks mass flow controller (5850E)
calibrated for 0-2 SLPM @ 70 oF was used to measure and control hydrogen gas flow.
Another mass flow controller (5850E) calibrated for 0-28 SLPH @ 70 oF was used to
measure and control methane gas flow, which was selected as an internal standard. A
Tescom S91W11505 backpressure regulator was used to maintain the overall system
pressure required for deep desulfurization.
Figure 4.2 Schematic of high pressure experimental setup for the hydrodesulfurization of heavy gas oil.
N2
H2S/H2
FIC 1
FIC 2
FIC 3
R 1
EA 1EA 3
Vent
M 1
Balance
H2
HC Vent
Vent
Vent
NaOH
CH4 PH-1,2
TIC 1
TIC 2
TIC 3
TIC 4
TIC 4
GC-TCD
EA 2
LCV 1
NaOH
Vent
Vent
GAS
GC-TCD
GC-M S
TIC 5
Vent
Paraffin
HC Product
GAS
N2
H2S/H2
FIC 1
FIC 2
FIC 3
R 1
EA 1EA 3
Vent
M 1
Balance
H2
HC Vent
Vent
Vent
NaOH
CH4 PH-1,2
TIC 1
TIC 2
TIC 3
TIC 4
TIC 4
GC-TCD
EA 2
LCV 1
NaOH
Vent
Vent
GAS
GC-TCD
GC-M S
TIC 5
Vent
Paraffin
HC Product
GAS
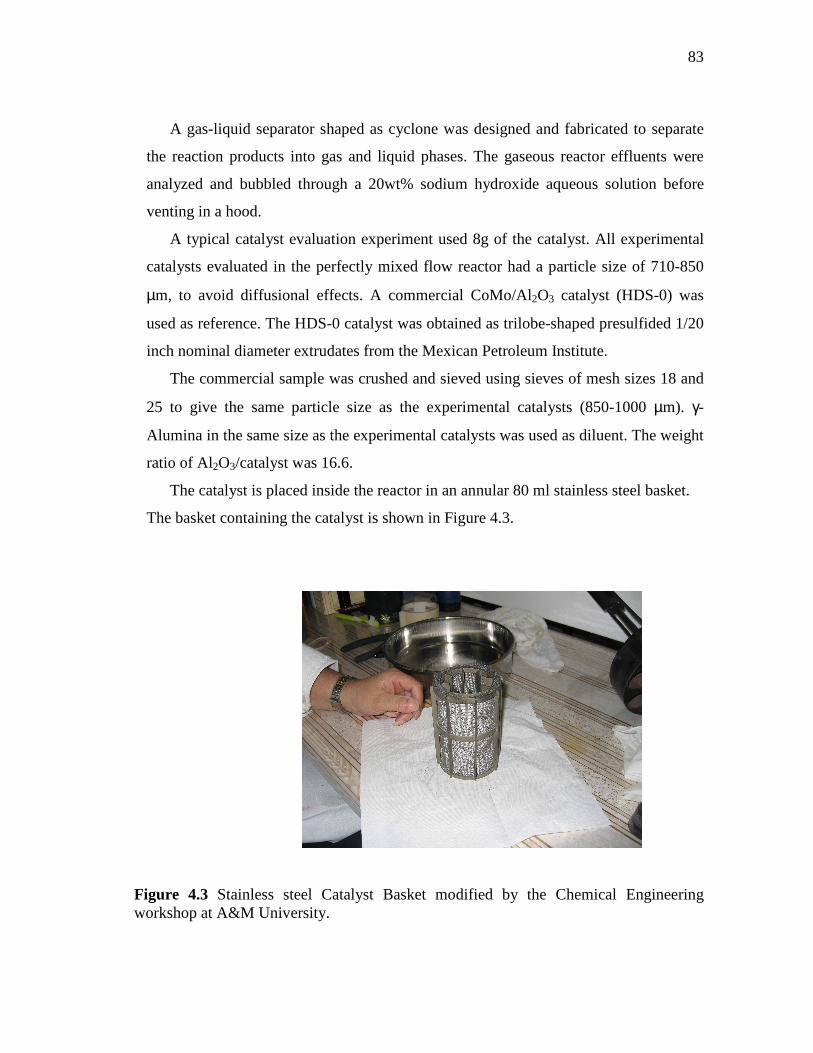
83
A gas-liquid separator shaped as cyclone was designed and fabricated to separate
the reaction products into gas and liquid phases. The gaseous reactor effluents were
analyzed and bubbled through a 20wt% sodium hydroxide aqueous solution before
venting in a hood.
A typical catalyst evaluation experiment used 8g of the catalyst. All experimental
catalysts evaluated in the perfectly mixed flow reactor had a particle size of 710-850
µm, to avoid diffusional effects. A commercial CoMo/Al 2O3 catalyst (HDS-0) was
used as reference. The HDS-0 catalyst was obtained as trilobe-shaped presulfided 1/20
inch nominal diameter extrudates from the Mexican Petroleum Institute.
The commercial sample was crushed and sieved using sieves of mesh sizes 18 and
25 to give the same particle size as the experimental catalysts (850-1000 µm). γ-
Alumina in the same size as the experimental catalysts was used as diluent. The weight
ratio of Al2O3/catalyst was 16.6.
The catalyst is placed inside the reactor in an annular 80 ml stainless steel basket.
The basket containing the catalyst is shown in Figure 4.3.
Figure 4.3 Stainless steel Catalyst Basket modified by the Chemical Engineering workshop at A&M University.
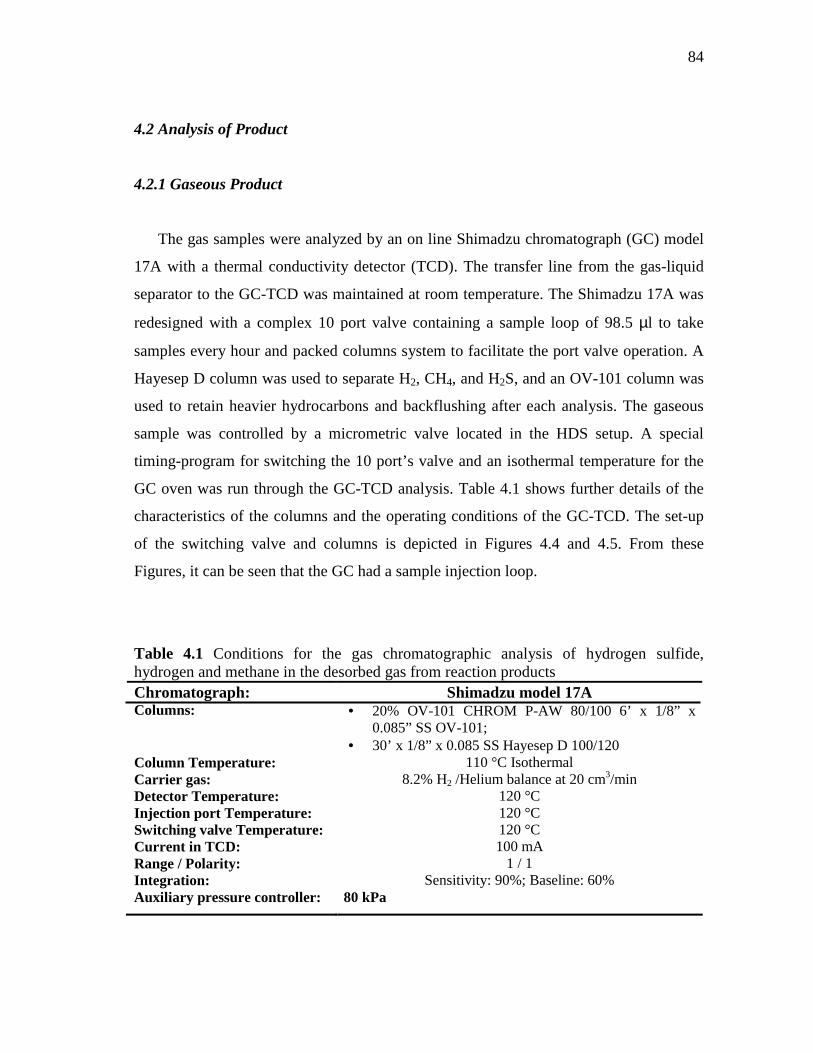
84
4.2 Analysis of Product
4.2.1 Gaseous Product
The gas samples were analyzed by an on line Shimadzu chromatograph (GC) model
17A with a thermal conductivity detector (TCD). The transfer line from the gas-liquid
separator to the GC-TCD was maintained at room temperature. The Shimadzu 17A was
redesigned with a complex 10 port valve containing a sample loop of 98.5 µl to take
samples every hour and packed columns system to facilitate the port valve operation. A
Hayesep D column was used to separate H2, CH4, and H2S, and an OV-101 column was
used to retain heavier hydrocarbons and backflushing after each analysis. The gaseous
sample was controlled by a micrometric valve located in the HDS setup. A special
timing-program for switching the 10 port’s valve and an isothermal temperature for the
GC oven was run through the GC-TCD analysis. Table 4.1 shows further details of the
characteristics of the columns and the operating conditions of the GC-TCD. The set-up
of the switching valve and columns is depicted in Figures 4.4 and 4.5. From these
Figures, it can be seen that the GC had a sample injection loop.
Table 4.1 Conditions for the gas chromatographic analysis of hydrogen sulfide, hydrogen and methane in the desorbed gas from reaction products Chromatograph: Shimadzu model 17A Columns: • 20% OV-101 CHROM P-AW 80/100 6’ x 1/8” x
0.085” SS OV-101; • 30’ x 1/8” x 0.085 SS Hayesep D 100/120
Column Temperature: 110 °C Isothermal Carrier gas: 8.2% H2 /Helium balance at 20 cm3/min Detector Temperature: 120 °C Injection port Temperature: 120 °C Switching valve Temperature: 120 °C Current in TCD: 100 mA Range / Polarity: 1 / 1 Integration: Sensitivity: 90%; Baseline: 60% Auxiliary pressure controller: 80 kPa
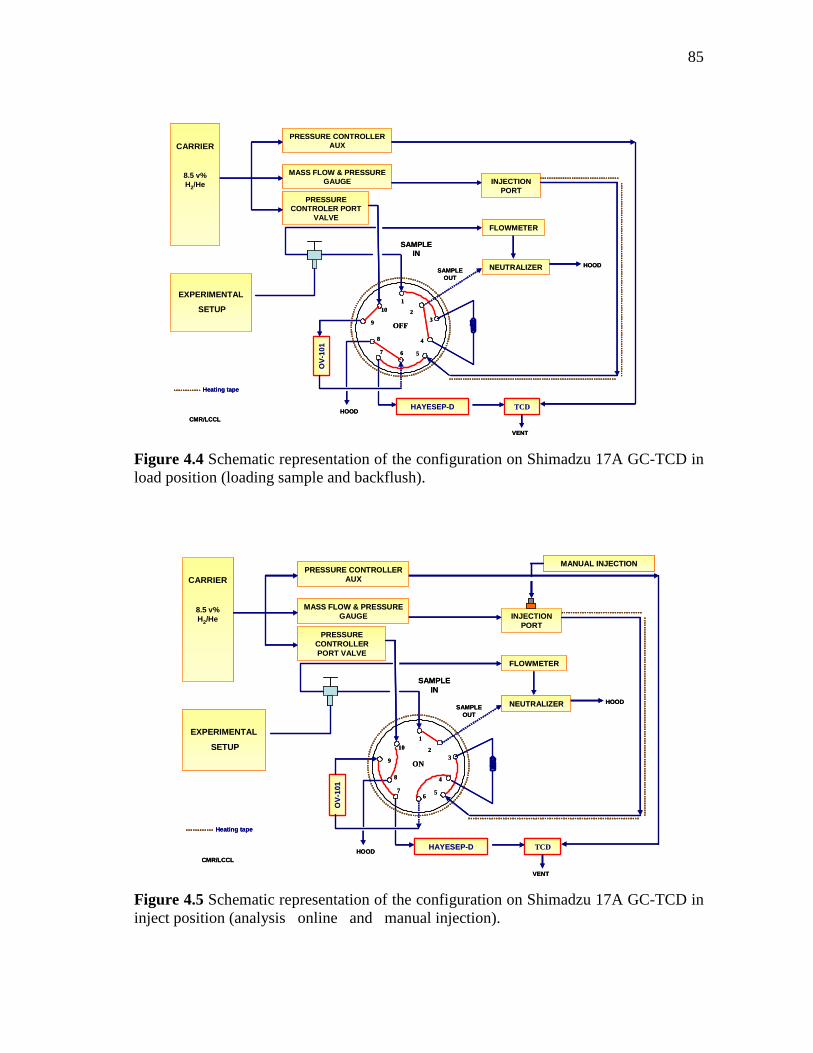
85
Figure 4.4 Schematic representation of the configuration on Shimadzu 17A GC-TCD in load position (loading sample and backflush). Figure 4.5 Schematic representation of the configuration on Shimadzu 17A GC-TCD in inject position (analysis online and manual injection).
3
6
9
1
210
OFF
57
48
OV
-101
HAYESEP-D TCDHOOD
SAMPLE IN
SAMPLE OUT
PRESSURE CONTROLLER AUX
MASS FLOW & PRESSURE GAUGE
PRESSURE CONTROLER PORT
VALVE
NEUTRALIZER HOOD
INJECTION PORT
CARRIER
8.5 v% H2/He
EXPERIMENTAL
SETUP
FLOWMETER
VENT
CMR/LCCL
Heating tape
3
6
9
1
210
OFF
57
48
OV
-101
HAYESEP-D TCDHOOD
SAMPLE IN
SAMPLE OUT
PRESSURE CONTROLLER AUX
MASS FLOW & PRESSURE GAUGE
PRESSURE CONTROLER PORT
VALVE
NEUTRALIZER HOOD
INJECTION PORT
CARRIER
8.5 v% H2/He
EXPERIMENTAL
SETUP
FLOWMETER
VENT
CMR/LCCL
Heating tape
3
6
9
1
210
ON
57
48
OV
-101
HAYESEP-D TCDHOOD
SAMPLE IN
SAMPLE OUT
PRESSURE CONTROLLER AUX
MASS FLOW & PRESSURE GAUGE
PRESSURE CONTROLLER PORT VALVE
NEUTRALIZER HOOD
INJECTION PORT
CARRIER
8.5 v% H2/He
EXPERIMENTAL
SETUP
FLOWMETER
VENT
CMR/LCCL
Heating tape
MANUAL INJECTION
3
6
9
1
210
ON
57
48
OV
-101
HAYESEP-D TCDHOOD
SAMPLE IN
SAMPLE OUT
PRESSURE CONTROLLER AUX
MASS FLOW & PRESSURE GAUGE
PRESSURE CONTROLLER PORT VALVE
NEUTRALIZER HOOD
INJECTION PORT
CARRIER
8.5 v% H2/He
EXPERIMENTAL
SETUP
FLOWMETER
VENT
CMR/LCCL
Heating tape
MANUAL INJECTIONMANUAL INJECTION
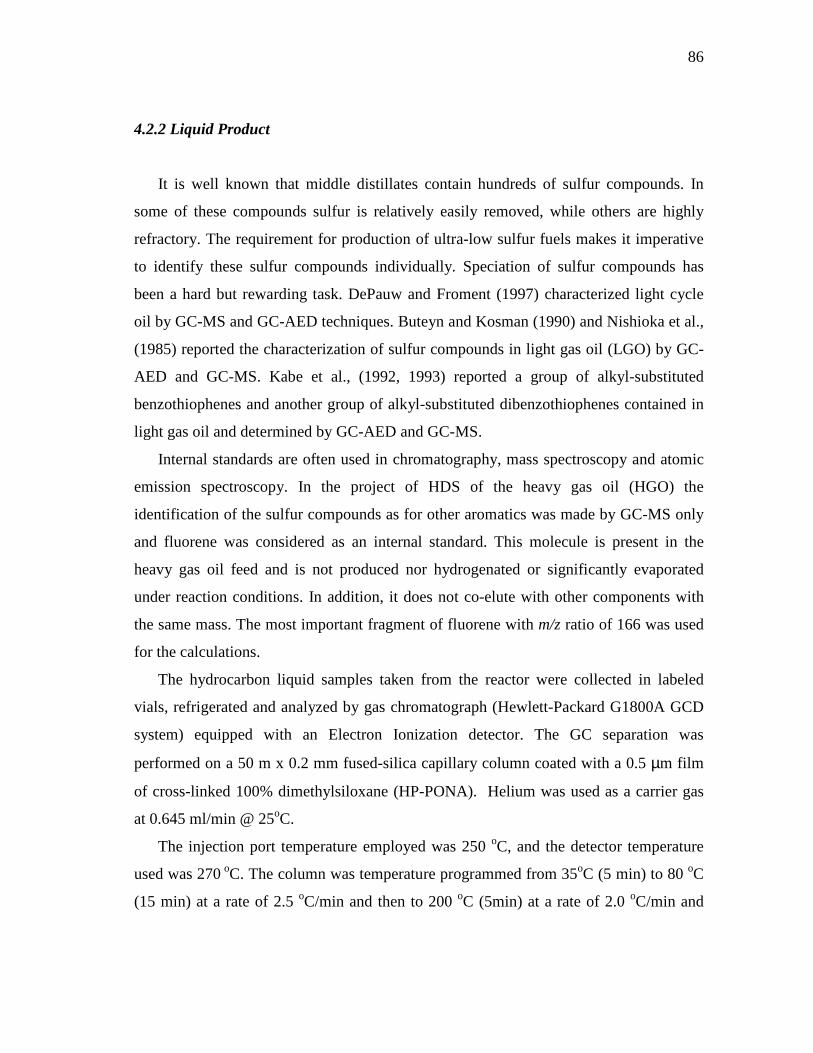
86
4.2.2 Liquid Product
It is well known that middle distillates contain hundreds of sulfur compounds. In
some of these compounds sulfur is relatively easily removed, while others are highly
refractory. The requirement for production of ultra-low sulfur fuels makes it imperative
to identify these sulfur compounds individually. Speciation of sulfur compounds has
been a hard but rewarding task. DePauw and Froment (1997) characterized light cycle
oil by GC-MS and GC-AED techniques. Buteyn and Kosman (1990) and Nishioka et al.,
(1985) reported the characterization of sulfur compounds in light gas oil (LGO) by GC-
AED and GC-MS. Kabe et al., (1992, 1993) reported a group of alkyl-substituted
benzothiophenes and another group of alkyl-substituted dibenzothiophenes contained in
light gas oil and determined by GC-AED and GC-MS.
Internal standards are often used in chromatography, mass spectroscopy and atomic
emission spectroscopy. In the project of HDS of the heavy gas oil (HGO) the
identification of the sulfur compounds as for other aromatics was made by GC-MS only
and fluorene was considered as an internal standard. This molecule is present in the
heavy gas oil feed and is not produced nor hydrogenated or significantly evaporated
under reaction conditions. In addition, it does not co-elute with other components with
the same mass. The most important fragment of fluorene with m/z ratio of 166 was used
for the calculations.
The hydrocarbon liquid samples taken from the reactor were collected in labeled
vials, refrigerated and analyzed by gas chromatograph (Hewlett-Packard G1800A GCD
system) equipped with an Electron Ionization detector. The GC separation was
performed on a 50 m x 0.2 mm fused-silica capillary column coated with a 0.5 µm film
of cross-linked 100% dimethylsiloxane (HP-PONA). Helium was used as a carrier gas
at 0.645 ml/min @ 25oC.
The injection port temperature employed was 250 oC, and the detector temperature
used was 270 oC. The column was temperature programmed from 35oC (5 min) to 80 oC
(15 min) at a rate of 2.5 oC/min and then to 200 oC (5min) at a rate of 2.0 oC/min and
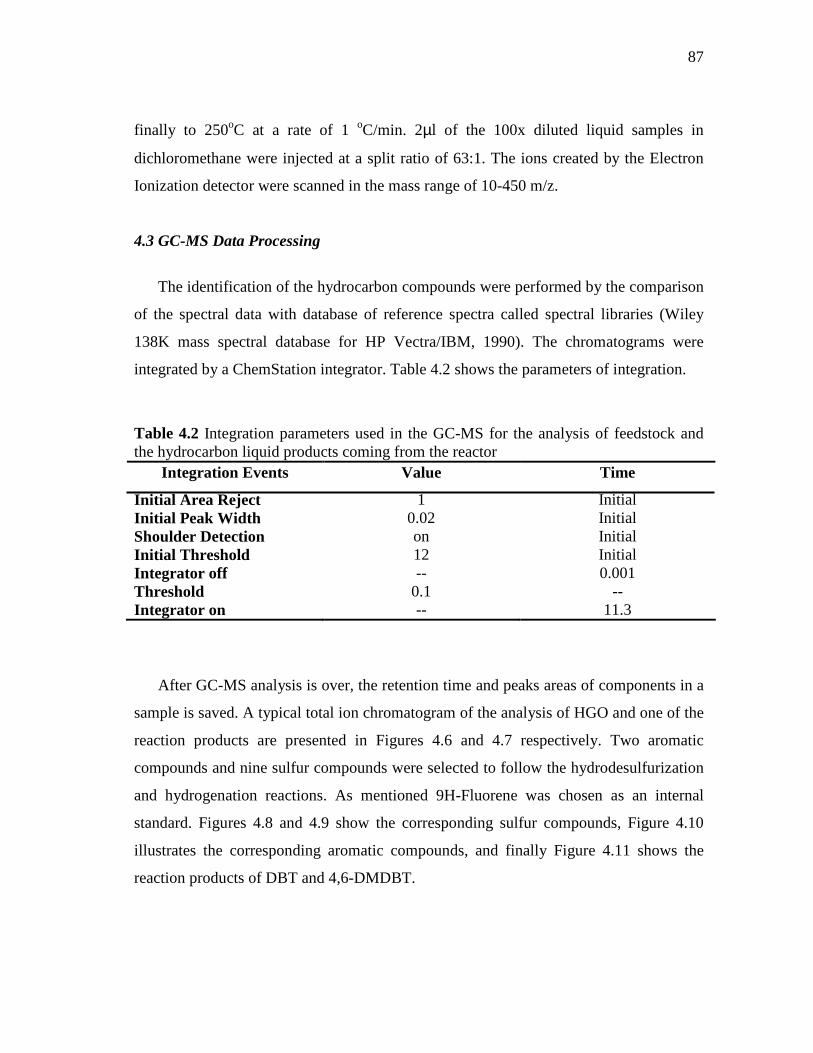
87
finally to 250oC at a rate of 1 oC/min. 2µl of the 100x diluted liquid samples in
dichloromethane were injected at a split ratio of 63:1. The ions created by the Electron
Ionization detector were scanned in the mass range of 10-450 m/z.
4.3 GC-MS Data Processing
The identification of the hydrocarbon compounds were performed by the comparison
of the spectral data with database of reference spectra called spectral libraries (Wiley
138K mass spectral database for HP Vectra/IBM, 1990). The chromatograms were
integrated by a ChemStation integrator. Table 4.2 shows the parameters of integration.
Table 4.2 Integration parameters used in the GC-MS for the analysis of feedstock and the hydrocarbon liquid products coming from the reactor
Integration Events Value Time
Initial Area Reject 1 Initial Initial Peak Width 0.02 Initial Shoulder Detection on Initial Initial Threshold 12 Initial Integrator off -- 0.001 Threshold 0.1 -- Integrator on -- 11.3
After GC-MS analysis is over, the retention time and peaks areas of components in a
sample is saved. A typical total ion chromatogram of the analysis of HGO and one of the
reaction products are presented in Figures 4.6 and 4.7 respectively. Two aromatic
compounds and nine sulfur compounds were selected to follow the hydrodesulfurization
and hydrogenation reactions. As mentioned 9H-Fluorene was chosen as an internal
standard. Figures 4.8 and 4.9 show the corresponding sulfur compounds, Figure 4.10
illustrates the corresponding aromatic compounds, and finally Figure 4.11 shows the
reaction products of DBT and 4,6-DMDBT.
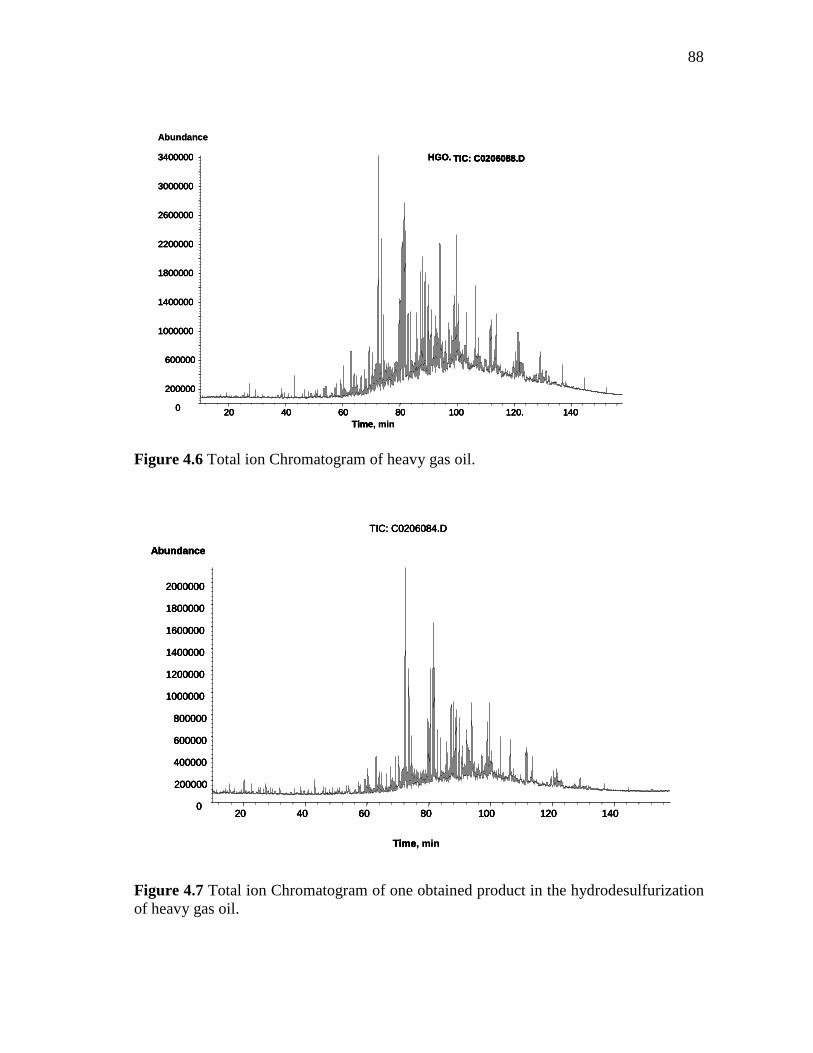
88
Figure 4.6 Total ion Chromatogram of heavy gas oil.
Figure 4.7 Total ion Chromatogram of one obtained product in the hydrodesulfurization of heavy gas oil.
20 40 60 80 100 120. 1400
200000
600000
1000000
1400000
1800000
2200000
2600000
3000000
3400000
Time
HGO. TIC: C0206088.D
20 40 60 80 100 120. 1400
200000
600000
1000000
1400000
1800000
2200000
2600000
3000000
3400000
Time, min
Abundance
HGO. TIC: C0206088.D
20 40 60 80 100 120. 1400
200000
600000
1000000
1400000
1800000
2200000
2600000
3000000
3400000
Time
HGO. TIC: C0206088.D
20 40 60 80 100 120. 1400
200000
600000
1000000
1400000
1800000
2200000
2600000
3000000
3400000
Time, min
Abundance
HGO. TIC: C0206088.D
20 40 60 80 100 120 1400
200000
400000
600000
800000
1000000
1200000
1400000
1600000
1800000
2000000
Time
Abundance
TIC: C0206084.D
20 40 60 80 100 120 1400
200000
400000
600000
800000
1000000
1200000
1400000
1600000
1800000
2000000
Time, min
Abundance
TIC: C0206084.D
20 40 60 80 100 120 1400
200000
400000
600000
800000
1000000
1200000
1400000
1600000
1800000
2000000
Time
Abundance
TIC: C0206084.D
20 40 60 80 100 120 1400
200000
400000
600000
800000
1000000
1200000
1400000
1600000
1800000
2000000
Time, min
Abundance
TIC: C0206084.D
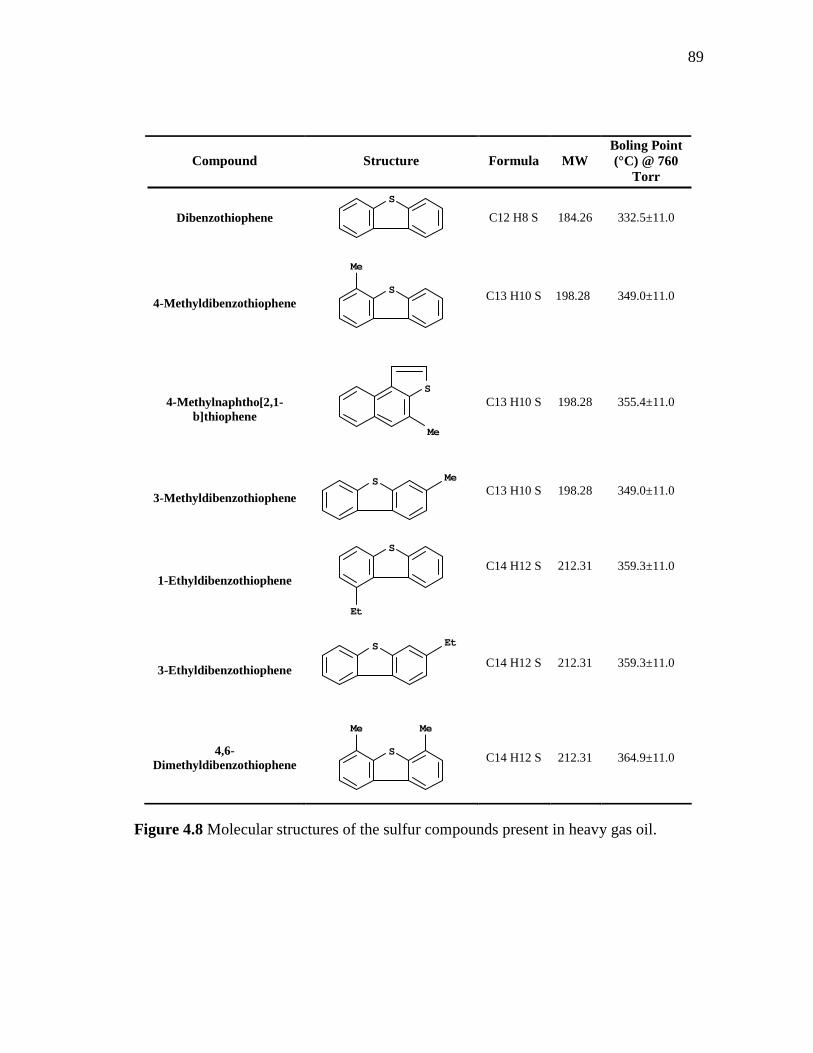
89
Compound Structure Formula MW Boling Point (°C) @ 760
Torr
Dibenzothiophene
S
C12 H8 S 184.26 332.5±11.0
4-Methyldibenzothiophene
Me
S
C13 H10 S
198.28
349.0±11.0
4-Methylnaphtho[2,1-b]thiophene
Me
S
C13 H10 S
198.28
355.4±11.0
3-Methyldibenzothiophene
MeS
C13 H10 S
198.28
349.0±11.0
1-Ethyldibenzothiophene
Et
S
C14 H12 S
212.31
359.3±11.0
3-Ethyldibenzothiophene
EtS
C14 H12 S
212.31
359.3±11.0
4,6-Dimethyldibenzothiophene
Me Me
S
C14 H12 S 212.31 364.9±11.0
Figure 4.8 Molecular structures of the sulfur compounds present in heavy gas oil.
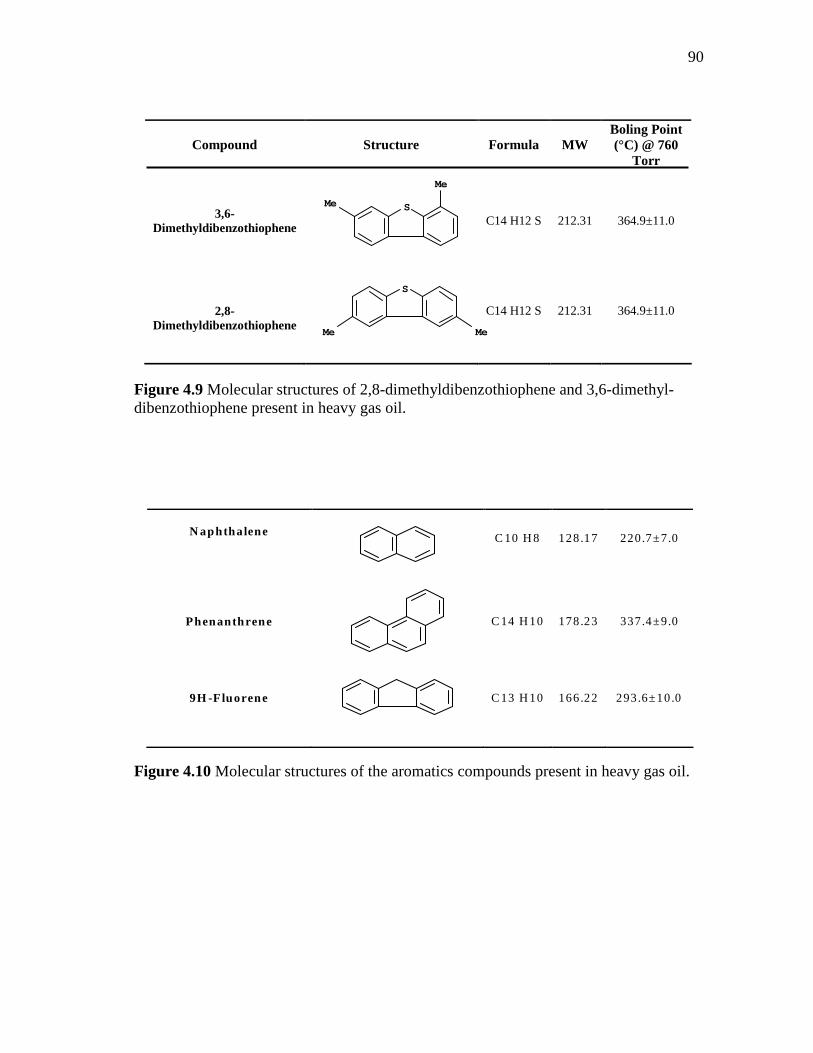
90
Compound Structure Formula MW Boling Point (°C) @ 760
Torr
3,6-Dimethyldibenzothiophene
Me
Me S
C14 H12 S
212.31
364.9±11.0
2,8-Dimethyldibenzothiophene
MeMe
S
C14 H12 S
212.31
364.9±11.0
Figure 4.9 Molecular structures of 2,8-dimethyldibenzothiophene and 3,6-dimethyl- dibenzothiophene present in heavy gas oil.
N aphthalene
C 10 H8
128.17
220.7±7.0
Phenanthrene
C14 H10 178.23 337.4±9.0
9H -F luorene
C13 H10
166.22
293.6±10.0
Figure 4.10 Molecular structures of the aromatics compounds present in heavy gas oil.
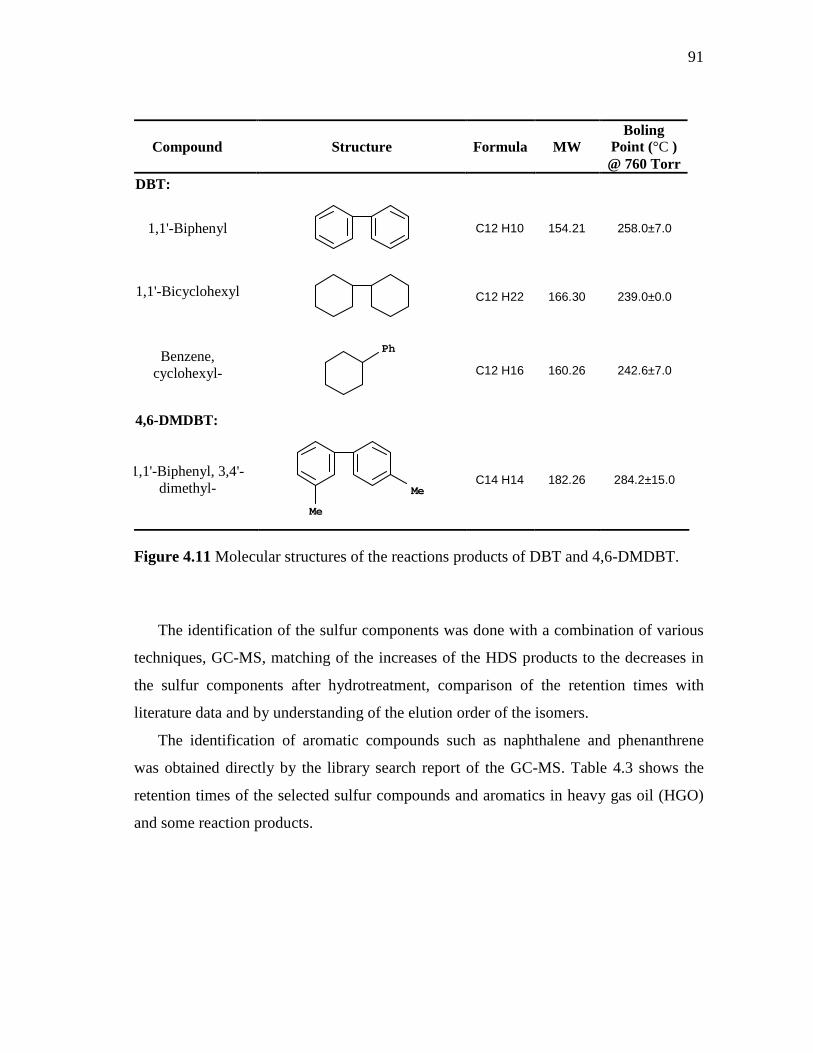
91
Compound Structure Formula MW Boling
Point (°C ) @ 760 Torr
DBT:
1,1'-Biphenyl
C12 H10 154.21 258.0±7.0
1,1'-Bicyclohexyl
C12 H22 166.30 239.0±0.0
Benzene,
cyclohexyl-
Ph
C12 H16 160.26 242.6±7.0
4,6-DMDBT:
1,1'-Biphenyl, 3,4'-dimethyl-
Me
Me
C14 H14 182.26 284.2±15.0
Figure 4.11 Molecular structures of the reactions products of DBT and 4,6-DMDBT.
The identification of the sulfur components was done with a combination of various
techniques, GC-MS, matching of the increases of the HDS products to the decreases in
the sulfur components after hydrotreatment, comparison of the retention times with
literature data and by understanding of the elution order of the isomers.
The identification of aromatic compounds such as naphthalene and phenanthrene
was obtained directly by the library search report of the GC-MS. Table 4.3 shows the
retention times of the selected sulfur compounds and aromatics in heavy gas oil (HGO)
and some reaction products.
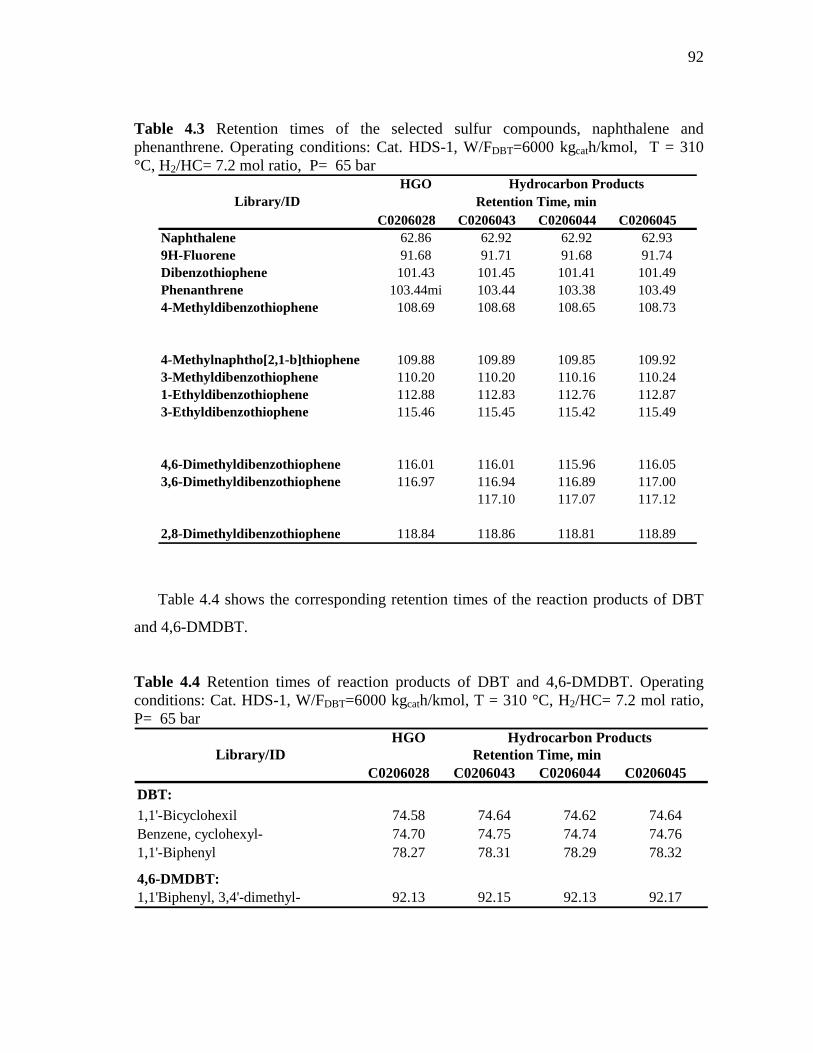
92
Table 4.3 Retention times of the selected sulfur compounds, naphthalene and phenanthrene. Operating conditions: Cat. HDS-1, W/FDBT=6000 kgcath/kmol, T = 310 °C, H2/HC= 7.2 mol ratio, P= 65 bar
HGO
C0206028 C0206043 C0206044 C0206045Naphthalene 62.86 62.92 62.92 62.939H-Fluorene 91.68 91.71 91.68 91.74Dibenzothiophene 101.43 101.45 101.41 101.49Phenanthrene 103.44mi 103.44 103.38 103.494-Methyldibenzothiophene 108.69 108.68 108.65 108.73
4-Methylnaphtho[2,1-b]thiophene 109.88 109.89 109.85 109.923-Methyldibenzothiophene 110.20 110.20 110.16 110.241-Ethyldibenzothiophene 112.88 112.83 112.76 112.873-Ethyldibenzothiophene 115.46 115.45 115.42 115.49
4,6-Dimethyldibenzothiophene 116.01 116.01 115.96 116.053,6-Dimethyldibenzothiophene 116.97 116.94 116.89 117.00
117.10 117.07 117.12
2,8-Dimethyldibenzothiophene 118.84 118.86 118.81 118.89
Hydrocarbon ProductsRetention Time, minLibrary/ID
Table 4.4 shows the corresponding retention times of the reaction products of DBT
and 4,6-DMDBT.
Table 4.4 Retention times of reaction products of DBT and 4,6-DMDBT. Operating conditions: Cat. HDS-1, W/FDBT=6000 kgcath/kmol, T = 310 °C, H2/HC= 7.2 mol ratio, P= 65 bar
HGO
C0206028 C0206043 C0206044 C0206045
DBT:1,1'-Bicyclohexil 74.58 74.64 74.62 74.64Benzene, cyclohexyl- 74.70 74.75 74.74 74.761,1'-Biphenyl 78.27 78.31 78.29 78.32
4,6-DMDBT:1,1'Biphenyl, 3,4'-dimethyl- 92.13 92.15 92.13 92.17
Library/IDHydrocarbon Products
Retention Time, min
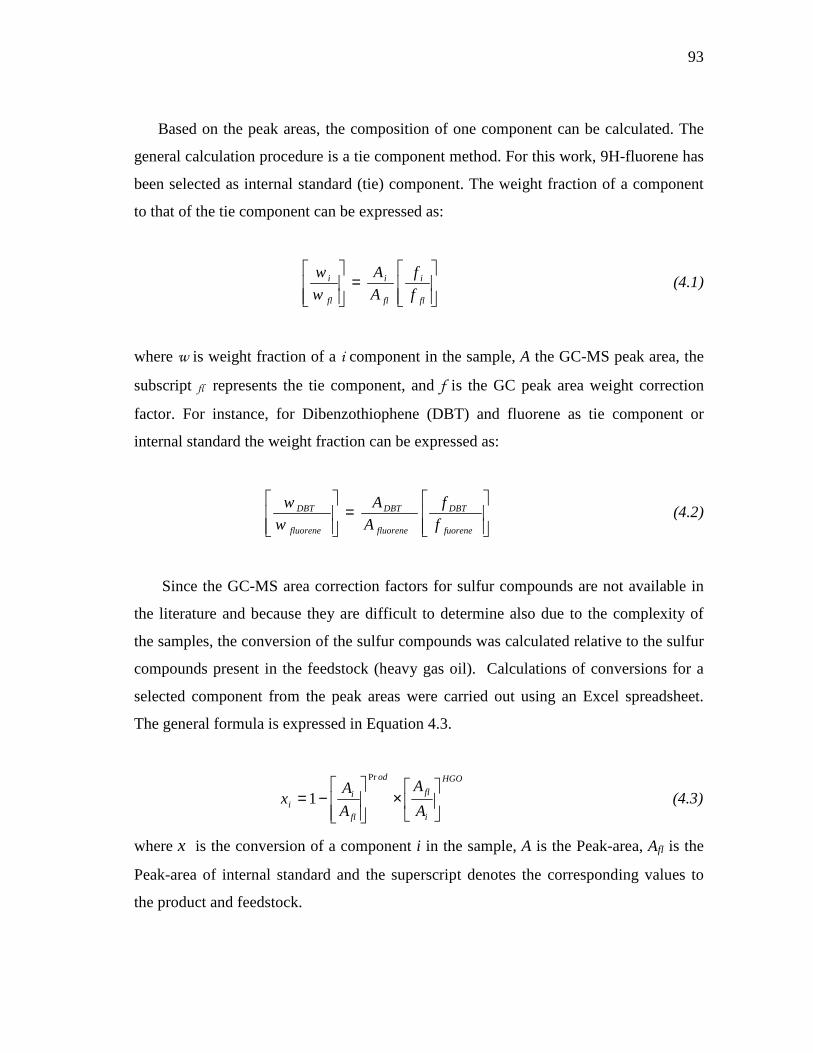
93
Based on the peak areas, the composition of one component can be calculated. The
general calculation procedure is a tie component method. For this work, 9H-fluorene has
been selected as internal standard (tie) component. The weight fraction of a component
to that of the tie component can be expressed as:
=
fl
i
fl
i
fl
i
f
f
A
A
w
w (4.1)
where w is weight fraction of a i component in the sample, A the GC-MS peak area, the
subscript fl represents the tie component, and f is the GC peak area weight correction
factor. For instance, for Dibenzothiophene (DBT) and fluorene as tie component or
internal standard the weight fraction can be expressed as:
=
fuorene
DBT
fluorene
DBT
fluorene
DBT
f
f
A
A
w
w (4.2)
Since the GC-MS area correction factors for sulfur compounds are not available in
the literature and because they are difficult to determine also due to the complexity of
the samples, the conversion of the sulfur compounds was calculated relative to the sulfur
compounds present in the feedstock (heavy gas oil). Calculations of conversions for a
selected component from the peak areas were carried out using an Excel spreadsheet.
The general formula is expressed in Equation 4.3.
HGO
i
fl
od
fl
ii A
A
A
Ax
×
−=
Pr
1 (4.3)
where x is the conversion of a component i in the sample, A is the Peak-area, Afl is the
Peak-area of internal standard and the superscript denotes the corresponding values to
the product and feedstock.
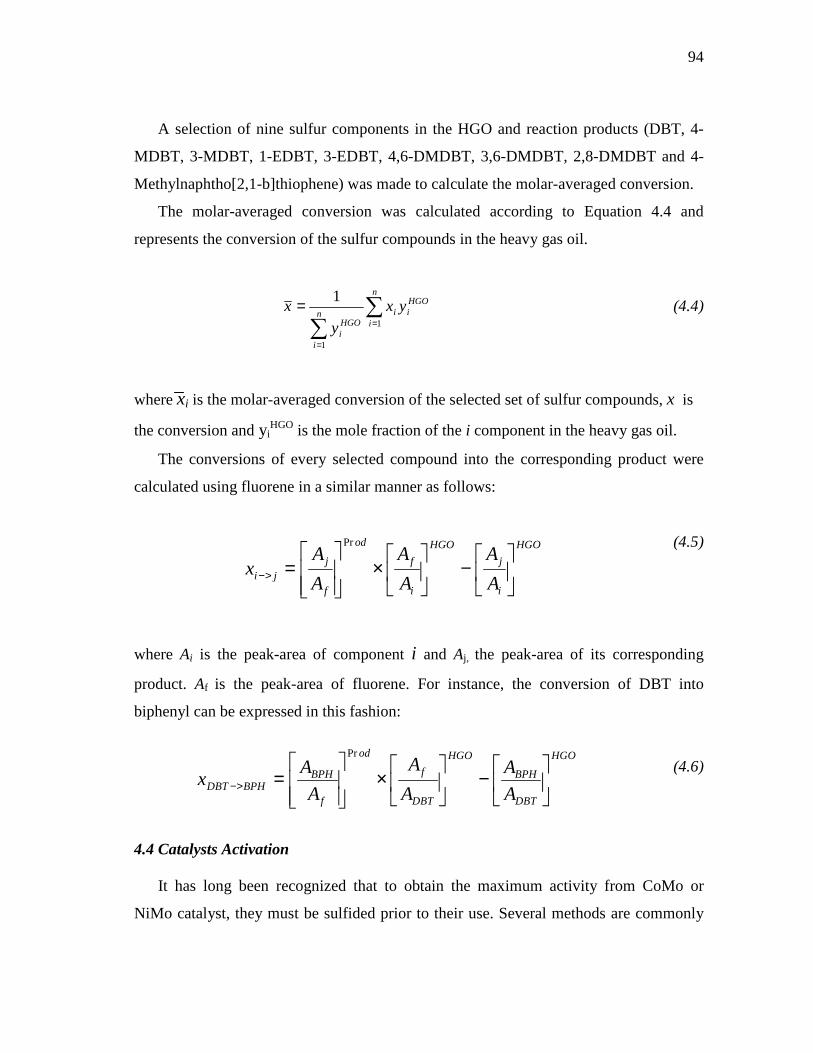
94
A selection of nine sulfur components in the HGO and reaction products (DBT, 4-
MDBT, 3-MDBT, 1-EDBT, 3-EDBT, 4,6-DMDBT, 3,6-DMDBT, 2,8-DMDBT and 4-
Methylnaphtho[2,1-b]thiophene) was made to calculate the molar-averaged conversion.
The molar-averaged conversion was calculated according to Equation 4.4 and
represents the conversion of the sulfur compounds in the heavy gas oil.
∑∑ =
=
=n
i
HGOiin
i
HGOi
yxy
x1
1
1 (4.4)
where xi is the molar-averaged conversion of the selected set of sulfur compounds, x is
the conversion and yiHGO is the mole fraction of the i component in the heavy gas oil.
The conversions of every selected compound into the corresponding product were
calculated using fluorene in a similar manner as follows:
(4.5)
where Ai is the peak-area of component i and Aj, the peak-area of its corresponding
product. Af is the peak-area of fluorene. For instance, the conversion of DBT into
biphenyl can be expressed in this fashion:
(4.6)
4.4 Catalysts Activation
It has long been recognized that to obtain the maximum activity from CoMo or
NiMo catalyst, they must be sulfided prior to their use. Several methods are commonly
HGO
i
j
HGO
i
f
od
f
jji A
A
A
A
A
Ax
−
×
=>−
Pr
HGO
DBT
BPH
HGO
DBT
f
od
f
BPHBPHDBT A
A
A
A
A
Ax
−
×
=>−
Pr
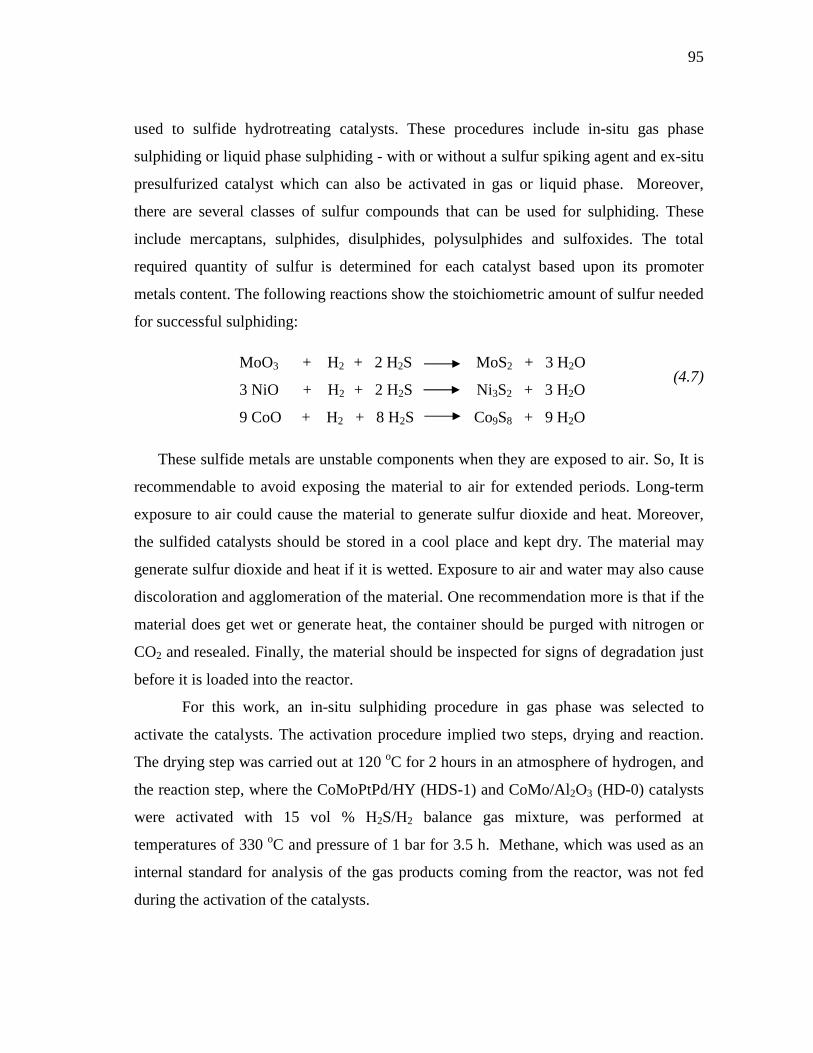
95
used to sulfide hydrotreating catalysts. These procedures include in-situ gas phase
sulphiding or liquid phase sulphiding - with or without a sulfur spiking agent and ex-situ
presulfurized catalyst which can also be activated in gas or liquid phase. Moreover,
there are several classes of sulfur compounds that can be used for sulphiding. These
include mercaptans, sulphides, disulphides, polysulphides and sulfoxides. The total
required quantity of sulfur is determined for each catalyst based upon its promoter
metals content. The following reactions show the stoichiometric amount of sulfur needed
for successful sulphiding:
(4.7)
These sulfide metals are unstable components when they are exposed to air. So, It is
recommendable to avoid exposing the material to air for extended periods. Long-term
exposure to air could cause the material to generate sulfur dioxide and heat. Moreover,
the sulfided catalysts should be stored in a cool place and kept dry. The material may
generate sulfur dioxide and heat if it is wetted. Exposure to air and water may also cause
discoloration and agglomeration of the material. One recommendation more is that if the
material does get wet or generate heat, the container should be purged with nitrogen or
CO2 and resealed. Finally, the material should be inspected for signs of degradation just
before it is loaded into the reactor.
For this work, an in-situ sulphiding procedure in gas phase was selected to
activate the catalysts. The activation procedure implied two steps, drying and reaction.
The drying step was carried out at 120 oC for 2 hours in an atmosphere of hydrogen, and
the reaction step, where the CoMoPtPd/HY (HDS-1) and CoMo/Al2O3 (HD-0) catalysts
were activated with 15 vol % H2S/H2 balance gas mixture, was performed at
temperatures of 330 oC and pressure of 1 bar for 3.5 h. Methane, which was used as an
internal standard for analysis of the gas products coming from the reactor, was not fed
during the activation of the catalysts.
MoO3 + H2 + 2 H2S MoS2 + 3 H2O
3 NiO + H2 + 2 H2S Ni3S2 + 3 H2O
9 CoO + H2 + 8 H2S Co9S8 + 9 H2O
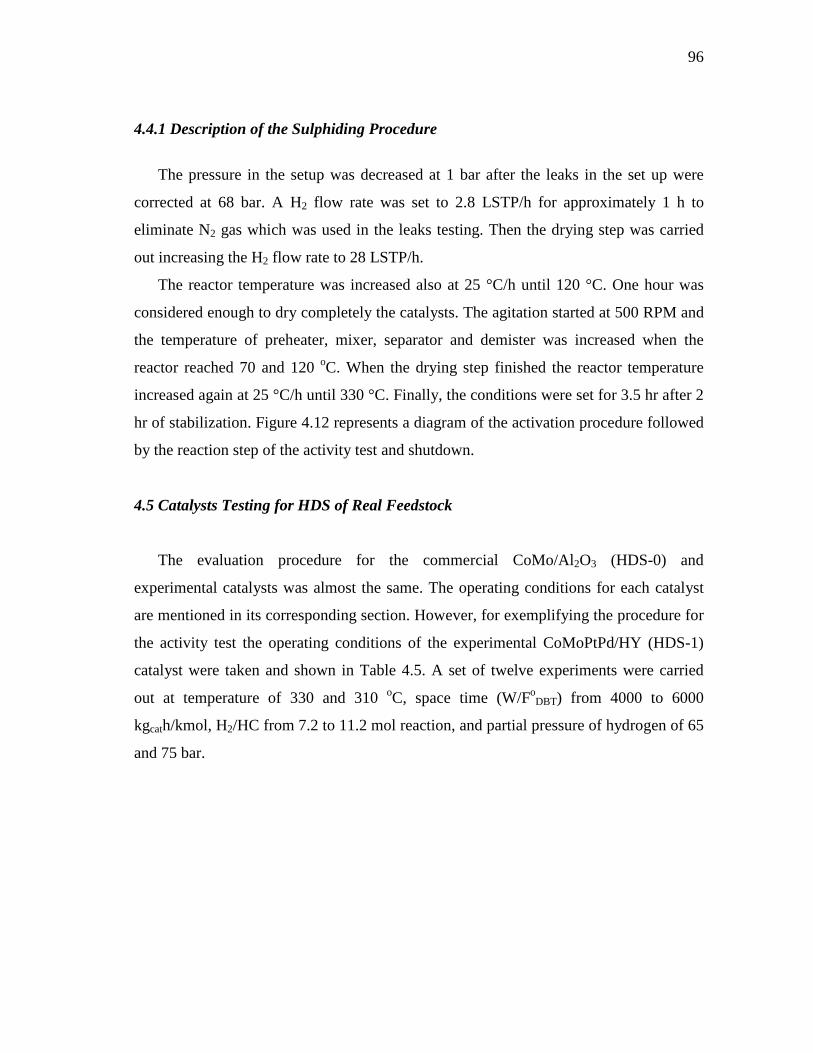
96
4.4.1 Description of the Sulphiding Procedure
The pressure in the setup was decreased at 1 bar after the leaks in the set up were
corrected at 68 bar. A H2 flow rate was set to 2.8 LSTP/h for approximately 1 h to
eliminate N2 gas which was used in the leaks testing. Then the drying step was carried
out increasing the H2 flow rate to 28 LSTP/h.
The reactor temperature was increased also at 25 °C/h until 120 °C. One hour was
considered enough to dry completely the catalysts. The agitation started at 500 RPM and
the temperature of preheater, mixer, separator and demister was increased when the
reactor reached 70 and 120 oC. When the drying step finished the reactor temperature
increased again at 25 °C/h until 330 °C. Finally, the conditions were set for 3.5 hr after 2
hr of stabilization. Figure 4.12 represents a diagram of the activation procedure followed
by the reaction step of the activity test and shutdown.
4.5 Catalysts Testing for HDS of Real Feedstock
The evaluation procedure for the commercial CoMo/Al2O3 (HDS-0) and
experimental catalysts was almost the same. The operating conditions for each catalyst
are mentioned in its corresponding section. However, for exemplifying the procedure for
the activity test the operating conditions of the experimental CoMoPtPd/HY (HDS-1)
catalyst were taken and shown in Table 4.5. A set of twelve experiments were carried
out at temperature of 330 and 310 oC, space time (W/FoDBT) from 4000 to 6000
kgcath/kmol, H2/HC from 7.2 to 11.2 mol reaction, and partial pressure of hydrogen of 65
and 75 bar.
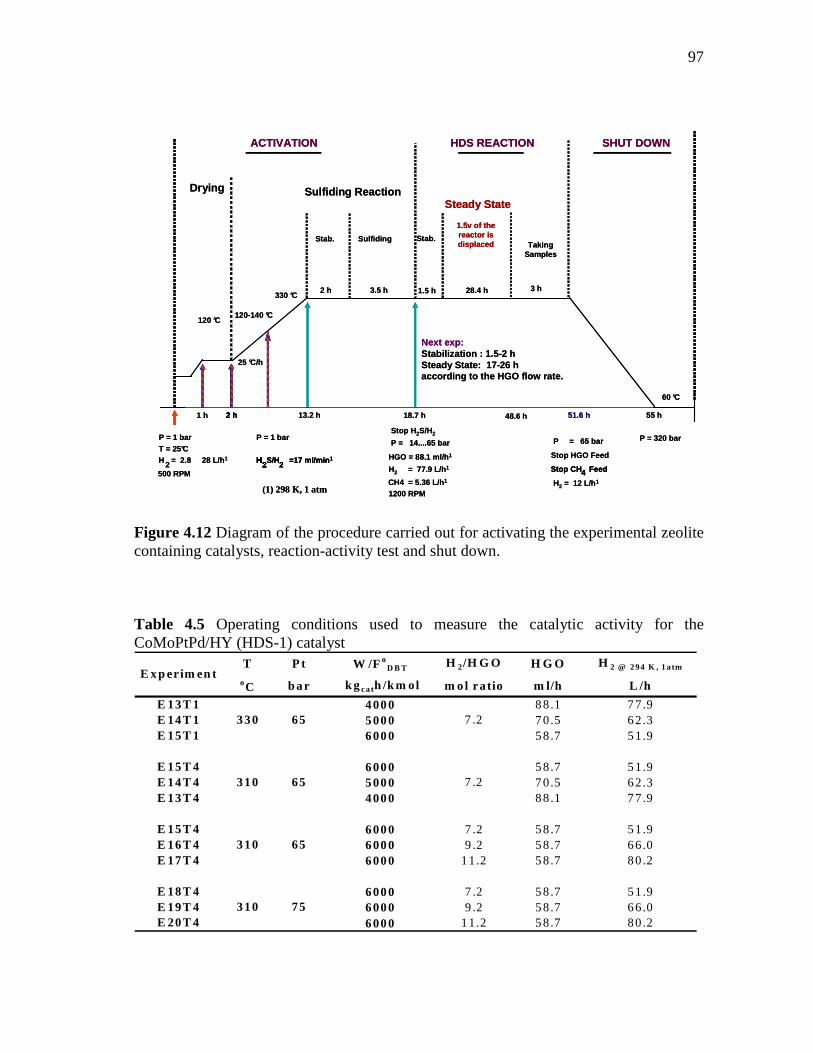
97
Figure 4.12 Diagram of the procedure carried out for activating the experimental zeolite containing catalysts, reaction-activity test and shut down. Table 4.5 Operating conditions used to measure the catalytic activity for the CoMoPtPd/HY (HDS-1) catalyst
T P t W /F oD B T H 2/H G O H G O H 2 @ 2 94 K , 1 a tm
oC bar kgca th /km ol m o l ra tio m l/h L /h
E 13T 1 4000 88.1 77.9E 14T 1 5000 70.5 62.3E 15T 1 6000 58.7 51.9
E 15T 4 6000 58.7 51.9E 14T 4 5000 70.5 62.3E 13T 4 4000 88.1 77.9
E 15T 4 6000 7.2 58.7 51.9E 16T 4 6000 9.2 58.7 66.0E 17T 4 6000 11.2 58.7 80.2
E 18T 4 6000 7.2 58.7 51.9E 19T 4 6000 9.2 58.7 66.0E 20T 4 6000 11.2 58.7 80.2
65
7.2
7 .2
75
E xp er im en t
310
330
310
310
65
65
SHUT DOWN
330 °C
120-140 °C
Stab.
60 °C
2 h 55 h
P = 320 bar
Next exp: Stabilization : 1.5-2 h Steady State: 17-26 haccording to the HGO flow rate.
2 h
ACTIVATION HDS REACTION
P = 1 barT = 25°CH2 = 2.8 28 L/h1
500 RPM
28.4 h
25 °C/h
3 h
Sulfiding
1.5v of the reactor is displaced Taking
Samples
2 h 18.7 h
1200 RPM
HGO = 88.1 ml/h 1
H2 = 77.9 L/h1
CH4 = 5.36 L/h1
P = 14....65 bar
Stop H 2S/H2P = 1 bar
H2S/H2 =17 ml/min 1H2 Stop CH4 Feed
51.6 h
Stop HGO Feed
P = 65 bar
H2 = 12 L/h 1
13.2 h
3.5 h
120 °C
Drying
1 h 48.6 h
Stab.
1.5 h
Sulfiding Reaction
(1) 298 K, 1 atm
Steady State
SHUT DOWN
330 °C
120-140 °C
Stab.
60 °C
2 h 55 h
P = 320 bar
Next exp: Stabilization : 1.5-2 h Steady State: 17-26 haccording to the HGO flow rate.
2 h
ACTIVATION HDS REACTION
P = 1 barT = 25°CH2 = 2.8 28 L/h1
500 RPM
28.4 h
25 °C/h
3 h
Sulfiding
1.5v of the reactor is displaced Taking
Samples
2 h 18.7 h
1200 RPM
HGO = 88.1 ml/h 1
H2 = 77.9 L/h1
CH4 = 5.36 L/h1
P = 14....65 bar
Stop H 2S/H2P = 1 bar
H2S/H2 =17 ml/min 1H2H2S/H2 =17 ml/min 1H2 Stop CH4 FeedStop CH4 Feed
51.6 h
Stop HGO Feed
P = 65 bar
H2 = 12 L/h 1
13.2 h
3.5 h
120 °C
Drying
1 h 48.6 h
Stab.
1.5 h
Sulfiding Reaction
(1) 298 K, 1 atm
Steady State
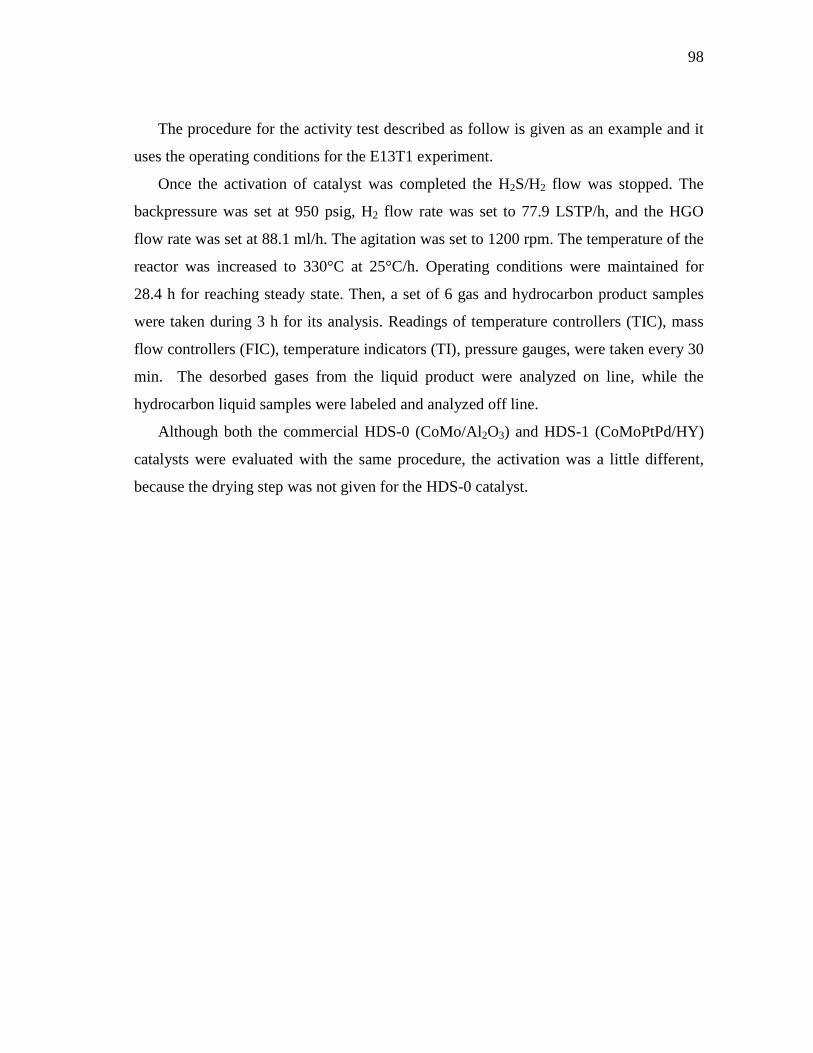
98
The procedure for the activity test described as follow is given as an example and it
uses the operating conditions for the E13T1 experiment.
Once the activation of catalyst was completed the H2S/H2 flow was stopped. The
backpressure was set at 950 psig, H2 flow rate was set to 77.9 LSTP/h, and the HGO
flow rate was set at 88.1 ml/h. The agitation was set to 1200 rpm. The temperature of the
reactor was increased to 330°C at 25°C/h. Operating conditions were maintained for
28.4 h for reaching steady state. Then, a set of 6 gas and hydrocarbon product samples
were taken during 3 h for its analysis. Readings of temperature controllers (TIC), mass
flow controllers (FIC), temperature indicators (TI), pressure gauges, were taken every 30
min. The desorbed gases from the liquid product were analyzed on line, while the
hydrocarbon liquid samples were labeled and analyzed off line.
Although both the commercial HDS-0 (CoMo/Al2O3) and HDS-1 (CoMoPtPd/HY)
catalysts were evaluated with the same procedure, the activation was a little different,
because the drying step was not given for the HDS-0 catalyst.
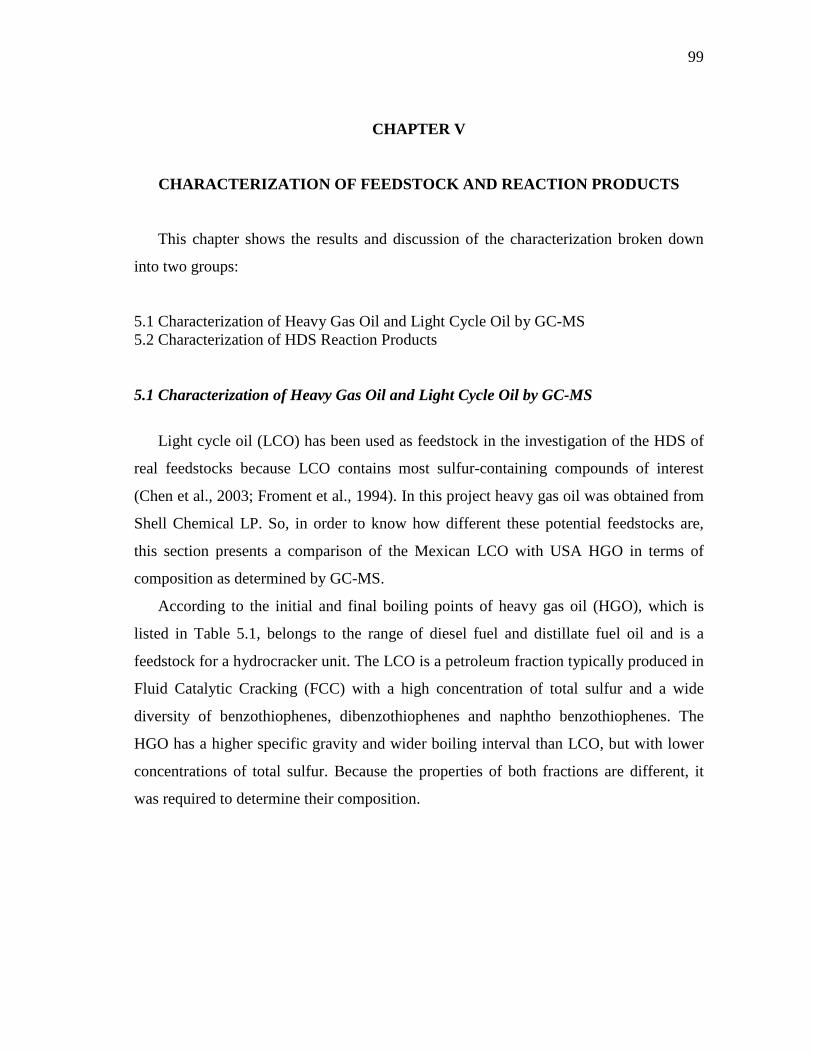
99
CHAPTER V
CHARACTERIZATION OF FEEDSTOCK AND REACTION PRODUCTS
This chapter shows the results and discussion of the characterization broken down
into two groups:
5.1 Characterization of Heavy Gas Oil and Light Cycle Oil by GC-MS 5.2 Characterization of HDS Reaction Products
5.1 Characterization of Heavy Gas Oil and Light Cycle Oil by GC-MS
Light cycle oil (LCO) has been used as feedstock in the investigation of the HDS of
real feedstocks because LCO contains most sulfur-containing compounds of interest
(Chen et al., 2003; Froment et al., 1994). In this project heavy gas oil was obtained from
Shell Chemical LP. So, in order to know how different these potential feedstocks are,
this section presents a comparison of the Mexican LCO with USA HGO in terms of
composition as determined by GC-MS.
According to the initial and final boiling points of heavy gas oil (HGO), which is
listed in Table 5.1, belongs to the range of diesel fuel and distillate fuel oil and is a
feedstock for a hydrocracker unit. The LCO is a petroleum fraction typically produced in
Fluid Catalytic Cracking (FCC) with a high concentration of total sulfur and a wide
diversity of benzothiophenes, dibenzothiophenes and naphtho benzothiophenes. The
HGO has a higher specific gravity and wider boiling interval than LCO, but with lower
concentrations of total sulfur. Because the properties of both fractions are different, it
was required to determine their composition.
100
Table 5.1 Typical properties of Heavy Gas oil (from Shell Chemical LP) and a Mexican Light Cycle Oil (from Mexican Petroleum Institute)
Physical and Chemical Properties Heavy Gas Oil Light Cycle Oil Specific Gravity @ 60°F 0.9318 0.9096 Initial Boiling Point, °F ( oC) 304 (151) 360 (182) Final Boiling Point, °F (oC) 763 (406) 750 (399) Total Sulfur, wt % 0.453 2.94 Hydrogen 10.84 na Carbon 88.29 na
na= not available
The characterization of both feedstocks was performed by using a Hewlett-Packard
G1800A GCD system gas chromatograph equipped with a capillary column (HP PONA)
and an Electron Ionization detector. The method of the analysis was the same as that
reported in chapter IV for the analysis of liquid products. The integration parameters
defined in the Chemstation software were basically the same. The identification of the
most important peaks which are shown in the chromatogram was done with the
Chemstation software. The area and area% data were taken for every peak to obtain the
corresponding concentration. Peaks with an identification quality higher than 90% of
confidence were considered as correct.
A classification in paraffins (P), naphthenes (N), aromatics (A) and sulfur-aromatics
(S-A) was selected for every compound to be included. The GC-MS report was
transferred to Excel and a program was constructed to develop the P/N/A/S-A
classification. The LCO/HGO weight ratio in terms of total sulfur is 6.5/1.
Heavy gas oil (HGO) contains a significant amount of C6-C9 hydrocarbons while
light cycle oil (LCO) is completely absent of them. The identification of DBT and BT’s
was moderately complicated in LCO. However in the HGO this was a hard task. Using
those integration parameters (Table 4.2, Chaper IV) when reviewing data of liquid
samples analysis, around 500 peaks are successfully integrated in the light cycle oil
(LCO) analysis, and a few interesting peaks corresponding to sulfur compounds have
been manually integrated only. The heavy gas oil (HGO) integration accounted for more
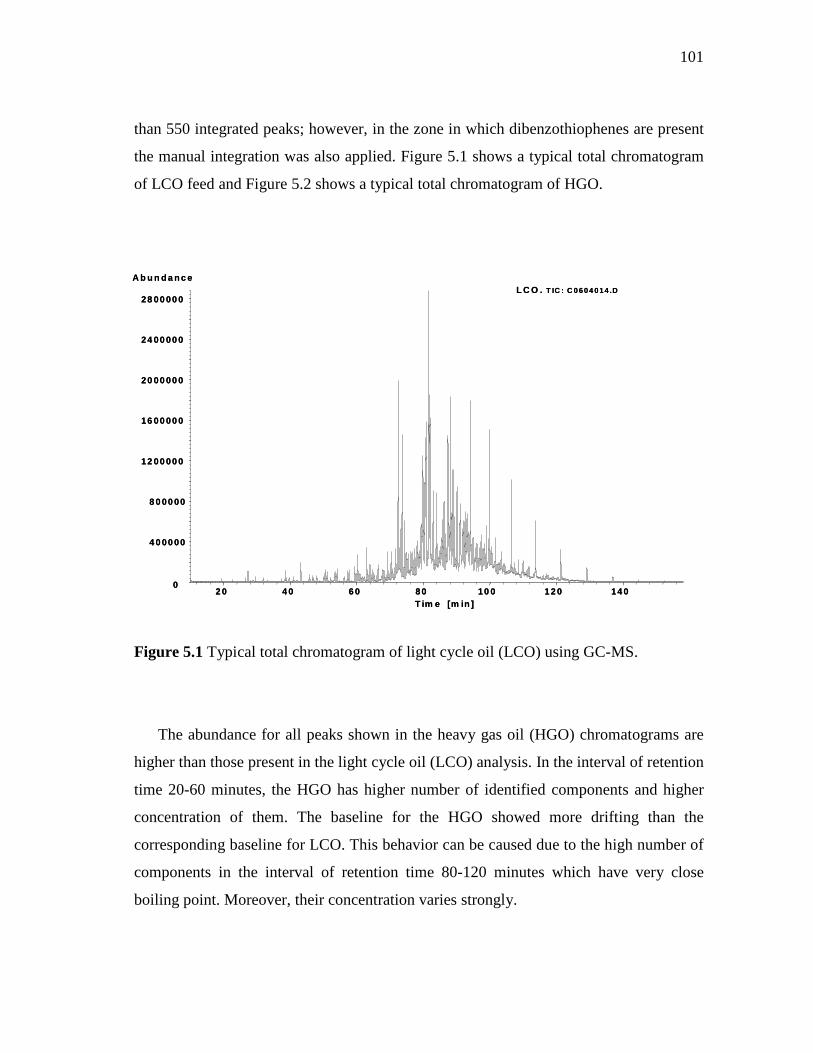
101
than 550 integrated peaks; however, in the zone in which dibenzothiophenes are present
the manual integration was also applied. Figure 5.1 shows a typical total chromatogram
of LCO feed and Figure 5.2 shows a typical total chromatogram of HGO.
Figure 5.1 Typical total chromatogram of light cycle oil (LCO) using GC-MS.
The abundance for all peaks shown in the heavy gas oil (HGO) chromatograms are
higher than those present in the light cycle oil (LCO) analysis. In the interval of retention
time 20-60 minutes, the HGO has higher number of identified components and higher
concentration of them. The baseline for the HGO showed more drifting than the
corresponding baseline for LCO. This behavior can be caused due to the high number of
components in the interval of retention time 80-120 minutes which have very close
boiling point. Moreover, their concentration varies strongly.
2 0 4 0 6 0 80 10 0 1 2 0 14 00
4 0 00 00
8 0 00 00
12 00 00 0
16 00 00 0
20 00 00 0
24 00 00 0
28 00 00 0
T im e [m in ]
A b u n d a n c eL C O . T IC : C 0 6 0 4 0 1 4 .D
2 0 4 0 6 0 80 10 0 1 2 0 14 00
4 0 00 00
8 0 00 00
12 00 00 0
16 00 00 0
20 00 00 0
24 00 00 0
28 00 00 0
T im e [m in ]
A b u n d a n c eL C O . T IC : C 0 6 0 4 0 1 4 .D
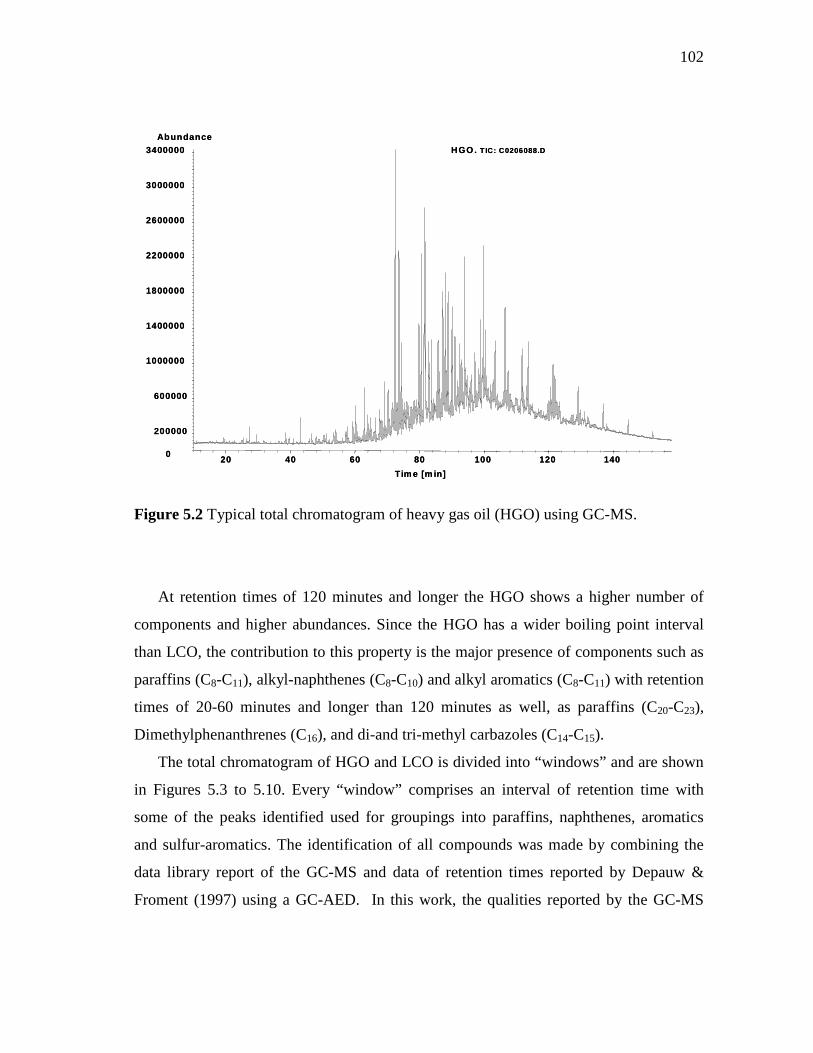
102
Figure 5.2 Typical total chromatogram of heavy gas oil (HGO) using GC-MS.
At retention times of 120 minutes and longer the HGO shows a higher number of
components and higher abundances. Since the HGO has a wider boiling point interval
than LCO, the contribution to this property is the major presence of components such as
paraffins (C8-C11), alkyl-naphthenes (C8-C10) and alkyl aromatics (C8-C11) with retention
times of 20-60 minutes and longer than 120 minutes as well, as paraffins (C20-C23),
Dimethylphenanthrenes (C16), and di-and tri-methyl carbazoles (C14-C15).
The total chromatogram of HGO and LCO is divided into “windows” and are shown
in Figures 5.3 to 5.10. Every “window” comprises an interval of retention time with
some of the peaks identified used for groupings into paraffins, naphthenes, aromatics
and sulfur-aromatics. The identification of all compounds was made by combining the
data library report of the GC-MS and data of retention times reported by Depauw &
Froment (1997) using a GC-AED. In this work, the qualities reported by the GC-MS
20 40 60 80 100 120 1400
200000
600000
1000000
1400000
1800000
2200000
2600000
3000000
3400000
Tim e [m in]
Abundance
HGO. T IC: C0206088.D
20 40 60 80 100 120 1400
200000
600000
1000000
1400000
1800000
2200000
2600000
3000000
3400000
Tim e [m in]
Abundance
HGO. T IC: C0206088.D
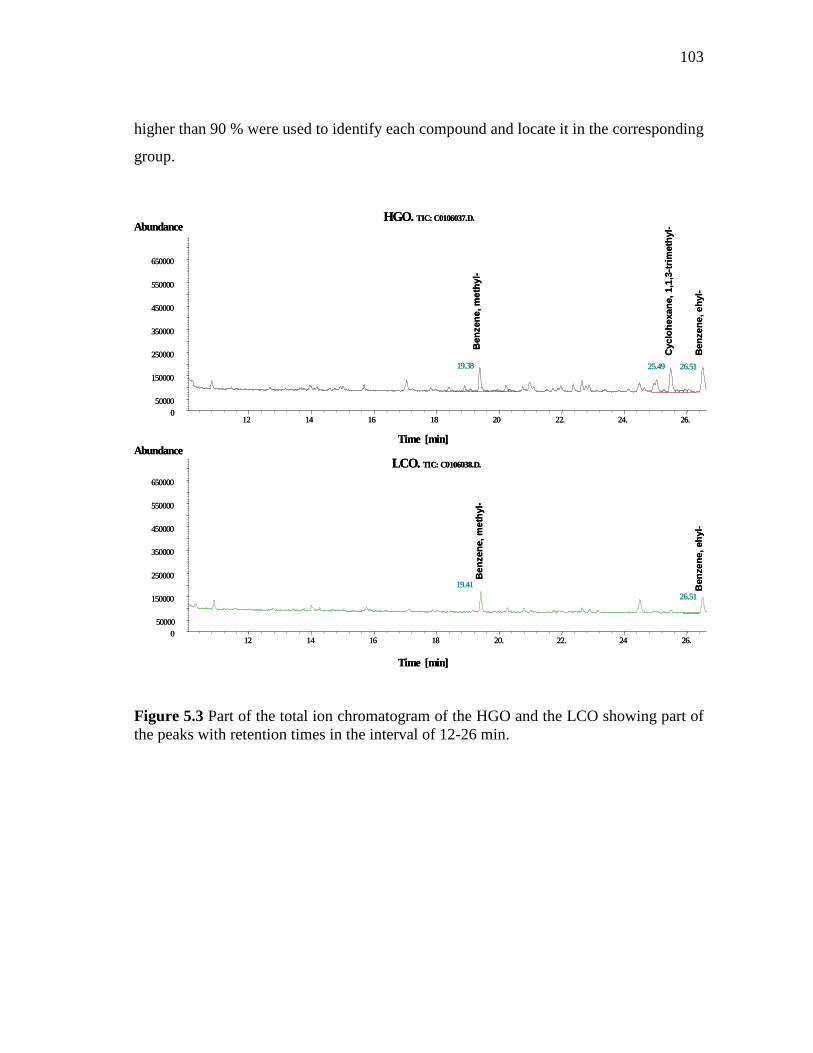
103
higher than 90 % were used to identify each compound and locate it in the corresponding
group.
Figure 5.3 Part of the total ion chromatogram of the HGO and the LCO showing part of the peaks with retention times in the interval of 12-26 min.
12 14 16 18 20 22. 24. 26.0
50000
150000
250000
350000
450000
550000
650000
Time [min]
AbundanceHGO. TIC: C0106037.D.
19.38 25.49 26.51
12 14 16 18 20. 22. 24 26.0
50000
150000
250000
350000
450000
550000
650000
Time [min]
AbundanceLCO. TIC: C0106038.D.
19.41
26.51
Ben
zene
, met
hyl-
Ben
zene
, met
hyl-
Cyc
lohe
xane
, 1,1
,3-t
rimet
hyl-
Ben
zene
, ehy
l-B
enze
ne, e
hyl-
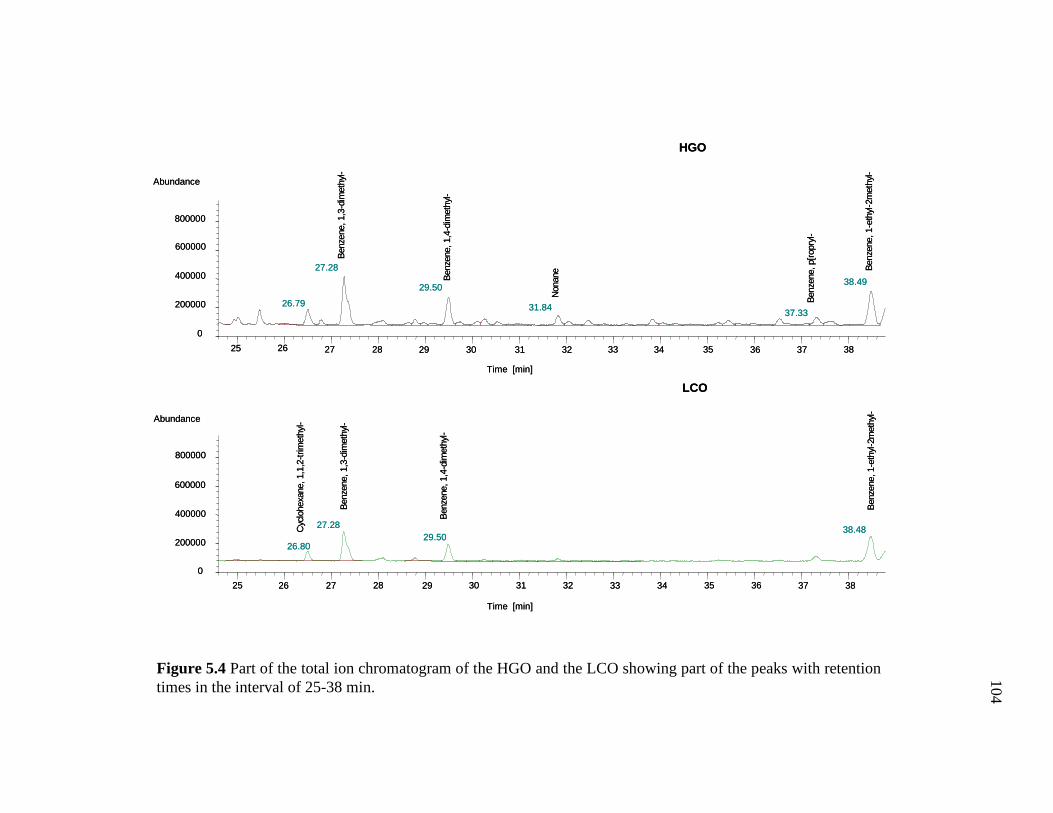
104
Figure 5.4 Part of the total ion chromatogram of the HGO and the LCO showing part of the peaks with retention times in the interval of 25-38 min.
25 26 27 28 29 30 31 32 33 34 35 36 37 38
0
200000
400000
600000
800000
Time [min]
Abundance
26.79
27.28
29.5038.49
25 26 27 28 29 30 31 32 33 34 35 36 37 38
0
200000
400000
600000
800000
Time [min]
Abundance
26.80
27.2829.50
38.48
Ben
zene
, 1,3
-dim
ethy
l-
Ben
zene
, 1,4
-dim
ethy
l-
Ben
zene
, 1-e
thyl
-2m
ethy
l-
Cyc
lohe
xane
, 1,1
,2-tr
imet
hyl-
Ben
zene
, 1,4
-dim
ethy
l-
Ben
zene
, 1,3
-dim
ethy
l-
Ben
zene
, 1-e
thyl
-2m
ethy
l-
Non
ane
31.84
Ben
zene
, p[r
opry
l-
37.33
HGO
LCO
25 26 27 28 29 30 31 32 33 34 35 36 37 38
0
200000
400000
600000
800000
Time [min]
Abundance
26.79
27.28
29.5038.49
25 26 27 28 29 30 31 32 33 34 35 36 37 38
0
200000
400000
600000
800000
Time [min]
Abundance
26.80
27.2829.50
38.48
Ben
zene
, 1,3
-dim
ethy
l-
Ben
zene
, 1,4
-dim
ethy
l-
Ben
zene
, 1-e
thyl
-2m
ethy
l-
Cyc
lohe
xane
, 1,1
,2-tr
imet
hyl-
Ben
zene
, 1,4
-dim
ethy
l-
Ben
zene
, 1,3
-dim
ethy
l-
Ben
zene
, 1-e
thyl
-2m
ethy
l-
Non
ane
31.84
Ben
zene
, p[r
opry
l-
37.33
HGO
LCO
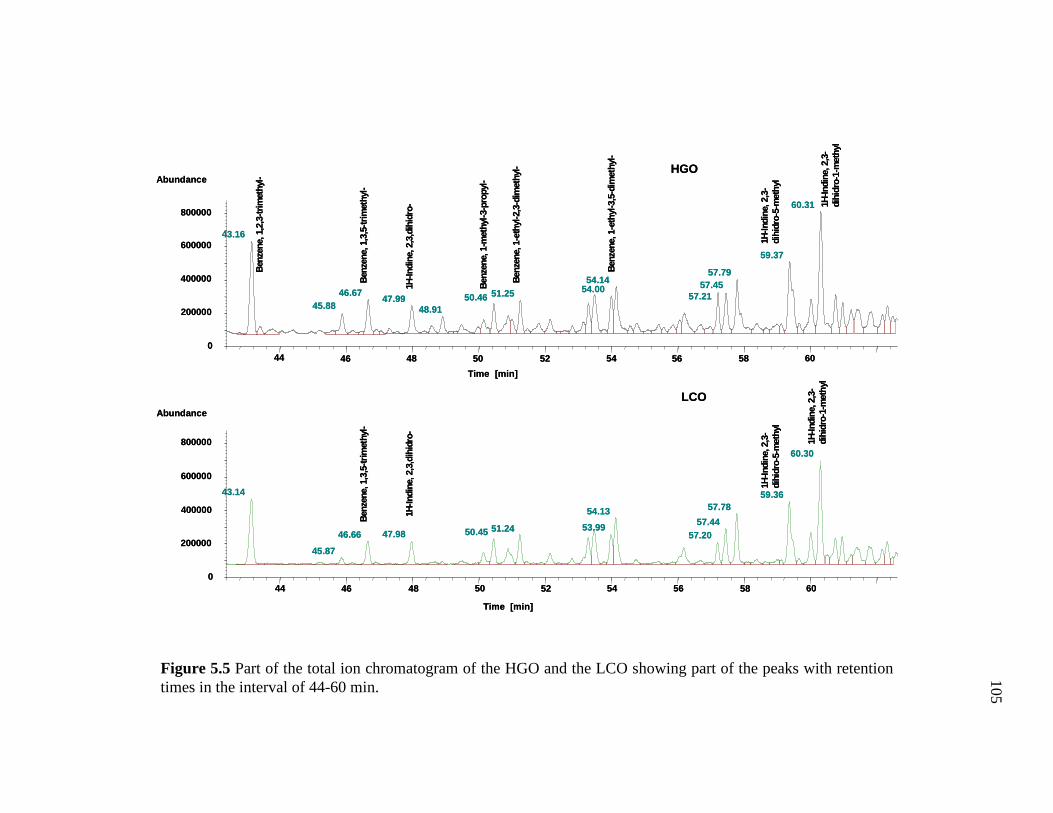
105
Figure 5.5 Part of the total ion chromatogram of the HGO and the LCO showing part of the peaks with retention times in the interval of 44-60 min.
44 46 48 50 52 54 56 58 600
200000
400000
600000
800000
Time [min]
Abundance
43.16
45.8846.67
47.9948.91
50.46 51.25 54.0054.14
57.2157.45
57.79
59.37
60.31
44 46 48 50 52 54 56 58 600
200000
400000
600000
800000
Time [min]
Abundance
43.14
45.87
46.66 47.98 50.45 51.24 53.99
54.13
57.2057.44
57.7859.36
60.30
1H-In
dine
, 2,3
-di
hidr
o-1-
met
hyl
Benz
ene,
1,3
,5-tr
imet
hyl-
1H-In
dine
, 2,3
,dih
idro
-
1H-In
dine
, 2,3
-di
hidr
o-5-
met
hyl
Benz
ene,
1,3
,5-tr
imet
hyl-
1H-In
dine
, 2,3
,dih
idro
-
Benz
ene,
1-m
ethy
l-3-p
ropy
l-
Benz
ene,
1-e
thyl
-2,3
-dim
ethy
l-
Benz
ene,
1-e
thyl
-3,5
-dim
ethy
l-
1H-In
dine
, 2,3
-di
hidr
o-5-
met
hyl
1H-In
dine
, 2,3
-di
hidr
o-1-
met
hyl
Benz
ene,
1,2
,3-tr
imet
hyl-
HGO
LCO
44 46 48 50 52 54 56 58 600
200000
400000
600000
800000
Time [min]
Abundance
43.16
45.8846.67
47.9948.91
50.46 51.25 54.0054.14
57.2157.45
57.79
59.37
60.31
44 46 48 50 52 54 56 58 600
200000
400000
600000
800000
Time [min]
Abundance
43.14
45.87
46.66 47.98 50.45 51.24 53.99
54.13
57.2057.44
57.7859.36
60.30
1H-In
dine
, 2,3
-di
hidr
o-1-
met
hyl
Benz
ene,
1,3
,5-tr
imet
hyl-
1H-In
dine
, 2,3
,dih
idro
-
1H-In
dine
, 2,3
-di
hidr
o-5-
met
hyl
Benz
ene,
1,3
,5-tr
imet
hyl-
1H-In
dine
, 2,3
,dih
idro
-
Benz
ene,
1-m
ethy
l-3-p
ropy
l-
Benz
ene,
1-e
thyl
-2,3
-dim
ethy
l-
Benz
ene,
1-e
thyl
-3,5
-dim
ethy
l-
1H-In
dine
, 2,3
-di
hidr
o-5-
met
hyl
1H-In
dine
, 2,3
-di
hidr
o-1-
met
hyl
Benz
ene,
1,2
,3-tr
imet
hyl-
HGO
LCO
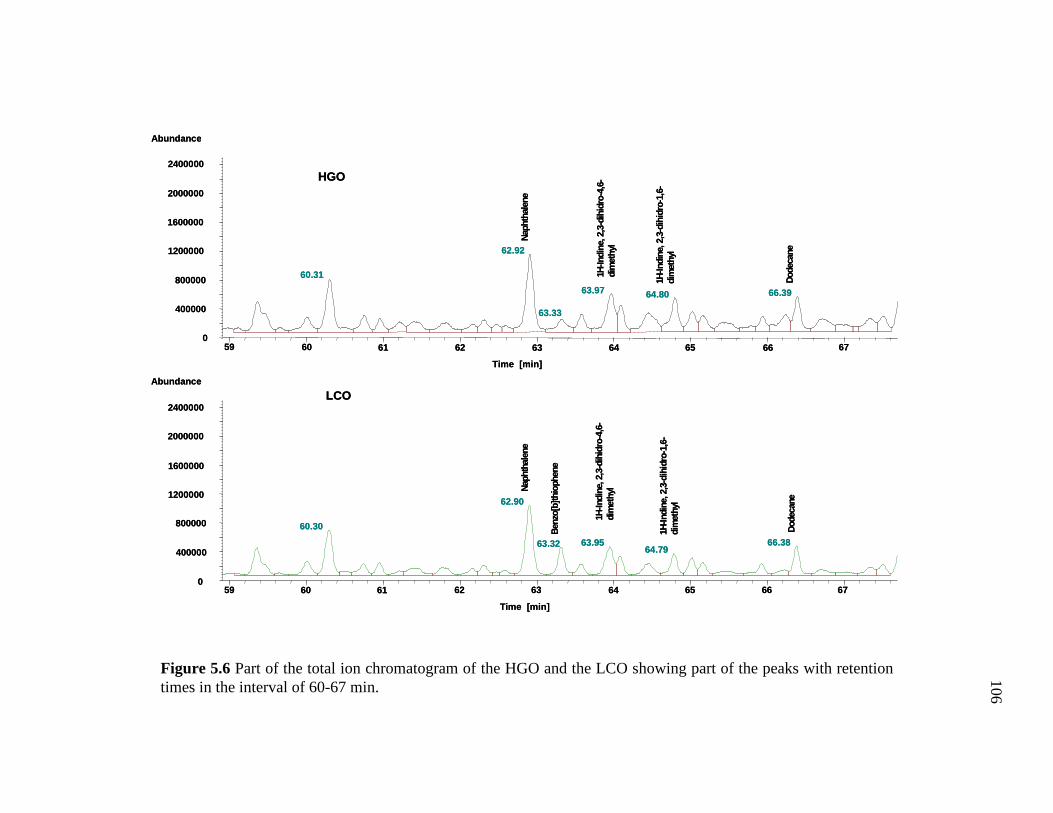
106
Figure 5.6 Part of the total ion chromatogram of the HGO and the LCO showing part of the peaks with retention times in the interval of 60-67 min.
59 60 61 62 63 64 65 66 670
400000
800000
1200000
1600000
2000000
2400000
Time [min]
Abundance
60.31
62.92
63.33
63.97 64.80 66.39
59 60 61 62 63 64 65 66 670
400000
800000
1200000
1600000
2000000
2400000
Time [min]
Abundance
60.30
62.90
63.32 63.9564.79
66.38
Nap
htha
lene
1H-In
dine
, 2,3
-dih
idro
-4,6
-di
met
hyl
Dod
ecan
e
Nap
htha
lene
1H-In
dine
, 2,3
-dih
idro
-4,6
-di
met
hyl
1H-In
dine
, 2,3
-dih
idro
-1,6
-di
met
hyl
1H-In
dine
, 2,3
-dih
idro
-1,6
-di
met
hyl
Dod
ecan
e
Benz
o[b]
thio
phen
e
HGO
LCO
59 60 61 62 63 64 65 66 670
400000
800000
1200000
1600000
2000000
2400000
Time [min]
Abundance
60.31
62.92
63.33
63.97 64.80 66.39
59 60 61 62 63 64 65 66 670
400000
800000
1200000
1600000
2000000
2400000
Time [min]
Abundance
60.30
62.90
63.32 63.9564.79
66.38
Nap
htha
lene
1H-In
dine
, 2,3
-dih
idro
-4,6
-di
met
hyl
Dod
ecan
e
Nap
htha
lene
1H-In
dine
, 2,3
-dih
idro
-4,6
-di
met
hyl
1H-In
dine
, 2,3
-dih
idro
-1,6
-di
met
hyl
1H-In
dine
, 2,3
-dih
idro
-1,6
-di
met
hyl
Dod
ecan
e
Benz
o[b]
thio
phen
e
HGO
LCO
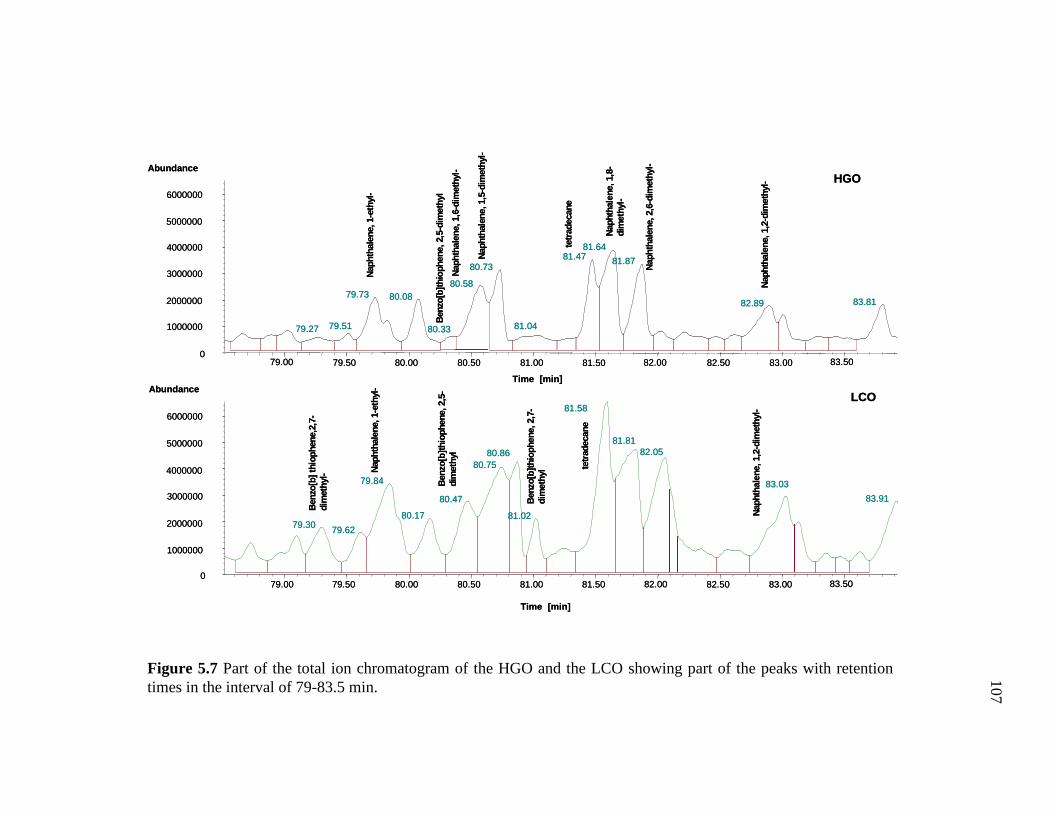
107
Figure 5.7 Part of the total ion chromatogram of the HGO and the LCO showing part of the peaks with retention times in the interval of 79-83.5 min.
79.00 79.50 80.00 80.50 81.00 81.50 82.00 82.50 83.00 83.500
1000000
2000000
3000000
4000000
5000000
6000000
Time [min]
Abundance
79.27 79.51
79.73 80.08
80.33
80.58
80.73
81.04
81.4781.64
81.87
82.89 83.81
79.00 79.50 80.00 80.50 81.00 81.50 82.00 82.50 83.00 83.500
1000000
2000000
3000000
4000000
5000000
6000000
Time [min]
Abundance
79.30 79.62
79.84
80.17
80.47
80.7580.86
81.02
81.58
81.8182.05
83.03
83.91
Ben
zo[b
] thi
ophe
ne,2
,7-
dim
ethy
l-
Nap
htha
lene
, 1-e
thyl
-
Nap
htha
lene
, 1,6
-dim
ethy
l-
Nap
htha
lene
, 1,5
-dim
ethy
l-
Ben
zo[b
]thio
phen
e, 2
,5-d
imet
hyl
Ben
zo[b
]thio
phen
e, 2
,5-
dim
ethy
l
Nap
htha
lene
, 1-e
thyl
-
Ben
zo[b
]thio
phen
e, 2
,7-
dim
ethy
l
tetra
deca
ne
tetra
deca
ne
Nap
htha
lene
, 1,8
-di
met
hyl-
Nap
htha
lene
, 2,6
-dim
ethy
l-
Nap
htha
lene
, 1,2
-dim
ethy
l-N
apht
hale
ne, 1
,2-d
imet
hyl-
HGO
LCO
79.00 79.50 80.00 80.50 81.00 81.50 82.00 82.50 83.00 83.500
1000000
2000000
3000000
4000000
5000000
6000000
Time [min]
Abundance
79.27 79.51
79.73 80.08
80.33
80.58
80.73
81.04
81.4781.64
81.87
82.89 83.81
79.00 79.50 80.00 80.50 81.00 81.50 82.00 82.50 83.00 83.500
1000000
2000000
3000000
4000000
5000000
6000000
Time [min]
Abundance
79.30 79.62
79.84
80.17
80.47
80.7580.86
81.02
81.58
81.8182.05
83.03
83.91
Ben
zo[b
] thi
ophe
ne,2
,7-
dim
ethy
l-
Nap
htha
lene
, 1-e
thyl
-
Nap
htha
lene
, 1,6
-dim
ethy
l-
Nap
htha
lene
, 1,5
-dim
ethy
l-
Ben
zo[b
]thio
phen
e, 2
,5-d
imet
hyl
Ben
zo[b
]thio
phen
e, 2
,5-
dim
ethy
l
Nap
htha
lene
, 1-e
thyl
-
Ben
zo[b
]thio
phen
e, 2
,7-
dim
ethy
l
tetra
deca
ne
tetra
deca
ne
Nap
htha
lene
, 1,8
-di
met
hyl-
Nap
htha
lene
, 2,6
-dim
ethy
l-
Nap
htha
lene
, 1,2
-dim
ethy
l-N
apht
hale
ne, 1
,2-d
imet
hyl-
HGO
LCO
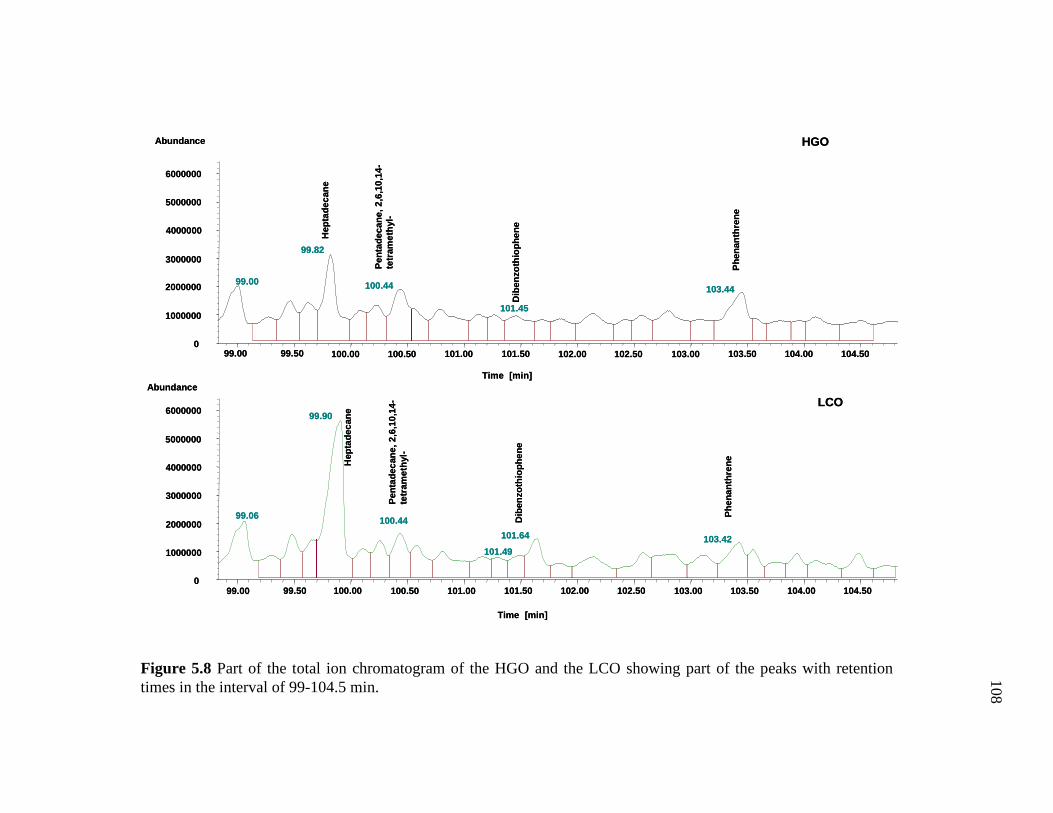
108
Figure 5.8 Part of the total ion chromatogram of the HGO and the LCO showing part of the peaks with retention times in the interval of 99-104.5 min.
99.00 99.50 100.00 100.50 101.00 101.50 102.00 102.50 103.00 103.50 104.00 104.500
1000000
2000000
3000000
4000000
5000000
6000000
Time [min]
Abundance
99.00
99.82
100.44
101.45
103.44
99.00 99.50 100.00 100.50 101.00 101.50 102.00 102.50 103.00 103.50 104.00 104.500
1000000
2000000
3000000
4000000
5000000
6000000
Time [min]
Abundance
99.06
99.90
100.44
101.49
101.64 103.42
Phe
nant
hren
e
Hep
tade
cane
Phe
nant
hren
e
Dib
enzo
thio
phen
eD
iben
zoth
ioph
ene
Hep
tade
cane
Pen
tade
cane
, 2,6
,10,
14-
tetr
amet
hyl-
Pen
tade
cane
, 2,6
,10,
14-
tetr
amet
hyl-
HGO
LCO
99.00 99.50 100.00 100.50 101.00 101.50 102.00 102.50 103.00 103.50 104.00 104.500
1000000
2000000
3000000
4000000
5000000
6000000
Time [min]
Abundance
99.00
99.82
100.44
101.45
103.44
99.00 99.50 100.00 100.50 101.00 101.50 102.00 102.50 103.00 103.50 104.00 104.500
1000000
2000000
3000000
4000000
5000000
6000000
Time [min]
Abundance
99.06
99.90
100.44
101.49
101.64 103.42
Phe
nant
hren
e
Hep
tade
cane
Phe
nant
hren
e
Dib
enzo
thio
phen
eD
iben
zoth
ioph
ene
Hep
tade
cane
Pen
tade
cane
, 2,6
,10,
14-
tetr
amet
hyl-
Pen
tade
cane
, 2,6
,10,
14-
tetr
amet
hyl-
HGO
LCO
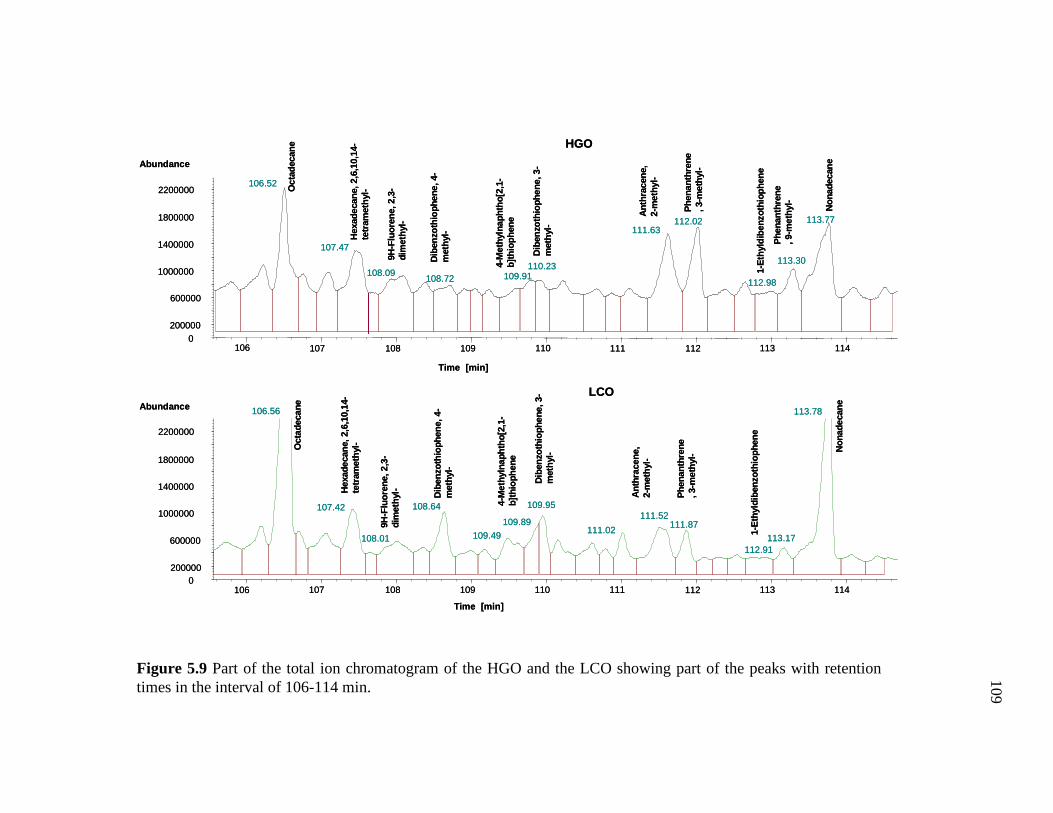
109
Figure 5.9 Part of the total ion chromatogram of the HGO and the LCO showing part of the peaks with retention times in the interval of 106-114 min.
106 107 108 109 110 111 112 113 1140
200000
600000
1000000
1400000
1800000
2200000
Time [min]
Abundance
106.52
107.47
108.09108.72 109.91
110.23
111.63112.02
112.98
113.30
113.77
106 107 108 109 110 111 112 113 1140
200000
600000
1000000
1400000
1800000
2200000
Time [min]
Abundance 106.56
107.42
108.01
108.64
109.49
109.89
109.95
111.02
111.52111.87
112.91113.17
113.78
Dib
enzo
thio
phen
e, 4
-m
ethy
l-
Oct
adec
ane
Hex
adec
ane,
2,6
,10,
14-
tetra
met
hyl-
Phe
nant
hren
e, 3
-met
hyl-
Oct
adec
ane
Hex
adec
ane,
2,6
,10,
14-
tetra
met
hyl-
Dib
enzo
thio
phen
e, 4
-m
ethy
l-
4-M
ethy
lnap
htho
[2,1
-b]
thio
phen
e
Dib
enzo
thio
phen
e, 3
-m
ethy
l-
1-E
thyl
dibe
nzot
hiop
hene
Phe
nant
hren
e, 9
-met
hyl- Non
adec
ane
Ant
hrac
ene,
2-
met
hyl-
1-E
thyl
dibe
nzot
hiop
hene
Dib
enzo
thio
phen
e, 3
-m
ethy
l-
4-M
ethy
lnap
htho
[2,1
-b]
thio
phen
e
9H-F
luor
ene,
2,3
-di
met
hyl-
9H-F
luor
ene,
2,3
-di
met
hyl- Ant
hrac
ene,
2-
met
hyl-
Phe
nant
hren
e, 3
-met
hyl-
Non
adec
ane
HGO
LCO
106 107 108 109 110 111 112 113 1140
200000
600000
1000000
1400000
1800000
2200000
Time [min]
Abundance
106.52
107.47
108.09108.72 109.91
110.23
111.63112.02
112.98
113.30
113.77
106 107 108 109 110 111 112 113 1140
200000
600000
1000000
1400000
1800000
2200000
Time [min]
Abundance 106.56
107.42
108.01
108.64
109.49
109.89
109.95
111.02
111.52111.87
112.91113.17
113.78
Dib
enzo
thio
phen
e, 4
-m
ethy
l-
Oct
adec
ane
Hex
adec
ane,
2,6
,10,
14-
tetra
met
hyl-
Phe
nant
hren
e, 3
-met
hyl-
Oct
adec
ane
Hex
adec
ane,
2,6
,10,
14-
tetra
met
hyl-
Dib
enzo
thio
phen
e, 4
-m
ethy
l-
4-M
ethy
lnap
htho
[2,1
-b]
thio
phen
e
Dib
enzo
thio
phen
e, 3
-m
ethy
l-
1-E
thyl
dibe
nzot
hiop
hene
Phe
nant
hren
e, 9
-met
hyl- Non
adec
ane
Ant
hrac
ene,
2-
met
hyl-
1-E
thyl
dibe
nzot
hiop
hene
Dib
enzo
thio
phen
e, 3
-m
ethy
l-
4-M
ethy
lnap
htho
[2,1
-b]
thio
phen
e
9H-F
luor
ene,
2,3
-di
met
hyl-
9H-F
luor
ene,
2,3
-di
met
hyl- Ant
hrac
ene,
2-
met
hyl-
Phe
nant
hren
e, 3
-met
hyl-
Non
adec
ane
HGO
LCO
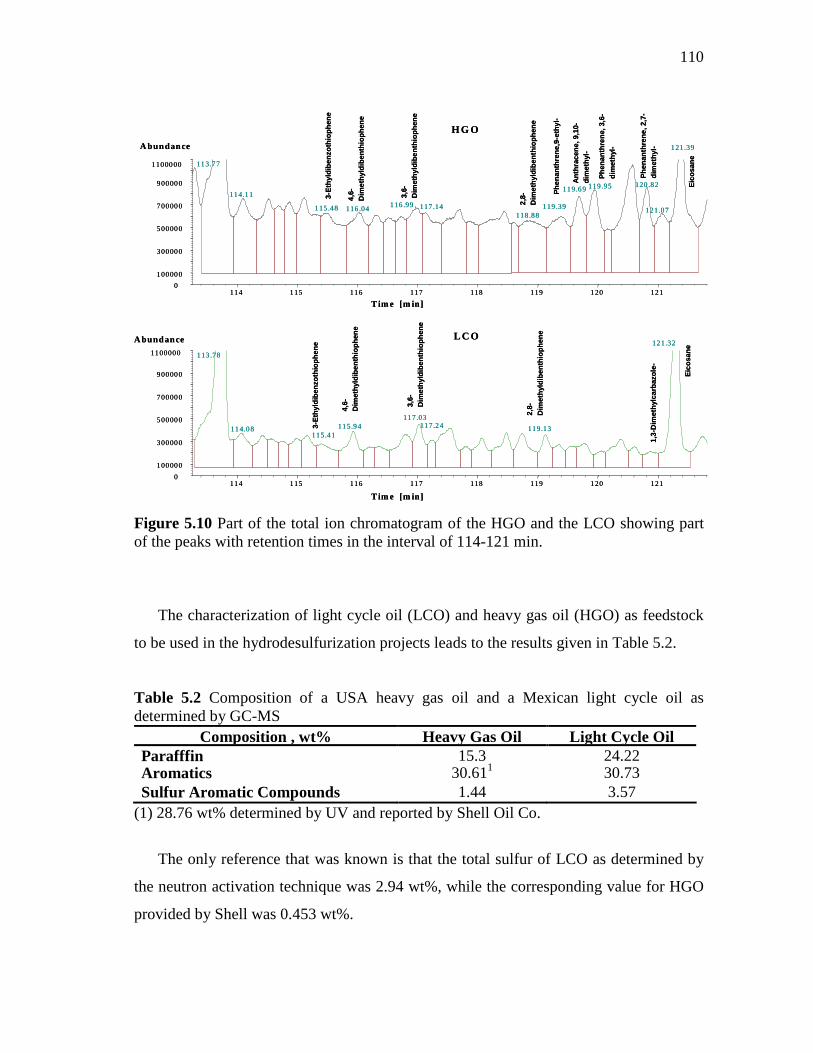
110
Figure 5.10 Part of the total ion chromatogram of the HGO and the LCO showing part of the peaks with retention times in the interval of 114-121 min.
The characterization of light cycle oil (LCO) and heavy gas oil (HGO) as feedstock
to be used in the hydrodesulfurization projects leads to the results given in Table 5.2.
Table 5.2 Composition of a USA heavy gas oil and a Mexican light cycle oil as determined by GC-MS
Composition , wt% Heavy Gas Oil Light Cycle Oil Parafffin 15.3 24.22 Aromatics 30.611 30.73 Sulfur Aromatic Compounds 1.44 3.57
(1) 28.76 wt% determined by UV and reported by Shell Oil Co.
The only reference that was known is that the total sulfur of LCO as determined by
the neutron activation technique was 2.94 wt%, while the corresponding value for HGO
provided by Shell was 0.453 wt%.
114 115 116 117 118 119 120 1210
100000
300000
500000
700000
900000
1100000
Tim e [m in]
Abundance
113.77
114.11
115.48 116.04 116.99 117.14118.88
119.39
119.95 120.82
121.07
121.39
114 115 116 117 118 119 120 1210
100000
300000
500000
700000
900000
1100000
Tim e [m in]
Abundance
113.78
114.08115.41
115.94117.03
117.24 119.13
121.32
3-E
thyl
dibe
nzot
hiop
hene
4,6-
Dim
ethy
ldib
enth
ioph
ene
3,6-
Dim
ethy
ldib
enth
ioph
ene
2,8-
Dim
ethy
ldib
enth
ioph
ene
3-E
thyl
dibe
nzot
hiop
hene
4,6-
Dim
ethy
ldib
enth
ioph
ene
3,6-
Dim
ethy
ldib
enth
ioph
ene
2,8-
Dim
ethy
ldib
enth
ioph
ene
Eic
osan
eE
icos
ane
Phe
nant
hren
e, 3
,6-
dim
ethy
l-
1,3-
Dim
ethy
lcar
bazo
le-
Phe
nant
hren
e, 2
,7-
dim
ethy
l-
Phe
nant
hren
e,9-
ethy
l-
Ant
hrac
ene,
9,1
0-di
met
hyl-
H G O
LCO
119.69
114 115 116 117 118 119 120 1210
100000
300000
500000
700000
900000
1100000
Tim e [m in]
Abundance
113.77
114.11
115.48 116.04 116.99 117.14118.88
119.39
119.95 120.82
121.07
121.39
114 115 116 117 118 119 120 1210
100000
300000
500000
700000
900000
1100000
Tim e [m in]
Abundance
113.78
114.08115.41
115.94117.03
117.24 119.13
121.32
3-E
thyl
dibe
nzot
hiop
hene
4,6-
Dim
ethy
ldib
enth
ioph
ene
3,6-
Dim
ethy
ldib
enth
ioph
ene
2,8-
Dim
ethy
ldib
enth
ioph
ene
3-E
thyl
dibe
nzot
hiop
hene
4,6-
Dim
ethy
ldib
enth
ioph
ene
3,6-
Dim
ethy
ldib
enth
ioph
ene
2,8-
Dim
ethy
ldib
enth
ioph
ene
Eic
osan
eE
icos
ane
Phe
nant
hren
e, 3
,6-
dim
ethy
l-
1,3-
Dim
ethy
lcar
bazo
le-
Phe
nant
hren
e, 2
,7-
dim
ethy
l-
Phe
nant
hren
e,9-
ethy
l-
Ant
hrac
ene,
9,1
0-di
met
hyl-
H G O
LCO
119.69
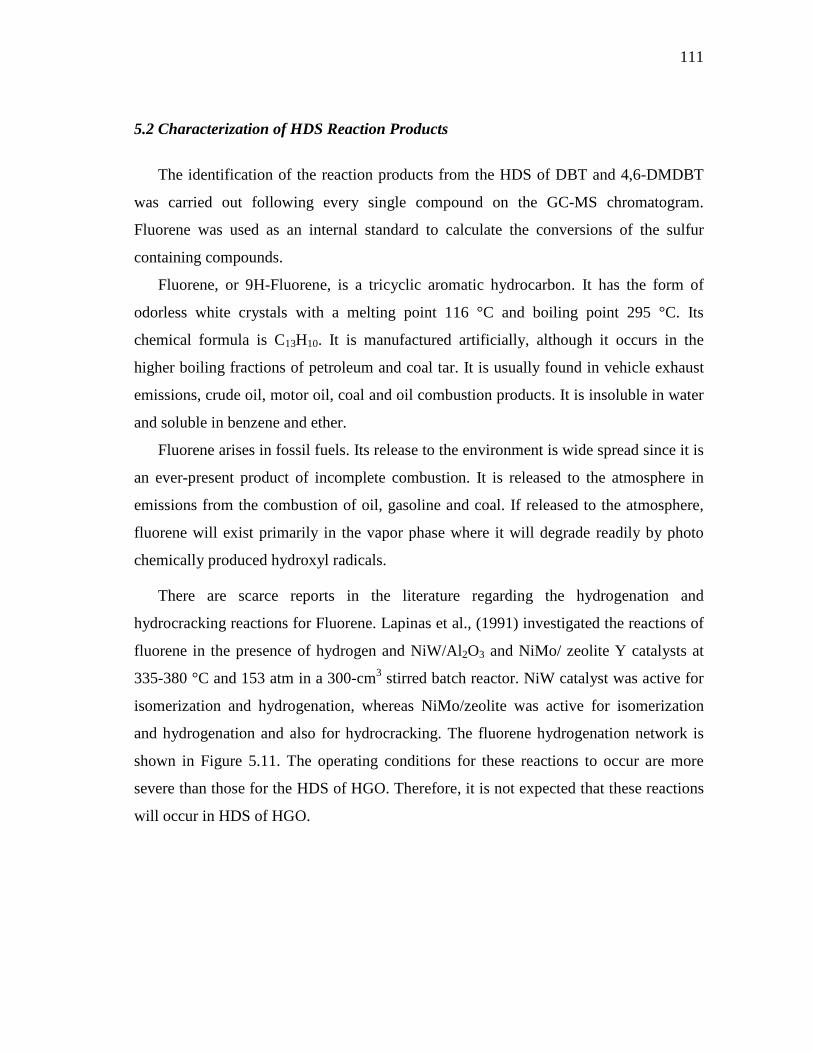
111
5.2 Characterization of HDS Reaction Products
The identification of the reaction products from the HDS of DBT and 4,6-DMDBT
was carried out following every single compound on the GC-MS chromatogram.
Fluorene was used as an internal standard to calculate the conversions of the sulfur
containing compounds.
Fluorene, or 9H-Fluorene, is a tricyclic aromatic hydrocarbon. It has the form of
odorless white crystals with a melting point 116 °C and boiling point 295 °C. Its
chemical formula is C13H10. It is manufactured artificially, although it occurs in the
higher boiling fractions of petroleum and coal tar. It is usually found in vehicle exhaust
emissions, crude oil, motor oil, coal and oil combustion products. It is insoluble in water
and soluble in benzene and ether.
Fluorene arises in fossil fuels. Its release to the environment is wide spread since it is
an ever-present product of incomplete combustion. It is released to the atmosphere in
emissions from the combustion of oil, gasoline and coal. If released to the atmosphere,
fluorene will exist primarily in the vapor phase where it will degrade readily by photo
chemically produced hydroxyl radicals.
There are scarce reports in the literature regarding the hydrogenation and
hydrocracking reactions for Fluorene. Lapinas et al., (1991) investigated the reactions of
fluorene in the presence of hydrogen and NiW/Al2O3 and NiMo/ zeolite Y catalysts at
335-380 °C and 153 atm in a 300-cm3 stirred batch reactor. NiW catalyst was active for
isomerization and hydrogenation, whereas NiMo/zeolite was active for isomerization
and hydrogenation and also for hydrocracking. The fluorene hydrogenation network is
shown in Figure 5.11. The operating conditions for these reactions to occur are more
severe than those for the HDS of HGO. Therefore, it is not expected that these reactions
will occur in HDS of HGO.
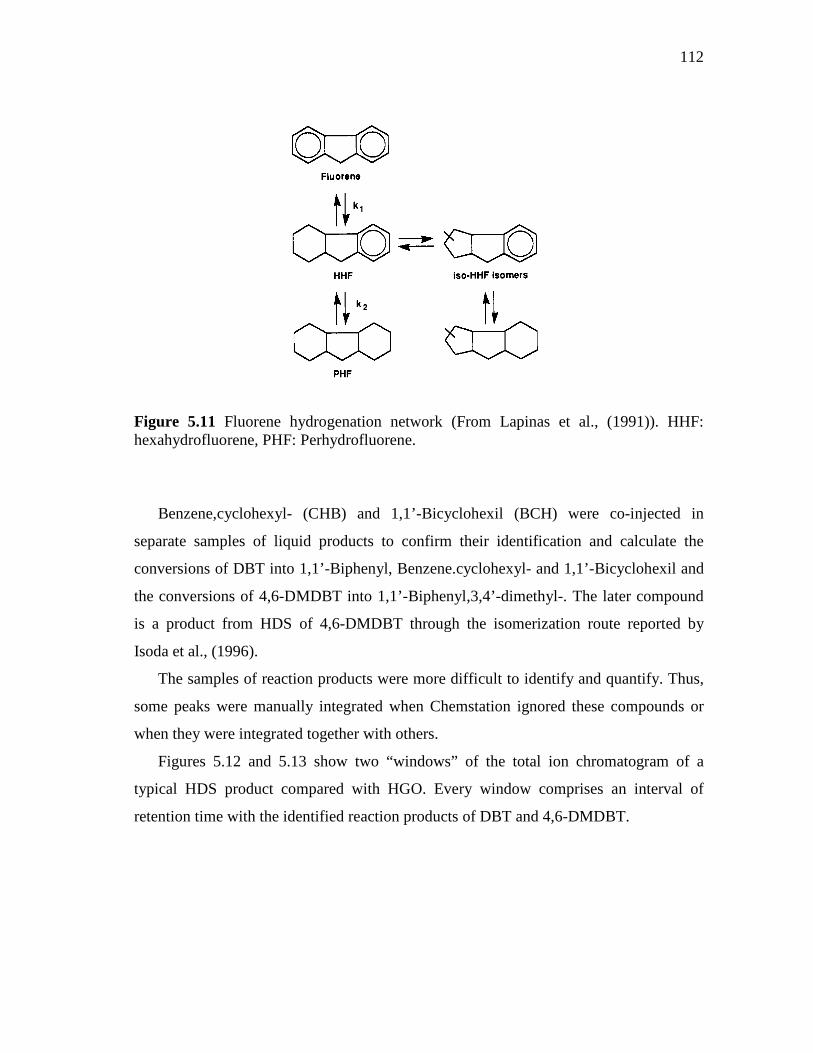
112
Figure 5.11 Fluorene hydrogenation network (From Lapinas et al., (1991)). HHF: hexahydrofluorene, PHF: Perhydrofluorene.
Benzene,cyclohexyl- (CHB) and 1,1’-Bicyclohexil (BCH) were co-injected in
separate samples of liquid products to confirm their identification and calculate the
conversions of DBT into 1,1’-Biphenyl, Benzene.cyclohexyl- and 1,1’-Bicyclohexil and
the conversions of 4,6-DMDBT into 1,1’-Biphenyl,3,4’-dimethyl-. The later compound
is a product from HDS of 4,6-DMDBT through the isomerization route reported by
Isoda et al., (1996).
The samples of reaction products were more difficult to identify and quantify. Thus,
some peaks were manually integrated when Chemstation ignored these compounds or
when they were integrated together with others.
Figures 5.12 and 5.13 show two “windows” of the total ion chromatogram of a
typical HDS product compared with HGO. Every window comprises an interval of
retention time with the identified reaction products of DBT and 4,6-DMDBT.
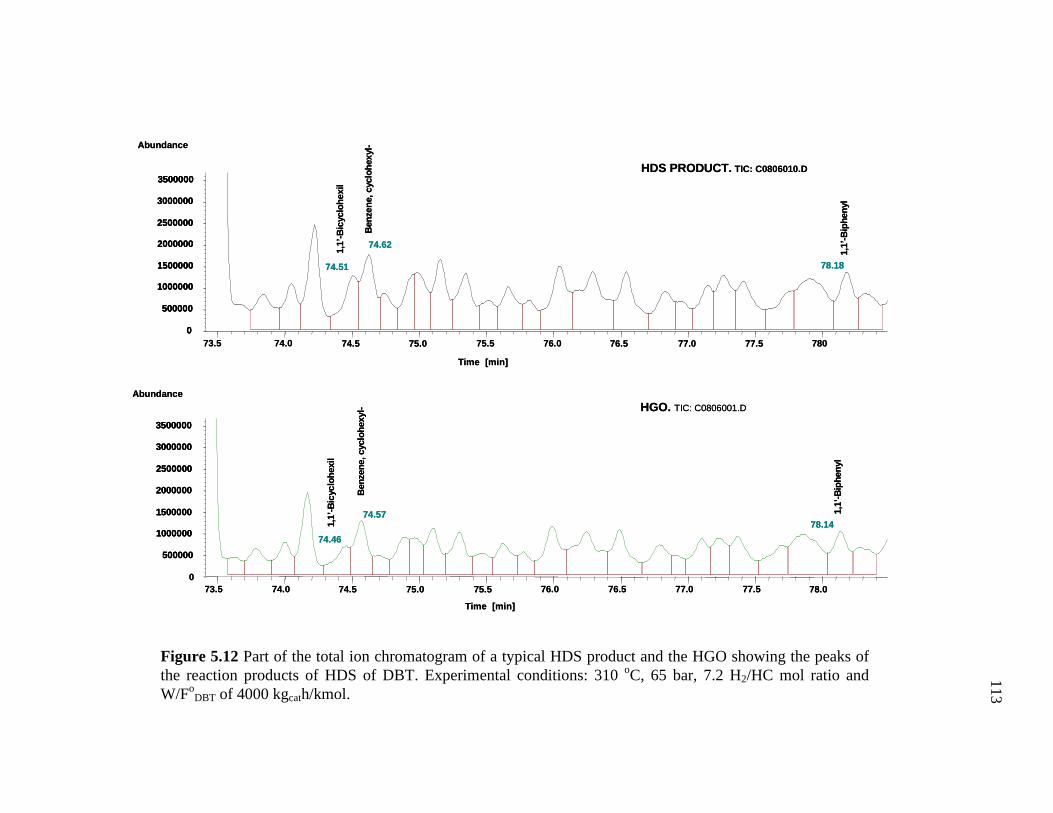
113
Figure 5.12 Part of the total ion chromatogram of a typical HDS product and the HGO showing the peaks of the reaction products of HDS of DBT. Experimental conditions: 310 oC, 65 bar, 7.2 H2/HC mol ratio and W/Fo
DBT of 4000 kgcath/kmol.
73.5 74.0 74.5 75.0 75.5 76.0 76.5 77.0 77.5 7800
500000
1000000
1500000
2000000
2500000
3000000
3500000
Time [min]
Abundance
HDS PRODUCT. TIC: C0806010.D
74.51
74.62
78.18
73.5 74.0 74.5 75.0 75.5 76.0 76.5 77.0 77.5 78.00
500000
1000000
1500000
2000000
2500000
3000000
3500000
Time [min]
Abundance
HGO. TIC: C0806001.D
74.46
74.5778.14
Ben
zene
, cyc
lohe
xyl-
1,1’
-Bic
yclo
hexi
l
1,1’
-Bip
heny
l
1,1’
-Bic
yclo
hexi
l
Ben
zene
, cyc
lohe
xyl-
1,1’
-Bip
heny
l
73.5 74.0 74.5 75.0 75.5 76.0 76.5 77.0 77.5 7800
500000
1000000
1500000
2000000
2500000
3000000
3500000
0
500000
1000000
1500000
2000000
2500000
3000000
3500000
Time [min]
Abundance
HDS PRODUCT. TIC: C0806010.D
74.51
74.62
78.18
73.5 74.0 74.5 75.0 75.5 76.0 76.5 77.0 77.5 78.00
500000
1000000
1500000
2000000
2500000
3000000
3500000
500000
1000000
1500000
2000000
2500000
3000000
3500000
Time [min]
Abundance
HGO. TIC: C0806001.D
74.46
74.5778.14
Ben
zene
, cyc
lohe
xyl-
1,1’
-Bic
yclo
hexi
l
1,1’
-Bip
heny
l
1,1’
-Bic
yclo
hexi
l
Ben
zene
, cyc
lohe
xyl-
1,1’
-Bip
heny
l
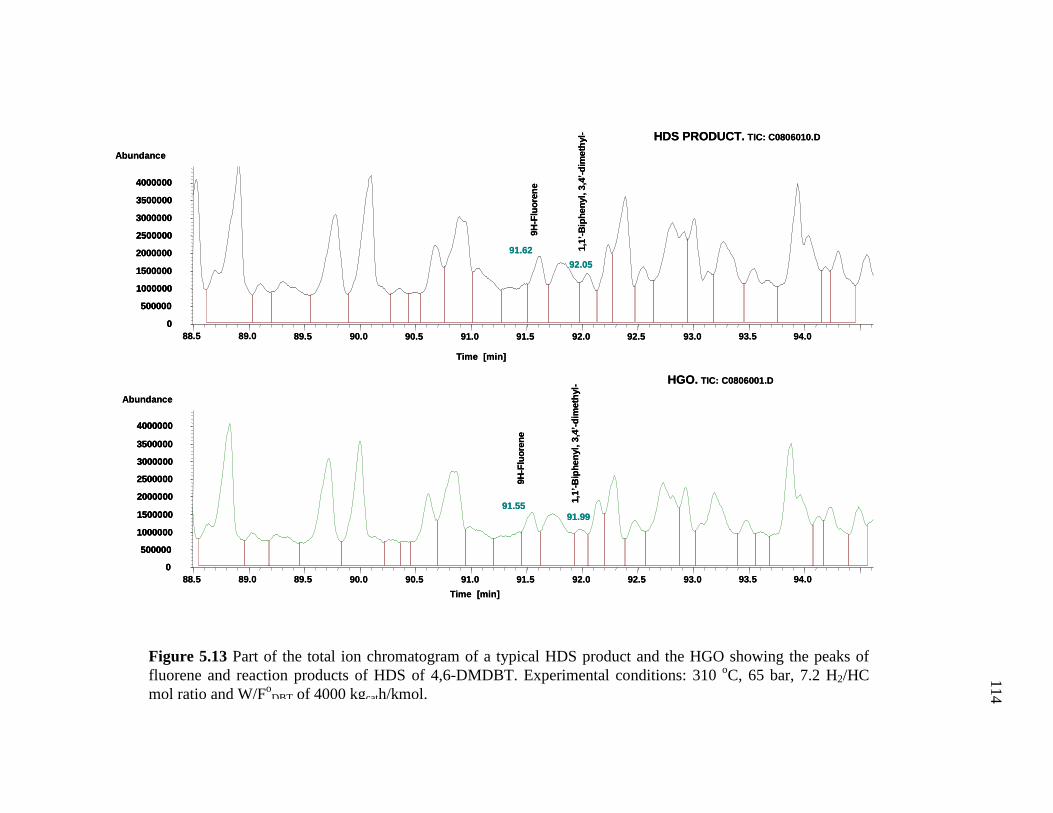
114
Figure 5.13 Part of the total ion chromatogram of a typical HDS product and the HGO showing the peaks of fluorene and reaction products of HDS of 4,6-DMDBT. Experimental conditions: 310 oC, 65 bar, 7.2 H2/HC mol ratio and W/FoDBT of 4000 kgcath/kmol.
88.5 89.0 89.5 90.0 90.5 91.0 91.5 92.0 92.5 93.0 93.5 94.00
500000
1000000
1500000
2000000
2500000
3000000
3500000
4000000
Time [min]
Abundance
HDS PRODUCT. TIC: C0806010.D
91.62
92.05
88.5 89.0 89.5 90.0 90.5 91.0 91.5 92.0 92.5 93.0 93.5 94.00
500000
1000000
1500000
2000000
2500000
3000000
3500000
4000000
Time [min]
Abundance
HGO. TIC: C0806001.D
91.5591.99
1,1’
-Bip
heny
l, 3,
4’-d
imet
hyl-
9H-F
luor
ene
9H-F
luor
ene
1,1’
-Bip
heny
l, 3,
4’-d
imet
hyl-
88.5 89.0 89.5 90.0 90.5 91.0 91.5 92.0 92.5 93.0 93.5 94.00
500000
1000000
1500000
2000000
2500000
3000000
3500000
4000000
0
500000
1000000
1500000
2000000
2500000
3000000
3500000
4000000
Time [min]
Abundance
HDS PRODUCT. TIC: C0806010.D
91.62
92.05
88.5 89.0 89.5 90.0 90.5 91.0 91.5 92.0 92.5 93.0 93.5 94.00
500000
1000000
1500000
2000000
2500000
3000000
3500000
4000000
0
500000
1000000
1500000
2000000
2500000
3000000
3500000
4000000
Time [min]
Abundance
HGO. TIC: C0806001.D
91.5591.99
1,1’
-Bip
heny
l, 3,
4’-d
imet
hyl-
9H-F
luor
ene
9H-F
luor
ene
1,1’
-Bip
heny
l, 3,
4’-d
imet
hyl-
115
CHAPTER VI
TEST OF THE CATALYSTS
This part presents the results on the Hydrodesulfurization of Heavy Gas oil (HGO)
over a commercial CoMo/Al2O3 and over CoMoNiPtPd supported on ultrastable
Faujasite (HY) catalysts. The effect of the reaction conditions: temperature (290-350 oC), space time (W/FoDBT: 3000-8000 kgcath/kmol), hydrogen/hydrocarbon ratio (2.8-
11.2 mol/mol) and pressure (65-75 bar) were studied. The activity of the catalysts in
terms of conversions of dibenzothiophene (DBT), methyldibenzothiophene’s (MDBT’s),
phenanthrene and molar-averaged conversion under the effect of variables is discussed.
For discussion purposes the activity test has been divided into six categories. The
activity test of the conventional CoMo/Al2O3 (HDS-0) catalyst constitutes the first
category. For this catalyst the effect of the space time at molar H2/HC ratio of 2.8 and
the effect of space time at molar H2/HC ratio of 7.2 is discussed. Moreover, the
conversions of DBT, phenanthrene and molar-averaged conversion under the effect of
space time and molar hydrogen/hydrocarbon ratio at 330 oC are also discussed.
The remaining categories include the activity test of the experimental zeolite
catalysts (HDS-1, HDS-8, HDS-10, HDS-3 and HDS-5).
For CoMoPtPd/HY (HDS-1) catalyst, the effect of space time and temperature and
the effect of the molar hydrogen/hydrocarbon ratio at 65 bar and 75 bar is discussed. For
reasons of safety 75 bar was the upper limit for the operating pressure.
For CoMo/PdNiPt-HY (HDS-8) and CoMoNi/PdPt-HY (HDS-10) catalysts, the
effect of the space time at 330 oC and 310 oC under molar H2/HC ratio of 7.2, the effect
of the space time at 310 oC and a molar H2/HC ratio of 11.2 and the effect of the molar
hydrogen/hydrocarbon ratio at 310 oC at 65-75 bar are discussed.
Finally for CoMoPtPd/Ni-HY (HDS-3) and CoMoPd/Pt-HY (HDS-5) catalysts, the
effect of the space time at 310 oC under molar H2/HC ratio of 7.2 and the study of the
effect of the molar hydrogen/hydrocarbon ratio at 310 oC at 65 bar is discussed.
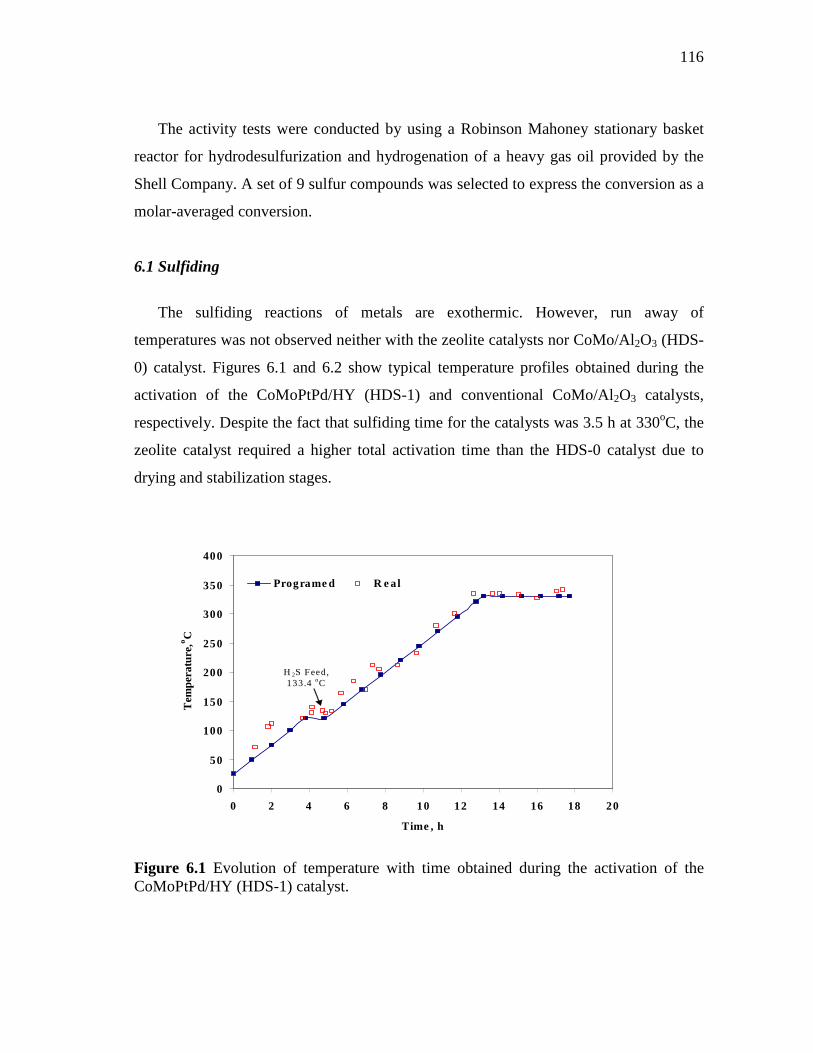
116
The activity tests were conducted by using a Robinson Mahoney stationary basket
reactor for hydrodesulfurization and hydrogenation of a heavy gas oil provided by the
Shell Company. A set of 9 sulfur compounds was selected to express the conversion as a
molar-averaged conversion.
6.1 Sulfiding
The sulfiding reactions of metals are exothermic. However, run away of
temperatures was not observed neither with the zeolite catalysts nor CoMo/Al2O3 (HDS-
0) catalyst. Figures 6.1 and 6.2 show typical temperature profiles obtained during the
activation of the CoMoPtPd/HY (HDS-1) and conventional CoMo/Al2O3 catalysts,
respectively. Despite the fact that sulfiding time for the catalysts was 3.5 h at 330oC, the
zeolite catalyst required a higher total activation time than the HDS-0 catalyst due to
drying and stabilization stages.
0
50
100
150
200
250
300
350
400
0 2 4 6 8 10 12 14 16 18 20
Time , h
Tem
pera
ture
, o C
Programe d R e al
H 2S Feed, 133.4 oC
Figure 6.1 Evolution of temperature with time obtained during the activation of the CoMoPtPd/HY (HDS-1) catalyst.
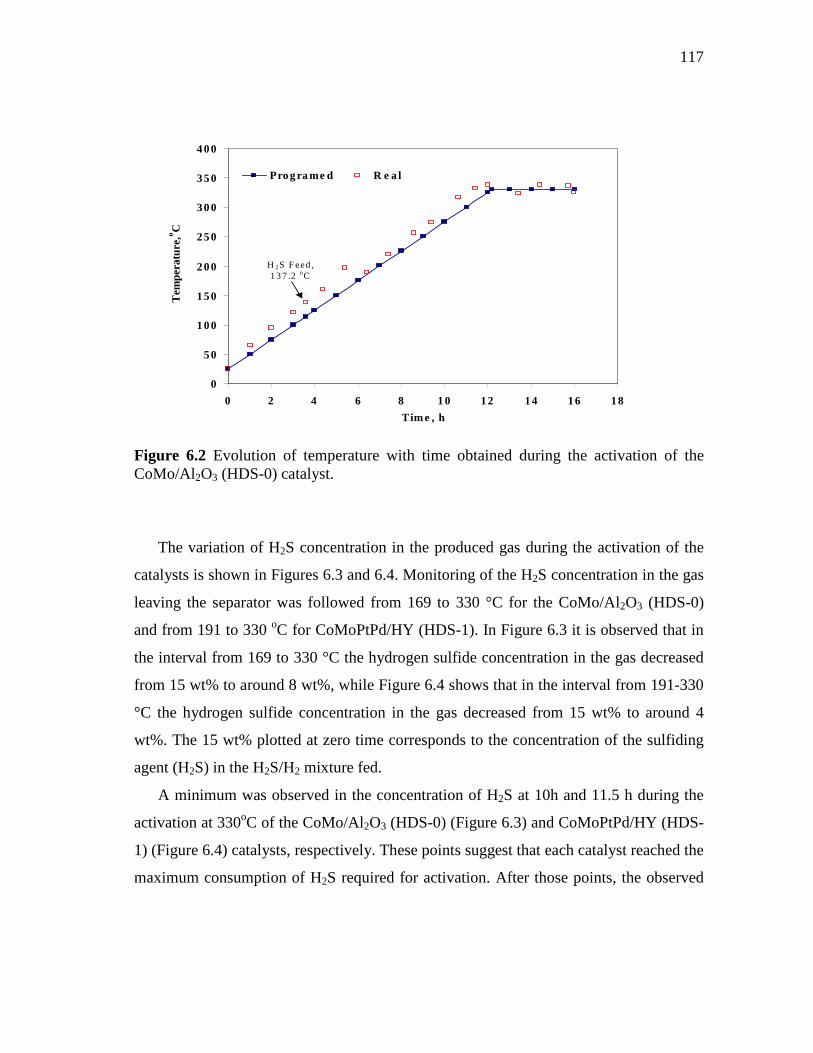
117
0
50
100
150
200
250
300
350
400
0 2 4 6 8 1 0 12 14 16 18
Time , h
Tem
pera
ture
, o CP rog rame d R e a l
H 2S F eed , 137 .2 oC
Figure 6.2 Evolution of temperature with time obtained during the activation of the CoMo/Al2O3 (HDS-0) catalyst.
The variation of H2S concentration in the produced gas during the activation of the
catalysts is shown in Figures 6.3 and 6.4. Monitoring of the H2S concentration in the gas
leaving the separator was followed from 169 to 330 °C for the CoMo/Al2O3 (HDS-0)
and from 191 to 330 oC for CoMoPtPd/HY (HDS-1). In Figure 6.3 it is observed that in
the interval from 169 to 330 °C the hydrogen sulfide concentration in the gas decreased
from 15 wt% to around 8 wt%, while Figure 6.4 shows that in the interval from 191-330
°C the hydrogen sulfide concentration in the gas decreased from 15 wt% to around 4
wt%. The 15 wt% plotted at zero time corresponds to the concentration of the sulfiding
agent (H2S) in the H2S/H2 mixture fed.
A minimum was observed in the concentration of H2S at 10h and 11.5 h during the
activation at 330oC of the CoMo/Al2O3 (HDS-0) (Figure 6.3) and CoMoPtPd/HY (HDS-
1) (Figure 6.4) catalysts, respectively. These points suggest that each catalyst reached the
maximum consumption of H2S required for activation. After those points, the observed
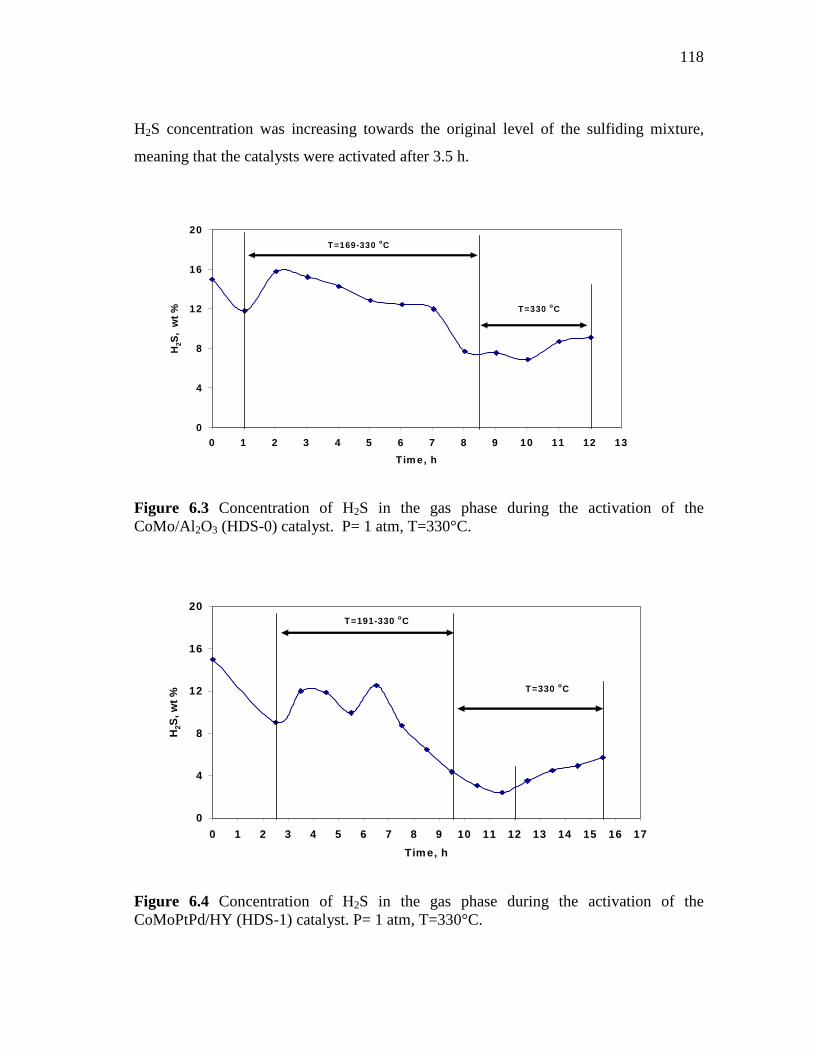
118
H2S concentration was increasing towards the original level of the sulfiding mixture,
meaning that the catalysts were activated after 3.5 h.
0
4
8
12
16
20
0 1 2 3 4 5 6 7 8 9 10 11 12 13
Tim e, h
H2S
, w
t %
T=330 o C
T=169-330 oC
Figure 6.3 Concentration of H2S in the gas phase during the activation of the CoMo/Al2O3 (HDS-0) catalyst. P= 1 atm, T=330°C.
0
4
8
12
16
20
0 1 2 3 4 5 6 7 8 9 10 11 12 13 14 15 16 17
Tim e, h
H2S
, wt %
T=330 oC
T=191-330 oC
Figure 6.4 Concentration of H2S in the gas phase during the activation of the CoMoPtPd/HY (HDS-1) catalyst. P= 1 atm, T=330°C.
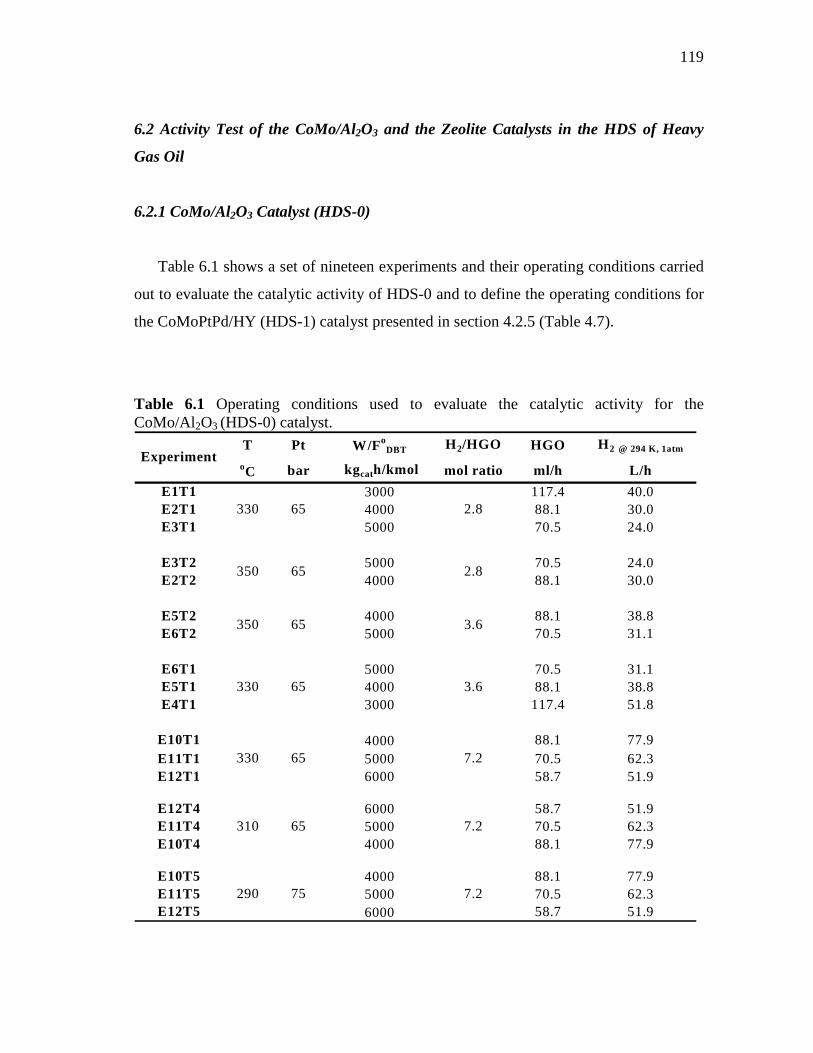
119
6.2 Activity Test of the CoMo/Al2O3 and the Zeolite Catalysts in the HDS of Heavy
Gas Oil
6.2.1 CoMo/Al2O3 Catalyst (HDS-0)
Table 6.1 shows a set of nineteen experiments and their operating conditions carried
out to evaluate the catalytic activity of HDS-0 and to define the operating conditions for
the CoMoPtPd/HY (HDS-1) catalyst presented in section 4.2.5 (Table 4.7).
Table 6.1 Operating conditions used to evaluate the catalytic activity for the CoMo/Al2O3 (HDS-0) catalyst.
T Pt W/FoDBT H 2/HGO HGO H 2 @ 294 K, 1atm
oC bar kgcath/kmol mol ratio ml/h L/h
E1T1 3000 117.4 40.0E2T1 4000 88.1 30.0E3T1 5000 70.5 24.0
E3T2 5000 70.5 24.0E2T2 4000 88.1 30.0
E5T2 4000 88.1 38.8E6T2 5000 70.5 31.1
E6T1 5000 70.5 31.1E5T1 4000 88.1 38.8E4T1 3000 117.4 51.8
E10T1 4000 88.1 77.9E11T1 5000 70.5 62.3E12T1 6000 58.7 51.9
E12T4 6000 58.7 51.9E11T4 5000 70.5 62.3E10T4 4000 88.1 77.9
E10T5 4000 88.1 77.9E11T5 5000 70.5 62.3E12T5 6000 58.7 51.9
7.2
7.2
7.2
65
65
65
75
65
330
350 65
350
290
Experiment
330
330
310
2.8
3.6
2.8
65
3.6
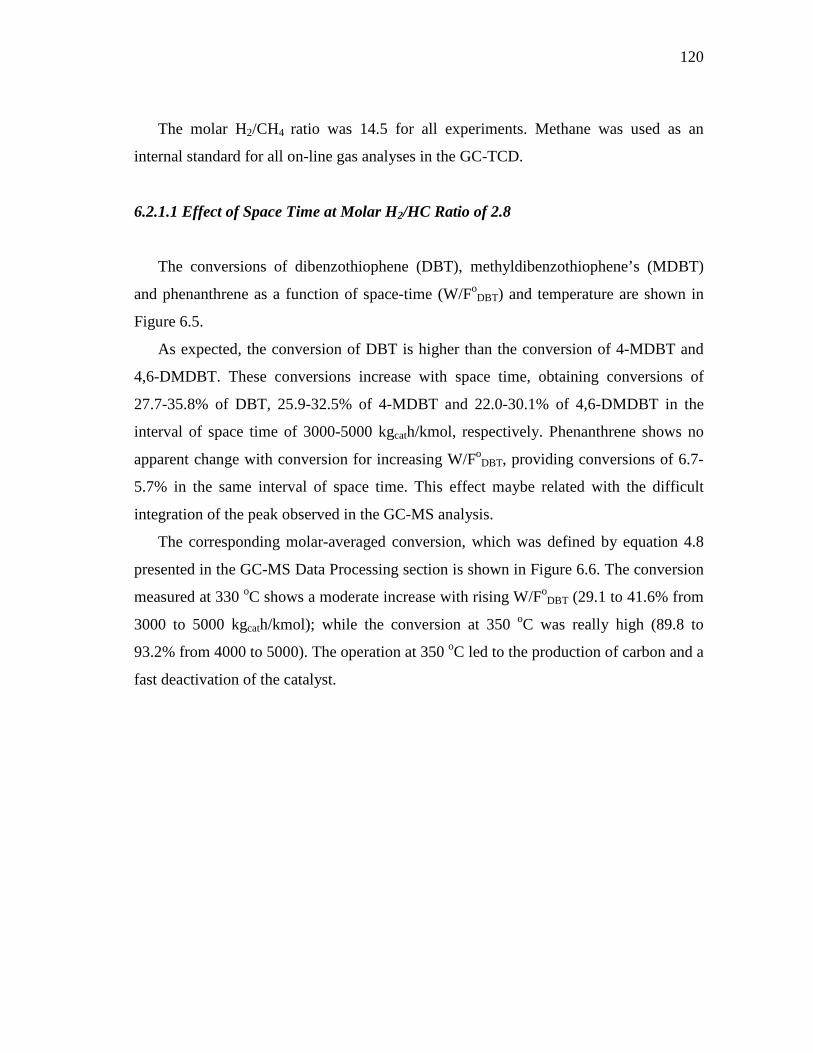
120
The molar H2/CH4 ratio was 14.5 for all experiments. Methane was used as an
internal standard for all on-line gas analyses in the GC-TCD.
6.2.1.1 Effect of Space Time at Molar H2/HC Ratio of 2.8
The conversions of dibenzothiophene (DBT), methyldibenzothiophene’s (MDBT)
and phenanthrene as a function of space-time (W/FoDBT) and temperature are shown in
Figure 6.5.
As expected, the conversion of DBT is higher than the conversion of 4-MDBT and
4,6-DMDBT. These conversions increase with space time, obtaining conversions of
27.7-35.8% of DBT, 25.9-32.5% of 4-MDBT and 22.0-30.1% of 4,6-DMDBT in the
interval of space time of 3000-5000 kgcath/kmol, respectively. Phenanthrene shows no
apparent change with conversion for increasing W/FoDBT, providing conversions of 6.7-
5.7% in the same interval of space time. This effect maybe related with the difficult
integration of the peak observed in the GC-MS analysis.
The corresponding molar-averaged conversion, which was defined by equation 4.8
presented in the GC-MS Data Processing section is shown in Figure 6.6. The conversion
measured at 330 oC shows a moderate increase with rising W/FoDBT (29.1 to 41.6% from
3000 to 5000 kgcath/kmol); while the conversion at 350 oC was really high (89.8 to
93.2% from 4000 to 5000). The operation at 350 oC led to the production of carbon and a
fast deactivation of the catalyst.
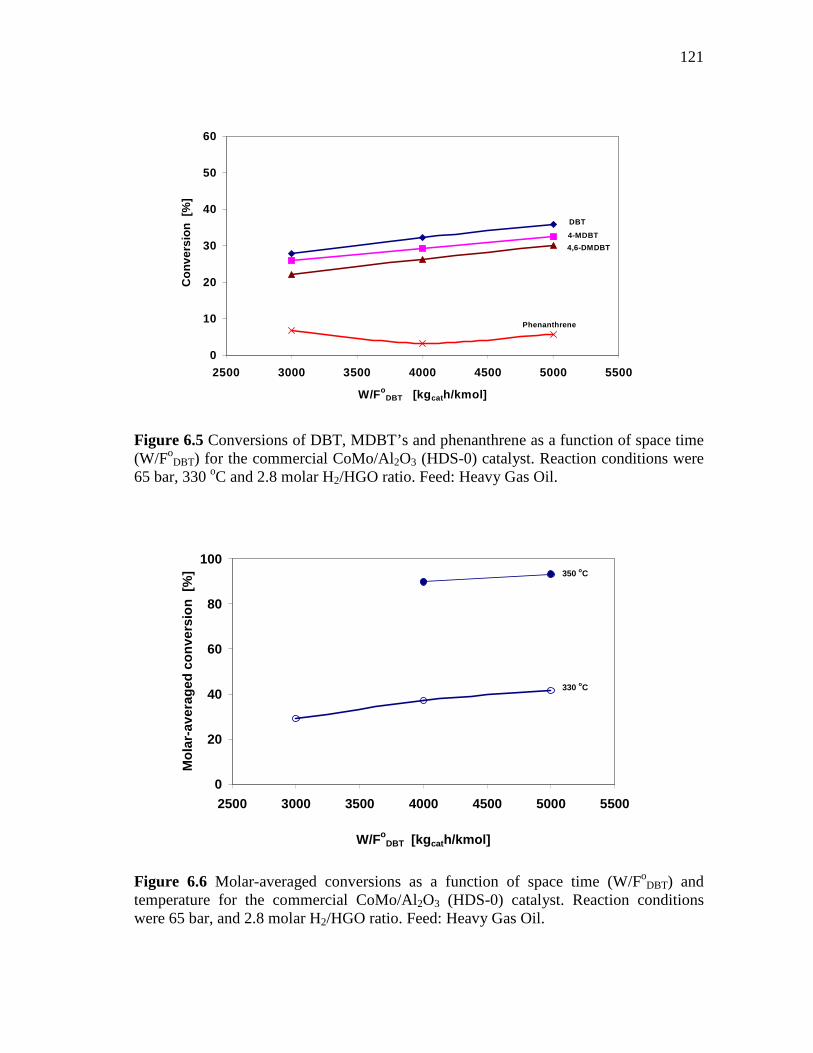
121
0
10
20
30
40
50
60
2500 3000 3500 4000 4500 5000 5500
W/FoDBT [kg cath/kmol]
Con
vers
ion
[%]
DBT
4-MDBT
4,6-DMDBT
Phenanthrene
Figure 6.5 Conversions of DBT, MDBT’s and phenanthrene as a function of space time (W/Fo
DBT) for the commercial CoMo/Al2O3 (HDS-0) catalyst. Reaction conditions were 65 bar, 330 oC and 2.8 molar H2/HGO ratio. Feed: Heavy Gas Oil.
0
20
40
60
80
100
2500 3000 3500 4000 4500 5000 5500
W/FoDBT [kg cath/kmol]
Mol
ar-a
vera
ged
conv
ersi
on [
%]
330 oC
350 oC
Figure 6.6 Molar-averaged conversions as a function of space time (W/Fo
DBT) and temperature for the commercial CoMo/Al2O3 (HDS-0) catalyst. Reaction conditions were 65 bar, and 2.8 molar H2/HGO ratio. Feed: Heavy Gas Oil.
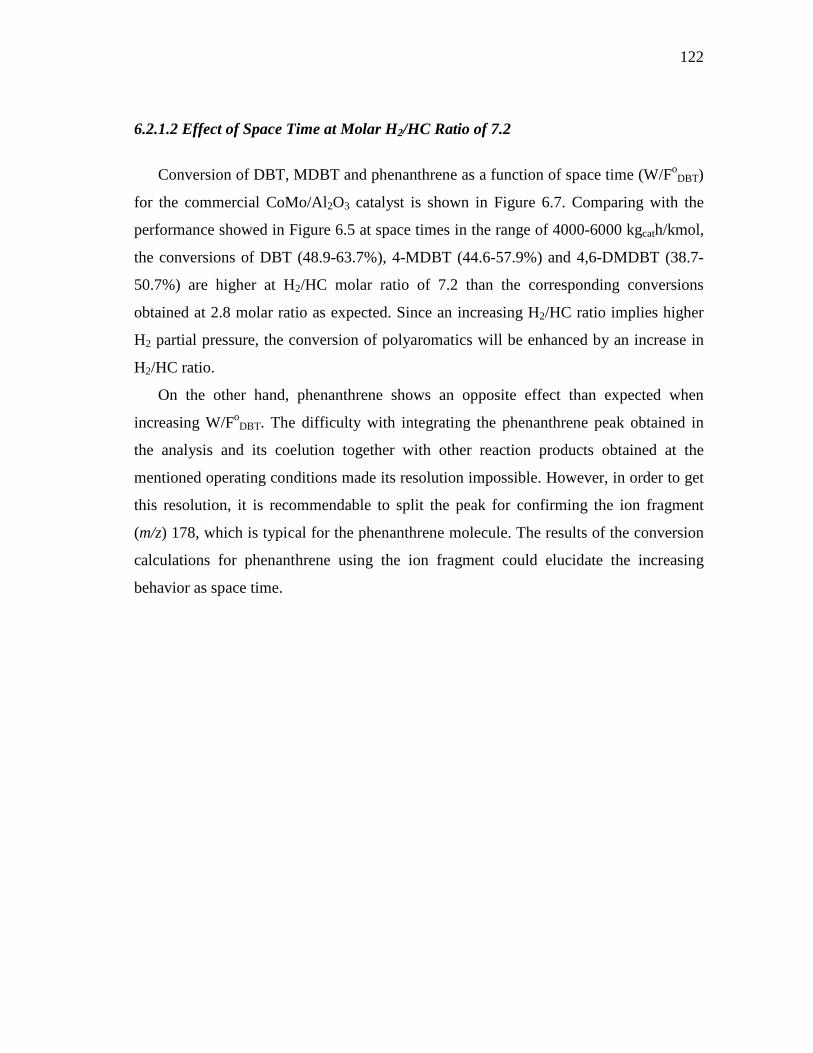
122
6.2.1.2 Effect of Space Time at Molar H2/HC Ratio of 7.2
Conversion of DBT, MDBT and phenanthrene as a function of space time (W/FoDBT)
for the commercial CoMo/Al2O3 catalyst is shown in Figure 6.7. Comparing with the
performance showed in Figure 6.5 at space times in the range of 4000-6000 kgcath/kmol,
the conversions of DBT (48.9-63.7%), 4-MDBT (44.6-57.9%) and 4,6-DMDBT (38.7-
50.7%) are higher at H2/HC molar ratio of 7.2 than the corresponding conversions
obtained at 2.8 molar ratio as expected. Since an increasing H2/HC ratio implies higher
H2 partial pressure, the conversion of polyaromatics will be enhanced by an increase in
H2/HC ratio.
On the other hand, phenanthrene shows an opposite effect than expected when
increasing W/FoDBT. The difficulty with integrating the phenanthrene peak obtained in
the analysis and its coelution together with other reaction products obtained at the
mentioned operating conditions made its resolution impossible. However, in order to get
this resolution, it is recommendable to split the peak for confirming the ion fragment
(m/z) 178, which is typical for the phenanthrene molecule. The results of the conversion
calculations for phenanthrene using the ion fragment could elucidate the increasing
behavior as space time.
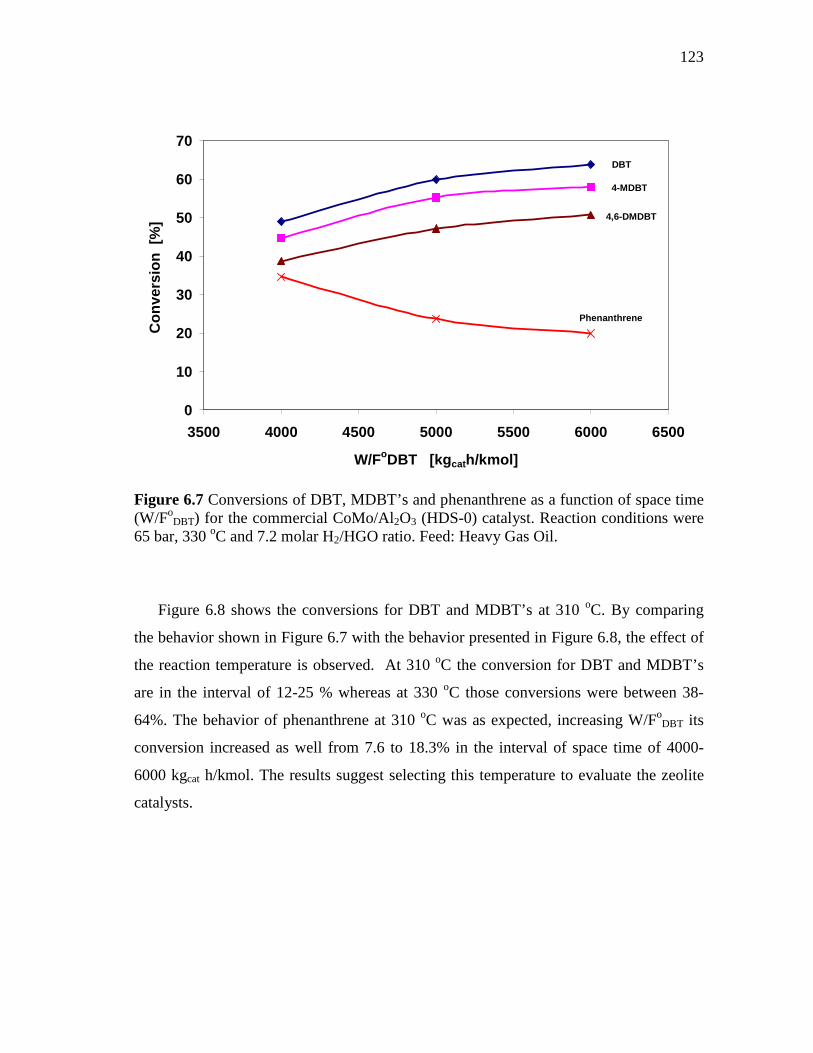
123
0
10
20
30
40
50
60
70
3500 4000 4500 5000 5500 6000 6500
W/FoDBT [kg cath/kmol]
Con
vers
ion
[%]
DBT
4-MDBT
4,6-DMDBT
Phenanthrene
Figure 6.7 Conversions of DBT, MDBT’s and phenanthrene as a function of space time (W/Fo
DBT) for the commercial CoMo/Al2O3 (HDS-0) catalyst. Reaction conditions were 65 bar, 330 oC and 7.2 molar H2/HGO ratio. Feed: Heavy Gas Oil.
Figure 6.8 shows the conversions for DBT and MDBT’s at 310 oC. By comparing
the behavior shown in Figure 6.7 with the behavior presented in Figure 6.8, the effect of
the reaction temperature is observed. At 310 oC the conversion for DBT and MDBT’s
are in the interval of 12-25 % whereas at 330 oC those conversions were between 38-
64%. The behavior of phenanthrene at 310 oC was as expected, increasing W/FoDBT its
conversion increased as well from 7.6 to 18.3% in the interval of space time of 4000-
6000 kgcat h/kmol. The results suggest selecting this temperature to evaluate the zeolite
catalysts.
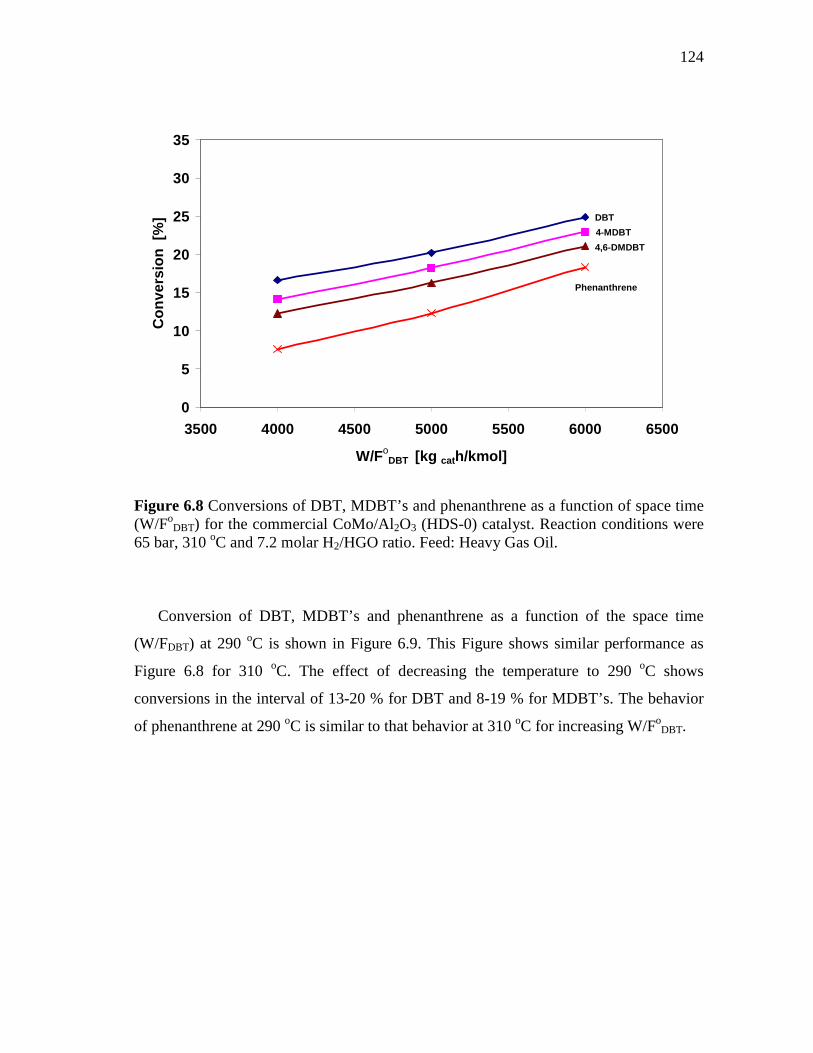
124
0
5
10
15
20
25
30
35
3500 4000 4500 5000 5500 6000 6500
W/FoDBT [kg cath/kmol]
Con
vers
ion
[%]
Phenanthrene
DBT
4-MDBT
4,6-DMDBT
Figure 6.8 Conversions of DBT, MDBT’s and phenanthrene as a function of space time (W/Fo
DBT) for the commercial CoMo/Al2O3 (HDS-0) catalyst. Reaction conditions were 65 bar, 310 oC and 7.2 molar H2/HGO ratio. Feed: Heavy Gas Oil.
Conversion of DBT, MDBT’s and phenanthrene as a function of the space time
(W/FDBT) at 290 oC is shown in Figure 6.9. This Figure shows similar performance as
Figure 6.8 for 310 oC. The effect of decreasing the temperature to 290 oC shows
conversions in the interval of 13-20 % for DBT and 8-19 % for MDBT’s. The behavior
of phenanthrene at 290 oC is similar to that behavior at 310 oC for increasing W/FoDBT.
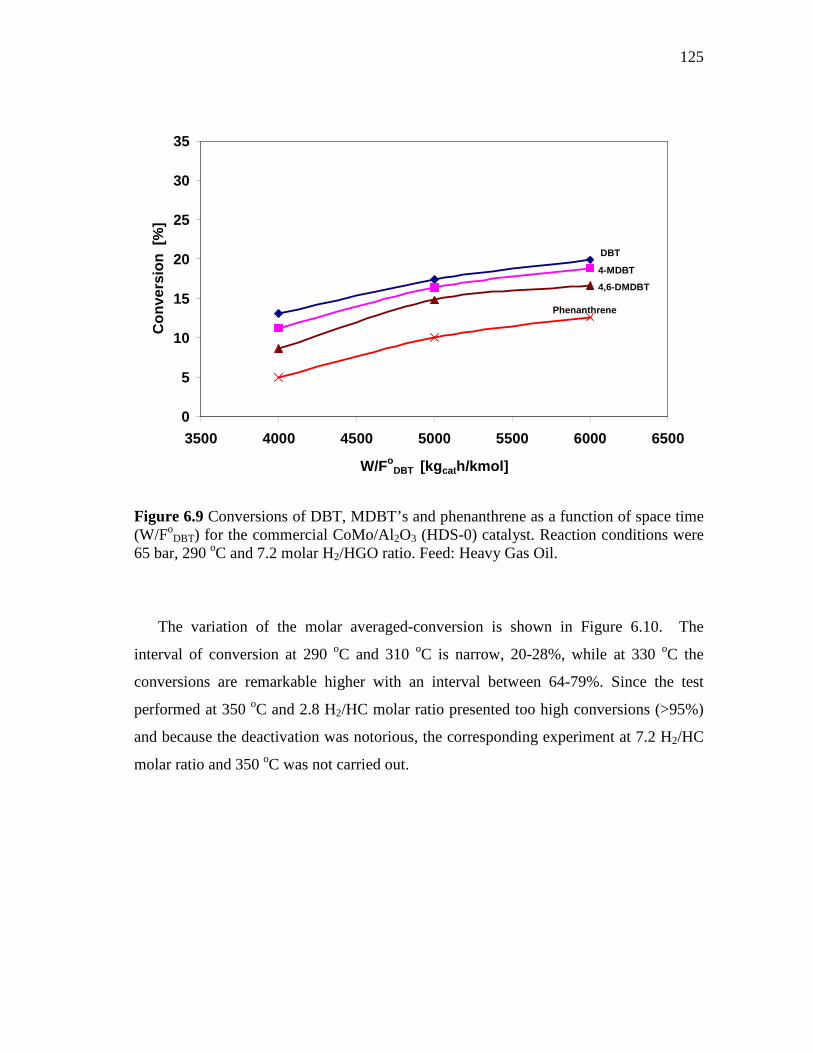
125
0
5
10
15
20
25
30
35
3500 4000 4500 5000 5500 6000 6500
W/FoDBT [kg cath/kmol]
Con
vers
ion
[%]
Phenanthrene
4,6-DMDBT
4-MDBT
DBT
Figure 6.9 Conversions of DBT, MDBT’s and phenanthrene as a function of space time (W/Fo
DBT) for the commercial CoMo/Al2O3 (HDS-0) catalyst. Reaction conditions were 65 bar, 290 oC and 7.2 molar H2/HGO ratio. Feed: Heavy Gas Oil.
The variation of the molar averaged-conversion is shown in Figure 6.10. The
interval of conversion at 290 oC and 310 oC is narrow, 20-28%, while at 330 oC the
conversions are remarkable higher with an interval between 64-79%. Since the test
performed at 350 oC and 2.8 H2/HC molar ratio presented too high conversions (>95%)
and because the deactivation was notorious, the corresponding experiment at 7.2 H2/HC
molar ratio and 350 oC was not carried out.
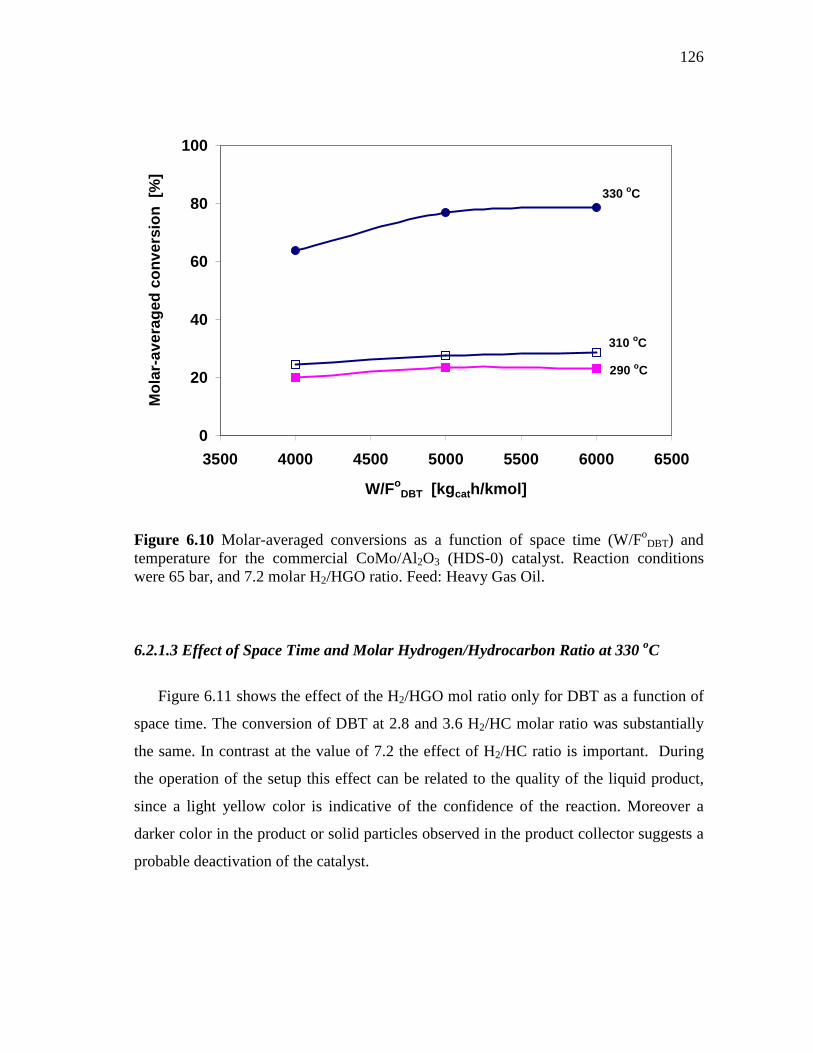
126
0
20
40
60
80
100
3500 4000 4500 5000 5500 6000 6500
W/FoDBT [kg cath/kmol]
Mol
ar-a
vera
ged
conv
ersi
on [
%] 330 oC
310 oC
290 oC
Figure 6.10 Molar-averaged conversions as a function of space time (W/FoDBT) and
temperature for the commercial CoMo/Al2O3 (HDS-0) catalyst. Reaction conditions were 65 bar, and 7.2 molar H2/HGO ratio. Feed: Heavy Gas Oil.
6.2.1.3 Effect of Space Time and Molar Hydrogen/Hydrocarbon Ratio at 330 oC
Figure 6.11 shows the effect of the H2/HGO mol ratio only for DBT as a function of
space time. The conversion of DBT at 2.8 and 3.6 H2/HC molar ratio was substantially
the same. In contrast at the value of 7.2 the effect of H2/HC ratio is important. During
the operation of the setup this effect can be related to the quality of the liquid product,
since a light yellow color is indicative of the confidence of the reaction. Moreover a
darker color in the product or solid particles observed in the product collector suggests a
probable deactivation of the catalyst.
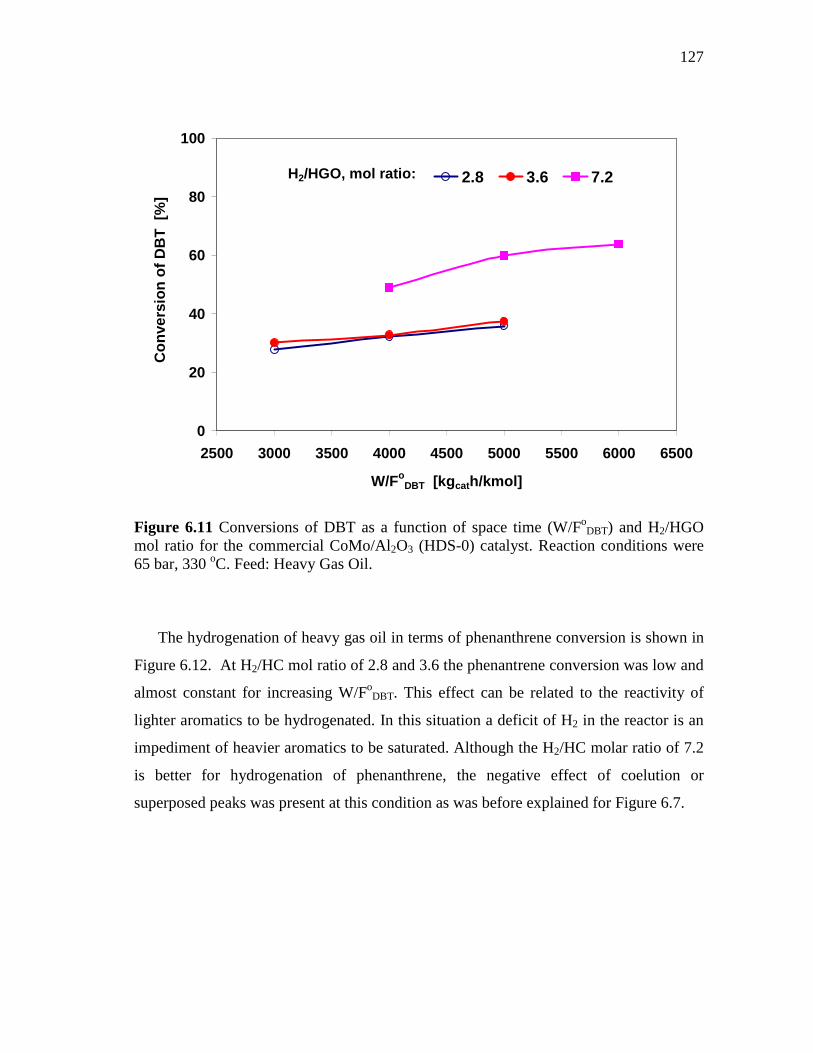
127
0
20
40
60
80
100
2500 3000 3500 4000 4500 5000 5500 6000 6500
W/FoDBT [kg cath/kmol]
Con
vers
ion
of D
BT
[%
]2.8 3.6 7.2H2/HGO, mol ratio:
Figure 6.11 Conversions of DBT as a function of space time (W/FoDBT) and H2/HGO
mol ratio for the commercial CoMo/Al2O3 (HDS-0) catalyst. Reaction conditions were 65 bar, 330 oC. Feed: Heavy Gas Oil.
The hydrogenation of heavy gas oil in terms of phenanthrene conversion is shown in
Figure 6.12. At H2/HC mol ratio of 2.8 and 3.6 the phenantrene conversion was low and
almost constant for increasing W/FoDBT. This effect can be related to the reactivity of
lighter aromatics to be hydrogenated. In this situation a deficit of H2 in the reactor is an
impediment of heavier aromatics to be saturated. Although the H2/HC molar ratio of 7.2
is better for hydrogenation of phenanthrene, the negative effect of coelution or
superposed peaks was present at this condition as was before explained for Figure 6.7.
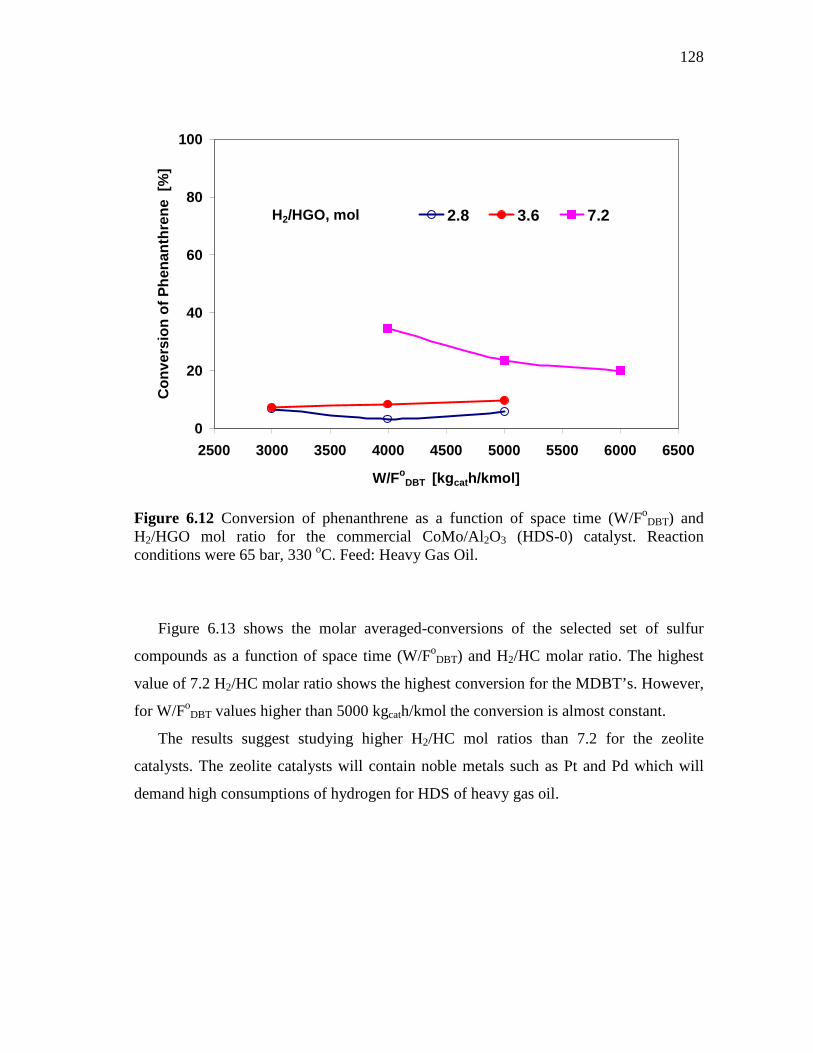
128
0
20
40
60
80
100
2500 3000 3500 4000 4500 5000 5500 6000 6500
W/FoDBT [kg cath/kmol]
Con
vers
ion
of P
hena
nthr
ene
[%]
2.8 3.6 7.2H2/HGO, mol
Figure 6.12 Conversion of phenanthrene as a function of space time (W/FoDBT) and
H2/HGO mol ratio for the commercial CoMo/Al2O3 (HDS-0) catalyst. Reaction conditions were 65 bar, 330 oC. Feed: Heavy Gas Oil.
Figure 6.13 shows the molar averaged-conversions of the selected set of sulfur
compounds as a function of space time (W/FoDBT) and H2/HC molar ratio. The highest
value of 7.2 H2/HC molar ratio shows the highest conversion for the MDBT’s. However,
for W/FoDBT values higher than 5000 kgcath/kmol the conversion is almost constant.
The results suggest studying higher H2/HC mol ratios than 7.2 for the zeolite
catalysts. The zeolite catalysts will contain noble metals such as Pt and Pd which will
demand high consumptions of hydrogen for HDS of heavy gas oil.
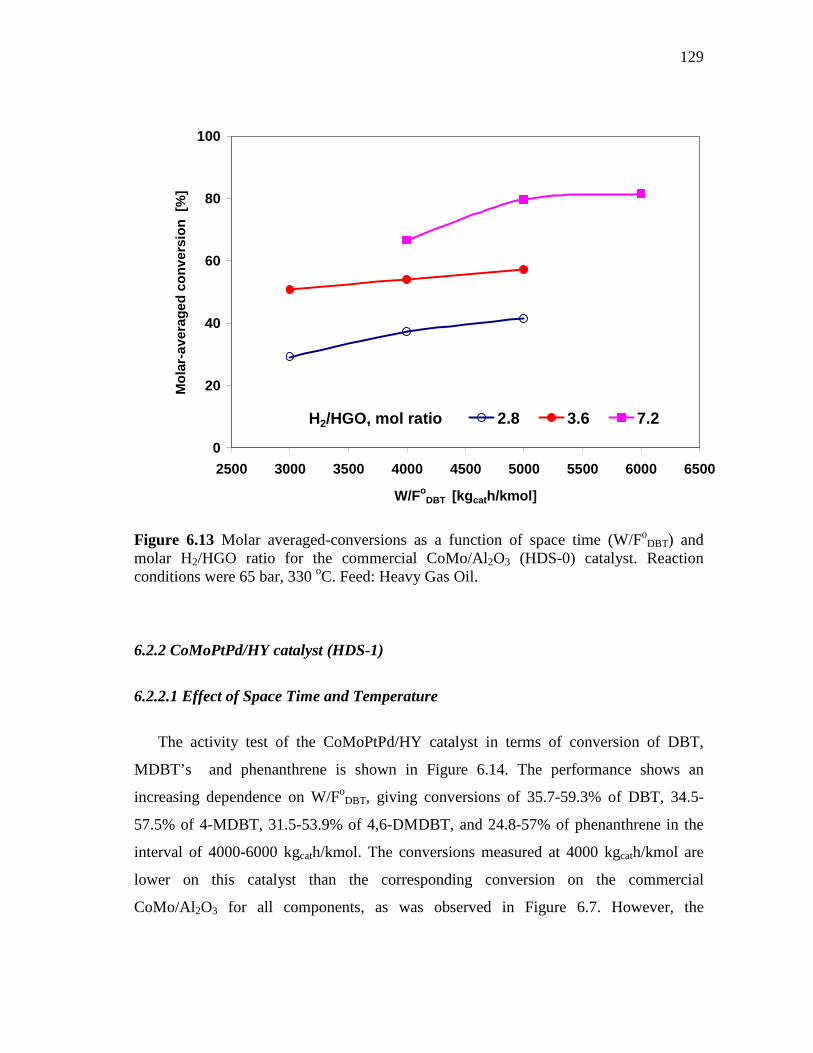
129
0
20
40
60
80
100
2500 3000 3500 4000 4500 5000 5500 6000 6500
W/FoDBT [kg cath/kmol]
Mol
ar-a
vera
ged
conv
ersi
on [
%]
2.8 3.6 7.2H2/HGO, mol ratio :
Figure 6.13 Molar averaged-conversions as a function of space time (W/Fo
DBT) and molar H2/HGO ratio for the commercial CoMo/Al2O3 (HDS-0) catalyst. Reaction conditions were 65 bar, 330 oC. Feed: Heavy Gas Oil.
6.2.2 CoMoPtPd/HY catalyst (HDS-1)
6.2.2.1 Effect of Space Time and Temperature
The activity test of the CoMoPtPd/HY catalyst in terms of conversion of DBT,
MDBT’s and phenanthrene is shown in Figure 6.14. The performance shows an
increasing dependence on W/FoDBT, giving conversions of 35.7-59.3% of DBT, 34.5-
57.5% of 4-MDBT, 31.5-53.9% of 4,6-DMDBT, and 24.8-57% of phenanthrene in the
interval of 4000-6000 kgcath/kmol. The conversions measured at 4000 kgcath/kmol are
lower on this catalyst than the corresponding conversion on the commercial
CoMo/Al2O3 for all components, as was observed in Figure 6.7. However, the
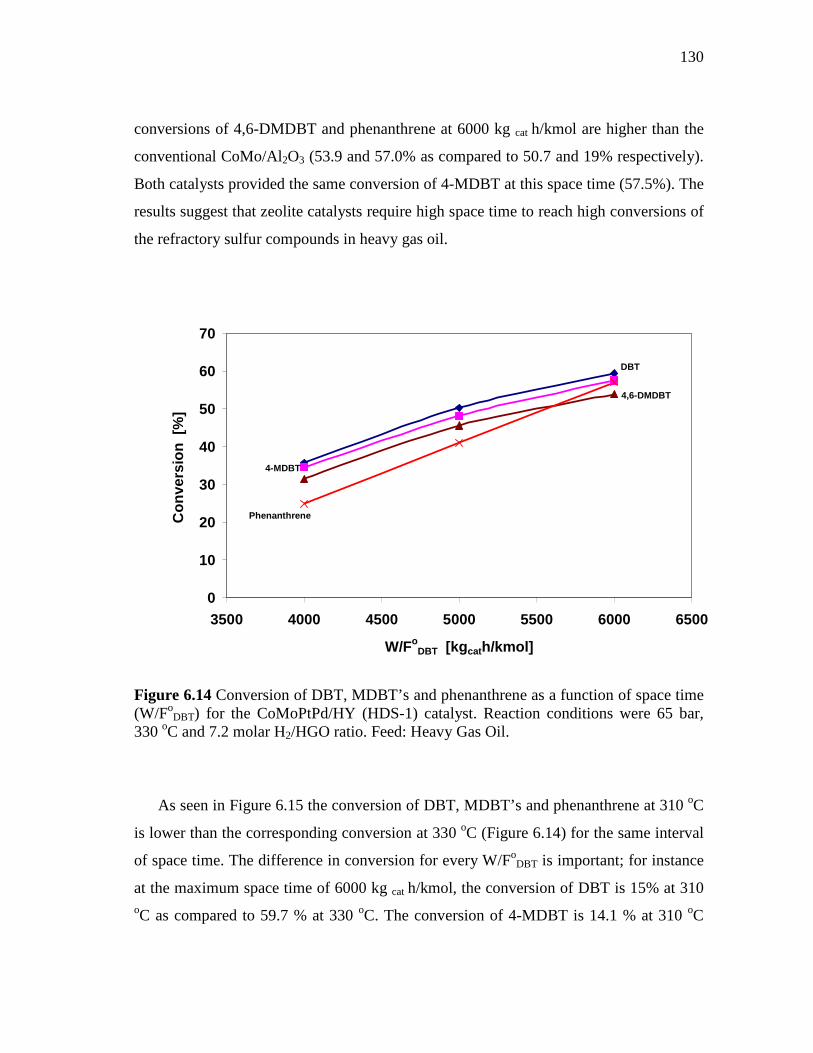
130
conversions of 4,6-DMDBT and phenanthrene at 6000 kg cat h/kmol are higher than the
conventional CoMo/Al2O3 (53.9 and 57.0% as compared to 50.7 and 19% respectively).
Both catalysts provided the same conversion of 4-MDBT at this space time (57.5%). The
results suggest that zeolite catalysts require high space time to reach high conversions of
the refractory sulfur compounds in heavy gas oil.
0
10
20
30
40
50
60
70
3500 4000 4500 5000 5500 6000 6500
W/FoDBT [kg cath/kmol]
Con
vers
ion
[%]
DBT
4-MDBT
4,6-DMDBT
Phenanthrene
Figure 6.14 Conversion of DBT, MDBT’s and phenanthrene as a function of space time (W/Fo
DBT) for the CoMoPtPd/HY (HDS-1) catalyst. Reaction conditions were 65 bar, 330 oC and 7.2 molar H2/HGO ratio. Feed: Heavy Gas Oil.
As seen in Figure 6.15 the conversion of DBT, MDBT’s and phenanthrene at 310 oC
is lower than the corresponding conversion at 330 oC (Figure 6.14) for the same interval
of space time. The difference in conversion for every W/FoDBT is important; for instance
at the maximum space time of 6000 kg cat h/kmol, the conversion of DBT is 15% at 310 oC as compared to 59.7 % at 330 oC. The conversion of 4-MDBT is 14.1 % at 310 oC
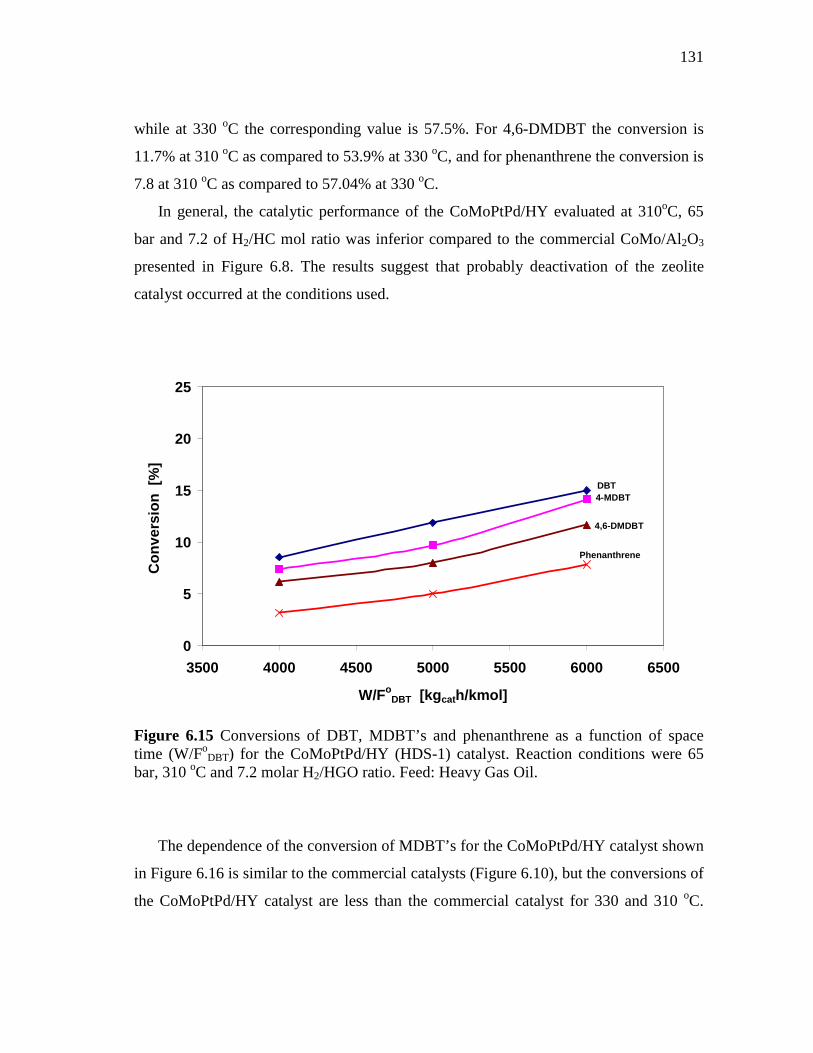
131
while at 330 oC the corresponding value is 57.5%. For 4,6-DMDBT the conversion is
11.7% at 310 oC as compared to 53.9% at 330 oC, and for phenanthrene the conversion is
7.8 at 310 oC as compared to 57.04% at 330 oC.
In general, the catalytic performance of the CoMoPtPd/HY evaluated at 310oC, 65
bar and 7.2 of H2/HC mol ratio was inferior compared to the commercial CoMo/Al2O3
presented in Figure 6.8. The results suggest that probably deactivation of the zeolite
catalyst occurred at the conditions used.
0
5
10
15
20
25
3500 4000 4500 5000 5500 6000 6500
W/FoDBT [kg cath/kmol]
Con
vers
ion
[%]
DBT 4-MDBT
4,6-DMDBT
Phenanthrene
Figure 6.15 Conversions of DBT, MDBT’s and phenanthrene as a function of space time (W/Fo
DBT) for the CoMoPtPd/HY (HDS-1) catalyst. Reaction conditions were 65 bar, 310 oC and 7.2 molar H2/HGO ratio. Feed: Heavy Gas Oil.
The dependence of the conversion of MDBT’s for the CoMoPtPd/HY catalyst shown
in Figure 6.16 is similar to the commercial catalysts (Figure 6.10), but the conversions of
the CoMoPtPd/HY catalyst are less than the commercial catalyst for 330 and 310 oC.
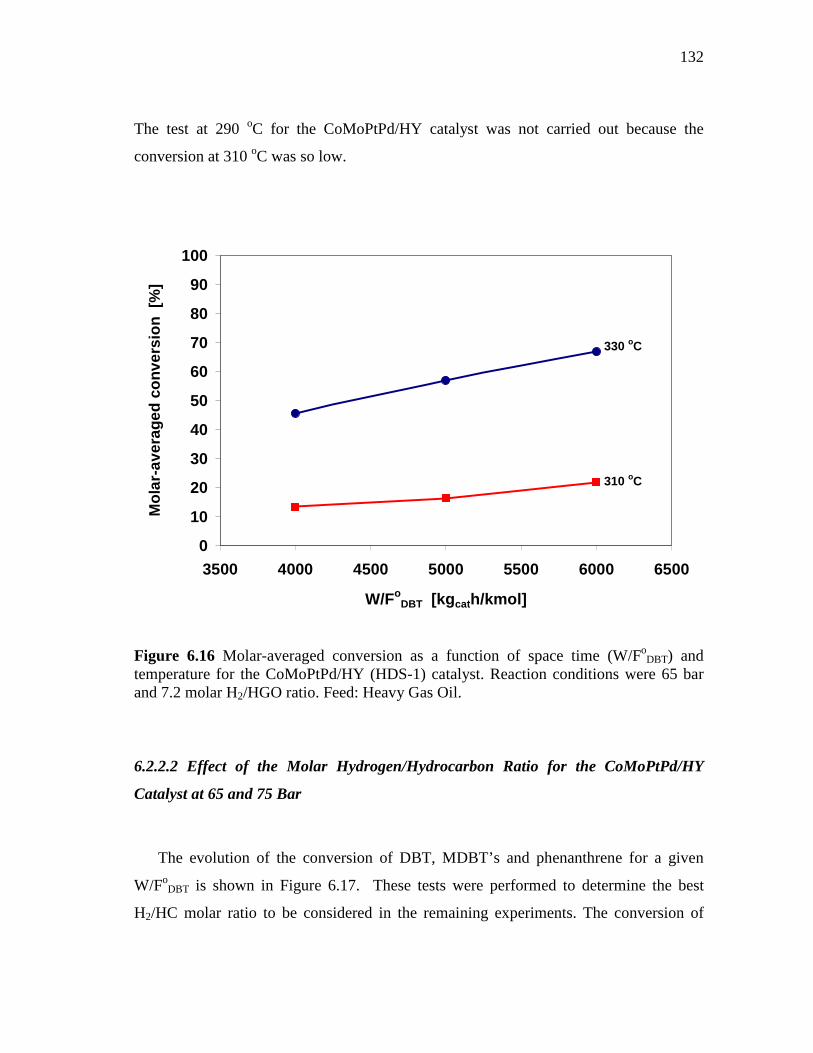
132
The test at 290 oC for the CoMoPtPd/HY catalyst was not carried out because the
conversion at 310 oC was so low.
0
10
20
30
40
50
60
70
80
90
100
3500 4000 4500 5000 5500 6000 6500
W/FoDBT [kg cath/kmol]
Mol
ar-a
vera
ged
conv
ersi
on [
%]
330 oC
310 oC
Figure 6.16 Molar-averaged conversion as a function of space time (W/Fo
DBT) and temperature for the CoMoPtPd/HY (HDS-1) catalyst. Reaction conditions were 65 bar and 7.2 molar H2/HGO ratio. Feed: Heavy Gas Oil.
6.2.2.2 Effect of the Molar Hydrogen/Hydrocarbon Ratio for the CoMoPtPd/HY
Catalyst at 65 and 75 Bar
The evolution of the conversion of DBT, MDBT’s and phenanthrene for a given
W/FoDBT is shown in Figure 6.17. These tests were performed to determine the best
H2/HC molar ratio to be considered in the remaining experiments. The conversion of
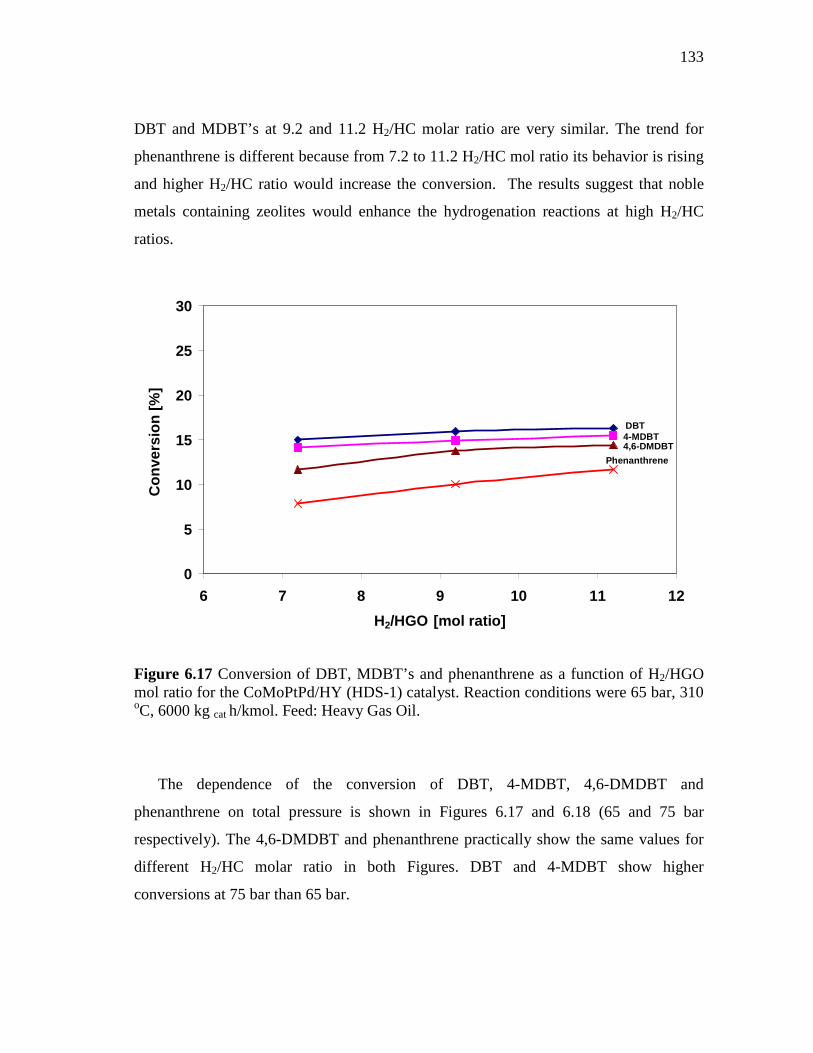
133
DBT and MDBT’s at 9.2 and 11.2 H2/HC molar ratio are very similar. The trend for
phenanthrene is different because from 7.2 to 11.2 H2/HC mol ratio its behavior is rising
and higher H2/HC ratio would increase the conversion. The results suggest that noble
metals containing zeolites would enhance the hydrogenation reactions at high H2/HC
ratios.
0
5
10
15
20
25
30
6 7 8 9 10 11 12
H2/HGO [mol ratio]
Con
vers
ion
[%]
DBT 4-MDBT 4,6-DMDBT
Phenanthrene
Figure 6.17 Conversion of DBT, MDBT’s and phenanthrene as a function of H2/HGO mol ratio for the CoMoPtPd/HY (HDS-1) catalyst. Reaction conditions were 65 bar, 310 oC, 6000 kg cat h/kmol. Feed: Heavy Gas Oil.
The dependence of the conversion of DBT, 4-MDBT, 4,6-DMDBT and
phenanthrene on total pressure is shown in Figures 6.17 and 6.18 (65 and 75 bar
respectively). The 4,6-DMDBT and phenanthrene practically show the same values for
different H2/HC molar ratio in both Figures. DBT and 4-MDBT show higher
conversions at 75 bar than 65 bar.
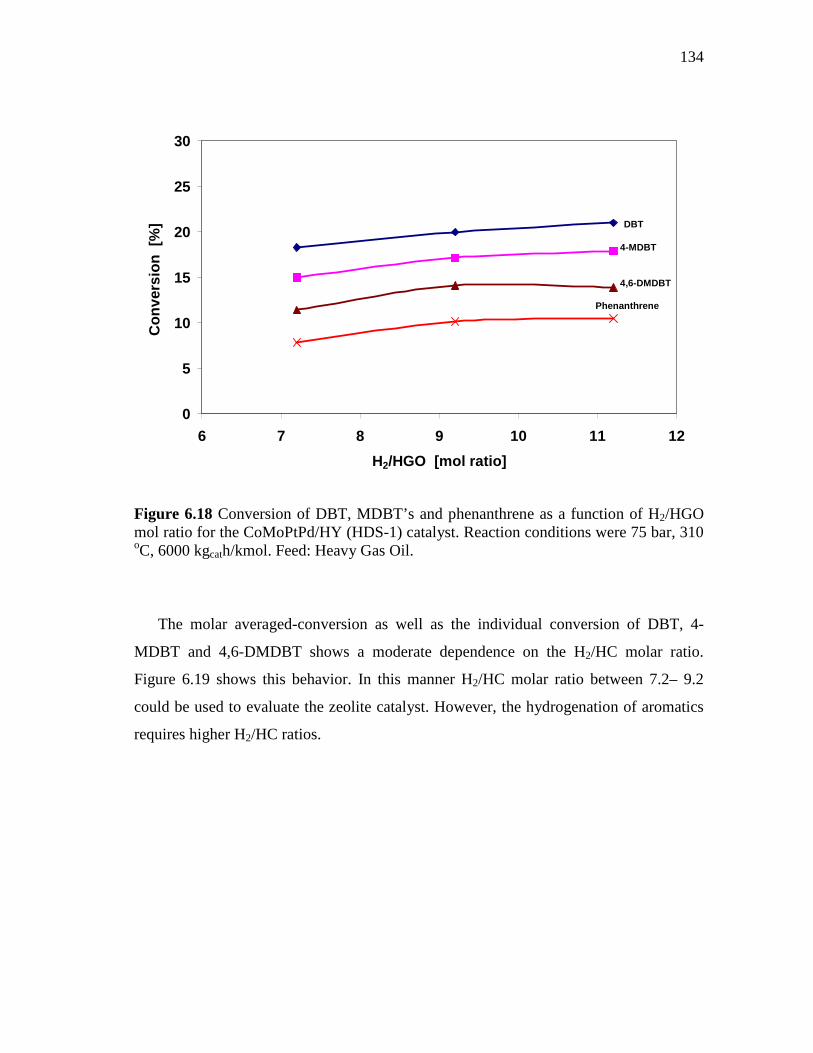
134
0
5
10
15
20
25
30
6 7 8 9 10 11 12
H2/HGO [mol ratio]
Con
vers
ion
[%] DBT
4-MDBT
4,6-DMDBT
Phenanthrene
Figure 6.18 Conversion of DBT, MDBT’s and phenanthrene as a function of H2/HGO mol ratio for the CoMoPtPd/HY (HDS-1) catalyst. Reaction conditions were 75 bar, 310 oC, 6000 kgcath/kmol. Feed: Heavy Gas Oil.
The molar averaged-conversion as well as the individual conversion of DBT, 4-
MDBT and 4,6-DMDBT shows a moderate dependence on the H2/HC molar ratio.
Figure 6.19 shows this behavior. In this manner H2/HC molar ratio between 7.2– 9.2
could be used to evaluate the zeolite catalyst. However, the hydrogenation of aromatics
requires higher H2/HC ratios.
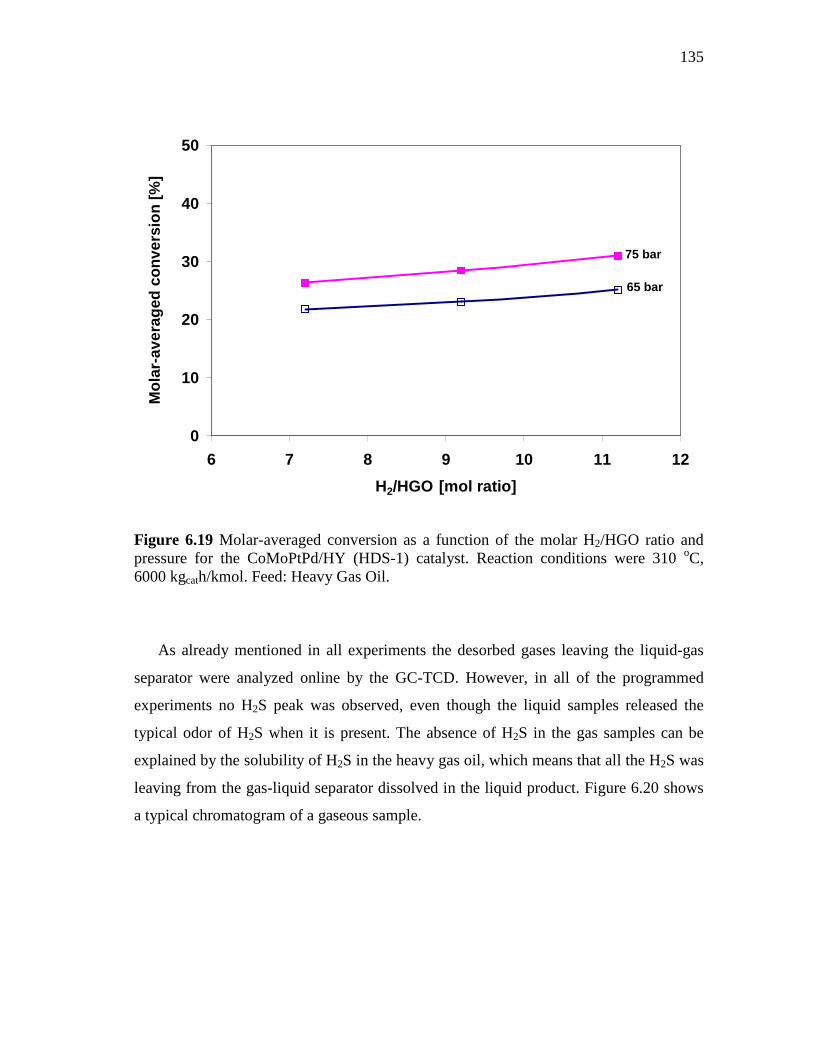
135
0
10
20
30
40
50
6 7 8 9 10 11 12
H2/HGO [mol ratio]
Mol
ar-a
vera
ged
conv
ersi
on [%
]
65 bar
75 bar
Figure 6.19 Molar-averaged conversion as a function of the molar H2/HGO ratio and pressure for the CoMoPtPd/HY (HDS-1) catalyst. Reaction conditions were 310 oC, 6000 kgcath/kmol. Feed: Heavy Gas Oil.
As already mentioned in all experiments the desorbed gases leaving the liquid-gas
separator were analyzed online by the GC-TCD. However, in all of the programmed
experiments no H2S peak was observed, even though the liquid samples released the
typical odor of H2S when it is present. The absence of H2S in the gas samples can be
explained by the solubility of H2S in the heavy gas oil, which means that all the H2S was
leaving from the gas-liquid separator dissolved in the liquid product. Figure 6.20 shows
a typical chromatogram of a gaseous sample.
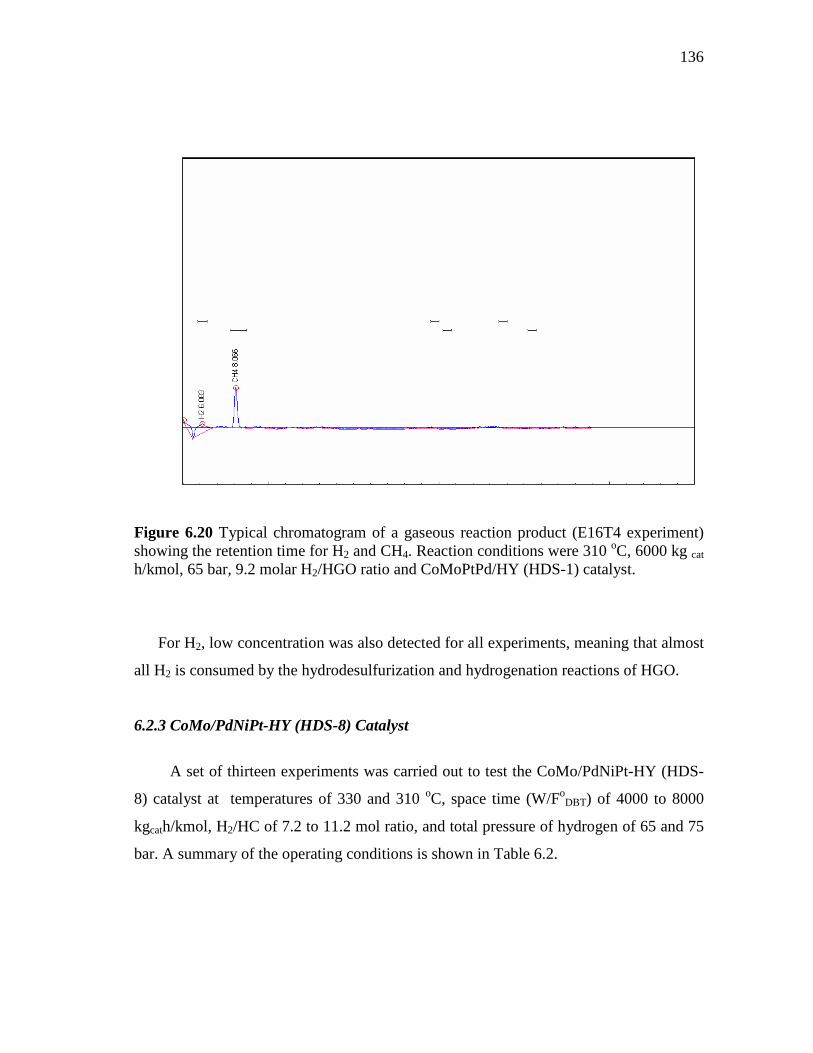
136
Figure 6.20 Typical chromatogram of a gaseous reaction product (E16T4 experiment) showing the retention time for H2 and CH4. Reaction conditions were 310 oC, 6000 kg cat
h/kmol, 65 bar, 9.2 molar H2/HGO ratio and CoMoPtPd/HY (HDS-1) catalyst.
For H2, low concentration was also detected for all experiments, meaning that almost
all H2 is consumed by the hydrodesulfurization and hydrogenation reactions of HGO.
6.2.3 CoMo/PdNiPt-HY (HDS-8) Catalyst
A set of thirteen experiments was carried out to test the CoMo/PdNiPt-HY (HDS-
8) catalyst at temperatures of 330 and 310 oC, space time (W/FoDBT) of 4000 to 8000
kgcath/kmol, H2/HC of 7.2 to 11.2 mol ratio, and total pressure of hydrogen of 65 and 75
bar. A summary of the operating conditions is shown in Table 6.2.
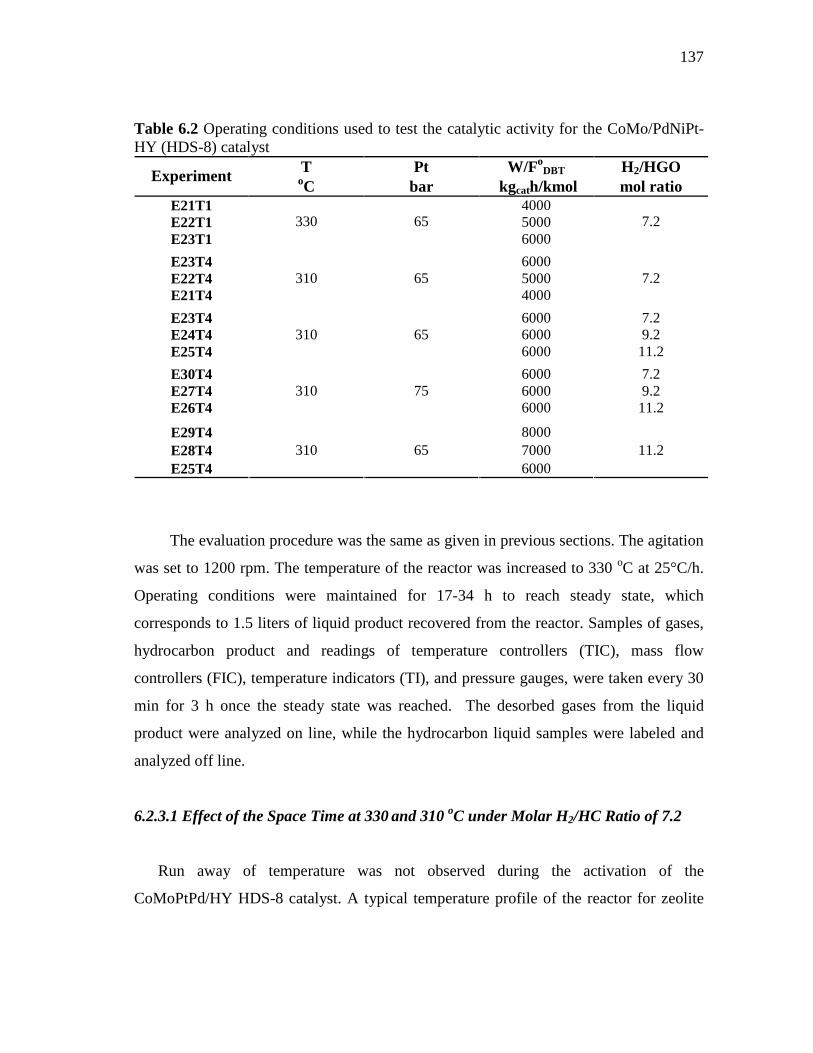
137
Table 6.2 Operating conditions used to test the catalytic activity for the CoMo/PdNiPt-HY (HDS-8) catalyst
T Pt W/FoDBT H2/HGO Experiment oC bar kgcath/kmol mol ratio
E21T1 4000 E22T1 5000 E23T1
330 65 6000
7.2
E23T4 6000 E22T4 5000 E21T4
310 65 4000
7.2
E23T4 6000 7.2 E24T4 6000 9.2 E25T4
310 65 6000 11.2
E30T4 6000 7.2 E27T4 6000 9.2 E26T4
310 75 6000 11.2
E29T4 8000 E28T4 7000 E25T4
310 65 6000
11.2
The evaluation procedure was the same as given in previous sections. The agitation
was set to 1200 rpm. The temperature of the reactor was increased to 330 oC at 25°C/h.
Operating conditions were maintained for 17-34 h to reach steady state, which
corresponds to 1.5 liters of liquid product recovered from the reactor. Samples of gases,
hydrocarbon product and readings of temperature controllers (TIC), mass flow
controllers (FIC), temperature indicators (TI), and pressure gauges, were taken every 30
min for 3 h once the steady state was reached. The desorbed gases from the liquid
product were analyzed on line, while the hydrocarbon liquid samples were labeled and
analyzed off line.
6.2.3.1 Effect of the Space Time at 330 and 310 oC under Molar H2/HC Ratio of 7.2
Run away of temperature was not observed during the activation of the
CoMoPtPd/HY HDS-8 catalyst. A typical temperature profile of the reactor for zeolite
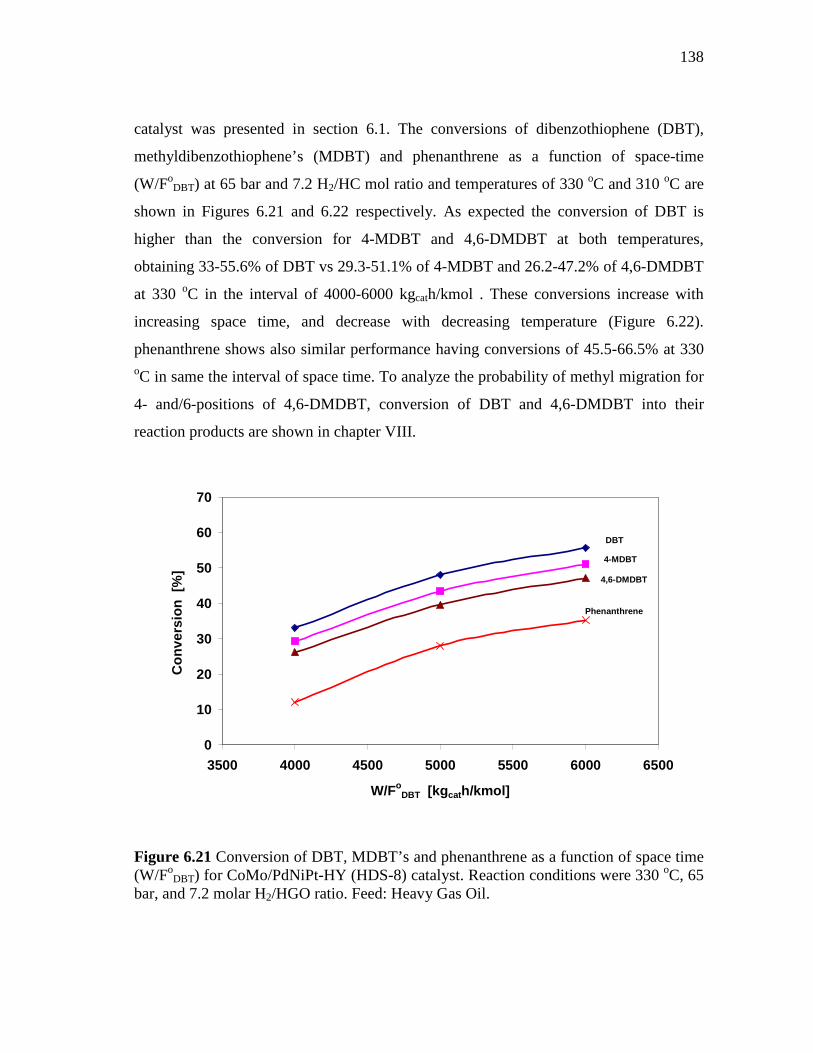
138
catalyst was presented in section 6.1. The conversions of dibenzothiophene (DBT),
methyldibenzothiophene’s (MDBT) and phenanthrene as a function of space-time
(W/FoDBT) at 65 bar and 7.2 H2/HC mol ratio and temperatures of 330 oC and 310 oC are
shown in Figures 6.21 and 6.22 respectively. As expected the conversion of DBT is
higher than the conversion for 4-MDBT and 4,6-DMDBT at both temperatures,
obtaining 33-55.6% of DBT vs 29.3-51.1% of 4-MDBT and 26.2-47.2% of 4,6-DMDBT
at 330 oC in the interval of 4000-6000 kgcath/kmol . These conversions increase with
increasing space time, and decrease with decreasing temperature (Figure 6.22).
phenanthrene shows also similar performance having conversions of 45.5-66.5% at 330 oC in same the interval of space time. To analyze the probability of methyl migration for
4- and/6-positions of 4,6-DMDBT, conversion of DBT and 4,6-DMDBT into their
reaction products are shown in chapter VIII.
0
10
20
30
40
50
60
70
3500 4000 4500 5000 5500 6000 6500
W/FoDBT [kg cath/kmol]
Con
vers
ion
[%]
DBT
4-MDBT
4,6-DMDBT
Phenanthrene
Figure 6.21 Conversion of DBT, MDBT’s and phenanthrene as a function of space time (W/Fo
DBT) for CoMo/PdNiPt-HY (HDS-8) catalyst. Reaction conditions were 330 oC, 65 bar, and 7.2 molar H2/HGO ratio. Feed: Heavy Gas Oil.
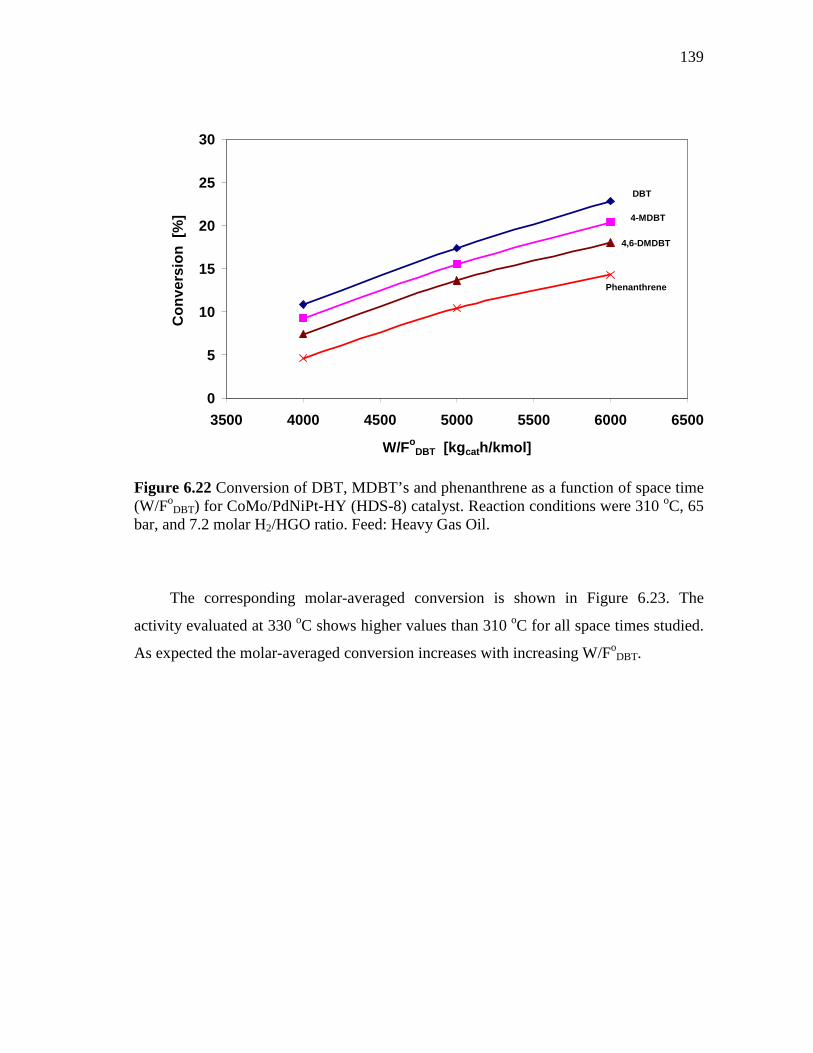
139
0
5
10
15
20
25
30
3500 4000 4500 5000 5500 6000 6500
W/FoDBT [kg cath/kmol]
Con
vers
ion
[%]
DBT
4-MDBT
4,6-DMDBT
Phenanthrene
Figure 6.22 Conversion of DBT, MDBT’s and phenanthrene as a function of space time (W/Fo
DBT) for CoMo/PdNiPt-HY (HDS-8) catalyst. Reaction conditions were 310 oC, 65 bar, and 7.2 molar H2/HGO ratio. Feed: Heavy Gas Oil. The corresponding molar-averaged conversion is shown in Figure 6.23. The
activity evaluated at 330 oC shows higher values than 310 oC for all space times studied.
As expected the molar-averaged conversion increases with increasing W/FoDBT.
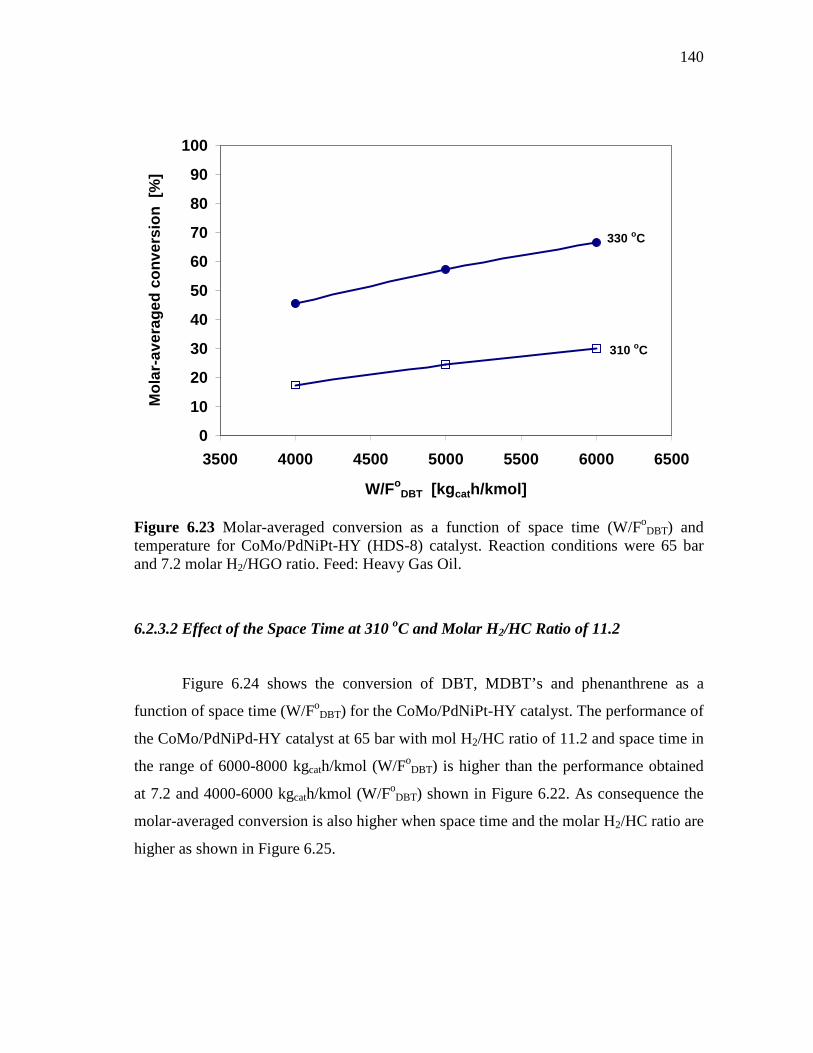
140
0
10
20
30
40
50
60
70
80
90
100
3500 4000 4500 5000 5500 6000 6500
W/FoDBT [kg cath/kmol]
Mol
ar-a
vera
ged
conv
ersi
on [
%]
330 oC
310 oC
Figure 6.23 Molar-averaged conversion as a function of space time (W/Fo
DBT) and temperature for CoMo/PdNiPt-HY (HDS-8) catalyst. Reaction conditions were 65 bar and 7.2 molar H2/HGO ratio. Feed: Heavy Gas Oil.
6.2.3.2 Effect of the Space Time at 310 oC and Molar H2/HC Ratio of 11.2
Figure 6.24 shows the conversion of DBT, MDBT’s and phenanthrene as a
function of space time (W/FoDBT) for the CoMo/PdNiPt-HY catalyst. The performance of
the CoMo/PdNiPd-HY catalyst at 65 bar with mol H2/HC ratio of 11.2 and space time in
the range of 6000-8000 kgcath/kmol (W/FoDBT) is higher than the performance obtained
at 7.2 and 4000-6000 kgcath/kmol (W/FoDBT) shown in Figure 6.22. As consequence the
molar-averaged conversion is also higher when space time and the molar H2/HC ratio are
higher as shown in Figure 6.25.
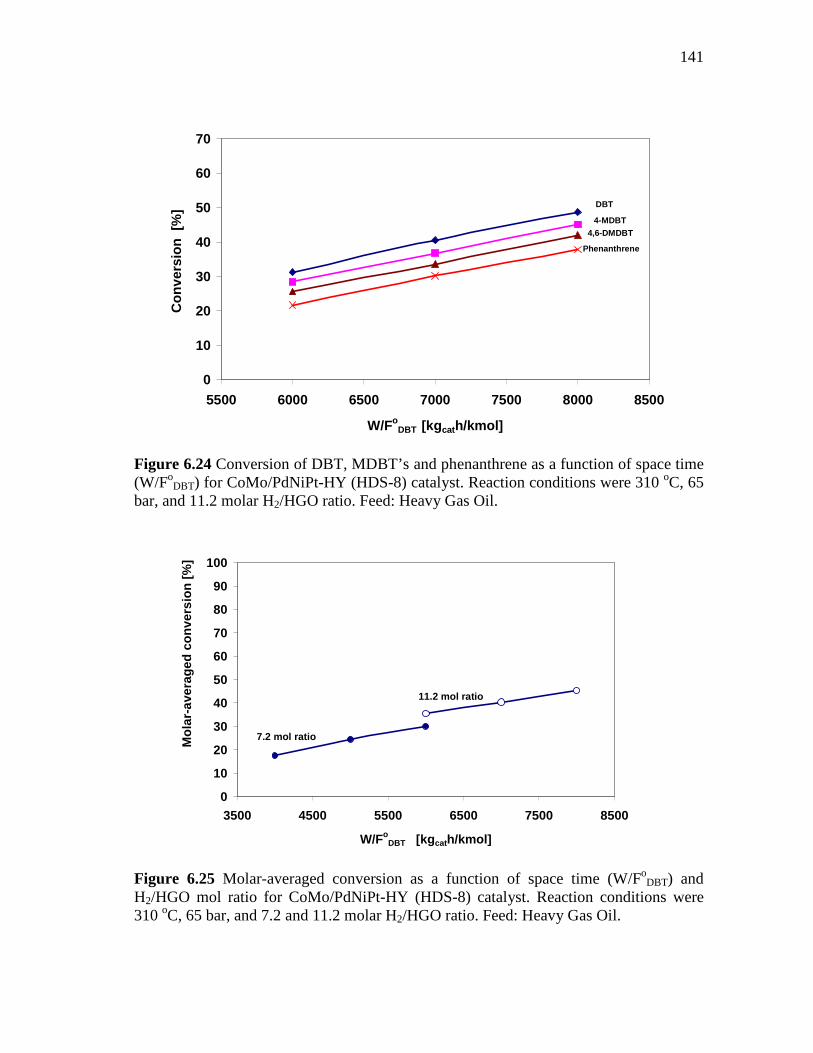
141
0
10
20
30
40
50
60
70
5500 6000 6500 7000 7500 8000 8500
W/FoDBT [kg cath/kmol]
Con
vers
ion
[%]
DBT
4-MDBT 4,6-DMDBT
Phenanthrene
Figure 6.24 Conversion of DBT, MDBT’s and phenanthrene as a function of space time (W/Fo
DBT) for CoMo/PdNiPt-HY (HDS-8) catalyst. Reaction conditions were 310 oC, 65 bar, and 11.2 molar H2/HGO ratio. Feed: Heavy Gas Oil.
0
10
20
30
40
50
60
70
80
90
100
3500 4500 5500 6500 7500 8500
W/FoDBT [kg cath/kmol]
Mol
ar-a
vera
ged
conv
ersi
on [%
]
11.2 mol ratio
7.2 mol ratio
Figure 6.25 Molar-averaged conversion as a function of space time (W/Fo
DBT) and H2/HGO mol ratio for CoMo/PdNiPt-HY (HDS-8) catalyst. Reaction conditions were 310 oC, 65 bar, and 7.2 and 11.2 molar H2/HGO ratio. Feed: Heavy Gas Oil.
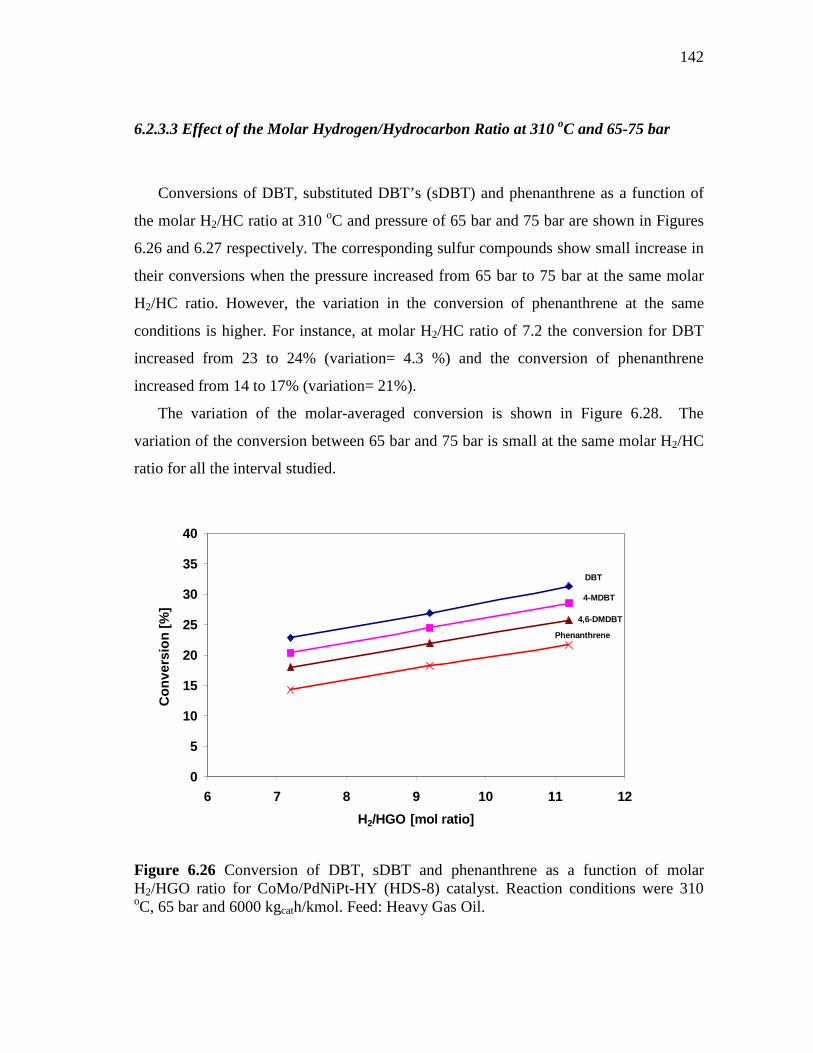
142
6.2.3.3 Effect of the Molar Hydrogen/Hydrocarbon Ratio at 310 oC and 65-75 bar
Conversions of DBT, substituted DBT’s (sDBT) and phenanthrene as a function of
the molar H2/HC ratio at 310 oC and pressure of 65 bar and 75 bar are shown in Figures
6.26 and 6.27 respectively. The corresponding sulfur compounds show small increase in
their conversions when the pressure increased from 65 bar to 75 bar at the same molar
H2/HC ratio. However, the variation in the conversion of phenanthrene at the same
conditions is higher. For instance, at molar H2/HC ratio of 7.2 the conversion for DBT
increased from 23 to 24% (variation= 4.3 %) and the conversion of phenanthrene
increased from 14 to 17% (variation= 21%).
The variation of the molar-averaged conversion is shown in Figure 6.28. The
variation of the conversion between 65 bar and 75 bar is small at the same molar H2/HC
ratio for all the interval studied.
0
5
10
15
20
25
30
35
40
6 7 8 9 10 11 12
H2/HGO [mol ratio]
Con
vers
ion
[%]
DBT
4-MDBT
4,6-DMDBT
Phenanthrene
Figure 6.26 Conversion of DBT, sDBT and phenanthrene as a function of molar H2/HGO ratio for CoMo/PdNiPt-HY (HDS-8) catalyst. Reaction conditions were 310 oC, 65 bar and 6000 kgcath/kmol. Feed: Heavy Gas Oil.
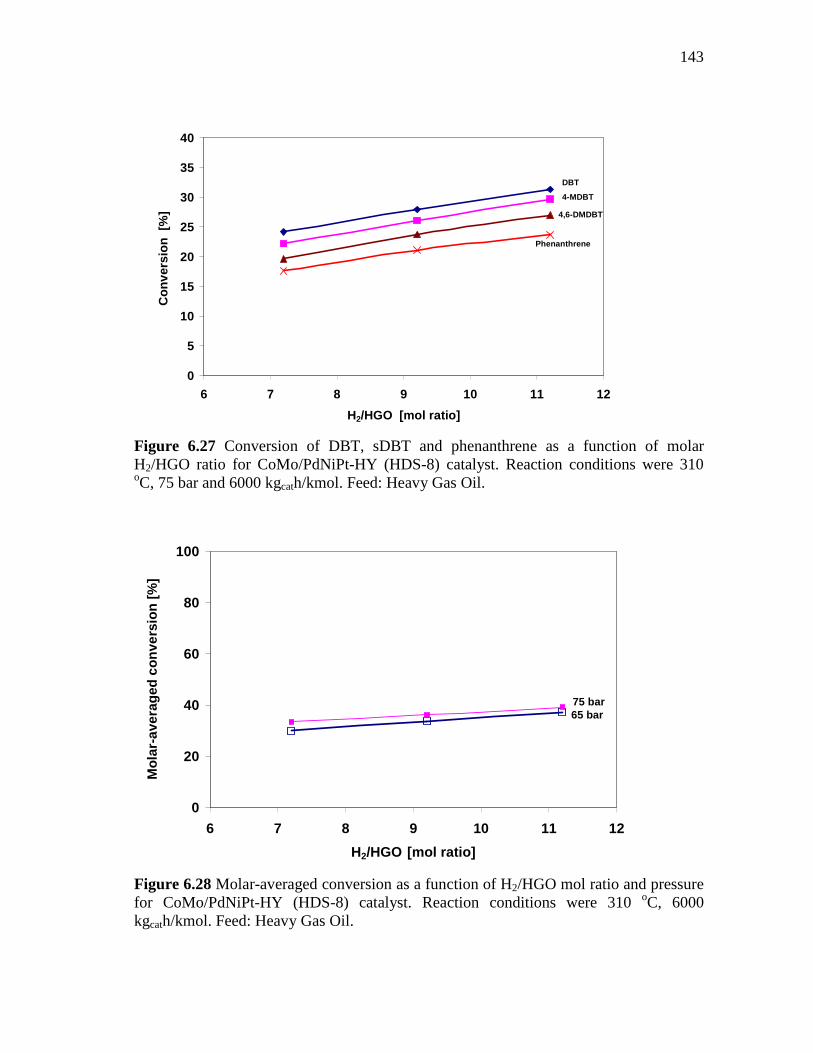
143
0
5
10
15
20
25
30
35
40
6 7 8 9 10 11 12
H2/HGO [mol ratio]
Con
vers
ion
[%]
DBT
4-MDBT
4,6-DMDBT
Phenanthrene
Figure 6.27 Conversion of DBT, sDBT and phenanthrene as a function of molar H2/HGO ratio for CoMo/PdNiPt-HY (HDS-8) catalyst. Reaction conditions were 310 oC, 75 bar and 6000 kgcath/kmol. Feed: Heavy Gas Oil.
0
20
40
60
80
100
6 7 8 9 10 11 12
H2/HGO [mol ratio]
Mol
ar-a
vera
ged
conv
ersi
on [%
]
65 bar75 bar
Figure 6.28 Molar-averaged conversion as a function of H2/HGO mol ratio and pressure for CoMo/PdNiPt-HY (HDS-8) catalyst. Reaction conditions were 310 oC, 6000 kgcath/kmol. Feed: Heavy Gas Oil.
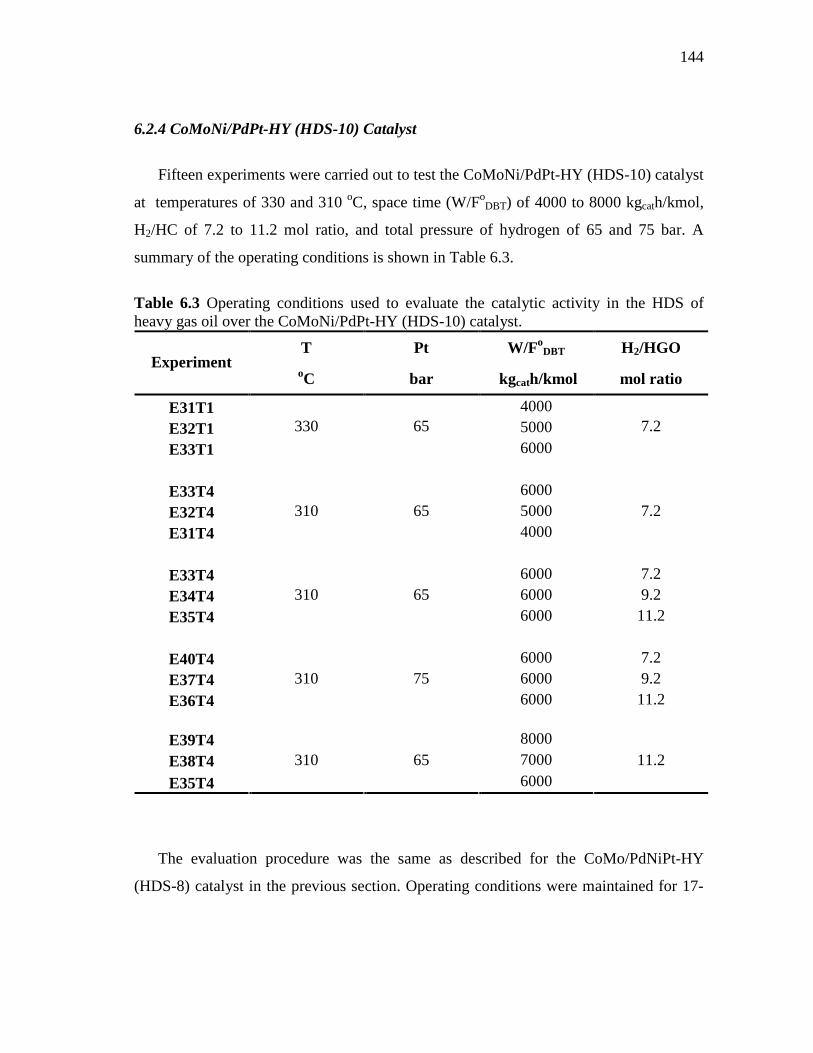
144
6.2.4 CoMoNi/PdPt-HY (HDS-10) Catalyst
Fifteen experiments were carried out to test the CoMoNi/PdPt-HY (HDS-10) catalyst
at temperatures of 330 and 310 oC, space time (W/FoDBT) of 4000 to 8000 kgcath/kmol,
H2/HC of 7.2 to 11.2 mol ratio, and total pressure of hydrogen of 65 and 75 bar. A
summary of the operating conditions is shown in Table 6.3.
Table 6.3 Operating conditions used to evaluate the catalytic activity in the HDS of heavy gas oil over the CoMoNi/PdPt-HY (HDS-10) catalyst.
T Pt W/FoDBT H2/HGO
Experiment oC bar kgcath/kmol mol ratio
E31T1 4000
E32T1 5000
E33T1
330 65 6000
7.2
E33T4 6000
E32T4 5000
E31T4 310 65
4000 7.2
E33T4 6000 7.2
E34T4 6000 9.2
E35T4 310 65
6000 11.2
E40T4 6000 7.2
E37T4 6000 9.2
E36T4 310 75
6000 11.2
E39T4 8000
E38T4 7000
E35T4
310 65 6000
11.2
The evaluation procedure was the same as described for the CoMo/PdNiPt-HY
(HDS-8) catalyst in the previous section. Operating conditions were maintained for 17-
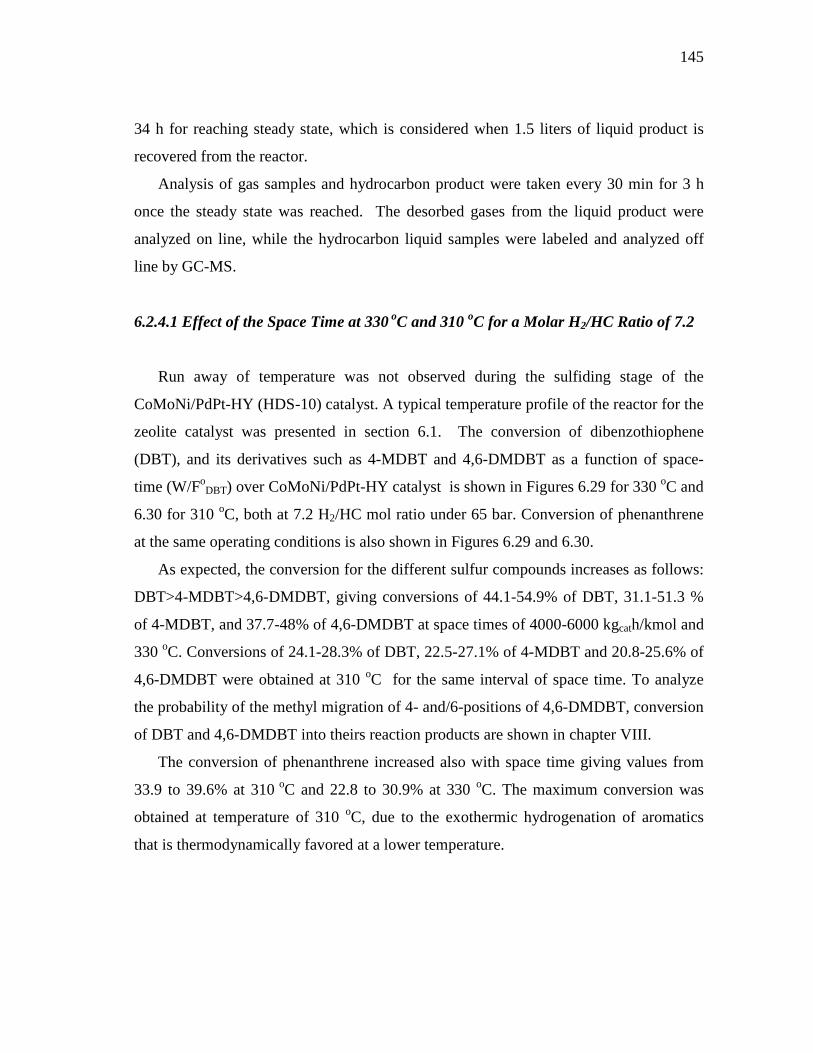
145
34 h for reaching steady state, which is considered when 1.5 liters of liquid product is
recovered from the reactor.
Analysis of gas samples and hydrocarbon product were taken every 30 min for 3 h
once the steady state was reached. The desorbed gases from the liquid product were
analyzed on line, while the hydrocarbon liquid samples were labeled and analyzed off
line by GC-MS.
6.2.4.1 Effect of the Space Time at 330 oC and 310 oC for a Molar H2/HC Ratio of 7.2
Run away of temperature was not observed during the sulfiding stage of the
CoMoNi/PdPt-HY (HDS-10) catalyst. A typical temperature profile of the reactor for the
zeolite catalyst was presented in section 6.1. The conversion of dibenzothiophene
(DBT), and its derivatives such as 4-MDBT and 4,6-DMDBT as a function of space-
time (W/FoDBT) over CoMoNi/PdPt-HY catalyst is shown in Figures 6.29 for 330 oC and
6.30 for 310 oC, both at 7.2 H2/HC mol ratio under 65 bar. Conversion of phenanthrene
at the same operating conditions is also shown in Figures 6.29 and 6.30.
As expected, the conversion for the different sulfur compounds increases as follows:
DBT>4-MDBT>4,6-DMDBT, giving conversions of 44.1-54.9% of DBT, 31.1-51.3 %
of 4-MDBT, and 37.7-48% of 4,6-DMDBT at space times of 4000-6000 kgcath/kmol and
330 oC. Conversions of 24.1-28.3% of DBT, 22.5-27.1% of 4-MDBT and 20.8-25.6% of
4,6-DMDBT were obtained at 310 oC for the same interval of space time. To analyze
the probability of the methyl migration of 4- and/6-positions of 4,6-DMDBT, conversion
of DBT and 4,6-DMDBT into theirs reaction products are shown in chapter VIII.
The conversion of phenanthrene increased also with space time giving values from
33.9 to 39.6% at 310 oC and 22.8 to 30.9% at 330 oC. The maximum conversion was
obtained at temperature of 310 oC, due to the exothermic hydrogenation of aromatics
that is thermodynamically favored at a lower temperature.
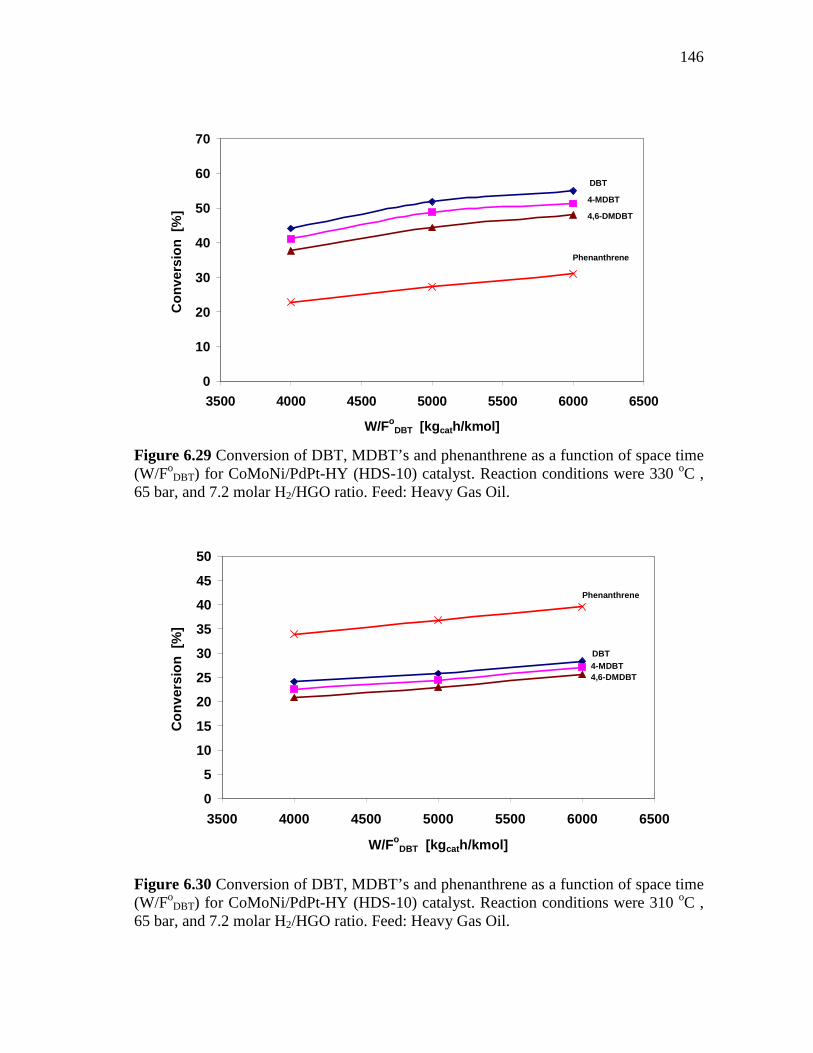
146
0
10
20
30
40
50
60
70
3500 4000 4500 5000 5500 6000 6500
W/FoDBT [kg cath/kmol]
Con
vers
ion
[%]
DBT
4-MDBT
4,6-DMDBT
Phenanthrene
Figure 6.29 Conversion of DBT, MDBT’s and phenanthrene as a function of space time (W/Fo
DBT) for CoMoNi/PdPt-HY (HDS-10) catalyst. Reaction conditions were 330 oC , 65 bar, and 7.2 molar H2/HGO ratio. Feed: Heavy Gas Oil.
0
5
10
15
20
25
30
35
40
45
50
3500 4000 4500 5000 5500 6000 6500
W/FoDBT [kg cath/kmol]
Con
vers
ion
[%]
DBT 4-MDBT 4,6-DMDBT
Phenanthrene
Figure 6.30 Conversion of DBT, MDBT’s and phenanthrene as a function of space time (W/Fo
DBT) for CoMoNi/PdPt-HY (HDS-10) catalyst. Reaction conditions were 310 oC , 65 bar, and 7.2 molar H2/HGO ratio. Feed: Heavy Gas Oil.
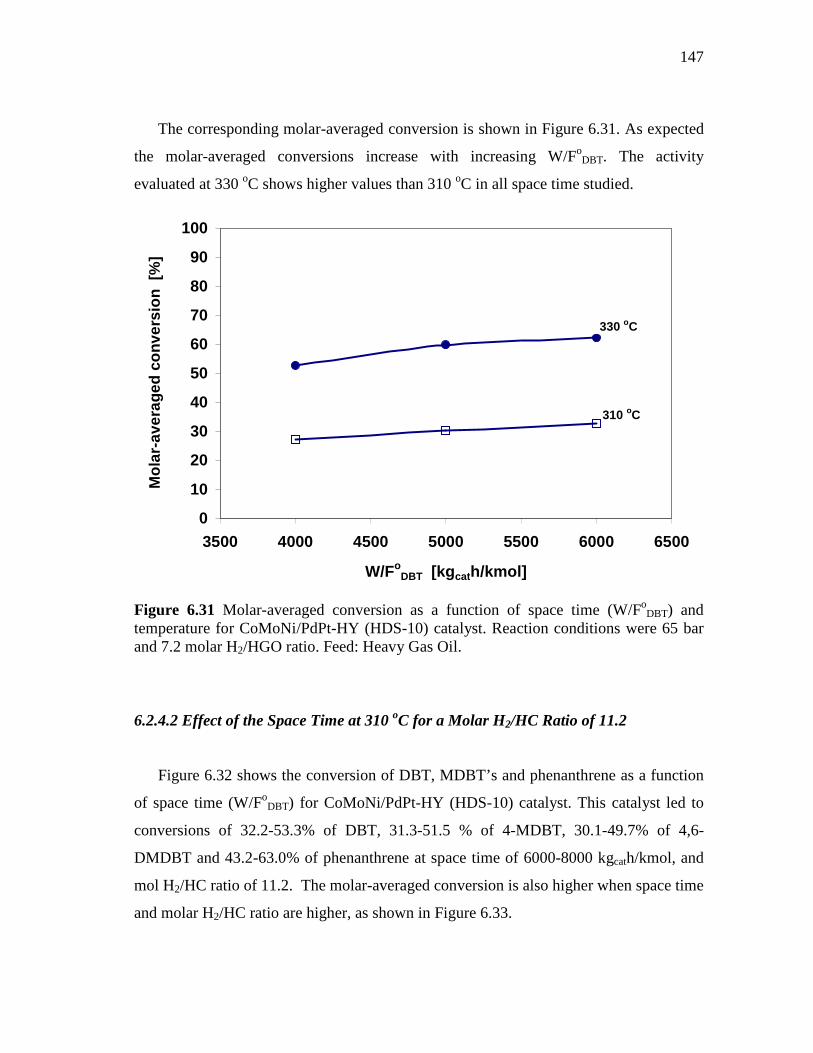
147
The corresponding molar-averaged conversion is shown in Figure 6.31. As expected
the molar-averaged conversions increase with increasing W/FoDBT. The activity
evaluated at 330 oC shows higher values than 310 oC in all space time studied.
0
10
20
30
40
50
60
70
80
90
100
3500 4000 4500 5000 5500 6000 6500
W/FoDBT [kg cath/kmol]
Mol
ar-a
vera
ged
conv
ersi
on [
%]
330 oC
310 oC
Figure 6.31 Molar-averaged conversion as a function of space time (W/Fo
DBT) and temperature for CoMoNi/PdPt-HY (HDS-10) catalyst. Reaction conditions were 65 bar and 7.2 molar H2/HGO ratio. Feed: Heavy Gas Oil. 6.2.4.2 Effect of the Space Time at 310 oC for a Molar H2/HC Ratio of 11.2
Figure 6.32 shows the conversion of DBT, MDBT’s and phenanthrene as a function
of space time (W/FoDBT) for CoMoNi/PdPt-HY (HDS-10) catalyst. This catalyst led to
conversions of 32.2-53.3% of DBT, 31.3-51.5 % of 4-MDBT, 30.1-49.7% of 4,6-
DMDBT and 43.2-63.0% of phenanthrene at space time of 6000-8000 kgcath/kmol, and
mol H2/HC ratio of 11.2. The molar-averaged conversion is also higher when space time
and molar H2/HC ratio are higher, as shown in Figure 6.33.
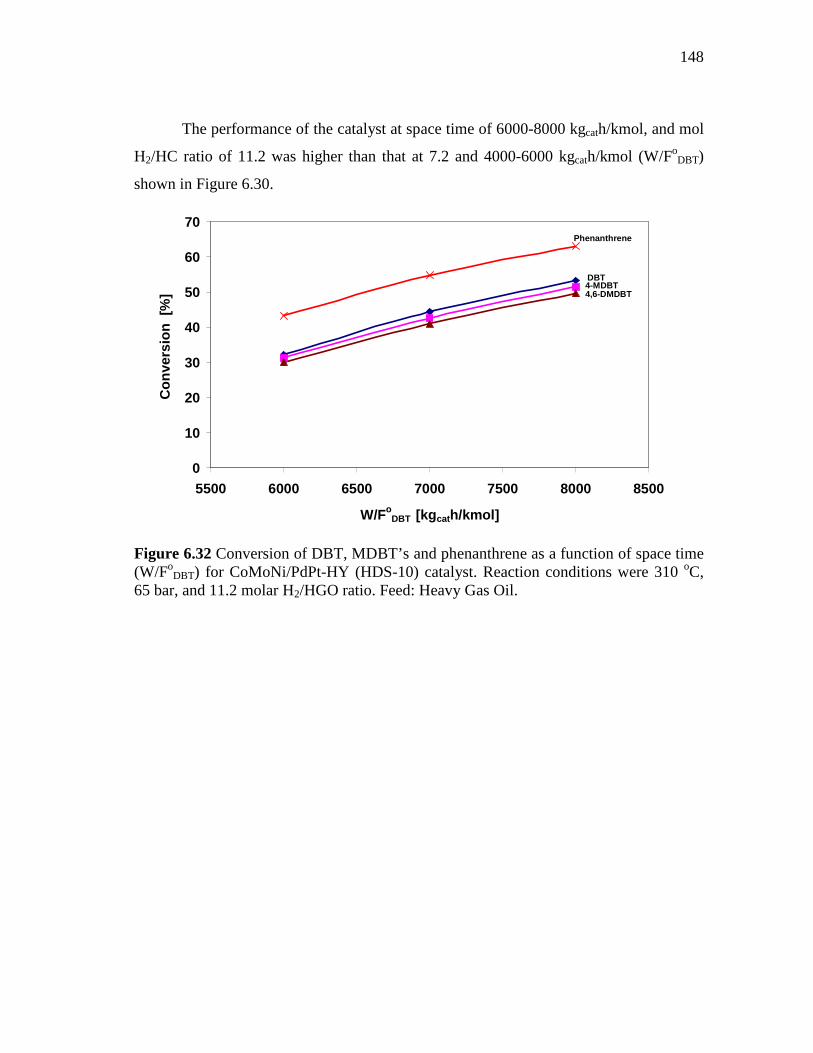
148
The performance of the catalyst at space time of 6000-8000 kgcath/kmol, and mol
H2/HC ratio of 11.2 was higher than that at 7.2 and 4000-6000 kgcath/kmol (W/FoDBT)
shown in Figure 6.30.
0
10
20
30
40
50
60
70
5500 6000 6500 7000 7500 8000 8500
W/FoDBT [kg cath/kmol]
Con
vers
ion
[%]
DBT 4-MDBT 4,6-DMDBT
Phenanthrene
Figure 6.32 Conversion of DBT, MDBT’s and phenanthrene as a function of space time (W/Fo
DBT) for CoMoNi/PdPt-HY (HDS-10) catalyst. Reaction conditions were 310 oC, 65 bar, and 11.2 molar H2/HGO ratio. Feed: Heavy Gas Oil.
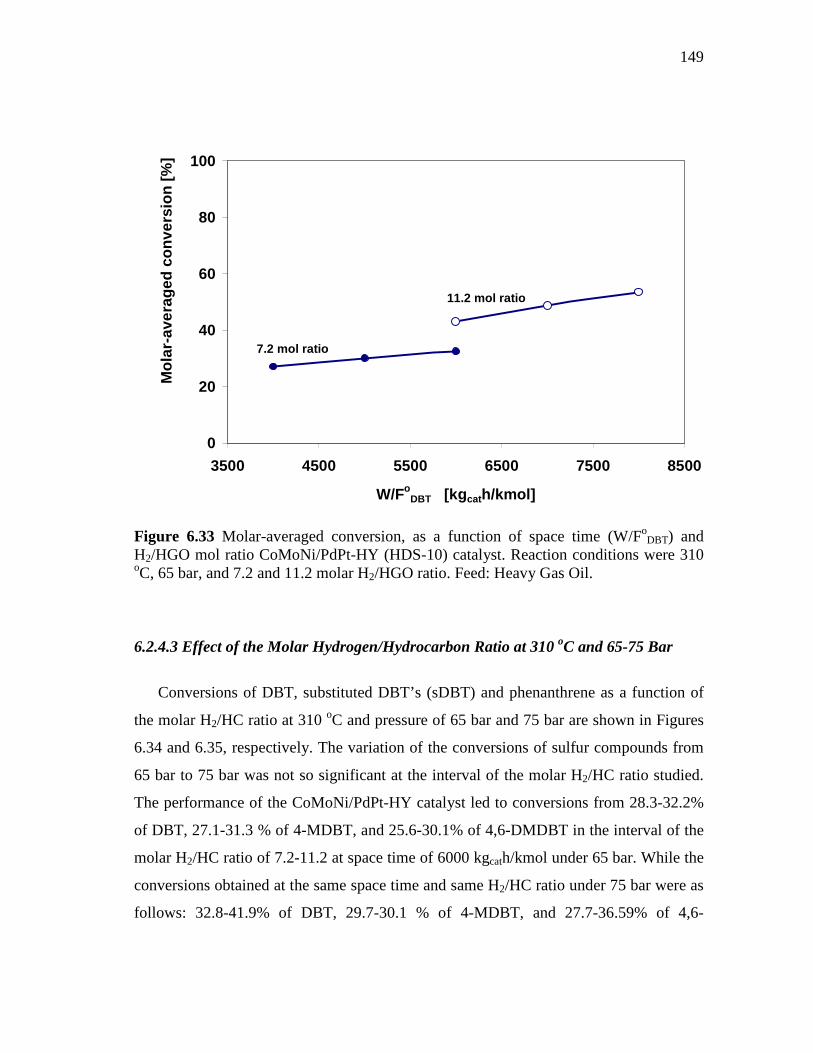
149
0
20
40
60
80
100
3500 4500 5500 6500 7500 8500
W/FoDBT [kg cath/kmol]
Mol
ar-a
vera
ged
conv
ersi
on [%
]
11.2 mol ratio
7.2 mol ratio
Figure 6.33 Molar-averaged conversion, as a function of space time (W/Fo
DBT) and H2/HGO mol ratio CoMoNi/PdPt-HY (HDS-10) catalyst. Reaction conditions were 310 oC, 65 bar, and 7.2 and 11.2 molar H2/HGO ratio. Feed: Heavy Gas Oil.
6.2.4.3 Effect of the Molar Hydrogen/Hydrocarbon Ratio at 310 oC and 65-75 Bar
Conversions of DBT, substituted DBT’s (sDBT) and phenanthrene as a function of
the molar H2/HC ratio at 310 oC and pressure of 65 bar and 75 bar are shown in Figures
6.34 and 6.35, respectively. The variation of the conversions of sulfur compounds from
65 bar to 75 bar was not so significant at the interval of the molar H2/HC ratio studied.
The performance of the CoMoNi/PdPt-HY catalyst led to conversions from 28.3-32.2%
of DBT, 27.1-31.3 % of 4-MDBT, and 25.6-30.1% of 4,6-DMDBT in the interval of the
molar H2/HC ratio of 7.2-11.2 at space time of 6000 kgcath/kmol under 65 bar. While the
conversions obtained at the same space time and same H2/HC ratio under 75 bar were as
follows: 32.8-41.9% of DBT, 29.7-30.1 % of 4-MDBT, and 27.7-36.59% of 4,6-
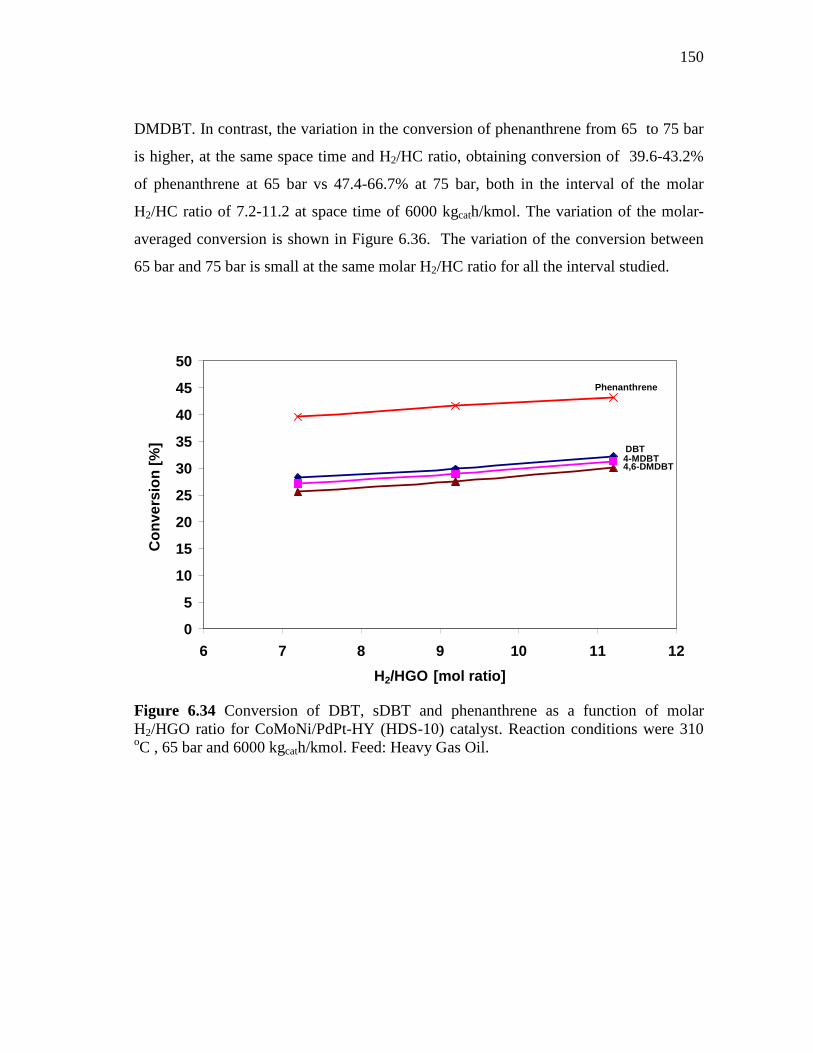
150
DMDBT. In contrast, the variation in the conversion of phenanthrene from 65 to 75 bar
is higher, at the same space time and H2/HC ratio, obtaining conversion of 39.6-43.2%
of phenanthrene at 65 bar vs 47.4-66.7% at 75 bar, both in the interval of the molar
H2/HC ratio of 7.2-11.2 at space time of 6000 kgcath/kmol. The variation of the molar-
averaged conversion is shown in Figure 6.36. The variation of the conversion between
65 bar and 75 bar is small at the same molar H2/HC ratio for all the interval studied.
0
5
10
15
20
25
30
35
40
45
50
6 7 8 9 10 11 12
H2/HGO [mol ratio]
Con
vers
ion
[%] DBT
4-MDBT 4,6-DMDBT
Phenanthrene
Figure 6.34 Conversion of DBT, sDBT and phenanthrene as a function of molar H2/HGO ratio for CoMoNi/PdPt-HY (HDS-10) catalyst. Reaction conditions were 310 oC , 65 bar and 6000 kgcath/kmol. Feed: Heavy Gas Oil.
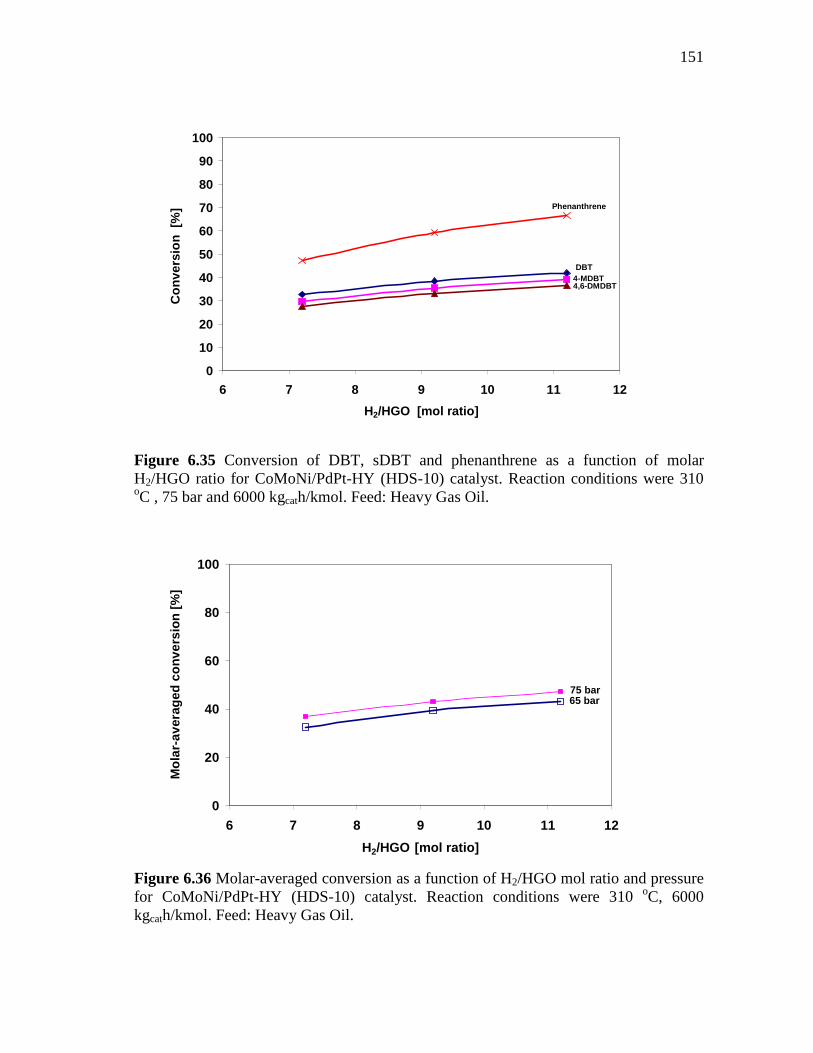
151
0
10
20
30
40
50
60
70
80
90
100
6 7 8 9 10 11 12
H2/HGO [mol ratio]
Con
vers
ion
[%]
DBT 4-MDBT 4,6-DMDBT
Phenanthrene
Figure 6.35 Conversion of DBT, sDBT and phenanthrene as a function of molar H2/HGO ratio for CoMoNi/PdPt-HY (HDS-10) catalyst. Reaction conditions were 310 oC , 75 bar and 6000 kgcath/kmol. Feed: Heavy Gas Oil.
0
20
40
60
80
100
6 7 8 9 10 11 12
H2/HGO [mol ratio]
Mol
ar-a
vera
ged
conv
ersi
on [%
]
65 bar75 bar
Figure 6.36 Molar-averaged conversion as a function of H2/HGO mol ratio and pressure for CoMoNi/PdPt-HY (HDS-10) catalyst. Reaction conditions were 310 oC, 6000 kgcath/kmol. Feed: Heavy Gas Oil.
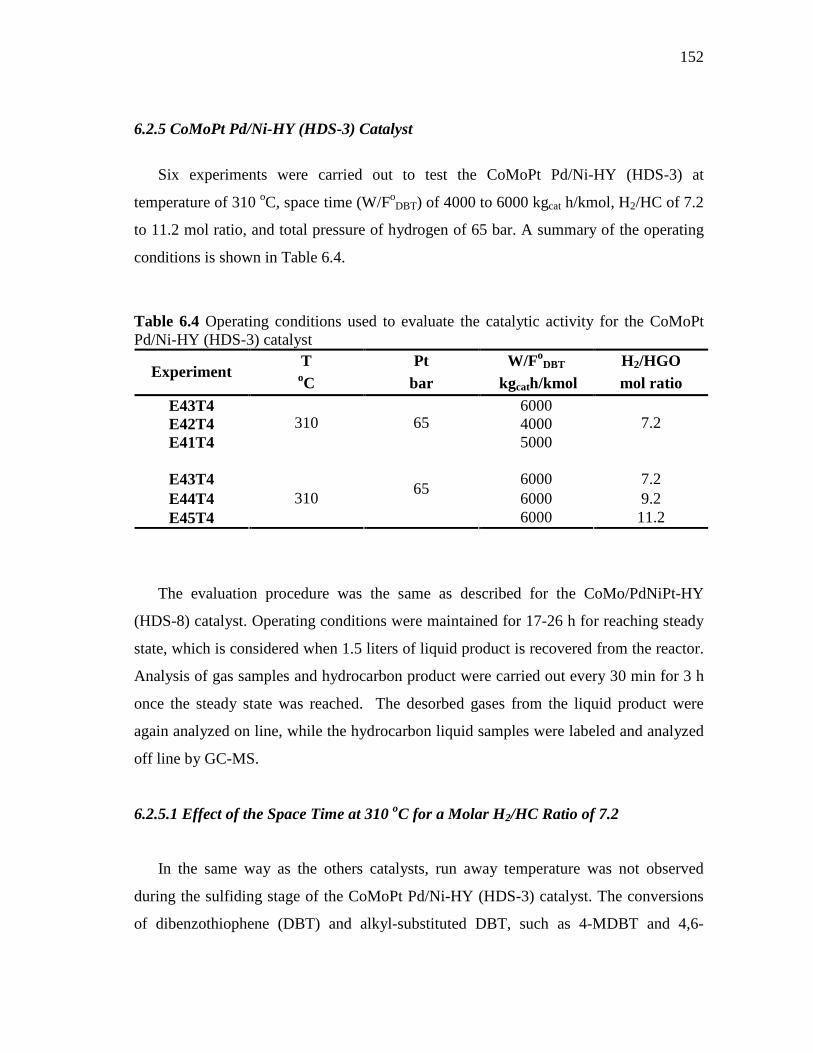
152
6.2.5 CoMoPt Pd/Ni-HY (HDS-3) Catalyst
Six experiments were carried out to test the CoMoPt Pd/Ni-HY (HDS-3) at
temperature of 310 oC, space time (W/FoDBT) of 4000 to 6000 kgcat h/kmol, H2/HC of 7.2
to 11.2 mol ratio, and total pressure of hydrogen of 65 bar. A summary of the operating
conditions is shown in Table 6.4.
Table 6.4 Operating conditions used to evaluate the catalytic activity for the CoMoPt Pd/Ni-HY (HDS-3) catalyst
T Pt W/FoDBT H2/HGO
Experiment oC bar kgcath/kmol mol ratio E43T4 6000 E42T4 4000 E41T4
310 65 5000
7.2
E43T4 6000 7.2 E44T4
65 6000 9.2
E45T4 310
6000 11.2
The evaluation procedure was the same as described for the CoMo/PdNiPt-HY
(HDS-8) catalyst. Operating conditions were maintained for 17-26 h for reaching steady
state, which is considered when 1.5 liters of liquid product is recovered from the reactor.
Analysis of gas samples and hydrocarbon product were carried out every 30 min for 3 h
once the steady state was reached. The desorbed gases from the liquid product were
again analyzed on line, while the hydrocarbon liquid samples were labeled and analyzed
off line by GC-MS.
6.2.5.1 Effect of the Space Time at 310 oC for a Molar H2/HC Ratio of 7.2
In the same way as the others catalysts, run away temperature was not observed
during the sulfiding stage of the CoMoPt Pd/Ni-HY (HDS-3) catalyst. The conversions
of dibenzothiophene (DBT) and alkyl-substituted DBT, such as 4-MDBT and 4,6-
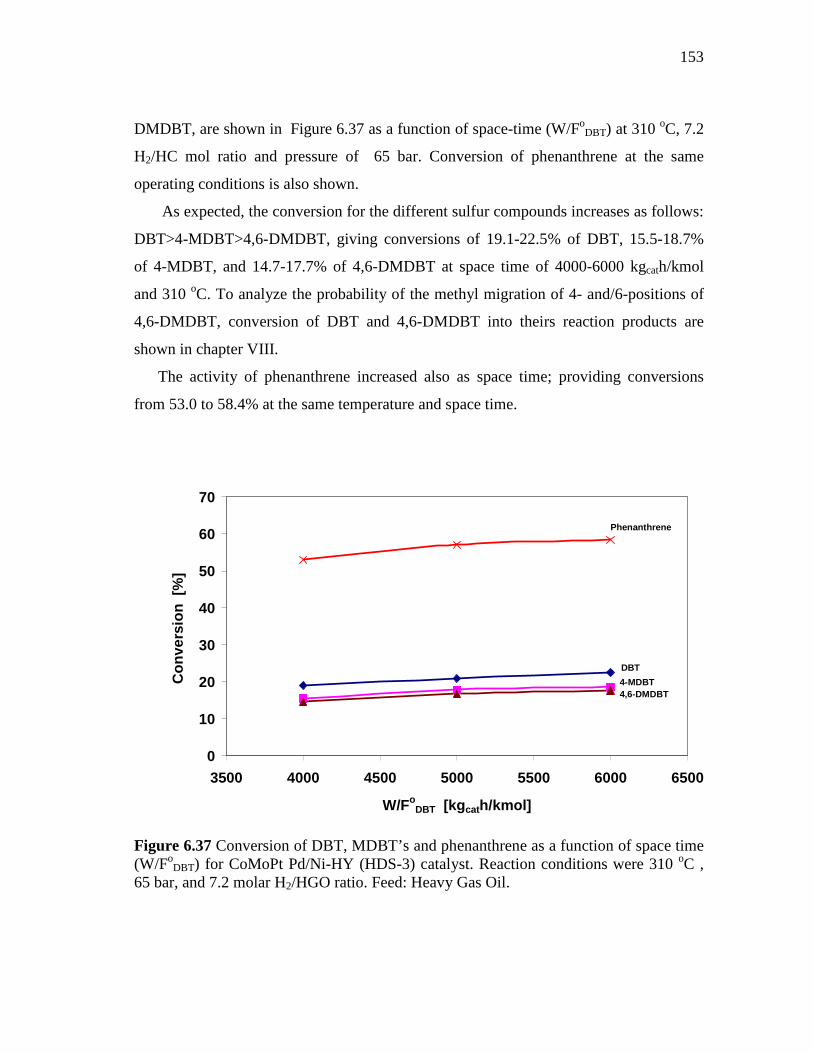
153
DMDBT, are shown in Figure 6.37 as a function of space-time (W/FoDBT) at 310 oC, 7.2
H2/HC mol ratio and pressure of 65 bar. Conversion of phenanthrene at the same
operating conditions is also shown.
As expected, the conversion for the different sulfur compounds increases as follows:
DBT>4-MDBT>4,6-DMDBT, giving conversions of 19.1-22.5% of DBT, 15.5-18.7%
of 4-MDBT, and 14.7-17.7% of 4,6-DMDBT at space time of 4000-6000 kgcath/kmol
and 310 oC. To analyze the probability of the methyl migration of 4- and/6-positions of
4,6-DMDBT, conversion of DBT and 4,6-DMDBT into theirs reaction products are
shown in chapter VIII.
The activity of phenanthrene increased also as space time; providing conversions
from 53.0 to 58.4% at the same temperature and space time.
0
10
20
30
40
50
60
70
3500 4000 4500 5000 5500 6000 6500
W/FoDBT [kg cath/kmol]
Con
vers
ion
[%]
DBT
4-MDBT 4,6-DMDBT
Phenanthrene
Figure 6.37 Conversion of DBT, MDBT’s and phenanthrene as a function of space time (W/Fo
DBT) for CoMoPt Pd/Ni-HY (HDS-3) catalyst. Reaction conditions were 310 oC , 65 bar, and 7.2 molar H2/HGO ratio. Feed: Heavy Gas Oil.
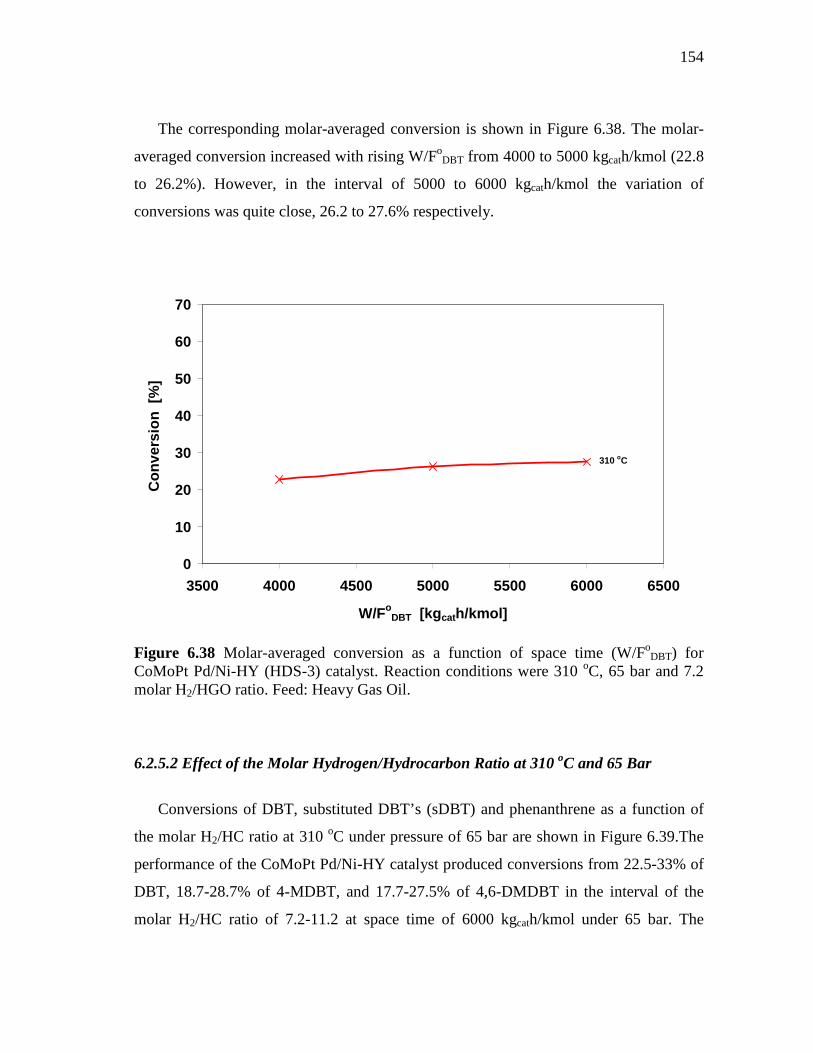
154
The corresponding molar-averaged conversion is shown in Figure 6.38. The molar-
averaged conversion increased with rising W/FoDBT from 4000 to 5000 kgcath/kmol (22.8
to 26.2%). However, in the interval of 5000 to 6000 kgcath/kmol the variation of
conversions was quite close, 26.2 to 27.6% respectively.
0
10
20
30
40
50
60
70
3500 4000 4500 5000 5500 6000 6500
W/FoDBT [kg cath/kmol]
Con
vers
ion
[%]
310 oC
Figure 6.38 Molar-averaged conversion as a function of space time (W/Fo
DBT) for CoMoPt Pd/Ni-HY (HDS-3) catalyst. Reaction conditions were 310 oC, 65 bar and 7.2 molar H2/HGO ratio. Feed: Heavy Gas Oil. 6.2.5.2 Effect of the Molar Hydrogen/Hydrocarbon Ratio at 310 oC and 65 Bar
Conversions of DBT, substituted DBT’s (sDBT) and phenanthrene as a function of
the molar H2/HC ratio at 310 oC under pressure of 65 bar are shown in Figure 6.39.The
performance of the CoMoPt Pd/Ni-HY catalyst produced conversions from 22.5-33% of
DBT, 18.7-28.7% of 4-MDBT, and 17.7-27.5% of 4,6-DMDBT in the interval of the
molar H2/HC ratio of 7.2-11.2 at space time of 6000 kgcath/kmol under 65 bar. The
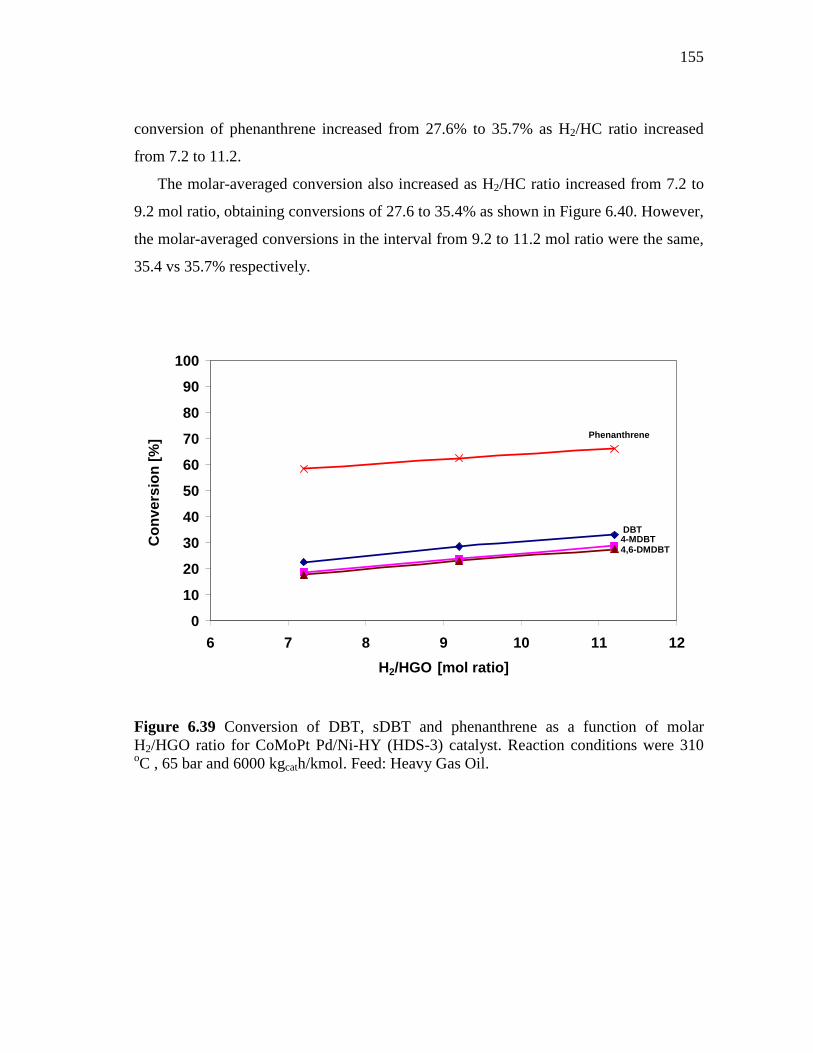
155
conversion of phenanthrene increased from 27.6% to 35.7% as H2/HC ratio increased
from 7.2 to 11.2.
The molar-averaged conversion also increased as H2/HC ratio increased from 7.2 to
9.2 mol ratio, obtaining conversions of 27.6 to 35.4% as shown in Figure 6.40. However,
the molar-averaged conversions in the interval from 9.2 to 11.2 mol ratio were the same,
35.4 vs 35.7% respectively.
0
10
20
30
40
50
60
70
80
90
100
6 7 8 9 10 11 12
H2/HGO [mol ratio]
Con
vers
ion
[%]
DBT 4-MDBT 4,6-DMDBT
Phenanthrene
Figure 6.39 Conversion of DBT, sDBT and phenanthrene as a function of molar H2/HGO ratio for CoMoPt Pd/Ni-HY (HDS-3) catalyst. Reaction conditions were 310 oC , 65 bar and 6000 kgcath/kmol. Feed: Heavy Gas Oil.
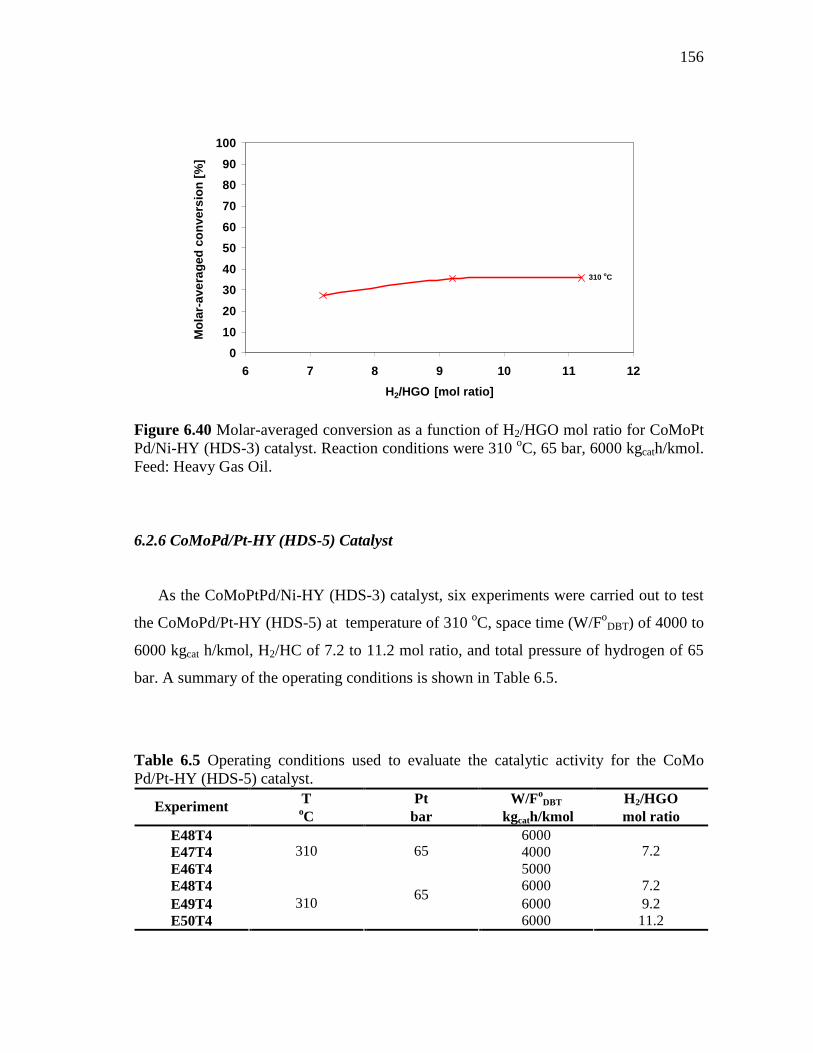
156
0
10
20
30
40
50
60
70
80
90
100
6 7 8 9 10 11 12
H2/HGO [mol ratio]
Mol
ar-a
vera
ged
conv
ersi
on [%
]
310 oC
Figure 6.40 Molar-averaged conversion as a function of H2/HGO mol ratio for CoMoPt Pd/Ni-HY (HDS-3) catalyst. Reaction conditions were 310 oC, 65 bar, 6000 kgcath/kmol. Feed: Heavy Gas Oil.
6.2.6 CoMoPd/Pt-HY (HDS-5) Catalyst
As the CoMoPtPd/Ni-HY (HDS-3) catalyst, six experiments were carried out to test
the CoMoPd/Pt-HY (HDS-5) at temperature of 310 oC, space time (W/FoDBT) of 4000 to
6000 kgcat h/kmol, H2/HC of 7.2 to 11.2 mol ratio, and total pressure of hydrogen of 65
bar. A summary of the operating conditions is shown in Table 6.5.
Table 6.5 Operating conditions used to evaluate the catalytic activity for the CoMo Pd/Pt-HY (HDS-5) catalyst.
T Pt W/FoDBT H2/HGO Experiment oC bar kgcath/kmol mol ratio
E48T4 6000 E47T4 4000 E46T4
310 65 5000
7.2
E48T4 6000 7.2 E49T4
65 6000 9.2
E50T4 310
6000 11.2
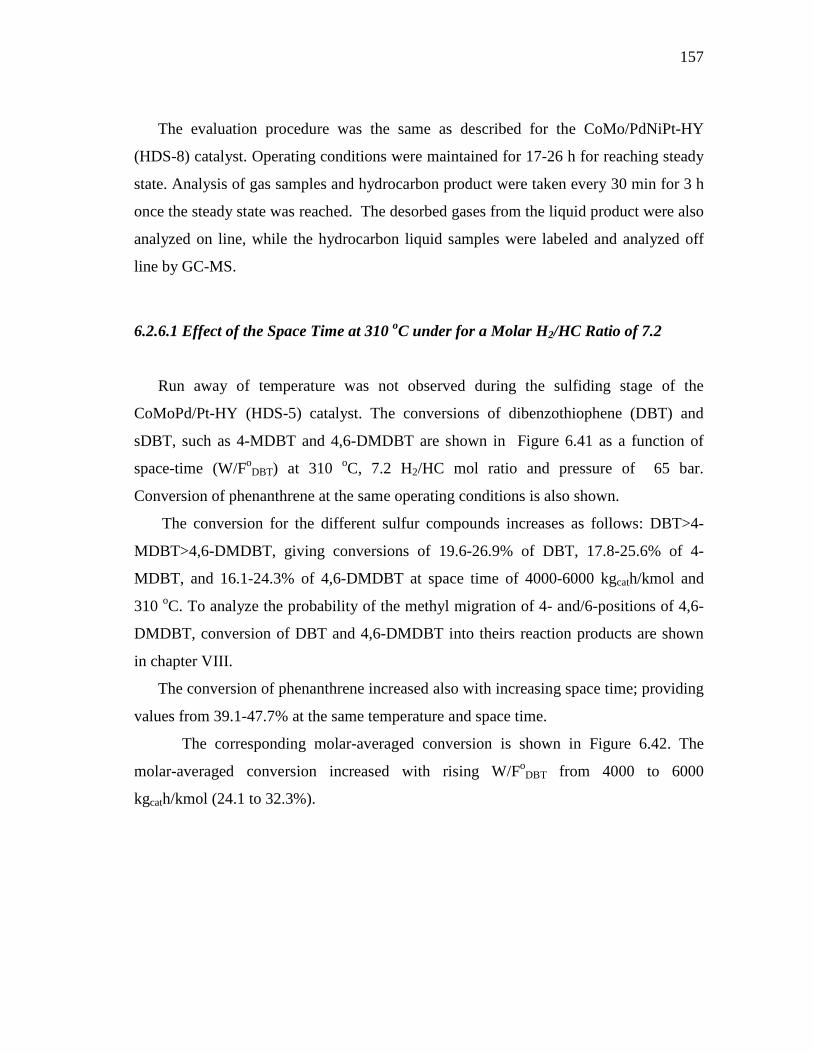
157
The evaluation procedure was the same as described for the CoMo/PdNiPt-HY
(HDS-8) catalyst. Operating conditions were maintained for 17-26 h for reaching steady
state. Analysis of gas samples and hydrocarbon product were taken every 30 min for 3 h
once the steady state was reached. The desorbed gases from the liquid product were also
analyzed on line, while the hydrocarbon liquid samples were labeled and analyzed off
line by GC-MS.
6.2.6.1 Effect of the Space Time at 310 oC under for a Molar H2/HC Ratio of 7.2
Run away of temperature was not observed during the sulfiding stage of the
CoMoPd/Pt-HY (HDS-5) catalyst. The conversions of dibenzothiophene (DBT) and
sDBT, such as 4-MDBT and 4,6-DMDBT are shown in Figure 6.41 as a function of
space-time (W/FoDBT) at 310 oC, 7.2 H2/HC mol ratio and pressure of 65 bar.
Conversion of phenanthrene at the same operating conditions is also shown.
The conversion for the different sulfur compounds increases as follows: DBT>4-
MDBT>4,6-DMDBT, giving conversions of 19.6-26.9% of DBT, 17.8-25.6% of 4-
MDBT, and 16.1-24.3% of 4,6-DMDBT at space time of 4000-6000 kgcath/kmol and
310 oC. To analyze the probability of the methyl migration of 4- and/6-positions of 4,6-
DMDBT, conversion of DBT and 4,6-DMDBT into theirs reaction products are shown
in chapter VIII.
The conversion of phenanthrene increased also with increasing space time; providing
values from 39.1-47.7% at the same temperature and space time.
The corresponding molar-averaged conversion is shown in Figure 6.42. The
molar-averaged conversion increased with rising W/FoDBT from 4000 to 6000
kgcath/kmol (24.1 to 32.3%).
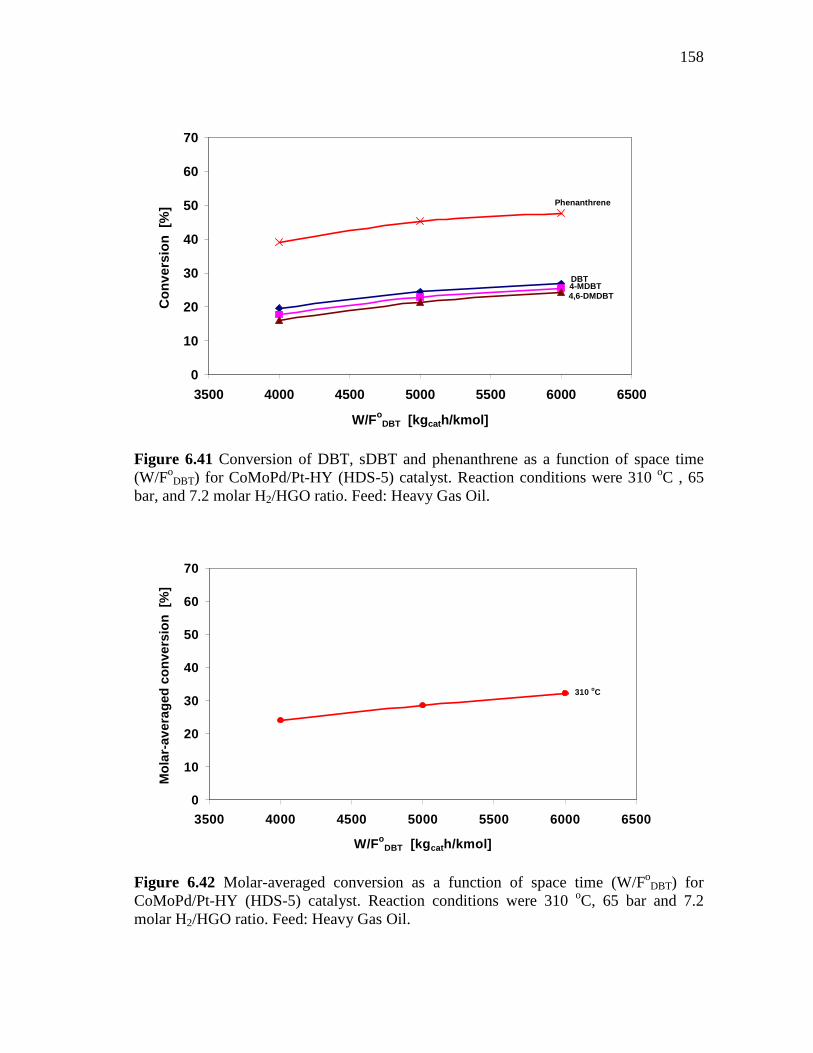
158
0
10
20
30
40
50
60
70
3500 4000 4500 5000 5500 6000 6500
W/FoDBT [kg cath/kmol]
Con
vers
ion
[%]
DBT 4-MDBT 4,6-DMDBT
Phenanthrene
Figure 6.41 Conversion of DBT, sDBT and phenanthrene as a function of space time (W/Fo
DBT) for CoMoPd/Pt-HY (HDS-5) catalyst. Reaction conditions were 310 oC , 65 bar, and 7.2 molar H2/HGO ratio. Feed: Heavy Gas Oil.
0
10
20
30
40
50
60
70
3500 4000 4500 5000 5500 6000 6500
W/FoDBT [kg cath/kmol]
Mol
ar-a
vera
ged
conv
ersi
on [
%]
310 oC
Figure 6.42 Molar-averaged conversion as a function of space time (W/Fo
DBT) for CoMoPd/Pt-HY (HDS-5) catalyst. Reaction conditions were 310 oC, 65 bar and 7.2 molar H2/HGO ratio. Feed: Heavy Gas Oil.
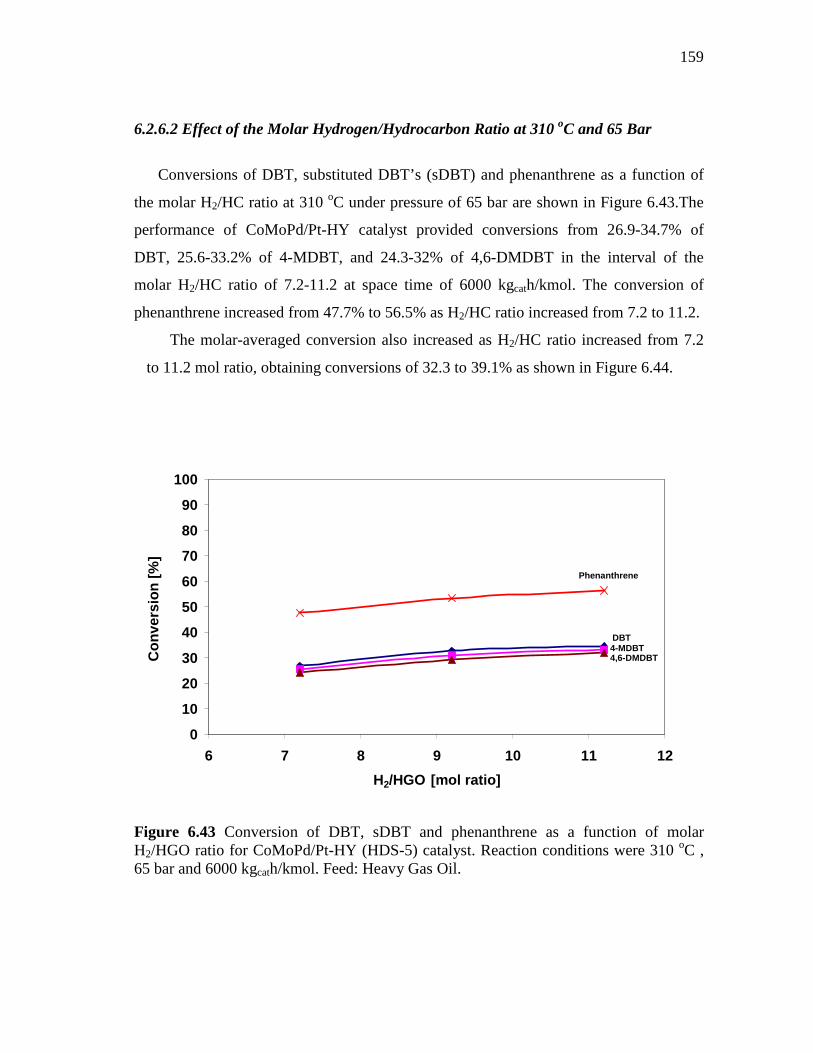
159
6.2.6.2 Effect of the Molar Hydrogen/Hydrocarbon Ratio at 310 oC and 65 Bar
Conversions of DBT, substituted DBT’s (sDBT) and phenanthrene as a function of
the molar H2/HC ratio at 310 oC under pressure of 65 bar are shown in Figure 6.43.The
performance of CoMoPd/Pt-HY catalyst provided conversions from 26.9-34.7% of
DBT, 25.6-33.2% of 4-MDBT, and 24.3-32% of 4,6-DMDBT in the interval of the
molar H2/HC ratio of 7.2-11.2 at space time of 6000 kgcath/kmol. The conversion of
phenanthrene increased from 47.7% to 56.5% as H2/HC ratio increased from 7.2 to 11.2.
The molar-averaged conversion also increased as H2/HC ratio increased from 7.2
to 11.2 mol ratio, obtaining conversions of 32.3 to 39.1% as shown in Figure 6.44.
0
10
20
30
40
50
60
70
80
90
100
6 7 8 9 10 11 12
H2/HGO [mol ratio]
Con
vers
ion
[%]
DBT 4-MDBT 4,6-DMDBT
Phenanthrene
Figure 6.43 Conversion of DBT, sDBT and phenanthrene as a function of molar H2/HGO ratio for CoMoPd/Pt-HY (HDS-5) catalyst. Reaction conditions were 310 oC , 65 bar and 6000 kgcath/kmol. Feed: Heavy Gas Oil.
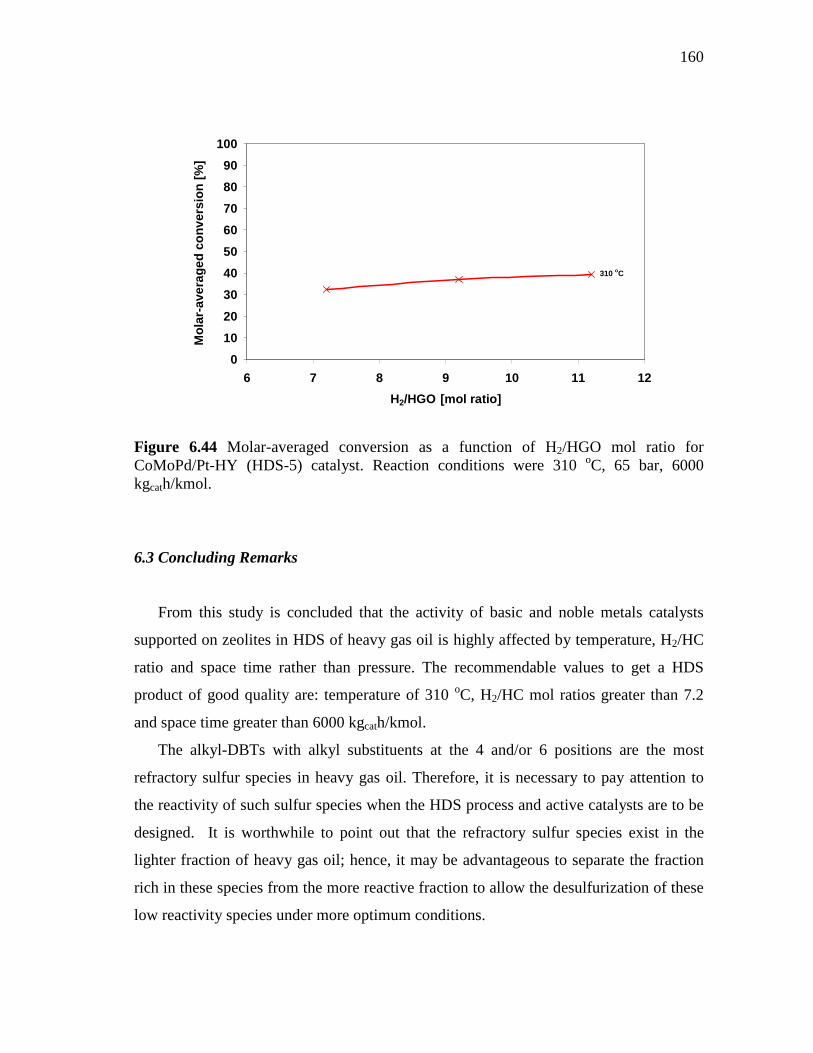
160
0
10
20
30
40
50
60
70
80
90
100
6 7 8 9 10 11 12
H2/HGO [mol ratio]
Mol
ar-a
vera
ged
conv
ersi
on [%
]
310 oC
Figure 6.44 Molar-averaged conversion as a function of H2/HGO mol ratio for CoMoPd/Pt-HY (HDS-5) catalyst. Reaction conditions were 310 oC, 65 bar, 6000 kgcath/kmol.
6.3 Concluding Remarks
From this study is concluded that the activity of basic and noble metals catalysts
supported on zeolites in HDS of heavy gas oil is highly affected by temperature, H2/HC
ratio and space time rather than pressure. The recommendable values to get a HDS
product of good quality are: temperature of 310 oC, H2/HC mol ratios greater than 7.2
and space time greater than 6000 kgcath/kmol.
The alkyl-DBTs with alkyl substituents at the 4 and/or 6 positions are the most
refractory sulfur species in heavy gas oil. Therefore, it is necessary to pay attention to
the reactivity of such sulfur species when the HDS process and active catalysts are to be
designed. It is worthwhile to point out that the refractory sulfur species exist in the
lighter fraction of heavy gas oil; hence, it may be advantageous to separate the fraction
rich in these species from the more reactive fraction to allow the desulfurization of these
low reactivity species under more optimum conditions.
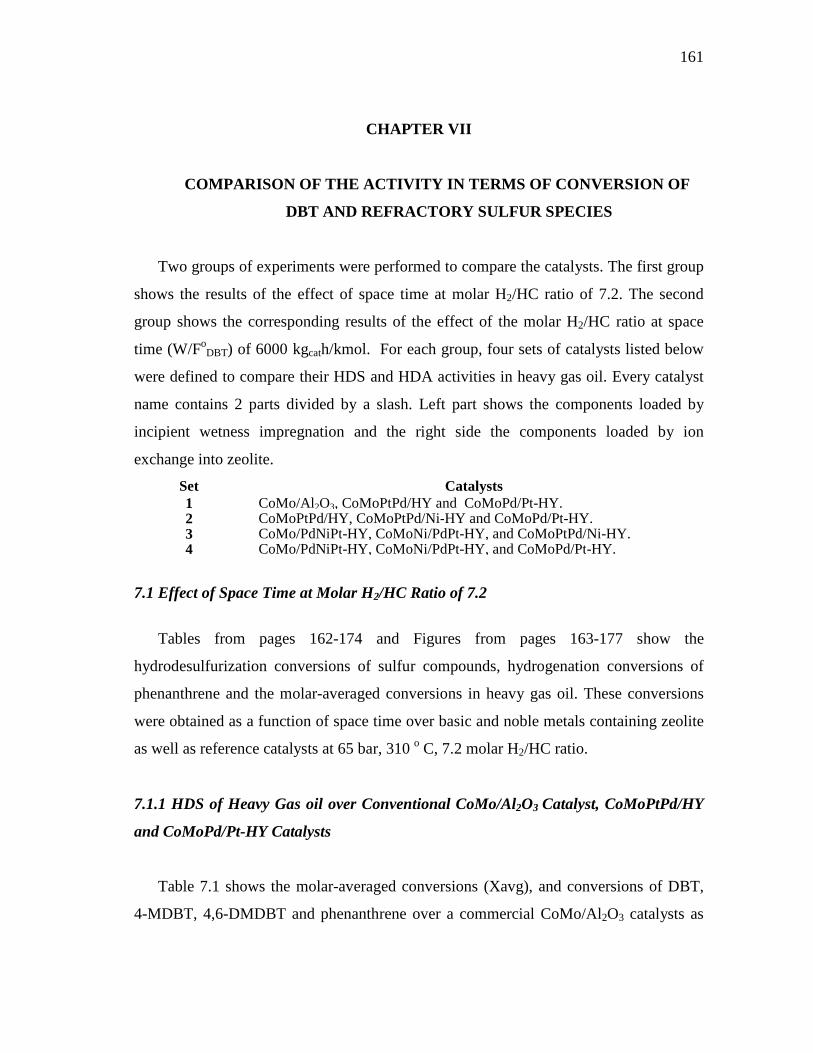
161
CHAPTER VII
COMPARISON OF THE ACTIVITY IN TERMS OF CONVERSION O F
DBT AND REFRACTORY SULFUR SPECIES
Two groups of experiments were performed to compare the catalysts. The first group
shows the results of the effect of space time at molar H2/HC ratio of 7.2. The second
group shows the corresponding results of the effect of the molar H2/HC ratio at space
time (W/FoDBT) of 6000 kgcath/kmol. For each group, four sets of catalysts listed below
were defined to compare their HDS and HDA activities in heavy gas oil. Every catalyst
name contains 2 parts divided by a slash. Left part shows the components loaded by
incipient wetness impregnation and the right side the components loaded by ion
exchange into zeolite.
Set Catalysts 1 CoMo/Al2O3, CoMoPtPd/HY and CoMoPd/Pt-HY. 2 CoMoPtPd/HY, CoMoPtPd/Ni-HY and CoMoPd/Pt-HY. 3 CoMo/PdNiPt-HY, CoMoNi/PdPt-HY, and CoMoPtPd/Ni-HY. 4 CoMo/PdNiPt-HY, CoMoNi/PdPt-HY, and CoMoPd/Pt-HY.
7.1 Effect of Space Time at Molar H2/HC Ratio of 7.2
Tables from pages 162-174 and Figures from pages 163-177 show the
hydrodesulfurization conversions of sulfur compounds, hydrogenation conversions of
phenanthrene and the molar-averaged conversions in heavy gas oil. These conversions
were obtained as a function of space time over basic and noble metals containing zeolite
as well as reference catalysts at 65 bar, 310 o C, 7.2 molar H2/HC ratio.
7.1.1 HDS of Heavy Gas oil over Conventional CoMo/Al2O3 Catalyst, CoMoPtPd/HY
and CoMoPd/Pt-HY Catalysts
Table 7.1 shows the molar-averaged conversions (Xavg), and conversions of DBT,
4-MDBT, 4,6-DMDBT and phenanthrene over a commercial CoMo/Al2O3 catalysts as
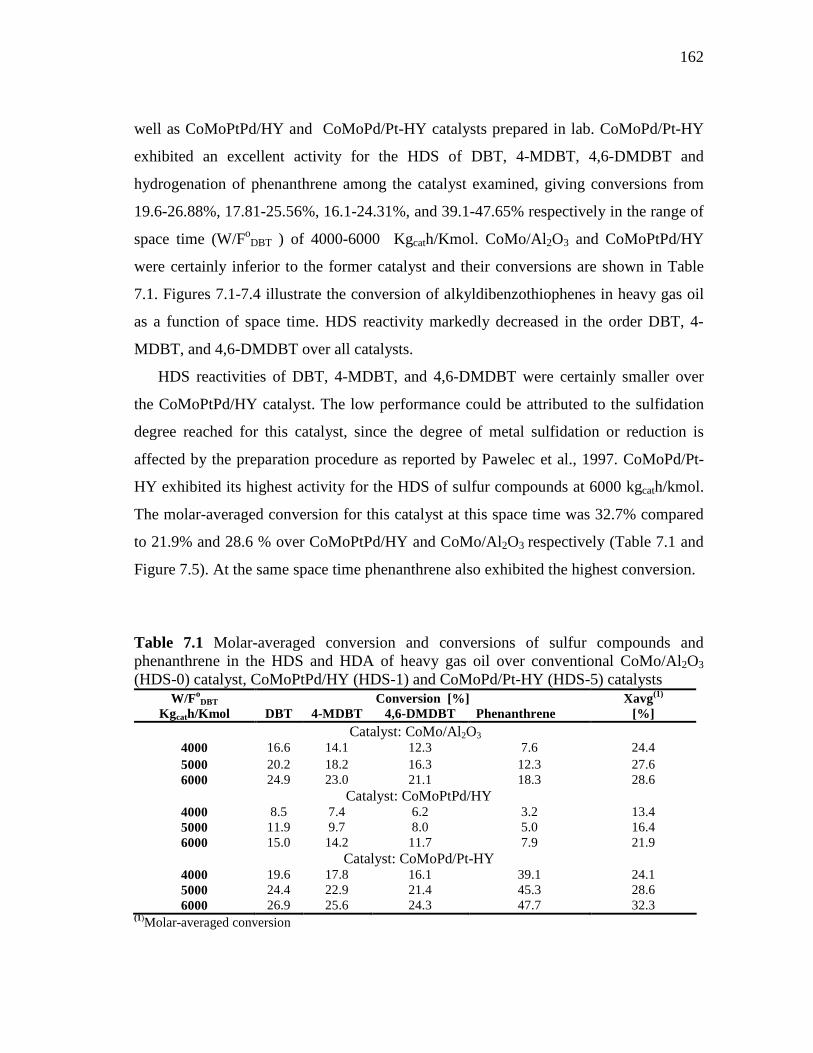
162
well as CoMoPtPd/HY and CoMoPd/Pt-HY catalysts prepared in lab. CoMoPd/Pt-HY
exhibited an excellent activity for the HDS of DBT, 4-MDBT, 4,6-DMDBT and
hydrogenation of phenanthrene among the catalyst examined, giving conversions from
19.6-26.88%, 17.81-25.56%, 16.1-24.31%, and 39.1-47.65% respectively in the range of
space time (W/FoDBT ) of 4000-6000 Kgcath/Kmol. CoMo/Al2O3 and CoMoPtPd/HY
were certainly inferior to the former catalyst and their conversions are shown in Table
7.1. Figures 7.1-7.4 illustrate the conversion of alkyldibenzothiophenes in heavy gas oil
as a function of space time. HDS reactivity markedly decreased in the order DBT, 4-
MDBT, and 4,6-DMDBT over all catalysts.
HDS reactivities of DBT, 4-MDBT, and 4,6-DMDBT were certainly smaller over
the CoMoPtPd/HY catalyst. The low performance could be attributed to the sulfidation
degree reached for this catalyst, since the degree of metal sulfidation or reduction is
affected by the preparation procedure as reported by Pawelec et al., 1997. CoMoPd/Pt-
HY exhibited its highest activity for the HDS of sulfur compounds at 6000 kgcath/kmol.
The molar-averaged conversion for this catalyst at this space time was 32.7% compared
to 21.9% and 28.6 % over CoMoPtPd/HY and CoMo/Al2O3 respectively (Table 7.1 and
Figure 7.5). At the same space time phenanthrene also exhibited the highest conversion.
Table 7.1 Molar-averaged conversion and conversions of sulfur compounds and phenanthrene in the HDS and HDA of heavy gas oil over conventional CoMo/Al2O3
(HDS-0) catalyst, CoMoPtPd/HY (HDS-1) and CoMoPd/Pt-HY (HDS-5) catalysts W/Fo
DBT Conversion [%] Xavg(1) Kgcath/Kmol DBT 4-MDBT 4,6-DMDBT Phenanthrene [%]
Catalyst: CoMo/Al2O3 4000 16.6 14.1 12.3 7.6 24.4 5000 20.2 18.2 16.3 12.3 27.6 6000 24.9 23.0 21.1 18.3 28.6
Catalyst: CoMoPtPd/HY 4000 8.5 7.4 6.2 3.2 13.4 5000 11.9 9.7 8.0 5.0 16.4 6000 15.0 14.2 11.7 7.9 21.9
Catalyst: CoMoPd/Pt-HY 4000 19.6 17.8 16.1 39.1 24.1 5000 24.4 22.9 21.4 45.3 28.6 6000 26.9 25.6 24.3 47.7 32.3
(1)Molar-averaged conversion
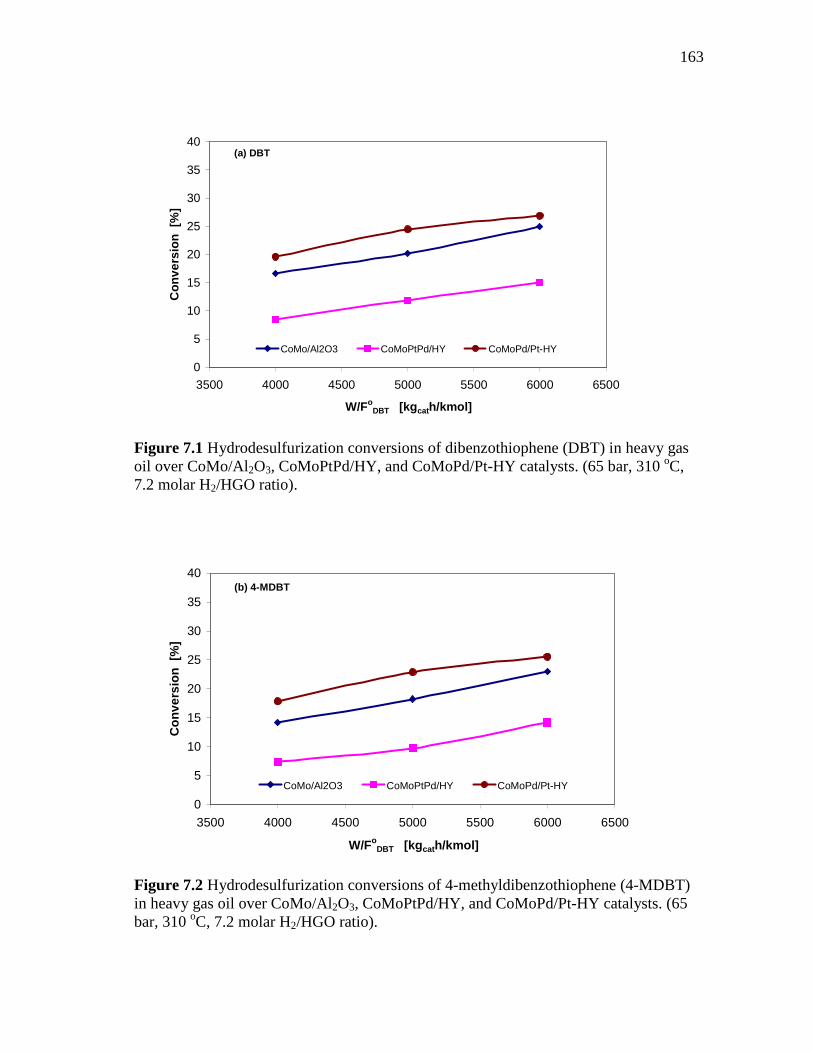
163
0
5
10
15
20
25
30
35
40
3500 4000 4500 5000 5500 6000 6500
W/FoDBT [kg cath/kmol]
Con
vers
ion
[%]
CoMo/Al2O3 CoMoPtPd/HY CoMoPd/Pt-HY
(a) DBT
Figure 7.1 Hydrodesulfurization conversions of dibenzothiophene (DBT) in heavy gas oil over CoMo/Al2O3, CoMoPtPd/HY, and CoMoPd/Pt-HY catalysts. (65 bar, 310 oC, 7.2 molar H2/HGO ratio).
0
5
10
15
20
25
30
35
40
3500 4000 4500 5000 5500 6000 6500
W/FoDBT [kg cath/kmol]
Con
vers
ion
[%]
CoMo/Al2O3 CoMoPtPd/HY CoMoPd/Pt-HY
(b) 4-MDBT
Figure 7.2 Hydrodesulfurization conversions of 4-methyldibenzothiophene (4-MDBT) in heavy gas oil over CoMo/Al2O3, CoMoPtPd/HY, and CoMoPd/Pt-HY catalysts. (65 bar, 310 oC, 7.2 molar H2/HGO ratio).
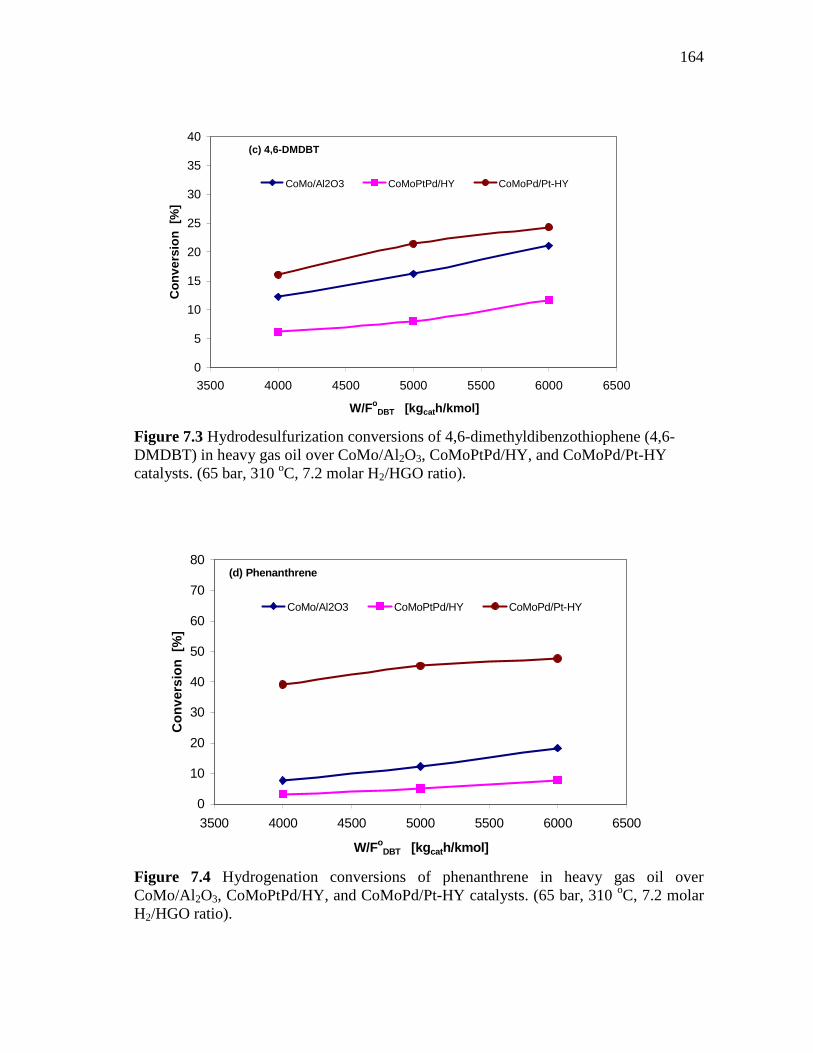
164
0
5
10
15
20
25
30
35
40
3500 4000 4500 5000 5500 6000 6500
W/FoDBT [kg cath/kmol]
Con
vers
ion
[%]
CoMo/Al2O3 CoMoPtPd/HY CoMoPd/Pt-HY
(c) 4,6-DMDBT
Figure 7.3 Hydrodesulfurization conversions of 4,6-dimethyldibenzothiophene (4,6-DMDBT) in heavy gas oil over CoMo/Al2O3, CoMoPtPd/HY, and CoMoPd/Pt-HY catalysts. (65 bar, 310 oC, 7.2 molar H2/HGO ratio).
0
10
20
30
40
50
60
70
80
3500 4000 4500 5000 5500 6000 6500
W/FoDBT [kg cath/kmol]
Con
vers
ion
[%]
CoMo/Al2O3 CoMoPtPd/HY CoMoPd/Pt-HY
(d) Phenanthrene
Figure 7.4 Hydrogenation conversions of phenanthrene in heavy gas oil over CoMo/Al2O3, CoMoPtPd/HY, and CoMoPd/Pt-HY catalysts. (65 bar, 310 oC, 7.2 molar H2/HGO ratio).
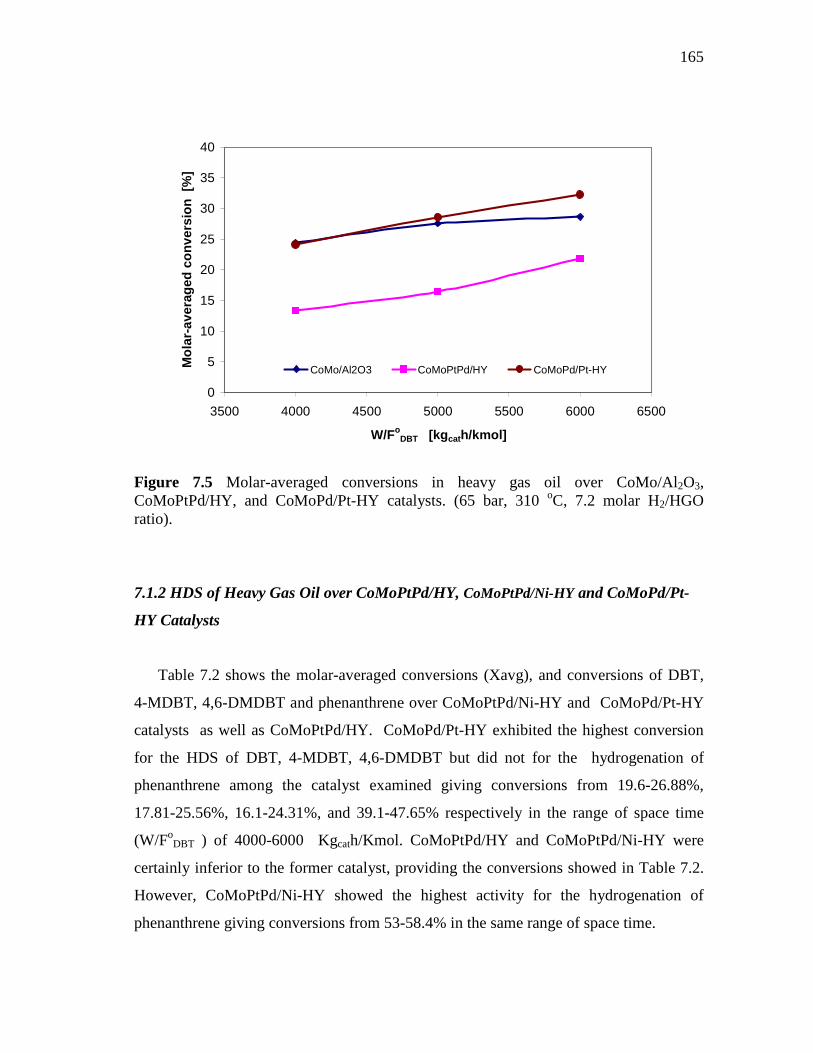
165
0
5
10
15
20
25
30
35
40
3500 4000 4500 5000 5500 6000 6500
W/FoDBT [kg cath/kmol]
Mol
ar-a
vera
ged
conv
ersi
on [
%]
CoMo/Al2O3 CoMoPtPd/HY CoMoPd/Pt-HY
Figure 7.5 Molar-averaged conversions in heavy gas oil over CoMo/Al2O3, CoMoPtPd/HY, and CoMoPd/Pt-HY catalysts. (65 bar, 310 oC, 7.2 molar H2/HGO ratio). 7.1.2 HDS of Heavy Gas Oil over CoMoPtPd/HY, CoMoPtPd/Ni-HY and CoMoPd/Pt-
HY Catalysts
Table 7.2 shows the molar-averaged conversions (Xavg), and conversions of DBT,
4-MDBT, 4,6-DMDBT and phenanthrene over CoMoPtPd/Ni-HY and CoMoPd/Pt-HY
catalysts as well as CoMoPtPd/HY. CoMoPd/Pt-HY exhibited the highest conversion
for the HDS of DBT, 4-MDBT, 4,6-DMDBT but did not for the hydrogenation of
phenanthrene among the catalyst examined giving conversions from 19.6-26.88%,
17.81-25.56%, 16.1-24.31%, and 39.1-47.65% respectively in the range of space time
(W/FoDBT ) of 4000-6000 Kgcath/Kmol. CoMoPtPd/HY and CoMoPtPd/Ni-HY were
certainly inferior to the former catalyst, providing the conversions showed in Table 7.2.
However, CoMoPtPd/Ni-HY showed the highest activity for the hydrogenation of
phenanthrene giving conversions from 53-58.4% in the same range of space time.
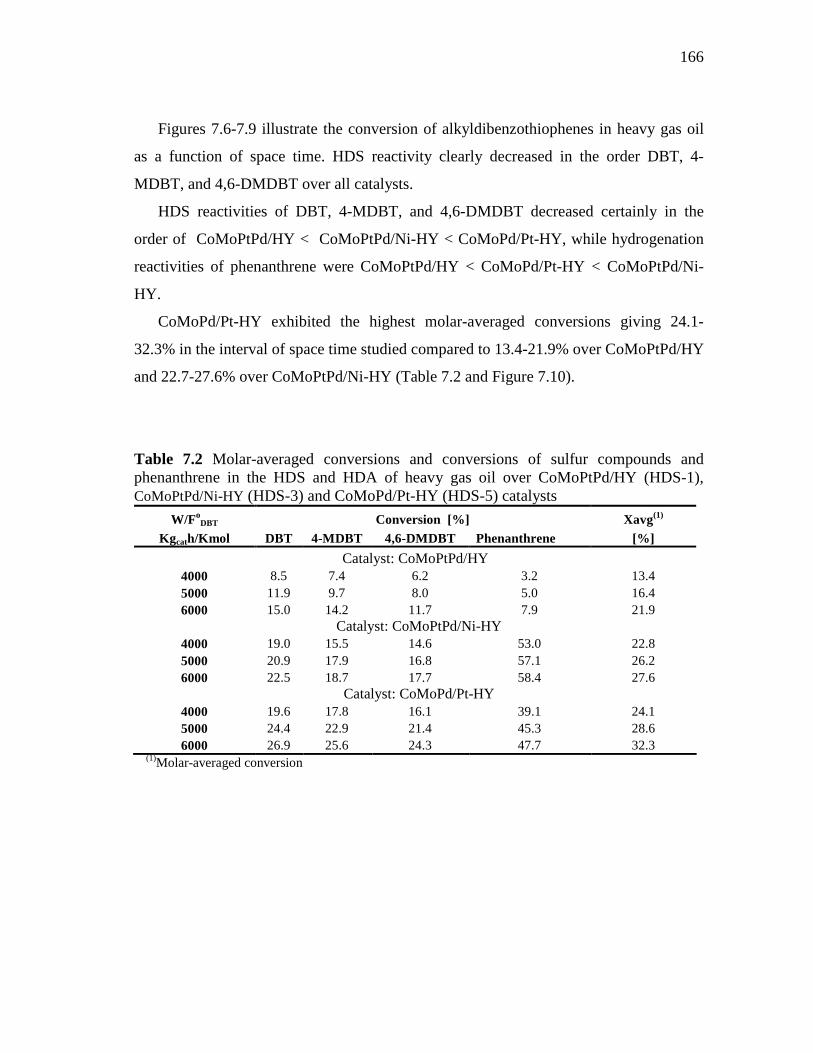
166
Figures 7.6-7.9 illustrate the conversion of alkyldibenzothiophenes in heavy gas oil
as a function of space time. HDS reactivity clearly decreased in the order DBT, 4-
MDBT, and 4,6-DMDBT over all catalysts.
HDS reactivities of DBT, 4-MDBT, and 4,6-DMDBT decreased certainly in the
order of CoMoPtPd/HY < CoMoPtPd/Ni-HY < CoMoPd/Pt-HY, while hydrogenation
reactivities of phenanthrene were CoMoPtPd/HY < CoMoPd/Pt-HY < CoMoPtPd/Ni-
HY.
CoMoPd/Pt-HY exhibited the highest molar-averaged conversions giving 24.1-
32.3% in the interval of space time studied compared to 13.4-21.9% over CoMoPtPd/HY
and 22.7-27.6% over CoMoPtPd/Ni-HY (Table 7.2 and Figure 7.10).
Table 7.2 Molar-averaged conversions and conversions of sulfur compounds and phenanthrene in the HDS and HDA of heavy gas oil over CoMoPtPd/HY (HDS-1), CoMoPtPd/Ni-HY (HDS-3) and CoMoPd/Pt-HY (HDS-5) catalysts
W/FoDBT Conversion [%] Xavg(1)
Kgcath/Kmol DBT 4-MDBT 4,6-DMDBT Phenanthrene [%]
Catalyst: CoMoPtPd/HY 4000 8.5 7.4 6.2 3.2 13.4 5000 11.9 9.7 8.0 5.0 16.4 6000 15.0 14.2 11.7 7.9 21.9
Catalyst: CoMoPtPd/Ni-HY 4000 19.0 15.5 14.6 53.0 22.8 5000 20.9 17.9 16.8 57.1 26.2 6000 22.5 18.7 17.7 58.4 27.6
Catalyst: CoMoPd/Pt-HY 4000 19.6 17.8 16.1 39.1 24.1 5000 24.4 22.9 21.4 45.3 28.6 6000 26.9 25.6 24.3 47.7 32.3
(1)Molar-averaged conversion
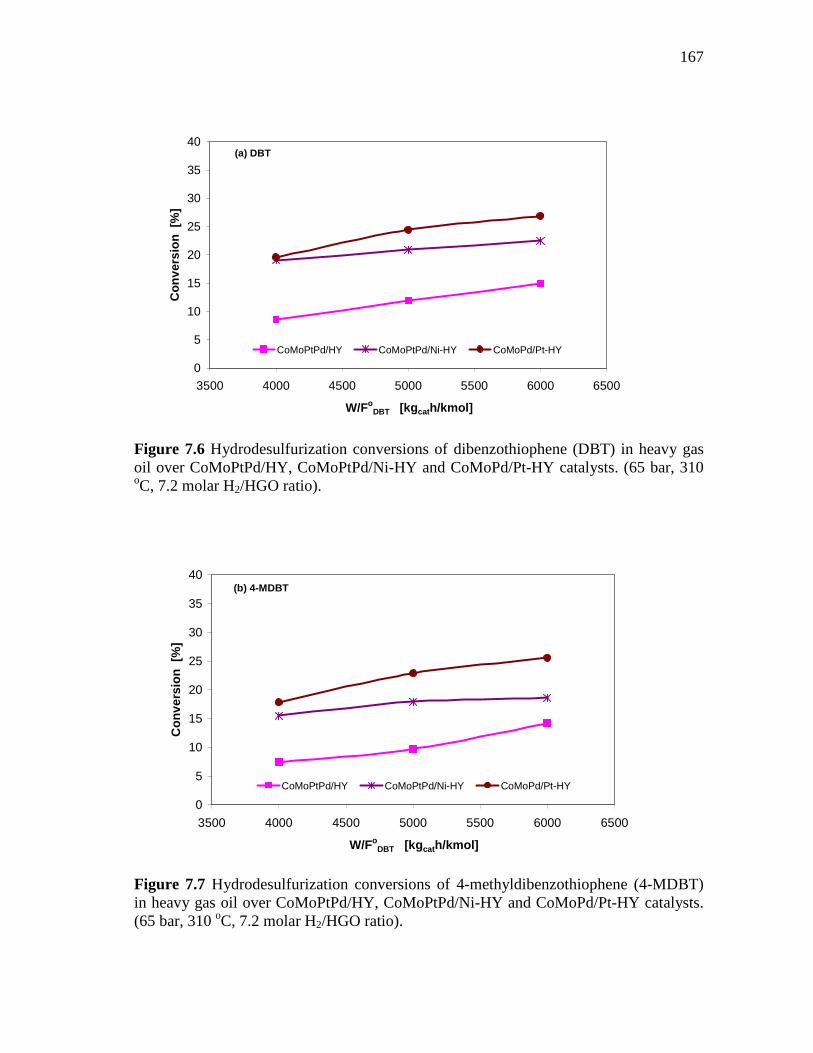
167
0
5
10
15
20
25
30
35
40
3500 4000 4500 5000 5500 6000 6500
W/FoDBT [kg cath/kmol]
Con
vers
ion
[%]
CoMoPtPd/HY CoMoPtPd/Ni-HY CoMoPd/Pt-HY
(a) DBT
Figure 7.6 Hydrodesulfurization conversions of dibenzothiophene (DBT) in heavy gas oil over CoMoPtPd/HY, CoMoPtPd/Ni-HY and CoMoPd/Pt-HY catalysts. (65 bar, 310 oC, 7.2 molar H2/HGO ratio).
0
5
10
15
20
25
30
35
40
3500 4000 4500 5000 5500 6000 6500
W/FoDBT [kg cath/kmol]
Con
vers
ion
[%]
CoMoPtPd/HY CoMoPtPd/Ni-HY CoMoPd/Pt-HY
(b) 4-MDBT
Figure 7.7 Hydrodesulfurization conversions of 4-methyldibenzothiophene (4-MDBT) in heavy gas oil over CoMoPtPd/HY, CoMoPtPd/Ni-HY and CoMoPd/Pt-HY catalysts. (65 bar, 310 oC, 7.2 molar H2/HGO ratio).
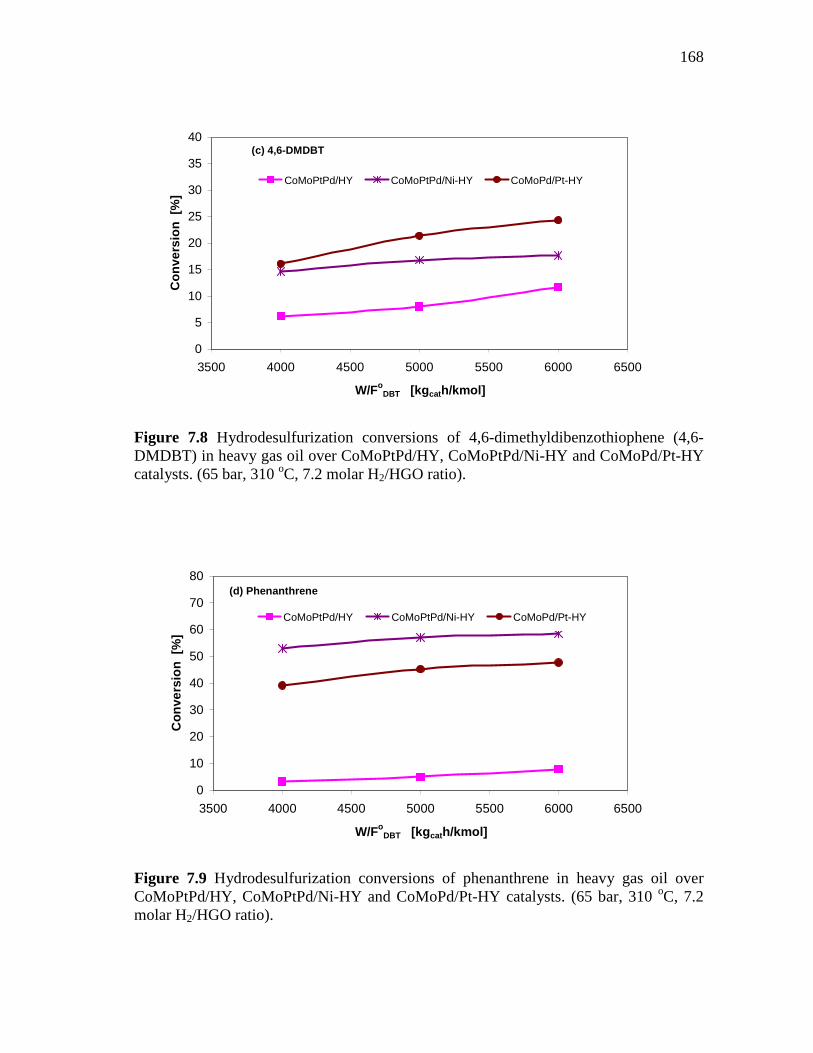
168
0
5
10
15
20
25
30
35
40
3500 4000 4500 5000 5500 6000 6500
W/FoDBT [kg cath/kmol]
Con
vers
ion
[%]
CoMoPtPd/HY CoMoPtPd/Ni-HY CoMoPd/Pt-HY
(c) 4,6-DMDBT
Figure 7.8 Hydrodesulfurization conversions of 4,6-dimethyldibenzothiophene (4,6-DMDBT) in heavy gas oil over CoMoPtPd/HY, CoMoPtPd/Ni-HY and CoMoPd/Pt-HY catalysts. (65 bar, 310 oC, 7.2 molar H2/HGO ratio).
0
10
20
30
40
50
60
70
80
3500 4000 4500 5000 5500 6000 6500
W/FoDBT [kg cath/kmol]
Con
vers
ion
[%]
CoMoPtPd/HY CoMoPtPd/Ni-HY CoMoPd/Pt-HY
(d) Phenanthrene
Figure 7.9 Hydrodesulfurization conversions of phenanthrene in heavy gas oil over CoMoPtPd/HY, CoMoPtPd/Ni-HY and CoMoPd/Pt-HY catalysts. (65 bar, 310 oC, 7.2 molar H2/HGO ratio).
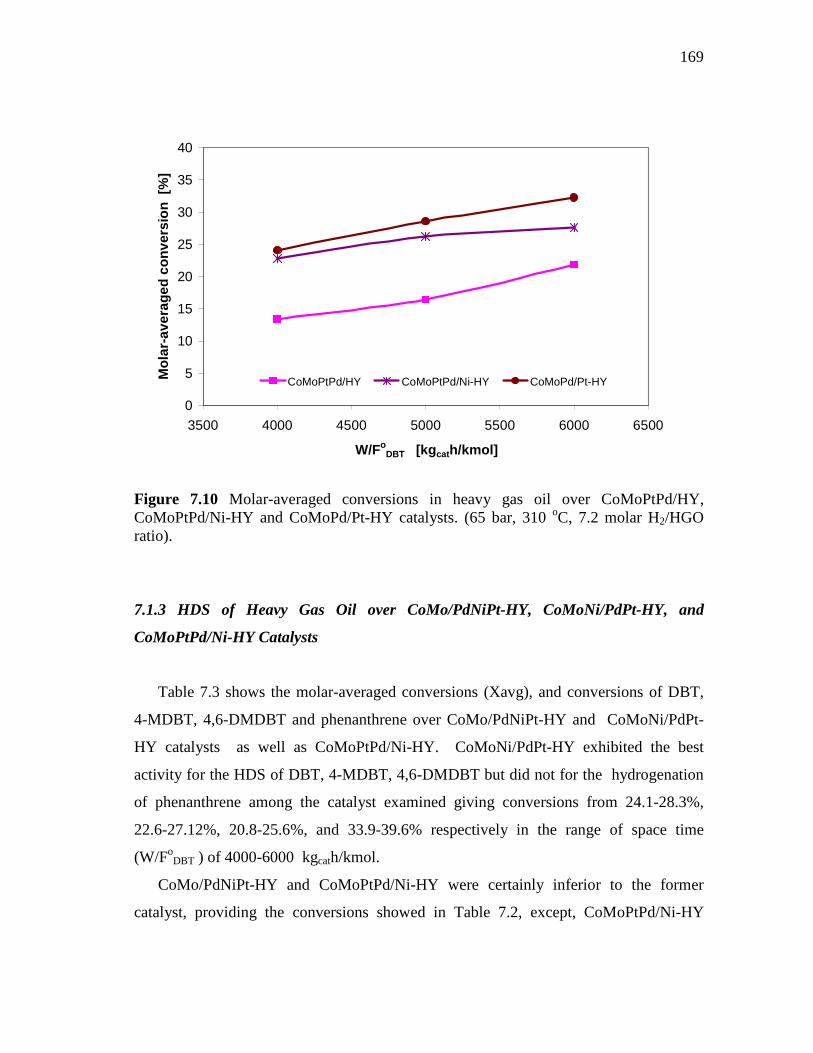
169
0
5
10
15
20
25
30
35
40
3500 4000 4500 5000 5500 6000 6500
W/FoDBT [kg cath/kmol]
Mol
ar-a
vera
ged
conv
ersi
on [
%]
CoMoPtPd/HY CoMoPtPd/Ni-HY CoMoPd/Pt-HY
Figure 7.10 Molar-averaged conversions in heavy gas oil over CoMoPtPd/HY, CoMoPtPd/Ni-HY and CoMoPd/Pt-HY catalysts. (65 bar, 310 oC, 7.2 molar H2/HGO ratio).
7.1.3 HDS of Heavy Gas Oil over CoMo/PdNiPt-HY, CoMoNi/PdPt-HY, and
CoMoPtPd/Ni-HY Catalysts
Table 7.3 shows the molar-averaged conversions (Xavg), and conversions of DBT,
4-MDBT, 4,6-DMDBT and phenanthrene over CoMo/PdNiPt-HY and CoMoNi/PdPt-
HY catalysts as well as CoMoPtPd/Ni-HY. CoMoNi/PdPt-HY exhibited the best
activity for the HDS of DBT, 4-MDBT, 4,6-DMDBT but did not for the hydrogenation
of phenanthrene among the catalyst examined giving conversions from 24.1-28.3%,
22.6-27.12%, 20.8-25.6%, and 33.9-39.6% respectively in the range of space time
(W/FoDBT ) of 4000-6000 kgcath/kmol.
CoMo/PdNiPt-HY and CoMoPtPd/Ni-HY were certainly inferior to the former
catalyst, providing the conversions showed in Table 7.2, except, CoMoPtPd/Ni-HY
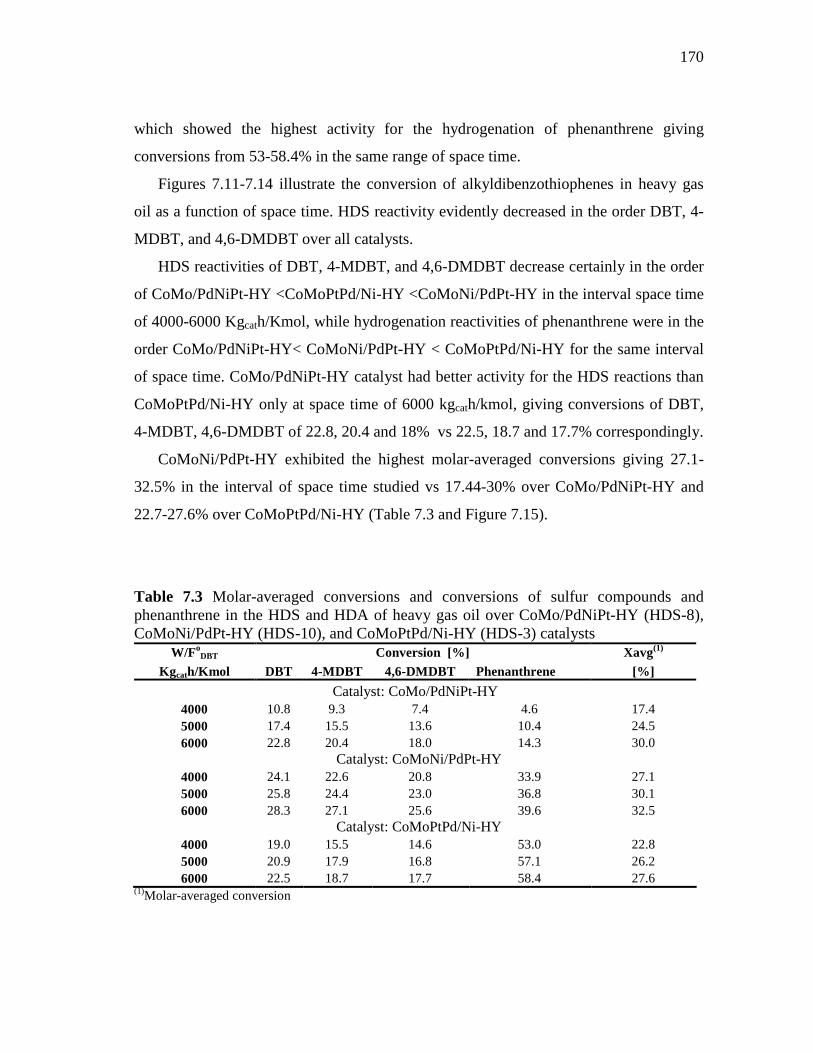
170
which showed the highest activity for the hydrogenation of phenanthrene giving
conversions from 53-58.4% in the same range of space time.
Figures 7.11-7.14 illustrate the conversion of alkyldibenzothiophenes in heavy gas
oil as a function of space time. HDS reactivity evidently decreased in the order DBT, 4-
MDBT, and 4,6-DMDBT over all catalysts.
HDS reactivities of DBT, 4-MDBT, and 4,6-DMDBT decrease certainly in the order
of CoMo/PdNiPt-HY <CoMoPtPd/Ni-HY <CoMoNi/PdPt-HY in the interval space time
of 4000-6000 Kgcath/Kmol, while hydrogenation reactivities of phenanthrene were in the
order CoMo/PdNiPt-HY< CoMoNi/PdPt-HY < CoMoPtPd/Ni-HY for the same interval
of space time. CoMo/PdNiPt-HY catalyst had better activity for the HDS reactions than
CoMoPtPd/Ni-HY only at space time of 6000 kgcath/kmol, giving conversions of DBT,
4-MDBT, 4,6-DMDBT of 22.8, 20.4 and 18% vs 22.5, 18.7 and 17.7% correspondingly.
CoMoNi/PdPt-HY exhibited the highest molar-averaged conversions giving 27.1-
32.5% in the interval of space time studied vs 17.44-30% over CoMo/PdNiPt-HY and
22.7-27.6% over CoMoPtPd/Ni-HY (Table 7.3 and Figure 7.15).
Table 7.3 Molar-averaged conversions and conversions of sulfur compounds and phenanthrene in the HDS and HDA of heavy gas oil over CoMo/PdNiPt-HY (HDS-8), CoMoNi/PdPt-HY (HDS-10), and CoMoPtPd/Ni-HY (HDS-3) catalysts
W/FoDBT Conversion [%] Xavg(1)
Kgcath/Kmol DBT 4-MDBT 4,6-DMDBT Phenanthrene [%]
Catalyst: CoMo/PdNiPt-HY 4000 10.8 9.3 7.4 4.6 17.4 5000 17.4 15.5 13.6 10.4 24.5 6000 22.8 20.4 18.0 14.3 30.0
Catalyst: CoMoNi/PdPt-HY 4000 24.1 22.6 20.8 33.9 27.1 5000 25.8 24.4 23.0 36.8 30.1 6000 28.3 27.1 25.6 39.6 32.5
Catalyst: CoMoPtPd/Ni-HY 4000 19.0 15.5 14.6 53.0 22.8 5000 20.9 17.9 16.8 57.1 26.2 6000 22.5 18.7 17.7 58.4 27.6
(1)Molar-averaged conversion
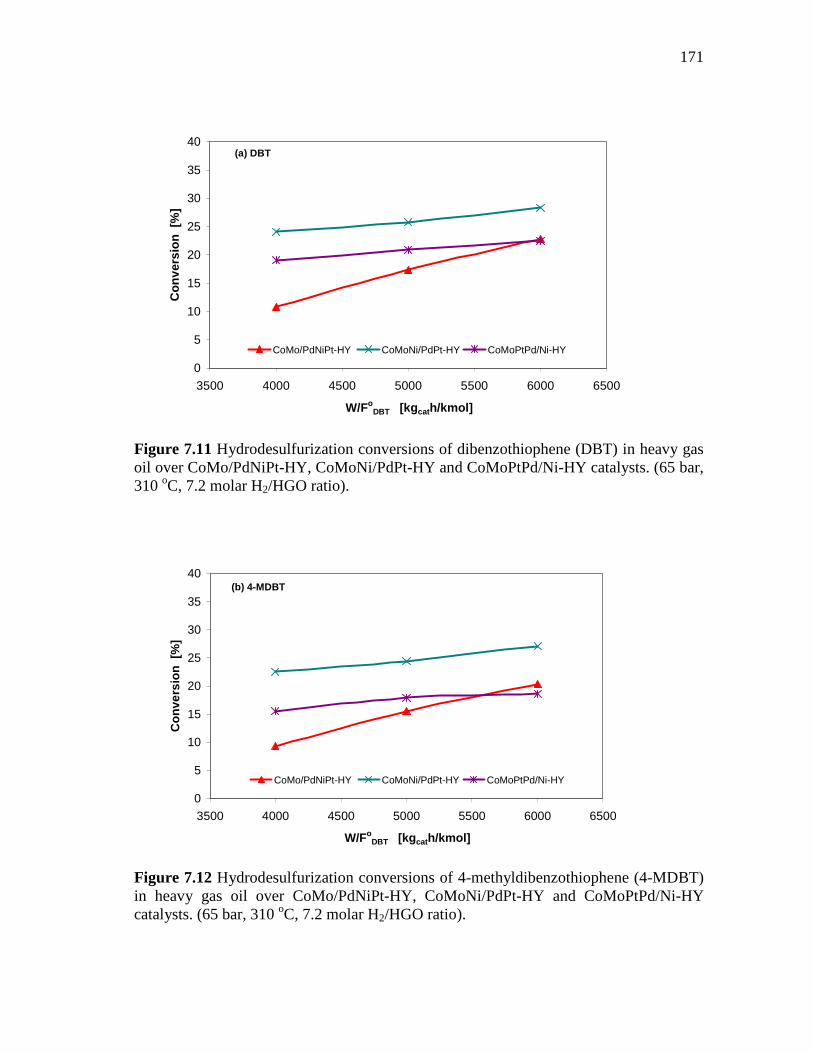
171
0
5
10
15
20
25
30
35
40
3500 4000 4500 5000 5500 6000 6500
W/FoDBT [kg cath/kmol]
Con
vers
ion
[%]
CoMo/PdNiPt-HY CoMoNi/PdPt-HY CoMoPtPd/Ni-HY
(a) DBT
Figure 7.11 Hydrodesulfurization conversions of dibenzothiophene (DBT) in heavy gas oil over CoMo/PdNiPt-HY, CoMoNi/PdPt-HY and CoMoPtPd/Ni-HY catalysts. (65 bar, 310 oC, 7.2 molar H2/HGO ratio).
0
5
10
15
20
25
30
35
40
3500 4000 4500 5000 5500 6000 6500
W/FoDBT [kg cath/kmol]
Con
vers
ion
[%]
CoMo/PdNiPt-HY CoMoNi/PdPt-HY CoMoPtPd/Ni-HY
(b) 4-MDBT
Figure 7.12 Hydrodesulfurization conversions of 4-methyldibenzothiophene (4-MDBT) in heavy gas oil over CoMo/PdNiPt-HY, CoMoNi/PdPt-HY and CoMoPtPd/Ni-HY catalysts. (65 bar, 310 oC, 7.2 molar H2/HGO ratio).
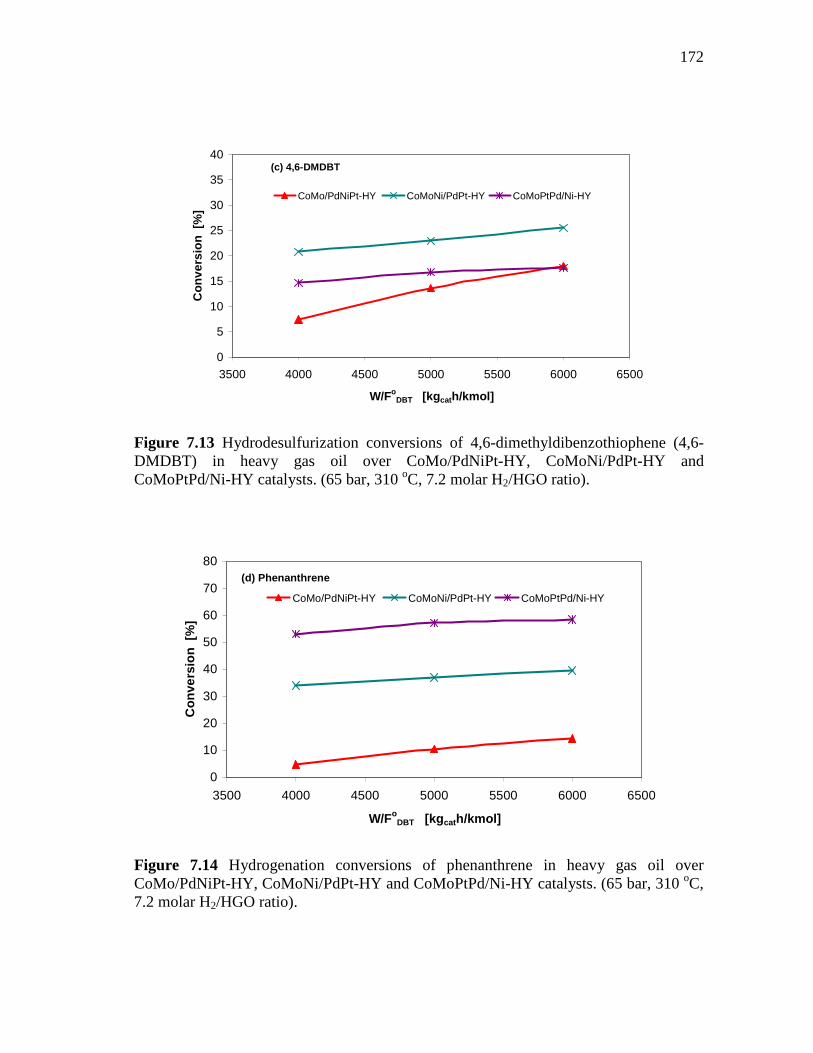
172
0
5
10
15
20
25
30
35
40
3500 4000 4500 5000 5500 6000 6500
W/FoDBT [kg cath/kmol]
Con
vers
ion
[%]
CoMo/PdNiPt-HY CoMoNi/PdPt-HY CoMoPtPd/Ni-HY
(c) 4,6-DMDBT
Figure 7.13 Hydrodesulfurization conversions of 4,6-dimethyldibenzothiophene (4,6-DMDBT) in heavy gas oil over CoMo/PdNiPt-HY, CoMoNi/PdPt-HY and CoMoPtPd/Ni-HY catalysts. (65 bar, 310 oC, 7.2 molar H2/HGO ratio).
0
10
20
30
40
50
60
70
80
3500 4000 4500 5000 5500 6000 6500
W/FoDBT [kg cath/kmol]
Con
vers
ion
[%]
CoMo/PdNiPt-HY CoMoNi/PdPt-HY CoMoPtPd/Ni-HY
(d) Phenanthrene
Figure 7.14 Hydrogenation conversions of phenanthrene in heavy gas oil over CoMo/PdNiPt-HY, CoMoNi/PdPt-HY and CoMoPtPd/Ni-HY catalysts. (65 bar, 310 oC, 7.2 molar H2/HGO ratio).
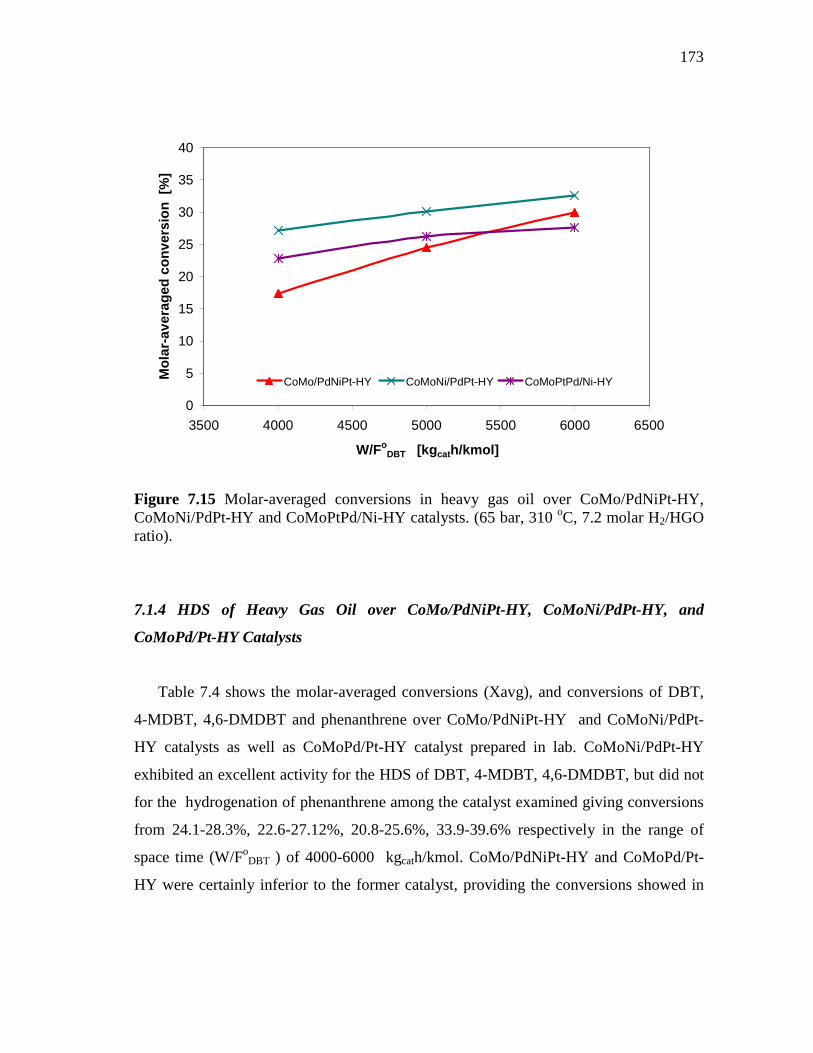
173
0
5
10
15
20
25
30
35
40
3500 4000 4500 5000 5500 6000 6500
W/FoDBT [kg cath/kmol]
Mol
ar-a
vera
ged
conv
ersi
on [
%]
CoMo/PdNiPt-HY CoMoNi/PdPt-HY CoMoPtPd/Ni-HY
Figure 7.15 Molar-averaged conversions in heavy gas oil over CoMo/PdNiPt-HY, CoMoNi/PdPt-HY and CoMoPtPd/Ni-HY catalysts. (65 bar, 310 oC, 7.2 molar H2/HGO ratio).
7.1.4 HDS of Heavy Gas Oil over CoMo/PdNiPt-HY, CoMoNi/PdPt-HY, and
CoMoPd/Pt-HY Catalysts
Table 7.4 shows the molar-averaged conversions (Xavg), and conversions of DBT,
4-MDBT, 4,6-DMDBT and phenanthrene over CoMo/PdNiPt-HY and CoMoNi/PdPt-
HY catalysts as well as CoMoPd/Pt-HY catalyst prepared in lab. CoMoNi/PdPt-HY
exhibited an excellent activity for the HDS of DBT, 4-MDBT, 4,6-DMDBT, but did not
for the hydrogenation of phenanthrene among the catalyst examined giving conversions
from 24.1-28.3%, 22.6-27.12%, 20.8-25.6%, 33.9-39.6% respectively in the range of
space time (W/FoDBT ) of 4000-6000 kgcath/kmol. CoMo/PdNiPt-HY and CoMoPd/Pt-
HY were certainly inferior to the former catalyst, providing the conversions showed in
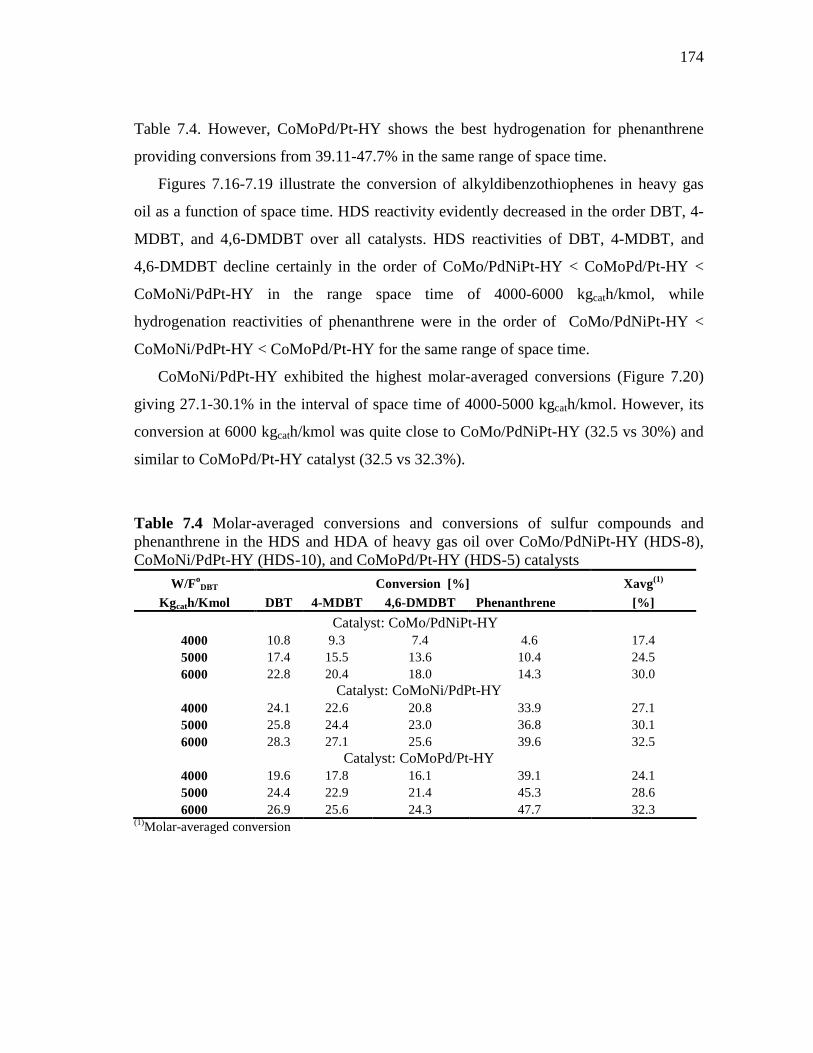
174
Table 7.4. However, CoMoPd/Pt-HY shows the best hydrogenation for phenanthrene
providing conversions from 39.11-47.7% in the same range of space time.
Figures 7.16-7.19 illustrate the conversion of alkyldibenzothiophenes in heavy gas
oil as a function of space time. HDS reactivity evidently decreased in the order DBT, 4-
MDBT, and 4,6-DMDBT over all catalysts. HDS reactivities of DBT, 4-MDBT, and
4,6-DMDBT decline certainly in the order of CoMo/PdNiPt-HY < CoMoPd/Pt-HY <
CoMoNi/PdPt-HY in the range space time of 4000-6000 kgcath/kmol, while
hydrogenation reactivities of phenanthrene were in the order of CoMo/PdNiPt-HY <
CoMoNi/PdPt-HY < CoMoPd/Pt-HY for the same range of space time.
CoMoNi/PdPt-HY exhibited the highest molar-averaged conversions (Figure 7.20)
giving 27.1-30.1% in the interval of space time of 4000-5000 kgcath/kmol. However, its
conversion at 6000 kgcath/kmol was quite close to CoMo/PdNiPt-HY (32.5 vs 30%) and
similar to CoMoPd/Pt-HY catalyst (32.5 vs 32.3%).
Table 7.4 Molar-averaged conversions and conversions of sulfur compounds and phenanthrene in the HDS and HDA of heavy gas oil over CoMo/PdNiPt-HY (HDS-8), CoMoNi/PdPt-HY (HDS-10), and CoMoPd/Pt-HY (HDS-5) catalysts
W/FoDBT Conversion [%] Xavg(1)
Kgcath/Kmol DBT 4-MDBT 4,6-DMDBT Phenanthrene [%]
Catalyst: CoMo/PdNiPt-HY 4000 10.8 9.3 7.4 4.6 17.4 5000 17.4 15.5 13.6 10.4 24.5 6000 22.8 20.4 18.0 14.3 30.0
Catalyst: CoMoNi/PdPt-HY 4000 24.1 22.6 20.8 33.9 27.1 5000 25.8 24.4 23.0 36.8 30.1 6000 28.3 27.1 25.6 39.6 32.5
Catalyst: CoMoPd/Pt-HY 4000 19.6 17.8 16.1 39.1 24.1 5000 24.4 22.9 21.4 45.3 28.6 6000 26.9 25.6 24.3 47.7 32.3
(1)Molar-averaged conversion
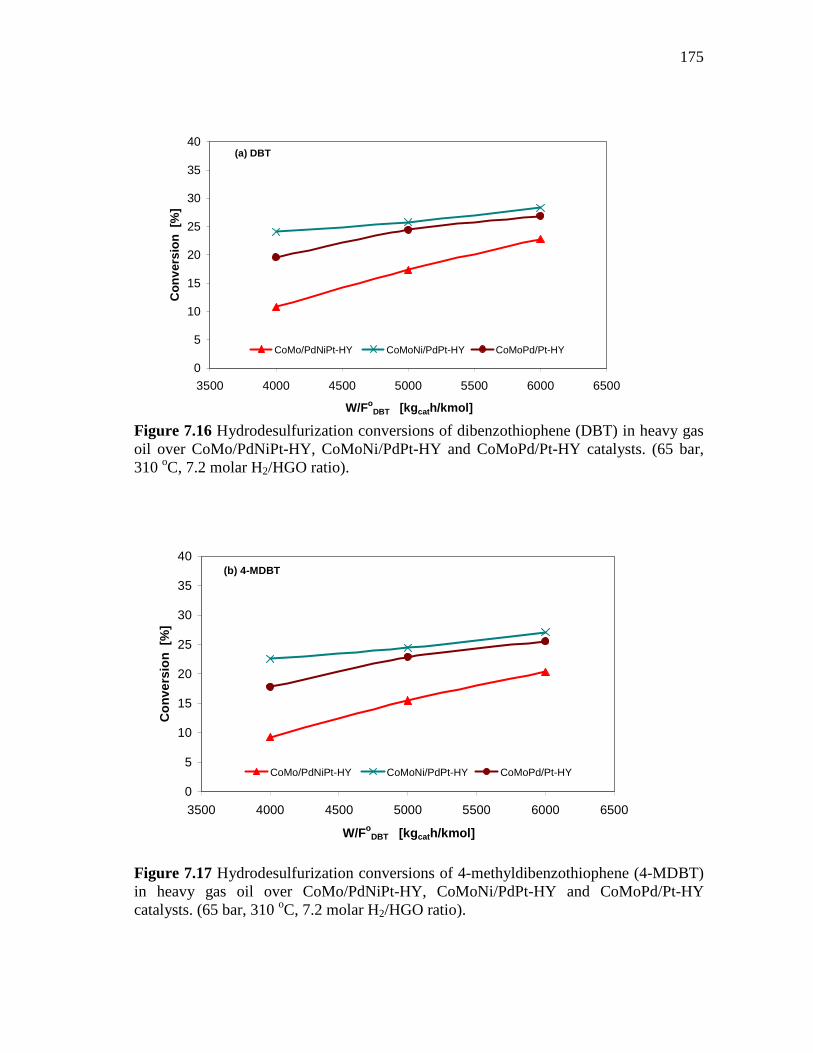
175
0
5
10
15
20
25
30
35
40
3500 4000 4500 5000 5500 6000 6500
W/FoDBT [kg cath/kmol]
Con
vers
ion
[%]
CoMo/PdNiPt-HY CoMoNi/PdPt-HY CoMoPd/Pt-HY
(a) DBT
Figure 7.16 Hydrodesulfurization conversions of dibenzothiophene (DBT) in heavy gas oil over CoMo/PdNiPt-HY, CoMoNi/PdPt-HY and CoMoPd/Pt-HY catalysts. (65 bar, 310 oC, 7.2 molar H2/HGO ratio).
0
5
10
15
20
25
30
35
40
3500 4000 4500 5000 5500 6000 6500
W/FoDBT [kg cath/kmol]
Con
vers
ion
[%]
CoMo/PdNiPt-HY CoMoNi/PdPt-HY CoMoPd/Pt-HY
(b) 4-MDBT
Figure 7.17 Hydrodesulfurization conversions of 4-methyldibenzothiophene (4-MDBT) in heavy gas oil over CoMo/PdNiPt-HY, CoMoNi/PdPt-HY and CoMoPd/Pt-HY catalysts. (65 bar, 310 oC, 7.2 molar H2/HGO ratio).
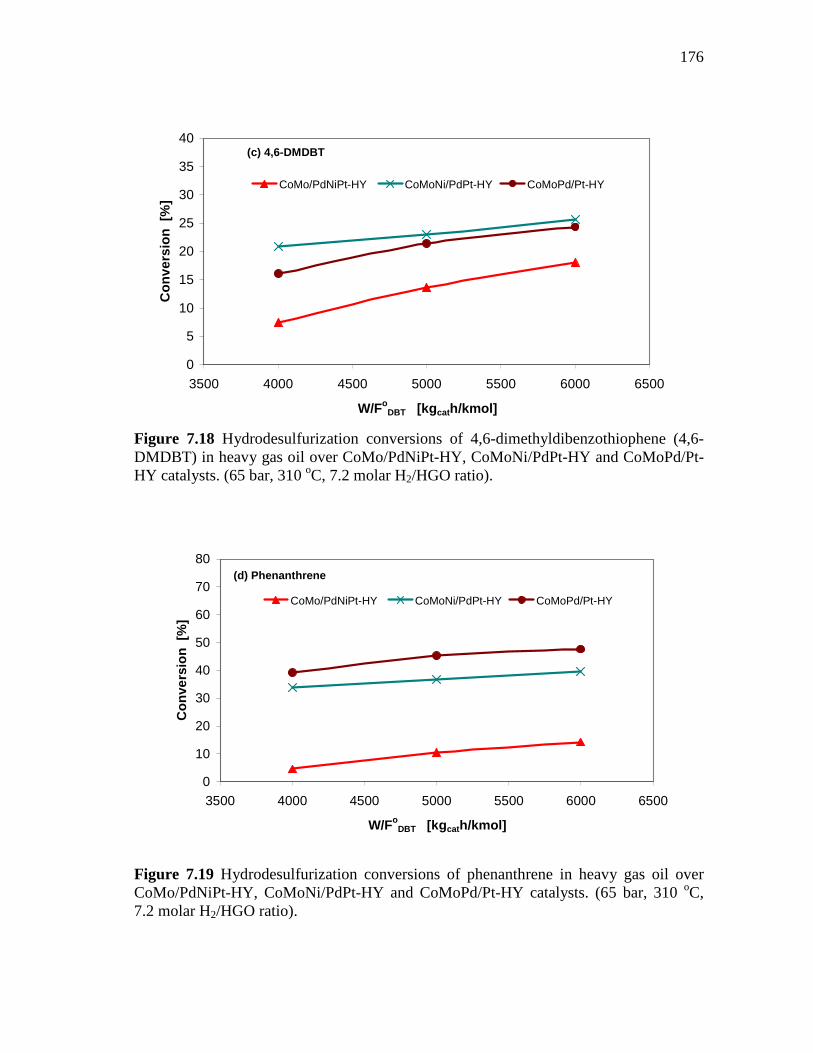
176
0
5
10
15
20
25
30
35
40
3500 4000 4500 5000 5500 6000 6500
W/FoDBT [kg cath/kmol]
Con
vers
ion
[%]
CoMo/PdNiPt-HY CoMoNi/PdPt-HY CoMoPd/Pt-HY
(c) 4,6-DMDBT
Figure 7.18 Hydrodesulfurization conversions of 4,6-dimethyldibenzothiophene (4,6-DMDBT) in heavy gas oil over CoMo/PdNiPt-HY, CoMoNi/PdPt-HY and CoMoPd/Pt-HY catalysts. (65 bar, 310 oC, 7.2 molar H2/HGO ratio).
0
10
20
30
40
50
60
70
80
3500 4000 4500 5000 5500 6000 6500
W/FoDBT [kg cath/kmol]
Con
vers
ion
[%]
CoMo/PdNiPt-HY CoMoNi/PdPt-HY CoMoPd/Pt-HY
(d) Phenanthrene
Figure 7.19 Hydrodesulfurization conversions of phenanthrene in heavy gas oil over CoMo/PdNiPt-HY, CoMoNi/PdPt-HY and CoMoPd/Pt-HY catalysts. (65 bar, 310 oC, 7.2 molar H2/HGO ratio).
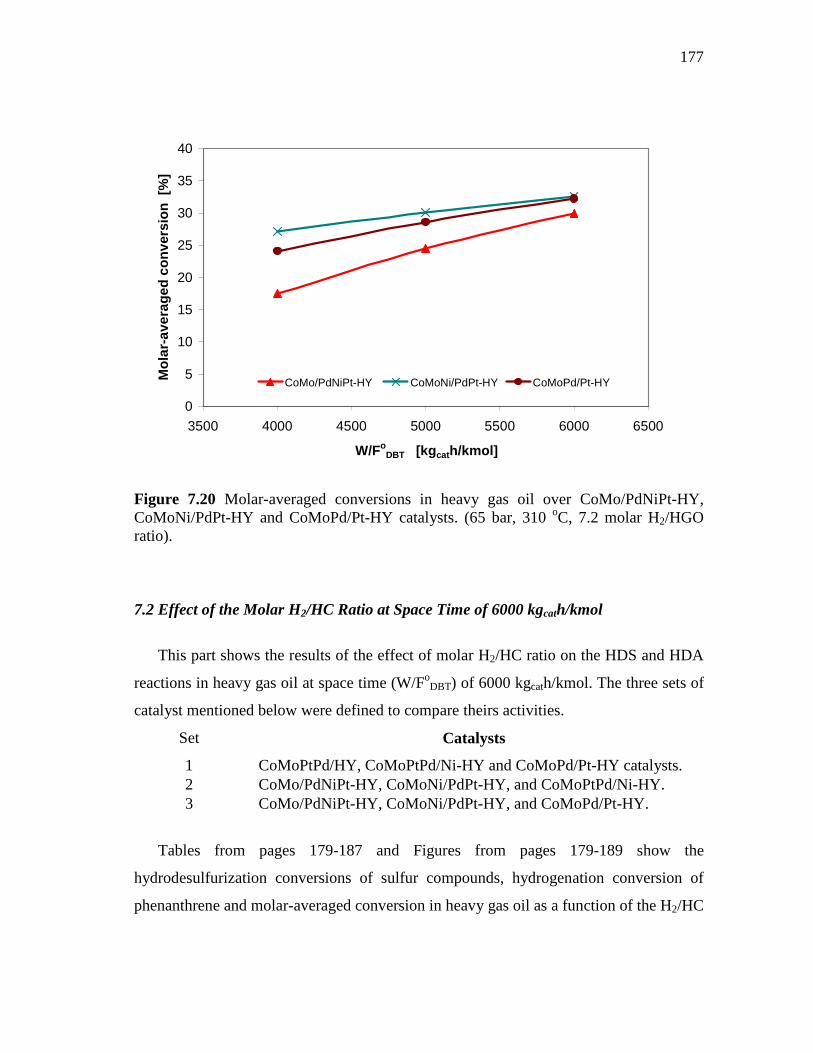
177
0
5
10
15
20
25
30
35
40
3500 4000 4500 5000 5500 6000 6500
W/FoDBT [kg cath/kmol]
Mol
ar-a
vera
ged
conv
ersi
on [
%]
CoMo/PdNiPt-HY CoMoNi/PdPt-HY CoMoPd/Pt-HY
Figure 7.20 Molar-averaged conversions in heavy gas oil over CoMo/PdNiPt-HY, CoMoNi/PdPt-HY and CoMoPd/Pt-HY catalysts. (65 bar, 310 oC, 7.2 molar H2/HGO ratio). 7.2 Effect of the Molar H2/HC Ratio at Space Time of 6000 kgcath/kmol
This part shows the results of the effect of molar H2/HC ratio on the HDS and HDA
reactions in heavy gas oil at space time (W/FoDBT) of 6000 kgcath/kmol. The three sets of
catalyst mentioned below were defined to compare theirs activities.
Set Catalysts
1 CoMoPtPd/HY, CoMoPtPd/Ni-HY and CoMoPd/Pt-HY catalysts. 2 CoMo/PdNiPt-HY, CoMoNi/PdPt-HY, and CoMoPtPd/Ni-HY. 3 CoMo/PdNiPt-HY, CoMoNi/PdPt-HY, and CoMoPd/Pt-HY.
Tables from pages 179-187 and Figures from pages 179-189 show the
hydrodesulfurization conversions of sulfur compounds, hydrogenation conversion of
phenanthrene and molar-averaged conversion in heavy gas oil as a function of the H2/HC
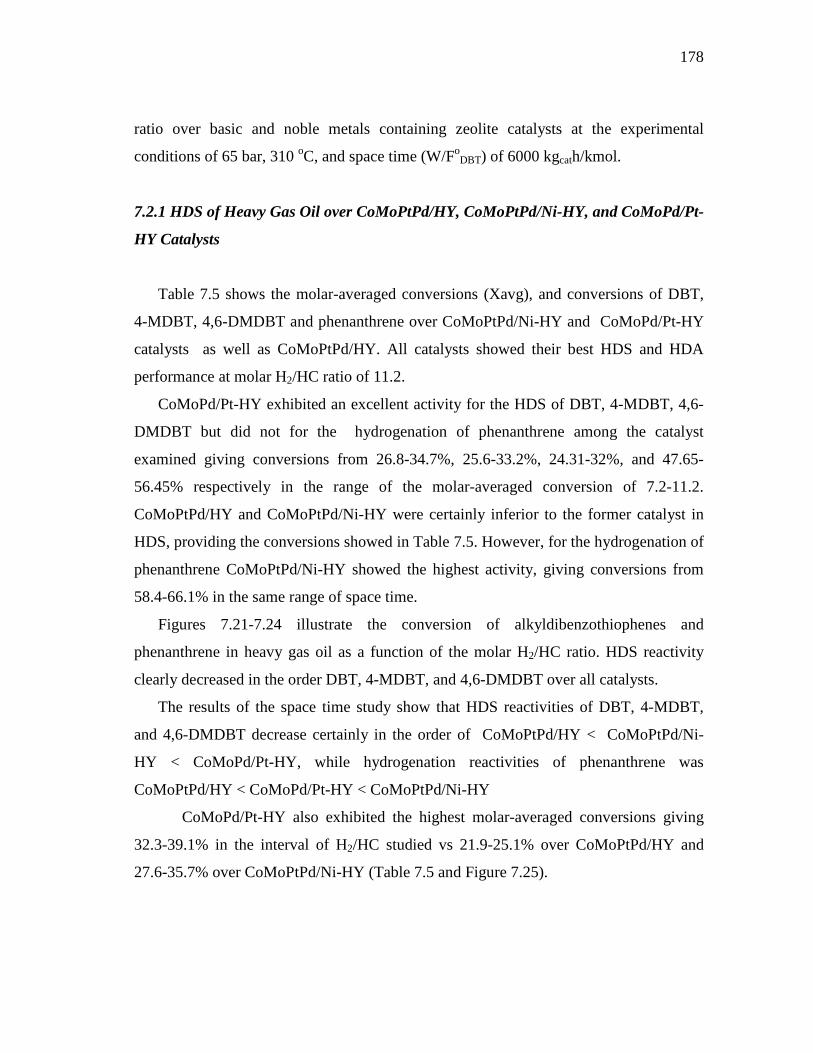
178
ratio over basic and noble metals containing zeolite catalysts at the experimental
conditions of 65 bar, 310 oC, and space time (W/FoDBT) of 6000 kgcath/kmol.
7.2.1 HDS of Heavy Gas Oil over CoMoPtPd/HY, CoMoPtPd/Ni-HY, and CoMoPd/Pt-
HY Catalysts
Table 7.5 shows the molar-averaged conversions (Xavg), and conversions of DBT,
4-MDBT, 4,6-DMDBT and phenanthrene over CoMoPtPd/Ni-HY and CoMoPd/Pt-HY
catalysts as well as CoMoPtPd/HY. All catalysts showed their best HDS and HDA
performance at molar H2/HC ratio of 11.2.
CoMoPd/Pt-HY exhibited an excellent activity for the HDS of DBT, 4-MDBT, 4,6-
DMDBT but did not for the hydrogenation of phenanthrene among the catalyst
examined giving conversions from 26.8-34.7%, 25.6-33.2%, 24.31-32%, and 47.65-
56.45% respectively in the range of the molar-averaged conversion of 7.2-11.2.
CoMoPtPd/HY and CoMoPtPd/Ni-HY were certainly inferior to the former catalyst in
HDS, providing the conversions showed in Table 7.5. However, for the hydrogenation of
phenanthrene CoMoPtPd/Ni-HY showed the highest activity, giving conversions from
58.4-66.1% in the same range of space time.
Figures 7.21-7.24 illustrate the conversion of alkyldibenzothiophenes and
phenanthrene in heavy gas oil as a function of the molar H2/HC ratio. HDS reactivity
clearly decreased in the order DBT, 4-MDBT, and 4,6-DMDBT over all catalysts.
The results of the space time study show that HDS reactivities of DBT, 4-MDBT,
and 4,6-DMDBT decrease certainly in the order of CoMoPtPd/HY < CoMoPtPd/Ni-
HY < CoMoPd/Pt-HY, while hydrogenation reactivities of phenanthrene was
CoMoPtPd/HY < CoMoPd/Pt-HY < CoMoPtPd/Ni-HY
CoMoPd/Pt-HY also exhibited the highest molar-averaged conversions giving
32.3-39.1% in the interval of H2/HC studied vs 21.9-25.1% over CoMoPtPd/HY and
27.6-35.7% over CoMoPtPd/Ni-HY (Table 7.5 and Figure 7.25).
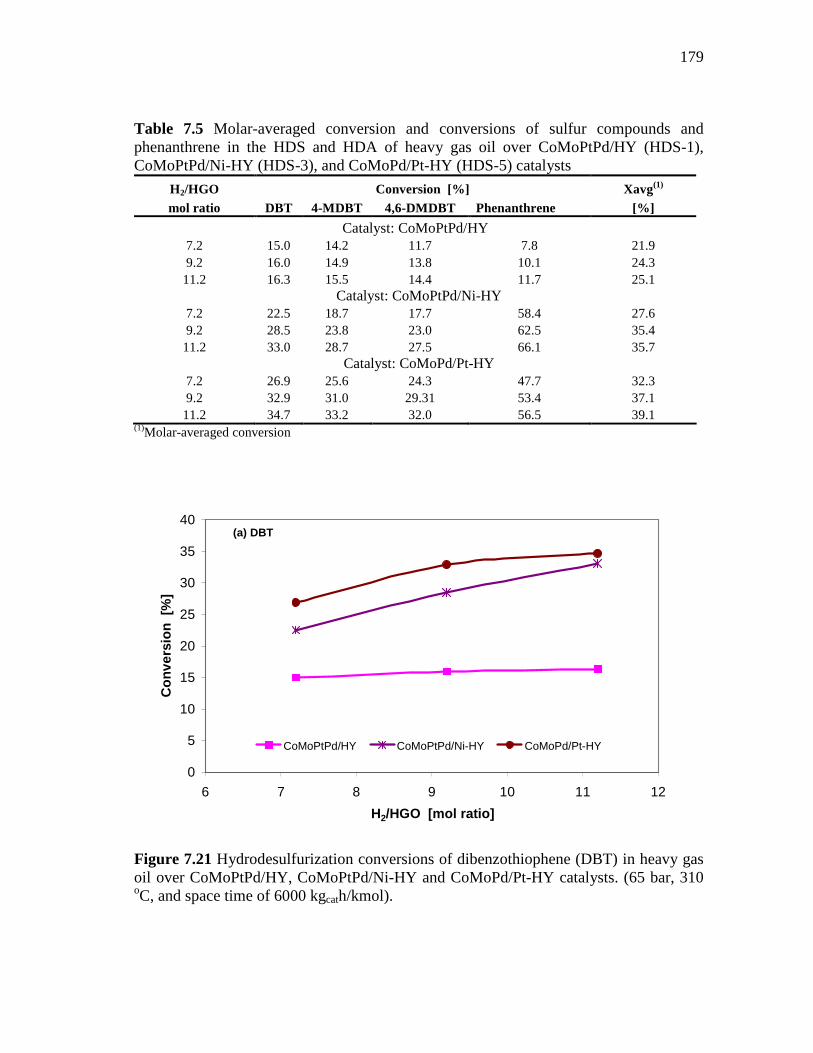
179
Table 7.5 Molar-averaged conversion and conversions of sulfur compounds and phenanthrene in the HDS and HDA of heavy gas oil over CoMoPtPd/HY (HDS-1), CoMoPtPd/Ni-HY (HDS-3), and CoMoPd/Pt-HY (HDS-5) catalysts
H2/HGO Conversion [%] Xavg(1) mol ratio DBT 4-MDBT 4,6-DMDBT Phenanthrene [%]
Catalyst: CoMoPtPd/HY 7.2 15.0 14.2 11.7 7.8 21.9 9.2 16.0 14.9 13.8 10.1 24.3 11.2 16.3 15.5 14.4 11.7 25.1
Catalyst: CoMoPtPd/Ni-HY 7.2 22.5 18.7 17.7 58.4 27.6 9.2 28.5 23.8 23.0 62.5 35.4 11.2 33.0 28.7 27.5 66.1 35.7
Catalyst: CoMoPd/Pt-HY 7.2 26.9 25.6 24.3 47.7 32.3 9.2 32.9 31.0 29.31 53.4 37.1 11.2 34.7 33.2 32.0 56.5 39.1
(1)Molar-averaged conversion
0
5
10
15
20
25
30
35
40
6 7 8 9 10 11 12
H2/HGO [mol ratio]
Con
vers
ion
[%]
CoMoPtPd/HY CoMoPtPd/Ni-HY CoMoPd/Pt-HY
(a) DBT
Figure 7.21 Hydrodesulfurization conversions of dibenzothiophene (DBT) in heavy gas oil over CoMoPtPd/HY, CoMoPtPd/Ni-HY and CoMoPd/Pt-HY catalysts. (65 bar, 310 oC, and space time of 6000 kgcath/kmol).
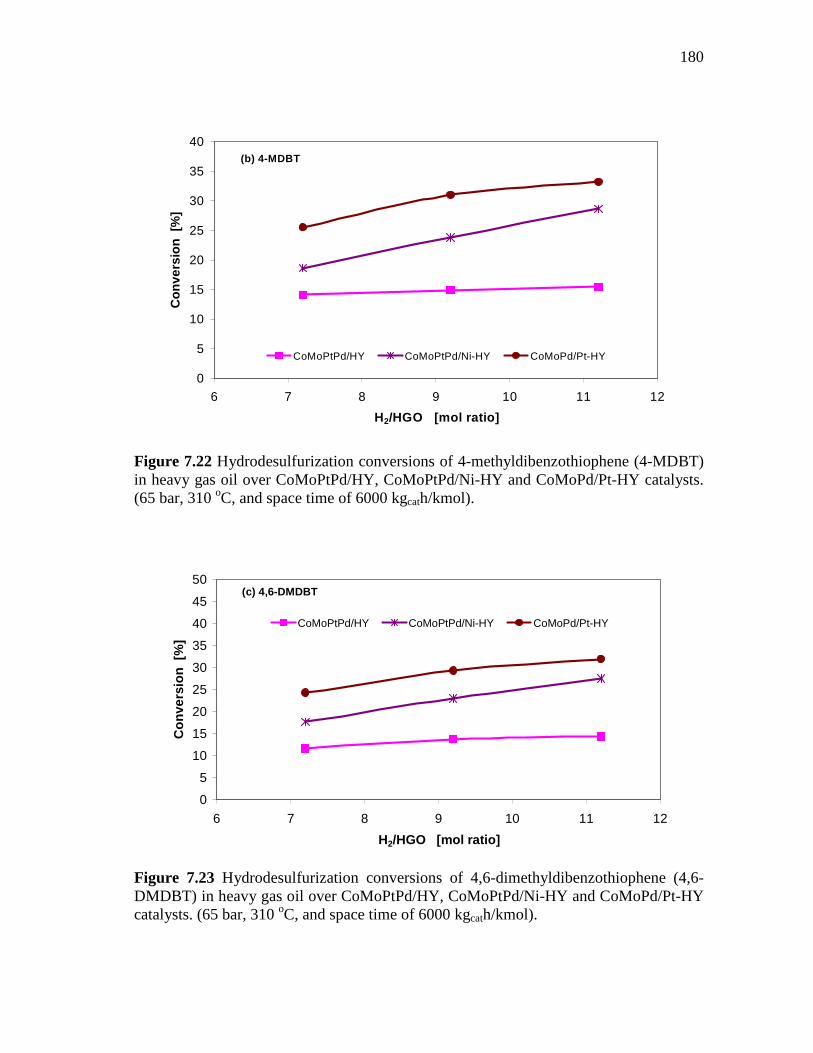
180
0
5
10
15
20
25
30
35
40
6 7 8 9 10 11 12
H2/HGO [mol ratio]
Con
vers
ion
[%]
CoMoPtPd/HY CoMoPtPd/Ni-HY CoMoPd/Pt-HY
(b) 4-MDBT
Figure 7.22 Hydrodesulfurization conversions of 4-methyldibenzothiophene (4-MDBT) in heavy gas oil over CoMoPtPd/HY, CoMoPtPd/Ni-HY and CoMoPd/Pt-HY catalysts. (65 bar, 310 oC, and space time of 6000 kgcath/kmol).
0
5
10
15
20
25
30
35
40
45
50
6 7 8 9 10 11 12
H2/HGO [mol ratio]
Con
vers
ion
[%]
CoMoPtPd/HY CoMoPtPd/Ni-HY CoMoPd/Pt-HY
(c) 4,6-DMDBT
Figure 7.23 Hydrodesulfurization conversions of 4,6-dimethyldibenzothiophene (4,6-DMDBT) in heavy gas oil over CoMoPtPd/HY, CoMoPtPd/Ni-HY and CoMoPd/Pt-HY catalysts. (65 bar, 310 oC, and space time of 6000 kgcath/kmol).
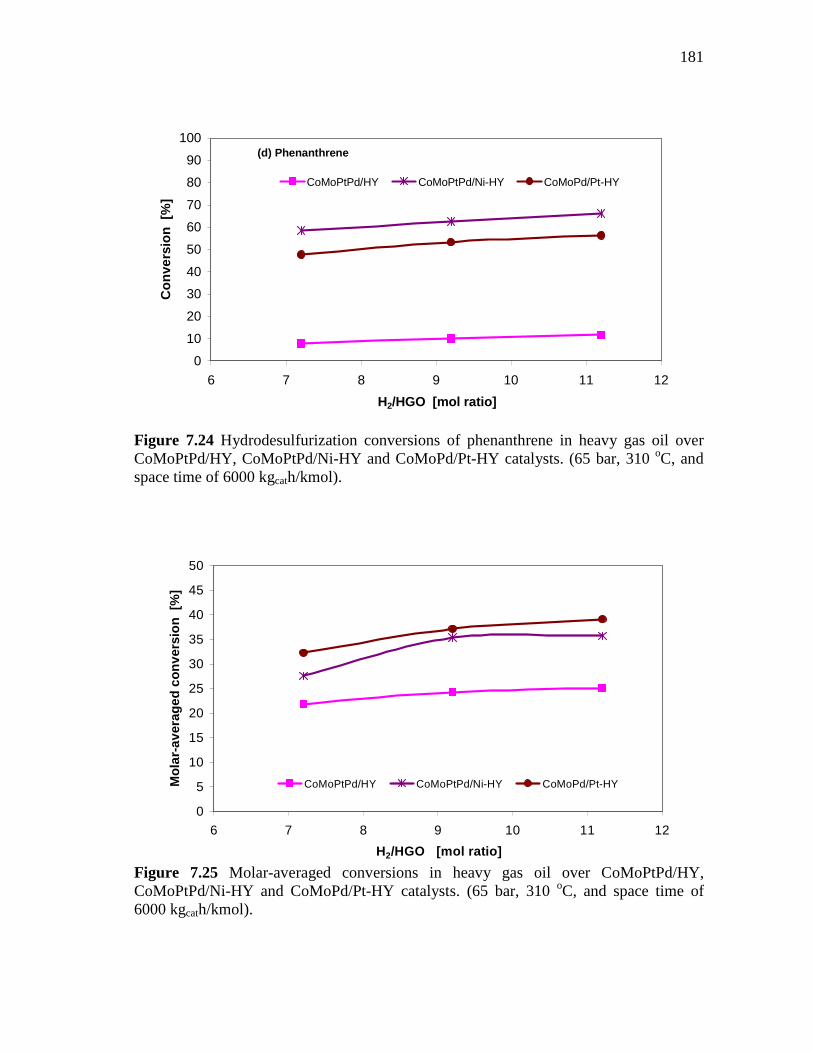
181
0
10
20
30
40
50
60
70
80
90
100
6 7 8 9 10 11 12
H2/HGO [mol ratio]
Con
vers
ion
[%]
CoMoPtPd/HY CoMoPtPd/Ni-HY CoMoPd/Pt-HY
(d) Phenanthrene
Figure 7.24 Hydrodesulfurization conversions of phenanthrene in heavy gas oil over CoMoPtPd/HY, CoMoPtPd/Ni-HY and CoMoPd/Pt-HY catalysts. (65 bar, 310 oC, and space time of 6000 kgcath/kmol).
0
5
10
15
20
25
30
35
40
45
50
6 7 8 9 10 11 12
H2/HGO [mol ratio]
Mol
ar-a
vera
ged
conv
ersi
on [
%]
CoMoPtPd/HY CoMoPtPd/Ni-HY CoMoPd/Pt-HY
Figure 7.25 Molar-averaged conversions in heavy gas oil over CoMoPtPd/HY, CoMoPtPd/Ni-HY and CoMoPd/Pt-HY catalysts. (65 bar, 310 oC, and space time of 6000 kgcath/kmol).
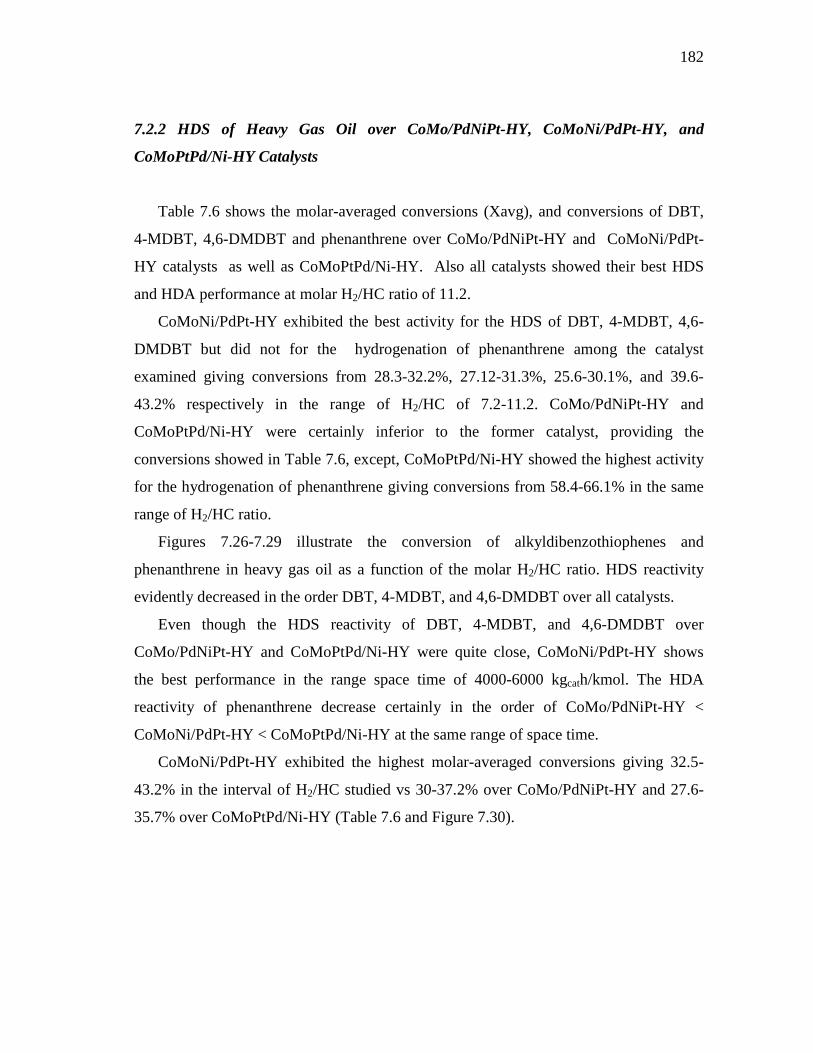
182
7.2.2 HDS of Heavy Gas Oil over CoMo/PdNiPt-HY, CoMoNi/PdPt-HY, and
CoMoPtPd/Ni-HY Catalysts
Table 7.6 shows the molar-averaged conversions (Xavg), and conversions of DBT,
4-MDBT, 4,6-DMDBT and phenanthrene over CoMo/PdNiPt-HY and CoMoNi/PdPt-
HY catalysts as well as CoMoPtPd/Ni-HY. Also all catalysts showed their best HDS
and HDA performance at molar H2/HC ratio of 11.2.
CoMoNi/PdPt-HY exhibited the best activity for the HDS of DBT, 4-MDBT, 4,6-
DMDBT but did not for the hydrogenation of phenanthrene among the catalyst
examined giving conversions from 28.3-32.2%, 27.12-31.3%, 25.6-30.1%, and 39.6-
43.2% respectively in the range of H2/HC of 7.2-11.2. CoMo/PdNiPt-HY and
CoMoPtPd/Ni-HY were certainly inferior to the former catalyst, providing the
conversions showed in Table 7.6, except, CoMoPtPd/Ni-HY showed the highest activity
for the hydrogenation of phenanthrene giving conversions from 58.4-66.1% in the same
range of H2/HC ratio.
Figures 7.26-7.29 illustrate the conversion of alkyldibenzothiophenes and
phenanthrene in heavy gas oil as a function of the molar H2/HC ratio. HDS reactivity
evidently decreased in the order DBT, 4-MDBT, and 4,6-DMDBT over all catalysts.
Even though the HDS reactivity of DBT, 4-MDBT, and 4,6-DMDBT over
CoMo/PdNiPt-HY and CoMoPtPd/Ni-HY were quite close, CoMoNi/PdPt-HY shows
the best performance in the range space time of 4000-6000 kgcath/kmol. The HDA
reactivity of phenanthrene decrease certainly in the order of CoMo/PdNiPt-HY <
CoMoNi/PdPt-HY < CoMoPtPd/Ni-HY at the same range of space time.
CoMoNi/PdPt-HY exhibited the highest molar-averaged conversions giving 32.5-
43.2% in the interval of H2/HC studied vs 30-37.2% over CoMo/PdNiPt-HY and 27.6-
35.7% over CoMoPtPd/Ni-HY (Table 7.6 and Figure 7.30).
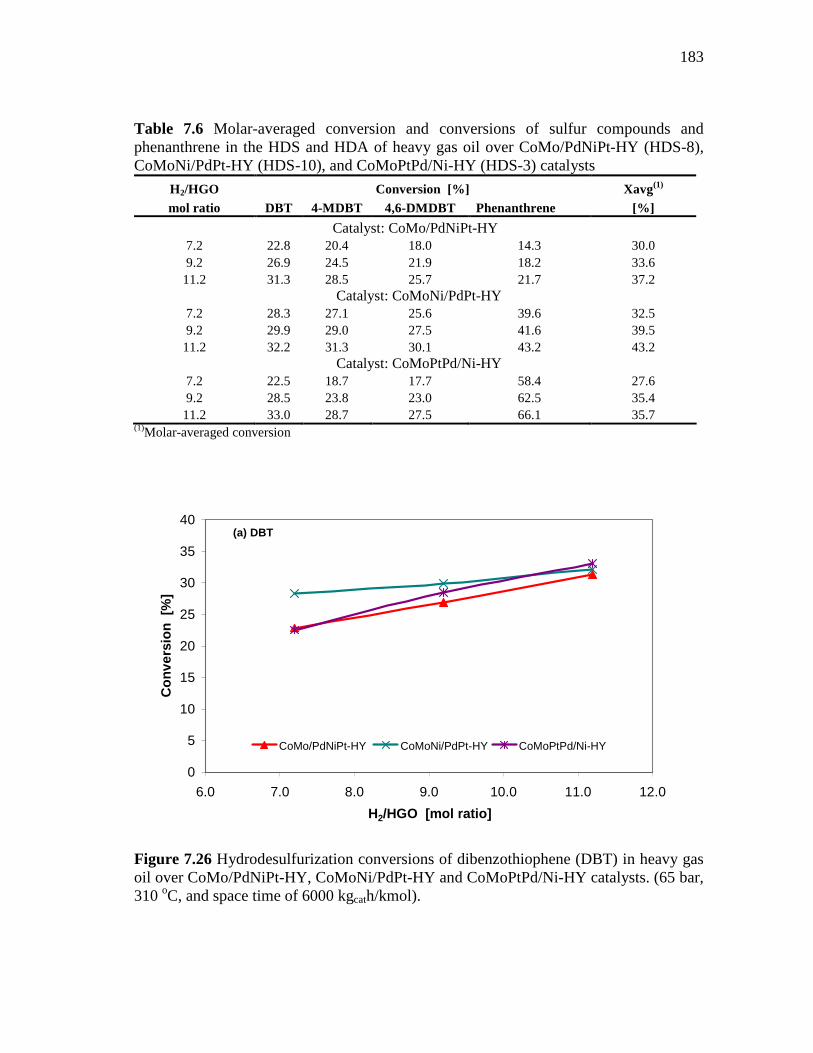
183
Table 7.6 Molar-averaged conversion and conversions of sulfur compounds and phenanthrene in the HDS and HDA of heavy gas oil over CoMo/PdNiPt-HY (HDS-8), CoMoNi/PdPt-HY (HDS-10), and CoMoPtPd/Ni-HY (HDS-3) catalysts
H2/HGO Conversion [%] Xavg(1) mol ratio DBT 4-MDBT 4,6-DMDBT Phenanthrene [%]
Catalyst: CoMo/PdNiPt-HY 7.2 22.8 20.4 18.0 14.3 30.0 9.2 26.9 24.5 21.9 18.2 33.6 11.2 31.3 28.5 25.7 21.7 37.2
Catalyst: CoMoNi/PdPt-HY 7.2 28.3 27.1 25.6 39.6 32.5 9.2 29.9 29.0 27.5 41.6 39.5 11.2 32.2 31.3 30.1 43.2 43.2
Catalyst: CoMoPtPd/Ni-HY 7.2 22.5 18.7 17.7 58.4 27.6 9.2 28.5 23.8 23.0 62.5 35.4 11.2 33.0 28.7 27.5 66.1 35.7
(1)Molar-averaged conversion
0
5
10
15
20
25
30
35
40
6.0 7.0 8.0 9.0 10.0 11.0 12.0
H2/HGO [mol ratio]
Con
vers
ion
[%]
CoMo/PdNiPt-HY CoMoNi/PdPt-HY CoMoPtPd/Ni-HY
(a) DBT
Figure 7.26 Hydrodesulfurization conversions of dibenzothiophene (DBT) in heavy gas oil over CoMo/PdNiPt-HY, CoMoNi/PdPt-HY and CoMoPtPd/Ni-HY catalysts. (65 bar, 310 oC, and space time of 6000 kgcath/kmol).
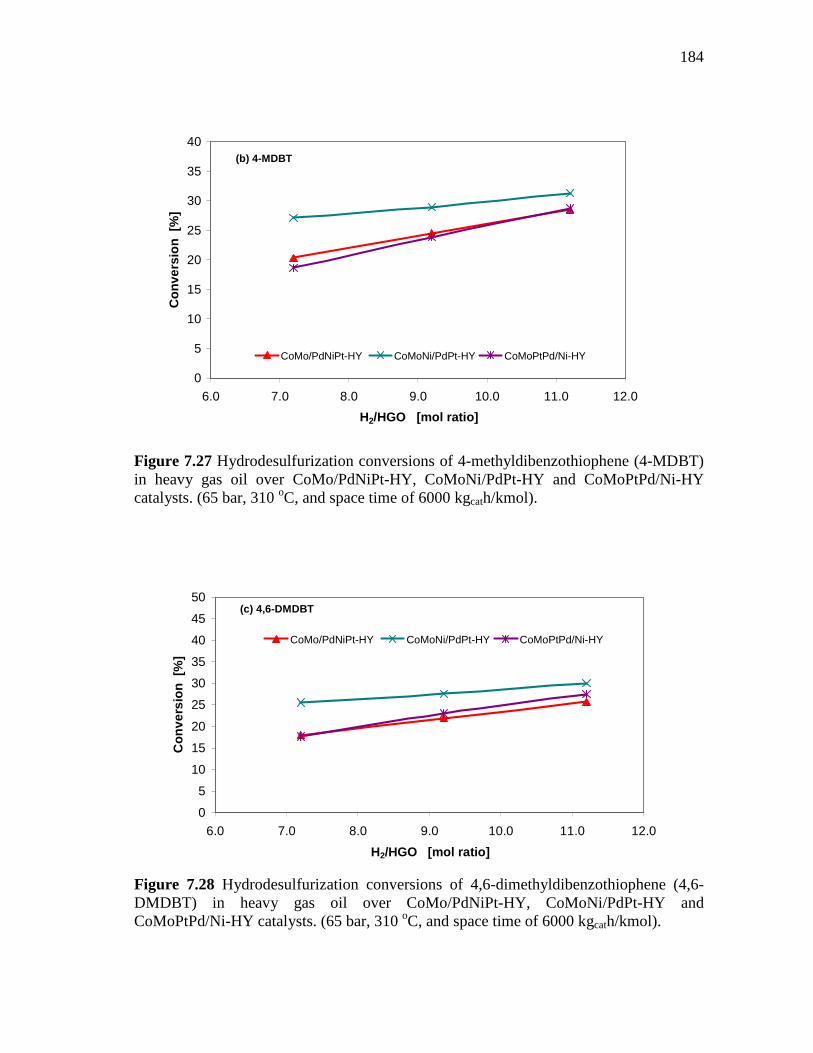
184
0
5
10
15
20
25
30
35
40
6.0 7.0 8.0 9.0 10.0 11.0 12.0
H2/HGO [mol ratio]
Con
vers
ion
[%]
CoMo/PdNiPt-HY CoMoNi/PdPt-HY CoMoPtPd/Ni-HY
(b) 4-MDBT
Figure 7.27 Hydrodesulfurization conversions of 4-methyldibenzothiophene (4-MDBT) in heavy gas oil over CoMo/PdNiPt-HY, CoMoNi/PdPt-HY and CoMoPtPd/Ni-HY catalysts. (65 bar, 310 oC, and space time of 6000 kgcath/kmol).
0
5
10
15
20
25
30
35
40
45
50
6.0 7.0 8.0 9.0 10.0 11.0 12.0
H2/HGO [mol ratio]
Con
vers
ion
[%]
CoMo/PdNiPt-HY CoMoNi/PdPt-HY CoMoPtPd/Ni-HY
(c) 4,6-DMDBT
Figure 7.28 Hydrodesulfurization conversions of 4,6-dimethyldibenzothiophene (4,6-DMDBT) in heavy gas oil over CoMo/PdNiPt-HY, CoMoNi/PdPt-HY and CoMoPtPd/Ni-HY catalysts. (65 bar, 310 oC, and space time of 6000 kgcath/kmol).
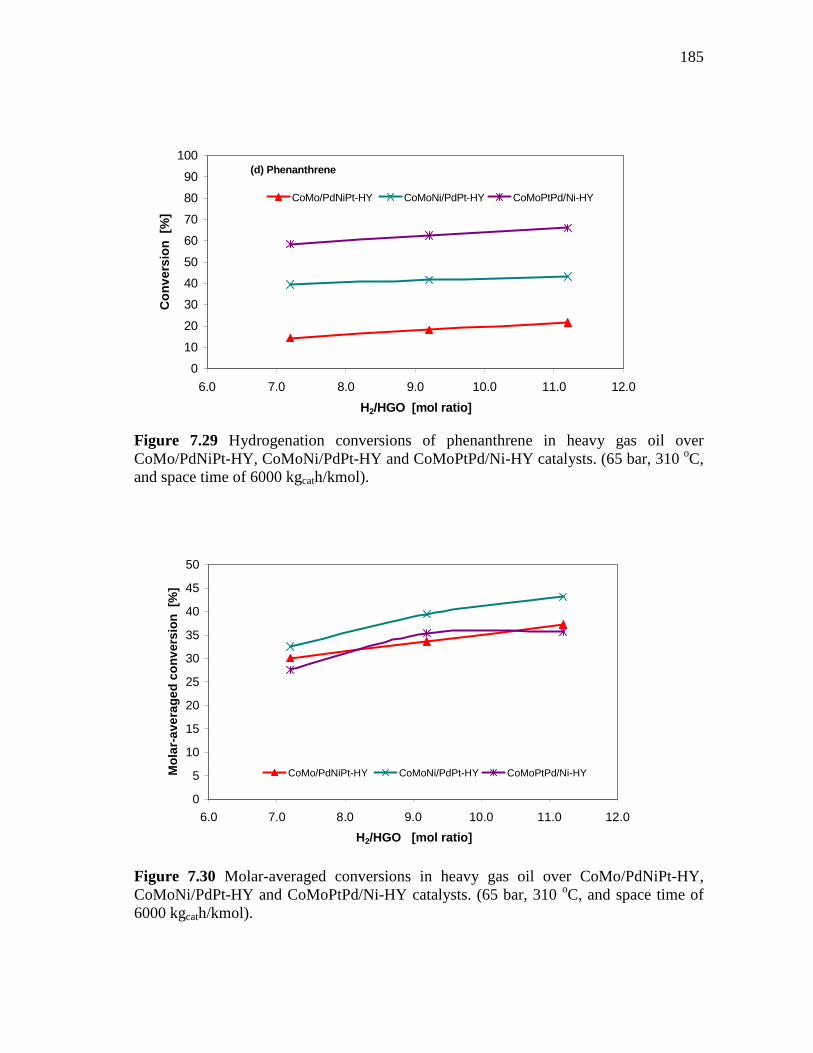
185
0
10
20
30
40
50
60
70
80
90
100
6.0 7.0 8.0 9.0 10.0 11.0 12.0
H2/HGO [mol ratio]
Con
vers
ion
[%]
CoMo/PdNiPt-HY CoMoNi/PdPt-HY CoMoPtPd/Ni-HY
(d) Phenanthrene
Figure 7.29 Hydrogenation conversions of phenanthrene in heavy gas oil over CoMo/PdNiPt-HY, CoMoNi/PdPt-HY and CoMoPtPd/Ni-HY catalysts. (65 bar, 310 oC, and space time of 6000 kgcath/kmol).
0
5
10
15
20
25
30
35
40
45
50
6.0 7.0 8.0 9.0 10.0 11.0 12.0
H2/HGO [mol ratio]
Mol
ar-a
vera
ged
conv
ersi
on [
%]
CoMo/PdNiPt-HY CoMoNi/PdPt-HY CoMoPtPd/Ni-HY
Figure 7.30 Molar-averaged conversions in heavy gas oil over CoMo/PdNiPt-HY, CoMoNi/PdPt-HY and CoMoPtPd/Ni-HY catalysts. (65 bar, 310 oC, and space time of 6000 kgcath/kmol).
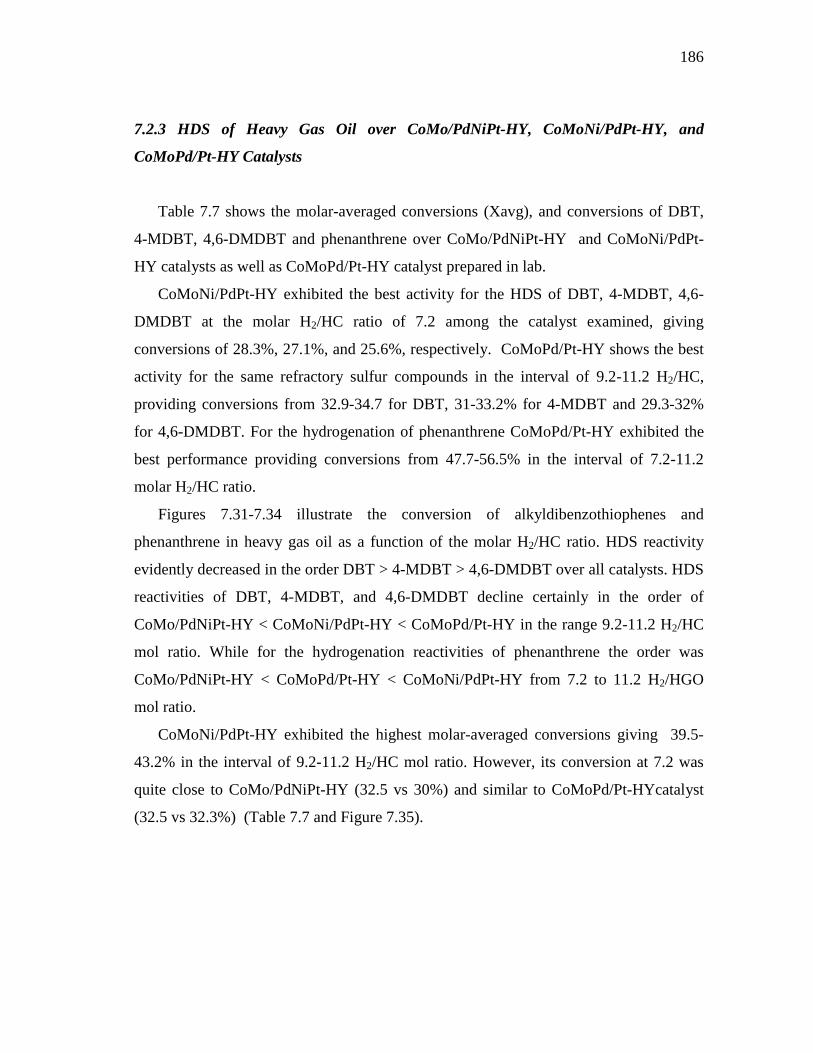
186
7.2.3 HDS of Heavy Gas Oil over CoMo/PdNiPt-HY, CoMoNi/PdPt-HY, and
CoMoPd/Pt-HY Catalysts
Table 7.7 shows the molar-averaged conversions (Xavg), and conversions of DBT,
4-MDBT, 4,6-DMDBT and phenanthrene over CoMo/PdNiPt-HY and CoMoNi/PdPt-
HY catalysts as well as CoMoPd/Pt-HY catalyst prepared in lab.
CoMoNi/PdPt-HY exhibited the best activity for the HDS of DBT, 4-MDBT, 4,6-
DMDBT at the molar H2/HC ratio of 7.2 among the catalyst examined, giving
conversions of 28.3%, 27.1%, and 25.6%, respectively. CoMoPd/Pt-HY shows the best
activity for the same refractory sulfur compounds in the interval of 9.2-11.2 H2/HC,
providing conversions from 32.9-34.7 for DBT, 31-33.2% for 4-MDBT and 29.3-32%
for 4,6-DMDBT. For the hydrogenation of phenanthrene CoMoPd/Pt-HY exhibited the
best performance providing conversions from 47.7-56.5% in the interval of 7.2-11.2
molar H2/HC ratio.
Figures 7.31-7.34 illustrate the conversion of alkyldibenzothiophenes and
phenanthrene in heavy gas oil as a function of the molar H2/HC ratio. HDS reactivity
evidently decreased in the order DBT > 4-MDBT > 4,6-DMDBT over all catalysts. HDS
reactivities of DBT, 4-MDBT, and 4,6-DMDBT decline certainly in the order of
CoMo/PdNiPt-HY < CoMoNi/PdPt-HY < CoMoPd/Pt-HY in the range 9.2-11.2 H2/HC
mol ratio. While for the hydrogenation reactivities of phenanthrene the order was
CoMo/PdNiPt-HY < CoMoPd/Pt-HY < CoMoNi/PdPt-HY from 7.2 to 11.2 H2/HGO
mol ratio.
CoMoNi/PdPt-HY exhibited the highest molar-averaged conversions giving 39.5-
43.2% in the interval of 9.2-11.2 H2/HC mol ratio. However, its conversion at 7.2 was
quite close to CoMo/PdNiPt-HY (32.5 vs 30%) and similar to CoMoPd/Pt-HYcatalyst
(32.5 vs 32.3%) (Table 7.7 and Figure 7.35).
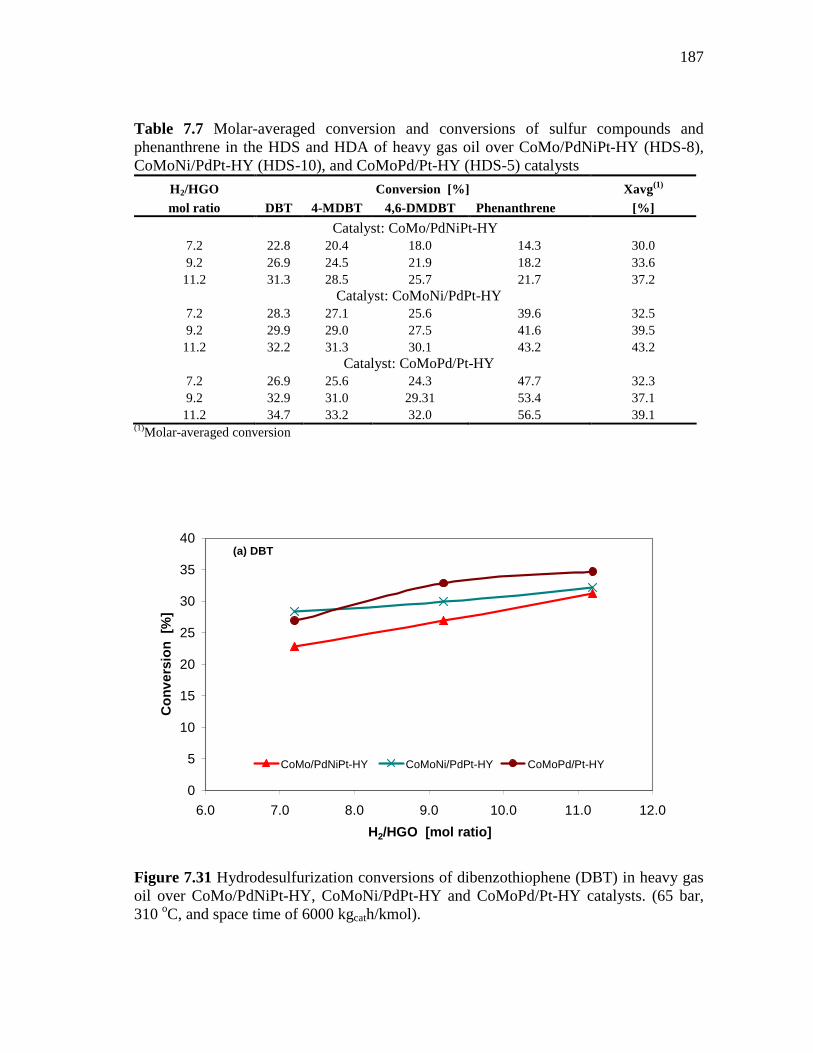
187
Table 7.7 Molar-averaged conversion and conversions of sulfur compounds and phenanthrene in the HDS and HDA of heavy gas oil over CoMo/PdNiPt-HY (HDS-8), CoMoNi/PdPt-HY (HDS-10), and CoMoPd/Pt-HY (HDS-5) catalysts
H2/HGO Conversion [%] Xavg(1) mol ratio DBT 4-MDBT 4,6-DMDBT Phenanthrene [%]
Catalyst: CoMo/PdNiPt-HY 7.2 22.8 20.4 18.0 14.3 30.0 9.2 26.9 24.5 21.9 18.2 33.6 11.2 31.3 28.5 25.7 21.7 37.2
Catalyst: CoMoNi/PdPt-HY 7.2 28.3 27.1 25.6 39.6 32.5 9.2 29.9 29.0 27.5 41.6 39.5 11.2 32.2 31.3 30.1 43.2 43.2
Catalyst: CoMoPd/Pt-HY 7.2 26.9 25.6 24.3 47.7 32.3 9.2 32.9 31.0 29.31 53.4 37.1 11.2 34.7 33.2 32.0 56.5 39.1
(1)Molar-averaged conversion
0
5
10
15
20
25
30
35
40
6.0 7.0 8.0 9.0 10.0 11.0 12.0
H2/HGO [mol ratio]
Con
vers
ion
[%]
CoMo/PdNiPt-HY CoMoNi/PdPt-HY CoMoPd/Pt-HY
(a) DBT
Figure 7.31 Hydrodesulfurization conversions of dibenzothiophene (DBT) in heavy gas oil over CoMo/PdNiPt-HY, CoMoNi/PdPt-HY and CoMoPd/Pt-HY catalysts. (65 bar, 310 oC, and space time of 6000 kgcath/kmol).
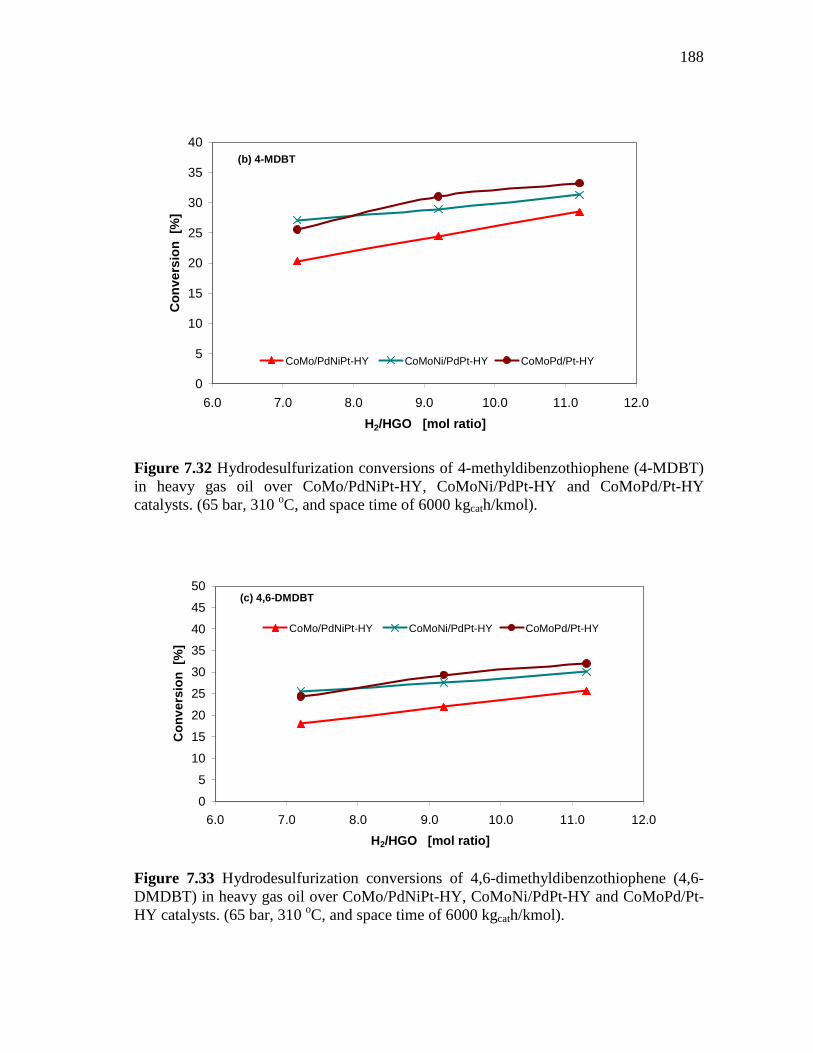
188
0
5
10
15
20
25
30
35
40
6.0 7.0 8.0 9.0 10.0 11.0 12.0
H2/HGO [mol ratio]
Con
vers
ion
[%]
CoMo/PdNiPt-HY CoMoNi/PdPt-HY CoMoPd/Pt-HY
(b) 4-MDBT
Figure 7.32 Hydrodesulfurization conversions of 4-methyldibenzothiophene (4-MDBT) in heavy gas oil over CoMo/PdNiPt-HY, CoMoNi/PdPt-HY and CoMoPd/Pt-HY catalysts. (65 bar, 310 oC, and space time of 6000 kgcath/kmol).
0
5
10
15
20
25
30
35
40
45
50
6.0 7.0 8.0 9.0 10.0 11.0 12.0
H2/HGO [mol ratio]
Con
vers
ion
[%]
CoMo/PdNiPt-HY CoMoNi/PdPt-HY CoMoPd/Pt-HY
(c) 4,6-DMDBT
Figure 7.33 Hydrodesulfurization conversions of 4,6-dimethyldibenzothiophene (4,6-DMDBT) in heavy gas oil over CoMo/PdNiPt-HY, CoMoNi/PdPt-HY and CoMoPd/Pt-HY catalysts. (65 bar, 310 oC, and space time of 6000 kgcath/kmol).
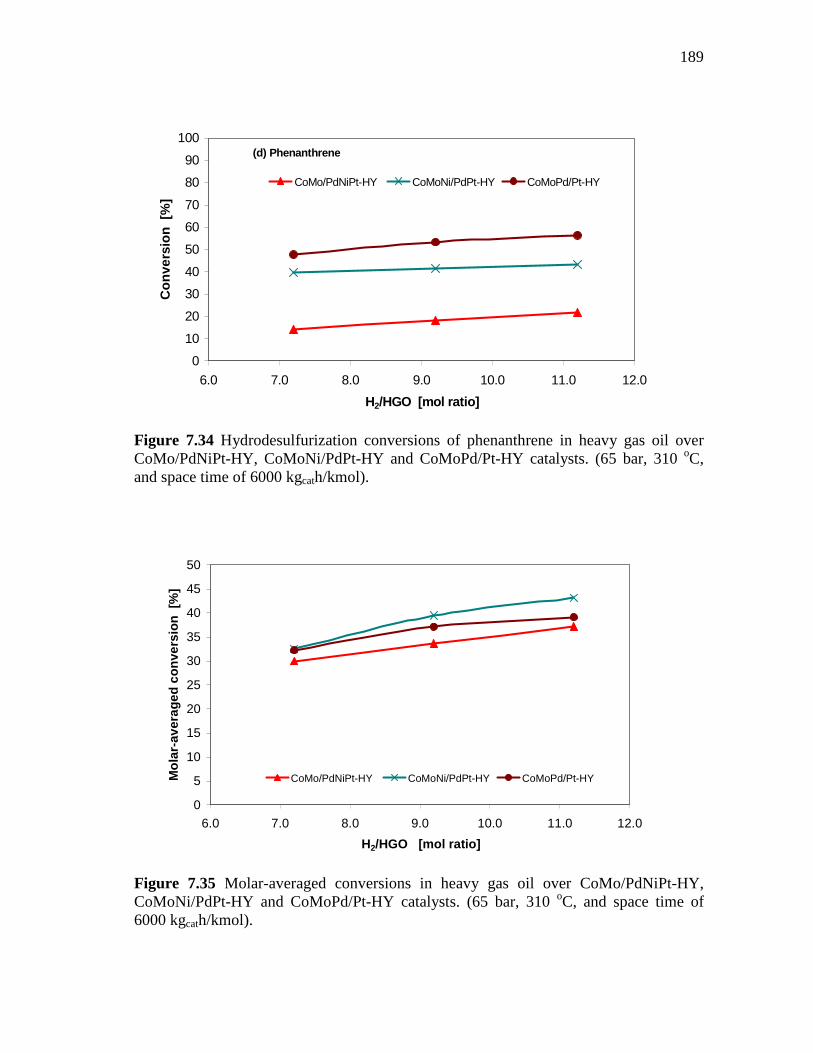
189
0
10
20
30
40
50
60
70
80
90
100
6.0 7.0 8.0 9.0 10.0 11.0 12.0
H2/HGO [mol ratio]
Con
vers
ion
[%]
CoMo/PdNiPt-HY CoMoNi/PdPt-HY CoMoPd/Pt-HY
(d) Phenanthrene
Figure 7.34 Hydrodesulfurization conversions of phenanthrene in heavy gas oil over CoMo/PdNiPt-HY, CoMoNi/PdPt-HY and CoMoPd/Pt-HY catalysts. (65 bar, 310 oC, and space time of 6000 kgcath/kmol).
0
5
10
15
20
25
30
35
40
45
50
6.0 7.0 8.0 9.0 10.0 11.0 12.0
H2/HGO [mol ratio]
Mol
ar-a
vera
ged
conv
ersi
on [
%]
CoMo/PdNiPt-HY CoMoNi/PdPt-HY CoMoPd/Pt-HY
Figure 7.35 Molar-averaged conversions in heavy gas oil over CoMo/PdNiPt-HY, CoMoNi/PdPt-HY and CoMoPd/Pt-HY catalysts. (65 bar, 310 oC, and space time of 6000 kgcath/kmol).
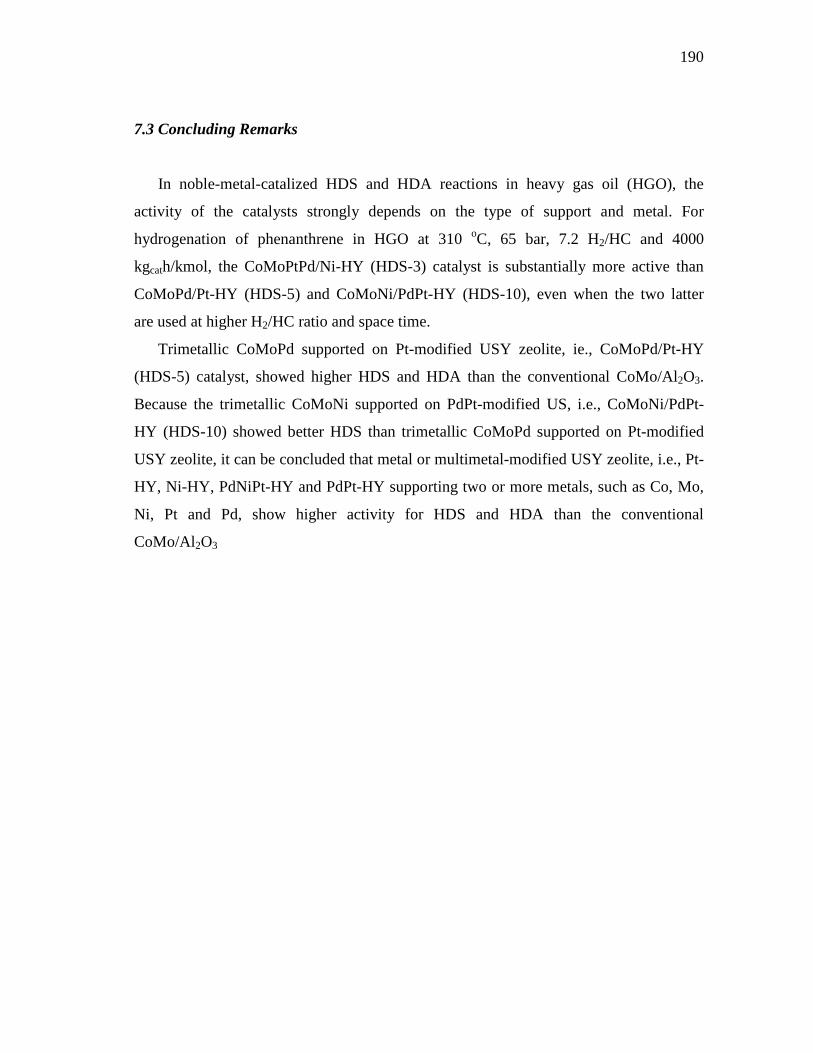
190
7.3 Concluding Remarks
In noble-metal-catalized HDS and HDA reactions in heavy gas oil (HGO), the
activity of the catalysts strongly depends on the type of support and metal. For
hydrogenation of phenanthrene in HGO at 310 oC, 65 bar, 7.2 H2/HC and 4000
kgcath/kmol, the CoMoPtPd/Ni-HY (HDS-3) catalyst is substantially more active than
CoMoPd/Pt-HY (HDS-5) and CoMoNi/PdPt-HY (HDS-10), even when the two latter
are used at higher H2/HC ratio and space time.
Trimetallic CoMoPd supported on Pt-modified USY zeolite, ie., CoMoPd/Pt-HY
(HDS-5) catalyst, showed higher HDS and HDA than the conventional CoMo/Al2O3.
Because the trimetallic CoMoNi supported on PdPt-modified US, i.e., CoMoNi/PdPt-
HY (HDS-10) showed better HDS than trimetallic CoMoPd supported on Pt-modified
USY zeolite, it can be concluded that metal or multimetal-modified USY zeolite, i.e., Pt-
HY, Ni-HY, PdNiPt-HY and PdPt-HY supporting two or more metals, such as Co, Mo,
Ni, Pt and Pd, show higher activity for HDS and HDA than the conventional
CoMo/Al2O3
191
CHAPTER VIII
COMPARISON OF ACTIVITY IN TERMS OF CONVERSION OF DB T AND
4,6-DMDBT INTO THEIR REACTION PRODUCTS
The Hydrodesulfurization (HDS) of Heavy gas oil containing 0.453 mass% was
performed at total pressure of 65 bar, temperature of 310 oC, space time (W/FoDBT)
varied from 4000 to 6000 kgcath/kmol and molar hydrogen to hydrocarbon ratio of 7.2
over a commercial CoMo/Al2O3 catalysts as well as experimental zeolite catalysts
prepared in lab, CoMoPtPd/HY (HDS-1), CoMoPd/Pt-HY (HDS-5), CoMoPtPd/Ni-HY
(HDS-3), CoMo/PdNiPt-HY (HDS-8), and CoMoNi/PdPt-HY (HDS-10) catalysts to
examine the HDS reactivities of DBT and 4,6-DMDBT which exist in the Heavy gas oil.
Among these catalysts, HDS-10 exhibited the highest HDS reactivity. Isomerization
reaction of 4-6-DMDBT into 3,6-DMDBT, and then desulfurization into 3,4-DMBPH
seems to be evident over the zeolites catalysts. The reaction products of the HDS of
DBT were biphenyl (BPH), cyclohexylbenzene (CHB), bicyclohexyl (BCH), and H2S.
Tetra-(THDBT) and hexahydrodibenzothiophene (HHDBT) were not detected.
8.1 Effect of Space Time at 310 oC and Molar H2/HC Ratio of 7.2
8.1.1 Commercial CoMo/Al2O3 (HDS-0) Catalyst
The catalyst used here was supplied by IMP. It contains 13.1-16.1 wt% MoO3, 3.2-
3.8 wt% CoO; total pore volume of 0.5 cm3/g and BET surface area mol of 215 m2/g. All
catalysts were crushed at 850-1000 µ to avoid diffusional limitations.
8.1.1.1 Conversion of DBT in HDS of Heavy Gas Oil
Table 8.1 and Figure 8.1 show the total conversions of DBT (XDBT), conversions of
DBT into BPH (XBPH), conversions of DBT into CHB (XCHB) and conversions of DBT
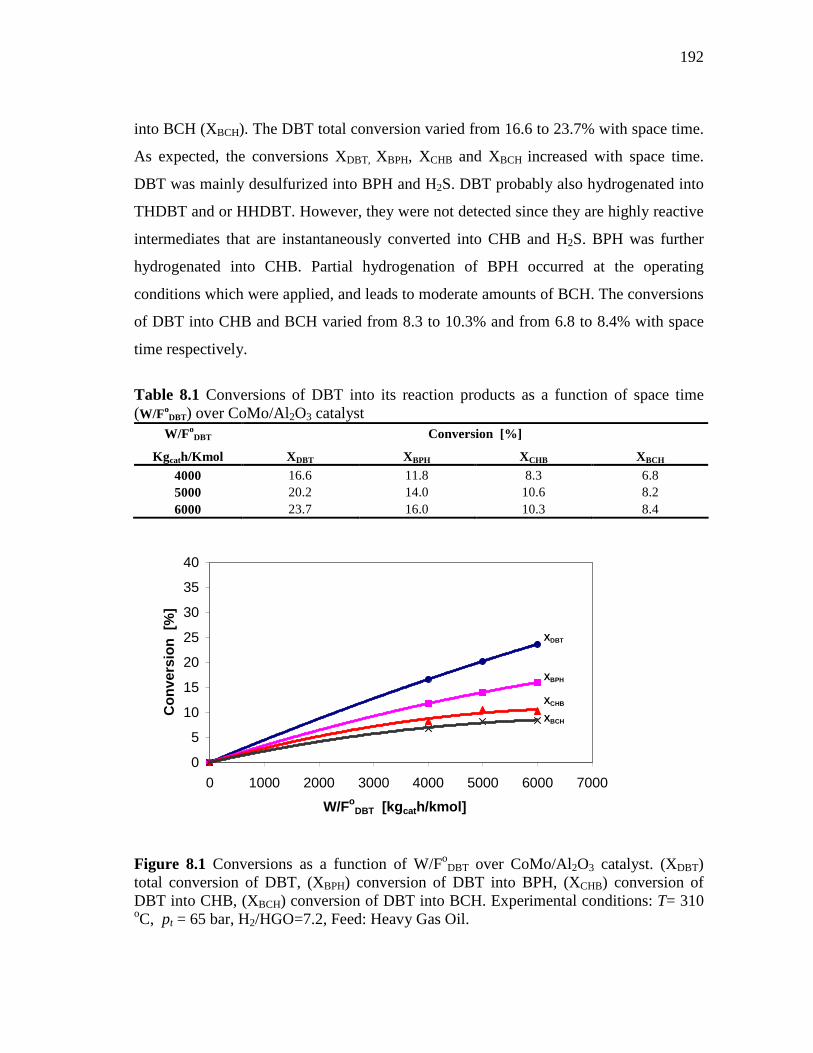
192
into BCH (XBCH). The DBT total conversion varied from 16.6 to 23.7% with space time.
As expected, the conversions XDBT, XBPH, XCHB and XBCH increased with space time.
DBT was mainly desulfurized into BPH and H2S. DBT probably also hydrogenated into
THDBT and or HHDBT. However, they were not detected since they are highly reactive
intermediates that are instantaneously converted into CHB and H2S. BPH was further
hydrogenated into CHB. Partial hydrogenation of BPH occurred at the operating
conditions which were applied, and leads to moderate amounts of BCH. The conversions
of DBT into CHB and BCH varied from 8.3 to 10.3% and from 6.8 to 8.4% with space
time respectively.
Table 8.1 Conversions of DBT into its reaction products as a function of space time (W/Fo
DBT) over CoMo/Al2O3 catalyst W/Fo
DBT Conversion [%]
Kgcath/Kmol X DBT XBPH XCHB XBCH
4000 16.6 11.8 8.3 6.8 5000 20.2 14.0 10.6 8.2 6000 23.7 16.0 10.3 8.4
0
5
10
15
20
25
30
35
40
0 1000 2000 3000 4000 5000 6000 7000
W/FoDBT [kg cath/kmol]
Con
vers
ion
[%]
XDBT
XBPH
XCHB
XBCH
Figure 8.1 Conversions as a function of W/Fo
DBT over CoMo/Al2O3 catalyst. (XDBT) total conversion of DBT, (XBPH) conversion of DBT into BPH, (XCHB) conversion of DBT into CHB, (XBCH) conversion of DBT into BCH. Experimental conditions: T= 310 oC, pt = 65 bar, H2/HGO=7.2, Feed: Heavy Gas Oil.
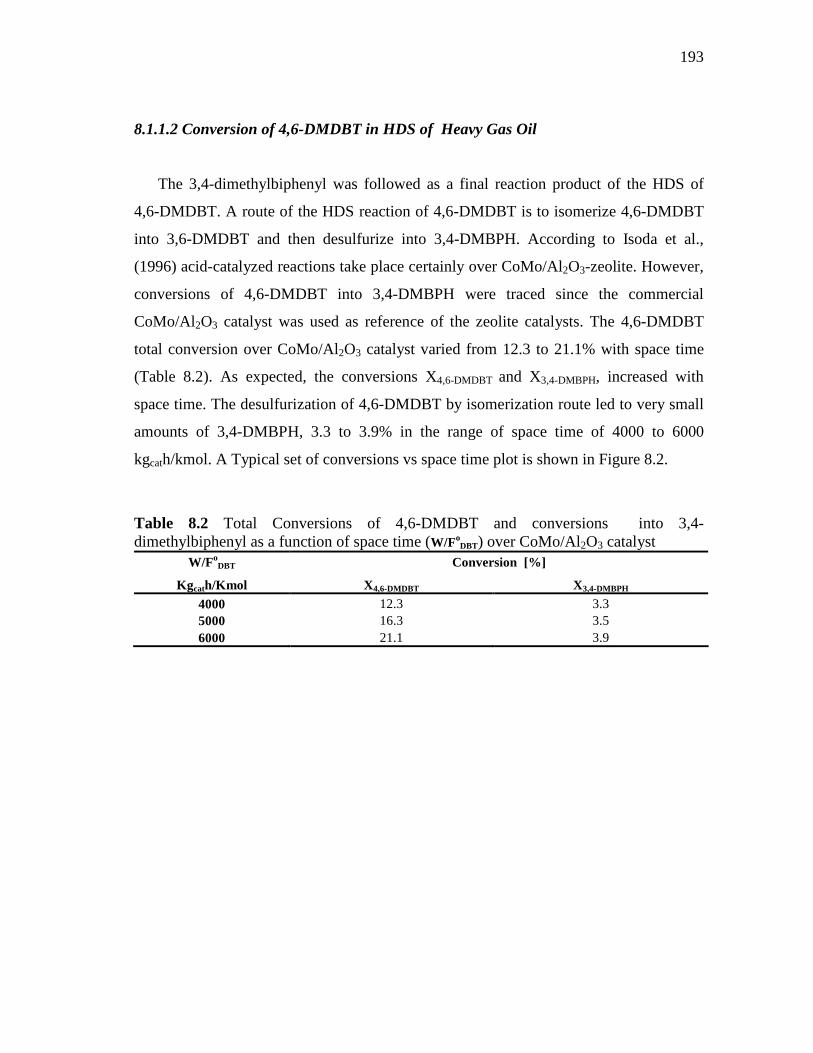
193
8.1.1.2 Conversion of 4,6-DMDBT in HDS of Heavy Gas Oil
The 3,4-dimethylbiphenyl was followed as a final reaction product of the HDS of
4,6-DMDBT. A route of the HDS reaction of 4,6-DMDBT is to isomerize 4,6-DMDBT
into 3,6-DMDBT and then desulfurize into 3,4-DMBPH. According to Isoda et al.,
(1996) acid-catalyzed reactions take place certainly over CoMo/Al2O3-zeolite. However,
conversions of 4,6-DMDBT into 3,4-DMBPH were traced since the commercial
CoMo/Al2O3 catalyst was used as reference of the zeolite catalysts. The 4,6-DMDBT
total conversion over CoMo/Al2O3 catalyst varied from 12.3 to 21.1% with space time
(Table 8.2). As expected, the conversions X4,6-DMDBT and X3,4-DMBPH, increased with
space time. The desulfurization of 4,6-DMDBT by isomerization route led to very small
amounts of 3,4-DMBPH, 3.3 to 3.9% in the range of space time of 4000 to 6000
kgcath/kmol. A Typical set of conversions vs space time plot is shown in Figure 8.2.
Table 8.2 Total Conversions of 4,6-DMDBT and conversions into 3,4- dimethylbiphenyl as a function of space time (W/Fo
DBT) over CoMo/Al2O3 catalyst W/Fo
DBT Conversion [%]
Kgcath/Kmol X 4,6-DMDBT X3,4-DMBPH
4000 12.3 3.3 5000 16.3 3.5 6000 21.1 3.9
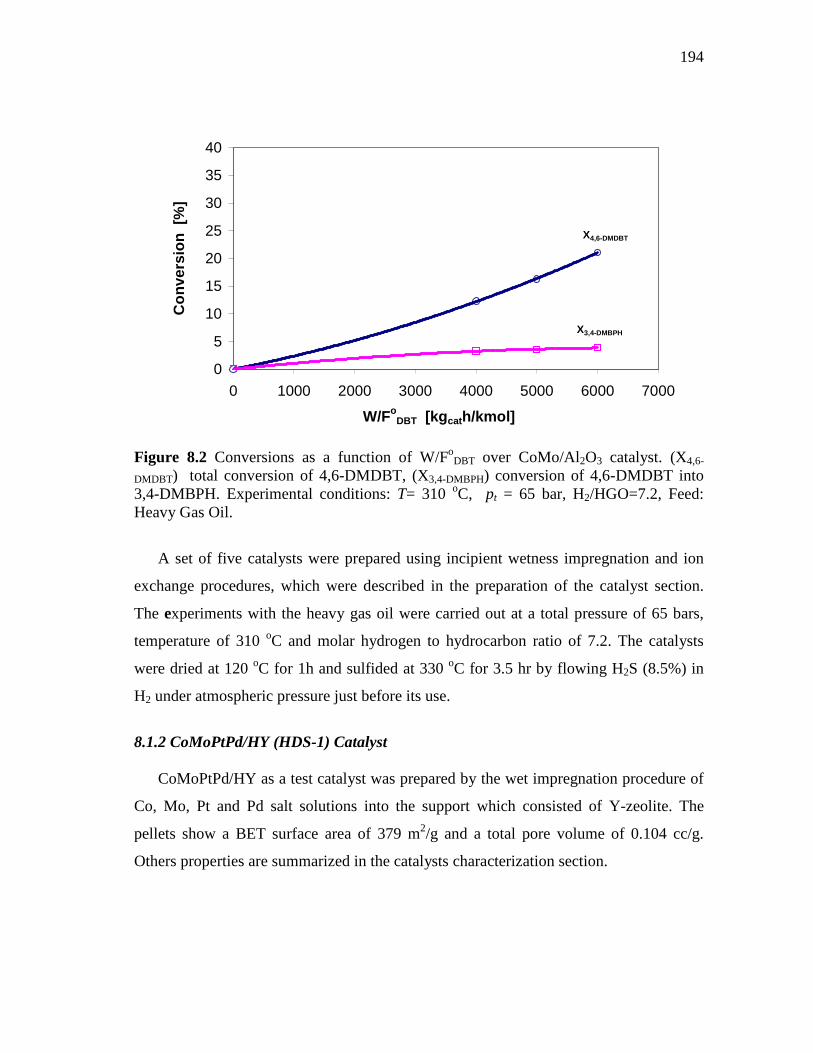
194
0
5
10
15
20
25
30
35
40
0 1000 2000 3000 4000 5000 6000 7000
W/FoDBT [kg cath/kmol]
Con
vers
ion
[%]
X4,6-DMDBT
X3,4-DMBPH
Figure 8.2 Conversions as a function of W/Fo
DBT over CoMo/Al2O3 catalyst. (X4,6-
DMDBT) total conversion of 4,6-DMDBT, (X3,4-DMBPH) conversion of 4,6-DMDBT into 3,4-DMBPH. Experimental conditions: T= 310 oC, pt = 65 bar, H2/HGO=7.2, Feed: Heavy Gas Oil.
A set of five catalysts were prepared using incipient wetness impregnation and ion
exchange procedures, which were described in the preparation of the catalyst section.
The experiments with the heavy gas oil were carried out at a total pressure of 65 bars,
temperature of 310 oC and molar hydrogen to hydrocarbon ratio of 7.2. The catalysts
were dried at 120 oC for 1h and sulfided at 330 oC for 3.5 hr by flowing H2S (8.5%) in
H2 under atmospheric pressure just before its use.
8.1.2 CoMoPtPd/HY (HDS-1) Catalyst
CoMoPtPd/HY as a test catalyst was prepared by the wet impregnation procedure of
Co, Mo, Pt and Pd salt solutions into the support which consisted of Y-zeolite. The
pellets show a BET surface area of 379 m2/g and a total pore volume of 0.104 cc/g.
Others properties are summarized in the catalysts characterization section.
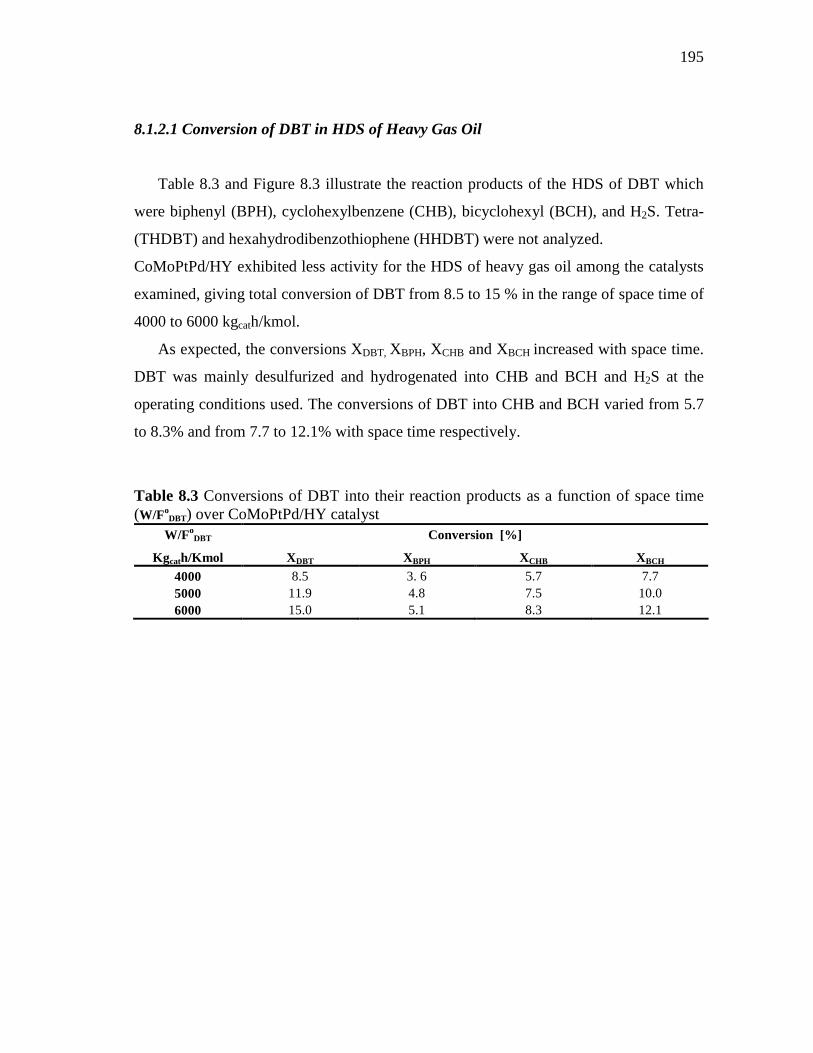
195
8.1.2.1 Conversion of DBT in HDS of Heavy Gas Oil
Table 8.3 and Figure 8.3 illustrate the reaction products of the HDS of DBT which
were biphenyl (BPH), cyclohexylbenzene (CHB), bicyclohexyl (BCH), and H2S. Tetra-
(THDBT) and hexahydrodibenzothiophene (HHDBT) were not analyzed.
CoMoPtPd/HY exhibited less activity for the HDS of heavy gas oil among the catalysts
examined, giving total conversion of DBT from 8.5 to 15 % in the range of space time of
4000 to 6000 kgcath/kmol.
As expected, the conversions XDBT, XBPH, XCHB and XBCH increased with space time.
DBT was mainly desulfurized and hydrogenated into CHB and BCH and H2S at the
operating conditions used. The conversions of DBT into CHB and BCH varied from 5.7
to 8.3% and from 7.7 to 12.1% with space time respectively.
Table 8.3 Conversions of DBT into their reaction products as a function of space time (W/Fo
DBT) over CoMoPtPd/HY catalyst W/Fo
DBT Conversion [%]
Kgcath/Kmol X DBT XBPH XCHB XBCH 4000 8.5 3. 6 5.7 7.7 5000 11.9 4.8 7.5 10.0 6000 15.0 5.1 8.3 12.1
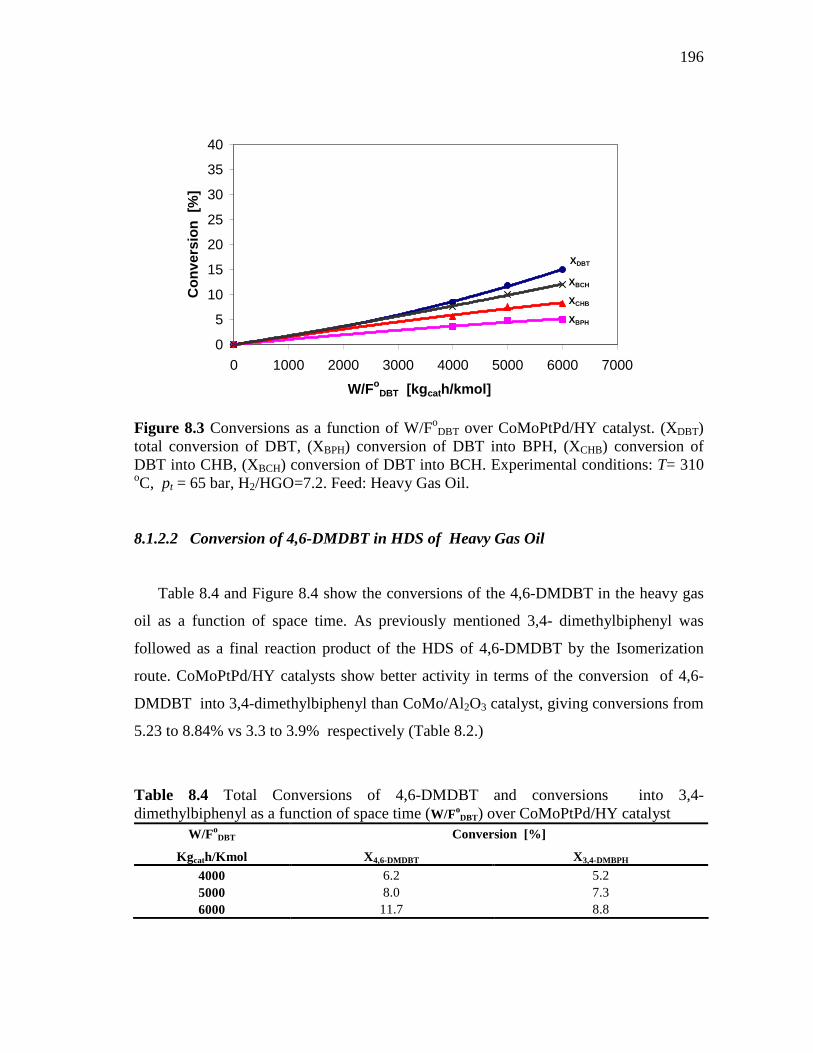
196
0
5
10
15
20
25
30
35
40
0 1000 2000 3000 4000 5000 6000 7000
W/FoDBT [kg cath/kmol]
Con
vers
ion
[%]
XDBT
XBPH
XCHB
XBCH
Figure 8.3 Conversions as a function of W/Fo
DBT over CoMoPtPd/HY catalyst. (XDBT) total conversion of DBT, (XBPH) conversion of DBT into BPH, (XCHB) conversion of DBT into CHB, (XBCH) conversion of DBT into BCH. Experimental conditions: T= 310 oC, pt = 65 bar, H2/HGO=7.2. Feed: Heavy Gas Oil. 8.1.2.2 Conversion of 4,6-DMDBT in HDS of Heavy Gas Oil
Table 8.4 and Figure 8.4 show the conversions of the 4,6-DMDBT in the heavy gas
oil as a function of space time. As previously mentioned 3,4- dimethylbiphenyl was
followed as a final reaction product of the HDS of 4,6-DMDBT by the Isomerization
route. CoMoPtPd/HY catalysts show better activity in terms of the conversion of 4,6-
DMDBT into 3,4-dimethylbiphenyl than CoMo/Al2O3 catalyst, giving conversions from
5.23 to 8.84% vs 3.3 to 3.9% respectively (Table 8.2.)
Table 8.4 Total Conversions of 4,6-DMDBT and conversions into 3,4-dimethylbiphenyl as a function of space time (W/Fo
DBT) over CoMoPtPd/HY catalyst W/Fo
DBT Conversion [%]
Kgcath/Kmol X 4,6-DMDBT X3,4-DMBPH
4000 6.2 5.2 5000 8.0 7.3 6000 11.7 8.8
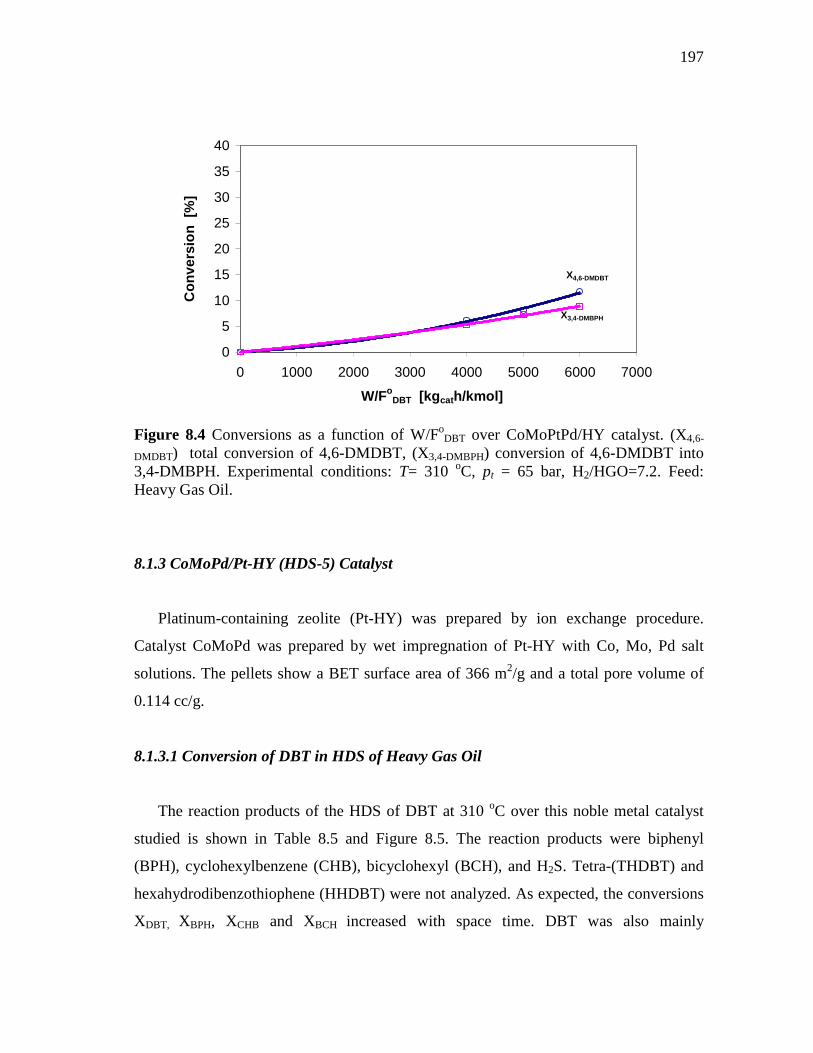
197
0
5
10
15
20
25
30
35
40
0 1000 2000 3000 4000 5000 6000 7000
W/FoDBT [kg cath/kmol]
Con
vers
ion
[%]
X4,6-DMDBT
X3,4-DMBPH
Figure 8.4 Conversions as a function of W/Fo
DBT over CoMoPtPd/HY catalyst. (X4,6-
DMDBT) total conversion of 4,6-DMDBT, (X3,4-DMBPH) conversion of 4,6-DMDBT into 3,4-DMBPH. Experimental conditions: T= 310 oC, pt = 65 bar, H2/HGO=7.2. Feed: Heavy Gas Oil. 8.1.3 CoMoPd/Pt-HY (HDS-5) Catalyst
Platinum-containing zeolite (Pt-HY) was prepared by ion exchange procedure.
Catalyst CoMoPd was prepared by wet impregnation of Pt-HY with Co, Mo, Pd salt
solutions. The pellets show a BET surface area of 366 m2/g and a total pore volume of
0.114 cc/g.
8.1.3.1 Conversion of DBT in HDS of Heavy Gas Oil
The reaction products of the HDS of DBT at 310 oC over this noble metal catalyst
studied is shown in Table 8.5 and Figure 8.5. The reaction products were biphenyl
(BPH), cyclohexylbenzene (CHB), bicyclohexyl (BCH), and H2S. Tetra-(THDBT) and
hexahydrodibenzothiophene (HHDBT) were not analyzed. As expected, the conversions
XDBT, XBPH, XCHB and XBCH increased with space time. DBT was also mainly
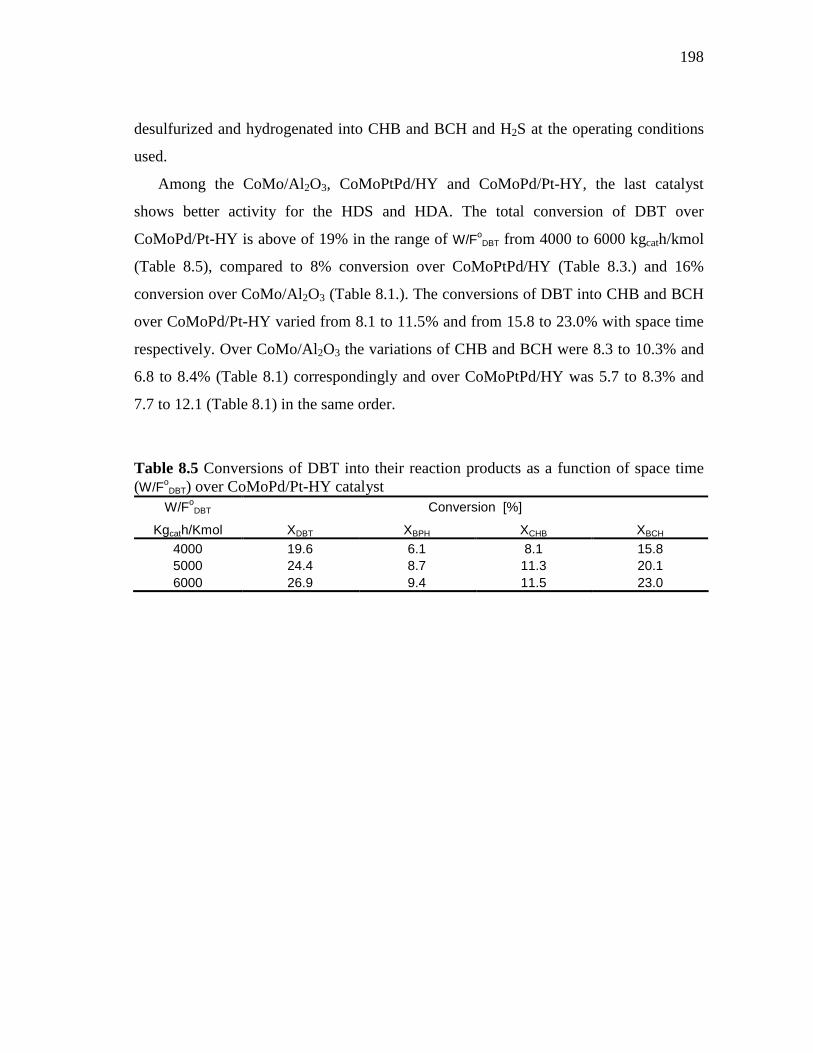
198
desulfurized and hydrogenated into CHB and BCH and H2S at the operating conditions
used.
Among the CoMo/Al2O3, CoMoPtPd/HY and CoMoPd/Pt-HY, the last catalyst
shows better activity for the HDS and HDA. The total conversion of DBT over
CoMoPd/Pt-HY is above of 19% in the range of W/FoDBT from 4000 to 6000 kgcath/kmol
(Table 8.5), compared to 8% conversion over CoMoPtPd/HY (Table 8.3.) and 16%
conversion over CoMo/Al2O3 (Table 8.1.). The conversions of DBT into CHB and BCH
over CoMoPd/Pt-HY varied from 8.1 to 11.5% and from 15.8 to 23.0% with space time
respectively. Over CoMo/Al2O3 the variations of CHB and BCH were 8.3 to 10.3% and
6.8 to 8.4% (Table 8.1) correspondingly and over CoMoPtPd/HY was 5.7 to 8.3% and
7.7 to 12.1 (Table 8.1) in the same order.
Table 8.5 Conversions of DBT into their reaction products as a function of space time (W/Fo
DBT) over CoMoPd/Pt-HY catalyst W/Fo
DBT Conversion [%]
Kgcath/Kmol XDBT XBPH XCHB XBCH 4000 19.6 6.1 8.1 15.8 5000 24.4 8.7 11.3 20.1 6000 26.9 9.4 11.5 23.0
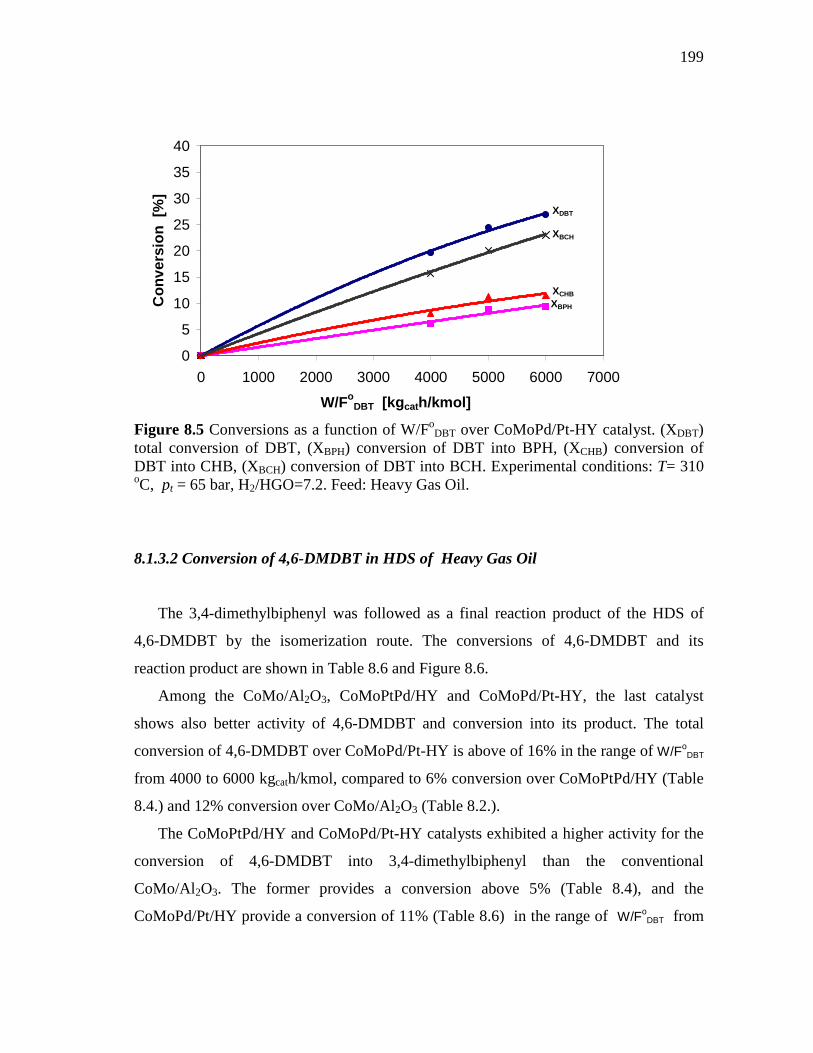
199
0
5
10
15
20
25
30
35
40
0 1000 2000 3000 4000 5000 6000 7000
W/FoDBT [kg cath/kmol]
Con
vers
ion
[%]
XDBT
XBPH
XCHB
XBCH
Figure 8.5 Conversions as a function of W/Fo
DBT over CoMoPd/Pt-HY catalyst. (XDBT) total conversion of DBT, (XBPH) conversion of DBT into BPH, (XCHB) conversion of DBT into CHB, (XBCH) conversion of DBT into BCH. Experimental conditions: T= 310 oC, pt = 65 bar, H2/HGO=7.2. Feed: Heavy Gas Oil. 8.1.3.2 Conversion of 4,6-DMDBT in HDS of Heavy Gas Oil
The 3,4-dimethylbiphenyl was followed as a final reaction product of the HDS of
4,6-DMDBT by the isomerization route. The conversions of 4,6-DMDBT and its
reaction product are shown in Table 8.6 and Figure 8.6.
Among the CoMo/Al2O3, CoMoPtPd/HY and CoMoPd/Pt-HY, the last catalyst
shows also better activity of 4,6-DMDBT and conversion into its product. The total
conversion of 4,6-DMDBT over CoMoPd/Pt-HY is above of 16% in the range of W/FoDBT
from 4000 to 6000 kgcath/kmol, compared to 6% conversion over CoMoPtPd/HY (Table
8.4.) and 12% conversion over CoMo/Al2O3 (Table 8.2.).
The CoMoPtPd/HY and CoMoPd/Pt-HY catalysts exhibited a higher activity for the
conversion of 4,6-DMDBT into 3,4-dimethylbiphenyl than the conventional
CoMo/Al2O3. The former provides a conversion above 5% (Table 8.4), and the
CoMoPd/Pt/HY provide a conversion of 11% (Table 8.6) in the range of W/FoDBT from
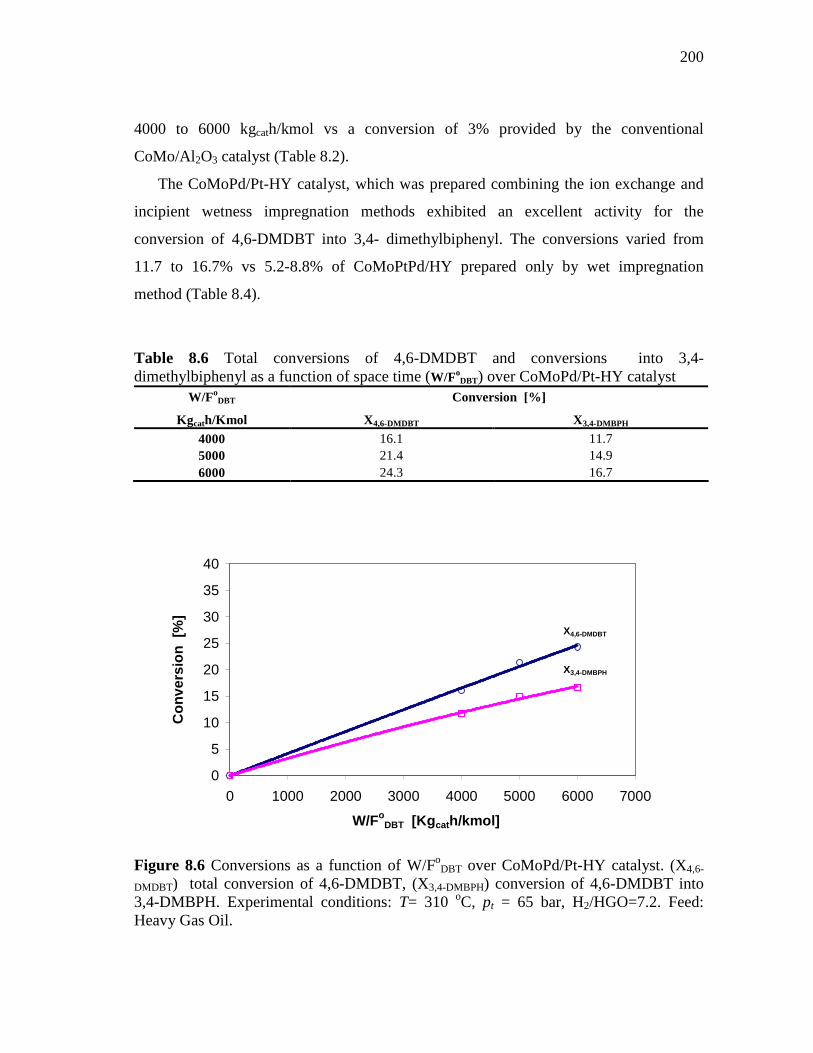
200
4000 to 6000 kgcath/kmol vs a conversion of 3% provided by the conventional
CoMo/Al2O3 catalyst (Table 8.2).
The CoMoPd/Pt-HY catalyst, which was prepared combining the ion exchange and
incipient wetness impregnation methods exhibited an excellent activity for the
conversion of 4,6-DMDBT into 3,4- dimethylbiphenyl. The conversions varied from
11.7 to 16.7% vs 5.2-8.8% of CoMoPtPd/HY prepared only by wet impregnation
method (Table 8.4).
Table 8.6 Total conversions of 4,6-DMDBT and conversions into 3,4- dimethylbiphenyl as a function of space time (W/Fo
DBT) over CoMoPd/Pt-HY catalyst W/Fo
DBT Conversion [%]
Kgcath/Kmol X 4,6-DMDBT X3,4-DMBPH
4000 16.1 11.7 5000 21.4 14.9 6000 24.3 16.7
0
5
10
15
20
25
30
35
40
0 1000 2000 3000 4000 5000 6000 7000
W/FoDBT [Kg cath/kmol]
Con
vers
ion
[%]
X4,6-DMDBT
X3,4-DMBPH
Figure 8.6 Conversions as a function of W/Fo
DBT over CoMoPd/Pt-HY catalyst. (X4,6-
DMDBT) total conversion of 4,6-DMDBT, (X3,4-DMBPH) conversion of 4,6-DMDBT into 3,4-DMBPH. Experimental conditions: T= 310 oC, pt = 65 bar, H2/HGO=7.2. Feed: Heavy Gas Oil.
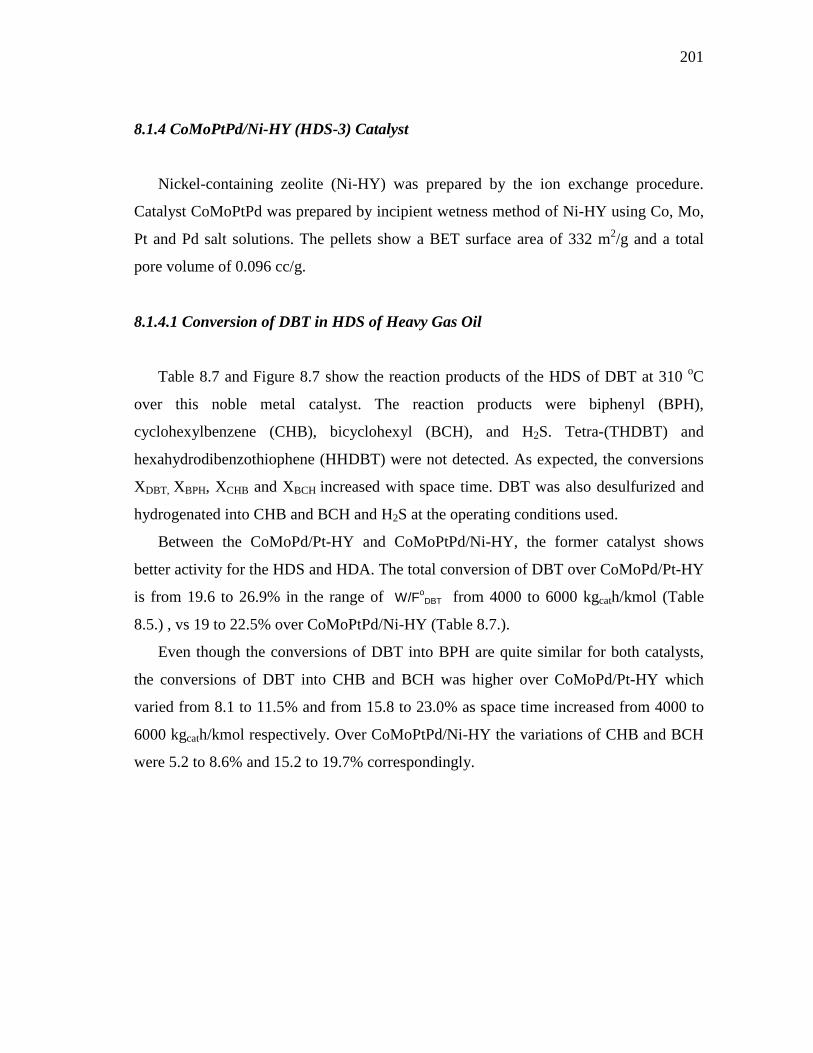
201
8.1.4 CoMoPtPd/Ni-HY (HDS-3) Catalyst
Nickel-containing zeolite (Ni-HY) was prepared by the ion exchange procedure.
Catalyst CoMoPtPd was prepared by incipient wetness method of Ni-HY using Co, Mo,
Pt and Pd salt solutions. The pellets show a BET surface area of 332 m2/g and a total
pore volume of 0.096 cc/g.
8.1.4.1 Conversion of DBT in HDS of Heavy Gas Oil
Table 8.7 and Figure 8.7 show the reaction products of the HDS of DBT at 310 oC
over this noble metal catalyst. The reaction products were biphenyl (BPH),
cyclohexylbenzene (CHB), bicyclohexyl (BCH), and H2S. Tetra-(THDBT) and
hexahydrodibenzothiophene (HHDBT) were not detected. As expected, the conversions
XDBT, XBPH, XCHB and XBCH increased with space time. DBT was also desulfurized and
hydrogenated into CHB and BCH and H2S at the operating conditions used.
Between the CoMoPd/Pt-HY and CoMoPtPd/Ni-HY, the former catalyst shows
better activity for the HDS and HDA. The total conversion of DBT over CoMoPd/Pt-HY
is from 19.6 to 26.9% in the range of W/FoDBT from 4000 to 6000 kgcath/kmol (Table
8.5.) , vs 19 to 22.5% over CoMoPtPd/Ni-HY (Table 8.7.).
Even though the conversions of DBT into BPH are quite similar for both catalysts,
the conversions of DBT into CHB and BCH was higher over CoMoPd/Pt-HY which
varied from 8.1 to 11.5% and from 15.8 to 23.0% as space time increased from 4000 to
6000 kgcath/kmol respectively. Over CoMoPtPd/Ni-HY the variations of CHB and BCH
were 5.2 to 8.6% and 15.2 to 19.7% correspondingly.
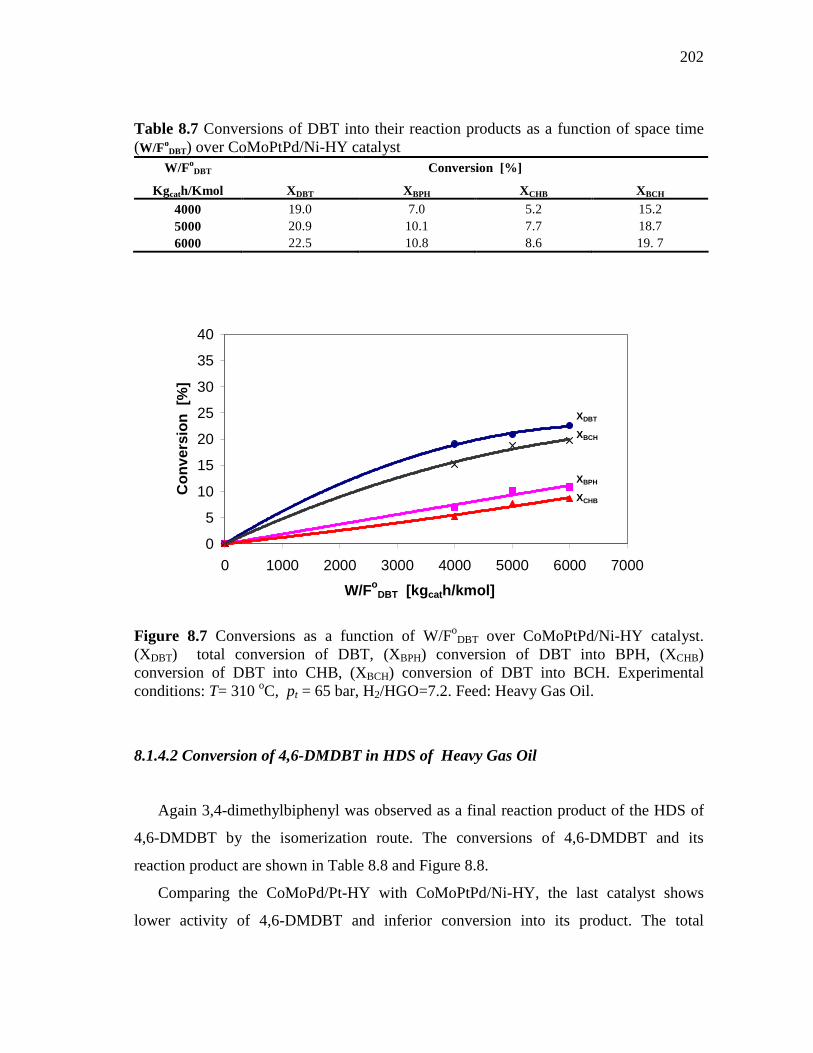
202
Table 8.7 Conversions of DBT into their reaction products as a function of space time (W/Fo
DBT) over CoMoPtPd/Ni-HY catalyst W/Fo
DBT Conversion [%]
Kgcath/Kmol X DBT XBPH XCHB XBCH 4000 19.0 7.0 5.2 15.2 5000 20.9 10.1 7.7 18.7 6000 22.5 10.8 8.6 19. 7
0
5
10
15
20
25
30
35
40
0 1000 2000 3000 4000 5000 6000 7000
W/FoDBT [kg cath/kmol]
Con
vers
ion
[%]
XDBT
XBPH
XCHB
XBCH
Figure 8.7 Conversions as a function of W/Fo
DBT over CoMoPtPd/Ni-HY catalyst. (XDBT) total conversion of DBT, (XBPH) conversion of DBT into BPH, (XCHB) conversion of DBT into CHB, (XBCH) conversion of DBT into BCH. Experimental conditions: T= 310 oC, pt = 65 bar, H2/HGO=7.2. Feed: Heavy Gas Oil.
8.1.4.2 Conversion of 4,6-DMDBT in HDS of Heavy Gas Oil
Again 3,4-dimethylbiphenyl was observed as a final reaction product of the HDS of
4,6-DMDBT by the isomerization route. The conversions of 4,6-DMDBT and its
reaction product are shown in Table 8.8 and Figure 8.8.
Comparing the CoMoPd/Pt-HY with CoMoPtPd/Ni-HY, the last catalyst shows
lower activity of 4,6-DMDBT and inferior conversion into its product. The total
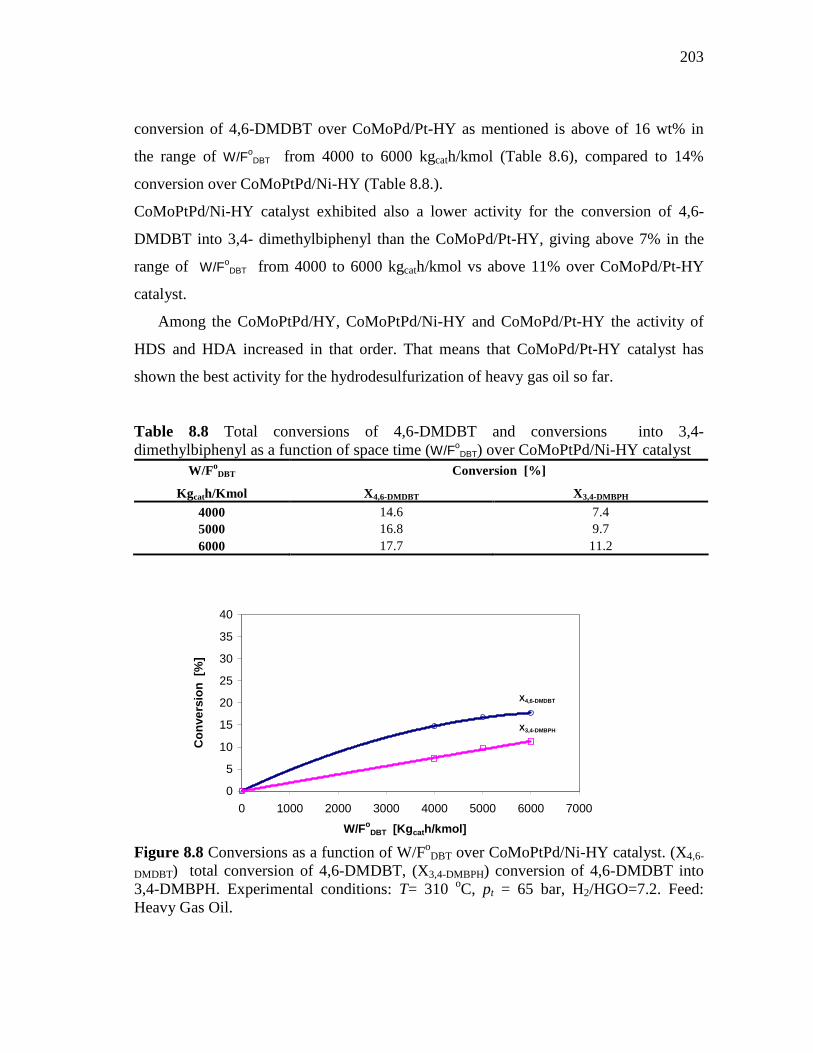
203
conversion of 4,6-DMDBT over CoMoPd/Pt-HY as mentioned is above of 16 wt% in
the range of W/FoDBT from 4000 to 6000 kgcath/kmol (Table 8.6), compared to 14%
conversion over CoMoPtPd/Ni-HY (Table 8.8.).
CoMoPtPd/Ni-HY catalyst exhibited also a lower activity for the conversion of 4,6-
DMDBT into 3,4- dimethylbiphenyl than the CoMoPd/Pt-HY, giving above 7% in the
range of W/FoDBT from 4000 to 6000 kgcath/kmol vs above 11% over CoMoPd/Pt-HY
catalyst.
Among the CoMoPtPd/HY, CoMoPtPd/Ni-HY and CoMoPd/Pt-HY the activity of
HDS and HDA increased in that order. That means that CoMoPd/Pt-HY catalyst has
shown the best activity for the hydrodesulfurization of heavy gas oil so far.
Table 8.8 Total conversions of 4,6-DMDBT and conversions into 3,4- dimethylbiphenyl as a function of space time (W/Fo
DBT) over CoMoPtPd/Ni-HY catalyst W/Fo
DBT Conversion [%]
Kgcath/Kmol X 4,6-DMDBT X3,4-DMBPH
4000 14.6 7.4 5000 16.8 9.7 6000 17.7 11.2
0
5
10
15
20
25
30
35
40
0 1000 2000 3000 4000 5000 6000 7000
W/FoDBT [Kg cath/kmol]
Con
vers
ion
[%]
X4,6-DMDBT
X3,4-DMBPH
Figure 8.8 Conversions as a function of W/Fo
DBT over CoMoPtPd/Ni-HY catalyst. (X4,6-
DMDBT) total conversion of 4,6-DMDBT, (X3,4-DMBPH) conversion of 4,6-DMDBT into 3,4-DMBPH. Experimental conditions: T= 310 oC, pt = 65 bar, H2/HGO=7.2. Feed: Heavy Gas Oil.
204
8.1.5 CoMo/PdNiPt-HY (HDS-8) Catalyst
Pd, Ni and Pt containing zeolite was prepared using ion exchange method in three
stages. PdNiPt-Zeolite supported CoMo catalyst was prepared by incipient wetness
method. The pellets had the lowest BET surface area than the before catalyst presented.
CoMoPtPd/Ni-HY had 298 m2/g and a total pore volume of 0.096 cc/g while
CoMoPtPd/Ni was of 332 m2/g with similar total pore volume.
8.1.5.1 Conversion of DBT in HDS of Heavy Gas Oil
The reaction products of the HDS of DBT at 310 oC over this noble metal catalyst
studied is shown in Table 8.9 and Figure 8.9. The reaction products were biphenyl
(BPH), cyclohexylbenzene (CHB), bicyclohexyl (BCH), and H2S. Tetra-(THDBT) and
hexahydrodibenzothiophene (HHDBT) were not analyzed. As expected, the conversions
XDBT, XBPH, XCHB and XBCH increased with space time. DBT was also mainly
desulfurized and hydrogenated into CHB and BCH and H2S at the operating conditions
used.
The DBT and 4,6-DMDBT HDS activities of PdNiPt-Zeolite supported CoMo
catalyst showed considerably lower activities at low space time (4000 kgcath/kmol) than
CoMoPtPd/Ni-HY, but did not a high values (6000 kgcath/kmol) since DBT conversions
were the same. The total conversion of DBT over CoMo/PdNiPt-HY is above of 10.8%
in the range of W/FoDBT from 4000 to 6000 kgcath/kmol, compared to 19% conversion
over CoMoPtPd/Ni-HY (Table 8.7.). The conversions of DBT into CHB and BCH over
CoMo/PdNiPt-HY varied from 5.1 to 14.4% and from 7.9 to 18.9% with space time
respectively. Over CoMoPtPd/Ni-HY the variations of CHB and BCH were 5.2 to 8.6%
and 15.2 to 19.7% correspondingly (Table 8.7).
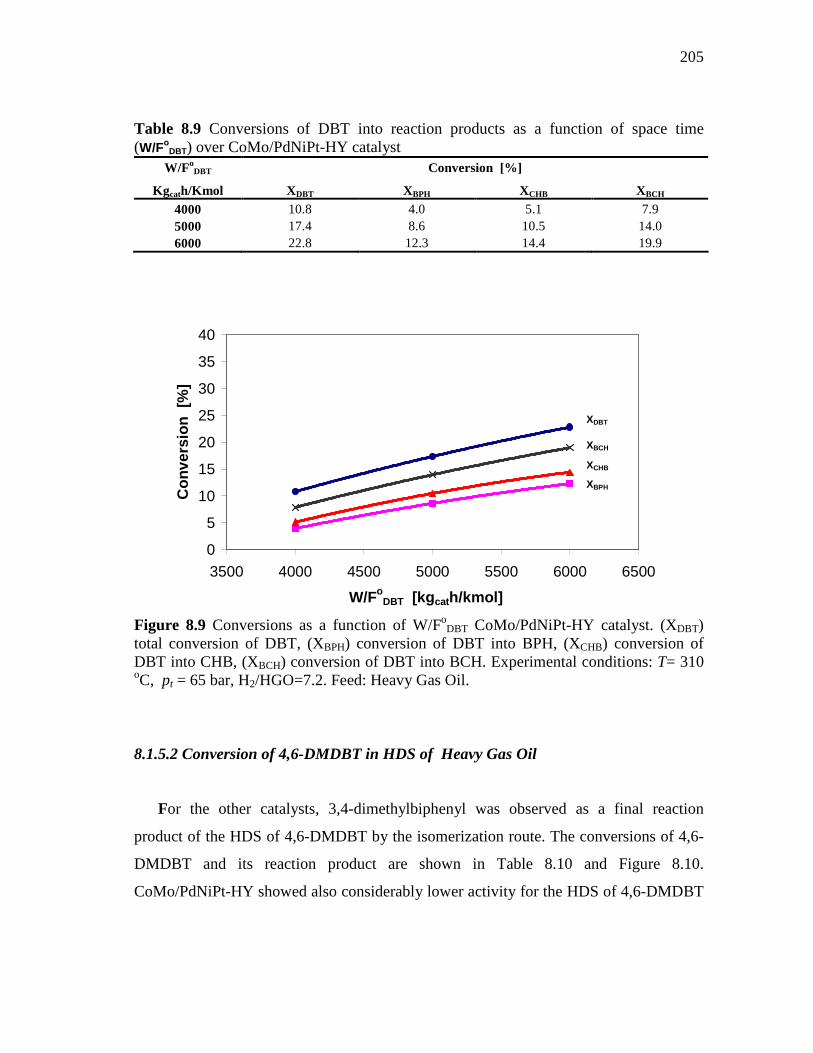
205
Table 8.9 Conversions of DBT into reaction products as a function of space time (W/Fo
DBT) over CoMo/PdNiPt-HY catalyst W/Fo
DBT Conversion [%]
Kgcath/Kmol X DBT XBPH XCHB XBCH 4000 10.8 4.0 5.1 7.9 5000 17.4 8.6 10.5 14.0 6000 22.8 12.3 14.4 19.9
0
5
10
15
20
25
30
35
40
3500 4000 4500 5000 5500 6000 6500
W/FoDBT [kg cath/kmol]
Con
vers
ion
[%]
XDBT
XBPH
XCHB
XBCH
Figure 8.9 Conversions as a function of W/Fo
DBT CoMo/PdNiPt-HY catalyst. (XDBT) total conversion of DBT, (XBPH) conversion of DBT into BPH, (XCHB) conversion of DBT into CHB, (XBCH) conversion of DBT into BCH. Experimental conditions: T= 310 oC, pt = 65 bar, H2/HGO=7.2. Feed: Heavy Gas Oil.
8.1.5.2 Conversion of 4,6-DMDBT in HDS of Heavy Gas Oil
For the other catalysts, 3,4-dimethylbiphenyl was observed as a final reaction
product of the HDS of 4,6-DMDBT by the isomerization route. The conversions of 4,6-
DMDBT and its reaction product are shown in Table 8.10 and Figure 8.10.
CoMo/PdNiPt-HY showed also considerably lower activity for the HDS of 4,6-DMDBT
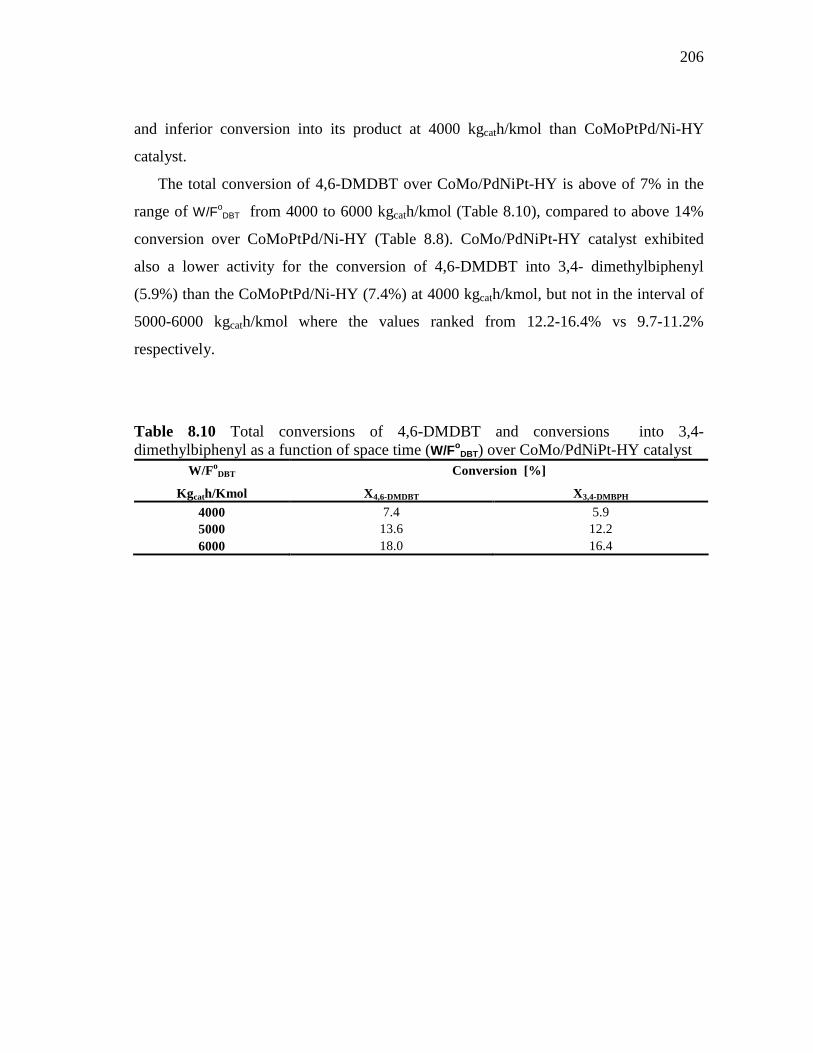
206
and inferior conversion into its product at 4000 kgcath/kmol than CoMoPtPd/Ni-HY
catalyst.
The total conversion of 4,6-DMDBT over CoMo/PdNiPt-HY is above of 7% in the
range of W/FoDBT from 4000 to 6000 kgcath/kmol (Table 8.10), compared to above 14%
conversion over CoMoPtPd/Ni-HY (Table 8.8). CoMo/PdNiPt-HY catalyst exhibited
also a lower activity for the conversion of 4,6-DMDBT into 3,4- dimethylbiphenyl
(5.9%) than the CoMoPtPd/Ni-HY (7.4%) at 4000 kgcath/kmol, but not in the interval of
5000-6000 kgcath/kmol where the values ranked from 12.2-16.4% vs 9.7-11.2%
respectively.
Table 8.10 Total conversions of 4,6-DMDBT and conversions into 3,4- dimethylbiphenyl as a function of space time (W/Fo
DBT) over CoMo/PdNiPt-HY catalyst W/Fo
DBT Conversion [%]
Kgcath/Kmol X 4,6-DMDBT X3,4-DMBPH
4000 7.4 5.9 5000 13.6 12.2 6000 18.0 16.4
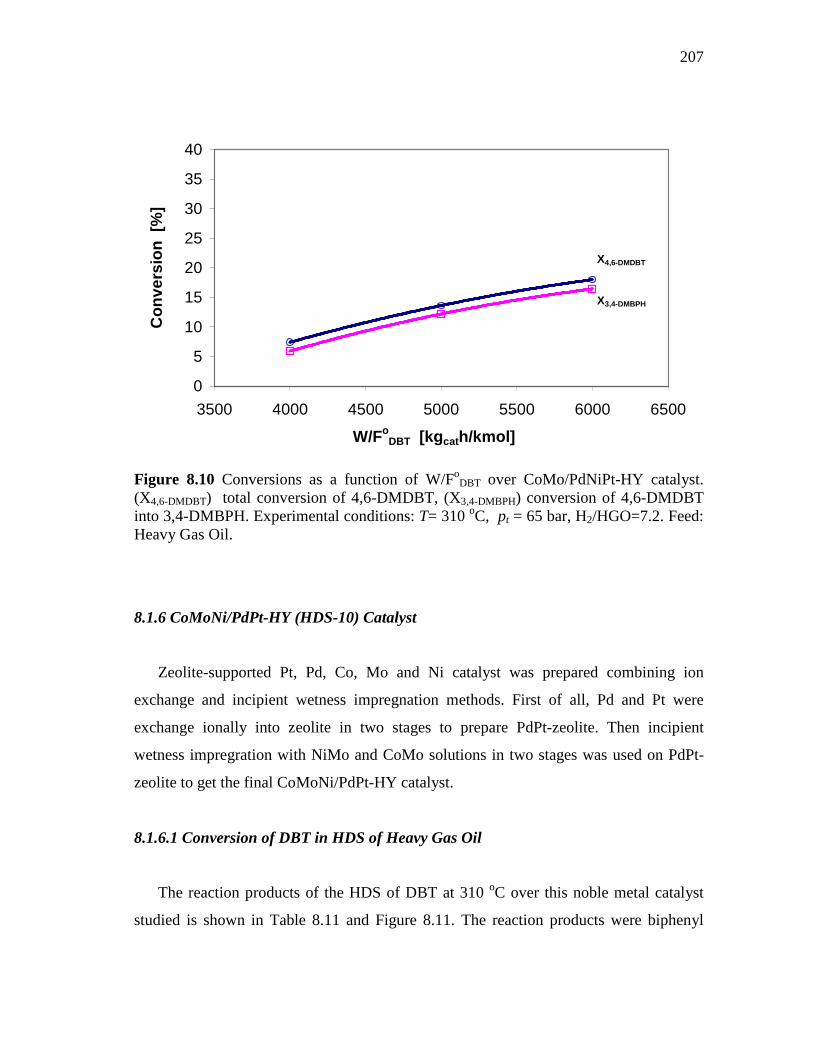
207
0
5
10
15
20
25
30
35
40
3500 4000 4500 5000 5500 6000 6500
W/FoDBT [kg cath/kmol]
Con
vers
ion
[%]
X4,6-DMDBT
X3,4-DMBPH
Figure 8.10 Conversions as a function of W/Fo
DBT over CoMo/PdNiPt-HY catalyst. (X4,6-DMDBT) total conversion of 4,6-DMDBT, (X3,4-DMBPH) conversion of 4,6-DMDBT into 3,4-DMBPH. Experimental conditions: T= 310 oC, pt = 65 bar, H2/HGO=7.2. Feed: Heavy Gas Oil.
8.1.6 CoMoNi/PdPt-HY (HDS-10) Catalyst
Zeolite-supported Pt, Pd, Co, Mo and Ni catalyst was prepared combining ion
exchange and incipient wetness impregnation methods. First of all, Pd and Pt were
exchange ionally into zeolite in two stages to prepare PdPt-zeolite. Then incipient
wetness impregration with NiMo and CoMo solutions in two stages was used on PdPt-
zeolite to get the final CoMoNi/PdPt-HY catalyst.
8.1.6.1 Conversion of DBT in HDS of Heavy Gas Oil
The reaction products of the HDS of DBT at 310 oC over this noble metal catalyst
studied is shown in Table 8.11 and Figure 8.11. The reaction products were biphenyl
208
(BPH), cyclohexylbenzene (CHB), bicyclohexyl (BCH), and H2S. Tetra-(THDBT) and
hexahydrodibenzothiophene (HHDBT) were not analyzed. As expected, the conversions
XDBT, XBPH, XCHB and XBCH increased with space time.
DBT was also mainly desulfurized and hydrogenated into CHB and BCH and H2S at
the operating conditions used. Even though CoMoNi/PdPt-HY had a BET surface area
of 129.6 m2/g and total pore volume of 0.083 cc/g was the best of all catalysts studied.
The catalyst shows an excellent activity for HDS and HDA of DBT and 4,6-DMDBT.
The high performance is attributed at its higher molybdenum concentration and its final
metal composition (Co 2.37 wt%, Mo 17.6 wt%, Ni 1.49 wt , Pt 0.39 wt%, and Pd
0.24wt%)
CoMoNi/PdPt-HY compared with the CoMoPd/Pt-HY catalyst, which had been the
best catalysts, shows better activity for the HDS. The DBT total conversion over
CoMoNi/PdPt-HY varied from 24.1 to 28.3% with space time vs from 19.6 to 26.9%
over CoMoPd/Pt-HY is (Table 8.5.)
The conversions of DBT into BPH, CHB and BCH varied from 3.2 to 4.7%, from
7.6 to 9.9% and from 9.7 to 13.8% with space time respectively.
Table 8.11 Conversions of DBT into their reaction products as a function of space time (W/Fo
DBT) over CoMoNi/PdPt-HY catalyst W/Fo
DBT Conversion [%]
Kgcath/Kmol X DBT XBPH XCHB XBCH
4000 24.1 3.2 7.6 9.7 5000 25.8 4.4 8.7 12.5 6000 28.3 4.7 9.9 13.8
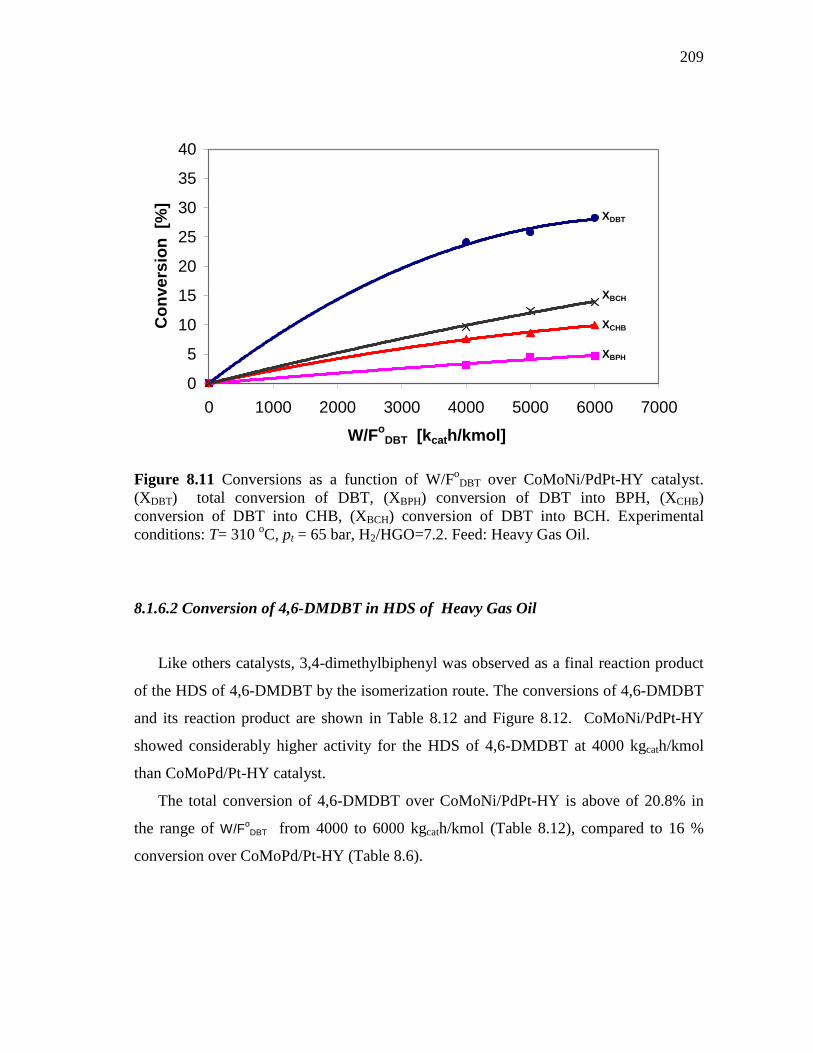
209
0
5
10
15
20
25
30
35
40
0 1000 2000 3000 4000 5000 6000 7000
W/FoDBT [k cath/kmol]
Con
vers
ion
[%] XDBT
XBPH
XCHB
XBCH
Figure 8.11 Conversions as a function of W/Fo
DBT over CoMoNi/PdPt-HY catalyst. (XDBT) total conversion of DBT, (XBPH) conversion of DBT into BPH, (XCHB) conversion of DBT into CHB, (XBCH) conversion of DBT into BCH. Experimental conditions: T= 310 oC, pt = 65 bar, H2/HGO=7.2. Feed: Heavy Gas Oil.
8.1.6.2 Conversion of 4,6-DMDBT in HDS of Heavy Gas Oil
Like others catalysts, 3,4-dimethylbiphenyl was observed as a final reaction product
of the HDS of 4,6-DMDBT by the isomerization route. The conversions of 4,6-DMDBT
and its reaction product are shown in Table 8.12 and Figure 8.12. CoMoNi/PdPt-HY
showed considerably higher activity for the HDS of 4,6-DMDBT at 4000 kgcath/kmol
than CoMoPd/Pt-HY catalyst.
The total conversion of 4,6-DMDBT over CoMoNi/PdPt-HY is above of 20.8% in
the range of W/FoDBT from 4000 to 6000 kgcath/kmol (Table 8.12), compared to 16 %
conversion over CoMoPd/Pt-HY (Table 8.6).
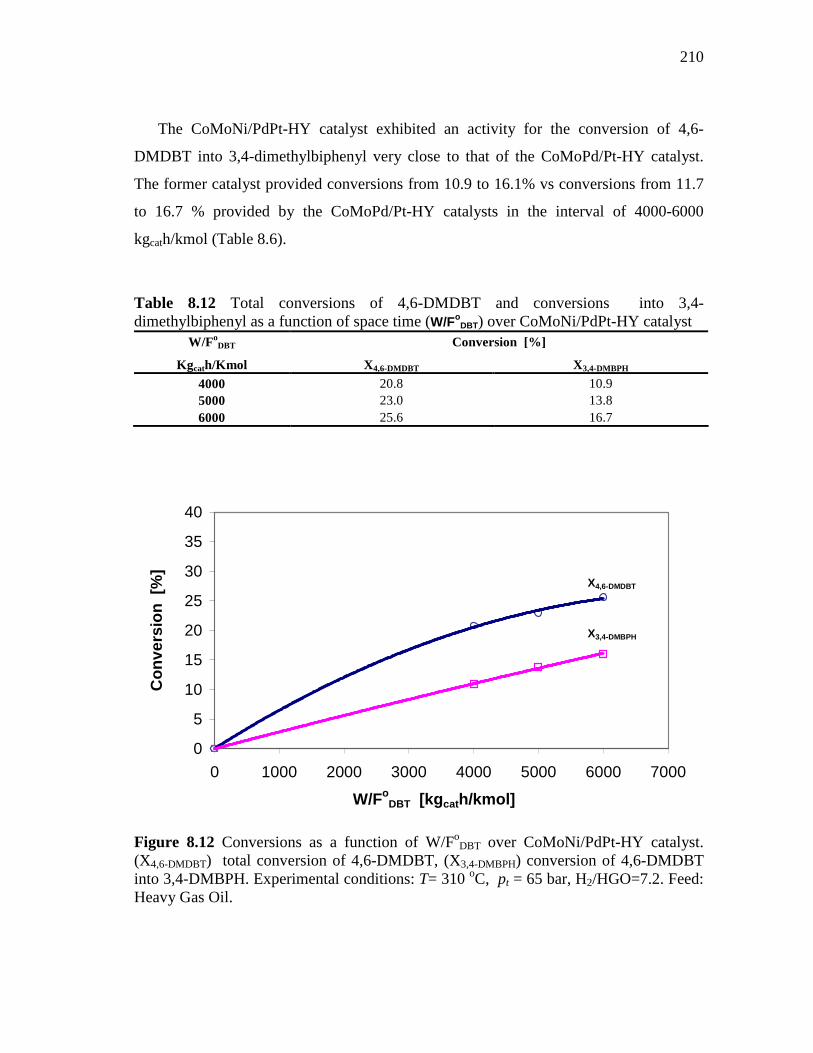
210
The CoMoNi/PdPt-HY catalyst exhibited an activity for the conversion of 4,6-
DMDBT into 3,4-dimethylbiphenyl very close to that of the CoMoPd/Pt-HY catalyst.
The former catalyst provided conversions from 10.9 to 16.1% vs conversions from 11.7
to 16.7 % provided by the CoMoPd/Pt-HY catalysts in the interval of 4000-6000
kgcath/kmol (Table 8.6).
Table 8.12 Total conversions of 4,6-DMDBT and conversions into 3,4- dimethylbiphenyl as a function of space time (W/Fo
DBT) over CoMoNi/PdPt-HY catalyst W/Fo
DBT Conversion [%]
Kgcath/Kmol X 4,6-DMDBT X3,4-DMBPH
4000 20.8 10.9 5000 23.0 13.8 6000 25.6 16.7
0
5
10
15
20
25
30
35
40
0 1000 2000 3000 4000 5000 6000 7000
W/FoDBT [kg cath/kmol]
Con
vers
ion
[%] X4,6-DMDBT
X3,4-DMBPH
Figure 8.12 Conversions as a function of W/Fo
DBT over CoMoNi/PdPt-HY catalyst. (X4,6-DMDBT) total conversion of 4,6-DMDBT, (X3,4-DMBPH) conversion of 4,6-DMDBT into 3,4-DMBPH. Experimental conditions: T= 310 oC, pt = 65 bar, H2/HGO=7.2. Feed: Heavy Gas Oil.
211
8.2 Concluding Remarks
Among the catalysts examined, catalysts containing metal-zeolite exhibited the best
activity for HDS conversions of alkyldibenzothiophenes in the heavy gas oil.
The trimetallic CoMoNi supported on PdPt-modified USY zeolite, i.e.,
CoMoNi/PdPt-HY (HDS-10) catalyst and trimetallic CoMoPd supported on Pt-modified
USY zeolite, ie., CoMoPd/Pt-HY (HDS-5) catalyst, showed excellent HDS and HDA
activity. These catalysts could be used in one-stage hydrotreating, in which deep HDS
reaction of fractions oil containing S<500 ppm are used; however, some studies of the
performance over a long period of operating time should be addressed to confirm the
sulfur tolerance.
Hydrodesulfurization of 4,6-DMDBT into 3,4-dimethylbiphenyl certainly was
observed. The results suggest isomerization of 4,6-DMDBT prior to HDS. This agrees
with Isoda et al., (1996), since methyl migrations could occur over zeolite catalysts.
More characterizations of these catalysts are still needed to fully understand how the
chemistry of the supports is related to the activity.
The optimization of the activation conditions could be essential to fully define the
potential of these catalysts.
212
CHAPTER IX
CONCLUSIONS
Co, Mo, Ni, Pd, Pt-promoted zeolites were synthesized to enhance the removal of
sulfur containing compounds through the hydrogenation route. The synthesis of the
catalysts was carried out by two different methods, namely the incipient wetness
impregnation and combining impregnation and ion exchange. Metal contents and texture
of the metal zeolite catalysts were analyzed and compared. Hydrodesulfurization of
heavy gas oil is used as probe reactions to examine the activity of the zeolite catalysts as
well as the activity of a commercial CoMo/Al2O3 catalyst. From the results, the
following conclusions can be drawn.
In the dibenzothiophene family dibenzothiophene exhibits the highest HDS
reactivity, whereas alkyl-DBTs exhibit very different reactivities, strongly depending on
the positions of the alkyl substituents. Alkyl substituents at the 4 and/or 6 positions
appeared to have the lowest reactivity as observed in diesel fuel (Ma et al., 1994).
Three routes of HDS of 4,6-DMDBT are proposed: One is the hydrogenolysis route
where the sulfur atom is directly eliminated without hydrogenation of the aromatic ring,
the other is the hydrogenation route where the hydrogenation of an olefinic bond or an
aromatic ring takes place prior to the hydrogenolysis of the C-S bond and finally the
isomerization route where the migration of the substituted methyl groups of 4,6-
DMDBT occur prior to the hydrogenolysis of the C-S bond.
Since the conversions of sulfur containing compounds depend strongly on the
reactions conditions, such as temperature, H2/HC ratio and space time, and HGO
contains a lot of light and heavy aromatic compounds in the boiling range of 151-406 oC
which are easily cracked at high temperature and low H2 concentration, it is
recommended that the hydrodesulfurization of heavy gas oil be carried out at
temperature of 310 oC, higher H2/HC ratio than 7.2 and higher space time than 6000
kgcath/kmol.
213
The study has examined the use of zeolite catalysts for hydrodesulfurization of heavy
gas oil. The CoMoPd/Pt-HY (HDS-5) and CoMoNi/PdPt-HY (HDS-10) catalysts belong
to a new class of hydrotreating catalysts with distinct properties, such as potential to
tolerate sulphur compounds due to its palladium content. Those catalysts are candidates
for deep HDS (S<50 ppm) of heavy gas oil with good hydrogenation of aromatic
compounds.
214
LITERATURE CITED
Anderson, J.R.; Pratt, K.C. Introduction to Characterization and Testing of Catalysts; Academic Press: Sydney, Australia, 1985.
Anderson J.R.; Boudart M. Catalysis: Science and Technology; Springer-Verlag: New
York, 1996. Albermale Catalysts. Effect of H2S on Hydroprocessing Reactions. From the web. : http://www.albemarlecatalysts.com/navigation/hydroprocessing/A_home.htm,
accessed on July 2003. Bekkim V.H.; Flanigen E.M.; Jansen E.M., J.C. (Eds). Introduction into Zeolite Science
and Practice; Elsevier: Amsterdam, 1991. Buteyn, J. L.; Kosman, J. J. Multielement Simulated Distillation by Capillary GC-
MED. Journal of Chromatographic Science. 1990, 28(1), 19-23. Chen, J.; Te, M.; Yang, H., and Ring, Z. Hydrodesulfurization of Dibenzothiophenic
Compounds in a Light Cycle Oil. Petroleum Science and Technology. 2003, 21 (5&6), 911-935.
Chianelli, R. R.; Pecoraro, T. A.; Halbert, T. R.; Pan, W. H.; Stiefel, E. I. Transition
Metal Sulfide Catalysis: Relation of the Synergic Systems to the Periodic Trends in Hydrodesulfurization. Journal of Catalysis. 1984, 86(1), 226-30.
Cid, R.; Neira, J.; Godoy, J.; Palacios, J.M.; López, A. A. Thiophene
Hydrodesulfurization on Sulfided Nickel-exchanged USY Zeolites. Effect of the pH of the Catalyst Preparation, Appl. Catal. A. General. 1995, 125, 169–183.
Cid, R.; Atanasova, P.; López, C. R.; Palacios, J. M.; López, A. A. Gas Oil
Hydrodesulfurization and Pyridine Hydrodenitrogenation over NaY-Supported Nickel Sulfide Catalysts: Effect of Ni Loading and Preparation Method, J. Catal. 1999, 182, 328–338.
Criterion Catalysts & Technologies. Centinel DC-2118 for Ultra Deep Desulphurisation.
Product Bulletin Centinel DC-2118, 2003 DePauw, G. A.; Froment, G. F. Molecular Analysis of the Sulphur Components in a
Light Cycle Oil of a Catalytic Cracking Unit by GC-MS and GC-AED. J. Chromatog. A, 1997, 761 (1-2), 231.
215
Farragher, A.L. Symposium on the Role of Solid State Chemistry in Catalysis. ACS Meeting, New Orleans, LA, 1977.
Farragher, A. L.; Cossee, P. Catalytic Chemistry of Molybdenum and Tungsten
Sulfides and Related Ternary Compounds. Catal., Proc. Int. Congr., 5th. 1973, Meeting Date 1972, 2 1301-18.
Froment, G. F. Modeling in the Development of Hydrotreatment Processes. Catalysis
Today. 2004, 98(1-2), 43-54 Froment G.F.; Depauw G.; Vanrysselberghe V. Kinetic Modeling and Reactor
Simulation in Hydrodesulfurization of Oil Fractions, Ind. Eng. Chem. Res. 1994, 33, 2975.
Fujikawa, T.; Chiyoda, O.; Tsukagoshi, M.; Idei, K; Takehara, S. Development of a
High Activity HDS Catalyst for Diesel Fuel: From Basic Research to Commercial Experience, Cat. Today. 1998, 45, 307–312.
Gates, B. C.; Katzer, J. R.; Schuit, G. C. A. Chemistry of Catalytic Processes; McGraw-
Hill: New York, 1979. Girgis, M.J.; Gates, B. C. Reactivities, Reaction Networks, and Kinetics in High-
Pressure Catalytic Hydroprocessing. Ind. Eng. Chem. Res. 1991, 30, 2021. Honna, K.; Sato, K. ; Araki, Y.; Miki, Y.; Matsubayashi, N.; Shimada, H. HY Zeolite-
Based Catalysts for Hydrocracking Heavy Oils. In Hydrotreatment and Hydrocraking of Oil Fractions, Stud. Surf. Sci. Cat. B. 127, Delmon, G.F. Froment and P. Grange, Eds., Elsevier Science: Amsterdam, The Netherlands, 1999, 427–430.
Houalla, M.; Broderick, D. H.; Sapre, A. V.; Nag, N. K.; De Beer, V. H. J.; Gates, B. C.;
Kwart, H. Hydrodesulfurization of Methyl-Substituted Dibenzothiophenes Catalyzed by Sulfided Co-Mo/γ-Al 2O3. J. Catal. 1980, 61, 523.
Houalla, Marwan; Nag, N. K.; Sapre, A. V.; Broderick, D. H.; Gates, B. C.
Hydrodesulfurization of Dibenzothiophene Catalyzed by Sulfided Cobalt Oxide-molybdenum trioxide/γ -alumina: the reaction network. AIChE Journal, 1978, 24(6), 1015-21.
Isoda T.; Ma X.; Mochida I. Hydrodesulfurization Reactivities of
Alkyldibenzothiophenes over Sulfided Molybdenum Based catalysts,. 208th National Meeting, Am. Chem. Soc.: Washington, D.C., August 21-26, 1994.
216
Isoda T.; Nagao S.; Ma X.; Korai Y.; Mochida I. Hydrodesulfurization Pathway of 4,6-Dimethyldibenzothiophene through Isomerization over Y-Zeolite Containing CoMo/Al2O3 Catalyst. Energy & Fuels. 1996, 10, 1078.
Isoda, T.; Takase, Y.; Kusakabe, K.; Morooka, S. Changes in Desulfurization Reactivity
of 4,6-Dimethyldibenzothiophene by Skeletal Isomerization Using a Ni Supported Y-Type Zeolite, Energy & Fuels, 2000, 14, 585–590.
Jan, C.; Lin, T.; Chang J. Aromatics Reduction over Supported Platinum Catalysts. 2.
Effects of Catalyst Precursors and Pretreatment Conditions on the Performance of Palladium-Promoted Platinum Catalysts. Ind. Eng. Chem. Res. 1996, 35,3893-3898.
Kabe, T.; Ishihara, A.; Tajima, H. Hydrodesulfurization of Sulfur-Containing
Polyaromatic Compounds in Light Oil. Ind. Eng. Chem. Res. 1992, 31, 1577. Kabe, Toshiaki; Ishihara, Atsushi; Zhang, Qing; Tsutsui, Hiroko; Tajima, Haruhiko.
Deep desulfurization of light oil. (Part 1). Hydrodesulfurization of Methyl-Substituted Benzothiophenes and Dibenzothiophenes in Light Gas Oil. Sekiyu Gakkaishi, 1993, 36(6), 467-71.
Kabe, T.; Ishiara, A.; Qian, W. Hydrodesulfurization and Hydrodenitrogenation;
Kodansha Ltd.: Tokyo, 1999. Kerkhof, F. P. J. M.; Moulijn, J. A. Quantitative Analysis of XPS Intensities for
Supported Catalysts. Journal of Physical Chemistry, 1979, 83(12), 1612-19. Kilanowski, D. R.; Teeuwen, H.; De Beer, V. H. J.; Gates, B. C.; Schuit, G. C. A.;
Kwart, H. Hydrodesulfurization of Thiophene, Benzothiophene, Dibenzothiophene, and Related Compounds Catalyzed by Sulfided Cobalt Oxide-molybdenum trioxide/γ -alumina: low-pressure reactivity studies. Journal of Catalysis, 1978, 55(2), 129-37.
Landau, M.V.; Berger, D.; Herskowitz, M. Hydrodesulfurization of Methyl-Substituted
Dibenzothiophenes: Fundamental Study of Routes to Deep Desulfurization. J. Catal., 1996, 159, 236–245.
Laniecki, M.; Zmierczak, W. Thiophene Hydrodesulfurization and Water-gas Shift
Reaction over Molybdenum-loaded Y-zeolite Catalysts. Zeolites. 1991, 11(1), 18-26. Lapinas, Arunas T.; Klein, Michael T.; Gates, Bruce C.; Macris, Aris; Lyons, James E.
Catalytic Hydrogenation and Hydrocracking of Fluorene: Reaction Pathways, Kinetics, and Mechanisms. Industrial & Engineering Chemistry Research. 1991, 30(1), 42-50.
217
Li, D.; Nishijima, A.; Morris, D. E. Zeolite-supported Ni and Mo Catalysts for Hydrotreatments. I. Catalytic Activity and Spectroscopy, J. Catal. 1999a, 182, 339–348.
Li, D.; Nishijima, A.; Morris, D. E.; Guthrie, G.D. Activity and Structure of
Hydrotreating Ni, Mo, and Ni-Mo Sulfide Catalysts Supported on γ-Al 2O3-USY Zeolite, J. Catal. 1999b, 188, 111–124.
Li, D.; Xu, H.; Guthrie Jr, G. D. Zeolite-Supported Ni and Mo Catalysts for
Hydrotreatments. II. HRTEM Observations, J. Catal. 2000, 189, 281–296. Ma, X.; Sakanishi, K.; Mochida, I. Hydrodesulfurization Reactivities of Various
Compounds in Diesel Fuel. Ind. Eng. Chem. Res. 1994, 33, 218. Ma, X.; Sakanishi, K.; Isoda, T.; Mochida, I. Hydrodesulfurization Reactivities of
Narrow-Cut fractions in a Gas Oil. Ind. Eng. Chem. Res. 1995, 34, 748. Ma, X.; Sakanishi, K.; Mochida, I. Hydrodesulfurization Reactivities of Various
Compounds in Vacuum Gasoil. Ind. Eng. Chem. Res. 1996, 35, 2487. Marin C.; Murrieta F.; Galvan E. Technical Reports on Hydrodesulfurization of Diesel
over Zeolite Catalysts. Instituto Mexicano del Petroleo, Mexico D.F., 2001. Meyers R.A. Handbook of Petroleum Refining Processes; McGraw-Hill Book Company:
New York, 1986. Moraweck, B.; Bergeret, G.; Cattenot, M.; Kougionas, V.; Geantet, C.; Portefaix, J.;
Zotin, J.; Breysse, M. The Nature of Ruthenium Sulfide Clusters Encaged in a Y Zeolite. Journal of Catalysis. 1997, 165(1), 45-56.
Nag, N. K.; Sapre, A. V.; Broderick, D. H.; Gates, B. C. Hydrodesulfurization of
Polycyclic Aromatics Catalyzed by Sulfided CoOMoO3/γ-Al 2O3: The Relative Reactivities. J. Catal. 1979, 57, 509.
Nishioka, M.; Bradshaw, J. S.; Lee, M. L.; Tominaga, Y.; Tedjamulia, M.; Castle, R. N.
Capillary Column Gas Chromatography of Sulfur Heterocycles in Heavy Oils and Tars Using a Biphenyl Polysiloxane Stationary Phase. Analytical Chemistry. 1985, 57(1), 309-12.
Okamoto, Y.; Preparation and Characterization of Zeolite-supported Molybdenum and
Cobalt-molybdenum Sulfide Catalysts. Catalysis Today. 1997, 39(1-2), 45-60.
218
Pawelec, B.; Fierro, J.L.G.; Cambra, J.F.; Arias, P.L.; Legarreta, J.A.; Vorbeck, G.; De Haan, J.W.; De Beer, V.H.J.; Van Santen, R.A. The Effect of Sulfidation on the Ni Distribution in Ni/USY Zeolites. Zeolites. 1997, 18(4), 250-259.
Penchev, V.; Davidova, N.; Kanazirev, V.; Minchev, Kh.; Neinska, I. Catalytic
Functions of Metal-zeolite Systems. Advances in Chemistry Series. 1973, 121, 461. Prins R. Catalytic Hydrodenitrogenation, Adv. Catal. 2001, 46, 399. Satterfield C.; Modell M.; Wilkens J. Simultaneous Catalytic Hydrodenitrogenation of
Pyridine and Hydrodesulfurization of Thiophene. Ind. Eng. And Chem. Proc. Design and Dev. 1980, 19, 154.
Schuit, G.C.A.; Gates, B.C. Chemistry and Engineering of Catalytic Hydrodesulfuri-
zation. AIChE Journal. 1973, 19(3), 417-38. Set Laboratories, Inc. Catalytic Hydrodesulfurization Process. From the web:
http://www.setlaboratories.com/cat2.htm#Hydrodesulfurization%20Process, access-ed on March 2006.
Shimada, K.; Yoshimura, Y. Ultra- deep Hydrodesulfurization and Aromatics
Hydrogenation of Diesel Fuel over a Pd-Pt Catalyst Supported on Yttrium-modified USY. Journal of the Japan Petroleum Institute. 2003, 46(6), 368-374.
Song, C.; Schmitz, A. D. Zeolite-supported Pd and Pt Catalysts for Low-Temperature
Hydrogenation of Naphthalene in the Absence and Presence of Benzothiophene. Energy & Fuels. 1997, 11(3), 656-661.
Song C., Designing Sulfur-resistant, Noble-metal Hydrotreating Catalysts, Chemtech.
1999, 29(3), 26-30 Song, C.; Hsu, C. S.; Mochida, I. Chemistry of Diesel Fuels; Taylor and Francis: New
York, NY, 2000. Speight, J. G. The Desulfurization of Heavy Oils and Residua; Marcel Dekker: New
York, 1981. Speight, J. G. The Desulfurization of Heavy Oils and Residua; Second edition, revised
and expanded, Marcel Dekker: New York, 2000. Speight J.G., Handbook of Petrolerum Product Analysis; John Wiley & Sons, Inc.:
Hoboken, New Jersey, 2002.
219
Sugioka, M.; Sado, F.; Matsumoto, Y.; Maesaki, N. New Hydrodesulfurization Catalysts: Noble Metals Supported on USY Zeolite. Catalysis Today, 1996, 29(1-4), 255-259.
Szostak, R. Handbook of Molecular Sieves; Van Nostrand Reinhold: NewYork,1992. Taniguchi, M.; Imamura, D. ; Ishige, H.; Ishii, Y.; Murata, T. ; Hidai, M.; Zanibelli, L.;
Berti, D.; Ferrari, M.; Flego, C.; Riva, R. The Influence of Zeolite Introduction on the HDS Activity of CoMo Catalysts. In Hydrotreatment and Hydrocraking of Oil Fractions, Stud. Surf. Sci. Cat. 127, B. Delmon, G.F. Froment and P. Grange, Eds., Elsevier Science, Amsterdam, The Netherlands, 1999, 219–226.
Thomas J. M. Thomas W.J., Principles and Practice of Heterogeneous Catalysis; VCH:
Weinheim, Germany, 1997. Topsoe, H.; Clausen, B.; Topsoe, N.Y.; Hyldtoft, J. Experimental and Theoretical
Studies of Periodic Trends and Promotional Behavior of Hydrotreating Catalysts. Preprints - American Chemical Society, Division of Petroleum Chemistry. 1993, 38(3), 638-41.
Topsoe H.; Clausen B.S.; Massoth F.E. Hydrotreating Catalysis: Science and
Technology; Springer-Verlag: Berlin, 1996. Velu S.; Song C.; Engelhard M.; Chin Y. Adsorptive Removal of Organic Sulfur
Compounds from Jet Fuel over K-Exchanged NiY Zeolites Prepared by Impregnation and Ion Exchange, Ind. Eng. Chem. Res. 2005, 44, 5740.
Vanrysselberghe, V.; Froment, G. F. Hydrodesulfurization of Dibenzothiophene on a
CoMo/Al2O3 Catalyst: Reaction Network and Kinetics. Ind. Eng. Chem. Res. 1996, 35, 3311.
Vanrysselberghe, V.; Le Gall, R.; Froment, G. F. Hydrodesulfurization of 4-
Methyldibenzothiophene and 4,6-Dimethyldibenzothiophene on a CoMo/Al2O3 Catalyst: Reaction Network and Kinetics. Ind. Eng. Chem. Res. 1998, 37, 1235.
Vanrysselberghe, V.; Froment, G. F. Kinetic Modeling of Hydrodesulfurization of Oil
Fractions: Light Cycle Oil. Ind. Eng. Chem. Res. 1998, 37, 4231. Vanrysselberghe V.; Froment G. F. Hydrodesulfurization-Heterogeneous. Encyclopedia
of Catalysis, John Wiley & Sons, Inc.:, New York, 2003. Voorhoeve, R. J. H. Electron Spin Resonance Study of Active Centers in Nickel-
tungsten Sulfide Hydrogenation Catalysts. Journal of Catalysis. 1971, 23(2), 236-42.
220
Voorhoeve, R. J. H.; Stuiver, J. C. M. Kinetics of Hydrogenation on Supported and Bulk Nickel-tungsten Sulfide Catalysts. Journal of Catalysis. 1971, 23(2), 228-35.
Vrinat, M. L.; The Kinetics of the Hydrodesulfurization Process: A Review. Appl. Catal.
1983, 6, 137-158. Weisser, O.; Landa, S. Sulfided Catalysts, Their Properties and Applications; Pergamon
Press: Oxford, 1973. Yasuda, H.; Kameoka, T.; Sato, T.; Kijima, N.; Yoshimura, Y. Sulfur-tolerant Pd-
Pt/Al2O3 Catalyst for Aromatic Hydrogenation. Applied Catalysis, A: General. 1999, 185(2), L199-L201.
Zanibelli, L.; Berti, D.; Ferrari, M.; Flego, C.; Riva, R. The Influence of Zeolite
Introduction on the HDS Activity of CoMo Catalysts. Studies in Surface Science and Catalysis. 1999, 127, 219-226.
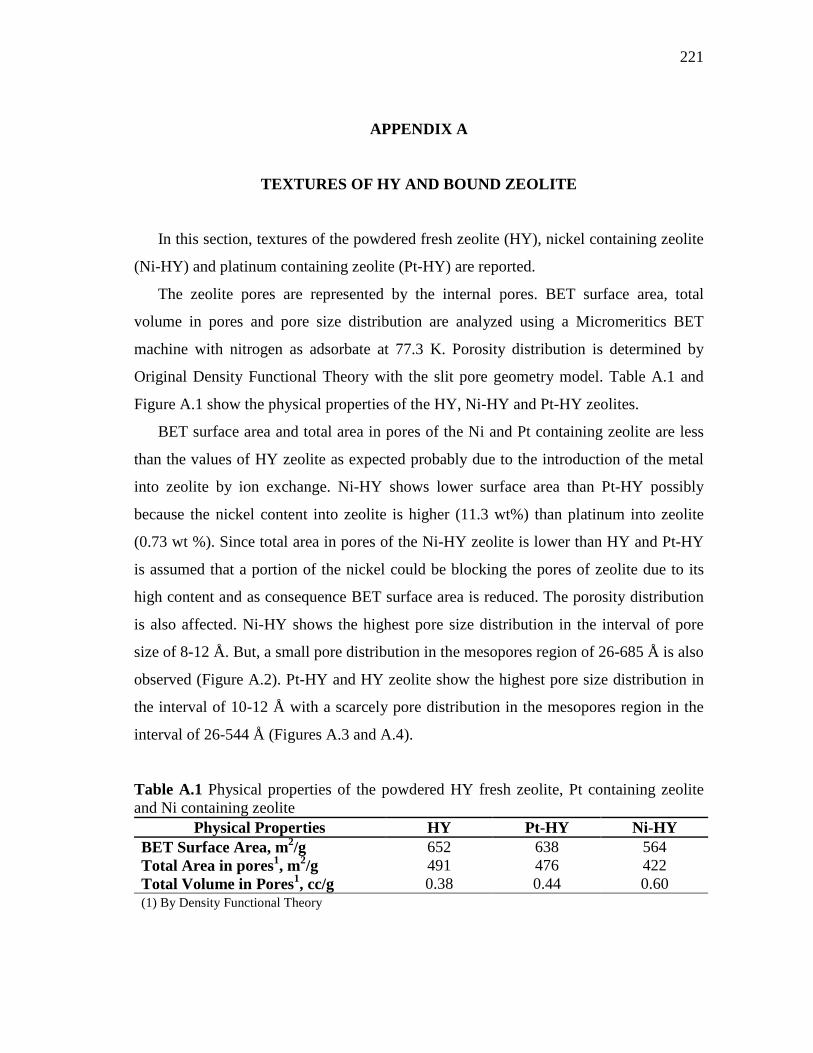
221
APPENDIX A
TEXTURES OF HY AND BOUND ZEOLITE
In this section, textures of the powdered fresh zeolite (HY), nickel containing zeolite
(Ni-HY) and platinum containing zeolite (Pt-HY) are reported.
The zeolite pores are represented by the internal pores. BET surface area, total
volume in pores and pore size distribution are analyzed using a Micromeritics BET
machine with nitrogen as adsorbate at 77.3 K. Porosity distribution is determined by
Original Density Functional Theory with the slit pore geometry model. Table A.1 and
Figure A.1 show the physical properties of the HY, Ni-HY and Pt-HY zeolites.
BET surface area and total area in pores of the Ni and Pt containing zeolite are less
than the values of HY zeolite as expected probably due to the introduction of the metal
into zeolite by ion exchange. Ni-HY shows lower surface area than Pt-HY possibly
because the nickel content into zeolite is higher (11.3 wt%) than platinum into zeolite
(0.73 wt %). Since total area in pores of the Ni-HY zeolite is lower than HY and Pt-HY
is assumed that a portion of the nickel could be blocking the pores of zeolite due to its
high content and as consequence BET surface area is reduced. The porosity distribution
is also affected. Ni-HY shows the highest pore size distribution in the interval of pore
size of 8-12 Å. But, a small pore distribution in the mesopores region of 26-685 Å is also
observed (Figure A.2). Pt-HY and HY zeolite show the highest pore size distribution in
the interval of 10-12 Å with a scarcely pore distribution in the mesopores region in the
interval of 26-544 Å (Figures A.3 and A.4).
Table A.1 Physical properties of the powdered HY fresh zeolite, Pt containing zeolite and Ni containing zeolite
Physical Properties HY Pt-HY Ni-HY BET Surface Area, m2/g 652 638 564 Total Area in pores1, m2/g 491 476 422 Total Volume in Pores1, cc/g 0.38 0.44 0.60 (1) By Density Functional Theory
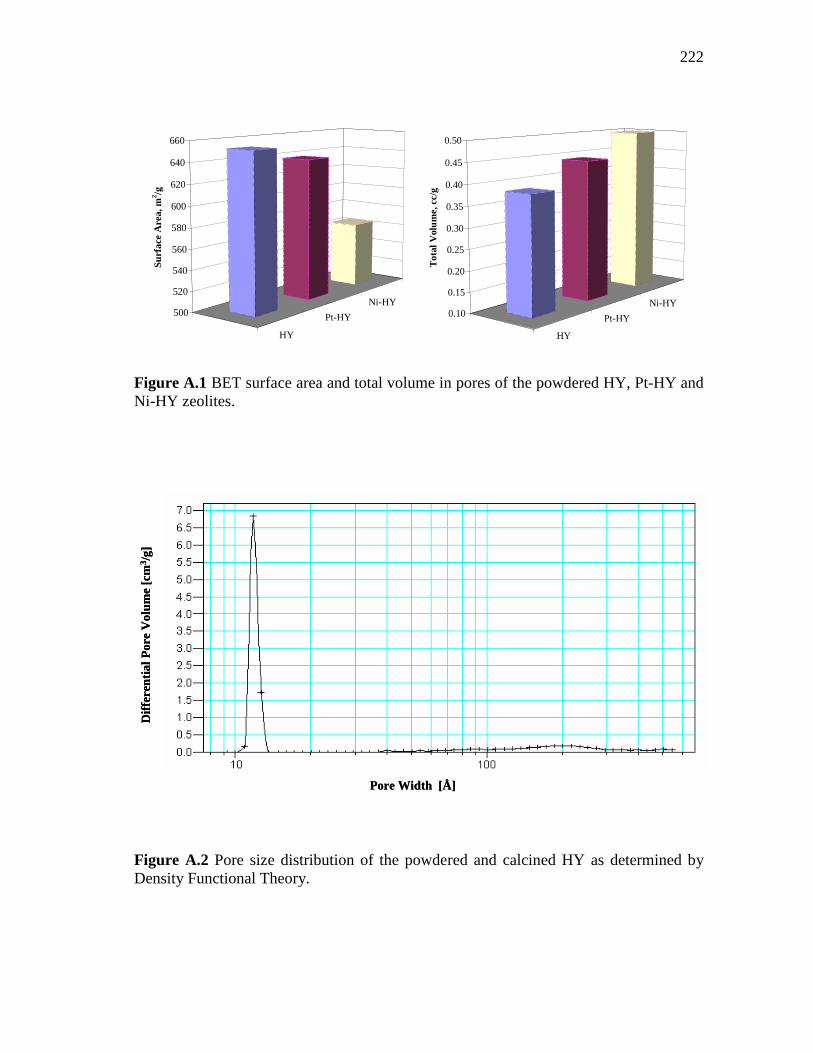
222
HY
Pt-HY
Ni-HY500
520
540
560
580
600
620
640
660
Sur
face
Are
a, m
2 /g
HY
Pt-HY
Ni-HY0.10
0.15
0.20
0.25
0.30
0.35
0.40
0.45
0.50
Tot
al V
olum
e, c
c/g
Figure A.1 BET surface area and total volume in pores of the powdered HY, Pt-HY and Ni-HY zeolites.
Figure A.2 Pore size distribution of the powdered and calcined HY as determined by Density Functional Theory.
Pore Width [Å]
Diff
eren
tial P
ore
Vol
ume
[cm
3 /g]
Pore Width [Å]
Diff
eren
tial P
ore
Vol
ume
[cm
3 /g]
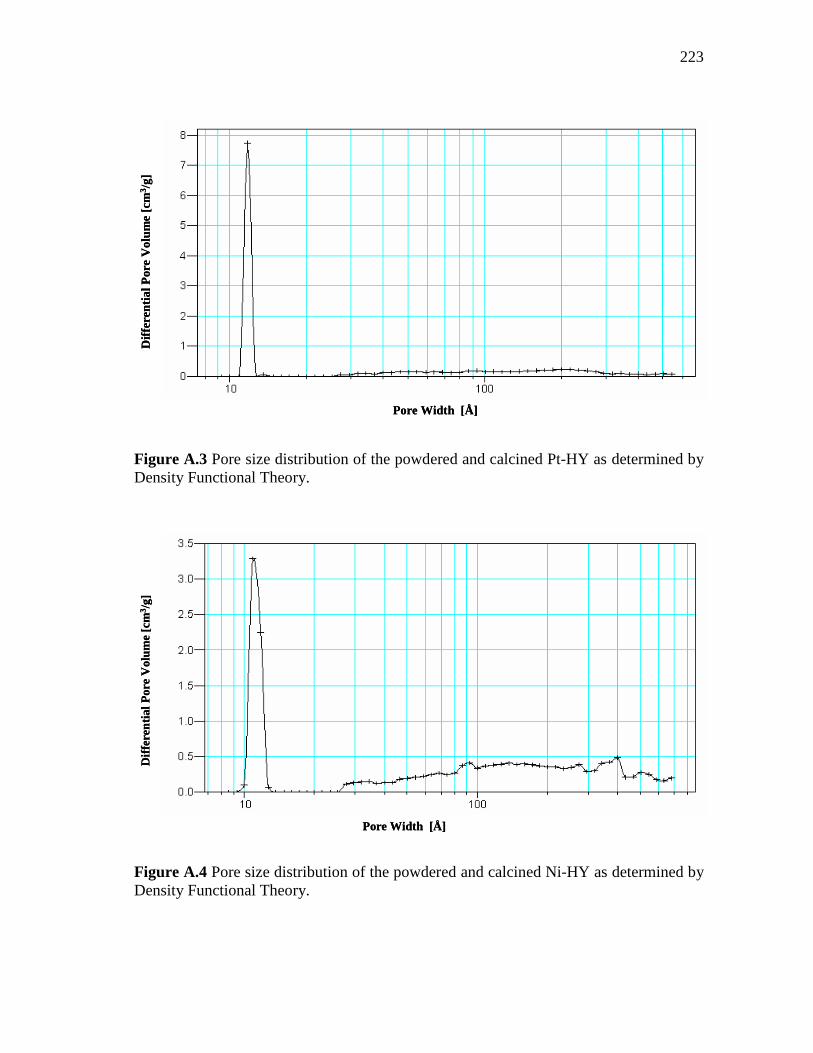
223
Figure A.3 Pore size distribution of the powdered and calcined Pt-HY as determined by Density Functional Theory.
Figure A.4 Pore size distribution of the powdered and calcined Ni-HY as determined by Density Functional Theory.
Diff
eren
tial P
ore
Vol
ume
[cm
3 /g]
Pore Width [Å]
Diff
eren
tial P
ore
Vol
ume
[cm
3 /g]
Pore Width [Å]
Diff
eren
tial P
ore
Vol
ume
[cm
3 /g]
Pore Width [Å]
Diff
eren
tial P
ore
Vol
ume
[cm
3 /g]
Pore Width [Å]
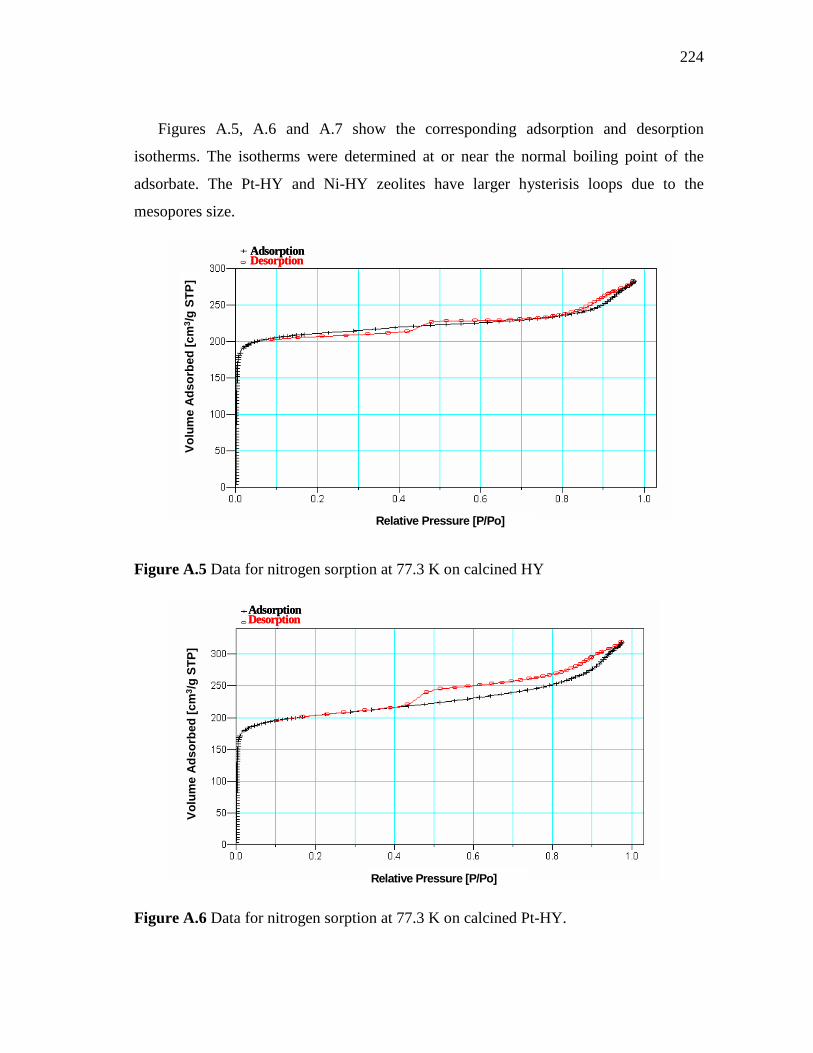
224
Figures A.5, A.6 and A.7 show the corresponding adsorption and desorption
isotherms. The isotherms were determined at or near the normal boiling point of the
adsorbate. The Pt-HY and Ni-HY zeolites have larger hysterisis loops due to the
mesopores size.
Figure A.5 Data for nitrogen sorption at 77.3 K on calcined HY Figure A.6 Data for nitrogen sorption at 77.3 K on calcined Pt-HY.
Vol
ume
Ads
orbe
d [c
m3 /
g S
TP
]
AdsorptionDesorption
Relative Pressure [P/Po]
Vol
ume
Ads
orbe
d [c
m3 /
g S
TP
]
AdsorptionDesorptionAdsorptionDesorption
Relative Pressure [P/Po]
Vol
ume
Ads
orbe
d [c
m3 /
g S
TP
]
AdsorptionDesorption
Relative Pressure [P/Po]
Vol
ume
Ads
orbe
d [c
m3 /
g S
TP
]
AdsorptionDesorptionAdsorptionDesorption
Relative Pressure [P/Po]
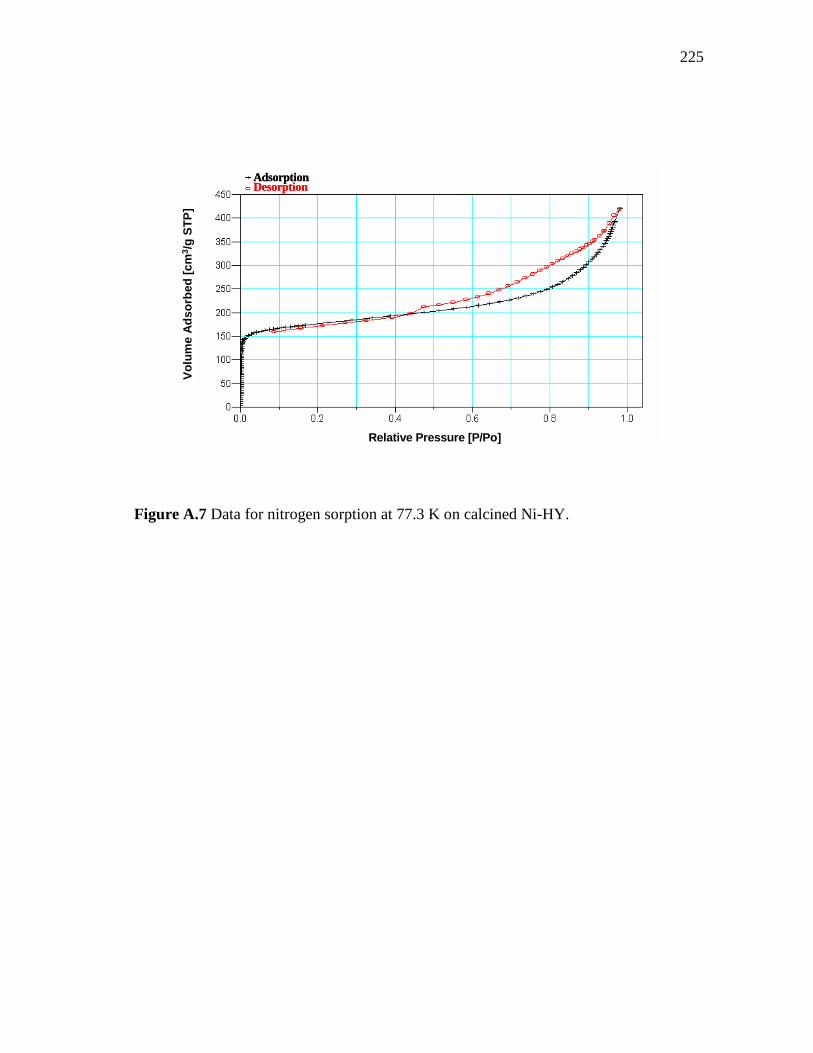
225
Figure A.7 Data for nitrogen sorption at 77.3 K on calcined Ni-HY.
AdsorptionDesorption
Vol
ume
Ads
orbe
d [c
m3 /
g S
TP
]
Relative Pressure [P/Po]
AdsorptionDesorptionAdsorptionDesorption
Vol
ume
Ads
orbe
d [c
m3 /
g S
TP
]
Relative Pressure [P/Po]
226
VITA
Celia Marin-Rosas was born in D.F., Mexico, to Mr. Pablo Marin Cervantes and
Mrs. Celia Rosas Blancas. In 1980, She attended the Universidad Nacional Autonoma de
Mexico, Mexico, where she received a Bachelor of Science degree in chemical
engineering in 1984. In this year, she began to work at Instituto Mexicano del Petroleo
(IMP) as a researcher in the Department of Catalysis. While she was working at IMP,
she attended the Instituto Politecnico Nacional, Mexico, for a master’s degree in
chemical engineering (1988-1990). She is author of several patents and papers of
catalysts development for the Petrochemical and Refining Industries.
She received a scholarship from IMP to study in the USA for a Ph.D. in chemical
engineering. Therefore, in 2002 she attended the Texas A&M University in College
Station to begin her graduate study toward her Ph.D. in the Artie McFerrin Department
of Chemical Engineering. Her future work place after graduation will be the Mexican
Petroleum Institute in the Coordination of Research Programs and Technological
Development of Reactors and Processes, Mexico.
She can be reached through the following address: Lazaro Cardenas Mz. 7, Lt.
17, Colonia Consejo Agrarista Mexicano, C.P. 09760, Mexico, D.F. Her permanent e-
mail address in [email protected].