middle europe opportunity fund ii n.v. · other non-current assets 837 1,609 2,278 2,683 2,917...
TRANSCRIPT
1
Ier
MIDDLE EUROPE OPPORTUNITY FUND II N.V.
PALMER CAPITAL EMERGING EUROPE PROPERTY FUND N.V.
ANNUAL REPORT 2014
2
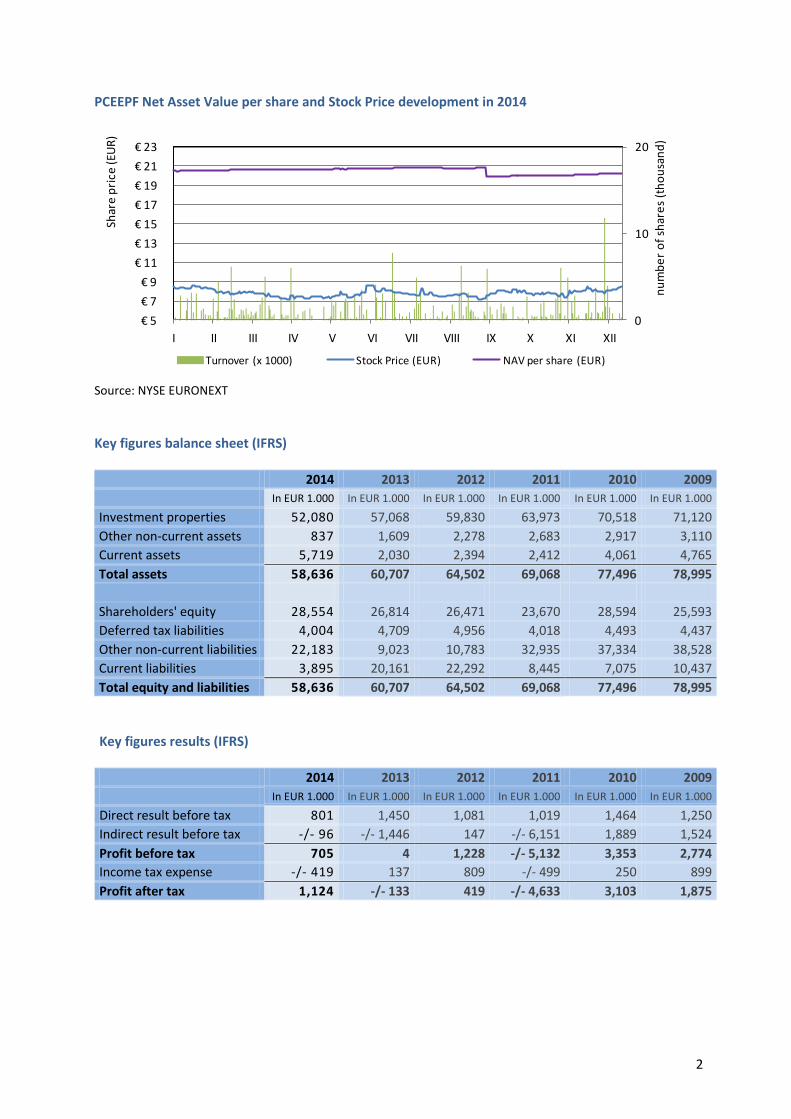
PCEEPF Net Asset Value per share and Stock Price development in 2014
Source: NYSE EURONEXT Key figures balance sheet (IFRS)
2014 2013 2012 2011 2010 2009
In EUR 1.000 In EUR 1.000 In EUR 1.000 In EUR 1.000 In EUR 1.000 In EUR 1.000
Investment properties 52,080 57,068 59,830 63,973 70,518 71,120
Other non-current assets 837 1,609 2,278 2,683 2,917 3,110
Current assets 5,719 2,030 2,394 2,412 4,061 4,765
Total assets 58,636 60,707 64,502 69,068 77,496 78,995
Shareholders' equity 28,554 26,814 26,471 23,670 28,594 25,593
Deferred tax liabilities 4,004 4,709 4,956 4,018 4,493 4,437
Other non-current liabilities 22,183 9,023 10,783 32,935 37,334 38,528
Current liabilities 3,895 20,161 22,292 8,445 7,075 10,437
Total equity and liabilities 58,636 60,707 64,502 69,068 77,496 78,995
Key figures results (IFRS) 2014 2013 2012 2011 2010 2009
In EUR 1.000 In EUR 1.000 In EUR 1.000 In EUR 1.000 In EUR 1.000 In EUR 1.000
Direct result before tax 801 1,450 1,081 1,019 1,464 1,250
Indirect result before tax -/- 96 -/- 1,446 147 -/- 6,151 1,889 1,524
Profit before tax 705 4 1,228 -/- 5,132 3,353 2,774
Income tax expense -/- 419 137 809 -/- 499 250 899
Profit after tax 1,124 -/- 133 419 -/- 4,633 3,103 1,875
0
10
20
€ 5
€ 7
€ 9
€ 11
€ 13
€ 15
€ 17
€ 19
€ 21
€ 23
I II III IV V VI VII VIII IX X XI XII
nu
mb
er
of
shar
es
(th
ou
san
d)
Turnover (x 1000) Stock Price (EUR) NAV per share (EUR)
Shar
e p
rice
(EU
R)

3
Key data per 31-12-2014 and 31-12-2013
31-12-2014 31-12-2013
Number of properties 15 17
Total Assets (in EUR 1,000) 58,636 60,707
Shareholders’ Equity (in EUR 1,000) 28,554 26,814
Total Liabilities (in EUR 1,000) 30,082 33,893
Bank Debts (in EUR 1,000) 24,682 27,099
LTV (in %)* 44.7 47.5
Net Asset Value per share (in EUR) 20.24 20.42
Share price at Euronext (in EUR) 8.45 8.49
Occupancy (in %) 75.0 73.9
Gross Income (in EUR 1,000) 6,960 7,563 * defined as Bank Debts / Investment property and other investments
Portfolio distribution at end 2014
Fair value per city at 31-12-2014 Portfolio area occupancy at 31-12-2014
23%
10%
8%
7%
52%
Prague, Czech Republic Brno, Czech Republic
Zilina, Slovakia Bratislava, Slovakia
Kosice, Slovakia
Czech Portfolio;
25,0%
Slovak Portfolio;
50,0%
Vacant
Czech Portfolio Slovak Portfolio

4
PALMER CAPITAL EMERGING EUROPE PROPERTY FUND N.V. Incorporation Palmer Capital Emerging Europe Property Fund N.V. (the Fund) is an investment company with variable capital within the meaning of article 76a of Book 2 of the Dutch Civil Code. The Fund was incorporated on 27 November 2002 by a notarial deed executed before Prof. D.F.M.M. Zaman, civil-law notary in Rotterdam. Registered Office and entry in Trade Register The Fund is registered in Amsterdam and is entered in the Trade Register of the Chamber of Commerce ‘Oost Nederland’ under number 08110094. Office Address Parkweg 4 7411 SH Deventer the Netherlands Tel: +31 (0)570 66 58 60 F: +31 (0)570 66 58 61 E-Mail: [email protected] Website: www.palmercapital.nl Correspondence Address P.O. Box 211 7400 AE Deventer the Netherlands Supervisory Board The Supervisory Board of the Fund comprises: Prof. Dr. J.L. Bouma (chairman) till 19 June 2014 Mr H.H. Kloos (chairman) since 19 June 2014 B. Vos M.Sc. The members of the Supervisory Board have chosen domicile at the offices of The Fund. H.H. Kloos, RBA, was born in Nijmegen (NL) on 1 September 1957. Mr. Kloos has been appointed in 2014 and is a former Director of VVAA Groep B.V. and FBS Bankiers N.V. Mr. Kloos is currently owner of Kloos Consultants B.V. and was appointed on an interim basis as Managing Director of several companies such as Robein Bank, Middle Europe Investments N.V., Palmer Capital Fondsenbeheer B.V., De’ Medici Vermogensbeheer B.V. and Auragenix N.V. Mr. Kloos is currently managing director a.i. of Mayflower Project [USA], member of the Supervisory Board of Palmer Capital Fondsenbeheer B.V., chairman of the commission of Investment Analysts with DSI and member of the Advisory Board with De’ Medici Vermogensbeheer. B. Vos M.Sc. is currently also chairman of the Supervisory Board of Palmer Capital Fondsenbeheer B.V., Palmer Capital Emerging Europe Equity Fund N.V., Palmer Capital Emerging Europe Russian Midcap Fund N.V., MEI-Middle Europe Opportunity Fund N.V. in liquidation, Middle Europe Opportunity Fund II N.V., Middle Europe Opportunity Fund III N.V. Chairman of the Advisory Board of Kempen Capital Management and Vice Chairman of the Supervisory Board of Koninklijke Reesink N.V.. Managing Board The Fund is managed by Palmer Capital Fondsenbeheer B.V. (formerly MEI-Fondsenbeheer B.V., MFB). Palmer Capital Fondsenbeheer B.V. (Managing Board) was incorporated under the name Midden-Europa Fondsenbeheer B.V. (subsequently changed into MFB) on 10 June 2002 by a notarial deed executed

5
before Mr. C.E.M. van Steenderen, public notary in Rijswijk. By a notarial deed executed before Mr. J.G.R.C. Prinsen, public notary in Deventer on 8 June 2012 the name of the Managing Board has been changed to Palmer Capital Fondsenbeheer B.V. Palmer Capital Fondsenbeheer B.V. is registered in Lochem and is entered in the Trade Register of the Chamber of Commerce ‘Oost Nederland’ under number 08107686. Palmer Capital Fondsenbeheer B.V. currently has the following directors: G.St.J. Barker LLB FRICS P.H.J. Mars M.Sc. Drs. P.H. van Kleef RC MRE The Managing Board has chosen domicile at the offices of the Fund. More information can be found on the website: http://www.palmercapital.nl. Stichting Prioriteit Stichting Prioriteit (the “Foundation”) of the Fund is managed by a Managing Board consisting of two members: G.St.J. Barker LLB FRICS H.H. Visscher Auditors KPMG Accountants N.V. Rijnzathe 1 3453 PV De Meern the Netherlands Legal Advisor Loyens & Loeff N.V. Blaak 31 3011 GA Rotterdam the Netherlands Listing and Paying Agent SNS Securities N.V. Nieuwezijds Voorburgwal 162 1012 SJ Amsterdam the Netherlands Administrator KroeseWevers Accountants B.V. Pantheon 2, 2nd floor 7500 AC Enschede the Netherlands Depositary Infintax Fund Services B.V. Gustav Mahlerplein 60p ITO Tower, 7th floor 1082 MA Amsterdam Nederland

6
Identification codes The ISIN code is NL0006311706 The REUTERS code is MERE.AE The BLOOMBERG code is MERENVFNA The Management of the Fund (Palmer Capital Fondsenbeheer B.V.) holds a licence from the AFM under the Act on the Supervision of Investment Institutions (Wet toezicht beleggingsinstellingen), which has since been absorbed into the ‘Wet Financieel Toezicht’. This investment involves risks. The price of shares may go down as well as up. Past performance is not a guarantee for future performance. Consult your broker or financial advisor prior to making any investment decisions.

7
CONTENTS
PALMER CAPITAL EMERGING EUROPE PROPERTY FUND N.V. ............................................................. 4
1 FOREWORD .......................................................................................................................... 10
2 SUMMARY ............................................................................................................................ 11
3 PROFILE ............................................................................................................................... 12
4 PRE-ADVICE OF THE SUPERVISORY BOARD .............................................................................. 14
5 REPORT OF THE MANAGEMENT BOARD ................................................................................... 15
5.1 FUND STRATEGY .................................................................................................................. 15 5.2 SUMMARY OF EVENTS .......................................................................................................... 15 5.3 OPERATIONAL HIGHLIGHTS .................................................................................................. 18 5.4 FINANCIAL HIGHLIGHTS ....................................................................................................... 21 5.5 RISK MANAGEMENT ............................................................................................................. 24 5.6 STATEMENT REGARDING ADMINISTRATIVE ORGANISATION AND INTERNAL CONTROL ............. 24 5.7 FUND COMMENTARY AND OUTLOOK .................................................................................... 24
6 THE REAL ESTATE PORTFOLIO ................................................................................................. 26
6.1 THE REAL ESTATE PORTFOLIO IN THE CZECH REPUBLIC ........................................................... 26 6.2 THE REAL ESTATE PORTFOLIO IN THE SLOVAK REPUBLIC ......................................................... 28 6.3 PORTFOLIO OVERVIEW ......................................................................................................... 31
7 CONSOLIDATED STATEMENT OF FINANCIAL POSITION .............................................................. 33
8 CONSOLIDATED INCOME STATEMENT ..................................................................................... 34
9 CONSOLIDATED STATEMENT OF COMPREHENSIVE INCOME ...................................................... 35
10 CONSOLIDATED STATEMENT OF CHANGES IN SHAREHOLDERS’ EQUITY ...................................... 36
11 CONSOLIDATED STATEMENT OF CASH FLOW ........................................................................... 37
12 NOTES TO THE CONSOLIDATED FINANCIAL STATEMENTS .......................................................... 38
12.1 GENERAL ............................................................................................................................. 38 12.2 SUMMARY OF SIGNIFICANT ACCOUNTING PRINCIPLES ........................................................... 38 12.3 STATEMENT OF COMPLIANCE AND FUTURE RELATED ASSUMPTIONS ...................................... 38 12.4 BASIS OF PREPARATION OF THE CONSOLIDATED FINANCIAL STATEMENTS .............................. 39 12.5 BASIS OF CONSOLIDATION ................................................................................................... 40 12.6 BASIS OF PREPARATION OF CONSOLIDATED STATEMENT OF CASH FLOW ................................ 40 12.7 FOREIGN CURRENCY ............................................................................................................ 41 12.8 FINANCIAL INSTRUMENTS .................................................................................................... 41 12.9 INVESTMENT PROPERTY ....................................................................................................... 42 12.10 OTHER INVESTMENTS .......................................................................................................... 45 12.11 DEFERRED TAX ASSETS ......................................................................................................... 45 12.12 TRADE AND OTHER RECEIVABLES .......................................................................................... 45 12.13 CASH AND CASH EQUIVALENTS ............................................................................................. 45 12.14 ASSETS HELD FOR SALE ........................................................................................................ 45 12.15 IMPAIRMENT ....................................................................................................................... 45 12.16 SHAREHOLDERS’ EQUITY ...................................................................................................... 46 12.17 LIABILITIES .......................................................................................................................... 46 12.18 INCOME .............................................................................................................................. 47 12.19 EXPENSES ............................................................................................................................ 47 12.20 FINANCIAL EXPENSES ........................................................................................................... 48 12.21 INCOME TAX EXPENSE .......................................................................................................... 48 12.22 SEGMENT REPORTING .......................................................................................................... 49 12.23 ACQUISITION OF SUBSIDIARIES............................................................................................. 53 12.24 INVESTMENT PROPERTY ....................................................................................................... 53 12.25 OTHER INVESTMENTS .......................................................................................................... 54

8
12.26 ANALYSIS DEFERRED TAXES STATED IN THE STATEMENT OF FINANCIAL POSITION ................... 55 12.27 DEFERRED TAX ASSETS ......................................................................................................... 55 12.28 TRADE AND OTHER RECEIVABLES .......................................................................................... 57 12.29 CASH AND CASH EQUIVALENTS ............................................................................................. 57 12.30 ASSETS HELD FOR SALE ........................................................................................................ 58 12.31 SHAREHOLDERS’ EQUITY ...................................................................................................... 59 12.32 ISSUED CAPITAL ................................................................................................................... 60 12.33 SHARE PREMIUM ................................................................................................................. 61 12.34 REVALUATION RESERVE ....................................................................................................... 62 12.35 RESERVE FOR CURRENCY TRANSLATION DIFFERENCES ........................................................... 62 12.36 EQUITY COMPONENT CONVERTIBLE BONDS .......................................................................... 62 12.37 RETAINED EARNINGS ........................................................................................................... 63 12.38 CALCULATION OF NET ASSET VALUE ...................................................................................... 63 12.39 INTEREST-BEARING LOANS AND BORROWINGS ...................................................................... 64 12.40 DEFERRED TAX LIABILITIES ................................................................................................... 66 12.41 TRADE AND OTHER PAYABLES ............................................................................................... 67 12.42 INCOME TAX PAYABLE .......................................................................................................... 67 12.43 FINANCIAL INSTRUMENTS .................................................................................................... 68 12.44 LEASE AGREEMENTS ............................................................................................................ 68 12.45 NON-CONTINGENT LIABILITIES ............................................................................................. 68 12.46 CONTINGENT LIABILITIES ..................................................................................................... 68 12.47 GROSS RENTAL INCOME ....................................................................................................... 69 12.48 REBILLED AND NON-REBILLED SERVICE CHARGES AND PROPERTY OPERATING EXPENSES ......... 69 12.49 NET VALUATION GAINS ON INVESTMENT PROPERTY .............................................................. 70 12.50 PROFIT ON DISPOSAL OF INVESTMENTS IN GROUP COMPANIES .............................................. 71 12.51 FINANCIAL INCOME ............................................................................................................. 71 12.52 OTHER OPERATING INCOME ................................................................................................. 71 12.53 ADMINISTRATIVE EXPENSES ................................................................................................. 72 12.54 OTHER OPERATING EXPENSES .............................................................................................. 73 12.55 PERSONNEL COSTS ............................................................................................................... 76 12.56 FINANCIAL EXPENSES ........................................................................................................... 76 12.57 ONGOING CHARGES FIGURE ................................................................................................. 76 12.58 TAX ON PROFITS .................................................................................................................. 77 12.59 EARNINGS PER (ORDINARY AND REGISTERED) SHARE ............................................................. 78 12.60 RISK MANAGEMENT ............................................................................................................. 80 12.61 RELATED PARTIES ................................................................................................................ 88 12.62 EVENTS AFTER STATEMENT OF FINANCIAL POSITION’S DATE .................................................. 90 12.63 ESTIMATES AND FORMATION OF AN OPINION BY THE MANAGEMENT ..................................... 90
13 COMPANY BALANCE SHEET .................................................................................................... 92
14 COMPANY PROFIT AND LOSS ACCOUNT .................................................................................. 93
15 NOTES TO THE COMPANY FINANCIAL STATEMENTS .................................................................. 94
15.1 GENERAL ............................................................................................................................. 94 15.2 PRINCIPLES OF VALUATION OF ASSETS AND LIABILITIES AND DETERMINATION OF RESULTS ..... 94 15.3 SIZE AND COMPOSITION OF THE CONSOLIDATED AND COMPANY EQUITY ............................... 95 15.4 RECONCILIATION STATEMENT WITH THE CONSOLIDATED INCOME STATEMENT ...................... 95 15.5 INVESTMENTS IN GROUP COMPANIES ................................................................................... 95 15.6 RECEIVABLES FROM GROUP COMPANIES............................................................................... 96 15.7 OTHER FINANCIAL INVESTMENTS.......................................................................................... 96 15.8 OTHER RECEIVABLES, PREPAYMENTS AND ACCRUED INCOME ................................................ 97 15.9 DEFERRED TAX ASSETS ......................................................................................................... 97 15.10 CASH AND CASH EQUIVALENTS ............................................................................................. 97 15.11 SHAREHOLDERS’ EQUITY ...................................................................................................... 98 15.12 ISSUED CAPITAL ................................................................................................................... 98 15.13 SHARE PREMIUM ............................................................................................................... 100 15.14 REVALUATION RESERVE ..................................................................................................... 100 15.15 RESERVE FOR CURRENCY TRANSLATION DIFFERENCES ......................................................... 101 15.16 EQUITY COMPONENT CONVERTIBLE BOND .......................................................................... 101

9
15.17 RETAINED EARNINGS ......................................................................................................... 101 15.18 CONVERTIBLE BONDS ......................................................................................................... 102 15.19 DEFERRED TAX LIABILITIES ................................................................................................. 102 15.20 DEBTS TO CREDIT INSTITUTIONS ......................................................................................... 103 15.21 OTHER LIABILITIES, ACCRUALS AND DEFERRED INCOME ....................................................... 104 15.22 NON-CONTINGENT LIABILITIES ........................................................................................... 104 15.23 CONTINGENT LIABILITIES ................................................................................................... 104 15.24 PERSONNEL COSTS ............................................................................................................. 104 15.25 REMUNERATION FOR THE MANAGING BOARD AND SUPERVISORY BOARD ............................. 105 15.26 RELATED PARTIES .............................................................................................................. 106 15.27 TAXES ............................................................................................................................... 107
16 OTHER INFORMATION ......................................................................................................... 108
16.1 GENERAL PROVISIONS OF THE ARTICLES OF ASSOCIATION CONCERNING RESULT
APPROPRIATION .......................................................................................................................... 108 16.2 PROPOSAL FOR THE COMPANY RESULT APPROPRIATION ...................................................... 108 16.3 DECREE ON THE DUTCH ACT ON FINANCIAL SUPERVISION .................................................... 108 16.4 PERSONAL INTERESTS ........................................................................................................ 109 16.5 SPECIAL CONTROLLING RIGHTS ........................................................................................... 109 16.6 EVENTS AFTER BALANCE SHEET DATE .................................................................................. 109 16.7 INDEPENDENT AUDITOR’S REPORT ..................................................................................... 110

10
1 FOREWORD For the Palmer Capital Emerging Europe Property Fund (the Fund), the key events in 2014 have been the securing of a new long-term senior loan from Tatra Banka for the Slovak portfolio and the refinancing of the Raiffeisen Bank loan on the Czech portfolio by a new loan from Sberbank on more flexible terms. Together with the repayment of the outstanding SNS Bank loan in February 2015, this successfully concluded phase two of the strategic plan announced in April 2012. This plan comprised three phases: (1) cost reductions, (2) debt finance restructuring to enable dividend distribution and, ultimately, (3) growth and expansion into new markets. Against a background of continuing economic uncertainty and fragile tenant demand in Central Europe, significant progress was achieved in improving the overall asset quality of the portfolio, with the successful sale of small assets in Kosice (Šaca) and Bratislava (Račianska), the sale of a development plot adjoining the Šujanovo náměstí building in Brno and the agreement to sell the Mariánské náměstí property in Brno (completed in March 2015). These sales have removed underperforming assets from the portfolio, improved occupancy and operational (gross to net income) ratios and allowed further reductions in loan to value ratios. The decline in occupancy rates was arrested during the year. The second part of the year showed occupancy rates improving from 73.9% to 75.0%, which is expected to continue into 2015. The portfolio requires constant additional investments in the assets to retain existing tenants and to attract new ones. The increase in resources for capital expenditure created by the refinancing programme is now supporting the asset management teams in their task to further improve the portfolio occupancy levels and more importantly the net operating income. Although 2014 operational costs were higher due to a material one-off charge related to the successful financial restructuring process, the structural operational costs have been reduced to EUR 2.44m, a reduction of 14.7% compared to the previous reporting period. The ongoing cost reduction programme is expected to show further progress in 2015. The fundamental improvements to the Fund’s financial structure and operations achieved over the last three years now permit a resumption of periodic dividend payments to shareholders. This, in turn is expected to lead to an increase in stock liquidity and a further reduction in the prevailing discount of the current stock price to the net asset value per share. Management believes that the long-term future of the Fund in its current listed, regulated form can only be secured by substantial growth of assets under management and a commensurate reduction in the ongoing charges ratio (operating costs as a percentage of NAV). Substantial growth in Assets under Management will improve stock liquidity to a level required by many professional investors and is a prerequisite for attracting investing institutions to support the Fund. Management is now implementing a strategy to achieve this growth within the next 2 years without material dilution of net asset value per share. More detailed information about the future strategy of the Fund will be shared with shareholders in the Annual General Meeting of shareholders.
11
2 SUMMARY Palmer Capital Emerging Europe Property Fund N.V. (the Fund, PCEEPF) is an investment company with variable capital incorporated under Dutch law and registered in Amsterdam. The shares have been listed on the NYSE Euronext Amsterdam since 2003. The Fund invests in commercial real estate in Central and Eastern Europe. The Fund offers several important features that distinguish it from other real estate funds:
The focus on Central and Eastern Europe;
Local representation of Palmer Capital with its own offices in Munich (Germany), Prague (Czech Republic), Warsaw (Poland), Cluj-Napoca (Romania) and Sofia (Bulgaria) with its own highly qualified staff and specific know-how;
Access to regional property management knowledge and facilities;
Long-term management experience in Central Europe (since 1992) Palmer Capital Fondsenbeheer B.V. (PCFB) is a management company of investment funds and has its seat in Deventer (the Netherlands). PCFB manages also two Equity Funds which are listed on the NYSE Euronext Amsterdam:
Palmer Capital Emerging Europe Equity Fund N.V. (PCEEEF);
Palmer Capital Russian Midcap Fund N.V. (PCRMF). PCFB also manages two non-listed Private Equity and Project Development Funds:
Middle Europe Opportunity Fund II N.V. (MEOF II);
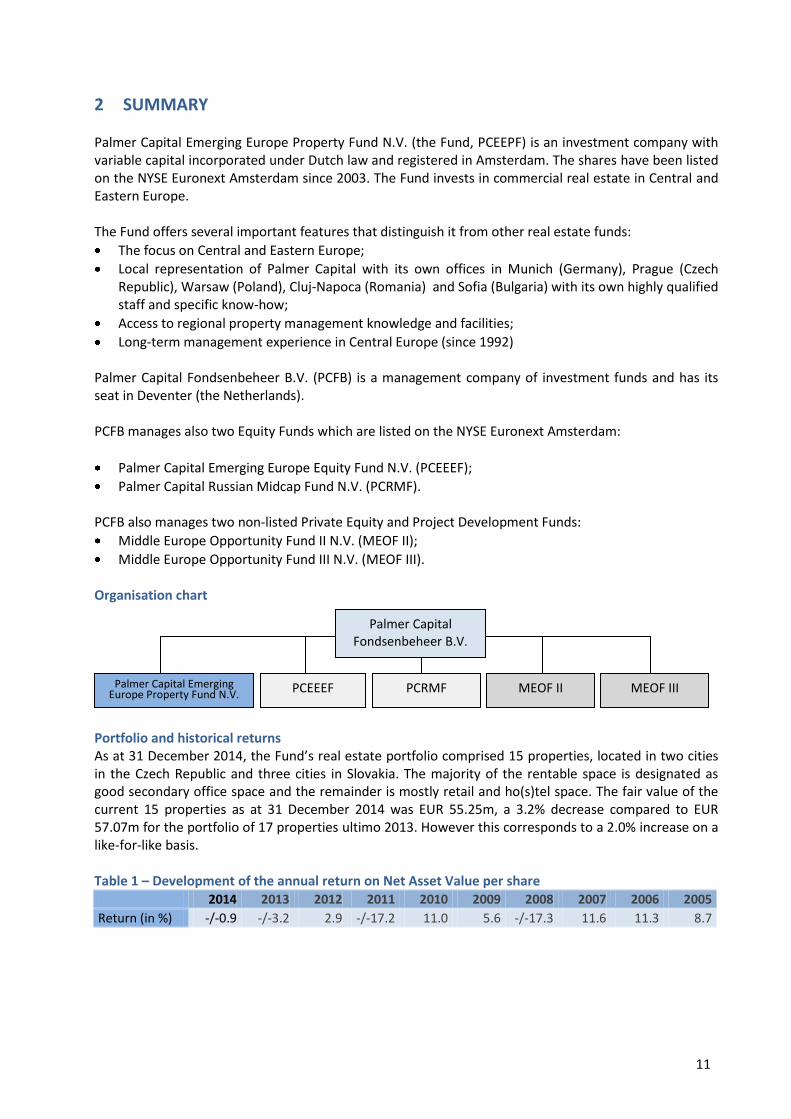
Middle Europe Opportunity Fund III N.V. (MEOF III). Organisation chart Portfolio and historical returns As at 31 December 2014, the Fund’s real estate portfolio comprised 15 properties, located in two cities in the Czech Republic and three cities in Slovakia. The majority of the rentable space is designated as good secondary office space and the remainder is mostly retail and ho(s)tel space. The fair value of the current 15 properties as at 31 December 2014 was EUR 55.25m, a 3.2% decrease compared to EUR 57.07m for the portfolio of 17 properties ultimo 2013. However this corresponds to a 2.0% increase on a like-for-like basis. Table 1 – Development of the annual return on Net Asset Value per share 2014 2013 2012 2011 2010 2009 2008 2007 2006 2005
Return (in %) -/-0.9 -/-3.2 2.9 -/-17.2 11.0 5.6 -/-17.3 11.6 11.3 8.7
MEOF II
Palmer Capital Fondsenbeheer B.V.
Palmer Capital Emerging Europe Property Fund N.V. PCRMF MEOF III PCEEEF

12
3 PROFILE The Palmer Capital Emerging Europe Property Fund N.V. (the Fund) invests in the established and emerging real estate markets of Central and Eastern Europe. The Fund currently specialises in commercial real estate investments in the Czech Republic and Slovakia. The Fund invests in principle through local companies on the basis of local legislation. Objective The Fund offers institutional and private investors the possibility to invest in a real estate portfolio in the emerging markets of Central and Eastern Europe. It uses the expertise of in-company and external commercial real estate specialists, who operate in the local markets concerned. The Fund’s investment policy is to deliver a high income return from commercial real estate whilst preserving capital value. Fund Structure and tradability On 4 January 2012 the Fund became active as a closed-end investment institution. From 5 January 2012 daily share trades as a closed-end investment fund are actioned through NYSE Euronext Amsterdam. Management Palmer Capital Fondsenbeheer B.V. is the management company of the Fund. On 24 January 2006 it obtained from the AFM a permit under the Act on the Supervision of Investment Institutions (“Wft”). Since 1 January 2007 PCEEPF has operated under the Wft. Investment Policy The Fund invests in income-producing commercial real estate in Central and Eastern Europe in accordance with predetermined investment criteria. The company aims at a diversified real estate portfolio, spreading risk across sectors and locations. Positions will be analysed regularly and adjusted where necessary. The Fund uses the local organisation of Palmer Capital and selected property management organisations with a good regional presence to identify, acquire and manage its real estate holdings. As a result, the Fund is able to invest effectively in A, B and C-class real estate, which, if professionally and actively managed, can generate a higher relative return on investment than a portfolio concentrated solely on A-class assets. Investment Criteria The managing board pursues an investment policy that takes the following investment criteria into consideration:
The Fund will invest in commercial real estate in Central and Eastern Europe, direct and indirect;
In principle not more than 60% of the book value of the total real estate portfolio will be financed with borrowed capital;
The Fund is allowed to invest in securities or place money on deposit to have enough cash available;
Investments are diversified at the following levels: o Countries, regions and cities in Central and Eastern Europe; o Commercial sectors, including offices, retail, industry, logistics; o Property classes: A-/ B-/ C-class; o Size of individual projects;
The Fund may use financial instruments to hedge the currency risks. The Fund actively manages its portfolio, using its thorough knowledge of the local real estate markets and its experience in various Central and Eastern European countries to identify new investment opportunities. Existing assets will be assessed regularly, to determine whether they should be retained in the portfolio or be sold.

13
Financing policy The Fund finances a substantial portion (31-12-2014: 44.7%) of the real estate portfolio with long-term external debt, although a Loan-to-Value percentage of up to 60% is possible. Management has regard to the need for flexibility, in particular the ability to sell real estate from the portfolio without incurring high debt finance breakage costs. The Fund prefers to use several different financiers, so as not to be dependent on just one party. Investor relations and information supply The Fund strives to achieve open, timely and clear communication with private and institutional investors, asset managers and other interested parties, and endeavours to configure its public and investor relations’ policy accordingly. Currently the Funds investors are largely private investors and asset/wealth managers. Corporate Governance Clarity and transparency in supervision and accounting is considered by the Fund to be the cornerstone of good management and entrepreneurship. The Fund aims for a sound system of corporate governance, with its strategy and investment objectives clearly defined and its operations effectively monitored by management, supervisory board and independent external parties. Fund governance Palmer Capital Fondsenbeheer B.V. endorses the DUFAS Principles of fund governance, as formulated by the Dutch Fund and Asset Management Association (DUFAS). Following these Principles, Palmer Capital Fondsenbeheer B.V. will act in the interests of investors of the funds Palmer Capital Fondsenbeheer B.V. manages. In case of a possible conflict of interest, transactions will be submitted to the Supervisory Board for approval. DUFAS principles of fund governance are presented on the website of DUFAS: www.dufas.nl.

14
4 PRE-ADVICE OF THE SUPERVISORY BOARD This annual report of the Palmer Capital Emerging Europe Property Fund N.V. (the Fund) has been prepared by the Managing Board. This report contains the financial statements for the period from 1 January until 31 December 2014. The financial statements are audited and have been approved by KPMG Accountants N.V. The auditor’s report is presented on pages 110 - 114. The Supervisory Board has received notice of this approval. The Supervisory Board recommends the financial statements for the year 2014 to the General Meeting for approval. The proposal by the Managing Board to distribute 30 cent per share for 2014 has been approved by the Supervisory Board. During 2014, the Supervisory Board had five meetings. During these meetings, the Supervisory Board discussed the (administrative) organization, the investment strategy, the commercial strategy and financial reporting. These meetings were attended by the Managing Board.
Deventer, 31 March 2015
Supervisory Board H. Kloos, chairman B. Vos M.Sc.
15
5 REPORT OF THE MANAGEMENT BOARD
The Management Board hereby presents the annual report of 2014 of Palmer Capital Emerging Europe Property Fund N.V. (the Fund). The reporting period is from 1 January 2014 to 31 December 2014.
5.1 FUND STRATEGY
The Management Board of the Fund presented a revised strategy to shareholders in April 2012. The aim was to position the Fund as the leading quoted vehicle investing in income-generating real estate in Central and Eastern Europe. The revised strategy envisaged a resumption of dividend payments combined with overall growth in Fund size and an expansion of the Fund into new sectors and additional countries within Central and Eastern Europe. The strategy was to be implemented in three stages: operational cost reductions to improve efficiency, restructuring of existing debt finance arrangements to create free cash flow and raising of fresh equity and debt to finance the substantial expansion of the Fund. The first two steps of the strategy have now been successfully concluded.
5.2 SUMMARY OF EVENTS
5.2.1 DEVELOPMENTS DURING 2014
Key events during the reporting period were the securing of the refinancing of the Czech portfolio by Sberbank in March and the long term refinancing of the Slovak portfolio by Tatra Banka during the second half of 2014. Under these new arrangements annual debt service has dropped from EUR 2.80m to EUR 1.99m (-29.1%) and the LTV has dropped from 47.5% to 44.6%
Occupancy over the reporting period increased from 73.9% to 75.0%. Contracted annual net rental income increased to EUR 3.44m as at December 31 2014, up from EUR 3.34m in December 2013 (+ 2.9%).
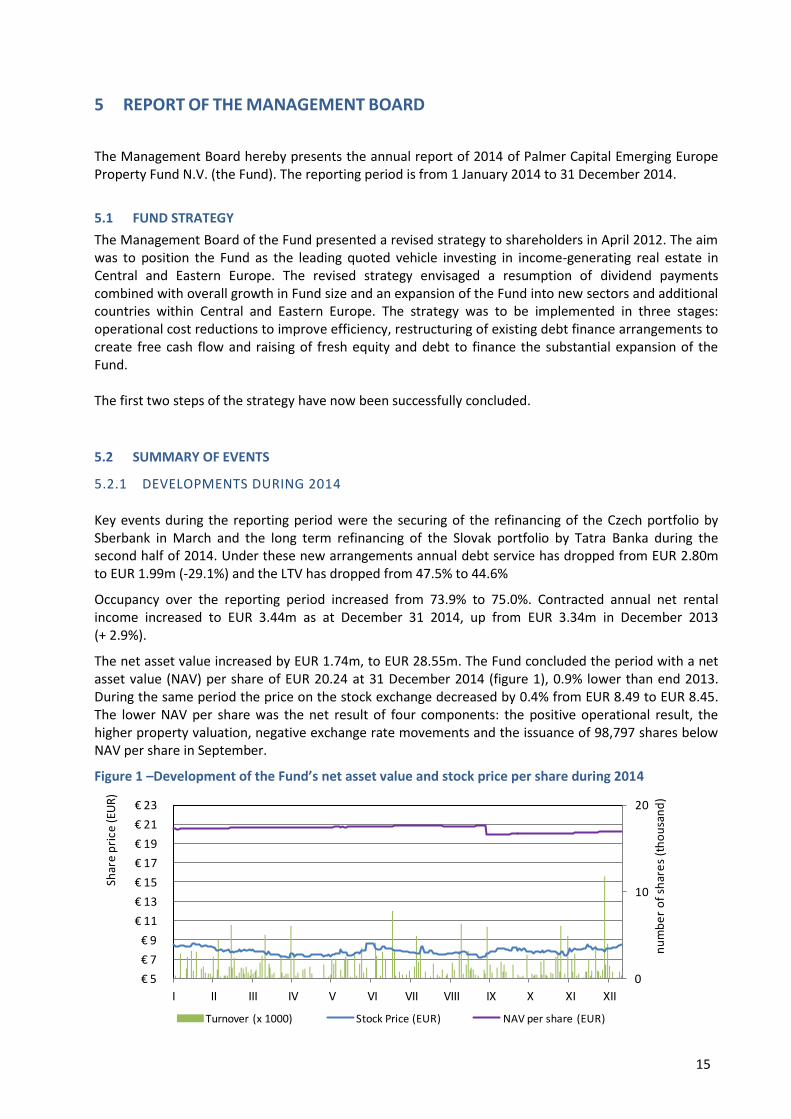
The net asset value increased by EUR 1.74m, to EUR 28.55m. The Fund concluded the period with a net asset value (NAV) per share of EUR 20.24 at 31 December 2014 (figure 1), 0.9% lower than end 2013. During the same period the price on the stock exchange decreased by 0.4% from EUR 8.49 to EUR 8.45. The lower NAV per share was the net result of four components: the positive operational result, the higher property valuation, negative exchange rate movements and the issuance of 98,797 shares below NAV per share in September.
Figure 1 –Development of the Fund’s net asset value and stock price per share during 2014
0
10
20
€ 5
€ 7
€ 9
€ 11
€ 13
€ 15
€ 17
€ 19
€ 21
€ 23
I II III IV V VI VII VIII IX X XI XII
nu
mb
er
of
shar
es
(th
ou
san
d)
Turnover (x 1000) Stock Price (EUR) NAV per share (EUR)
Shar
e p
rice
(EU
R)

16
During 2014 the Fund reported the following developments:
January New property manager in Slovakia Zbereko, spol. s.r.o. (Zbereko) was appointed on 1 January 2014 as property and facilities manager for the Slovak portfolio. The appointment of the new manager will lead to direct annual cost savings of approximately EUR 100,000. Zbereko was selected following a bidding process in which seven parties participated. Zbereko was chosen because of the price offered and the fact that the company is located in Kosice, the town in Slovakia where the Fund has its largest exposure.
March Completion of refinancing by Sberbank and refinancing of the Slovak portfolio The Fund completed in March the previously announced refinancing of the Czech real estate portfolio with Sberbank. The bank provided an annuity loan with a fixed interest rate period of 3 years to the Czech subsidiary Palmer Capital RE Bohemia, s.r.o. The annuity is calculated over a period of 20 years. The weighted average interest rate on the loan is 3.42%.
With the loan from Sberbank, the mortgage loan from Raiffeisen Bank was repaid in full. It also partially repaid the SNS bank loan. The surplus after instalment was invested in the real estate to improve the occupancy rate of the portfolio and to reduce operating costs. The loan-to-value of the Property Fund is at this point in time 47.5%.
The next step in the strategic refinancing of the Fund was to refinance the Slovak portfolio. In March the Tatra Banka loan was still EUR 15.0m, running off in December 2014. The Management Board entered discussions to extend the contract under more suitable and flexible terms. Based on discussions at that time with Tatra Banka and competing offers from other banks an additional financing requirement of between EUR 4m and EUR 5m was still anticipated.
June General Meeting of Shareholders – 19 June The General Meeting of Shareholders adopted the annual accounts of 2013 and decided not to distribute a dividend for 2013.
Harman Kloos appointed as Chairman of the Supervisory Board of the Fund – 19 June Harman Kloos RBA was appointed as Chairman of the Supervisory Board of the Fund, under condition of formal approval of the Authority Financial Markets (AFM). The formal approval of the AFM was announced in a press release on 31 October 2014.
August Sale of office building Račianska in Bratislava – 20 August The Fund concluded the sale of the Račianska 71 office building, in the Slovak capital Bratislava. The purchaser was a local business. The sale price of EUR 500,000 was close to the latest external property valuation. The sale was part of the refinancing plan and the portfolio restructuring plan for the Fund as announced during the General Meeting of 19 June 2014 and accorded with Management’s aim to reduce the exposure of the real estate portfolio in the Slovak Republic.
Share issue – 27 August The Fund commenced issuance of up to 100,000 shares, by continuously providing them on the public NYSE Euronext Amsterdam stock exchange at the stock price level at that time. On 12 September 2014 the Fund announced the share issue had been successfully concluded. 98,997 shares were issued at an average price of EUR 6.43 per share. A major tranche, 96,020 shares, were issued over-the-counter. The outstanding shareholdings of the Fund increased by 7.39% to 1,438,704 shares.
September The Fund announces refinancing progress – 23 September The Fund informed the market about progress in the strategic refinancing to increase free cash flow and financial control, and to facilitate eventual dividend distribution. The agreement on extension of the Tatra Banka loan initiated a refinancing and
17
recapitalization process to secure the Fund’s long-term future. The recapitalization options necessary to improve the fund’s financial structure and secure the Tatra Banka loan were an issue of convertible bonds, an issue of shares and/or an issue of secured bonds. A consultation among the investor base resulted in the decision to issue a convertible bond.
October Issue of convertible bond loan – 1 October 2014 The Fund issued the first tranche of a convertible bond loan for a maximum amount of EUR 2.49m. The convertible bond was part of the refinancing process as presented during the General Meeting of 19 June 2014. The proceeds during the reporting period were EUR 1.07m, which were used in December to install the expiring Slovak Tatra Banka loan. Tatra Banka then provided a new EUR 12m facility for five years at more favorable terms.
November The Fund sells part of Brno office building – 12 November 2014 The Fund concluded the sale of a discrete part of the Sujanova Namesti 3 office building, in the Czech regional capital Brno. The part of the property sold was derelict and did not contribute to the net operating income. The purchaser was a local entrepreneur. The sale price was EUR 725,000. The proceeds were used for the refinancing plan and for Fund costs.
December The Fund holds an EGM – 10 December 2014 An Extraordinary General Meeting was held to inform the shareholders about the refinancing process and about the strategic options for the future of the Fund.
Sale of the Šaca property The Fund concluded the sale of the Šaca logistic property, in the Slovak city of Kosice. The property was sold for net EUR 775,000 to a local transport company. The property did not generate material net operating income. The proceeds were used to install the expiring Tatra Banka loan in order to secure long term refinancing.
External valuation of property portfolio The Fund implemented the updated external valuation of the property portfolio. The fair value of the fifteen property portfolio as at 31 December 2014 was EUR 55.25m (2013: EUR 57.06m | 17 properties). However on a like for like basis (15 properties) the fair value increased 2.0%.
Extension of SNS Bank loan The short term SNS Bank loan was extended by amendment until 1 July 2015.
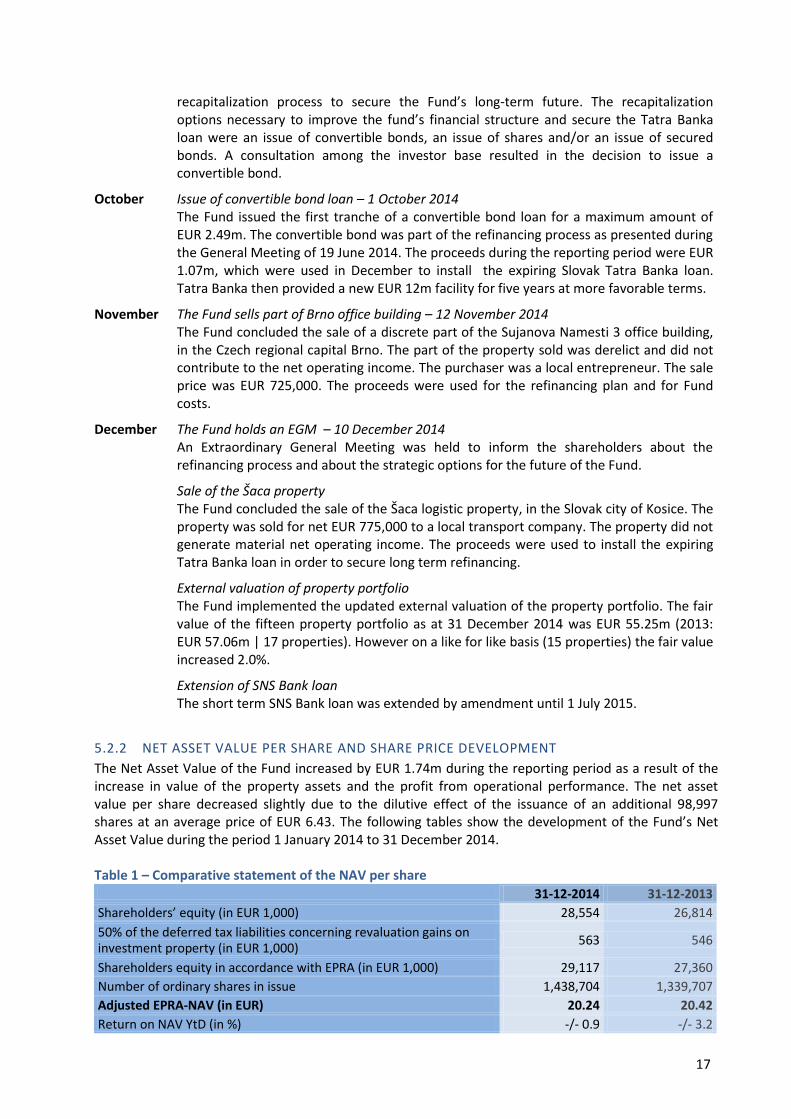
5.2.2 NET ASSET VALUE PER SHARE AND SHARE PRICE DEVELOPMENT
The Net Asset Value of the Fund increased by EUR 1.74m during the reporting period as a result of the increase in value of the property assets and the profit from operational performance. The net asset value per share decreased slightly due to the dilutive effect of the issuance of an additional 98,997 shares at an average price of EUR 6.43. The following tables show the development of the Fund’s Net Asset Value during the period 1 January 2014 to 31 December 2014.
Table 1 – Comparative statement of the NAV per share 31-12-2014 31-12-2013
Shareholders’ equity (in EUR 1,000) 28,554 26,814
50% of the deferred tax liabilities concerning revaluation gains on investment property (in EUR 1,000)
563 546
Shareholders equity in accordance with EPRA (in EUR 1,000) 29,117 27,360
Number of ordinary shares in issue 1,438,704 1,339,707
Adjusted EPRA-NAV (in EUR) 20.24 20.42
Return on NAV YtD (in %) -/- 0.9 -/- 3.2

18
Table 2 –Development of the share price per month up to 31-12-2014 Month Opening price
Start of month in EUR
Closing price End of month
in EUR
Volume
pieces
January 8.21 8.22 17,912
February 8.22 7.85 25,087
March 7.85 7.20 21,123
April 7.25 7.40 15,118
May 7.40 7.60 19,699
June 7.50 7.88 30,112
July 7.86 7.51 16,357
August 7.50 7.40 20,750
September 7.40 7.95 18,566
October 7.81 7.80 12,118
November 7.75 7.93 25,267
December 8.05 8.45 32,233
With an average daily transaction volume of 1,400 shares, the trading activity remained relatively stable during most of 2014, although this average rose significantly, to 1,600 per trading day, in December. At the end of the reporting period, the stock price traded at EUR 8.45, with a 58% discount to the net asset value, down from 62% on December 31 2013.
5.3 OPERATIONAL HIGHLIGHTS
5.3.1 REAL ESTATE (INVESTMENT) MARKET
This year was statistically the second most successful year in terms of Commercial Real Estate investment in the Czech Republic since the start of the global financial crisis. Transaction volume grew 77% year-on-year (y-o-y), with EUR 1.97b trading in comparison with EUR 1.10b in 2013. The second half of the year saw almost double the volume of the transactions close than in the first half of 2014 (first half year EUR 0.68b versus EUR 1.29b in second half year).
After Logistics, offices were the most popular assets in the Czech Republic in 2014 with EUR 516m in transactions closed, equivalent to 26% of the total year’s volume. This compares with EUR 690m and 62% during 2013. Third place belonged to the retail sector, which saw EUR 324m transact in 2014, 17% of total volumes.
The improving economy has also impacted the Slovak real estate market. The investment volume in 2014 exceeded EUR 610m and was the highest level recorded since 2005. The Slovakian real estate market has also seen a successful year, especially in terms of leasing activity, 140% increase compared to the previous year.
In general, both smaller domestic investors and international players have increased their appetite for higher yielding value-added secondary products, even in smaller regional cities. Secondary locations have started to attract international capital too.
Market prognosis The real estate experts predict investment activity in 2015 to be strong with volumes to surpass EUR 2b again. The increased availability of cheap debt finance, which is underpinned by Euro area Quantitative Easing will help to drive investment volumes. It is expected that yields continue on their downwards trend across all sectors. In alignment with the market situation, as a result of improving market conditions, yields are also expected to compress in Slovakia over the upcoming quarters.
Most interestingly, better value is also expected to be offered by secondary properties, considering that the margin between prime and secondary will begin to erode over the course of the year as the restricted supply of prime properties coupled with cheap debt will encourage investors to broaden their

19
investment horizons. Also certain investor groups will return who have not been active since the crisis, which is an endorsement of especially the Czech Republic as a mature investment market.
The Palmer Capital assetmanagement organisation confirms the additional activity in the secondary real estate market, with much more enquiries than half a year ago.
5.3.2 OPERATIONAL DEVELOPMENT
The weighted occupancy rate of the portfolio was 75.0% at year-end 2014. The occupancy rate of the Czech part of the portfolio was 78.3% (73.0%). The Czech portfolio has shown a steady increase in occupancy since mid-year. The Slovak portfolio has shown a slight decrease in occupancy over the year, to 73.2%, compared to 74.3% at the start of the year. See also 12.31.3.
5.3.3 REAL ESTATE PORTFOLIO DEVELOPMENT
The net rental and related income of EUR 3.03m from the current portfolio in 2014 was 8.7% lower compared to the previous year. This decrease was due to the sale of two assets from the portfolio, a sharp short-term occupancy drop of the Czech portfolio during the first half of 2014 and the further devaluation of the Czech Koruna. However, new lettings contracted in the second half of the year have now increased contracted annual rental income to EUR 3.44m (an increase of 2.9% on 2013) which should result in a substantial improvement in financial performance in 2015.
During the reporting period part of the Czech office building Sunajova namesti 3 in Brno, the Slovak office building Račianska 71 and the Slovak logistic property Šaca in Kosice were sold. See for more details 12.23.4.
Figure 2 – The properties that were sold during 2014
Račianska 71, Bratislava, SK Offices & Storage 2,894 m2 (rentable)
Šaca, Kosiče, SK Storage & Logistics 14,130 m2 (rentable)
Table 3 – Comparative statement of the real estate portfolio 31-12-20141 31-12-2013 change %
Fair value (in EUR 1,000) 55,253 57,068 - 1,815 - 3.2
Number of properties 15 17 - 2 - 11.8
Rentable area (in m²) 91,727 112,576 - 20,849 - 18.5
Occupancy* (in %) 75.0 73.9 1.1 1.5 *weighted based on fair value
Table 4 – Statement of changes in investment properties 2014 2013
in EUR 1,000 in EUR 1,000
Balance as at 1 January 57,068 59,830
Purchases and additions 365 415
Exchange rate differences -/- 210 -/- 1,794
Fair value adjustments 54 -/- 1,383
Sales -/- 2,024 -
Balance as at 31 December (including assets held for sale) 55,253 57,068
Reclassification -/- 3,173 -
Balance as at 31 December 52,080 57,068
1 Including GiTy, asset held for sale
20
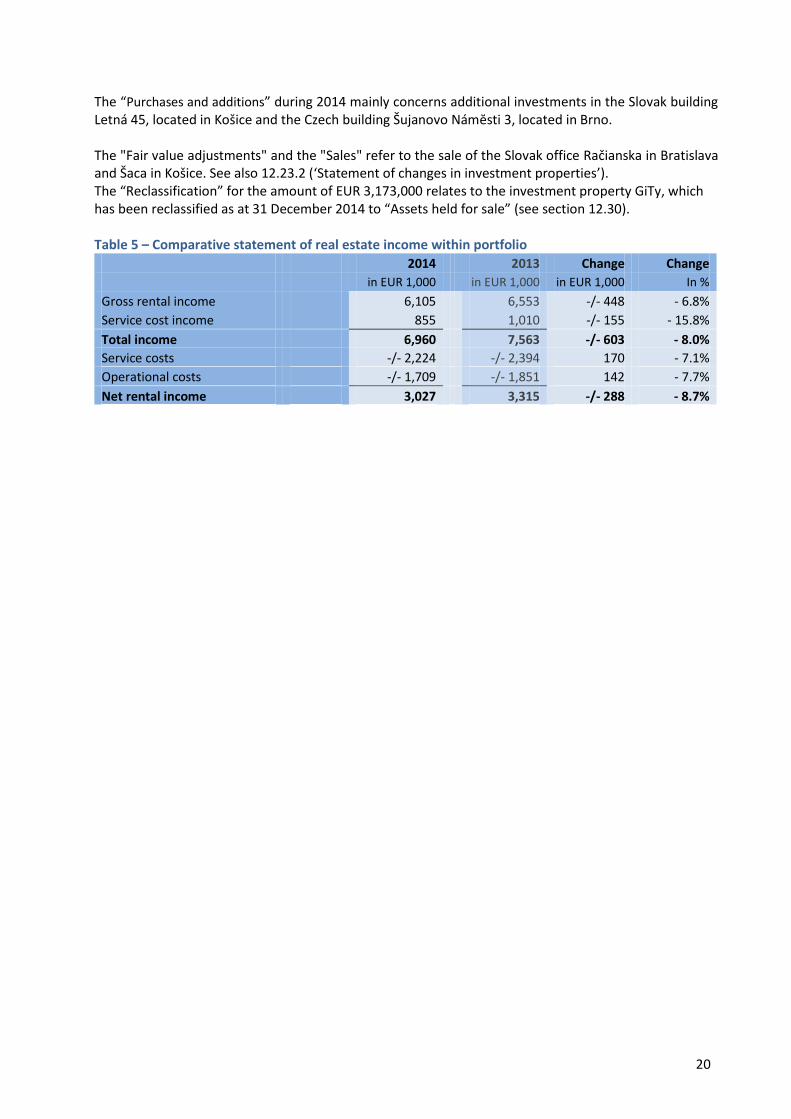
The “Purchases and additions” during 2014 mainly concerns additional investments in the Slovak building Letná 45, located in Košice and the Czech building Šujanovo Námĕsti 3, located in Brno. The "Fair value adjustments" and the "Sales" refer to the sale of the Slovak office Račianska in Bratislava and Šaca in Košice. See also 12.23.2 (‘Statement of changes in investment properties’). The “Reclassification” for the amount of EUR 3,173,000 relates to the investment property GiTy, which has been reclassified as at 31 December 2014 to “Assets held for sale” (see section 12.30). Table 5 – Comparative statement of real estate income within portfolio
2014 2013 Change Change
in EUR 1,000 in EUR 1,000 in EUR 1,000 In %
Gross rental income 6,105 6,553 -/- 448 - 6.8%
Service cost income 855 1,010 -/- 155 - 15.8%
Total income 6,960 7,563 -/- 603 - 8.0%
Service costs -/- 2,224 -/- 2,394 170 - 7.1%
Operational costs -/- 1,709 -/- 1,851 142 - 7.7%
Net rental income 3,027 3,315 -/- 288 - 8.7%
21
5.4 FINANCIAL HIGHLIGHTS
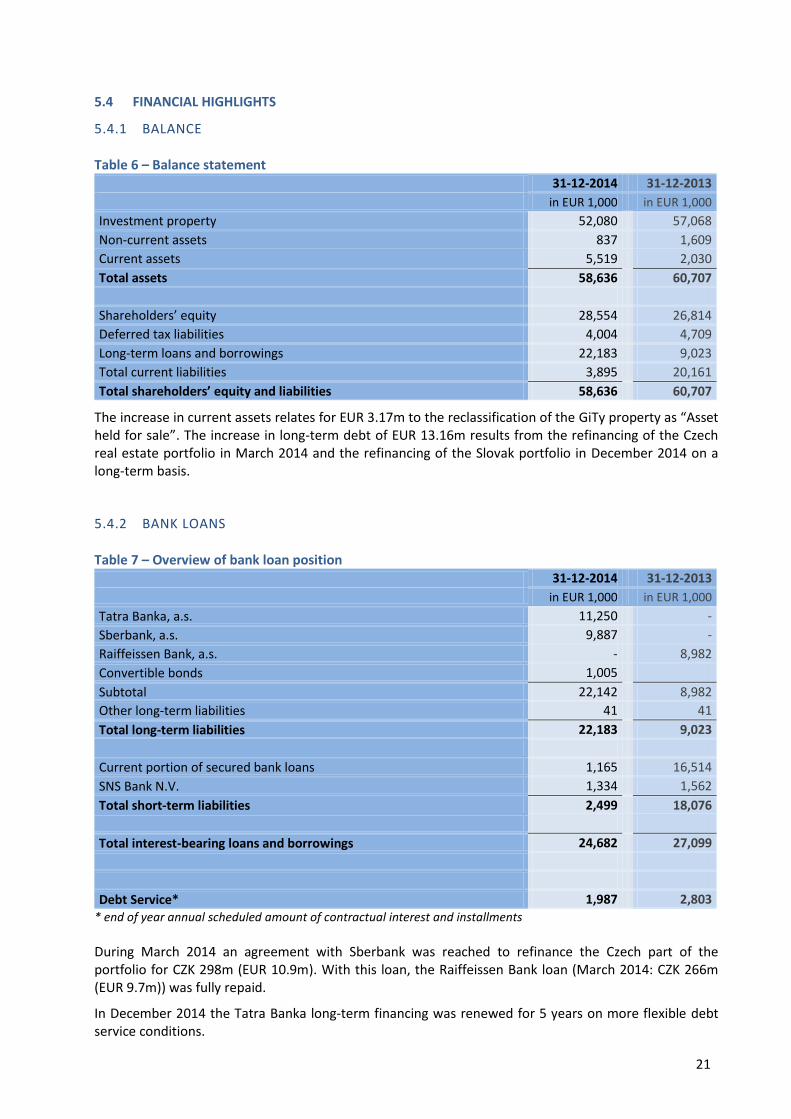
5.4.1 BALANCE
Table 6 – Balance statement
31-12-2014 31-12-2013
in EUR 1,000 in EUR 1,000
Investment property 52,080 57,068
Non-current assets 837 1,609
Current assets 5,519 2,030
Total assets 58,636 60,707
Shareholders’ equity 28,554 26,814
Deferred tax liabilities 4,004 4,709
Long-term loans and borrowings 22,183 9,023
Total current liabilities 3,895 20,161
Total shareholders’ equity and liabilities 58,636 60,707
The increase in current assets relates for EUR 3.17m to the reclassification of the GiTy property as “Asset held for sale”. The increase in long-term debt of EUR 13.16m results from the refinancing of the Czech real estate portfolio in March 2014 and the refinancing of the Slovak portfolio in December 2014 on a long-term basis.
5.4.2 BANK LOANS
Table 7 – Overview of bank loan position
31-12-2014 31-12-2013
in EUR 1,000 in EUR 1,000
Tatra Banka, a.s. 11,250 -
Sberbank, a.s. 9,887 -
Raiffeissen Bank, a.s. - 8,982
Convertible bonds 1,005
Subtotal 22,142 8,982
Other long-term liabilities 41 41
Total long-term liabilities 22,183 9,023
Current portion of secured bank loans 1,165 16,514
SNS Bank N.V. 1,334 1,562
Total short-term liabilities 2,499 18,076
Total interest-bearing loans and borrowings 24,682 27,099
Debt Service* 1,987 2,803
* end of year annual scheduled amount of contractual interest and installments
During March 2014 an agreement with Sberbank was reached to refinance the Czech part of the portfolio for CZK 298m (EUR 10.9m). With this loan, the Raiffeissen Bank loan (March 2014: CZK 266m (EUR 9.7m)) was fully repaid.
In December 2014 the Tatra Banka long-term financing was renewed for 5 years on more flexible debt service conditions.
22
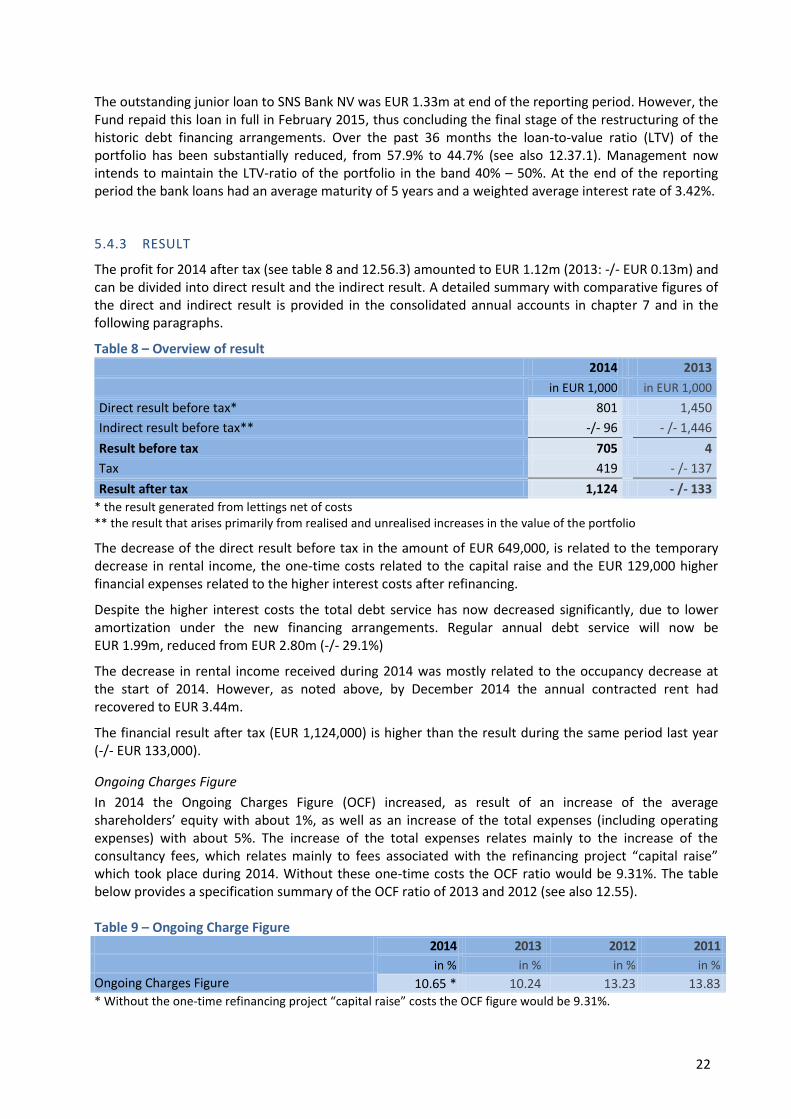
The outstanding junior loan to SNS Bank NV was EUR 1.33m at end of the reporting period. However, the Fund repaid this loan in full in February 2015, thus concluding the final stage of the restructuring of the historic debt financing arrangements. Over the past 36 months the loan-to-value ratio (LTV) of the portfolio has been substantially reduced, from 57.9% to 44.7% (see also 12.37.1). Management now intends to maintain the LTV-ratio of the portfolio in the band 40% – 50%. At the end of the reporting period the bank loans had an average maturity of 5 years and a weighted average interest rate of 3.42%.
5.4.3 RESULT
The profit for 2014 after tax (see table 8 and 12.56.3) amounted to EUR 1.12m (2013: -/- EUR 0.13m) and can be divided into direct result and the indirect result. A detailed summary with comparative figures of the direct and indirect result is provided in the consolidated annual accounts in chapter 7 and in the following paragraphs.
Table 8 – Overview of result
2014 2013
in EUR 1,000 in EUR 1,000
Direct result before tax* 801 1,450
Indirect result before tax** -/- 96 - /- 1,446
Result before tax 705 4
Tax 419 - /- 137
Result after tax 1,124 - /- 133
* the result generated from lettings net of costs ** the result that arises primarily from realised and unrealised increases in the value of the portfolio
The decrease of the direct result before tax in the amount of EUR 649,000, is related to the temporary decrease in rental income, the one-time costs related to the capital raise and the EUR 129,000 higher financial expenses related to the higher interest costs after refinancing.
Despite the higher interest costs the total debt service has now decreased significantly, due to lower amortization under the new financing arrangements. Regular annual debt service will now be EUR 1.99m, reduced from EUR 2.80m (-/- 29.1%)
The decrease in rental income received during 2014 was mostly related to the occupancy decrease at the start of 2014. However, as noted above, by December 2014 the annual contracted rent had recovered to EUR 3.44m.
The financial result after tax (EUR 1,124,000) is higher than the result during the same period last year (-/- EUR 133,000).
Ongoing Charges Figure
In 2014 the Ongoing Charges Figure (OCF) increased, as result of an increase of the average shareholders’ equity with about 1%, as well as an increase of the total expenses (including operating expenses) with about 5%. The increase of the total expenses relates mainly to the increase of the consultancy fees, which relates mainly to fees associated with the refinancing project “capital raise” which took place during 2014. Without these one-time costs the OCF ratio would be 9.31%. The table below provides a specification summary of the OCF ratio of 2013 and 2012 (see also 12.55). Table 9 – Ongoing Charge Figure 2014 2013 2012 2011
in % in % in % in %
Ongoing Charges Figure 10.65 * 10.24 13.23 13.83 * Without the one-time refinancing project “capital raise” costs the OCF figure would be 9.31%.
23
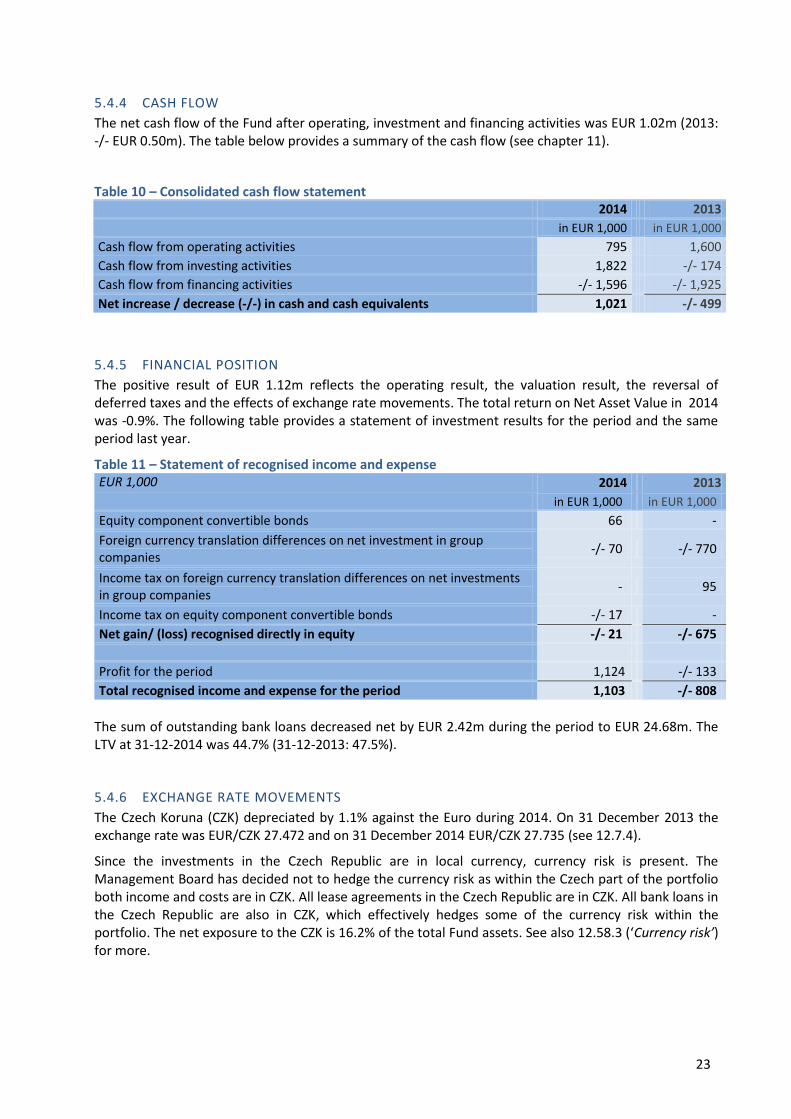
5.4.4 CASH FLOW
The net cash flow of the Fund after operating, investment and financing activities was EUR 1.02m (2013: -/- EUR 0.50m). The table below provides a summary of the cash flow (see chapter 11).
Table 10 – Consolidated cash flow statement 2014 2013
in EUR 1,000 in EUR 1,000
Cash flow from operating activities 795 1,600
Cash flow from investing activities 1,822 -/- 174
Cash flow from financing activities -/- 1,596 -/- 1,925
Net increase / decrease (-/-) in cash and cash equivalents 1,021 -/- 499
5.4.5 FINANCIAL POSITION
The positive result of EUR 1.12m reflects the operating result, the valuation result, the reversal of deferred taxes and the effects of exchange rate movements. The total return on Net Asset Value in 2014 was -0.9%. The following table provides a statement of investment results for the period and the same period last year.
Table 11 – Statement of recognised income and expense EUR 1,000 2014 2013
in EUR 1,000 in EUR 1,000
Equity component convertible bonds 66 -
Foreign currency translation differences on net investment in group companies
-/- 70 -/- 770
Income tax on foreign currency translation differences on net investments in group companies
- 95
Income tax on equity component convertible bonds -/- 17 -
Net gain/ (loss) recognised directly in equity -/- 21 -/- 675
Profit for the period 1,124 -/- 133
Total recognised income and expense for the period 1,103 -/- 808
The sum of outstanding bank loans decreased net by EUR 2.42m during the period to EUR 24.68m. The LTV at 31-12-2014 was 44.7% (31-12-2013: 47.5%).
5.4.6 EXCHANGE RATE MOVEMENTS
The Czech Koruna (CZK) depreciated by 1.1% against the Euro during 2014. On 31 December 2013 the exchange rate was EUR/CZK 27.472 and on 31 December 2014 EUR/CZK 27.735 (see 12.7.4).
Since the investments in the Czech Republic are in local currency, currency risk is present. The Management Board has decided not to hedge the currency risk as within the Czech part of the portfolio both income and costs are in CZK. All lease agreements in the Czech Republic are in CZK. All bank loans in the Czech Republic are also in CZK, which effectively hedges some of the currency risk within the portfolio. The net exposure to the CZK is 16.2% of the total Fund assets. See also 12.58.3 (‘Currency risk’) for more.

24
5.5 RISK MANAGEMENT
For a description of the main risks and uncertainties, we refer to the Risk paragraph 12.58 and the notes to the consolidated financial statements.
5.6 STATEMENT REGARDING ADMINISTRATIVE ORGANISATION AND INTERNAL CONTROL
Management has reviewed all elements of the administrative organization during the reporting period. We consider that the administrative organization and internal control as prescribed by Article 121 of the Bgfo (“Besluit gedragstoezicht financiële ondernemingen”), meets the requirements prescribed by the Financial Supervision Act (Wet op het financieel toezicht, the “Wft”) and related regulations. Pursuant to this, we declare as the Managing Board of Palmer Capital Emerging Europe Property Fund N.V. that the Company possesses a description as prescribed by Article 121 of the Bgfo, which meets the requirements as prescribed by the Bgfo. In addition, the Managing Board declares with a reasonable degree of certainty that the administrative organization and internal control function effectively and in accordance with this description.
5.7 FUND COMMENTARY AND OUTLOOK
In 2014, the Fund achieved significant progress at operational, asset and financing level. All legacy management and consultancy contracts have now been terminated or replaced, all junior debt has been repaid, all outstanding loans have been collected and all senior debt has been renegotiated to provide long term maturity on more flexible terms.
The Fund now has direct control over all key operational areas and can continue to realize management and operational cost savings and efficiencies. Through the refinancings, amortization costs have been substantially reduced, allowing additional cash resources to be used for physical improvement of the real estate portfolio and tenant retention. The management anticipates further improvement in portfolio occupancy levels in 2015. The rationalisation of the existing portfolio will continue, with further sales of assets that deliver a weak return on equity or where future income or growth prospects are poor.
Looking forward there are some interesting themes for the year ahead. Economic optimism has been sustained, although developments in Ukraine do raise some concerns. Until a robust recovery is clearly established, expectations for occupier demand across the region will remain relatively conservative. Uncertainties persist over future interest rate movements, but there is no doubt that the overall financing environment has substantially improved over the last nine months, with real competition now developing amongst lending banks. This is having a positive effect on yields, with a general expectation that prime property in particular will show substantial yield compression in 2015. This, allied with the recently-commenced asset purchase programme of the European Central Bank, encourages a view that the global prospects for price appreciation of fixed and financial assets are currently very positive.
Against this background, the Fund Management is confident that the Fund’s operational earnings have now improved to the level necessary to sustain periodic dividend payments to shareholders. Accordingly, Management is recommending a distribution to the shareholders of 30 cents per share for 2014.
In the medium term, the Management recognises that the Fund needs to grow substantially to be able to generate and sustain share price growth and dividend payments to shareholders at an attractive level. Significant growth in assets under management is also necessary to improve the trading liquidity of the Fund’s stock. However, the Management also recognises the concerns of shareholders that such growth should not be achieved at the cost of a substantial dilution of existing shareholders.
Following suggestions from shareholders at the Fund’s EGM in December 2014, the Management and its professional advisors are now investigating the takeover of 3 other quoted entities with income-producing continental European property holdings. These target entities have a market capitalisation substantially below their net asset value, theoretically enabling the Fund to finance an acquisition by the

25
issuance of shares at a premium to its current share price. Reflecting the target entity’s share price discount to net assets, a successful acquisition should enhance rather than dilute NAV per share whilst increasing the size of the Fund, the number of shares in issue and the liquidity of the stock. The intention of Management is to position this Fund as the “consolidation” entity of choice for distressed real estate funds and corporate structures, able to demonstrate a successful track record of stabilisation and recovery of shareholder value, supported by a strong and sustainable dividend policy.
Deventer, 31 March 2015 The management, Palmer Capital - Fondsenbeheer B.V. G.St.J. Barker LLB FRICS, Managing director P.H.J. Mars, M.Sc., Managing director P.H. van Kleef RC MRE, Managing director
26
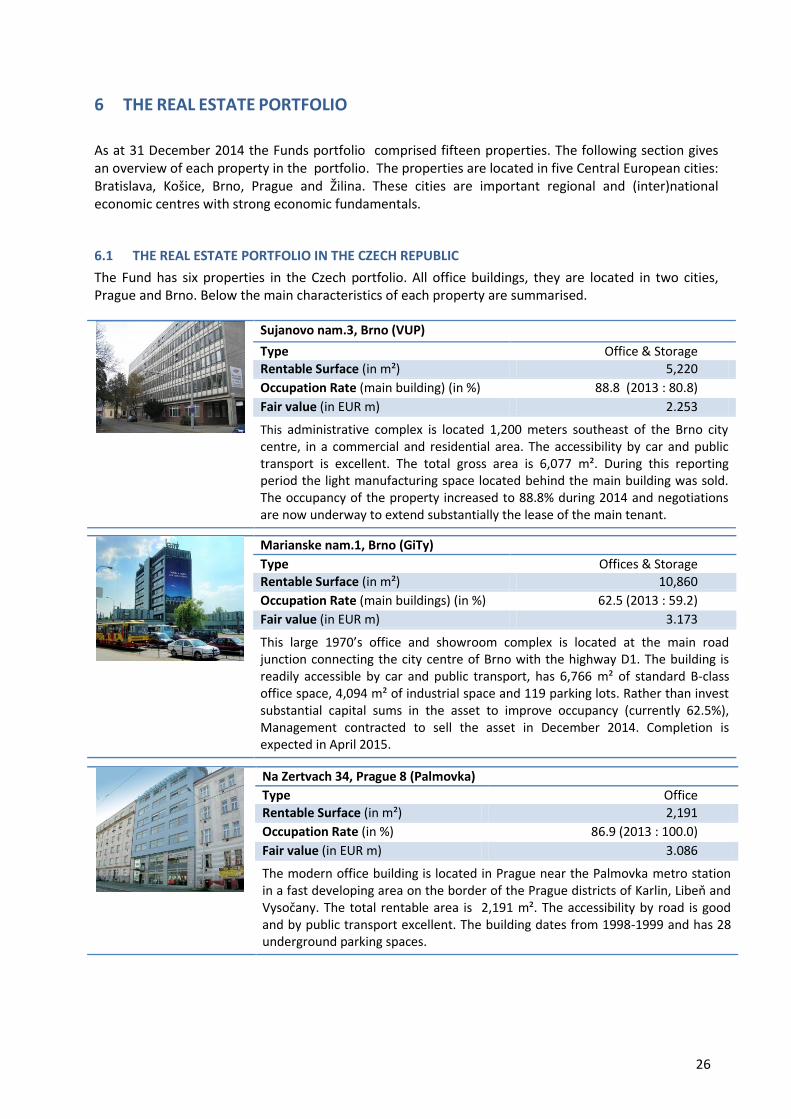
6 THE REAL ESTATE PORTFOLIO
As at 31 December 2014 the Funds portfolio comprised fifteen properties. The following section gives an overview of each property in the portfolio. The properties are located in five Central European cities: Bratislava, Košice, Brno, Prague and Žilina. These cities are important regional and (inter)national economic centres with strong economic fundamentals.
6.1 THE REAL ESTATE PORTFOLIO IN THE CZECH REPUBLIC
The Fund has six properties in the Czech portfolio. All office buildings, they are located in two cities, Prague and Brno. Below the main characteristics of each property are summarised.
Sujanovo nam.3, Brno (VUP)
Type Office & Storage Rentable Surface (in m²) 5,220
Occupation Rate (main building) (in %) 88.8 (2013 : 80.8)
Fair value (in EUR m) 2.253
This administrative complex is located 1,200 meters southeast of the Brno city centre, in a commercial and residential area. The accessibility by car and public transport is excellent. The total gross area is 6,077 m². During this reporting period the light manufacturing space located behind the main building was sold. The occupancy of the property increased to 88.8% during 2014 and negotiations are now underway to extend substantially the lease of the main tenant.
Marianske nam.1, Brno (GiTy)
Type Offices & Storage
Rentable Surface (in m²) 10,860
Occupation Rate (main buildings) (in %) 62.5 (2013 : 59.2)
Fair value (in EUR m) 3.173
This large 1970’s office and showroom complex is located at the main road junction connecting the city centre of Brno with the highway D1. The building is readily accessible by car and public transport, has 6,766 m² of standard B-class office space, 4,094 m² of industrial space and 119 parking lots. Rather than invest substantial capital sums in the asset to improve occupancy (currently 62.5%), Management contracted to sell the asset in December 2014. Completion is expected in April 2015.
Na Zertvach 34, Prague 8 (Palmovka)
Type Office
Rentable Surface (in m²) 2,191
Occupation Rate (in %) 86.9 (2013 : 100.0)
Fair value (in EUR m) 3.086
The modern office building is located in Prague near the Palmovka metro station in a fast developing area on the border of the Prague districts of Karlin, Libeň and Vysočany. The total rentable area is 2,191 m². The accessibility by road is good and by public transport excellent. The building dates from 1998-1999 and has 28 underground parking spaces.

27
Prvniho pluku 621, Prague 8 (Karlin)
Type Office
Rentable Surface (in m²) 3,287
Occupation Rate (in %) 80.8 (2013 : 87.5)
Fair value (in EUR m) 3.635
This office complex contains two adjoining buildings. It is located in Karlin, Prague 8. One of the buildings was recently refurbished to modern standard and the other building was constructed in 2002. Both buildings have 4 floors. The total rentable space (predominantly office space) is 3,287 m². There is sufficient parking capacity, with 35 parking spaces in the courtyard.
Politickych veznu 10, Prague 1 (Newton House)
Type Office
Rentable Surface (in m²) 2,305
Occupation Rate (in %) 85.4 (2013 : 62.6)
Fair value (in EUR m) 4.594
This representative office building is located in Prague’s city centre, near Wenceslas Square. The main building has 8 floors. The total rentable space is 2,305 m². The whole complex has partly been reconstructed with additional parking spaces. The property is close to the Wilsonova arterial road through Prague city centre and within 5 minutes walk of the central railway station.
Drahobejlova 27, Prague 8 (Drahobejlova)
Type Office
Rentable Surface (in m²) 2,304
Occupation Rate (in %) 61.0 (2013 : 35.2)
Fair value (in EUR m) 1.662
This office building, originally a 1930’s industrial building, is located in the lively mixed-use Vysočany district of Prague close to the new O² hockey stadium. The total interior rentable area is 2,304 m² in the current layout. Although it was reconstructed in 2000 as an administrative building it does not meet all modern market requirements for this property class. It has, however, excellent public transport connections and interesting potential for conversion to residential use (lofts) which Management is now investigating in detail.

28
6.2 THE REAL ESTATE PORTFOLIO IN THE SLOVAK REPUBLIC
The Fund has nine properties in its Slovak portfolio. Mainly office properties, they are located in three cities, Bratislava, Žilina and Košice. The main characteristics of each property are briefly summarised below:
Záhradnicka 46, Bratislava (Záhradnicka)
Type Office
Rentable Surface (in m²) 3,755
Occupation Rate (in %) 55.6 (2013 : 61.2)
Fair value (in EUR m) 4.100
The underground floors and first 4 upper storeys of this modernised property are used for office or retail purposes. The building is located on a side road close to the business centre of Bratislava. It has 6 stories and 2 underground floors in total, providing 3,755 m² of rentable area. The building has 28 parking spaces.
Gemerská 3, Kosiče (Gemerská)
Type Office
Rentable Surface (in m²) 4,523
Occupation Rate (in %) 66.3 (2013 : 71.1)
Fair value (in EUR m) 1.620
This C-class 1970’s administrative building is prominently located on one of the main roads into the centre of Košice , near the 55,000 m² Cassovia retail park. The total rentable space is 4,523 m². The building is easily accessible by car and by public transport. There is a controlled-access parking lot with 88 parking spaces available.
Krivá 18, Kosiče (Krivá 18)
Type Office
Rentable Surface (in m²) 6,058
Occupation Rate (in %) 68.0 (2013 : 69.0)
Fair value (in EUR m) 2.890
This 10-storey commercial building occupies an accessible location approximately 500m south east from the city centre. The premises can be used for office or retail purposes. The total rentable space of Krivá 18 is 6,058 m². There are 111 parking places available.
Pražská 4, Kosiče (Pražská 4)
Type Office
Rentable Surface (in m²) 6,119
Occupation Rate (in %) 64.6 (2013 : 69.4)
Fair value (in EUR m) 2.500
The two administrative 10-floor buildings are located in the residential area Terasa, approximately 1,5 km west from the historical centre of Košice. The premises can be used for office, business and accommodation purposes. The total space of Pražská 4 is 7,670 m² of which 6,119 m² is rentable. There are 71 parking spaces available.

29
Pražská 2, Kosiče (Pražská 2)
Type Office
Rentable Surface (in m²) 6,024
Occupation Rate (in %) 81.4 (2013 : 81.4)
Fair value (in EUR m) 2.740
The two administrative 10-floor buildings are located in the residential area Terasa, approximately 1.5 km west from the historical centre of Košice. The premises can be used for office, business and accommodation purposes. The total space of Pražská 2 is 7,723 m² of which 6,024 m² is rentable.
Krivá 23, Kosiče (Krivá 23)
Type Office
Rentable Surface (in m²) 7,318
Occupation Rate 66.0 (2013 : 68.3)
Fair value (in EUR m) 2.840
This 10-storey commercial building occupies an accessible location approximately 500m south east from the city centre. The premises can be used for office or retail purposes. The total space of Krivá 23 is 9,034 m² of which 7,318 m² is rentable. There are 111 parking places available.
Letná 45, Kosiče (Letná)
Type Office
Rentable Surface (in m²) 11,229
Occupation Rate (in %) 86.7 (2013 : 88.5)
Fair value (in EUR m) 9.880
This office building (the biggest in the portfolio) is prominently situated on Festival Square, approx. 1 km north west from the historical centre of Košice. There is an ongoing refurbishment programme to increase accessibility, aesthetics and tenant facilities. The total rentable space is 11,229 m². The building is easily accessible by car or public transport as it is near the outer city ring road. There are 70 parking places and 14 garages available.
Kysucká 16, Kosiče (Kosmalt)
Type Office/hostel
Rentable Surface (in m²) 10,712
Occupation Rate (in %) 70.2 (2013 : 67.1)
Fair value (in EUR m) 6.070
Two storeys with a total of 1,787 m² are used for administrative purposes and retail. The remaining eleven storeys of 9,830 m² are used as long-stay (hostel) apartments. The building is suited for tenants who specifically need affordable living space such as students and employees of large corporations. The building is easy to reach and is located just 1 km west from the historic centre.

30
A. Rudnayova 21, Žilina (Vural)
Type Office
Rentable Surface (in m²) 9,825
Occupation Rate (in %) 72.7 (2013 : 71.3)
Fair value (in EUR m) 4.210
This is a relatively large office building on a 6,200 m² plot. It is located in an
accessible location in Žilina. The building is well recognized in the local office market (telecom company T-Com, software company Kros). There is sufficient parking, currently over 100 spaces with possibilities to expand. The building is expected to benefit from recent regional economic developments; for example
the opening by the car maker KIA of their new Žilina factory. Negotiations are currently underway with a major tenant to substantially increase their representation in the building.
31
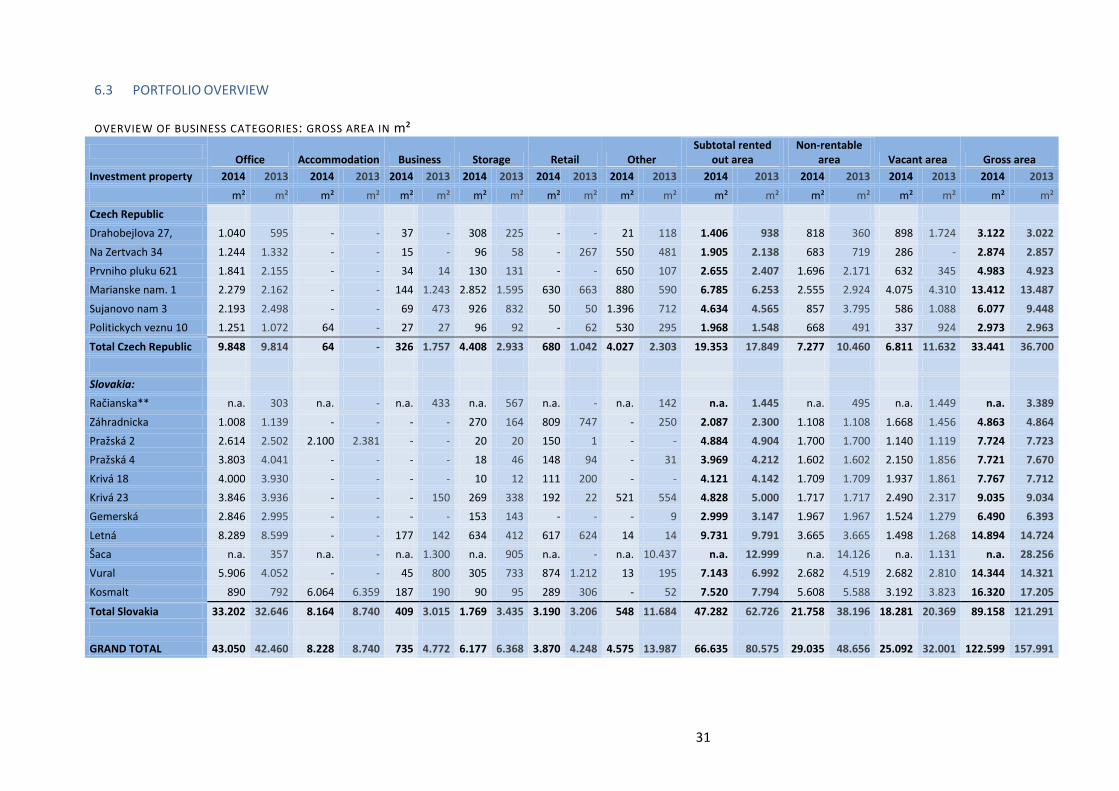
6.3 PORTFOLIO OVERVIEW
OVERVIEW OF BUSINESS CATEGORIES: GROSS AREA IN m²
Office Accommodation Business Storage Retail Other
Subtotal rented out area
Non-rentable area Vacant area Gross area
Investment property 2014 2013 2014 2013 2014 2013 2014 2013 2014 2013 2014 2013 2014 2013 2014 2013 2014 2013 2014 2013
m² m² m² m² m² m² m² m² m² m² m² m² m² m² m² m² m² m² m² m²
Czech Republic
Drahobejlova 27, 1.040 595 - - 37 - 308 225 - - 21 118 1.406 938 818 360 898 1.724 3.122 3.022
Na Zertvach 34 1.244 1.332 - - 15 - 96 58 - 267 550 481 1.905 2.138 683 719 286 - 2.874 2.857
Prvniho pluku 621 1.841 2.155 - - 34 14 130 131 - - 650 107 2.655 2.407 1.696 2.171 632 345 4.983 4.923
Marianske nam. 1 2.279 2.162 - - 144 1.243 2.852 1.595 630 663 880 590 6.785 6.253 2.555 2.924 4.075 4.310 13.412 13.487
Sujanovo nam 3 2.193 2.498 - - 69 473 926 832 50 50 1.396 712 4.634 4.565 857 3.795 586 1.088 6.077 9.448
Politickych veznu 10 1.251 1.072 64 - 27 27 96 92 - 62 530 295 1.968 1.548 668 491 337 924 2.973 2.963
Total Czech Republic 9.848 9.814 64 - 326 1.757 4.408 2.933 680 1.042 4.027 2.303 19.353 17.849 7.277 10.460 6.811 11.632 33.441 36.700
Slovakia:
Račianska** n.a. 303 n.a. - n.a. 433 n.a. 567 n.a. - n.a. 142 n.a. 1.445 n.a. 495 n.a. 1.449 n.a. 3.389
Záhradnicka 1.008 1.139 - - - - 270 164 809 747 - 250 2.087 2.300 1.108 1.108 1.668 1.456 4.863 4.864
Pražská 2 2.614 2.502 2.100 2.381 - - 20 20 150 1 - - 4.884 4.904 1.700 1.700 1.140 1.119 7.724 7.723
Pražská 4 3.803 4.041 - - - - 18 46 148 94 - 31 3.969 4.212 1.602 1.602 2.150 1.856 7.721 7.670
Krivá 18 4.000 3.930 - - - - 10 12 111 200 - - 4.121 4.142 1.709 1.709 1.937 1.861 7.767 7.712
Krivá 23 3.846 3.936 - - - 150 269 338 192 22 521 554 4.828 5.000 1.717 1.717 2.490 2.317 9.035 9.034
Gemerská 2.846 2.995 - - - - 153 143 - - - 9 2.999 3.147 1.967 1.967 1.524 1.279 6.490 6.393
Letná 8.289 8.599 - - 177 142 634 412 617 624 14 14 9.731 9.791 3.665 3.665 1.498 1.268 14.894 14.724
Šaca n.a. 357 n.a. - n.a. 1.300 n.a. 905 n.a. - n.a. 10.437 n.a. 12.999 n.a. 14.126 n.a. 1.131 n.a. 28.256
Vural 5.906 4.052 - - 45 800 305 733 874 1.212 13 195 7.143 6.992 2.682 4.519 2.682 2.810 14.344 14.321
Kosmalt 890 792 6.064 6.359 187 190 90 95 289 306 - 52 7.520 7.794 5.608 5.588 3.192 3.823 16.320 17.205
Total Slovakia 33.202 32.646 8.164 8.740 409 3.015 1.769 3.435 3.190 3.206 548 11.684 47.282 62.726 21.758 38.196 18.281 20.369 89.158 121.291
GRAND TOTAL 43.050 42.460 8.228 8.740 735 4.772 6.177 6.368 3.870 4.248 4.575 13.987 66.635 80.575 29.035 48.656 25.092 32.001 122.599 157.991

32
CONSOLIDATED FINANCIAL STATEMENTS 2014

33
7 CONSOLIDATED STATEMENT OF FINANCIAL POSITION
1 Group equity
after distribution of result Notes 31-12-2014 31-12-2013 In EUR 1,000 In EUR 1,000
Assets
Investment property 12.24 52,080 57,068
Other investments 12.25 89 555
Deferred tax assets 12.27 748 1,054
Total non-current assets 52,917 58,677
Trade and other receivables 12.28 854 1,371
Cash and cash equivalents 12.29 1,692 659
Assets held for sale 12.30 3,173 -
Total current assets 5,719 2,030
Total assets 58,636 60,707
Shareholders’ equity1 12.31
Issued capital 12.32 7,194 6,699
Share premium 12.33 17,361 17,219
Revaluation reserve 12.34 4,004 4,191
Reserve for currency translation differences 12.35 2,135 2,205
Equity component convertible bonds 12.36 49 -
Retained earnings 12.37 -/- 2,189 -/- 3,500
Total shareholders’ equity (attributable to parent company shareholders)
28,554 26,814
Liabilities
Interest-bearing loans and borrowings 12.39 22,183 9,023
Deferred tax liabilities 12.40 4,004 4,709
Total non-current liabilities 26,187 13,732
Interest-bearing loans and borrowings 12.39 2,499 18,076
Trade and other payables 12.41 1,393 2,073 Income tax payable 12.42 3 12
Total current liabilities 3,895 20,161
Total liabilities 30,082 33,893
Total shareholders’ equity and liabilities 58,636 60,707

34
8 CONSOLIDATED INCOME STATEMENT
Notes 2014 2013
In EUR 1,000 In EUR 1,000
Gross rental income 12.47 6,105 6,553
Service charge income 855 1,010
Service charge expenses 12.48 -/- 2,224 -/- 2,397
Property operating expenses 12.48 -/- 1,709 -/- 1,851
Net rental and related income 3,027 3,315
Valuation gains on investment property 1,447 859
Valuation losses on investment property -/- 1,543 -/- 2,305
Net valuation gains on investment property 12.49 -/- 96 -/- 1,446
Financial income 12.51 111 75
Other operating income 12.52 22 28
Other income 133 103
Total income 3,064 1,972
Administrative expenses 12.53 352 554
Other operating expenses 12.54 932 454
Total expenses 1,284 1,008
Net operating result before financial expenses 1,780 964
Financial expenses 12.56 1,075 960
Profit before income tax 705 4
Income tax expense 12.58 419 -/- 137
Profit for the period 1,124 -/- 133
Attributable to:
Parent company shareholders 1,124 -/- 133
Profit for the period 1,124 -/- 133
Basic earnings per (ordinary and registered) share (EUR) 12.59.1 0.82 -/- 0.10
Diluted earnings per (ordinary and registered) share (EUR) 12.59.4 0.82 -/- 0.10
35
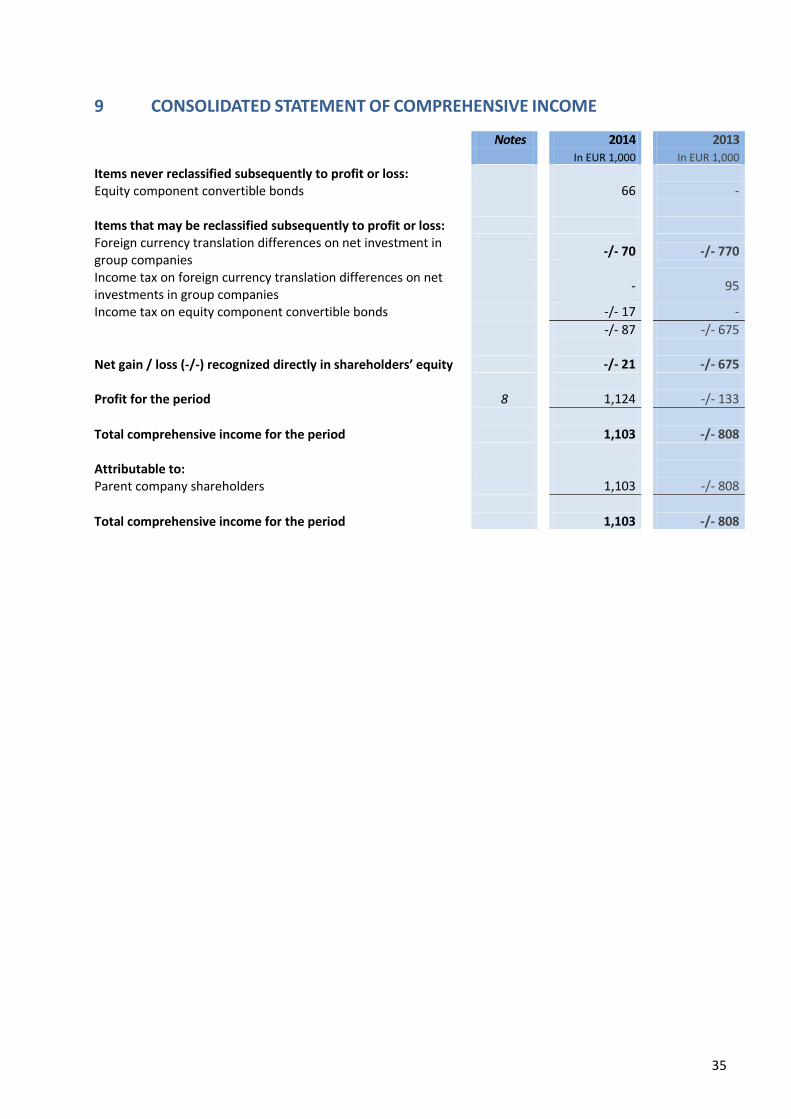
9 CONSOLIDATED STATEMENT OF COMPREHENSIVE INCOME
Notes 2014 2013 In EUR 1,000 In EUR 1,000
Items never reclassified subsequently to profit or loss:
Equity component convertible bonds 66 - Items that may be reclassified subsequently to profit or loss:
Foreign currency translation differences on net investment in group companies
-/- 70 -/- 770
Income tax on foreign currency translation differences on net investments in group companies
- 95
Income tax on equity component convertible bonds -/- 17 -
-/- 87 -/- 675
Net gain / loss (-/-) recognized directly in shareholders’ equity -/- 21 -/- 675
Profit for the period 8 1,124 -/- 133
Total comprehensive income for the period 1,103 -/- 808
Attributable to: Parent company shareholders 1,103 -/- 808
Total comprehensive income for the period 1,103 -/- 808

36
10 CONSOLIDATED STATEMENT OF CHANGES IN SHAREHOLDERS’ EQUITY
Issued
capital Share
premium Revaluation
reserve
Reserve for
currency
translation
differences
Equity
component
convertible
bonds Retained earnings
Total
share-
holders’
equity
In EUR 1,000 In EUR 1,000 In EUR 1,000 In EUR 1,000 In EUR 1,000 In EUR 1,000 In EUR 1,000
Balance as at 1 January 2014 6,699 17,219 4,191 2,205 - -/- 3,500 26,814
Total comprehensive income - - -/- 187 -/- 70 49 1,311 1,103
Own ordinary shares issued 495 142 - - - - 637
Balance as at 31 Dec 2014 7,194 17,361 4,004 2,135 49 -/- 2,189 28,554
Balance as at 1 January 2013 6,429 16,338 4,769 2,880 - -/-3,945 26,471
Total comprehensive income - - -/- 578 -/- 675 - 445 -/- 808
Own ordinary shares issued 270 881 - - - - 1,151
Balance as at 31 Dec 2013 6,699 17,219 4,191 2,205 - -/- 3,500 26,814
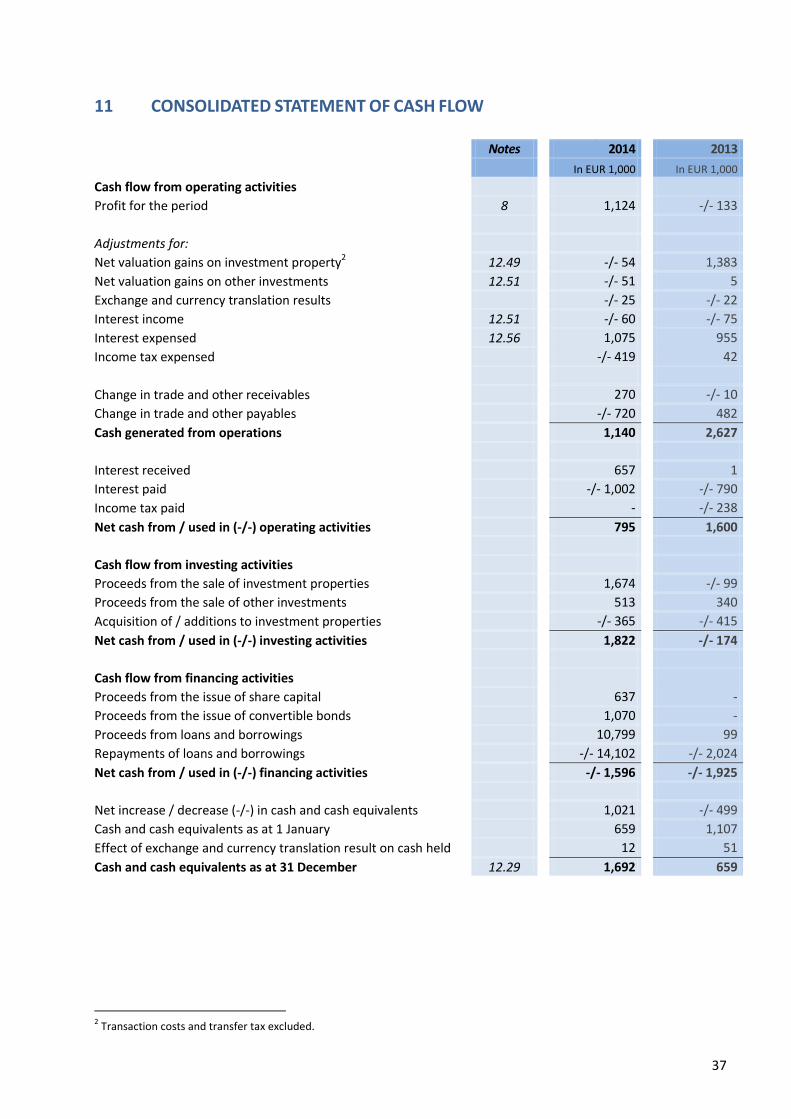
37
11 CONSOLIDATED STATEMENT OF CASH FLOW
2 Transaction costs and transfer tax excluded.
Notes 2014 2013
In EUR 1,000 In EUR 1,000
Cash flow from operating activities
Profit for the period 8 1,124 -/- 133
Adjustments for:
Net valuation gains on investment property2 12.49 -/- 54 1,383
Net valuation gains on other investments 12.51 -/- 51 5
Exchange and currency translation results -/- 25 -/- 22
Interest income 12.51 -/- 60 -/- 75
Interest expensed 12.56 1,075 955
Income tax expensed -/- 419 42
Change in trade and other receivables 270 -/- 10
Change in trade and other payables -/- 720 482
Cash generated from operations 1,140 2,627
Interest received 657 1
Interest paid -/- 1,002 -/- 790
Income tax paid - -/- 238
Net cash from / used in (-/-) operating activities 795 1,600
Cash flow from investing activities
Proceeds from the sale of investment properties 1,674 -/- 99
Proceeds from the sale of other investments 513 340
Acquisition of / additions to investment properties -/- 365 -/- 415
Net cash from / used in (-/-) investing activities 1,822 -/- 174
Cash flow from financing activities
Proceeds from the issue of share capital 637 -
Proceeds from the issue of convertible bonds 1,070 -
Proceeds from loans and borrowings 10,799 99
Repayments of loans and borrowings -/- 14,102 -/- 2,024
Net cash from / used in (-/-) financing activities -/- 1,596 -/- 1,925
Net increase / decrease (-/-) in cash and cash equivalents 1,021 -/- 499
Cash and cash equivalents as at 1 January 659 1,107
Effect of exchange and currency translation result on cash held 12 51
Cash and cash equivalents as at 31 December 12.29 1,692 659
38
12 NOTES TO THE CONSOLIDATED FINANCIAL STATEMENTS
12.1 GENERAL The company Palmer Capital Emerging Europe Property Fund N.V., hereinafter referred to as the Fund, was incorporated on 27 November 2002 in accordance with Dutch law and is established in Amsterdam (the Netherlands). The Fund obtained a listing on the NYSE Euronext Amsterdam on 13 November 2003. The consolidated financial statements of the Fund for the financial period comprise the Fund and its subsidiaries.
12.2 SUMMARY OF SIGNIFICANT ACCOUNTING PRINCIPLES The consolidated financial statements have been prepared in accordance with the International Financial Reporting Standards (“IFRS”) and the interpretations thereof adopted by the International Accounting Standards Board (“IASB”) as adopted by the European Union (hereinafter referred to as “EU-IFRS”). In the preparation of these consolidated financial statements also there has been taken account of other legal regulations, under which Book 2, Title 9 of the Dutch Civil Code (Boek 2, Titel 9 Burgerlijk Wetboek) and the Dutch Act on Financial Supervision (Wet op het financieel toezicht, the “Wft”). Use has been made for purposes of the Fund N.V.’s company profit and loss account of the exemption pursuant to Book 2, article 2:402 of the Dutch Civil Code.
12.3 STATEMENT OF COMPLIANCE AND FUTURE RELATED ASSUMPTIONS PCEEPF has applied the significant accounting principles as set out in section 12.2 to 12.22. The Managing Board authorized the consolidated financial statements for issue on 31 March 2015. As at 31 December 2014, shareholders’ equity of the Fund is positive. As stated in the liquidity forecast till 2016, the current cash position is sufficient to cover budgeted costs. Based on these assumptions, the Managing Board is of the opinion that the Fund is able to continue as a going concern and that the annual accounts are based on assumptions of going concern.
39
12.4 BASIS OF PREPARATION OF THE CONSOLIDATED FINANCIAL STATEMENTS
12.4.1 General The financial statements have been prepared on the basis of historical cost, except for investment property and financial assets at fair value through the profit or loss, which are recognized at fair value. The accounting policies explained below have been consistently applied to the results, other gains and losses, assets, liabilities and cash flows of entities included in the consolidated financial statements and are consistent with those used in the previous period. The consolidated financial statements are presented in Euros, rounded to the nearest thousand.
12.4.2 Judgements, estimates and assumptions Preparation of the consolidated financial statements in accordance with EU-IFRS requires the Management to make judgements, estimates and assumptions that affect the application of policies and the reported value of assets and liabilities, income and expenses. The estimates and associated assumptions have been based on historical experience and various other factors that are believed to be reasonable under the circumstances. The results of which forms the basis of making the judgements about carrying amounts of assets and liabilities that are not readily apparent from other sources. The actual results may differ from these estimates. The estimates and underlying assumptions are reviewed on an on-going basis. Revisions to accounting estimates are recognized in the period in which the estimate is revised if the revision affects only that period or in the period of revision and future periods if the revision affects both current and future periods. Judgements made by Management in the application of the EU-IFRS that have significant effect on the financial statements, and estimates with a significant risk of material adjustment in the next year are described in section 12.63 of the Notes.
12.4.3 Reclassification comparative figures In 2013 Asset Management fee amounting to EUR 246,000 was presented under “Administrative expenses”. Since the Asset Management fee in 2014 is presented under “Property operating expenses”, the amount of EUR 246,000 is reclassified to “Administrative expenses”. This reclassification has impact on the sections 12.22.3, 12.48.2 and 12.53.2.
12.4.4 New standards and interpretations not yet applied A number of new standards, changes to standards and interpretations have only taken effect after 1 January 2014 and therefore have not been applied to this consolidated annual statements. New standards that might be relevant for PCEEPF are described below. PCEEPF does not plan to apply this standard ahead of time. The Group expects that the changes listed below will not have material effect on its results and financial position.
IFRS 9 Financial Instruments (2010), IFRS 9 Financial Instruments (2009) IFRS 9 (2009) introduces new requirements for the classification and measurement of financial assets. Under IFRS 9 (2009), financial assets are classified and measured based on the business model in which they are held and the characteristics of their contractual cash flows. IFRS 9 (2010) introduces additions relating to financial liabilities. The IASB currently has an active project to make limited amendments to the classification and measurement requirements of IFRS 9 and add new requirements to address the impairment of financial assets and hedge accounting. IFRS 9 (2010 and 2009) are effective for annual periods beginning on or after 1 January 2015 with early adoption permitted.

40
IFRS 15 Revenue from Contracts with Customers IFRS 15 establishes a comprehensive framework for determining whether, how much and when revenue is recognised. It replaces existing revenue recognition guidance, including IAS 18 Revenue, IAS 11 Construction Contracts and IFRIC 13 Customer Loyalty Programmes. IFRS 15 is effective for annual reporting periods beginning on or after 1 January 2017, with early adoption permitted.
12.5 BASIS OF CONSOLIDATION
12.5.1 Subsidiaries Subsidiaries are those entities controlled by the Fund. Control exists when the Fund is exposed or has rights to variable returns from its involvement with that entity and has the ability to affect those returns through its power over that entity. The financial statements of subsidiaries have been included in the consolidated financial statements with effect from the date on which control commences until the date that control ceases.
12.5.2 Consolidated subsidiaries All subsidiaries of the Fund have been included in the consolidation. This relates to the following companies:
12.5.3 Elimination of transactions on consolidation All intercompany receivables, payables, significant transactions and any unrealized profits and losses on transactions within the Fund, or income or expenses from such transactions within the Fund have been eliminated in the consolidated financial statements.
12.6 BASIS OF PREPARATION OF CONSOLIDATED STATEMENT OF CASH FLOW The Fund has used the indirect method for the consolidated statement of cash flow. Given the nature of the Fund (investment company) financial income is not netted against financial expenses, but presented separately under the total income (see also section 12.18.4), so financial income is presented in the consolidated statement of cash flow under “Cash flow from operating activities”. Cash and cash equivalents as mentioned in the consolidated statement of cash flow includes the statement of financial position’s item “Cash and cash equivalents” and “Bank overdrafts”. Cash flows in foreign currencies are converted at the exchange rate applicable on settlements date. Transactions without settlement in cash are not recognized in the consolidated statement of cash flow.
Company
Registered office
Country of incorporation
Holding as at 31-12-2014
Holding as at 31-12-2013
In % In %
A Palmer Capital RE Bohemia s.r.o. Prague Czech Republic 100.0 100.0
B Palmer Capital RE Slovakia s.r.o. Bratislava Slovakia 100.0 100.0
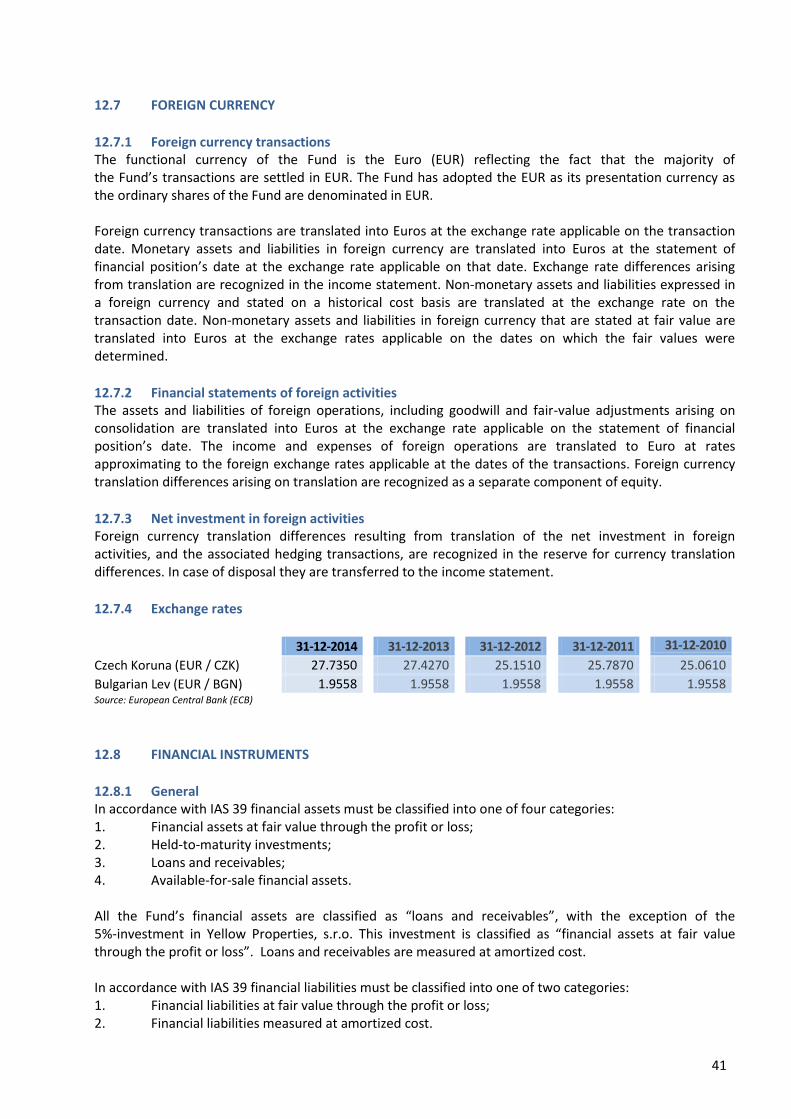
41
12.7 FOREIGN CURRENCY
12.7.1 Foreign currency transactions The functional currency of the Fund is the Euro (EUR) reflecting the fact that the majority of the Fund’s transactions are settled in EUR. The Fund has adopted the EUR as its presentation currency as the ordinary shares of the Fund are denominated in EUR. Foreign currency transactions are translated into Euros at the exchange rate applicable on the transaction date. Monetary assets and liabilities in foreign currency are translated into Euros at the statement of financial position’s date at the exchange rate applicable on that date. Exchange rate differences arising from translation are recognized in the income statement. Non-monetary assets and liabilities expressed in a foreign currency and stated on a historical cost basis are translated at the exchange rate on the transaction date. Non-monetary assets and liabilities in foreign currency that are stated at fair value are translated into Euros at the exchange rates applicable on the dates on which the fair values were determined.
12.7.2 Financial statements of foreign activities The assets and liabilities of foreign operations, including goodwill and fair-value adjustments arising on consolidation are translated into Euros at the exchange rate applicable on the statement of financial position’s date. The income and expenses of foreign operations are translated to Euro at rates approximating to the foreign exchange rates applicable at the dates of the transactions. Foreign currency translation differences arising on translation are recognized as a separate component of equity.
12.7.3 Net investment in foreign activities Foreign currency translation differences resulting from translation of the net investment in foreign activities, and the associated hedging transactions, are recognized in the reserve for currency translation differences. In case of disposal they are transferred to the income statement.
12.7.4 Exchange rates
Source: European Central Bank (ECB)
12.8 FINANCIAL INSTRUMENTS
12.8.1 General In accordance with IAS 39 financial assets must be classified into one of four categories: 1. Financial assets at fair value through the profit or loss; 2. Held-to-maturity investments; 3. Loans and receivables; 4. Available-for-sale financial assets. All the Fund’s financial assets are classified as “loans and receivables”, with the exception of the 5%-investment in Yellow Properties, s.r.o. This investment is classified as “financial assets at fair value through the profit or loss”. Loans and receivables are measured at amortized cost. In accordance with IAS 39 financial liabilities must be classified into one of two categories: 1. Financial liabilities at fair value through the profit or loss; 2. Financial liabilities measured at amortized cost.
31-12-2014 31-12-2013 31-12-2012 31-12-2011 31-12-2010
Czech Koruna (EUR / CZK) 27.7350 27.4270 25.1510 25.7870 25.0610
Bulgarian Lev (EUR / BGN) 1.9558 1.9558 1.9558 1.9558 1.9558

42
All the Fund’s financial liabilities are classified as “financial liabilities measured at amortized cost”.
12.8.2 Recognition The Fund recognizes a financial instrument on its statement of financial position when it becomes a party to the contractual provisions of the instrument.
12.8.3 Derecognition The Fund derecognizes a financial asset when the contractual rights to the cash flows from the financial asset expire or it transfers the financial asset and the transfer qualifies for derecognition. A transfer will qualify for derecognition when the Fund transfers substantially all the risks and rewards of ownership. A financial liability is derecognized when the obligation specified in the contract is discharged, cancelled or expired.
12.8.4 Offsetting financial instruments Financial assets and liabilities are offset and the net amount reported in the statement of financial position when there is a legally enforceable right to offset the recognized amounts and there is an intention to settle on a net basis, or realize the assets and settle the liability simultaneously.
12.8.5 Compound financial instruments Compound financial instruments issued by the Fund comprise convertible bonds denominated in Euro that can be converted to ordinary shares at the option of the holder, when the number of ordinary shares to be issued is fixed and does not vary with changes in fair value. The liability component of compound financial instruments is initially recognized at the fair value of a similar liability that does not have an equity conversion option. The equity component is initially recognized at the difference between the fair value of the compound financial instrument as a whole and the fair value of the liability component. Any directly attributable transaction costs are allocated to the liability and equity components in proportion to their initial carrying amounts. The equity component is recognized directly in the shareholders’ equity under “Equity component convertible bonds”. The deferred tax liabilities are deducted taking into account the principles of valuation for deferred taxes (see section 12.21 “Income tax expense”). Subsequent to initial recognition, the liability component of a compound financial instrument is measured at amortized cost using the effective interest method. The equity component of a compound financial instrument is not remeasured. Interest related to the financial liability is recognized in profit or loss. On conversion, the financial liability is reclassified to equity and no gain or loss is recognized.
12.9 INVESTMENT PROPERTY An investment property is a property that is held to realize rental income or an increase in value, or both. The initial recognition of the investment properties is at cost. Investment properties are stated at fair value. An external, independent valuer with a relevant recognized qualification and recent experience with the location and the type of property to be appraised, values the portfolio annually. The valuations have been made in accordance with the appropriate sections of the current Valuation Standards contained within the RICS Valuation standards. The fair values are based on market values, being the estimated amount for which a property could be exchanged on the date of valuation between a willing buyer and a willing seller in an arm’s length transaction after proper marketing wherein the parties had each acted knowledgeably,

43
prudently and without compulsion. Considering the type of investment property Level 3 fair value hierarchy is applied for all real estate assets in the portfolio. The valuations are made on the basis of the total of the net annual rents generated by the properties and, where relevant, the associated costs. The major sources of uncertainty in estimates are as follows: A. Development of rents; B. Capitalisation factor for transactions; C. Fair rents per type of property; D. Property prices. Three standard methods of valuation computation are considered, namely ‘Term and reversion’, ‘Hard core and top-slice’ and ‘Initial Yield’:
The term and reversion method involves the following: net income up to the end of the contract term and the market-based net income over the following at least ten years are discounted back to the valuation date (“term”). For the time after this period, the stabilised net rental income is capitalised at the market interest rate and also discounted back to the valuation date to determine the perpetual yield (“reversion”). Depending on the estimates of risk – which are based on the type of property, location and region as well as current market circumstances – different discount rates are applied to the current rental income and the capitalisation of the perpetual yield. The assumptions underlying the valuation, e.g. for risk, void periods, vacancies or maintenance costs, are based on estimates by relevant market players, on derived data or the appraisers’ experience.
The hard core and top-slice method is similar to the logic behind the term and reversion model. Net income generated by the property – up to the market rent (hard core component) – is capitalised at a normal market interest rate as a perpetual yield over the entire term (term of the rental contract plus subsequent rental). The top-slice component (the net income for this same term that exceeds the market rent) is then discounted at a risk-adjusted market interest rate. The amount of the risk premium is dependent on the probability of vacancy.
The initial yield method applies a single all risks yield at the date of valuation, i.e. net income / gross purchase price.
For all investment properties that are measured at fair value, the current use of the properties is their highest and best use. In this reporting period all properties were externally valuated using the Hard core and top-slice method. The application of one of these methods depends on the level of vacancy. In order to arrive at the valuation of the property, the annual net rents are capitalized using a Yield factor that includes the specific risks inherent to the net cash flows. The following is a statement of the range of Yields factors used for each type of property.
12.9.1 Analysis of Yield factor per property category
* including GiTy, asset held for sale
** Yield factor 2013 and 2014 according to specification of the external valuation.
No. Property category* Yield factor 2014** Yield factor 2013*
in % in %
A Office B+-class 8.25 – 9.50 8.25 – 9.00
B Office B--class 11.00 – 14.00 11.00 – 14.00
C Office / storage B--class 11.16 12.00
D Industrial storage B-class 21.15 21.06
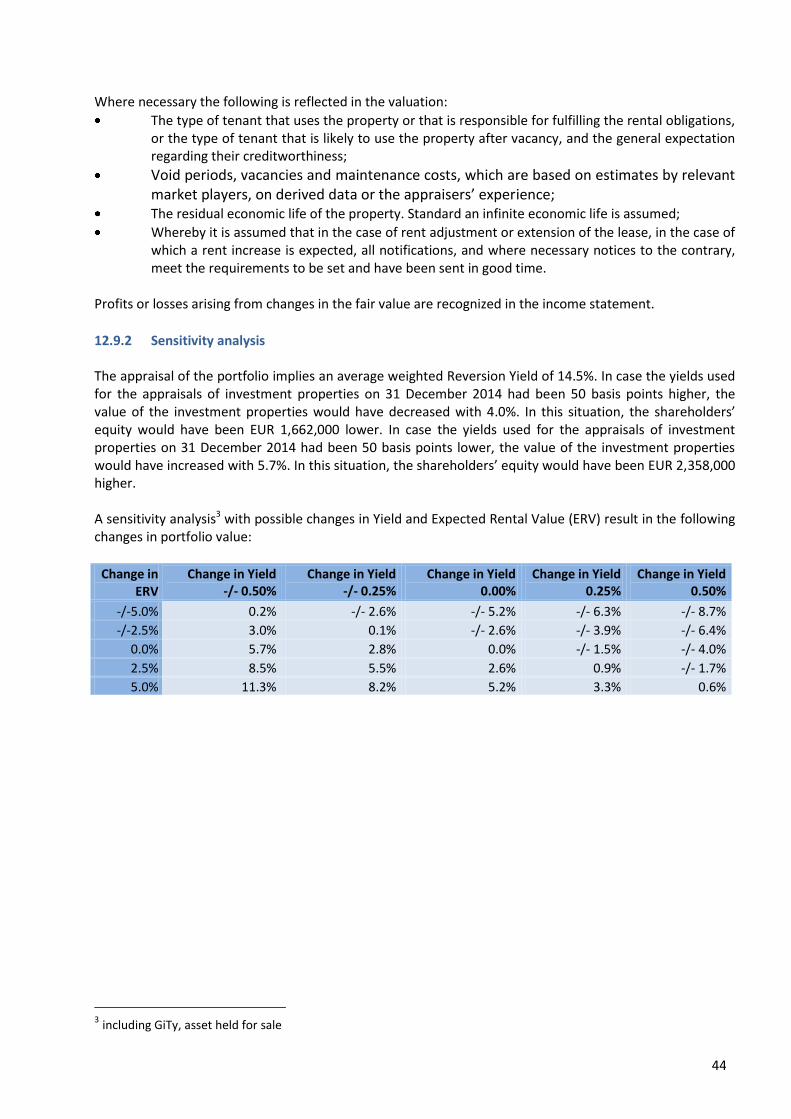
44
Where necessary the following is reflected in the valuation:
The type of tenant that uses the property or that is responsible for fulfilling the rental obligations, or the type of tenant that is likely to use the property after vacancy, and the general expectation regarding their creditworthiness;
Void periods, vacancies and maintenance costs, which are based on estimates by relevant market players, on derived data or the appraisers’ experience;
The residual economic life of the property. Standard an infinite economic life is assumed;
Whereby it is assumed that in the case of rent adjustment or extension of the lease, in the case of which a rent increase is expected, all notifications, and where necessary notices to the contrary, meet the requirements to be set and have been sent in good time.
Profits or losses arising from changes in the fair value are recognized in the income statement.
12.9.2 Sensitivity analysis The appraisal of the portfolio implies an average weighted Reversion Yield of 14.5%. In case the yields used for the appraisals of investment properties on 31 December 2014 had been 50 basis points higher, the value of the investment properties would have decreased with 4.0%. In this situation, the shareholders’ equity would have been EUR 1,662,000 lower. In case the yields used for the appraisals of investment properties on 31 December 2014 had been 50 basis points lower, the value of the investment properties would have increased with 5.7%. In this situation, the shareholders’ equity would have been EUR 2,358,000 higher. A sensitivity analysis3 with possible changes in Yield and Expected Rental Value (ERV) result in the following changes in portfolio value:
3 including GiTy, asset held for sale
Change in ERV
Change in Yield -/- 0.50%
Change in Yield -/- 0.25%
Change in Yield 0.00%
Change in Yield 0.25%
Change in Yield 0.50%
-/-5.0% 0.2% -/- 2.6% -/- 5.2% -/- 6.3% -/- 8.7%
-/-2.5% 3.0% 0.1% -/- 2.6% -/- 3.9% -/- 6.4%
0.0% 5.7% 2.8% 0.0% -/- 1.5% -/- 4.0%
2.5% 8.5% 5.5% 2.6% 0.9% -/- 1.7%
5.0% 11.3% 8.2% 5.2% 3.3% 0.6%

45
12.10 OTHER INVESTMENTS All other investments are financial instruments. The accounting principles for financial instruments are described in section 12.8 “Financial instruments”.
12.11 DEFERRED TAX ASSETS The principles of valuation with regard to the deferred tax assets are described in section 12.21 “Income tax expense”.
12.12 TRADE AND OTHER RECEIVABLES Trade and other receivables are recognized initially at fair value and subsequently measured at amortized cost using the effective interest method, less provision for impairment.
12.13 CASH AND CASH EQUIVALENTS Cash and cash equivalents consist of cash and bank balances. Time deposits are only included in cash and cash equivalents if the expectation is that they will be used to fund working capital. In the consolidated statement of cash flows bank overdrafts at call, which constitute an integral part of PCEEPF’s Asset Management, form part of cash and cash equivalents.
12.14 ASSETS HELD FOR SALE Non-current assets, or disposal groups comprising assets and liabilities, are classified as held for sale if it is highly probable that they will be recovered primarily through sale rather than through continuing use. Such assets, or disposal groups, are generally measured at the lower of their carrying amount and fair value less costs to sell, except for investment property. Investment property held for sale is measured in accordance with section 12.9 “Investment property”. Any impairment loss on a disposal group is allocated first to goodwill, and then to the remaining assets and liabilities on a pro rata basis, except that no loss is allocated to financial assets, deferred tax assets or investment property, which continue to be measured in accordance with the Funds other accounting policies. Impairment losses on initial classification as held for sale or held for distribution and subsequent gains and losses on remeasurement are recognized in profit or loss. Once classified as held for sale, intangible assets and property, plant and equipment are no longer amortized or depreciated, and any equity-accounted investee is no longer equity accounted.
12.15 IMPAIRMENT
Other investments, trade and other receivables and cash and cash equivalents are classified as loans and receivables and are recognized initially at fair value and subsequently measured at amortized cost using the effective interest method, less provision for impairment. A provision for impairment is established when there is objective evidence that the Fund will not be able to collect all amounts due according to the original terms of the receivables. Significant financial difficulties of the debtor, probability that the debtor

46
will enter bankruptcy or financial reorganization and default or delinquency in payments is considered indicators that a receivable is impaired. The amount of the provision is the difference between the asset’s carrying amount and the present value of estimated future cash flows, discounted at the original effective interest rate. The carrying amount of the asset is reduced through the use of an allowance account, and the amount of the loss is recognized in the consolidated income statement. When a receivable is uncollectible, it is written off against the allowance account for receivables. Subsequent recoveries of amounts previously written off are credited in the consolidated income statement.
12.16 SHAREHOLDERS’ EQUITY The Fund operates as a closed-end company. The issued capital of the Fund is considered as shareholders’ equity.
12.17 LIABILITIES
12.17.1 Interest-bearing loans and borrowings Interest-bearing loans and borrowings are recognized initially at fair value, net of transaction costs incurred. The cost in foreign currency is translated at the exchange rate applicable on the transaction date. After first inclusion, interest-bearing loans and borrowings are stated at amortized cost, with any difference between cost and the redemption amount being stated in the income statement over the term of the loans on the basis of the effective interest method.
12.17.2 Provisions A provision is recognized in the statement of financial position when the Fund has a legal or constructive obligation as result of a past event, and when it is probable that an outflow of economic benefits will be required to settle the obligation. If the effect is material, provisions are determined by discounting the expected future cash flows at a pre-tax rate that reflects current market assessments of the time value money and, where appropriate, the risks to the obligation.
12.17.3 Deferred tax liabilities The principles of valuation with regard to the deferred tax liabilities are described in section 12.21 “Income tax expense”.
12.17.4 Income tax payable Income tax on profits still to be paid, which is presented under this heading, is recognized at nominal value.
12.17.5 Trade and other payables Trade and other payables are recognized initially at fair value and subsequently measured at amortized cost using the effective interest method.
47
12.18 INCOME
12.18.1 Gross rental income Rental income from investment properties is stated in the income statement excluding value added tax, on the basis of the period of the lease. If the investment property has been acquired in the course of the financial period, the rental income is accounted for from the date of acquisition by the Fund. If office or other equipment is leased together with the premises, this is included in the rental income. Incentives paid as encouragement for entering into leases are included in the statement of financial position as prepayments, and recognized in the income statement as an integral part of total rental income. The incentives included in the statement of financial position are stated in the income statement on a straight-line basis on the basis of the duration of the lease. Amounts separately charged to lessees, which are regarded as service charges, are not included in rental income but stated in the income statement as income from service charges.
12.18.2 Property operating expenses Property operating expenses consist mainly of maintenance costs, property taxes, insurance premiums, and Management and collection costs. Service charges are stated separately in the income statement. If the investment property has been acquired in the course of the financial period, the direct operating expenses are accounted for from the date of acquisition by the Fund.
12.18.3 Valuation gains / losses on investment property The profits and losses on investment properties recognized relate to changes in the fair value of the investment properties in relation to the fair value as at 31 December of the preceding financial period. Classification of the change in value of an investment property under profits or losses is based on the cumulative change in value over the financial period as a whole.
12.18.4 Financial income Interest income on funds invested is recognized in the income statement as it accrues, by means of the effective interest method. Given the nature of the Fund (investment company) finance income is not netted against finance charges, but presented separately under the total of income. Financial income arises principally from the investments held in order to be used for investment in property. Financial income also includes the exchange and currency translation profits that arise principally from the settlement of monetary items or from the translation of monetary items in foreign currency.
12.18.5 Other operating income Other operating income is recognized in the income statement when it is probable that economic benefits will flow into the Fund and the (net) revenues can be measured reliably.
12.19 EXPENSES Administrative expenses and other operating expenses are recognized in the income statement as incurred. Expenses may only be deferred if they meet the definition of an asset.
48
12.20 FINANCIAL EXPENSES Net finance charges comprise the interest expense on funds taken up, calculated using the effective interest method, exchange and currency translation losses, which arise principally from the settlement of monetary items, or in the translation of monetary items in foreign currency. Interest expense is recognized in the income statement as it accrues, by means of the effective interest rate method.
12.21 INCOME TAX EXPENSE The income tax expense for the financial period comprises the tax on profits and deferred tax on profits owed and deductible during the financial period. The tax on profits is recognized in the income statement. The tax owed and deductible for the financial period is the anticipated tax payable on the taxable profits for the financial period, calculated on the basis of tax rates applicable at the statement of financial position’s date, or which have been materially decided upon at the statement of financial position’s date, and adjustments on the tax owed for preceding years. The provision for deferred tax liabilities is formed on the basis of the statement of financial position method, whereby a provision is made for temporary differences between the book value of assets and liabilities for the purposes of financial reporting and the book value of those items for tax purposes. No provision is made for the following temporary differences: goodwill not deductible for tax purposes, the first inclusion of assets or liabilities that influence neither the profit for financial statements purposes nor the profit for tax purposes, and differences associated with investments in subsidiaries to the extent that they will probably not be settled in the foreseeable future. The amount of the provision for deferred tax liabilities is based on the manner in which it is expected that the carrying amount of the assets and liabilities will be realized or settled, whereby use is made of the tax rates adopted at the statement of financial position’s date, or which have already been materially decided upon at the statement of financial position’s date. A deferred tax asset is included only to the extent that it is probable that taxable profits will be available in the future which can be used for realization of the asset item. The amount of the deferred tax assets is reduced to the extent that it is no longer probable that the associated tax benefit will be realized. Additional tax on profits as a result of dividend distributions is recognized at the same time as the obligation to distribute the dividend concerned.
49
12.22 SEGMENT REPORTING
12.22.1 General Segment information is given for each operating segment. An operating segment is a component of the Fund:
That engages in business activities from which it may earn revenues and incur expenses (including revenues and expenses related to transactions with other components of the Fund);
Whose operating results are used by the Fund’s chief operating decision maker to make decisions about resources to be allocated to the segment and to regularly review and assess its performance; and for which discrete financial information is available.
Given the Fund’s Management decision-making structure and internal reporting structure each investment property is indicated as an operating segment. The investment properties held during the financial period (current period and / or previous period), as mentioned in section 12.24.1 “Analysis of investment properties” are taken into account in the segment reporting overviews. The following segment reporting overviews are given for each investment property: A. Overview of segment result (net operating income), distinguished to the Fund’s geographic
categories; B. Overview of assets and liabilities distinguished to the Fund’s geographic categories. Since each separate investment property is indicated as an operating segment, most of the Fund’s assets and liabilities cannot be allocated to the operating segments. Therefore only the carrying amount of each investment property is reported as segment assets (see section 12.24.1 “Analysis of investment properties”). The prices for transactions between segments are determined on a business-like, objective basis.
12.22.2 The Fund’s geographic categories The Fund distinguishes the following geographic categories: A. The Czech Republic; B. Slovakia; C. The Netherlands. The following segmentation criteria are used:
The allocation of the investment property is based on the geographic location of the premises;
The allocation of deferred tax assets is based on the geographic location of the company which generated the deferred tax assets;
The allocation of investments in associates are based on the business location of the company the Fund invests in;
The allocation of other assets (bank accounts, cash, receivables, etc.) is based on the geographic location of the debtor;
The allocation of deferred tax liabilities is based on the geographic location of the company which generated the deferred tax liabilities;
The allocation of the other liabilities is based on the geographic location of the creditor. The allocation of segment results (net operating income) to the several geographic categories is based on the geographic location of the premises. The geographic category “The Netherlands” relates primarily to other investments held by the Fund in anticipation of their investment in property.
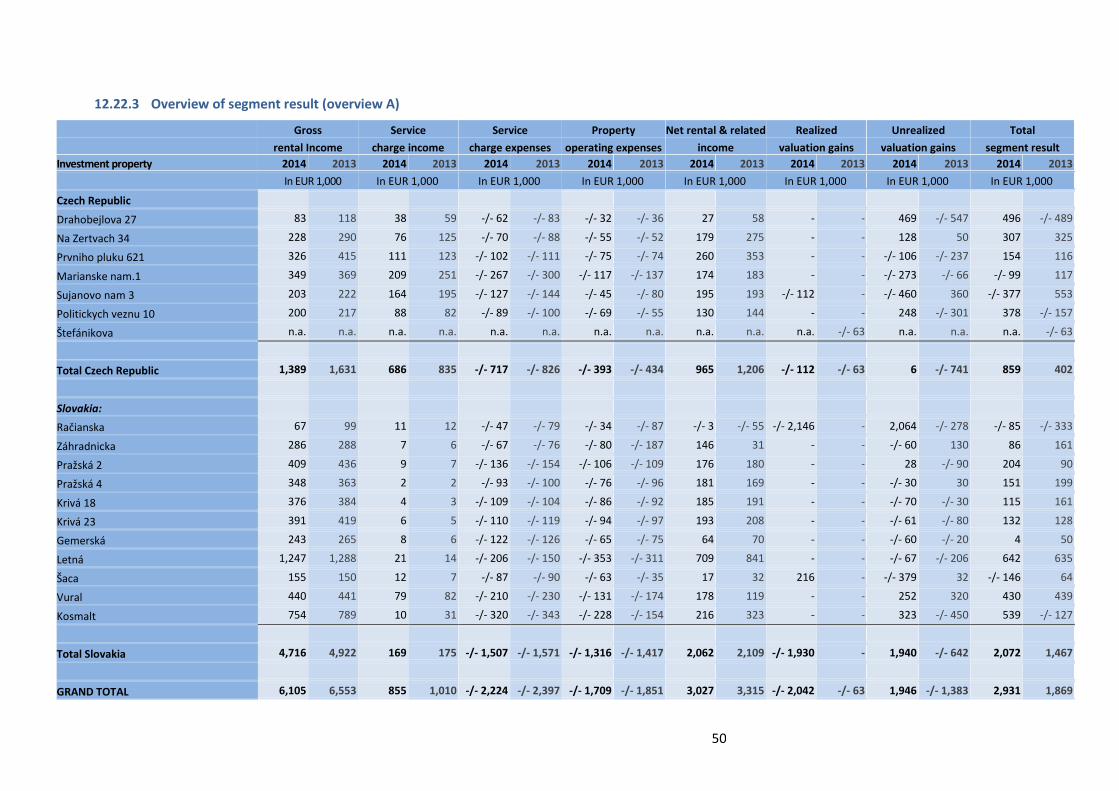
50
12.22.3 Overview of segment result (overview A)
Gross
rental Income
Service
charge income
Service
charge expenses
Property
operating expenses
Net rental & related
income
Realized
valuation gains
Unrealized
valuation gains
Total
segment result
Investment property 2014 2013 2014 2013 2014 2013 2014 2013 2014 2013 2014 2013 2014 2013 2014 2013
In EUR 1,000 In EUR 1,000 In EUR 1,000 In EUR 1,000 In EUR 1,000 In EUR 1,000 In EUR 1,000 In EUR 1,000
Czech Republic
Drahobejlova 27 83 118 38 59 -/- 62 -/- 83 -/- 32 -/- 36 27 58 - - 469 -/- 547 496 -/- 489
Na Zertvach 34 228 290 76 125 -/- 70 -/- 88 -/- 55 -/- 52 179 275 - - 128 50 307 325
Prvniho pluku 621 326 415 111 123 -/- 102 -/- 111 -/- 75 -/- 74 260 353 - - -/- 106 -/- 237 154 116
Marianske nam.1 349 369 209 251 -/- 267 -/- 300 -/- 117 -/- 137 174 183 - - -/- 273 -/- 66 -/- 99 117
Sujanovo nam 3 203 222 164 195 -/- 127 -/- 144 -/- 45 -/- 80 195 193 -/- 112 - -/- 460 360 -/- 377 553
Politickych veznu 10 200 217 88 82 -/- 89 -/- 100 -/- 69 -/- 55 130 144 - - 248 -/- 301 378 -/- 157
Štefánikova n.a. n.a. n.a. n.a. n.a. n.a. n.a. n.a. n.a. n.a. n.a. -/- 63 n.a. n.a. n.a. -/- 63
Total Czech Republic 1,389 1,631 686 835 -/- 717 -/- 826 -/- 393 -/- 434 965 1,206 -/- 112 -/- 63 6 -/- 741 859 402
Slovakia:
Račianska 67 99 11 12 -/- 47 -/- 79 -/- 34 -/- 87 -/- 3 -/- 55 -/- 2,146 - 2,064 -/- 278 -/- 85 -/- 333
Záhradnicka 286 288 7 6 -/- 67 -/- 76 -/- 80 -/- 187 146 31 - - -/- 60 130 86 161
Pražská 2 409 436 9 7 -/- 136 -/- 154 -/- 106 -/- 109 176 180 - - 28 -/- 90 204 90
Pražská 4 348 363 2 2 -/- 93 -/- 100 -/- 76 -/- 96 181 169 - - -/- 30 30 151 199
Krivá 18 376 384 4 3 -/- 109 -/- 104 -/- 86 -/- 92 185 191 - - -/- 70 -/- 30 115 161
Krivá 23 391 419 6 5 -/- 110 -/- 119 -/- 94 -/- 97 193 208 - - -/- 61 -/- 80 132 128
Gemerská 243 265 8 6 -/- 122 -/- 126 -/- 65 -/- 75 64 70 - - -/- 60 -/- 20 4 50
Letná 1,247 1,288 21 14 -/- 206 -/- 150 -/- 353 -/- 311 709 841 - - -/- 67 -/- 206 642 635
Šaca 155 150 12 7 -/- 87 -/- 90 -/- 63 -/- 35 17 32 216 - -/- 379 32 -/- 146 64
Vural 440 441 79 82 -/- 210 -/- 230 -/- 131 -/- 174 178 119 - - 252 320 430 439
Kosmalt 754 789 10 31 -/- 320 -/- 343 -/- 228 -/- 154 216 323 - - 323 -/- 450 539 -/- 127
Total Slovakia 4,716 4,922 169 175 -/- 1,507 -/- 1,571 -/- 1,316 -/- 1,417 2,062 2,109 -/- 1,930 - 1,940 -/- 642 2,072 1,467
GRAND TOTAL 6,105 6,553 855 1,010 -/- 2,224 -/- 2,397 -/- 1,709 -/- 1,851 3,027 3,315 -/- 2,042 -/- 63 1,946 -/- 1,383 2,931 1,869
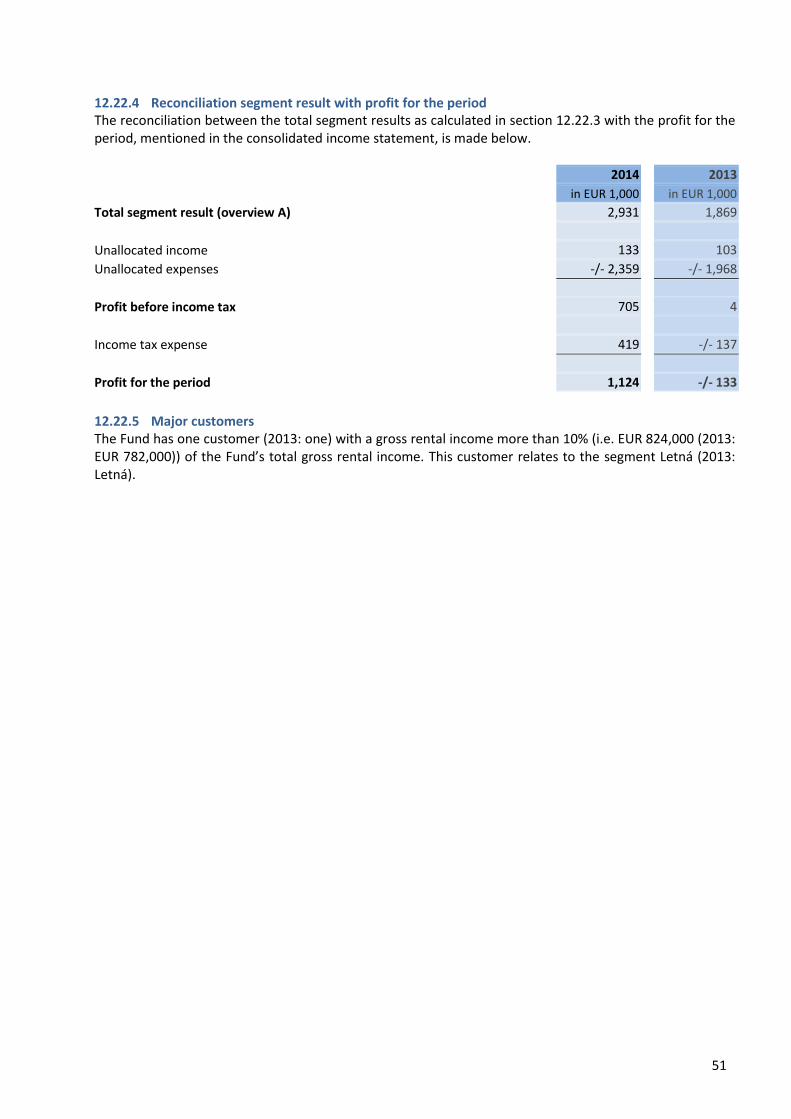
51
12.22.4 Reconciliation segment result with profit for the period The reconciliation between the total segment results as calculated in section 12.22.3 with the profit for the period, mentioned in the consolidated income statement, is made below.
2014 2013
in EUR 1,000 in EUR 1,000
Total segment result (overview A) 2,931 1,869
Unallocated income 133 103
Unallocated expenses -/- 2,359 -/- 1,968
Profit before income tax 705 4
Income tax expense 419 -/- 137
Profit for the period 1,124 -/- 133
12.22.5 Major customers The Fund has one customer (2013: one) with a gross rental income more than 10% (i.e. EUR 824,000 (2013: EUR 782,000)) of the Fund’s total gross rental income. This customer relates to the segment Letná (2013: Letná).

52
12.22.6 Overview of geographic assets and liabilities (overview B) Assets Czech Republic Slovakia The Netherlands Subtotal Unallocated Total assets
31-12-14 31-12-13 31-12-14 31-12-13 31-12-14 31-12-13 31-12-14 31-12-13 31-12-14 31-12-13 31-12-14 31-12-13
In EUR 1,000 In EUR 1,000 In EUR 1,000 In EUR 1,000 In EUR 1,000 In EUR 1,000
Investment property 15,230 19,091 36,850 37,977 - - 52,080 57,068 - - 52,080 57,068
Other investments 89 555 - - - - 89 555 - - 89 555
Deferred tax assets 174 88 574 966 - - 748 1,054 - - 748 1,054
Trade and other receivables 240 921 610 307 4 143 854 1,371 - - 854 1,371
Cash and cash equivalents 840 486 562 163 290 10 1,692 659 - - 1,692 659
Assets held for sale 3,173 - - - - - 3,173 - - - 3,173 -
Total geographic assets 19,746 21,141 38,596 39,413 294 153 58,636 60,707 - - 58,636 60,707
Liabilities
Interest bearing loans and borrowings
10,403 9,834 11,940 15,703 2,339 1,562 24,682 27,099 - - 24,682 27,099
Deferred tax liabilities 449 882 3,539 3,827 16 - 4,004 4,709 - - 4,004 4,709
Trade and other payables 540 572 459 439 394 1,062 1,393 2,073 - - 1,393 2,073
Income tax payable - 12 3 - - - 3 12 - - 3 12
Total geographic liabilities 11,392 11,300 15,941 19,969 2,749 2,624 30,082 33,893 - - 30,082 33,893

53
12.23 ACQUISITION OF SUBSIDIARIES During 2014 the Fund acquired no subsidiaries.
12.24 INVESTMENT PROPERTY
12.24.1 Analysis of investment properties
12.24.2 Statement of changes in investment properties
The “Reclassification” for the amount of EUR 3,173,000 relates to the investment property GiTy, which has been reclassified as at 31 December 2014 to “Assets held for sale” (see section 12.30).
4 A part (plot) of VUP has been sold during 2014 (see section 12.24.4).
No. Name of premises
Address
Fair value 31-12-14
Fair value 31-12-13
Interest 31-12-14
Interest 31-12-13
In EUR 1,000 In EUR 1,000 In % In % In ownership of Palmer Capital RE Bohemia, s.r.o.
1 Drahobejlova Drahobejlova 27, Prague 1,662 1,207 100.0 100.0
2 Palmovka Na Žertvách 34, Prague 3,086 2,992 100.0 100.0
3 Karlin Prvního Pluku 621/8a, Prague 3,635 3,783 100.0 100.0
4 GiTy Mariánské Nám. 617/1, Brno n.a. 3,484 held for sale 100.0
5 VUP4 Šujanovo námĕsti 3, Brno 2,253 3,281 100.0 100.0
6 Newton House Politických Vězňu 10, Prague 4,594 4,344 100.0 100.0
In ownership of Palmer Capital RE Slovakia, s.r.o.
7 Račianska Račianska 71, Bratislava n.a. 552 sold 100.0
8 Záhradnicka Záhradnícka 46, Bratislava 4,100 4,160 100.0 100.0
9 Pražská 2 Pražská 2, Košice 2,740 2,710 100.0 100.0
10 Pražská 4 Pražská 4, Košice 2,500 2,530 100.0 100.0
11 Krivá 18 Krivá 18, Košice 2,890 2,960 100.0 100.0
12 Krivá 23 Krivá 23, Košice 2,840 2,900 100.0 100.0
13 Gemerská Gemerská 3, Košice 1,620 1,650 100.0 100.0
14 Letná Letná 45, Košice 9,880 9,950 100.0 100.0
15 Šaca Šaca, Železiarenska 49, Košice n.a. 935 sold 100.0
16 Vural Alexandra Rudnaya 21, Žilina 4,210 3,930 100.0 100.0
17 Kosmalt Kysucká 16, Košice 6,070 5,700 100.0 100.0
Total fair value 52,080 57,068
2014 2013
In EUR 1,000 In EUR 1,000
Balance as at 1 January 57,068 59,830
Purchases and additions 365 415
Exchange rate differences -/- 210 -/- 1,794
Fair value adjustments 54 -/- 1,383
Sales -/- 2,024 -
Reclassification -/- 3,173 -
Balance as at 31 December 52,080 57,068

54
12.24.3 Valuation of investment properties The investment properties, stated under section 12.24.1 “Analysis of investment properties”, were valued by an external, independent valuer as at 31 December of the current year. The valuations are prepared for accounting purposes and are in accordance with relevant IFRS regulations. The market values of the investment properties are primarily derived using comparable recent market transactions at arm's length terms. All investment properties are valued at fair value.
12.24.4 Sales of investment properties The sales of investment properties stated under 12.24.2 “Statement of changes in investment properties” concern the following premises (for the realized value adjustments see section 12.49.3):
12.24.5 Transactions (investment property) with related parties The transactions executed during the financial period in respect to purchase and sale of investments were not executed with parties affiliated with the Management Board or the Fund.
12.25 OTHER INVESTMENTS
12.25.1 Analysis of other investments
Principal of investment Interest rate Final date
In CZK 1,000 In EUR 1,000
Yellow Properties, s.r.o. (5.00%) 1,691 65 n.a. n.a.
No. Name of premises Notes 1. Račianska This investment property was sold during September 2014 for the amount of
EUR 500,000.
2. VUP A part (plot) of this investment property at the rear end of the office building was sold during November 2014 for the amount of CZK 20m (EUR 724,000). The sold part of this investment property has been vacant for several years and therefore generates no rental income.
3. Šaca This investment property was sold during December 2014 for the amount of EUR 800,000.
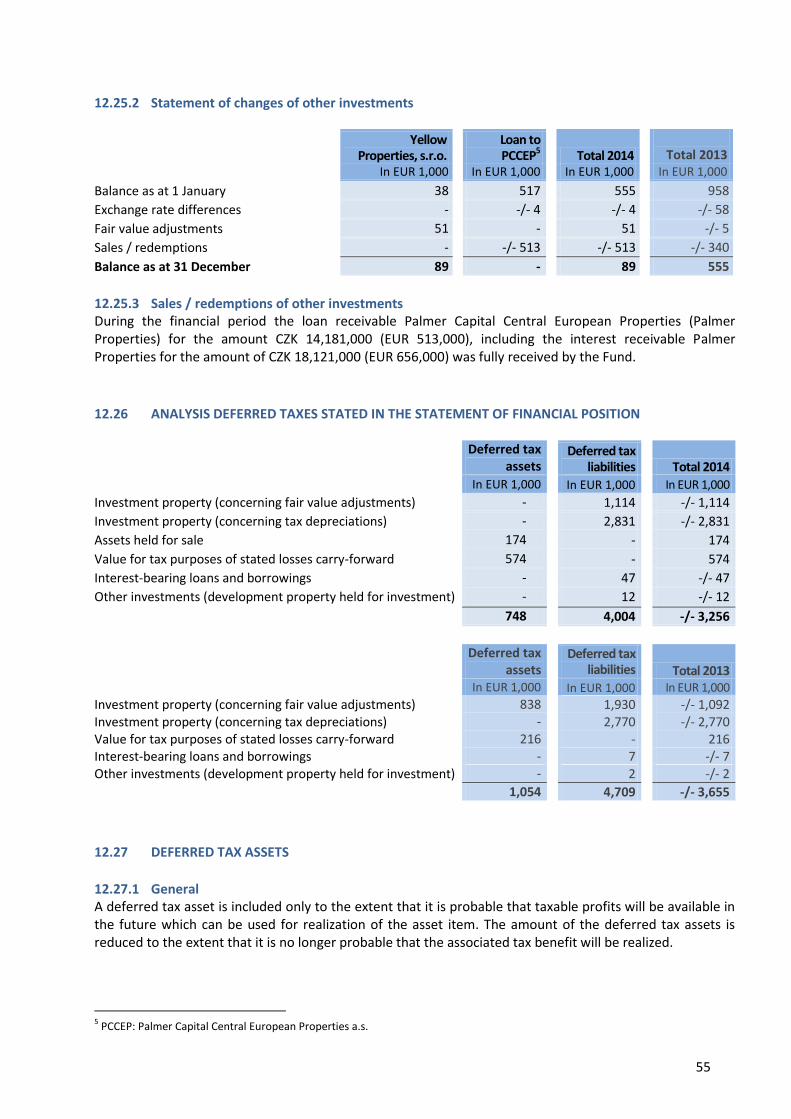
55
12.25.2 Statement of changes of other investments
Yellow
Properties, s.r.o. Loan to PCCEP5 Total 2014
Total 2013
In EUR 1,000 In EUR 1,000 In EUR 1,000 In EUR 1,000
Balance as at 1 January 38 517 555 958
Exchange rate differences - -/- 4 -/- 4 -/- 58
Fair value adjustments 51 - 51 -/- 5
Sales / redemptions - -/- 513 -/- 513 -/- 340
Balance as at 31 December 89 - 89 555
12.25.3 Sales / redemptions of other investments During the financial period the loan receivable Palmer Capital Central European Properties (Palmer Properties) for the amount CZK 14,181,000 (EUR 513,000), including the interest receivable Palmer Properties for the amount of CZK 18,121,000 (EUR 656,000) was fully received by the Fund.
12.26 ANALYSIS DEFERRED TAXES STATED IN THE STATEMENT OF FINANCIAL POSITION
Deferred tax
assets Deferred tax
liabilities Total 2014 In EUR 1,000 In EUR 1,000 In EUR 1,000
Investment property (concerning fair value adjustments) - 1,114 -/- 1,114
Investment property (concerning tax depreciations) - 2,831 -/- 2,831
Assets held for sale 174 - 174
Value for tax purposes of stated losses carry-forward 574 - 574
Interest-bearing loans and borrowings - 47 -/- 47
Other investments (development property held for investment) - 12 -/- 12
748 4,004 -/- 3,256
Deferred tax
assets
Deferred tax liabilities
Total 2013
In EUR 1,000 In EUR 1,000 In EUR 1,000
Investment property (concerning fair value adjustments) 838 1,930 -/- 1,092 Investment property (concerning tax depreciations) - 2,770 -/- 2,770 Value for tax purposes of stated losses carry-forward 216 - 216 Interest-bearing loans and borrowings - 7 -/- 7 Other investments (development property held for investment) - 2 -/- 2
1,054 4,709 -/- 3,655
12.27 DEFERRED TAX ASSETS
12.27.1 General A deferred tax asset is included only to the extent that it is probable that taxable profits will be available in the future which can be used for realization of the asset item. The amount of the deferred tax assets is reduced to the extent that it is no longer probable that the associated tax benefit will be realized.
5 PCCEP: Palmer Capital Central European Properties a.s.

56
12.27.2 Analysis of deferred tax assets stated in the statement of financial position 31-12-2014 31-12-2013
In EUR 1,000 In EUR 1,000
Investment property (will never expire) - 838
Assets held for sale (will never expire) 174 -
Value for tax purposes of stated losses carry-forward 574 216
748 1,054
12.27.3 Statement of changes in deferred tax assets stated in the statement of financial position 2014 2013
In EUR 1,000 In EUR 1,000
Balance as at 1 January 1,054 1,320
Additions 588 178
Withdrawal -/- 894 -/- 384
Change in tax rate - -/- 44
Exchange rate differences - -/- 16
Balance as at 31 December 748 1,054
The Managing Board expects (taking into account local tax law and regulations) that there will be sufficient taxable profit in the future for the Fund to set off these losses.
12.27.4 Analysis of deferred tax assets not stated in the statement of financial position 31-12-2014 31-12-2013
In EUR 1,000 In EUR 1,000
Investment property (will never expire) 321 1,214
Assets held for sale (will never expire) 361 -
Value for tax purposes of not stated losses carry-forward 269 170
951 1,384
12.27.5 Statement of changes in deferred tax assets not stated in the statement of financial position 2014 2013
In EUR 1,000 In EUR 1,000
Balance as at 1 January 1,384 1,246
Adjustments previous period 35 -
Additions 164 303
Withdrawal -/- 624 -/- 68
Exchange rate differences -/- 8 -/- 97
Balance as at 31 December 951 1,384
The Managing Board expects (taking into account local tax law and regulations) that in the future there will be insufficient taxable profit for the Fund to set off these losses.
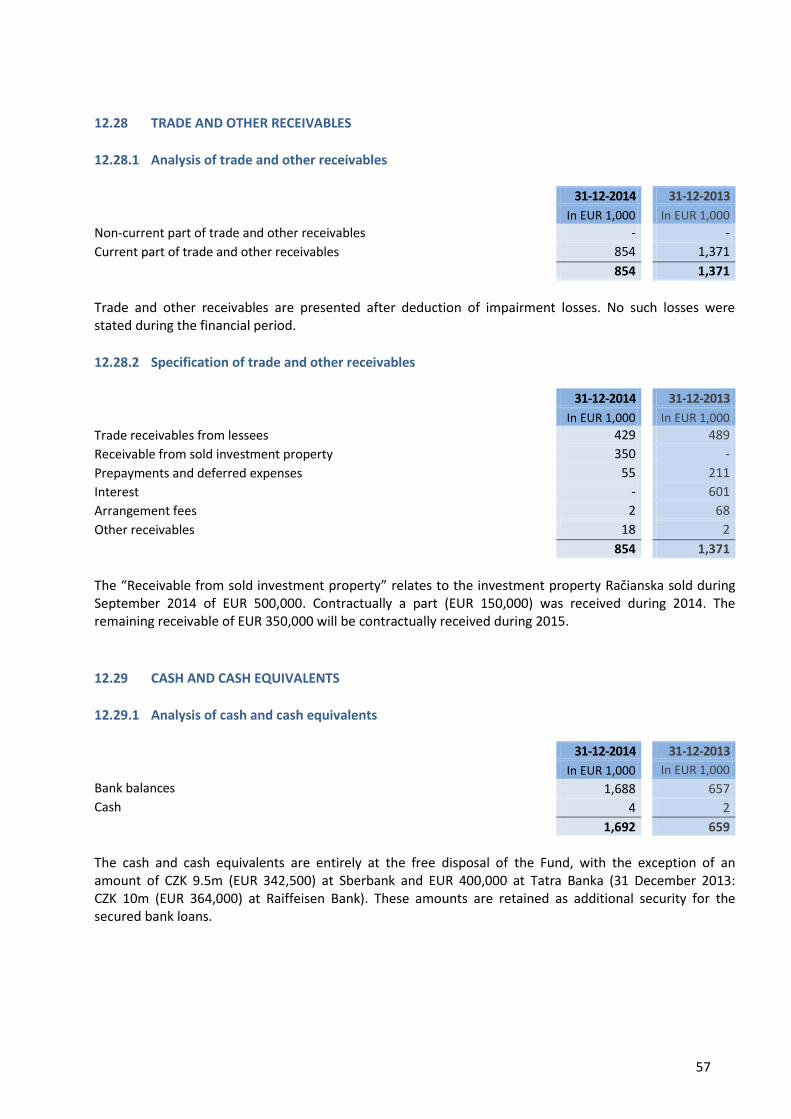
57
12.28 TRADE AND OTHER RECEIVABLES
12.28.1 Analysis of trade and other receivables 31-12-2014 31-12-2013
In EUR 1,000 In EUR 1,000
Non-current part of trade and other receivables - -
Current part of trade and other receivables 854 1,371
854 1,371
Trade and other receivables are presented after deduction of impairment losses. No such losses were stated during the financial period.
12.28.2 Specification of trade and other receivables 31-12-2014 31-12-2013
In EUR 1,000 In EUR 1,000
Trade receivables from lessees 429 489
Receivable from sold investment property 350 -
Prepayments and deferred expenses 55 211
Interest - 601
Arrangement fees 2 68
Other receivables 18 2
854 1,371
The “Receivable from sold investment property” relates to the investment property Račianska sold during September 2014 of EUR 500,000. Contractually a part (EUR 150,000) was received during 2014. The remaining receivable of EUR 350,000 will be contractually received during 2015.
12.29 CASH AND CASH EQUIVALENTS
12.29.1 Analysis of cash and cash equivalents 31-12-2014 31-12-2013
In EUR 1,000 In EUR 1,000
Bank balances 1,688 657
Cash 4 2
1,692 659
The cash and cash equivalents are entirely at the free disposal of the Fund, with the exception of an amount of CZK 9.5m (EUR 342,500) at Sberbank and EUR 400,000 at Tatra Banka (31 December 2013: CZK 10m (EUR 364,000) at Raiffeisen Bank). These amounts are retained as additional security for the secured bank loans.
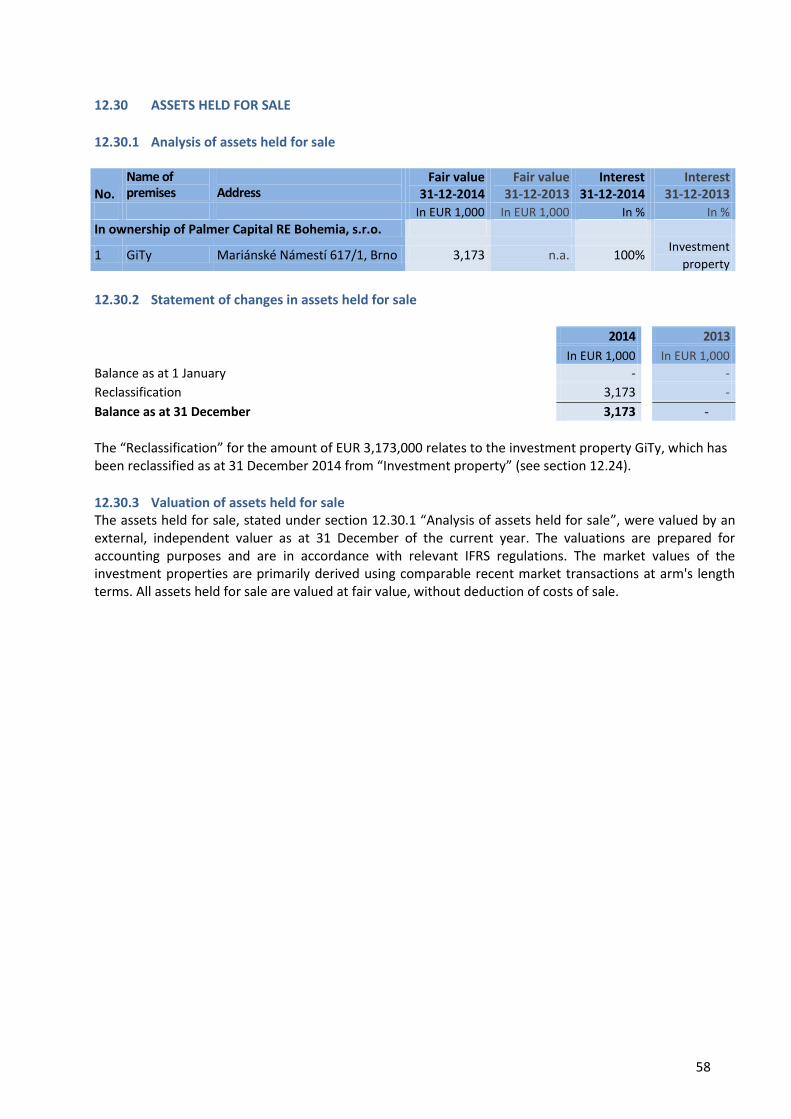
58
12.30 ASSETS HELD FOR SALE
12.30.1 Analysis of assets held for sale
12.30.2 Statement of changes in assets held for sale
The “Reclassification” for the amount of EUR 3,173,000 relates to the investment property GiTy, which has been reclassified as at 31 December 2014 from “Investment property” (see section 12.24).
12.30.3 Valuation of assets held for sale The assets held for sale, stated under section 12.30.1 “Analysis of assets held for sale”, were valued by an external, independent valuer as at 31 December of the current year. The valuations are prepared for accounting purposes and are in accordance with relevant IFRS regulations. The market values of the investment properties are primarily derived using comparable recent market transactions at arm's length terms. All assets held for sale are valued at fair value, without deduction of costs of sale.
No. Name of premises
Address
Fair value 31-12-2014
Fair value 31-12-2013
Interest 31-12-2014
Interest 31-12-2013
In EUR 1,000 In EUR 1,000 In % In % In ownership of Palmer Capital RE Bohemia, s.r.o.
1 GiTy Mariánské Námestí 617/1, Brno 3,173 n.a. 100% Investment
property
2014 2013
In EUR 1,000 In EUR 1,000
Balance as at 1 January - -
Reclassification 3,173 -
Balance as at 31 December 3,173 -
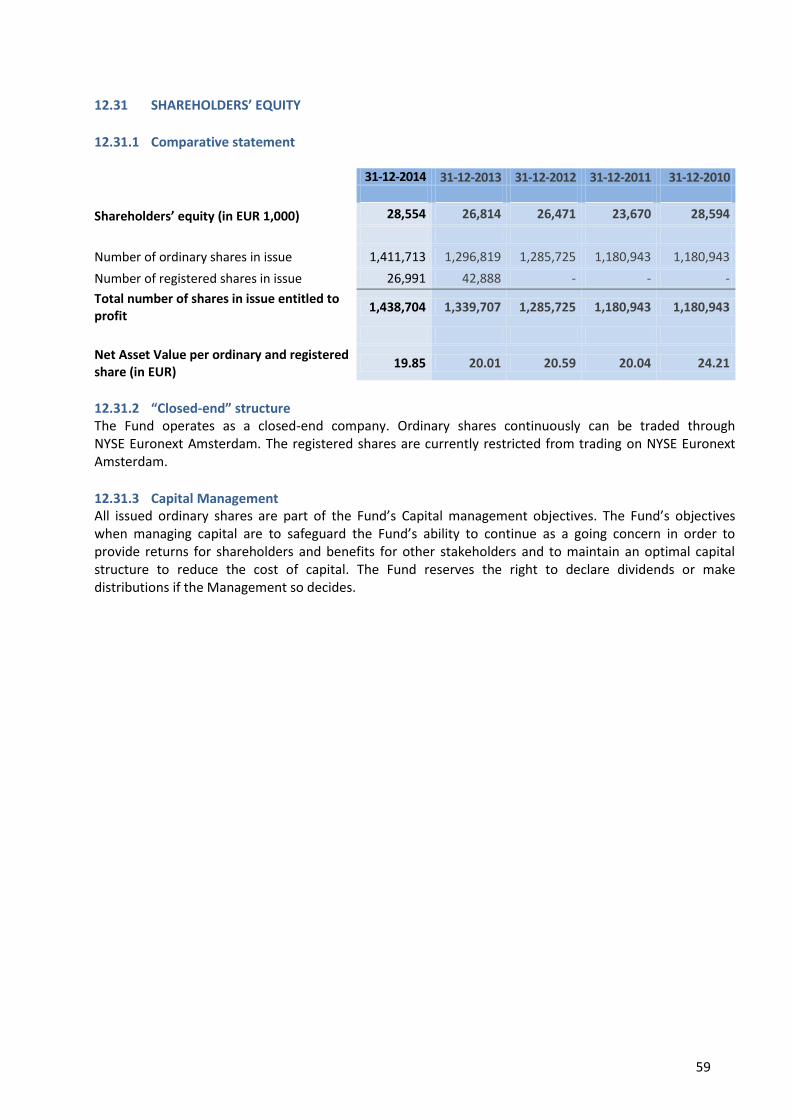
59
12.31 SHAREHOLDERS’ EQUITY
12.31.1 Comparative statement 31-12-2014 31-12-2013 31-12-2012 31-12-2011 31-12-2010
Shareholders’ equity (in EUR 1,000) 28,554 26,814 26,471 23,670 28,594
Number of ordinary shares in issue 1,411,713 1,296,819 1,285,725 1,180,943 1,180,943
Number of registered shares in issue 26,991 42,888 - - -
Total number of shares in issue entitled to profit
1,438,704 1,339,707 1,285,725 1,180,943 1,180,943
Net Asset Value per ordinary and registered share (in EUR)
19.85 20.01 20.59 20.04 24.21
12.31.2 “Closed-end” structure The Fund operates as a closed-end company. Ordinary shares continuously can be traded through NYSE Euronext Amsterdam. The registered shares are currently restricted from trading on NYSE Euronext Amsterdam.
12.31.3 Capital Management All issued ordinary shares are part of the Fund’s Capital management objectives. The Fund’s objectives when managing capital are to safeguard the Fund’s ability to continue as a going concern in order to provide returns for shareholders and benefits for other stakeholders and to maintain an optimal capital structure to reduce the cost of capital. The Fund reserves the right to declare dividends or make distributions if the Management so decides.
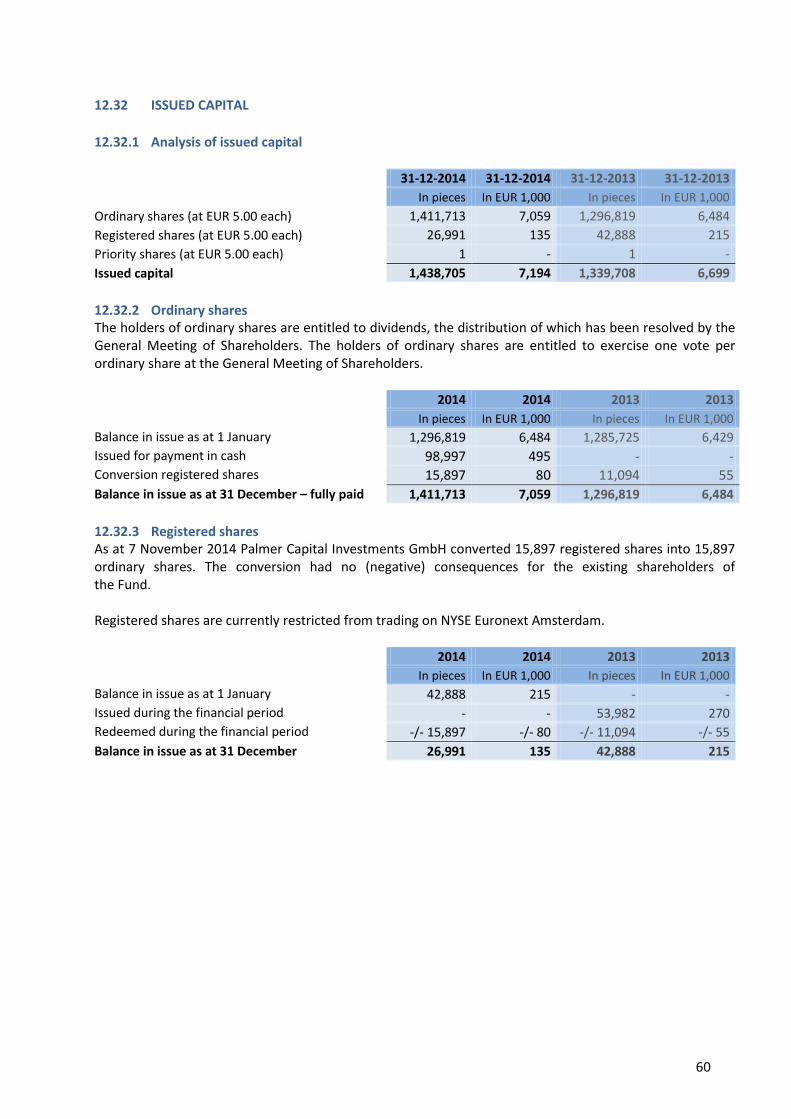
60
12.32 ISSUED CAPITAL
12.32.1 Analysis of issued capital
31-12-2014 31-12-2014 31-12-2013 31-12-2013
In pieces In EUR 1,000 In pieces In EUR 1,000
Ordinary shares (at EUR 5.00 each) 1,411,713 7,059 1,296,819 6,484
Registered shares (at EUR 5.00 each) 26,991 135 42,888 215
Priority shares (at EUR 5.00 each) 1 - 1 -
Issued capital 1,438,705 7,194 1,339,708 6,699
12.32.2 Ordinary shares The holders of ordinary shares are entitled to dividends, the distribution of which has been resolved by the General Meeting of Shareholders. The holders of ordinary shares are entitled to exercise one vote per ordinary share at the General Meeting of Shareholders. 2014 2014 2013 2013
In pieces In EUR 1,000 In pieces In EUR 1,000
Balance in issue as at 1 January 1,296,819 6,484 1,285,725 6,429
Issued for payment in cash 98,997 495 - - Conversion registered shares 15,897 80 11,094 55
Balance in issue as at 31 December – fully paid 1,411,713 7,059 1,296,819 6,484
12.32.3 Registered shares As at 7 November 2014 Palmer Capital Investments GmbH converted 15,897 registered shares into 15,897 ordinary shares. The conversion had no (negative) consequences for the existing shareholders of the Fund. Registered shares are currently restricted from trading on NYSE Euronext Amsterdam. 2014 2014 2013 2013
In pieces In EUR 1,000 In pieces In EUR 1,000
Balance in issue as at 1 January 42,888 215 - -
Issued during the financial period - - 53,982 270
Redeemed during the financial period -/- 15,897 -/- 80 -/- 11,094 -/- 55
Balance in issue as at 31 December 26,991 135 42,888 215

61
12.32.4 Priority shares From the profit earned in a financial period, primarily and as far as possible a dividend is distributed on the priority shares amounting to seven percent (7%) on an annual basis, calculated over the nominal value of the priority shares. No further distributions are made on the priority shares. 2014 2014 2013 2013 In pieces In EUR 1,000 In pieces In EUR 1,000
Balance in issue as at 1 January 1 - 1 - Issued during the financial period - - - - Redeemed during the financial period - - - -
Balance in issue as at 31 December 1 - 1 -
12.32.5 Analysis of authorized share capital 31-12-2014 31-12-2014 31-12-2013 31-12-2013
In pieces In EUR 1,000 In pieces In EUR 1,000
Ordinary shares (at EUR 5.00 each) 2,999,999 15,000 2,999,999 15,000
Priority shares (at EUR 5.00 each) 1 - 1 -
Authorized share capital 3,000,000 15,000 3,000,000 15,000
12.33 SHARE PREMIUM The share premium comprises the amount paid in by the shareholders on ordinary and registered shares of the Fund over and above the nominal value. The uplift received on issuance of own ordinary and preferred shares or the reduction applied on redemption of own ordinary and registered shares is recognized directly in the share premium reserve. The paid-up share premium for tax purposes as at 31 December 2014 was EUR 17,361,000 (31 December 2013: EUR 17,219,000). 2014 2013
In EUR 1,000 In EUR 1,000
Balance as at 1 January 17,219 16,338
Received on issued ordinary and registered shares 142 881
Balance as at 31 December 17,361 17,219

62
12.34 REVALUATION RESERVE The revaluation reserve comprises the cumulative unrealized positive net change in the fair value of the investment properties (including investment properties classified as “Assets held for sale”), less the related deferred tax liabilities. The deferred tax liabilities are deducted with due regard for the principles of valuation for deferred taxes (see section 12.21 “Income tax expense”). In case of sale of the investment property the cumulative unrealized positive net change in the fair value of the investment property sold, as well as the related deferred tax liabilities, are no longer stated in the revaluation reserve but recognized under retained earnings. 2014 2013
In EUR 1,000 In EUR 1,000
Balance as at 1 January 4,191 4,769
Addition to / reduction on (-/-) change in fair value during the financial period -/- 187 -/- 578
Balance as at 31 December 4,004 4,191
12.35 RESERVE FOR CURRENCY TRANSLATION DIFFERENCES The reserve for currency translation differences comprises the exchange rate differences that arise from the foreign currency translation of net investments in subsidiaries outside the euro-zone into PCEEPF’s reporting currency. 2014 2013
In EUR 1,000 In EUR 1,000
Balance as at 1 January 2,205 2,880
Addition / reduction (-/-) in connection with translation net investments -/- 88 -/- 675
Change in connection with decrease of net investments 18 -
Balance as at 31 December 2,135 2,205
12.36 EQUITY COMPONENT CONVERTIBLE BONDS The reserve for convertible bonds comprises the amount allocated to the equity component for the convertible bonds as issued by the Fund (see section 12.39.3 “Analysis of convertible bonds”), less the deferred tax liabilities. 2014 2013
In EUR 1,000 In EUR 1,000
Balance as at 1 January - -
Addition in connection with issued convertible bonds 49 -
Balance as at 31 December 49 -
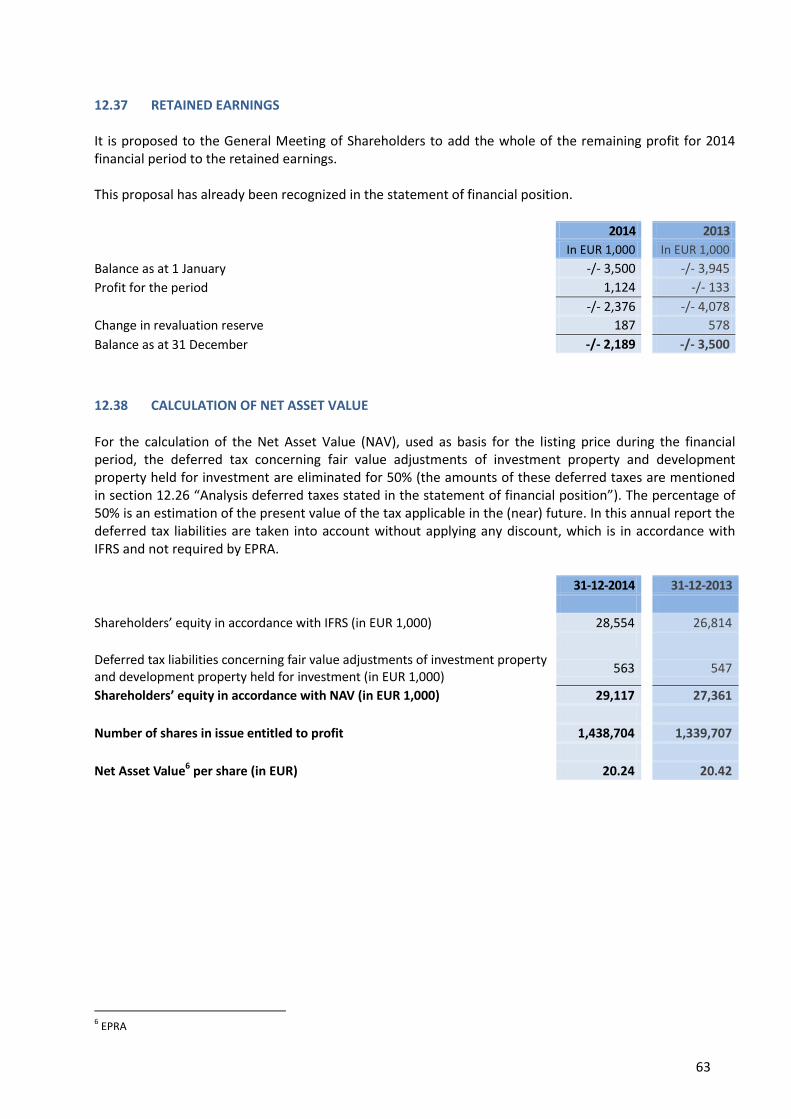
63
12.37 RETAINED EARNINGS It is proposed to the General Meeting of Shareholders to add the whole of the remaining profit for 2014 financial period to the retained earnings. This proposal has already been recognized in the statement of financial position. 2014 2013
In EUR 1,000 In EUR 1,000
Balance as at 1 January -/- 3,500 -/- 3,945
Profit for the period 1,124 -/- 133
-/- 2,376 -/- 4,078
Change in revaluation reserve 187 578
Balance as at 31 December -/- 2,189 -/- 3,500
12.38 CALCULATION OF NET ASSET VALUE
For the calculation of the Net Asset Value (NAV), used as basis for the listing price during the financial period, the deferred tax concerning fair value adjustments of investment property and development property held for investment are eliminated for 50% (the amounts of these deferred taxes are mentioned in section 12.26 “Analysis deferred taxes stated in the statement of financial position”). The percentage of 50% is an estimation of the present value of the tax applicable in the (near) future. In this annual report the deferred tax liabilities are taken into account without applying any discount, which is in accordance with IFRS and not required by EPRA. 31-12-2014 31-12-2013
Shareholders’ equity in accordance with IFRS (in EUR 1,000) 28,554 26,814
Deferred tax liabilities concerning fair value adjustments of investment property and development property held for investment (in EUR 1,000)
563 547
Shareholders’ equity in accordance with NAV (in EUR 1,000) 29,117 27,361
Number of shares in issue entitled to profit 1,438,704 1,339,707
Net Asset Value6 per share (in EUR) 20.24 20.42
6 EPRA

64
12.39 INTEREST-BEARING LOANS AND BORROWINGS
12.39.1 Analysis of interest-bearing loans and borrowings 31-12-2014 31-12-2013
In EUR 1,000 In EUR 1,000
Long-term liabilities
Secured bank loans 21,137 8,982
Convertible bonds 1,005 -
Other long-term liabilities 41 41
22,183 9,023
Current liabilities
Current portion of secured bank loans 1,165 16,514
Current portion of other long-term liabilities 1,334 1,562
2,499 18,076
Total interest-bearing loans and borrowings 24,682 27,099
During the financial period Palmer Capital RE Slovakia s.r.o. agreed with Tatra Banka, a.s. for extension of the secured bank loan (for the amount of EUR 12m as at 31 December 2014) until 30 November 2019.
12.39.2 Statement of changes of secured bank loans 2014 2013
In EUR 1,000 In EUR 1,000
Balance as at 1 January 25,496 28,441
Loans advanced 10,696 -
Redemptions -/- 13,771 -/- 2,024
Exchange rate differences -/- 119 -/- 921
Balance as at 31 December 22,302 25,496
In the “Redemptions” an amount of EUR 9,840,000 (CZK 269,701,000) is included related to the refinancing of a substantial part of the secured bank loans. During the financial period Palmer Capital RE Bohemia s.r.o. agreed with Sberbank for refinancing of the whole secured bank loan with Raiffeisen Bank a.s. The date of maturity of the new secured bank loan is 31 March 2019.
12.39.3 Analysis of convertible bonds No. Date
of issue Date of
maturity Nominal
interest rate Face value
Carrying amount
Face value Carrying amount
31-12-2014 31-12-2014 31-12-2013 31-12-2013 In % In EUR 1,000 In EUR 1,000 In EUR 1,000 In EUR 1,000
1 1-12-2014 1-12-2019 6.00 1,070 1,005 - -
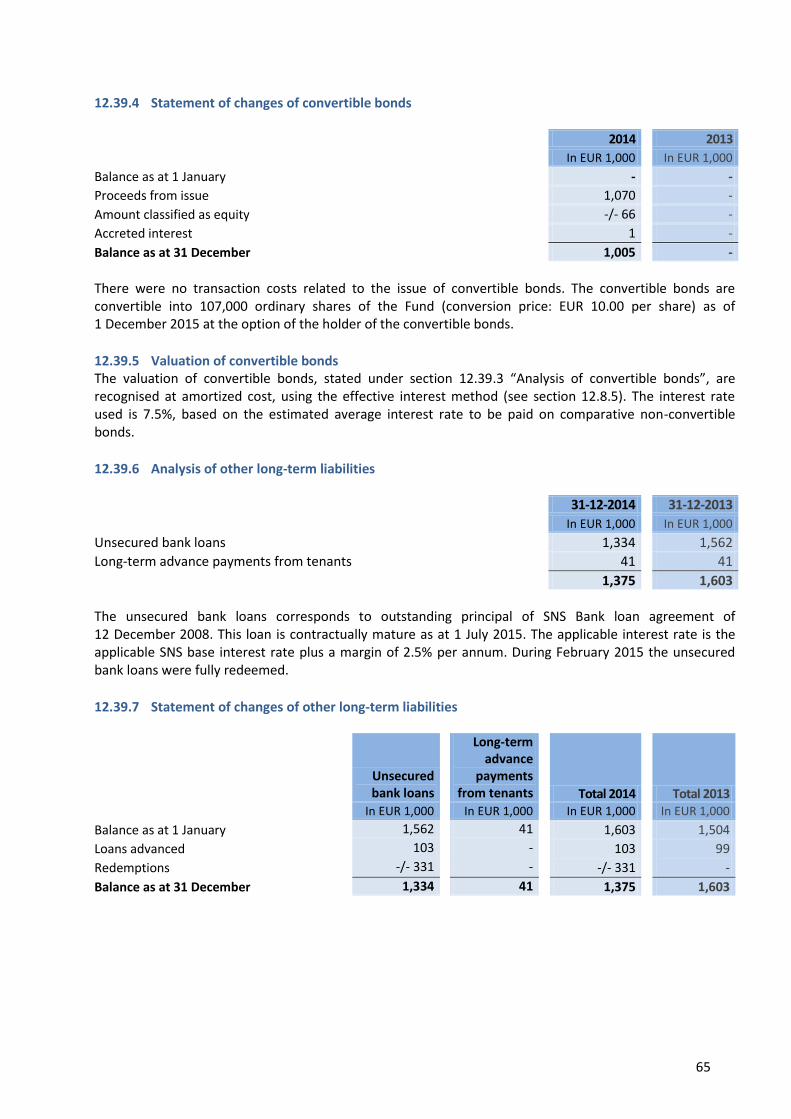
65
12.39.4 Statement of changes of convertible bonds 2014 2013
In EUR 1,000 In EUR 1,000
Balance as at 1 January - -
Proceeds from issue 1,070 -
Amount classified as equity -/- 66 -
Accreted interest 1 -
Balance as at 31 December 1,005 -
There were no transaction costs related to the issue of convertible bonds. The convertible bonds are convertible into 107,000 ordinary shares of the Fund (conversion price: EUR 10.00 per share) as of 1 December 2015 at the option of the holder of the convertible bonds.
12.39.5 Valuation of convertible bonds The valuation of convertible bonds, stated under section 12.39.3 “Analysis of convertible bonds”, are recognised at amortized cost, using the effective interest method (see section 12.8.5). The interest rate used is 7.5%, based on the estimated average interest rate to be paid on comparative non-convertible bonds.
12.39.6 Analysis of other long-term liabilities 31-12-2014 31-12-2013
In EUR 1,000 In EUR 1,000
Unsecured bank loans 1,334 1,562
Long-term advance payments from tenants 41 41
1,375 1,603 The unsecured bank loans corresponds to outstanding principal of SNS Bank loan agreement of 12 December 2008. This loan is contractually mature as at 1 July 2015. The applicable interest rate is the applicable SNS base interest rate plus a margin of 2.5% per annum. During February 2015 the unsecured bank loans were fully redeemed.
12.39.7 Statement of changes of other long-term liabilities
Unsecured bank loans
Long-term advance
payments from tenants Total 2014 Total 2013
In EUR 1,000 In EUR 1,000 In EUR 1,000 In EUR 1,000
Balance as at 1 January 1,562 41 1,603 1,504
Loans advanced 103 - 103 99
Redemptions -/- 331 - -/- 331 -
Balance as at 31 December 1,334 41 1,375 1,603

66
12.39.8 Pledges to banks and bank covenants As of 31 December 2014 the following securities were provided to and bank covenants agreed with the two banks to secure their bank loans. As at 31 December 2014 the Debt Service Coverage Ratio (DSCR) on the Sberbank loan is 1.13 (31 December 2013 Raiffeisen Bank loan: 1.25) and on the Tatra Banka loan is 1.65 (31 December 2013: 1.29).
Sberbank 31-12-2014
Tatra Banka 31-12-2014
Carrying amount secured bank loans (in EUR 1,000) 10,403 11,899
Securities:
Carrying amount investment property (in EUR 1,000)
Carrying amount trade and other receivables (in EUR 1,000)
Carrying amount cash and cash equivalents (in EUR 1,000)
18,403
43 839
36,850
214 559
Bank covenants:
Debt Service Coverage Ratio (DSCR) (minimum) 1.10 1.25
EBITDA / annual instalments of bank or other loans 110% n.a.
Minimum EBITDA as percentage of gross revenues n.a. 38%
Loan yield n.a. 13%
Moreover the shares of Palmer Capital RE Bohemia s.r.o. are secured to Sberbank.
12.40 DEFERRED TAX LIABILITIES
12.40.1 General The deferred tax liabilities relate to the differences between the carrying amount of the assets and the book value of the assets for tax purposes.
12.40.2 Analysis of deferred tax liabilities stated in the statement of financial position 31-12-2014 31-12-2013
In EUR 1,000 In EUR 1,000
Investment property 3,945 4,699
Interest-bearing loans and borrowings 47 7
Other investments 12 3
4,004 4,709
12.40.3 Statement of changes of deferred tax liabilities stated in the statement of financial position 2014 2013
In EUR 1,000 In EUR 1,000
Balance as at 1 January 4,709 4,956
Adjustments previous period -/- 179 -
Additions on account of temporary differences 437 422
Withdrawal on account of temporary differences -/- 959 -/- 416
Change in tax rate - -/- 174
Exchange rate differences -/- 4 -/- 79
Balance as at 31 December 4,004 4,709

67
12.41 TRADE AND OTHER PAYABLES
12.41.1 Analysis of trade and other payables 31-12-2014 31-12-2013
In EUR 1,000 In EUR 1,000
Non-current part of trade and other payables - -
Current part of trade and other payables 1,393 2,073
1,393 2,073
12.41.2 Specification of trade and other payables 31-12-2014 31-12-2013
In EUR 1,000 In EUR 1,000
Trade payables 771 838
Deposits received 392 424
Administrative expenses 71 644
Value Added Tax en other taxes 82 44
Interest payables 68 28
Other liabilities, accruals and deferred income 9 95
1,393 2,073
12.41.3 Specification of payable administrative expenses 31-12-2014 31-12-2013
In EUR 1,000 In EUR 1,000
Administrative expenses 334 793
Provisional waiver* -/- 263 -/- 149
71 644
* -/- EUR 149.000 (2013) is unconditional waiver
12.42 INCOME TAX PAYABLE
12.42.1 Analysis of income tax payable 31-12-2014 31-12-2013
In EUR 1,000 In EUR 1,000
Income tax current year 3 12

68
12.43 FINANCIAL INSTRUMENTS
12.43.1 General In the context of normal operations the Fund incurs credit, interest and currency risks. These risks are not hedged by the Fund. The net investment in foreign subsidiaries is also not hedged by the Fund. At the statement of financial position’s date there were no unsettled derivative financial instruments.
12.43.2 Fair value The book value of the Fund’s financial assets and financial liabilities is a reasonable approach for its fair value, as all financial assets, classified as “loans and receivables”, and all financial liabilities, classified as “financial liabilities measured at amortized cost” will be reprised within 3 months after statement of financial position’s date (see also section 12.60.4 “Interest rate risk”).
12.44 LEASE AGREEMENTS
12.44.1 Lease agreements in which the Fund is lessee The Fund has not entered as lessee into operating or finance lease agreements.
12.44.2 Lease agreements in which the Fund is lessor The Fund has not entered as lessor into operating or finance lease agreements other than the leases indicated in section 12.47.2 “Non-cancellable operating lease agreements”.
12.45 NON-CONTINGENT LIABILITIES As at 31 December 2014 the Fund was not subject to contractual obligation concerning investments, repairs, maintenance or other non-contingent liabilities that will be settled in the following financial period.
12.46 CONTINGENT LIABILITIES As at 31 December 2014 the Fund has the following contingent liabilities:
Palmer Capital RE Bohemia, s.r.o. has a potential liability under some circumstances (e.g. cancelled lease) for the amount of CZK 6,829,000 (EUR 246,000) to Kooperativa (the lessee of the parking places Štefánikova), which has paid the rent in advance for parking places for several years. Based on the negotiations during 2012 for the sale of the investment property Štefánikova, the new owner permits the lessee the usage of the parking places (free of payment) and the new owner will pay the tax with regard to the rent;
The Fund has a potential liability for the amount of EUR 114,000 to Palmer Capital Fondsenbeheer B.V. regarding to Management fee, as a result of a provisional waiver for the Management fee (2014) above EUR 800,000.
As at 31 December 2014 the Fund was not subject to any further contingent liabilities, among which included obligations that result from security transactions related to (exchange) rate risk in connection with investments.

69
12.47 GROSS RENTAL INCOME
12.47.1 General During the financial period, as well as during the previous financial period no contingent rental income was accounted for as income in the income statement. Leases for determined time are normally indexed yearly with annual inflation stated by respectively the Czech and Slovak central banks. New leases for determined time are normally signed for a term of five years. All these lease contracts include at least a three-month deposit. Weighted to the fair value, the weighted average percentage of the vacant space of the investment properties in the portfolio at the end of 2014 was 25.0% (2013: 25.8%).
12.47.2 Non-cancellable leases The gross rental income receivable on account of non-cancellable leases related to the investment properties as at 31 December of the relevant financial period is as follows. The future minimum gross rental income receivable in foreign currency has been translated at the exchange rate as at 31 December of the relevant financial period. 31-12-2014 31-12-2013
In EUR 1,000 In EUR 1,000
<1 year 4,200 4,750
1-5 years 2,656 3,540
>5 years 163 5,884
7,019 14,174
12.48 REBILLED AND NON-REBILLED SERVICE CHARGES AND PROPERTY OPERATING EXPENSES
12.48.1 General In connection with the fact that the Fund invoices the service charges independently (or as principal) to the lessees on the basis of the leases entered into, such reimbursed service charges are shown separately in the income statement. The work associated with the service charges is carried out either by the Fund, or by third parties on a contract basis. Contracts for the performance of service work are normally entered into for a maximum period of six months.
12.48.2 Analysis of property operating expenses 2014 2013
In EUR 1,000 In EUR 1,000
Property management 493 745
Asset management 448 246
Maintenance expenses in respect of investment properties 310 388
Taxes on investment properties 223 213
Commission fees 140 162
Insurance premiums 27 27
Other direct operating expenses 68 70
1,709 1,851

70
12.48.3 Allocation of service charges and property operating expenses The determination of costs connecting with not rented investment properties is based on investment properties that had an average vacancy of more than 10% during the financial period. The analysis of the service charges and direct operating expenses to the investment properties, whether or not rent-generating, is as follows: 2014 2013
In EUR 1,000 In EUR 1,000
For investment properties let 3,107 3,254
For investment properties not let 825 990
3,932 4,244
12.49 NET VALUATION GAINS ON INVESTMENT PROPERTY
12.49.1 General The analysis of value adjustments (gains and losses) during the financial period consists of realized as well as unrealized value adjustments. Value adjustments are presented as a gain (or loss) in case the total of unrealized and realized value adjustments for each investment property is positive (or negative).
12.49.2 Analysis of net valuation gains on investment property 2014 2013
In EUR 1,000 In EUR 1,000
Realized value adjustments -/- 2,042 -/- 63
Unrealized value adjustments 1,946 -/- 1,383
-/- 96 -/- 1,446
12.49.3 Specification of realized value adjustments The realized value adjustments are attributable as follows:
2014 2013
In EUR 1,000 In EUR 1,000
Račianska, Bratislava -/- 2,146 -
Šaca, Košice 216 -
Štefánikova 167, Žlin - -/- 63
Part of VUP, Brno -/- 112 -
-/- 2,042 -/- 63

71
The realized value adjustment consists of the total value adjustments of the sold property, calculated as the difference between selling price and its purchase price. Therefore the realized value adjustments include also the cumulative unrealized value adjustments booked in previous years. The specification is as follows: 2014 2013
In EUR 1,000 In EUR 1,000
Value adjustments booked in current year -/- 197 -
Value adjustments booked in previous years -/- 1,695 -
-/- 1,892 -
Consultancy fees and legal fees -/- 65 -
Costs of splitting VUP -/- 49 -
Transfer tax -/- 34 -/- 63
Other costs on sale of investment property -/- 2 -
-/- 150 -/- 63
-/- 2,042 -/- 63
12.50 PROFIT ON DISPOSAL OF INVESTMENTS IN GROUP COMPANIES Profit on disposal of investments in group companies comprises gains or losses resulting from the sale of investments in group companies sold during the financial period, i.e. the amount received above the book value of the group company at the selling date. The group companies are valued at selling date in accordance with the Fund’s own accounting policies. During the financial period the Fund sold no investments in group companies.
12.51 FINANCIAL INCOME 2014 2013
In EUR 1,000 In EUR 1,000
Interest income 60 75
Valuation gains on other investments 51 -
111 75
12.52 OTHER OPERATING INCOME 2014 2013
In EUR 1,000 In EUR 1,000
Provisions and fees related to leases 13 26
Penalty interest and fees 9 -
Other - 2
22 28
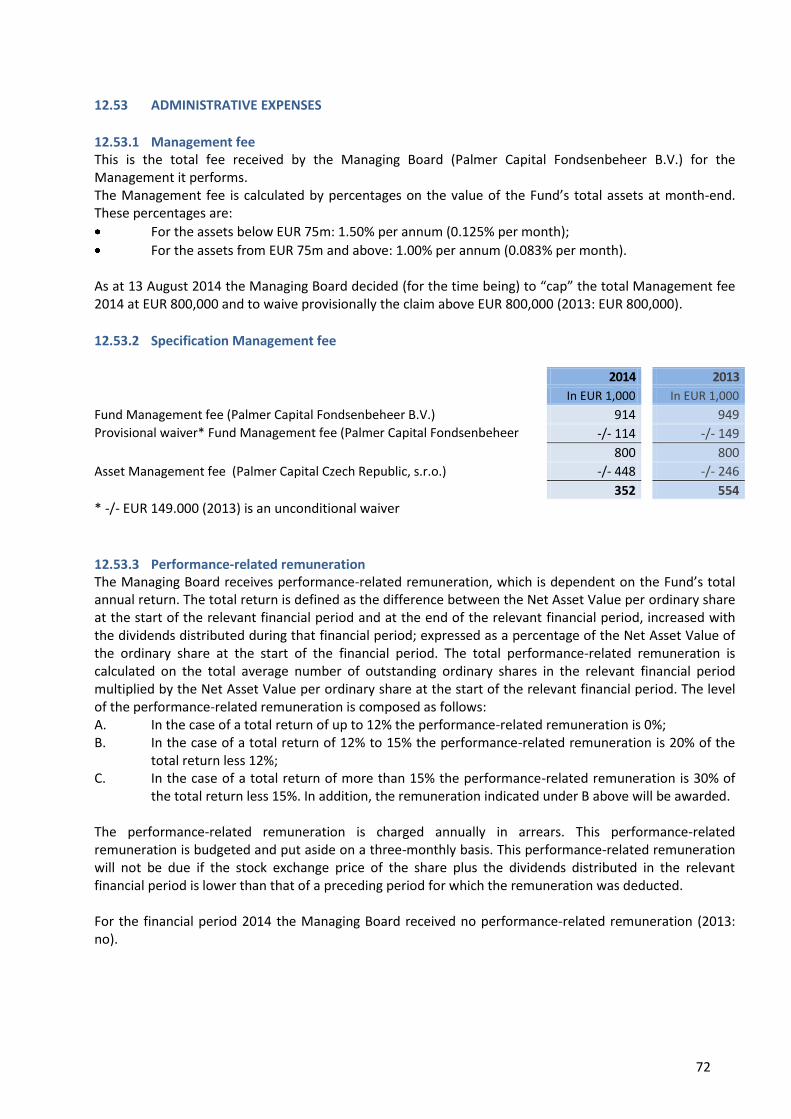
72
12.53 ADMINISTRATIVE EXPENSES
12.53.1 Management fee This is the total fee received by the Managing Board (Palmer Capital Fondsenbeheer B.V.) for the Management it performs. The Management fee is calculated by percentages on the value of the Fund’s total assets at month-end. These percentages are:
For the assets below EUR 75m: 1.50% per annum (0.125% per month);
For the assets from EUR 75m and above: 1.00% per annum (0.083% per month). As at 13 August 2014 the Managing Board decided (for the time being) to “cap” the total Management fee 2014 at EUR 800,000 and to waive provisionally the claim above EUR 800,000 (2013: EUR 800,000).
12.53.2 Specification Management fee
2014 2013
In EUR 1,000 In EUR 1,000
Fund Management fee (Palmer Capital Fondsenbeheer B.V.) 914 949
Provisional waiver* Fund Management fee (Palmer Capital Fondsenbeheer B.V.)
-/- 114 -/- 149
800 800
Asset Management fee (Palmer Capital Czech Republic, s.r.o.) -/- 448 -/- 246
352 554
* -/- EUR 149.000 (2013) is an unconditional waiver
12.53.3 Performance-related remuneration The Managing Board receives performance-related remuneration, which is dependent on the Fund’s total annual return. The total return is defined as the difference between the Net Asset Value per ordinary share at the start of the relevant financial period and at the end of the relevant financial period, increased with the dividends distributed during that financial period; expressed as a percentage of the Net Asset Value of the ordinary share at the start of the financial period. The total performance-related remuneration is calculated on the total average number of outstanding ordinary shares in the relevant financial period multiplied by the Net Asset Value per ordinary share at the start of the relevant financial period. The level of the performance-related remuneration is composed as follows: A. In the case of a total return of up to 12% the performance-related remuneration is 0%; B. In the case of a total return of 12% to 15% the performance-related remuneration is 20% of the
total return less 12%; C. In the case of a total return of more than 15% the performance-related remuneration is 30% of
the total return less 15%. In addition, the remuneration indicated under B above will be awarded. The performance-related remuneration is charged annually in arrears. This performance-related remuneration is budgeted and put aside on a three-monthly basis. This performance-related remuneration will not be due if the stock exchange price of the share plus the dividends distributed in the relevant financial period is lower than that of a preceding period for which the remuneration was deducted. For the financial period 2014 the Managing Board received no performance-related remuneration (2013: no).
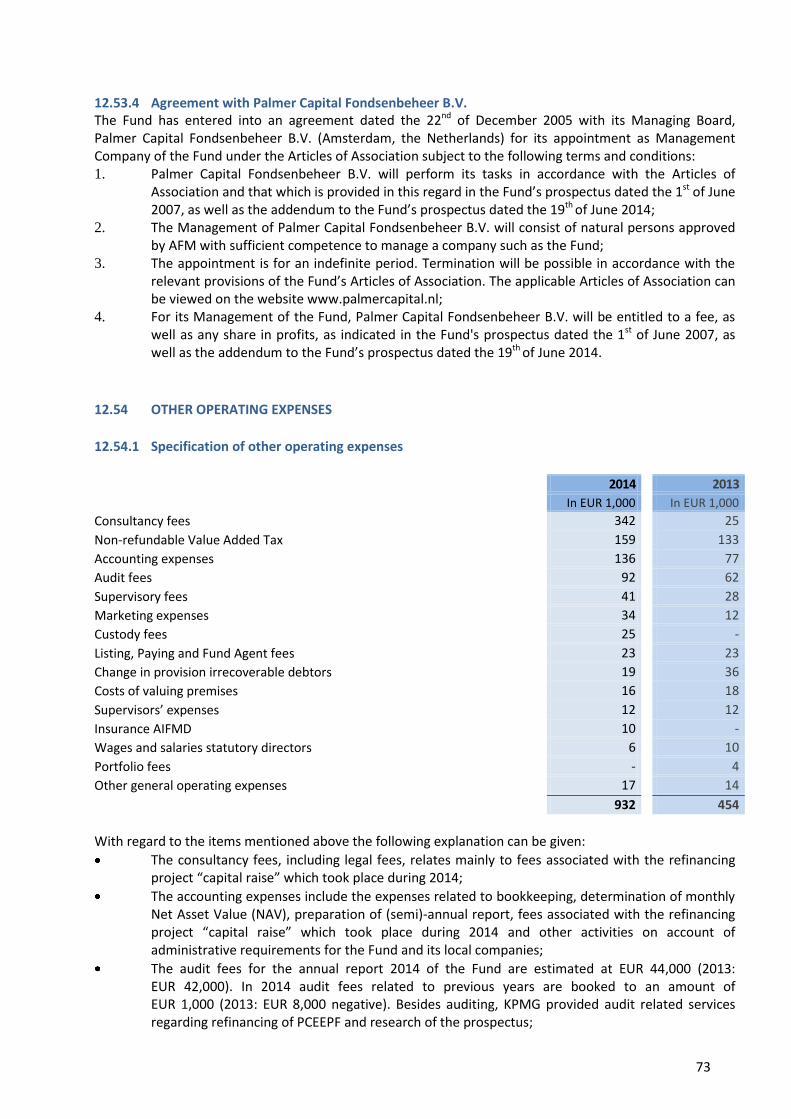
73
12.53.4 Agreement with Palmer Capital Fondsenbeheer B.V. The Fund has entered into an agreement dated the 22nd of December 2005 with its Managing Board, Palmer Capital Fondsenbeheer B.V. (Amsterdam, the Netherlands) for its appointment as Management Company of the Fund under the Articles of Association subject to the following terms and conditions: 1. Palmer Capital Fondsenbeheer B.V. will perform its tasks in accordance with the Articles of
Association and that which is provided in this regard in the Fund’s prospectus dated the 1st of June 2007, as well as the addendum to the Fund’s prospectus dated the 19th of June 2014;
2. The Management of Palmer Capital Fondsenbeheer B.V. will consist of natural persons approved by AFM with sufficient competence to manage a company such as the Fund;
3. The appointment is for an indefinite period. Termination will be possible in accordance with the relevant provisions of the Fund’s Articles of Association. The applicable Articles of Association can be viewed on the website www.palmercapital.nl;
4. For its Management of the Fund, Palmer Capital Fondsenbeheer B.V. will be entitled to a fee, as well as any share in profits, as indicated in the Fund's prospectus dated the 1st of June 2007, as well as the addendum to the Fund’s prospectus dated the 19th of June 2014.
12.54 OTHER OPERATING EXPENSES
12.54.1 Specification of other operating expenses
2014 2013
In EUR 1,000 In EUR 1,000
Consultancy fees 342 25
Non-refundable Value Added Tax 159 133
Accounting expenses 136 77
Audit fees 92 62
Supervisory fees 41 28
Marketing expenses 34 12
Custody fees 25 -
Listing, Paying and Fund Agent fees 23 23
Change in provision irrecoverable debtors 19 36
Costs of valuing premises 16 18
Supervisors’ expenses 12 12
Insurance AIFMD 10 -
Wages and salaries statutory directors 6 10
Portfolio fees - 4
Other general operating expenses 17 14
932 454
With regard to the items mentioned above the following explanation can be given:
The consultancy fees, including legal fees, relates mainly to fees associated with the refinancing project “capital raise” which took place during 2014;
The accounting expenses include the expenses related to bookkeeping, determination of monthly Net Asset Value (NAV), preparation of (semi)-annual report, fees associated with the refinancing project “capital raise” which took place during 2014 and other activities on account of administrative requirements for the Fund and its local companies;
The audit fees for the annual report 2014 of the Fund are estimated at EUR 44,000 (2013: EUR 42,000). In 2014 audit fees related to previous years are booked to an amount of EUR 1,000 (2013: EUR 8,000 negative). Besides auditing, KPMG provided audit related services regarding refinancing of PCEEPF and research of the prospectus;

74
The custody fees relates to the operational activities regarding AIFMD Depositary;
Other general expenses include, among others, costs of press releases, NYSE Euronext and bank costs;
The supervisory fees include supervisory board fees and costs related to the supervision of the Dutch Authority for the Financial Markets, (Stichting Autoriteit Financiële Markten, the AFM) and “De Nederlandsche Bank” (DNB).
12.54.2 Analysis of Supervisory Board fees 2014 2013 In EUR 1,000 In EUR 1,000
H.H. Kloos RBA (chairman since 19 June 2014) 7 - B. Vos M.Sc. 14 14 Prof. Dr. J.L. Bouma (chairman till 19 June 2014) 7 14
28 28 Prof. Dr. J.L. Bouma (previous years) 13 -
41 28
PCEEPF has provided no loans, advances or guarantees for the members of the Supervisory Board. The members of the Supervisory Board receive no options or remuneration in the form of PCEEPF’s shares.
12.54.3 Transaction costs In accordance with the EU-IFRS principles of valuation the Fund includes the transaction costs incurred on purchase of investments in the purchase price of the investment, and recognizes the transaction costs incurred on sale of investment property and other investments under realized changes in the value of investments. The analysis of identifiable and quantifiable transaction costs on purchase and sale of investments during the financial period is as follows:
2014 2013
In EUR 1,000 In EUR 1,000
Transaction costs on purchase of investments - -
Transaction costs on sale of investments -/- 67 -
-/- 67 -
12.54.4 Costs of lending financial instruments During the financial period no financial instruments were borrowed or lent by either the Fund or her associated parties (so-called securities lending). In this connection no expenses were therefore incurred or fees requested.
12.54.5 Remuneration for orders on behalf of the Fund The Managing Board, the Directors of the Managing Board, the Fund or the custodian of the Fund, parties affiliated with these parties, or third parties did not receive any remuneration, in any way, received nor promised for performing assignments for the Fund.
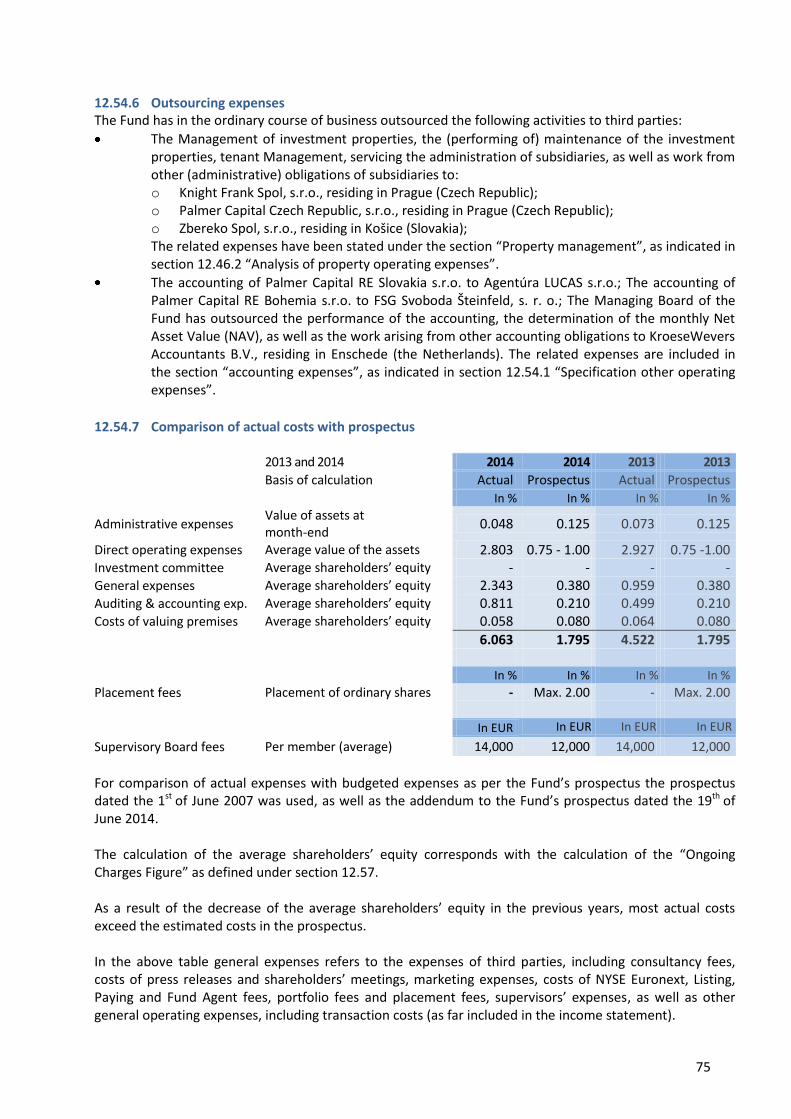
75
12.54.6 Outsourcing expenses The Fund has in the ordinary course of business outsourced the following activities to third parties:
The Management of investment properties, the (performing of) maintenance of the investment properties, tenant Management, servicing the administration of subsidiaries, as well as work from other (administrative) obligations of subsidiaries to: o Knight Frank Spol, s.r.o., residing in Prague (Czech Republic); o Palmer Capital Czech Republic, s.r.o., residing in Prague (Czech Republic); o Zbereko Spol, s.r.o., residing in Košice (Slovakia); The related expenses have been stated under the section “Property management”, as indicated in section 12.46.2 “Analysis of property operating expenses”.
The accounting of Palmer Capital RE Slovakia s.r.o. to Agentúra LUCAS s.r.o.; The accounting of Palmer Capital RE Bohemia s.r.o. to FSG Svoboda Šteinfeld, s. r. o.; The Managing Board of the Fund has outsourced the performance of the accounting, the determination of the monthly Net Asset Value (NAV), as well as the work arising from other accounting obligations to KroeseWevers Accountants B.V., residing in Enschede (the Netherlands). The related expenses are included in the section “accounting expenses”, as indicated in section 12.54.1 “Specification other operating expenses”.
12.54.7 Comparison of actual costs with prospectus 2013 and 2014 2014 2014 2013 2013
Basis of calculation Actual Prospectus Actual Prospectus
In % In % In % In %
Administrative expenses Value of assets at month-end
0.048 0.125 0.073 0.125
Direct operating expenses Average value of the assets 2.803 0.75 - 1.00 2.927 0.75 -1.00 Investment committee Average shareholders’ equity - - - - General expenses Average shareholders’ equity 2.343 0.380 0.959 0.380 Auditing & accounting exp. Average shareholders’ equity 0.811 0.210 0.499 0.210 Costs of valuing premises Average shareholders’ equity 0.058 0.080 0.064 0.080
6.063 1.795 4.522 1.795 In % In % In % In %
Placement fees Placement of ordinary shares - Max. 2.00 - Max. 2.00
In EUR In EUR In EUR In EUR
Supervisory Board fees Per member (average) 14,000 12,000 14,000 12,000
For comparison of actual expenses with budgeted expenses as per the Fund’s prospectus the prospectus dated the 1st of June 2007 was used, as well as the addendum to the Fund’s prospectus dated the 19th of June 2014. The calculation of the average shareholders’ equity corresponds with the calculation of the “Ongoing Charges Figure” as defined under section 12.57. As a result of the decrease of the average shareholders’ equity in the previous years, most actual costs exceed the estimated costs in the prospectus. In the above table general expenses refers to the expenses of third parties, including consultancy fees, costs of press releases and shareholders’ meetings, marketing expenses, costs of NYSE Euronext, Listing, Paying and Fund Agent fees, portfolio fees and placement fees, supervisors’ expenses, as well as other general operating expenses, including transaction costs (as far included in the income statement).
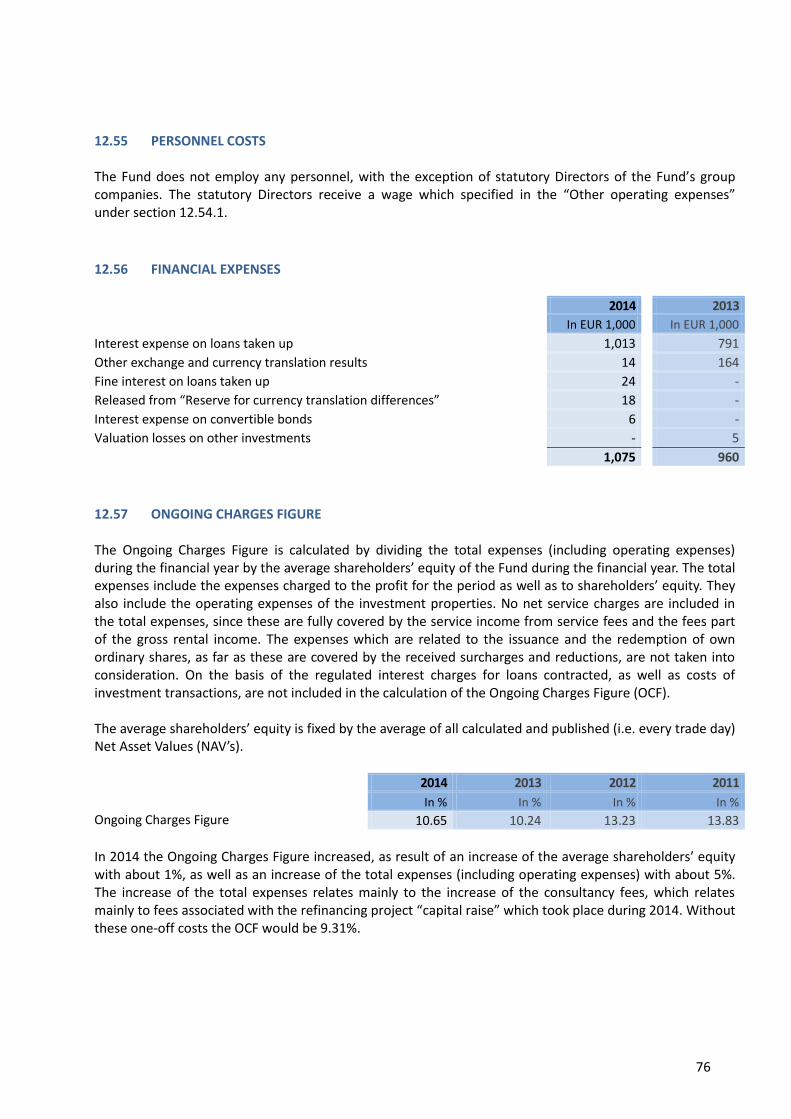
76
12.55 PERSONNEL COSTS The Fund does not employ any personnel, with the exception of statutory Directors of the Fund’s group companies. The statutory Directors receive a wage which specified in the “Other operating expenses” under section 12.54.1.
12.56 FINANCIAL EXPENSES
2014 2013
In EUR 1,000 In EUR 1,000
Interest expense on loans taken up 1,013 791
Other exchange and currency translation results 14 164
Fine interest on loans taken up 24 -
Released from “Reserve for currency translation differences” 18 -
Interest expense on convertible bonds 6 -
Valuation losses on other investments - 5
1,075 960
12.57 ONGOING CHARGES FIGURE The Ongoing Charges Figure is calculated by dividing the total expenses (including operating expenses) during the financial year by the average shareholders’ equity of the Fund during the financial year. The total expenses include the expenses charged to the profit for the period as well as to shareholders’ equity. They also include the operating expenses of the investment properties. No net service charges are included in the total expenses, since these are fully covered by the service income from service fees and the fees part of the gross rental income. The expenses which are related to the issuance and the redemption of own ordinary shares, as far as these are covered by the received surcharges and reductions, are not taken into consideration. On the basis of the regulated interest charges for loans contracted, as well as costs of investment transactions, are not included in the calculation of the Ongoing Charges Figure (OCF). The average shareholders’ equity is fixed by the average of all calculated and published (i.e. every trade day) Net Asset Values (NAV’s). 2014 2013 2012 2011
In % In % In % In %
Ongoing Charges Figure 10.65 10.24 13.23 13.83
In 2014 the Ongoing Charges Figure increased, as result of an increase of the average shareholders’ equity with about 1%, as well as an increase of the total expenses (including operating expenses) with about 5%. The increase of the total expenses relates mainly to the increase of the consultancy fees, which relates mainly to fees associated with the refinancing project “capital raise” which took place during 2014. Without these one-off costs the OCF would be 9.31%.

77
12.58 TAX ON PROFITS
12.58.1 Tax position The taxable profits of the Fund are subject to corporate income tax.
12.58.2 Tax on profits stated in the income statement 2014 2013
Tax due on profits In EUR 1,000 In EUR 1,000
Current year -/- 3 -/- 13
Adjustments in respect of previous years 12 58
9 45
Deferred tax on profits
Origination and reversal of temporary differences 233 -/- 211
Adjustments in respect of previous years 177 -/- 97
Change in tax rate - 126
410 -/- 182
Total tax on profits stated in the income statement 419 -/- 137
12.58.3 Reconciliation with the effective tax rate 2014 2014 2013 2013 In % In EUR 1,000 In % In EUR 1,000
Profit before tax 705 4
Tax using the company’s domestic tax rate 23.5 -/- 166 25.0 -/- 1 Effect of tax rates in foreign jurisdictions -/- 2.1 15 1,400.0 -/- 56 Change in tax rate 0.0 - -/- 3,150.0 126 Tax effect of: Non-deductible expenses 0.6 -/- 4 250.0 -/- 10 Tax exempt revenues -/- 21.1 149 0.0 - Current year losses for which no deferred tax asset is recognized
22.6 -/- 159 3,925.0 -/- 157
Recognition of tax effect in respect of previously unrecognized tax losses
-/- 63.7 449 0.0 -
Unused fiscal losses in respect of previous years for which deferred tax asset was recognized
7.6 -/- 54 0.0 -
Adjustments in respect of previous years -/- 26.8 189 975.0 -/- 39
-/- 59.4 419 3,425.0 -/- 137
12.58.4 Deferred tax recognized directly in shareholders’ equity 2014 2013
In EUR 1,000 In EUR 1,000
Related to currency translation differences - 95
Related to convertible bonds -/- 17 -
-/- 17 95

78
12.58.5 Applicable local tax rates 2015 2014 2013 2012 2011
In % In % In % In % In %
The Netherlands:
Up to EUR 200,000 20.0 20.0 20.0 20.0 20.0
As of EUR 200,000 25.0 25.0 25.0 25.0 25.0
Czech Republic 19.0 19.0 19.0 19.0 19.0
Slovakia 22.0 22.0 23.0 19.0 19.0
12.59 EARNINGS PER (ORDINARY AND REGISTERED) SHARE
12.59.1 Calculation of basic earnings per (ordinary and registered) share The basic earnings per (ordinary and registered) share are calculated by dividing the profit for the period attributable to shareholders of (ordinary and registered) shares by the weighted average number of outstanding (ordinary and registered) shares during the financial period.
12.59.2 Profit for the period attributable to shareholders of (ordinary and registered) shares (basic) 2014 2013
In EUR 1,000 In EUR 1,000
Profit for the financial period 1,124 -/- 133
12.59.3 Weighted average number of outstanding (ordinary and registered) shares (basic) 2014 2013
pieces pieces
Issued shares as at 1 January 1,339,707 1,285,725
Effect on issued shares during the financial period 30,224 17,663
Effect on redeemed shares during the financial period - -
1,369,931 1,303,388
12.59.4 Calculation of diluted earnings per (ordinary and registered) share The diluted earnings per (ordinary and registered) share is calculated by dividing the profit for the period attributable to shareholders of (ordinary and registered) shares by the weighted average number of (ordinary and registered) shares during the financial period including all outstanding convertible securities.
12.59.5 Profit for the period attributable to shareholders of (ordinary and registered) shares (diluted) 2014 2013
In EUR 1,000 In EUR 1,000
Profit for the financial period 1,124 -/- 133
Interest expense on convertible bonds (net of tax) 5 -
Deferred taxes convertible bonds - -
1,129 -/- 133

79
12.59.6 Weighted average number of outstanding (ordinary and registered) shares (diluted) 2014 2013
pieces pieces
Weighted average number of outstanding (ordinary and registered) shares during the period (basic)
1,369,931 1,303,388
Effect on conversion of convertible bonds 8,794 -
1,378,725 1,303,388

80
12.60 RISK MANAGEMENT
12.60.1 General According to its investment policy set out in the prospectus the Fund may hold investments in direct investment property in Middle Europe. The Fund’s investment portfolio currently consists primarily of property in the Czech Republic and Slovakia. These investment properties in principle are held for an indefinite period. The Fund’s investment activities result in exposure to various risks. The Managing Board of the Fund determines the tactical investment mix. The Managing Board monitors the deviation between the previously determined tactical investment mix and the actual investment mix regularly. The nature and scope of investment properties at the statement of financial position’s date and the risk policy with regard to the above-mentioned risks and other risks are discussed below.
12.60.2 Market risk Investment property values are affected by many factors, including the outlook for economic growth, inflation rate, and developments on the capital markets and the rental income at the time of sale of the investment property. The greater the fluctuation in the development of these factors, the greater the risk. The Fund cannot resist macro-economic factors that determine property value. However, through good investment property management the Fund will seek to maximise the attraction of the investment properties in its portfolio to prospective purchasers. The Fund invests in countries which have different legal systems to Western Europe. In some areas there is much less public information available than would be the case in Western Europe. Control of the market risk is determined largely by the Management’s investment policy, which is aimed at achieving investment results by purchasing investments that are assumed to have been undervalued and are expected to benefit from the further development of the Czech and Slovak economy. The market risk is managed on a day-to-day basis. See also the “Sensitivity analysis” of the investment properties (section 12.9.2).
12.60.3 Currency risk The currency risk can be defined as the risk that the fair value of investments, the fair value or future cash flows of a financial instrument will fluctuate because of changes in foreign exchange rates. The Fund may invest in properties in countries where the Euro (not yet) has been implemented. There is a currency risk that the exchange rate fluctuates. The Fund has the option to use financial instruments to hedge the currency risk. The Fund invests in some investment property in currencies other than the functional currency (the Euro) used in these financial statements. At present, the only currency involved is the Czech Koruna (CZK): Consequently the Fund is exposed to the risk that the exchange rate of the functional currency in relation to the foreign currency may develop in such a way that this has a negative impact on the value of the investment portfolio in Czech Koruna. Taking into account the high costs involved and Management’s expectation that the EUR/CZK exchange rate will continue to show relative stability over the long term, Management has opted not to hedge the currency risk by means of financial derivatives, such as forward contracts.

81
At the reporting date the Fund had the following exposure with regard to financial assets. The percentages are based on the carrying amount of financial assets.
31-12-2014 31-12-2013
In % In %
Czech Koruna (CZK) 44.0 76.0
Euro (EUR) 56.0 24.0
100.0 100.0
The following table sets out the Fund’s total exposure to currency risk and the net exposure to currencies of the monetary assets and liabilities. The amounts are based on the carrying amount of monetary assets and liabilities.
Monetary assets Monetary liabilities Net exposure
31-12-2014 31-12-2014 31-12-2014
In EUR 1,000 In EUR 1,000 In EUR 1,000
Czech Koruna (CZK) 1,056 10,537 -/- 9,481
Euro (EUR) 1,435 15,105 -/- 13,670
2,491 25,642 -/- 23,151
Monetary assets Monetary liabilities Net exposure
31-12-2013 31-12-2013 31-12-2013
In EUR 1,000 In EUR 1,000 In EUR 1,000
Czech Koruna (CZK) 1,881 10,126 -/- 8,245
Euro (EUR) 455 18,581 -/- 18,126
2,336 28,707 -/- 26,371
In case the euro had weakened by 5% in relation to all currencies, with all variables held constant, net assets attributable to holders of redeemable shares and the change in the net assets attributable to holders of redeemable shares per the income statement would have decreased by the amounts shown below:
31-12-2014 31-12-2013
In EUR 1,000 In EUR 1,000
Czech Koruna (CZK) 474 412 A 5% strengthening of the euro against the above currencies would have resulted in an equal but opposite effect on the above financial statement amounts to the amounts shown above, on the basis that all other variables remain constant.
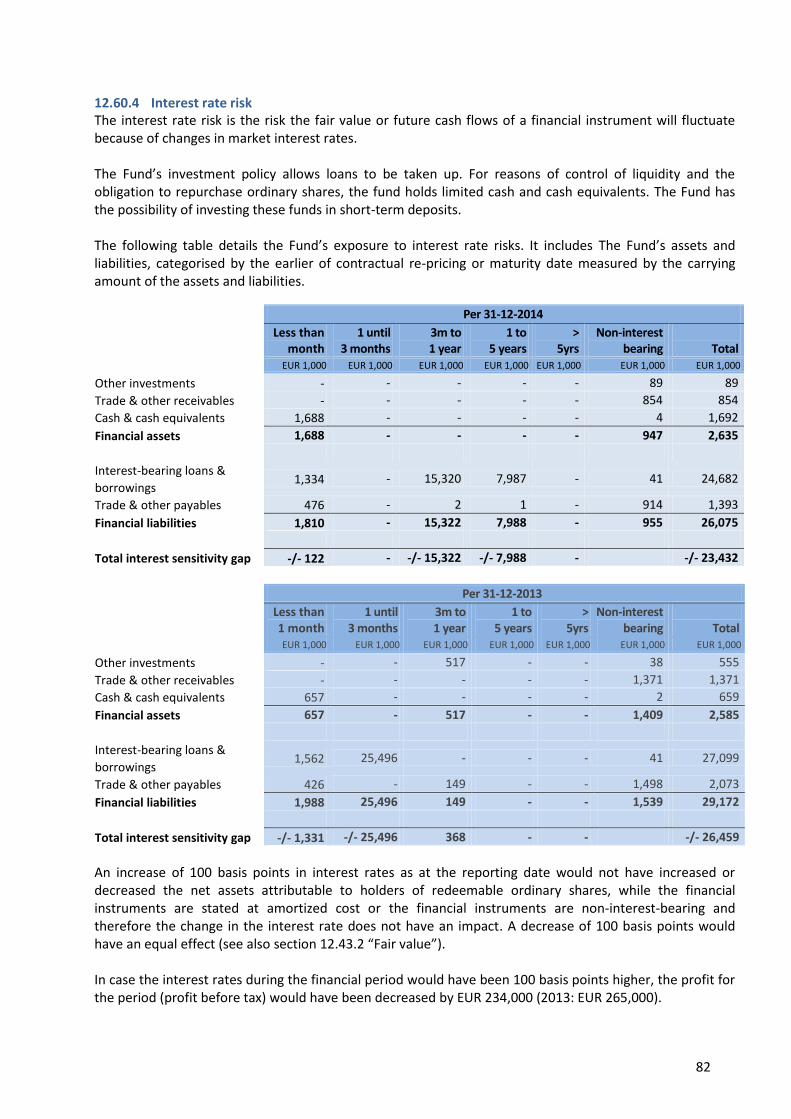
82
12.60.4 Interest rate risk The interest rate risk is the risk the fair value or future cash flows of a financial instrument will fluctuate because of changes in market interest rates. The Fund’s investment policy allows loans to be taken up. For reasons of control of liquidity and the obligation to repurchase ordinary shares, the fund holds limited cash and cash equivalents. The Fund has the possibility of investing these funds in short-term deposits. The following table details the Fund’s exposure to interest rate risks. It includes The Fund’s assets and liabilities, categorised by the earlier of contractual re-pricing or maturity date measured by the carrying amount of the assets and liabilities. Per 31-12-2014
Less than
month 1 until
3 months 3m to 1 year
1 to 5 years
> 5yrs
Non-interest bearing
Total
EUR 1,000 EUR 1,000 EUR 1,000 EUR 1,000 EUR 1,000 EUR 1,000 EUR 1,000
Other investments - - - - - 89 89
Trade & other receivables - - - - - 854 854
Cash & cash equivalents 1,688 - - - - 4 1,692
Financial assets 1,688 - - - - 947 2,635
Interest-bearing loans &
borrowings 1,334 - 15,320 7,987 - 41 24,682
Trade & other payables 476 - 2 1 - 914 1,393
Financial liabilities 1,810 - 15,322 7,988 - 955 26,075
Total interest sensitivity gap -/- 122 - -/- 15,322 -/- 7,988 - -/- 23,432
Per 31-12-2013
Less than 1 month
1 until 3 months
3m to 1 year
1 to 5 years
> 5yrs
Non-interest bearing
Total
EUR 1,000 EUR 1,000 EUR 1,000 EUR 1,000 EUR 1,000 EUR 1,000 EUR 1,000
Other investments - - 517 - - 38 555
Trade & other receivables - - - - - 1,371 1,371
Cash & cash equivalents 657 - - - - 2 659
Financial assets 657 - 517 - - 1,409 2,585
Interest-bearing loans &
borrowings 1,562 25,496 - - - 41 27,099
Trade & other payables 426 - 149 - - 1,498 2,073
Financial liabilities 1,988 25,496 149 - - 1,539 29,172
Total interest sensitivity gap -/- 1,331 -/- 25,496 368 - - -/- 26,459
An increase of 100 basis points in interest rates as at the reporting date would not have increased or decreased the net assets attributable to holders of redeemable ordinary shares, while the financial instruments are stated at amortized cost or the financial instruments are non-interest-bearing and therefore the change in the interest rate does not have an impact. A decrease of 100 basis points would have an equal effect (see also section 12.43.2 “Fair value”). In case the interest rates during the financial period would have been 100 basis points higher, the profit for the period (profit before tax) would have been decreased by EUR 234,000 (2013: EUR 265,000).
83
The main part of the financial liabilities is the interest-bearing loans and borrowings. At the end of the reporting period the Fund paid the following weighted average interest:
31-12-2014 31-12-2013
In % In %
Weighted average interest rate of interest-bearing loans and borrowings 3.48 3.03
12.60.5 Price risk The price risk can be defined as the risk that the value of the investments will fluctuate as a result of changes in market prices (other than those arising from currency risk or interest rate risk), caused by factors specific to the individual investment or the issuing institution or factors applicable to the market as a whole. Rental risk includes the risk of loss of rental income due to vacancies, the let ability of space and movements in market rents. Property value risk includes the risk of loss of property value due to changing economic circumstances, economic decline and / or oversupply of comparable real estate property prices. Since the Fund’s investment properties are stated at fair value, with both realized and unrealized value adjustments being recognized directly in the income statement, a change in market conditions impacts directly on the Fund’s investment result. The price risk is managed by the Fund by constructing a portfolio such that optimum diversification across sectors and markets is achieved. For the sensitivity analysis of the investment property, see section 12.9.2 “Sensitivity analysis”.
12.60.6 Concentration risk The concentration risk is the risk that can occur if the Fund has a large concentration of investments in certain regions or types of investment properties or if the Fund depends on a limited number of large tenants. To reduce this risk, investments are spread across different types of investment properties in several regions in Central Europe and the portfolio has a large number of small and medium-sized tenants.
12.60.7 Risk associated with investing with borrowed money The risk associated with investing with borrowed money lies in the fact that shareholders might lose their investment because the lender has a priority call on the proceeds of realisation. The investments are indeed used as a security for the bank loans. However, this risk is limited to the equity within the borrower subsidiary as there is no cross collateralisation and no parent entity guarantee. If the “Loan to Value” (LTV) ratio is too high according to the covenants with the banks it is possible that the Fund will need to sell investment property to improve LTV.
12.60.8 Economic risk Economic risk is derived from direct financial factors (developments in interest rates and inflation) and market developments (changes in GDP growth and employment). The former tend to affect capital values, the latter occupancy rates and rental levels. Economic risk is managed by the Fund through focussing the Fund’s investments on flexible assets in economically stable regional centres, and managing these assets through local professional teams closely attuned to developments in local market conditions.
12.60.9 Counterpart risk (credit risk) The credit risk can be defined as the risk of a counterparty being unable to fulfil its obligation to the Fund associated with monetary assets. The Fund has a credit policy and the counterpart risk is monitored and controlled on a continuous basis. The risk is presumed to be low, given the short settlement period of most of such monetary assets.
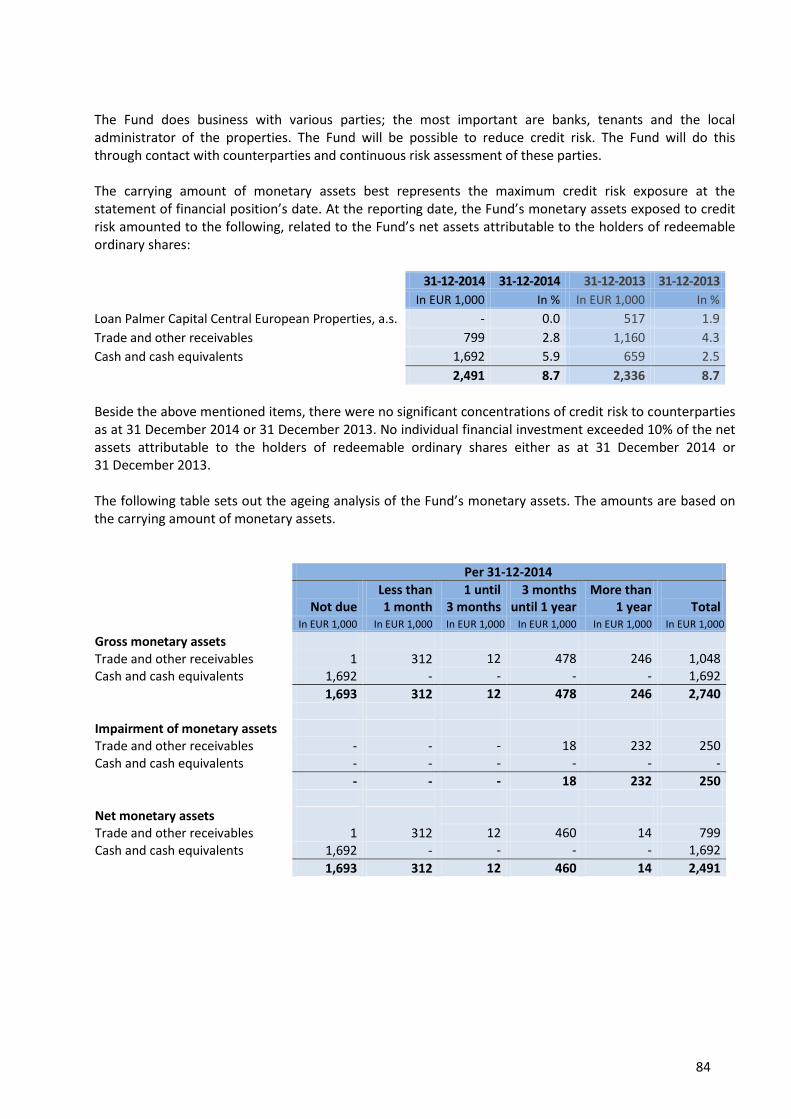
84
The Fund does business with various parties; the most important are banks, tenants and the local administrator of the properties. The Fund will be possible to reduce credit risk. The Fund will do this through contact with counterparties and continuous risk assessment of these parties. The carrying amount of monetary assets best represents the maximum credit risk exposure at the statement of financial position’s date. At the reporting date, the Fund’s monetary assets exposed to credit risk amounted to the following, related to the Fund’s net assets attributable to the holders of redeemable ordinary shares: 31-12-2014 31-12-2014 31-12-2013 31-12-2013
In EUR 1,000 In % In EUR 1,000 In %
Loan Palmer Capital Central European Properties, a.s. - 0.0 517 1.9
Trade and other receivables 799 2.8 1,160 4.3
Cash and cash equivalents 1,692 5.9 659 2.5
2,491 8.7 2,336 8.7
Beside the above mentioned items, there were no significant concentrations of credit risk to counterparties as at 31 December 2014 or 31 December 2013. No individual financial investment exceeded 10% of the net assets attributable to the holders of redeemable ordinary shares either as at 31 December 2014 or 31 December 2013. The following table sets out the ageing analysis of the Fund’s monetary assets. The amounts are based on the carrying amount of monetary assets. Per 31-12-2014
Not due Less than 1 month
1 until 3 months
3 months until 1 year
More than 1 year
Total
In EUR 1,000 In EUR 1,000 In EUR 1,000 In EUR 1,000 In EUR 1,000 In EUR 1,000
Gross monetary assets
Trade and other receivables 1 312 12 478 246 1,048 Cash and cash equivalents 1,692 - - - - 1,692
1,693 312 12 478 246 2,740 Impairment of monetary assets Trade and other receivables - - - 18 232 250 Cash and cash equivalents - - - - - -
- - - 18 232 250
Net monetary assets Trade and other receivables 1 312 12 460 14 799
Cash and cash equivalents 1,692 - - - - 1,692
1,693 312 12 460 14 2,491

85
Per 31-12-2013
Not due Less than 1 month
1 until 3 months
3 months until 1 year
More than 1 year
Total
In EUR 1,000 In EUR 1,000 In EUR 1,000 In EUR 1,000 In EUR 1,000 In EUR 1,000
Gross monetary assets
Other investments - - - - 517 517
Trade and other receivables 35 287 88 104 829 1,343
Cash and cash equivalents 659 - - - - 659
694 287 88 104 1,346 2,519
Impairment of monetary assets
Other investments - - - - - -
Trade and other receivables - - - 6 177 183
Cash and cash equivalents - - - - - -
- - - 6 177 183
Net monetary assets
Other investments - - - - 517 517
Trade and other receivables 35 287 88 98 652 1,160
Cash and cash equivalents 659 - - - - 659
694 287 88 98 1,169 2,336
The following table sets out the pledges of the Fund’s financial assets. Per 31-12-2014
Guarantee deposits
from tenants Other pledge Total
In EUR 1,000 In EUR 1,000 In EUR 1,000
Other investments - - -
Trade and other receivables 214 - 214
Cash and cash equivalents - - -
Financial assets 214 - 214
Per 31-12-2013
Guarantee deposits
from tenants
Other pledge
Total In EUR 1,000 In EUR 1,000 In EUR 1,000
Other investments - - -
Trade and other receivables 69 - 69
Cash and cash equivalents - - -
Financial assets 69 - 69
12.60.10 Rent risk Rent levels may be subject to downward pressure in periods of economic weakness. In the market, vacancy rates can increase and rents will drop. This can also occur at other points of the economic cycle when new development creates supply that temporarily exceeds demand. Rental risk can be best mitigated by professional, active local asset management with the ability to deploy cash resources to modernise assets and fund tenant incentives. It is also mitigated by ensuring diversification in lease contract expiry dates, to avoid a number of contracts expiring contemporaneously into a weak market.
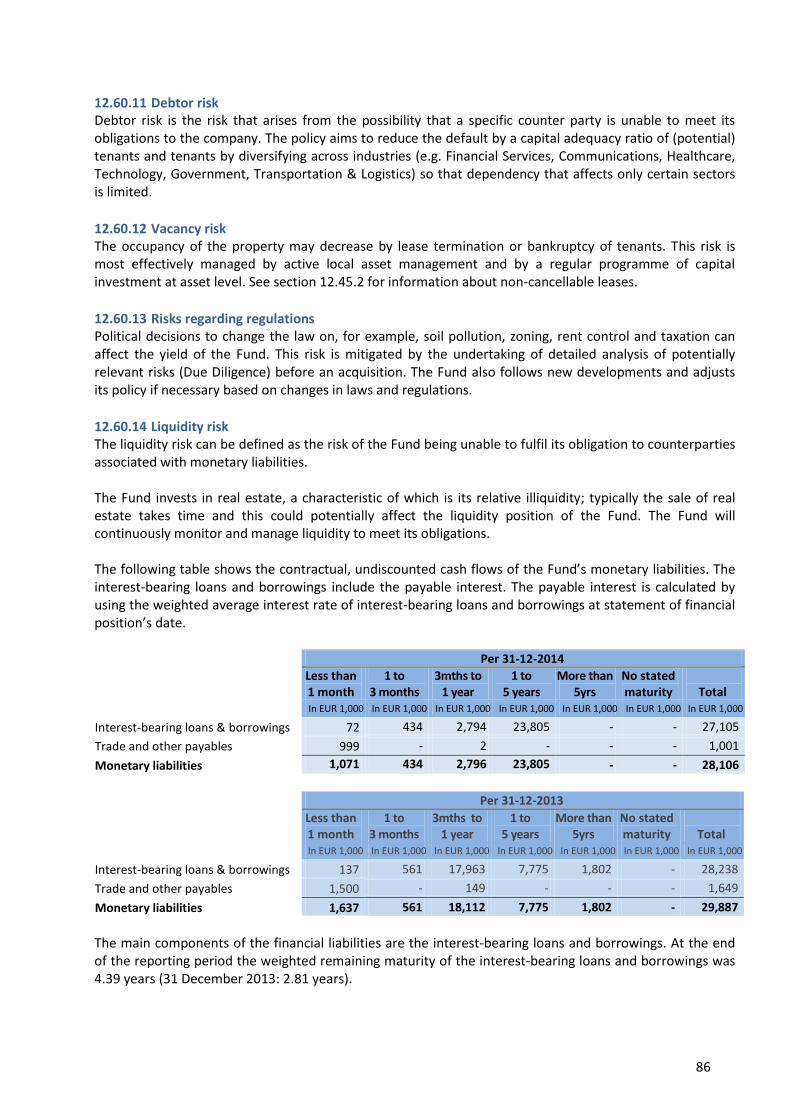
86
12.60.11 Debtor risk Debtor risk is the risk that arises from the possibility that a specific counter party is unable to meet its obligations to the company. The policy aims to reduce the default by a capital adequacy ratio of (potential) tenants and tenants by diversifying across industries (e.g. Financial Services, Communications, Healthcare, Technology, Government, Transportation & Logistics) so that dependency that affects only certain sectors is limited.
12.60.12 Vacancy risk The occupancy of the property may decrease by lease termination or bankruptcy of tenants. This risk is most effectively managed by active local asset management and by a regular programme of capital investment at asset level. See section 12.45.2 for information about non-cancellable leases.
12.60.13 Risks regarding regulations Political decisions to change the law on, for example, soil pollution, zoning, rent control and taxation can affect the yield of the Fund. This risk is mitigated by the undertaking of detailed analysis of potentially relevant risks (Due Diligence) before an acquisition. The Fund also follows new developments and adjusts its policy if necessary based on changes in laws and regulations.
12.60.14 Liquidity risk The liquidity risk can be defined as the risk of the Fund being unable to fulfil its obligation to counterparties associated with monetary liabilities. The Fund invests in real estate, a characteristic of which is its relative illiquidity; typically the sale of real estate takes time and this could potentially affect the liquidity position of the Fund. The Fund will continuously monitor and manage liquidity to meet its obligations. The following table shows the contractual, undiscounted cash flows of the Fund’s monetary liabilities. The interest-bearing loans and borrowings include the payable interest. The payable interest is calculated by using the weighted average interest rate of interest-bearing loans and borrowings at statement of financial position’s date.
Per 31-12-2014
Less than 1 month
1 to 3 months
3mths to 1 year
1 to 5 years
More than 5yrs
No stated maturity
Total
In EUR 1,000 In EUR 1,000 In EUR 1,000 In EUR 1,000 In EUR 1,000 In EUR 1,000 In EUR 1,000
Interest-bearing loans & borrowings 72 434 2,794 23,805 - - 27,105
Trade and other payables 999 - 2 - - - 1,001
Monetary liabilities 1,071 434 2,796 23,805 - - 28,106
Per 31-12-2013
Less than 1 month
1 to 3 months
3mths to 1 year
1 to 5 years
More than 5yrs
No stated maturity
Total
In EUR 1,000 In EUR 1,000 In EUR 1,000 In EUR 1,000 In EUR 1,000 In EUR 1,000 In EUR 1,000
Interest-bearing loans & borrowings 137 561 17,963 7,775 1,802 - 28,238
Trade and other payables 1,500 - 149 - - - 1,649
Monetary liabilities 1,637 561 18,112 7,775 1,802 - 29,887
The main components of the financial liabilities are the interest-bearing loans and borrowings. At the end of the reporting period the weighted remaining maturity of the interest-bearing loans and borrowings was 4.39 years (31 December 2013: 2.81 years).
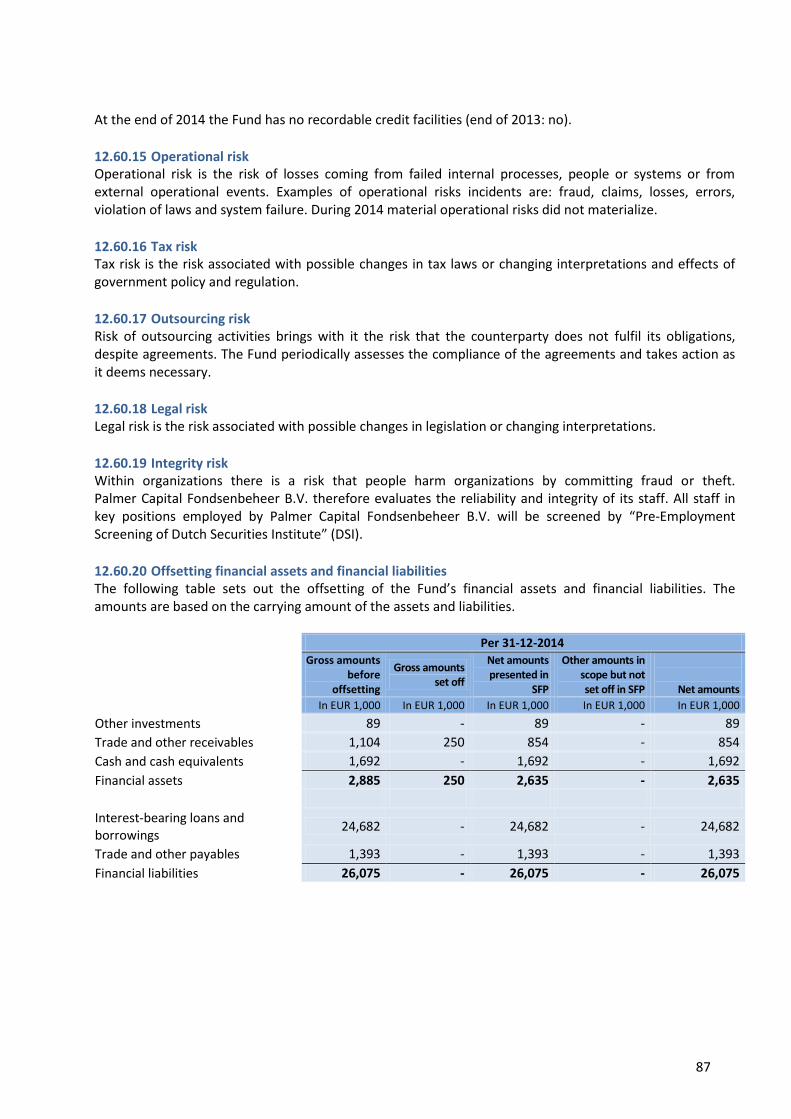
87
At the end of 2014 the Fund has no recordable credit facilities (end of 2013: no).
12.60.15 Operational risk Operational risk is the risk of losses coming from failed internal processes, people or systems or from external operational events. Examples of operational risks incidents are: fraud, claims, losses, errors, violation of laws and system failure. During 2014 material operational risks did not materialize.
12.60.16 Tax risk Tax risk is the risk associated with possible changes in tax laws or changing interpretations and effects of government policy and regulation.
12.60.17 Outsourcing risk Risk of outsourcing activities brings with it the risk that the counterparty does not fulfil its obligations, despite agreements. The Fund periodically assesses the compliance of the agreements and takes action as it deems necessary.
12.60.18 Legal risk Legal risk is the risk associated with possible changes in legislation or changing interpretations.
12.60.19 Integrity risk Within organizations there is a risk that people harm organizations by committing fraud or theft. Palmer Capital Fondsenbeheer B.V. therefore evaluates the reliability and integrity of its staff. All staff in key positions employed by Palmer Capital Fondsenbeheer B.V. will be screened by “Pre-Employment Screening of Dutch Securities Institute” (DSI).
12.60.20 Offsetting financial assets and financial liabilities The following table sets out the offsetting of the Fund’s financial assets and financial liabilities. The amounts are based on the carrying amount of the assets and liabilities. Per 31-12-2014
Gross amounts before
offsetting
Gross amounts set off
Net amounts presented in
SFP
Other amounts in scope but not set off in SFP
Net amounts
In EUR 1,000 In EUR 1,000 In EUR 1,000 In EUR 1,000 In EUR 1,000
Other investments 89 - 89 - 89
Trade and other receivables 1,104 250 854 - 854
Cash and cash equivalents 1,692 - 1,692 - 1,692
Financial assets 2,885 250 2,635 - 2,635
Interest-bearing loans and borrowings
24,682 - 24,682 - 24,682
Trade and other payables 1,393 - 1,393 - 1,393
Financial liabilities 26,075 - 26,075 - 26,075
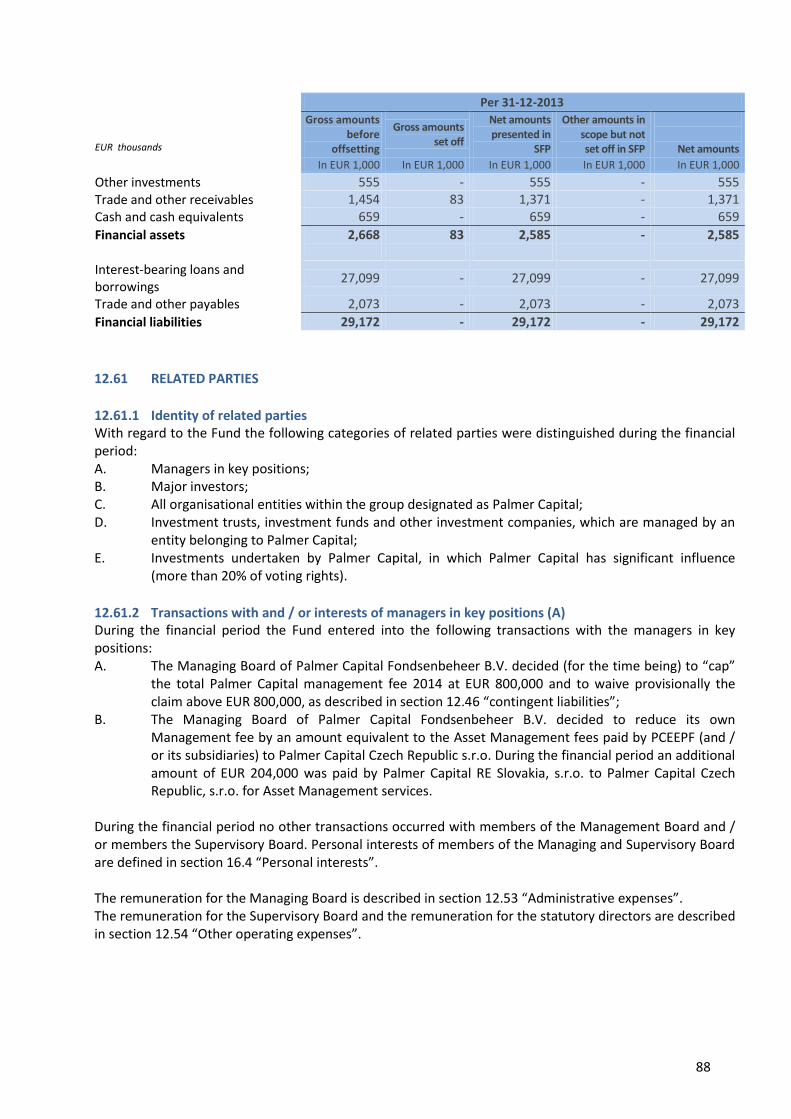
88
Per 31-12-2013
EUR thousands
Gross amounts before
offsetting
Gross amounts set off
Net amounts presented in
SFP
Other amounts in scope but not set off in SFP
Net amounts
In EUR 1,000 In EUR 1,000 In EUR 1,000 In EUR 1,000 In EUR 1,000
Other investments 555 - 555 - 555
Trade and other receivables 1,454 83 1,371 - 1,371
Cash and cash equivalents 659 - 659 - 659
Financial assets 2,668 83 2,585 - 2,585 Interest-bearing loans and borrowings
27,099 - 27,099 - 27,099
Trade and other payables 2,073 - 2,073 - 2,073
Financial liabilities 29,172 - 29,172 - 29,172
12.61 RELATED PARTIES
12.61.1 Identity of related parties With regard to the Fund the following categories of related parties were distinguished during the financial period: A. Managers in key positions; B. Major investors; C. All organisational entities within the group designated as Palmer Capital; D. Investment trusts, investment funds and other investment companies, which are managed by an
entity belonging to Palmer Capital; E. Investments undertaken by Palmer Capital, in which Palmer Capital has significant influence
(more than 20% of voting rights).
12.61.2 Transactions with and / or interests of managers in key positions (A) During the financial period the Fund entered into the following transactions with the managers in key positions: A. The Managing Board of Palmer Capital Fondsenbeheer B.V. decided (for the time being) to “cap”
the total Palmer Capital management fee 2014 at EUR 800,000 and to waive provisionally the claim above EUR 800,000, as described in section 12.46 “contingent liabilities”;
B. The Managing Board of Palmer Capital Fondsenbeheer B.V. decided to reduce its own Management fee by an amount equivalent to the Asset Management fees paid by PCEEPF (and / or its subsidiaries) to Palmer Capital Czech Republic s.r.o. During the financial period an additional amount of EUR 204,000 was paid by Palmer Capital RE Slovakia, s.r.o. to Palmer Capital Czech Republic, s.r.o. for Asset Management services.
During the financial period no other transactions occurred with members of the Management Board and / or members the Supervisory Board. Personal interests of members of the Managing and Supervisory Board are defined in section 16.4 “Personal interests”. The remuneration for the Managing Board is described in section 12.53 “Administrative expenses”. The remuneration for the Supervisory Board and the remuneration for the statutory directors are described in section 12.54 “Other operating expenses”.

89
12.61.3 Transactions with and /or interests of major investors (B) Pursuant to the decree on Dutch Act on Financial Supervision (Wet op het financieel toezicht, the “Wft”) the Fund reports one major investor, namely Stichting Prioriteit MERE (the “Foundation”), which holds all priority shares in the Fund’s capital. No transactions occurred between the Foundation and the Fund during the financial period.
12.61.4 Transactions with other related parties (C-D-E) During the financial period the Fund entered into or maintained the following transactions with the other related parties: A. Providing credit by the Fund to Palmer Capital Central European Properties, a.s. for the principal
amount of EUR 1.31m (2013: EUR 1.31m). For this credit provision an annual average interest payment of 12.0% (2013: 12.0%) was received. During the financial period the loan receivable and the receivable interest was received in full by the Fund.
B. Palmer Capital RE Bohemia, s.r.o. paid asset management fees to Palmer Capital Czech Republic, s.r.o. in the amount of EUR 80,000 (2013: EUR 84,000). The Managing Board of Palmer Capital Fondsenbeheer B.V. has decided to reduce its own management fee by the same amount;
C. Palmer Capital RE Slovakia, s.r.o. paid asset management fees to Palmer Capital Czech Republic s.r.o. in the amount of EUR 368,000 (2013: EUR 162,000). The Managing Board of Palmer Capital Fondsenbeheer B.V. has decided to reduce its own management fee by the same amount;
D. Palmer Capital RE Bohemia, s.r.o. paid fee for advisory services to Palmer Capital Czech Republic, s.r.o. for the amount of EUR 14,000 (2013: EUR 17,000);
E. Palmer Capital RE Slovakia, s.r.o. paid fee for advisory services to Palmer Capital Czech Republic, s.r.o. for the amount of EUR 32,000 (2013: EUR nil);
F. Palmer Capital related parties rented office space in the Fund owned properties: 268 m2 (2013: 259 m2);
G. The Fund paid wages and salaries for its statutory Directors in the amount of EUR 6,000 (2013: EUR 10,000);
H. Providing guarantee by Palmer Capital RE Bohemia, s.r.o., together with Middle Europe Opportunity Fund II N.V. (together the shareholders of Yellow Properties s.r.o.) in favour of Raiffeisen Bank a.s. for the amount of CZK 18,675,000 (2013: CZK 18,675,000). During the financial period Yellow Properties, s.r.o. has fully repaid the secured bank loan to Raiffeisen Bank, a.s. and therefore the guarantee has expired.
I. Palmer Capital Investments GmbH converted 15,897 registered shares of the Fund into 15,897 ordinary shares of the Fund as described in section 12.30.3 “Registered shares”.
12.61.5 Investments in other related parties (C-D-E) Investment trusts, investment funds and other investment companies, which are managed by an entity belonging to Palmer Capital, do hold investments in companies in which the Fund also holds investments.
Middle Europe Opportunity Fund II N.V. (MEOF II) (in)directly holds investments in companies in which the Fund also holds investments. The following table shows the percentages the Palmer Capital managed companies hold of the outstanding shares in the companies as at 31 December 2014: Company MEOF II The Fund Total
In % In % In %
Yellow Properties, s.r.o. 95.0 5.0 100.0
Yellow Properties, sro is a Czech limited company currently undertaking a property development in Prague 9 adjoining the Fund’s Drahobejlova asset. Practical completion of the development, which comprised 84 apartments and 4 retail units, took place in October 2014. 90% of the units have now been sold, the bank funding has been fully repaid and the Fund will receive a positive cash return on its investment during 2015.
90
12.61.6 Agreements with related parties The Fund has not entered into any agreements with parties affiliated with the Managing Board of the Fund, other than as described in section 12.53.4 “Agreement with Palmer Capital Fondsenbeheer B.V.”.
12.62 EVENTS AFTER STATEMENT OF FINANCIAL POSITION’S DATE As at 20 February 2015 the Fund placed the second tranche of the convertible bond launched in October 2014 for an amount of EUR 1.42m. This amount has been used for the full instalment of the unsecured bank loan from SNS. As at 27 February 2015 all debts to this credit institution had been fully redeemed. In February 2015 a contract was signed for the sale of the Fund’s investment property Mariánské Námestí 617/1, in Brno (Czech Republic) for CZK 86.4m (EUR 3,115,200). Receipt of sale proceeds is anticipated in April 2015. No other material events have occurred after the date of the financial position.
12.63 ESTIMATES AND FORMATION OF AN OPINION BY THE MANAGEMENT The Managing Board has discussed with the Supervisory Board the development and choice of, and the provision of information on, the critical principles of financial reporting and estimates, as well as the application of those principles and estimates.
12.63.1 The major sources of uncertainty in estimates are as follows: A. Development of rents; B. Capitalisation factor for transactions; C. Fair rents per type of property; D. Property prices. In section 12.24.3 “Valuation of investment properties” the critical assessments by the Managing Board in applying the Fund’s principles of the valuation of the investment properties are stated.

91
COMPANY FINANCIAL STATEMENTS 2014
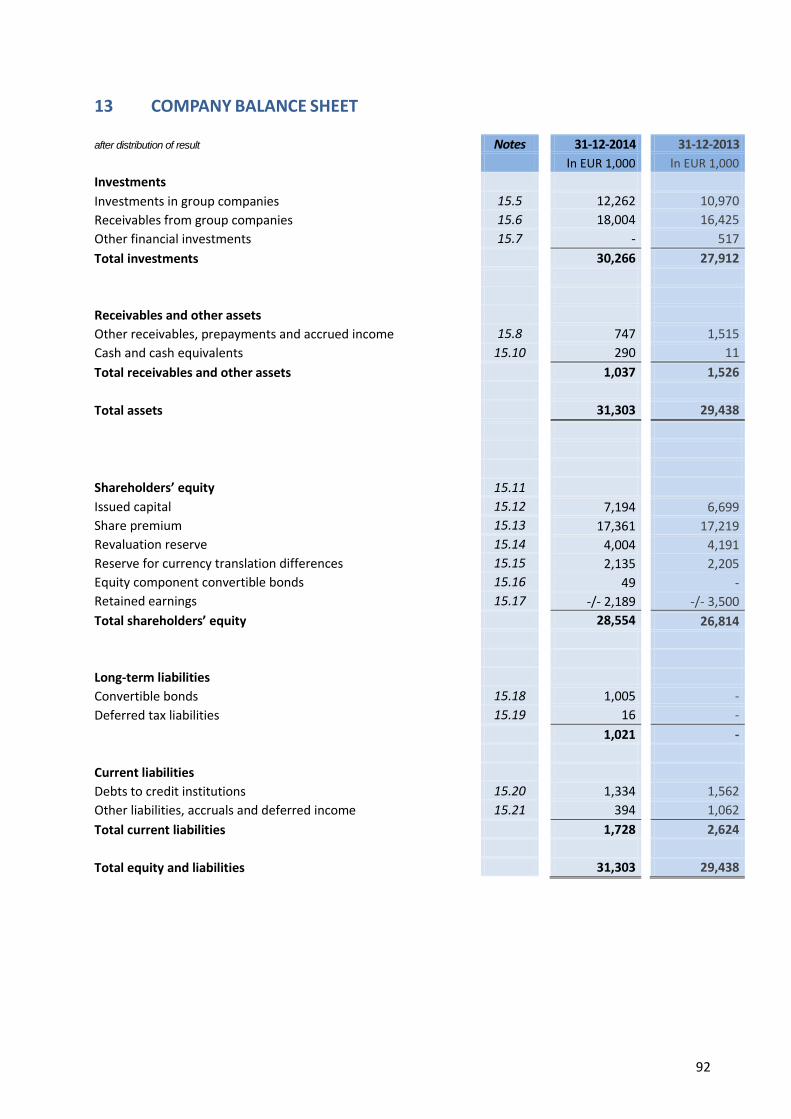
92
13 COMPANY BALANCE SHEET after distribution of result Notes 31-12-2014 31-12-2013
In EUR 1,000 In EUR 1,000
Investments
Investments in group companies 15.5 12,262 10,970
Receivables from group companies 15.6 18,004 16,425
Other financial investments 15.7 - 517
Total investments 30,266 27,912
Receivables and other assets
Other receivables, prepayments and accrued income 15.8 747 1,515
Cash and cash equivalents 15.10 290 11
Total receivables and other assets 1,037 1,526
Total assets 31,303 29,438
Shareholders’ equity 15.11
Issued capital 15.12 7,194 6,699
Share premium 15.13 17,361 17,219
Revaluation reserve 15.14 4,004 4,191
Reserve for currency translation differences 15.15 2,135 2,205
Equity component convertible bonds 15.16 49 -
Retained earnings 15.17 -/- 2,189 -/- 3,500
Total shareholders’ equity 28,554 26,814
Long-term liabilities
Convertible bonds 15.18 1,005 -
Deferred tax liabilities 15.19 16 -
1,021 -
Current liabilities
Debts to credit institutions 15.20 1,334 1,562
Other liabilities, accruals and deferred income 15.21 394 1,062
Total current liabilities 1,728 2,624
Total equity and liabilities 31,303 29,438

93
14 COMPANY PROFIT AND LOSS ACCOUNT Notes 2014 2013
In EUR 1,000 In EUR 1,000
Share in result of group companies (after tax) 15.5.2 1,300 -/- 49
Other result (after tax) -/- 176 -/- 84
Result for the financial period 1,124 -/- 133

94
15 NOTES TO THE COMPANY FINANCIAL STATEMENTS
15.1 GENERAL The company financial statements for 2014 are part of the Fund’s financial statements for 2014. With regard to the Fund’s company profit and loss account use has been made of the exemption pursuant to Book 2, article 2:402 of the Dutch Civil Code.
15.2 PRINCIPLES OF VALUATION OF ASSETS AND LIABILITIES AND DETERMINATION OF RESULTS
15.2.1 General For the purpose of determining the principles of valuation of assets and liabilities and the determination of results for its company financial statements, the Fund makes use of the option offered in Book 2, article 2:362 (8) of the Dutch Civil Code. This means that the principles of valuation of assets and liabilities and determination of results (hereinafter referred to as the “principles of valuation”) of the Fund’s company financial statements are identical to those that have been applied for the consolidated EU-IFRS financial statements. In this context equity participations, on which significant influence is exercised, are valued on the basis of the equity method. These consolidated EU-IFRS financial statements have been prepared in accordance with the standards adopted by the International Accounting Standards Board (“IASB”) and accepted by the European Union (hereinafter referred to as “EU-IFRS”). Reference is made to sections 12.4 to 12.21 inclusive for a description of these principles.
15.2.2 Investments in group companies Investments in group companies are stated at Net Asset Value. The Fund determines the Net Asset Value as well as the cost of acquisition of the equity participation by valuing the assets, provisions and liabilities of the company in which it is participating and calculating its result on the basis of the same principles as its own assets, provisions, liabilities and result. The Net Asset Value of the foreign group companies is translated into Euros at the exchange rate as at the balance sheet date. The results of the foreign group companies are translated at the average exchange rates during the financial period. Results arising from this translation are recognized directly in shareholders’ equity in the “Reserve for currency translation differences” related to the equity participations. In the event of sale of equity participation the cumulative exchange differences related to that equity participation are transferred to the “Other reserves”.
15.2.3 Receivables from group companies Receivables from group companies are stated at amortized cost. In the case of the Fund this is identical to the acquisition price. The acquisition price in foreign currency is determined on the basis of the exchange rate at the transaction date. As at balance sheet date the receivables from group companies are translated into Euros at the exchange rate as at the balance sheet date. Where losses are to be expected on the receivables, a reduction in value is applied in this respect.
15.2.4 Result from investments in group companies The share of the result of companies in which equity participations are held comprises the Fund’s share in the results of such equity participations. The results of the equity participations have been determined on the basis of the principles of valuation adopted by the Fund. The revaluations of the equity participations are therefore included in this item. Results on transactions, in the case of which transfer of assets and liabilities has occurred between the Fund and its affiliates and between the affiliates themselves, has not been recognized in so far as they can be regarded as unrealized. If the equity participation has been
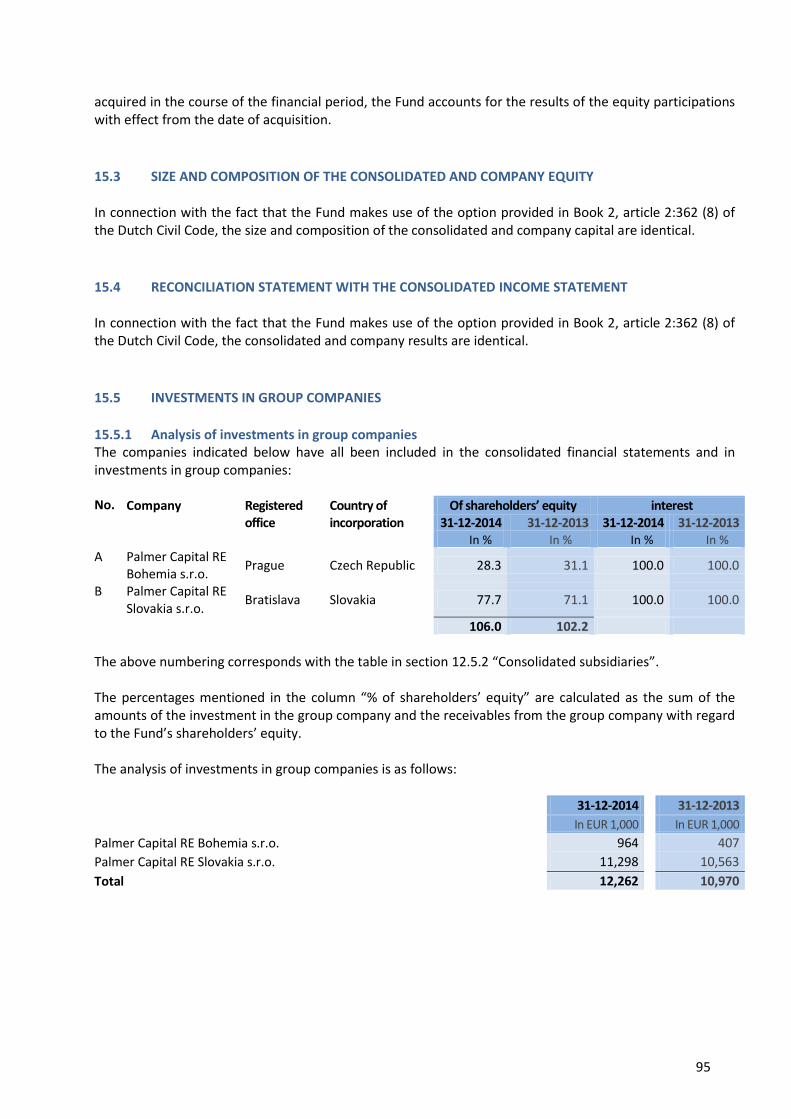
95
acquired in the course of the financial period, the Fund accounts for the results of the equity participations with effect from the date of acquisition.
15.3 SIZE AND COMPOSITION OF THE CONSOLIDATED AND COMPANY EQUITY In connection with the fact that the Fund makes use of the option provided in Book 2, article 2:362 (8) of the Dutch Civil Code, the size and composition of the consolidated and company capital are identical.
15.4 RECONCILIATION STATEMENT WITH THE CONSOLIDATED INCOME STATEMENT In connection with the fact that the Fund makes use of the option provided in Book 2, article 2:362 (8) of the Dutch Civil Code, the consolidated and company results are identical.
15.5 INVESTMENTS IN GROUP COMPANIES
15.5.1 Analysis of investments in group companies The companies indicated below have all been included in the consolidated financial statements and in investments in group companies: No. Company Registered Country of Of shareholders’ equity interest office incorporation 31-12-2014 31-12-2013 31-12-2014 31-12-2013 In % In % In % In %
A Palmer Capital RE Bohemia s.r.o.
Prague Czech Republic 28.3 31.1 100.0 100.0
B Palmer Capital RE Slovakia s.r.o.
Bratislava Slovakia 77.7 71.1 100.0 100.0
106.0 102.2
The above numbering corresponds with the table in section 12.5.2 “Consolidated subsidiaries”. The percentages mentioned in the column “% of shareholders’ equity” are calculated as the sum of the amounts of the investment in the group company and the receivables from the group company with regard to the Fund’s shareholders’ equity. The analysis of investments in group companies is as follows:
31-12-2014 31-12-2013
In EUR 1,000 In EUR 1,000
Palmer Capital RE Bohemia s.r.o. 964 407
Palmer Capital RE Slovakia s.r.o. 11,298 10,563
Total 12,262 10,970
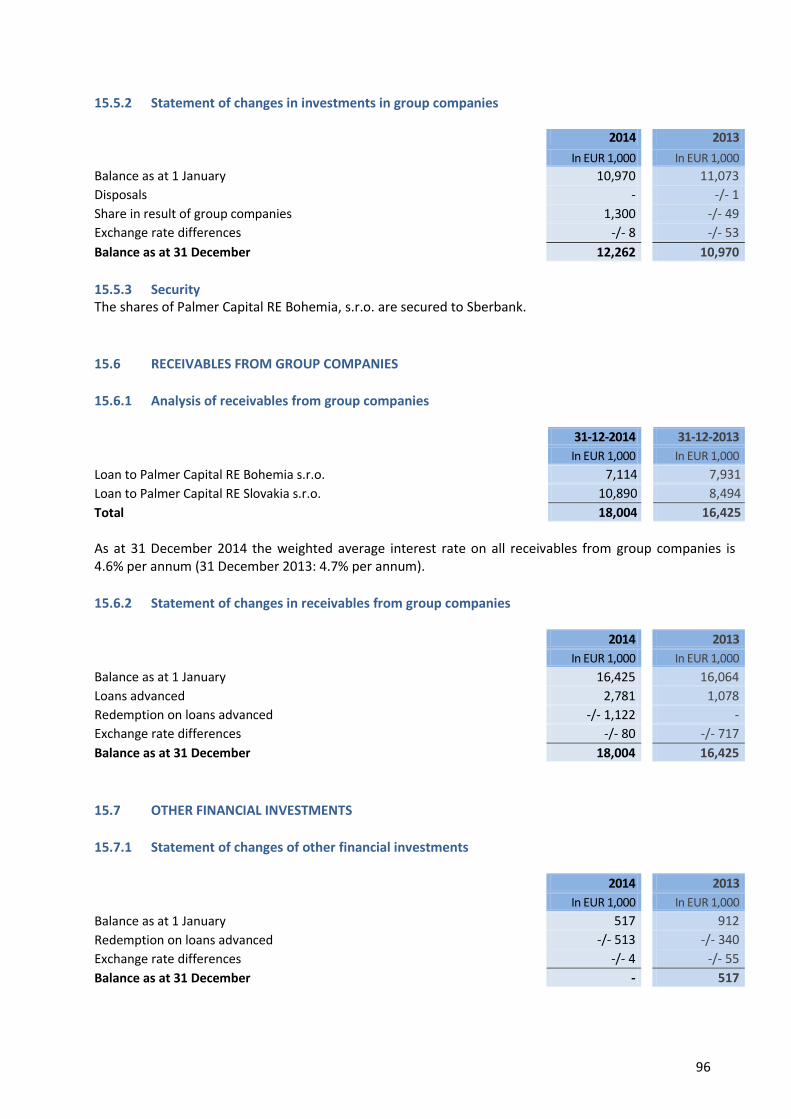
96
15.5.2 Statement of changes in investments in group companies 2014 2013
In EUR 1,000 In EUR 1,000
Balance as at 1 January 10,970 11,073
Disposals - -/- 1
Share in result of group companies 1,300 -/- 49
Exchange rate differences -/- 8 -/- 53
Balance as at 31 December 12,262 10,970
15.5.3 Security The shares of Palmer Capital RE Bohemia, s.r.o. are secured to Sberbank.
15.6 RECEIVABLES FROM GROUP COMPANIES
15.6.1 Analysis of receivables from group companies
31-12-2014 31-12-2013
In EUR 1,000 In EUR 1,000
Loan to Palmer Capital RE Bohemia s.r.o. 7,114 7,931
Loan to Palmer Capital RE Slovakia s.r.o. 10,890 8,494
Total 18,004 16,425
As at 31 December 2014 the weighted average interest rate on all receivables from group companies is 4.6% per annum (31 December 2013: 4.7% per annum).
15.6.2 Statement of changes in receivables from group companies
2014 2013
In EUR 1,000 In EUR 1,000
Balance as at 1 January 16,425 16,064
Loans advanced 2,781 1,078
Redemption on loans advanced -/- 1,122 -
Exchange rate differences -/- 80 -/- 717
Balance as at 31 December 18,004 16,425
15.7 OTHER FINANCIAL INVESTMENTS
15.7.1 Statement of changes of other financial investments
2014 2013
In EUR 1,000 In EUR 1,000
Balance as at 1 January 517 912
Redemption on loans advanced -/- 513 -/- 340
Exchange rate differences -/- 4 -/- 55
Balance as at 31 December - 517

97
15.8 OTHER RECEIVABLES, PREPAYMENTS AND ACCRUED INCOME
15.8.1 Analysis of other receivables, prepayments and accrued income 31-12-2014 31-12-2013
In EUR 1,000 In EUR 1,000
Interest on receivables from group companies 743 771
Interest on other financial investments - 601
Prepayments 4 143
747 1,515
15.9 DEFERRED TAX ASSETS
15.9.1 General A deferred tax asset is included only to the extent that it is probable that taxable profits will be available in the future which can be used for realization of the asset item. The amount of the deferred tax assets is reduced to the extent that it is no longer probable that the associated tax benefit will be realized.
15.9.2 Analysis deferred tax assets not stated in the balance sheet 31-12-2014 31-12-2013
In EUR 1,000 In EUR 1,000
Value for tax purposes of not stated losses carry-forward 234 170
15.9.3 Statement of changes in deferred tax assets not stated in the balance sheet 2014 2013 In EUR 1,000 In EUR 1,000
Balance as at 1 January 170 76
Additions 64 94
Balance as at 31 December 234 170
The Managing Board expects that with regard to these tax losses there will be insufficient taxable profit in the future for the Fund to set off these losses.
15.10 CASH AND CASH EQUIVALENTS Cash and cash equivalents are entirely at the free disposal of the Fund.

98
15.11 SHAREHOLDERS’ EQUITY
15.11.1 Statement of changes in shareholders’ equity
Issued
capital
Share
premium
Revaluation
reserve
Reserve for
currency
translation
differences
Equity
component
convertible
bonds
Retained
earnings
Total
Share-
holders’
equity
In EUR 1,000 In EUR 1,000 In EUR 1,000 In EUR 1,000 In EUR 1,000 In EUR 1,000 In EUR 1,000
Balance as at 1 January 2014 6,699 17,219 4,191 2,205 - -/- 3,500 26,814
Result for the financial period - - - - - 1,124 1,124
Change in revaluation reserve - - -/- 187 - - 187 -
Change in reserve for currency
translation differences - - - -/- 70 - - -/- 70
Change in equity component
convertible bonds - - - - 49 - 49
Own ordinary shares issued 495 142 - - - - 637
Balance as at 31 December 2014 7,194 17,361 4,004 2,135 49 -/- 2,189 28,554
Balance as at 1 January 2013 6,429 16,338 4,769 2,880 - -/- 3,945 26,471
Result for the financial period - - - - - -/- 133 -/- 133
Change in revaluation reserve - - -/- 578 - - 578 -
Change in reserve for currency
translation differences - - - -/- 675 - - -/- 675
Own ordinary shares issued 270 881 - - - - 1,151
Balance as at 31 December 2013 6,699 17,219 4,191 2,205 - -/- 3,500 26,814
15.12 ISSUED CAPITAL
15.12.1 Analysis issued capital 31-12-2014 31-12-2014 31-12-2013 31-12-2013
pieces In EUR 1,000 pieces In EUR 1,000
Ordinary shares (at EUR 5.00 each) 1,411,713 7,059 1,296,819 6,484
Registered shares (at EUR 5.00 each) 26,991 135 42,888 215
Priority shares (at EUR 5.00 each) 1 - 1 -
Issued capital 1,438,705 7,194 1,339,708 6,699

99
15.12.2 Ordinary shares The holders of ordinary shares are entitled to dividends, the distribution of which has been resolved by the General Meeting of Shareholders. The holders of ordinary shares are entitled to exercise one vote per ordinary share at the General Meeting of Shareholders. 2014 2014 2013 2013
pieces In EUR 1,000 pieces In EUR 1,000
Balance in issue as at 1 January 1,296,819 6,484 1,285,725 6,429
Issued for payment in cash 98,997 495 - - Conversion registered shares 15,897 80 11,094 55
Balance in issue as at 31 December – fully paid 1,411,713 7,059 1,296,819 6,484
15.12.3 Registered shares As at 7 November 2014 Palmer Capital Investments GmbH converted 15,897 registered shares into 15,897 ordinary shares. The conversion had no (negative) consequences for the existing shareholders of the Fund. Registered shares are currently restricted from trading on NYSE Euronext Amsterdam. 2014 2014 2013 2013
pieces In EUR 1,000 pieces In EUR 1,000
Balance in issue as at 1 January 42,888 215 - -
Issued during the financial period - - 53,982 270
Redeemed during the financial period -/- 15,897 -/- 80 -/- 11,094 -/- 55
Balance in issue as at 31 December 26,991 135 42,888 215
15.12.4 Priority shares From the profit earned in a financial period, primarily and as far as possible a dividend is distributed on the priority shares amounting to seven percent (7%) on an annual basis, calculated over the nominal value of the priority shares. No further distributions are made on the priority shares. 2014 2014 2013 2013 pieces In EUR 1,000 pieces In EUR 1,000
Balance in issue as at 1 January 1 - 1 -
Issued during the financial period - - - -
Redeemed during the financial period - - - -
Balance in issue as at 31 December 1 - 1 -
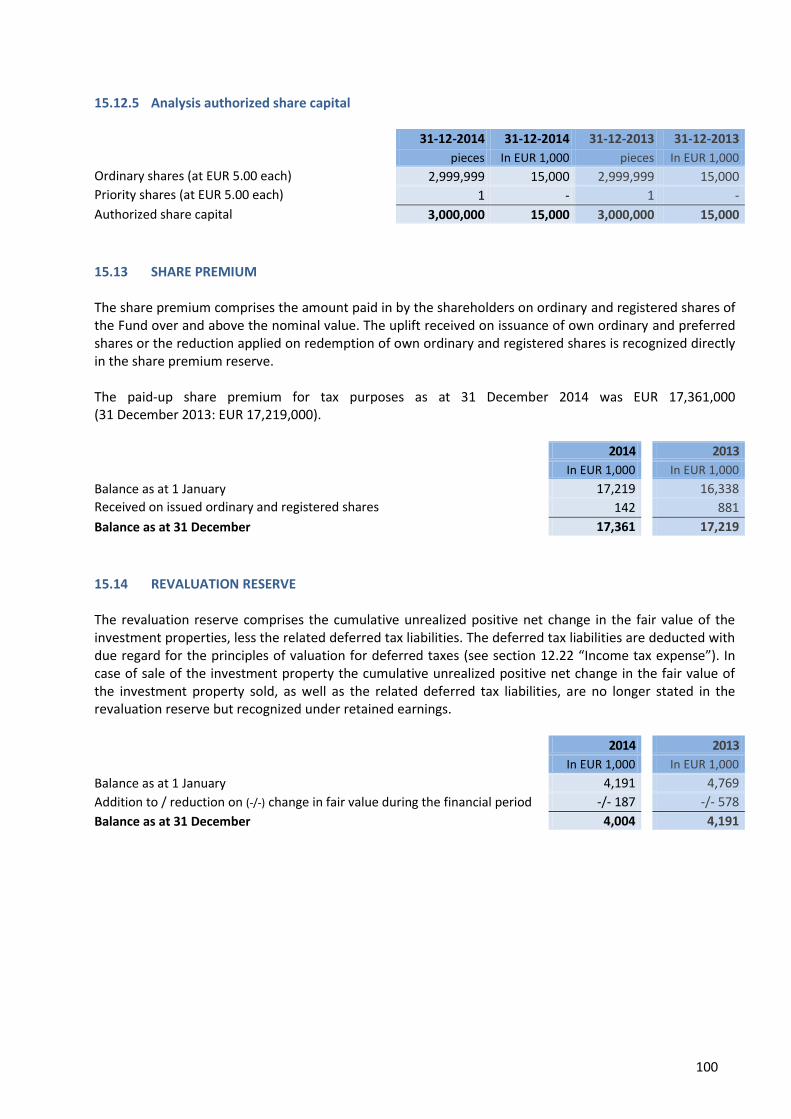
100
15.12.5 Analysis authorized share capital 31-12-2014 31-12-2014 31-12-2013 31-12-2013
pieces In EUR 1,000 pieces In EUR 1,000
Ordinary shares (at EUR 5.00 each) 2,999,999 15,000 2,999,999 15,000
Priority shares (at EUR 5.00 each) 1 - 1 -
Authorized share capital 3,000,000 15,000 3,000,000 15,000
15.13 SHARE PREMIUM The share premium comprises the amount paid in by the shareholders on ordinary and registered shares of the Fund over and above the nominal value. The uplift received on issuance of own ordinary and preferred shares or the reduction applied on redemption of own ordinary and registered shares is recognized directly in the share premium reserve. The paid-up share premium for tax purposes as at 31 December 2014 was EUR 17,361,000 (31 December 2013: EUR 17,219,000). 2014 2013
In EUR 1,000 In EUR 1,000
Balance as at 1 January 17,219 16,338
Received on issued ordinary and registered shares 142 881
Balance as at 31 December 17,361 17,219
15.14 REVALUATION RESERVE The revaluation reserve comprises the cumulative unrealized positive net change in the fair value of the investment properties, less the related deferred tax liabilities. The deferred tax liabilities are deducted with due regard for the principles of valuation for deferred taxes (see section 12.22 “Income tax expense”). In case of sale of the investment property the cumulative unrealized positive net change in the fair value of the investment property sold, as well as the related deferred tax liabilities, are no longer stated in the revaluation reserve but recognized under retained earnings. 2014 2013
In EUR 1,000 In EUR 1,000
Balance as at 1 January 4,191 4,769
Addition to / reduction on (-/-) change in fair value during the financial period -/- 187 -/- 578
Balance as at 31 December 4,004 4,191

101
15.15 RESERVE FOR CURRENCY TRANSLATION DIFFERENCES The reserve for currency translation differences comprises the exchange rate differences that arise from the foreign currency translation of net investments in subsidiaries outside the euro-zone into the Fund’s reporting currency. 2014 2013
In EUR 1,000 In EUR 1,000
Balance as at 1 January 2,205 2,880
Addition / reduction (-/-) in connection with translation net investments -/- 88 -/- 675
Change in connection with decrease of net investments 18 -
Balance as at 31 December 2,135 2,205
15.16 EQUITY COMPONENT CONVERTIBLE BOND
The reserve for convertible bonds comprises the amount allocated to the equity component for the convertible bonds as issued by the Fund (see section 12.39.3 “Analysis of convertible bonds”), less the deferred tax liabilities. 2014 2013
In EUR 1,000 In EUR 1,000
Balance as at 1 January - -
Addition in connection with issued convertible bonds 49 -
Balance as at 31 December 49 -
15.17 RETAINED EARNINGS It is proposed to the General Meeting of Shareholders to deduct the whole of the remaining profit for 2014 financial period from the retained earnings. This proposal has already been recognized in the company balance sheet. 2014 2013
In EUR 1,000 In EUR 1,000
Balance as at 1 January -/- 3,500 -/- 3,945
Profit for the period 1,124 -/- 133
-/- 2,376 -/- 4,078
Change in revaluation reserve 187 578
Balance as at 31 December -/- 2,189 -/- 3,500

102
15.18 CONVERTIBLE BONDS
15.18.1 Analysis of convertible bonds
No. Date of issue Date of
maturity Nominal interest rate
Face value Carrying amount
Face value Carrying amount
31-12-2014 31-12-2014 31-12-2013 31-12-2013
In % In EUR 1,000 In EUR 1,000 In EUR 1,000 In EUR 1,000
1 1-12-2014 1-12-2019 6.00 1,070 1,005 - -
15.18.2 Statement of changes of convertible bonds
2014 2013
In EUR 1,000 In EUR 1,000
Balance as at 1 January - -
Proceeds from issue 1,070 -
Amount classified as equity -/- 66 -
Accreted interest 1 -
Balance as at 31 December 1,005 -
There were no transaction costs related to the issue of convertible bonds. The convertible bonds are convertible into 107,000 ordinary shares of the Fund (conversion price: EUR 10.00 per share) as of 1 December 2015 at the option of the holder of the convertible bonds.
15.18.3 Valuation of convertible bonds The valuation of convertible bonds, stated under section 15.18.1 “Analysis of convertible bonds”, are recognised at amortized cost, using the effective interest method (see section 12.8.5). The interest rate used is 7.5%, based on the estimated average interest rate to be paid on comparative non-convertible bonds.
15.19 DEFERRED TAX LIABILITIES
15.19.1 General The deferred tax liabilities relate to the differences between the carrying amount of the assets and the book value for tax purposes of the assets.
15.19.2 Analysis of deferred tax liabilities stated in the balance sheet 31-12-2014 31-12-2013
In EUR 1,000 In EUR 1,000
Convertible bonds 16 -
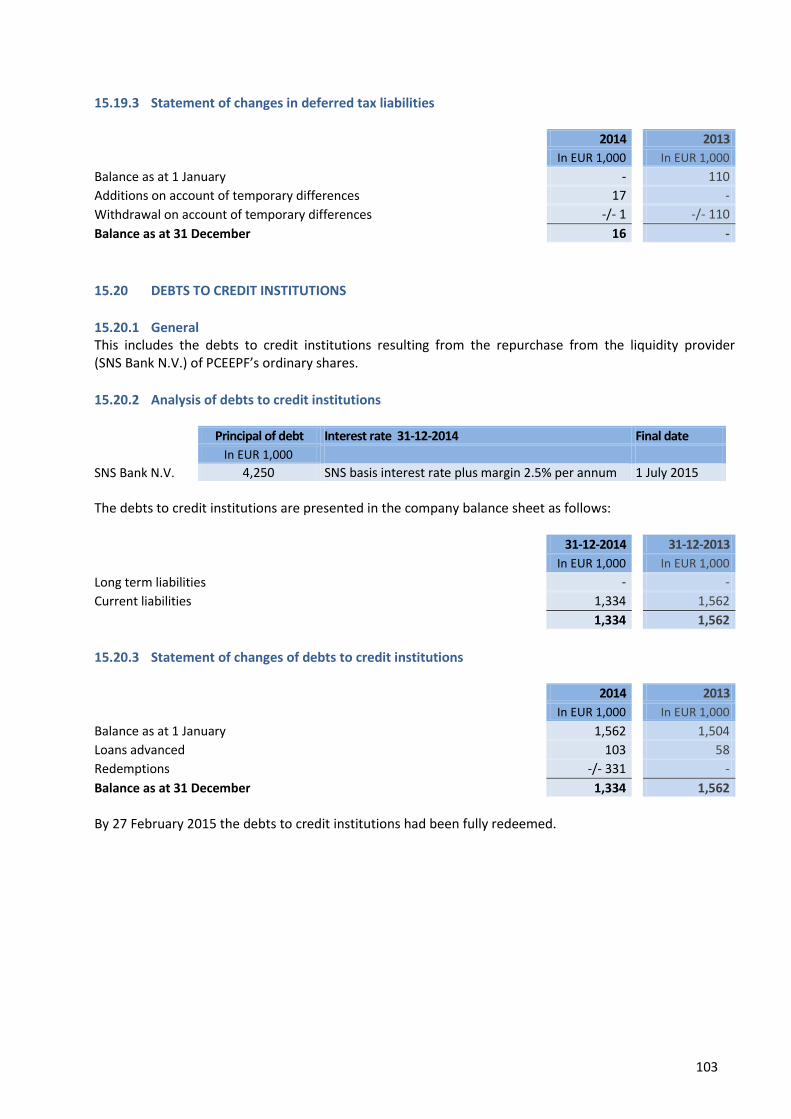
103
15.19.3 Statement of changes in deferred tax liabilities 2014 2013
In EUR 1,000 In EUR 1,000
Balance as at 1 January - 110
Additions on account of temporary differences 17 -
Withdrawal on account of temporary differences -/- 1 -/- 110
Balance as at 31 December 16 -
15.20 DEBTS TO CREDIT INSTITUTIONS
15.20.1 General This includes the debts to credit institutions resulting from the repurchase from the liquidity provider (SNS Bank N.V.) of PCEEPF’s ordinary shares.
15.20.2 Analysis of debts to credit institutions
Principal of debt Interest rate 31-12-2014 Final date
In EUR 1,000 SNS Bank N.V. 4,250 SNS basis interest rate plus margin 2.5% per annum 1 July 2015
The debts to credit institutions are presented in the company balance sheet as follows:
31-12-2014 31-12-2013
In EUR 1,000 In EUR 1,000
Long term liabilities - -
Current liabilities 1,334 1,562
1,334 1,562
15.20.3 Statement of changes of debts to credit institutions 2014 2013
In EUR 1,000 In EUR 1,000
Balance as at 1 January 1,562 1,504
Loans advanced 103 58
Redemptions -/- 331 -
Balance as at 31 December 1,334 1,562
By 27 February 2015 the debts to credit institutions had been fully redeemed.

104
15.21 OTHER LIABILITIES, ACCRUALS AND DEFERRED INCOME
15.21.1 Specification other liabilities, accruals and deferred income This relates to other liabilities, accruals and deferred income with a term shorter than one year. The specification is as follows: 31-12-2014 31-12-2013
In EUR 1,000 In EUR 1,000
Administrative expenses 71 644
Trade payables 294 390
Interest payables 29 28
394 1,062
15.22 NON-CONTINGENT LIABILITIES As at 31 December 2014 the Fund was not subject to any contractual obligation concerning investments, repairs, maintenance or other non-contingent liabilities that needed to be settled in the following financial period.
15.23 CONTINGENT LIABILITIES As at 31 December 2014 the Fund has the following contingent liabilities:
The Fund has a potential liability for the amount of EUR 114,000 to Palmer Capital Fondsenbeheer B.V. regarding to Management fee, as a result of a provisional waiver for the Management fee (2014) above EUR 800,000.
As at 31 December 2014 the Fund was not subject to any further contingent liabilities, among which included obligations that result from security transactions related to (exchange) rate risk in connection with investments.
15.24 PERSONNEL COSTS The Fund does not employ any personnel (2013: nil).

105
15.25 REMUNERATION FOR THE MANAGING BOARD AND SUPERVISORY BOARD During the financial period no (2013: no) remuneration including pension charges in the meaning of article 2:383 (1) of the Dutch Civil Code was charged to the Fund or group companies in respect of (former) members of the Managing Board. For the remuneration of the Management of the Fund 0.125% of the value of the total assets of the Fund is paid monthly to the Managing Board (Palmer Capital Fondsenbeheer B.V.), as stated in section 12.53 “Administrative expenses”. As of 1 July 2012 the Managing Board of Palmer Capital Fondsenbeheer B.V. has decided to reduce its own Management fee by the amount of Asset Management fee paid by Fund entities to Palmer Capital Czech Republic, s.r.o. As at 13 August 2014 the Managing Board decided (for the time being) to “cap” the total Management fee 2014 at EUR 800,000 and to waive provisionally the claim above EUR 800,000.
15.25.1 Specification remuneration Supervisory Board
2014 2013
In EUR 1,000 In EUR 1,000
H.H. Kloos RBA (chairman since 19 June 2014) 7 -
B. Vos M.Sc. 14 14
Prof. Dr. J.L. Bouma (chairman till 19 June 2014) 7 14
28 28
Prof. Dr. J.L. Bouma (previous years) 13 -
41 28
The Fund has provided no loans, advances or guarantees for the members of Managing Board or the members of the Supervisory Board. Neither the members of the Managing Board nor the members of the Supervisory Board received any options or remuneration in the form of the Fund’s shares.

106
15.26 RELATED PARTIES
15.26.1 Identity of related parties With regard to the Fund the following categories of related party were distinguished during the 2014 financial period: A. Managers in key positions; B. Major investors; C. All organisational entities within the group designated as Palmer Capital (PC); D. Investment trusts, investment funds and other investment companies, which are managed by an
entity belonging to Palmer Capital; E. Investments undertaken by Palmer Capital, in which Palmer Capital has significant influence
(more than 20% of voting rights).
15.26.2 Transactions with and / or interests of managers in key positions (A) During the financial period the Fund entered into the following transactions with the managers in key positions: A. The Managing Board of Palmer Capital Fondsenbeheer B.V. decided (for the time being) to “cap”
the total Management fee 2014 at EUR 800,000 and to waive provisionally the claim above EUR 800,000, as described in section 15.23 “Contingent liabilities”;
B. The Managing Board of Palmer Capital Fondsenbeheer B.V. decided to reduce its own Management fee, with the Asset Management fees paid by the Fund (and / or its subsidiaries) to Palmer Capital Czech Republi,c s.r.o. During the financial period an additional amount of EUR 204,000 was paid by Palmer Capital RE Slovakia, s.r.o. to Palmer Capital Czech Republic, s.r.o. regarding Asset Management fee.
During the financial period no other transactions occurred with members of the Managing Board and / or members of the Supervisory Board. In addition, neither the Managing Board nor the Supervisory Board held interests in the Fund or investments of the Fund. The remuneration for the Managing Board is described in section 12.53 “Administrative expenses”. The remuneration for the Supervisory Board is described in section 12.54 “Other operating expenses”.
15.26.3 Transactions with and / or interests of major investors (B) Pursuant to the decree on Dutch Act on Financial Supervision (Wet op het financieel toezicht, the “Wft”) the Fund reports one major investor, namely Stichting Prioriteit MERE (the “Foundation”), which holds all priority shares in the Fund’s capital. No transactions occurred between the Foundation and the Fund during the financial period.
15.26.4 Transactions with other related parties (C-D-E) During the financial period the Fund entered into the following transactions with the other related parties: A. Providing loans to group companies, as described in section 15.6 “Receivables from group
companies”; B. Providing credit by the Fund to Palmer Capital Central European Properties a.s. for the principal
amount of EUR 1.31m (2013: EUR 1.31m). For this credit provision an annual average interest payment of 12.0% (2013: 12.0%) was received. During the financial period the loan receivable and the receivable interest is fully received by the Fund.
C. Palmer Capital Investments GmbH converted 15,897 registered shares of the Fund into 15,897 ordinary shares of the Fund as described in section 12.32.3 “Registered shares”.
15.26.5 Investments in other related parties (C-D-E) During the financial period the Fund has not entered into investments in other related parties.
107
15.27 TAXES The taxable profits of the Fund are subject to corporate income tax. Deventer, 31 March 2015 The Managing Board: Palmer Capital Fondsenbeheer B.V. On behalf of, G.St.J. Barker LLB FRICS P.H.J. Mars M.Sc. Drs. P.H. van Kleef RC MRE Managing Director Managing Director Managing Director The Supervisory Board: H.H. Kloos RBA B. Vos M.Sc. Chairman
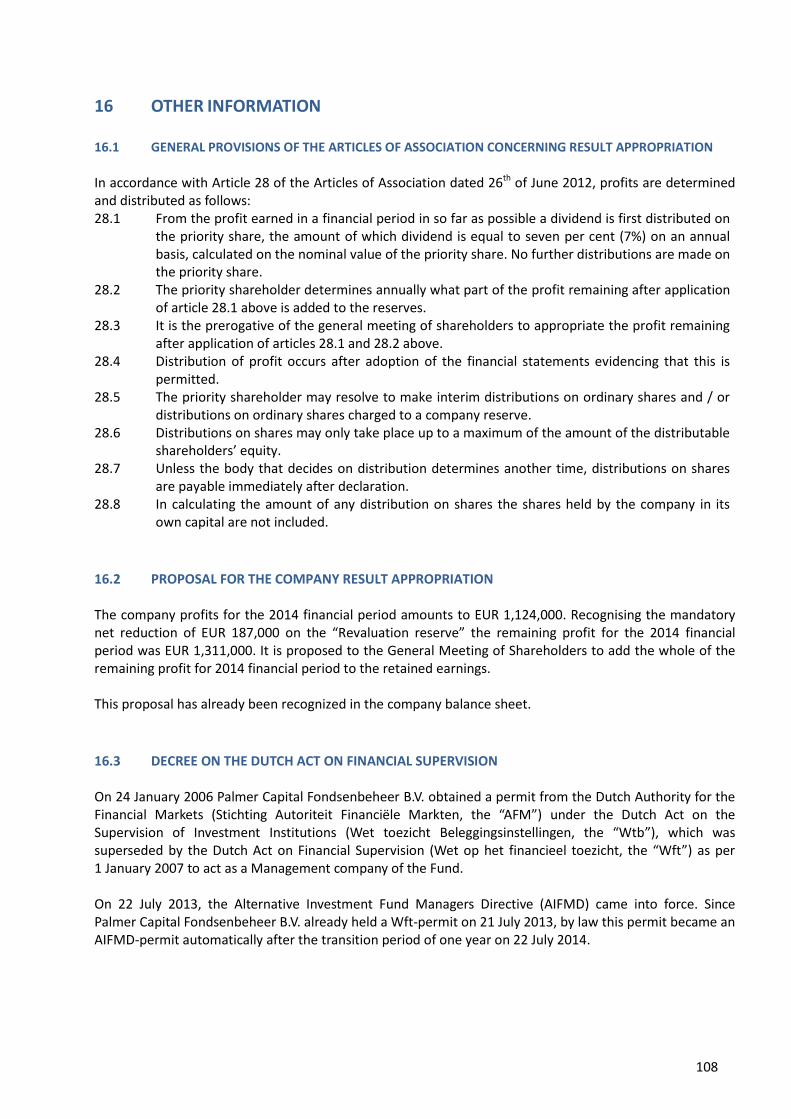
108
16 OTHER INFORMATION
16.1 GENERAL PROVISIONS OF THE ARTICLES OF ASSOCIATION CONCERNING RESULT APPROPRIATION
In accordance with Article 28 of the Articles of Association dated 26th of June 2012, profits are determined and distributed as follows: 28.1 From the profit earned in a financial period in so far as possible a dividend is first distributed on
the priority share, the amount of which dividend is equal to seven per cent (7%) on an annual basis, calculated on the nominal value of the priority share. No further distributions are made on the priority share.
28.2 The priority shareholder determines annually what part of the profit remaining after application of article 28.1 above is added to the reserves.
28.3 It is the prerogative of the general meeting of shareholders to appropriate the profit remaining after application of articles 28.1 and 28.2 above.
28.4 Distribution of profit occurs after adoption of the financial statements evidencing that this is permitted.
28.5 The priority shareholder may resolve to make interim distributions on ordinary shares and / or distributions on ordinary shares charged to a company reserve.
28.6 Distributions on shares may only take place up to a maximum of the amount of the distributable shareholders’ equity.
28.7 Unless the body that decides on distribution determines another time, distributions on shares are payable immediately after declaration.
28.8 In calculating the amount of any distribution on shares the shares held by the company in its own capital are not included.
16.2 PROPOSAL FOR THE COMPANY RESULT APPROPRIATION The company profits for the 2014 financial period amounts to EUR 1,124,000. Recognising the mandatory net reduction of EUR 187,000 on the “Revaluation reserve” the remaining profit for the 2014 financial period was EUR 1,311,000. It is proposed to the General Meeting of Shareholders to add the whole of the remaining profit for 2014 financial period to the retained earnings. This proposal has already been recognized in the company balance sheet.
16.3 DECREE ON THE DUTCH ACT ON FINANCIAL SUPERVISION On 24 January 2006 Palmer Capital Fondsenbeheer B.V. obtained a permit from the Dutch Authority for the Financial Markets (Stichting Autoriteit Financiële Markten, the “AFM”) under the Dutch Act on the Supervision of Investment Institutions (Wet toezicht Beleggingsinstellingen, the “Wtb”), which was superseded by the Dutch Act on Financial Supervision (Wet op het financieel toezicht, the “Wft”) as per 1 January 2007 to act as a Management company of the Fund. On 22 July 2013, the Alternative Investment Fund Managers Directive (AIFMD) came into force. Since Palmer Capital Fondsenbeheer B.V. already held a Wft-permit on 21 July 2013, by law this permit became an AIFMD-permit automatically after the transition period of one year on 22 July 2014.
109
16.4 PERSONAL INTERESTS During the financial period neither the Managing Board nor the Supervisory Board held interests in investments by the Fund, except for B. Vos M.Sc. who had 2,000 ordinary shares (31 December 2013: 2,000) in private possession and 2,074 ordinary shares (31 December 2013: 2,074) in possession through Bas Vos B.V. As at 31 December 2014 Palmer Capital Investments GmbH held 26,991 registered shares (31 December 2013: 42,888) in the Fund.
16.5 SPECIAL CONTROLLING RIGHTS Special rights in respect of control of the company have been granted to the holders of priority shares. The priority shares are bearer shares. As provided by the Articles of Association the priority shares entitle the Foundation:
To determine the number of members of the Managing Board and Supervisory Board;
To make binding nominations for appointment of the members of the Managing Board and the members of the Supervisory Board;
To make the proposal to the General Meeting of Shareholders to suspense or dismiss a Managing Board member and / or a Supervisory Board member;
To make the proposal to the Supervisory Board for the remuneration of the members of the Supervisory Board;
To determine which part of the profits remaining after priority dividend (see also section 16.1) shall be reserved;
To make interim distributions on ordinary shares and / or distributions on ordinary shares charged to a company reserve;
To make the proposal to the General Meeting of Shareholders to amend the Articles of Association of the Fund;
To make the proposal to the General Meeting of Shareholders for statutory merger or statutory demerger of the Fund;
To make the proposal to the General Meeting of Shareholders for dissolution of the Fund. The General Meeting of Shareholders needs the approval of the Foundation for decisions of the Managing Board concerning:
Reduction of the issued share capital.
16.6 EVENTS AFTER BALANCE SHEET DATE As at 20 February 2015 the Fund placed the second tranche of the convertible bond launched during October 2014 for an amount of EUR 1.42m. This amount has been used for the full instalment of the unsecured bank loan from SNS. By 27 February 2015 all debts to this credit institution had been fully redeemed. No other material events after financial position’s date.
110
16.7 INDEPENDENT AUDITOR’S REPORT
To: The general meeting of shareholders of Palmer Capital Emerging Europe Property Fund N.V.
Report on the audit of the financial statements 2014 Our opinion
We have audited the financial statements 2014 of Palmer Capital Emerging Europe Property Fund N.V. (the company), based in Amsterdam. The financial statements include the consolidated financial statements and the company financial statements.
In our opinion:
the consolidated financial statements give a true and fair view of the financial position of Palmer Capital Emerging Europe Property Fund N.V. as at December 31, 2014, and of its result and its cash flows for 2014 in accordance with International Financial Reporting Standards as adopted by the European Union (EU-IFRS) and with Part 9 of Book 2 of the Netherlands Civil Code.
the company financial statements give a true and fair view of the financial position of Palmer Capital Emerging Europe Property Fund N.V. as at December 31, 2014 and of its result for 2014 in accordance with Part 9 of Book 2 of the Netherlands Civil Code.
The consolidated financial statements comprise:
the consolidated statement of financial position as at December 31, 2014;
the following consolidated statements for 2014: the income statement, the statements of comprehensive income, changes in shareholders’ equity and cash flows; and
the notes comprising a summary of the significant accounting policies and other explanatory information.
The company financial statements comprise:
the company balance sheet as at December 31, 2014;
the company profit and loss account for 2014; and
the notes comprising a summary of the significant accounting policies and other explanatory information.
Basis for our opinion
We conducted our audit in accordance with Dutch law, including the Dutch Standards on Auditing. Our responsibilities under those standards are further described in the “Our responsibilities for the audit of the financial statements” section of our report.
We are independent of Palmer Capital Emerging Europe Property Fund N.V. in accordance with the Verordening inzake de onafhankelijkheid van accountants bij assurance-opdrachten (ViO) and other relevant independence regulations in the Netherlands. Furthermore, we have complied with the Verordening gedrags- en beroepsregels accountants (VGBA).
We believe that the audit evidence we have obtained is sufficient and appropriate to provide a basis for our opinion.
111
Materiality
Misstatements can arise from fraud or errors and are considered material if, individually or in the aggregate, they could reasonably be expected to influence the economic decisions of users taken on the basis of these financial statements. The materiality affects the nature, timing and extent of our audit procedures and the evaluation of the effect of identified misstatements on our opinion.
Based on our professional judgement we determined the materiality for the financial statements as a whole at EUR 530,000. The materiality is based on 0.9% of balance sheet total. This corresponds to 2.0% of Net Asset Value. We have also taken into account misstatements and/or possible misstatements that in our opinion are material for qualitative reasons for the users of the financial statements.
We communicated to the Supervisory Board that all misstatements in excess of EUR 25,000, which are identified during the audit, would be reported to them, as well as smaller misstatements that in our view must be reported on qualitative grounds.
Scope of the group audit
Palmer Capital Emerging Europe Property Fund N.V. is head of a group of entities that operates in three different European countries: the Netherlands, Slovakia and Czech Republic. The financial information of this group is included in the financial statements of Palmer Capital Emerging Europe Property Fund N.V.
Because we are ultimately responsible for the opinion, we are also responsible for directing, supervising and performing the group audit. In this respect we have determined the nature and extent of the audit procedures to be carried out for group entities. Decisive were the size and / or the risk profile of the group entities or operations. On this basis, we selected group entities for which an audit or review had to be carried out on the complete set of financial information or specific items.
Our group audit focused on all group entities since they are all considered individually significant. We have performed audit procedures ourselves for the Dutch holding company and the valuation of the investment property of the entire group and have used the work of other KPMG auditors for auditing the two foreign group entities Palmer Capital RE Bohemia s.r.o. and Palmer Capital RE Slovakia s.r.o.
The Group audit team sent detailed instructions to the component auditors, covering the significant areas that should be covered (which included the relevant risk of material misstatement) and set out the information required to be reported back to the Group audit team. The Group audit team visited the component location Czech Republic to review the audit files of the component auditors of Palmer Capital RE Bohemia s.r.o. and Palmer Capital RE Slovakia s.r.o. and to have discussions with the component auditors, local management and the external appraiser. Furthermore we have inspected two of the fifteen investment properties as well as the project Yellow Properties (accounted for as other investments).
By performing the procedures mentioned above at group entities, together with additional procedures at group level, we have been able to obtain sufficient and appropriate audit evidence about the group’s financial information to provide an opinion about the financial statements.
Our key audit matters
Key audit matters are those matters that, in our professional judgement, were of most significance in our audit of the financial statements. We have communicated the key audit matters to the supervisory board. The key audit matters are not a comprehensive reflection of all matters discussed.
These matters were addressed in the context of our audit of the financial statements as a whole and in forming our opinion thereon, and we do not provide a separate opinion on these matters.

112
Valuation of Investment Property
The valuation of the Investment Property of EUR 55.3 million per December 31, 2014 is important to our audit as it is the company’s most significant asset and involves a high decree of estimation uncertainty. The management board has a process in place to internally revaluate investment properties on a quarterly base and on a yearly base by an external valuator. These valuations are based on assumptions such as future rents, occupancy rates, rentfree periods and yields.
Our audit procedures included, amongst others, considerations of the quality and the objectivity of the valuation process and the independence and expertise of the external valuator. We furthermore assessed the accuracy of the property related data delivered to the external valuator for input for the valuations and used our KPMG valuation specialists to assist us in analysing the valuations and challenging the underlying assumptions with relevant market data. Finally we focused on the adequacy of the disclosures on the valuation of the property as included in note 12.9 and 12.23 of the disclosures to the financial statements.
We observed that the valuation of the investment property performed by management board resulted in an acceptable valuation of the investment property for the purpose of the financial statements.
Monitoring of debt and liquidity
During 2014, the company was faced with the need to refinance her debt. Amongst others the financing of the Slovak and Czech investment portfolio was due for renewal. The successful refinancing of the portfolios and the future compliance to debt covenants are of significant impact on the company’s ability to continue as a going concern and therefore important for the management board to control. The assessment of future compliance to debt covenants is by nature judgmental as it is based on assumptions on future market and/or economic conditions. Given the potential significant impact on the assumption of the going concern principle applied in the financial statements, the refinancing of the portfolios and future compliance to debt covenants are important to our audit.
Our audit procedures included, among others, examining loan documentation specifically for loan covenants, examining the issuance of the bond loans dated 1 December 2014 and 20 February 2015 and examining the sale agreements of investment properties. Furthermore we evaluated the assumptions and methodologies used by the management board to prepare covenant and liquidity forecasts.
We also refer to the disclosure of the company regarding the (re)financing of the company as disclosed in note 12.37 of the financial statements and note 16.6 regarding subsequent events. We assessed the adequacy of these disclosures.
Our assessment is that the application of the going concern assumption made by the management board is reasonable. The debt positions and related conditions and covenants have been adequately disclosed in the financial statements.
Responsibilities of the management board and the Supervisory Board for the financial statements
The management board is responsible for the preparation and fair presentation of the financial statements in accordance with EU-IFRS and Part 9 of Book 2 of the Netherlands Civil Code and for the preparation of the management board report in accordance with Part 9 of Book 2 of the Netherlands Civil Code. Furthermore, the management board is responsible for such internal control as the management board determines is necessary to enable the preparation of the financial statements that are free from material misstatement, whether due to errors or fraud.
As part of the preparation of the financial statements, management is responsible for assessing the company’s ability to continue as a going concern. Based on the financial reporting frameworks mentioned, the management board should prepare the financial statements using the going concern basis of accounting unless the management board either intends to liquidate the company or to cease operations, or has no realistic alternative but to do so. The management board should disclose events and

113
circumstances that may cast significant doubt on the company’s ability to continue as a going concern in the financial statements.
The Supervisory Board is responsible for overseeing the company’s financial reporting process.
Our responsibilities for the audit of the financial statements
Our objective is to plan and perform the audit assignment in a manner that allows us to obtain sufficient and appropriate audit evidence for our opinion.
Our audit has been performed with a high, but not absolute, level of assurance, which means we may not have detected all errors and fraud.
We have exercised professional judgement and have maintained professional skepticism throughout the audit, in accordance with Dutch Standards on Auditing, ethical requirements and independence requirements. Our audit included e.g.:
Identifying and assessing the risks of material misstatement of the financial statements, whether due to errors or fraud, designing and performing audit procedures responsive to those risks, and obtaining audit evidence that is sufficient and appropriate to provide a basis for our opinion. The risk of not detecting a material misstatement resulting from fraud is higher than for one resulting from errors, as fraud may involve collusion, forgery, intentional omissions, misrepresentations, or the override of internal control.
Obtaining an understanding of internal control relevant to the audit in order to design audit procedures that are appropriate in the circumstances, but not for the purpose of expressing an opinion on the effectiveness of the company’s internal control.
Evaluating the appropriateness of accounting policies used and the reasonableness of accounting estimates and related disclosures made by the management board.
Concluding on the appropriateness of the management board’s use of the going concern basis of accounting, and based on the audit evidence obtained, whether a material uncertainty exists related to events or conditions that may cast significant doubt on the company’s ability to continue as a going concern. If we conclude that a material uncertainty exists, we are required to draw attention in our auditor’s report to the related disclosures in the financial statements or, if such disclosures are inadequate, to modify our opinion. Our conclusions are based on the audit evidence obtained up to the date of our auditor’s report. However, future events or conditions may cause the company ceasing to continue as a going concern.
Evaluating the overall presentation, structure and content of the financial statements, including the disclosures; and
Evaluating whether the financial statements represent the underlying transactions and events in a manner that achieves fair presentation.
We communicate with the Supervisory Board regarding, among other matters, the planned scope and timing of the audit and significant audit findings, including any significant findings in internal control that we identify during our audit.
We provide the Supervisory Board with a statement that we have complied with relevant ethical requirements regarding independence, and to communicate with them all relationships and other matters that may reasonably be thought to bear on our independence, and where applicable, related safeguards.
From the matters communicated with the Supervisory Board, we determine those matters that were of most significance in the audit of the financial statements of the current period and are therefore the key audit matters. We describe these matters in our auditor’s report unless law or regulation precludes public
114
disclosure about the matter or when, in extremely rare circumstances, not mentioning it is in the public interest.
Report on other legal and regulatory requirements Report on the management board report and the other information
Pursuant to legal requirements of Part 9 of Book 2 of the Netherlands Civil Code (concerning our obligation to report about the management board report and other information),:
We have no deficiencies to report as a result of our examination whether the management board report, to the extent we can assess, has been prepared in accordance with Part 9 of Book 2 of the Netherlands Civil Code, and whether the information as required by Part 9 of Book 2 of the Netherlands Civil Code has been annexed.
We report that the management board report, to the extent we can assess, is consistent with the financial statements.
Engagement
We were engaged by the Supervisory Board as auditor of Palmer Capital Emerging Europe Property Fund N.V. before the year 2008 and have operated as statutory auditor ever since that date.
Utrecht, March 31, 2015
KPMG Accountants N.V.
G.J. Hoeve RA