middle school math acceleration and equitable access to eighth-grade...
TRANSCRIPT

Educational Evaluation and Policy AnalysisMay 2015, Vol. 37, No. 1S, pp. 80S –101S
DOI: 10.3102/0162373715576076© 2015 AERA. http://eepa.aera.net
Introduction
Several years ago, the Wake County Public School System (WCPSS) in North Carolina sought a strategy to provide equitable access to appropriate and rigorous mathematics courses in the middle grades and to ensure access to Algebra I by the eighth grade for academically prepared students. In particular, the district hoped to increase the disproportionately low rates of enroll-ment in advanced math coursework among Black students, Hispanic students, and students from low-income households. To support this goal, in the 2010–2011 school year, WCPSS enacted a
mathematics course-assignment policy based on a numeric criterion developed by the SAS Institute’s Education Value-Added Assessment System (EVAAS) to determine student eligibility for an accelerated math curriculum in the sixth and sev-enth grades and for placement in Algebra I in the eighth grade. District officials believed that increasing students’ access to such coursework prior to high school would, in turn, increase their subsequent academic opportunities and, specifi-cally, their likelihood of completing a rigorous, college-preparatory sequence of high school mathematics.
576076 EPAXXX10.3102/0162373715576076Dougherty et al.Middle School Math Acceleration and Equitable Access to 8th Grade Algebraresearch-article2015
Middle School Math Acceleration and Equitable Access to Eighth-Grade Algebra: Evidence From the Wake County
Public School System
Shaun M. Dougherty
University of ConnecticutJoshua S. Goodman
Harvard UniversityDarryl V. Hill
Wake County Public School SystemErica G. Litke
Harvard UniversityLindsay C. Page
University of Pittsburgh
Taking algebra by eighth grade is considered an important milestone on the pathway to college readiness. We highlight a collaboration to investigate one district’s effort to increase middle school algebra course-taking. In 2010, the Wake County Public Schools began assigning middle school students to accelerated math and eighth-grade algebra based on a defined prior achievement metric. This policy reduced the relationship between course assignment and student characteristics such as income and race/ethnicity, while increasing its relationship to academic skill. The policy increased the share of students on track for algebra by eighth grade. Students placed in accelerated math were exposed to higher-skilled peers but larger classes. Future work will assess impacts on subsequent achievement and course-taking outcomes.
Keywords: mathematics education, middle schools, equity, algebra, regression discontinuity
Middle School Math Acceleration and Equitable Access to 8th Grade Algebra
81S
While several educational agencies have recently attempted to address such goals through grade-specific, algebra-for-all policies, WCPSS leadership believed that mandating every student into an accelerated course would be inappropri-ate, as such a policy action might lead to certain students enrolling in courses for which they were not academically prepared. Instead, the district identified the EVAAS-generated measure, a pre-dicted probability of success on the North Carolina End-of-Course (EOC) assessment in Algebra I, as an objective measure with which to standardize the process of assigning students to mathematics courses in the middle grades. Such a measure would identify students who might be overlooked for the recommendation to take accelerated-level courses as a result of variation in course-grading practices and subjective beliefs about which students are capable of success in these courses. These subjective practices and beliefs, district officials argued, rest with teach-ers or counselors who might otherwise make rec-ommendations on the basis of student characteristics, such as race/ethnicity or socio-economic status, even conditional on demon-strated ability (Hui, 2011).
In EVAAS, district leadership believed it found a measure that would reduce or eliminate such bias, increase overall enrollment in acceler-ated mathematics coursework in the middle grades, and importantly, increase enrollment spe-cifically for students who were, up to that point, underrepresented in such courses. They reasoned that students who had proven themselves capable of success based on their prior test scores would flourish academically, become more engaged in their schoolwork, and gain access to more accel-erated mathematics courses while in high school. WCPSS also contended that the structure of the policy would both encourage acceleration into Algebra I for appropriately prepared eighth-grade students (somewhat analogous to single-grade, algebra-for-all policies used in other districts) and improve the overall pipeline for advanced math by affecting the placement of ris-ing sixth and seventh graders into advanced math courses, setting them on course for Algebra I in the eighth grade.
By virtue of our team’s collective affiliations with the Center for Education Policy Research (CEPR) at Harvard University and the Strategic
Data Project (SDP), a research–education agency partnership housed at CEPR, we have built a partnership between WCPSS personnel and aca-demic researchers to investigate the implementa-tion of the district’s middle grades mathematics assignment policy and its impact on student out-comes. This collaborative effort seeks to gener-ate evidence that will inform both the WCPSS district leadership and the broader mathematics education policy community about the potential benefits and consequences of an assignment strategy such as that currently used in Wake County.
In this article, we describe the initial phase of this ongoing investigation, focusing on evidence about how the assignment rule was implemented, the extent to which it achieved the goal of improving equitable access to advanced math coursework, and how the rule establishes the opportunity for future study of the impact of accelerated coursework on student outcomes. We begin by describing the research and policy con-text related to math course and algebra assign-ment policies. We then describe the WCPSS assignment policy in detail. Given the focus of this issue, we next describe the broader SDP part-nership that has facilitated this investigation. Following this, we detail the data used in our exploration of the WCPSS math assignment strategy and discuss the identification strategy we use for understanding the causal impacts of acceleration in middle grades mathematics on several student-level outcomes.
We find four main results. First, overall rates of math acceleration increased substantially after implementation of the assignment rule. Second, the policy succeeded in moving the district toward the goal of equalizing access to advanced math coursework, both by increasing enrollment among Black students, Hispanic students, and students from lower-income families, and by reducing the role of these demographic factors in the course-assignment process. Third, relative to non-accelerated students, accelerated students’ math classes had much more academically skilled peers and were substantially larger. Fourth, the discontinuity in coursework gener-ated at the eligibility threshold is sufficiently large and precise to serve as an instrument for various student outcomes that will be explored in later work. After discussing these results, the

Dougherty et al.
82S
final section concludes with discussions of next steps in this ongoing partnership between the school district and academic researchers.
Motivation
In the United States, mathematics achieve-ment is often regarded as essential for individual educational and economic success, as well as national global competitiveness (Chazan, 2008; The College Board, 2000). Indeed, recent evi-dence suggests that increasing the number of years of mathematics required of students raises earnings, especially among students from minority or economically disadvantaged groups (Goodman, 2012). Beginning with Sputnik in 1957, continuing with A Nation at Risk (Gardner, 1983) and still in more recent reports (see, for example, Brown et al., 2013; National Mathematics Advisory Panel, 2008), policymak-ers have called for increased proficiency in math as a national imperative. Efforts thus have focused on increasing the amount and rigor of mathematics course-taking, with a particular focus on exposure to algebra (Adelman, 2006). As a key prerequisite for a sequence of courses culminating in college-level classes such as cal-culus and statistics, Algebra I is considered a critical “gatekeeper” course (Adelman, 2006; Education Commission of the States, 1998; Rickles, 2013; Walston & McCarroll, 2010).
With this gateway status recognized, Algebra I enrollment rates have increased over the last two decades, with significant growth at the eighth-grade level (Walston & McCarroll, 2010). Concurrently, algebra course-taking in later grades has declined, reflecting the push for alge-bra earlier in students’ mathematics careers (Stein, Kaufman, Sherman, & Hillen, 2011). Yet, this shift has not been experienced uniformly. For example, among eighth graders, Black stu-dents and Hispanic students continue to enroll in Algebra I at rates lower than their White counter-parts (Domina, 2014; Gamoran & Hannigan, 2000; Stein et al., 2011), even conditional on prior achievement (Walston & McCarroll, 2010). This may be due to a combination of differences in mathematical preparedness and course place-ment practices. In addition, Black students and Hispanic students may disproportionately attend schools in which algebra is not offered in the
middle school years. Nevertheless, concerns about the equality of access to algebra courses remain and have been foregrounded in recent years, particularly given evidence of the positive outcomes associated with taking algebra.
Research has documented the relationship between algebra enrollment and a variety of edu-cational and economic outcomes (Adelman, 2006; Gamoran & Hannigan, 2000; Ham & Walker, 1999; Ma, 2005; National Council for Teachers of Mathematics, 1989; Stein et al., 2011). Yet, much of this research suffers from likely selection bias (Rickles, 2013; Stein et al., 2011) and therefore does not support causal claims about the impact of algebra. Typically, students are assigned to algebra coursework based on a combination of teacher or counselor recommendation, prior achievement, and student or parent preferences. A concern that arises from such course selection processes relates to those students who may be overlooked. Together with factors such as teacher expecta-tions and school course offerings, students who are prepared for a course may nonetheless be excluded. Indeed, even among those sufficiently prepared, certain demographic groups are not proportionally represented in algebra courses (Domina, 2014; Stein et al., 2011; Stone, 1998; Walston & McCarroll, 2010).
In response to concerns regarding equity in exposure to algebra, many policymakers have advocated for early and universal access to alge-bra, with some districts and states mandating Algebra I for all ninth-grade students (as in Chicago, see Allensworth, Nomi, Montgomery, & Lee, 2009; Nomi, 2012) and others for all eighth-grade students (e.g., Burris, Heubert, & Levin, 2006; Silver, 1995; and, for an account of a state-wide policy in California, see Bitter & O’Day, 2010). The “Algebra-for-All” movement has gen-erated substantial debate (Loveless, 2008; Schneider, 2009; Silver, 1995), at the heart of which lies a tension regarding student readiness for algebra. As was the concern in WCPSS, selec-tive entry may deny access to those prepared for the course, placing unfair barriers to future oppor-tunities. Yet, universal enrollment may force underprepared students into a course in which they may not be successful, particularly without additional supports. In addition, universal policies may yield unintended or unanticipated adjust-ments by schools and teachers, undermining the

Middle School Math Acceleration and Equitable Access to 8th Grade Algebra
83S
aims of the policy. For example, while some schools may adapt pedagogy in rigorous ways to meet the needs of a more heterogeneous popula-tion, others may “water down” the curriculum and nevertheless perpetuate previous systems of inequality (Schneider, 2009). Universal policies also implicitly mandate changes to students’ prep-aration for algebra, having curricular implications for the grades prior to those in which students take algebra. These changes may not occur in practice. Simply mandating that all students take algebra without giving attention to their preparation, what an algebra course entails, or how it is taught may be damaging to the very students the policy was intended to help.
Despite ongoing debates, limited causal evi-dence exists on universal algebra policies (Rickles, 2013; Stein et al., 2011). Researchers, unsurpris-ingly, find that universal policies increase algebra enrollment (Allensworth et al., 2009; Burris et al., 2006; Everson & Dunham, 1996; Stein et al., 2011). Impacts on student achievement, however, are mixed (Stein et al., 2011). Clotfelter, Ladd, and Vigdor (2012a, 2012b) find negative effects of accelerating low-skilled students into Algebra I in ninth grade. Ninth-grade universal algebra in Chicago negatively affected the mathematics achievement of high-skilled students placed in heterogeneous classes (Nomi, 2012). While the Chicago policy increased the overall algebra credit accumulation, it also increased failure rates across ability groups, and it did not lead to improved standardized test scores (Allensworth et al., 2009). For low-performing students assigned to a “dou-ble dose” of algebra,1 the policy yielded not only positive short-term impacts on grade-point aver-age (GPA) and standardized test scores (Nomi & Allensworth, 2009) but also an increase in course failure rates. In the longer term, the double-dose strategy yielded positive effects on American College Testing (ACT) performance, high school graduation, and college entrance (Cortes, Goodman, & Nomi, 2015). Thus, there may be promise for algebra enrollment policies when combined with appropriate support for underpre-pared students, although care must be taken with how such policies are implemented (Nomi & Allensworth, 2013).
In the face of ongoing debates and mixed evidence on universal placement strategies,
practitioners and policymakers have begun to seek alternative, objective mechanisms to advance stu-dents’ mathematics trajectories and to identify policies that might best encourage early and equitable exposure for students who are pre-pared. The recent WCPSS policy relying on an objective measure to target students for accelera-tion provides an important opportunity to under-stand the benefits and consequences of alternative mathematics course-assignment strategies.
Policy Overview and Context
Historically, about 30% of WCPSS eighth graders have enrolled in Algebra I annually. Responding to concerns that the demographics of the eighth-grade students enrolling in Algebra I did not reflect those of the district overall, the school board, along with a task force focused on economically disadvantaged students, sought to ensure that all students who demonstrated the potential to be successful in accelerated mathe-matics courses and Algebra I in the middle grades both had access to and were encouraged to enroll in the course.
As a result, the district designed and imple-mented a targeted middle-grade math enrollment strategy. Beginning in the 2010–2011 academic year, the district identified students for acceler-ated mathematics and pre-Algebra in the sixth and seventh grades, respectively, and for Algebra I in the eighth grade utilizing a proprietary numeric criterion developed by the SAS Institute’s EVAAS. The EVAAS prediction model capitalizes on extant student test score information (e.g., standardized End-of-Grade [EOG] test scores from all available prior grades) and specifically predicts each student’s probabil-ity for each achievement level on the Algebra I EOC exam.2 For sixth- and seventh-grade stu-dents with a 70% or higher probability of achiev-ing Level III on the Algebra I EOC exam, the policy recommends placement for sixth-grade accelerated math and seventh-grade pre-Algebra, respectively, putting these students on track for Algebra I in the eighth grade. For eighth-grade students with a 70% probability or higher of earning a Level III on the Algebra I EOC, the policy recommends placement in Algebra I in the eighth grade.3

Dougherty et al.
84S
Partnership and Longitudinal Data
Given the focus of this Educational Evaluation and Policy Analysis (EEPA) special issue on research partnerships that use data and rigorous analytic methods to inform educational practice, the details and structure of the relationship that paved the way for this investigation bear descrip-tion. All the authors on this article are currently or were previously affiliated with Harvard University as students, faculty, or staff research-ers and are currently affiliated with the CEPR at Harvard. CEPR is the hosting entity of the SDP.
The SDP was formed in 2008 with funding from the Bill and Melinda Gates Foundation. The goal of SDP is to transform the use of data in education to improve student achievement. Two fundamental and related challenges were at the heart of SDP’s genesis. First, school districts are awash in data but often lack capacity to conduct analyses that have the potential to inform prac-tice and decision making. Second, while educa-tion research had contributed to our collective understanding on important topics such as teacher effectiveness and retention, alternative certification programs, and college-going out-comes, most districts lacked the opportunity to learn about these topics in their own contexts and with their own data (Hess & Fullerton, 2008). Seeking to address these challenges, SDP began as a pilot partnership between CEPR and two school districts—Charlotte-Mecklenburg Schools and the District of Columbia Public Schools—and has since grown to include over 60 partner agencies, including school districts, state education agencies, charter management organi-zation, and non-profits.4
SDP utilizes several strategies in working toward this mission. The SDP research team uti-lizes data from each partner agency’s administra-tive information systems to conduct detailed, descriptive analyses related to students’ college readiness and success as well as human capital and teacher effectiveness to better inform that particular agency’s strategic planning, manage-ment, and decision making and to encourage its continued use of data for such purposes. These analyses are referred to as the SDP diagnostics. Data gathered to support the diagnostics include detailed longitudinal information on students, such as demographic characteristics, courses
taken, years enrolled, and measures of academic achievement, including course grades and stan-dardized test scores. Data also include teacher-level information, such as demographic characteristics, educational and licensure back-ground, the number of years for which each teacher has been with the district, and the specific courses and groups of students each teacher teaches. While these data are typically pulled from a number of disparate data sources and gov-erning entities throughout an agency, the SDP research team works to bring the various elements into several unified files for analysis. Because of the research relationship that preceded WCPSS joining SDP, the district and Harvard University had already established agreements and security protocols to enable the sharing of student- and teacher-level data between the two organizations. These agreements were then updated (and data refreshed) through the continuation of the SDP relationship.
In 2011, WCPSS joined on as a partnership district with SDP. Prior to becoming a formal SDP partner, WCPSS had contracted with CEPR to conduct a set of descriptive analyses focused on trends in achievement gaps by salient student characteristics, such as race/ethnicity and socio-economic status. The district had undergone a leadership change, and the then-incoming (now former) superintendent requested these analyses to provide a third-party look at academic achievement trends among the district’s students. Through the process of conducting these analy-ses, members of our team had the opportunity to learn about the context and policy efforts under-way in the district. These early conversations led to mutual interest in WCPSS signing on as a partner district in the SDP and in investigating district efforts, such as the newly established middle-grade math assignment policy.
As the relationship was being established con-tractually, the SDP team was able to learn about the district’s impetus for implementing the policy and was able to underscore the unique opportu-nity, given the structure of the policy, to investi-gate its impact with a rigorous, quasi-experimental research design. With the formation of the SDP relationship, the district and CEPR researchers agreed that understanding the impact of the mid-dle-grade math assignment policy would be a focus of the ongoing research partnership.
Middle School Math Acceleration and Equitable Access to 8th Grade Algebra
85S
Perhaps most critical to the success of this project, SDP places Strategic Data Fellows within each of its partner agencies. The SDP Fellows are skilled quantitative analysts selected through a national recruitment process to serve in a 2-year fellowship in one of the SDP partner agencies. The role of the fellow in each agency is to improve data inquiry and data-driven decision making. Fellows contribute time to working on and facilitating the SDP diagnostics as well as conducting key projects that are both of import to the district and related to each fellow’s substan-tive domains of interest. As part of his fellowship work within WCPSS, Darryl Hill, a member of this project’s team, took on the WCPSS math placement policy as a key component of his port-folio of work for the district.
Hill’s position within the district has been an integral aspect of this project for a number of rea-sons. First, he was able to learn, firsthand, about the details and intricacies of the various WCPSS data systems. In addition to facilitating the assembly of the original data files required for the SDP diagnostics, he was able to gather data elements required for this particular investigation that were not part of the diagnostic datasets. For example, he was able to gather the individual-level EVAAS probabilities for all students in WCPSS. He was able to develop an intimate understanding of the data’s idiosyncrasies, which he gained by working directly with the district’s various data owners. Second, Hill was physically close and had direct access to the district staff members integrally involved in the development and implementation of the policy under explora-tion. This access afforded him the opportunity to talk regularly with district leaders about their intentions and visions for the WCPSS math assignment strategy. Third, his position as a researcher within the district afforded him access to school leaders and teachers responsible for responding to the district’s charge of implement-ing the new strategy for math course placement. By traveling to many of the district’s schools, Hill was able to talk directly with school leaders and mathematics teachers and learn about the on-the-ground context in which the policy was being implemented across schools. He learned about schools’ site-specific approaches to the policy’s implementation. This included learning about both the structures and services schools put in
place to support students struggling in acceler-ated mathematics as well as the perceived needs the schools had for successful implementation. Much of what Hill learned has and continues to inform the group’s analytic approach. For exam-ple, Hill was able to learn that compliance with the policy became stronger over time as a result of a powerful directive from the superintendent and that some schools grouped their students into specially created sections of advanced math courses that corresponded to EVAAS scores. These details led our team to understand why compliance with the policy appeared more mod-est in its first few years and underscored the importance of including school-level fixed effects in our modeling strategy.
Fourth, Hill was able to represent the team’s preliminary work not only internally to district leadership but also externally to interested par-ties and community members within Wake County. For instance, after the team presented preliminary results at an annual academic confer-ence, community members learned about the ongoing work and were interested to discuss its meaning and implications for students in Wake County. Hill was able to facilitate these interac-tions with community members and utilized them as an opportunity to further educate about the findings to date. Finally, as the team’s work moves forward, Hill will be able to lead dissemi-nation of the study’s findings within the district, for example, by presenting to bodies such as the district’s school board, the superintendent’s lead-ership council, and school leaders, teachers, and community members throughout Wake County. In all these ways, Hill’s presence in WCPSS allows this investigation to serve as an example of research done with a district rather than to a district.
Data
To examine implementation of the enrollment policy, we utilize data from WCPSS’s longitudi-nal student information system. This system assigns students unique identifiers that allow the district to follow their progress from primary school through secondary school. For our pur-poses, the data’s longitudinal structure facilitates this research by tracking students from the end of fifth grade, when they are assigned EVAAS

Dougherty et al.
86S
scores that determine whether they will be accel-erated in math, through middle and high school, during which many of our outcomes of interest are measured. We can track students as long as they stay within WCPSS and will explore whether acceleration affected the rate of attrition from the district. Without the ability to link student records across years, this study would not be feasible.
Three major components of the data are critical to the present study. First, the data include student-level EVAAS scores, which provide an estimate of each student’s predicted probability of success in algebra, as described above. New EVAAS scores are generated annually for rising seventh and eighth graders, as further standardized test scores are incorporated into the calculation.
Second, the data contain each student’s com-plete middle school coursework transcript. We can, therefore, observe the math courses in which students enroll and whether they were accelerated in math. Because classrooms can be uniquely identified and linked to both students and teachers, we can construct measures of peer composition, such as class size or average prior achievement, and teacher characteristics, such as years of expe-rience or value added. These classroom-level measures will help us characterize in greater detail the various channels through which acceleration may have affected student outcomes.
Third, the data contain information on student demographics, such as gender, free/reduced-price lunch status, and race/ethnicity. Such vari-ables will serve as controls in some regression specifications and will allow us to explore het-erogeneity in program impacts.
Finally, for future work, we are in the process of linking the transcript data to three important categories of outcomes that may be affected by math acceleration, namely standardized test scores, grades earned in middle school courses, and the high school coursework in which stu-dents later enroll. Standardized test scores will come from North Carolina’s EOG exams in math and reading comprehension, administered in the third through eighth grades, regardless of the specific courses in which the students were enrolled. That all students in a given grade receive a common assessment will allow us to explore whether acceleration affected math and reading achievement at the end of sixth, seventh, and eighth grade.
Sample Description and Equity Considerations
Because the acceleration policy under study was first implemented in the 2010–2011 school year, we focus largely on data for the 2010–2011, 2011–2012, and 2012–2013 school years. Our main analytic sample consists of WCPSS stu-dents with valid EVAAS scores who entered the sixth grade in the 2009–2010 through 2012–2013 school years. We refer to these students collec-tively as the 2010–2013 cohorts, named for the spring of the academic year in which they first entered the sixth grade. The 2010 cohort was subject to the new policy starting only in seventh grade, while the subsequent three cohorts were subject to it starting in sixth grade.
Table 1 contains summary statistics for the main analysis sample. Column 1, which contains all students in the sample, shows that 57% of WCPSS students in these grades are White or Asian and 38% are Black or Hispanic. During this time period, 70% of middle school students are in accelerated math coursework, and the average EVAAS-predicted probability is more than 10 percentage points higher than the 70% eligibility threshold set by the assignment rule. In fact, that EVAAS threshold represents roughly the 25th percentile of math skill in the district, so that the accelerated track should contain about 75% of WCPSS students if the acceleration rule were followed exactly.
Columns 2 and 3 divide the sample into stu-dents in accelerated math courses and those not. Accelerated students are substantially more likely to be White or Asian and less likely to be Black or Hispanic. Accelerated students have much higher math skills, whether measured by EVAAS or by their fifth-grade math exam z score, the latter of which suggests a 1.3 standard deviation difference between the average perfor-mance of the two groups. Finally, accelerated students’ math classes have much more highly skilled peers, are roughly five students larger, and have fewer Black or Hispanic peers than do the math classes of non-accelerated students.
Before turning to a description of the empiri-cal strategy we will use to estimate the impact of math acceleration on student outcomes, we first take a broad view of the overall impact of the new policy on the way in which students

87S
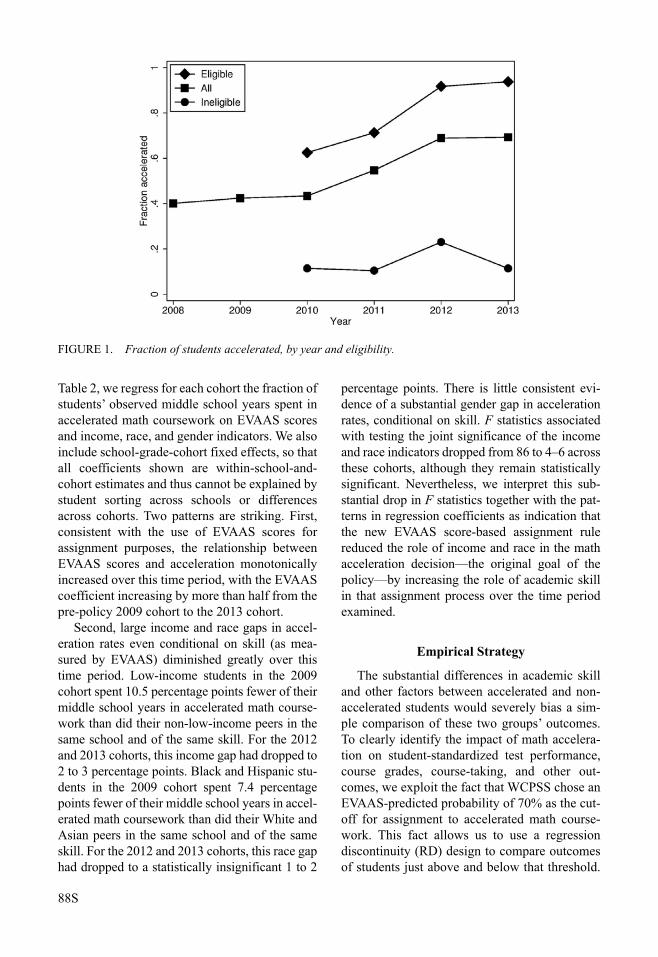
were assigned to accelerated coursework. Upon implementation, the policy immediately increased rates of enrollment in middle school accelerated math, and placement recommendations based on this policy have been followed with a high (and increasing) degree of fidelity. As Figure 1 shows, the share of students in accelerated math in the sixth through eighth grades during the 2007–2008, 2008–2009, and 2009–2010 school years was about 40% to 44%. That share then jumped to 55% in the first year of policy implementation and up to nearly 70% in the subsequent 2 years. In 2010–2011, 71% of EVAAS-eligible students enrolled in coursework leading to or called Algebra I. By 2012–2013, this figure had risen to 94%. Rates of acceleration have been largely flat for students deemed ineligible by the new policy.
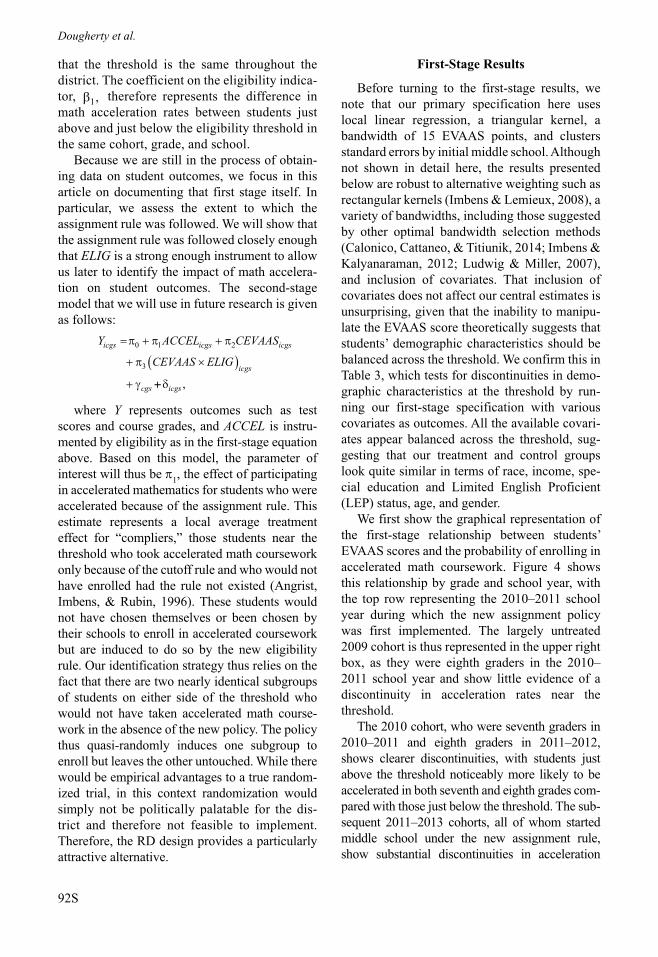
Figure 2 shows rates of math acceleration by low-income status. Acceleration rates rose sub-stantially for both low-income and non-low-income students over this time period, although a large income gap in acceleration still persists in part because of the large income gap in EVAAS scores. Perhaps the most striking feature of these graphs is that EVAAS-eligible low-income stu-dents’ rates of acceleration more than doubled from 40% to close to 90% over this time period. We see very similar patterns when comparing Black and Hispanic students with White and Asian students. EVAAS-eligible Black and Hispanic students’ rates of acceleration also roughly doubled from about 45% to about 90% over this time period (not shown).
To study how the policy improved equitable access to accelerated math more rigorously, in
TABLE 1Summary Statistics
(1) (2) (3)
All students Accelerated Non-accelerated
(A) Controls Female 0.501 0.504 0.495 White 0.509 0.598 0.304 Asian 0.062 0.079 0.024 Black 0.247 0.171 0.425 Hispanic 0.135 0.106 0.203 Other race 0.046 0.046 0.044 Poor 0.375 0.266 0.630 Special education 0.351 0.366 0.316 Limited English proficiency 0.161 0.138 0.213 Age on September 1 13.299 13.262 13.386(B) Math course and skills Accelerated 0.699 1.000 0.000 EVAAS (most recent) 80.671 91.824 54.171 EVAAS (earliest) 83.051 92.868 60.235 Fifth-grade math z score 0.032 0.421 −0.884(C) Math course peer consumption Mean fifth-grade math z score 0.018 0.412 −0.898 SD fifth-grade math z score 0.629 0.617 0.655 Class size 26.243 27.719 22.811 Fraction Black or Hispanic 0.429 0.327 0.666 Fraction female 0.499 0.502 0.492 N 82,359 57,584 24,775
Note. Mean values of key variables are shown for all students in the 2010–2013 cohorts. EVAAS = Education Value-Added Assessment System.
88S
Table 2, we regress for each cohort the fraction of students’ observed middle school years spent in accelerated math coursework on EVAAS scores and income, race, and gender indicators. We also include school-grade-cohort fixed effects, so that all coefficients shown are within-school-and-cohort estimates and thus cannot be explained by student sorting across schools or differences across cohorts. Two patterns are striking. First, consistent with the use of EVAAS scores for assignment purposes, the relationship between EVAAS scores and acceleration monotonically increased over this time period, with the EVAAS coefficient increasing by more than half from the pre-policy 2009 cohort to the 2013 cohort.
Second, large income and race gaps in accel-eration rates even conditional on skill (as mea-sured by EVAAS) diminished greatly over this time period. Low-income students in the 2009 cohort spent 10.5 percentage points fewer of their middle school years in accelerated math course-work than did their non-low-income peers in the same school and of the same skill. For the 2012 and 2013 cohorts, this income gap had dropped to 2 to 3 percentage points. Black and Hispanic stu-dents in the 2009 cohort spent 7.4 percentage points fewer of their middle school years in accel-erated math coursework than did their White and Asian peers in the same school and of the same skill. For the 2012 and 2013 cohorts, this race gap had dropped to a statistically insignificant 1 to 2
percentage points. There is little consistent evi-dence of a substantial gender gap in acceleration rates, conditional on skill. F statistics associated with testing the joint significance of the income and race indicators dropped from 86 to 4–6 across these cohorts, although they remain statistically significant. Nevertheless, we interpret this sub-stantial drop in F statistics together with the pat-terns in regression coefficients as indication that the new EVAAS score-based assignment rule reduced the role of income and race in the math acceleration decision—the original goal of the policy—by increasing the role of academic skill in that assignment process over the time period examined.
Empirical Strategy
The substantial differences in academic skill and other factors between accelerated and non-accelerated students would severely bias a sim-ple comparison of these two groups’ outcomes. To clearly identify the impact of math accelera-tion on student-standardized test performance, course grades, course-taking, and other out-comes, we exploit the fact that WCPSS chose an EVAAS-predicted probability of 70% as the cut-off for assignment to accelerated math course-work. This fact allows us to use a regression discontinuity (RD) design to compare outcomes of students just above and below that threshold.
FIGURE 1. Fraction of students accelerated, by year and eligibility.

89S
These two groups of students are nearly identical in all ways except that the former group was rec-ommended for acceleration while the latter was not. As such, comparison of these two groups near the threshold should yield estimates unbi-ased by differences in prior academic achieve-ment or other student characteristics. Of course, a limitation of this approach is that estimated impacts of acceleration that are derived from the RD analysis are local to those students near the 70% cutoff, or those students who are around the 25th percentile of the achievement, as deter-mined by the EVAAS measure.
The EVAAS-predicted probability of success in Algebra I, therefore, serves as our forcing vari-able, the variable utilized to assign students
exogenously to either the treatment group, those invited to accelerated math courses, or the con-trol group, those not invited to such acceleration. Because EVAAS scores are recalculated after each grade to incorporate new standardized test scores and because math acceleration may affect such scores and thus subsequent EVAAS values, EVAAS scores calculated at the end of sixth and seventh grades may be partly endogenous to the policy itself. We therefore use as a forcing vari-able each student’s EVAAS score as calculated at the end of fifth grade, prior to the point in time when middle school math acceleration could have affected that score.
Our use of RD is consistent with the guide-lines presented by the What Works Clearinghouse
FIGURE 2. Fraction of students accelerated, by income.

90S
(Schochet et al., 2010). First, the invitation to enroll in accelerated mathematics is based on a clear, clean assignment rule. Students with a pre-dicted probability of 70% or greater are invited to take an accelerated math course and those with a probability below 70% are not. Second, the forc-ing variable is ordinal, as it is a probability pre-dicted from a multivariate model, and therefore has numerous possible values on either side of the cutoff. Third, it is utilized by WCPSS only for assigning students to math courses, so that no other factors are confounded with the forcing variable.
For the RD approach to yield valid causal inference, subjects must not be able to manipu-late the forcing variable. Given that the EVAAS probability is a predicted value based on a propri-etary model with multiple inputs, manipulation would be difficult, if not impossible. Support for this supposition comes from the fact that, while WCPSS selected the cutoff criteria of 70%, SAS was responsible for generating the probability values, and the underlying model is not made public. Second, the cutoff scores are a function of prior standardized test performance and students likely have neither sufficient technical knowl-edge of the policy nor sufficient capability to manipulate their own test performance to affect their placement on the continuum of the forcing variable directly on either side of the cutoff. In addition, for the earliest cohorts, students sat for standardized tests prior to the development of the
prediction model or assignment policy and could not have anticipated it being implemented.
To confirm this reasoning, we examine the integrity of the forcing variable graphically. Figure 3 shows a histogram of the forcing vari-able for all students in the main analysis sample, with Panel A showing the full sample and Panel B showing the subsample that the RD analysis will focus on. The threshold value of 70% is marked with a vertical dashed line. We observe no discrete change in the density at the threshold, suggesting no obvious manipulation of the EVAAS scores. Although this figure presents the distribution for students across all grades and school years, tests and figures disaggregated by grade and school year look similarly smooth.
While students are recommended for acceler-ated mathematics if they have a 70% or higher EVAAS probability, not all eligible students enroll in the recommended course, and some ineligible students do manage their way into the accelerated courses regardless. The discrepan-cies between eligibility and take-up mean that the probability of a student enrolling in an accel-erated mathematics course does not jump sharply from 0 to 1 at the 70% threshold. As a result, we will model the relationship between our outcome and the EVAAS probability as a “fuzzy” RD (Imbens & Lemieux, 2008; Murnane & Willett, 2011). We explain our strategy with respect to a generic outcome Y, such as a standardized test score or course grade.
TABLE 2Decreasing Role of Demographics in Math Acceleration Process
(1) (2) (3) (4) (5)
2009 cohort 2010 cohort 2011 cohort 2012 cohort 2013 cohort
EVAAS (earliest) 0.009*** (0.000) 0.011*** (0.000) 0.012*** (0.000) 0.012*** (0.001) 0.014*** (0.001)Low income −0.105*** (0.010) −0.077*** (0.009) −0.077*** (0.010) −0.020*** (0.007) −0.032*** (0.011)Black/Hispanic −0.074*** (0.013) −0.044*** (0.010) −0.040*** (0.010) −0.005 (0.009) −0.017 (0.011)Female 0.003 (0.007) 0.008 (0.007) 0.016*** (0.006) 0.002 (0.005) 0.019*** (0.004)Constant −0.120*** (0.025) −0.256*** (0.024) −0.274*** (0.035) −0.188*** (0.057) −0.386*** (0.051)R2 .41 .58 .60 .65 .62F (income, race) 86.1 41.3 36.7 4.0 5.7N 9,286 9,381 9,267 9,607 9,752
Note. Heteroskedasticity robust standard errors clustered by initial middle school are in parentheses. Each column uses OLS to estimate the rela-tionship between the fraction of middle school years spent in accelerated math coursework and earliest EVAAS score, income, race, and gender. Each regression includes school-by-grade fixed effects. The sample consists of the last middle school year observed for each student in the listed cohort. Below each column are F tests of the joint significance of the income and race coefficients. The p values associated with those F tests are all less than .01. EVAAS = Education Value-Added Assessment System; OLS = ordinary least squares.***p < .01.

91S
We use a two-stage approach using instru-mental variables to estimate the effect of partici-pating in accelerated mathematics on our outcome Y. We first use each student’s position relative to the probability cutoff as an instrument for enrollment in accelerated mathematics. For the first stage, we use local linear regression to fit the following linear probability model for stu-dent i in cohort c, grade g, and initial middle school s:
ACCEL ELIG CEVAAS
CEVAAS ELIG
icgs icgs icgs
icgs
= + +
+ ×( )+
β β β
β
µ
0 1 2
3
ccgs icgs+ε ,
where ACCEL is an indicator for enrollment in an accelerated math course, and ELIG is an indicator for a student’s end of fifth-grade EVAAS score exceeding 70%. CEVAAS is a stu-dent’s EVAAS score recentered around that threshold, such that β2 represents the slope of the relationship between the probability of acceleration and EVAAS to the left of the threshold. The interaction between CEVAAS and ELIG allows that slope to differ to the right of the threshold. We include cohort-by-grade-by-school fixed effects, which improves the precision of our estimates but has little impact on their magnitude, as would be expected given
FIGURE 3. Distribution of EVAAS scores.Note. EVAAS = Education Value-Added Assessment System.
Dougherty et al.
92S
that the threshold is the same throughout the district. The coefficient on the eligibility indica-tor, β1, therefore represents the difference in math acceleration rates between students just above and just below the eligibility threshold in the same cohort, grade, and school.
Because we are still in the process of obtain-ing data on student outcomes, we focus in this article on documenting that first stage itself. In particular, we assess the extent to which the assignment rule was followed. We will show that the assignment rule was followed closely enough that ELIG is a strong enough instrument to allow us later to identify the impact of math accelera-tion on student outcomes. The second-stage model that we will use in future research is given as follows:
Y ACCEL CEVAAS
CEVAAS ELIG
icgs icgs icgs
icgs
cgs
= + +
+ ×( )+
π π π
π
γ
0 1 2
3
++δicgs ,
where Y represents outcomes such as test scores and course grades, and ACCEL is instru-mented by eligibility as in the first-stage equation above. Based on this model, the parameter of interest will thus be π1, the effect of participating in accelerated mathematics for students who were accelerated because of the assignment rule. This estimate represents a local average treatment effect for “compliers,” those students near the threshold who took accelerated math coursework only because of the cutoff rule and who would not have enrolled had the rule not existed (Angrist, Imbens, & Rubin, 1996). These students would not have chosen themselves or been chosen by their schools to enroll in accelerated coursework but are induced to do so by the new eligibility rule. Our identification strategy thus relies on the fact that there are two nearly identical subgroups of students on either side of the threshold who would not have taken accelerated math course-work in the absence of the new policy. The policy thus quasi-randomly induces one subgroup to enroll but leaves the other untouched. While there would be empirical advantages to a true random-ized trial, in this context randomization would simply not be politically palatable for the dis-trict and therefore not feasible to implement. Therefore, the RD design provides a particularly attractive alternative.
First-Stage Results
Before turning to the first-stage results, we note that our primary specification here uses local linear regression, a triangular kernel, a bandwidth of 15 EVAAS points, and clusters standard errors by initial middle school. Although not shown in detail here, the results presented below are robust to alternative weighting such as rectangular kernels (Imbens & Lemieux, 2008), a variety of bandwidths, including those suggested by other optimal bandwidth selection methods (Calonico, Cattaneo, & Titiunik, 2014; Imbens & Kalyanaraman, 2012; Ludwig & Miller, 2007), and inclusion of covariates. That inclusion of covariates does not affect our central estimates is unsurprising, given that the inability to manipu-late the EVAAS score theoretically suggests that students’ demographic characteristics should be balanced across the threshold. We confirm this in Table 3, which tests for discontinuities in demo-graphic characteristics at the threshold by run-ning our first-stage specification with various covariates as outcomes. All the available covari-ates appear balanced across the threshold, sug-gesting that our treatment and control groups look quite similar in terms of race, income, spe-cial education and Limited English Proficient (LEP) status, age, and gender.
We first show the graphical representation of the first-stage relationship between students’ EVAAS scores and the probability of enrolling in accelerated math coursework. Figure 4 shows this relationship by grade and school year, with the top row representing the 2010–2011 school year during which the new assignment policy was first implemented. The largely untreated 2009 cohort is thus represented in the upper right box, as they were eighth graders in the 2010–2011 school year and show little evidence of a discontinuity in acceleration rates near the threshold.
The 2010 cohort, who were seventh graders in 2010–2011 and eighth graders in 2011–2012, shows clearer discontinuities, with students just above the threshold noticeably more likely to be accelerated in both seventh and eighth grades com-pared with those just below the threshold. The sub-sequent 2011–2013 cohorts, all of whom started middle school under the new assignment rule, show substantial discontinuities in acceleration

93S
rates as well. These discontinuities seem particu-larly striking in seventh grade, although the most recent 2013 cohort shows a substantial discontinu-ity in sixth grade, the 1 year for which we can cur-rently observe them. Overall, these graphs suggest that the new assignment rule has been more and more faithfully implemented over time and will serve as a strong source of exogenous variation in the probability of a given student being accelerated in math.
Figure 5 provides an alternative way of mea-suring the strength of the first stage. Here, we define the treatment as the fraction of each stu-dent’s observed middle school years spent in accelerated math coursework. We then pool the 2010–2013 cohorts, which yield a much less noisy figure than those separated by grade and school year. The discontinuity here is striking. Students just below the eligibility threshold spend less than 40% of their middle school years in accelerated coursework, whereas those just above the threshold spend about 55% of their time in such coursework, on average.
We confirm this graphical intuition in Table 4 by fitting the first-stage regressions described previously. The top row uses as an outcome the fraction of each student’s observed middle school years spent in accelerated math coursework. The remaining rows use as an outcome an indicator for being accelerated in a given grade and year. The first column represents the untreated 2009 cohort, while the second through fifth columns represent the treated 2010–2013 cohorts. The final column pools all four treated cohorts.
As expected, there is no evidence that the eli-gibility threshold affected math acceleration rates in the 2009 cohort’s first 2 years, prior to the policy’s introduction. In eighth grade, there is small and only marginally significant evidence of an impact for that cohort in the policy’s first year. For the 2010 cohort, which was in seventh grade when the new policy began, eligibility increases the fraction of middle school years spent in accelerated math by 7.3 percentage points. This fraction rises monotonically across subsequent cohorts, so that eligibility increases the fraction of years accelerated by 28.3 percent-age points for the 2013 cohort. Pooling all four treated cohorts leads to an average estimated first-stage effect of 13.4 percentage points. For the pooled sample, the F statistic for the eligibil-ity coefficient is nearly 50, well beyond the threshold of 10 suggested by Bound, Jaeger, and Baker (1995) for a strong instrument. The second through fourth rows show that much of the strength of this instrument comes from particu-larly strong impacts on seventh grade accelera-tion decisions, although smaller effects in sixth and eighth grade are still highly statistically significant.
Table 5 explores potential channels through which acceleration might affect later outcomes by estimating how acceleration affects the peers and teachers to which students are exposed in their pri-mary math classes. Each coefficient shows the estimated impact of current acceleration status, where acceleration has been instrumented with eligibility. Relative to non-accelerated students,
TABLE 3McCrary and Covariate Balance Test
(1) (2) (3) (4) (5) (6) (7)
Count Black/Hispanic Low income Special education LEPAge on
September 1 Female
Eligible −2.573 (2.600) 0.000 (0.025) −0.034 (0.028) −0.032 (0.025) 0.020 (0.018) 0.017 (0.031) −0.002 (0.027)µ 52.52 0.70 0.65 0.22 0.21 13.30 0.53N 261 16,010 16,010 16,010 16,010 16,010 16,010
Note. Heteroskedasticity robust standard errors clustered by initial middle school are in parentheses. Each coefficient is the reduced form estimate of the relationship between eligibility for acceleration and the listed covariate. The coefficients shown are generated by local linear regression using a triangular kernel of bandwidth 15, including cohort-by-school-by-grade fixed effects. The first column uses as an outcome the number of observations in each year, grade, and 1-point-wide EVAAS bin. Also listed is the mean of the covariate for students just below the threshold (with EVAAS between 67 and 70). The sample includes the 2012–2013 cohorts. Potential manipulation of the regression discon-tinuity forcing variable assessed via methods advanced by McCrary (2008). EVAAS = Education Value-Added Assessment System; LEP = Limited English Proficient.

94S
those accelerated because of the assignment rule end up with peers who are 1.1 standard deviations higher in math skill as measured by their fifth-grade math scores. Interestingly, these two sets of classes have similar standard deviations in such math skill, so that acceleration does not change the heterogeneity of skill to which students are exposed. Accelerated students end up in classes that are 4.2 students larger. They have peers who are more than 20 percentage points less likely to be low income, Black, or Hispanic, although gen-der composition is unchanged. There is little evi-dence that acceleration affects the quality of
students’ math teachers on average, although we do see suggestive evidence that accelerated stu-dents are less likely to be assigned teachers with value-added measures 1 standard deviation below the mean. In total, these results suggest that accel-eration exposes students not only to higher-skilled peers and possibly fewer low-quality teachers, which might have positive effects, but also to larger class sizes, which might have negative effects. Based on these results, it is worth noting that because of the structure of the policy, students on different sides of the EVAAS threshold had mathematics classroom experiences that differ not
FIGURE 4. Placement in accelerated math.Note. EVAAS = Education Value-Added Assessment System.

95S
only in terms of curriculum and course content but also in terms of the composition of their class-room. In this respect, the treatment that we are assessing with our RD design is multidimensional in nature and not necessarily the effect of a more advanced mathematics curriculum exclusively.
Finally, Table 6 replicates the first row of Table 4, interacting all right-hand side variables with income, race, or gender indicators to study whether the district was enforcing the EVAAS threshold rule differently for different groups of students. The first and second panels suggest that the assignment rule is applied similarly across students of different income levels but slightly more strictly to Black and Hispanic students than to White and Asian students. Consistent with Table 2, we see small differences in acceleration rates by income and race conditional on EVAAS scores.5 The third panel suggests that the assign-ment rule is applied somewhat more strictly to male students than to female students, with the difference between the two discontinuity coeffi-cients being marginally significant. Again con-sistent with Table 2, the female coefficient suggests that, conditional on EVAAS score, female students are no more likely to be acceler-ated than male students. Overall, these results suggest that the assignment rule is being applied fairly similarly across student subgroups.
Conclusion
Findings from our initial investigation of the WCPSS math acceleration policy suggest that overall participation in accelerated mathematics courses has increased as a result, and that the assignment policy has been applied equally across student subgroups defined by gender and by race/ethnicity. In addition to increasing over-all participation in accelerated mathematics, this assignment strategy has also resulted in girls being represented in accelerated math courses in proportion to their enrollment in the district. In contrast, however, while enrollment rates for Black students and Hispanic students also improved substantially over their pre-policy levels, neither group of students has achieved representation in accelerated courses in a way that is proportional to their overall share of dis-trict enrollment. This last detail underscores the fact that policies that base assignment solely on demonstrated ability may not be sufficient to ameliorate long-standing imbalances in access to important academic steppingstones. Nevertheless, our analyses do reveal that poli-cies such as these can serve to diminish the extent to which factors such as income and race relate to course placement, at least conditional on student achievement.
FIGURE 5. Fraction of years in accelerated math.Note. EVAAS = Education Value-Added Assessment System.

96S
Yet to be known is whether the rule-based assignment policy in Wake County has a mean-ingful impact on student-level measures of school engagement and academic performance. In subsequent analyses, we will utilize course-taking, course grades, standardized test scores, attendance, discipline, and college going as pol-icy-relevant outcomes of interest in both the short and long term. Earlier work in Chicago that provided algebra instruction for all ninth-grade students in the district suggests that accelerating students into algebra may result in mixed short-term academic benefits as measured by test scores (Allensworth et al., 2009; Nomi & Allensworth, 2009) but that there may be a
long-term payoff in the way of college going for students affected by this policy (Cortes et al., 2015). The continued work is especially impor-tant, given that clear differences exist between the educational contexts of Chicago and Wake County and the potential usefulness of these out-come data for education policy in a variety of contexts. Our ongoing access to and use of the longitudinal data from WCPSS will add to the existing literature on math acceleration and alge-bra access policies, while providing relevant feedback on the policy’s impact on student out-comes in its local context.
It is important to emphasize that without our research partnership with WCPSS, there would
TABLE 4First-Stage Estimates of Exposure to Accelerated Math Coursework
(1) (2) (3) (4) (5) (6)
2009 cohort 2010 cohort 2011 cohort 2012 cohort 2013 cohort2010–2013
cohorts
Fraction of years accelerated
0.012 (0.022)
0.073*** (0.024)
0.092*** (0.029)
0.186*** (0.034)
0.283*** (0.072)
0.134*** (0.019)
µ 0.21 0.20 0.25 0.55 0.37 0.33 F 0.3 9.1 10.2 29.6 15.5 48.9 N 4,736 4,910 4,956 4,010 2,134 16,010Accelerated in
Grade 60.016
(0.033)0.004
(0.023)0.012
(0.025)0.158*** (0.053)
0.283*** (0.072)
0.125*** (0.027)
µ 0.31 0.28 0.26 0.59 0.37 0.39 F 0.2 0.0 0.2 9.0 15.5 21.2 N 1,554 1,679 1,763 2,098 2,134 7,674Accelerated in
Grade 7−0.005 (0.023)
0.189*** (0.069)
0.276*** (0.065)
0.291*** (0.050)
0.252*** (0.039)
µ 0.06 0.08 0.24 0.42 0.25 F 0.0 7.6 17.7 34.3 41.6 N 1,594 1,669 1,676 1,912 5,257Accelerated in
Grade 80.049* (0.028)
0.189*** (0.058)
0.100* (0.055)
0.147*** (0.035)
µ 0.06 0.11 0.16 0.14 F 3.2 10.8 3.2 18.0 N 1,588 1,562 1,517 3,079
Note. Heteroskedasticity robust standard errors clustered by initial middle school are in parentheses. In the first row, first-stage estimates show the impact of eligibility for acceleration on the fraction of middle school years spent in accelerated math coursework. The remaining rows show the impact of eligibility for acceleration on current acceleration status, by grade. The coefficients shown are generated by local linear regression using a triangular kernel of bandwidth 15, including cohort-by-school-by-grade fixed effects. Eligibility is measured by each student’s earliest EVAAS score. Below each coefficient is the proportion of students just below the threshold enrolled in accelerated coursework, as well as the F statistic associated with the excluded instrument. EVAAS = Education Value-Added Assessment System.*p < .10. ***p < .01.

97S
be no prospect for establishing or continuing this line of investigation. Furthermore, the district’s continued maintenance of its longitudinal data systems as well as its commitment to using these data to measure ongoing impact and to improve equity of both practice and outcomes make this work possible. Thus, the WCPSS policy and this research partnership through the SDP serve as a compelling example of how cooperation among researchers and education agencies can leverage existing data to answer important questions about the impact of innovative policies. Our aim is that collaborative efforts such as these will yield fruit both for informing the broader research commu-nity as well as organization-level decision mak-ing in educational agencies that are often data rich but comparatively limited in terms of ana-lytic capacity.
This issue of EEPA is a signal that the educa-tion policy research community strives to build stronger bridges to and partnerships with educa-tion agencies to apply rigorous analytic tools to policy questions of the highest importance. We believe that this is the right direction for the field. Yet, our own experience has reminded us collec-tively to remain cognizant of the potential risks and controversies that can be generated by edu-cation policies and efforts to assess their impact,
such as our efforts with WCPSS. For example, though the incentive structure within the aca-demic community clearly favors the presentation of work in progress, the risks associated with the potential misuse and misunderstanding of early findings is borne disproportionately by the part-nering educational agency. If policy innovation, research partnerships, and the honest evaluation of educational policies using experimental and quasi-experimental methods are to be furthered, the utmost care must be taken to honor the inter-ests and working realities of the students, com-munity members, educators, and agency leaders involved.
Finally, the WCPSS middle-grade mathemat-ics acceleration policy is emblematic of policies that are established in ways that allow for high-quality and causally identified impact analyses, and our subsequent analyses will seek to under-stand finer-grained variation in the implementa-tion of the policy across school contexts and the impacts of this policy on student outcomes in both the short and long term. If our investiga-tion suggests this as a broadly feasible and promising strategy for improving students’ access to rigorous and appropriate coursework in mathematics, the WCPSS course-assignment strategy will serve as an example for other
TABLE 5Peer and Teacher Characteristics in Primary Math Classroom
(1) (2) (3) (4) (5) (6)
(A) Peers M math skill SD math skill Class sizeFraction female
Fraction low income
Fraction Black/Hispanic
Accelerated 1.079*** (0.088)
−0.016 (0.037)
4.154*** (1.097)
0.007 (0.031)
−0.241*** (0.026)
−0.225*** (0.031)
N 16,010 16,010 16,010 16,010 16,010 16,010
(B) Teachers VAM estimate Low VAMYears of
experienceNovice teacher
Female teacher
Missing Teacher
Accelerated 0.284 (0.289)
−0.213** (0.100)
0.138 (1.223)
0.014 (0.040)
0.142 (0.086)
−0.038 (0.056)
N 14,110 14,110 12,649 12,649 12,713 16,010
Note. Heteroskedasticity robust standard errors clustered by initial middle school are in parentheses. Each panel shows instru-mental variable estimates of the impact of acceleration, where acceleration is instrumented with eligibility. The coefficients shown are by local linear regression using a triangular kernel of bandwidth 15, including cohort-by-school-by-grade fixed effects. In Panel B, low VAM is defined as having an estimated VAM more than 1 standard deviation below average, and the final column’s outcome is an indicator for missing information about a student’s primary math teacher. The sample includes the 2010–2013 cohorts. VAM = value-added measure.**p < .05. ***p < .01.

98S
districts considering similar policy goals and actions. WCPSS’s use of the EVAAS measure, specifically, should not serve as a limiting factor for other districts considering ways to provide an objective access to school resources or curricula. In addition to understanding impacts ultimately, research partnerships also serve as a potential opportunity for constructing measures analogous to the EVAAS-predicted probability, or for find-ing ways to identify other approaches for
implementing district- or school-level policies, so that their impact on student outcomes can be rigorously understood.
Authors’ Note
The views in this article are those of the authors and do not reflect the views of the Foundation, the Wake County Public Schools, or the Center for Education Policy Research. All errors, omissions, and conclu-sions are those of the authors.
TABLE 6First-Stage Impacts, by Gender, Income, and Race
(1) (2) (3) (4) (5)
2010–2013 cohorts 2010 cohort 2011 cohort 2012 cohort 2013 cohort
(A) Income Nonpoor ×
Eligible0.140*** (0.023)
0.124** (0.049)
0.049 (0.039) 0.185*** (0.046)
0.265*** (0.087)
Poor × Eligible 0.129*** (0.026)
0.042* (0.024)
0.113*** (0.035)
0.187*** (0.049)
0.285*** (0.090)
Poor −0.030 (0.025)
−0.001 (0.027)
−0.044 (0.031)
−0.040 (0.058)
−0.089 (0.080)
p .75 .14 .18 .97 .86 N 16,010 4,910 4,956 4,010 2,134(B) Race White/Asian ×
Eligible0.097*** (0.025)
0.092** (0.035)
0.011 (0.046) 0.099** (0.045)
0.264*** (0.078)
Black/Hispanic × Eligible
0.152*** (0.024)
0.066** (0.031)
0.124*** (0.033)
0.236*** (0.047)
0.286*** (0.094)
Black/Hispanic −0.027 (0.026)
−0.012 (0.022)
−0.045 (0.046)
−0.040 (0.062)
−0.085 (0.070)
p .10 .57 .04 .05 .85 N 16,010 4,910 4,956 4,010 2,134(C) Gender Male × Eligible 0.160***
(0.018)0.087*** (0.031)
0.131*** (0.037)
0.203*** (0.052)
0.314*** (0.068)
Female × Eligible
0.111*** (0.028)
0.063* (0.032)
0.051 (0.036)
0.171*** (0.049)
0.259*** (0.098)
Female 0.035 (0.023)
0.004 (0.029)
0.037 (0.027)
0.017 (0.047)
0.128* (0.074)
p .08 .56 .08 .67 .58 N 16,010 4,910 4,956 4,010 2,134
Note. Heteroskedasticity robust standard errors clustered by initial middle school are in parentheses. First-stage estimates show the impact of eligibility for acceleration on the fraction of middle school years spent in accelerated math coursework. The coef-ficients shown are generated by local linear regression using a triangular kernel of bandwidth 15, including cohort-by-school-by-grade fixed effects. These replicate the regressions from the top row of Table 4, interacting the independent variables with indicators for income, race, or gender. Also shown is a p value from F test of the equality of the two interaction coefficients shown. The sample includes the 2010–2013 cohorts.*p < .10. **p < .05. ***p < .01.
Middle School Math Acceleration and Equitable Access to 8th Grade Algebra
99S
Acknowledgments
We are grateful to many individuals who have helped make this work possible. We thank the Center for Education Policy Research at Harvard University and the Strategic Data Project, especially Patty Diaz-Andrade, Tim Brennan, Zubair Butt, Jon Fullerton, Will Marinell, and Jared Silver. We also thank employ-ees of the Wake County Public School System, par-ticularly Kevin Gilleland, Bradley McMillen, Cathy Moore, Ruth Steidinger, and Sonya Stephens, for insights about the policy, schools, and data. We thank the SAS Institute, particularly Jill Leandro, Caroline McCullen, and John White, for providing archived datasets.
Declaration of Conflicting Interests
The author(s) declared the following potential con-flicts of interest with respect to the research, author-ship, and/or publication of this article:
Funding
The author(s) disclosed receipt of the following finan-cial support for the research, authorship, and/or publi-cation of this article: This work was made possible by The Bill & Melinda Gates Foundation through its generous funding of the Strategic Data Project.
Notes
1. A “double dose” of algebra means that a student takes two periods of algebra per day.
2. The Algebra End-of-Course (EOC) exam is the North Carolina state-standardized test that all students must complete at the end of Algebra I and is required of students who have taken the course. The exam is counted as part of the final course grade for each student.
3. Level III represents a passing score on the North Carolina Algebra I EOC exam.
4. For more information about the Strategic Data Project, see www.strategicdataproject.org.
5. These coefficients are less precisely estimated than their equivalent coefficients in Table 2 because this table included the entire sample, whereas Table 4 includes only students near the eligibility threshold.
References
Adelman, C. (2006). The toolbox revisited: Paths to degree completion from high school through college. Washington, DC: U.S. Department of Education.
Allensworth, E., Nomi, T., Montgomery, N., & Lee, V. E. (2009). College preparatory curriculum for all: Academic consequences of requiring Algebra and
English I for ninth graders in Chicago. Educational Evaluation and Policy Analysis, 31, 367–391.
Angrist, J. D., Imbens, G. W., & Rubin, D. B. (1996). Identification of causal effects using instrumen-tal variables. Journal of the American Statistical Association, 91, 444–455.
Bitter, C., & O’Day, J. (2010). Raising expectations for mathematics instruction in California: Algebra and beyond (Policy and Practice Brief). California Collaborative on District Reform. Retrieved from http://www.cacollaborative.org/sites/default/files/CA_Collaborative_8th_Grade_Algebra.pdf
Bound, J., Jaeger, D. A., & Baker, R. M. (1995). Problems with instrumental variables estimation when the correlation between the instruments and the endogenous explanatory variable is weak. Journal of the American Statistical Association, 90, 443–450.
Brown, J., Schiller, K., Roey, S., Perkins, R., Schmidt, W., & Houang, R. (2013). Algebra and geom-etry curricula (NCES 2013-451). Washington, DC: National Center for Education Statistics, Institute of Education Sciences, U.S. Department of Education.
Burris, C., Heubert, J. P., & Levin, H. M. (2006). Accelerating mathematics achievement using heterogeneous grouping. American Educational Research Journal, 43, 105–136.
Calonico, S., Cattaneo, M. D., & Titiunik, R. (2014). Robust nonparametric confidence intervals for regression-discontinuity designs. Econometrica, 82, 2295–2326.
Chazan, D. (2008). The shifting landscape of school algebra in the United States. In C. E. Greenes & R. Rubenstein (Eds.), Algebra and algebraic think-ing in school mathematics: Seventieth yearbook (pp. 19–33). Reston, VA: National Council of Teachers of Mathematics.
Clotfelter, C., Ladd, H., & Vigdor, J. (2012a). The aftermath of accelerating algebra: Evidence from a district policy initiative (National Bureau of Economic Research, Working Paper 18161). Retrieved from http://www.nber.org/papers/w18161
Clotfelter, C., Ladd, H., & Vigdor, J. (2012b). Algebra for 8th graders: Evidence on its effects from 10 North Carolina districts (National Bureau of Economic Research, Working Paper 18649). Retrieved from http://www.nber.org/papers/w18649
The College Board. (2000). Equity 2000: A systemic education reform model—A summary report, 1990-2000. Washington, DC. Retrieved from http://www.collegeboard.com/prod_downloads/about/association/equity/EquityHistoricalReport.pdf

Dougherty et al.
100S
Cortes, K., Goodman, J., & Nomi, T. (2015). Intensive math instruction and educational attainment: Long-run impacts of double-dose algebra. Journal of Human Resources, 50, 108–158.
Domina, T. (2014). The link between middle school mathematics course placement and achievement. Child Development, 85, 1948–1964.
Education Commission of the States. (1998). Equity 2000. Denver, CO: Retrieved from http://www.ecs.org/html/Document.asp?chouseid=1510
Everson, H. T., & Dunham, M. D. (1996). Signs of success—Equity 2000[R]: Preliminary evidence of effectiveness. New York, NY: The College Board.
Gamoran, A., & Hannigan, E. (2000). Algebra for all? Benefits of college-preparatory mathematics for students with diverse abilities in early second-ary school. Educational Evaluation and Policy Analysis, 22, 241–254.
Gardner, D. (1983). A nation at risk: The impera-tive for educational reform—Report of the National Commission on Excellence in Education. Washington, DC: U.S. Government Printing Office.
Goodman, J. (2012). The labor of division: Returns to compulsory math coursework (Harvard Kennedy School Faculty Research Working Paper Series, RWP12–RW032). Retrieved from http://scholar.harvard.edu/files/joshuagoodman/files/rwp12-032_goodman.pdf
Ham, S., & Walker, E. (1999). Getting to the right algebra: The equity 2000 initiative in Milwaukee public schools. Manpower Demonstration and Research Corporation. Retrieved from www.mdrc.org/publications
Hess, F. M., & Fullerton, J. (2008). Balanced score-cards and management data. In M. Kanstoroom & E. C. Osberg (Eds.), A byte at the apple: Rethinking education data for the post-NCLB era (pp. 160–185). Washington, DC: Thomas B. Fordham Institute Press.
Hui, T. K. (2011, August 13). Wake board addresses teacher role in algebra enrollment. The News & Observer. Retrieved from http://www.newsob server.com/2011/08/13/1409485/ board-addresses-algebra-enrollment.html#disqus_thread
Imbens, G., & Kalyanaraman, K. (2012). Optimal bandwidth choice for the regression discontinuity estimator. The Review of Economic Studies, 79, 933–959.
Imbens, G., & Lemieux, T. (2008). Regression dis-continuity designs: A guide to practice. Journal of Econometrics, 142, 615–635.
Loveless, T. (2008). The misplaced math student: Lost in eighth grade Algebra. Washington, DC: Brown Center on Education Policy, Brookings Institution.
Ludwig, J., & Miller, D. L. (2007). Does Head Start improve children’s life chances? Evidence from a regression discontinuity design. The Quarterly Journal of Economics, 122, 159–208.
Ma, X. (2005). Early acceleration of students in mathematics: Does it promote growth and stabil-ity of growth in achievement across mathematical areas? Contemporary Educational Psychology, 30, 439–460.
McCrary, J. R. (2008). Manipulation of the running variable in the regression discontinuity design: A density test. Journal of Econometrics, 142, 648–714.
Murnane, R. J., & Willett, J. B. (2011). Methods mat-ter: Improving causal inference in education and social science research. New York, NY: Oxford University Press.
National Council for Teachers of Mathematics. (1989). Curriculum and evaluation standards for school mathematics. Reston, VA: Author.
National Mathematics Advisory Panel. (2008). Foundations for success: The final report of the National Mathematics Advisory Panel. Washington, DC: U.S. Department of Education.
Nomi, T. (2012). The unintended consequences of an algebra-for-all policy on high-skill students: Effects on instructional organization and students’ academic outcomes. Educational Evaluation and Policy Analysis, 34, 489–505.
Nomi, T., & Allensworth, E. (2009). Double dose algebra as an alternative strategy to remediation: Effects on students’ academic outcomes. Journal of Research on Educational Effectiveness, 2, 111–148.
Nomi, T., & Allensworth, E. (2013). Sorting and sup-porting: Why double-dose algebra leads to better test scores but more course failures. American Educational Research Journal, 50, 756–788.
Rickles, J. H. (2013). Examining heterogeneity in the effect of taking algebra in eighth grade. The Journal of Educational Research, 106, 251–268.
Schneider, M. (2009). Math in American high schools: The delusion of rigor. Washington, DC: American Enterprise Institute for Public Policy Research, AEI Outlook Series. Retrieved from http://www.aei.org/article/education/k-12/math-in-american-high-schools/
Schochet, P., Cook, T., Deke, J., Imbens, G., Lockwood, J. R., Porter, J., & Smith, J. (2010). Standards for regression discontinuity designs. Retrieved from http://ies.ed.gov/ncee/wwc/pdf/wwc_rd.pdf
Silver, E. (1995). Rethinking “algebra for all.” Educational Leadership, 52(6), 30–33.
Stein, M. K., Kaufman, J., Sherman, M., & Hillen, A. (2011). Algebra: A challenge at the crossroads of policy and practice. Review of Educational Research, 81, 453–492.

Middle School Math Acceleration and Equitable Access to 8th Grade Algebra
101S
Stone, C. (1998). Leveling the playing field: An urban school system examines equity in access to math-ematics curriculum. Urban Review, 30, 295–307.
Walston, J., & McCarroll, J. C. (2010). Eighth-grade algebra: Findings from the eighth-grade round of the Early Childhood Longitudinal Study, Kindergarten Class of 1998-99 (ECLS-K, Statistics in Brief, NCES 2010-016). Washington, DC: National Center for Education Statistics.
Authors
SHAUN M. DOUGHERTY is an assistant professor of education policy and leadership at the University of Connecticut Neag School of Education. His research focuses on applied quantitative analysis of education policies and programs, equity, and career and techni-cal education.
JOSHUA S. GOODMAN is an assistant professor of public policy at Harvard University’s Kennedy School of Government. His research focuses on the long-run impact of math curriculum interventions, as well as issues sur-rounding the quality of postsecondary institutions.
DARRYL V. HILL is director of performance strategy and analytics for the Wake County Public School System. His research focuses on access and equity, per-formance management, and using rigorous methods to support causal inference in program evaluation.
ERICA G. LITKE is a doctoral candidate at the Harvard Graduate School of Education. Her research focuses on issues of teaching quality and equity in sec-ondary mathematics, specifically teaching and policy in urban districts.
LINDSAY C. PAGE is an assistant professor of research methodology and a research scientist at the Learning Research and Development Center at the University of Pittsburgh. Her research focuses on quantitative meth-ods and their application to questions regarding the effectiveness of educational policies and programs across the preschool to postsecondary spectrum.
Manuscript received October 1, 2013Revision received June 14, 2014
Accepted January 23, 2015