middle˜income jobs - portland business alliance to the value of jobs comparator regions. the report...
TRANSCRIPT

MIDDLE-INCOME JOBS
MIDDLE-INCOME JOBSin the Portland-metro economy2015
IntroductionDuring the last three decades, Portland-metro, like most regions of the United States, has experienced a decline in middle-income jobs. Driven largely by global market changes and technological advancements, jobs at the top and bottom ends of the labor market have grown, while middle-wage jobs, as a share of the overall workforce, have declined. The result is increased job and income polarization, a trend many policy makers are trying to address, here in Portland-metro and across the United States.
This is the first report on middle-income jobs by the Value of Jobs Coalition. Since 2010, the coalition has attempted to build a better understanding of the Portland-metro economy by producing data-based reports on regional economic trends and baseline economic factors. The goal is to show the importance of a strong private sector, supported by a healthy business community, to the region’s overall economic vitality. A vibrant economy with good jobs provides the funding for important public services like education, social safety nets, parks, roads and transit.
Building on previous studies undertaken by the coalition, this report seeks to illuminate what has happened to middle-income jobs over time, relative to the Value of Jobs comparator regions. The report also looks at where middle-income jobs cluster in the region, and where people who hold those jobs live.
Highlights of the findings include:
� Portland-metro, like most of the nation, has seen low- and high-income jobs account for increasingly larger shares of the region’s overall employment base, while middle-income jobs, as a share of the region’s total employment, have dropped from 69 percent in 1980 to 57 percent in 2013.
� During that same period, wages for both middle- and low-income jobs have been stagnant. Portland-metro’s income inequality index is lower than most of the comparator regions; however, adjusting for the region’s relatively higher cost of living, Portland-metro’s middle wages provide families with less buying power than those in most comparator regions.
� Middle-income jobs are disproportionately concentrated in a few key geographic areas: in traditional industrial areas along the Columbia and Willamette rivers; near medical facilities; adjacent to Highways 26 and 217 where tech companies have developed; and in Vancouver, Washington.
� Affordability is an issue throughout Portland-metro, but problems are particularly acute within the city of Portland. Middle-income families are increasingly priced out of the center of the region - the heart of the city - clustering instead on the eastern end of Multnomah County; the western reaches of Washington County; and in Vancouver, Washington.
The data and analysis of this report were compiled by ECONorthwest for the Value of Jobs Coalition. Portland-metro in this report refers to the Metropolitan Statistical Area of Portland-Vancouver-Hillsboro, OR-WA MSA.

1
What the data showThis report focuses on five aspects of middle-income employment in the Portland-Metropolitan Statistical Area (called Portland-metro in this report), including:
� Share of total employment � Wages � Wage group � Industries � Locations
The report also compares Portland-metro’s employment changes from 1980 to 2013 (annual averages) to changes in the following geographic areas:
� “Peer” regions defined as Cincinnati, Sacramento, Salt Lake City and St. Louis
� “Aspirational” regions defined as Seattle, Denver and Minneapolis
These comparator regions have been used in past Value of Jobs reports to provide national context for the Portland-metro’s economy. In 2014, Salt Lake City was added as a peer region to align with analysis done by Greater Portland Inc.
This report initiates a regional dialogue about an indisputable reality that is affecting Portland-metro families: declining availability of middle-income jobs and wage polarization, along with a region that is becoming increasingly unaffordable for middle-income workers. While many factors contributing to this trend are beyond the region’s control, some can be impacted by the region’s leaders. The goal,
therefore, is to identify proactive steps that can be taken to make Portland-metro a national leader where middle-income families thrive.
A global trend
Global market changes and technology have had major impacts on labor markets across the U.S. and in Portland-metro. As the markets have evolved to be global in nature, companies in the U.S. and abroad have moved lower value-added production overseas, which has impacted manufacturing employment in the nation as a whole. At the same time, foreign markets have been identified as growth opportunities for many industries, benefiting workers at home. As a trade-based economy, Portland-metro has benefited from the development of global markets, as earlier Value of Jobs reports have shown.
Technology has affected manufacturing, with robotics and automation replacing humans on production lines. Technology’s impact has also spread into office and service work as software becomes an inexpensive substitute for routine labor. ATMs have replaced bank tellers; tax software has displaced accountants; online shopping has reduced the demand for retail clerks; and even grocery stores, restaurants and transportation providers are replacing human labor with automation. It is very likely that more and more of the remaining routine jobs will be replaced by technology over time.
BY THE NUMBERS:$38,650. Median Portland-metro wage.
69. The percentage share of middle-wage jobs in Portland-metro’s overall employment base in 1980.
57. The percentage share of middle-wage jobs in Portland-metro’s overall employment base in 2013.
620,580. Number of middle-income wage earners in Portland-metro in 2013.
185, 103, 47, 161. Percentage growth of high-, upper-middle-, lower-middle- and low-wage jobs respectively from 1980 to 2013.
$70,000. Household income needed by a family to purchase the median home in Portland-metro.
2
The consequence, in Portland-metro and across the U.S., is job polarization. Jobs are growing at the high-skill end including those workers who create, implement and manage the technological advancements. These jobs typically require a four-year college degree or better. At the low end of the wage scale are jobs that require little if any post-secondary training and are not easily automated: facility maintenance workers, food preparers and others. It is the jobs in the middle — the jobs that have traditionally been a path out of poverty for lower-wage workers — that are being automated, moved or replaced with jobs that require new and different skills.
The impact to Portland-metro of these global trends is a mixed bag. Like most of the country, Portland-metro has seen some manufacturing jobs move overseas. On the other hand, Portland-metro has done a better job of holding on to traditional manufacturing than most
regions (see the Value of Jobs Manufacturing Report, published in 2012). Technology also has had an impact in Portland-metro, with automation and efficiency resulting in leaner manufacturing processes and fewer jobs. Yet, Portland-metro is a center for technology development, and a large amount of both hardware and software development happens here, leading to job creation. Likewise, Portland-metro’s economy is fundamentally driven by international trade, which benefits from global market development. Indeed, some 490,000 Oregon jobs are tied to trade either directly or indirectly, according to the Value of Jobs 2013 International Trade report, and growth in trade results in more jobs for Oregonians.
The question facing policy makers is how they can leverage the positive impacts of global market evolution and technology to position Portland-metro, and the region’s families, for
Figure 1: Median income by occupation and wage group, Portland 2013
$17.2
$13.3
$16.0 $16.3 $16.5
$0
$10,000
$20,000
$30,000
$40,000
$50,000
$60,000
$70,000
$80,000
$90,000
$100,000 Portland
High wage Upper middle Lower middle Low wage
Construction, Inst/Repair, Teachers, Arts, Protective Services, Comm. Services
Mgmt, Legal, Health Practitioners, Comp/Math, Arc/Eng, Scientists, Bus/Fin
Admin, Production, Health Support,
Transportation, Sales Bldg. Maint., Personal Care,
Farming, Food Prep.
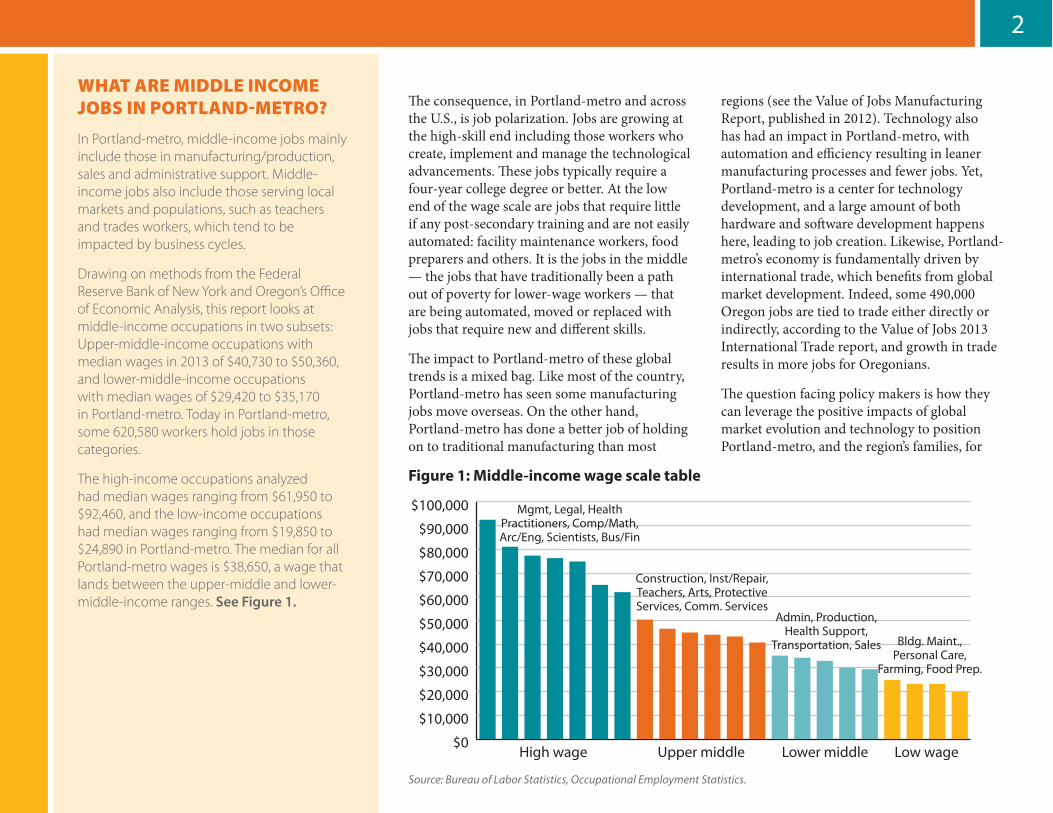
Figure 1: Middle-income wage scale table
Source: Bureau of Labor Statistics, Occupational Employment Statistics.
WHAT ARE MIDDLE INCOME JOBS IN PORTLAND-METRO?
In Portland-metro, middle-income jobs mainly include those in manufacturing/production, sales and administrative support. Middle-income jobs also include those serving local markets and populations, such as teachers and trades workers, which tend to be impacted by business cycles.
Drawing on methods from the Federal Reserve Bank of New York and Oregon’s Office of Economic Analysis, this report looks at middle-income occupations in two subsets: Upper-middle-income occupations with median wages in 2013 of $40,730 to $50,360, and lower-middle-income occupations with median wages of $29,420 to $35,170 in Portland-metro. Today in Portland-metro, some 620,580 workers hold jobs in those categories.
The high-income occupations analyzed had median wages ranging from $61,950 to $92,460, and the low-income occupations had median wages ranging from $19,850 to $24,890 in Portland-metro. The median for all Portland-metro wages is $38,650, a wage that lands between the upper-middle and lower-middle-income ranges. See Figure 1.
3
prosperity in the decades ahead. Leaders should consider what factors are important to make sure Portland-metro is ready to accommodate change, including educational attainment, land availability and transportation infrastructure.
Wage gaps
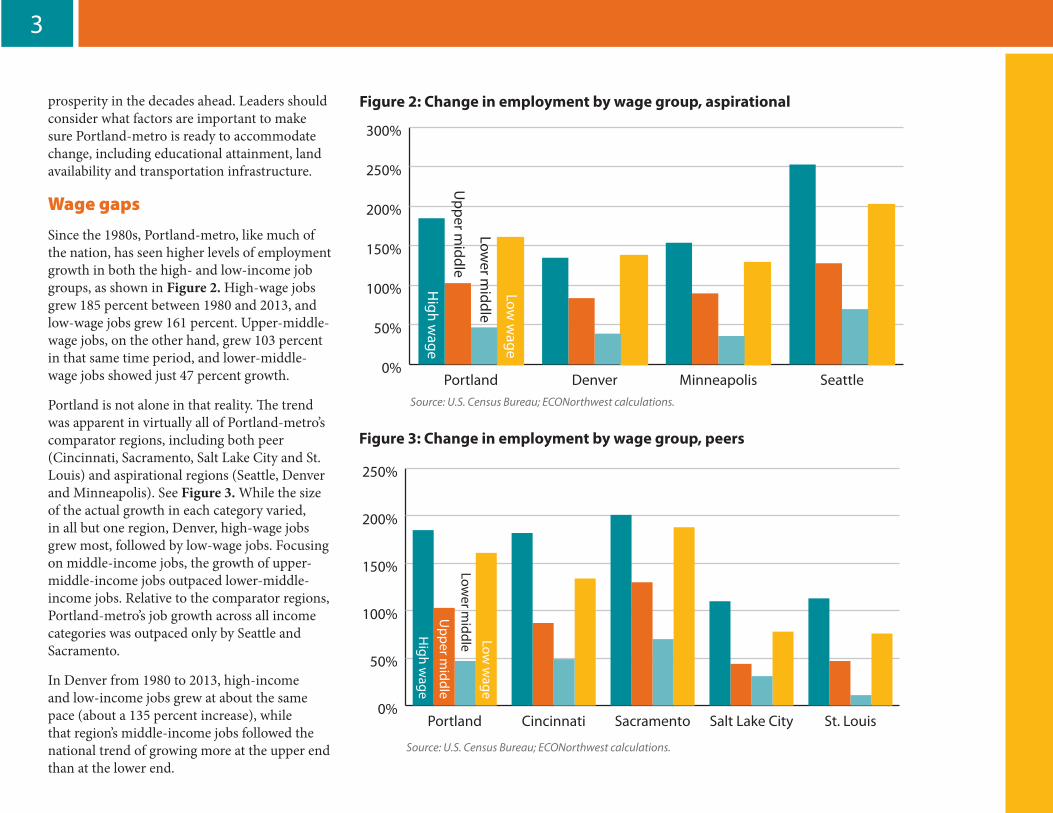
Since the 1980s, Portland-metro, like much of the nation, has seen higher levels of employment growth in both the high- and low-income job groups, as shown in Figure 2. High-wage jobs grew 185 percent between 1980 and 2013, and low-wage jobs grew 161 percent. Upper-middle-wage jobs, on the other hand, grew 103 percent in that same time period, and lower-middle-wage jobs showed just 47 percent growth.
Portland is not alone in that reality. The trend was apparent in virtually all of Portland-metro’s comparator regions, including both peer (Cincinnati, Sacramento, Salt Lake City and St. Louis) and aspirational regions (Seattle, Denver and Minneapolis). See Figure 3. While the size of the actual growth in each category varied, in all but one region, Denver, high-wage jobs grew most, followed by low-wage jobs. Focusing on middle-income jobs, the growth of upper-middle-income jobs outpaced lower-middle-income jobs. Relative to the comparator regions, Portland-metro’s job growth across all income categories was outpaced only by Seattle and Sacramento.
In Denver from 1980 to 2013, high-income and low-income jobs grew at about the same pace (about a 135 percent increase), while that region’s middle-income jobs followed the national trend of growing more at the upper end than at the lower end.
Figure 2: Change in employment by wage group, aspirational cities, 1980-2013
$17.2
$13.3
$16.0 $16.3 $16.5
0%
50%
100%
150%
200%
250%
300%
Low wageLower middleUpper middleHigh wage
SeattleMinneapolisDenverPortland
High w
age
Low w
age
Lower m
iddle
Upper m
iddle
Figure 3: Change in employment by wage group, peers cities, 1980-2013
$17.2
$13.3
$16.0 $16.3 $16.5
0%
50%
100%
150%
200%
250%
Low Wage
Lower Middle
Upper Middle
High Wage
St. LouisSalt Lake CitySacramentoCincinnatiPortland
High w
age
Low w
age
Lower m
iddle
Upper m
iddle
Figure 2: Change in employment by wage group, aspirational
Figure 3: Change in employment by wage group, peers
Source: U.S. Census Bureau; ECONorthwest calculations.
Source: U.S. Census Bureau; ECONorthwest calculations.

4
In Portland-metro and among the comparator regions, middle-income jobs as a share of the region’s overall employment have declined. In 1980, middle-wage jobs accounted for 69 percent of Portland-metro’s overall employment. By 2013, that share had dropped to 57 percent, as shown in Figures 4 and 5.
All of Portland-metro’s comparator regions experienced similar drops in the share of overall employment attributed to middle-income jobs. Seattle had the largest drop, with a 14-percentage-point decline, and Salt Lake City had the lowest, with a 9-point drop.
Looking ahead, the Oregon Department of Employment predicts more balanced job growth over the next decade. The department predicts that high-, low- and upper-middle-income jobs will all grow 15-20 percent in Portland-metro between 2012 and 2022, while lower-middle-income jobs are expected to grow 13 percent. As Portland-metro’s population grows, there will be greater demand for middle-income workers in the construction trades, educators, health care workers and other local service providers.
If that prediction proves true, the disparity that occurred in the three decades since 1980 will not continue. But policy makers need to act affirmatively to ensure a reversal of the trend. With continued uncertainty surrounding the impact of technological evolution on the distribution of jobs, investments still need to be made to position Portland competitively in the future.
Wages stagnate at the middle and bottom
In addition to holding a declining share of the region’s overall employment, middle-income jobs, as well as low-income jobs, have experienced wage stagnation. In Portland-metro, median wage in high-income occupations grew by approximately $20,000 since 1980 (adjusted for inflation), from about $50,000 in 1980 to just over $70,000 in 2013. Conversely, median wage for low-income workers stayed the same, at just over $20,000. The same was true for lower-middle-income occupations, with a median wage staying stagnant at about $35,000, and upper-middle-income occupations, with a median wage staying at about $45,000, see Figure 6.
Figure 4: Middle-wage job share, peer cities, 1980 and 2013
$17.2
$13.3
$16.0 $16.3 $16.5
0%
10%
20%
30%
40%
50%
60%
70%
80%2013
1980
St. LouisSalt Lake City
SacramentoCincinnati
Portland
19802013
Figure 5: Middle-wage job share, aspirational cities, 1980 and 2013
$17.2
$13.3
$16.0 $16.3 $16.5
0%
10%
20%
30%
40%
50%
60%
70%
80%2013
1980
SeattleMinneapolisDenverPortland
1980
2013
Figure 4: Middle-wage job share, peer cities, 1980 and 2013
Figure 5: Middle-wage job share, aspirational cities, 1980 and 2013
Source: U.S. Census Bureau; ECONorthwest calculations.
Source: U.S. Census Bureau; ECONorthwest calculations.
Figure 6: Real median wage by wage group, Portland 1980 - 2013 (2013 $)
$17.2
$13.3
$16.0 $16.3 $16.5
$0
$10,000
$20,000
$30,000
$40,000
$50,000
$60,000
$70,000
$80,000
Low wage
Lower middle
Upper middle
High wage
2013200019901980
Figure 6: Real median wage by wage group, Portland 1980 - 2013 (2013 dollars)
Source: U.S. Census Bureau; ECONorthwest calculations.

5
Portland-metro has outperformed its peers in terms of growth in median wages among high-wage occupations, see Figure 7. Between 1980 and 2013, the median income for high-wage occupations increased by 41 percent, outpacing every other region except Seattle, where median income among high-wage occupations grew about 46 percent.
Conversely, median wage among Portland-metro’s low-wage occupations was among the slowest growing in the comparator groups, at just 4 percent. This is likely because Oregon starts with a higher minimum wage relative to the nation as a whole. The only region that saw the median wage for low-wage jobs grow more slowly from 1980 to 2013 was Cincinnati, with 1 percent growth.
Wage growth for middle-income jobs between 1980 and 2013 among peer regions was mixed. Looking at peer regions (Cincinnati, Sacramento, Salt Lake City and St. Louis) Portland-metro’s 1 percent loss in median wage for upper-middle-income occupations ranked third, trailing Cincinnati and St. Louis, (with gains of 7 percent and 5 percent respectively). Similarly, Portland-metro ranked third in median wage growth for lower-middle-income occupations (3 percent growth for Portland), falling behind Sacramento (11 percent gain) and Salt Lake City (8 percent gain), as shown in Figure 7.
Portland-metro performed worse than all of its aspirational regions in median wage growth for middle-income jobs. While Portland lost 1 percent in median wage for upper-middle-income occupations, Denver, Seattle and Minneapolis all showed gains, see Figure 8. For
Figure 7: Growth in real median wages by wage group, peer cities, 1980-2013
$17.2
$13.3
$16.0 $16.3 $16.5
-5%
5%
15%
25%
35%
45%
55%
Low Wage
Lower Middle
Upper Middle
High Wage
St. LouisSalt Lake CitySacramentoCincinnatiPortland
High w
age
Low w
ageLow
er middle
Upper m
iddle
Figure 8: Growth in real median wages by wage group, aspirational cities, 1980-2013
$17.2
$13.3
$16.0 $16.3 $16.5
-5%
5%
15%
25%
35%
45%
55%
Low Wage
Lower Middle
Upper Middle
High Wage
SeattleMinneapolisDenverPortland
High w
age
Low w
age
Lower m
iddle
Upper m
iddle
Figure 7: Growth in real median wages by wage group, peers, 1980-2013
Figure 8: Growth in real median wages by wage group, aspirational, 1980-2013
Source: U.S. Census Bureau; U.S. Bureau of Labor Statistics; ECONorthwest calculations
Source: U.S. Census Bureau; U.S. Bureau of Labor Statistics; ECONorthwest calculations
6
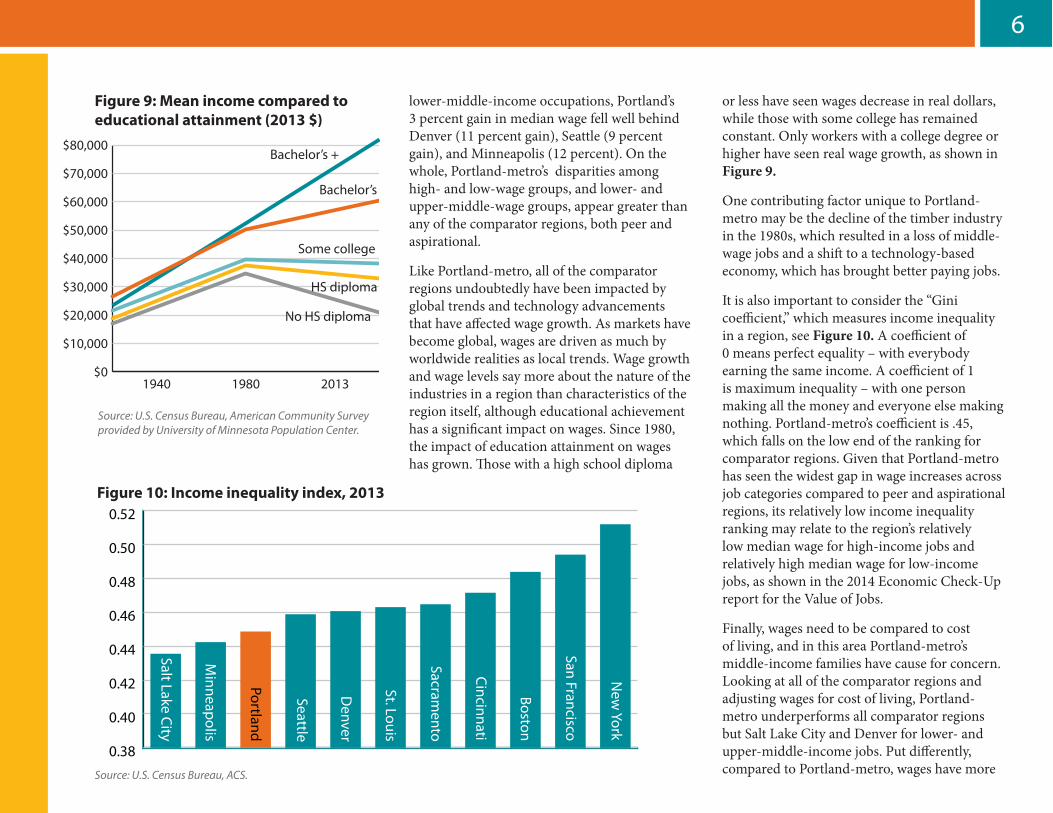
lower-middle-income occupations, Portland’s 3 percent gain in median wage fell well behind Denver (11 percent gain), Seattle (9 percent gain), and Minneapolis (12 percent). On the whole, Portland-metro’s disparities among high- and low-wage groups, and lower- and upper-middle-wage groups, appear greater than any of the comparator regions, both peer and aspirational.
Like Portland-metro, all of the comparator regions undoubtedly have been impacted by global trends and technology advancements that have affected wage growth. As markets have become global, wages are driven as much by worldwide realities as local trends. Wage growth and wage levels say more about the nature of the industries in a region than characteristics of the region itself, although educational achievement has a significant impact on wages. Since 1980, the impact of education attainment on wages has grown. Those with a high school diploma
or less have seen wages decrease in real dollars, while those with some college has remained constant. Only workers with a college degree or higher have seen real wage growth, as shown in Figure 9.
One contributing factor unique to Portland-metro may be the decline of the timber industry in the 1980s, which resulted in a loss of middle-wage jobs and a shift to a technology-based economy, which has brought better paying jobs.
It is also important to consider the “Gini coefficient,” which measures income inequality in a region, see Figure 10. A coefficient of 0 means perfect equality – with everybody earning the same income. A coefficient of 1 is maximum inequality – with one person making all the money and everyone else making nothing. Portland-metro’s coefficient is .45, which falls on the low end of the ranking for comparator regions. Given that Portland-metro has seen the widest gap in wage increases across job categories compared to peer and aspirational regions, its relatively low income inequality ranking may relate to the region’s relatively low median wage for high-income jobs and relatively high median wage for low-income jobs, as shown in the 2014 Economic Check-Up report for the Value of Jobs.
Finally, wages need to be compared to cost of living, and in this area Portland-metro’s middle-income families have cause for concern. Looking at all of the comparator regions and adjusting wages for cost of living, Portland-metro underperforms all comparator regions but Salt Lake City and Denver for lower- and upper-middle-income jobs. Put differently, compared to Portland-metro, wages have more
Figure 10: Income inequality index, 2013
$17.2
$13.3
$16.0 $16.3 $16.5
0.38
0.40
0.42
0.44
0.46
0.48
0.50
0.52
Gini Index
New
York
San Francisco
Boston
Cincinnati
Sacramento
St. Louis
Denver
Seattle
Portland
Minneapolis
Salt Lake City
Figure 10: Income inequality index, 2013
Source: U.S. Census Bureau, ACS.
Figure 9: Mean income compared to education attainment (2013 $)
$17.2
$13.3
$16.0 $16.3 $16.5
$0
$10,000
$20,000
$30,000
$40,000
$50,000
$60,000
$70,000
$80,000Bachelor’s +
Bachelor’s
Some college
HS diploma
No HS diploma
201319801940
Figure 9: Mean income compared to educational attainment (2013 $)
Source: U.S. Census Bureau, American Community Survey provided by University of Minnesota Population Center.

7
buying power for middle-income families in every region but Salt Lake City and Denver, as shown in Figures 11 and 12.
The stagnation of incomes in middle- and low-wage occupations, along with a higher cost of living, are trends that policy makers should watch. The focus should be on whether Portland-metro is achieving the right mix of jobs to achieve real growing wages for the region’s families and addressing factors that contribute to the higher cost of living.
Where the jobs and workers are
Labor markets and housing prices have shaped where middle-wage employees work and live. Workers with some college or other post-secondary training, but no degree, are a reasonable proxy for middle-income workers (although some middle-income occupations require a four-year degree). A look at jobs reports and census data provide a good picture of where middle-income workers actually work and where they live.
Regional Price Parity
Regional Price Parity (RPP) is a new form of measurement developed by the U.S. Department of Commerce in 2014. Much like currency exchange, it compares real buying power in different regions at a given point in time.
For example, the New York metropolitan area has an RPP of about 122, meaning prices are about 22 percent higher than the national average. When factored against median household incomes, this provides a measure to account for cost of living differences for a given region.
Figure 8: RPP adjusted lower middle income occupations wage distribution, 2013
$0 $10,000 $20,000 $30,000 $40,000 $50,000 $60,000 $70,000 $80,000 $90,000 $100,000
Salt Lake City
Denver
Portland
Sacramento
Minneapolis
Seattle
Cincinnati
St. Louis10th 20th 30th 40th 50th 60th 70th 80th 90th
Figure 11: RPP adjusted lower-middle-income occupations median way, 2013
$17.2
$13.3
$16.0 $16.3 $16.5
$0
$10,000
$20,000
$30,000
$40,000
$50,000
$60,000
median wage
St. Louis
Cincinnati
Seattle
Minneapolis
Sacramento
Portland
Denver
Salt Lake City
$34,826
Figure 11: RPP adjusted lower-middle-income occupation median wage, 2013
Source: U.S. Census Bureau; ECONorthwest calculations.
Figure 9: RPP adjusted upper middle income occupations wage distribution, 2013
$0 $10,000 $20,000 $30,000 $40,000 $50,000 $60,000 $70,000 $80,000 $90,000 $100,000
Denver
Salt Lake City
Portland
Seattle
Sacramento
Cincinnati
Minneapolis
St. Louis10th 20th 30th 40th 50th 60th 70th 80th 90th
Figure 12: RPP adjusted upper-middle-income occupations median way, 2013
$0
$10,000
$20,000
$30,000
$40,000
$50,000
$60,000
median wage
St. Louis
Minneapolis
Cincinnati
Sacramento
Seattle
Portland
Salt Lake City
Denver
$44,776
Figure 12: RPP adjusted upper-middle-income occupation median wage, 2013
Source: U.S. Census Bureau; ECONorthwest calculations.
8
26
I-84
I-5
I-20
5
217
1201 - 3559
N umber of J obs with Earnings between $1251 and $3333 per month
> 1200
Source: United States C ensus Bureau, M etro RLIS
N o Data
0 - 50
51 - 200
201 - 500
501 - 1200
> 1200
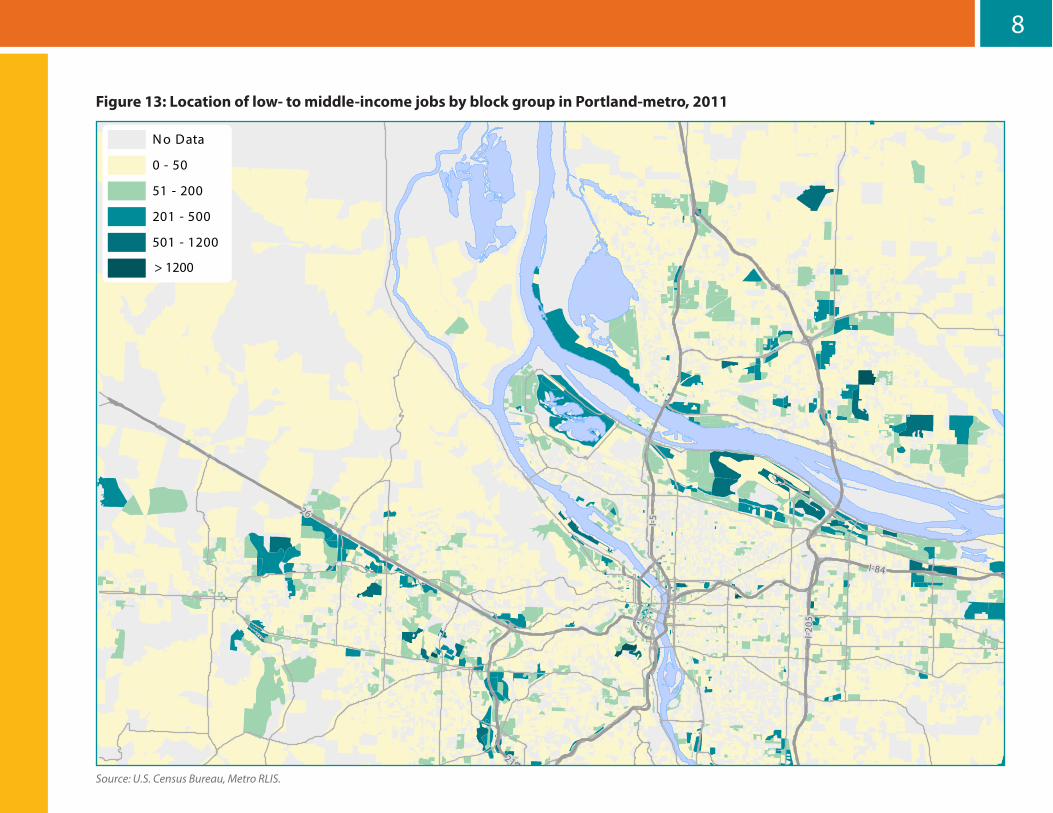
Figure 13: Location of low- to middle-income jobs by block group in Portland-metro, 2011
Source: U.S. Census Bureau, Metro RLIS.

9
26
I-84
I-5
I-20
5217
Source: United States C ensus Bureau, M etro RLIS
N o Data
0 - 10
11 - 50
51 - 100
101 - 200
>200
N umber of J obs with Earnings between $1251 and $3333 per monthFigure 14: Residence of low- to middle-income workers by block group in Portland-metro, 2011
Source: U.S. Census Bureau, Metro RLIS.

10
In Portland-metro, middle-income jobs tend to be found in industries such as construction, health care, support services, teaching, transportation/warehousing, manufacturing and retail trade. Many of these industries are forecasted to continue to grow in the years ahead, providing opportunities for Portland-metro workers.
Historically, many of these industries generating middle-income jobs have tended to concentrate in certain areas of the region. Figure 13 shows they are along the Willamette and Columbia rivers in areas traditionally occupied by industry; adjacent to Highways 26 and 217, where technology-based industries have grown up; around major medical centers, which have seen steady job growth; and in Clark County, where job centers and residents have grown significantly over the last three decades.
These also are areas that have had sufficient supplies of industrial land to accommodate growing industries and access to efficient transportation systems for workers, freight and customers. Looking ahead, a question facing the region will be whether those areas will continue to be able to accommodate middle-income job growth and retention, and whether there will be new areas for these jobs to grow.
In contrast, Figure 14 shows that Portland-metro’s middle-income workers do not live where they work. A reduced availability of middle-income jobs, combined with stagnant incomes and a higher cost of living, have steadily pushed Portland-metro’s middle-income workers out of the urban core. Today, middle-income workers live where homes are relatively more affordable, predominantly east of I-205, in outer Washington County and in Clark
County. Aside from being a problem for workers who want to live close to where they work, this mismatch of job and residence locations raises questions about the availability of workforce housing and a transportation system capable of getting people to and from their jobs.
Housing affordability in Portland-metro
Portland-metro has become increasingly unaffordable. For this analysis, the cost of home ownership was defined as not only the mortgage (assuming a 20 percent down payment and a 30-year amortizing loan), but also property taxes, insurance and utilities. Affordability was defined as spending no more than 30 percent of the household income to purchase and live in a single-family house, condominium or
WHAT IS WORKFORCE HOUSING?
The term “workforce housing” typically refers to ownership of multi-family housing units that are affordable to middle-income wage earners, and are located with convenient access to middle-income jobs. Having workforce housing that is affordable and available to support middle-income earners should be a key component of any strategy to attract and retain middle-income jobs.
Figure 15: Median house price by comparitor cities, 2014
$17.2
$13.3
$16.0 $16.3 $16.5
$0
$50
$100
$150
$200
$250
$300
$350
$400
House Price
Cincinnati
St Louis
Salt Lake City
Sacramento
Portland
Minneapolis
Denver
Seattle
thou
sand
s
Figure 15: Median house price by aspirational and peer cities, 2014
Source: National Association of Realtors.
11
townhouse. Data was collected by home sales reported through the Regional Multiple Listing Service (RMLS) for the calendar year of 2014; values reported are the mean sales price in each area. Home prices in Vancouver, Washington, were not analyzed for this initial affordability study but will be considered in future analysis.
The analysis found that on average, a family of four would need to earn $70,000 per year (a high-income wage in a single-income household) to be able to purchase a home in the region, assuming the region’s median house price of $285,000, as shown in Figure 15.
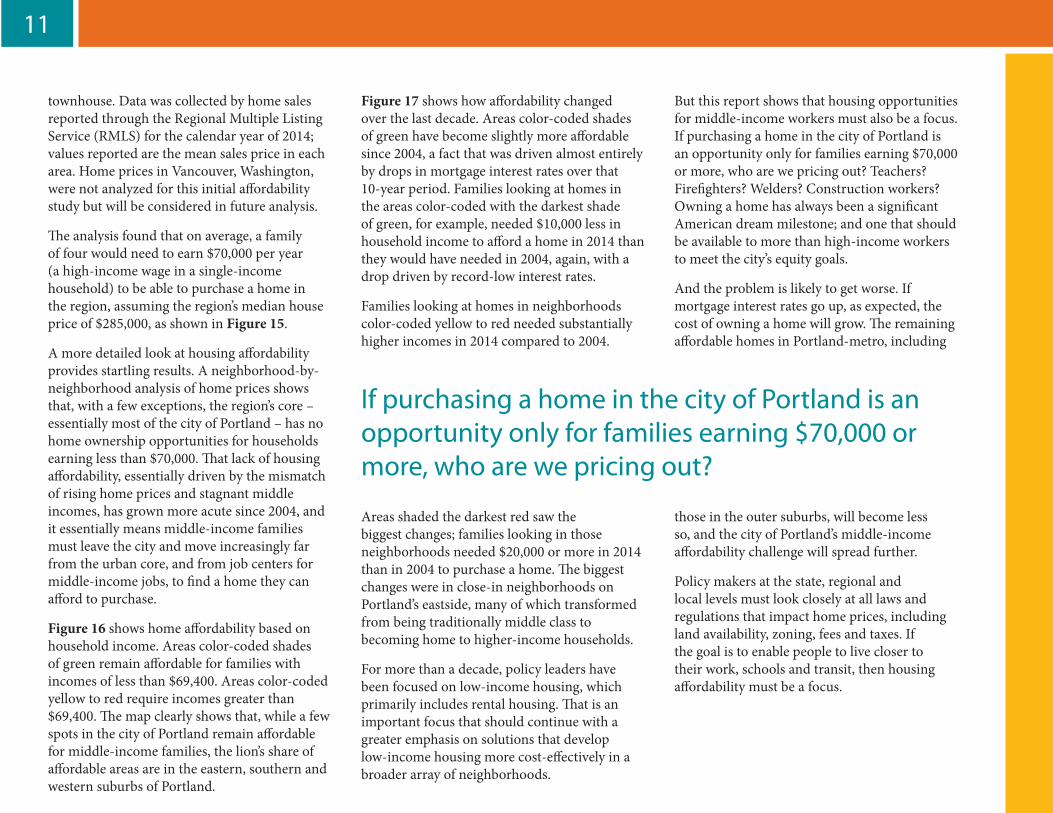
A more detailed look at housing affordability provides startling results. A neighborhood-by-neighborhood analysis of home prices shows that, with a few exceptions, the region’s core – essentially most of the city of Portland – has no home ownership opportunities for households earning less than $70,000. That lack of housing affordability, essentially driven by the mismatch of rising home prices and stagnant middle incomes, has grown more acute since 2004, and it essentially means middle-income families must leave the city and move increasingly far from the urban core, and from job centers for middle-income jobs, to find a home they can afford to purchase.
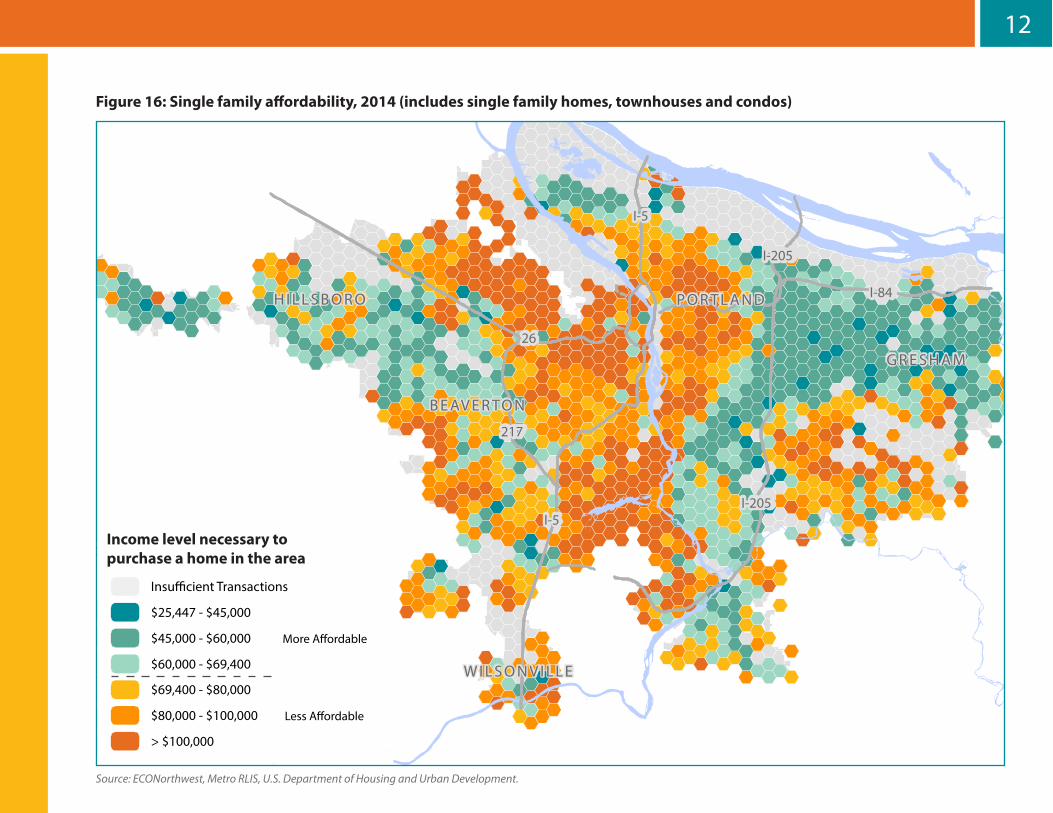
Figure 16 shows home affordability based on household income. Areas color-coded shades of green remain affordable for families with incomes of less than $69,400. Areas color-coded yellow to red require incomes greater than $69,400. The map clearly shows that, while a few spots in the city of Portland remain affordable for middle-income families, the lion’s share of affordable areas are in the eastern, southern and western suburbs of Portland.
Figure 17 shows how affordability changed over the last decade. Areas color-coded shades of green have become slightly more affordable since 2004, a fact that was driven almost entirely by drops in mortgage interest rates over that 10-year period. Families looking at homes in the areas color-coded with the darkest shade of green, for example, needed $10,000 less in household income to afford a home in 2014 than they would have needed in 2004, again, with a drop driven by record-low interest rates.
Families looking at homes in neighborhoods color-coded yellow to red needed substantially higher incomes in 2014 compared to 2004.
Areas shaded the darkest red saw the biggest changes; families looking in those neighborhoods needed $20,000 or more in 2014 than in 2004 to purchase a home. The biggest changes were in close-in neighborhoods on Portland’s eastside, many of which transformed from being traditionally middle class to becoming home to higher-income households.
For more than a decade, policy leaders have been focused on low-income housing, which primarily includes rental housing. That is an important focus that should continue with a greater emphasis on solutions that develop low-income housing more cost-effectively in a broader array of neighborhoods.
But this report shows that housing opportunities for middle-income workers must also be a focus. If purchasing a home in the city of Portland is an opportunity only for families earning $70,000 or more, who are we pricing out? Teachers? Firefighters? Welders? Construction workers? Owning a home has always been a significant American dream milestone; and one that should be available to more than high-income workers to meet the city’s equity goals.
And the problem is likely to get worse. If mortgage interest rates go up, as expected, the cost of owning a home will grow. The remaining affordable homes in Portland-metro, including
those in the outer suburbs, will become less so, and the city of Portland’s middle-income affordability challenge will spread further.
Policy makers at the state, regional and local levels must look closely at all laws and regulations that impact home prices, including land availability, zoning, fees and taxes. If the goal is to enable people to live closer to their work, schools and transit, then housing affordability must be a focus.
If purchasing a home in the city of Portland is an opportunity only for families earning $70,000 or more, who are we pricing out?
12
26
I-5
I-5
I-205
I-205
I-84
217
P O R T L A N D
G R E S H A M
H I L L S B O R O
B E AV E R TO N
W I L S O N V I L L E
Income Level
$25,447 - $45,000
$45,000 - $60,000
$60,000 - $69,400
$69,400 - $80,000
$80,000 - $100,000
> $100,000
Source: ECONorthwest, Metro RLIS, US Department of Housing and Urban Development
Based on 30% MFI ($69,400)Includes Single Family Homes, Townhouses, and Condominiums
Figure 16: Single family affordability, 2014 (includes single family homes, townhouses and condos)
Source: ECONorthwest, Metro RLIS, U.S. Department of Housing and Urban Development.
26
I-5
I-5
I-205
I-205
I-84
217
P O R T L A N D
G R E S H A M
H I L L S B O R O
B E AV E R TO N
W I L S O N V I L L E
Income Level
$25,447 - $45,000
$45,000 - $60,000
$60,000 - $69,400
$69,400 - $80,000
$80,000 - $100,000
> $100,000
Source: ECONorthwest, Metro RLIS, US Department of Housing and Urban Development
Based on 30% MFI ($69,400)Includes Single Family Homes, Townhouses, and Condominiums
Income level necessary to purchase a home in the area

13
26
I-5
I-5
I-205
I-205
I-84
217
P O R T L A N D
G R E S H A M
H I L L S B O R O
B E AV E R TO N
W I L S O N V I L L E
Source: ECONorthwest, REIS, Metro RLIS, US Census, US Department of Housing and Urban Development
Change in Income
< - $10,000
-$10,000 - -$5,000
-$5,000 - $1,500
$1,500 - $10,000
$10,000 - $20,000
> $20,000
2004-2014
2004-2014
Figure 17: Change in single family affordability, 2004-2014 (includes single family homes, townhouses and condos)
Source: ECONorthwest, Metro RLIS, U.S. Department of Housing and Urban Development.
26
I-5
I-5
I-205
I-205
I-84
217
P O R T L A N D
G R E S H A M
H I L L S B O R O
B E AV E R TO N
W I L S O N V I L L E
Source: ECONorthwest, REIS, Metro RLIS, US Census, US Department of Housing and Urban Development
Change in Income
< - $10,000
-$10,000 - -$5,000
-$5,000 - $1,500
$1,500 - $10,000
$10,000 - $20,000
> $20,000
2004-2014
2004-2014
Change in income necessary to purchase a home over 10 years

14
ConclusionGlobal trends and technology have impacted jobs and wages in Portland-metro and across the U.S. As jobs at the high and low ends have grown, middle-income jobs, as a share of the region’s overall employment base, have declined and wages have stagnated. This has had a direct impact on the region’s families and their perception of economic opportunity.
Policy makers could shrug and say this is a national, even international, trend, and there is not much the Portland-metro can do to change direction. But that’s untrue. The region’s broad posture on economic and population growth will be a key determinant of the future of middle-income employment. Growth drives demand for construction, education, and health care workers—many in middle-income occupations that are less prone to technological replacement.
Given that the region is expected to grow under all forecasts, Portland has better prospects for middle-income job growth than a slow-growing city like Cleveland. Policy makers routinely consider actions that influence the rate of population growth, and those indirectly affect the outlook for the middle-income labor market. Beyond the region’s broad perspective on population growth, several policy areas should be prioritized. These include:
EducationTechnological advances will continue to eliminate routine work, impacting jobs. Regions that invest in educational and training programs that prepare workers for a more
technology-based future will have a greater opportunity to retain and attract valuable jobs that support families.
Employers, educators and students must strengthen collaboration around high-demand skills that offer pathways to the middle class and beyond. Greater emphasis must be placed on closing the education achievement gap to ensure all future workers, including underserved groups, have equal access to better-paying jobs that can support families.
Protection of existing job corridorsQuality middle-income jobs continue to exist in areas that traditionally have been home to heavy industry, including along the Columbia and Willamette rivers. Regulatory policies that impact those companies’ ability to maintain operations and grow should be carefully weighed against the need to protect middle-income jobs in Portland-metro.
TradeFor Portland-metro, trade expansion means job growth. Portland is one of the most trade-dependent regions in the country, with particularly strong relationships with Asia. As those countries develop, and trade agreements pave the way for more opportunities, Oregon’s economy will grow. Trade-related jobs, especially in the manufacturing sector, are prime sources for middle incomes. Just as important, those sectors support local-service industries that are a significant generator of middle-income jobs: manufacturing, education, health care and others.
Facilitation of growth corridorsMiddle-income jobs are growing in tech centers on the western end of the region and around medical centers. It is important to understand the factors that support growth and develop policies that nurture these growing job centers.
InfrastructureMany of the region’s middle-income jobs congregate along rivers and key interstates. It is clear that infrastructure maintenance and development is critical to retain and grow middle-income jobs. Policy leaders should focus on ensuring that the region’s port thrives and highway congestion points are addressed.
Workforce housingDevelopment of workforce housing must be a top priority, especially in the city of Portland, which has become unaffordable for most middle-income families seeking to buy a home.
All of those policy areas have been identified in past Value of Jobs reports, but this report, with its analysis of the pressures on Portland-metro’s middle-income sector, shows the need for greater urgency to act. If Portland-metro is to avoid the fate of other regions, like New York and San Francisco, where income disparities are a daily fact of life, the time is now to take steps to create an environment where middle-income jobs can grow and thrive, and the workers in those jobs can afford to own a home.
15
Thank you to our partner organizations.

16
Thank you to our funding partners.A number of companies and organizations contributed to the funding of this report and the Value of Jobs initiative, including:
Bank of AmericaCenturyLinkColumbia SportswearESCO CorporationFerguson Wellman Capital ManagementThe Greenbrier CompaniesIntel CorporationKey BankMelvin Mark CompaniesMiller Nash LLPNike
NW NaturalPacific PowerPortland General ElectricRegence BlueCross BlueShield of OregonSchnitzer Steel IndustriesThe StandardStoel RivesUniversity of OregonU.S. BankVigor IndustrialWalmart
Media Partners:Oregonian Media GroupKGW Media GroupThe Portland Tribune & Community Newspapers


PUBLISHED BY:
PORTLAND BUSINESS ALLIANCE200 SW Market Street, Suite 150Portland, OR 97201www.valueofjobs.com
About the Value of Jobs Coalition
The Value of Jobs Coalition is based on the premise that in order to have a prosperous, healthy Portland region with a good quality of life, we need more private-sector jobs. The coalition began with an economic study in the fall of 2010, which uncovered troubling economic data about the Portland-metro region. A number of other studies have followed that highlight the region’s economic opportunities and challenges. Find out more at:
www.valueofjobs.com.
For more information about this report or other Value of Jobs studies, go online to www.valueofjobs.com.
� Economic Impacts of Congestion
� 2014 Check-up on the Portland-Region’s Economic Health
� Portland-Metro’s Health Care
� International Trade & The Portland Harbor’s Impact
� 2013 Check-up on the Portland-Region’s Economic Health
� Higher Education & Regional Prosperity
� 2012 Check-up on the Portland-Region’s Economic Health
� Portland-Metro’s Manufacturing Sector
� Land Availability: Limited Options
� Portland-Metro’s Traded Sector
� 2011 Check-up on the Portland-Region’s Economic Health
� International Trade study
� 2010 Check-up on the Portland-Region’s Economic Health