midmar mile 2012 impact assessment: top line summary report zama dlamini karen kohler tourism...
TRANSCRIPT
Midmar Mile 2012 Impact Assessment:Top Line Summary Report
Zama DlaminiKaren KohlerTourism KwaZulu-NatalMay 2012

Positive Highlights
• 99% of respondents said they would recommend the event to family and friends.
• 85% of respondents did not experience problems at the event.
• 94% of respondents said they would attend the event again.
• Some 96% were satisfied with information provided through various media.
• About 61% and 36% had a ‘good’ and an ‘excellent’ experience, respectively.
• Some 99% of respondents said they would recommend KZN as a tourist destination to family and friends.
Methodology
– Face to face survey with a probability sample of 225 respondents over the 2 days of the event, 11 and 12 February 2012.
– Respondents were systematically selected throughout the 2-day period of the event.

43%
9%
48%
42%
21%
37%38%
21%
40%
35%31%
34%
47%
14%
39%
0%
10%
20%
30%
40%
50%
60%
Overnight Local Day Visitor
2008
2009
2010
2011
2012
Nature of Midmar Mile Participants and Spectators
According to a Z-test of two independent sample proportions, there was no statistically significant difference between the proportion of overnight and day visitors when comparing 2011 and 2012.
Provinces
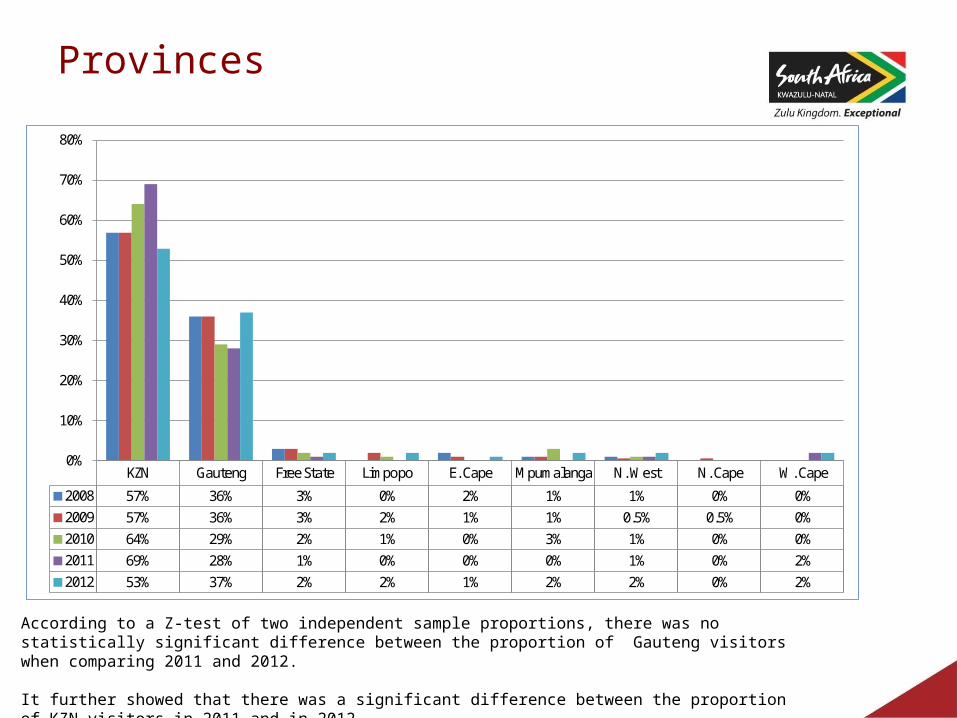
KZN Gauteng Free State Limpopo E. Cape Mpumalanga N. West N. Cape W. Cape
2008 57% 36% 3% 0% 2% 1% 1% 0% 0%2009 57% 36% 3% 2% 1% 1% 0.5% 0.5% 0%2010 64% 29% 2% 1% 0% 3% 1% 0% 0%2011 69% 28% 1% 0% 0% 0% 1% 0% 2%2012 53% 37% 2% 2% 1% 2% 2% 0% 2%
0%
10%
20%
30%
40%
50%
60%
70%
80%
According to a Z-test of two independent sample proportions, there was no statistically significant difference between the proportion of Gauteng visitors when comparing 2011 and 2012.
It further showed that there was a significant difference between the proportion of KZN visitors in 2011 and in 2012.

Participants and Vehicles
2008 2009 2010 2011 2012
Participants 15 440 15 942 16 000 16 210 16 007
Vehicles 6 383 6 876 7 123 7 054 7 602
Although there was an increase in vehicles that entered the resort during the 2012 event, the average group size decreased which means that there were fewer people in a travelling party compared to 2011. This could be an indication that people opted to travel on their own in smaller groups than before. This may suggest an improvement in affordability levels. The 2012 event saw a decrease in the number of participants, however, this was minimal.
Group Size and Spectator Estimate
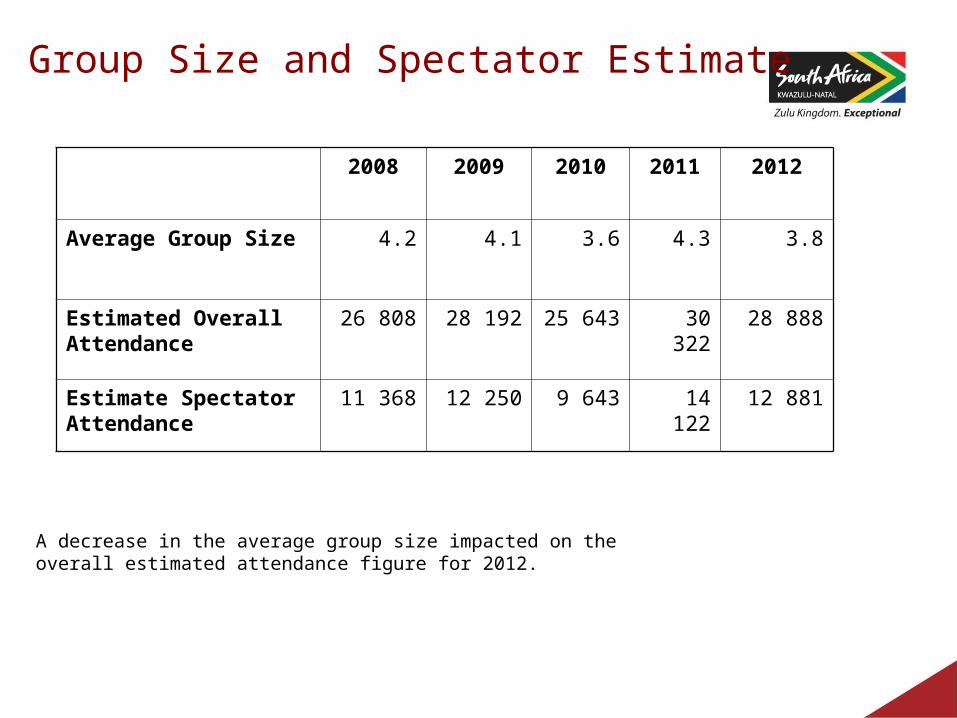
2008 2009 2010 2011 2012
Average Group Size 4.2 4.1 3.6 4.3 3.8
Estimated Overall Attendance
26 808 28 192 25 643 30 322 28 888
Estimate Spectator Attendance
11 368 12 250 9 643 14 122 12 881
A decrease in the average group size impacted on the overall estimated attendance figure for 2012.

Estimated Economic Impact - Participants
Year Overnight Participants Local and Day Participants
2010
Number 7 840 8 160
*Low Estimate R14 600 882 R2 103 912
**Middle Estimate R19 240 144 R4 252 176
***High Estimate R23 879 406 R6 400 440
2011
Number 6 322 9 888
Low Estimate R11 696 806 R3 907 046
Middle Estimate R15 458 310 R4 795 680
High Estimate R19 226 810 R5 684 314
2012
Number 4 967 3 452
Low Estimate R16 463 497 R1 322 377
Middle Estimate R19 404 579 R1 636 593
High Estimate R22 345 661 R1 950 810
*Low estimate of margin of error of mean at 95% confidence level
**No Margin of Error
***High estimate of margin of error of mean at 95% confidence level
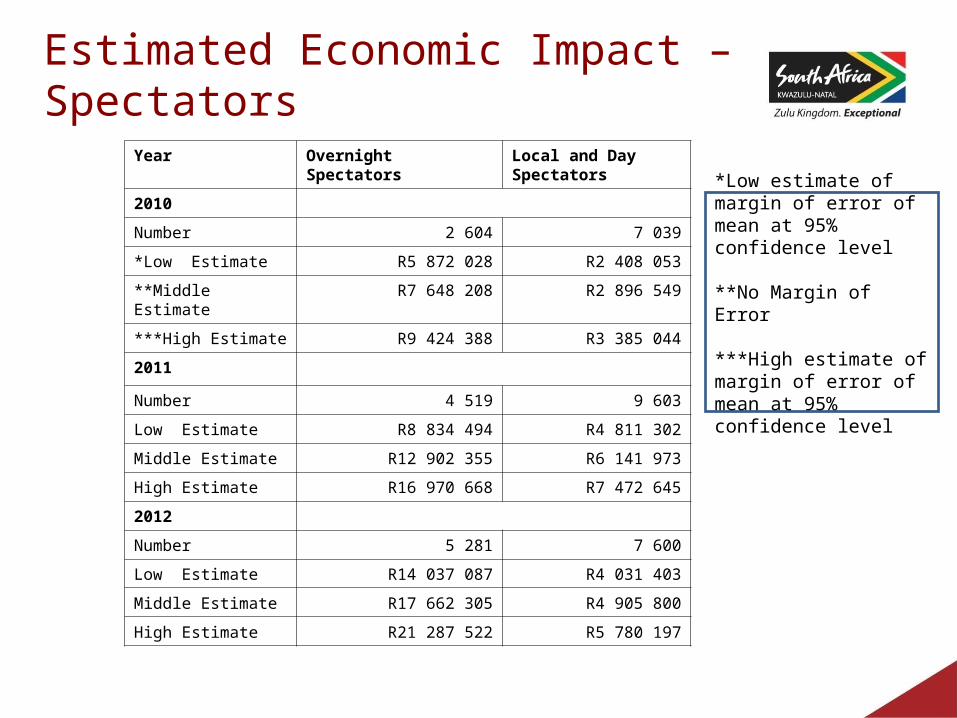
Estimated Economic Impact – Spectators
Year Overnight Spectators Local and Day Spectators
2010
Number 2 604 7 039
*Low Estimate R5 872 028 R2 408 053
**Middle Estimate R7 648 208 R2 896 549
***High Estimate R9 424 388 R3 385 044
2011
Number 4 519 9 603
Low Estimate R8 834 494 R4 811 302
Middle Estimate R12 902 355 R6 141 973
High Estimate R16 970 668 R7 472 645
2012
Number 5 281 7 600
Low Estimate R14 037 087 R4 031 403
Middle Estimate R17 662 305 R4 905 800
High Estimate R21 287 522 R5 780 197
*Low estimate of margin of error of mean at 95% confidence level
**No Margin of Error
***High estimate of margin of error of mean at 95% confidence level
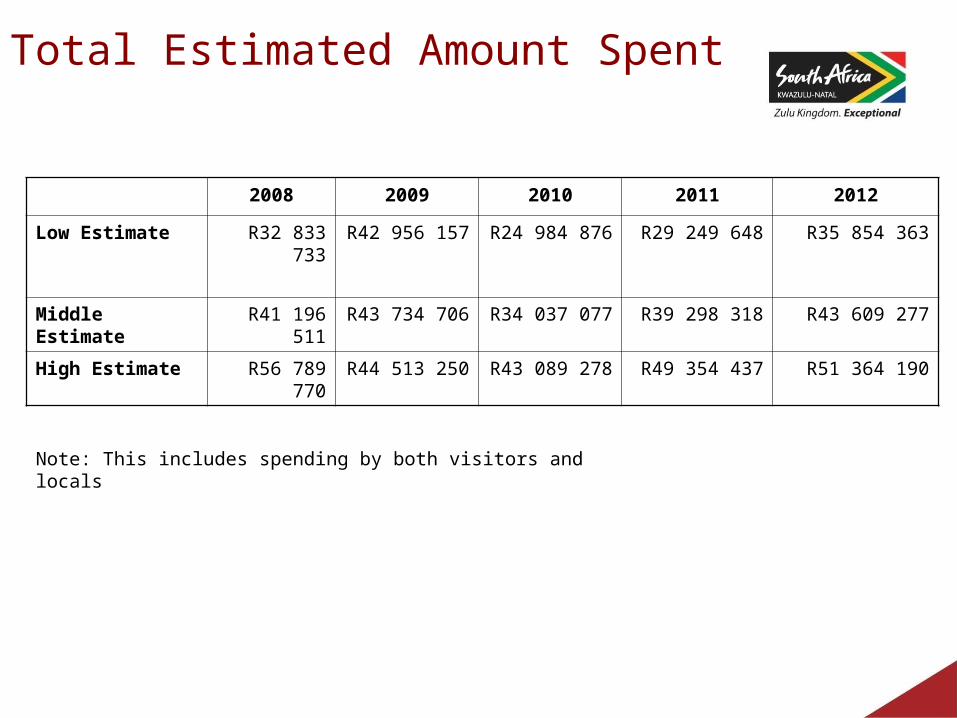
Total Estimated Amount Spent
2008 2009 2010 2011 2012
Low Estimate R32 833 733 R42 956 157 R24 984 876 R29 249 648 R35 854 363
Middle Estimate R41 196 511 R43 734 706 R34 037 077 R39 298 318 R43 609 277
High Estimate R56 789 770 R44 513 250 R43 089 278 R49 354 437 R51 364 190
Note: This includes spending by both visitors and locals
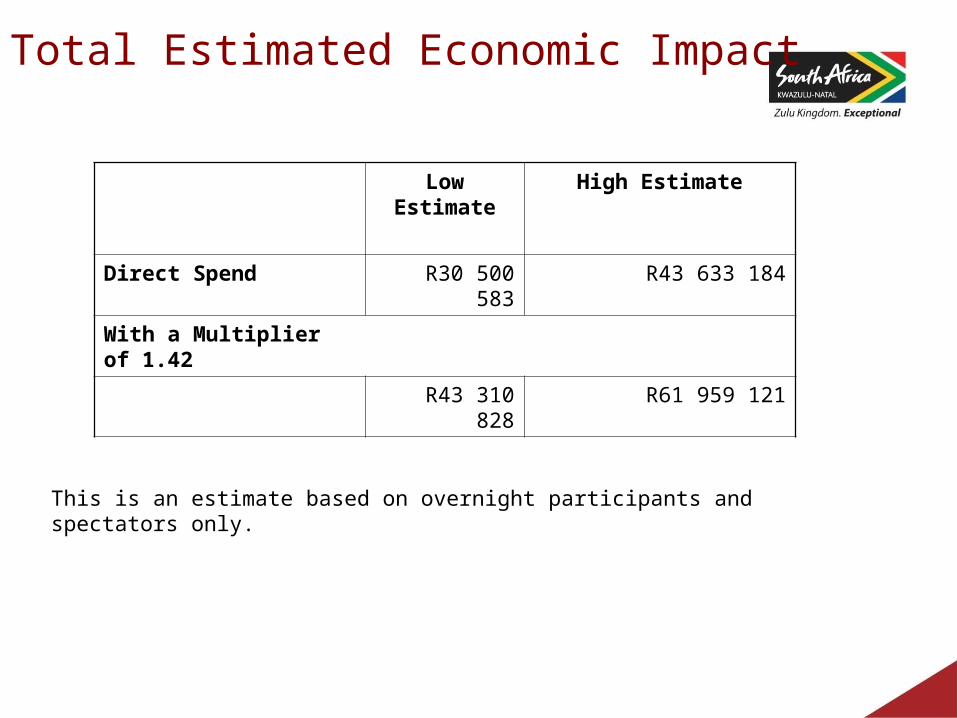
Total Estimated Economic Impact
Low Estimate High Estimate
Direct Spend R30 500 583 R43 633 184
With a Multiplier of 1.42
R43 310 828 R61 959 121
This is an estimate based on overnight participants and spectators only.

Spend Breakdown
Items 2008 2009 2010 2011 2012
Accommodation R1 708 R1 504 R2 251 R1 248 R2 048
Food & Beverage
R514 R451 R416 R343 R598
Transport R670 R441 R553 R501 R841
Entertainment R280 R432 R321 R323 R380
Souvenirs R424 R319 R225 R286 R457
Consistent with the general increase in prices, the average spend across all items increased in 2012. For example, an increase in transport might be influenced by a increase in the price of petrol. Statistics SA reported in March 2012 that “the transport index increased by 0,8% between January 2012 and February 2012, mainly due to a 34c/litre increase in the price of petrol”.
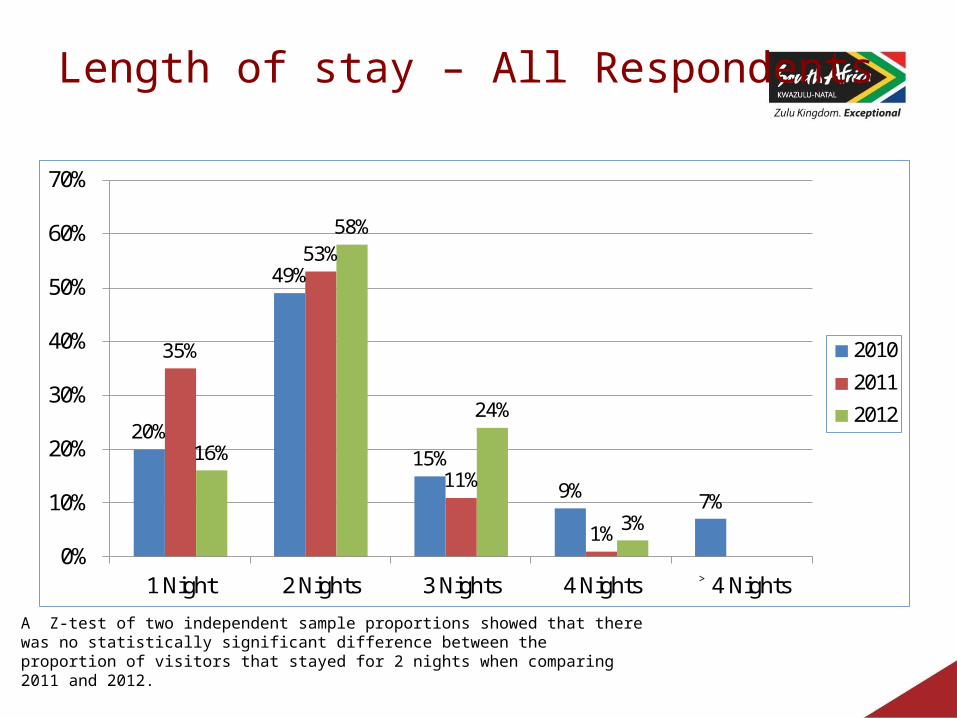
20%
49%
15%
9% 7%
35%
53%
11%
1%
16%
58%
24%
3%
0%
10%
20%
30%
40%
50%
60%
70%
1 Night 2 Nights 3 Nights 4 Nights ˃ 4 Nights
2010
2011
2012
Length of stay – All Respondents
A Z-test of two independent sample proportions showed that there was no statistically significant difference between the proportion of visitors that stayed for 2 nights when comparing 2011 and 2012.
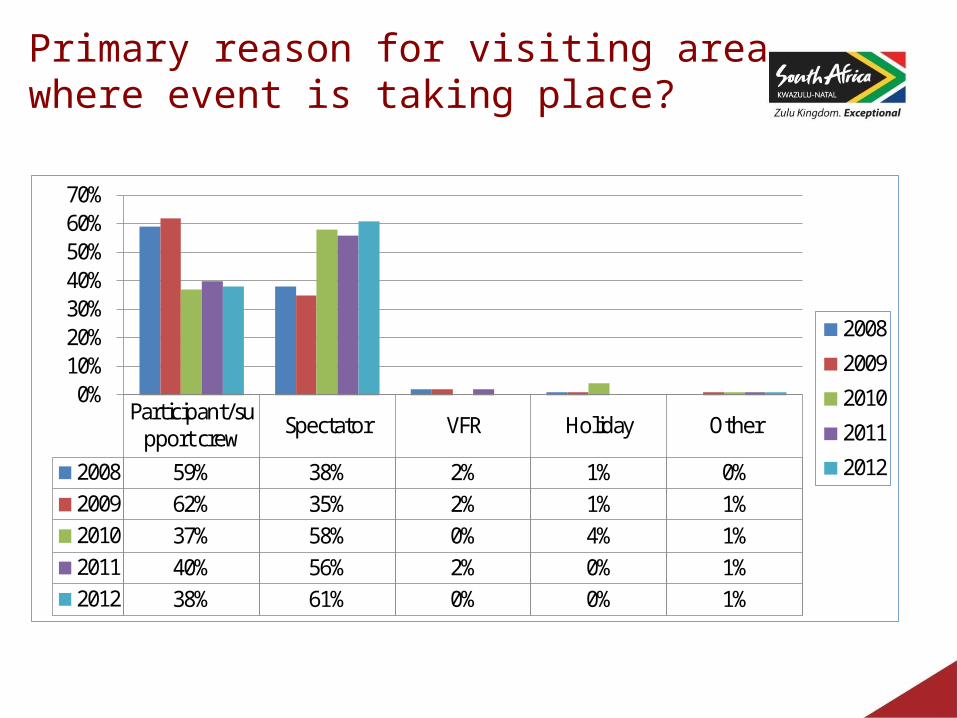
Primary reason for visiting area where event is taking place?
Participant/support crew Spectator VFR Holiday Other
2008 59% 38% 2% 1% 0%2009 62% 35% 2% 1% 1%2010 37% 58% 0% 4% 1%2011 40% 56% 2% 0% 1%2012 38% 61% 0% 0% 1%
0%10%20%30%40%50%60%70%
2008
2009
2010
2011
2012

Accommodation
Friends &
relatives
Family hotel
Luxury hotel B&B Holiday
flatSelf-
catering Camping Holiday home
Guest house Lodge Other
2010 23% 7% 4% 16% 7% 15% 11% 9% 0% 0% 9%2011 16% 3% 4% 17% 1% 14% 39% 0% 5% 1% 0%2012 21% 11% 3% 23% 0% 6% 22% 2% 1% 4% 8%
0%
5%
10%
15%
20%
25%
30%
35%
40%
45%
A Z-test could not be performed as the responses were below the minimum number required to carry out such a test.
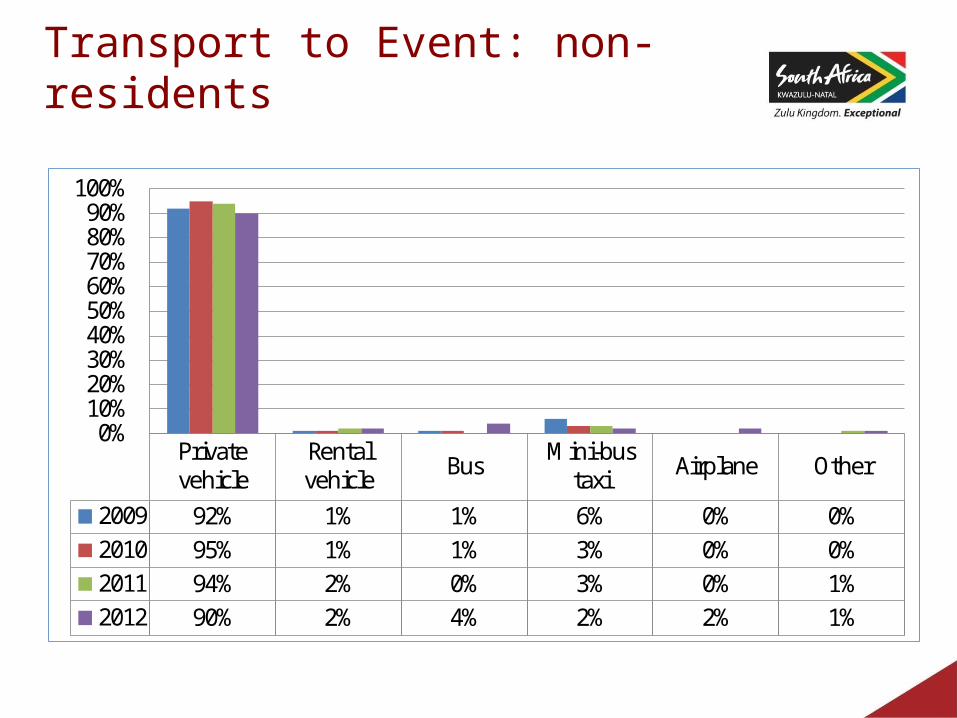
Private vehicle
Rental vehicle Bus Mini-bus
taxi Airplane Other
2009 92% 1% 1% 6% 0% 0%2010 95% 1% 1% 3% 0% 0%2011 94% 2% 0% 3% 0% 1%2012 90% 2% 4% 2% 2% 1%
0%10%20%30%40%50%60%70%80%90%
100%
Transport to Event: non-residents

Word-of-mouth TV Ad
Newspapers/Magazines
*Swum before/
attended previously
Posters/ banners Radio Internet Other
2008 50% 2% 2% 40% 0% 1% 0% 5%2009 54% 2% 1% 31% 1% 1% 0% 11%2010 32% 4% 1% 58% 2% 1% 0% 3%2011 49% 1% 0.5% 43% 0% 1% 0.5% 6%2012 37% 1% 1% 54% 0.4% 0.4% 0% 7%
0%
10%
20%
30%
40%
50%
60%
70%
Influenced to attend?
A Z-test of two independent sample proportions showed that there was no statistically significant difference between the proportion of attendees in 2011 who were influenced by word-of-mouth or by having swum before and the proportion of attendees in 2012.
* In 2008 and 2009, this figure only included those respondents that had participated previously. As from 2010, it included those respondents that had attended (spectators) or participated (swimmers) previously.

Information Satisfaction
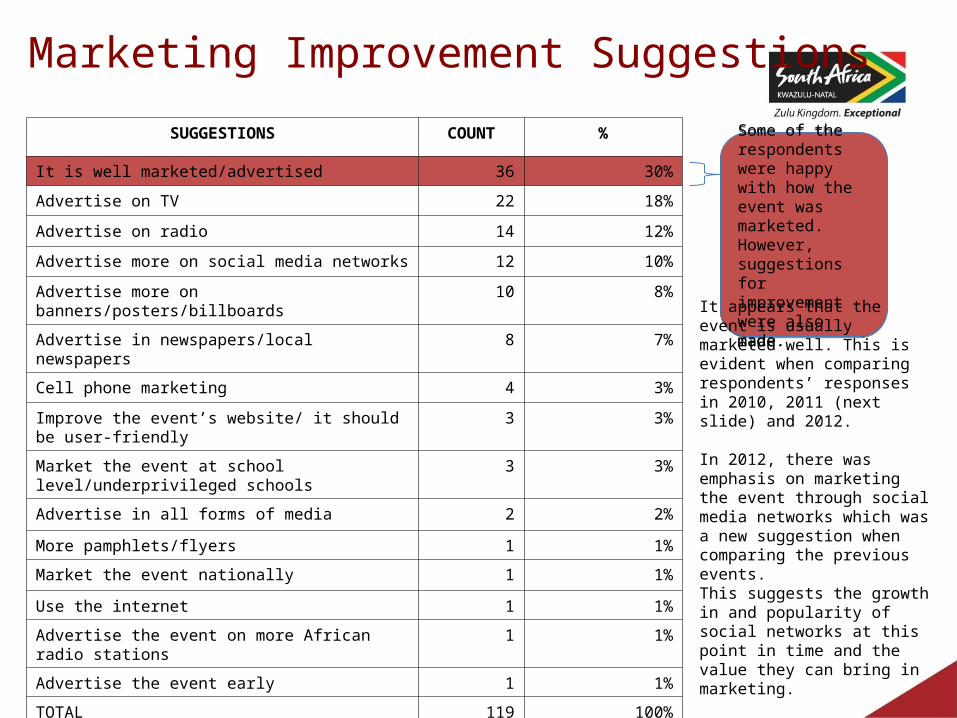
Marketing Improvement Suggestions
SUGGESTIONS COUNT %
It is well marketed/advertised 36 30%
Advertise on TV 22 18%
Advertise on radio 14 12%
Advertise more on social media networks 12 10%
Advertise more on banners/posters/billboards 10 8%
Advertise in newspapers/local newspapers 8 7%
Cell phone marketing 4 3%
Improve the event’s website/ it should be user-friendly
3 3%
Market the event at school level/underprivileged schools
3 3%
Advertise in all forms of media 2 2%
More pamphlets/flyers 1 1%
Market the event nationally 1 1%
Use the internet 1 1%
Advertise the event on more African radio stations 1 1%
Advertise the event early 1 1%
TOTAL 119 100%
Some of the respondents were happy with how the event was marketed. However, suggestions for improvement were also made.
Some of the respondents were happy with how the event was marketed. However, suggestions for improvement were also made.
It appears that the event is usually marketed well. This is evident when comparing respondents’ responses in 2010, 2011 (next slide) and 2012.
In 2012, there was emphasis on marketing the event through social media networks which was a new suggestion when comparing the previous events. This suggests the growth in and popularity of social networks at this point in time and the value they can bring in marketing.

SUGGESTIONS %
Advertising/marketing is good/excellent 47
Advertise it more on TV/radio/ Supersport 20
Well organised 10
Cannot comment/don't know 5
Advertise at schools 4
Advertise more 3
Advertise early with all media 3
Advertise through sports magazines 2
Live TV coverage of the race 2
Put it on the website 1
Advertise through billboards 1
Better communication with booking 1Company stand allocation is poor 1
Entrance price is getting expensive 1
Market accommodation around the area 1
More advertising to more culturally diverse medium 1
More coverage in news papers 1More visibility of the results at the venue 1Should have more accommodation locally 1
Total 100
Marketing Improvement Suggestions: 2010 Event
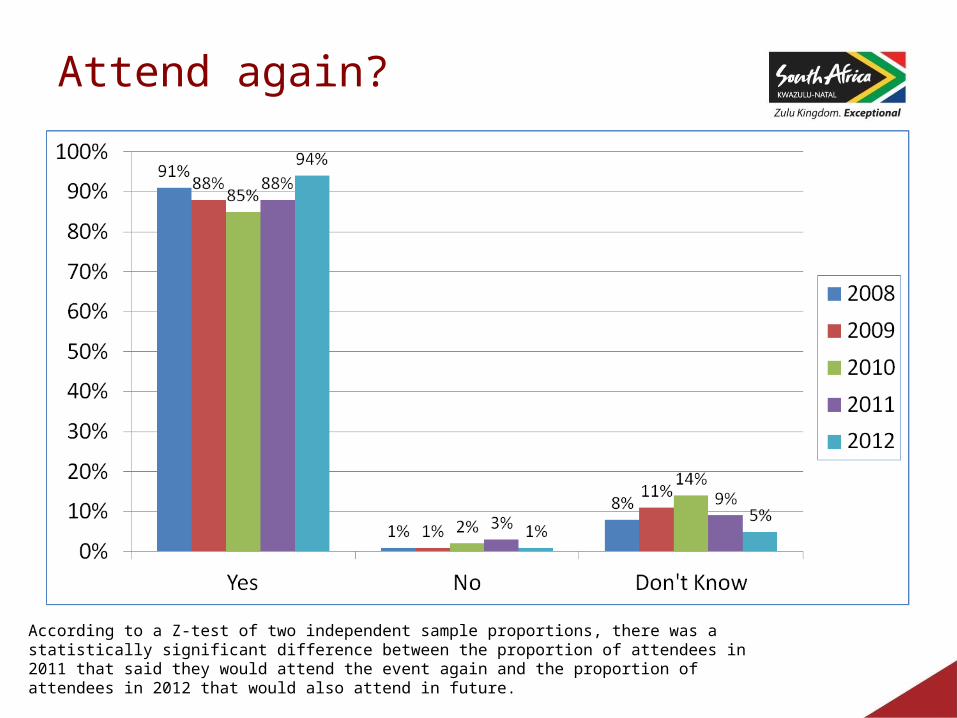
Attend again?
According to a Z-test of two independent sample proportions, there was a statistically significant difference between the proportion of attendees in 2011 that said they would attend the event again and the proportion of attendees in 2012 that would also attend in future.
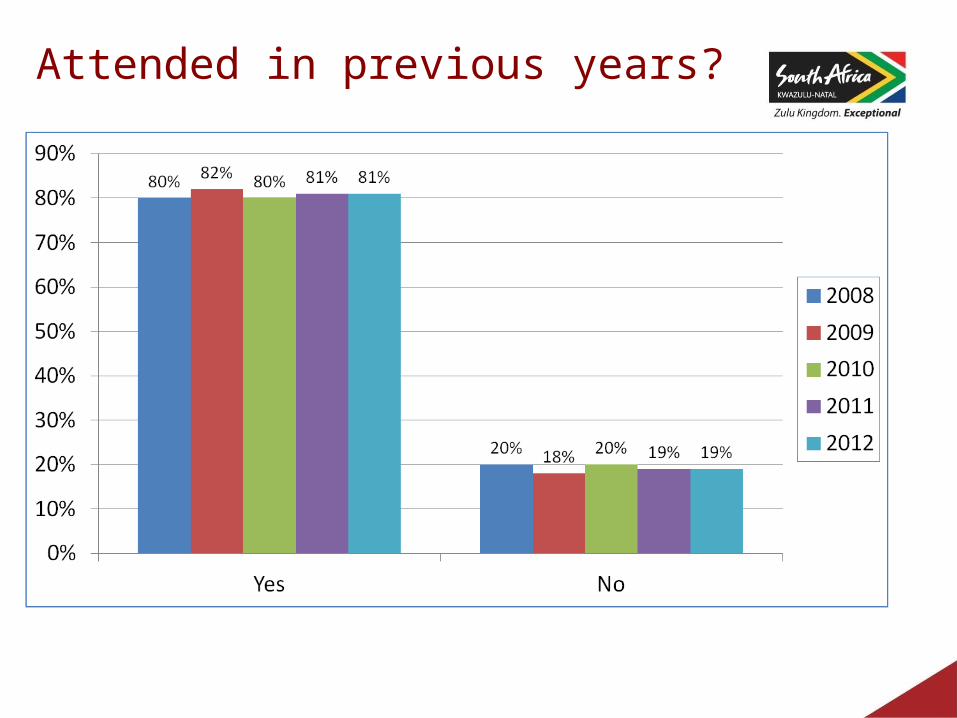
Attended in previous years?
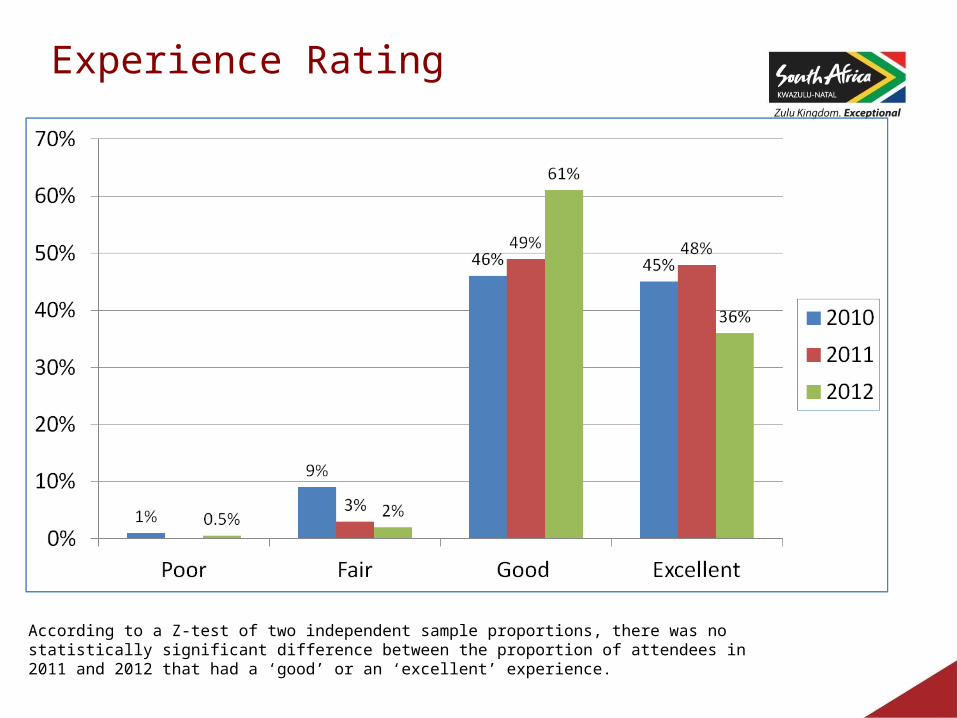
Experience Rating
According to a Z-test of two independent sample proportions, there was no statistically significant difference between the proportion of attendees in 2011 and 2012 that had a ‘good’ or an ‘excellent’ experience.

Experience problems?

Problems that were experienced were cited as follows:
1. No ATMs
2. No rubbish bins/shortage of the bins
3. Slow registration/the change of a registration system
4. Dirty toilets/no toilet paper in toilets
5. High food prices
6. No halal catering
7. Taxis that were transporting people were insufficient
8. Noise made by the generators
9. Event was too crowded
10. Communication breakdown with people with disabilities
Problems that were experienced in 2011 were as follows:• Parking• Registration for double mile• Heavy traffic• Not enough information
Experience problems?
There were many more problems during the 2012 event compared to 2011. The organizers should attend to these problems as they could pose as a deterrence in attending future events.
Installation of temporary ATMs may play a role in improving the economic value of the event on the region. Consequently, it would also be of benefit to the variety of stalls that are found at the event in terms of possible increased profit margins.
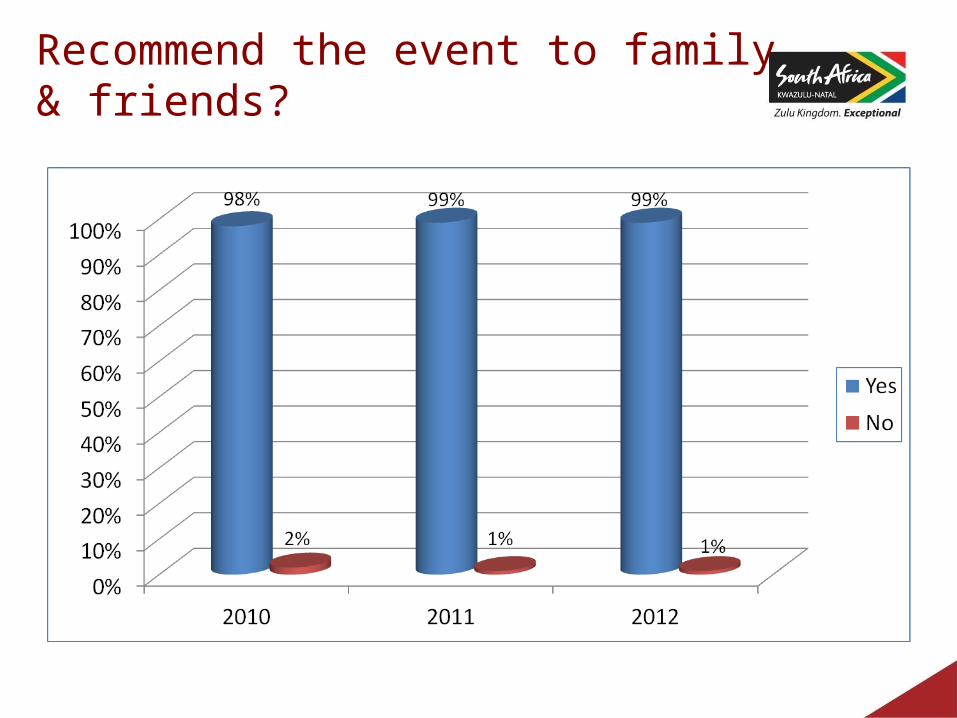
Recommend the event to family & friends?
Reasons for Recommending the Event
Respondents cited the following reasons for recommending the event:
• Good sport• It’s fun/enjoyable• It’s a well organized/run event• It’s a family event• Good way to exercise• Good social event• It’s an event for all ages• It promotes healthy lifestyle/fitness• Beautiful atmosphere• Good for children• It’s an internationally recognized outdoor event that promotes KZN

Recommend KZN as a tourist destination to family & friends?
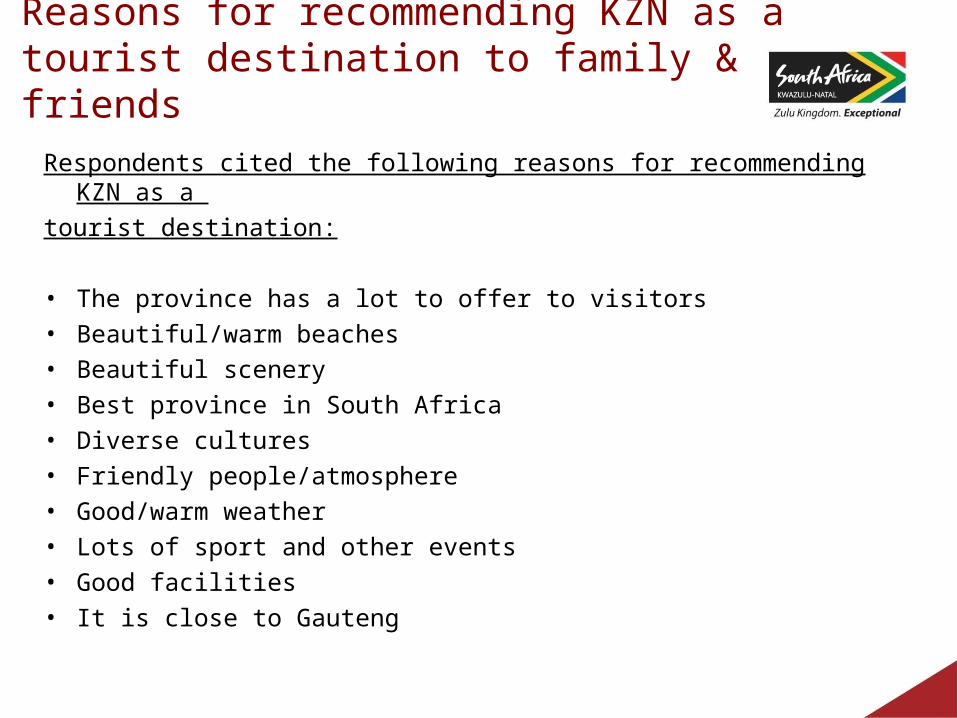
Reasons for recommending KZN as a tourist destination to family & friends
Respondents cited the following reasons for recommending KZN as a
tourist destination:
• The province has a lot to offer to visitors• Beautiful/warm beaches• Beautiful scenery• Best province in South Africa• Diverse cultures• Friendly people/atmosphere• Good/warm weather• Lots of sport and other events• Good facilities• It is close to Gauteng
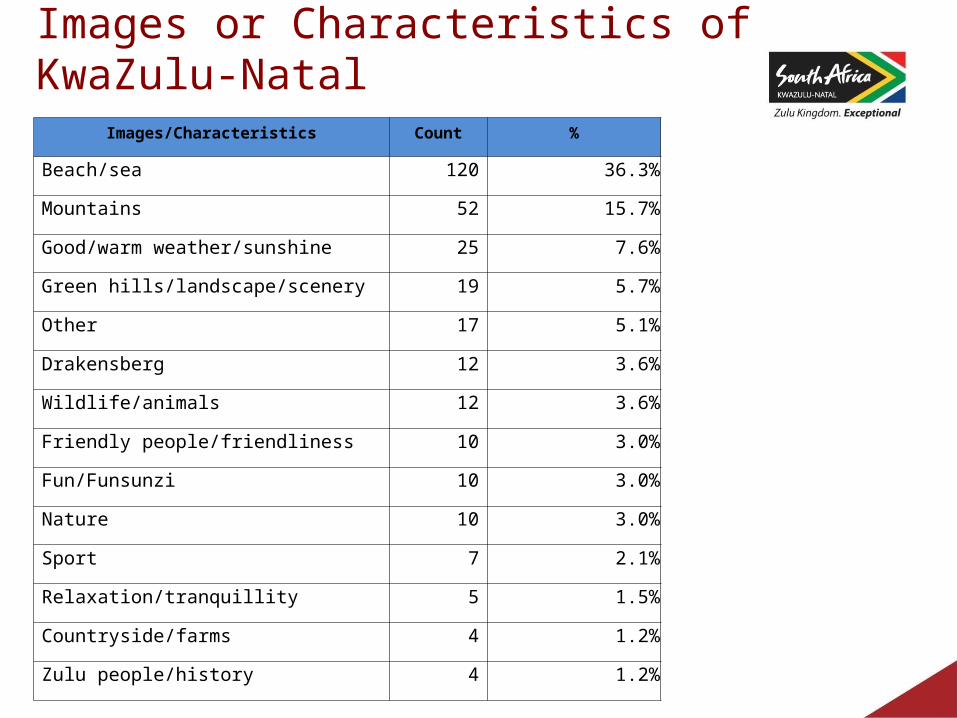
Images/Characteristics Count %
Beach/sea 120 36.3%
Mountains 52 15.7%
Good/warm weather/sunshine 25 7.6%
Green hills/landscape/scenery 19 5.7%
Other 17 5.1%
Drakensberg 12 3.6%
Wildlife/animals 12 3.6%
Friendly people/friendliness 10 3.0%
Fun/Funsunzi 10 3.0%
Nature 10 3.0%
Sport 7 2.1%
Relaxation/tranquillity 5 1.5%
Countryside/farms 4 1.2%
Zulu people/history 4 1.2%
Images or Characteristics of KwaZulu-Natal
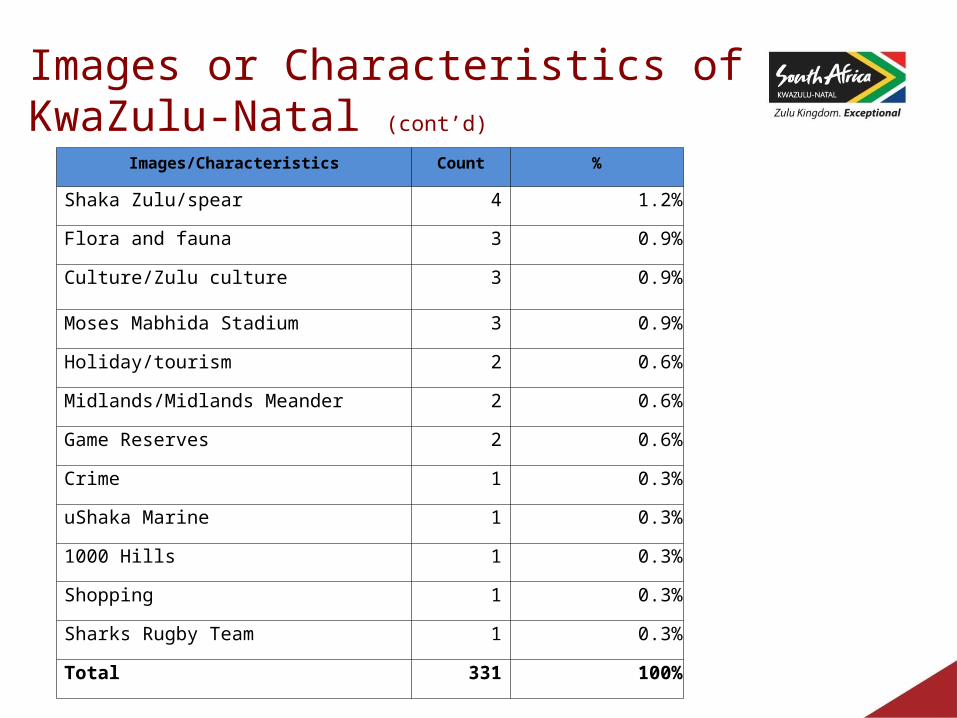
Images or Characteristics of KwaZulu-Natal (cont’d)
Images/Characteristics Count %
Shaka Zulu/spear 4 1.2%
Flora and fauna 3 0.9%
Culture/Zulu culture 3 0.9%
Moses Mabhida Stadium 3 0.9%
Holiday/tourism 2 0.6%
Midlands/Midlands Meander 2 0.6%
Game Reserves 2 0.6%
Crime 1 0.3%
uShaka Marine 1 0.3%
1000 Hills 1 0.3%
Shopping 1 0.3%
Sharks Rugby Team 1 0.3%
Total 331 100%
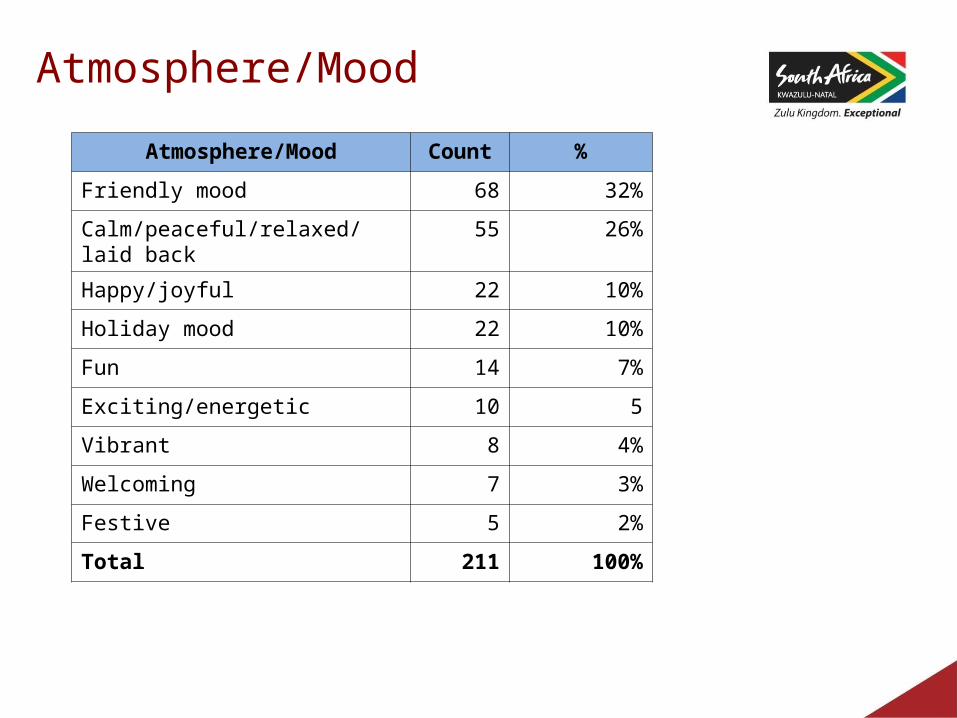
Atmosphere/Mood
Atmosphere/Mood Count %
Friendly mood 68 32%
Calm/peaceful/relaxed/laid back 55 26%
Happy/joyful 22 10%
Holiday mood 22 10%
Fun 14 7%
Exciting/energetic 10 5
Vibrant 8 4%
Welcoming 7 3%
Festive 5 2%
Total 211 100%
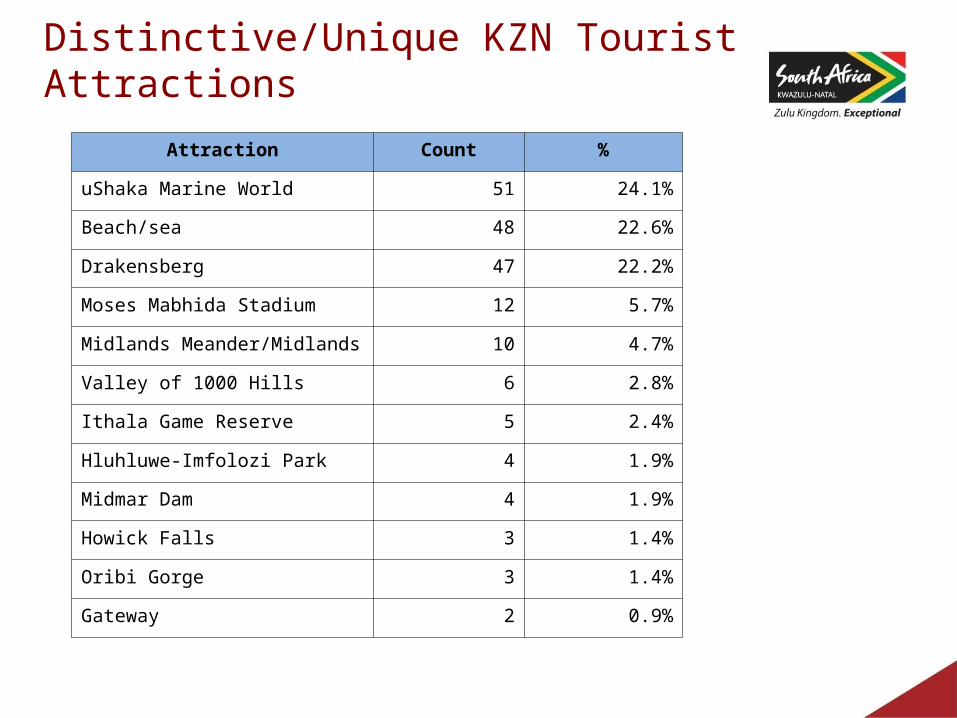
Distinctive/Unique KZN Tourist Attractions
Attraction Count %
uShaka Marine World 51 24.1%
Beach/sea 48 22.6%
Drakensberg 47 22.2%
Moses Mabhida Stadium 12 5.7%
Midlands Meander/Midlands 10 4.7%
Valley of 1000 Hills 6 2.8%
Ithala Game Reserve 5 2.4%
Hluhluwe-Imfolozi Park 4 1.9%
Midmar Dam 4 1.9%
Howick Falls 3 1.4%
Oribi Gorge 3 1.4%
Gateway 2 0.9%
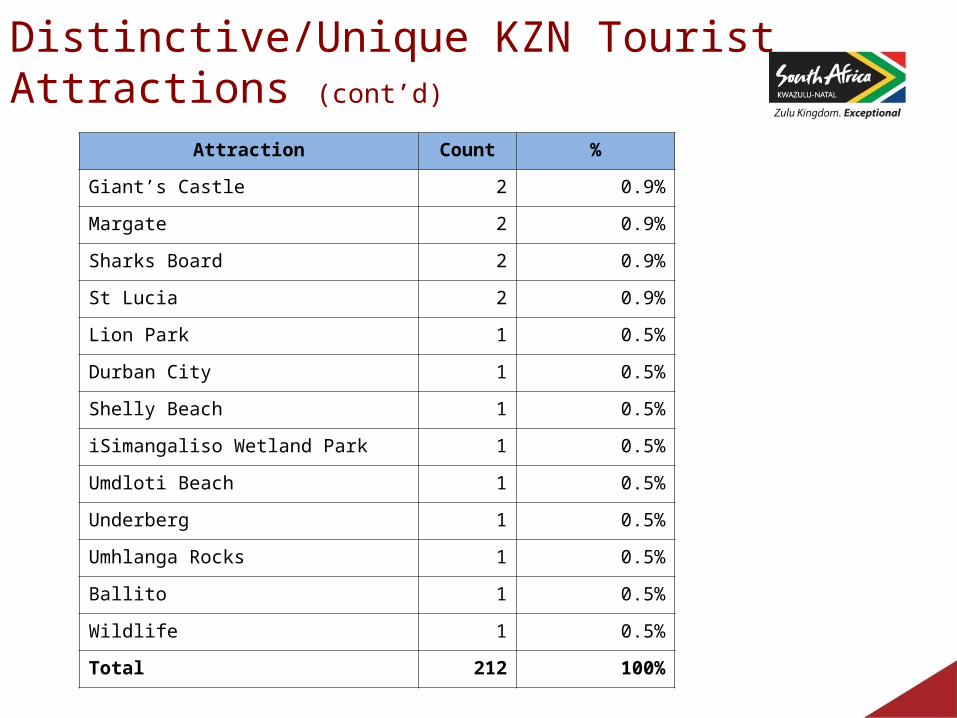
Distinctive/Unique KZN Tourist Attractions (cont’d)
Attraction Count %
Giant’s Castle 2 0.9%
Margate 2 0.9%
Sharks Board 2 0.9%
St Lucia 2 0.9%
Lion Park 1 0.5%
Durban City 1 0.5%
Shelly Beach 1 0.5%
iSimangaliso Wetland Park 1 0.5%
Umdloti Beach 1 0.5%
Underberg 1 0.5%
Umhlanga Rocks 1 0.5%
Ballito 1 0.5%
Wildlife 1 0.5%
Total 212 100%
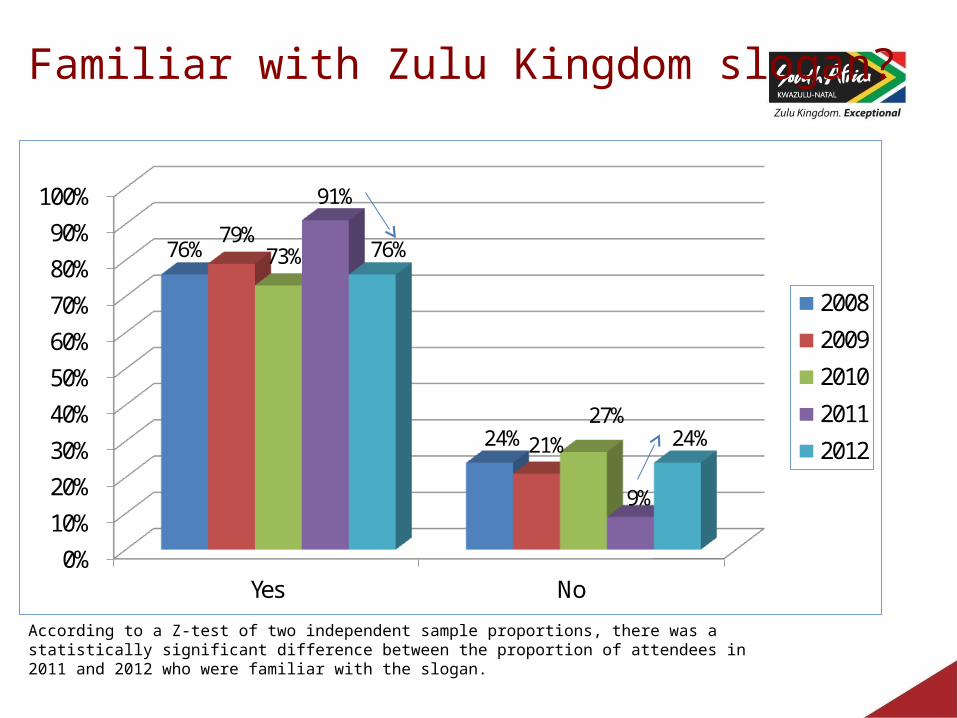
Familiar with Zulu Kingdom slogan?
0%10%20%30%40%50%60%70%80%90%
100%
Yes No
76%
24%
79%
21%
73%
27%
91%
9%
76%
24%
2008
2009
2010
2011
2012
According to a Z-test of two independent sample proportions, there was a statistically significant difference between the proportion of attendees in 2011 and 2012 who were familiar with the slogan.
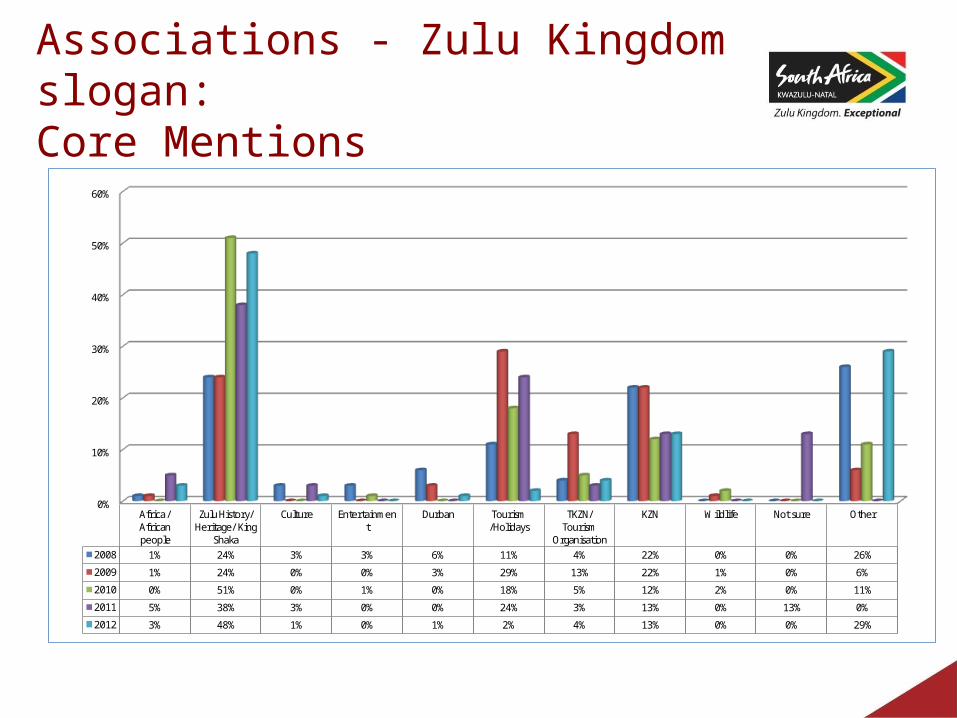
Associations - Zulu Kingdom slogan:Core Mentions
0%
10%
20%
30%
40%
50%
60%
Africa / African people
Zulu History/ Heritage/ King
Shaka
Culture Entertainment
Durban Tourism /Holidays
TKZN/ Tourism
Organisation
KZN Wildlife Not sure Other
2008 1% 24% 3% 3% 6% 11% 4% 22% 0% 0% 26%
2009 1% 24% 0% 0% 3% 29% 13% 22% 1% 0% 6%
2010 0% 51% 0% 1% 0% 18% 5% 12% 2% 0% 11%
2011 5% 38% 3% 0% 0% 24% 3% 13% 0% 13% 0%
2012 3% 48% 1% 0% 1% 2% 4% 13% 0% 0% 29%
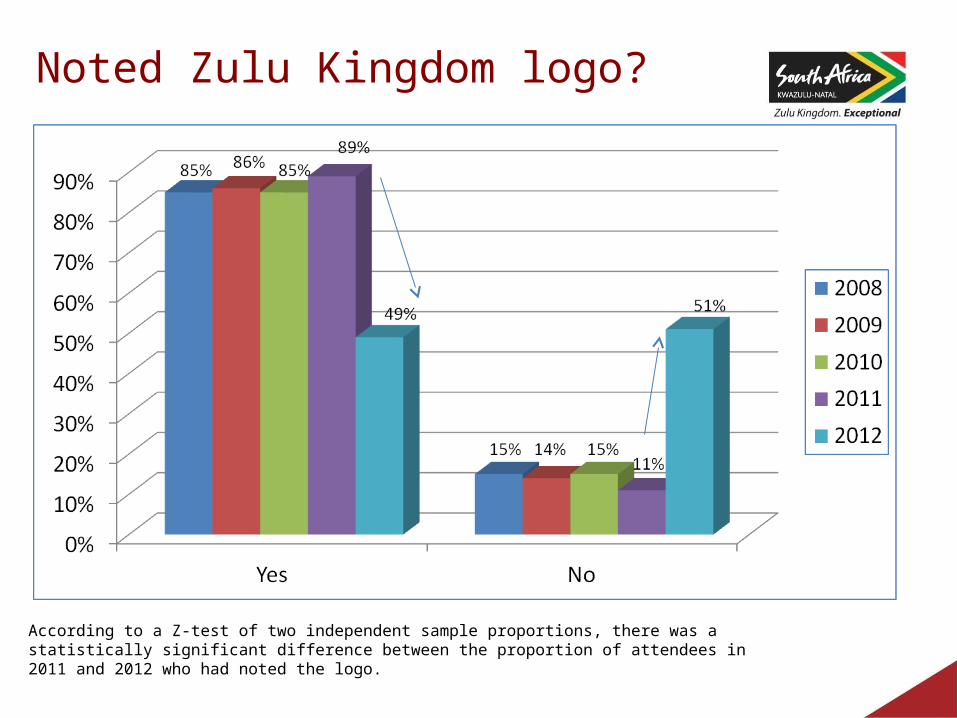
Noted Zulu Kingdom logo?
According to a Z-test of two independent sample proportions, there was a statistically significant difference between the proportion of attendees in 2011 and 2012 who had noted the logo.
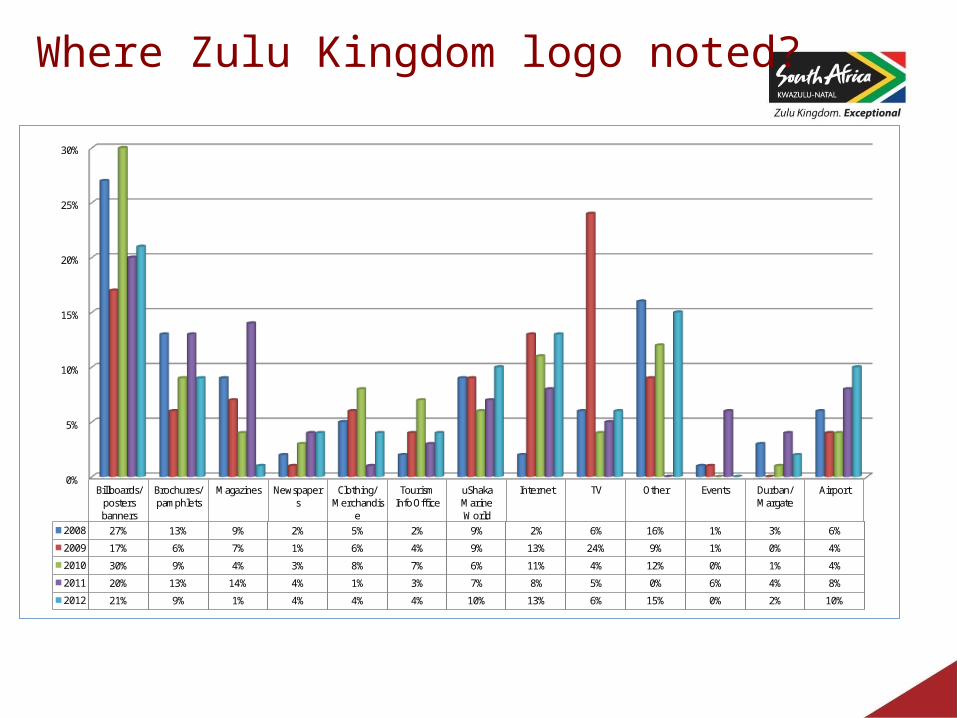
Where Zulu Kingdom logo noted?
0%
5%
10%
15%
20%
25%
30%
Billboards/ posters banners
Brochures/ pamphlets
Magazines Newspapers
Clothing/ Merchandis
e
Tourism Info Office
uShaka Marine World
Internet TV Other Events Durban/ Margate
Airport
2008 27% 13% 9% 2% 5% 2% 9% 2% 6% 16% 1% 3% 6%
2009 17% 6% 7% 1% 6% 4% 9% 13% 24% 9% 1% 0% 4%
2010 30% 9% 4% 3% 8% 7% 6% 11% 4% 12% 0% 1% 4%
2011 20% 13% 14% 4% 1% 3% 7% 8% 5% 0% 6% 4% 8%
2012 21% 9% 1% 4% 4% 4% 10% 13% 6% 15% 0% 2% 10%

Event Improvement Suggestions
The respondents made the following suggestions in terms of
improving the event in future:
1. Bigger beer tent
2. Cleaner toilets/provide executive portable toilets
3. Install ATMs
4. Corporate tents should not block spectators’ view
5. Encourage other race groups, especially black people, to take part in the event
6. More seating areas for spectators
7. There should be live entertainment
8. Initiate other water activities besides swimming
9. Install swimming pools for kids
10. Provide change rooms
11. More rubbish bins
12. Additional entrance/ develop ways to reduce traffic queue
13. More halal stalls/ variety of food stalls
14. More parking area

Event Improvement Suggestions (cont’d)
15. More signage
16. Provide late registration desk at the start and the finish points
17. Registration should be opened at the dam on Friday
18. The event should run for 3 days – from friday to sunday
19. Provide electricity on camp sites to avoid noise made by generators
20. Provide information board
21. More shaded areas for the spectators
22. Facilities to cater for people with disabilities
23. More coffee outlets and toilets at the registration site
24. Provide taps to wash hands/ for drinking water
25. Cut the number of swimmers within each category
26. Break the event to further age groups
27. Provide parking in Howick/PMB/Midlands area and have buses that will transport spectators and swimmers to the dam
1. Although there seemed to have been an increase in overnight and day visitors, a Z-test of two independent sample proportions suggested that this was not statistically significant. Nevertheless, it appears that the Midmar Mile attracts mainly people from outside the Midlands area. This is good in a sense that there is ‘new’ money that is injected into the local economy.
2. As the event attracts visitors to the area, it appears that such visitors mainly come from within the province of KZN as well as Gauteng. A Z-test revealed that there was a statistically significant difference between the proportion of Gauteng attendees in 2011 and 2012 events. This may suggests two things. Firstly that the end is marketed extensively in this two provinces. Secondly, it suggests that the majority of swimming clubs are possibly dominant in this provinces.
3. The majority of visitors stayed for 2 nights for the event. A Z-test of two independent sample proportions indicated that there was statistically significant difference between the proportion of visitors that stayed for 2 nights in 2012 when compared to 2011. Generally, visitors to the Midmar Mile usually stay for 2 nights which is in line with duration of the event.
4. The main forms of accommodation that were utilised by respondents were B&B establishments and camping facilities. Most visitors also stayed with family and friends. This gives an indication that respondents opted for more ‘affordable’ accommodation.
Findings

5. Previous research has shown that the main two factors that influenced people to attend the event were word-of-mouth as well as previous participation. The 2012 event was no exception. This indicates that people were satisfied with what they had been told about the event. It also suggests that they were satisfied with their previous participation.
6. The majority of respondents were satisfied with the event information that was provided through various channels such as newspapers/magazines and posters.
7. Respondents were happy with how the event was marketed. However, there were suggestions for improvement such as:
– TV advertisement– Radio Advertisement– The use of social media networks
8. It is positive to report that 94% of the respondents said they would attend the event again. This talks to the satisfaction levels pertaining to the event. Furthermore, according to a Z-test of two independent sample proportions, there was a statistically significant difference between the proportion of attendees in 2011 and 2012 who said they would attend the event again.
9. Although there seemed to be an increased number of respondents that said they had a ‘good’ experience, a Z-test indicated that there was no statistically significant difference between the proportion of visitors in 2011 and 2012 who had had such an experience.
Findings (cont’d)
Findings (cont’d)
10. The majority of respondents (99%) said they would recommend the event to family and friends for the following reasons:
– Family event– Fun/enjoyable– Good sport– Well organized/run event
11. Over 95% of respondents said they would recommend KZN as a tourist destination to family and friends for the following reasons:
– Beautiful/warm beaches– Friendly people/atmosphere– Good facilities– Beautiful scenery
12. The top 4 images/characteristics of KZN were cited as:– Beach/sea– Mountains– Good/warm weather/sunshine– Green hills/landscape/scenery
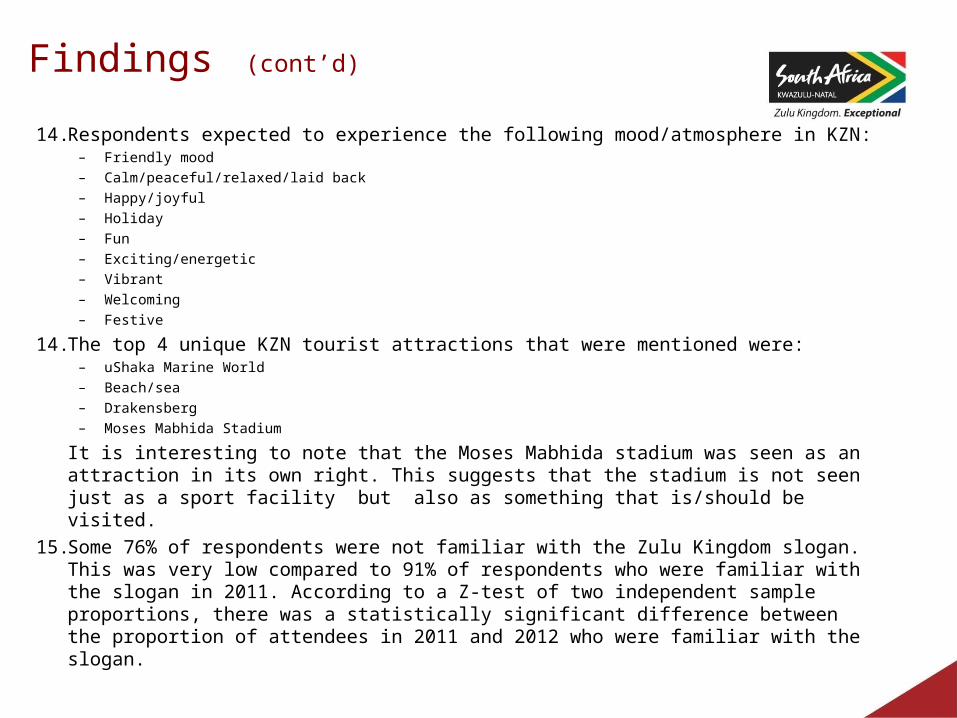
14. Respondents expected to experience the following mood/atmosphere in KZN:– Friendly mood– Calm/peaceful/relaxed/laid back– Happy/joyful– Holiday– Fun– Exciting/energetic– Vibrant– Welcoming– Festive
14. The top 4 unique KZN tourist attractions that were mentioned were:– uShaka Marine World– Beach/sea– Drakensberg– Moses Mabhida Stadium
It is interesting to note that the Moses Mabhida stadium was seen as an attraction in its own right. This suggests that the stadium is not seen just as a sport facility but also as something that is/should be visited.
15. Some 76% of respondents were not familiar with the Zulu Kingdom slogan. This was very low compared to 91% of respondents who were familiar with the slogan in 2011. According to a Z-test of two independent sample proportions, there was a statistically significant difference between the proportion of attendees in 2011 and 2012 who were familiar with the slogan.
Findings (cont’d)
Findings (cont’d)
15. The slogan was mainly associated with Zulu history/heritage/King Shaka .
16. The noting of the logo decreased from 89% in 2011 to 49% in 2012. According to a Z-test of two independent sample proportions, there was a statistically significant difference between the proportion of attendees in 2011 and 2012 who had noted the logo. It is important to note that this was a new logo that was tested, hence a major decrease from 2011.
17. The logo was noted mainly in billboards, posters or banners. It is possible that this also relates to banners that were put up at the Midmar dam as they were widely visible.
The recommendations are based on the factors that were raised by respondents that require attention:
•The organizers to consider installing mobile ATM machines. This will assist in contributing towards the amount that is spent during the event.
•The organizers to arrange for food stalls that will cater for attendees with Halal food requirements so as to increase satisfaction levels.
In terms of the marketing activities of TKZN, it is recommended that the organization develops and rolls out a campaign to familiarize the public with the new branding elements – the slogan and logo- so as to recapture the loss of brand equity which occurred as a result of the re-branding exercise.
Recommendations