migration report of jharkhand
TRANSCRIPT
1 | P a g e
Acknowledgements
This report is a result of many people’s hard work and dedication. I would like to take this
opportunity to extend sincere thanks and gratitude to all of them on behalf of Society for
Labour and Development (SLD).
I express my heartfelt gratitude to Anannya Bhattacharjee, President of Garment and Allied
Workers Union (GAWU), Haryana for her help in conceptualizing this report at various
stages of the research. Her insights into labour issues and guidance to conduct the research
have enriched the content of this report. Her support was also crucial in conducting field
work among migrant workers in Gurgaon.
The grassroots organizations in Gurgaon, Nari Shakti Manch and Mazdoor Ekta Manch, were
instrumental in providing outreach to the migrant workers in Gurgaon and their families in
Jharkhand. The community organizers in the states of Uttar Pradesh, Bihar and Jharkhand –
Touqir, Sugra and Rakesh were instrumental in verifying the situation in rural regions, which
are source areas of migration. My thanks to all of them for their hard work and
commitment.
Efforts of Rajneesh and Muqbil in analyzing the data and editing the content respectively
were of immense help in finalizing the report. My sincere thanks to Muqbil and Rajneesh.
Sandhya contributed whole-heartedly in printing the report. The staff in SLD provided
conducive environment to work on this report and their daily support was crucial in carrying
forward the work. My sincere thanks to Sunila, Retu and Amarnath.
I am thankful to Rosa Luxemburg Foundation, South Asia for extending much needed
financial support to the project. Their continuous support and encouragement to engage
with labour issues is heartening.
Finally, my sincere thanks and gratitude to the migrant workers in Hazaribag district of
Jharkhand; who were friendly, informative and quite insightful in describing their issues and
conditions. Their capacity to sustain in most difficult and very hard-working environment
with the hope for better future of their family was the central source of inspiration to
conduct this research.
Parimal Maya Sudhakar Senior Programme Manager – Research Society for Labour and Development, New Delhi [email protected] +91-8800241099 011-26525806
2 | P a g e
Table of Contents
1) Executive Summary 03
2) List of Tables 07
3) Introduction 08
4) Sources of Migration Data 14
5) Different Flows of Migration 20
6) Inter-State Migration 27
7) Rationale of the Project 33
8) Objectives of the Project 34
9) Methodology 35
10) Profile of Hazaribag District 36
11) Key Findings 37
12) Conclusion 51
13) Recommendations 56
14) Annexure - 1 62
15) Annexure – 2 65
16) Annexure – 3 77
Annexure 1: Inter-state Migrant Workmen Act, 1979
Annexure 2: Profile of Organizations Working on Migration Issue
Annexure List: List of Organizations Working on Migration Issue

3 | P a g e
Executive Summary
Migration and urbanization are two important inter-related phenomena of economic
development. If channelized properly, it has the potential of societal transformation.
Otherwise, it can be not only counter-productive for the societal harmony but also
disastrous for the long term economic development. The historical experiences have proved
that process of migration is unstoppable in modern times. The migrant workers are key
force behind rising contribution of urban conglomerations to India’s GDP. Migrants are
indispensable but mostly invisible key actors in cities’ development. Rural migrants in urban
spaces are socially mobile, culturally flexible and economically aspiring people. Migrants are
an important component of social dynamism and material development of the society. They
can also be tools of cultural amalgamation and innovation. Yet, they are most vulnerable to
economic exploitation and social stereotyping.
The contribution of migrants to the GDP of the country goes unnoticed. It is estimated that
the migrants contribute no less than 10% to the country’s GDP.1 Many other positive as well
as potential impact through the migration process remains unrecognized. According to
Census 2001, in India, internal migrants account for as large as 309 million, which was about
28% of the then total population. More recent numbers, as revealed by NSSO (2007-08),
show that there are about 326 million internal migrants in India, i.e. nearly 30% of the total
population. Almost 70% of all the migrants are women, the fact often forgotten and lost in
the data on migration.
The migrants face plethora of difficulties – such as – lack of identity proofs at destination
places, exclusion from democratic process, pathetic living conditions and exploitative
working conditions. Migrant women and children are extremely vulnerable to trafficking
and sex exploitation. The migrants are often excluded from state provided health and
education services as well as public distribution system. This is despite the fact that the
phenomena of migration has tremendous potential to alter the age-old social inequality
providing avenues of economic progress to the downtrodden. 1 P. Deshingkar and S. Akter, Migration and Human Development in India, Human Development Research
Paper, UNDP, 2009.
4 | P a g e
The migration process is an important tool to break old feudal bondage, including the caste
system, in the rural area. Migrants bring back to the source place hoards of new
information, skills, knowledge about new technology, new attitude and most importantly –
rising aspiration. Due to lack of a comprehensive policy on migration, the potential of the
migration process is not explored and the problems related to migration are not addressed.
Internal migration has mostly helped the migrant’s family to survive in difficult financial
conditions, i.e., due to migration the family has not fallen into the trap of abject poverty. At
the same time, the remittances by the migrant member have resulted in repayment of loan
and bearing the cost of medical treatment to some extent. The remittances have helped
some families to construct pacca houses and support children’s education. These are not
insignificant achievements in rural areas. If the household’s income rises in the village, there
is ground to believe that the remittances sent by the migrants will be used more on health
and education needs of the family as well as to increase the assets of the family.
The key issues emerging from this study are the need to strengthen employment
opportunities in rural areas, ensure informed migration from village to urban spaces,
guarantee living wage to the migrant workers in the cities and enactment of a legal
framework to protect human dignity of migrant workers. Otherwise, poor will continue to
migrate from vulnerable to vulnerable situation without any substantial increase in their
standard of living. There is an urgent need to develop a holistic approach to address the
multiple challenges that migrant population face on a day today basis.
Internal migration is a cross-sectoral process requiring interventions at multiple levels and
interaction among various stake-holders. Migration involves women-men-children, young
and old, migrating in a family or alone, for a short term or a long term period, within one’s
district or other districts in the same state or to the different state. The process of migration
touches the entire process of human life – identity, benefits from the state, dignity of
labour, values of laws etc etc. Therefore, there is a necessity to develop a governance
system for internal migration in India – a system involving rural and urban institutions,
different state governments, central government, International Labour Organization, trade
unions and the civil society.
5 | P a g e
Rationale of the Project: The four-fold research undertaken by the Society for Labour and
Development traces the forward and backward linkages of workers in Haryana who have
migrated from villages in Uttar Pradesh, Bihar and Jharkhand. The research also analyses
the factors that drive rural to urban migration, and the socio-economic profile of the
migrant workers’ families in the villages. This report is the fourth part of the project
Researching Labour and Migration between Home and Destination States and Developing
a Holistic Rural-Urban Approach. Earlier, the two reports explored the reasons and
processes of rural to urban migration and its impact on rural society in Uttar Pradesh and
Bihar while the third report dealt with working and living conditions of migrant workers in
Gurgaon.
Methodology: The research consists of primary and secondary data from Hazaribag district
of Jharkhand. The primary data collection targeted 200 respondents in Hazaribag districts.
Focus group discussions (FGDs) were conducted with the help of Participatory Rural
Appraisal tools. Total 5 FGDs were conducted in 5 villages of the district. Apart from it,
structured interviews were conducted with one government official and one representative
of a civil society organization working among migrants in the selected districts.
Key Findings: Lack of sufficient livelihood opportunity stands out as the single most cited
reason for migrating to the urban area. The above discussion on economic condition, in
deed, pointed towards miserable situation in the rural area with regard to income of the
household as well amenities government is supposed to provide to the rural population.
78% of the respondents said that their family member(s) migrated because of the
inadequate employment opportunities in the village. 8% of respondents said that loss of
income from traditional livelihood of the family caused the family member(s) to migrate to
the urban area. 6% of the respondents said that worries about children’s future, like support
to education, marriage etc, made the family member(s) to migrate in search of additional
income for the family. 8% of the respondents said that their family member had migrated by
keeping them in the dark. Means, they have no knowledge of why and where the family
member has migrated. During the FGDs, it was found that many girls from the villages and
nearby areas are eloping with the sub-agents to cities. The family members decried that the
sub-agents lured the young girls with promise of hefty pays and city-life and succeeded in
taking them to the cities.

6 | P a g e
The internal migration has mostly helped the migrant’s family to survive in the
difficult financial conditions, i.e. due to migration the family has not fallen into the trap of
the abject poverty. At the same time, the remittances by the migrant member have resulted
in supporting children’s education and bearing the cost of medicines to some extent. The
remittances have helped some families to construct pacca houses and repayment of loans.
These are no lesser achievements in rural areas.
If the household’s income rises in the village, there is a ground to believe that the
remittances sent by the migrants will be used more on health and education needs of the
family as well as to increase the assets of the family.
The problems faced by the family due to migration of a key family member are
mostly unnoticed, undocumented and hence remain unaddressed. The temporary nature of
work in the informal sector in the urban areas where most of the migrant workers get
employment is a cause of concern for families in the village. When a migrant visits home;
uncertainty of continuance of his employment after his/her return, is a major worry for the
families in the village as well as for the migrant himself/herself. Impact of migration on
women is less explored, less known area so far. The women who migrated for work shoulder
double burden of responsibilities – at household and at the workplace. They have to adjust
with different cultural and social set up. While they lack the support of family members in
case of need (e.g. illness etc), at the same time, they feel empowered and liberated in a
certain sense as their behaviour and movement are not under the constant monitoring of
other family members. Similarly, the women in the family – particularly wife - who are left
behind by the migrant members constantly need to guard one’s honour and dignity. Many
of them are viewed with suspicion of extra-marital relationship by villagers, their own family
members and some time by the husband also. At the same time, many women feel
empowered with the sense that they are taking care of children, elders in the family and
managing financial affairs of the family. The government institutions and elected local
bodies such as Panchayats do not keep records of the migrants. Due to lack of
comprehensive official data on number of migrants, destination places and nature of work
there and remittances, ‘migration’ has remained a least priority area in government policies.
In fact, it can be argued that due to least priority accorded to the migration issue, the
governments have not taken initiatives to establish data gathering and registration
mechanisms. This implies to the urban administration as well.

7 | P a g e
List of Tables
o Table 1: Migration as per Place of Last Residence Criterion
o Table 2: Age Composition of Migrants by Residence and Sex in India, 2001 (in %)
o Table 3: Percentage Distribution of Migrants by Marital Status and Age
o Table 4: Percentage Distribution of Migrants by Reasons for Migration and Sex, 2001
Census
o Table 5: Distribution of Internal Migrants by Distance Categories in India 2001
o Table 6: Distribution of Internal Migrants by Streams in India 2001
o Table 7: Situation of Internal Migrants in Rural and Urban Areas of India, 2007-08
o Table 8: Reasons for Migration of Migrants by Last Residence
o Table 9: Reasons for Migration by Streams and Distance Categories in India
o Table 10: Reasons for Migration of Migrants (Marriage Excluded) by Last Residence
o Table 11: Total Inter-state Migrants by Place of Birth in Major States
o Table 12: Number of In-migrants by Last Residence into Important UAs
o Table 13: Industry-wise Representation of Respondents
o Table 14: Distribution of Land Owning Workers
o Table 15: Reasons for Staying Alone in Gurgaon
o Table 16: Reasons for Migration
o Table 17: Frequency and Reasons For Home Visits
o Table 18: Workplace Punishments
o Table 19: Comfort in Finding Rented House
o Table 20: Last Disease Afflicting the Respondent in Gurgaon
o Table 21: Sexual Harassment of Migrant Women
o Table 22: Repayment of Debt
o Table 23: Workers’ Satisfaction Level
8 | P a g e
Introduction
Internal migration is an essential and inevitable component of the economic and
social life of a country. Migrants2 constitute a floating and invisible population, alternating
between source and destination areas and remaining on the periphery of the society.
According to Census 2001, in India, internal migrants account for as large as 309
million, which was about 28% of the then total population. More recent numbers, as
revealed by NSSO (2007-08), show that there are about 326 million internal migrants in
India, i.e. nearly 30% of the total population. Almost 70% of all the migrants are women, the
fact often forgotten and lost in the data on migration. The contribution of migrants to the
GDP of the country goes unnoticed. It is estimated that the migrants contribute no less than
10% to the country’s GDP.3 Many other positive as well as potential impact through the
migration process remains unrecognized.
2 According to the Indian Census, a person is considered as migrant if his place of birth is different from the place where he is being enumerated or if the place in which he is being enumerated during the census is other than his place of last residence. 3 P. Deshingkar and S. Akter, Migration and Human Development in India, Human Development Research
Paper, UNDP, 2009.
Earlier, studies on internal migration have indicated a decline in
population mobility up to 1990s. However, the post-economic reform
period has witnessed a spurt in internal migration, which is confirmed by
Census of India, 2001, and NSSO study done during 2007-08.
Pointing out the immense growth in internal migration, Eminent journalist, P. Sainath once wrote, “In 1993 there was only one bus every week between Mehbubnnagar in Andhra Pradesh to Mumbai. In 2003, there were as many as 45 buses plying every week between these two destinations excluding private bus services. The increase was a result of the people migrating to the Mumbai-Pune belt in search of employment.” Sainath further pointed out, “Since 2008, the bus service has declined to 28 per week as a result of Mahatma Gandhi National Rural Employment Guarantee Scheme (MGNREGS).”
Another example is the demand on Indian Railways to increase its services during the festival season between particular destinations. For example, in 2011, the Northern Railways ran 74 special trains to clear the rush of passengers travelling during Chhhat festival. Similarly, in 2012, the Southern Railways ran special trains for passengers during Pongal festivities.

9 | P a g e
Socio-economic changes taking place in India in the epoch of globalization have a
strong imprint of the internal migration process. The economic reform policy in the era of
globalization aims to reduce governmental expenditure in order to reduce fiscal deficit,
promotes export-oriented growth, lessens governmental controls and licensing, and
encourages private participation for competition and efficiency. It is argued by the
supporters of this policy as well as its opponents that the economic reforms would result in
enormous increase in the internal migration of the population.
There is a clear evidence of an increase in the flow of migration from rural areas to urban
areas and from industrially less developed states to industrially more developed states.
Overall, there is a significant increase in the pattern of migration from agricultural sector to
non-agricultural sectors.
There are two dominant streams in the migration studies. The debate revolves
around the structural logic of capitalist development versus individual rationality and
Supporters of economic reform argue
that the impetus provided to
investment and competition has
resulted in a boost to economic
growth and job opportunities. This
has led to pull factors accelerating
rural to urban migration.
Opponents of the economic reform argue
that the new policy is adversely affecting
agriculture as well as village and cottage
industries resulting in impoverishment of
rural population. This condition is pushing
the people to migrate to urban areas in
search of livelihood.
Lead source states of internal migrants include Uttar Pradesh,
Bihar, Rajasthan, Madhya Pradesh, Andhra Pradesh, Chhattisgarh,
Jharkhand, Odisha, Uttarakhand and Tamil Nadu, whereas key destination
areas are Delhi, Maharashtra, Gujarat, Haryana, Punjab and Karnataka.
There are conspicuous migration corridors within the country: Bihar to
National Capital Region (NCR), Bihar to Haryana and Punjab, Uttar
Pradesh to Maharashtra, Odisha to Gujarat, Odisha to Andhra Pradesh
and Rajasthan to Gujarat.
10 | P a g e
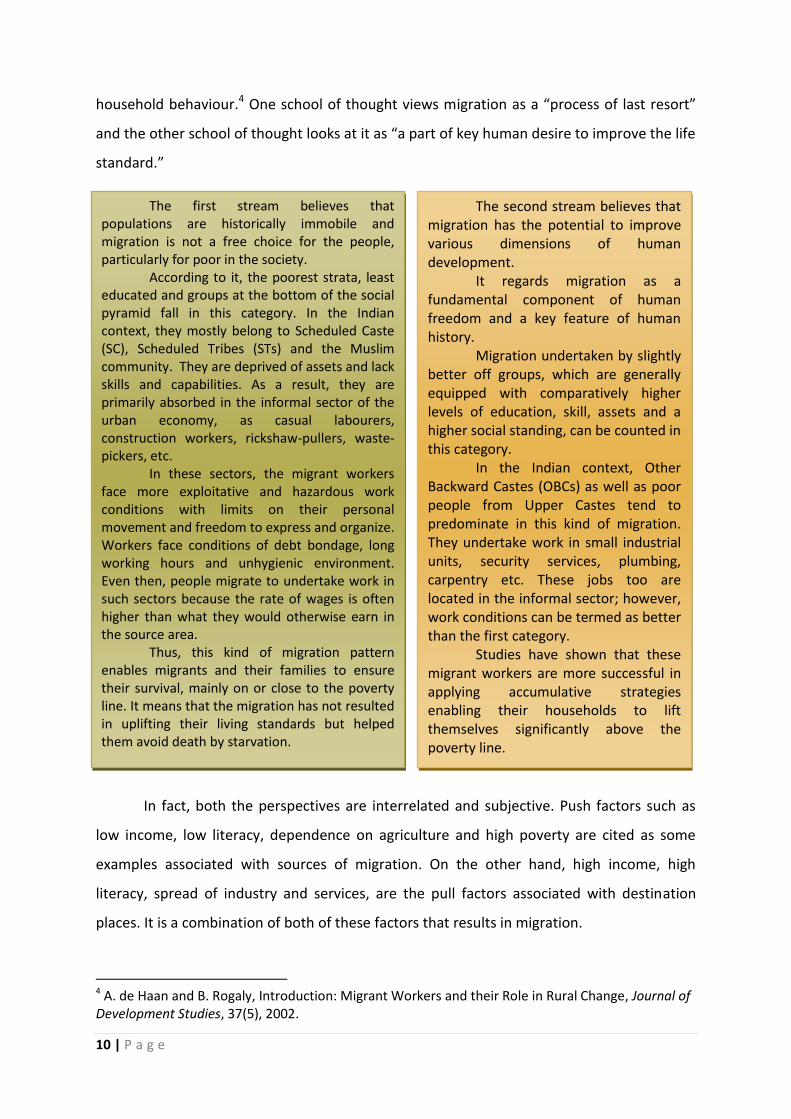
household behaviour.4 One school of thought views migration as a “process of last resort”
and the other school of thought looks at it as “a part of key human desire to improve the life
standard.”
In fact, both the perspectives are interrelated and subjective. Push factors such as
low income, low literacy, dependence on agriculture and high poverty are cited as some
examples associated with sources of migration. On the other hand, high income, high
literacy, spread of industry and services, are the pull factors associated with destination
places. It is a combination of both of these factors that results in migration.
4 A. de Haan and B. Rogaly, Introduction: Migrant Workers and their Role in Rural Change, Journal of Development Studies, 37(5), 2002.
The first stream believes that populations are historically immobile and migration is not a free choice for the people, particularly for poor in the society.
According to it, the poorest strata, least educated and groups at the bottom of the social pyramid fall in this category. In the Indian context, they mostly belong to Scheduled Caste (SC), Scheduled Tribes (STs) and the Muslim community. They are deprived of assets and lack skills and capabilities. As a result, they are primarily absorbed in the informal sector of the urban economy, as casual labourers, construction workers, rickshaw-pullers, waste-pickers, etc.
In these sectors, the migrant workers face more exploitative and hazardous work conditions with limits on their personal movement and freedom to express and organize. Workers face conditions of debt bondage, long working hours and unhygienic environment. Even then, people migrate to undertake work in such sectors because the rate of wages is often higher than what they would otherwise earn in the source area.
Thus, this kind of migration pattern enables migrants and their families to ensure their survival, mainly on or close to the poverty line. It means that the migration has not resulted in uplifting their living standards but helped them avoid death by starvation.
The second stream believes that migration has the potential to improve various dimensions of human development.
It regards migration as a fundamental component of human freedom and a key feature of human history.
Migration undertaken by slightly better off groups, which are generally equipped with comparatively higher levels of education, skill, assets and a higher social standing, can be counted in this category.
In the Indian context, Other Backward Castes (OBCs) as well as poor people from Upper Castes tend to predominate in this kind of migration. They undertake work in small industrial units, security services, plumbing, carpentry etc. These jobs too are located in the informal sector; however, work conditions can be termed as better than the first category.
Studies have shown that these migrant workers are more successful in applying accumulative strategies enabling their households to lift themselves significantly above the poverty line.

11 | P a g e
A substantial number of migrant workers work in the informal sector, are mostly
unorganized and have very little or no social security benefits. Also, their working
conditions are mostly unsafe, exploitative and robbing the very dignity of workers. Despite
the huge and ever-increasing number of internal migrants and many problems faced by
them, they are at the bottom of priority in government policies. Inaction towards addressing
internal migrants’ problems or misconceived policies towards them are often the result of
the misunderstanding about the migratory phenomenon and lack of awareness about the
contribution they are making towards the country’s economic growth and development.
The internal migrants, whom the above description fits well, can be categorized
under the term Distress Migration. It means movement from one’s usual place of residence
wherein the individual and/or the family perceive that under the existing circumstances the
only option open to them to survive is to migrate to another place. Such distress is
Internal migrants’ condition is best summed up by Harsh Mander and Gayatri Sahgal as follows:
“Millions of footloose and impoverished men, women and children in India, migrate from the countryside each year to cities – in crowded trains, buses, trucks and sometimes on foot – their modest belongings bundled over their heads, in search of the opportunities and means to survive. Some arrive alone; some are accompanied by family or friends. Some stay for a season, some several years, some permanently. Many tend to drift quickly to low-end, low paid, vulnerable occupations – picking waste, pulling rickshaws, constructing buildings and roads, or working in people’s homes. They service a city which does not welcome them. Forever treated as intruders and somehow illegitimate citizens, they live in under-served makeshift shanties, under plastic sheets, or on streets and in night shelters. Police and municipal authorities notoriously harass and drive them away. Laws protect them in theory, but rarely in practice. Their wage rates tend to be exploitative, illegal and uncertain, work hours long, and conditions of employment unhealthy and unsafe. They are often unable to easily access even elementary citizenship rights in the city, like the right to vote, a ration card, supplementary feeding for their children, and school admissions. Their numbers are substantial; their economic contributions enormous; yet internal migrants tend to remain in the periphery of public policy.”
The internal migrants, whom the above description fits well, can be categorized under the term Distress Migration. It means movement from one’s usual place of residence wherein the individual and/or the family perceive that under the existing circumstances the only option open to them to survive is to migrate to another place. Such distress is associated with extreme paucity of livelihood options, natural calamities, and social distress. Thus, migration is distress if it is motivated by extreme economic deprivation, natural and environmental disasters, or forms of intolerable or life-threatening social oppression.

12 | P a g e
associated with extreme paucity of livelihood options, natural calamities, and social distress.
Thus, migration is distress if it is motivated by extreme economic deprivation, natural and
environmental disasters, or forms of intolerable or life-threatening social oppression.5
Most of the internal migrants are excluded from the economic, social, cultural, and
political life of the society. They are often treated as second class citizens by local
authorities and sometime by the local community as well. Internal migrants face enormous
difficulties in their day to day lives, such as, lack of local identity proof, lack of political
representation, lack of local residency or tenant rights, lack of access to social security
benefits such as cheap ration or free schooling for children, a hate campaign against them
by local political or ethnic groups, involvement in low-paid insecure hazardous work.
Migration and urbanization are two important inter-related phenomena of economic
development. If channelized properly, it has the potential of societal transformation.
Otherwise, it can be not only counter-productive for the societal harmony but also
disastrous for the long term economic development. The historical experiences have proved
that process of migration is unstoppable in modern times. The migrant workers are key
force behind rising contribution of urban conglomerations to India’s GDP. Migrants are
indispensable but mostly invisible key actors in cities’ development. Rural migrants in urban
spaces are socially mobile, culturally flexible and economically aspiring people. Migrants are
an important component of social dynamism and material development of the society. They
can also be tools of cultural amalgamation and innovation. Yet, they are most vulnerable to
economic exploitation and social stereotyping.
Among migrant workers, men have been more visible than women. Women work in
factories, in the informal sector, as well as are homemakers. The women in the slums or
housing colonies face greater hardship than their male counterparts- such as lack of proper
bathrooms, lack of privacy, harassment from male residents, landlords, etc. Lack of clean
5 Harsh Mander and Gayatri Sahgal, Internal Migration in India: Distress and Opportunities, A Study Commissioned by Dan Church India, 2010.
Despite the fact that Article 19 of the Constitution of India gives the
right to all citizens to “move freely throughout the territory of India; to reside
and settle in any part of the territory of India”; discrimination and prejudices
against internal migrants are high and rising.

13 | P a g e
water and electricity are major problems. Women workers face informalization, low wage,
sexual harassment, domestic v6iolence, abandonment and the double burden of homecare
and wage-related work. Women also face the consequences of uncared-for and uneducated
children as they themselves struggle with employment and lack of schools and childcare.
Inter-linkages between gender and migration are well-established now. Substantial
work has been done on gender and domestic work as well as health care work. In last two
decades some scholars have claimed an increase share of women in migration process. This
has been countered by many others. It has been said that women have always been a major
part of migration process. What has changed is the growing research on gender and
migration in last two decades. This research has, however, not converted into policy
formulation for the internal women migrants who have been relishing at the bottom of the
migration pyramid for ages.
6 Wadhwan, Neha, Living in Domesti-City: Women and Migration for Domestic Work from Jharkhand, EPW, Vol.
XLVIII No 43, Oct 2013, pp. 47-54
14 | P a g e
Sources of Migration Data
Census of India and the National Sample Survey Organization’s (NSSO) studies are
the two authentic sources to get the data on migration in India. Historically, information on
migration has been collected since 1872. It was confined to seeking information only on
place of birth till 1961. The scope of collecting information on migration was enlarged by
including the rural or urban status of the place of birth and duration of residence at the
place of residence in 1961. Since the 1971 Census, data is being collected on the basis of
place of last residence in addition to the question on birth place. Question on “Reason for
migration” was introduced in 1981. The following reasons for migration from place of last
residence are captured: work/employment, business, education, marriage, moved after
birth, moved with household and any other.
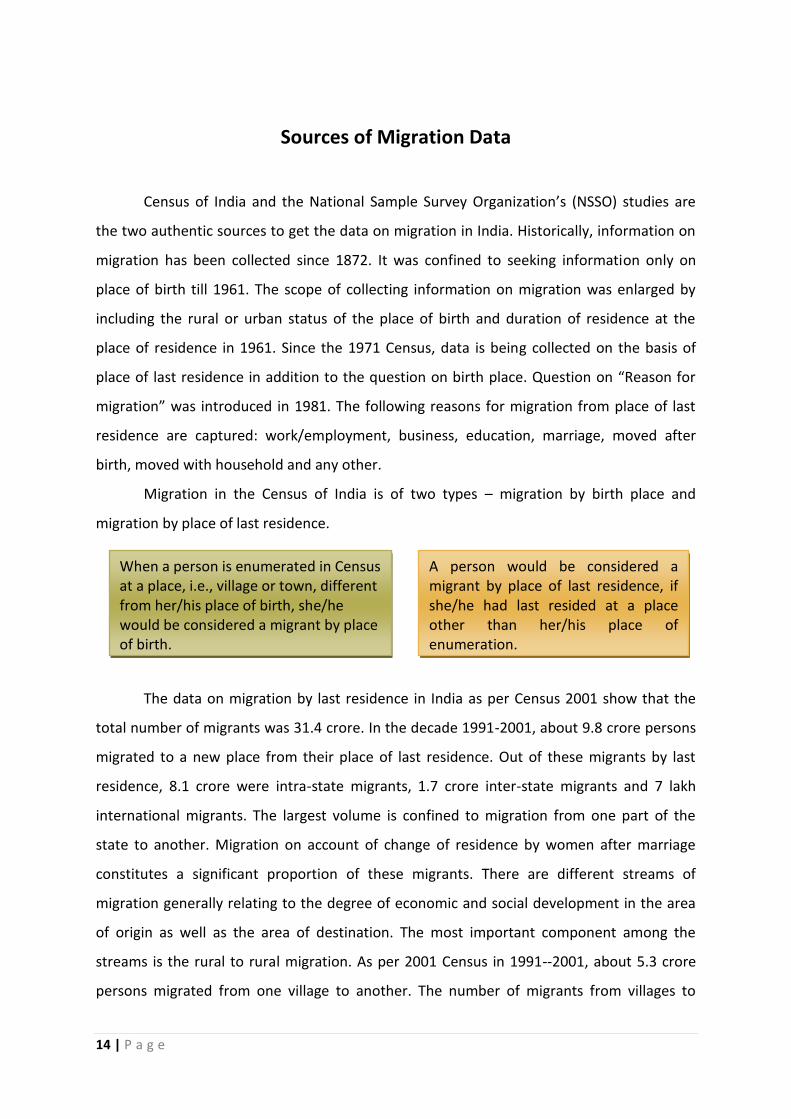
Migration in the Census of India is of two types – migration by birth place and
migration by place of last residence.
The data on migration by last residence in India as per Census 2001 show that the
total number of migrants was 31.4 crore. In the decade 1991-2001, about 9.8 crore persons
migrated to a new place from their place of last residence. Out of these migrants by last
residence, 8.1 crore were intra-state migrants, 1.7 crore inter-state migrants and 7 lakh
international migrants. The largest volume is confined to migration from one part of the
state to another. Migration on account of change of residence by women after marriage
constitutes a significant proportion of these migrants. There are different streams of
migration generally relating to the degree of economic and social development in the area
of origin as well as the area of destination. The most important component among the
streams is the rural to rural migration. As per 2001 Census in 1991--2001, about 5.3 crore
persons migrated from one village to another. The number of migrants from villages to
When a person is enumerated in Census at a place, i.e., village or town, different from her/his place of birth, she/he would be considered a migrant by place of birth.
A person would be considered a migrant by place of last residence, if she/he had last resided at a place other than her/his place of enumeration.
15 | P a g e
towns was about 2.1 crore. Similarly, the number of migrants from towns to villages was
about 62 lakh and from one town to another about 1.4 crore.
Migration into large metropolises was significant in 1991-2001 with Greater Mumbai
drawing about 24.9 lakh migrants, Delhi about 21.1 lakh migrants, Chennai about 4.3 lakh
migrants to name the largest three urban destinations in the country. As the trend in
migration to large urban agglomerations continued, the Census 2011 is likely to show a
spurt in population in these places as well as other urban destinations such as Bengaluru,
Kochi and Ahmadabad. In fact, Indian Institute of Human Settlement (IIHS) has come out
with data claiming that Delhi, excluding the rest of NCR, attracts the maximum number of
migrants. The concerned IIHS study is based on Census of India 2001, NSSO 2007--08 and
the preliminary data of Census 2011. It is no secret that the rest of NCR, which is a fast
growing urban residential and industrial hub, too attracts substantial number of migrants.
While Delhi has the highest per capita income and income growth among Indian metros, the
NCR in totality has a huge concentration of wealth, resources, infrastructure and a relatively
high quality of urban services. There is large number of service sector jobs on offer in the
NCR, more so in the informal sector.7
About 30% of the total internal migrants belong to the youth category in the 15-29
years age group8 while 70% of the total internal migrants are women. It is also estimated
that about 15 million children are internal migrants.9 Yet, women and children remain as
invisible component of the migrant population. Even though the maximum number of
migrant women is categorized into “migration due to marriage” category, scholars feel that
7 Anahita Mukherjee, “Flow of Migrants Highest to Delhi, not Maharashtra”, TNN, Dec 6, 2011. 8 I S Rajan, Internal Migration and Youth in India: Main Features, Trends and Emerging Challenges, New Delhi, UNESCO, 2013. 9 Smita, “Distress Seasonal Migration and its Impact on Children’s Education”, Brighton, CREATE Pathways to Access Research Monograph No. 28, 2008.
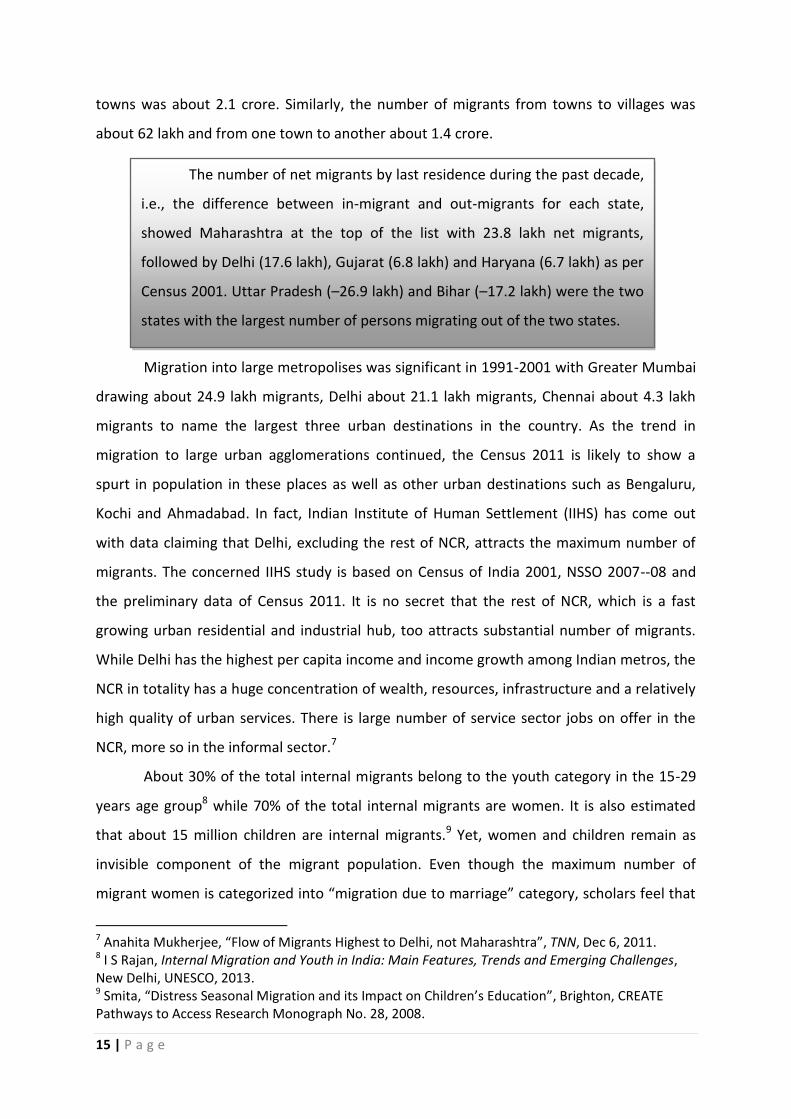
The number of net migrants by last residence during the past decade,
i.e., the difference between in-migrant and out-migrants for each state,
showed Maharashtra at the top of the list with 23.8 lakh net migrants,
followed by Delhi (17.6 lakh), Gujarat (6.8 lakh) and Haryana (6.7 lakh) as per
Census 2001. Uttar Pradesh (–26.9 lakh) and Bihar (–17.2 lakh) were the two
states with the largest number of persons migrating out of the two states.

16 | P a g e
many of them would be working in the informal sector after marriage. Since Census only
registers the primary reason of migration, the actual number of migrant women earning for
their households could be much higher than estimated.
Internal Migrants as Percentage of Total Population in India, 1971-200110 Table 1: Migration as per Place of Last Residence Criterion
In the 2001 census the percentage of lifetime migrants11 has increased by 3.13
percentage points. The decade of 1991--2001 has seen a profound change in our economic
policy. The country adopted a new economic policy in 1991 with the underlying principles of
liberalization and privatization. Due to this policy, private investments, both domestic and
foreign, it has been argued, were attracted to areas that were already developed and well
endowed with infrastructural facilities. As a result of the new approach, the interregional
inequality in income levels has sharply widened and it seems to have affected the migration
process in the country.12
10 Census of India (Various Years), Migration Tables (D-01 and D-02). 11
It denotes the persons enumerated in a given area at a particular Census who were born outside the area of enumeration 12 R B Bhagat, “Internal Migration in India: Are the Underclass More Mobile?” A paper presented in the 26th IUSSP General Population Conference held at Marrakech, Morocco, 27 Sep--2 Oct 2009.
Census Years
All Areas Rural Urban
Total Male Female Total Male Female Total Male Female
1971 29.12 17.46 41.66 27.18 12.88 42.25 36.92 35.00 39.16
1981 30.30 17.22 44.30 28.29 12.06 45.34 36.80 33.24 40.84
1991 26.94 14.05 40.85 25.56 9.71 42.45 30.91 26.28 36.10
2001 30.07 17.04 44.05 27.98 11.14 45.79 35.51 31.98 39.44

17 | P a g e
Table 2: Age Composition of Migrants by Residence and Sex in India, 2001 (in %)13
Age Total Migrants Rural Migrants Urban Migrants
T M F T M F T M F
0 – 14 12.6 22.31 8.59 11.22 27.81 6.86 15.57 17.44 13.88
15 – 29 29.35 27.24 30.24 29.47 2568 30.46 29.10 28.64 29.54
30 – 34 11.13 8.90 12.07 11.44 8.12 12.32 10.48 9.58 11.30
25 – 39 10.58 9.08 11.22 10.65 8.33 11.26 10.46 9.74 11.10
40+ 36.07 32.20 37.30 37.02 29.78 38.93 34.15 33.34 33.97
Total 100 100 100 100 100 100 100 100 100
The age-wise distribution of migrants shows that the largest proportion of migrants
is in the 15--29 age group. However, one could also see a concentration of migrants in the
40--59 working age group. If we group it into five-year categories for analysis, the highest
number of migrants reported is for the age group 25-29 years, and the same is true for both
men and women as well as for rural and urban areas. No major difference in this trend
exists between rural and urban areas. In other words, nearly one-third of the migrants are
youth, indicating that most men primarily migrate for employment. The concentration of
migrants among children (0--14 age group) may be due to the inclusion of children who
moved immediately after birth or moved along with family members.
13 S Irudiya Rajan, Discussion Paper – Internal Migration and Youth in India: Main Features, Trends and Emerging Challenges, UNESCO, 2013, p. 7.
18 | P a g e
Table 3: Percentage Distribution of Migrants by Marital Status and Age14
Status Never Married Currently Married
Widowed Divorced or Separated
All Ages 30.72 67.11 1.88 0.29
0 – 9 100 0 0 0
10 – 19 60.75 39.03 0.13 0.09
20 – 29 9.76 89.39 0.59 0.26
30 – 39 2.95 94.74 1.64 0.67
40 – 49 1.66 92.95 4.63 0.76
50 – 59 1.76 85.09 12.47 0.68
60 – 69 2.64 67.22 29.47 0.67
70 – 79 3.60 54.02 41.84 0.54
80+ 6.34 45.20 47.97 0.49
The age composition of migrants with reference to their marital status divulges that
migrants in the younger age group (10--19 years) are mostly never married, confirming that
they migrate mainly when they accompany parents or family members, or for educational
purposes. The migrants with “currently married” status are largely concentrated in prime
working-age groups (20--49), which includes the top tier of the youth bracket (20--29). For
instance, 9 out of 10 migrants between the ages of 20 and 29 were married.
14 S Irudiya Rajan, Discussion Paper – Internal Migration and Youth in India: Main Features, Trends and Emerging Challenges, UNESCO, 2013, p. 8.

19 | P a g e
Table 4: Percentage Distribution of Migrants by Reasons for Migration and Sex, 2001 Census15
The educational profile of migrants reveals the ways in which educational
attainment configures migration trends. The above table shows the educational status of
migrants. It is clear that the proportion of illiterates among migrants in India is very high.
More than half of the female migrants (57.8%) and 25.8% of the male migrants were found
to be illiterate. The second largest share of migrants, both male and female, has the
educational level “literate but below matric/secondary”. The share of migrants with the
educational level “matric/secondary but below graduate”, was 12.7% in 2001, with male
migrants having a larger share of 21%. The gender aspect reveals that the proportion of
migrants with a higher educational level is very low, particularly among females. This less
than optimal track record reveals a compelling area of future state support and policy
action. Increased investment in education and ensuring access to education for all is
necessary to bolster the skill level and employability of India’s young workforce. Current
figures show that migration in India is predominantly characterized by the illiterate working
class, which migrates primarily in search of employment.
15 S Irudiya Rajan, Discussion Paper – Internal Migration and Youth in India: Main Features, Trends and Emerging Challenges, UNESCO, 2013, p. 8.
Education Level Person Male Female
Illiterate 48.25 25.76 57.75
Literate without Educational Level
1.94 2.02 1.91
Literate but below Matric/Secondary Level
31.24 39.27 27.85
Matric/Secondary but below Graduate Level
12.69 21.04 9.17
Technical Diploma or Certificate not Equal to Degree Level
0.54 1.32 0.21
Graduate and above other than Technical Degree
4.48 8.63 2.73
Technical Degree/Diploma Equal to Degree/Post-Graduate Degree
0.86 1.97 0.39
20 | P a g e
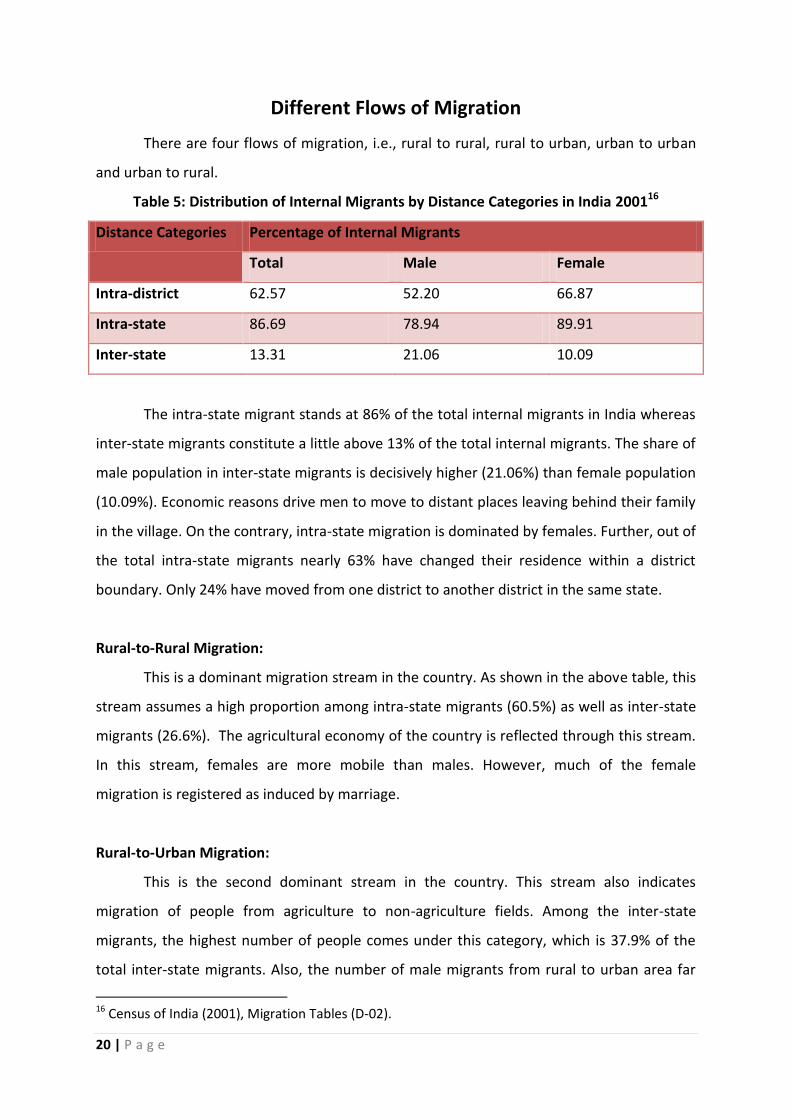
Different Flows of Migration
There are four flows of migration, i.e., rural to rural, rural to urban, urban to urban
and urban to rural.
Table 5: Distribution of Internal Migrants by Distance Categories in India 200116
Distance Categories Percentage of Internal Migrants
Total Male Female
Intra-district 62.57 52.20 66.87
Intra-state 86.69 78.94 89.91
Inter-state 13.31 21.06 10.09
The intra-state migrant stands at 86% of the total internal migrants in India whereas
inter-state migrants constitute a little above 13% of the total internal migrants. The share of
male population in inter-state migrants is decisively higher (21.06%) than female population
(10.09%). Economic reasons drive men to move to distant places leaving behind their family
in the village. On the contrary, intra-state migration is dominated by females. Further, out of
the total intra-state migrants nearly 63% have changed their residence within a district
boundary. Only 24% have moved from one district to another district in the same state.
Rural-to-Rural Migration:
This is a dominant migration stream in the country. As shown in the above table, this
stream assumes a high proportion among intra-state migrants (60.5%) as well as inter-state
migrants (26.6%). The agricultural economy of the country is reflected through this stream.
In this stream, females are more mobile than males. However, much of the female
migration is registered as induced by marriage.
Rural-to-Urban Migration:
This is the second dominant stream in the country. This stream also indicates
migration of people from agriculture to non-agriculture fields. Among the inter-state
migrants, the highest number of people comes under this category, which is 37.9% of the
total inter-state migrants. Also, the number of male migrants from rural to urban area far
16 Census of India (2001), Migration Tables (D-02).
21 | P a g e
surpassed that of women in both the categories. Among inter-state migrants, 44.7% of men
migrate from rural to urban area as compared to 30.9% of women. Among intra-state
migrants, 27.1% of men migrate from rural to urban area as compared to 13.6% of women.
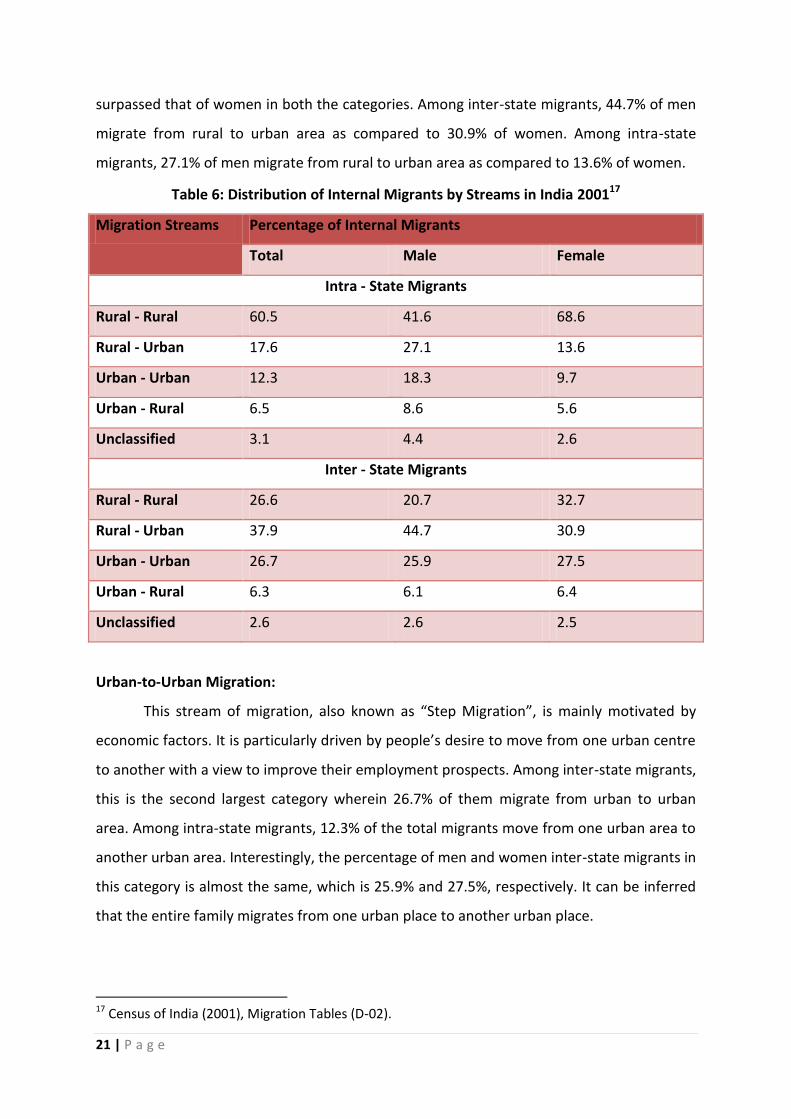
Table 6: Distribution of Internal Migrants by Streams in India 200117
Migration Streams Percentage of Internal Migrants
Total Male Female
Intra - State Migrants
Rural - Rural 60.5 41.6 68.6
Rural - Urban 17.6 27.1 13.6
Urban - Urban 12.3 18.3 9.7
Urban - Rural 6.5 8.6 5.6
Unclassified 3.1 4.4 2.6
Inter - State Migrants
Rural - Rural 26.6 20.7 32.7
Rural - Urban 37.9 44.7 30.9
Urban - Urban 26.7 25.9 27.5
Urban - Rural 6.3 6.1 6.4
Unclassified 2.6 2.6 2.5
Urban-to-Urban Migration:
This stream of migration, also known as “Step Migration”, is mainly motivated by
economic factors. It is particularly driven by people’s desire to move from one urban centre
to another with a view to improve their employment prospects. Among inter-state migrants,
this is the second largest category wherein 26.7% of them migrate from urban to urban
area. Among intra-state migrants, 12.3% of the total migrants move from one urban area to
another urban area. Interestingly, the percentage of men and women inter-state migrants in
this category is almost the same, which is 25.9% and 27.5%, respectively. It can be inferred
that the entire family migrates from one urban place to another urban place.
17 Census of India (2001), Migration Tables (D-02).

22 | P a g e
Table 7: Situation of Internal Migrants in Rural and Urban Areas of India, 2007-0818
States Rural households with at least one internal migrant (%)
% of male migrants in rural areas
Urban households with at least one internal migrant (%)
% of male migrants in urban areas
% of internal migrants among 15--29 age group in rural areas
% of internal migrants among 15--29 age group in urban areas
Andhra Pradesh
3.5 14.1 2.9 19.1 76.6 23.4
Bihar & Jharkhand
16.6 NA 9.5 NA 92.6 7.4
Delhi 8.7 60.5 3.8 33.7 13.4 86.6
Goa 2.8 30.2 2.9 31.0 43.3 56.7
Gujarat 1.9 6.3 2.5 19.5 54.6 45.4
Haryana 14.9 57.4 20.3 49.2 63.2 36.8
Himachal Pradesh
20.4 53.7 13.1 53.7 92.8 7.2
Jammu and Kashmir
5.2 42.8 4.2 38.2 84.8 15.2
Karnataka 4.0 17.9 3.0 20.7 71.8 28.2
Kerala 11.5 21.2 10.1 20.8 77.1 22.9
Maharashtra 3.1 9.1 3.3 17.3 56.4 43.6
MP & Chhattisgarh
3.0 NA 4.5 38.4 69.8 30.2
North-East 3.0 NA 4.0 37.1 80.7 19.3
Odisha 12.0 58.6 8.0 56.2 89.3 10.7
Punjab 5.1 24.9 4.5 28.9 64.2 35.8
Rajasthan 12.1 50.0 8.2 36.2 82.4 17.6
Tamil Nadu 3.6 19.5 3.1 21.3 60.1 39.9
Union Territories
6.3 28.1 7.8 43.5 47.5 52.5
UP & Uttaranchal
17.3 NA 9.1 NA 86.9 13.1
West Bengal 7.6 48.2 6.7 47.3 76.2 23.8
All India 9.0 NA 5.4 NA 80.7 19.3
Urban-to-Rural Migration:
It is relatively less important phenomena accounting for only 6.3% and 6.5% of the
total inter-state and intra-state migrants, respectively. There are three prominent reasons
18 NSSO 2007--08 data on migration.
23 | P a g e
for the existence of this stream. One, the high cost of living in urban areas has led people to
reside on the fringe of towns; two, people retiring from government services as well as
private jobs in the cities move to their native places; three, migrants (including both –
internal and international) returning to home village to settle down there.
There are several measures to assess the intensity of internal migration, such as
households with at least one internal migrant and the number of internal migrants per 1000
households. In 1993, households with at least one internal migrant were reported at 3% in
India, which increased to 8% in 2007--08. According to the latest round of the NSS,
approximately 1 in 10 households reported an internal migrant. The highest proportion of
households with internal migrants was reported for Himachal Pradesh (20%), Haryana
(17%), Bihar and Jharkhand (16%), Uttar Pradesh (15%) and 11% each for Kerala, Rajasthan
and Odisha. The number of internal migrants per 1000 households was reported as 41
persons in 1993, which increased to 122 persons in 2007--08, indicating the pace at which
internal migration is growing in India. Much like the earlier measures among the states, 306
persons per 1000 households were reported for Himachal Pradesh, followed by Haryana
(275 persons), Uttar Pradesh (266 persons) and Bihar and Jharkhand (223 persons).
24 | P a g e
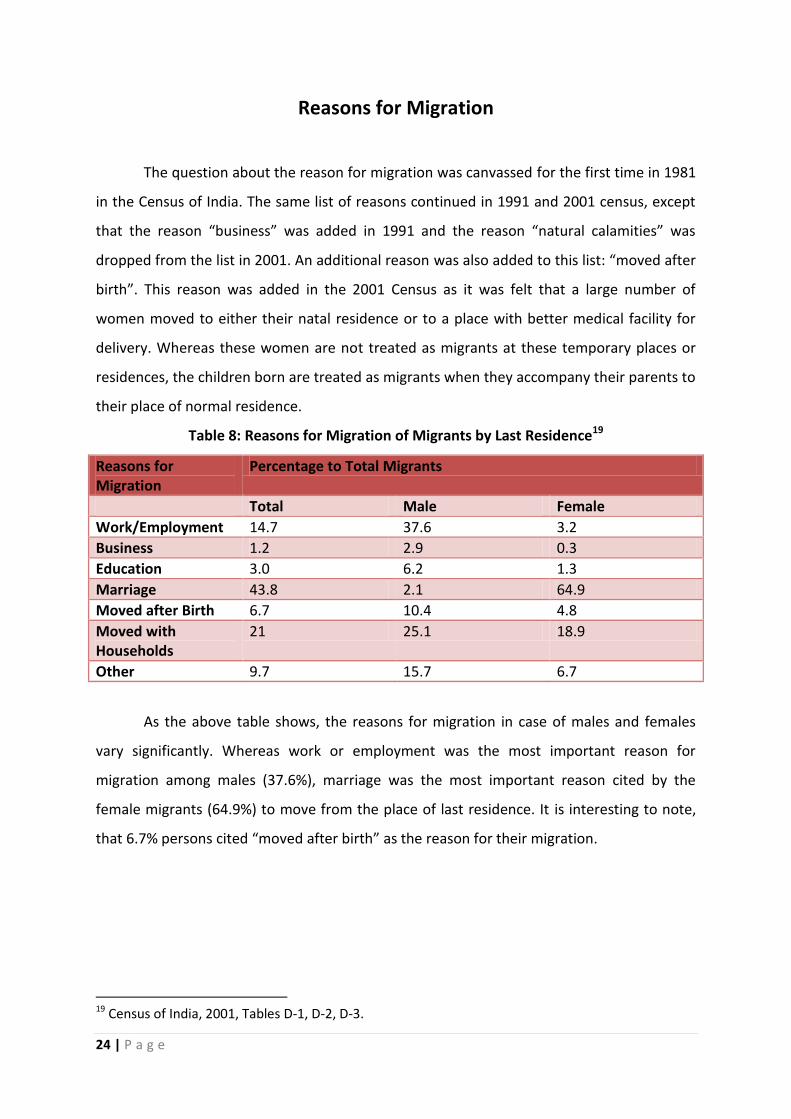
Reasons for Migration
The question about the reason for migration was canvassed for the first time in 1981
in the Census of India. The same list of reasons continued in 1991 and 2001 census, except
that the reason “business” was added in 1991 and the reason “natural calamities” was
dropped from the list in 2001. An additional reason was also added to this list: “moved after
birth”. This reason was added in the 2001 Census as it was felt that a large number of
women moved to either their natal residence or to a place with better medical facility for
delivery. Whereas these women are not treated as migrants at these temporary places or
residences, the children born are treated as migrants when they accompany their parents to
their place of normal residence.
Table 8: Reasons for Migration of Migrants by Last Residence19
Reasons for Migration
Percentage to Total Migrants
Total Male Female
Work/Employment 14.7 37.6 3.2
Business 1.2 2.9 0.3
Education 3.0 6.2 1.3
Marriage 43.8 2.1 64.9
Moved after Birth 6.7 10.4 4.8
Moved with Households
21 25.1 18.9
Other 9.7 15.7 6.7
As the above table shows, the reasons for migration in case of males and females
vary significantly. Whereas work or employment was the most important reason for
migration among males (37.6%), marriage was the most important reason cited by the
female migrants (64.9%) to move from the place of last residence. It is interesting to note,
that 6.7% persons cited “moved after birth” as the reason for their migration.
19 Census of India, 2001, Tables D-1, D-2, D-3.
25 | P a g e
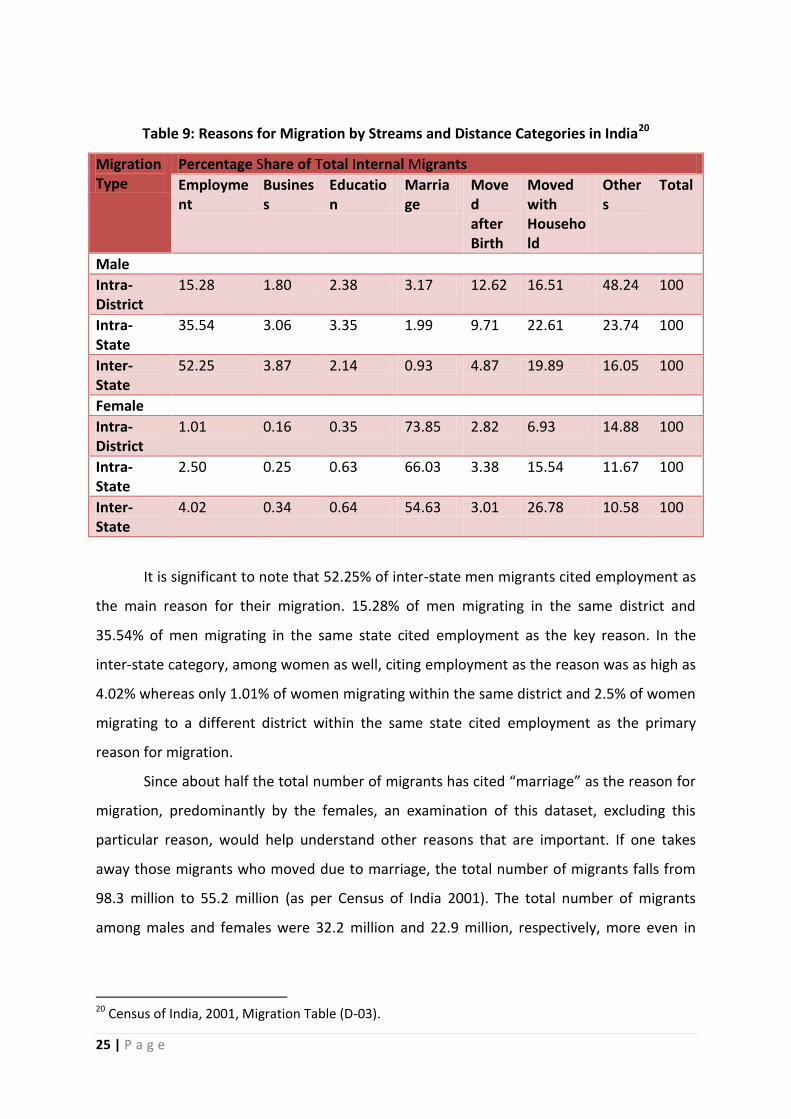
Table 9: Reasons for Migration by Streams and Distance Categories in India20
Migration Type
Percentage Share of Total Internal Migrants
Employment
Business
Education
Marriage
Moved after Birth
Moved with Household
Others
Total
Male
Intra-District
15.28 1.80 2.38 3.17 12.62 16.51 48.24 100
Intra-State
35.54 3.06 3.35 1.99 9.71 22.61 23.74 100
Inter-State
52.25 3.87 2.14 0.93 4.87 19.89 16.05 100
Female
Intra-District
1.01 0.16 0.35 73.85 2.82 6.93 14.88 100
Intra-State
2.50 0.25 0.63 66.03 3.38 15.54 11.67 100
Inter-State
4.02 0.34 0.64 54.63 3.01 26.78 10.58 100
It is significant to note that 52.25% of inter-state men migrants cited employment as
the main reason for their migration. 15.28% of men migrating in the same district and
35.54% of men migrating in the same state cited employment as the key reason. In the
inter-state category, among women as well, citing employment as the reason was as high as
4.02% whereas only 1.01% of women migrating within the same district and 2.5% of women
migrating to a different district within the same state cited employment as the primary
reason for migration.
Since about half the total number of migrants has cited “marriage” as the reason for
migration, predominantly by the females, an examination of this dataset, excluding this
particular reason, would help understand other reasons that are important. If one takes
away those migrants who moved due to marriage, the total number of migrants falls from
98.3 million to 55.2 million (as per Census of India 2001). The total number of migrants
among males and females were 32.2 million and 22.9 million, respectively, more even in
20 Census of India, 2001, Migration Table (D-03).
26 | P a g e
terms of the ratio between the two sexes than when the reason “marriage” was included.
The following table enumerates this detail:
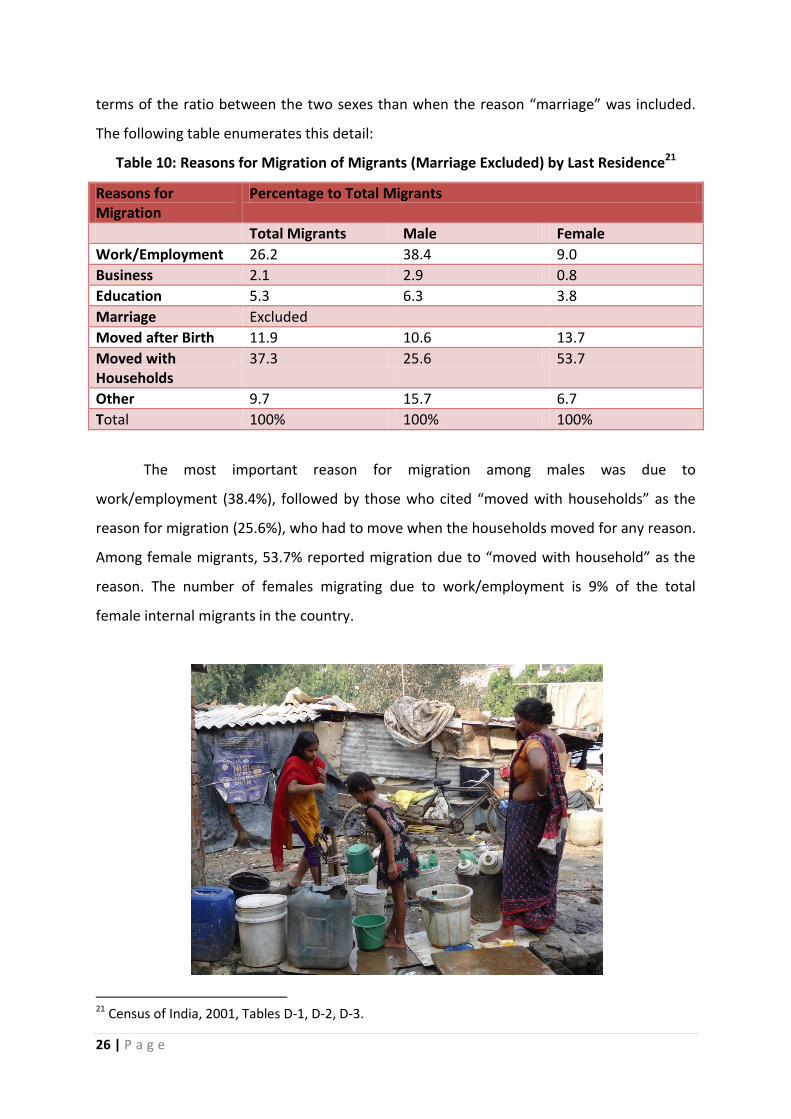
Table 10: Reasons for Migration of Migrants (Marriage Excluded) by Last Residence21
Reasons for Migration
Percentage to Total Migrants
Total Migrants Male Female
Work/Employment 26.2 38.4 9.0
Business 2.1 2.9 0.8
Education 5.3 6.3 3.8
Marriage Excluded
Moved after Birth 11.9 10.6 13.7
Moved with Households
37.3 25.6 53.7
Other 9.7 15.7 6.7
Total 100% 100% 100%
The most important reason for migration among males was due to
work/employment (38.4%), followed by those who cited “moved with households” as the
reason for migration (25.6%), who had to move when the households moved for any reason.
Among female migrants, 53.7% reported migration due to “moved with household” as the
reason. The number of females migrating due to work/employment is 9% of the total
female internal migrants in the country.
21 Census of India, 2001, Tables D-1, D-2, D-3.

27 | P a g e
Inter-State Migration
Noticeably, the migration of population across the boundary of a state rose sharply
by 54.5% from about 27.2 million in 1991 to about 42.1 million in 2001.22 State-wise data on
inter-state migrants by place of birth would help to identify the most preferred destinations
for inter-state migrants. As a table below shows, the most important five states in terms of
inter-state migration have registered more than 1 million in-migrants by place of birth from
outside the state, as well as from other countries. This includes both old migrants as well as
the recent migrants. Maharashtra is at the top of the list with 7.9 million in-migrant
population, followed by Delhi (5.6 million) and West Bengal (5.5 million). The percentage of
the in-migrants to the total population in these three states were, 8.2%, 40.8% and 7.0%
respectively, accounting for about 39.5% of the total inter-state migrants in the country.
Table 11: Total Inter-state Migrants by Place of Birth in Major States23
States Total Population
Total In-migrants
% In-Migrants to Total Population
Share of Total Migrants
Delhi 13,850,507 5,646,277 40.8 11.6
Haryana 21,144,564 2,951,752 14.0 6.1
Punjab 24,358,999 2,130,662 8.7 4.4
Maharashtra 96,878,627 7,954,038 8.2 16.4
West Bengal 80,176,197 5,582,325 7.0 11.5
Migration to Urban Agglomerations
Migration is one of the important factors contributing to the growth of urban
population. The total urban population of the country (excluding Jammu and Kashmir)
increased from 217.6 million in 1991 to 283.6 million in 2001 registering a growth rate of
30.3%. The migration data of 2001 Census indicates that 20.5 million people enumerated in
urban areas are migrants from rural areas who moved in within the last 10 years. There are
6.2 million migrants who have similarly migrated from urban areas to rural areas. Thus, the
net addition to urban population on account of migration is 14.3 million. This works out to
22 Data Highlights, Census of India, 2001, Migration Tables, p. 10. 23 Data Highlights, Census of India, 2001, Migration Tables, p. 11.

28 | P a g e
be 6.6% of the urban population in 1991. In other words, out of the urban growth of 30.3%,
6.6% is accounted for by migration to urban areas.24
The 2001 Census data present migration data by last residence for each urban
agglomeration (UA) and city in the country. The inflow of migrants depends upon the size of
the UA/city as in large UAs and cities the availability of work/employment is greater.
However, in terms of amenities and services, in-migration causes a severe pressure, as these
are not commensurate to high growth in population. A table below provides a comparison
of migrants by last residence during the past 10 years into important UAs and their share to
total UA population. It provides an insight into the fast pace at which migration is taking
place in these centres.
Table 12: Number of In-migrants by Last Residence into Important UAs
Name of the UA
2001 Population
In Migrants Total In-migrants
% of In-Migrants to Total Population
Intra-State Inter-State International
Greater Mumbai
16,434,386 892,706 1,571,181 25,665 2,489,552 15.1
Delhi 12,877,470 77,663 1,988,314 46,383 2,112,363 16.4
Chennai 6,560,242 334,972 94,964 5,684 435,620 6.6
Kolkata 13,205,697 470,601 297,279 54,509 822,389 6.2
Hyderabad 5,742,036 407,861 88,216 2,406 498,483 8.7
Bangalore 5,701,446 401,932 353,156 6,397 761,485 13.4
The total number of in-migrants during 1991--2001 was the largest in Greater
Mumbai UA, the main component being those who are coming from outside the state. Delhi
UA, on the other hand, received 1.9 million migrants from other states, the largest among
the UAs shown above. Bangalore UA, which received 0.3 million in-migrants from other
states, more than Chennai and Kolkata, is likely due to its growing opportunities in
information technology-related work and a consequently booming construction industry. In
terms of proportion of in-migrants to total population in these UAs, Delhi UA was at the top,
with in-migrants constituting 16.4% of the population. Greater Mumbai UA (15.1%) and
Bangalore UA (13.4%) were the next two in terms of proportion among the UAs listed
above.
24 Data Highlights, Migration Tables, Census of India, 2001.

29 | P a g e
Internal migration remains grossly underestimated due to empirical and conceptual
difficulties in measurement. The two major sources of data on migration in India, the Census
and the National Sample Survey (NSS) cover only permanent or semi-permanent migration
with seasonal migration partly overlapping with the category of short duration migration.
However, even the definition of permanent or semi-permanent migration adopted in the
Census and the NSS has its limitations. For example, they do not count migrants who are
staying in the cities for long as ‘long-term migrants’ if those migrants retain their place of
residence and identity in the village. As a result, the coverage of these two data sources
becomes so restrictive that both of these report declining trends of out migration over the
years. Several studies have pointed out that migration is not always permanent and
seasonal and circular migration is widespread, especially among the socio-economically
deprived groups, such as the Scheduled Castes (SCs), Scheduled Tribes (STs) and Other
Backward Castes (OBCs), who are asset poor and face resource and livelihood deficits.25
Seasonal and circular migrants, constitute a “floating” population, as they alternate
between living at their source and destination locations, and in turn lose access to social
protection benefits linked to the place of residence. The National Commission on Rural
Labour finds increasing trends of seasonal and temporary migrants over the years. Besides
this, many of the micro studies dealing with the issue of migration reported much higher
incidence of out-migration, particularly in the case of underdeveloped regions. Besides,
there is a considerable change in the nature and cause of migration -- in recent years
proportionately more migration is taking place among the labour force in search of their
livelihoods, which is mainly for relatively longer terms, without discontinuing their
residences and other belongings in the villages.
In light of the on-going structural changes and consequent changing contours of
rural economy, the nature and pattern of migration has also been changing over time.
Accordingly, the concept of migration now connotes much wider dimension than what has
been conceptualized conventionally. Now the whole spectrum of migration varies from daily
commuting to some nearby places on the one hand, to permanent shift of residence to
some distant places on the other hand. Besides this, since rural migrants are not a
25 P. Deshingkar and S Akter, Migration and Human Development in India, Research Paper, 2009/13, Human Development, UNDP, 2009.
30 | P a g e
homogenous group, the nature and pattern of migration also varies from one to the other
social group of migrants.
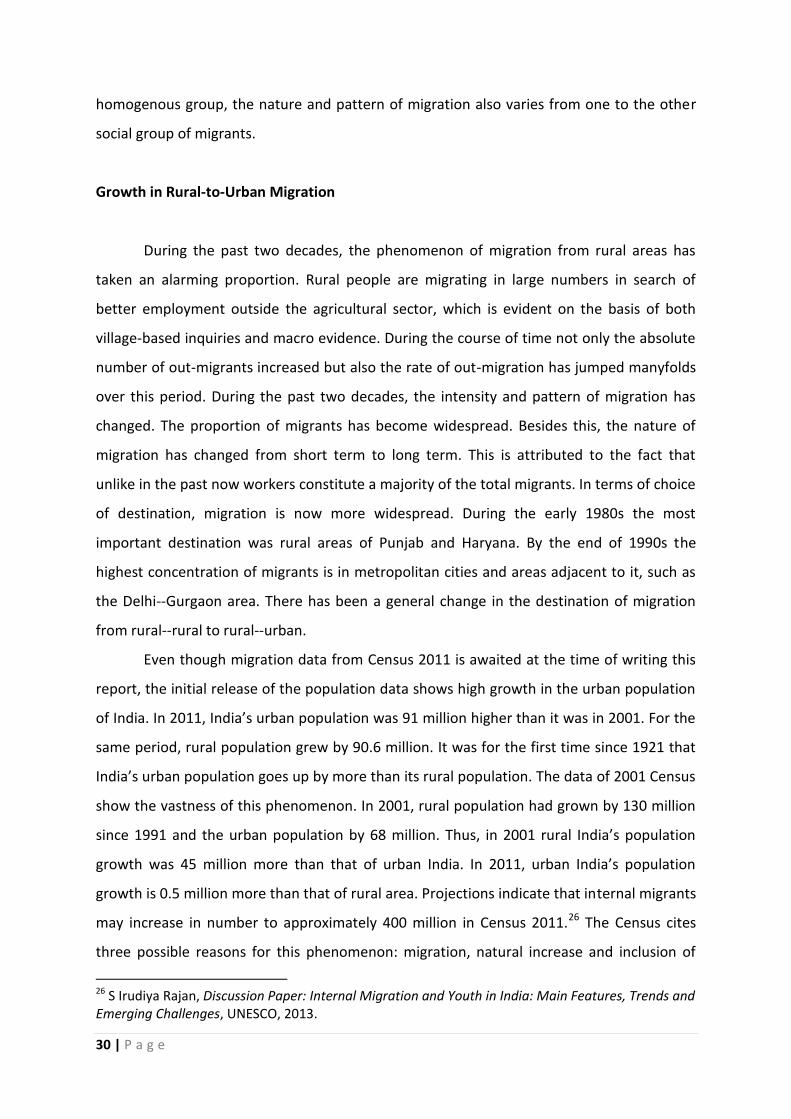
Growth in Rural-to-Urban Migration
During the past two decades, the phenomenon of migration from rural areas has
taken an alarming proportion. Rural people are migrating in large numbers in search of
better employment outside the agricultural sector, which is evident on the basis of both
village-based inquiries and macro evidence. During the course of time not only the absolute
number of out-migrants increased but also the rate of out-migration has jumped manyfolds
over this period. During the past two decades, the intensity and pattern of migration has
changed. The proportion of migrants has become widespread. Besides this, the nature of
migration has changed from short term to long term. This is attributed to the fact that
unlike in the past now workers constitute a majority of the total migrants. In terms of choice
of destination, migration is now more widespread. During the early 1980s the most
important destination was rural areas of Punjab and Haryana. By the end of 1990s the
highest concentration of migrants is in metropolitan cities and areas adjacent to it, such as
the Delhi--Gurgaon area. There has been a general change in the destination of migration
from rural--rural to rural--urban.
Even though migration data from Census 2011 is awaited at the time of writing this
report, the initial release of the population data shows high growth in the urban population
of India. In 2011, India’s urban population was 91 million higher than it was in 2001. For the
same period, rural population grew by 90.6 million. It was for the first time since 1921 that
India’s urban population goes up by more than its rural population. The data of 2001 Census
show the vastness of this phenomenon. In 2001, rural population had grown by 130 million
since 1991 and the urban population by 68 million. Thus, in 2001 rural India’s population
growth was 45 million more than that of urban India. In 2011, urban India’s population
growth is 0.5 million more than that of rural area. Projections indicate that internal migrants
may increase in number to approximately 400 million in Census 2011.26 The Census cites
three possible reasons for this phenomenon: migration, natural increase and inclusion of
26 S Irudiya Rajan, Discussion Paper: Internal Migration and Youth in India: Main Features, Trends and Emerging Challenges, UNESCO, 2013.

31 | P a g e
new areas as “urban.” The IIHS study claims that “natural growth” is the primary reason for
urban population growth. While acknowledging that there has been a marginal decrease in
the natural growth over the past one decade, it said that rural-to-urban migration has only
marginally increased from 21.2% in 1991--2001 to 24.1% in 2001--11. Hence, “natural
growth” stands out as the primary reason.27 On the other hand, P. Sainath argues that the
above mentioned three factors applied in the past too, yet the rural population far
outstripped those to the urban population.28 As far as “natural increase” is concerned,
Registrar General and Census Commissioner of India, Dr. C. Chandramouli made it clear in
following words:
“Fertility has declined across the country. There has been a fall in numbers even in
the 0-6 age group, as a proportion of the total population. In fact, in absolute numbers too,
this group has declined by 5 million, compared to the previous Census. This would suggest
migration as a significant factor in urban growth. But what kind of migrations we can only
ascertain or comment on when their patterns emerge more clearly. The Census in itself is
not structured to captured short-term or footloose migrations.”29
As far as “inclusion of new areas as urban” could be the reason behind urban
population growth is concerned, the facts state it otherwise. In 2011, the number of
“statutory towns’30 increased by mere 241 since 2001. In the preceding decade, this
increase was a whopping 813.31 In contrast to this, the number of “census towns’32 nearly
tripled since 2001 to 3894. In the earlier decade, there was decline in census towns from
1702 to 1361. It meant that in a decade since 2001, the male workforce in the agriculture
27 Anahita Mukherjee, “Flow of Migrants Highest to Delhi, not Maharashtra”, TNN, Dec 6, 2011. 28 P Sainath, “Census Finding Point to a Decade of Rural Distress”, The Hindu, Sept 25, 2011 (http://www.thehindu.com/opinion/columns/sainath/census-findings-point-to-decade-of-rural-distress/article2484996.ece) 29 Ibid. 30 A statutory town is an urban unit with a municipality, corporation, cantonment board or notified town area committee. 31 P Sainath, “Census Finding Point to a Decade of Rural Distress”, The Hindu, Sept 25, 2011 (http://www.thehindu.com/opinion/columns/sainath/census-findings-point-to-decade-of-rural-distress/article2484996.ece) 32 Census town is a village or other unit of population declared as a town when: its population crosses 5,000; when the number of male workers in agriculture falls to less than 25% of the total; where population density is at least 400 per square kilometer.
32 | P a g e
has sharply declined in thousands of villages across the country.33 The logical conclusion of it
is that this workforce migrated from agriculture to informal sector in the urban areas, thus,
resulting in the growth of urban population surpassing that of rural for the first time since
India’s Independence.
Inter-state migration of workers and the resulting impoverishment of the lives of
migrants and their families has been a well-identified issue for some time. However, the
struggle for protection of such workers, who live without citizenship rights within their own
country, has been relatively weak. Despite the irreversible phenomenon of migration into
urban areas, the migrants are looked upon as “outsiders” by the local host administration
and as a burden on the system and resources at the destination. Planning for the poor in the
urban spaces where the migrants ultimately reach in search for a livelihood is conspicuous
by its absence. As the mind-set of the urban planners is to treat migrants as outsiders and a
burden on existing civic infrastructure, they get excluded from most urban planning
processes and mechanisms, compounding the problems that they are already plagued with.
In India, migrants’ right to the city is denied on the political defence of the “sons of the soil’
theory, which aims to create vote-banks along ethnic, linguistic and religious lines. Exclusion
and discrimination against migrants take place through political and administrative
processes, market mechanisms and socio-economic processes, causing a gulf between
migrants and locals.34 This leads to marginalization of migrants in the decision-making
processes of the city, and exacerbates their vulnerabilities to the vagaries of the labour
market, poverty traps and risks of discrimination and violence. There remains no concerted
strategy to ensure portability of entitlements for migrants.35 Planning for migrant families,
which are not settled but on the move, warrants a fundamental rethinking of development
approaches and models.36
33 P Sainath, “Census Finding Point to a Decade of Rural Distress”, The Hindu, Sept 25, 2011 (http://www.thehindu.com/opinion/columns/sainath/census-findings-point-to-decade-of-rural-distress/article2484996.ece). 34 R B Bhagat, Migrants’ (Denied) Right to the City, M-H Zerah, V Dupont, S Tawa Lama-Rewal (scientific eds.) and M. Faetanini (publication ed.), Urban Policies and the Right to the City in India: Rights, Responsibilities and Citizenship, New Delhi, UNESCO/Centre de Sciences Humaines, 2011, pp. 48—57. 35 P Deshingkar and J Farrington, Circular Migration and Multilocational Livelihood Strategies in Rural India, New Delhi, Oxford University Press, 2009. 36 Smita, Locked Homes Empty Schools: The Impact of Distress Seasonal Migration on the Rural Poor, New Delhi, Zubaan, 2007.

33 | P a g e
Rationale of the Project
A way to address the injustice against migrant workers is based on the analysis that
the strategies need to include not just the destination states but also the home states of
migrants. The need for SLD to engage at the source of migration emerged during the course
of its intervention with the migrant workers in Gurgaon. SLD’s work in Bihar, UP, and
Jharkhand has been preliminary, and plans are underway for deepening and expanding this
part of the work. The SLD has begun to link with Bihar, UP, and Jharkhand the predominant
catchment areas from where migrant workers come to Gurgaon. This has included visiting
the districts from which migration is taking place, meeting with local organizations and also
families of those migrants, who are especially active in SLD’s work. These visits are geared
towards building at first communication links and sharing of concerns. Migrant workers’
own families and communities in home states know very little about the conditions that
their migrant relatives and friends face; this gap in knowledge leads to false notions about
the destination states and ignorance about the hurdles of migrant workers. Also, the source
states face multinational and corporate encroachment as much as the destination states and
yet, there is virtually no sharing of a common agenda for development.
Part of this research traces the forward and backward linkages of workers in
Haryana who have migrated from villages in other states, particularly in two sectors,
construction and garment. In-depth qualitative sample study of families across rural-urban
divide would also give insight into specific situations and trends. The research focuses on
social economic issues, such as education, health, wages, processes of migration and its
regulation in source and destination states. The research tries to document gender aspects
of migration -- for example, the social and familial responsibilities entrusted on women who
are left behind by their husbands (responsibility of children, of aged in-laws and relatives, of
small pieces of farm land, etc.) and the undue pressure that these responsibilities bring on
them. This enriches our understanding of migrant women workers, double roles, etc. The
four-fold research undertaken by the SLD traces the forward and backward linkages of
workers in Haryana who have migrated from villages in Uttar Pradesh, Bihar and
Jharkhand. The research also analyses the factors that drive rural to urban migration, and
the socio-economic profile of the migrant workers’ families in the villages. This report is
the fourth part of the project Researching Labour and Migration between Home and
Destination States and Developing a Holistic Rural-Urban Approach. Earlier, the two
reports explored the reasons and processes of rural to urban migration and its impact on
rural society in Uttar Pradesh and Bihar while the third report dealt with working and
living conditions of migrant workers in Gurgaon.

34 | P a g e
Objectives of the Project
Following are the major objectives of this project:
1. To understand labour mobility in terms of push factors, pull factors, scale and
changes in workers’ lives, etc.
2. To capture socio-economic profile of the migrants.
3. To understand the process of migration.
4. To capture the developmental and industrial changes in both states, i.e., the home
state and destination state.
5. To capture the scenario of civic rights, facilities and availability of government’s
welfare schemes for migrants in destination state.
6. To understand gender-related problems arising out of migration.
7. To comprehend relevant laws and institutions, etc., related to migration and
migrants.
8. To identify other social justice organizations working in the above-mentioned four
states among the migrants and their families.
9. To explore the role of local self-government bodies in the process of migration.
10. To train local constituencies and raise their awareness about the issues discovered
in the research report.
Target Groups
The project aims at building bridges with the following stake-holders in the migration
process:
Migrant workers
Workers' families
Governments
Elected offices
Social services such as schools and health services
Labour and employment departments, social justice organizations.
35 | P a g e
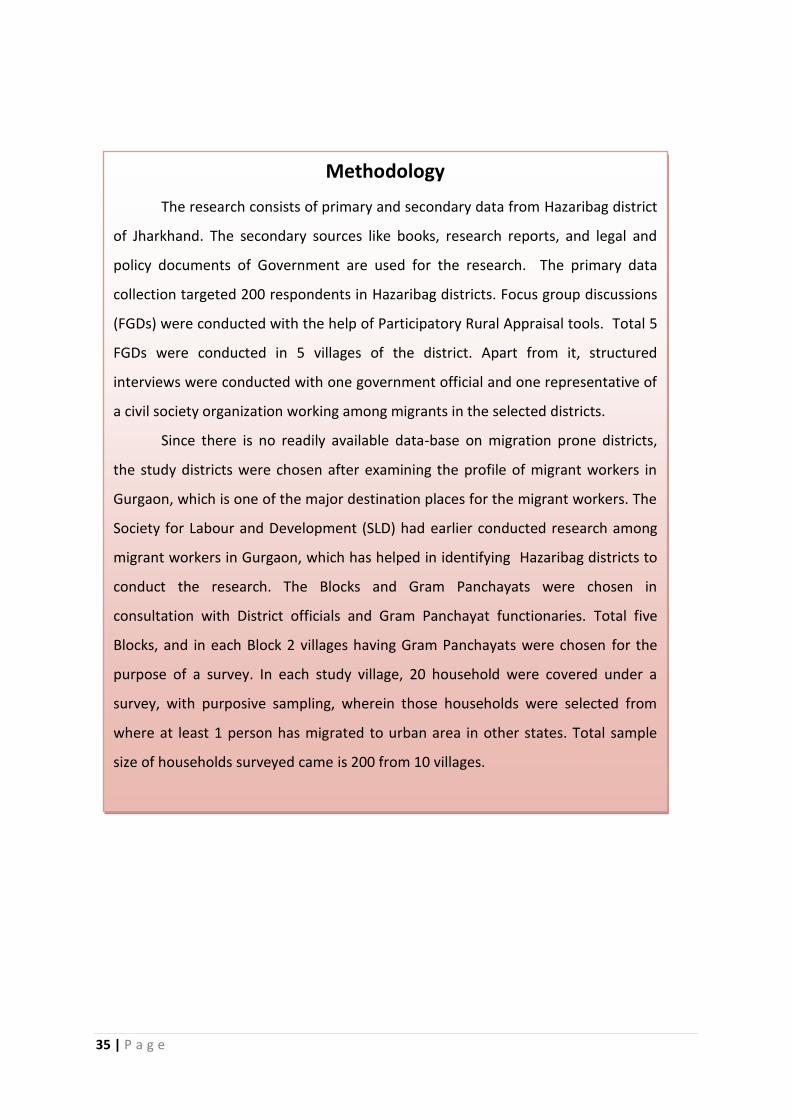
Methodology
The research consists of primary and secondary data from Hazaribag district
of Jharkhand. The secondary sources like books, research reports, and legal and
policy documents of Government are used for the research. The primary data
collection targeted 200 respondents in Hazaribag districts. Focus group discussions
(FGDs) were conducted with the help of Participatory Rural Appraisal tools. Total 5
FGDs were conducted in 5 villages of the district. Apart from it, structured
interviews were conducted with one government official and one representative of
a civil society organization working among migrants in the selected districts.
Since there is no readily available data-base on migration prone districts,
the study districts were chosen after examining the profile of migrant workers in
Gurgaon, which is one of the major destination places for the migrant workers. The
Society for Labour and Development (SLD) had earlier conducted research among
migrant workers in Gurgaon, which has helped in identifying Hazaribag districts to
conduct the research. The Blocks and Gram Panchayats were chosen in
consultation with District officials and Gram Panchayat functionaries. Total five
Blocks, and in each Block 2 villages having Gram Panchayats were chosen for the
purpose of a survey. In each study village, 20 household were covered under a
survey, with purposive sampling, wherein those households were selected from
where at least 1 person has migrated to urban area in other states. Total sample
size of households surveyed came is 200 from 10 villages.

36 | P a g e
Profile of Hazaribag District
The district of Hazaribag is situated in the north east part of North Chotanagpur
Division in the state of Jharkhand. The district headquarter at Hazaribag is 93 K.M.
by road from the capital city, Ranchi. There are three natural divisions of the
district: Medium Plateau, Lower Plateau and Damodar Valley. About 45% area of
the district is forest area. There are several ores and minerals in the naturally rich
and beautiful district of Hazaribag. Mica and Coal are the main minerals. China
clay and limestone are also found in the district. Most parts of the district are full
of forests and stones. The cultivable land can be divided into two parts – Upper
Land and Lower Land. The lands situated on the banks of the river are fertile. But
the upper land is barren. Despite heavy rain fall, irrigation facilities are quite
inadequate in the district. As a result, agriculture is not flourishing in the district.
On the contrary, people in villages rely more on forest products to meet their daily
needs. Coal mines are a major source of employment for the local people. The
significant reserve deposit of this district includes Charhi, Kuju, Ghato, Tand and
Barkagaon of North karanpura Coalfield.
In 2006, the Indian government named Hazaribag as one of the country’s 250
most backward districts. It is one of the 21 districts in Jharkhand currently
receiving funds from the Backward Regions Grant Fund (BRGF) Programme.
Hazaribag was part of the united Bihar state. It became part of Jharkhand when
the state was carved out from Bihar on 15 November 2000. The socio-economic
characteristics of the state’s population coupled with low levels of development
have been an issue afflicting the state before and after its creation as a separate
entity. Like in whole of Jharkhand, Hazaribag district has a very high percentage of
rural households. Out of the total population in the district, as per Census 2011,
84.13% population lives in rural areas. In the rural areas of the district the sex ratio
is 954 females per 1000 males. The literacy rate in the rural areas is 66.64% with
77.86% of men and 54.91% of women being literate. The district has about little
over 13% of tribal population, 14% of scheduled caste population, 45% of Other
Backward Castes and 28% of general population.
37 | P a g e
The Key Findings
Respondents’ Profile
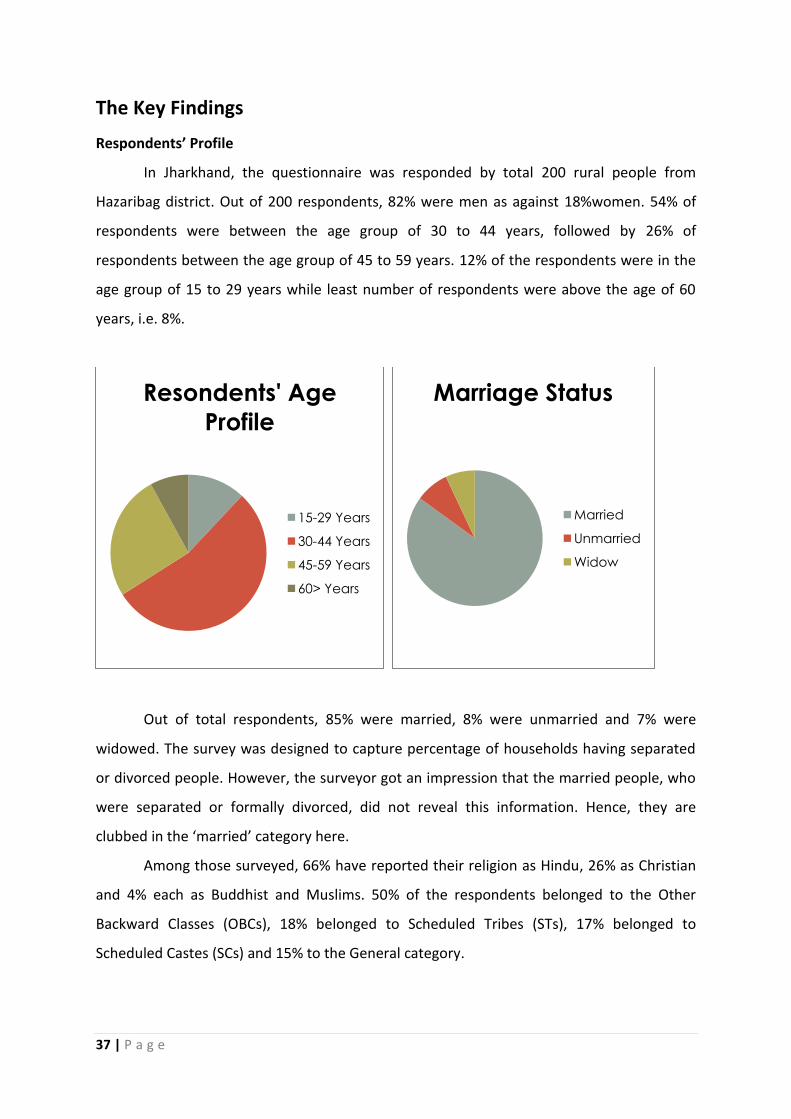
In Jharkhand, the questionnaire was responded by total 200 rural people from
Hazaribag district. Out of 200 respondents, 82% were men as against 18%women. 54% of
respondents were between the age group of 30 to 44 years, followed by 26% of
respondents between the age group of 45 to 59 years. 12% of the respondents were in the
age group of 15 to 29 years while least number of respondents were above the age of 60
years, i.e. 8%.
Out of total respondents, 85% were married, 8% were unmarried and 7% were
widowed. The survey was designed to capture percentage of households having separated
or divorced people. However, the surveyor got an impression that the married people, who
were separated or formally divorced, did not reveal this information. Hence, they are
clubbed in the ‘married’ category here.
Among those surveyed, 66% have reported their religion as Hindu, 26% as Christian
and 4% each as Buddhist and Muslims. 50% of the respondents belonged to the Other
Backward Classes (OBCs), 18% belonged to Scheduled Tribes (STs), 17% belonged to
Scheduled Castes (SCs) and 15% to the General category.
Resondents' Age
Profile
15-29 Years
30-44 Years
45-59 Years
60> Years
Marriage Status
Married
Unmarried
Widow
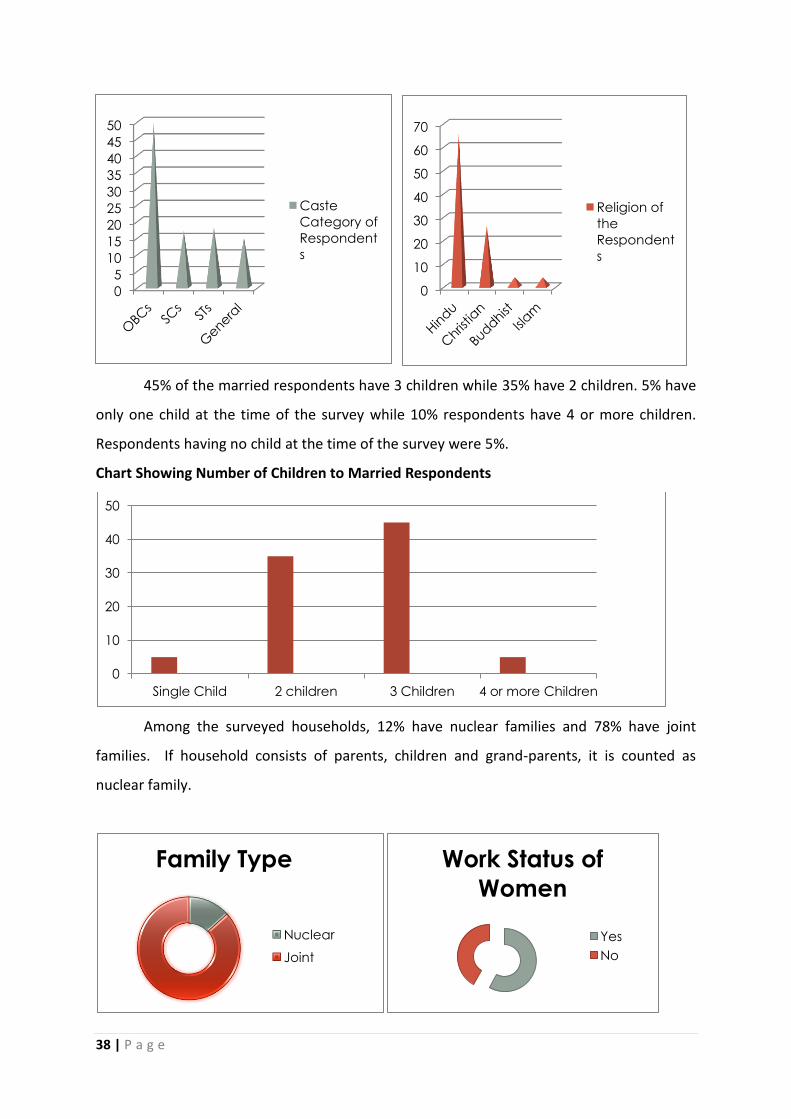
38 | P a g e
45% of the married respondents have 3 children while 35% have 2 children. 5% have
only one child at the time of the survey while 10% respondents have 4 or more children.
Respondents having no child at the time of the survey were 5%.
Chart Showing Number of Children to Married Respondents
Among the surveyed households, 12% have nuclear families and 78% have joint
families. If household consists of parents, children and grand-parents, it is counted as
nuclear family.
0
5
10
15
20
25
30
35
40
45
50
Caste
Category of
Respondent
s
0
10
20
30
40
50
60
70
Religion of
the
Respondent
s
0
10
20
30
40
50
Single Child 2 children 3 Children 4 or more Children
Family Type
Nuclear
Joint
Work Status of
Women
Yes
No
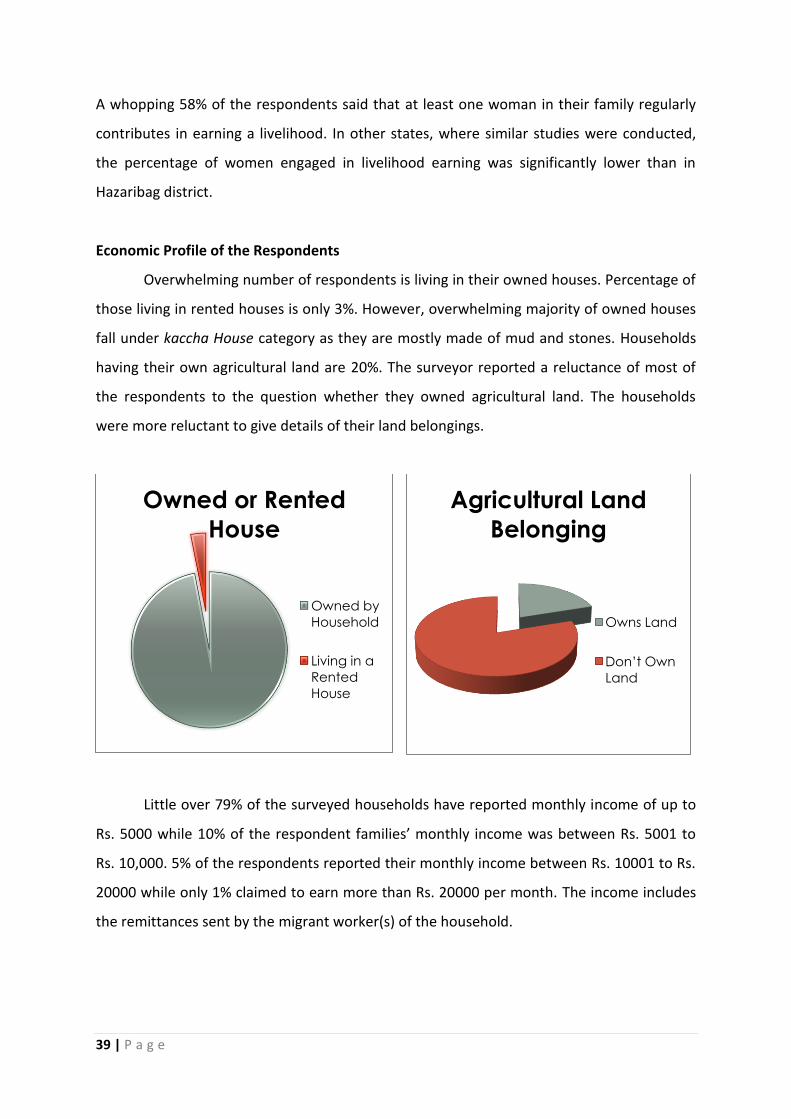
39 | P a g e
A whopping 58% of the respondents said that at least one woman in their family regularly
contributes in earning a livelihood. In other states, where similar studies were conducted,
the percentage of women engaged in livelihood earning was significantly lower than in
Hazaribag district.
Economic Profile of the Respondents
Overwhelming number of respondents is living in their owned houses. Percentage of
those living in rented houses is only 3%. However, overwhelming majority of owned houses
fall under kaccha House category as they are mostly made of mud and stones. Households
having their own agricultural land are 20%. The surveyor reported a reluctance of most of
the respondents to the question whether they owned agricultural land. The households
were more reluctant to give details of their land belongings.
Little over 79% of the surveyed households have reported monthly income of up to
Rs. 5000 while 10% of the respondent families’ monthly income was between Rs. 5001 to
Rs. 10,000. 5% of the respondents reported their monthly income between Rs. 10001 to Rs.
20000 while only 1% claimed to earn more than Rs. 20000 per month. The income includes
the remittances sent by the migrant worker(s) of the household.
Owned or Rented
House
Owned by
Household
Living in a
Rented
House
Agricultural Land
Belonging
Owns Land
Don’t Own
Land

40 | P a g e
72% of the surveyed households said that they get employment in the village or
nearby throughout the year. Rest of the respondents said that employment availability
varies from 3 to 11 months in the village or nearby area. The high percentage of households
having round the year employment is also a result of the Mahatma Gandhi National Rural
Employment Guarantee Act. In the survey, 93% of the respondents said that they are aware
of this Act and availing benefits of it. However, many of the respondents also complain of
irregularity in the work schedule and corruption in payments.
86% of the household use Chulha for cooking purpose while 8% household use LPG
cylinder for cooking daily food. Only 6% household uses Kerosene as a cooking fuel. Some of
the households were found with LPG Gas chulha but no gas cylinder. Those respondents
said that they have got the LPG connection free of cost in the government schemes but cant
afford to buy a cylinder each month. Hence they have given their cylinder to someone else
0
10
20
30
40
50
60
70
80
90
Average Monthly Income
0 10 20 30 40 50 60 70 80
Employment
Availability
0
20
40
60
80
100
Yes No
Awareness
about
MGNREGA

41 | P a g e
who could use it. Only 34% of the households have electricity connection while solar
electricity bulbs have been installed at public places in the villages and on the roads. Some
of these solar bulbs were found non-functional at the time of the survey.
Incorporation into Government’s Flagship Schemes
As mentioned above, most of the respondents have taken cognizance of MGNREGA,
a flagship scheme of Government of India. A look into other such schemes reveals that only
MGNREGA was successful in reaching out to the intended beneficiaries. About rest of the
schemes, the people gave mix responses at best.
Out of total respondents, only 38% have the Rashtriya Swasthy Bima Yojana Card or
the Smart Card as is being popularly referred to it by the government officials. Significantly,
68% of the respondents said that government’s health care centre is not accessible to them
due to distance factor. In response to a question on medical expenses occurred to a
household in immediate last two months, 79% of the respondents said that they had spent
up to Rs. 5000 for a medical treatment of family members in one calendar year. The high
percentage of respondents spending less than Rs. 5000 per year on the health exigencies of
the family shows the level of financial destitution. The poor in this region even do not have
access to credits to meet the health needs of the family. Only 2% respondents said that they
spent more than Rs. 15000 on the medical treatment of the family members in one year.
Cooking Fuel
Chulha
LPG
Kerosene
Electricity
Connection
Yes
No
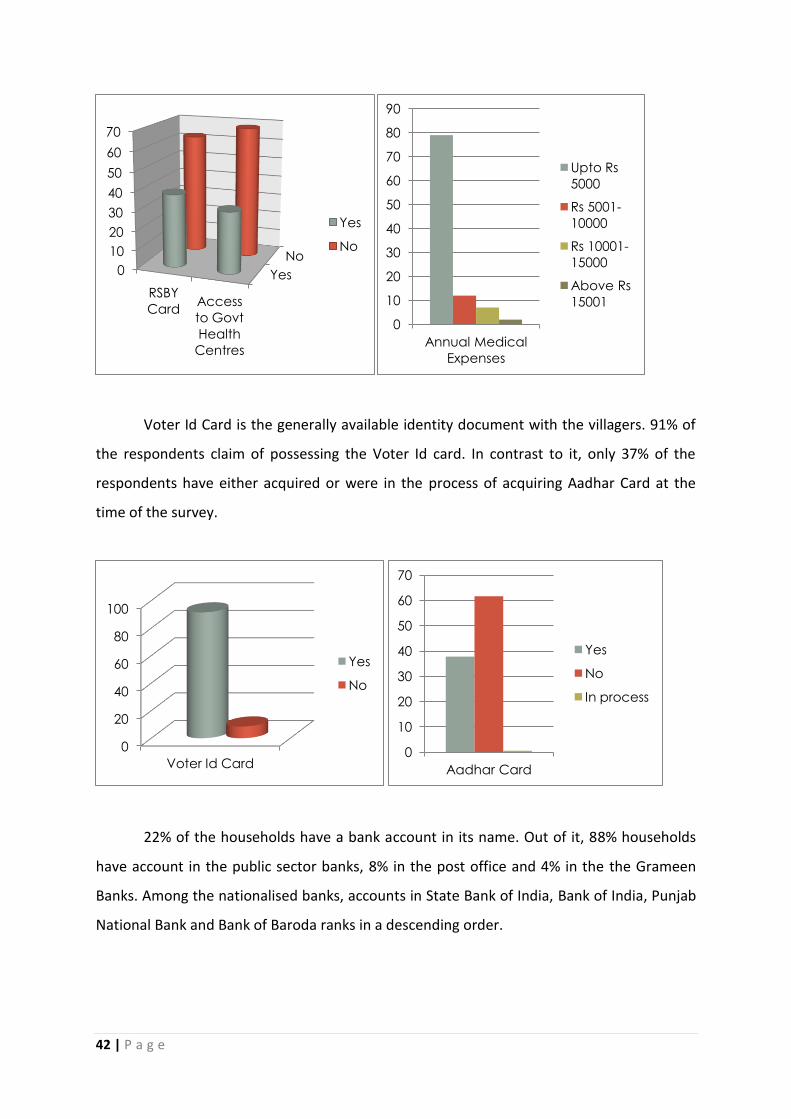
42 | P a g e
Voter Id Card is the generally available identity document with the villagers. 91% of
the respondents claim of possessing the Voter Id card. In contrast to it, only 37% of the
respondents have either acquired or were in the process of acquiring Aadhar Card at the
time of the survey.
22% of the households have a bank account in its name. Out of it, 88% households
have account in the public sector banks, 8% in the post office and 4% in the the Grameen
Banks. Among the nationalised banks, accounts in State Bank of India, Bank of India, Punjab
National Bank and Bank of Baroda ranks in a descending order.
Yes
No 0
10
20
30
40
50
60
70
RSBY
Card Access
to Govt
Health
Centres
Yes
No
0
10
20
30
40
50
60
70
80
90
Annual Medical
Expenses
Upto Rs
5000
Rs 5001-
10000
Rs 10001-
15000
Above Rs
15001
0
20
40
60
80
100
Voter Id Card
Yes
No
0
10
20
30
40
50
60
70
Aadhar Card
Yes
No
In process

43 | P a g e
At the time of the survey, very few people were aware of the Direct Cash Transfer
Benefit scheme of the Government of India. Only 2% of the respondents said that they have
heard about it while the news has not reached to the rest of the people. 78% of the
households have the BPL or APL type of ration card with them. It means that mostly these
households are entitled for cheap food grains from the government shops. While rest of the
surveyed households do have a ration card, those are not marked as BPL or APL cards.
Hence these households do not receive benefits with regard to cheap food. Since the survey
was carried out before the passing of the Food Security Act, there is a possibility that more
percentage of households would receive benefits of cheap food grains from the government
shops.
0
10
20
30
40
50
60
70
80
Bank Account
Yes
No
0
20
40
60
80
100
Bank
Account
Public Bank
Post Office
Grameen
Bank
0
20
40
60
80
100
Yes NO
Ration
Card
0
10
20
30
40
50
60
Total Ration
Card
Holders
BPL
APL
Antodaya
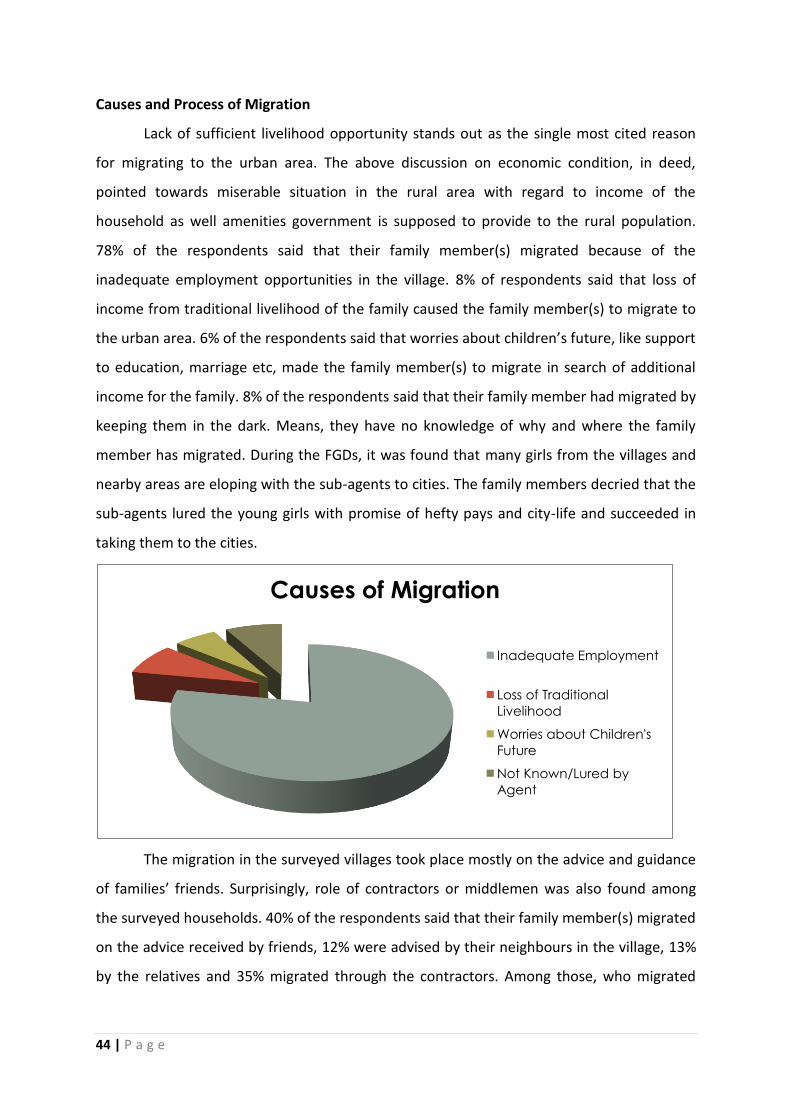
44 | P a g e
Causes and Process of Migration
Lack of sufficient livelihood opportunity stands out as the single most cited reason
for migrating to the urban area. The above discussion on economic condition, in deed,
pointed towards miserable situation in the rural area with regard to income of the
household as well amenities government is supposed to provide to the rural population.
78% of the respondents said that their family member(s) migrated because of the
inadequate employment opportunities in the village. 8% of respondents said that loss of
income from traditional livelihood of the family caused the family member(s) to migrate to
the urban area. 6% of the respondents said that worries about children’s future, like support
to education, marriage etc, made the family member(s) to migrate in search of additional
income for the family. 8% of the respondents said that their family member had migrated by
keeping them in the dark. Means, they have no knowledge of why and where the family
member has migrated. During the FGDs, it was found that many girls from the villages and
nearby areas are eloping with the sub-agents to cities. The family members decried that the
sub-agents lured the young girls with promise of hefty pays and city-life and succeeded in
taking them to the cities.
The migration in the surveyed villages took place mostly on the advice and guidance
of families’ friends. Surprisingly, role of contractors or middlemen was also found among
the surveyed households. 40% of the respondents said that their family member(s) migrated
on the advice received by friends, 12% were advised by their neighbours in the village, 13%
by the relatives and 35% migrated through the contractors. Among those, who migrated
Causes of Migration
Inadequate Employment
Loss of Traditional
Livelihood
Worries about Children's
Future
Not Known/Lured by
Agent
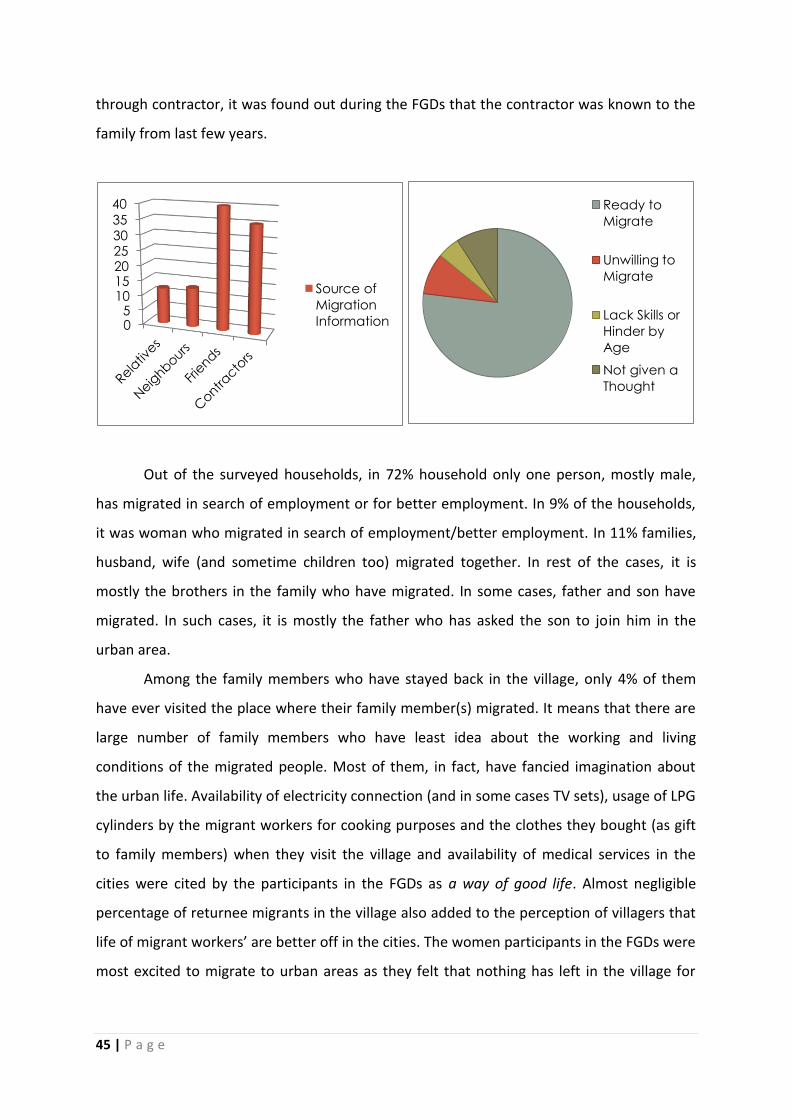
45 | P a g e
through contractor, it was found out during the FGDs that the contractor was known to the
family from last few years.
Out of the surveyed households, in 72% household only one person, mostly male,
has migrated in search of employment or for better employment. In 9% of the households,
it was woman who migrated in search of employment/better employment. In 11% families,
husband, wife (and sometime children too) migrated together. In rest of the cases, it is
mostly the brothers in the family who have migrated. In some cases, father and son have
migrated. In such cases, it is mostly the father who has asked the son to join him in the
urban area.
Among the family members who have stayed back in the village, only 4% of them
have ever visited the place where their family member(s) migrated. It means that there are
large number of family members who have least idea about the working and living
conditions of the migrated people. Most of them, in fact, have fancied imagination about
the urban life. Availability of electricity connection (and in some cases TV sets), usage of LPG
cylinders by the migrant workers for cooking purposes and the clothes they bought (as gift
to family members) when they visit the village and availability of medical services in the
cities were cited by the participants in the FGDs as a way of good life. Almost negligible
percentage of returnee migrants in the village also added to the perception of villagers that
life of migrant workers’ are better off in the cities. The women participants in the FGDs were
most excited to migrate to urban areas as they felt that nothing has left in the village for
0 5
10 15 20 25 30 35
40
Source of
Migration
Information
Ready to
Migrate
Unwilling to
Migrate
Lack Skills or
Hinder by
Age
Not given a
Thought

46 | P a g e
their comfort – यहााँ पे क्या रखा है? was their standard reference to a question on whether
they would like to migrate to the city.
Out of the surveyed households, 77% of the respondents said they would like to migrate if
they get a good employment opportunity while 9% said that they can not migrate as they
have assured employment/livelihood in the village. 5% of the respondents said that they
would not be able to migrate either because of their age or they do not have skills to work
in urban areas. 9% of the respondents said they have not thought about possibility of
migrating to urban area.
Migrant labourers from Bihar and Jharkhand were one of the key labour forces in the
development of port cities of Kolkata and Mumbai during the colonial period. After
independence, labourers from Bihar and Jharkhand migrated in large numbers to Punjab
and contributed in the Green Revolution of the country. While Mumbai remained as one of
the favoured destination as it has been a financial capital of India, of late, migrants from
Jharkhand have thronged the National Capital Region (NCR), which includes Delhi and
urbanized areas surrounding Delhi, such as Gurgaon, NOIDA, Gaziabad and Faridabad. In the
post-economic reform period, migrant labourers from Jharkhand are going to as far places
as Andhra Pradesh, Karnataka, Tamil Nadu, Gujarat, Asam, Jammu and Kerala. This survey
has showed that NCR has become the most favoured destination for the migrant workers
followed by Maharashtra. It has come out in the FGDs that migrants are going to small,
medium and large cities in different states of the country. For example, in Maharashtra,
migrants from these districts are situated not only in Mumbai but are disbursed in various
urban areas such as Thane (which is a suburb of Mumbai), Pune, Nashik and Aurangabad.
Similarly, in Gujarat, they are working in Ahmadabad, Surat and Baroda. 35% of the
respondents said that their family member(s) migrated to NCR while 17% migrated to
Maharashtra followed by 15% to Gujrat. About 7% migrated to Punjab including Chandigarh
and 10% to West Bengal. 16% of the respondents were unable to tell the exact city or state
of the migrant family member(s).
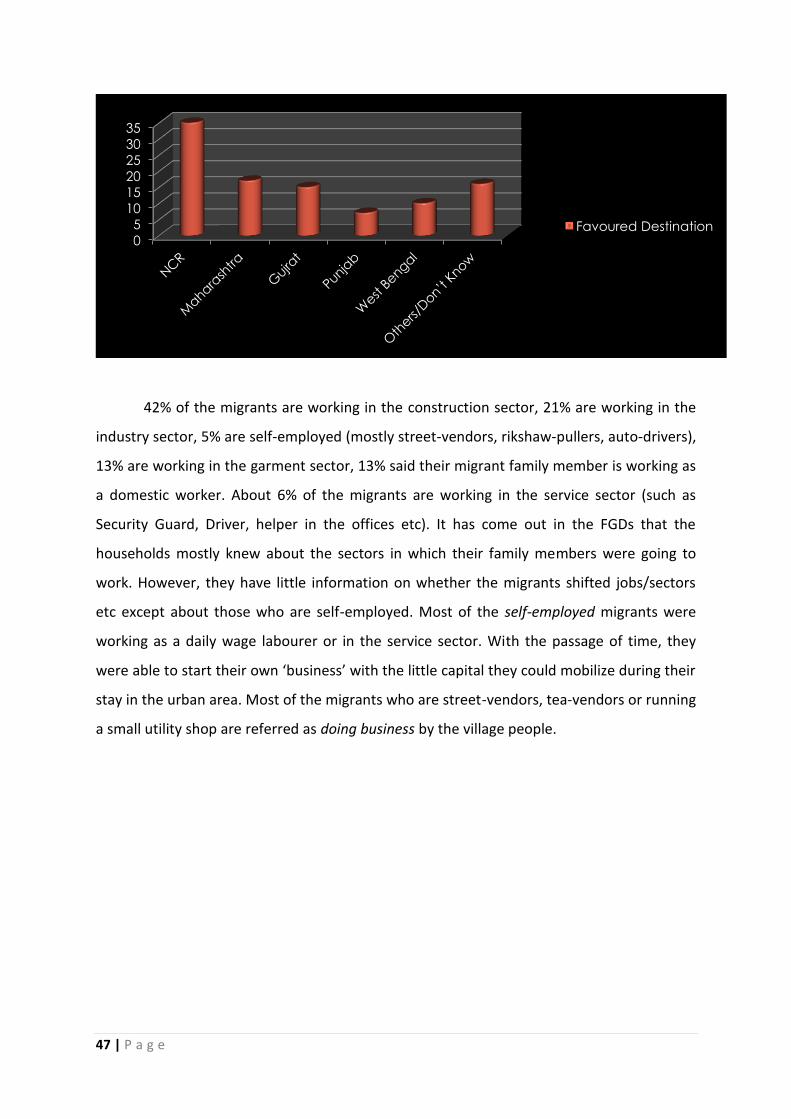
47 | P a g e
42% of the migrants are working in the construction sector, 21% are working in the
industry sector, 5% are self-employed (mostly street-vendors, rikshaw-pullers, auto-drivers),
13% are working in the garment sector, 13% said their migrant family member is working as
a domestic worker. About 6% of the migrants are working in the service sector (such as
Security Guard, Driver, helper in the offices etc). It has come out in the FGDs that the
households mostly knew about the sectors in which their family members were going to
work. However, they have little information on whether the migrants shifted jobs/sectors
etc except about those who are self-employed. Most of the self-employed migrants were
working as a daily wage labourer or in the service sector. With the passage of time, they
were able to start their own ‘business’ with the little capital they could mobilize during their
stay in the urban area. Most of the migrants who are street-vendors, tea-vendors or running
a small utility shop are referred as doing business by the village people.
0
5
10
15
20
25
30
35
Favoured Destination

48 | P a g e
37% of the migrants earn upto Rs. 5000 per month while 51% earn between Rs. 5001
to Rs. 7000 per month. About 11% migrant earn between Rs. 7001 to Rs 10000 per month
and 2% households said that their migrant family member earns more than Rs. 10000 per
month. Those who earn more than Rs. 7000 per month are mostly self-employed or working
in the service sector.
Out of total surveyed households, 55% said that they receive regular money from
the migrant in their family, 20% said that they receive it irregularly – i.e. only occasionally
and 10% said that so far they have received money only in case of urgent needs such as to
bear health cost etc. 15% of the households said that they have not receive any money from
the migrant family member so far. Out of those who are either regularly or irregularly
getting remittances, 60% said they receive average up to Rs. 2000 in one instance. 35% said
they receive average amount between Rs. 2001 to Rs. 5000 in one instance while remaining
0
5
10
15
20
25
30
35
40
45
Work-Area of Migrants
Construction
Industry
Self-employed
Garment
Domestic Workers
Service Sector
0
10
20
30
40
50
60
Monthly Income of Migrants
Upto Rs 5000
Rs. 5001-7000
Rs.7001-10000
More than Rs. 10000
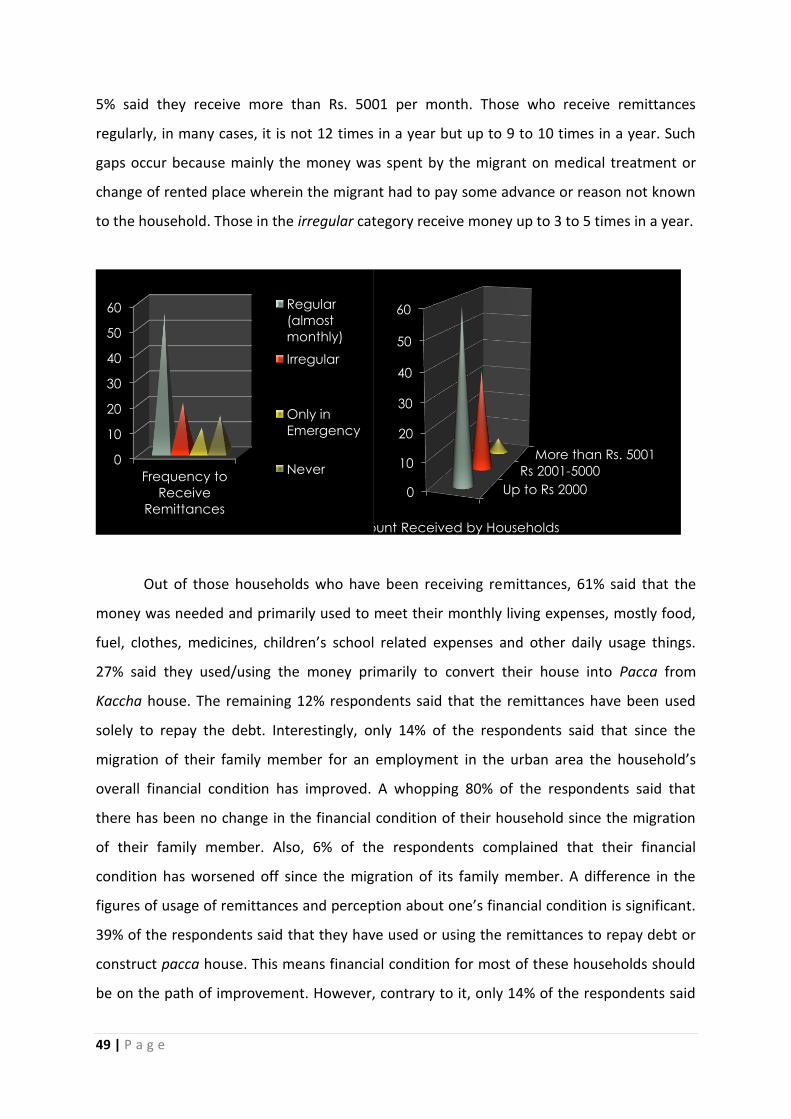
49 | P a g e
5% said they receive more than Rs. 5001 per month. Those who receive remittances
regularly, in many cases, it is not 12 times in a year but up to 9 to 10 times in a year. Such
gaps occur because mainly the money was spent by the migrant on medical treatment or
change of rented place wherein the migrant had to pay some advance or reason not known
to the household. Those in the irregular category receive money up to 3 to 5 times in a year.
Out of those households who have been receiving remittances, 61% said that the
money was needed and primarily used to meet their monthly living expenses, mostly food,
fuel, clothes, medicines, children’s school related expenses and other daily usage things.
27% said they used/using the money primarily to convert their house into Pacca from
Kaccha house. The remaining 12% respondents said that the remittances have been used
solely to repay the debt. Interestingly, only 14% of the respondents said that since the
migration of their family member for an employment in the urban area the household’s
overall financial condition has improved. A whopping 80% of the respondents said that
there has been no change in the financial condition of their household since the migration
of their family member. Also, 6% of the respondents complained that their financial
condition has worsened off since the migration of its family member. A difference in the
figures of usage of remittances and perception about one’s financial condition is significant.
39% of the respondents said that they have used or using the remittances to repay debt or
construct pacca house. This means financial condition for most of these households should
be on the path of improvement. However, contrary to it, only 14% of the respondents said
0
10
20
30
40
50
60
Frequency to
Receive
Remittances
Regular
(almost
monthly)
Irregular
Only in
Emergency
Never
Up to Rs 2000
Rs 2001-5000
More than Rs. 5001
0
10
20
30
40
50
60
Amount Received by Households
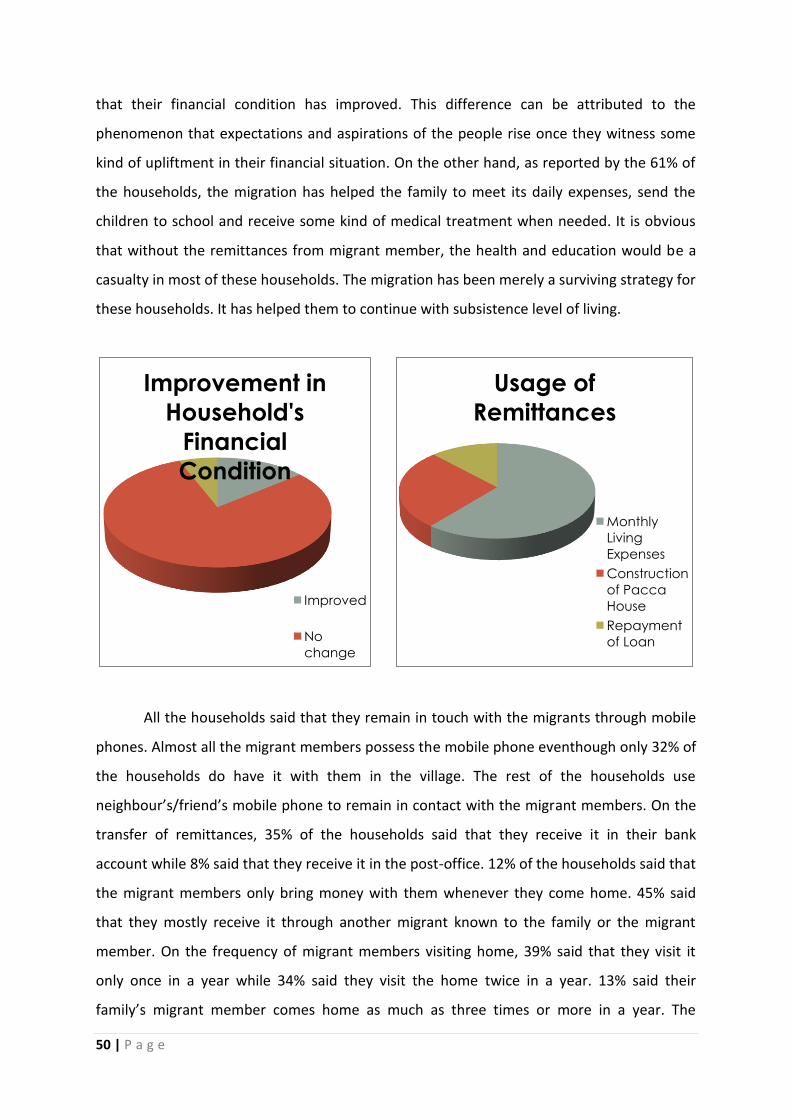
50 | P a g e
that their financial condition has improved. This difference can be attributed to the
phenomenon that expectations and aspirations of the people rise once they witness some
kind of upliftment in their financial situation. On the other hand, as reported by the 61% of
the households, the migration has helped the family to meet its daily expenses, send the
children to school and receive some kind of medical treatment when needed. It is obvious
that without the remittances from migrant member, the health and education would be a
casualty in most of these households. The migration has been merely a surviving strategy for
these households. It has helped them to continue with subsistence level of living.
All the households said that they remain in touch with the migrants through mobile
phones. Almost all the migrant members possess the mobile phone eventhough only 32% of
the households do have it with them in the village. The rest of the households use
neighbour’s/friend’s mobile phone to remain in contact with the migrant members. On the
transfer of remittances, 35% of the households said that they receive it in their bank
account while 8% said that they receive it in the post-office. 12% of the households said that
the migrant members only bring money with them whenever they come home. 45% said
that they mostly receive it through another migrant known to the family or the migrant
member. On the frequency of migrant members visiting home, 39% said that they visit it
only once in a year while 34% said they visit the home twice in a year. 13% said their
family’s migrant member comes home as much as three times or more in a year. The
Improvement in
Household's
Financial
Condition
Improved
No
change
Usage of
Remittances
Monthly
Living
Expenses
Construction
of Pacca
House
Repayment
of Loan

51 | P a g e
remaining 14% said that their family’s migrant member has either not visited home since
migration or visits once in 2-3 years.
On the negative impact of migration on the household, it is the physical distance
between the migrant and the family that bothers most of the respondents. 68% of the
respondents said that it becomes traumatic at many times that the dear one in the family is
staying alone at a far distance place. The migrant has to cook for himself everyday or does
not get good food to eat, concerns about his health and uncerainity of job continuance if he
visits home mostly dominate the households’ worries. 14% of the respondents said that
migrant member not worrying about other family members or not taking care of aged
parents is the most negative aspect of migration. This has come out particularly from those
households wherein the migrant’s wife and children have moved out to the urban area with
him leaving behind aged parents and younger sister(s) and brother(s). 8% of the respndents
said that children are deprived of father’s company is a matter of concern and it would
result in children’s roudiness or rough behaviour. 6% of the respondents said that long
distance between migrant husaband and wife in the village creates ground for mutual
suspicion and tensions in the family. 4% of the respondents said that the migrants bring in
urban culture to the village which is a dangerous trend. The elements of urban culture as
interpreted by these respondents varies from habitual drinking to family planning to
emphasis on girls’ education.
0
5
10
15
20
25
30
35
40
45
Mode to Receive
Remittances
Bank
Account
Post Office
Through
Friends
Migrant
Themselves
0
5
10
15
20
25
30
35
40
45
Frequency to Visit Home
Once in a
Year
Twice in a
Year
Thrice in a
Year
Once in 2-3
Years
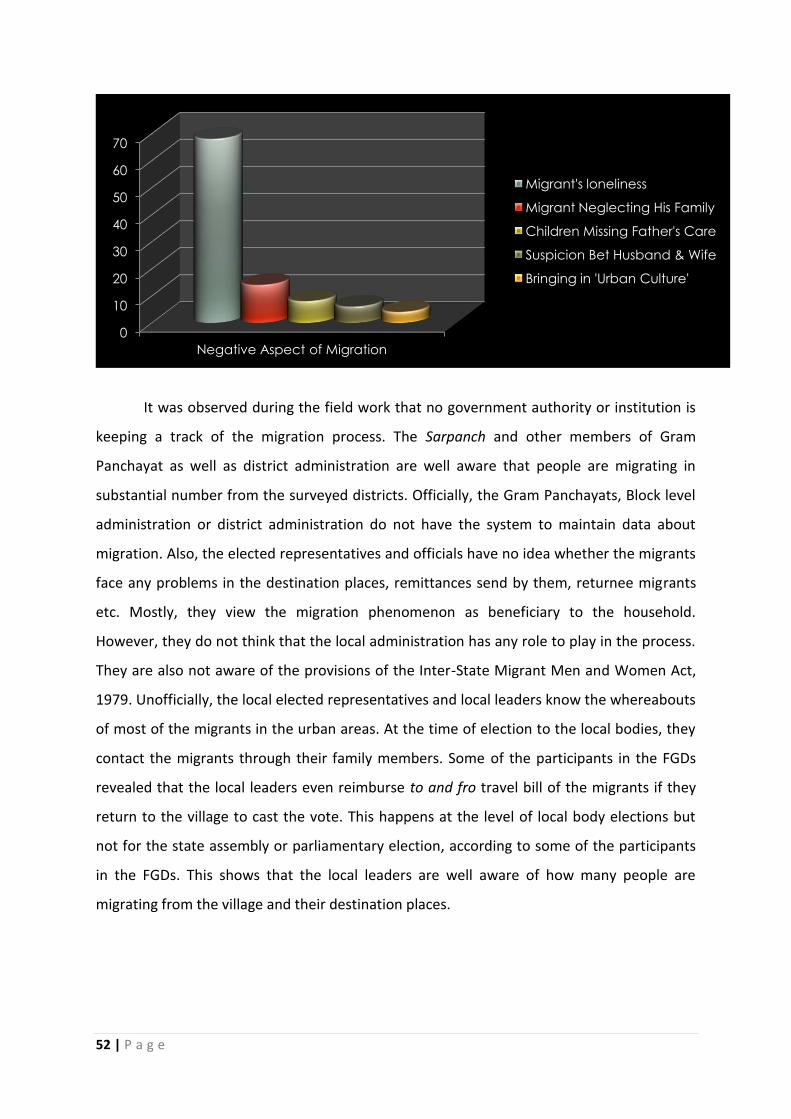
52 | P a g e
It was observed during the field work that no government authority or institution is
keeping a track of the migration process. The Sarpanch and other members of Gram
Panchayat as well as district administration are well aware that people are migrating in
substantial number from the surveyed districts. Officially, the Gram Panchayats, Block level
administration or district administration do not have the system to maintain data about
migration. Also, the elected representatives and officials have no idea whether the migrants
face any problems in the destination places, remittances send by them, returnee migrants
etc. Mostly, they view the migration phenomenon as beneficiary to the household.
However, they do not think that the local administration has any role to play in the process.
They are also not aware of the provisions of the Inter-State Migrant Men and Women Act,
1979. Unofficially, the local elected representatives and local leaders know the whereabouts
of most of the migrants in the urban areas. At the time of election to the local bodies, they
contact the migrants through their family members. Some of the participants in the FGDs
revealed that the local leaders even reimburse to and fro travel bill of the migrants if they
return to the village to cast the vote. This happens at the level of local body elections but
not for the state assembly or parliamentary election, according to some of the participants
in the FGDs. This shows that the local leaders are well aware of how many people are
migrating from the village and their destination places.
0
10
20
30
40
50
60
70
Negative Aspect of Migration
Migrant's loneliness
Migrant Neglecting His Family
Children Missing Father's Care
Suspicion Bet Husband & Wife
Bringing in 'Urban Culture'

53 | P a g e
Conclusion
It is a combination of push and pull factors that is resulting in migration from rural to
urban areas. The push factors are inadequate employment opportunities in rural areas, loss
of income from traditional livelihood and rising aspirations of the rural people for economic
prosperity. The pull factors in the urban area are availability of unskilled and semi-skilled
work, perception of possibility of upward mobility in the cities, availability of transportation
to reach out to urban areas and use of mobile phones to remain in contact with family in the
village. Most of the migrants do not own cultivable land. Those who own it, the size of their
cultivable land is small. Also, profitability in the agriculture is illusive which depends on
weather, effectiveness of seeds and fertilizers, and minimum support prices provided by the
government. Loss in agriculture directly impacts employment opportunity and income of
agricultural labourers. As a result, the small land-holders and non-land-holders need
additional source of income to meet family’s basic needs. Very little presence of cottage,
small and medium scale industry further compounds the problem since it diminishes
possibility to get work in the village or nearby area. The traditional livelihood sources like
silk production and its trade has not expanded beyond a level, therefore employment in this
sector is restricted to those who have skills in this work. There are other factors because of
which people do not find incentives to stay back in the village. These factors are lack of
quality health care, lack of quality education and non-implementation of many of the
government’s welfare measures such as construction of pacca houses or non-availability of
ration to all the households etc. The MGNREGA, although implemented with much vigour
and fanfare, has not helped in diminishing flow of migration from rural to urban area. The
minimal level of payment and only maximum 100 days’ work availability are the two factors,
which have rendered the MGNREGA less effective than intended. Also, the delays in the
transfer of payment in the bank or post-office accounts has made it less attractive for the
poor whose survival is depending on receiving regular money to meet daily expenses.
The internal migration has mostly helped the migrant’s family to survive in the
difficult financial conditions, i.e. due to migration the family has not fallen into the trap of
the abject poverty. At the same time, the remittances by the migrant member have resulted
in supporting children’s education and bearing the cost of medicines to some extent. The
remittances have helped some families to construct pacca houses and repayment of loans.
54 | P a g e
These are no lesser achievements in rural areas. Estimates of the domestic remittance
market were roughly $ 10 billion for the year 2007-08.37
If the household’s income rises in the village, there is a ground to believe that the
remittances sent by the migrants will be used more on health and education needs of the
family as well as to increase the assets of the family. Even though remittances have proved
to be helpful, most of the migrants and their families in the village do not have access to
bank accounts or post-offices to send/receive money.
The problems faced by the family due to migration of a key family member are
mostly unnoticed, undocumented and hence remain unaddressed. The Information-
Technology revolution has not gone beyond the mobile phones as far as connectivity
between migrants and their families are concerned. The temporary nature of work in the
informal sector in the urban areas where most of the migrant workers get employment is a
cause of concern for families in the village. When a migrant visits home; uncertainty of
continuance of his employment after his/her return, is a major worry for the families in the
village as well as for the migrant himself/herself. Impact of migration on women is less
explored, less known area so far. The women who migrated for work shoulder double
burden of responsibilities – at household and at the workplace. They have to adjust with
different cultural and social set up. While they lack the support of family members in case of
need (e.g. illness etc), at the same time, they feel empowered and liberated in a certain
sense as their behaviour and movement are not under the constant monitoring of other
family members. Similarly, the women in the family – particularly wife - who are left behind
by the migrant members constantly need to guard one’s honour and dignity. Many of them
are viewed with suspicion of extra-marital relationship by villagers, their own family
members and some time by the husband also. At the same time, many women feel
empowered with the sense that they are taking care of children, elders in the family and
managing financial affairs of the family. Sometime, they also receive special importance as
her husband is contributing significantly to family’s income and welfare.
The government institutions and elected local bodies such as Panchayats do not
keep records of the migrants. Due to lack of comprehensive official data on number of
migrants, destination places and nature of work there and remittances, ‘migration’ has
37
C. Tumbe, Remittances in India: Facts and Issues, Working Paper No. 331, Indian Institute of Management, Bangalore, India, 2011

55 | P a g e
remained a least priority area in government policies. In fact, it can be argued that due to
least priority accorded to the migration issue, the governments have not taken initiatives to
establish data gathering and registration mechanisms. This implies to the urban
administration as well. There are no help desks or resource centres for the migrants in the
urban areas, who are mostly depend on their acquaintances – close or remote – or
contractors to locate work and accommodation in the urban area.

56 | P a g e
Recommendations
Fill Knowledge and Research Gaps to Enable Evidence-Based Policy-Making:
Reasons, processes and impacts of internal migration are not adequately captured in
the macro databases like Census and NSSO. This has hampered formulation of policies to
prevent distress migration, facilitate inter-state migration and design schemes to deliver to
the migrants. The data and knowledge gap prevented multiple but coordinated
interventions by Central government, State governments and Non-governmental
organizations to facilitate migration and ensure integration of migrants into the economic,
social, political and cultural life of the country.
1. Revise design of Census and National Sample Surveys on migration to adequately
capture sex disaggregated and age-disaggregated data on short-term migration, multiple
reasons for migration, multiple reasons for women’s migration and multiple reasons for
children’s migration.
2. Conduct detailed countrywide mapping of internal migration (at panchayat level with
the support of civil society organizations and labour departments)
3. Encourage state-level research institutions to develop state migration profiles, including
state-wise mapping of nature, timing, duration and magnitude of migration cycles.
4. Build capacity of panchayats to maintain a database of migrant workers (with details of
numbers of migrants and recruitment by contractors) and also to register returned
migrants.
5. Adopt harmonized definition and methodology for recognizing migrant children in the
data on out-of school children and school dropouts through revision in categories and
sampling strategy to include the migrants.
6. Undertake detailed mapping of type, pattern, scale and geographical and sector-wise
spread of child migration across and within states (to be carried out by the Panchayati
Raj Institutions with the support of schools).
7. Increase research on sector-wise contribution of migrants in different industries of the
economy, including their contribution to GDP and domestic remittances.
8. Increase research on sector-wise contribution of women migrants in different industries
of the economy, including their contribution to GDP and domestic remittances
57 | P a g e
Develop a Coherent Development Policy Framework on Migration:
1. Identify migration prone districts and make appropriate financial allocation on the lines
of Backward Region Grant Fund (BRGF) scheme currently applicable in 250 districts in
the country.
2. State Governments should identify the migration prone districts where MGNREGS is not
implemented properly. The District Magistrate should be issued directives to address the
problem on a war footing.
3. Comprehensive district-level plans are required in migration prone areas to boost
irrigation and power supply to the villages. This should help in improving agriculture and
living standard in the villages.
4. The National Rural Livelihood Mission needs to be properly implemented in the
migration prone districts.
5. Union and State Governments need to develop a plan for giving incentives to small-scale
industries to develop in the region so that more full-time/part time jobs are created in
the locality.
6. Introduce Life Insurance and Workplace Accident Insurance Schemes exclusively for
migrant workers.
Develop a Coherent Legal Framework on Migration:
1. Gram Panchayats should be authorised to certify a migrant worker before he leaves for
the destination point. The migrant may be issued a certificate and a card with necessary
phone numbers where he can call in case of any distress at the destination point.
2. Revise the Inter-State Migrant Workmen (Regulation of Employment and Conditions of
Service) Act (1979) including the following gaps:
The Act applies to only migrants crossing state boundaries and, therefore, a large
section of migrants are excluded from its ambit.
It does not monitor unregistered contractors and establishments.
It remains silent on provision for crèches, education centres for children or
mobile medical units for the labourers.

58 | P a g e
It articulates no guidelines for inter-state cooperation.
It covers only regulation of employment and conditions of service of migrants
and does not address access to social protection of migrants, their right to the
city and the special vulnerabilities of children and women migrants.
Important provisions of the Act such as minimum wages, displacement allowance
medical facilities and protective clothing remain unenforced.
3. Prioritize implementation of existing labour laws including the Minimum Wages Act
(1948), Payment of Wages Act (1936), Contract Labour (Regulation and Abolition) Act
(1970), Equal Remuneration Act (1976), Bonded Labour System (Abolition) Act (1976),
Child Labour (Prohibition and Regulation) Act (1986), Workmen’s Compensation Act
(1923), Building and Other Construction Workers (Regulation of Employment and
Conditions of Service) Act (1996), and Unorganized Workers Social Security Act (2008).
Ensure working migrant women’s rights through these Acts.
4. Issue temporary LPG connection to migrants at the destination to enable access to
subsidized cylinders through government sanctioned agencies
5. Issue temporary ration cards to migrants at the destination to enable access to
subsidized food through the Public Distribution System
6. Adopt recommendations on a National Minimum Social Security Scheme for informal
workers suggested by the National Commission for Enterprises in the Unorganised
Sector (NCEUS), with the following features:
7. Universal registration of workers and issuance of unique photo identity and/or smart
cards by grass roots organizations
8. Complete portability in terms of registration, payment of premium (where applicable),
and receipt of benefits of all centrally sponsored social protection programmes,
irrespective of where migrants reside
9. National Minimum Social Security Package for all workers consisting of a retirement
benefit, a life cover, and a family health cover
10. Mainstream migration in a comprehensive and focused manner in policy documents and
national development plans such as Five Year Plans, MGNREGA, Rashtriya Swasthya
Bima Yojana, Jawaharlal Nehru National Urban Renewal Mission and City Development
Plans.
59 | P a g e
11. Establish migrant labour cells in each state labour department with the support of the
Labour Ministry.
12. The migrant workers are largely unorganised. Trade Unions, Kisan Sabhas and
appropriate Ministries/Departments need to find ways of organizing the migrant
workers. Registration of Unions/Associations in the informal sectors should be made
easy.
Develop Customized Support System for the Migrants:
1. Promote setting up migrant resource centres offering pre-departure counselling, access
to labour market information and institutionalized access to jobs, including training,
placement and skill upgradation.
2. Promote setting up of walk-in resource centres for migrants at destination places, which
provide legal counselling and information on grievance handling and dispute resolution
mechanisms.
3. Create labour helplines at both the source and the destination places.
4. Arrange night shelters and short-stay homes for migrants to provide seasonal and
temporary accommodation for migrant workers in high in-migration states.
5. Develop seasonal hostels to promote retention of children in schools in source areas, set
up worksite schools at the destination with systems to transfer enrolment, attendance
and credits to formal schools, undertake bridge courses and remedial education for
return migrant children
6. Arrange hostel and accommodation facility for unaccompanied women migrants and
civic amenities for basic sanitation and hygiene.
7. Equip worksites in with on-site or near-site ICDS anganwadis for children.
8. Establish mobile crèches, early childcare and/or day-care centres at or close to worksites
for children in the age group 0–14 years.
9. Ensure access to formal banking facilities for migrants and their families. Facilitate
secure transfer of remittances of migrants, through banking correspondents and mobile
banking, while incorporating flexibility in bank procedures (such as modification of KYC
norms and special banking hours).
60 | P a g e
10. Organize sensitization drives for policymakers, local government officials, NGOs,
employers and financial institutions regarding obstacles in accessing public services by
migrants.
11. Promote targeted interventions for health protection that address health issues of high
risk migrant populations (for example, NACO strategy on HIV Intervention for Migrants
and Red Ribbon Express trains).
12. Establish mobile health units to service health needs of migrant families and children.
Implement Existing Government Programmes Benefiting Women and Children:
1. Increase financial and human resources for Integrated Child Development Services
(ICDS), National Maternity Benefit Scheme and Rajiv Gandhi Creche Scheme in
migration-prone areas.
2. Facilitate access of migrant women to Janani Suraksha Yojana to promote institutional
delivery among pregnant poor women.
3. Enforce provisions for establishing crèches, as mandated under labour laws in the
construction, mining and plantation sectors and at MGNREGA worksites.
4. Establish mobile crèches, early childcare and day care centres for children in the age
group 0–14 years.
5. Provide Mid-Day Meals mandatorily for migrant children.
6. Increase coverage of ICDS in migrant labour camps and worksites, and improve facilities
for pre-school education and growth monitoring.
Make Provisions for Educational Needs of Migrant Children:
1. Set up village or panchayat-based seasonal hostels in sending areas to provide
residential facilities for children to stay back in the village and to promote retention of
children in local schools.
2. Tap the Special Training Programme component of RTE to ensure age-appropriate
educational competency of out-of-school and dropout child migrants.
3. Ensure child migrants’ right to education by linking them to seasonal hostels or worksite
schools in receiving areas to prevent child labour and to ensure that children are in adult
care in a safe and clean environment and have an opportunity to learn and play.

61 | P a g e
4. Include migrant parents in School Management Committees.
5. Appoint para-teachers or mobile education volunteers conversant in the native
languages of migrant children.
6. Arrange transport facilities for migrant children for easy access to schools in distant and
uninhabited areas at the destination.
7. Provide bridge courses and remedial education for children in sending areas on their
return from migration.
62 | P a g e
Annexure 1
The Inter-State Migrant Workers (Regulation of Employment and Conditions of Service) Bill, 2011
Of late, Government of India acknowledged the enormity of inter-state migration from rural
to urban area. In order to address the issues arising out of millions of inter-state workers in
various urban conglomerations in the country, the Ministry of Labour and Employment
(MoLE) prepared a bill to replace the existing Inter-State Migrant Workmen (Regulation of
Employment and Conditions of Service) Act, 1979. The act was enacted in 1979 to
safeguard the interests of migrant workers. The Act applies to every establishment and
every contractor who employs or who employed five or more Inter-State Migrant Workmen
on any day of the preceding 12 months. The Act provides for:-
(a) Registration of all principal employers/contractors employing migrant labour.
(b) Licensing of contractors – no contractor can recruit any migrant labour without obtaining
license from the appropriate Government.
(c) Issue of passbook affixed with a passport-sized photograph of the workman indicating
the name and the place of the establishment where the worker is employed, the period of
employment, rates of wages, etc. to every inter-state migrant workman.
(d) Payment of minimum wages fixed under the Minimum Wages Act, 1948. Principal
employer to nominate a representative to be present at the time of disbursement of wages
to the migrant workman by the contractor.
(e) Payment of equal wages for inter-state migrant workmen performing similar nature of
work along with the local labourers.
(f) Payment of journey allowance including payment of wages during the period of journey.
(g) Payment of displacement allowance.
(h) Suitable residential accommodation.
(i) Medical facilities free of charge.

63 | P a g e
(j) Protective clothing.
(k) Reporting by the contractor the incidence of fatal accident or serious injury of such
workman to the specified authorities of both the States and also the next of kin of the
workman.
The new bill is called The Inter-State Migrant Workers (Regulation of Employment and
Conditions of Service) Bill, 2011. This bill was introduced in the Rajya Sabha on 18th August
2011. However, it was soon referred to the Standing Committee on Labour in Lok Sabha for
detailed consideration. The new bill, ironically, only replaced the words such as workmen
for workers to make it gender neutral. Later on, the MoLE announced constitution of the
task force to prepare a detailed report on necessary changes in the earlier act (1979).
On 14th December 2011, The Standing Committee on Labour made the following
observation and recommendation on the new Bill:
“The Committee note that the Government propose to amend the Inter-State Migrant
Workmen (Regulation of Employment and Conditions of Service) Act, 1979 through the
present Bill only to the extent by substituting the words ‘workman’ and ‘workmen’ with that
of ‘worker’ and ‘workers’ in order to make it gender neutral. The proposed amendment is
pursuant to the recommendation made by the Task Force constituted by the Government of
India to suggest amendments in the labour laws concerning women and children. The
Committee were informed by the representatives of the Ministry that a Committee has
already been constituted to take a comprehensive view on the amendments required in the
existing Act. The Committee also learnt that the Government have no data on the number of
migrant workers in each State. Besides, the Government do not even have the information
regarding licensed/unlicensed contractors in the States. More so, the Government have not
made any concrete and fruitful efforts to ensure that contractors and employers mandatorily
register the workers under them so that they can avail of social benefits under the Act. The
Committee have also not come across any reported case(s) of gender discrimination under
the present Act. The Committee are convinced that by mere substitution of the words
`workman' and `workmen' with `worker' and `workers' will neither ameliorate the conditions
nor address the substantial issues like registration, passbook, payment of minimum and
64 | P a g e
equal wages, journey and displacement allowance, free medical facilities, suitable residential
accommodation etc. of the migrant workers.
The Committee are of the considered view that Government should wait for the
recommendations of the Committee already constituted to have comprehensive review of
the Inter-State Migrant Workmen (Regulation of Employment and Conditions of Service) Act,
1979.
The Committee, therefore, recommend that the Bill should be returned to the Government
with a request to bring a comprehensive amendment Bill so that the problems of the migrant
workers could be addressed in entirety.”

65 | P a g e
Annexure – 2
Organizations Working among Migrants and Their Work:
National Coalition of Organizations for the Security of Migrant Workers (NCOSMW) Around 30 NGOs working for migrant rights in the states of Maharashtra, Uttar Pradesh,
Rajasthan, Bihar, Odisha, Madhya Pradesh, and Gujarat have formed an umbrella
organization - National Coalition of Organisations for the Security of Migrant Workers
(NCOSMW). Prominent members of this coalition are Aajeevika Bureau, Disha Foundation,
YUVA, Pratikar, PRAYAS, Mumbai Mobile Creches, PEPUS, Sahbhagi Siksha Kendra,
Samarthan, Grameen Development Services and BASIX. The NCOSMW is focussing on
drafting a national policy on migration, ensuring extension of social security for migrant
workers and increasing state and national level visibility and recognition of the migration
issue. Anjali Borhade and Rajiv Khandelwal are Convenor and Co-convenor of NCOSMW.
Aajeevika Bureau
Identity-Cards: Aajeevika Bureau has developed a system of doing registration of migrants
and issuing identity cards to them. The worker applies for the identity card by filling out a
simple registration form that captures demographic information including the duration of
their migration cycle and his/her destination, trade and income. Migrants get this
information verified by the Sarpanch. Following this, migrants are issued with an identity
card that contains all relevant details, including their domicile, trade, education and contact
details. This system was initiated in 2005. Ministry of Labour and Employment of Rajasthan
recognised it as a valid proof of identity in December 2007. This authorisation has
increasingly been accepted by employers, police and local administration as a credible proof
of identity.
Now this card can also be used for opening of bank accounts and enrolment for social
security services. The photo ID is also a critical document preventing migrants from

66 | P a g e
experiencing police harassment that is common place in cities. Aajeevika Bureau has
registered over 70,000 migrants since 2005.
Sir Dorabji Tata Trust (SDTT) has supported about 32 organizations to replicate this system
in 41 districts in states such as Odisha, Bihar, Uttar Pradesh, Madhya Pradesh, and
Rajasthan. These organizations are covering about 100,000 migrants in high out-migration
states as well as key urban destinations. It is obvious that the scale of migration is so high
that a much larger response with involvement of state, civil society and trade unions are
required to address this identity crisis.
Shramik Sahayata evam Sandarbha Kendras: Aajeevika Bureau provides legal counselling
for migrants who suffer due to the nature of the informal labour market. This service
comprises of focussed programmes for legal literacy and direct legal help through mediation
and litigation. In the case of a dispute, workers can just walk-in the Shramik Sahayata evam
Sandarbha Kendras (or 3SKs) to register their case and seek counsel and aid. There are
regular legal clinic days to resolve the cases. The legal clinic is replica of the formal court
mechanism. The legal clinic mediates between the complainant and the offenders. An
emphasis is on resolving disputes through negotiation rather than litigation as the latter can
be expensive and time consuming for the workers. Over 1,000 cases were registered with
the Aajeevika Bureau so far out of which 540 cases have been resolved, mainly through
arbitration. This intervention has resulted in a settlement of over US$ 100,000 in favor of
workers.
Labour Line: In August 2011, Aajeevika Bureau has started a phone-based help line for
workers in Udaipur, Rajasthan. The helpline involves a dedicated phone line answered by a
trained counsellor. It allows workers to reach out for counsel in case of any problem related
to wages, retrenchment or abuse. Labour Line is supported by a network of walk-in resource
centres. The majority of cases that reach the counsellors are regarding wage payments.
Suvidha Rasoi Ghars: Aajeevika has collaborated with Hindustan Petroleum Corporation
Limited (HPCL) to set up community kitchens or Suvidha Rasoi Ghars in Ahmedabad. These
kitchens are spaces with stoves and LPG cylinders where groups of migrants can cook. The
installation cost is borne by the company. Now, the Aajeevika has also started a mobile

67 | P a g e
kitchen initiative for migrant workers. This service is being run at ten different locations,
benefitting more than 400 migrant workers across the city of Ahmedabad. This is not only
cost-effective but also more hygienic resulting in better health outcomes for the migrant
community.
Source: www.aajeevika.org
Labournet
Identity Cards: The Bangalore based LabourNet programme has also issued migrants with
identity cards. Since 2006, it has registered over 40,000 workers. LabourNet operates
through a network of Worker Facilitation Centres in Karnataka. It undertakes the
registration of unorganised sector workers, including migrants, through referrals and direct
field-based registration drives. It collects workers’ details regarding their qualification,
experience, family details and proof of address. The information is entered into a a
centralised database. An annual fee of Rs. 150 is charged from workers for registration. On
the basis of this registration, workers are entitled for a laminated identity card, a bank
account opened in their name and accident insurance coverage.
Workers Training Programme: LabourNet provides training support to the workers in order
to create a more productive workforce. The trainings are given with the objectives to
increase employability and improvement in remuneration. It imparts skills training through
their Worker Facilitation Centres in Karnataka. The trained workers are issued certificates in
a number of different trades such as carpenters, masons, electricians and beauticians.
According to LabourNet, the programme has provided training for 6 300 workers, conducted
skills assessments for 7 500 workers and provided job linkages to over 8000 workers.
Source: www.labournet.in
Strengthen and Harmonise Research and Action on Migration (SHRAM)
SHRAM is a research portal and data repository on migration and migrants. It is a first-of-its-
kind interactive research and data portal on migration. It contains a searchable repository of
migration research, and aims to facilitate researcher interaction and policy and strategy
formulations, and to conduct virtual training programmes.
Source: www.shram.org

68 | P a g e
Disha Foundation
Identity Cards: Disha Foundation in Nashik has issued identity cards to 15,000 migrants
employed in various sectors. Membership of the trade union and registration for identity
card is entwined. Migrants are provided with official membership and a photo identity card
for the union. Rs. 10 is charged for lifetime membership and it is offered to migrants in
Nashik city as well as at source villages. These trade union cards have been validated by the
gram panchayats of source villages. The identity card has been proved as a useful proof of
identity to access public services in Nashik city.
Complaint Box: Disha Foundation and Department of Labour, Maharashtra, have jointly
initiated a grievance handling cell pertaining to the migrants’ employment, wages and
related complaints. Two complaint boxes are kept at the two labour markets in the Nashik
city. A complainant has to drop a complaint form in the box. A local committee, consisting of
Naka Workers deals with lighter complaints and major cases are referred to the labour
department.
Portability of Ration Benefits: The Maharashtra Government has issued a notification in
November, 2000 (Resolution 1000/ GR 399/ 2000/ NP28) for facilitation of temporary ration
card in a destination city for seasonal migrants. On the basis of this notification, Disha
Foundation played a mediating role between the Department of Public Distribution System,
state government authorities and the migrants. The government authorities made on-site
visits with Disha foundation and issued an order to provide seasonal migrants with
temporary ration cards for four months against their existing ration cards. It was made
extendable to 12 months. If migrants are going back to the home village, they have to cancel
the temporary ration card at the destination city so that they avail subsidised food grain in
their home villages. These temporary ration cards can be renewed on their return to the
destination city. In this case, the destination city is Nashik in Maharashtra. Department of
Public Distribution System relaxed the rules for migrant workers to acquire temporary ration
cards. For instance, in place of proof of identity and residence, a letter from the contractor
stating where the migrant works; a photo of the migrant with family members; a
recommendation from another registered migrant from the same village; a Disha Union card
and letter of recommendation from Disha are required for registration for ration card.

69 | P a g e
Initially, Department of Public Distribution System issued new ration cards to 55 migrants of
Civil Naka in Nashik. After the success of this experiment, 1200 more migrants were issued
the temporary ration cards.
Sexual and Reproductive Health (SRH) of Migrants: Disha Foundation piloted a project
designed to improve the sexual and reproductive health (SRH) of migrants in Nashik,
Maharashtra. Disha Foundation introduced a formal referral process for migrants to
government health services to provide better access to health care. A triplicate referral form
was developed for migrants, health providers and Disha Foundation itself. The medical
history and related details of migrants are provided in the form, while the reverse side of
the form provides contact information of all available government health services in Nashik.
The form is helpful for migrants in getting direct treatment from doctors without much
delay and discussion.
Migration Resource Centre: The Migration Resource Centre works on fulfilment of two
objectives: One, it will facilitate migration to Nashik city through livelihood skills building
and job linkages; and two, it will focus on the better implementation of existing government
programmes at source villages of migrants in Nashik district to reduce distress migration.
The Migration Resource Centre plans to generate data on migrant flows for better informed
programmes and policies. Establishment of this centre is a result of Disha Foundation’s
seven year’s work to bring in the migration issue into policy level discourse. The Union
Ministry of Tribal Affairs has sanctioned a grant for the construction of the Migration
Resource Centre and the Maharashtra state government has financed the programme cost
for three years. The land for the construction of the centre has been allotted by the Urban
Land Ceiling Department.
Source: www.dishafoundation.wordpress.com
Paryavaran Evam Prodyogiki Utthan Samiti (PEPUS)
Shramik Sahayata Kendra: Paryavaran Evam Prodyogiki Utthan Samiti (PEPUS) - means
Society for Environmental and Technical Upliftment - is based in Jhusi, Allahabad, Uttar
Pradesh. It facilitates the process of dispute resolution for migrant labourers and aims to
reach a settlement through mutual dialogue. Migrant labourers submit a written complaint
70 | P a g e
at the Shramik Sahayata Kendra (Migrant Resource Centre). After discussion, an information
letter is issued by the Centre to the opponent party. In most of the cases, the opponent
party is either the labour contractor or brick kiln owner or both. The letter comprises of
details of the dispute and date of hearing. On the day of the dispute hearing, both parties
assemble at the centre and a hearing took place. The Centre makes attempts to resolve the
dispute by proactive mediation and arbitration. However, the unresolved cases are
forwarded to an advocate of the High Court, who attends the centre on a regular basis and
takes necessary action for dispute resolution. PEPUS’ data shows that they have registered a
total of 187 cases, of which 50 cases have been resolved, with a total of Rs. 7,39,141 unpaid
wage arrears being accorded to labourers. PEPUS has also promoted the formation of a
collective of migrant labourers working in brick kilns, known as Bhatta Parivar Vikas Sewa
Samiti, i.e. Association for Development of Families of Brick Kiln Workers.
Source: www.pepus.org
Aide et Action
Village Migration Register: Aide et Action has started a practice to maintain a village
migration register in source states like Odisha to keep a database of migrant families and
the migrant children. The village migrant register is kept in 66 villages covering three
districts: Balangir, Nuapada and Bargarh. This register is also helpful in identifying probable
migrant children for the next season. Aide et Action has identified these children and carries
out advocacy with the Sarva Shiksha Abhiayaan (SSA) to retain these children at source
villages in Odisha.
Seasonal Hostels: In Andhra Pradesh, Aide et Action 163 worksite schools in 10 districts.
Similarly, in the Tiruvellur district of Tamil Nadu, Aide et Action has established 10 worksite
schools catering to 430 migrant children of families working in brick kilns. The worksite
owners and workers were involved in setting up these schools for migrant children. Along
with it, it has established nine seasonal hostels in Srikakulam, Andhra Pradesh with the
support of a local NGO, Action in Rural Technology and Service. These hostels are used to
retain the children of the migrant fishing community. In 2013, Aide et Action, in
collaboration with SSA Odisha, has planned to retain 5,000 children through seasonal
hostels in the Balangir, Nuapada and Bargarh districts.
71 | P a g e
Source: www.aea-southasia.org
Lokadrusti
Seasonal Hostels: Lokadrusti has set up seven seasonal hostels in seven of the most
migration prone villages in the Khariar Block of Nuapada district. Families from these villages
have to often undertake distress migration to brick kilns in Andhra Pradesh and Tamil Nadu.
Since 2004, Lokadrusti has opened 168 seasonal hostels in the migration-prone villages of
Nuapada district, preventing the migration of more than 4,000 children – both girls and boys
- and subsequent dropping out of school. Many children have completed their education
upto 12th standard by staying in these hostels and many of them are now enrolled for
college education. It also runs bridge courses to re-enrol the returnee migrant children to
the school. Lokadrusti is supported in its endeavour by America India Foundation.
The District Primary Education Programme of the Sarva Shiksha Abhiyan in Odisha has
adopted this model and started establishing seasonal hostels named as ‘Residential Care
Centres’ (RCC). The RCCs are maintained in the existing government schools of the
respective villages with the support of village SHGs, school teachers, sub inspectors of
schools and Panchayati Raj Institution members.
Source: www.aif.org and www.lokadrusti.org
Sanlaap
Sensitization Programmes: Sanlaap initially focussed on providing rehabilitation support to
the rescued survivors of prostitution. The objective was also to prevent second generation
prostitution. Gradually, Sanlaap realized the need to carry out human traffic prevention
activities in the source area. Then Sanlaap has started to create awareness on safe
migration, trafficking and violence against women in the source areas of migration. It
undertakes sensitization programmes for panchayat members and district administration
personnel on migration and trafficking. It involves Community-based Organisations in this
process. On the other hand, the girls in the villages are connected to vocational trainings to
ensure they are able to make a living, look after themselves and educate others about
trafficking.
Shelter-Homes: Sanlaap also runs four shelter homes for about 250 girls in and around
Kolkata for minors rescued from commercial sexual exploitation, girl children of women in
72 | P a g e
prostitution and other vulnerable girl children. The shelter homes offer a holistic
programme encompassing education, mental health intervention, vocational training and
economic initiatives, dance movement therapy and legal aid.
The UN Women and Child Rights and You (CRY) are supporting Sanlaap since 2010.
Source: www.sanlaapindia.org
Butterflies
The Mobile Education Programme: Motto of Butterflies is “If the children cannot come to
the school, let us take the school to them”. Under the Mobile Education Programme, the
Chalta Firta School (Mobile Learning Centre) has brought the school to the children’s
doorstep. This has benefitted the migrant children more because they cannot attend school
due to lack of school certificates and other proofs of identification. Butterflies’ Mobile
Education Programme also facilitates the admission of out-of-school children into formal
schools. Innovative teaching methodologies are used to engage creatively with children,
such as play methods and age-appropriate learning materials such as educational toys like
blocks, flash cards and multilingual educational books. Children also have access to different
types of technology-based tools, like LCD TVs and laptops. Teachers, referred as ‘child right
advocates’, provide computer education to children and share educational software. When
migrant families go to their villages (for instance during harvest and Holi festival), a list of
children is maintained so that they may be reintegrated once they return. In case parents
migrate to new locations, Butterflies facilitates the process of making affidavits so that the
children may go to formal schools at their next destination. Currently Butterflies reaches out
to children across 11 project locations in Delhi and 4 project locations in the Haridwar
district of Uttarakhand. It works in close coordination with State Education Departments in
Delhi and Uttarakhand.
Source: www.butterflieschildrights.org
Mobile Crèches
Childcare Services: Mobile Crèches was founded in 1969 in Delhi and mainly operates in the
National Capital Region to provide childcare services to migrant children on construction
sites. It has developed a comprehensive day-care programme wherein it runs an eight-hour
programme six days a week throughout the year. The programme is an integrated package
of health, nutritional and educational services to respond to the different needs of children
73 | P a g e
from birth to 12 years. It has three distinct sections: (i) the crèche for children below three
years old; (ii) the Balwadi (pre-school) for children between the ages of three and six; (iii)
the non-formal education for older children. Mobile Crèches operates 650 day-care centres
and has developed partnership with 200 builders. Builders and contractors are increasingly
accepting a greater responsibility in managing and financing the crèche. Mobile Crèches is
also engaging the government authorities for implementation of the State Boards and
welfare funds set up under the Building and Other Construction Workers Act of 1996.
Source: www.mobilecreches.org
The Tata Trust Migrant Support Programme
Under the Urban Poverty and Livelihoods portfolio of the Sir Dorabji Tata Trust and Allied
Trusts, the Tata Trust Migrant Support Programme is reaching out to over 100,000 migrants
through 34 partners working in eight states. It has a special focus on Rajasthan, Odisha and
Uttar Pradesh. A Centre for Migration and Labour Solutions is created in partnership with
Aajeevika Bureau to act as a technical support unit to its network of migration patterns.
Migration Resource Centres (MRCs) are established at various source and destination places
to provide legal aid, counselling and facilitate access to social services.
Shahri Adhikar Manch: Begharon Ke Saath - (SAM-BKS)
Shahri Adhikar Manch: Begharon Ke Saat (SAM-BKS) or ‘Urban Rights Forum: With the
Homeless’ comprises of a coalition of over 30 voluntary organisations. SAM-BKS’s
sensitization drive for homeless citizens in Delhi and against the demolition of shelters for
the homeless formed the background of the Delhi High Court’s and the Supreme Court’s
directives to the Delhi Government in January 2010 to build at least one shelter per 100,000
inhabitants on a priority basis, and to make these 24-hour shelters, functional throughout
the year. These directives were later given to all the States and Union Territories. SAM-BKS
is supported by Indo-Global Social Service Society, Delhi (IGSSS).
Source: www.igsss.org
UNESCO’s Gender, Youth and Migration (GYM) Sub-Community:
UNESCO is supporting the establishment of a knowledge management tool on Gender,
Youth and Migration (GYM). The GYM is a sub-community of practice of the Gender
74 | P a g e
Community of UN Solution Exchange, which is supported by UNICEF and UN Women. GYM
will be a dedicated ‘resource hub’ that will bring together experts, researchers, NGOs and
officials who share a common concern on the topic of gender, migration and youth. Their
interaction is expected to deepen their knowledge and expertise in this area. The GYM sub-
community would serve as a base for informing socially inclusive and sustainable policies.
Source: www.unesco.org/newdelhi
International Labour Organization (ILO)
The International Labour Organisation (ILO) has partnered with the Union Ministry of Labour
and Employment and state governments to promote decent work. The objective of this
collaboration is to reduce the percentage of seasonal migrants turning into bondage labour,
especially in the brick kiln sector. A pilot project was initiated in Tamil Nadu by the ILO and it
is now being expanded to cover the brick kiln sector in the states of Andhra Pradesh, Uttar
Pradesh, Odisha, Jharkhand and Chhattisgarh. The project aims to promote the decent work
in the brick kiln sector. Promotion of decent work comprises of improvement of workplace
conditions, transparency in wage payments, social dialogue to resolve workplace problems,
enrolling migrant workers in government schemes at source and destination states,
unionising workers and schooling opportunities for migrant children.
In order to tackle cases of bondage among inter-state migrant workers, the project aims to
establish an inter-state coordination mechanism at the national level. On 8 June 2012, a
Memorandum of Understanding (MoU) has been signed between a source state - Odisha
and a destination state - Andhra Pradesh and the Ministry of Labour and Employment for
inter-state coordination to reduce the vulnerability to bondage of migrant workers. Under
this agreement, a Migrant Workers Cell was constituted to look into the issues of inter-state
migrants and to provide assistance to the states and for facilitating resolution of grievances
between the states. Similar MoUs are expected to be signed by Jharkhand, Uttar Pradesh,
Chhattisgarh and Bihar with corresponding destination states.
Source: www.ilo.org/newdelhi and www.labour.nic.in
Bihar Government’s Jeevika Programme
Bihar government, with support from the World Bank, has started a Bihar Rural Livelihoods
Project within the framework of the National Rural Livelihoods Mission. It is named as
Jeevika. The project is covering 400 villages and 7,00,000 households. Under this

75 | P a g e
programme, government facilitates job fairs in which private companies such as Vardhaman
Spinning of Oswal group, Orient Craft Fashion Institute of Technology and Matrix Clothing
Pvt. Ltd, Gurgaon participate. The companies provide information on workplace, hostels and
informing the youth regarding the salaries and incentives being offered. Community
resource persons are also trained to mobilise the youth to participate in job-fairs. A
dedicated call centre has been set up in Bodh-Gaya for this purpose. Jeevika also runs short-
term training courses for migrant workers to facilitate a shift to higher incomes and
organised sector jobs. Jeevika, under the Labour department, has also planned to issue
identity cards to the migrants to ensure entitlements of social security and to prevent
exploitation by police on buses and trains. It also has a plan to introduce pensions to
migrants. Migration Resource Centres are planned at the block level. The centres will build a
data base of migrants with details of their destinations, income and name of contractor.
In addition to Jeevika, the Government of Bihar has also instituted the Bihar State Migrant
Labour Accident Grant Scheme, which provides compensation to a deceased migrant family
up to Rs. 1 lakh in event of death, Rs. 75,000 for permanent disability and Rs. 37,500 for
partial disability. A Joint Labour Commissioner has also been positioned at New Delhi to
address grievances of Bihari migrants.
Source: www.brlp.in
Shimla Municipality’s Shelter Initiative
A young Deputy-Mayor of Shimla Municipality initiated a proposal to construct hostels for
seasonal migrant workers. The construction workers from Bihar, U.P., Jammu and Kashmir
and other parts of Himachal Pradesh stay in Shimla in temporary tents in extreme cold
conditions. Now, municipality is constructing 3 hostels for migrant workers. The municipality
is also considering bus services originating from these hostels. The workers may not find it
convenient to stay in the hostels if transport is not available to and fro the worksites.
Government of Kerala’s Initiatives
Kerala government has initiated a draft of the legislation titled Kerala Migrant Workers
(Conditions of Service and Compulsory Registration) Social Security Bill. The state
government has appointed state-level and regional level nodal officers for monitoring the
complaints from migrant labourers. Awareness camps are being organized throughout the

76 | P a g e
state among migrant workers on their rights and wages. Government has prepared a
booklet containing the legal rights of the migrant workers and legal liabilities of the principal
employers/contractors. The booklet is distributed free of cost.
77 | P a g e
Annexure - 3
International Conventions and Declarations Concerning Migration
UN Universal Declaration on Human Rights (1948)
UN International Convention on the Elimination of All Forms of Racial Discrimination
(1966)
UN International Covenant on Economic, Social and Cultural Rights (1966)
UN International Covenant on Civil and Political Rights (1966)
UN International Convention on the Protection of the Rights of All Migrant Workers
and Members of their Families (2003)
UN Convention on the Elimination of All Forms of Discrimination against Women
(CEDAW) (1979)
UN Convention on the Rights of the Child (CRC) (1989)
UNESCO Universal Declaration on Cultural Diversity (2001)
UNESCO Convention for the Safeguarding of Intangible Cultural Heritage (2003)
UNESCO Convention on the Protection and Promotion of the Diversity of Cultural
Expressions (2005)
Protocol to Prevent, Suppress and Punish Trafficking in Persons, Especially Women
and Children (2000), supplementing the United Nations Convention against
Transnational Organized Crime
ILO Migration for Employment Convention (Revised) (1949) (No. 97)
ILO Social Security (Minimum Standards) Convention (1952) (No. 102)
ILO Equality of Treatment (Social Security) Convention (1962) (No. 118)
ILO Migrant Workers (Supplementary Provisions) Convention (1975) (No. 143)
ILO Maintenance of Social Security Rights Convention (No. 157) (1982)
ILO Domestic Workers Convention (2011) (No. 189)
ILO Migration for Employment (Revised) Recommendation (1949) (No. 86)
ILO Protection of Migrant Workers (Underdeveloped Countries) Recommendation
(1955) (No. 100)
ILO Migrant Workers Recommendation (1975) (No. 151)
ILO Domestic Workers Recommendation (2011) (No. 201)
SAARC Convention on Preventing and Combating Trafficking in Women and Children
for Prostitution (2002)34
Indian Legislations
Workmen’s Compensation Act (1923)
Payment of Wages Act (1936)
Minimum Wages Act (1948)
Immoral Traffic (Prevention) Act (1956)

78 | P a g e
Contract Labour (Regulation and Abolition) Act (1970)
Bonded Labour System (Abolition) Act (1976)
Equal Remuneration Act (1976)
Inter-State Migrant Workmen (Regulation of Employment and Conditions of Service)
Act (1979)
Child Labour (Prohibition and Regulation) Act (1986)
Building and Other Construction Workers (Regulation of Employment and Conditions
of Service) Act (1996)
Unorganised Workers Social Security Act (2008)
Criminal Law (Amendment) Act 2013
Migration Networks
National
National Coalition of Organisations for the Security of Migrant Workers (NCOSMW)
Gender Youth Migration (GYM), Gender Community of Practice, UN Solution
Exchange
http://www.solutionexchange-un.net.in/communities/gender_gym
Strengthen and Harmonize Research and Action on Migration (SHRAM)
Forthcoming: www.shram.org
Internal Migration in India Initiative (IMII)
www.unesco.org/newdelhi
International
Asia Pacific Migration Resource Network
www.apmrn.usp.ac.fj
Cities of Migration, Canada
www.citiesofmigration.ca
Development Research Centre on Migration, Globalisation and Poverty, University of
Sussex
www.migrationdrc.org
European Migration Network
www.emn.intrasoft-intl.com/html/index.html
European Network Against Racism (ENAR)
www.enar-eu.org
Global Development Network
http://www.gdnet.org/cms.php?id=migration_theme80 Social Inclusion of Internal
Migrants in India
Global Forum on Migration and Development
79 | P a g e
www.gfmd.org/en
Global Migration Group
www.globalmigrationgroup.org
Human Rights, Children and Migration
www.hrcam.org
Inter Press Service News Agency – Migration and Refugees
www.ipsnews.net/news/human-rights/migration-refugees
Migration For Development
www.migration4development.org
Migrant Forum in Asia
www.mfasia.org
Migrating out of Poverty Research Programme Consortium
www.migratingoutofpoverty.dfid.gov.uk/
Migrants Rights International
www.migrantwatch.org
Migration Policy Institute
www.migrationpolicy.org
Refugee and Migratory Movements Research Unit (RMMRU), University of Dhaka
www.rmmru.org
The Hague Process on Refugees and Migration
www.thehagueprocess.org
United Nations Institute for Training and Research (UNITAR)
www.unitar.org
Research Institutes, NGOs and Trusts working on Migration Issue
Aajeevika Bureau
www.aajeevika.org
Agrasar
www.agrasar.org
Butterflies
www.butterflieschildrights.org
Centre for Development Studies
www.cds.edu
Centre for Education and Communication
www.cec-india.org
Disha Foundation
www.dishafoundation.wordpress.com
Eko India Financial Services Pvt. Ltd
www.eko.co.in
80 | P a g e
FINO Paytech
www.finopaytech.com
Ghoghardiha Prakhand Swarajya Vikas Sangh (GPSVS)
www.gpsvs.org.in
Grameen Evam Samajik Vikas Sanstha (GSVS)
www.gsvsajmer.in
Gram Vikas Parishad
www.gvpindia.org
Gramin Vikas Trust (GVT)
www.gvtindia.org
LabourNet
www.labournet.in
Lokadrusti
www.lokadrusti.org
Mahanirban Calcutta Research Group
www.mcrg.ac.in
Mobile Crèches
www.mobilecreches.org
National Aids Control Organisation (NACO)
http://www.naco.gov.in/NACO
National Association of Street Vendors of India (NASVI)
www.nasvinet.org
National Institute of Urban Affairs (NIUA)
www.niua.org
Nirmana
www.nirmana.org
Paryavaran Evam Prodyogiki Utthan Samiti (PEPUS)
www.pepus.org
Rajiv Gandhi National Institute of Youth Development
www.rgniyd.gov.in
Samarthan – Centre for Development Support
www.samarthan.org
Sanlaap
www.sanlaapindia.org
SETU
www.setuahmedabad.blogspot.in/2011/08/setu-centre-for-social-knowledge-
and.html
Youth for Unity & Voluntary Action (YUVA)
www.yuvaurbanindia.org
Yugantar

81 | P a g e
www.yugantar.org.in
International Organisations working on the Issue of Migration
International Council on Social Welfare
www.icsw.org
International Labour Organisation (ILO)
www.ilo.org/newdelhi/aboutus/WCMS_166809/lang--en/index.htm
International Organisation for Migration (IOM)
www.iom.int/cms/en/sites/iom/home/where-we-work/asia-and-the-
pacific/india.html
Joint United Nations Programme on HIV/AIDS (UNAIDS)
www.unaids.org/en/regionscountries/countries/india
The Office of the United Nations High Commissioner for Refugees (UNHCR)
www.unhcr.org/pages/49e4876d6.html
UNAIDS
www.unaids.org/en/regionscountries/countries/india
United Nations Children’s Fund (UNICEF)
www.unicef.org/india
United Nations Development Programme (UNDP)
www.in.undp.org/india/en/home.html
United Nations Educational, Scientific and Cultural Organisation (UNESCO)
www.unesco.org; www.unesco.org/newdelhi
United Nations Human Settlements Programme (UN-HABITAT)
www.unhabitat.org
United Nation Population Fund (UNFPA)
www.unfpa.org
UN Women, South Asia
www.unwomensouthasia.org
World Health Organisation (WHO)
www.whoindia.org