migration to vsi openvms · · 2017-11-27• eva storage arrays • linux •... any system which...
TRANSCRIPT

© 2015 Hewlett-Packard Enterprise Ltd.
Migration to VSI OpenVMSHPE PERFDAT OpenVMS Performance SolutionHPE OpenVMS ServiceControl
OpenVMS Connect Forum 2017, Vienna
DI. Dr. Wolfgang Burger
HPE GDS/TS Austria

Agenda
• Migration to VSI OpenVMS• HPE PERFDAT OpenVMS Performance Solution
• HPE OpenVMS ServiceControl
• HPE PERFDAT OpenVMS Performance Solution• Concepts & architecture
• How-To Configure selective file filtering (Demo)
Create user defined (calculated) stats (Demo)
Online alerting (Demo)
Report automation (automatic graph creation)
Migration to VSI OpenVMS 2OpenVMS Connect Forum 2017

Migration to VSI OpenVMS
What is HPE PERFDAT?• OpenVMS Performance Solution
• High resolution performance collector
• Automatic data management
• Highly automated collection, filterimng, charting and trend analysis capabilities for effective performance lifecycle management
• Capable to monitor non-OpenVMS systems
• Brocade switches
• EVA storage arrays
• Linux
• ... Any system which providesperformance data via SNMP
• No 3rd party and/or freeware/open source dependency
• Commercial product
Migration to VSI OpenVMS 3OpenVMS Connect Forum 2017

HPE PERFDAT customer
Migration to VSI OpenVMS 4
•~1500 OpenVMS productive system•Monitors ~ 500 non-OpenVMS systems
Customers in 16 countries

Migration to VSI OpenVMS
What is HPE OpenVMS ServiceControl?
Failover Switchover
Migration to VSI OpenVMS 5
Service switchover
Server 1
App 1
Server 2
App 3
App 2
Server 3
App 4
Server 1
App 1
Server 2
App 3
Server 3
App 4
App 2
Sw
itch
App2 C
md
Service failover due to a service fault
Server 1
App 1
Server 2
App 3
App 2
Server 3
App 4
Server 1
App 1
Server 2
App 3
Server 3
App 4
App 2
Service failover due to a system fault
Server 1
App 1
Server 2
App 3
App 2
Server 3
App 4
Server 1
App 1
Server 2
App 3
Server 3
App 4
App 2
• Freeware• No 3rd party and/or
freeware/open source dependency• Support on request
OpenVMS Connect Forum 2017

HPE OpenVMS ServiceControl at a glance
Migration to VSI OpenVMS 6
Visualize Services
One-Stop Service Health Check Service State and
Event Monitoring
Service Auto-Recovery
Service Management
Service Exception Alerting
OpenVMS Connect Forum 2017

Migration to VSI OpenVMS
• HPE PERFDAT– C code – OpenVMS data collector
– 70 % kernel mode code– Calls OpenVMS kernel routines– C-RTL, LIB$, System services
– All other components– 100 % user mode code– C-RTL, LIB$, System services
– Inter-process communication– MBX– TCP/IP– UDP (SNMP)
Migration to VSI OpenVMS 7
• HPE OpenVMS ServiceControl– C code– 100 % user mode code– C-RTL, LIB$, System services– Inter-process communication
– ICC– MBX– TCP/IP
HPE PERFDAT & HPE OpenVMS ServiceControl characteristics
OpenVMS Connect Forum 2017

Migration to VSI OpenVMS
• Challenges• Where do I get the kits?
• Where do I get licences?
• Applications binary compatible with VSI OpenVMS?
• Re-compile & re-link required?
• Code modifications required• Kernel mode routines
• OpenVMS internal data structure modification that affect HPE PERFDAT?
• Mixed cluster architecture• ICC has always been a challenge
Migration to VSI OpenVMS 8OpenVMS Connect Forum 2017

Migration to VSI OpenVMS
Test environment
Migration to VSI OpenVMS 9
ES47 2P/1CEV7 1GHz2 GB MemoryHPE OpenVMS AXP V7.3-2 – V8.4
VMSTM1
EIB
EIA
VMSTM2E
WA
EW
B
VMSTM4
EW
A
EW
B
rx2800 2P/16CItanium 9500 2.13 GHz72 GB MemoryVSI OpenVMS IA64 V8.4 1H1 – V8.4 2H1
rx4640 1P/1C Madison 1.3 GHz2GB MemoryHPE OpenVMS IA64V8.2 – V8.4
OpenVMS Connect Forum 2017

Migration to VSI OpenVMS
• Challenges• Where do I get the kits?• Where do I get licences?
• Could not find• link or hint on the official VSI web site• link or hint on the official HPE web site
• How to get them?• Contact VSI support Europe
[email protected]• Response within 24 h with download link
• All VSI kits, patches & layered products
Migration to VSI OpenVMS 10OpenVMS Connect Forum 2017
Migration to VSI OpenVMS
• Challenges• Applications binary compatible with VSI OpenVMS?
YES• Re-compile & re-link required?
YES• Code modifications required
NO• Any mixed cluster issues (HPE OpenVMS ServiceControl)
NO• Only actions required
• Modify Install/Startup/Shutdown/Control scipts due to:• Product re-branding• New version number
Migration to VSI OpenVMS 11OpenVMS Connect Forum 2017

Questions
12

HPE PERFDAT OpenVMS Performance Solution
13

Requirements
•High resolution performance data collection for easy root-cause analysis
•Completeness of dataThe data collector has to provide sufficient performance information about all OpenVMS sub-systems including XFC, LAN and network protocol support.
•Online rule based performance alertingOnline performance alerting has to support system management to detect performance anomalies even though their impact does not slow down the overall system performance significantly so that this remains transparent to the end-user.
OpenVMS Connect Forum 2017 HPE PERFDAT – OpenVMS Performance Solution 14

Requirements (contd.)
OpenVMS Connect Forum 2017 HPE PERFDAT – OpenVMS Performance Solution 15
• Easy to handleo Plug and play
• Once the performance solution is installed data has to be collected and all performance management related tasks like trending and data archiving has to be performed automatically to maintain a performance history based on predefined profiles, unattended, and without any need of additional customization work.
o Easy to manage and control
o Automated data management without any system management intervention• Ability to manage huge amounts of data (> 1TByte)
• Archive and housekeeping functionality
o Easy data transfer for offline analysis
Requirements (contd.)
OpenVMS Connect Forum 2017 HPE PERFDAT – OpenVMS Performance Solution 16
• Single point and transparent performance data access regardless of where the performance data is stored within the whole environment via a single common interface
• Data analysis without data pre-processing
• Data import/export capabilities to guarantee:
o collaboration with other performance data collection utilities (import data from other sources)
o collaboration with existing performance analysis utilities and charting tools

Requirements (contd.)
OpenVMS Connect Forum 2017 HPE PERFDAT – OpenVMS Performance Solution 17
• Automatic trend and capacity reporting
• Up- and backward data compatibility
• Full cluster analysis capability
• No dependency on any layered product except those available on the OpenVMS installation media
• No dependency on any 3rd party product or any kind of shareware/freeware

Requirements (contd.)
OpenVMS Connect Forum 2017 HPE PERFDAT – OpenVMS Performance Solution 18
• State of the art graphical GUI for data analysiso Easy to handleo Intuitive o Easy data navigationo Online descriptions for all statistics availableo State of the art graphical features like
• Stack/unstack functionality• Zoom in/out• Shift left /right• Data scanning • Ability to scale graphs separately• Auto, native and manual scaling capability• Data overlay capability (graphs of different time periods can be overlapped
to allow visual comparison)
o Correlation- and deviation analysis capability o Multi window support for multi screen systems

Requirements (contd.)
OpenVMS Connect Forum 2017 HPE PERFDAT – OpenVMS Performance Solution 19
• We are not alone
o Performance depend on external, shared storage
o Systems are coupled via shared storage
• Serious performance management sometimes requires one „to look over the rim of the tea cup“
o Attached shared Storage
o Systems accessing the same shared storage Solaris
Linux
...

Architecture
OpenVMS Connect Forum 2017 HPE PERFDAT – OpenVMS Performance Solution 20
API
Performance Database File Name Cache service DQL_NAME
Distributed Performance Database
Query Interface
Statistics
PERFDAT
Performance Architecture
Pe
rfo
rma
nce
Ale
rtin
g
Au
to tre
nd
en
gin
e
Gra
ph
ica
l
Use
r In
terf
ace
Au
to A
rch
ivin
g
PERFDAT EVA/SNMP
extension
PERFDAT OpenVMS
Data Collector
PERFDAT_MGR
controls / managesCSV
Ma
p
Imp
ort
Inse
rt
Inse
rt
PERFDAT
configutaration
databasePERFDAT
Cluster view
database
Maps

HPE PERFDAT Components
•OpenVMS Data Collector • PERFDAT SNMP extension • PERFDAT EVA extension• Distributed performance database• Application Programming Interface• PERFDAT configuration database• Performance database file name cache service DQL_NAME • Data Query Interface (DQL)•Online performance alerting• Statistics package• Auto trend engine• Auto Archiving and housekeeping•Management Interface (PERFDAT_MGR)•Graphical User Interface• Tools
OpenVMS Connect Forum 2017 HPE PERFDAT – OpenVMS Performance Solution 21
HPE PERFDAT Components
•OpenVMS Data Collector • PERFDAT SNMP extension • PERFDAT EVA extension• Distributed performance database• Application Programming Interface• PERFDAT configuration database• Performance database file name cache service DQL_NAME • Data Query Interface (DQL)•Online performance alerting• Statistics package• Auto trend engine• Auto Archiving and housekeeping•Management Interface (PERFDAT_MGR)•Graphical User Interface• Tools
OpenVMS Connect Forum 2017 HPE PERFDAT – OpenVMS Performance Solution 22

OpenVMS Data Collector – Features
OpenVMS Connect Forum 2017 HPE PERFDAT – OpenVMS Performance Solution 23
• Up to 3 collections in parallel
• More than 700 statistics organized in 25 metrics
• Profile controlled – profiles reside in the PERFDAT configuration database and are managed via the PERFDAT_MGR utility
• Sample interval is freely definable (minimum = 1 second)
• Each of the metrics can be enabled/disabled independently
• For each of the metrics (except the system metrics), thresholds can be set to minimize the amount of data collected

OpenVMS Data Collector – Features
OpenVMS Connect Forum 2017 HPE PERFDAT – OpenVMS Performance Solution 24
• Metrics can be restricted to single/multiple devices, processes, users, images and volumes
• Device metrics allows I/O resolution to single process, files and files per process (not only hot file statistic but also the originator of hot files can be identified)
• Files in the device- and XFC metrics not only resolve to file ID’s but also to their real file names
• Complete XFC integration
• Permits online monitoring
• Online performance alerting can be enabled dynamically

OpenVMS Data Collector – Features
OpenVMS Connect Forum 2017 HPE PERFDAT – OpenVMS Performance Solution 25
• Dynamic resource trimming
o In order to avoid performance problems due to running PERFDAT, the tool monitors its own resource consumption, and if CPU load and/or I/O load exceeds definable thresholds PERFDAT automatically increases collection sample intervals and/or dismisses metrics rules.
• Controlled by PERFDAT_MGR

OpenVMS performance metrices
OpenVMS Connect Forum 2017 HPE PERFDAT – OpenVMS Performance Solution 26
• System
• CPU
• Process
• User
• Image
• Account
• Device
• Device.IOSize
• Device.IOTimeHist
• Device.File
• Device.Process
• Device.Process.File
• Device.Capacity
• Device.Path
• IOPathes
• XFCVolume
• XFCVolume.IOSize
• XFCVolume.File
• XFCVolume.File.IOSize
• LANAdapter
• LANAdapter.Device
• LANProtocol
• SCSPort
• SCSPort.VC
• SCSPort.VC.Channel
HPE PERFDAT Components
•OpenVMS Data Collector • PERFDAT SNMP extension • PERFDAT EVA extension• Distributed performance database• Application Programming Interface• PERFDAT configuration database• Performance database file name cache service DQL_NAME • Data Query Interface (DQL)•Online performance alerting• Statistics package• Auto trend engine• Auto Archiving and housekeeping•Management Interface (PERFDAT_MGR)•Graphical User Interface• Tools
OpenVMS Connect Forum 2017 HPE PERFDAT – OpenVMS Performance Solution 27

PERFDAT Query Interface (DQL)
•OpenVMS Connect Forum 2017 HPE PERFDAT – OpenVMS Performance Solution 28
worldwide single point access

PERFDAT Query Interface (DQL)
OpenVMS Connect Forum 2017 HPE PERFDAT – OpenVMS Performance Solution 29
• Featureso Query interface (DQL) similar to SQLo Transparent single point access via network abstraction layer o Up- and downward data compatibility via data abstraction layero Dynamic CSV file mapping capability for accessing and analysing
data from different data sourceso Multi file version support o CSV load capabilityo CSV file import capability (data is not only inserted but also
normalized)o CSV export capabilityo Statistic package fully integrated in data query interface

Components
OpenVMS Connect Forum 2017 HPE PERFDAT – OpenVMS Performance Solution 30
Node A
DQL$ PDBC$SRV
Statistic Package
DQL$SRV
Data Collector
1 2 3
CSV
DCL Query Interface
Data Management
Performance Database
Connectivity Server
Data Server
CSV Mapping CFG
RMS data streams
IP data streams
Management streams

Query Interface - Community
OpenVMS Connect Forum 2017 HPE PERFDAT – OpenVMS Performance Solution 31
• When accessing the performance database via a dedicated server the Community defines the database view
• Community
o Defined via the logical PERFDAT$COMMUNITY
o Defines the nodes of interest
o Only data created by these nodes will be visible
• Independent of the Community definition, the local node and the archive node (if available) are always accessed

Query Interface - Data Flow
OpenVMS Connect Forum 2017 HPE PERFDAT – OpenVMS Performance Solution 32
DQL$SRV
DQL$ /
PDBC$SRV
A
Data request from GUI
DQL$SRV
DQL$ /
PDBC$SRV
DQL$SRV
DQL$ /
PDBC$SRV
DQL$SRV
DQL$ /
PDBC$SRV
B C Archive
Community =
A,C
Community =
C
Community =
A,B

Query Interface - Data Flow
OpenVMS Connect Forum 2017 HPE PERFDAT – OpenVMS Performance Solution 33
DQL$SRV
DQL$ /
PDBC$SRV
A
Data request from GUI
DQL$SRV
DQL$ /
PDBC$SRV
DQL$SRV
DQL$ /
PDBC$SRV
DQL$SRV
DQL$ /
PDBC$SRV
B C Archive
Community =
A,C
Community =
C
Community =
A,B

Query Interface - Data Flow
OpenVMS Connect Forum 2017 HPE PERFDAT – OpenVMS Performance Solution 34
DQL$SRV
DQL$ /
PDBC$SRV
A
Data request from GUI
DQL$SRV
DQL$ /
PDBC$SRV
DQL$SRV
DQL$ /
PDBC$SRV
DQL$SRV
DQL$ /
PDBC$SRV
B C Archive
Community =
A,C
Community =
C
Community =
A,B

HPE PERFDAT Components
•OpenVMS Data Collector • PERFDAT SNMP extension • PERFDAT EVA extension• Distributed performance database• Application Programming Interface• PERFDAT configuration database• Performance database file name cache service DQL_NAME • Data Query Interface (DQL)•Online performance alerting• Statistics package• Auto trend engine• Auto Archiving and housekeeping•Management Interface (PERFDAT_MGR)•Graphical User Interface• Tools
OpenVMS Connect Forum 2017 HPE PERFDAT – OpenVMS Performance Solution 35
Online Performance Alerting
OpenVMS Connect Forum 2017 HPE PERFDAT – OpenVMS Performance Solution 36
• Provides real-time alerting capabilities
• Can be dynamically enabled for each active performance collection (OpenVMS & SNMP extension & EVA extension)
• Statistics to monitor, alert conditions and alert method defined by alert blocks
• Alert blocks are defined within an alert definition file
• An alert definition file is a text file – syntax compareable to PCM import files
• An alert definition file with valid alert blocks are a prerequiste to enable online performance alerting
• Max. number of elements tracked by a single alert block is 4096

HPE PERFDAT Components
•OpenVMS Data Collector • PERFDAT SNMP extension • PERFDAT EVA extension• Distributed performance database• Application Programming Interface• PERFDAT configuration database• Performance database file name cache service DQL_NAME • Data Query Interface (DQL)•Online performance alerting• Statistics package• Auto trend engine• Auto Archiving and housekeeping•Management Interface (PERFDAT_MGR)•Graphical User Interface• Tools
OpenVMS Connect Forum 2017 HPE PERFDAT – OpenVMS Performance Solution 37

Auto trend engine
OpenVMS Connect Forum 2017 HPE PERFDAT – OpenVMS Performance Solution 38
• Is triggered by the archiving process (if the archiving process is stopped the auto trend engine is stopped too)
• Only processes performance data created on the local node
• Automatic selection and compression of performance statistics for trend- and capacity analysis.
• Time span of a trend report can be day, week, month, quarter or year.
• Trends are generated based on predefined report profiles
• Trend report profiles are defined via PERFDAT_MGR
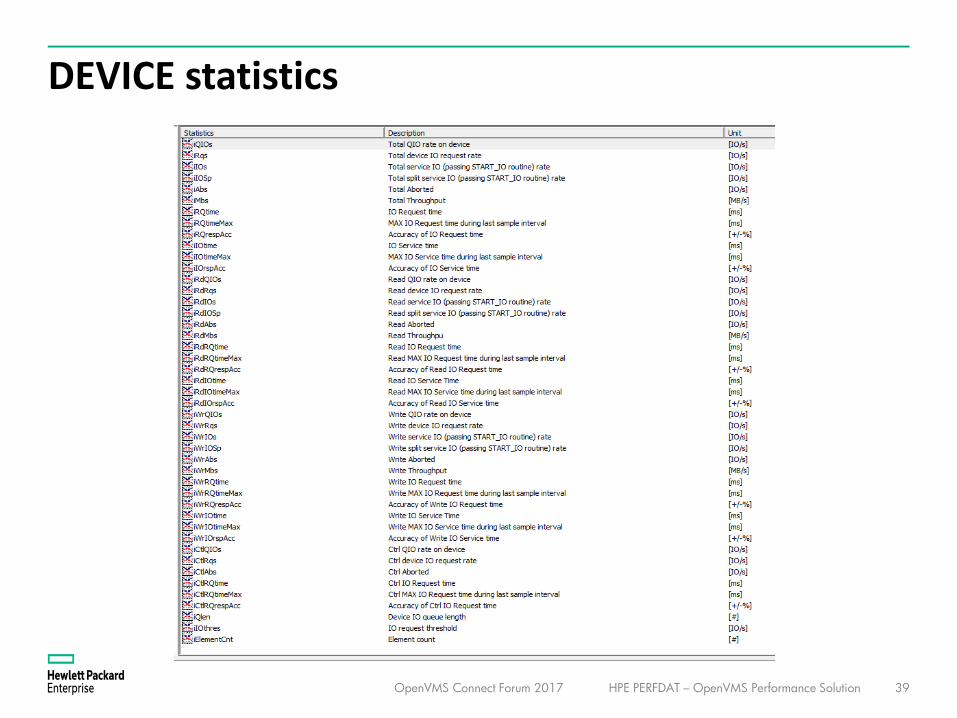
DEVICE statistics
OpenVMS Connect Forum 2017 HPE PERFDAT – OpenVMS Performance Solution 39

Response-Time sensitive Application (serial I/Os)
• iRQTimeoAvg. end-to-end response time (read&write) – process point of view
• iRQTimeMaxoMax end-to-end response time (read&write) – process point of view
oHigh value -> check DEVICE.IOTIMEHIST metric
• iIOTimeoAvg. physical response time (read&write) – adapter point of view
• iIOTimeMaxoMax physical response time (read&write) – adapter point of view
• iQlenoDevice I/O queue length
OpenVMS Connect Forum 2017 HPE PERFDAT – OpenVMS Performance Solution 40
Response-Time sensitive Application (serial I/Os)
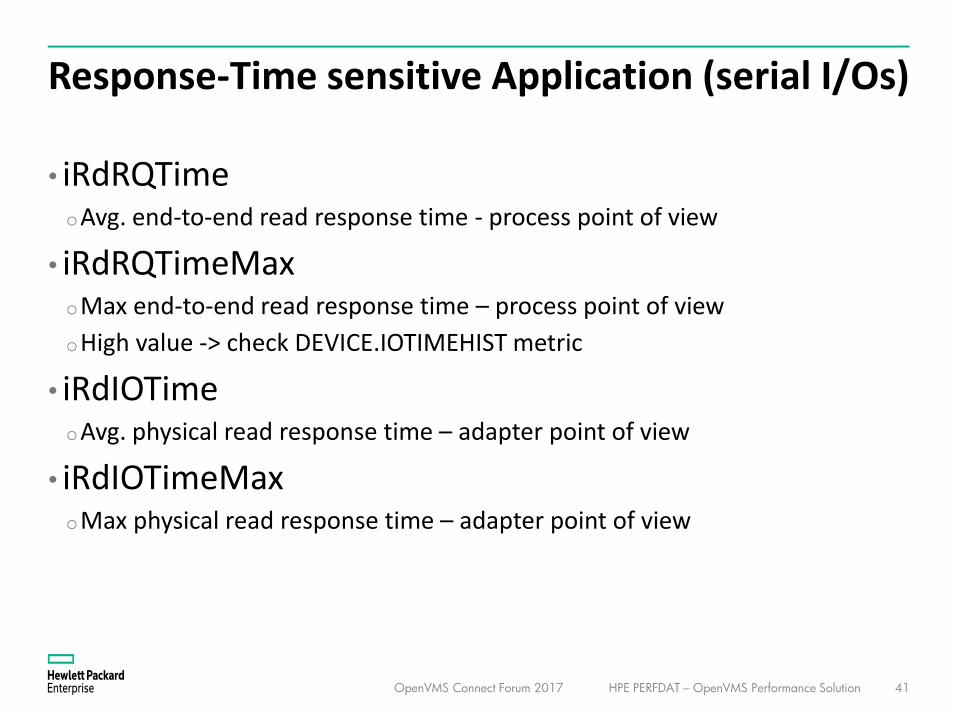
• iRdRQTimeoAvg. end-to-end read response time - process point of view
• iRdRQTimeMaxoMax end-to-end read response time – process point of view
oHigh value -> check DEVICE.IOTIMEHIST metric
• iRdIOTimeoAvg. physical read response time – adapter point of view
• iRdIOTimeMaxoMax physical read response time – adapter point of view
OpenVMS Connect Forum 2017 HPE PERFDAT – OpenVMS Performance Solution 41

Response-Time sensitive Application (serial I/Os)
• iWrRQTimeoAvg. end-to-end write response time - process point of view
• iWrRQTimeMaxoMax end-to-end write response time – process point of view
oHigh value -> check DEVICE.IOTIMEHIST metric
• iWrIOTimeoAvg. physical write response time – adapter point of view
• iWrIOTimeMaxoMax physical write response time – adapter point of view
OpenVMS Connect Forum 2017 HPE PERFDAT – OpenVMS Performance Solution 42

Response-Time sensitive Application (serial I/Os)
• iCtrlRQTimeoAvg. end-to-end non data transfer response time – process point of view
• iCtrlRQTimeMaxoMax end-to-end non data transfer response time - process point of view
oHigh value -> check DEVICE.IOTIMEHIST metric
•No physical I/O response time stats for non data transfers. Non data transfers are effectively reads or writes at this level.
OpenVMS Connect Forum 2017 HPE PERFDAT – OpenVMS Performance Solution 43

OpenVMS Connect Forum 2017 HPE PERFDAT – OpenVMS Performance Solution 44
• Big difference between avg. and max response time values• Check this metric if this is due to a single event or not
DEVICE.IOTIMEHIST
How-To: Configure selective file filtering
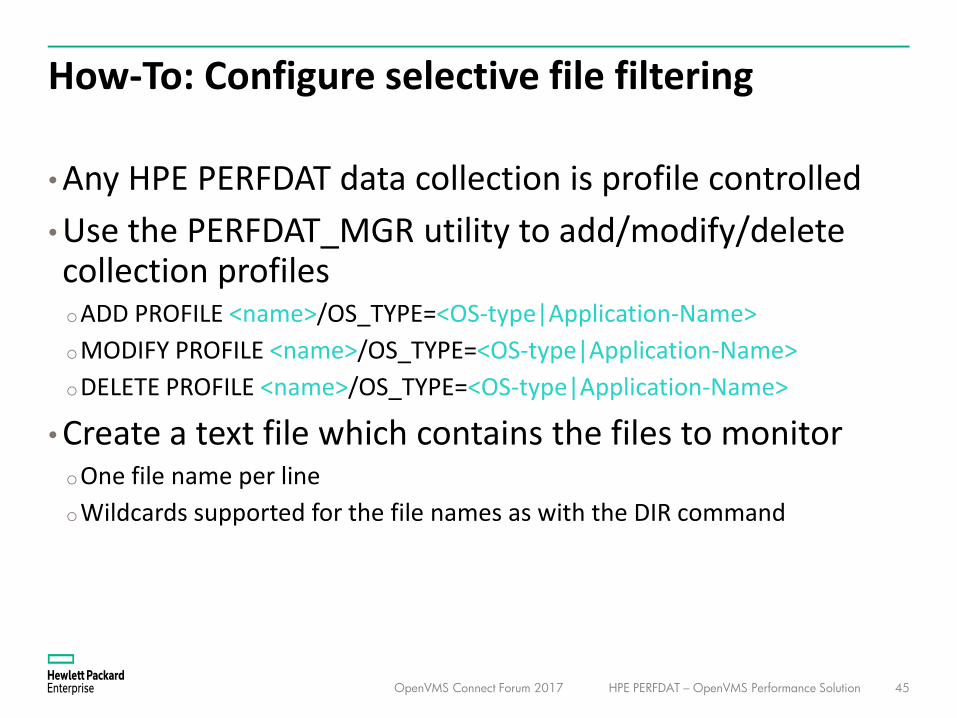
•Any HPE PERFDAT data collection is profile controlled
•Use the PERFDAT_MGR utility to add/modify/delete collection profiles oADD PROFILE <name>/OS_TYPE=<OS-type|Application-Name>
oMODIFY PROFILE <name>/OS_TYPE=<OS-type|Application-Name>
oDELETE PROFILE <name>/OS_TYPE=<OS-type|Application-Name>
•Create a text file which contains the files to monitoroOne file name per line
oWildcards supported for the file names as with the DIR command
OpenVMS Connect Forum 2017 HPE PERFDAT – OpenVMS Performance Solution 45

How-To: Configure selective file filtering
File filter input file example:
$ type SHARKDB$ROOT:[CFG]OGS$DB_FILES.TXTDSA400:[OGS.HP.TICKET$DB]HP$TICKET$DB.DBRDSA400:[OGS.HP.TICKET$DB.EUML]EUML.DBSDSA400:[OGS.HP.TICKET$DB.LOTTO]LOTTO.DBSDSA400:[OGS.HP.TICKET$DB.QUITTUNG]QUITTUNGS_NBR.DBSDSA400:[OGS.HP.TICKET$DB]HP$TICKET$DB.AIJ*DSA410:[OGS.HP.UMSATZ$DB]HP$UMSATZ$DB.DBRDSA410:[OGS.HP.TICKET$DB.TOTO]TOTO.DBSDSA410:[OGS.HP.UMSATZ$DB]HP$UMSATZ$DB.AIJ*DSA420:[OGS.HP.TICKET$DB.JOKER]JOKER.DBSDSA420:[OGS.HP.RUNDEN$DB]HP$RUNDEN$DB.AIJ*DSA430:[OGS.HP.UMSATZ$DB.TAG]UMSATZ_TAG.DBSSHARKDB$RUJROOT:[RUJ]*.RUJ$
OpenVMS Connect Forum 2017 HPE PERFDAT – OpenVMS Performance Solution 46

How-To: Configure selective file filtering
Create/modify profile with selective file filteringPerfDat_MGR> ADD PROFILE OGS/OS=OPENVMS
WELCOME to OpenVMS collection profile wizard
Collection sample interval [600 sec]: 60Enable SYSTEM metrix [Yes]:…Enable DEVICE metrix: [Yes]:
On DEVICES (eq. DKA100, DG*, TN*) [*$D*,*DS*]:Enable IO size metrix on selected FOD devices [No]: YesEnable FILE metrix on selected FOD devices [No]: Yes
Top $QIO rate FILE statistics on selected FOD devices [No]:…
Filter List File name []: SHARKDB$ROOT:[CFG]OGS$DB_FILES.TXTDo you want to enable per PROCESS collection on selected devices [No]: Yes
Top $QIO rate PROCESS statistics on selected devices [No]:On Process [ALL]: HP*,SHARK*Enable per FILE collection for each Process collection on FOD devices [No]: Yes
Top $QIO rate FILE statistics for each Process on FOD devices [No]:…
Filter List File name []: SHARKDB$ROOT:[CFG]OGS$DB_FILES.TXT…
Process to be excluded from file monitoring []: NONE...
OpenVMS Connect Forum 2017 HPE PERFDAT – OpenVMS Performance Solution 47

How-To: Configure selective file filtering
•Start performance collection with new/modified profile
$ MCR PERFDAT_MGR START COLLECTION <profile>
/OS_TYPE=OpenVMS [/SHARE]
•Define the new/modified profile as the default profile in the auto-start table, if the default collection shall start with this profile whenever the HPE PERFDAT OpenVMS data collector starts
$ MCR PERFDAT_MGR MODIFY AUTOSTART <node-name>
OpenVMS Connect Forum 2017 HPE PERFDAT – OpenVMS Performance Solution 48

How-To: Create user defined stats
•User defined stats are:
oCalculated statistics (measures)
oCan be defined node specific
oCan be accessed as if they are part of the data collection
•Usefull whenever you need a different view on the performance data
oi.e. 2ms of DEVICE.IOTIMEHISTprovides I/Os per second which completed < 2ms
You need to know %
new user stat $2msecPerc = 2msec / iIOS * 100
OpenVMS Connect Forum 2017 HPE PERFDAT – OpenVMS Performance Solution 49

How-To: Create user defined stat - GUI
OpenVMS Connect Forum 2017 HPE PERFDAT – OpenVMS Performance Solution 50
1. Select toolbar button
2. Select OS Filter/Metric Filter/Node Filter

How-To: Create user defined stat - GUI
OpenVMS Connect Forum 2017 HPE PERFDAT – OpenVMS Performance Solution 51
1. Stats name
3. Description
2. Description
4. Unit
5. Click

How-To: Create user defined stat - GUI
OpenVMS Connect Forum 2017 HPE PERFDAT – OpenVMS Performance Solution 52
User stat available in stats list

How-To: Create user defined stat – DQL$
Syntax:
DEFINE PROCEDURE equation METRIX metric_nameOSTYPE OS_name DESCRIPTION description_text
UNIT unit_text [NODE node_name];
This example:
$ MCR DQL$DQL$> DEFINE PROCEDURE $2msecPerc = 2ms / iIOs * 100
METRIX DEVICE.IOTIMEHIST OS OPENVMS DESCRIPTION "Percentage of < 2ms I/Os" UNIT "%" NODE *;
For detailed description of the syntax please refer to the documentation or use „GUI learning mode“
OpenVMS Connect Forum 2017 HPE PERFDAT – OpenVMS Performance Solution 53

How To: Configure Online performance alerting
1) Baseline your system(s)
2) Define Alert definition files•Define the alert blocks
•Define the alter methods
3) Enable online alerting on HPE PERFDAT collection
OpenVMS Connect Forum 2017 HPE PERFDAT – OpenVMS Performance Solution 54

Alert definition file
Default alert definition files provided (use them as examples)
•OpenVMS:
PERFDAT$CFG:PERFDAT_ALERT_OPENVMS.CFG
•EVA:
PERFDAT$CFG:PERFDAT_ALERT_EVA.CFG
•Brocade:
PERFDAT$CFG:PERFDAT_ALERT_BROCADE.CFG
•TRU64:
PERFDAT$CFG:PERFDAT_ALERT_TRU64.CFG
OpenVMS Connect Forum 2017 HPE PERFDAT – OpenVMS Performance Solution 55

Alert block
•Alert block starts withADD ALERT:
•Alert block ends withEND ALERT:
•Configuration keywords:
•OSTYPE: •METRIX: • STATISTICS:• SCALED_BY:•OPERATOR• ELEMENTS• STACKED• STACKED_ELEM_NAME:
OpenVMS Connect Forum 2017 HPE PERFDAT – OpenVMS Performance Solution 56
• SAMPLE_COUNT:• WARNING_THRESHOLD: • WARNING_CMD:• CRITICAL_THRESHOLD:• CRITICAL_CMD:• CLEARALERTMSG:• CLEARALERT_CMD:• SUBMIT_QUEUE:

Alert definition block (example)
ADD ALERT:
OSTYPE: OpenVMSMETRIX: DEVICESTATISTICS: iRdIOs, iRdIOTime, iWrIOTimeSCALED_BY:OPERATOR: GT, GT, GTELEMENTS: DSA*STACKED: NOSTACKED_ELEM_NAME:SAMPLE_COUNT: 2WARNING_THRESHOLD: 200, 1, 1WARNING_CMD:CRITICAL_THRESHOLD: 400, 2, 2CRITICAL_CMD:CLEARALERTMSG: TRUECLEARALERT_CMD:SUBMIT_QUEUE:
END ALERT:
OpenVMS Connect Forum 2017 HPE PERFDAT – OpenVMS Performance Solution 57

Configuration paramteres
Please refer to:
•PERFDAT_MGR online help$ MCR PERFDAT_MGR HELP ENABLE ALERT
•HPE PERFDAT – PERFDAT_MGR reference manualSection ENABLE ALERT
OpenVMS Connect Forum 2017 HPE PERFDAT – OpenVMS Performance Solution 58

Enable/Disable online alerting
$ MCR PERFDAT_MGR
ENABLE ALERT collection_profile
/OS_TYPE=<os-type|application-name>
/ALERT_FILENAME=<alert-definition-file>
/NODE=<EVA or SNMP node name>
DISABLE ALERT collection_profile
/OS_TYPE=<os-type|application-name>
/NODE=<EVA or SNMP node name>
OpenVMS Connect Forum 2017 HPE PERFDAT – OpenVMS Performance Solution 59

Alert methods
• OPCOM (default)• Alert log file (default)oPERFDAT$ALERT:PERFDAT_ALERT_<node>.LOG_<date>
• User defined script (optional)oAlert block parameter: CRITICAL_CMD CRITICAL_CMD CLEARALERT_CMD SUBMIT_QUEUE
oData passed to user defined script: P1 Node name P2 Metric name P3 Statistics P4 Element name P5 Average value of the statistics P6 Critical/Warning threshold or both if this is a CLEAR event P7 Numeric severity level (1=Claer, 2= Warning, 3=Error)
OpenVMS Connect Forum 2017 HPE PERFDAT – OpenVMS Performance Solution 60

Report automation (automatic graph creation)
The CREATE GRAPH command selects data from collection databases and creates PNG formatted graphs that can be viewed directly with your WEB browser. This command facilitates automated WEB based graphing.
Synatx:CREATE GRAPH [STACKED] statistics_itemlist
FROM metric_name
ALIAS alias_name [DATE date]
[ELEMENT element_name]
[WHERE filter_list]
[INTO directory]
[NAME graph_name]
[STACKED_OVERLAY | SINGLE_SCALED];
OpenVMS Connect Forum 2017 HPE PERFDAT – OpenVMS Performance Solution 61

CREATE GRAPH
• Layout is defined by a graph layout file (default = PERFDAT$CFG:PERFDAT_CSV2PNG.CFG)
• For detailed description of the layout parameters please refer to:oPERFDAT$CFG:PERFDAT_CSV2PNG.CFG
oDQL$ online help$ DQL$ HELP CREATE GRAPH Graph_Cfg_Parameters
oHPE PERFDAT – DQL$ reference manual
Section CREATE GRAPH
• Use the DEFINE GRAPH_CFG to define the layout for the adjecent CREATE GRAPH command
• DEFINE HEADER defines the caption of the graph
OpenVMS Connect Forum 2017 HPE PERFDAT – OpenVMS Performance Solution 62

Create Graph
Enter commands interactively • Example
$ MCR DQL$
DQL> ATTACH ALIAS DTIPM1_DEFAULT DATE 9-APR-2008;
DQL> DEFINE GRAPH_CFG PERFDAT$CFG:FILL_AREA.CFG;
DQL> DEFINE HEADER “My Stats to look at”;
DQL> CREATE GRAPH iCpuLoad, iDiskMB, iDiskIO FROM SYSTEM ALIAS DTIPM1_DEFAULT
cont> DATE 9-APR-2008 WHERE TIME >= 9-APR-2008 10:00:00, TIME < 9-APR-2008 11:45cont> NAME SAME_SCALE;
Write commands into a file and execute this file• Example
$ TYPE PERFDAT$CFG:DQL_TEST_SCRIPT.DQL
ATTACH ALIAS DTIPM1_DEFAULT DATE 9-APR-2008;
DEFINE GRAPH_CFG PERFDAT$CFG:FILL_AREA.CFG;
DEFINE HEADER “My Stats to look at”;
CREATE GRAPH iCpuLoad, iDiskMB, iDiskIO FROM SYSTEM ALIAS DTIPM1_DEFAULT DATE 9-APR-2008 WHERE TIME >= 9-APR-2008 10:00:00, TIME < 9-APR-2008 11:45 NAME SAME_SCALE;
$ MCR DQL$ @PERFDAT$CFG:DQL_TEST_SCRIPT.DQL
OpenVMS Connect Forum 2017 HPE PERFDAT – OpenVMS Performance Solution 63

CREATE GRAPH exampleSingle scale for all stats – filled area graphDQL> ATTACH ALIAS DTIPM1_DEFAULT DATE 9-APR-2008;DQL> DEFINE GRAPH_CFG PERFDAT$CFG:FILL_AREA.CFG;DQL> CREATE GRAPH iCpuLOad, iDiskMB, iDiskIO FROM SYSTEM ALIAS DTIPM1_DEFAULT cont> DATE 9-APR-2008 WHERE TIME >= 9-APR-2008 10:00:00, TIME < 9-APR-2008 11:45cont> NAME SAME_SCALE;
OpenVMS Connect Forum 2017 HPE PERFDAT – OpenVMS Performance Solution 64

CREATE GRAPH exampleStats individually scaled– line graphDQL> ATTACH ALIAS DTIPM1_DEFAULT DATE 9-APR-2008;DQL> CREATE GRAPH iCpuLOad, iDiskMB, iDiskIO FROM SYSTEM ALIAS DTIPM1_DEFAULT cont> DATE 9-APR-2008 WHERE TIME >= 9-APR-2008 10:00:00, TIME < 9-APR-2008 11:45cont> NAME DIFF_SCALE SINGLE_SCALED;
OpenVMS Connect Forum 2017 HPE PERFDAT – OpenVMS Performance Solution 65

CREATE GRAPH exampleStats individually scaled– filled area graphDQL> ATTACH ALIAS DTIPM1_DEFAULT DATE 9-APR-2008;DQL> CREATE GRAPH iCpuLOad, iDiskMB, iDiskIO FROM SYSTEM ALIAS DTIPM1_DEFAULT cont> DATE 9-APR-2008 WHERE TIME >= 9-APR-2008 10:00:00, TIME < 9-APR-2008 11:45cont> NAME DIFF_SCALE SINGLE_SCALED;
OpenVMS Connect Forum 2017 HPE PERFDAT – OpenVMS Performance Solution 66

Report automation - Workflow
•Create a DCL script thatoCreates a valid DQL$ scripts (contains all required DQL commnds to create
the graphs as required)
oExecute the DQL script from the DCL script$ MCR DQL$ @<DQL script>
oUse DCL COPY commands to move the PNG files into the target directories
oReschedule the DCL script for execution
• Submit the the DCL script into a batch script
OpenVMS Connect Forum 2017 HPE PERFDAT – OpenVMS Performance Solution 67

Supported Versions
• HPE PERFDAT V4.8 ECO 1is supported on:OpenVMS AXP V7.3-2 – V8.4OpenVMS IA64 V8.2 – V8.4-2L1
• HPE PERFDATGUI V4.3.1:Windows XP/7/8.1/10
• Upcoming releases (Q1/2018):oHPE PERFDAT V4.9Bug-fixesSupports VSI OpenVMS AXP V8.4-2L2
OpenVMS Connect Forum 2017 HPE PERFDAT – OpenVMS Performance Solution 68

HPE PERFDAT links
For more information about HPE PERFDAT please contact:
oHPE PERFDAT Support: [email protected]
oWolfgang Burger: [email protected]
oOur partner: Compinia GmbH & Co. KG:
Download: http://www.perfdat.com/
OpenVMS Connect Forum 2017 HPE PERFDAT – OpenVMS Performance Solution 69

Questions
70