mikesbikes introduction player's manual
TRANSCRIPT

MikesBikes Introduction Player’s Manual (2021 Rev D)
© Smartsims International Ltd

Contents i
Contents
Overview 1
What is MikesBikes? ....................................................................................... 1 Single-Player & Multi-Player ............................................................................ 1 Decision Schedule .......................................................................................... 2 Shareholder Value (SHV) ................................................................................ 3 The Simulation Interface ................................................................................ 4 Student Support ............................................................................................ 7
Market Analysis 8
Your Competitors ........................................................................................... 8 The Market Segments .................................................................................... 8 Your Customers ............................................................................................. 9
Making Decisions 13
Overview ..................................................................................................... 13 Year 1 Decisions ........................................................................................... 13 Year 2 New Decisions .................................................................................... 17 Year 3 New Decisions .................................................................................... 18 Year 4 New Decisions .................................................................................... 19 Year 5 & Beyond ........................................................................................... 21
Reporting 22
Report Shortcuts .......................................................................................... 22 Reports Menu ............................................................................................... 23

1
What is MikesBikes?
MikesBikes is an Online Business Simulation that gives you the opportunity to manage your own virtual bicycle manufacturing company.
You are initially tasked with implementing an improved marketing strategy for your
company’s only product, a Mountain Bike. As you progress through years in the simulation you will be provided access to additional decision areas of your company. Eventually having control over your company’s distribution, operations, product development and finance decisions. Your success is measured by the amount of Shareholder Value (SHV) you can create in comparison to your competitors.
Learning Outcomes
At the conclusion of the simulation you will:
• Understand core business terms and concepts.
• Be able to review market research and reports to formulate strategy.
• Gain experience in pricing and promoting a product, conducting a sales forecast and setting distribution strategy.
• Understand how operations and finance decisions support product strategy.
• Have experience taking a new product to market.
• Know how to continue to adapt strategy as you experience competition and
market changes.
• Be able to analyze financial and market reports.
• Develop the skills necessary to work effectively in a team environment.
Single-Player & Multi-Player
MikesBikes features two versions; the Single-Player and the Multi-Player.
The Single-Player features at the start of the course and allows you to practice
against a single computer-controlled competitor. In the Single-Player you move forward (rollover) through years (decision periods) at your own pace and in your own time. This enables you to become familiar with your company, the market and test out different decisions. Your primary goal is to maintain a higher shareholder value (SHV) than your competitor.
In the Multi-Player you will be competing against multiple competitors to achieve
the highest SHV. Depending on your course settings, may be competing against student-run companies from within your course, or against computer-controlled competitors. The Multi-Player simulation progresses according to a preset rollover (decision deadline) schedule. Before each rollover you must have your decisions entered into each of the decision screens within the simulation.
C H A P T E R 1
Overview

Overview 2
Rollovers
A rollover is the term used to describe moving from one year (decision period) to the next. A rollover processes the currently entered decisions and then displays your results.
SINGLE-PLAYER
Rollovers in the Single-Player are controlled by you through the Rollovers menu:
In the Single-Player you are also able to Rollback (move back one year) or Restore (reset the simulation back to the start).
MULTI-PLAYER
Rollovers in the Multi-Player occur automatically on pre-set dates determined by your course instructor.
Once your course’s rollovers are scheduled you will see the next scheduled event on your company’s Home page:
Click on the event to see all upcoming rollovers, as well as those already processed.
There is no final submit process. Simply enter your decision changes into each decision screen and then click Save. A save notification will appear and the change will be shown on-screen. The change is now saved on our simulation server ready to be processed at the upcoming rollover.
If you are playing the Multi-Player in teams, only one team member needs to enter your final decisions.
You can check all your saved decisions using the Currently Saved Decisions report.
Decision Schedule
You start the simulation responsible for the marketing decisions for your company’s Mountain Bike. Each new year you will be given access to at least one new decision area to manage.
The table below outlines the decisions which you will be managing in Year 1, and then the additional new decisions released in each year subsequent.

Overview 3
Decision Period (Year Ahead) New Decisions
Decision Period 1 (2022) • Name your Company
• Name your Product
• Retail Price
• Sales Forecast
• Production Quantity
• Advertising Budget/Mix
Decision Period 2 (2023) • Distribution
• Corporate Branding
Decision Period 3 (2024) • Factory Capacity
• Production Efficiency
• Product Quality
• Long-term Debt
Decision Period 4 (2025) • Product Development
• Option to Add 2nd Product
• Equity Issue/Purchase
• Dividend Policy
Decision Period 5 (2026) • Option to Add 3rd Product
Decision Period 6 (2027) • Option to Add 4th Product
Shareholder Value (SHV)
The objective in MikesBikes is to achieve the highest Shareholder Value (SHV).
SHV is the investment value over time of owning a single share in your company. It is calculated using your current Share Price (being the market value of one share in your company), plus the value and interest of all past dividends paid. Share Price is
driven by your company’s profit over time, earnings per share, and debt to equity ratio.
For more see the Support Center Article: How Do I Increase Shareholder Value?
Tracking Shareholder Value
Your company’s SHV will be displayed via the pop-up notifications on log in, and on your company’s Home page.
You can compare your SHV with other’s in the industry through the Industry
Benchmark Report. You can also see your SHV rank across the course through the Course Scoreboard on the Home page (if this has been enabled by your course
instructor).

Overview 4
The Simulation Interface
Top-Menu Navigation
The MikesBikes interface utilizes top-of-screen navigation with the following main menu items:
• Home: This first screen serves as your company dashboard.
• Marketing: Product, Distribution and Corporate Branding Decisions.
• Operations: Factory Capacity, Efficiency and Quality Decisions.
• Finance: Debt, Equity and Dividend Decisions.
• Reports: To access all your company’s reports.
• Rollovers: Process a rollover, rollback or restore (Single-Player only).
Company Home Screen
Your company’s Home screen displays:
• Your company’s name.
• The Year Ahead (the year you are making decisions for).
• Key results from last year, including a link to the Course Scoreboard.
• Shortcuts to your product decisions and new decisions available this year.
• Key reports.
• Year-relevant help videos.
The Help Widget
A Need Some Help? tab features at the bottom right of all screens. Clicking on the
tab expands the Help widget. You have the option to Search help articles, click on a
screen-relevant Frequently Asked Question, view a screen-relevant Suggested Video, or Contact Us to send a message to the Smartsims Support Team.

Overview 5
Top-Right Icons
At the top-right of the simulation interface there are three icons:
1. Saved Decisions: Opens the Currently Saved Decisions report so you can
check all currently saved decisions. These are the decisions which will be processed at rollover.
2. Alerts & Notifications: Brings back the initial on-login notifications which provides key results and information for making decisions for the year ahead.
3. Exit Simulation: Exits the simulation interface and takes you back to the course page.
Decision Screens
Selecting the Marketing (Year 1 & 2), Operations (from Year 3) and Finance (from
Year 3) menus will open their corresponding decision screens.
LEFT-HAND MENU
Decision screens features a left-hand menu displaying the separate decisions available under each main menu.

Overview 6
CENTER DECISION COLUMN
The center column is where your decisions are located; a decision field with the currently entered decision and last year’s decision.
Most screens provide additional information below the decision field offering live feedback on the potential consequence of your decision.
RIGHT-HAND COLUMN
The right-hand column is designed to help you make well-informed decisions. It
features:
1. The Live Forecast
The Live Forecast widget is located at the top-right of all decision screens:
The Forecast Profit and Cash figures are based on your currently entered decisions and update in real-time as you save decision changes on any screen. This enables you to see the impact of individual decisions on overall performance.

Overview 7
2. Screen-Relevant Results
Relevant key results from last year are displayed:
3. Screen-Relevant Reports
Relevant reports are listed, along with a More Reports link to the Reports menu:
Student Support
DIRECT EMAIL
The Smartsims Support Team is available to answer any questions you have by emailing: [email protected]
CONTACT FORM
Submit a Contact Us form through the Smartsims website.
INTEGRATED HELP
All Smartsims Simulations feature in-application help. Simply click on the Need Some Help? tab on any screen to open the Help Widget.
SMARTSIMS SUPPORT CENTER
The Smartsims Support Center is our simulation knowledgebase. This enables you to receive an instant answer to your question by simply typing your question into the search field. Alternatively, you can also Browse All MikesBikes Support Articles.

8
Your Competitors
In the Single-Player version you compete against a single computer-controlled opponent. You both start with one Mountain Bike product with identical results.
The Multi-Player version features between four and ten companies in your industry. These may be student-run or computer-controlled depending on your instructor’s preference. All companies start with one Mountain Bike product with identical results.
You can track your competitors using the key industry-level reports below:
• Industry Benchmark Report: Compare key financial metrics across all
companies in your industry.
• Market Summary: Compare all products in the industry based on key
market metrics.
The Market Segments
This bicycle industry is categorized into three market segments; Mountain Bikes, Road Bikes and Kids Bikes.
Mountain Bike Market
Mountain bikes are designed for primarily for rough terrain and off-road use. They tend to have wide handlebars, suspension and wide tires. Customers in this segment are focused on fitness and the outdoors. They want a bike that will go anywhere and everywhere. They are prepared to pay more for a bike that meets their needs.
Road Bike Market
Road bikes are designed for speed. They feature light frames, low handlebars and thin tires. Customers in this market are passionate about cycling and are looking for
a performance edge to get to the front of the pack. They are not sensitive to price if you have a market leading bike.
Kids Bike Market
Kids bikes range greatly in design and style but are primarily designed to introduce cycling to kids. They are built for children aged 4 to 15 years old, but the purchase is usually made by their parents. From a parent’s perspective the bike must be durable and stylish, but relatively inexpensive.
C H A P T E R 2
Market Analysis

Market Analysis 9
Your Customers
Market research indicates there are five key factors impacting customer demand in this industry; Price, Advertising, Quality, Distribution and Product Specifications.
The table below indicates the level of impact these have on customer demand for each market segment:
Segment Price Advertising Quality Distribution Product Specs
Mountain Medium High Medium Medium Medium
Road Low Medium High Low High
Kids High High Low Medium Low
Retail Price
Price sensitivity refers to how Retail Price, relative to others in the market, impacts consumer demand.
Price is always relevant, but it is less important in some markets than others. Those purchasing Music Headphones prioritize price higher than most others. Therefore, a change in price can have a large impact on sales. Whereas customers in the Gaming
market less influenced by price in comparison to other factors.
Compare your Retail Price with your competitors using the Market Summary report.
Advertising
Customers in each of the markets can be reached by advertising across five possible media channels. To get the most out of your advertising budget you will need to know the media viewing habits for each market (being how much do customers watch/use the different media channels). Then, combine this with Advertising Reach (what percentage can be reach for a given spend). This enables you to determine an optimal advertising mix across the channels, as well as how much to spend on each channel.
MEDIA VIEWING HABITS
The table below provides the proportion of each market that can be reached using the different media channels:
Segment Search Digital Video
Social Media
TV Print
Mountain 35% 25% 45% 25% 15%
Road 50% 25% 20% 20% 30%
Kids 20% 50% 15% 35% 25%
Note: Each row will add to more than 100% as people watch multiple media channels.
ADVERTISING REACH
The Advertising Reach chart shows the proportion of the viewing audience that can
be reached in each media channel at different levels of expenditure.

Market Analysis 10
For example, an investment of $1.2m in any channel will reach approximately 30% of the audience. Then by looking at the Media Viewing Habits table above, we can see that for the TV media channel this would reach 30% * 35% = 10.5% of the Kids market, and 30% * 25% = 7.5% of the Mountain market.
Note that the curve is initially steep, up to about $1.5m expenditure (per channel).
However, beyond that the curve flattens so the increase in audience reached becomes less as you spend more.
ADVERTISING PERFORMANCE
The effectiveness of your advertising budget and allocation (mix) is measured by the
awareness of your product in the minds of customers. You can track your product’s Awareness rating (0-100) and compare with competitors through the Market
Summary report.
Quality
Quality refers to the level of customer satisfaction in your product based on finish, workmanship and the rate of product defects. This is measured using a Quality rating out of 100 which applies to all your company’s products. You can compare each company’s Quality rating using the Market Summary report.
Quality expenditure is available from Year 4 under the Operations menu.
Distribution
Your company uses three distribution channels; Bike Shops, Sports Stores and Department Stores. These retailers keep a retail margin (a percentage) on each bike
they sell.
The table below shows the proportion of customers who purchase through each distribution channel:
Retail Channel Mountain Road Kids
Bike Shops 20% 90% 10%
Sports Stores 60% 10% 10%
Department Stores 20% 0% 80%

Market Analysis 11
BIKE SHOPS
The bike shop is a specialty store dedicated to bikes and bike-related products. Store
assistants are trained bike specialists, able to tailor specific bikes to specific customers. Bike shops generally stock bikes in the mid to high price range (Road and Mountain). They generally require a higher retail margin.
SPORTS STORES
Sports stores stock a wide range of sporting equipment including bikes. The staff at these stores are not as knowledgeable on the complete bike range, but with their specialty in the outdoors, they are experts in Mountain Bikes.
DEPARTMENT STORES
Department stores (chain retailers) stock a wide range of all products. Their staff do not know much about bikes or the bicycle industry, but they have the largest customer base. They typically stock low to mid-priced bikes, sell in high quantities and generally require less retail margin.
DISTRIBUTION PERFORMANCE
Your company’s distribution performance is tracked through a Distribution rating (0-100) and features on the Market Summary report.

Market Analysis 12
Product Specifications
Product specifications in the bicycle industry are determined by a bike’s Style and Technical features. Customers in each market have an ideal combination in mind of Style and Technical specifications.
These preferences are visually represented through the Perceptual Map:
The color circles on the Perceptual Map above represent the range of Style and
Technical specs for each market. The center of each circle represents the ideal specifications based on customer preferences.
Your product’s Product Specification rating features on the Market Summary report. Compare this with your competitors to determine whether investment in product development is required.
The Product Development decision is available from Year 4.

13
Overview
You can access your decision screens through the top navigation main menus:
• Marketing: Product, Distribution and Corporate Branding Decisions.
• Operations: Factory Capacity, Efficiency and Quality Decisions.
• Finance: Debt, Equity and Dividend Decisions.
In Year 1 of MikesBikes you will be responsible for only your Mountain Bike’s marketing decisions. As such, only the Marketing menu is available in Year 1.
Each new year you will be provided at least one new decision area to manage. In
Year 2 the Marketing menu expands to include Distribution and Corporate Branding. In Year 3 the Operations and Finance menus appear.
Your company’s Home screen also displays shortcuts to your product decisions, as
well as shortcuts to any new decisions.
Year 1 Decisions
When you first open the simulation interface you are given the option to give your company a new name:
As well as give your Mountain Bike a new name:
C H A P T E R 3
Making Decisions

Making Decisions 14
Get started by getting to know your company and the market using the Key Reports located on your company’s Home page.
In your first year of management, you are responsible for the Marketing decisions for your company’s Mountain Bike. Your product decisions are available by clicking on
either the Marketing menu or the product square on your company’s Home page:
Your product decision screens will then be displayed:
You will be required to determine:
• A suitable Retail Price.
• A realistic Sales Forecast.
• Required Production units to meet this forecast.
• Allocating your Advertising budget across the five media channels.

Making Decisions 15
Pricing & Production Screen (Marketing)
The Pricing & Production screen is where you manage your product’s Retail Price, Sales Forecast and Production for the year ahead:
RETAIL PRICE
Retail Price is the price that you instruct your retailers to sell your product for.
Your pricing changes should be aligned to your current strategy and coordinated with other decision areas. For example, a decrease in price will usually require additional production and possibly factory capacity. Pricing is one of the more influential
decisions on sales and profit, so changes should be well thought through.
Learn more about Pricing Strategy in MikesBikes.
SALES FORECAST
A Sales Forecast is an estimate on how many units (bikes) you think you will sell over the coming year.
Your sales forecast should be made based on previous year’s demand, plus any changes based on the estimated impact of your current decisions.
Learn more about How to Forecast Sales in MikesBikes.
PRODUCTION
A Production quantity is must be specified to ensure your factory produces sufficient units to meet your sales forecast for the year ahead.
Your production decision should match your Sales Forecast, minus any Opening Inventory (stock remaining from last year). If your Factory Capacity is not sufficient
to meet required production quantity, you will need to increase factory capacity (available Year 3).
Advertising Screen (Marketing)
There are five media channels to allocate your advertising budget across:

Making Decisions 16
See Media Viewing Habits and Advertising Reach under Chapter 2 to learn how to determine an optimal advertising mix and how much to spend on each channel.
SEARCH
Search places paid advertisements within organic internet search results (examples: Google, Bing, Yahoo).
Your company’s advertisements will be shown when users type relevant keywords and phrases into their favorite search engine, enabling you to reach a very targeted audience.
This channel is most effective in reaching customers in the Road segment.
DIGITAL VIDEO
Digital video services allow viewers to watch on-demand content without charge (examples: Youtube, Hulu).
As the service is free, paid advertisements are played before, during or after the streaming content. Advertisements can be accurately targeted based on the viewer’s
viewing preferred genres.
This channel is most effective in reaching customers in the Kids segment.
SOCIAL MEDIA
Social media platforms enable users to connect and share their stories with others
(examples: Facebook, Instagram, Twitter).
These platforms provide companies with the ability to integrate paid advertisements within the user’s news feed. Very specific audience targeting is achieved based on
the user’s interests.
This channel is most effective in reaching customers in the Mountain segment.
TELEVISION
Television (TV) advertising on cable and free-to-air broadcasts is still one of the most effective method to reach of reaching a large audience.
Live viewers do not have the ability to skip advertisements, so your promotional
content is seen by the majority of the viewing audience.
This channel is most effective in reaching customers in the Kids and Mountain segments.

Making Decisions 17
Print advertising covers promotional content featured in magazines, newspapers,
direct mail and out of home advertising (e.g. billboards, signage).
Print media covers a wide range of audiences including specialist bike and outdoor magazines.
This channel is most effective in reaching customers in the Road and Kids segments.
Year 2 New Decisions
In addition to last year’s decisions two new marketing decisions are available this
year:
• Distribution
• Corporate Branding
Distribution Screen (Marketing)
The Distribution screen enables you to set a Retail Margin for each of the three
distribution channels; Bike Shops, Sports Stores and Department Stores.
A retail margin is the percentage of a product's retail price which is retained by the distributor for selling a product. Increasing your retail margins encourages distributors to sell your bikes but results in you earning less on each sale. Decreasing your retail margins increases your company’s profits, but too low and shops will stock your competitor’s bikes over yours.
To read about your customer’s shopping habits, go to the Distribution heading under Chapter 2.
Corporate Branding Screen (Marketing)
The Corporate Branding screen controls the amount spent on promoting your company’s brand.
Branding makes customers aware of your company, and therefore, more receptive to your product advertising.

Making Decisions 18
Expenditure in corporate branding will improve your brand awareness over time, as well as increase your individual product awareness. This is especially cost effective when your firm has multiple products.
Year 3 New Decisions
The new decisions available this year are:
• Factory Capacity
• Efficiency
• Quality
• Debt
Factory Capacity Screen (Operations)
The Factory Capacity decision sets the maximum production capability of your factory, measured in Standard Capacity Units (SCU).
Over the course of the simulation you will need to Buy additional SCU to support sales growth. Alternatively, if at some point you end up with too much factory capacity (SCU), relative to production, you can Sell SCU to reduce factory idle time.
Efficiency (Operations)
Investment in Efficiency reduces the level of wastage which occurs as part of the
manufacturing process.
Decreasing wastage increases factory capacity available for production. As you increase your Factory Capacity you will also need to increase efficiency expenditure
to maintain the same level of wastage.
Quality (Operations)
Quality expenditure improves the quality of the bikes that reach your customers.

Making Decisions 19
A high-quality bike increases customer satisfaction, and therefore, demand. However, keep in mind some markets are more sensitive to quality than others.
The effectiveness of your quality expenditure is measured by the Quality Index. As you increase your factory capacity you will also need to increase quality expenditure
to maintain your Quality Index.
Debt Screen (Finance)
All companies start with existing Debt of $1m. The Debt screen enables you to either Raise additional debt or Repay existing debt.
Raising additional debt (cash) can be done to finance expenditure, such as product development or increasing factory capacity. However, this does come with an annual
interest cost. Alternatively, you can repay some or all your existing debt to improve your Debt/Equity Ratio.
Year 4 New Decisions
The new decisions available this year are:
• Product Modification
• New Product Launch
• Equity
• Dividend
Product Development Screen (Marketing)
You can now choose to update your existing product through a Spec Improvement, a Cost Reduction, or Both.

Making Decisions 20
Each option has an associated cost and benefit. You should review the information
provided within each box before you make your decision.
Add New Product Screen (Marketing)
This year you can Add a New Product into either the new Road or Kids market.
A new product will cost $1m to develop and may require you to increase your factory capacity. However, taking advantage of these new markets is key to future success.
Once your decision has been saved, your new product will be available under the
Marketing menu and on your company’s Home page. You will then be able to make the necessary product-level decisions.
Equity Screen (Finance)
All companies start with an existing balance of one million issued shares. The Equity screen enables you to either Issue additional shares to the public or Repurchase shares.

Making Decisions 21
Issuing shares raises additional cash to fund decisions. However, this does have a
negative impact on shareholder value. Whereas, repurchasing shares can be expensive, but by reducing the number of issued shares you will increase their value.
Dividend Screen
The Dividend screen enables you to pay a dividend to your shareholders.
A dividend is an annual payment to provide a return on your shareholder’s investment in your company. The dollar amount paid is per outstanding share. Paying dividends can be costly, but it has a direct positive impact on Shareholder Value.
Year 5 & Beyond
The new decisions available this year are:
• Product Modification
• New Product Launch
• Equity
• Dividend
.
22
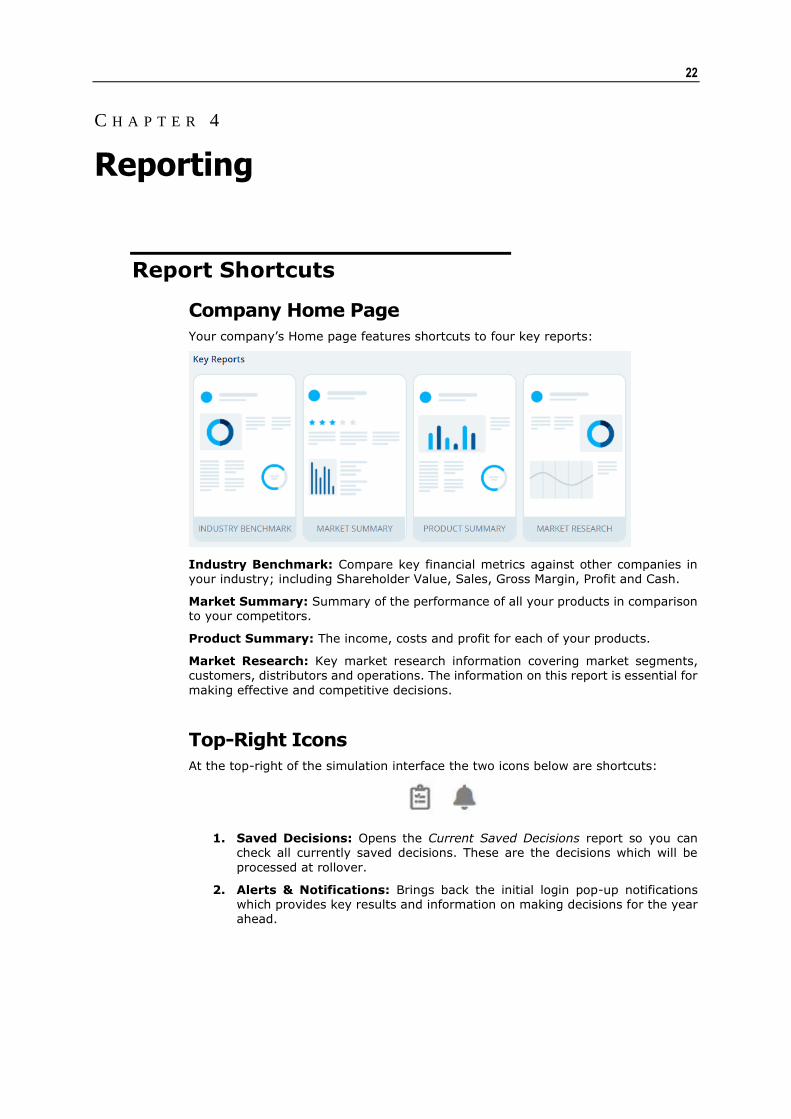
Report Shortcuts
Company Home Page
Your company’s Home page features shortcuts to four key reports:
Industry Benchmark: Compare key financial metrics against other companies in your industry; including Shareholder Value, Sales, Gross Margin, Profit and Cash.
Market Summary: Summary of the performance of all your products in comparison to your competitors.
Product Summary: The income, costs and profit for each of your products.
Market Research: Key market research information covering market segments, customers, distributors and operations. The information on this report is essential for
making effective and competitive decisions.
Top-Right Icons
At the top-right of the simulation interface the two icons below are shortcuts:
1. Saved Decisions: Opens the Current Saved Decisions report so you can check all currently saved decisions. These are the decisions which will be
processed at rollover.
2. Alerts & Notifications: Brings back the initial login pop-up notifications which provides key results and information on making decisions for the year ahead.
C H A P T E R 4
Reporting

Reporting 23
Live Forecast
Click on the Live Forecast widget at any time to view your Forecast Results Summary. This displays forecast sales revenue, gross margin and income for the year ahead, including a comparison with actual results from last year.
Reports Menu
The Reports menu provides you with access to all of your company’s reports. Once selected, the left-menu categorizes reports according to the headings below.
Key Reports
Industry Benchmark: Compare key financials of your company and your competitors; including Shareholder Value, Sales, Gross Margin, Profit and Cash.
Market Summary: See how your product(s) are performing in comparison to others in the industry.
Product Summary: The key results for your product(s).
Market Research: Important market information covering market segments and customers.
Forecast Results Summary: View forecast sales revenue, gross margin and income for the year ahead; including a comparison with actual results from last year.
Market Share: A pie chart showing market share for each company in the industry.
Current Saved Decisions: All of your currently saved decisions for the year ahead.
Course Scoreboard: See how your company ranks across your entire course (if enabled by your instructor).
Marketing
Market Research: Important market information covering market segments and
customers.
Market Summary: See how your product(s) are performing in comparison to others in the industry.
Product Summary: The key results for your product(s).
Market Share: A pie chart showing market share for each company in the industry.
Distribution Summary: View consumer shopping habits by market segment and
your own distribution results.
Perceptual Map: Charts the markets as segmented by style and technical specifications. The center of each circle represents customer’s ideal specifications.
Operations
Product Summary: The key results for your product(s).
Factory Report: A summary of your factory capacity, capacity usage and production process.
Operations Information: View factory capacity requirements, operations costs and
decision limits.

Reporting 24
Multifirm Quality Ratings: A line chart comparison the quality indexes for all companies in the industry.
Finance
Income Statement: Sales revenue and costs of goods sold, finally calculating your Net Income (or loss). Also knows as a Profit and Loss (P&L) Statement.
Balance Sheet: Statement of financial position, listing assets, liabilities and owner’s equity.
Cashflow Statement: Statement of cashflows listing incoming and outgoing funds.
Equity Movements Statement: Details the change in owner’s equity, including changes in share capital, dividends paid, retained earnings and other reserves.
Finance Information: View finance related costs and decision limits.
Forecast Results
Forecast Results Summary: Forecast sales revenue, gross margin and income for
the year ahead, including a comparison with actual results from last year.
Forecast Income Statement: Based on currently entered decisions, a comparison of your forecast income statement against last year’s income statement.
Forecast Cashflow Statement: Based on currently entered decisions, a forecast of incoming and outgoing cash for the year ahead.
Historical Reports
A selection of key reports for each past year of the simulation.
Search
The search feature enables you to conduct a keyword search across all reports.