milda puČetaitĖ
TRANSCRIPT

VILNIUS UNIVERSITY
MILDA PUČETAITĖ
VIBRATIONAL SPECTROSCOPY AND
MICROSPECTROSCOPIC IMAGING OF URINARY STONES
AND BIOLOGICAL FLUIDS
Doctoral Dissertation
Physical Sciences, Physics (02P)
Vilnius, 2016

The dissertation has been developed during the years 2012 – 2016 in
Vilnius University
Supervisor - Prof. Dr. Valdas Šablinskas (Vilnius University, physical
sciences, physics - 02P)
Advisor - Prof. Dr. Per Uvdal (Lund University, physical sciences, physics
- 02P)

VILNIAUS UNIVERSITETAS
MILDA PUČETAITĖ
INKSTŲ AKMENŲ IR BIOLOGINIŲ SKYSČIŲ TYRIMAS
VIRPESINĖS SPEKTROMETRIJOS IR MIKROSKOPIJOS
METODAIS
Daktaro disertacija
Fiziniai mokslai, Fizika (02P)
Vilnius, 2016 metai

Disertacija rengta 2012 – 2016 metais Vilniaus universitete
Mokslinis vadovas - prof. dr. Valdas Šablinskas (Vilniaus universitetas,
Fiziniai mokslai, Fizika - 02P)
Mokslinis konsultantas - prof. dr. Per Uvdal (Lundo universitetas, Fiziniai
mokslai, Fizika - 02P)

5
Contents INTRODUCTION .......................................................................................... 10
GOALS AND TASKS OF THE THESIS ........................................................................ 12
STATEMENTS OF THE THESIS .............................................................................. 13
NOVELTY AND RELEVANCE OF THE RESULTS ........................................................... 14
PUBLICATIONS INCLUDED IN THE THESIS ............................................................... 15
Peer-reviewed publications .................................................................... 15
Conference proceedings ......................................................................... 15
PAPERS NOT INCLUDED IN THE THESIS .................................................................. 16
CONFERENCE ABSTRACTS .................................................................................. 17
PARTICIPATION IN FUNDED SCIENCE PROJECTS ....................................................... 19
AUTHOR’S CONTRIBUTION ................................................................................. 19
CHAPTER 1 .... BIOMEDICAL APPLICATIONS OF VIBRATIONAL SPECTROSCOPY:
CURRENT STATUS AND TECHNICAL ADVANCES ............................................ 5
1.1. VIBRATIONAL SPECTROSCOPY MEASUREMENT TECHNIQUES AND THEIR BIOMEDICAL
APPLICATIONS ................................................................................................. 22
1.2.1. Accessories of FTIR spectrometer: ATR units ................................ 24
1.2.2. Accessories of FTIR spectrometer: microscope ............................. 26
1.2.3. Raman scattering spectroscopy techniques: surface enhanced
Raman scattering – SERS ......................................................................... 28
1.2.4. Raman scattering spectroscopy techniques: coherent anti-Stokes
Raman scattering - CARS ......................................................................... 31
1.3. DATA ANALYSIS TECHNIQUES ....................................................................... 35
1.3.1. Spectral pre-processing ................................................................ 35
1.3.2. Qualitative and quantitative spectral analysis ............................. 35
1.3.3. Chemical imaging ......................................................................... 37
1.3.4. Basic theory of Kramers-Kronig transform (KKT) .......................... 37

6
CHAPTER 2 ..... VIBRATIONAL SPECTROSCOPY ANALYSIS OF URINARY STONES
.................................................................................................................. 21
2.1. URINARY STONE DISEASE ............................................................................ 42
2.1.1. Formation of urinary stones: crystallization, aggregation and
growth ..................................................................................................... 42
2.1.2. Urinary stone analysis .................................................................. 44
2.2. VIBRATIONAL SPECTROSCOPY APPLICATIONS TO URINARY STONE ANALYSIS ........... 48
2.2.1. IR absorption spectroscopy of urinary stones ............................... 48
2.2.2. Raman scattering spectroscopy of urinary stones ........................ 49
2.3. URINARY STONE ANALYSIS: EXPERIMENTAL DETAILS ......................................... 51
2.3.1. Sample preparation of urinary stones .......................................... 51
2.3.2. FTIR absorption spectroscopy of urinary stones ........................... 52
2.3.3. FTIR reflection microspectroscopy of urinary stones .................... 53
2.3.4. FIR absorption spectroscopy of urinary stones ............................. 53
2.3.5. FIR reflection microspectroscopy of urinary stones ...................... 53
2.3.6. Raman scattering spectroscopy of urinary stones ........................ 54
2.3.7. Nonlinear optical microscopy of urinary stones ............................ 55
2.3.8. Spectral analysis of urinary stones ............................................... 56
2.3.9. IR and Raman chemical imaging of urinary stones ....................... 57
2.4. URINARY STONE ANALYSIS: RESULTS AND DISCUSSION ...................................... 58
2.4.1. IR chemical imaging of urinary stones: modified KKT correction of
reflectance spectra .................................................................................. 66
2.4.2. IR chemical imaging of urinary stones: MIR vs. FIR ...................... 71
2.4.3. FT-Raman chemical imaging of urinary stones ............................. 76
2.4.4. IR chemical imaging of urinary stones: use of HCA ....................... 78
2.4.5. Multimodal CARS chemical imaging of urinary stones ................. 83
2.4.6. Final remarks on vibrational spectroscopy of urinary stones ........ 93
2.5. URINARY DEPOSITS: A HINT OF THE STONE FORMATION .................................... 97

7
2.6. INFRARED SPECTROSCOPIC ANALYSIS OF URINARY DEPOSITS: EXPERIMENTAL DETAILS
.................................................................................................................... 99
2.6.1. Sample preparation of urinary deposits ....................................... 99
2.6.2. FTIR transmission microspectroscopy of urinary deposits ............ 99
2.6.3. FTIR ATR spectroscopy of urinary deposits ................................. 100
2.7. ANALYSIS OF URINARY DEPOSITS: RESULTS AND DISCUSSION ............................ 101
2.8. VIBRATIONAL SPECTROSCOPY ANALYSIS OF URINARY STONES AND URINARY DEPOSITS:
CONCLUSIONS ............................................................................................... 108
CHAPTER 3 .. VIBRATIONAL SPECTROSCOPY ANALYSIS OF BIOLOGICAL FLUIDS
.................................................................................................................. 40
3.1. ANALYSIS OF BIOLOGICAL FLUIDS FOR DISEASE DIAGNOSIS ............................... 110
3.1.1. Detection of metabolites in bodily fluids .................................... 110
3.1.2. Uric acid ...................................................................................... 111
3.2. URIC ACID DETECTION IN SOLUTION BY MEANS OF SERS: EXPERIMENTAL DETAILS 114
3.2.1. Preparation and characterization of Ag NPs colloids .................. 114
3.2.2. Uric acid sample preparation for SERS measurements ............... 115
3.2.3. Raman and SERS measurements of uric acid aqueous solutions 116
3.2.4. Theoretical calculations of uric acid molecule ............................ 117
3.3. SERS SPECTROSCOPY OF METABOLITES IN SOLUTION: RESULTS AND DISCUSSION . 118
3.3.1. Evaluation of the prepared SERS substrates ............................... 119
3.3.2. Detection of uric acid in aqueous solution .................................. 123
3.4. ANALYSIS OF EXTRACELLULAR FLUID FOR KIDNEY CANCER DIAGNOSIS ................. 130
3.4.1. Kidney cancer ............................................................................. 130
3.4.2. Vibrational spectroscopy applications for cancer diagnostics .... 131
3.5. IR SPECTROSCOPIC ANALYSIS OF ECF: EXPERIMENTAL DETAILS ......................... 134
3.5.1. ECF sample preparation .............................................................. 134
3.5.2. FTIR spectroscopy measurements of ECF films ........................... 134
3.5.3. Spectral analysis of ECF films ...................................................... 134
3.6. IR SPECTROSCOPIC ANALYSIS OF ECF: RESULTS AND DISCUSSION ...................... 136

8
3.7. VIBRATIONAL SPECTROSCOPY ANALYSIS OF BIOLOGICAL FLUIDS: CONCLUSIONS .... 146
BIBLIOGRAPHY ......................................................................................... 147
APPENDIX I ............................................................................................... 176
APPENDIX II .............................................................................................. 180
APPENDIX III ............................................................................................. 183
APPENDIX IV ............................................................................................ 191
ACKNOWLEDGEMENTS ............................................................................. 195

9
Abbreviations
ACP – amorphous calcium phosphate
ATR – attenuated total reflection
CARS – coherent anti-Stokes Raman scattering
CCD – charge-coupled device
COD – calcium oxalate dihydrate
COM – calcium oxalate monohydrate
DFT – density functional theory
DTGS – deuterated triglycine sulphate
FIR – far infrared
FTIR – Fourier transform infrared
HCA – hierarchical cluster analysis
IR – infrared
KKT – Kramers-Kronig transform
LSPR – localized surface plasmon resonance
MCT – mercury cadmium telluride
MIR – middle infrared
Nd:YAG – neodymium doped yttrium aluminum garnet
NIR – near infrared
PMT – photomultiplier tube
ROI – region of interest
SERS – surface enhanced Raman scattering
SHG – second harmonic generation
TPEF – two-photon emission fluorescence

10
Introduction
Rapid advance in biology and medicine leads to an increasing
demand of knowledge about chemical composition and structure of related
molecular compounds, their function and response to changing environment.
Vibrational spectroscopy has been increasingly used for this purpose [1–7]. It
provides information about vibrational modes in sample molecules and is a
standard method for determination of chemical composition, molecular
structure and intermolecular interactions. Versatility of sample preparation
methods, possibility to analyze small samples provided by coupling the
spectrometers to microscopes and the fact that no labelling is needed to
obtain contrast makes vibrational spectroscopy extremely attractive for
studies of biological samples: from small molecules to complex structures of
proteins, from biological fluids to cells and tissues [8–13].
Many scientific research nowadays is based on a thought that
vibrational spectroscopy could also be useful for early diagnostics of diseases
[5,14–17]. It allows detecting alterations in biochemistry of cells, tissues,
biological fluids, etc. caused by various pathologies. Due to sensitivity of
vibrational spectroscopy, these alterations could be discovered earlier than
with any other currently available chemical or spectroscopic method. When
experiments are performed according to protocol and under constant
conditions, vibrational spectroscopy can also provide objective and operator
independent results. In addition, availability of fiber optics and the fact that
vibrational spectra can be recorded in a fraction of seconds opens up a
possibility for diagnosis in vivo [12,18–20].
Despite the potential of vibrational spectroscopy methods and a
vast amount of laboratory research being carried out, application of
vibrational spectroscopy in routine biomedical tests is still episodic. There are

11
several reasons for this. Firstly, for the method to be approved in medical
practice, it has to produce certain values of sensitivity and specificity, go
through reliability tests and clinical trials [21,22]. With lack of close
cooperation between medics and scientists, this is a difficult task to
accomplish. Secondly, analysis of biological samples is challenging in itself due
to issues related to sample preparation and spectral analysis [21]. Normally,
they contain a mixture of macromolecules which all contribute to the
resultant spectrum causing spectral bands to overlap and broaden. While
such spectra contain vast amounts of information that can be used for
diagnostic purposes, their analysis by simply evaluating peak positions,
intensities and half-widths usually gives little use; particularly, when the
spectral data set is large. Therefore, data pre-processing algorithms and
multivariate statistical analysis for data reduction and classification is
necessary [23–25]. Furthermore, samples of various nature and in various
environments require consideration of the most suitable approach for their
analysis. For instance, solid biological samples, such as urinary stones, often
require use of infrared (IR) microscopy in specular reflection mode which
yields Reststrahlen spectral bands in the recorded spectra [26]. This method
allows obtaining information about both chemical composition and structure
of samples as, unlike other techniques, does not require sample grinding. On
the other hand, specular reflectance spectra require complex mathematical
processing before both qualitative and quantitative analysis can be performed
[27]. Standard Kramers-Kronig transform is rarely applicable due to issues
related to acquisition of spectra, sample homogeneity and surface roughness.
Alternatively to the specular reflection IR microspectroscopy, Raman
scattering methods could be applied. While this technique requires no sample
preparation, fluorescence background is a common issue when biological
samples are analyzed. In addition, due to low yield of Raman scattered
photons, spectral acquisition time is long.

12
Low efficiency of Raman scattering also prevents it from
applications in detection of small concentrations of substances in solutions,
such as biological fluids. This can be overcome by using signal enhancement
by metal nanoparticles – surface enhanced Raman scattering spectroscopy.
The challenge for this method to be used in clinical practice lies in achieving
reproducibility and selectivity when biological fluids of complex compositions
are analyzed [28,29].
Finally, despite the fact that complementary use of vibrational
spectroscopy techniques provides the best perspectives for their practical
applications, they are often viewed at as separate and competing techniques.
This limits their acceptance among other routine methods.
Goals and tasks of the thesis
Responding to the challenges highlighted above, the main goal of
this thesis is complementary application of vibrational spectroscopy and
microspectroscopy methods for analysis of biomedical samples - urinary
stones, urinary deposits and biological fluids. The work is focused on adapting
the methods and data analysis techniques to obtain reliable and repeatable
results. To achieve this goal, the following tasks were formulated:
1. Apply and evaluate potential of vibrational spectroscopy and
microspectroscopy techniques for comprehensive morphochemical
analysis of human urinary stones.
2. Apply and evaluate potential of infrared spectroscopy and
microspectroscopy for chemical analysis of urinary deposits.
3. Explore enhancement effects of various drop-dried colloidal substrates
with differently shaped silver nanoparticles and find optimal experimental
conditions for detection traces of uric acid in aqueous solutions by means
of surface enhanced Raman scattering (SERS) spectroscopy and perform

13
assignment of the SERS spectral bands by means of density functional
theory calculations.
4. Perform infrared spectral analysis of extracellular fluid taken from healthy
and tumor kidney tissue during nephrectomy surgery for identification of
spectral markers of cancer.
Statements of the thesis
1. Specular reflection IR microspectroscopy in MIR and FIR spectral region
can be efficiently used for chemical imaging of solid, rough surface
samples such as human urinary stones only when specific spectral pre-
processing is performed.
2. Epi-detected non-linear optical imaging provides chemically sensitive
information concerning microstructure of urinary stones at lateral
resolution higher than 1 µm.
3. Macro-ATR IR spectroscopy is found to be superior method to
conventional optical microscopy for determining chemical composition of
atypical crystal, poly-crystal and amorphous urinary deposits.
4. Semi-quantitative analysis of uric acid in biological fluids by means of
colloidal SERS with detection limits down to 10-6 M is possible only when
special drop-drying technique is used for preparation of the substrates.
5. Statistical multivariate analysis applied to IR spectral bands of glycogen in
the spectral region of C-O stretching vibrations allows differentiating
between healthy and cancerous kidney tissue with sensitivity up to 91 %.

14
Novelty and relevance of the results
• Complementary use of vibrational spectroscopy techniques has the best
prospects for practical biomedical applications due to their versatility
regarding sample size, aggregation state or concentration.
• In this work we show for the first time that for solid samples, such as
urinary stones, diffuse reflection influence has to be taken into account
for reliable qualitative and semi-quantitative analysis using specular
reflection IR microspectroscopy. This can be done either by subtracting
the diffuse reflection component from the specular reflection spectra or
by applying FIR radiation for the analysis.
• Despite the fact that nonlinear optical microscopy has been mostly used
for analysis of tissues and lipid structures, the method is suitable to
determine both chemical composition and microstructure of urinary
stones for more comprehensive pathogenesis of urolithiasis.
• The only currently applied method for early diagnosis of urolithiasis –
optical microscopy of urinary deposits – is unreliable both in detecting the
deposits and determining their chemical composition. Macro-ATR IR
spectroscopy is found to be superior method for determining chemical
composition of atypical crystal, poly-crystal and amorphous urinary
deposits.
• Possibility to obtain quantitative information about low concentration
substances in solutions (or biological fluids) by means of SERS is of great
importance if the method is going to be used in clinical practice. We show
that for detection of uric acid by colloidal SERS technique it is possible
only when special drop-drying technique is used for preparation of the
substrates
• IR spectroscopic analysis of extracellular fluid is a new, never before
applied method for differentiation of healthy and cancerous tissue.

15
Publications included in the thesis
Peer-reviewed publications
1. M. Pucetaite, V. Hendrixson, A. Zelvys, F. Jankevicius, J. Ceponkus, V.
Sablinskas, Application of Infrared Spectroscopical Imaging in Specular
Reflection Mode for Morphological Studies of Urinary Stones, J. Mol.
Struct. 1031, 38-42 (2013).
2. S. Tamošaitytė, V. Hendrixon, A. Želvys, R. Tyla, Z. A. Kučinskienė, F.
Jankevičius, M. Pučetaitė, V. Jablonskienė, V. Šablinskas, Combined
studies of chemical composition of urine sediments and kidney stones by
means of infrared microspectroscopy, J. Biomed. Opt. 18(2), 027011
(2013).
3. M. Pucetaite, S. Tamosaityte, A. Engdahl, J. Ceponkus, V. Sablinskas,
P. Uvdal, Microspectroscopic Infrared Specular Reflection Chemical
Imaging of Multi-Component Urinary Stones: MIR vs. FIR, Cent. Eur. J.
Chem. 12(1), 44-52 (2014).
4. M. Pucetaite, M. Velicka, J. Pilipavicius, A. Beganskiene, J. Ceponkus,
V. Sablinskas, Uric acid detection by means of SERS spectroscopy on dried
Ag colloidal drops, J. Raman Spectrosc. 47(6), 681-686 (2016).
5. M. Pucetaite, S. Tamosaityte, R. Galli, V. Sablinskas, G. Steiner,
Microstructure of urinary stones as studied by means of multimodal
nonlinear optical imaging, J. Raman Spectrosc, n/a-n/a (2016) (online
Early View, DOI: 10.1002/jrs.4985).
Conference proceedings
1. M. Pucetaite, P. Banys, V. Sablinskas, Application of infrared reflection
microspectroscopy for chemical imaging of cross-sectioned urinary calculi,
Proc. of SPIE 8798, 87980U (2013); doi:10.1117/12.2032506.

16
2. M. Pucetaite, M. Velicka, S. Tamosaityte, V. Sablinskas, Application of
SERS spectroscopy for detection of trace components in urinary deposits,
Proc. of SPIE 8957, 895708-1 (2014); doi: 10.1117/12.2040386.
3. V. Urboniene, M. Velicka, J. Ceponkus, M. Pucetaite, F. Jankevicius,
V. Sablinskas, G. Steiner, Intra-operative on-line discrimination of kidney
cancer from normal tissue by IR ATR spectroscopy of extracellular fluid,
Proc. of SPIE 9704, 97040E (2016); doi:10.1117/12.2213408.
Papers not included in the thesis
1. S. Tamosaityte, E. Baltakyte, D. Blazevic, M. Pucetaite, J. Ceponkus,
V. Hendrixson, S. Varvuolytė, V. Sablinskas, Baseline correction of infrared
absorption spectra of urinary sediments by taking Mie scattering effects
into account, Proc. of SPIE 8798, 87980V (2013); doi:10.1117/12.2032508.
2. V. Urboniene, M. Pucetaite, F. Jankevičius, A. Želvys, V. Sablinskas,
G. Steiner, Identification of kidney tumor tissue by infrared spectroscopy
of extracellular matrix, J. Biomed. Opt. 19(8), 087005 (2014).
3. J. Ceponkus, M. Jonusas, C. P. Cotter, M. Pucetaite, V.Aleksa, G. A. Guirgis,
V. Sablinskas, Structural Studies of 1,1-Dimethyl-2-oxy-1-silacyclohexane
by Means of Matrix Isolation Infrared Absorption Spectroscopy, J. Phys.
Chem. A 119(11), 2721-2726 (2015).
4. J. Ceponkus, V. Sablinskas, V. Aleksa, M. Pucetaite, R. Platakyte, C. W.
Reed, C. Cotter, G. Guirgis, Raman and infrared spectroscopic studies of
structure and stability of 1,1,2,2-tetrachloro-1,3-disilacyclopentane, Vib.
Spectrosc. 81, 136–43 (2015).
5. M. Velicka, V. Urboniene, J. Ceponkus, M. Pucetaite, F. Jankevicius,
V. Sablinskas, Detection of cancerous biological tissue areas by means of
infrared absorption and SERS spectroscopy of intercellular fluid, Proc. of
SPIE 9550, 95500A, (2015); doi:10.1117/12.2186395.

17
6. A. Stirke, R.-M. Apetrei, M. Kirsnyte, L. Dedelaite, V. Bondarenka,
V. Jasulaitiene, M. Pucetaite, A. Selskis, G. Carac, G. Bahrim, A.
Ramanavicius, Synthesis of Polypyrrole Microspheres by Streptomyces
Spp., Polymer 84, 99–106 (2016).
7. J. Pilipavicius, R. Kaleinikaite, M. Pucetaite, M. Velicka, A. Kareiva, A.
Beganskiene, Controllable Formation of High Density SERS-Active Silver
Nanoprism Layers on Hybrid Silica-APTES Coatings, Appl. Surf. Sci. 377,
134–40 (2016).
Conference abstracts
1. Valdas Sablinskas, Milda Pucetaite, Justinas Ceponkus, Chemical Imaging
of Heterogeneous and Rough Surfaces by Means of Infrared
Microspectroscopy in Specular Reflection, ScIX2012 39th annual meeting
of FACSS, Kansas City, USA
2. Sandra Tamošaitytė, Evelina Baltakytė, Milda Pučetaitė, Valdas Šablinskas,
Šlapimo nuosėdų cheminės sudėties tyrimai FT-Ramano sklaidos
spektriniu metodu, 40-oji Lietuvos Nacionalinė Fizikos Konferencija, 2013,
Vilnius, Lietuva
3. Milda Pucetaite, Jonas P. Banys, Sandra Tamošaitytė, Justinas Čeponkus,
Valdas Šablinskas, Biologinių paviršių cheminio vaizdinimo panaudojant
infraraudonosios spinduliuotės veidrodinio atspindžio spektrus ypatumai,
40-oji Lietuvos Nacionalinė Fizikos Konferencija, 2013, Vilnius, Lietuva
4. Milda Pucetaite, Jonas P. Banys, Valdas Šablinskas, Application of Infrared
Reflection Microspectroscopy for Chemical Imaging of Cross-sectioned
Urinary Calculi, European conferences on biomedical optics (ECBO) (part
of congress World of photonics) 2013, Munich, Germany
5. Sandra Tamosaityte, Evelina Baltakyte, Dominyka Blazevic, Milda
Pucetaite, Justinas Ceponkus, Sonata Varvuolyte, Vaiva Hendrixson and

18
Valdas Šablinskas, Baseline Correction of IR Spectra of Urinary Sediments
by Taking Mie Scattering Effects into Account, European conferences on
biomedical optics (ECBO) (part of congress World of photonics) 2013,
Munich, Germany
6. Milda Pucetaite, Martynas Velicka, Valdas Sablinskas, Application of SERS
spectroscopy for detection of trace components in urinary deposits,
Photonics West 2014, San Francisco, USA
7. Vidita Urboniene, Milda Pucetaite, Feliksas Jankevicius, Valdas Sablinskas,
Gerald Steiner, IR spectroscopical studies of intercellular liquid as tool for
cancer detection, Photonics West 2014, San Francisco, USA
8. Milda Pucetaite, Martynas Velicka, Jurgis Pilipavicius, Almira
Ramanaviciene, Indre Aleknaviciene, Evaldas Pabreza and Valdas
Sablinskas, Comparative study of Raman enhancement effect for uric acid
on various SERS substrates, EUCMOS 2014, Dusseldorf, Germany
9. Milda Pucetaite, Dominyka Blazevic, Elvyra Malysko, Vaiva Hendrixson
and Valdas Sablinskas, Infrared spectroscopic analysis of urinary
sediments: transmission vs. ATR, EUCMOS 2014, Dusseldorf, Germany
10. Milda Pučetaitė, Sandra Tamošaitytė, Roberta Galli, Gerald Steiner, Valdas
Šablinskas, CARS mikroskopijos taikymas inkstų akmenų cheminiam
vaizdinimui (Chemical Imaging of Urinary Stones by CARS Microscopy), 41-
oji Lietuvos Nacionalinė Fizikos Konferencija, 2015, Vilnius, Lietuva
11. Milda Pučetaitė, Martynas Velička, Jurgis Pilipavičius, Valdas Šablinskas,
SERS spektrometrijos taikymas šlapimo rūgšties aptikimui biologiniuose
skysčiuose (Application of SERS Spectroscopy for Detection of Uric Acid in
Biological Fluids), 41-oji Lietuvos Nacionalinė Fizikos Konferencija, 2015,
Vilnius, Lietuva
12. Martynas Velicka, Milda Pucetaite, Justinas Ceponkus, Valdas Sablinskas,
Application of various colloidal SERS approaches for detection of traces of
uric acid, Global Biotechnology Congress 2015, Boston, USA

19
Participation in funded science projects
Major part of the studies presented in this thesis was supported
by:
• Project funded by The State Studies Foundation „Studies of Relations
between kidney stone disease and metabolic syndrome“ (2010-2011).
• Project funded by Lithuanian Research Council „Diagnostical studies of
chronical noninfectious diseases by means of infrared spectral
microscopy“ (2011-2012).
• Project funded by European Social Fund „Synthesys of Materials for
Advanced Semiconductor and Nano Technologies and its
Characterization by Means of Steady-state and Ultrafast
Spectroscopies in Wide Spectral Range“ (2013-2015).
• Project funded by Lithuanian Research Council „Spectroscopic express
analyzer of cancerous tissue“ (2015-2018).
Author’s contribution
For the results of the analysis of urinary stones presented in this
thesis, all the experimental work, data analysis and the substantial part of
publication writing was done by the author of the thesis. The experimental
work for the analysis of urinary deposits was performed by Sandra
Tamošaitytė, Dominyka Blaževič and Evelina Baltakytė. The author
participated in conceiving the ideas and the writing, performed major part of
data analysis. All the results presented in this work on detection of small
concentrations of uric acid in aqueous solutions were obtained by the author
through experimental work, data analysis and theoretical calculations.
Substantial part of the publication on the topic was also written by the
author. Major part of experimental work on extracellular fluid analysis was
performed by Doc. Vidita Urbonienė and Martynas Velička, although the

20
author also participated in some of them. Data analysis of the recorded
spectra, the results of which are presented in this thesis, and part of the
writing was performed by the author.

Chapter 1 Biomedical applications of vibrational spectroscopy: current status and technical advances

22
1.1. Vibrational spectroscopy measurement techniques and their biomedical applications
Vibrational spectroscopy is a classical method for material
characterization. It probes molecular vibrations within samples. Frequencies
of these vibrations uniquely define chemical composition and structure of
molecules within given environment. Two main techniques of vibrational
spectroscopy are infrared (IR) absorption and Raman scattering spectroscopy.
Radiation absorption in matter is associated with various processes
one of which is transition between energy states of an atom or a molecule.
For the transition to take place, the energy (i.e., frequency) of the incident
photon has to be equal to the band gap between the states. Absorption of
infrared radiation corresponds with transitions between vibrational energy
levels. IR radiation covers spectral region between 10000 and 10 cm-1
(corresponding wavelengths - 1 and 1000 µm). This region is further
subdivided into three smaller intervals: near infrared (NIR) – 10000÷
4000 cm-1, middle infrared (MIR) - 4000÷200 cm-1 and far infrared (FIR) –
200÷10 cm-1. Most of fundamental vibrational transitions are found in the
MIR spectral region; however, some vibrational transitions can also appear in
NIR (mostly combinations and overtones of fundamental vibrations) or FIR
(vibrations of heavy atoms or intermolecular vibrations) spectral regions
[30,31].
Fourier transform infrared (FTIR) spectrometers are used to record
IR absorption spectra [31]. Since it is a standard technique, it will not be
discussed in detail here. The recorded IR absorption spectrum is unique to a
given compound and is often referred to as “fingerprint” of molecules. Thus,
analysis of the IR absorption spectra allows identification of chemical
composition of molecular substances. For instance, frequencies of vibrational
modes when only a few atoms have large displacements and the rest of the

23
molecule remains stationary are characteristic to functional groups in which
the vibrations are centered. When the vibrations involve displacements of
many atoms (skeletal modes), the frequencies of absorption bands are
specific to structure of the molecule.
Raman scattering spectroscopy is a complementary or alternative
technique to the infrared absorption spectroscopy. It is based on inelastic
scattering of monochromatic light – a phenomenon when frequency of the
incident radiation changes due to its interaction with molecular vibrations
[30,32]. Both dispersive and FT spectrometers can be used to record Raman
scattering spectra. Dispersive Raman scattering spectrometers with excitation
lasers emitting light in the visible spectral region (VIS) and either
photomultiplier tubes (PMT) or charge-coupled device (CCD) detectors for
signal detection are the most popular. However, excitation with visible lasers
often produces fluorescence in colorful samples and samples with impurities.
The fluorescent background overwhelms the weak Raman scattering signal
and makes it difficult or impossible to analyze. The fluorescence effect can be
minimized by use of lasers emitting radiation in the NIR spectral region. There
are two major drawbacks of using these lasers, however. First, high laser
power is required to obtain signal, due to the intensity being inversely
proportional to the power of four of the excitation wavelength; second,
sensitivity of detectors in the NIR spectral region is much lower than
sensitivity of PMTs or CCDs in the visible spectral region. Low signal-to-noise
ratio caused by these factors can be overcome by averaging a lot of spectra
which is only reasonable if FT-Raman spectrometer is used.
Similarly as IR absorption spectra, Raman scattering spectra are
unique to molecular substances and can be used for their identification. Of
note is that the most information about samples can be gained by
complementary application of the both methods. For instance, molecules
having an inversion center obey alternative forbiddance rule: their vibrations

24
are either infrared (asymmetric modes) or Raman (symmetric modes) active
[30].
Versatility, chemical and structural sensitivity of vibrational
spectroscopy makes it extremely attractive for studies of biological systems.
With development of novel techniques it has become possible to analyze bio-
samples regardless of their aggregation state, environment they are in, etc.
and address specific questions related to their composition, structure,
intermolecular interactions and function. While there are a number of such
techniques (for instance, surface enhanced IR absorption (SEIRA)
spectroscopy, nano-IR spectroscopy, spatially offset Raman spectroscopy,
etc.) only the ones related to this work will be covered in the following
sections. Both their advantages and shortcomings will be discussed as well as
their most important applications for analysis of biological samples
highlighted.
1.2.1. Accessories of FTIR spectrometer: ATR units
In addition to the common transmission measurements, FTIR
spectrometers can have various attachments which expand their capabilities.
For instance, attenuated total reflection (ATR) units are widely used as they
simplify sample preparation to a great extent. The ATR method is based on a
total internal reflection phenomenon at the interface between ATR element
of high refractive index and the sample of lower optical density [31]. At the
point of the reflection, electromagnetic field of the incident IR radiation
penetrates into the sample and decays exponentially with the distance from
the interface (evanescent wave). Thus, the reflected beam contains spectral
information about absorbance in the sample. The depth of penetration
depends on the wavelength (λ ), refractive indices of the ATR element and
the sample ( 1n and 2n ) and the angle of incidence (θ ):

25
212
21 )(sin2 nnn
d−
=θπ
λ . (1)
As the penetration depth is linearly dependent on the wavelength,
absorption bands at the lower wavenumbers (larger wavelengths) of the
spectrum will be of smaller intensity than at the larger wavenumbers (smaller
wavelengths). This effect is compensated by applying correction to the
absorbance spectra:
1000
~ν⋅= ABATR , (2)
here AB is absorbance spectrum, ATR – spectrum after the correction and ν~ -
wavenumber.
ATR technique enables analysis of gaseous, liquid and solid samples
with minimal sample preparation as long as it is possible to obtain full contact
between the ATR element and the sample. It does not require samples to be
thin as the volume where the spectrum is measured is determined by the
penetration depth. Single and multiple internal reflection ATR elements are
available. The materials mostly used as the ATR elements are listed in Table 1.
Table 1. Materials used as ATR elements and their refractive indices at 10 µm wavelength
[33].
Material Refractive index
Zinc selenide (ZnSe) 2,41
Germanium (Ge) 4,00
Silicon (Si) 3,42
Diamond 2,38
The fact that FTIR ATR technique does not require any specific
sample preparation, is non-destructive and label-free makes it extremely
attractive for various biomedical applications. To name a few, the method has
been applied to find biomarkers in urine samples [34], diagnose brain cancer

26
from serum [35,36], detect harmful additives in food (meat, milk, and other)
[37–40], etc. Moreover, use of array (focal-plane array – FPA) detectors allows
employing the ATR technique for chemical imaging, for which not only no
sample preparation is needed, but spatial resolution is enhanced as well [41].
Since incident radiation is travelling through the ATR element of high
refractive index (n) before it hits the sample adhered to it, numerical aperture
(NA) and, in turn, diffraction limited spatial resolution (r) is increased [41]:
NA61.0 λ
=r , here αsin⋅= nNA . α is a half-angle of the radiation cone that
enters/exits the objective. FTIR ATR chemical imaging has been used for
analysis of both dried and live cells at sub-cellular level [42,43], for analysis of
breast tissue to find small mineral calcifications [44], for analysis of processes
in microfluidic systems [45], etc.
1.2.2. Accessories of FTIR spectrometer: microscope
FTIR microscopes may be used for analysis of micro-samples or
imaging/mapping of macro-samples. The smallest details that can be analyzed
Fig. 1. Scheme of Cassegrain objective in (A) transmission and (B) reflection modes.

27
are limited by diffraction and for MIR radiation are as small as ~10×10 µm. In
the microscope, radiation from the interferometer is usually focused onto the
sample and collected into the detector by Cassegrain optics (Fig. 1).
Microscopes can operate both in transmission (Fig. 1 A) and reflection modes
(Fig. 1 B). MCT single-point or FPA detectors are used for signal detection. In
order to view at the sample and select regions of interest (ROI), visible
radiation is directed onto the sample through the optics as well. The sample
may be viewed at through an ocular or CCD camera.
Emergence of IR microscopes has expanded the capabilities of IR
spectroscopy as imaging of samples with chemical sensitivity and specificity
became available. In the biomedical field, IR microspectroscopic imaging of
fixed cells and tissues has been of particular importance. It has been used to
uncover protein folding in cells in order to diagnose diseases such as
Alzheimer’s, Parkinson’s, Huntington’s and others [46–49]. Tissue imaging has
mostly been used in order to determine boundaries between cancerous and
healthy tissue in prostate, kidneys, breast, colon etc. [50–54]. In all these
studies the method has shown excellent correlation with histopathological
images and has a potential to be used in clinical practice. IR
microspectroscopy in reflection mode allows analyzing thick, solid samples
such as bone [55]. However, reflectance spectra are influenced by anomalous
dispersion of refractive index which distorts the spectral band shapes [27].
This issue prevents wider applications of IR microspectroscopy in reflection
mode. Since analysis of reflectance spectra is within the scope of this thesis it
will be more extensively discussed in sections 1.3.4, 2.4.1 and 2.4.2.
Synchrotron has been increasingly used as a radiation source for IR
microspectroscopy. Due to beam properties of synchrotron radiation (SR), its
use allows increasing spatial resolution when chemical images are made
through mapping. SR has been used for imaging biomedical samples from
cells and tissues to human hair sections and bones [46,56–60]. Despite the

28
fact that SR is considered an ideal source in FIR spectral range, FIR has rarely
been used for analysis of biosamples. The main reason for this is that water,
which is abundant in most of the biosamples, has an intense absorption in the
FIR spectral region.
1.2.3. Raman scattering spectroscopy techniques: surface enhanced Raman
scattering – SERS
Raman scattering spectroscopy is often considered complementary
to the IR absorption spectroscopy rather than stand-alone technique due to
its low yield. However, Raman scattering signal can be considerably (up to
108) enhanced by locating sample molecules in the vicinity of metal (Ag, Au,
Cu, Pt) nanoparticles – a phenomenon known as surface enhanced Raman
scattering (SERS) [61]. There are two possible enhancement mechanisms: (I)
electromagnetic and (II) chemical. The former one is responsible for
approximately 103-107 of the overall enhancement. It takes place when the
nanoparticles are affected by external electromagnetic field (the field is
constant at a given moment of time if the nanoparticle is much smaller than
the radiation wavelength) of incident laser radiation and localized surface
Fig. 2. Interaction between metal nanoparticle and electromagnetic field of incident
light.

29
plasmons – collective oscillations of electrons – are induced. They produce a
local electromagnetic field around the nanoparticles (Fig. 2.) which is the
strongest at the two points (A and B) along the axis of the nanoparticle
directed parallel to the external field. In addition, at these points the
directions of the local field coincides with the direction of the external field;
thus, superposition of the fields yields an intensity enhancement. If a
molecule is located in either one of these positions, its Raman scattering
signal is enhanced as well. The enhancement is even larger if the molecule is
in a small gap – so called hot spot - between two nanoparticles [61,62].
An important condition to obtain high Raman scattering signal
enhancement is to attain resonance (local surface plasmon resonance – LSPR)
between the frequency of incident radiation and natural frequency of the
plasmons determined by the nature of the metal, size and shape of the
nanoparticles. It has been shown that metals are useful as plasmonic
materials if the real part of their dielectric function ( ))(Re( λe ) in the
wavelength region of excitation is both large and negative [62]. For this
reason, silver and gold which both meet these conditions are the most widely
used in SERS applications. When the size of the nanoparticles increases, the
LSPR red-shifts and is damped. The shape of the nanoparticles also influences
the position and intensity of the LSPR. For instance, the LSPR of Ag
nanoprisms is red-shifted from 400-450 nm to 700-1000 nm as compared to
the spherical Ag nanoparticles. In addition, resonance conditions could be met
for more than one wavelength which makes it easier to select the excitation
laser for the SERS experiment to obtain maximum enhancement [62].
The second, chemical, enhancement mechanism is responsible for
only additional factor of 10 of the overall enhancement. It stems from the
interactions between the analyte molecule and the metal, such as electron
transfer between the two [62].

30
When analyzing biological molecules, and, in particular, when
creating biosensors it is important to achieve reproducibility of the recorded
SERS spectra to be able to perform quantitative analysis. This remains the
major drawback of SERS spectroscopy since there are many factors that can
affect the intensity of the spectra [63]. Firstly, preparing identical uniform
substrates is only possible by implementing relatively expensive and complex
lithography techniques. Synthesizing colloidal metal nanoparticle solutions is
cheap and easily available; however, reproducible results are hardly
achievable when they are used in SERS spectroscopy. Adsorption
characteristics of analyte molecules on the metal nanoparticles influence the
SERS signal intensity as well. For instance, different extent of surface coverage
may lead to different molecule orientation, and in turn, due to surface
selection rules [64], different relative intensities of SERS spectral bands [63].
In addition, SERS signal intensity depends on the overall surface coverage,
described by adsorption isotherms. It has been shown, that with increasing
number of molecules adsorbed on the metal nanoparticle surface, the SERS
signal intensity increases and, at a certain point, reaches its maximum value.
Further addition of molecules does not increase the signal intensity and might
even reduce it, as the “free”, not adsorbed molecules damp the resonance of
the nanoparticles [63].
Despite the issues mentioned above, SERS spectroscopy has been
increasingly proposed as a method of choice for disease diagnosis and
prevention [65–68]. Due to its high sensitivity the method has mostly been
used for detection of low concentration substances in biological fluids such as
urine, blood, saliva, tears, etc. [69–74]. It has also been employed to
differentiate between bacterial strains for detection of disease inducing
microorganisms in food and water [75–78]. Moreover, imaging of cells and
tissues by use of SERS labeling has been reported both ex- and in vivo [79–81].
However, the biggest issue with SERS spectroscopy that prevents it from

31
being used in routine clinical practice is production of metal nanoparticle
substrates that would provide reproducible results suitable for quantitative
analysis.
1.2.4. Raman scattering spectroscopy techniques: coherent anti-Stokes Raman
scattering - CARS
Another technique that allows obtaining much higher Raman
scattering signal is coherent anti-Stokes Raman scattering (CARS) microscopy
[82]. CARS is a four-wave mixing process based on sample excitation using
two ultra-short spatially and temporally tuned lasers. The frequency
difference of these lasers is selected to match the energy of molecular
oscillations (Fig. 3). For the four photons that are involved in the CARS
process, phase matching condition has to be met (Fig. 3). This is the case for
only one direction of kaS vector of the anti-Stokes photon. That means that all
the CARS photons are directed in a single direction different from the one the
laser radiation is propagating in. This makes CARS signal easy to record. In
Fig. 3. Energy level diagram showing transitions for CARS and non-resonant background
(left); scheme of phase matching between the two pump, Stokes and CARS photons
(right).

32
addition, intensity of the recorded anti-Stokes Raman scattering signal is
proportional to the square of the number of the oscillators. For this reason
CARS has an advantage of high sensitivity as well as faster image acquisition
rates over spontaneous Raman scattering. Furthermore, recording signal in
the anti-Stokes spectral region means that one-photon fluorescence
background generated by colorful samples and impurities is not recorded
which is extremely important when biological samples are analyzed [82]. On
the other hand, together with the resonant CARS signal, frequency
independent non-resonant background is generated. It is attributed to
electronic transitions between virtual states in non-resonant molecules
(Fig. 3). The overall CARS signal is then described by contributions of both
resonant and non-resonant contributions of third-order susceptibility (χ3R and
χ3NR respectively) [83]:
𝐼𝐶𝐶𝐶𝐶(𝜔) ∝ (|𝜒𝐶3(𝜔)|2 + |𝜒𝑁𝐶3 |2 + 2𝜒𝑁𝐶3 Re[𝜒𝐶3(𝜔)]) ∙ 𝐼𝑝𝑝𝑝𝑝2 ∙
∙ 𝐼𝐶𝑆𝑆𝑆𝑆𝑆, (3)
where, ICARS, Ipump and IStokes – intensities of the CARS, pump and Stokes beams
respectively. The contribution of the non-resonant background (I) distorts
shapes of the CARS spectral bands as compared to the bands in the
spontaneous Raman scattering spectra and (II) overwhelms the resonant
CARS signal causing lower contrast in the CARS images [83]. There are CARS
detection schemes, such as epi-CARS [84], polarization CARS [85], frequency
modulated CARS [86], interferometric CARS [87], that allows avoiding the
undesirable non-resonant background in the images. In the epi-CARS
technique, the resonant CARS signal is recorded in the backward direction
while the non-resonant background is only generated in the forward direction
[84,88].
In the CARS microscopy experiment (simplified experiment scheme
is presented in Figure 4), phase matching condition between the lasers is
achieved by fine tuning a delay line. The radiation is directed onto the sample

33
and scattered radiation is collected with an optical microscope equipped with
non-descanned detectors. Signal can be recorded in either trans- or epi-
directions depending on the nature of the sample. Finally, the non-linearity of
the CARS process determines that the coherent scattering signal is only
generated in a small volume where the lasers are focused and the phase
matching condition is met. For this reason, 3D imaging of samples is possible
with this method [82].
CARS is a technique mostly used for label-free imaging of various
biological systems and offering biochemical specificity with submicron spatial
resolution [89–91]. Possibility of simultaneous acquisition of other non-linear
optical signals enables multimodal imaging: CARS, two-photon excited
fluorescence (TPEF) and second harmonic generation (SHG) signals [82]. While
CARS is generated by specific molecular vibrations, TPEF is generated by
endogenous fluorophores (such as pigments). SHG signal is generated by non-
centrosymmetric microstructures lacking inversion symmetry. Thus,
multimodal imaging allows distinguishing different chemical species and their
morphological distribution in the sample. In addition, it has been shown that
in vivo measurements are possible by utilizing single mode optical fibers for
so called CARS endoscopy [92,93].
Multimodal CARS microscopy proved to be of particular use for
imaging lipid-rich structures such as brain and kidney tissues [94,95].
Fig. 4. Block scheme of CARS imaging system.

34
However, its potential in imaging and analysis of mineral samples has also
been shown [96]. While trans- detection is preferable for thin samples due to
more intensive signal acquired, epi- detection is also possible and allows
analysis of samples independent of their thickness. It has been recently
demonstrated that epi-detected multimodal imaging can be used to uncover
distributions of mineral (apatite) and organic matter in tooth which provides
better understanding of its morphological structures in micro scale and
facilitate optical diagnosis and tooth characterization in dentistry [97].

35
1.3. Data analysis techniques
1.3.1. Spectral pre-processing
First step in spectral data analysis is pre-processing which allows
correcting artefacts related to signal acquisition (e.g., scattering, influence
from atmospheric gases, uneven sample thickness, etc.) [23,24,98]. It usually
includes atmospheric compensation (physical models are used to estimate
and account for the amount of CO2 and H2O influencing the spectra), baseline
correction (which can be a simple offset correction or scattering correction;
rubber-band method is used to correct more complex baseline deviations)
and normalization. Sometimes, spectral smoothing may be required to obtain
higher signal-to-noise ratio. However, this comes with a price of lowered
spectral resolution [31]. Another technique for spectral de-noising is use of
principal component analysis (PCA) [99]. Spectra are decomposed into
principal components (PCs) and then reconstructed from only few of them
leaving the ones that represent the noise out.
Better separation of overlapped spectral bands is achieved by
calculating derivatives of spectra or by applying Fourier self-deconvolution
algorithm [31,100]. The latter includes altering the decay function of the
recorded signal which results in narrower spectral bands. Differentiation
produces narrower lineshapes of spectral bands as well. While odd derivatives
have dispersive lineshape, even derivatives result in symmetric lineshape. Of
note, derivatives of order higher than two are rarely used as their lineshape is
complex and may lead to incorrect interpretation of spectra.
1.3.2. Qualitative and quantitative spectral analysis
After spectral pre-processing, further analysis can be performed.
Qualitative analysis is usually performed by comparing vibrational spectra of

36
samples with vibrational spectra of pure components. There are several free-
access spectral libraries (for example, http://webbook.nist.gov/;
http://rruff.info/) which contain vibrational spectra of various molecular
compounds and which can be used for determination of chemical
composition of samples. Otherwise, such libraries can be purchased or
constructed according to the samples analyzed in a laboratory. Of note, it is
usually preferred that both the sample and the library spectrum would be
recorded using the same method (e.g., IR transmission or ATR) and under
similar environmental conditions.
Absorbance is directly proportional to concentration of absorbing
matter. As long as this relationship is linear, quantitative information (relative
concentration) about the substances in the sample can be extracted by
calculating integral intensities of characteristic spectral bands and dividing
them by corresponding integral intensities of spectral bands in the reference
spectrum of pure component.
When the spectral data set is very large, it is difficult, and often
unnecessary, to analyze spectra one by one. Multivariate analysis methods
allow separating the large data set into groups according to the differences
between the spectra (i.e., chemical changes in the sample(s)) [101]. One of
such methods is hierarchical cluster analysis (HCA) which forms clusters that
are organized as tree – the root of the tree contains the whole data set, while
the leaves are individual spectra. The results of the HCA are often displayed as
a tree-like graph – a dendrogram. In the HCA, the clustering begins with the
single spectra which are successively merged into groups according to their
similarity. The similarity is usually determined by calculating Euclidean
distances between every point in the spectra; then a specific algorithm
(usually Ward’s algorithm) is used for the grouping [102]. The procedure is
repeated until only one cluster remains. Such approach has been used for
classification of cells, tissue types, microorganisms, plants etc. [103,104].

37
1.3.3. Chemical imaging
IR and Raman microscopy allows obtaining morphochemical
information about samples which means that not only chemical composition
is known, but also where in the sample a specific chemical component is
located. A spectral data set obtained by imaging or mapping is pre-processed
as described above. Calculation of integral intensities of characteristic spectral
bands or use of the HCA (or other multivariate analysis techniques) generates
a single value - the integral intensity or cluster number - associated with each
spectrum in the data set. In order to create a chemical image, these values
are color-coded and attributed to each pixel in the image [23].
1.3.4. Basic theory of Kramers-Kronig transform (KKT)
As mentioned above, in the external reflectance measurements,
the spectral band shapes are affected by the dispersion of refractive index (n)
[27]:
)(2)/(1
2200
22
γωωωe imqNn+−
+= , (4)
here ω – incident radiation frequency, ω0 – natural resonant frequency of the
oscillators in the sample, γ –damping coefficient, q – charge, associated with
the oscillator, m – oscillator mass, N – number of oscillators. The dispersion
affected spectral bands, or Reststrahlen bands, appear as first derivative of
absorbance spectral bands: they acquire negative values at the high
frequency side and their peak position is red shifted. Such distortion
aggravates spectral analysis and, therefore, needs to be corrected.
Dispersion is normal when 0<ω< ω0 and ω0< ω<∞. In the range of
normal dispersion, the refractive index is real, i.e., | 220 ωω − |>> γωi . When
ω=ω0, i.e., in the spectral range of absorption, the refractive index becomes
complex [27]:

38
iknn +=' , (5)
here k describes the absorption and relates with the absorption coefficient (α)
as follows [27]: λπα k4
= . Then, the dispersion relation for the real and the
complex parts of the refractive index becomes [27]:
( )22222
0
220
0
2
)(21
1ωγωω
ωω
e +−
−
+=
mNqn , (6)
2222200
2
)(21
ωγωω
γω
e +−
−
=
mNqk . (7)
Dispersion is anomalous when the refractive index is decreasing
when the frequency is increasing (in the spectral range around ω=ω0). The
real and the complex parts of the refractive index are related through the
Kramers-Kronig transform [27]:
Here n(∞) – asymptotic value of the refractive index when
frequency is approaching infinity, πων 2= and the P denotes Cauchy
principal value which allows calculating the value of the integral at 0νν =
[105]:
∫ ∫ ∫∞ − ∞
+→
−+
−=
−0 0 000
0
0
0
d)(d)(limd)( r
rr
FFFPω
ω
ννννν
νννν
ννν , (10)
here F(ω) is a complex function.
When analyzing the external reflectance, Kramers-Kronig
relations are used to calculate the phase change between the incident (r) and
the reflected (r‘) radiation. It is known from the Fresnel equations that for an
absorbing material, the amplitude of the reflected unpolarised radiation [27]:
∫∞
−+∞=
02
020 d)(2)()( ν
νννν
πν kPnn , (8)
∫∞
−∞−
−=0
20
20
0 d)()(2)( ν
ννν
πν
ν nnPk . (9)

39
11]exp[)(]exp['
2
2
++−+
===iknikniRirr δνδ , (11)
here δ is the phase change (-π≤ δ≤ π), )(νR - reflectivity; the incidence is from
air (refractive index n1=1) and normal (angle of incidence θ=00). It can be then
shown that [27]:
δcos211
2 RRRn
−+−
= , (12)
δδ
cos21sin2RR
Rk−+
−= . (13)
The phase change δ can be calculated through the Kramers-
Kronig relations as follows [27]:
∫∞
−−=
02
02
d)(ln2
)( 00 ν
ννν
πν
νδR
P . (14)
Having subsequently calculated the k, optical density is [27]:
lkD ννπν ~)(2)( = , (15)
here l is penetration depth.
Reliable analysis of specular reflectance spectra cannot be
accomplished without performing the KKT. However, real life sample rarely
yield ideal specular reflectance. Typically, many phenomena (such as
scattering, diffuse reflectance, reflectance from back surfaces, etc.) influence
the spectra [106]. In addition, the prerequisite to have an angle of incidence
equal to 00 in order to obtain the Equation 11 is not satisfied in the
Cassegranian optics used in the IR microscopes. For these reasons, use of the
KKT has been episodic. Appropriate use of the KKT for pre-processing
reflectance spectra of rough-surfaced samples – urinary stones – and
obtaining reliable information about their morphochemistry is within the
scope of this thesis and will be discussed in chapter 2.


Chapter 2 Vibrational spectroscopy analysis of urinary stones

42
2.1. Urinary stone disease
Urinary stone disease (urolithiasis) is a life-style related non-
communicable disorder. Despite the fact that recent study in England showed
a decrease in prevalence rates of urolithiasis [107], global literature still
reports increasing numbers of patients with kidney stones [108–110]. A
variety and complexity of processes influencing stone formation prevents
from tracing a single explanation of etiology and pathogenesis of the disease
which, in turn, causes lack of appropriate prevention measures [111–113].
The fact is confirmed by increasingly high recurrence rates of urolithiasis. As
some studies have shown, 30% to 40% of untreated patients will form a new
stone in 5 years’ time [112,114,115]. This has a significant impact on a quality
of life. Furthermore, the prevalence and incidence of kidney stone disease has
been increasing across the world throughout the 20th century. For example,
in the US the prevalence of the disease is approximately 10 % (13 % for men
and 7 % for women) which is a drastic increase from 3 % recorded in the
1964-1972 time period [112]. Developed, industrialized European countries
follow similar trends and urolithiasis is becoming a major health care problem
worldwide.
2.1.1. Formation of urinary stones: crystallization, aggregation and
growth
Urinary stones are mainly composed from calcium containing
minerals: calcium oxalates (whewellite (CaC2O4∙H2O) or calcium oxalate
monohydrate (COM) and weddelitte (CaC2O4∙2H2O) or calcium oxalate
dihydrate (COD)) and calcium phosphates (apatites (Ca5(PO4)3(F,Cl,OH)) and
brushite (CaHPO4∙2H2O)). These minerals account for approximately 80% of all
cases. Ten percent of the stones are constituted from struvite
(NH4MgPO4∙6H2O, a mineral originating from infection by bacteria that

43
possess enzyme urease), 9% - from uric acid (C5H4N4O3) and the remainder 1%
- from other substances such as cystine (C6H12N2O4S2), ammonium acid urate
(C5H7N5O3), drugs, etc. [116]. These rates vary according to geography, sex
and age [117].
An essential condition for the stone formation is oversaturation of
urine. It can be caused by some pathological conditions as well as dietary
habits of the patient. For instance, increased calcium oxalate oversaturation
may result from low urine volume or excessive excretion of calcium or
oxalate, or combination of these factors [116]. The oversaturation may
constantly vary in time and/or include several different components resulting
in multi-component stones. For the urine to be oversaturated with the rare
components, such as struvite, cystine or drugs, specific conditions are
required, whereas, oversaturation with calcium oxalate, phosphates and uric
acid can occur even in urine of healthy people. In these people, the
development of the stones might be prevented by crystallization inhibitors,
lack of crystallization centers or simply because the process is energetically
disadvantageous [118]. Thus, the oversaturation is essential but insufficient
condition to the stone formation.
There are three most important processes of urinary stone
formation: nucleation, growth and aggregation. During the stage of
nucleation, small crystals – crystallization centers – form. The nucleation can
be divided into primary if new crystals form in the oversaturated solution and
secondary if the nuclei form on the surface of pre-existing crystals. In turn, the
primary nucleation can be further subdivided into homogeneous, when
crystals are formed spontaneously in the volume of the solution, and
heterogeneous, when crystals form on a surface. The latter form of nucleation
is the most probable in urinary system [118].
During the stage of crystal growth molecules and ions in the urine
are transported into vicinity of the pre-formed nuclei and incorporated into

44
their lattice. The aggregation of the formed crystals is a process of them
clumping together during their constant collisions [118].
It is obvious that prohibiting the oversaturation of urine will, in
turn, prevent the crystallization. External prohibitors and inhibitors, such as
various urinary macromolecules affect the crystallization processes as well:
they can either prevent or induce nucleation, crystallization and/or
aggregation. For instance, albumin adsorbed on hydroxyapatite may induce
nucleation of calcium oxalate [118].
The above described processes determine chemical composition,
texture (shape and arrangement of crystal grains in the stone) and
morphology of urinary stones. Accordingly, the stones have been classified
into 7 main types and 22 subtypes [117], each relating to some specific
pathology. Therefore, analysis of stones texture and morphology as well as
determination of their chemical composition is of great importance for
treatment and prevention of urolithiasis. In the multicomponent stones, an
arrangement of areas of different chemical compositions could be a hint to
the history of stones growth.
2.1.2. Urinary stone analysis
Comprehensive analysis of urinary stones is important for effective
treatment and prevention of urolithiasis, especially in cases of residual and
recurrent stones. Large number of various physical and chemical methods has
been used for the analysis [119]. They are summarized in Table 2
[26,117,120–130]. None of the methods alone can provide full information
about the morphology, texture, chemical and mineralogical composition of
the stones. For instance, texture can only be determined by techniques such
as scanning electron microscopy or polarization microscopy. While chemical
methods provide information about atomic and molecular content of the
stones, ability to determine their exact mineralogical composition is limited.

45
Furthermore, in choosing a method for the urinary stone analysis one has to
pay attention to its availability and price.
Recently, three methods became the most popular for the stone
analysis: polarization microscopy, X-ray diffraction spectroscopy and IR
absorption spectroscopy [119]. These methods are discussed below in more
detail.
Polarization microscopy is a method based on interaction of
polarized light with crystals. Depending of the crystalline structure of the
analyzed material as many as 20 different properties such as color, shape,
refraction or birefringence can be observed. In addition to the low cost and
Table 2. Physical and chemical methods used for analysis of urinary stones and the
information they provide [26,117,120–130].
Methods
Information extracted
Morphology/
structure/
texture
Chemical composition
Mineralogical
composition Elemental
composition
Non-
crystal/organic
components
Optical microscopy
(stereomicroscopy) x
Chemical analysis
x x x*
Thermal gravimetry
x* x*
X-ray diffraction
spectroscopy x
Laser induced breakdown
spectroscopy (LIBS) x
x
Scanning electron
microscopy x
x*
Computer tomography x
x
FT-IR
(micro)spectroscopy/Ram
an spectroscopy
x*
x x
Polarization microscopy x
x
*only limited information can be obtained

46
rapidity, polarized microscopy has an advantage of capability to identify
structures as small as 5 μm. However, experienced and skilled scientists are
required to perform subjective analysis. Furthermore, while differentiation of
COM from COD is relatively simple, some crystals such as calcium phosphates
are difficult to identify [119,131]. Therefore, polarized microscopy is not used
as a standalone technique for the urinary stone analysis, but rather as a
complement to other methods [113,123].
X-ray diffraction spectroscopy is based on X-ray diffraction on
crystal lattice. The diffraction pattern corresponds to reciprocal lattice of the
crystal and is described by Bragg’s equation:
λmΘd =sin2 , (22)
here d is the distance between crystal planes, Θ – diffraction angle, m –
positive integer, λ – wavelength. Powdered urinary stone samples are usually
analyzed with this method [122]. Although the method provides precise
quantitative information about crystalline composition of urinary stones,
amorphous components cannot be detected. An important advantage of X-
ray diffraction spectroscopy is that the analysis can be automated [131].
However, high price and long measurement time prevents this method from
being used routinely.
For a more detailed analysis of urinary stones, synchrotron
radiation based X-ray microtomography (SR-µCT) has been applied [132]. The
method allowed determining texture, chemical composition and
microstructure of urinary stones while keeping them intact. While this
technique could not be used routinely, it allows reconstructing formation path
of selected stones. It has been particularly useful for identification and
characterization of Randall’s plaques – subepithelial calcifications constituted
from calcium apatite – which are known to be initial growth centers of the
stones [133–136].

47
Dual energy CT has also been used to detect and characterize the
urinary stones in vivo [126]. The types of the stones can be precisely
determined by using this technique (except for the stones constituted from
mixtures of uric acid and hydroxyapatite). However, this technique is still to
be validated and its clinical impact determined.
Vibrational spectroscopy, infrared absorption spectroscopy in
particular, has become one of the most popular methods for urinary stone
analysis due to its availability, rapid and precise identification of constituents,
possible automation and low costs [119]. Since application of vibrational
spectroscopy methods for urinary stone analysis is within the scope of this
thesis, they will be described in more detail in the next chapter.

48
2.2. Vibrational spectroscopy applications to urinary stone analysis
2.2.1. IR absorption spectroscopy of urinary stones
Infrared absorption spectroscopy has become one of the most
popular methods for urinary stone analysis due to its availability, rapid and
precise identification of constituents, possible automation and low costs
[119]. It has been used both as a stand-alone method [137–139] and as a
complementary technique to X-ray spectroscopy, thermogravimetry, SEM,
etc. [127,128,140]. The method has been shown to provide reliable
information about chemical composition of both crystalline and amorphous
constituents of the stones. Crystalline phases, such as COM and COD, can be
distinguished. Moreover, in frequent cases of multicomponent stones
quantitative analysis can be performed. However, a rather time consuming
sample preparation for transmission measurements has prevented the
method from becoming routine.
To solve the problem of complex sample preparation, there have
been several attempts to apply ATR IR spectroscopy both for qualitative and
quantitative analysis of urinary stones [141–143]. In these studies pulverized
stone samples are pressed to the ATR element to record IR spectra. Their
analysis provides similar or superior qualitative and quantitative information
as the spectra recorded using KBr pellet technique. Since less sample
preparation is required for the ATR IR spectroscopic method, it has been
concluded to be favorable for urinary stone analysis. However, more
investment is needed as ATR accessories for IR spectrometers are costly.
Major disadvantage of both KBr pellet and ATR techniques is that
the stone is pulverized during sample preparation. For complete description
of urinary stone type, full information about its morphology, structure and
chemical composition is required [117,144,145]. Infrared spectroscopic
imaging (mapping) of cross-sectioned urinary stones is capable of

49
simultaneously providing information about both their chemical composition
and structure. IR spectroscopic imaging studies of rigid biological samples
such as bones or calcified inclusions in biological tissues are performed in
transmission mode [146]. Thin (less than 10 µm) sections of the samples were
obtained by using a microtome. However, this technique is not very well
suited for the urinary stones due to their brittleness. Some later studies were
devoted to applying reflectance mode of the IR microscope for the imaging of
calcium oxalate stones [26,132,147]. The authors of these papers showed that
spectral information from specularly reflected infrared light can be used for
qualitative analysis with the same success as KBr pellet (transmission) or ATR
techniques. However, distortions of spectral bands (Reststrahlen bands) of
specular reflectance spectra were neglected in the former studies which may
introduce error to the images. The Reststrahlen bands in the specular
reflectance spectrum resemble first derivative of the absorption spectrum
and they are shifted towards lower wavenumbers. Such distortions can
introduce serious errors when integral intensities of the Reststrahlen bands
are used for estimation of concentration of some chemical compound in
particular spot of the imaged surface. This is particularly true in case of the
band overlapping. Contour of the overlapped Reststrahlen bands due to the
first derivative feature is complicated and the bands are hardly
distinguishable. Intensity of the adjacent bands is also influenced by the first-
derivative effect. The prerequisites of having pure specular reflection signal
recorded at 00 angle of incidence prevents standard Kramers–Kronig
transform from being used to correct the spectra.
2.2.2. Raman scattering spectroscopy of urinary stones
Raman scattering spectroscopy is not nearly as much used for the
urinary stone analysis as IR absorption spectroscopy. In most of the studies it
has been used solely as a complementary technique to the latter [128,148].

50
The main reason for that is the fluorescence signal from the stones usually
obscuring the Raman scattering signal. On the other hand, Raman scattering
spectroscopy has several advantages over IR absorption spectroscopy: it does
not require any sample preparation to obtain the spectra, there are
commercial hand-held Raman scattering spectrometers that can be used for
routine analysis, fiber optics could be used for analysis in vivo [149]. For this
reason, there is now an increasing number of studies that propose Raman
scattering spectroscopy as a method of choice for the urinary stone analysis
[150,151,129].
Raman scattering microscopy with He-Ne laser excitation
(632.8 nm) was used for identification of urinary stone composition from
urine powder after the stone was broken by ureteroscopic lithotripsy [150].
The stone samples were photobleached to avoid fluorescence and the main
components of the stones could be qualitatively identified. Although reliable
quantitative analysis was not feasible due to limited sampling, the method
was demonstrated to be useful for immediate stone analysis after their
removal procedures.
Similar results were obtained and automated analysis of urinary
stones was developed by A. Miernik et al. [151]. In this study, 532 nm and
785 nm excitation were used and the fluorescent background was
mathematically removed prior analysis. Both major and minor components
could be identified which shows the potential of the technique. In the
subsequent paper the author tested the possibility of using a commercial fiber
optics used for endoscopic treatment of urolithiasis for urinary stone analysis
in vivo [149]. Although the results showed that the currently used fibers are
unsuitable for such purpose, the study provided useful information for further
development of such systems.

51
2.3. Urinary stone analysis: experimental details
2.3.1. Sample preparation of urinary stones
Urinary stones were obtained from Vilnius University hospital
Santariskes clinics Urology Centre (authorization from Vilnius Regional
Biomedical Research Ethics Committee for biomedical research No. 158200-5-
053-056LP1). Firstly, they were inspected by using optical stereomicroscopy
(Stemi 2000C with AxioCam ERcSs video camera, Carl Zeiss, Oberkochen,
Germany) and, according to morphological features, pre-assigned to one of
the possible types and subtypes [117]. The stones which were intact during
their removal procedure were checked for specific features which were then
analyzed by recording Raman scattering spectra. No sample preparation was
necessary for Raman scattering spectroscopy experiments of urinary stones.
Then, the intact stones were cross-sectioned. The direction of the section was
chosen according to the stone’s morphology. For example, papillary stones
with a visible Randall’s plaque were sectioned perpendicularly to the plaque.
One half of the stone was used to perform IR/Raman/CARS chemical imaging.
For the measurements, it was fixed on a glass microscope slide using two-
component epoxy and polished gently in order to obtain flat surface. Sand
paper of various roughnesses (P220, P240 or P400) and/or polishing glass
(originally intended to polish optical windows for infrared spectroscopy) was
used for the polishing. After the polishing, the stones we cleaned with
acetone using a cotton swab. Unless displaying any exclusive morphological
features, both halves of the stone were assumed to have identical chemical
composition; thus, the second half was used to perform qualitative and
quantitative analysis by means of IR absorption spectroscopy. The samples for
the latter were prepared by using KBr (potassium bromide) pellet technique:
the stone sample is grinded using an agate mortar and pestle and mixed with

52
a KBr powder in ratio 1:100 (2 mg:200 mg) and the mixture is pressed into a
pellet with a manual hydraulic press (Specac, Orpington, England) under
740 MPa pressure. The stones which were broken during their removal
procedure were also checked for the distinct features (which were the
analyzed by Raman spectroscopy) and subsequently grounded to prepare the
KBr pellets.
Samples for the FIR absorption measurements were prepared by
polyethylene (PE) pellet technique: the stone sample is grinded using an agate
mortar and pestle and mixed with a PE powder in ratio 1:50 (2 mg:100 mg)
and the mixture is then placed into the die of manual hydraulic press (Specac,
Orpington, England). The stainless steel parts of the die were pre-heated to
approx. 1500 C. The die with the sample were placed in an oven (pre-heated
to approx. 2000 C) and kept until the temperature of its outer surface reached
1500 C again. At this point, the inner temperature of the die had reached the
melting temperature of the PE (approx. 1360 C). The die was then placed
under the press and the sample pressed into a pellet under 370 MPa
pressure.
2.3.2. FTIR absorption spectroscopy of urinary stones
Infrared absorption spectra were recorded by using FTIR
spectrometer Vertex 70 (Bruker Optik GmbH, Ettlingen, Germany) equipped
with globar light source, KBr beamsplitter and liquid nitrogen cooled MCT
detector. The spectra were recorded in 3900-650 cm-1 spectral range with
spectral resolution of 6 cm-1. For the resultant spectrum, 128 interferograms
were averaged and Fourier transformed into a spectrum applying Blackmann-
Harris 3 apodization function and zero filling factor 2.

53
2.3.3. FTIR reflection microspectroscopy of urinary stones
Infrared reflectance spectra were obtained using infrared
microscope ’Hyperion 3000’ (Bruker Optik GmbH, Ettlingen, Germany)
equipped with a single element MCT detector and combined with Vertex 70
spectrometer (Bruker Optik GmbH, Ettlingen, Germany). A 15x/0.4 objective
was used. Knife edge aperture was fully open when collecting the spectra.
Over 1500 spectra were collected from one stone while mapping the surface
of the cross-section by means of motorized micrometer stage. The step size
between the scanned points was set to approximately 100 µm (for the rare
cases of large stones, the step was increased in order to adjust the
measurement time to the working time of the detector (approx. 9 h)). The
spectra were recorded in 3500-650 cm-1 spectral range with spectral
resolution of 6 cm-1. Thirty two interferograms were averaged for one
resultant spectrum of each point and the result Fourier transformed into a
spectrum applying Blackmann-Harris 3 apodization function and zero filling
factor 2.
2.3.4. FIR absorption spectroscopy of urinary stones
FIR absorption spectra were recorded by using FT-IR spectrometer
Vertex 70 (Bruker Optik GmbH, Ettlingen, Germany) equipped with globar
light source, wide range MIR-FIR beamspliter and DTGS detector. The spectra
were recorded in 680-30 cm-1 spectral range with spectral resolution of
8 cm-1. For the resultant spectrum, 128 interferograms were averaged and
Fourier transformed into a spectrum applying Blackmann-Harris 3 apodization
function and zero filling factor 4.
2.3.5. FIR reflection microspectroscopy of urinary stones
FIR microspectroscopy experiments were carried out at the MAX-IV
laboratory in Lund, Sweden. Sets of reflectance spectra for the chemical

54
imaging in the FIR spectral region were obtained using FTIR microscope
’Hyperion 3000’ (Bruker Optik GmbH, Ettlingen, Germany) connected to the
IFS 66v FT-IR spectrometer equipped with multi-layer Mylar 6 µm
beamsplitter. Synchrotron radiation was used for the FIR microspectroscopy
experiments. A general Purpose 4.2K Si Bolometer System (Infrared
Laboratories, Tucson, USA) was used to record the spectra. The microscope is
equipped with plastic chamber purged with nitrogen gas to avoid the
influence of atmospheric water absorptions to the spectra. The mapping
parameters were selected the same as for the MIR microscopy
measurements. The spectral acquisition parameters were as follows: the
spectra were recorded in 700 – 150 cm-1 spectral range, 128 interferograms
were averaged and the result was Fourier transformed into a spectrum
applying Blackman-Harris 3-Term apodization function and zero filling factor
of 4. Spectra were recorded with 8 cm-1 spectral resolution. It took
approximately 14 hours to perform the mapping in the FIR spectral region
(the time varies depending on the size of the stone, i.e., on the number of
measurement points).
2.3.6. Raman scattering spectroscopy of urinary stones
The Raman spectra were recorded with FT-Raman spectrometer
‘MultiRAM’ (Bruker Optik GmbH, Ettlingen, Germany) equipped with Nd:YAG
laser source (λ=1064 nm, Pmax=1 W) and liquid nitrogen cooled Ge
(germanium) diode detector Gold plated mirror objective (focal length –
33 mm) was used. Diameter of the laser beam at its focal point is 100 μm. For
the mapping of the stones, the parameters were selected the same as for the
MIR microscopy measurements. To obtain each Raman spectrum, 128
interferograms were averaged and the result was Fourier transformed by
applying Blackman-Harris 3-Term apodization function and zero filling factor
of 2. The 4 cm-1 spectral resolution was used. Laser power was adjusted

55
according each sample to avoid burning. The time needed to perform Raman
imaging is approximately 40 hours. For this reason, images of few stones were
only used as reference for FTIR imaging results.
2.3.7. Nonlinear optical microscopy of urinary stones
Nonlinear optical microspectroscopy experiments were carried out
in Dresden University of Technology, Dresden, Germany. Two erbium fiber
laser sources were used for the nonlinear optical imaging. They were spatially
and temporally overlapped by using a dichroic beam combiner and a delay
line, respectively. The “pump” laser (Femto Fiber pro NIR from Toptica
Photonics AG, Gräfelfing, Germany) emits NIR radiation at 781.5 nm with
pulse duration of 1.2 ps and maximum power of 100 mW. The “Stokes” laser
(Femto Fiber pro TNIR, also from Toptica Photonics AG) which is tunable and
has pulse duration of 0.8 ps was set to 1005 nm or 857 nm resonantly
addressing the symmetric stretching vibration of methylene at 2850 cm-1 or
mixed C-O, C-N, C-C vibrations of uric acid at 1121 cm-1, respectively. The
emitted power is 1.5 mW at 1005 nm and 12 mW at 857 nm. Multiphoton
images were acquired by an upright microscope Axio Examiner Z.1 equipped
with scanning module LSM 7 (all from Carl Zeiss AG, Jena, Germany) and non-
descanned detectors. The nonlinear signals were acquired in reflection mode
using band-pass filters. A band-pass filter with band 633-647 nm was used to
select the CARS signal corresponding to the Raman band at 2850 cm-1, and
one with band 670-754 nm was used for acquisition of the CARS signal
corresponding to the Raman band at 1121 cm-1. A band-pass filter with band
381-399 nm was used to acquire SHG. Green TPEF was acquired in the range
500 – 550 nm. A W Plan – Apochromat water immersion objective of 20x and
NA=1.0 was used. The laser power in the focus is 50% of the nominal laser
power. Tile scan mode was used for acquisition of large images. Z stacks

56
followed by a maximum intensity projection were used to compensate for
lack of planarity of sample surface.
2.3.8. Spectral analysis of urinary stones
Assignment of the recorded IR absorption spectra was performed
by comparing them with reference spectra of pure components (COM (Fluka),
uric acid (Fluka), hydroxyapatite (Sigma Aldrich) and l-cystine (Sigma Aldrich)).
The reference spectra were obtained by using the same experimental
conditions as spectra of the urinary stone samples. Reference spectra of
struvite, fluorapatite, COD and other rare components were obtained from
online spectral libraries [152,153].
When possible, relative concentrations urinary stones’ constituents
were determined by calculating integral intensities of characteristic spectral
bands and dividing them by corresponding integral intensities of spectral
bands in the reference spectra of synthetic components.
The KKT of the reflectance spectra of urinary stones was performed
using MATLAB package (Version 7.9, The MathWorks, Inc., USA). When
performing the KKT of spectra, an offset was added to all the intensity values
if necessary. This is reasoned by the fact that if the reflectance is close to zero,
due to the )(ln νR term in the Equation 14, the integral becomes singular
[27]. The spectra which were collected beyond the borders of the stone’s
surface and which carry no information about the sample were not corrected.
Subsequently to the KKT, baseline correction (rubber-band method) was
applied to the spectra.
The prerequisite to obtain the Equation 11 is for the angle of
incidence to be 00. The IR microscope objective used in this work yields a solid
angle of incidence of approximately 230. However, the use of the Kramers-
Kronig relations is still valid for the urinary stone samples which have
refractive index Re(n) that varies between 1.2-1.6 and extinction coefficient

57
Im(n) that varies between 0.01-0.3. For these values, reflectance of non-
polarized radiation remain nearly constant in the angle range between 0 – 300
[154].
2.3.9. IR and Raman chemical imaging of urinary stones
IR and Raman chemical images of urinary stones were obtained by
calculating integral intensity of spectral band, characteristic to a chemical
component of interest. A specific color was then assigned according to the
numerical value of the integral intensity. The procedure is repeated for all the
spectra of the cross-section and a map, representing the distribution of
integral intensities across the surface, is constructed. The procedure was
performed using MATLAB package (Version 7.9, The MathWorks, Inc., USA).
The chemical images were also obtained by using HCA. It was
applied to the vector normalized reflectance spectra in the 1800-650 cm-1
spectral region (“fingerprint” region). Euclidean distances between the
spectra were calculated, and then Ward’s algorithm was used to group the
data. The number of clusters was selected in advance according to the a priori
knowledge about chemical composition of the stone acquired from the
transmission measurements. In some cases, the analysis of the reflectance
spectra allowed identifying additional components in the stone, not predicted
by the transmission measurements due to their minor amounts. The number
of classes for the HCA was then varied accordingly. Each cluster was assigned
with some specific color and chemical maps were formed. The HCA analysis
was performed and corresponding chemical maps were constructed using
OPUS software (Bruker Optik GmbH, Ettlingen, Germany).

58
2.4. Urinary stone analysis: results and discussion
Comprehensive analysis of urinary stones is important for effective
treatment and prevention of urolithiasis, especially in cases of residual and
recurrent stones. For this reason, in this work we applied and evaluated
potential of various vibrational spectroscopy methods (IR (microspectroscopy
in MIR and FIR spectral regions, Raman scattering spectroscopy and
multimodal CARS microscopy imaging) for morphochemical analysis of human
urinary stones.
Urinary stones were firstly analyzed by optical stereomicroscopy.
The stones were classified according to their morphology and subsequent
analysis routine was ascribed. The stones obtained in this work were either
intact (single or multiple stones) or broken during their removal procedure.
Morphology of the intact stones provides information about whether the
stone grew attached or loose in the urinary system. Signs of papillary
umbilication possibly hosting a Randall‘s plaque suggest the former while
uniform smooth surface – the latter. In Figure 5 A-C, typical papillary COM
Fig. 5. Typical pappilary urinary stones constituted from COM.

59
stones are presented. The apatite plugs are, however, missing from the
surface dip (marked by arrows). In the Figure 5 D, the apatite deposition
(marked by arrow) is visible on the tip of the COM stone with depressed
surface typical to papillary stones. The reddish layer around the deposit is
bilirubin.
The stones in Figure 6 have smooth and glossy surface with color
varying according to their chemical composition: yellow to orange is typical to
uric acid while beige to dark brown – to COM. The smooth and glossy surface
is a result of rubbing between multiple stones confined in the same
anatomical site in urinary tract [117].
Information about latest stages of urinary stones’ growth can be
obtained by analyzing distinct features on their surface (such as shown in
Figure 7 and Figure 8) by Raman scattering spectroscopy. For this, laser
radiation was directed to the selected ROI and the scattering signal was
recorded. The white sharp crystals on the surface of the stones presented in
Figure 7, were identified as COD by Raman scattering spectroscopy (Fig. 7 D).
Presence of such crystals suggests that the stones were in a phase of active
formation before their removal from the patients’ organisms [145,155]. Small
translucent crystals on the surface of another COM stone (Fig. 8) were
determined to be sucrose. It has been shown that increased amounts of
sucrose in human organism can increase calcium concentration which in turn
causes stone formation [116]. The whitish surface of this stone also suggests
recent depositions of COM [117]. In the latter case, the use of Raman
Fig. 6. Urinary stones with smooth surface constituted from (A) uric acid and COM, (B, C).

60
Fig. 7. Urinary stones constituted from COM and sharp crystals of COD deposited on
their surface (marked by arrows). Raman scattering spectrum of COD in D was
recorded from the area marked by arrow in C.
Fig. 8. Urinary stone constituted from COM; on its surface, small crystals of sucrose are
visible (marked by arrows). In the Raman scattering spectrum of the crystals (on the
right) both spectral bands of sucrose and COM are visible; the latter are marked by
asterisk.

61
spectroscopy subsequent to the visual investigation is fundamental. If the
stone was ground, the small amounts of sucrose could not be detected as the
absorption of COM would be overwhelming.
Most of the information that can be extracted from inspecting
morphology of urinary stones is lost when they are broken during their
removal procedure. However, they can still be attributed to a certain type
according to their color and other features such as packing of crystals. Figure
9 A and B shows two types of COM stones. The stone in A is lighter brown and
has an unorganized crystal structure as compared to the stone in B.
Differences in color and crystal organization is suggestive of the environment
the stone was growing in, growth rate and, most importantly, underlying
disorders [117,145]. Therefore, morphological examination of urinary stones
is of great importance not only for planning further course of study but for
predicting diagnosis as well. Uric acid stone of yellow-orange color is
presented in Figure 9 C. Debris of the broken stones may still contain some
distinct features that can be separately analyzed by Raman scattering
spectroscopy. For instance, a clot of blood could be identified in the COM
stone presented in Figure 9 D (marked by arrow). Since minerals constituting
urinary stones typically have strong absorbance, even larger amounts of
organic substances (such as blood) may remain unidentified if the stone is
ground. Thus, the use of Raman scattering spectroscopy is of great
Fig. 9. Urinary stones that were broken during their removal procedure. The stones are
constituted from: (A, B and D) COM, (C) uric acid.

62
importance for identification of all constituents of both intact and broken
urinary stones.
The visually inspected urinary stones were further investigated by
FTIR absorption spectroscopy. One half of the intact stones or whole broken
stones were analyzed. The results of the 403 stones analysis are presented in
Figure 10. The graph summarizes prevalence of different types of urinary
stones in Lithuania. Calcium oxalate stones include all stones the major
constituent of which is COM, COD or their mixture. Minor amounts of
phosphates – various apatites or amorphous calcium phosphates (ACP) –
might be present in these stones as well. In accordance with the literature
results [156], it can be seen that calcium oxalate urinary stones are the most
common type of stones with prevalence value of 61 %. However, this
percentage is lower as compared to the 70-80 % observed in countries such as
USA or Germany [156–158]. Major component in uric acid stones is uric acid,
Fig. 10. Chemical composition of human urinary stones as determined by means of IR
absorption spectroscopy of 403 stone samples; the graph represents prevalence of
calcium oxalate, uric acid, struvite, apatite and brushite stones in Lithuania.
Calcium oxalate stones 61%
Uric acid stones 26%
Struvite stones 10%
Apatite stones
1%
Brushite (+apatite)
stones 2%

63
possibly with COM or other minerals as minor constituents. They are less
common and comprise 26 % of all urinary stones. This percentage is
unexpectedly high as compared to the literature values of 10-15 %. The
prevalence of struvite (10 %), brushite (2 %) and apatite (1 %) stones are in
accordance with the literature [156].
In many cases minor components remain unidentified by FTIR
absorption spectroscopy unless they are mechanically separated from the
major components during the visual investigation. This is particularly true for
uric acid stones mixed with minor amounts of other components since uric
acid has strong absorbance and many spectral bands in the MIR spectral
region. Therefore, we expanded the spectral region used for analysis to FIR.
Spectral bands in the FIR spectral region provide information about low
frequency vibrations of heavy atoms as well as phonon modes of crystal
lattices [159].
The recorded FIR absorption spectra of COM, COD, uric acid,
hydroxyapatite, struvite, ACP and brushite are presented in Figure 11.
Characteristic spectral bands can be observed for all crystalline minerals.
Some of them (marked by arrows) could be assigned to characteristic
molecular vibrations according to the literature [160–166]. Most bands below
400 cm-1, however, remain unassigned. In crystals, spectral bands of lattice
vibrations are found in this spectral region.
In the FIR spectral region, two hydration states of calcium oxalate –
COM and COD – can be discriminated from each other by spectral bands at
395 cm-1 and 152 cm-1 observed in the COD spectrum. On the other hand,
struvite and ACP have very similar spectral bands; thus it is difficult to
differentiate between the two components.

64
Fig. 11. FIR absorption spectra of mineral components the most frequently found in
urinary stones. Some of the spectral bands in the spectra (marked by arrows) could be
assigned to molecular vibrations as described in the literature [160-166].

65
Normalized MIR and FIR absorption spectra of urinary stone
constituted from uric acid and COM are compared in Figure 12. Spectral
bands which are characteristic to each chemical component and which were
later used to produce chemical images are denoted by dotted lines. In the
spectra of the stone (Fig. 12 A, B (top)), spectral bands of the stone’s
constituents are much better separated in the FIR spectral region than they
are in the MIR spectral region. In the latter, bands of COM (ν(C=O) at
1625 cm-1, ν(C-O) at 1318 cm-1, δ(O-C=O) at 782 cm-1 [167]) and uric
acid (ν(C=O) at 1673 cm-1, δ(O-H) at 1301 cm-1, ring vibration at 1121 cm-1,
δ(N-H) at 783 cm-1 [161]) are of similar intensities and are highly overlapped.
For this reason, small amounts (approximately curic acid > 4∙ccalcium oxalate) of COM
could hardly be identified from the MIR spectra. Meanwhile, in the FIR
spectral region, the band at 274 cm-1 assigned to γ(O=C-C=O) of COM [160]
can be clearly distinguished as the spectral bands of uric acid absorption in
this region are weak. Similarly, the presence of uric acid is determined by
distinctive absorption bands in the 700 – 550 cm-1 spectral region.
Quantitative analysis of urinary stones could only be performed for
urinary stones, constituted from those chemical components which had their
Fig. 12. MIR (A) and FIR (B) absorption spectra of urinary stone constituted from COM
and uric acid (top) and spectra of corresponding synthetic components (middle and
bottom); red dotted lines mark spectral bands characteristic to COM and uric acid.

66
synthetic counterparts the spectra of which could be recorded in our
laboratory. The analysis was performed as described in section 2.3.8. The
accuracy of the quantitative analysis in both MIR and FIR spectral regions is
defined by the accuracy of the calculations of the integral intensities. It is
approximately 5 % as determined by performing quantitative analysis of
mixtures of synthetic minerals – COM and uric acid – in various
concentrations.
2.4.1. IR chemical imaging of urinary stones: modified KKT correction of
reflectance spectra
In the external reflectance measurements, the spectral band
shapes are affected by the dispersion of refractive index. The dispersion
affected spectral bands, or Reststrahlen bands, appear as first derivative of
absorbance spectral bands: they acquire negative values at the high
frequency side and their peak position is red shifted. Such distortions
introduce error into the chemical images formed by calculating integral
intensities of the Reststrahlen bands. When the recorded reflection signal is a
sum of both specular and diffuse reflections standard KKT procedure cannot
be used to correct the distortions due to assumption made during derivation
of the relations. In this work, we firstly made an attempt to modify the KKT
correction procedure by subtracting the diffuse reflection component from
the reflectance spectra of cross-sectioned calculi prior the transform. The
correction procedure was applied to the relevant spectral bands in the
spectra (the bands specific to a particular chemical component in the stone,
not overlapping with spectral bands of other components in the spectra of
mixed stones) only. Corresponding bands from the IR absorption spectra of
the pure components, obtained employing KBr pellet technique, were used
for the subtraction. The remaining specular reflection component was then
corrected by applying the KKT. Finally, in order to retain spectral information,

67
the corrected specular reflection component was combined with the
subtracted diffuse reflection component. The amount of diffuse reflection
that had to be subtracted was determined iteratively: the diffuse reflection
contour was multiplied by a constant which was varied until the peak position
and the contour symmetry after the KKT resembled those of the spectral band
in the absorption spectrum. Such constant was found for each spectrum in
the data set. The outliers were omitted from the correction and their integral
intensities were automatically assigned to zero (block scheme of the
procedure is presented in the Appendix I Fig. AI-1).
Spectral band at 1318 cm-1 (symmetric C-O stretch in COM [167])
taken from the reflectance spectrum of the urinary stone constituted from
COM and uric acid recorded in the area of COM is presented in Figure 13. The
spectrum in A shows the band in the raw reflectance spectrum while the
Fig. 13. Reflectance (A), KKT calculated absorbance without (B) and with (C) prior diffuse
reflection subtraction and absorbance (D) spectral bands of COM at 1318 cm-1.
Reflectance spectrum in (A) was recorded in the area of COM in the cross-section of
urinary stone constituted from COM and uric acid. Absorbance spectrum is recorded by
preparing synthetic COM powder for transmission measurements by KBr pellet
technique.

68
curve in B represents the band corrected by applying the KKT without any pre-
processing. It can be seen that the band shape and the peak position does not
match the COM absorption band (Fig. 13 D). The difference and the blue shift
of the band could be explained by the influence of the diffuse reflection [31].
Normally, Reststrahlen spectral bands are red shifted comparing them to the
absorption spectral bands. The KKT restores the peak positions. However, in
this case, the influence of the diffuse reflection blue shifts the Reststrahlen
bands causing the KKT to overestimate the peak position. As a result, the
calculated band appears blue shifted comparing it with the absorption
spectral bands. The same band corrected by applying the modified KKT
method when the diffuse reflection component is subtracted from the
recorded reflectance spectrum is presented in Figure 13 C. In this case, the
peak position is restored and the first-derivative like dispersion contour
Fig. 14. Reflectance (A), KKT calculated absorbance without (B) and with (C) prior diffuse
reflection subtraction and absorbance (D) spectral bands of uric acid at 1121 cm-1.
Reflectance spectrum in (A) was recorded in the area of uric acid in the cross-section of
urinary stone constituted from COM and uric acid. Absorbance spectrum is recorded by
preparing synthetic uric acid powder for transmission measurements by KBr pellet
technique.

69
corrected to correspond with the absorption band (Fig. 13 D). The same
results were obtained for the spectral band of uric acid at 1121 cm-1 assigned
to ring vibrations (Fig. 14) [161].
The optical and IR chemical images of the urinary stone are
presented in Figure 15. Characteristic spectral bands were selected to be used
for the chemical imaging: the band at 1318 cm-1 for COM and the band at
1121 cm-1 for uric acid. The area of the cross-section is approximately 9×8 mm
and it was mapped using ~300×300 µm step of the microscope xyz-stage. By
comparing the images obtained by calculating the integral intensity of
spectral bands in the raw spectra (Fig. 15 B, C) and in the corrected spectra
(Fig. 15 D, E) it can be seen that the latter corresponds better with the optical
image than the former. In addition, the contrast is higher and the boundaries
between layers of uric acid and COM can be separated more precisely. As it
Fig. 15. Optical (A) and IR chemical (B-E) images of urinary stone constituted from COM
and uric acid. (B) and (C) shows distribution of COM and uric acid respectively as
determined by calculating integral intensity of characteristic spectral bands in the raw
spectra; (D) and (E) shows distribution of COM and uric acid respectively as determined
by calculating integral intensity of characteristic spectral bands in the KKT corrected
spectra after the subtraction of diffuse reflection.

70
was found that applying the KKT to the raw reflectance spectra without the
subtraction procedure yielded asymmetric bands, corresponding chemical
images were not constructed.
Similar results were obtained for urinary stones with different
chemical compositions (refer to Fig. AI-2 – AI-7 in the Appendix I). Contrast of
chemical images of COM and uric acid in the cross-sectioned stones were
improved in the most of cases. However, applying the correction procedure to
spectral bands of apatite did not provide the expected results. Chemical
images obtained by calculating the integral intensity of spectral bands in the
corrected spectra were highly distorted. This could be explained by the fact
that the shape of the contour of the characteristic spectral band assigned to
PO4-3 vibrations in apatite is different in the IR absorption spectra of synthetic
mineral and in the stones. This is due to the fact that the synthetic mineral is
highly crystalline which gives rise to sharper spectral bands. On the other
hand, apatite in urinary stones is less structured or even amorphous which
gives rise to broader spectral bands. Subtraction of such differently shaped
contours in order to account for the diffuse reflection signal in the reflectance
spectra is not appropriate and causes distortions in the chemical images of
apatite. The one exception to this is presented in Fig. AI-4 (Appendix I).
Apatite spectral bands in this particular stone were of similar shape as the
band of the synthetic mineral; thus contrast in the corrected image of apatite
in the cross-section of this stone is improved. Apatite can be well
distinguished in the other chemical images obtained by calculating the
integral intensity of spectral bands in the raw spectra. This is reasoned by the
fact that the characteristic spectral band of apatite is broad and less
influenced by the diffuse reflection as it lies in the spectral region of lower
wavenumbers (1036 cm-1, PO4-3 stretch) as compared to the characteristic
spectral bands of COM and uric acid.

71
2.4.2. IR chemical imaging of urinary stones: MIR vs. FIR
Despite the fact that the diffuse reflection subtraction procedure
followed by the KKT provided improved chemical images of urinary stones as
compared to the images created from the raw reflectance spectra, this
modification requires performing complex mathematical operations and data
pre-processing. Further we show that expanding the wavelength region which
is used fo r the chemical imaging to FIR can simplify the spectral analysis.
Standard KKT procedure implemented in most of spectral analysis software
packages can be used to correct the Reststrahlen bands in the FIR spectra.
The KKT corrected spectra can then be used for the chemical imaging.
Firstly, cross-sectioned urinary stone constituted from uric acid and
COM (the same as presented in section 2.4.1.) was studied by means of
confocal optical profilometer in order to determine the dimensions of
Fig. 16. (A) Optical image of urinary stone constituted from COM and uric acid; the red
box in the image indicates a ROI which was analyzed by optical profilometer. (B)
Enhanced optical image of the ROI indicated in (A). (C) 3-D topology of the ROI as
obtained by the optical profilometer. (D) One dimensional profile of a diagonal section
(from right upper corner to left down corner) in (C).

72
irregularities of its surface. Several regions of interest (ROI) were analyzed.
For one of the selected ROI, the 3-D topology and one-dimensional profile of
its diagonal section are presented in Figure 16 C, D. The size of the
irregularities of the stone’s surface was determined to vary in the range of 2 -
20 µm. It is notable, that the influence of surface roughness to the reflected
light depends on the ratio between the size of the irregularities and the
wavelength of the incident radiation [168]. In this context, the surface is
considered rough and the diffuse reflection – strong, if the wavelength is
close to the size of the irregularities, and vice versa - the surface is “mirror
like” and the diffuse reflection is weak, if the wavelength is much larger than
the size of the surface roughness. In case of the investigated stone, the
Fig. 17. Reflectance (top), KKT transformed reflectance (middle) and absorbance
(bottom) MIR (A, B) and FIR (C, D) spectra characteristic to COM (left) and uric acid
(right). Characteristic spectral bands for the both components in both spectral regions
(refer to the main text) are marked by red dotted lines.

73
wavelength of MIR radiation (2.5 – 25 µm) has the same order of magnitude
as the irregularities of the surface of the stone. Because of that, the recorded
reflection signal contains a considerable part of diffuse reflection which
should be subtracted from the data prior further analysis. On the other hand,
the wavelength of FIR radiation (25 – 1000 µm) is larger than the roughness of
the surface. Therefore, the contribution of the diffuse reflection to the
specular reflection signal is then significantly lower and negligible.
To obtain the chemical images by calculating integral intensities,
characteristic spectral bands (in both MIR and FIR spectral regions) were
selected as follows: ν s(C-O) vibration band at 1318 cm-1 for COM (integration
limits 1215 - 1415 cm-1), ring vibrations’ band at 1121 cm-1 for uric acid
(integration limits 1038 - 1143 cm-1), γ(O=C-C=O) band at 274 cm-1 for COM
(integration limits 195 - 360 cm-1) [160] and γ(N-H) - at 472 cm-1 for uric acid
(integration limits 411 - 490 cm-1) [169]. KKT transformed reflectance and
absorbance MIR and FIR spectra characteristic to COM and uric acid are
presented in Figure 17. As already discussed in the previous section, due to
influence of the diffuse reflection, the KKT transformed bands in the MIR
spectral region (Fig. 17 A, B (middle)) are asymmetric and different from the
bands in the absorption spectrum (Fig. 17 A, B (bottom)). On the other hand,
the spectral bands in the FIR spectrum are restored correctly by the KKT
(Fig. 17 C, D (middle)) and reproduce the bands in the reference spectrum
obtained by PE pellet technique (Fig. 17 C, D (bottom)). Of note, in the FIR
reflection spectrum of uric acid, the relative intensities of spectral bands in
the 700 – 550 cm-1 spectral region are changed as compared to the FIR
absorption spectrum. This can be explained by the fact that negative part of
each of the Reststrahlen bands diminishes intensity of an adjacent spectral
band on the larger wavenumbers’ side. Therefore, the band at 474 cm-1
appears as the most intense. Despite the fact that the KKT restores the

74
asymmetry of the spectral contours and shifts of the spectral bands, the
relative intensities remain unaccounted for.
Fig. 18. Optical (A) and IR chemical (B-E) images of urinary stone constituted from COM
and uric acid. (B) and (C) shows distribution of COM and uric acid respectively as
determined by calculating integral intensity of characteristic spectral bands in the raw
spectra in MIR spectral region; (D) and (E) shows distribution of COM and uric acid
respectively as determined by calculating integral intensity of characteristic spectral
bands in the raw spectra in FIR spectral region.
Fig. 19. Optical (A) and IR chemical (B, C) images of urinary stone constituted from COM
and uric acid. (B) and (C) shows distribution of COM and uric acid respectively as
determined by calculating integral intensity of characteristic spectral bands in the FIR
spectral region after applying the KKT.

75
The optical and chemical images representing the analyzed urinary stone are
shown in Figure 18. The chemical images were obtained from the raw MIR
and FIR spectra. These chemical images represent the distribution of
particular chemical component (in this case, COM (Fig. 18 B, D) and uric acid
(Fig. 18 C, E)) throughout the cross-section of the stone. When raw
reflectance spectra are used for the imaging, the information about the
structure of the stone that can be obtained is similar both for MIR and FIR
images: the boundaries between the components are not clear and the
contrast of the images is low. The arrangement of the chemical components
throughout the cross-section that can be seen in the optical image (Fig. 18 A)
is hardly distinguishable in the corresponding chemical images. Further, we
will show that in order to obtain more informative chemical images and
better determine the structure of urinary stones, the FIR reflectance spectra
should be KKT transformed prior the calculation of the integral intensities of
the spectral bands.
Chemical images formed from the FIR reflectance spectra after
applying the KKT are presented in Figure 19. The apparent differences can be
seen between the images in Figure 18 and Figure 19. In the latter, the
contrast of the chemical images is better; therefore, more structural details
can be distinguished. In addition, the images correspond well with the optical
image of the cross-section presented in Figure 19 A: the ring structure that
can be seen in the optical image is confirmed to be layers of different
chemical components – COM and uric acid. As mentioned in the previous
section, it was found that applying the KKT to the MIR reflectance spectra
yielded asymmetric bands and corresponding MIR chemical images were not
constructed.

76
2.4.3. FT-Raman chemical imaging of urinary stones
So far, the results of the chemical imaging were compared with the optical
image of the stone. However, obtaining a master image which would
represent a true distribution of the chemical constituents would provide
quantitative evaluation of the images’ quality [170]. Therefore, FT-Raman
imaging of the same cross-sectioned stone constituted from COM and uric
acid was carried out. Raman spectral bands do not suffer from distortions
caused by anomalous dispersion and their integral intensities can be used to
form chemical images without any pre-processing; thus, the images obtained
do not contain artefacts caused by calculation errors and can be considered to
Fig. 20. Raman spectrum (A) and checmical images (B, C) of urinary stone constituted
from COM and uric acid. (B) and (C) shows distribution of COM and uric acid respectively
as determined by calculating integral intensity of characteristic spectral bands in the
Raman spectra. The spectrum in (A) was recorded in an area of uric acid indicated by the
white circles in the chemical images. The red dotted line marks spectral band
characteristic to uric acid at 1039 cm-1 assigned to ring and C-O vibrations.

77
represent the real distribution of the chemical components. However, the
time needed to collect the Raman spectra is much longer (approx. 40 hours)
than the time needed to measure MIR or FIR reflectance spectra (approx. 8 –
15 hours). Therefore, IR imaging is a preferable technique for the chemical
and structural analysis.
The same step between mapping points was used in the FT-Raman
experiment as in the FTIR microscopy. The bands at 1039 cm-1 of normal
vibrational mode which includes the ring and C-O vibrations in uric acid
(integration limits 1018 - 1058 cm-1) [42] and at 597 cm-1 of O-C-O
deformation in COM (integration limits 550 - 637 cm-1) [171] were
respectively chosen for the integration in order to form the chemical images
representing distribution of uric acid and COM.
In Figure 20 A, Raman spectrum collected in the area of the stone
containing uric acid (designated in Fig. 20 B, C) is presented. The Raman
images (Fig. 20 B (COM), C (uric acid)) lead us to similar conclusions
concerning the distribution of the chemical components as the images
obtained from the FIR spectra corrected by the KKT. In order to evaluate the
quality of the MIR and FIR images, subtraction procedure was performed:
Raman images were considered to be the master images (representing real
distribution of the components) and they were subtracted from MIR and FIR
images [170]. The images were normalized for pixels to have values between
0 and 1 before the procedure. The RMS (root-mean-square) error of the
residual for the MIR image, constructed from the raw spectra, is 44.33, for the
FIR image, constructed from the raw spectra – 36.98 and for the FIR image,
constructed from the KKT corrected spectra – 13.42. This result confirms that
FIR image, constructed from the KKT corrected spectra, has higher quality and
that FIR microspectroscopy can be effectively used for the chemical imaging
of urinary stones.

78
Considering the obtained results, FIR imaging seems to be superior
to the MIR imaging in case of chemical imaging of rough (2 – 25 µm in the
case of MIR radiation) surfaces by specular reflection mode. Therefore, before
the multi-spectral IR analysis of urinary stones, one should evaluate the
magnitude of the surface irregularities and choose the appropriate method.
2.4.4. IR chemical imaging of urinary stones: use of HCA
As shown above, chemical imaging is normally performed by
calculating integral intensities of characteristic spectral bands and assigning
colors to the obtained values. The color in the chemical image is then
proportional to concentration of particular chemical component (or functional
group) in a particular area of the sample. However, external reflectance
spectra are complicated to analyze as the KKT has to be applied to the
Reststrahlen spectral bands prior the integration procedure in order to obtain
reliable chemical images. In addition, diffuse reflection contributing to the
overall reflection signal obstructs the analysis in the MIR spectral region and
has to be subtracted from the spectra prior applying the KKT. This requires
performing complex data processing which introduces artefacts into the
images. In the FIR spectral region, diffuse reflection has no or less influence
and the KKT can be successfully performed. However, microspectroscopic
measurements in the FIR spectral region requires sophisticated equipment
which is currently difficult, if not impossible, to implement in routine analysis.
Due to reasons stated above, multivariate data analysis, namely
HCA, was performed to construct chemical images of the urinary stones. The
HCA chemical images constructed from the MIR (no KKT) and FIR (KKT
transformed) reflectance spectra of urinary stone constituted from COM and
uric acid (the same that was analyzed above) are presented in Fig. 21 B and C.
Both images contain four groups identified by the HCA. The spectra of each
group (excluding group No. 1 (dark blue) which corresponds to outliers) are
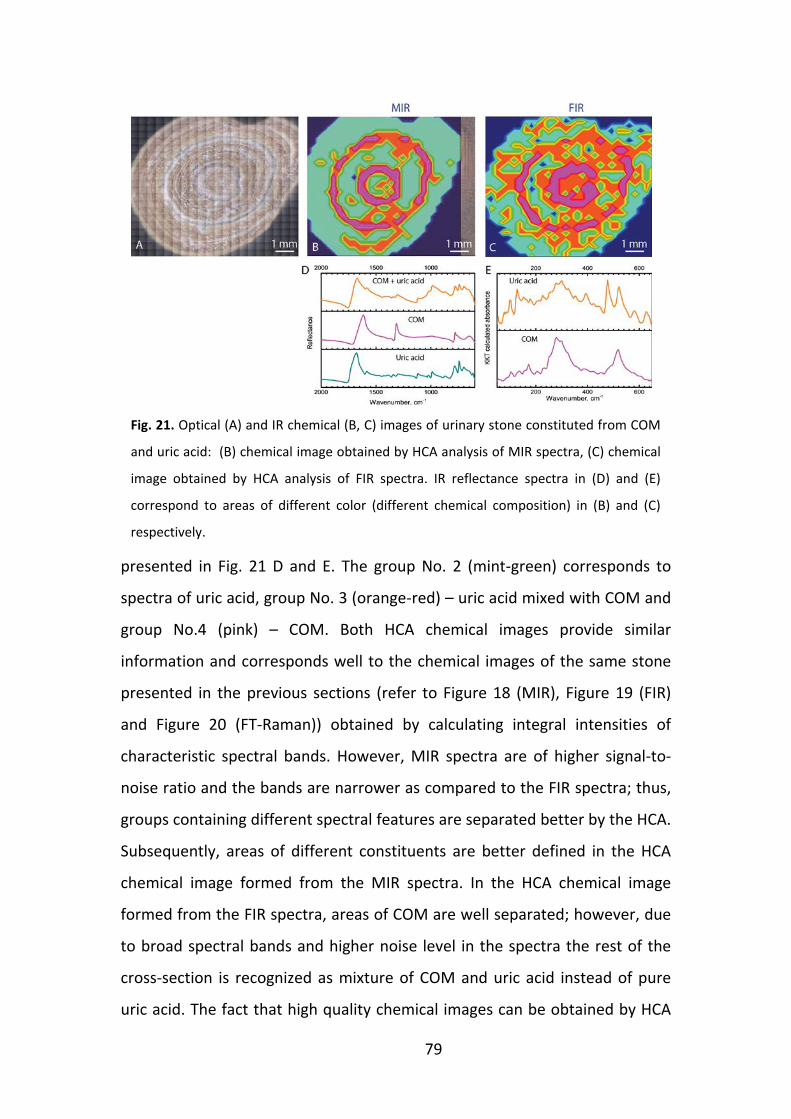
79
presented in Fig. 21 D and E. The group No. 2 (mint-green) corresponds to
spectra of uric acid, group No. 3 (orange-red) – uric acid mixed with COM and
group No.4 (pink) – COM. Both HCA chemical images provide similar
information and corresponds well to the chemical images of the same stone
presented in the previous sections (refer to Figure 18 (MIR), Figure 19 (FIR)
and Figure 20 (FT-Raman)) obtained by calculating integral intensities of
characteristic spectral bands. However, MIR spectra are of higher signal-to-
noise ratio and the bands are narrower as compared to the FIR spectra; thus,
groups containing different spectral features are separated better by the HCA.
Subsequently, areas of different constituents are better defined in the HCA
chemical image formed from the MIR spectra. In the HCA chemical image
formed from the FIR spectra, areas of COM are well separated; however, due
to broad spectral bands and higher noise level in the spectra the rest of the
cross-section is recognized as mixture of COM and uric acid instead of pure
uric acid. The fact that high quality chemical images can be obtained by HCA
Fig. 21. Optical (A) and IR chemical (B, C) images of urinary stone constituted from COM
and uric acid: (B) chemical image obtained by HCA analysis of MIR spectra, (C) chemical
image obtained by HCA analysis of FIR spectra. IR reflectance spectra in (D) and (E)
correspond to areas of different color (different chemical composition) in (B) and (C)
respectively.

80
of the MIR spectra without performing any band correction procedures or
additional pre-processing makes the HCA chemical imaging of urinary stones
an attractive option for routine analysis.
While chemical images obtained by performing HCA analysis
provide qualitative information about the distribution of chemical
components in the cross-section of the urinary stone, quantitative
information is lost. Therefore, chemical imaging by calculating integral
intensities of characteristic spectral bands should be performed when semi-
quantification of the components is necessary. However, the HCA chemical
imaging is less sensitive to the contour shape of Reststrahlen spectral bands
and neglects the influence of the diffuse reflection providing superior
qualitative information as long as correct number of groups is pre-selected. As
HCA is a built-in function of many data analysis software, it does not require
any complex algorithms of analysis to be written (as in the case of diffuse
reflection influenced MIR reflectance spectra). Also, no changes in the custom
measurement procedure are necessary (as in the case of FIR reflectance
microspectroscopy).
***
So far, the effects of using MIR and FIR microspectroscopy and
different data analysis methods have been demonstrated on a single stone. Of
note, similar results were obtained for other urinary stones of various types as
well (Appendix II). In all the cases when integral intensities were used for the
chemical imaging, FIR images provided information about the chemical
composition of the stone which correlated well with the results obtained by
standard IR absorption spectroscopy. In addition, the information about the
distribution of the constituents throughout the cross-section of the stone was
obtained. When similar (or the same) amount of data points were recorded
when performing the spectral mapping, FIR chemical imaging provided

81
superior results to the MIR chemical imaging. This is due to several reasons.
Firstly, as discussed above, impact of diffuse reflection is suppressed when FIR
radiation is used and KKT can be applied to the spectra. This means that
calculation of integral intensities of characteristic spectral bands can be done
more precisely. Secondly, recording external reflectance spectra in the FIR
spectral region is less sensitive to slight variations in surface height (focus)
appearing due to natural pores in the stone or brittleness of the mineral.
Use of HCA for constructing the chemical images both in MIR and
FIR spectral regions provided similar or, in many cases, superior qualitative
information about distribution of constituents in the stones’ cross-sections
than the usually used integration of characteristic spectral bands. To calculate
the integral intensities, spectral bands have to be well separated. In the FIR
spectral region, the bands are broad which makes selection of integration
limits difficult. On the other hand, the HCA takes every point of the spectra
into account, thus every spectral feature is used to separate spectra into
groups. This is especially evident when imaging stones containing ACP in the
FIR spectral region. Spectral features characteristic to the ACP (at 675-
500 cm-1 and 475-225 cm-1) are weak, very broad and overlapping with
spectral bands of COM. Therefore, distribution of the ACP cannot be clearly
determined by calculating the integral intensities. However, the HCA
separates spectra containing spectral features characteristic to the ACP into
separate groups which allows observing its distribution in the cross-sections
of the stones.
Advantages of HCA over calculation of the integral intensities were
also observed when imaging multi-component rather than two-component
stones. The fact that characteristic spectral bands of all the constituents are at
similar wavenumbers results in unreliable chemical images when the integral
intensities are calculated. For instance, characteristic spectral band of uric
acid at 1121 cm-1 is well separated in mixtures with COM. When calcium

82
phosphate (apatite) is present in the stone as well, integration of this spectral
band provides non-zero results in the regions of the phosphate (characteristic
spectral band at 1036 cm-1 assigned to asymmetric PO4-3
stretch) in addition to
the regions of uric acid. Other bands of uric acid are overlapping with spectral
bands of COM and similar outcome is obtained. On the other hand, the HCA
differentiates spectra to groups according to all spectral features rather than
only one band and reliable information about distribution of all the
constituents can be obtained. The fact that high quality chemical images can
be obtained by HCA of the MIR spectra without performing any band
correction procedures or additional pre-processing makes the HCA chemical
imaging of urinary stones an attractive option for routine analysis.
One downside of the HCA is its sensitivity to noise in the spectra.
This is particularly prominent in the FIR spectral region where the spectral
bands are considerably weaker than in the MIR and water absorption is
difficult to compensate for. The noisy spectra are often attributed to separate
groups resulting in ambiguity of the imaging results.

83
2.4.5. Multimodal CARS chemical imaging of urinary stones
The drawback of the IR specular reflection microspectroscopic
imaging is its limited lateral resolution which allows observing distribution of
only major components in the cross-sections of urinary stones. For this
reason, epi-detected nonlinear optical microscopy was used for imaging of
the stones.
Figure 22 shows optical and multimodal images of the surface of a
halved urinary stone that is constituted from struvite and COM. The chemical
composition of this stone was determined by performing infrared
Fig. 22. Optical (A) and multimodal (B-F) images of urinary stone constituted from COM
and struvite: (B) SHG(arrows)/blue fluorescence image, (C) TPEF image, (D) CARS/red
fluorescence image, (E) merged SHG/blue fluorescence (blue), TPEF (green), CARS/red
fluorescence (red) image. The box in A indicates an area images by the multimodal
nonlinear optical microscopy. The box in (D) indicates the enlarged region which
contains CARS-active structures represented in (F). The black circular spots in the images
are due to bubbles in the immersion water. Scale bar (B-E): 200 μm.

84
transmission measurement of the other half of the stone prepared by KBr
pellet technique as described in section 2.3.1. In the optical image (Fig. 22 A)
segment of COM (dark brown, marked by arrow) is surrounded by the whitish
mineral struvite. The area denoted by the red box in the image was analyzed
by multimodal nonlinear optical imaging. Figure 22 B shows the SHG intensity
image. It is expected that the SHG is generated by struvite (marked by arrows)
as it belongs to a non-centrosymmetric orthorhombic space group (Pmn21 =
= C2v7) [172]. Some signal at wavelength 390 nm is also generated by COM in
all the analyzed stones. This signal is considerably weaker than that from
struvite and is probably due to residual fluorescence emitted below 399 nm
(further referred to as blue fluorescence) and therefore transmitted to the
detector by the band-pass filter used for acquisition. To verify the origin of the
signal from struvite in the stone, we compared the intensity of the signal
acquired using the band-pass filter 381-399 nm and a broader filter
transmitting all blue light below 480 nm to the detector. Intensity of the
recorded signal was found to be the same with both filters, showing that the
signal is emitted only at wavelengths very close to the half of wavelength of
the pump beam and thus enabling us to conclude that it is SHG.
TPEF signal was observed in the region of COM (Fig. 22 C). Since no
TPEF signal was recorded from synthetic COM powder (refer Fig. AIII-1
(Appendix III)), it is likely predominantly generated by pigments and organic
macromolecules that are integrated into the COM lattice during the stone
growth [144]. The origin of the blue fluorescence signal mentioned above can
be explained in similar manner. Region of COM deposition also shows
fluorescence in the 633-647 nm spectral region (further referred to as red
fluorescence) and a weak CARS signal (Fig. 22 D). This was confirmed by
turning the “Stokes” laser off – the intensity of the overall signal diminished
slightly, but the fluorescence signal remained. However, the Raman spectrum
of COM contains only weak spectral bands in the 3600-2800 cm-1 spectral

85
region that can be assigned to vibrations of water [173]; thus, the weak signal
that is suppressed by turning off the Stokes laser is likely non-resonant
background only, rather than a resonant CARS signal.
It has been shown by X. Sheng et al. that the adhesiveness of COM
surface depends on its crystal face [174].Therefore, different layers of COM
provide different fluorescence intensities which can be associated with
changes in pigment/macromolecules density among the layers. In turn, the
layers arranged in concentric circles are typical to COM stones (in this case,
only segment of COM) and imply their intermittent and slow growth [144]. In
the merged SHG/blue fluorescence, TPEF, CARS/red fluorescence image (Fig.
22 E) both COM and struvite segments of the stone can be clearly
distinguished what demonstrates chemical sensitivity of the multimodal
nonlinear optical imaging.
In addition to the weak signal generated by COM, strong CARS
signal was observed localized in small crystal-like structures approx. 1-5 μm in
size and randomly distributed across the cross-sections. The area denoted by
the cyan box in Figure 22 D is shown enlarged in Figure 22 F for better
visualization of the structures. The signal was verified to be CARS both by
turning the “Stokes” laser off, which suppressed the signal and thus excluded
presence of red fluorescence, and by detuning of the “Stokes” laser, which
also strongly decreased the signal and thus ruled out the non-resonant
background as main source of the signal. To the best of authors’ knowledge,
such formations in the stones have never been reported before. They were
found in most (8 out of 10) of the analyzed stones, independent of their type.
The strong CARS signal generated by these structures implies their
organic origin for which the signal generated by addressing spectral band at
2850 cm-1 is normally intense due to CH2 vibrations. Organic substances which
are the most often found in urinary stones are purines (uric acid, ammonium
hydrogen urate, xanthine, 2,8-dihydroxyadenine, etc.), l-cystine and proteins

86
[119]. FT-Raman spectra of pure uric acid (saturation of urine with other
purines is relatively rare), l-cystine and a protein representative – PSA – are
presented in Figure 23. They were all recorded under the same conditions and
using the same excitation laser power. It can be seen that all the three
substances have active spectral bands in the region between 3300 and
2600 cm-1. In CARS microscopic imaging, the „Stokes“ laser is set to address
vibrations at 2850 cm-1 with full width at half maximum (FWHM) of 15 cm-1
(see the enlarged spectral region in Fig. 23) which means that either uric acid
(N-H stretching vibrations) or proteins (CH2 vibrations) could provide the CARS
Fig. 23. FT–Raman spectra of uric acid, l-cystine and a protein representative – PSA; note
the difference in Raman scattering intensity scale – uric acid bands are more intense than
PSA at 2850 cm-1.

87
signal. Note, that the uric acid bands in this spectral region are more intense
than the protein bands. In order to test which of the substances generates the
CARS signal, we tuned the „Stokes“ laser to 875 nm to resonantly address
mixed C-O, C-N, C-C vibrations of uric acid at 1121 cm-1. This band is specific to
uric acid, but is lacking in the spectrum of proteins.
The CARS signal of these structures could be observed in the
images of COM, COD and apatite stone obtained addressing both 2850 cm-1
and 1121 cm-1 vibrations (Fig. 24 B-G). An optical image of the stone’s cross-
section is presented in Figure 24 A. The red box in the image indicates the
area imaged by multimodal nonlinear optical microscopy. In order to improve
the contrast of the CARS image obtained addressing the band at 1121 cm-1
Fig. 24. Optical (A) and multimodal (B-G) images of urinary stone constituted from
COM/COD and apatite. The box in (A) shows the areas imaged by the multimodal
nonlinear optical microscopy. The CARS images were recorded at 2850 cm-1 (B-D) and
1121 cm-1 (E-G): (B, E) CARS/red fluorescence; (C, F) merged images: blue fluorescence
(blue), TPEF (green) and CARS/red fluorescence (red). The boxes in (B) and (E) indicate
the enlarged regions in (D) and (G) respectively, which contains CARS-active structures.
Scale bar (B-C and E-F): 200 μm.

88
(Fig. 24 E), an image with the „Stokes“ laser turned off was recorded and
subtracted from the CARS image. This procedure allows removing the red
fluorescence signal (at 670-745 nm in this case), which is more intense in this
spectral region due to the broader band-pass filter used. Of note, the setting
up of the multimodal imaging system after the laser tuning required sample
to be removed from the sample stage. For this reason, the images addressing
the band at 1121 cm-1 appear shifted as compared to the images at 2850 cm-1.
The enlarged view of areas indicated by cyan rectangles in the 2850 cm-1 CARS
image and the subtracted 1121 cm-1 CARS image (Fig. 24 B and E) clearly
shows that the same structures are observed in both images (marked by
arrows). In accordance with the discussion above, this demonstrates that they
are constituted from uric acid.
Of note, powder of synthetic uric acid was found to generate both
CARS and weak TPEF signals (refer to Fig. AIII-2 (Appendix III)). Surprisingly,
TPEF was not observed in the case of the small structures. It is possible that in
the stones the TPEF signal of the small crystallites is not distinguished from
the strong TPEF signal of the surrounding major constituents. The shape of
the structures is also consistent with the usual monoclinic, pseudo-
orthorhombic shapes of uric acid crystallites [175]. We also measured
multimodal images of synthetic uric acid dihydrate (refer to Fig. AIII-3
(Appendix III)) – a possible uric acid hydration state in urinary stones.
However, neither the shape of the crystallites nor the signal they generated
was consistent with the structures found in the stones. While the uric acid
dihydrate generated CARS signal is similar to that from uric acid, it also
produced intense blue signal which was lacking in the crystallites found in the
stones.
Hyperuricosuria (i.e., excessive amounts of uric acid in urine) has
been related to formation of various types of calcium oxalate urinary stones
[176]. It has been deduced that they can act as an inducer for formation of

89
unattached COM stones. On the other hand, random distribution of the uric
acid crystallites observed in the CARS images in this work suggests that they
were likely to be accidentally included from urine during the stone formation.
Solubility of uric acid in water is low and, subsequently, uric acid micro-
crystallites may be present in urine of even healthy people [177]. During
formation of stones in urinary tract, the crystallites might be incorporated
into the stones’ structure. This could also explain the fact that the small
structures were found present in almost all the analyzed stones of various
types (calcium oxalate (COM/COD, possibly mixed with phosphates), uric acid
(mixed with COM) and struvite (mixed with COM)).
In this case, both optical (Fig. 24 A) and IR chemical images
(Fig. 25 A) were used for interpretation of the multimodal images. In the IR
chemical image (Fig. 25 A), areas of different chemical composition were
identified by HCA and color-coded so that the green color corresponds to
areas of apatite, red – to mixture of COM and COD, magenta – to COM.
Corresponding IR reflectance spectra are presented in Figure 25 B. It is
noticeable that the microstructure and the layering of the stone can only be
distinguished in the multimodal images (Fig. 24 B-G). The IR chemical image
Fig. 25. IR chemical image (A) of urinary stone constituted from COM/COD and apatite.
The box in (A) shows the area imaged by the multimodal nonlinear optical microscopy. IR
reflectance spectra in (B) correspond to areas of different color (different chemical
composition) in (A) as identified by the HCA.

90
presents a rough arrangement of the major constituents and allows
discriminating regions of COM and COM+COD. These two hydrates of calcium
oxalate could not be distinguished in the multimodal images.
Optical and multimodal images of a urinary stone constituted from
uric acid and COM are presented in Figure 26. An optical image of the stone’s
cross-section is presented in Figure 26 A. The red box in the image denotes
the area imaged by multimodal nonlinear optical microscopy. The CARS signal
at 2850 cm-1 (Fig. 26 B) is predominantly generated by uric acid and was not
observed with the “Stokes” laser off (only weak red fluorescence in this case).
As CARS and TPEF (Fig. 26 C) signals were generated from the same structures
arranged in direction perpendicular to the edge of the stone, we conclude,
that TPEF signal was also predominantly generated by uric acid. However, the
TPEF signal generated by synthetic uric acid powder was considerably weaker
than the signal observed in the stones. Therefore, it is likely that the TPEF
signal is additionally generated by macromolecules and pigments (such as
uricine) incorporated into the structure of the stone. The small crystalline
structures of uric acid could be discriminated in the CARS image as well. The
area denoted by cyan box in Figure 26 B is enlarged and presented in Figure
Fig. 26. Optical (A) and multimodal (B-F) images of urinary stone constituted from uric
acid and COM. The box in (A) shows the area imaged by the multimodal nonlinear optical
microscopy: (B) CARS/red fluorescence intensity image; (C) TPEF signal intensity image;
(D) blue fluorescence signal intensity image; (E) merged image: blue fluorescence (blue),
TPEF (green) and CARS/red fluorescence (red). The box in (B) indicates the enlarged
region represented in (F), which contains CARS active-structures. Scale bar (B-E): 200 μm.

91
26 F. The crystallites are clearly visible as the CARS signal they generate is
somewhat stronger than the bulk uric acid. The reason for this is not known.
The COM in the stone can be discriminated as well (arrow in Fig. 26 D) since,
in addition to the TPEF signal, it gives rise to weak blue fluorescence signal.
As in the case of the previously described urinary stone,
microstructure and layering of the stone in Figure 26 can only be
distinguished in the multimodal images while only arrangement of major
constituents is revealed in the IR chemical image (Fig. 27). This is exceptionally
relevant in the case of determining presence of COM in the stone: its layer
can be well discriminated in the multimodal images while the chemical image
only suggests presence of COM in the outer layer of the stone (green color).
In total, 10 stones of five different types were analyzed in this work
(refer to Fig. AIII-4 – Fig. AIII-10 (Appendix III)): 4 stones were constituted
from calcium oxalate, possibly with impurities of amorphous calcium
phosphate (ACP), 2 stones of calcium oxalate and apatite, 3 stones of COM
and uric acid, one stone of COM and struvite. TPEF, blue and red fluorescence,
as well as weak CARS signal were generated by COM in all the stones. Since no
Fig. 27. IR chemical (A) image of urinary stone constituted from COM/COD and apatite.
The box in (A) shows the area imaged by the multimodal nonlinear optical microscopy.
IR reflectance spectra in (B) correspond to areas of different color (different chemical
composition) in (A) as identified by the HCA.

92
fluorescence signal was generated by synthetic powder of COM, we deduced
that it is likely predominantly generated by pigments and organic
macromolecules that are integrated into the COM lattice during the stone
growth. Neither COD nor ACP could be discriminated from COM in the
multimodal images (Fig. 24, Fig. AIII-4 – Fig. AIII-7, Fig. AIII-10 (Appendix III)).
Apatite, on the other hand, generated both red fluorescence and blue
fluorescence, as well as and green TPEF signal (Fig. AIII-8 (Appendix III)). These
signals were more intense than those generated by COM and thus clearly
distinguishable. Uric acid in the stones generated intense CARS (at 2850 cm-1)
and TPEF signal. The latter was considerably weaker in synthetic powder of
uric acid, thus, the TPEF signal is likely generated predominantly by
macromolecules and pigments (uricine), which also give a yellow to orange
color to the component. Finally, intense SHG signal was generated by struvite
due to its non-centrosymmetric orthorhombic crystal structure. These five
chemical components constitute the majority (93.5 %) of human urinary
stones [131]. The results presented in this work show that four of them can
be clearly discriminated in the multimodal images. The CARS active
microcrystallites were observed in 8 out of 10 analyzed stones. They appeared
of similar shapes and sizes and were randomly distributed in all types of the
stones.
Given that nonlinear optical microscopy is mostly used for
detection of lipids in biological samples, we expected to record CARS signal
generated by organic matrix in the urinary stones as well. However, no such
signal was observed in the multimodal images. It has been shown that organic
matrix (mainly lipids and proteins) may constitute at least 5 % of urinary
stones’ mass [178]. They have been identified by chemical methods and
observed in stone cross-sections by immunohistochemical staining [179,180].
There might be two reasons why the organic matrix was not observed in the
multimodal images: (I) the particles of organic matrix are too small and/or (II)

93
signal generated by the matrix is too weak to be recorded when epi-detection
is used.
The results presented here confirm that different chemical
constituents of urinary stones can be well discriminated in the multimodal
images. One advantage of the method over the previously proposed FTIR
microspectroscopy [26,181,182] is its speed - the images can be captured in
less than an hour. In addition, high lateral resolution allows revealing hidden
information about the microstructure of the stones. However, expensive and
not widely commercialized equipment is at present required for the nonlinear
optical microscopy and, therefore, this technique could hardly be immediately
applied for routine analysis of urinary stones. On the other hand, imaging of
selected stones can be performed in order to obtain relevant information
about their growth and deliver useful insights in etiology and pathogenesis of
urolithiasis.
2.4.6. Final remarks on vibrational spectroscopy of urinary stones
In this work, 403 human urinary stones were analyzed by
vibrational spectroscopy methods. As presented in the results, different
methods provide different information about the stones and complement
each other. However, using all of them on all of the stones would be
complicated and time consuming. Therefore, standardization, or a protocol, is
necessary for adapting the multistage approach for each individual stone
sample in such a way that questions related to the causes of urolithiasis and
lithogenesis of the stone could be best answered. Based on the results
obtained in this work, we describe such protocol (Fig. 28). It includes stone
inspection by stereomicroscopy, choice of one or several vibrational

94
Fi
g. 2
8. B
lock
sche
me
of a
pro
toco
l for
com
preh
ensiv
e ur
inar
y st
one
anal
ysis

95
spectroscopy methods, spectral pre-processing and data analysis which finally
allows collecting comprehensive data about the stone and deducing its
etiology and lithogenesis.
Visual inspection of urinary stones provides valuable information
about the type of the stone [117,144,145]. Moreover, it gives some clue on
what path further analysis should take:
• If the stone is intact, its structure can be determined which can lead to
lithogenesis hypothesis.
• If the surface of the stone has some specific features or domains of
different morphology their chemical composition is determined by
recording Raman scattering spectra.
• The stone is cross-sectioned. One half is used for IR chemical imaging
while the second half is grinded and KBr/PE pellet samples are prepared
for IR transmission analysis.
• Either MIR or FIR (if available) spectral region can be chosen for the
imaging according to the size of the surface roughness of the stone.
• Chemical imaging according to the HCA results is easier to accomplish and
should be used for high signal-to-noise spectra when no quantitative
information is required; otherwise, chemical imaging should be done
according to the integral intensities of characteristic spectral bands.
• If the IR chemical imaging is not sufficient to characterize the stone,
nonlinear optical microscopy imaging is used for microstructural analysis.
• If the stone is broken during its removal procedure and its visual analysis
reveals no distinct morphological features, the stone is grinded and
KBr/PE pellet samples are prepared for IR transmission analysis. However,
if debris of the stone has some specific features or domains of different
morphology their chemical composition is determined by recording
Raman scattering spectra prior the grinding.

96
This protocol allows obtaining comprehensive information about
urinary stones. Assigning a stone to a specific type according to its
morphology and chemical composition alone suggests an underlying disorder
causing urolithiasis and aids in prescribing appropriate treatment to prevent
recurrences [117]. Further information about the structure of the stone
obtained from IR, Raman or nonlinear optical microscopy measurements
provides hypothesis about the stone lithogenesis. Information obtained by
use the methods can aid medics in understanding the urinary stone disease.

97
2.5. Urinary deposits: a hint of the stone formation
As mentioned above, an essential condition for the stone
formation is oversaturation of urine – a condition which can subsequently
lead to nucleation, crystal growth and aggregation. Examination of the small
crystallites excreted with the urine is used as a diagnostic method for
urolithiasis and can indicate formation of the urinary stone in the urinary
tract. On the other hand, the crystallites are found both in healthy and
lithogenic patients. The factors that help identify the latter are crystal size,
shape and chemical composition. It has been shown that urinary crystals of
lithogenic patients are relatively large, contain sharp edges rather than blunt
edges and are more likely to aggregate [177,183]. In addition, the higher
amount of, for instance, COM in respect to COD can also suggest the stone
formation.
Early discovery and identification of the formed urinary crystals in
the urine of high risk urolithiasis patients could be crucial for taking
appropriate preventive measures that inhibit further urinary stone formation.
This is particularly true in cases of recurrent stones. Optical microscopy is
currently the only method used to analyze the urinary crystals routinely [184].
They are identified by their morphology, crystal birefringence (the microscope
must be equipped with polarizers) and prior knowledge of urine pH. However,
this method is not reliable to determine chemical composition of “atypical”
(crystallites of varied crystalline appearance or materials rarely found in
urinary deposits), amorphous deposits and/or crystal clusters.
As already mentioned above, optical microscopy is currently the
only method used to analyze the urinary crystals routinely [184]. FT-IR
microscopy was first shown to be suitable for chemical composition analysis
of urinary crystals in 1991 by Daudon et al. [185]. It was demonstrated that

98
the technique is suitable to differentiate the crystals and identify deposits of
heterogeneous or unusual (e.g., drug metabolites) composition. In the
subsequent paper, they proposed combining IR absorption spectroscopy with
KBr pellet technique instead of using IR microscopy [186]. Combining the
spectral results obtained from analysis of urinary deposits and kidney stones
with the results obtained by optical microscopy of the deposits, the
researchers found 97.3 % correlation between stone type and urinary crystals
type. These studies were limited by the amount of sample required for the
KBr pellet technique. Later on, the researchers’ group published a paper
where IR microscopy was used to analyze “atypical” urinary crystals which
could not be identified by combined approach of morphological, crystal
birefringence and urine pH analysis [187]; thus, IR microscopy was proposed
as a complementary technique to the existing routine analysis methods.
The mentioned IR absorption spectroscopy methods have not yet
become routine. This is mainly reasoned by the fact, that IR microscopy used
for the analysis requires sophisticated and expensive equipment while IR
absorption spectroscopy combined with KBr pellet technique for sample
preparation – a considerable amount of sample.

99
2.6. Infrared spectroscopic analysis of urinary deposits: experimental details
2.6.1. Sample preparation of urinary deposits
Urine samples from 68 healthy individuals (reference group), 151
patients in risk of urolithiasis group and 76 urolithiasis patients were collected
at Vilnius University Hospital Santariskiu Clinics or Faculty of Medicine, Vilnius
University. Urine samples from the urolithiasis patients were collected just
before the kidney stone removal procedure. Morning urine was collected
from the rest of the patients. The samples were centrifuged to separate the
urinary deposits from the whole urine volume. The centrifuged urine was
placed on an ashless paper filter (Whatman 542) and left for 24 hours to dry.
We chose filters with 2.7 μm particle retention to separate the crystals
suitable for investigation. The urinary crystals were collected from the surface
of the filter and transferred onto an optical window transparent in the IR
spectral region (CaF2 or ZnSe). Most of deposits, crystals or crystal clusters
were too thick to record appropriate transmission spectra for qualitative
analysis. For this reason, they were squeezed between two IR transparent
optical windows and crushed until suitable sample thickness (approx. 10–
20 µm) was obtained. One of the optical windows was then removed for the
IR radiation to reach the sample directly. The damage of the crushing to the
optical windows was either not observed or minor.
2.6.2. FTIR transmission microspectroscopy of urinary deposits
IR absorption spectra were obtained using IR microscope ’Hyperion
3000’ (Bruker Optik GmbH, Ettlingen, Germany) equipped with a single
element MCT detector and combined with Vertex 70 spectrometer (Bruker
Optik GmbH, Ettlingen, Germany). A 15x/0.4 objective was used. Knife edge
aperture was set according to the sample size in order to avoid stray light. The

100
spectra of crystals smaller than 10×10 µm could not be recorded due to too
low signal reaching the detector. The spectra were recorded in 4000-650 cm-1
spectral range with spectral resolution of 4 cm-1. One hundred and twenty
eight interferograms were averaged for one resultant spectrum of each point
and the result Fourier transformed into a spectrum applying Blackmann-Harris
3 apodization function and zero filling factor 2.
Either the visible mode of the IR microscope or stereo microscope
(Stemi 2000C with AxioCam ERcSs video camera, Carl Zeiss, Oberkochen,
Germany) was used for the morphological investigation of the urinary
deposits before the crushing.
2.6.3. FTIR ATR spectroscopy of urinary deposits
IR ATR spectra were recorded using either a Ge ATR 20× objective
of the IR microscope described previously (’Hyperion 3000’ from Bruker Optik
GmbH, Ettlingen, Germany) or a small (22×30 cm) portable IR spectrometer
Alpha with diamond ATR accessory (Bruker Optik GmbH, Ettlingen, Germany).
All the ATR spectra were recorded in 600-4000 cm-1 spectral range with
spectral resolution of 4 cm-1. One hundred and twenty eight interferograms
were averaged for one resultant spectrum of each point and the result Fourier
transformed into a spectrum applying Blackmann-Harris 3 apodization
function and zero filling factor 2.

101
2.7. Analysis of urinary deposits: results and discussion
Thus far, prospects of applying vibrational spectroscopy methods
for determining underlying disorders of urolithiasis and lithogenesis of urinary
stones after they have formed and been removed from human organism were
discussed. However, urolithiasis is a painful disorder in many cases requiring
invasive treatment which significantly affects patient’s quality of life.
Therefore, early discovery and identification of urinary crystals in urine could
be crucial for taking appropriate preventive measures and inhibiting further
urinary stone formation in high risk urolithiasis patients. In addition, it could
aid medics in prescribing non-invasive treatment for the already formed
stones. Currently used optical microscopy is unreliable to determine chemical
composition of “atypical” (crystallites of varied crystalline appearance or
materials rarely found in urinary deposits), amorphous deposits and/or crystal
Fig. 29. Optical images and corresponding IR absorption spectra of urinary deposits
constituted from struvite.

102
clusters. For these reasons, urinary deposits from healthy individuals
(reference group), risk of urolithiasis group and urolithiasis patients were
analyzed in this work by means of IR (micro)spectroscopy.
When observed in the visible light mode of the IR microscope,
urinary deposits were found either as crystals having a regular morphological
structure, polycrystalline clusters or amorphous formations. Optical images of
urinary deposits of two different patients and their IR absorption spectra are
presented in Figure 29. While one of the samples has a crystalline structure,
the other is irregularly shaped. However, both of them are constituted from
struvite as deduced from the spectra. This confirms the fact that visual
inspection is not a reliable method for urinary deposit analysis and other
methods for this purpose should be sought.
Three different approaches to record IR absorption spectra were
applied for the urinary deposit analysis: IR transmission microspectroscopy, IR
ATR microspectroscopy (further referred to as micro-ATR) and IR ATR
Fig. 30. Optical image of urinary deposit constituted from struvite and organic matrix
and corresponding IR absorption (A), micro-ATR (B) and macro-ATR (C) spectra.
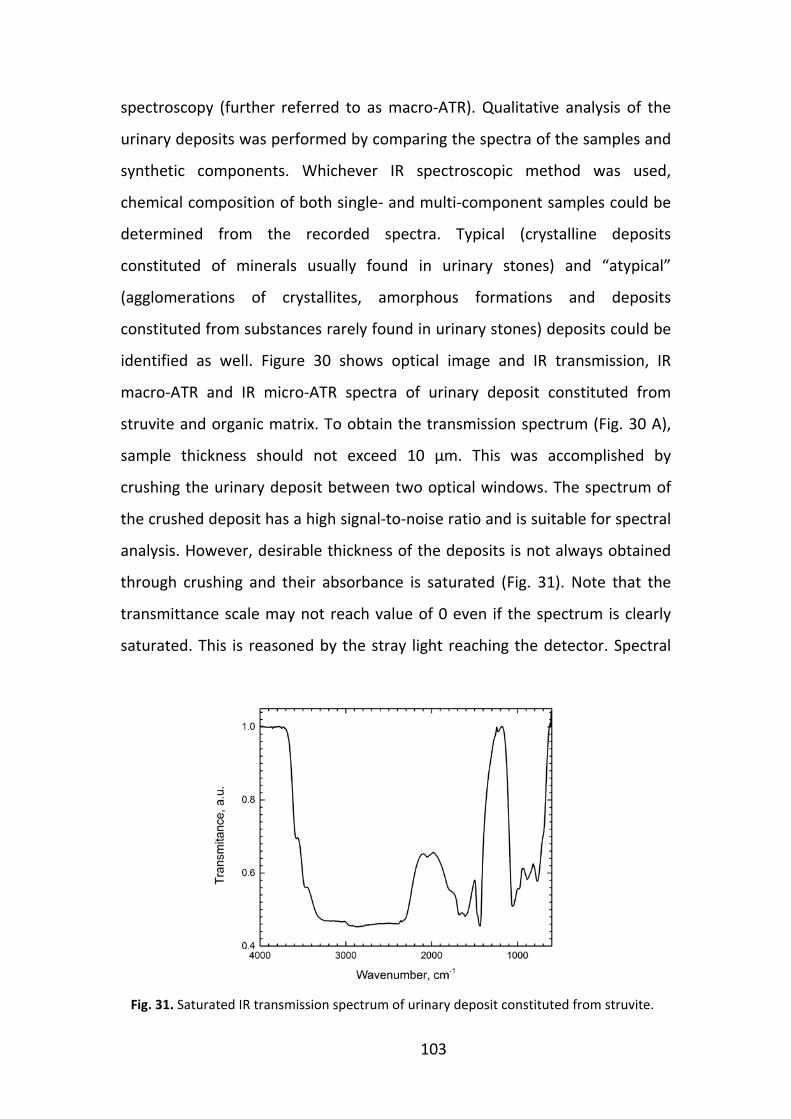
103
spectroscopy (further referred to as macro-ATR). Qualitative analysis of the
urinary deposits was performed by comparing the spectra of the samples and
synthetic components. Whichever IR spectroscopic method was used,
chemical composition of both single- and multi-component samples could be
determined from the recorded spectra. Typical (crystalline deposits
constituted of minerals usually found in urinary stones) and “atypical”
(agglomerations of crystallites, amorphous formations and deposits
constituted from substances rarely found in urinary stones) deposits could be
identified as well. Figure 30 shows optical image and IR transmission, IR
macro-ATR and IR micro-ATR spectra of urinary deposit constituted from
struvite and organic matrix. To obtain the transmission spectrum (Fig. 30 A),
sample thickness should not exceed 10 μm. This was accomplished by
crushing the urinary deposit between two optical windows. The spectrum of
the crushed deposit has a high signal-to-noise ratio and is suitable for spectral
analysis. However, desirable thickness of the deposits is not always obtained
through crushing and their absorbance is saturated (Fig. 31). Note that the
transmittance scale may not reach value of 0 even if the spectrum is clearly
saturated. This is reasoned by the stray light reaching the detector. Spectral
Fig. 31. Saturated IR transmission spectrum of urinary deposit constituted from struvite.

104
analysis of such samples is difficult or impossible. In addition, crushing the
deposits causes damage to the soft ZnSe. Use of harder materials such as CaF2
is impossible due to its strong absorption below 900 cm-1. Spectral bands in
this spectral region often allow identifying the chemical composition of
urinary deposits. Moving the crushed deposits from one optical window to
the other might cause sample loss.
Using ATR technique eliminates the requirement of sample
thickness. In turn, additional treatment is not needed for the urinary deposits
prior the measurements. Figure 30 B, C shows macro- and micro-ATR spectra
of the deposits. They are mostly consistent with the IR absorption spectrum
(Fig. 30 A) and allow deducing chemical composition of the deposits.
However, some differences between the spectra are observed: the macro-
ATR spectrum (measured first) can be assigned to pure struvite; no spectral
bands characteristic to the organic matrix are visible. During the
measurement of the macro-ATR spectrum, the deposit was pressed to the
diamond ATR element with a stainless steel handle and crushed.
Subsequently, the crushed deposit was transferred from the element onto
CaF2 optical window for the micro-ATR and transmission measurements.
Some sample was inevitably lost during the transfer which caused changes
observed in the micro-ATR and IR absorption spectra, where spectral bands
characteristic to the organic matrix are visible and overlap with the bands of
struvite. Signal-to-noise ratio of the macro-ATR spectrum is lower as
compared to the one recorded by the micro-ATR. This is due to stray light
reaching the detector as the small deposits do not cover the whole surface of
the macro-ATR element (2×2 mm). The coverage would require large amount
of the deposits which was rarely observed even in the urine samples of
urolithiasis patients. Despite the lower signal-to noise ratio, however, the
spectra are of sufficient quality for qualitative analysis.

105
The urinary deposits found in the urine samples varied in size with
the smallest ones being less than 10 µm (smaller ones could not be picked up
from the filter or were filtered through it) and the largest ones – more than
300 µm in size. ATR spectra of urinary deposits of various sizes and
constituted from uric acid are presented in Figure 32. It can be seen again that
superior results are provided by the micro-ATR (Fig. 32 B) which allows
recording high signal-to noise spectra of deposits as small as 15×10 µm in size.
However, this method requires sophisticated and expensive equipment and a
trained spectroscopist to measure the spectra. It could hardly be
implemented in a clinical laboratory for routine analysis. On the other hand,
portable IR spectrometer Alpha with macro-ATR unit could be used for this
purpose. As long as the deposits are larger than 100×100 µm, their spectra
can be recorded by means of macro-ATR (Fig. 32 A). It has been shown that
urinary deposits of urolithiasis patients are both larger and have wider size
distribution than healthy controls [177,183]. In addition, they are more likely
to aggregate.
In this work, 68 samples of healthy controls were investigated.
Spectra of only 23 samples were recorded as others did not contain any
Fig. 32. Macro-ATR (A) and micro-ATR (B) spectra of urinary deposits of various sizes
constituted from uric acid dihydrate.

106
deposits or they were too small to be removed from the filter. The analyzed
deposits were mainly (18 samples) constituted from uric acid dihydrate (an
unstable phase of uric acid) and proteins. COM was also identified in 3 of
these samples. Surprisingly, struvite was found in 4 of the urine samples of
healthy controls. Growth of struvite crystals in urinary tract is related to
bacterial infection and, therefore, was unexpected to be found in these
samples. One sample was found to be constituted from calcite. The urinary
deposits in this group were found to be small and did not exceed size of
270 µm.
The risk for urolithiasis group included 151 urine samples. Only 24
of them did not contain any deposits or they were too small to be removed
from the filter. Similarly as in the case of healthy controls, chemical
composition of most of the analyzed samples was deduced to be either uric
acid dihydrate or proteins or mixture of these two components. Struvite,
brushite and COM were also found. However, the main difference between
these samples and the samples of healthy controls was the size of the
deposits. Formations of up to 800 µm in size were found in the risk for
urolithiasis group samples. It is possible, that these formations aggregated in
the test-tubes after the samples were taken from the patients. Either way,
increased rate of aggregation of urinary deposits in urine suggests increased
risk for urolithiasis.
Finally, we compared chemical composition of urinary deposits
and urinary stones obtained from the same urolithiasis patients. In 73 % of
the cases of the 76 patients investigated, at least one common component
was found both in the deposits and in the stones. In 41 % of those cases, a
complete match of chemical composition was observed. For calcium oxalate
stones, however, the samples exhibited absolute match only in 27 % of the
cases. Protein formations were mostly found instead. In addition, a miss-
match of phosphate types found in the calcium oxalate stones and the

107
corresponding deposits was observed. This can be explained by the fact that
different phosphates form from other phosphatic precursors in urine when
different pH or ion concentration conditions are met [188].
For uric acid stones, absolute correlation of chemical composition
of the stones and deposits was observed for 71 % of samples. This implies
that presence of uric acid deposits in urine is a precursor of a urinary stone
formation. Of note, small uric acid crystallites have been found in urine of
healthy people as well [189]. This is due to low solubility of uric acid in
aqueous solutions, particularly under conditions of increased acidity.
Therefore, determining size of urinary deposits might be extremely relevant in
case of uric acid.
Phosphate (struvite, apatite and brushite) urinary stones are rare
and only 6 of them were included in this study of urinary deposits. In 4 of the
cases, correlation between the chemical composition of the deposits and the
stones was found. As in the case of uric acid stones, presence of phosphate
deposits could signal the phosphate stone formation in the urinary tract.
However, more phosphate stones should be investigated for reliable results.
Some of the components, for example, uric acid dihydrate, found in
the urinary deposits were not found in any of the stones. This can be
explained by the fact that dihydrate form of uric acid is highly unstable and
turns to uric acid (anhydrous) during formation of the stones [190]. In
addition, components rarely found in urinary stones such as drug metabolites
or calcite could be identified in the urinary deposits. While these components
rarely constitute urinary stones themselves, they can influence the processes
of stone formation; thus, their identification is relevant and may provide
additional information about underlying causes of urolithiasis.

108
2.8. Vibrational spectroscopy analysis of urinary stones and urinary deposits: conclusions
1. Morphological examination of urinary stones provided both valuable
information about their growth processes and some clue on what path
further vibrational spectroscopic analysis should take. Specific
morphological features suggesting last stages of stones’ growth were
additionally analyzed by Raman scattering microscopy which revealed
chemical composition of minor components in urinary stones such as
COD, sucrose or blood.
2. Comprehensive chemical analysis of urinary stones by means of IR
spectroscopy is only possible when both MIR and FIR radiation is used.
After performing IR spectroscopic analysis of 403 urinary stones,
distribution according to their type was determined: calcium oxalate
stones – 61 %, uric acid stones – 26 %, struvite stones – 10 %, brushite
stones - 2 % and apatite stones - 1 %.
3. Specular reflection microspectroscopic imaging of urinary stones in MIR
spectral region can be effectively used only if (I) modification of the
experimental spectra – the subtraction of the diffuse reflection
component – is performed prior application of KKT to convert
Reststrahlen spectral bands to absorbance bands or (II) HCA is used to
group the spectra and create the chemical images.
4. Specular reflection microspectroscopic imaging of urinary stones in FIR
spectral region allows suppressing influence of diffuse reflection. KKT can

109
be directly used to convert Reststrahlen spectral bands to absorbance
bands without any additional pre-processing.
5. Epi-detected nonlinear optical microscopy, when CARS, TPEF and SHG
signals are recorded, can be used to determine chemical composition and
microstructure of urinary stones. Different constituents of urinary stones
can be well discriminated according to the optical signal they generate.
6. IR transmission microspectroscopy, macro-ATR and micro-ATR
spectroscopic methods were shown to be suitable to determine chemical
composition of atypical crystal, poly-crystal and amorphous urinary
deposits and are superior to the conventional optical microscopy. The fact
that high quality macro-ATR spectra of urinary deposits larger than
100 µm could be recorded and that the method does not require
sophisticated equipment, makes it attractive for applications in clinical
practice.
7. High correlation between chemical composition of urinary deposits and
urinary stones obtained from the same urolithiasis patients was observed.
At least one common component was found both in the deposits and in
the stones in 73 % of the cases of the 76 patients investigated. In 41 % of
those cases, a complete match of chemical composition was observed.

Chapter 3 Vibrational spectroscopy analysis of biological fluids

110
3.1. Analysis of biological fluids for disease diagnosis
Bodily fluids, such as blood, urine, saliva, tears or extracellular fluid,
are biological fluids produced in human organism. They are aqueous solutions
of proteins, lipids, various metabolites, electrolytes and other compounds.
Bodily fluids are often used for diagnostic purposes as they contain important
biomarkers specific to particular disorders. As compared to analysis of tissue
biopsies, such testing is minimally or non-invasive, sample collection,
processing and storage is simple and its cost is low. Microscopic examination,
proteomic, chemical or microbiological analysis can be performed once fluid
samples are obtained [191].
3.1.1. Detection of metabolites in bodily fluids
The main disadvantage of testing bodily fluids is relatively low
concentrations of analytes which leads to poor sensitivity. Moreover,
detection of specific biomarkers is often complicated due to interference of
all the constituents present in the bodily fluids. Despite these shortcomings,
blood and urine screening is a routine procedure in diagnostics. Biomarkers of
various infections, genetic disorders or organ dysfunction are well known
[192]. For example, creatinine levels in blood serum and plasma are indicative
of impaired kidney function; glucose – of diabetes; prostate-specific antigen –
of prostate cancer, etc. [15]. Still, discovery of new biomarkers remain to be
challenging, mostly, due to normally occurring variations of concentrations
and molecular structures of the same compound from individual to individual.
New and improved methods for the more precise biomarker detection are
continuously sought as well.
Vibrational spectroscopy methods have been extensively applied
for analysis of bodily fluids [15,193,11,34,194]. While both IR absorption and
Raman scattering spectroscopy provide useful information about presence of

111
certain metabolites, proteins and drugs and their concentrations, they also
have disadvantages that prevent them from being used as routine diagnostic
methods. For the IR absorption spectroscopy it is contribution of water
absorption to the spectra; for the Raman scattering spectroscopy – poor
signal-to-noise ratio caused by low sample concentrations and fluorescence
background frequently occurring in bio-samples. To overcome these
disadvantages, ways to develop and improve data analysis and to find new
approaches to sample preparation have been sought [23,24,195,196].
SERS spectroscopy has been increasingly proposed as a method of
choice for disease diagnosis and prevention as well [65–68]. Advantages of
SERS over conventional Raman scattering spectroscopy includes significantly
increased signal which allows detection of trace amounts of substances in
samples and fluorescence quenching [197,198]. In addition, high sensitivity of
the method and ease of use provided by emergence of portable hand-held
Raman scattering spectrometers would allow development of point-of-care
analysis systems. However, for SERS to be used routinely, further studies of
selectivity and reproducibility are still required.
3.1.2. Uric acid
Uric acid (C5H4N4O3) is an end product of purine metabolism in
human organism. Most of it (approx. 70 %) is disposed through the kidneys as
a constituent of urine; the other part is recirculated into the blood system and
acts as an antioxidant together with vitamin C [199–201]. Normally, uric acid
concentration in blood ranges from 20 mM to 45 mM [202]; in urine - from
100 mM to 600 mM per 24 h [203]. Its elevated or decreased levels in either
of the bodily fluids can suggest disorders such as gout, pre-eclamsia or
cardiovascular disease [204–206]. Uric acid analysis in urine is also performed
in order to evaluate kidney function [207].

112
Various methods have been used for detection of uric acid:
enzymatic method, differential spectrophotometry, liquid chromatography,
etc. [204,208–210]. However, these methods either lack sensitivity when low
concentrations of the sample molecules need to be detected or require
sophisticated, bulky and expensive equipment.
Electrochemical SERS (e-SERS) was proposed for detection of uric
acid in aqueous solutions as well as in urine stimulant [162,211]. The method
was capable of detecting uric acid concentrations down to 0.1 mM and little
interference from other components was observed in the urine stimulant.
However, the use of metal nanoparticle (NP) colloids remains the most
common approach for obtaining the Raman signal enhancement. That is
mainly due to simplicity of preparation, low costs and high enhancement
factor (EF) of the colloidal SERS substrates. In addition, different techniques
can be used for colloid preparation in order to obtain NPs of specific shapes
and sizes. This allows shifting the surface plasmon resonance (SPR) maximum
and adapting it to the particular excitation frequency. It has been shown that
adsorption of the analyte molecules also depends on the shape of the NPs
[212]. To the best of our knowledge, colloidal SERS approach has not been
used for uric acid detection yet.
Several types of colloidal suspensions of gold (Au) and silver (Ag)
NPs were used in a study of blood serum and plasma in search of a sensing
method for metabolic profiling [213]. It was discovered, that, once the
proteins were eliminated from serum, and when employing NIR (785 nm)
excitation in combination with Ag NPs, intense and repeatable SERS spectra
could be recorded. However, the spectra were dominated by only two
metabolite species, namely, uric acid and hypoxanthine. Although the study
demonstrated that SERS spectroscopy is hardly suitable for the metabolic
profiling, it also showed that selective adsorption and intense SERS spectra of
uric acid can be obtained in the analyzed biofluids.

113
The results of the earlier studies imply that colloidal SERS has
potential to be employed as an efficient method for detection of uric acid in
various bodily fluids.

114
3.2. Uric acid detection in solution by means of SERS: experimental details
3.2.1. Preparation and characterization of Ag NPs colloids
Three types of Ag NPs colloids were used in this study: (I) citrate
reduced (mainly spherical), (II) hydroxylamine hydrochloride reduced
(spherical) and (III) Ag seed-catalyzed ascorbic acid reduced (prisms).
Trisodium citrate (Merck), silver nitrate (Merck), hydroxylamine hydrochloride
(Thermo Scientific), PSSS (Sigma-Aldrich), ascorbic acid (Sigma-Aldrich) and 2%
sodium hydroxide solution (Thermo Scientific) were purchased and used as
received.
Citrate reduced Ag NPs colloid was prepared by using Lee-Meisel
method [214]. Briefly, 9 mg of silver nitrate is added to 50 ml of DI water
heated to 45-500 C. The solution is then brought up to boiling point and 1 ml
of 1 % sodium citrate tribasic dihydrate solution is added to stabilize the NPs.
The colloid is left boiling for one hour (the vial is covered with Al foil to
prevent water from evaporating) and then is placed in an ice bath for rapid
cooling. Vigorous stirring was kept during the whole process.
For preparation of hydroxylamine hydrochloride reduced Ag NPs
colloid a method described by Leopold-Lendl was used [215]. While stirring,
silver nitrate solution (17 mg of AgNO3 diluted in 10 ml of H2O) was rapidly
added into hydroxylamine hydrochloride solution (9.4 mg of NH2OH∙HCl
diluted in 90 ml of H2O) containing 0.5 ml of 2 % NaOH solution. The reaction
was completed in several seconds and yellowish-grayish solution was
obtained.
The preparation of Ag nanoprism colloid is described by Aherne et
al. [216]. For seed solution, 5 ml of 2.5 mM sodium citrate tribasic dihydrate,
0.25 mL of 500 mg/l PSSS and 0.3 ml of 10 mM sodium borohydrate were
mixed while stirring. Then, 5 ml of 0.5 mM silver nitrate solution is dropwise

115
added to the mixture. Under formation of the seed particles, yellow color of
the solution is obtained. For growth of the Ag nanoprism NPs, 75 μl of 10 mM
ascorbic acid solution is added to 5 ml of DI water. Then, 25 μl of the seed
solution is introduced. Three ml of 0.5 mM silver nitrate solution is dropwise
added to the mixture which causes change in the color of the solution from
colorless to dark blue. To stabilize the NPs, 0.5 ml of 25 mM sodium citrate
tribasic dihydrate solution is added. Vigorous stirring was kept during the
whole process.
The prepared colloids were centrifuged for 30 min. (RCF=10400×g)
in order to achieve higher concentration of the Ag NPs. For each 100 ml of
colloidal solution approximately 20 ml of the concentrate was obtained.
For characterization of the colloidal suspensions, UV-VIS spectra
(spectral range 250-800 nm (250-1300 nm for the Ag nanoprism colloid),
spectral resolution 5 nm) were recorded by Lambda 1050 spectrometer
(Perkin-Elmer) equipped with two light sources (deuterium lamp and halogen
lamp) and three detectors (photomultiplier tube, InGaAs and PbS). The
spectra were recorded prior and after the centrifugation in order to ensure
that the properties of the colloids remained unaltered. The spectra were
normalized for analysis. Additionally, transmission electron micrographs of
the dried colloids were recorded with transmission electron microscope
Libra 200 (Carl Zeiss, Oberkochen, Germany) in Leibniz Institute for Polymer
Research, Dresden, Germany.
3.2.2. Uric acid sample preparation for SERS measurements
Uric acid powder was purchased from Sigma-Aldrich and used as
received. Its aqueous solutions of various concentrations were prepared by
diluting a 1×10⁻³ M stock solution with DI water. The latter was prepared by
adding 16,8 mg of uric acid into 98 ml of DI water. Two ml of 2 % NaOH
solution was added in order to dissolve the uric acid completely. Uric acid

116
solution of 65 mM concentration was prepared as well by adding 1 mg of uric
acid powder into mixture of 98 ml of DI water and 2 ml 2 % NaOH. Raman
spectrum of this sample was used in enhancement factor calculations.
The substrates for the SERS measurements were prepared by
dropping 23 μl of Ag NP colloid onto Al2O3 surface. The latter was obtained by
vacuum deposition of 150 nm Al layer on glass slides (pre-cleaned in an
ultrasonic bath by subsequent immersion into water, acetone, isopropanol
and methanol for 5 min. each). To form the oxide layer, the slides were kept
in an atmosphere for 24 h. Nine colloidal drops were dried in a closed
environment (chamber of 23 cm × 8 cm × 9 cm dimensions) at room
temperature (230 C). A hygrometer was placed in the box to read out humidity
data. Subsequently, 23 μl of uric acid solution was dropped onto the prepared
substrate and left to dry under the same conditions. The prepared samples
were rinsed with DI water and dried.
3.2.3. Raman and SERS measurements of uric acid aqueous solutions
Raman and SERS spectra (4000-70 cm-1) were recorded using
Fourier transform (FT) Raman spectrometer MultiRAM (Bruker Optik GmbH,
Ettlingen, Germany) equipped with Nd:YAG laser (1064 nm) and liquid-
nitrogen-cooled Ge diode detector. Gold plated mirror objective (focal length
– 33 mm) was used. Diameter of the laser beam at its focal point is 100 μm.
To obtain the spectra, 128 interferograms were averaged and the result was
Fourier transformed by applying Blackman-Harris 3-Term apodization function
and zero filling factor of 2. Spectral resolution of 4 cm-1 was used. Laser power
was set to 100 mW. The uniformity of the NPs films was checked for by
recording SERS spectra in 19 positions (approximately every 300 µm) across
the diameter of the dried samples. Otherwise, five to seven spectra were
recorded in randomly chosen points of each dried droplet. The recorded SERS
spectra were cut at 1750 cm-1 as the large wavenumber region did not contain

117
significant spectral information. Both SERS and Raman spectra were baseline
corrected (rubber band baseline correction).
3.2.4. Theoretical calculations of uric acid molecule
All DFT calculations were performed using Gaussian 09 software
[217]. Visualization of the molecules was performed with GaussView [218].
The geometries and normal vibrational modes of three most stabile
tautomers of uric acid, and three most stable anions [219] adsorbed on five-
atom silver cluster were calculated using B3LYP functional and LANL2DZ basis
set. Two different environments - vacuum and aqueous solvent -were
considered in the calculations. The geometry of the Ag cluster was pre-
optimized using the same conditions and kept "frozen" during the further
calculations. Various orientations of the molecules in respect to the silver
structure were considered and only the most stable structures are presented
herein. In order to achieve agreement between the calculated harmonic
frequencies and the experimental data, scaling factor was applied for the
calculated bands’ positions.

118
3.3. SERS spectroscopy of metabolites in solution: results and discussion
In this study we applied FT-Raman system with 1064 nm excitation
for detection of uric acid in aqueous solutions by means of colloidal SERS. The
NIR excitation ensured low or even absent fluorescence background in the
SERS spectra. However, due to strong water absorption in this spectral region
(third overtone of OH stretching vibration), the ability to measure wet
samples was limited and the sample drying procedure was applied. Normally,
drying a drop of colloidal solution leaves a ring-like structure of the colloidal
particles – a “coffee ring” [220,221]. In SERS, high signal enhancement can be
reached in the “coffee-ring” area; however, no reproducibility of the
enhancement factor can be expected [222]. Recently, many studies have been
carried out in order to understand and avoid formation of the ring [220,223–
227]. For example, Y. Xie et al. described a method which allows reproducibly
obtaining self-assembled monolayers of Au nanorods by controlling humidity
and temperature of the drying environment [228]. Furthermore, it has been
determined that wettability and temperature of the substrate on which the
colloid drop is casted has great influence on how the NPs settle [229–231]. All
of these factors should be considered when preparing SERS substrates by
drying the metal NPs colloids.
In this work we compared enhancement effects of various drop-
dried colloidal substrates with differently shaped silver nanoparticles and
found optimal experimental conditions for detection of uric acid in aqueous
solutions by means of SERS. Assignment of the SERS spectral bands was
performed by means of density functional theory (DFT) calculations.

119
3.3.1. Evaluation of the prepared SERS substrates
Normalized UV-VIS spectra of the three Ag NPs colloids are
presented in Figure 33. The absorption peaks arising from surface plasmon
resonance of the NPs in the Lee-Meisel, Leopold-Lendl and Aherne et al.
colloids are located at 428 nm (HWHM=188 nm), 411 nm (HWHM=84 nm) and
788 nm (HWHM=301 nm) respectively. The positions of the bands are
determined both by the shape and size of the nanoparticles while the widths
– by their size distribution [214–216,232]. In this case, diameter of the
spherical Ag nanoparticles in the Lee-Meisel and Leopold-Lendl colloids was
predicted to be approximately 30 - 80 nm while the edge length of the Ag
nanoprisms in the Aherne et al. colloid – 40 - 60 nm. This was confirmed by
recording and inspecting transmission electron micrographs of the dried
colloids (refer to Fig. AIV-1 (Appendix IV)). The normalized UV-VIS spectra of
the concentrated colloids remain the same implying that the centrifugation
does not affect the properties of the nanoparticles (refer to Fig. AIV-2
(Appendix IV)). When preparing different batches of the colloids, 12-20 nm
Fig. 33. UV-VIS spectra of Lee-Meisel (red), Leopold-Lendl (green) and Aherne et al.
(blue) colloids.

120
(up to 107 nm for the Aherne et al. colloids) deviation of the SPR peak
position was observed.
The colloids were drop-dried in order to prepare SERS substrates
suitable for the measurements with NIR (1064 nm) excitation. In preparing of
the substrates much effort was put to avoid the “coffee-ring” formation and
achieve uniform layering of the NPs. Aluminum oxide was chosen as a surface
to dry the colloids on. It has lower wettability than the commonly used glass
which results in collecting of NPs in smaller area [229], however, initial
pinning still takes place (pinning is generally not observed on highly
hydrophobic surfaces) and no secondary rings of NPs aggregates form while
drying [230]. In addition, the velocity of the flow that causes the NPs to
migrate to the edge and form the “coffee-ring” is smaller in the drops with
larger contact angles, i.e., drops on hydrophobic surfaces [233]. The drops
were dried at room temperature in a closed chamber. The initial humidity of
the chamber was 29 % as determined by the air conditioning in the laboratory
room. Initially, fast evaporation of the drops takes place in the closed
Fig. 34. Gradient of humidity during drying of 9 colloidal drops in a closed chamber of
23 cm × 8 cm × 9 cm dimensions.

121
chamber and causes pinning of the drops’ edges [228]. Subsequently, the
humidity rises and the rate of the evaporation decreases causing near-
equilibrium evaporation processes [228]. Such slow evaporation prevents
many of the NPs from migrating to the edge and agglomerating. The gradient
of the humidity during the process is presented in Figure 34. Drying at room
temperature also contributes to the formation of nearly uniform coverage of
base area of the drops [231].
The images of the dried drops are presented in Figure 35 A. It can
be seen that on the edge of the Lee-Meisel colloidal drop there is a thin ring
Fig. 35. (A) Images of the dried colloidal circularly shaped drops (from the left to right):
Lee-Meisel, Aherne et al., Leopold-Lendl; (B) Profiles of SERS enhancement factor
distribution across the drops: red – Lee-Meisel, blue – Aherne et al., green – Leopold-
Lendl colloid.

122
of silver agglomerates. These agglomerates are already in micrometer scale
which means that they are washed away during rinsing of the substrates with
distilled water and/or provide no enhancement effect. The rest of the drop
area appears nearly uniformly covered with the NPs, similarly as the Leopold-
Lendl and the Aherne et al. dried colloidal drops. To check the uniformity of
the NPs film, SERS spectra were recorded in 19 positions (approximately every
300 µm) across the diameter of the dried samples. It is expected that
formation of the “coffee-ring” would reason stronger SERS signal on the edges
of the samples. A graph of analytical enhancement factors (AEFs) of the SERS
spectra in each measurement position is presented in Figure 35 B. They were
calculated as described by E. C. Le Ru et al. [234] for the spectral band at
500 cm-1 representing CN bending/in-plane ring deformation vibrations in uric
acid. Raman spectrum of 65 mM uric acid solution was used in the calculation
(see Fig. AIV-3 (Appendix IV)). Analytical enhancement factor shows how
much more signal can be recorded by SERS as compared to the normal Raman
scattering spectroscopy and was calculated as follows:
𝐴𝐴𝐴 = 𝐼𝑆𝑆𝑆𝑆/𝑐𝑆𝑆𝑆𝑆𝐼𝑆𝑆/𝑐𝑆𝑆
,. (16)
here ISERS and IRS are integral intensities of the characteristic spectral bands in
the SERS and Raman scattering spectra respectively; cSERS and cRS are
concentration of the analyzed solutions.
No increase in the AEF values was observed on the edges of the
samples. For the samples prepared by using Lee-Meisel and Leopold-Lendl
colloids, the AEF varies somewhat with the measurement positions (relative
standard deviation for both samples was approx. 30 %). Therefore, the whole
drop area can be exploited for the measurements. The variations could be
accounted for by variations in the uniformity of the NPs’ film. This is expected,
as there is a distribution of shapes and sizes of NPs in the colloids. Similar
profiles were obtained for different samples prepared by using different
batches of colloids (refer to Fig. AIV-4 – Fig. AIV-6 (Appendix IV)). For the
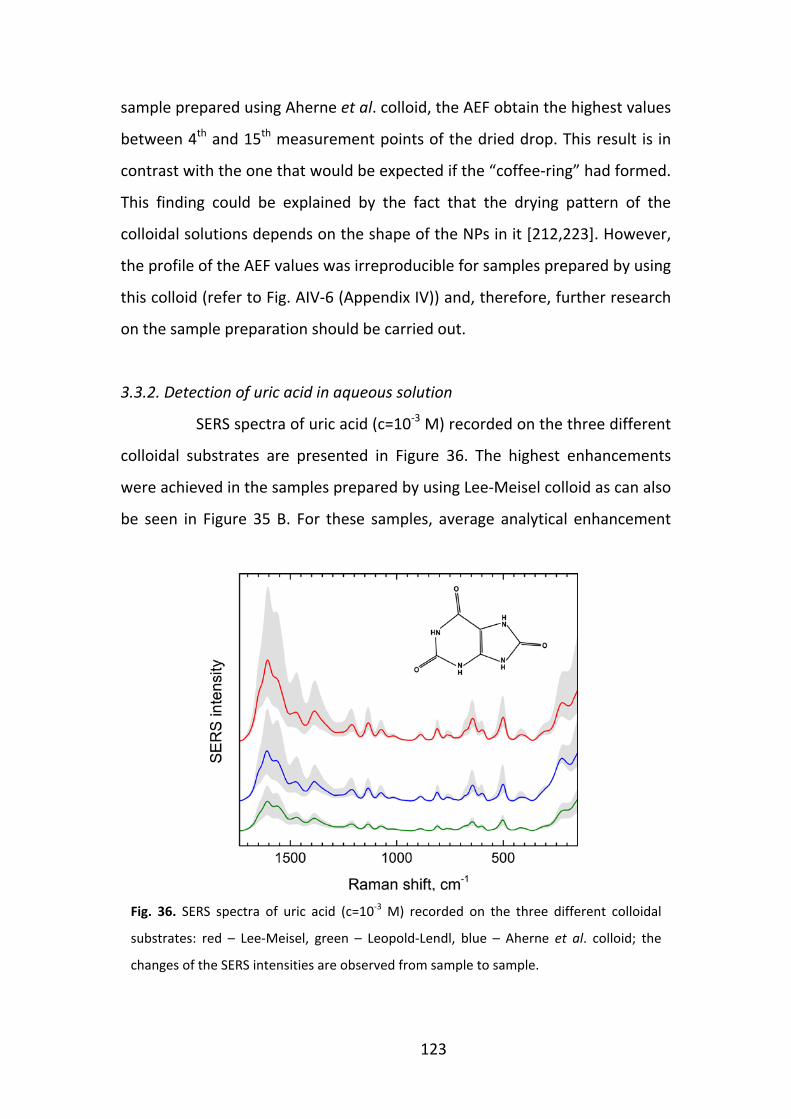
123
sample prepared using Aherne et al. colloid, the AEF obtain the highest values
between 4th and 15th measurement points of the dried drop. This result is in
contrast with the one that would be expected if the “coffee-ring” had formed.
This finding could be explained by the fact that the drying pattern of the
colloidal solutions depends on the shape of the NPs in it [212,223]. However,
the profile of the AEF values was irreproducible for samples prepared by using
this colloid (refer to Fig. AIV-6 (Appendix IV)) and, therefore, further research
on the sample preparation should be carried out.
3.3.2. Detection of uric acid in aqueous solution
SERS spectra of uric acid (c=10-3 M) recorded on the three different
colloidal substrates are presented in Figure 36. The highest enhancements
were achieved in the samples prepared by using Lee-Meisel colloid as can also
be seen in Figure 35 B. For these samples, average analytical enhancement
Fig. 36. SERS spectra of uric acid (c=10-3 M) recorded on the three different colloidal
substrates: red – Lee-Meisel, green – Leopold-Lendl, blue – Aherne et al. colloid; the
changes of the SERS intensities are observed from sample to sample.

124
factor (AEF) was calculated to be 2.63∙104. For the samples prepared by using
Leopold-Lendl and Aherne et al. colloids the average AEFs were 1.21∙104 and
1.89∙104 respectively.
Considering the reproducibility of the drop drying pattern and the
enhancement obtained with each type of the colloidal substrates, we have
chosen the Lee-Meisel colloid for further experiments.
SERS spectra of uric acid solutions of different concentrations are
presented in Figure 37. Strong SERS signal of uric acid aqueous solution with
concentrations down to 10-6 M (Fig. 37 C) was observed and SERS spectra
could be recorded without any changes in experimental conditions (such as
increasing number of scans or laser power). Medically relevant concentrations
of uric acid range between 10-4 M and 10-3 M. The above results show that
colloidal SERS is sensitive enough and could be used for detection of uric acid
in biological fluids.
Fig. 37. SERS spectra of uric acid solutions obtained by using Lee-Meisel colloidal
substrate: A – 10-3 M, B – 10-5 M, C – 10-6 M.

125
Table 3 shows the relations between integral intensity of well
separated SERS spectral bands characteristic to uric acid, CN bending/in-plane
ring deformation at 500 cm-1 and CN stretching/mixed vibrations at 1135 cm-1,
and concentration of the sample solutions. The mean spectra represented as
black lines in Figure 37 were used for the calculations. The integral intensity
values increase linearly which suggests possibility of estimating concentration
of uric acid. The ratio of the integral intensity values of the bands does not
vary with concentration which suggests that the orientation of uric acid in
respect to the metal nanoparticle surface does not depend on the amount of
adjacent molecules. Considering the intensity variations from-sample-to-
sample observed in Figure 37 (grey areas), only semi-quantitative analysis,
when concentration is determined with precision within order of magnitude,
is possible. This is a well-known issue and large effort is made to develop
methods of sample preparation to obtain reproducible SERS enhancement
[235–238]. In this work, the use of hydrophobic aluminum oxide surface as a
substrate and a sealed chamber for drying of the colloidal drops allowed
obtaining nearly uniform distribution of Ag NPs in the drops’ area and avoid
the “coffee-ring” formation. Despite the fact that high reproducibility was not
yet achieved, this implies that strict control of sample preparation conditions
could eventually lead to creation of reproducible self-assembled layers of NPs
Table 3. Integral intensities of SERS spectral bands characteristic to uric acid, CN
bending/in-plane ring deformation at 500 cm-1 and ring vibrations at 1121 cm-1, at
different concentration of uric acid aqueous solutions. The last column shows the ratios
of the integral intensity values of the bands.
Concentration, µM
Integral intensity of spectral band at 500 cm-1 (δ(CN)/ring
vibrations): I 500
Integral intensity of spectral band at 1135 cm-1
(ν(CN)/mixed): I 1135
I 500 /I 1135
1 2.47 0.99 2.49100 3.25 1.46 2.231000 5.86 2.78 2.11
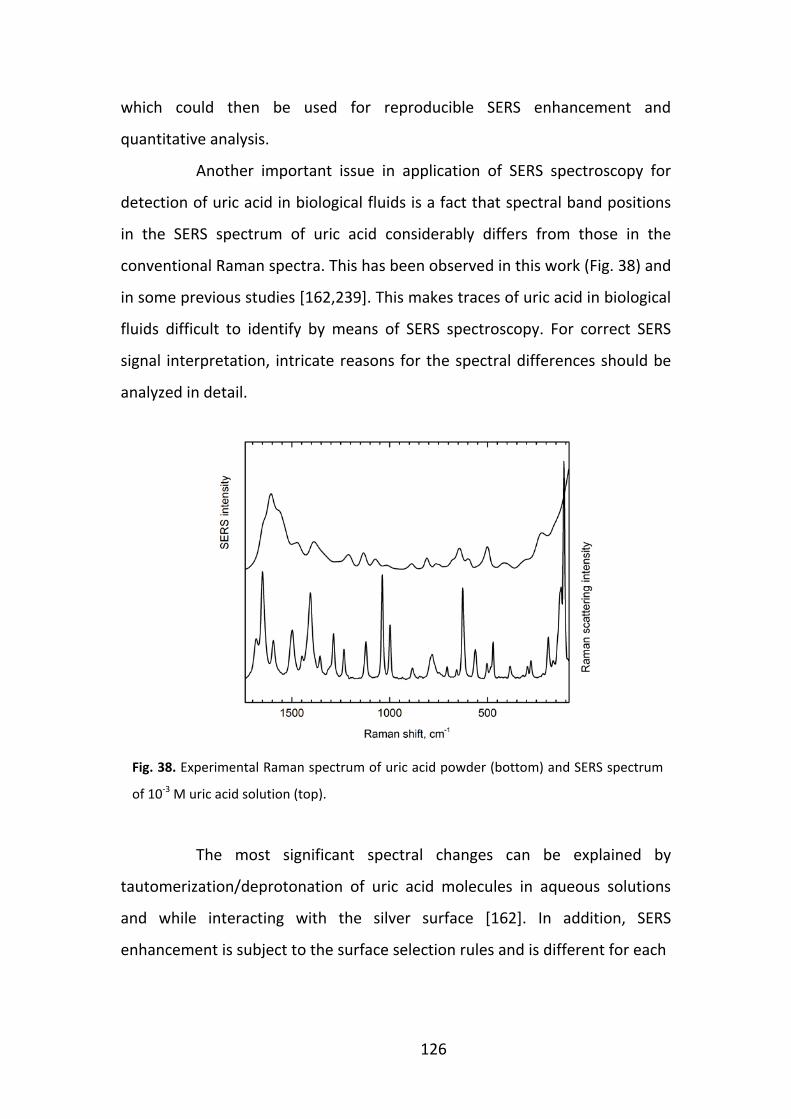
126
which could then be used for reproducible SERS enhancement and
quantitative analysis.
Another important issue in application of SERS spectroscopy for
detection of uric acid in biological fluids is a fact that spectral band positions
in the SERS spectrum of uric acid considerably differs from those in the
conventional Raman spectra. This has been observed in this work (Fig. 38) and
in some previous studies [162,239]. This makes traces of uric acid in biological
fluids difficult to identify by means of SERS spectroscopy. For correct SERS
signal interpretation, intricate reasons for the spectral differences should be
analyzed in detail.
The most significant spectral changes can be explained by
tautomerization/deprotonation of uric acid molecules in aqueous solutions
and while interacting with the silver surface [162]. In addition, SERS
enhancement is subject to the surface selection rules and is different for each
Fig. 38. Experimental Raman spectrum of uric acid powder (bottom) and SERS spectrum
of 10-3 M uric acid solution (top).

127
vibrational mode [64]. We performed DFT calculations of monomeric uric
acid molecule and its most stable tautomers and anions adsorbed on Ag
cluster (refer to Fig. AIV-7 (Appendix IV)) in order to explain the observed
spectral changes and to assign spectral bands in the SERS spectra.
The calculated structure of the most stabile uric acid tautomer -
five-atom silver cluster complex in vacuum is presented in Figure 39 A. The
scaled (Scaling Factor = 0.94) calculated Raman spectrum of this complex and
the measured SERS spectrum in the 1740-150 cm-1 spectral region are
depicted in Figure 39 B. The calculations where water as a solvent (uniform
Fig. 39. (A) – The most stabile uric acid tautomer-Ag cluster complex (dark grey – carbon,
dark blue – nitrogen, red – oxygen, light grey – hydrogen, light blue – silver); blue arrows
depicts atoms’ displacement vectors, yellow arrow – transition dipole moment vector; (B)
- scaled calculated spectrum (bottom) and the measured SERS spectrum (top) in the
1740-150 cm-1 spectral region.

128
dielectric medium) was taken into account did not provide relevant changes
in the structures or vibrational spectra of the complexes and will not be
discussed separately.
In the 1740-900 cm-1 spectral region high correlation between the
calculated and experimental spectrum is observed. This allows concluding
that both tautomerization of the molecule and its adsorption to the metal
influence the changes in the SERS spectra. The inconsistencies in the 900-
300 cm-1 spectral region could be explained by the fact that electromagnetic
enhancement effect was not included in the calculations. It can be seen in
Figure 39 B that the spectral bands in the SERS spectrum can be assigned to
certain modes in the calculated spectrum, but the relative intensities are in
disagreement. Visualization of transition dipole moment vector (Fig. 39 A) of
vibrations in this spectral region allowed predicting the role of the
electromagnetic enhancement effect. The vector perpendicular to the surface
of the silver cluster implies that the Raman scattering from that mode is
highly enhanced and the corresponding spectral band appears much more
intense in the experimental spectrum. The assignments of spectral bands are
summarized in Table 4.
The obtained results on uric acid detection are important for
reasoned selection of experimental conditions; also, for correct interpretation
of SERS spectra and detection of uric acid in bodily fluids such as blood and
urine. However, real clinical practice requires quantitative information to be
feasible. In addition, biological fluids contain a wide variety of molecules that
can adsorb on the metal surface and provide SERS signal. Therefore, in order
to apply SERS spectroscopy as a diagnostic method in clinical practice further
research on selectivity and quantification should be carried out.

129
Table 4. Experimental SERS (10-3 M uric acid solution) and calculated Raman vibrational
modes and their assignment.
Experimental SERS mode
(cm-1)
Calculated mode
(cm-1) Assignment
411 421 ip ring deformation *
501 550 CN bending/ip ring deformation
601 596 oop NH bending/oop ring deformation **
644 636 CO bending/skeletal ring deformation [207]
764 757 oop NH bending/ring vibration [207] **
809 821 CN bending/ip ring deformation [207]
887 916 CN stretching/NH bending [207]
1011 999 CN stretching/ring vibrations [207]]
1074 1060 CN stretching/OH bending/mixed [207]
1135 1174 CN stretching/mixed [207]
1214 1257 ip NH bending/mixed [207] **
1386 1376 CN stretching/ip NH, OH bending ***
1502 1480 CN, CC stretching, NH, OH bending [207]
1567 1567 C=C, CN stretching, NH, OH bending
1607 1609 C=O stretching *
* strongly enhanced
** not enhanced
*** little enhanced ip – in-plane oop – out-of-plane

130
3.4. Analysis of extracellular fluid for kidney cancer diagnosis
3.4.1. Kidney cancer
Cancer (depending on its type) is one of the leading causes of
morbidity and mortality worldwide. It refers to a group of diseases that can
affect any part of human body and which are characterized by formation of
abnormal, uncontrollably growing and proliferating tissue cells. These cells
may form a mass – a tumor, disrupt tissue structure and obstruct normal body
function which leads to serious ailment and/or death. They are also able to
invade adjacent body parts and spread to other organs (metastasize). The
number of recorded cancer cases is constantly increasing and is expected to
rise up to 70 % in the next twenty years [240].
Cancer types are discriminated according to the organ the cancer
starts in and the appearance of the cancer cells. It is further classified and
graded according to its anatomical extent, size and abnormality of cancer cells
[241]. One of the common classification systems is TNM (tumor, nodes,
metastases) [242,243]. It describes whether the tumor is localized in the
organ of origin (T), whether it has any involvement with lymph nodes (N) or
metastases in distant organs (M). A number (1-4) next to the letter refers to
the extent of the tumor: the higher the number the larger and the more
spread is the cancer. Its size is further specified by letters A or B next to the
number. Tumor grade is denoted by letter G and a number (1-4): the higher
the number, the more abnormal are the cancer cells.
Kidneys have important functions in human body. They produce
urine with which waste products are eliminated from the body. At the same
time, they regulate fluid, acid-base and electrolyte balance. There are several
types of kidney cancer that impair with these functions, however, renal cell
carcinoma accounts for approximately 90 % of all cases [244]. According to
histological examination malignant renal cell carcinoma is further divided into

131
five sub-types: clear cell (80 %), papillary (10%), chromophobe (5 %),
collecting duct (5%) and unclassified (5 %) [244]. The earlier it is diagnosed
and the more effective the treatment, the less problems it will cause. Partial,
simple and radical nephrectomy (surgical kidney removal) is currently the
main method for treating cancer [245]. Only partial nephrectomy (only the
tumor and part of the kidney is removed) allows sparing some kidney
function. On the other hand, it is extremely important that all the cancer cells
are removed to prevent recurrences. Therefore, ability to determine exact
borders between healthy and tumor tissues are vital. Currently, standard
procedure for this purpose is histological examination of biopsied tissue [246].
Such procedure requires time for transferring the specimen to the histology
lab, sample preparation (cryosectioning and staining) and examination. The
waiting for the results can either prolong the surgery or require repeated
surgical intervention. In addition, diagnosis made according to the histological
examination is mostly based on subjective descriptors of tissue and cell
structure. Therefore, there is a growing need for new intra-operative
diagnostic methods which could provide reliable information about the tissue
type and would allow indicating borders between healthy and cancerous
tissue. Use of intrinsic biochemical cancer markers could provide information
about pathological changes at their very early stage, thus making the
determination of the borders more reliable.
3.4.2. Vibrational spectroscopy applications for cancer diagnostics
IR spectroscopy is a candidate method for analysis of biopsied
tissue samples. IR absorption spectra can be recorded in fraction of a minute.
Their analysis allows obtaining biochemical information about the sample,
which could be further used to discriminate between healthy and cancerous
tissues. In addition, compact modern FTIR spectrometers can be used directly
in the operating room (OR) for in situ analysis. Such approach has been

132
already successfully implemented in brain surgery [247]. There is also a
multitude of laboratory research carried out in this field and on various other
tissue types [18,248–251]. Wider implementation of the method in clinical
practice is limited by problematic sample preparation and complex data
analysis. Since tissue contains water, which has strong absorbance in the IR
spectral region (namely at 1400-1800 cm-1 and 2600-3800 cm-1), it needs to
be dried. Thin (10-50 μm) dried cryosections of tissues are usually used in IR
spectroscopy [23]. Such sample preparation takes time and affects tissue
structure (the cells are possibly damaged when the tissue is frozen, sectioned
and thawed) [252]. In addition, tissue is built from large polyatomic molecules
(proteins, lipids, carbohydrates, fatty acids, etc.) which all contribute to the IR
absorption spectra. Thus, small differences in the chemistry of healthy and
cancerous tissues may remain obscured or complex statistical analysis is
needed to analyze the spectra.
The minor changes in biochemistry of cancer cells as compared
with the healthy ones are difficult to detect by IR spectroscopy. However, the
consequence of these changes – significantly increased metabolism [253] –
could be easier to spot. Cancerous cells need more nutrition to sustain their
fast growth and proliferation. The nutrients reach the cells from blood
through extracellular fluid (ECF) [254]. Thus, it is expected that the chemical
composition of the ECF around the cancerous cells is altered considerably
with increased concentrations of glucose and lipids [255,256]. As the tumor
grows, part of its cells appears far away from the blood vessels providing the
nutrients and oxygen. For this reason, some types of cancer (kidney, uterus,
bladder, ovary, skin and brain) accumulate glycogen – polysaccharide of
glucose – to a great extent in order to survive under hypoxic conditions and in
environment poor in nutrients [257]. The rapid metabolism also provides
increased amounts of waste products (such as lactic acid) in the ECF. The first
attempt to obtain infrared spectra of ECF surrounding healthy and cancerous

133
tissue cells was made by our group [258]. It was shown that the spectra of ECF
differ, but no statistics was performed due to insufficient number of samples.

134
3.5. IR spectroscopic analysis of ECF: experimental details
3.5.1. ECF sample preparation
Tissue samples were obtained from Vilnius University hospital
Santariskiu Klinikos during partial, simple or radical nephrectomy. The
protocol of this study was approved by Vilnius regional bioethics committee
(approval No. 158200-15-803-312). Thin films of ECF were prepared by
pressing small piece of the freshly resected human kidney tissue against
diamond ATR element of FTIR spectrometer Alpha (Bruker Optik GmbH,
Ettlingen, Germany). The tissue was removed from the element after a few
seconds and the remaining ECF was left to dry at room temperature.
3.5.2. FTIR spectroscopy measurements of ECF films
IR absorption spectra of the ECF samples were collected in ATR
mode of FTIR spectrometer Alpha (Bruker Optik GmbH, Ettlingen, Germany)
equipped with single reflection diamond ATR crystal and DTGS detector. From
the moment the sample was placed on the ATR element, repeated
measurements were performed collecting 4 scans for each spectrum until the
ECF dried. The spectra were recorded in 4000-800 cm-1 spectral range with
spectral resolution of 4 cm-1. Interferograms were Fourier transformed into
spectra applying Blackmann-Harris 3 apodization function and zero filling
factor 2.
3.5.3. Spectral analysis of ECF films
Ten IR spectra of each of the dried ECF samples were averaged into
one resultant spectrum. Baseline correction was applied to the spectra before
qualitative spectral analysis. In order to evaluate whether spectral differences
between spectra of healthy and cancerous tissue correspond to the tissue

135
type, multivariate analysis was used. Vector normalized, first derivative
spectra were used in the HCA and PCA. MATLAB package (Version 7.14, The
MathWorks, Inc., USA) was used for the analysis. For the HCA, Ward’s
algorithm was used to group the data according to Euclidean distances
between the spectra in the 1200-890 cm-1 spectral region where lies the most
significant differences between the samples obtained from healthy and
cancerous tissue. Tree diagrams, or dendrograms, were constructed to
represent the results of the clustering. An algorithm of optimal leaf ordering
was applied for the adjacent clusters to have the highest similarity [259].
PCA was performed using MATLAB function princomp. PC score
plots were constructed from the first two principal components (representing
approx. 85 % of variance) in order to observe relationship between the data.

136
3.6. IR spectroscopic analysis of ECF: results and discussion
There is a growing need for new intra-operative diagnostic
methods which could provide reliable information about the tissue type and
would allow indicating borders between healthy and cancerous tissue. Here,
ECF samples taken from healthy and cancerous tissue were analyzed by
means of ATR FT-IR spectroscopy. HCA and PCA were applied to examine the
spectral differences between normal tissue and various tumors and
determine whether the method could be suitable for clinical practice.
Table 5. Grouping of tissue samples obtained after partial, simple or radical nephrectomy
from patients with kidney tumors; this grouping is according to the tissue type and tumor
grade as determined by histopathology.
*Unless stated otherwise under Remarks, all the tumors were diagnosed as clear cell renal cell
carcinoma
Tissue type
Number
of
patients
Remarks
Normal tissue 84
G1* 11 1 sample – chromophobe renal cell
carcinoma
G2* 44 2 samples – papillary, 2 samples –
multilocular cystic, 1 sample - chromophobe renal cell carcinoma
G3* 23 1 sample - mixed epithelial and
stromal tumor, 1 sample – papillary renal cell carcinoma
Kidney angiomyolipoma 1
Kidney oncocytoma 4
Pyelonephritis 1

137
The spectral measurements were performed directly in the OR
during surgery of 84 patients. For each patient two tissue samples – normal
and tumor were taken and used for preparation of thin ECF film on the
diamond ATR crystal. Information from histopathological examination was
later obtained and used to group the samples according to tumor type and
grade (Table 5).
Baseline corrected IR absorption spectra of the ECF films of normal
(healthy) and tumor tissue are presented in Figure 40. The red curves
represent averages of the spectra while the grey areas show variations
between the spectra in each group. In the 1700 – 1500 cm-1 spectral region
the Amide I and Amide II protein bands are located. It has been shown that
the structure of these bands is highly sensititve to protein structures [260].
However, it can be seen that the main spectral differences between the
Fig. 40. Baseline corrected IR absorption spectra of the ECF films of healthy (top) and
tumor (bottom) tissue. The gray areas represent variations of spectral intensity
between different samples.

138
normal and tumour ECFs are in the 1200 – 890 cm-1 spectral region.
Carbohydrates and phospholipids give rise to the spectral bands in this region.
Three strong bands at 1152, 1080 and 1022 cm-1 in the spectra of
ECF taken from cancerous tissue are assigned to δ(CHO) and υ(C-O) vibrations
in glycogen and glucose [261]. Reference spectra of synthetic glucose,
glycogen and lactic acid were recorded in order to clarify the assignment
(Fig. 41). It can be seen that spectral bands of glucose and, in particular,
glycogen correspond to the bands observed in the spectra of the ECF.
According to Warburg effect, cancer cells predominantly produce energy by
fast-rate glycolysis which allows them proliferating faster and adapting to
anaerobic conditions when the tumor cells grow far away from blood vessels
Fig. 41. IR absorption spectra of synthetic glucose, glycogen and lactic acid. The enlarged
spectral region at 1200-890 cm-1 contains spectral bands assigned to δ(CHO) and υ(C-O)
vibrations.

139
[262]. Additionally, it has been shown that glucose in kidney cancer cells (and
the most frequent clear cell renal cell carcinoma in particular) is stored in
cytosol in form of glycogen [257]. The fact that both glycogen and glucose
spectral bands can be observed in the spectra suggests that the sample film
contains not only the ECF but also detached cells and intracellular fluid from
damaged cells in the tissue. Situation is different for normal cells. Low-rate
glycolysis in normal cells serves as an efficient energy source and less glucose
has to be supplied by ECF. Some glucose in such cells are converted to
glycogen and stored in cytosol as fast energy source in case of urgent demand
of energy. Low concentrations of glucose and glycogen in the fluid samples of
normal tissue cause the absence of their characteristic infrared spectral
bands.
We have also measured IR absorption spectra of dried tissue
samples by means of ATR FTIR spectroscopy. The small tissue sections used to
obtain ECF films were dried in vacuum and then pressed to the ATR crystal to
record the spectra. Although not shown here, the spectral results are similar
to those obtained for the ECF films – spectra of cancerous tissue contains
glycogen/glucose spectral bands in the 1200 – 880 cm-1 spectral region
whereas spectra of normal tissue – do not. This is in contrast to the results
obtained from the spectra of cryosectioned tissue samples where the spectral
differences are hardly visible and statistical analysis is required to
differentiate the tissue type [51]. Possibly, in case of cryosectioned tissue
sample preparation (snap-freezing, sectioning, thawing and drying) causes
changes in the carbohydrate content of the sample [252].

140
Multivariate data analysis allows better evaluation of relationship
between samples. HCA was applied to the spectra of ECF films of healthy and
grade G1 - G3 tumour tissue. Two main well separated clusters can be
observed in the dendrogram in Figure 42. The first cluster – coloured in green
(Branch I) – is mainly constituted from the spectra of healthy tissue films. The
three spectra of cancerous tissue films (red and orange) infiltrated in this
group under closer inspection were revieled to contain major lipid bands. This
could be the reason for their clustering in the group of healthy tissue films. It
can also be observed that there are several sub-clusters in this group. This
shows that the spectra of healthy tissue films taken from different patients
are not identical. The second major group – coloured in yellow, orange and
red according to the tumour grade (Branch II) – is mainly consituted from the
spectra of cancerous tissue films. Due to high variations between the spectra
and the relative intensity of the glycogen/glucose bands as seen in Figure 40,
Fig. 42. Dendrogram representing results of HCA of IR spectra of ECF taken from healthy
kidney tissue and cancerous kidney tissue of various tumor grades.

141
no significant grouping according to the tumour grade can be observed in this
group. Similarily as in the group of healthy tissue films, the observed sub-
clusters mainly represent differences between spectra recorded in the
samples from different patients. They can be explained by several reasons.
Firstly, when stamping the tissue to obtain films, only particular small area of
the tumour or healthy tissue is sampled. Naturally, there might be variations
in chemistry between different areas in the tissue which subsequently cause
variations in the spectra. On the other hand, a concept of personalized
medicine reasons that molecular content is changing from patient to patient.
Subsequently, the variations in the spectra of tissue films taken from different
patients are observed. However, the obvious clustering of spectra of healthy
and tumour tissue films imply that they can be used to differentiate between
the tissue types. Of note is that including the spectra of benign tumours into
the analysis resulted them being clustered in the group of healthy tissue films.
According to the HCA results presented in Figure 42, sensitivity and
specificity values were calculated. Sensitivity shows the ability of a method to
correctly identify cancer and is calculated as follows [263]:
negatives Falsepositives Truepositives TrueySensitivit+
= , (17)
here True positive is the number of cases when the result of analysis predicts
cancer and the patient has the disease; False negative is the number of cases
when the result of analysis does not predict cancer, but the patient has the
disease. Similarly, specificity shows the ability of a method to corectly identify
healthy tissue and is calculated as follows [263]:
positives Falsenegatives Truenegatives TrueySpecificit+
= , (18)
here True negatives is a number of cases when the result of analysis correctly
identifies healthy tissue; False positives is a number of cases when the result
of analysis predict cancer, but the patient does not have the disease. The
sensitivity and specificity values obtained for the HCA analysis of the IR

142
absorption spectra of the ECF samples were 91 % and 96 % respectively. This
result means that spectra of ECF taken from healthy tissue can be better
identified than spectra of ECF taken from cancerous tissue. This is reasoned
by the fact that in the latter spectral variations from sample to sample and
due to different tumour grades are larger. The relatively low sensitivity value
shows that more samples have to be investigated and the spectral analysis
methods improved before IR spectroscopy can be applied in clinical practice.
In order to test whether IR absorption spectra of tissue films from
tumours of different malignancies could be differentiated, HCA was
performed on the spectra of benign tumours and tumours of grades G1 and
G3. The corresponding dendrogram is presented in Figure 43. Similarily as in
the dendrogram in Figure 42, two major clusters (coloured in blue (Branch I)
and red (Branch II)) can be observed. However, the grouping of the spectra is
Fig. 43. Dendrogram representing results of HCA of IR spectra of ECF taken from benign
kidney tumors (oncocytomas and angiomyolipoma), kidney tissue inflamation
(pyelonephritis) and kidney tumors of grades G1 and G3.

143
not so distinct as in the case of healthy and tumour tissues. The first (I) cluster
contains two sub-clusters one of which mainly contains spectra of begnin
tumours. However, the second sub-cluster as well as the second cluster (II)
contains spectra of G1 and G3 graded tumour films intermixed between
themselves. Again, this can be reasoned by variations in chemistry between
different areas in the tissue or variations in the spectra of tissue films taken
from different patients. In addition, limited amount of samples could cause
the inconclusive results of the HCA.
Averaged IR absorption spectra of ECF taken from cancerous
kidney tissue of various grades and a benign tumor – oncocytoma are
presented in Figure 44. The spectra are normalized according to the Amide I
spectral band at 1650 cm-1. Differences in relative intensity of
glycogen/glucose spectral bands for each type of tissue can be observed. The
more malignant the tumour, the more pronounced the glycogen/glucose
Fig. 44. Normalized (according to the Amide I band) averages of IR absorption spectra of
ECF taken from cancerous kidney tissue of various grades and a benign tumor –
oncocytoma.

144
bands are. On the other hand, due to the variations between the spectra
(Fig. 40), the averaged spectra of G1 and G2 tumours are highly similar. The
averaged spectrum of oncocytomas (Fig. 44) resemble spectra of healthy
tissue ECF films (Fig. 40). This explains their clustering in the group of healthy
tissue ECF films as mentioned above.
PCA was performed as a complementary data analysis technique to
show the relationship between the IR absorption spectra of healthy and
tumor tissue films and the spectra of benign tumors and tumors of grade G1
and G3. The corresponding PC score plots of the first two principal
components are presented in Figure 45 and Figure 46. The results of the PCA
can be interpreted in a similar way as the results of the HCA. In Figure 45, the
clusters of healthy and tumor tissues are well separated. It can be observed
that while the data points in the group of the healthy tissue (green) are
localized and relatively close to each other, the data points in the group of the
Fig. 45. Principal component score plot representing results of PCA of IR spectra of ECF
taken from healthy kidney tissue and cancerous kidney tissue of various tumor grades.

145
tumor tissue (red) are more spread out which means that the spectral
differences are larger in this group.
In Figure 46 the clusters of benign tumors and tumors of grade G1
and G3 are mostly separated as well. This plot supplements the results
presented in Figure 43, as it can be observed that the data points in the group
of G3 tumors (red) are less spread than others. This shows that the spectral
differences vary less between spectra of this group; thus, it can be well
separated from the group of G1 and benign tumors (light blue).
Fig. 46. Principal component score plot representing results of PCA of IR spectra of ECF
taken from benign kidney tumours (oncocytomas and angiomyolipoma), kidney tissue
inflamation (pyelonephritis) and kidney tumours of grades G1 and G3.

146
3.7. Vibrational spectroscopy analysis of biological fluids: conclusions
1. For detection of metabolites in biological fluids, drop-dried colloidal
substrates using Lee-Meisel, Leopold-Lendl and Aherne et al. colloids
containing nanoparticles of different shapes were produced. Nearly
uniform spread of the nanoparticles across the area of the drop was
achieved which, in turn, led to relatively small variance (approx. 30 %) in
analytical enhancement factor across the drops’ diameter.
2. The SERS substrates produced by using the Lee-Meisel colloid allowed
detecting uric acid in aqueous solutions of concentrations down to 10-6 M.
DFT calculations of uric acid tautomer – five-atom silver cluster complexes
allowed correct assignment uric acid spectral bands in SERS spectra.
Differences between Raman and SERS spectra of uric acid can be mainly
explained by tautomerization of the molecule and its bonding to the silver
surface.
3. IR absorption spectra of dried ECF taken from kidney tissue contain
reliable spectral markers, mainly assigned to glycogen, capable of
differentiating between healthy and tumor tissue. Results of the HCA of
the spectra show that the spectra of healthy and tumor tissue films can
be reliably separated into two groups. Sensitivity and specificity values of
the method are 91 % and 96 % respectively.

147
Bibliography [1] F. Siebert and P. Hildebrandt, Vibrational spectroscopy in life science
(Wiley-VCH, Weinheim, 2008).
[2] P. Lasch and J. Kneipp, Eds., Biomedical vibrational spectroscopy (Wiley-
Interscience, Hoboken, N.J, 2008).
[3] C. Krafft and J. Popp, The many facets of Raman spectroscopy for
biomedical analysis, Anal. Bioanal. Chem. 407, 699–717 (2014).
[4] C. Krafft, I. W. Schie, T. Meyer, M. Schmitt, and J. Popp, Developments
in spontaneous and coherent Raman scattering microscopic imaging for
biomedical applications, Chem. Soc. Rev. 45, 1819–1849 (2016).
[5] C. Hughes and M. J. Baker, Can mid-infrared biomedical spectroscopy of
cells, fluids and tissue aid improvements in cancer survival? A patient
paradigm, Analyst 141, 467–475 (2016).
[6] L. Opilik, T. Schmid, and R. Zenobi, Modern Raman Imaging: Vibrational
Spectroscopy on the Micrometer and Nanometer Scales, Annu. Rev.
Annal. Chem. 6, 379-398 (2013).
[7] A. A. Bunaciu, S. Fleschin, and H. Y. Aboul-Enein, Biomedical
Investigations Using Fourier Transform-Infrared Microspectroscopy,
Crit. Rev. Anal. Chem. 44, 270–276 (2014).
[8] H. Kim and M. Cho, Infrared Probes for Studying the Structure and
Dynamics of Biomolecules, Chem. Rev. 113, 5817–5847 (2013).
[9] R. Adato and H. Altug, In-situ ultra-sensitive infrared absorption
spectroscopy of biomolecule interactions in real time with plasmonic
nanoantennas, Nat. Commun. 4, 2154 (2013).
[10] A. Rygula, K. Majzner, K. M. Marzec, A. Kaczor, M. Pilarczyk, and M.
Baranska, Raman spectroscopy of proteins: a review, J. Raman
Spectrosc. 44, 1061–1076 (2013).

148
[11] M. J. Baker, S. R. Hussain, L. Lovergne, V. Untereiner, C. Hughes, R. A.
Lukaszewski, G. Thiéfin, and G. D. Sockalingum, Developing and
understanding biofluid vibrational spectroscopy: a critical review,
Chem. Soc. Rev. 45, 1803–1818 (2016).
[12] J.-X. Cheng and X. S. Xie, Vibrational spectroscopic imaging of living
systems: An emerging platform for biology and medicine, Science 350,
aaa8870 (2015).
[13] M. Diem, A. Ergin, S. Remiszewski, X. Mu, A. Akalin, and D. Raz, Infrared
micro-spectroscopy of human tissue: principles and future promises,
Faraday Discuss. (2016).
[14] D. I. Ellis, D. P. Cowcher, L. Ashton, S. O’Hagan, and R. Goodacre,
Illuminating disease and enlightening biomedicine: Raman spectroscopy
as a diagnostic tool, Analyst 138, 3871–3884 (2013).
[15] A. L. Mitchell, K. B. Gajjar, G. Theophilou, F. L. Martin, and P. L. Martin-
Hirsch, Vibrational spectroscopy of biofluids for disease screening or
diagnosis: translation from the laboratory to a clinical setting, J.
Biophotonics 7, 153–165 (2014).
[16] M. J. Baker and K. Faulds, Fundamental developments in clinical
infrared and Raman spectroscopy, Chem. Soc. Rev. 45, 1792–1793
(2016).
[17] C. Petibois and B. Desbat, Clinical application of FTIR imaging: new
reasons for hope, Trends Biotechnol. 28, 495–500 (2010).
[18] A. B. Seddon, Mid-infrared (IR) – A hot topic: The potential for using
mid-IR light for non-invasive early detection of skin cancer in vivo, Phys.
Status Solidi B 250, 1020–1027 (2013).
[19] K. Kong, C. Kendall, N. Stone, and I. Notingher, Raman spectroscopy for
medical diagnostics — From in-vitro biofluid assays to in-vivo cancer
detection, Adv. Drug Deliv. Rev. 89, 121–134 (2015).

149
[20] Z. Wang, Y. Liu, L. Gao, Y. Chen, P. Luo, K. K. Wong, and S. T. Wong, Use
of multimode optical fibers for fiber-based coherent anti-Stokes Raman
scattering microendoscopy imaging, Opt. Lett. 36, 2967–2969 (2011).
[21] S. Kumar, T. Verma, R. Mukherjee, F. Ariese, K. Somasundaram, and S.
Umapathy, Raman and infra-red microspectroscopy: towards
quantitative evaluation for clinical research by ratiometric analysis,
Chem. Soc. Rev. 45, 1879–1900 (2016).
[22] N. C. Purandare, J. Trevisan, I. I. Patel, K. Gajjar, A. L. Mitchell, G.
Theophilou, G. Valasoulis, M. Martin, G. von Bünau, et al., Exploiting
biospectroscopy as a novel screening tool for cervical cancer: towards a
framework to validate its accuracy in a routine clinical setting,
Bioanalysis 5, 2697–2711 (2013).
[23] M. J. Baker, J. Trevisan, P. Bassan, R. Bhargava, H. J. Butler, K. M.
Dorling, P. R. Fielden, S. W. Fogarty, N. J. Fullwood, et al., Using Fourier
transform IR spectroscopy to analyze biological materials, Nat. Protoc.
9, 1771–1791 (2014).
[24] H. J. Butler, L. Ashton, B. Bird, G. Cinque, K. Curtis, J. Dorney, K.
Esmonde-White, N. J. Fullwood, B. Gardner, et al., Using Raman
spectroscopy to characterize biological materials, Nat. Protoc. 11, 664–
687 (2016).
[25] J. Trevisan, P. P. Angelov, A. D. Scott, P. L. Carmichael, and F. L. Martin,
IRootLab: a free and open-source MATLAB toolbox for vibrational
biospectroscopy data analysis, Bioinformatics, btt084 (2013).
[26] J. C. Anderson, J. C. Williams, A. P. Evan, K. W. Condon, and A. J.
Sommer, Analysis of urinary calculi using an infrared
microspectroscopic surface reflectance imaging technique, Urol. Res.
35, 41–48 (2007).
[27] M. Claybourn, External Reflection Spectroscopy, in Handb. Vib.
Spectrosc. (John Wiley & Sons, Ltd, 2006).

150
[28] C. Haisch, Raman-based microarray readout: a review, Anal. Bioanal.
Chem., 1–11 (2016).
[29] D.-W. Li, W.-L. Zhai, Y.-T. Li, and Y.-T. Long, Recent progress in surface
enhanced Raman spectroscopy for the detection of environmental
pollutants, Microchim. Acta 181, 23–43 (2013).
[30] Valdas Sablinskas, Justinas Ceponkus, Modernioji molekulių virpesinė
spektrometrija
(www.bfsk.ff.vu.lt/Modernioji_molekuliu_virpesine_spektrometrija.pdf).
[31] Peter R. Griffiths, James A. De Haseth, Fourier Transform Infrared
Spectrometry, 2nd Edition (John Wiley & Sons, Inc., Hoboken, New
Jersey, 2007).
[32] Laurence A. Nafie, Theory of Raman Scattering in Handbook of Raman
Spectroscopy, Ian R. Lewis, Howell G. M. Edwards, Eds. (Marcel Dekker
AG, Basel 2001).
[33] http://refractiveindex.info/ (30 June 2016).
[34] K. V. Oliver, F. Matjiu, C. Davey, S. Moochhala, R. J. Unwin, and P. R.
Rich, Attenuated total reflection Fourier transform infrared (ATR-FTIR)
spectroscopy as a bedside diagnostic tool for detecting renal disease
biomarkers in fresh urine samples, SPIE Proc. 9332, 933202 (2015).
[35] J. R. Hands, K. M. Dorling, P. Abel, K. M. Ashton, A. Brodbelt, C. Davis, T.
Dawson, M. D. Jenkinson, R. W. Lea, et al., Attenuated total reflection
fourier transform infrared (ATR-FTIR) spectral discrimination of brain
tumour severity from serum samples, J. Biophotonics 7, 189–199
(2014).
[36] J. R. Hands, G. Clemens, R. Stables, K. Ashton, A. Brodbelt, C. Davis, T. P.
Dawson, M. D. Jenkinson, R. W. Lea, et al., Brain tumour differentiation:
rapid stratified serum diagnostics via attenuated total reflection
Fourier-transform infrared spectroscopy, J. Neurooncol. 127, 463–472
(2016).

151
[37] M. Zhao, G. Downey, and C. P. O’Donnell, Detection of adulteration in
fresh and frozen beefburger products by beef offal using mid-infrared
ATR spectroscopy and multivariate data analysis, Meat Sci. 96, 1003–
1011 (2014).
[38] S. Jawaid, F. N. Talpur, S. T. H. Sherazi, S. M. Nizamani, and A. A.
Khaskheli, Rapid detection of melamine adulteration in dairy milk by SB-
ATR–Fourier transform infrared spectroscopy, Food Chem. 141, 3066–
3071 (2013).
[39] J. y. Shim, I. k. Cho, H. k. Khurana, Q. x. Li, and S. Jun, Attenuated Total
Reflectance–Fourier Transform Infrared Spectroscopy Coupled with
Multivariate Analysis for Measurement of Acesulfame-K in Diet Foods, J.
Food Sci. 73, C426–C431 (2008).
[40] A. C. Galvis-Sánchez, A. Barros, and I. Delgadillo, FTIR-ATR infrared
spectroscopy for the detection of ochratoxin A in dried vine fruit, Food
Addit. Contam. 24, 1299–1305 (2007).
[41] K. L. Andrew Chan and S. G. Kazarian, Attenuated total reflection
Fourier-transform infrared (ATR-FTIR) imaging of tissues and live cells,
Chem Soc Rev 45, 1850–1864 (2016).
[42] M. K. Kuimova, K. L. A. Chan, and S. G. Kazarian, Chemical Imaging of
Live Cancer Cells in the Natural Aqueous Environment, Appl. Spectrosc.
63, 164–171 (2009).
[43] T. P. Wrobel, K. M. Marzec, K. Majzner, K. Kochan, M. Bartus, S.
Chlopicki, and M. Baranska, Attenuated total reflection Fourier
transform infrared (ATR-FTIR) spectroscopy of a single endothelial cell,
Analyst 137, 4135–4139 (2012).
[44] S. G. Kazarian and K. L. A. Chan, Micro- and Macro-Attenuated Total
Reflection Fourier Transform Infrared Spectroscopic Imaging, Appl.
Spectrosc. 64, 135A–152A (2010).

152
[45] K. L. A. Chan, X. Niu, A. J. de Mello, and S. G. Kazarian, Rapid
prototyping of microfluidic devices for integrating with FT-IR
spectroscopic imaging, Lab. Chip 10, 2170–2174 (2010).
[46] L. P. Choo, D. L. Wetzel, W. C. Halliday, M. Jackson, S. M. LeVine, and H.
H. Mantsch, In situ characterization of beta-amyloid in Alzheimer’s
diseased tissue by synchrotron Fourier transform infrared
microspectroscopy, Biophys. J. 71, 1672–1679 (1996).
[47] M. Szczerbowska-Boruchowska, P. Dumas, M. Z. Kastyak, J. Chwiej, M.
Lankosz, D. Adamek, and A. Krygowska-Wajs, Biomolecular
investigation of human substantia nigra in Parkinson’s disease by
synchrotron radiation Fourier transform infrared microspectroscopy,
Arch. Biochem. Biophys. 459, 241–248 (2007).
[48] W. André, C. Sandt, P. Dumas, P. Djian, and G. Hoffner, Structure of
Inclusions of Huntington’s Disease Brain Revealed by Synchrotron
Infrared Microspectroscopy: Polymorphism and Relevance to
Cytotoxicity, Anal. Chem. 85, 3765–3773 (2013).
[49] M. Bonda, V. Perrin, B. Vileno, H. Runne, A. Kretlow, L. Forró, R. Luthi-
Carter, L. M. Miller, and S. Jeney, Synchrotron Infrared
Microspectroscopy Detecting the Evolution of Huntington’s Disease
Neuropathology and Suggesting Unique Correlates of Dysfunction in
White versus Gray Brain Matter, Anal. Chem. 83, 7712–7720 (2011).
[50] M. J. Baker, E. Gazi, M. D. Brown, J. H. Shanks, P. Gardner, and N. W.
Clarke, FTIR-based spectroscopic analysis in the identification of
clinically aggressive prostate cancer, Br. J. Cancer 99, 1859–1866
(2008).
[51] V. Sablinskas, V. Urboniene, J. Ceponkus, A. Laurinavicius, D. Dasevicius,
F. Jankevicius, V. Hendrixson, E. Koch, and G. Steiner, Infrared
spectroscopic imaging of renal tumor tissue, J. Biomed. Opt. 16, 96006
(2011).

153
[52] H. Fabian, N. A. N. Thi, M. Eiden, P. Lasch, J. Schmitt, and D. Naumann,
Diagnosing benign and malignant lesions in breast tissue sections by
using IR-microspectroscopy, Biochim. Biophys. Acta BBA - Biomembr.
1758, 874–882 (2006).
[53] M. Verdonck, A. Denayer, B. Delvaux, S. Garaud, R. D. Wind, C.
Desmedt, C. Sotiriou, K. Willard-Gallo, and E. Goormaghtigh,
Characterization of human breast cancer tissues by infrared imaging,
Analyst 141, 606–619 (2016).
[54] J. Nallala, O. Piot, M.-D. Diebold, C. Gobinet, O. Bouché, M. Manfait,
and G. D. Sockalingum, Infrared imaging as a cancer diagnostic tool:
Introducing a new concept of spectral barcodes for identifying
molecular changes in colon tumors, Cytometry A 83A, 294–300 (2013).
[55] L. C. Prinsloo, L. Wadley, and M. Lombard, Infrared reflectance
spectroscopy as an analytical technique for the study of residues on
stone tools: potential and challenges, J. Archaeol. Sci. 41, 732–739
(2014).
[56] P. Dumas, G. D. Sockalingum, and J. Sulé-Suso, Adding synchrotron
radiation to infrared microspectroscopy: what’s new in biomedical
applications?, Trends Biotechnol. 25, 40–44 (2007).
[57] M. J. Tobin, L. Puskar, R. L. Barber, E. C. Harvey, P. Heraud, B. R. Wood,
K. R. Bambery, C. T. Dillon, and K. L. Munro, FTIR spectroscopy of single
live cells in aqueous media by synchrotron IR microscopy using
microfabricated sample holders, Vib. Spectrosc. 53, 34–38 (2010).
[58] H.-Y. N. Holman, M. C. Martin, E. A. Blakely, K. Bjornstad, and W. R.
Mckinney, IR spectroscopic characteristics of cell cycle and cell death
probed by synchrotron radiation based Fourier transform IR
spectromicroscopy, Biopolymers 57, 329–335 (2000).
[59] L. Kreplak, F. Briki, Y. Duvault, J. Doucet, C. Merigoux, F. Leroy, J. L.
Lévêque, L. Miller, G. L. Carr, et al., Profiling lipids across Caucasian and

154
Afro-American hair transverse cuts, using synchrotron infrared
microspectrometry, Int. J. Cosmet. Sci. 23, 369–374 (2001).
[60] M. Petra, J. Anastassopoulou, T. Theologis, and T. Theophanides,
Synchrotron micro-FT-IR spectroscopic evaluation of normal paediatric
human bone, J. Mol. Struct. 733, 101–110 (2005).
[61] S. Schlücker, Surface-Enhanced Raman Spectroscopy: Concepts and
Chemical Applications, Angew. Chem. Int. Ed. 53, 4756–4795 (2014).
[62] P. G. Etchegoin and E. C. Le Ru, Basic Electromagnetic Theory of SERS, in
Surf. Enhanc. Raman Spectrosc., S. Schlücker, Ed. (Wiley-VCH Verlag
GmbH & Co. KGaA, 2010).
[63] R. Aroca, Surface enhanced vibrational spectroscopy (Wiley, Hoboken,
NJ, 2006).
[64] E. C. L. Ru, S. A. Meyer, C. Artur, P. G. Etchegoin, J. Grand, P. Lang, and
F. Maurel, Experimental demonstration of surface selection rules for
SERS on flat metallic surfaces, Chem. Commun. 47, 3903–3905 (2011).
[65] W. Xie and S. Schlücker, Medical applications of surface-enhanced
Raman scattering, Phys. Chem. Chem. Phys. 15, 5329–5344 (2013).
[66] T. Vo-Dinh, F. Yan, and M. B. Wabuyele, Surface-enhanced Raman
scattering for medical diagnostics and biological imaging, J. Raman
Spectrosc. 36, 640–647 (2005).
[67] J. H. Granger, M. C. Granger, M. A. Firpo, S. J. Mulvihill, and M. D.
Porter, Toward development of a surface-enhanced Raman scattering
(SERS)-based cancer diagnostic immunoassay panel, Analyst 138, 410–
416 (2012).
[68] M. Li, S. K. Cushing, J. Zhang, S. Suri, R. Evans, W. P. Petros, L. F. Gibson,
D. Ma, Y. Liu, et al., Three-Dimensional Hierarchical Plasmonic Nano-
Architecture Enhanced Surface-Enhanced Raman Scattering
Immunosensor for Cancer Biomarker Detection in Blood Plasma, ACS
Nano 7, 4967–4976 (2013).

155
[69] T.-L. Wang, H. K. Chiang, H.-H. Lu, and F.-Y. Peng, Semi-quantitative
Surface Enhanced Raman Scattering Spectroscopic Creatinine
Measurement in Human Urine Samples, Opt. Quantum Electron. 37,
1415–1422 (2006).
[70] G. D. Mistro, S. Cervo, E. Mansutti, R. Spizzo, A. Colombatti, P.
Belmonte, R. Zucconelli, A. Steffan, V. Sergo, et al., Surface-enhanced
Raman spectroscopy of urine for prostate cancer detection: a
preliminary study, Anal. Bioanal. Chem. 407, 3271–3275 (2015).
[71] S. Feng, D. Lin, J. Lin, B. Li, Z. Huang, G. Chen, W. Zhang, L. Wang, J. Pan,
et al., Blood plasma surface-enhanced Raman spectroscopy for non-
invasive optical detection of cervical cancer, Analyst 138, 3967–3974
(2013).
[72] F. Inscore, C. Shende, A. Sengupta, H. Huang, and S. Farquharson,
Detection of Drugs of Abuse in Saliva by Surface-Enhanced Raman
Spectroscopy (SERS), Appl. Spectrosc. 65, 1004–1008 (2011).
[73] P. Hu, X.-S. Zheng, C. Zong, M.-H. Li, L.-Y. Zhang, W. Li, and B. Ren, Drop-
coating deposition and surface-enhanced Raman spectroscopies
(DCDRS and SERS) provide complementary information of whole human
tears, J. Raman Spectrosc. 45, 565–573 (2014).
[74] C. Leordean, V. Canpean, and S. Astilean, Surface-Enhanced Raman
Scattering (SERS) Analysis of Urea Trace in Urine, Fingerprint, and Tear
Samples, Spectrosc. Lett. 45, 550–555 (2012).
[75] K. Kairyte, Z. Luksiene, M. Pucetaite, and V. Sablinskas, Differentiation
of bacterial strains by means of surface enhanced FT-Raman
spectroscopy, Lith. J. Phys. 52 (2012).
[76] H. Chu, Y. Huang, and Y. Zhao, Silver Nanorod Arrays as a Surface-
Enhanced Raman Scattering Substrate for Foodborne Pathogenic
Bacteria Detection, Appl. Spectrosc. 62, 922–931 (2008).

156
[77] A. P. Craig, A. S. Franca, and J. Irudayaraj, Surface-Enhanced Raman
Spectroscopy Applied to Food Safety, Annu. Rev. Food Sci. Technol. 4,
369–380 (2013).
[78] H. Zhou, D. Yang, N. P. Ivleva, N. E. Mircescu, R. Niessner, and C. Haisch,
SERS Detection of Bacteria in Water by in Situ Coating with Ag
Nanoparticles, Anal. Chem. 86, 1525–1533 (2014).
[79] J. Kneipp, H. Kneipp, A. Rajadurai, R. W. Redmond, and K. Kneipp,
Optical probing and imaging of live cells using SERS labels, J. Raman
Spectrosc. 40, 1–5 (2009).
[80] M. V. Yigit and Z. Medarova, In vivo and ex vivo applications of gold
nanoparticles for biomedical SERS imaging, Am J Nucl Med Mol Imaging
2, 232–241 (2012).
[81] X. Qian, X.-H. Peng, D. O. Ansari, Q. Yin-Goen, G. Z. Chen, D. M. Shin, L.
Yang, A. N. Young, M. D. Wang, et al., In vivo tumor targeting and
spectroscopic detection with surface-enhanced Raman nanoparticle
tags, Nat. Biotechnol. 26, 83–90 (2008).
[82] J.-X. Cheng, Coherent Anti-Stokes Raman Scattering Microscopy, Appl.
Spectrosc. 61, 197–208 (2007).
[83] W. Min, C. W. Freudiger, S. Lu, and X. S. Xie, Coherent Nonlinear Optical
Imaging: Beyond Fluorescence Microscopy, Annu. Rev. Phys. Chem. 62,
507–530 (2011).
[84] A. Volkmer, J.-X. Cheng, and X. Sunney Xie, Vibrational Imaging with
High Sensitivity via Epidetected Coherent Anti-Stokes Raman Scattering
Microscopy, Phys. Rev. Lett. 87 (2001).
[85] J.-X. Cheng, L. D. Book, and X. S. Xie, Polarization coherent anti-Stokes
Raman scattering microscopy, Opt. Lett. 26, 1341–1343 (2001).
[86] F. Ganikhanov, C. L. Evans, B. G. Saar, and X. S. Xie, High-sensitivity
vibrational imaging with frequency modulation coherent anti-Stokes

157
Raman scattering (FM CARS) microscopy, Opt. Lett. 31, 1872–1874
(2006).
[87] E. O. Potma, C. L. Evans, and X. S. Xie, Heterodyne coherent anti-Stokes
Raman scattering (CARS) imaging, Opt. Lett. 31, 241–243 (2006).
[88] M. Jurna, J. P. Korterik, C. Otto, L. Herek, and H. L. Offerhaus,
Background free CARS imaging by local phase detection, SPIE Proc.
7183, 718310 (2009).
[89] J. P. Pezacki, J. A. Blake, D. C. Danielson, D. C. Kennedy, R. K. Lyn, and R.
Singaravelu, Chemical contrast for imaging living systems: molecular
vibrations drive CARS microscopy, Nat Chem Biol 7, 137–145 (2011).
[90] C. L. Evans and X. S. Xie, Coherent Anti-Stokes Raman Scattering
Microscopy: Chemical Imaging for Biology and Medicine, Annu. Rev.
Anal. Chem. 1, 883–909 (2008).
[91] T. T. Le, S. Yue, and J.-X. Cheng, Shedding new light on lipid biology with
coherent anti-Stokes Raman scattering microscopy, J. Lipid Res. 51,
3091–3102 (2010).
[92] F. Légaré, C. L. Evans, F. Ganikhanov, and X. S. Xie, Towards CARS
Endoscopy, Opt. Express 14, 4427–4432 (2006).
[93] Y. Wu, Y. Leng, J. Xi, and X. Li, Scanning all-fiber-optic endomicroscopy
system for 3D nonlinear optical imaging of biological tissues, Opt.
Express 17, 7907–7915 (2009).
[94] O. Uckermann, R. Galli, S. Tamosaityte, E. Leipnitz, K. D. Geiger, G.
Schackert, E. Koch, G. Steiner, and M. Kirsch, Label-Free Delineation of
Brain Tumors by Coherent Anti-Stokes Raman Scattering Microscopy in
an Orthotopic Mouse Model and Human Glioblastoma, PLOS ONE 9,
e107115 (2014).
[95] R. Galli, V. Sablinskas, D. Dasevicius, A. Laurinavicius, F. Jankevicius, E.
Koch, and G. Steiner, Non-linear optical microscopy of kidney tumours,
J. Biophotonics 7, 23–27 (2014).

158
[96] R. C. Burruss, A. D. Slepkov, A. F. Pegoraro, and A. Stolow, Unraveling
the complexity of deep gas accumulations with three-dimensional
multimodal CARS microscopy, Geology 40, 1063–1066 (2012).
[97] Z. Wang, W. Zheng, C.-Y. Stephen Hsu, and Z. Huang, Epi-detected
quadruple-modal nonlinear optical microscopy for label-free imaging of
the tooth, Appl. Phys. Lett. 106, 33701 (2015).
[98] P. Lasch, Spectral pre-processing for biomedical vibrational
spectroscopy and microspectroscopic imaging, Chemom. Intell. Lab.
Syst. 117, 100–114 (2012).
[99] H. Anton, Elementary linear algebra (Wiley, New York, 1987).
[100] J. K. Kauppinen, D. J. Moffatt, H. H. Mantsch, and D. G. Cameron,
Fourier Self-Deconvolution: A Method for Resolving Intrinsically
Overlapped Bands, Appl. Spectrosc. 35, 271–276 (1981).
[101] A. de Juan, S. Piqueras, M. Maeder, T. Hancewicz, L. Duponchel, and R.
Tauler, Chemometric Tools for Image Analysis, in Infrared Raman
Spectrosc. Imaging, R. Salzer and H. W. Siesler, Eds. (Wiley-VCH Verlag
GmbH & Co. KGaA, 2014).
[102] E. Mooi and M. Sarstedt, Cluster Analysis, in Concise Guide Mark. Res.
(Springer Berlin Heidelberg, Berlin, Heidelberg, 2010).
[103] H. J. Byrne, P. Knief, M. E. Keating, and F. Bonnier, Spectral pre and post
processing for infrared and Raman spectroscopy of biological tissues
and cells, Chem. Soc. Rev. 45, 1865–1878 (2016).
[104] H.-F. Lu, J.-B. Shen, X.-Y. Lin, and J.-L. Fu, Relevance of Fourier transform
infrared spectroscopy and leaf anatomy for species classification in
Camellia (Theaceae), Taxon 57 (2008).
[105] A. Matulis, Kompleksiniai skaičiai ir funkcijos. Analizinių skaičiavimų
menas, (VU leidykla, Vilnius, 2005).
[106] B. J. Davis, P. S. Carney, and R. Bhargava, Theory of mid-infrared
absorption microspectroscopy, Anal. Chem. 82 (2010).
159
[107] H. Heers and B. W. Turney, Trends in urological stone disease: a 5-year
update of hospital episode statistics, BJU Int., n/a-n/a (2016).
[108] H. S. Bagga, T. Chi, J. Miller, and M. L. Stoller, New Insights Into the
Pathogenesis of Renal Calculi, Urol. Clin. North Am. 40, 1–12 (2013).
[109] A. Mangera, K. Khan, and B. T. Parys, Has the incidence of urolithiasis
presenting to secondary care increased in the last 10 years?, J. Clin.
Urol. 6, 239–242 (2013).
[110] M. López and B. Hoppe, History, epidemiology and regional diversities
of urolithiasis, Pediatr. Nephrol. 25, 49–59 (2008).
[111] N. M. Mehmet and O. Ender, Effect of urinary stone disease and its
treatment on renal function, World J. Nephrol. 4, 271–276 (2015).
[112] V. Romero, H. Akpinar, and D. G. Assimos, Kidney Stones: A Global
Picture of Prevalence, Incidence, and Associated Risk Factors, Rev. Urol.
12, e86–e96 (2010).
[113] G. Bihl and A. Meyers, Recurrent renal stone disease—advances in
pathogenesis and clinical management, The Lancet 358, 651–656
(2001).
[114] F. Grases, A. Costa-Bauzá, M. Ramis, V. Montesinos, and A. Conte,
Recurrence of renal lithiasis, Scand. J. Urol. Nephrol. 37, 482–486
(2003).
[115] P. M. Ferraro, G. C. Curhan, A. D’Addessi, and G. Gambaro, Risk of
recurrence of idiopathic calcium kidney stones: analysis of data from
the literature, J. Nephrol., 1–7 (2016).
[116] F. L. Coe, A. Evan, and E. Worcester, Kidney stone disease, J. Clin. Invest.
115, 2598–2608 (2005).
[117] M. Daudon and P. Jungers, Stone Composition and Morphology: A
Window on Etiology, in Urolithiasis, J. J. Talati, H.-G. Tiselius, D. M.
Albala, and Z. YE, Eds. (Springer London, 2012).

160
[118] J. P. Kavanagh, Physicochemical Aspects of Uro-crystallization and Stone
Formation, in Urin. Tract Stone Dis., N. P. Rao, G. M. Preminger, and J.
P. Kavanagh, Eds. (Springer London, 2010).
[119] G. Schubert, Urinary Stone Analysis, in Urin. Tract Stone Dis., N. P. Rao,
G. M. Preminger, and J. P. Kavanagh, Eds. (Springer London, London,
2010).
[120] L. Larsson, B. Sörbo, H.-G. Tiselius, and S. Öhman, A method for
quantitative wet chemical analysis of urinary calculi, Clin. Chim. Acta
140, 9–20 (1984).
[121] R. N. Sharma, I. Shah, S. Gupta, P. Sharma, and A. A. Beigh,
Thermogravimetric Analysis of Urinary Stones, Br. J. Urol. 64, 564–566
(1989).
[122] P. A. Bhatt and P. Paul, Analysis of urinary stone constituents using
powder X-ray diffraction and FT-IR, J. Chem. Sci. 120, 267–273 (2008).
[123] B. G, S. G, and B. C, 10,000 analyses of urinary calculi using X-ray
diffraction and polarizing microscopy., Eur. Urol. 8, 251–256 (1981).
[124] K. Štěpánková, K. Novotný, M. Vašinová Galiová, V. Kanický, J. Kaiser,
and D. W. Hahn, Laser ablation methods for analysis of urinary calculi:
Comparison study based on calibration pellets, Spectrochim. Acta Part B
At. Spectrosc. 81, 43–49 (2013).
[125] J. Anzano and R.-J. Lasheras, Strategies for the identification of urinary
calculus by laser induced breakdown spectroscopy, Talanta 79, 352–360
(2009).
[126] G. Hidas, R. Eliahou, M. Duvdevani, P. Coulon, L. Lemaitre, O. N. Gofrit,
D. Pode, and J. Sosna, Determination of Renal Stone Composition with
Dual-Energy CT: In Vivo Analysis and Comparison with X-ray Diffraction,
Radiology 257, 394–401 (2010).

161
[127] V. S. Joshi, S. R. Vasant, J. G. Bhatt, and M. J. Joshi, Some critical aspects
of FT-IR, TGA, powder XRD, EDAX and SEM studies of calcium oxalate
urinary calculi, Indian J Biochem Biophys 51, 237–43 (2014).
[128] J. R. Guerra-López, J. A. Güida, and C. O. D. Védova, Infrared and Raman
studies on renal stones: the use of second derivative infrared spectra,
Urol. Res. 38, 383–390 (2010).
[129] R. Selvaraju, A. Raja, and G. Thiruppathi, FT-Raman spectral analysis of
human urinary stones, Spectrochim. Acta. A. Mol. Biomol. Spectrosc.
99, 205–210 (2012).
[130] A. Spek, F. Strittmatter, A. Graser, P. Kufer, C. Stief, and M. Staehler,
Dual energy can accurately differentiate uric acid-containing urinary
calculi from calcium stones, World J. Urol., 1–6 (2016).
[131] G. Schubert, Stone analysis, Urol. Res. 34, 146–150 (2006).
[132] S. D. Blaschko, J. Miller, T. Chi, L. Flechner, S. Fakra, A. Kahn, P. Kapahi,
and M. L. Stoller, Microcomposition of Human Urinary Calculi Using
Advanced Imaging Techniques, J. Urol. 189, 726–734 (2013).
[133] M. Daudon, D. Bazin, and E. Letavernier, Randall’s plaque as the origin
of calcium oxalate kidney stones, Urolithiasis 43, 5–11 (2015).
[134] M. Daudon and D. Bazin, When the Synchrotron radiations highlight the
Randall’s plaques and kidney concretions, J. Phys. Conf. Ser. 425, 22006
(2013).
[135] H.-G. Tiselius, The role of calcium phosphate in the development of
Randall’s plaques, Urolithiasis 41, 369–377 (2013).
[136] M. Daudon, O. Traxer, P. Jungers, and D. Bazin, Stone Morphology
Suggestive of Randall’s Plaque, AIP Conf. Proc. 200(26), 26–34 (2007).
[137] I. Singh, Renal geology (quantitative renal stone analysis) by ‘Fourier
transform infrared spectroscopy,’ Int. Urol. Nephrol. 40, 595–602
(2008).
162
[138] Z. Jing, W. GuoZeng, J. Ning, Y. JiaWei, G. Yan, and Y. Fang, Analysis of
urinary calculi composition by infrared spectroscopy: a prospective
study of 625 patients in eastern China, Urol. Res. 38, 111–115 (2010).
[139] M. Daudon, C. Hennequin, B. Lacour, G. L. Moel, R. Donsimoni, S.
Fellahi, M. Paris, and S. Troupel, Sex- and age-related composition of 10
617 calculi analyzed by infrared spectroscopy, Urol. Res. 23, 319–326
(1995).
[140] R. Selvaraju, A. Raja, and G. Thiruppathi, FT-IR spectroscopic, thermal
analysis of human urinary stones and their characterization,
Spectrochim. Acta. A. Mol. Biomol. Spectrosc. 137, 1397–1402 (2015).
[141] L. Benramdane, M. Bouatia, M. O. B. Idrissi, and M. Draoui, Infrared
Analysis of Urinary Stones, Using a Single Reflection Accessory and a
KBr Pellet Transmission, Spectrosc. Lett. 41, 72–80 (2008).
[142] H. J. Gulley-Stahl, J. A. Haas, K. A. Schmidt, A. P. Evan, and A. J. Sommer,
Attenuated Total Internal Reflection Fourier Transform Infrared
Spectroscopy: A Quantitative Approach for Kidney Stone Analysis, Appl.
Spectrosc. 63, 759–766 (2009).
[143] M. Volmer, J. C. M. de Vries, and H. M. J. Goldschmidt, Infrared Analysis
of Urinary Calculi by a Single Reflection Accessory and a Neural Network
Interpretation Algorithm, Clin. Chem. 47, 1287–1296 (2001).
[144] M. Daudon, P. Jungers, and D. Bazin, Stone Morphology: Implication for
Pathogenesis, AIP Conf. Proc. 1049, (2008).
[145] J. Cloutier, L. Villa, O. Traxer, and M. Daudon, Kidney stone analysis:
“Give me your stone, I will tell you who you are!,” World J. Urol. 33,
157–169 (2015).
[146] A. Boskey and N. Pleshko Camacho, FT-IR imaging of native and tissue-
engineered bone and cartilage, Biomaterials 28, 2465–2478 (2007).

163
[147] F. Blanco, P. Ortiz-Alías, M. López-Mesas, and M. Valiente, High
precision mapping of kidney stones using μ-IR spectroscopy to
determine urinary lithogenesis, J. Biophotonics 8, 457–465 (2015).
[148] S. K. Khalil and M. A. Azooz, Application of vibrational spectroscopy in
identification of the composition of the urinary stones, J Appl Sci Res 3,
387–391 (2007).
[149] A. Miernik, Y. Eilers, C. Nuese, C. Bolwien, A. Lambrecht, A. Hesse, J. J.
Rassweiler, D. Schlager, K. Wilhelm, et al., Is in vivo analysis of urinary
stone composition feasible? Evaluation of an experimental setup of a
Raman system coupled to commercial lithotripsy laser fibers, World J.
Urol. 33, 1593–1599 (2015).
[150] Y.-C. Chiu, H.-Y. Yang, S.-H. Lu, and H. K. Chiang, Micro-Raman
spectroscopy identification of urinary stone composition from
ureteroscopic lithotripsy urine powder, J. Raman Spectrosc. 41, 136–
141 (2010).
[151] A. Miernik, Y. Eilers, C. Bolwien, A. Lambrecht, D. Hauschke, G.
Rebentisch, P. S. Lossin, A. Hesse, J. J. Rassweiler, et al., Automated
Analysis of Urinary Stone Composition Using Raman Spectroscopy: Pilot
Study for the Development of a Compact Portable System for
Immediate Postoperative Ex Vivo Application, J. Urol. 190, 1895–1900
(2013).
[152] http://webbook.nist.gov/chemistry/ (3 June 2016).
[153] http://rruff.info/ (3 June 2016).
[154] W. R. Hunter, Errors in using the Reflectance vs Angle of Incidence
Method for Measuring Optical Constants, JOSA 55, 1197–1204 (1965).
[155] C. Conti, M. Casati, C. Colombo, M. Realini, L. Brambilla, and G. Zerbi,
Phase transformation of calcium oxalate dihydrate–monohydrate:
Effects of relative humidity and new spectroscopic data, Spectrochim.
Acta. A. Mol. Biomol. Spectrosc. 128, 413–419 (2014).

164
[156] T. Knoll, A. B. Schubert, D. Fahlenkamp, D. B. Leusmann, G. Wendt-
Nordahl, and G. Schubert, Urolithiasis Through the Ages: Data on More
Than 200,000 Urinary Stone Analyses, J. Urol. 185, 1304–1311 (2011).
[157] C. D. Scales, A. C. Smith, J. M. Hanley, and C. S. Saigal, Prevalence of
Kidney Stones in the United States, Eur. Urol. 62, 160–165 (2012).
[158] G. Foster, C. Stocks, and M. S. Borofsky, Emergency department visits
and hospital admissions for kidney stone disease, 2009, Statistical Brief
139, (2012).
[159] L. M. Miller, G. D. Smith, and G. L. Carr, Synchrotron-based Biological
Microspectroscopy: From the Mid-Infrared through the Far-Infrared
Regimes, J. Biol. Phys. 29, 219–230 (2003).
[160] R. L. Frost, J. Yang, and Z. Ding, Raman and FTIR spectroscopy of natural
oxalates: Implications for the evidence of life on Mars, Chin. Sci. Bull.
48, 1844–1852 (2003).
[161] G. Vasuki and R. Selvaraju, Growth and Characterization of Uric Acid
Crystals, International Journal of Science and Research 3(8), 696-699
(2014).
[162] B. L. Goodall, A. M. Robinson, and C. L. Brosseau, Electrochemical-
surface enhanced Raman spectroscopy (E-SERS) of uric acid: a potential
rapid diagnostic method for early preeclampsia detection, Phys. Chem.
Chem. Phys. PCCP 15, 1382–1388 (2013).
[163] J. Shi, A. Klocke, M. Zhang, and U. Bismayer, Thermal behavior of dental
enamel and geologic apatite: An infrared spectroscopic study, Am.
Mineral. 88, 1866–1871 (2003).
[164] L. Berzina-Cimdina and N. Borodajenko, Research of calcium phosphates
using Fourier transform infrared spectroscopy (INTECH Open Access
Publisher, 2012).
[165] C. Rey, M. Shimizu, B. Collins, and M. J. Glimcher, Resolution-enhanced
fourier transform infrared spectroscopy study of the environment of

165
phosphate ions in the early deposits of a solid phase of calcium-
phosphate in bone and enamel, and their evolution with age. I:
Investigations in thev 4 PO4 domain, Calcif. Tissue Int. 46, 384–394
(1990).
[166] V. Stefov, B. Šoptrajanov, F. Spirovski, I. Kuzmanovski, H. . Lutz, and B.
Engelen, Infrared and Raman spectra of magnesium ammonium
phosphate hexahydrate (struvite) and its isomorphous analogues. I.
Spectra of protiated and partially deuterated magnesium potassium
phosphate hexahydrate, J. Mol. Struct. 689, 1–10 (2004).
[167] S. Popescu, M. Stefanescu, E. Popovici, and I. Perhaita, Evaluation of the
renal calculi compositions, J. Therm. Anal. Calorim. 114, 765–775
(2013).
[168] J. A. DeSanto, Overview of Rough Surface Scattering, in Light Scatt.
Nanoscale Surf. Rough., A. A. Maradudin, Ed. (Springer US, 2007).
[169] A. K. Chandra and T. Zeegers-Huyskens, Theoretical study of the acidity
and basicity of uric acid and its interaction with water, J. Mol. Struct.
THEOCHEM 811, 215–221 (2007).
[170] John. C. Russ, The Image Processing Handbook, 6th edition, (Taylor &
Francis Group, Boca Raton, 2011), Chapter 5, p.p. 320-323.
[171] H. G. M. Edwards, D. W. Farwell, and M. R. D. Seaward, Raman spectra
of oxalates in lichen encrustations on Renaissance frescoes,
Spectrochim. Acta Part Mol. Spectrosc. 47, 1531–1539 (1991).
[172] J. Prywer, A. Torzewska, and T. Płociński, Unique surface and internal
structure of struvite crystals formed by Proteus mirabilis, Urol. Res. 40,
699–707 (2012).
[173] R. L. Frost and M. L. Weier, Thermal treatment of whewellite—a
thermal analysis and Raman spectroscopic study, Thermochim. Acta
409, 79–85 (2004).

166
[174] X. Sheng, T. Jung, J. A. Wesson, and M. D. Ward, Adhesion at calcium
oxalate crystal surfaces and the effect of urinary constituents, Proc.
Natl. Acad. Sci. U. S. A. 102, 267–272 (2005).
[175] R. Shirley and D. J. Sutor, Anhydrous Uric Acid: Nature and Occurrence
of a New Form in Urinary Calculi, Science 159, 544–544 (1968).
[176] F. Grases, P. Sanchis, J. Perelló, and A. Costa-Bauzá, Role of uric acid in
different types of calcium oxalate renal calculi, Int. J. Urol. 13, 252–256
(2006).
[177] J. Gao, J.-F. Xue, M. Xu, B.-S. Gui, F.-X. Wang, and J.-M. Ouyang,
Comparison of Physicochemical Properties of Nano- and Microsized
Crystals in the Urine of Calcium Oxalate Stone Patients and Control
Subjects, J Nanomater. 2014, 49:49–49:49 (2014).
[178] K. Kohri, T. Yasui, A. Okada, M. Hirose, S. Hamamoto, Y. Fujii, K. Niimi,
and K. Taguchi, Biomolecular mechanism of urinary stone formation
involving osteopontin, Urol. Res. 40, 623–637 (2012).
[179] K. P. Aggarwal, S. Tandon, P. K. Naik, S. K. Singh, and C. Tandon, Peeping
into Human Renal Calcium Oxalate Stone Matrix: Characterization of
Novel Proteins Involved in the Intricate Mechanism of Urolithiasis, PLOS
ONE 8, e69916 (2013).
[180] M. A. Warpehoski, P. J. Buscemi, D. C. Osborn, B. Finlayson, and E. P.
Goldberg, Distribution of organic matrix in calcium oxalate renal calculi,
Calcif. Tissue Int. 33, 211–222 (1981).
[181] M. Pucetaite, V. Hendrixson, A. Zelvys, F. Jankevicius, R. Tyla, J.
Ceponkus, and V. Sablinskas, Application of infrared spectroscopic
imaging in specular reflection mode for determination of distribution of
chemical components in urinary stones, J. Mol. Struct. 1031, 38–42
(2013).
[182] M. Pucetaite, S. Tamosaityte, A. Engdahl, J. Ceponkus, V. Sablinskas,
and P. Uvdal, Microspectroscopic infrared specular reflection chemical

167
imaging of multi-component urinary stones: MIR vs. FIR, Cent. Eur. J.
Chem. 12, 44–52 (2013).
[183] J. Y. He, S. P. Deng, and J. M. Ouyang, Morphology, Particle Size
Distribution, Aggregation, and Crystal Phase of Nanocrystallites in the
Urine of Healthy Persons and Lithogenic Patients, IEEE Trans.
NanoBioscience 9, 156–163 (2010).
[184] Y. M. F. Marickar and A. Salim, Photmicrography of urinary deposits in
stone clinic, Urol. Res. 37, 359–368 (2009).
[185] M. Daudon, C. Marfisi, B. Lacour, and C. Bader, Investigation of urinary
crystals by Fourier transform infrared microscopy., Clin. Chem. 37, 83–
87 (1991).
[186] Z. Kaid-Omar, M. Daudon, A. Attar, A. Semmoud, B. Lacour, A. Addou,
and others, Corrélation entre cristalluries et composition des calculs,
Prog. En Urol. 9, 633–641 (1999).
[187] S. Verdesca, G. B. Fogazzi, G. Garigali, P. Messa, and M. Daudon,
Crystalluria: prevalence, different types of crystals and the role of
infrared spectroscopy, Clin. Chem. Lab. Med. 49, 515–520 (2010).
[188] A. Gul and P. Rez, Models for protein binding to calcium oxalate
surfaces, Urol. Res. 35, 63–71 (2007).
[189] T. C. Ngo and D. G. Assimos, Uric Acid Nephrolithiasis: Recent Progress
and Future Directions, Rev. Urol. 9, 17–27 (2007).
[190] W. L. Strohmaier, J. Seilnacht, and G. Schubert, Clinical significance of
uric acid dihydrate in urinary stones, Urol. Res. 39, 357–360 (2011).
[191] https://labtestsonline.org/understanding/analytes/body-
fluid/tab/glance/ (3 June 2016).
[192] R. Mayeux, Biomarkers: Potential Uses and Limitations, NeuroRX 1,
182–188 (2004).

168
[193] A. Sevinc, D. Yonar, and F. Severcan, Investigation of neurodegenerative
diseases from body fluid samples using Fourier transform infrared
spectroscopy, Biomed. Spectrosc. Imaging 4, 341–357 (2015).
[194] J. Ollesch, S. L. Drees, H. M. Heise, T. Behrens, T. Brüning, and K.
Gerwert, FTIR spectroscopy of biofluids revisited: an automated
approach to spectral biomarker identification, Analyst 138, 4092–4102
(2013).
[195] L. Lovergne, P. Bouzy, V. Untereiner, R. Garnotel, M. J. Baker, G. Thiéfin,
and G. D. Sockalingum, Biofluid infrared spectro-diagnostics: pre-
analytical considerations for clinical applications, Faraday Discuss.
(2015).
[196] A. Bonifacio, S. Cervo, and V. Sergo, Label-free surface-enhanced
Raman spectroscopy of biofluids: fundamental aspects and diagnostic
applications, Anal. Bioanal. Chem. 407, 8265–8277 (2015).
[197] H. Wang and S. Zou, A generalized electrodynamics model for surface
enhanced Raman scattering and enhanced/quenched fluorescence
calculations, RSC Adv. 3, 21489–21493 (2013).
[198] G. McNay, D. Eustace, W. E. Smith, K. Faulds, and D. Graham, Surface-
Enhanced Raman Scattering (SERS) and Surface-Enhanced Resonance
Raman Scattering (SERRS): A Review of Applications, Appl. Spectrosc.
65, 825–837 (2011).
[199] B. N. Ames, R. Cathcart, E. Schwiers, and P. Hochstein, Uric acid
provides an antioxidant defense in humans against oxidant- and radical-
caused aging and cancer: a hypothesis, Proc. Natl. Acad. Sci. U. S. A. 78,
6858–6862 (1981).
[200] B. F. Becker, Towards the physiological function of uric acid, Free Radic.
Biol. Med. 14, 615–631 (1993).

169
[201] F. J. Nieto, C. Iribarren, M. D. Gross, G. W. Comstock, and R. G. Cutler,
Uric acid and serum antioxidant capacity: a reaction to atherosclerosis?,
Atherosclerosis 148, 131–139 (2000).
[202] D. I. Feig, M. Mazzali, D.-H. Kang, T. Nakagawa, K. Price, J. Kannelis, and
R. J. Johnson, Serum Uric Acid: A Risk Factor and a Target for
Treatment?, J. Am. Soc. Nephrol. 17, S69–S73 (2006).
[203] K.-H. Yu, S.-F. Luo, W.-P. Tsai, and Y.-Y. Huang, Intermittent elevation of
serum urate and 24-hour urinary uric acid excretion, Rheumatology 43,
1541–1545 (2004).
[204] N. Misra, V. Kumar, L. Borde, and L. Varshney, Localized surface
plasmon resonance-optical sensors based on radiolytically synthesized
silver nanoparticles for estimation of uric acid, Sens. Actuators B Chem.
178, 371–378 (2013).
[205] S. A. Bainbridge, F. von Versen-Höynck, and J. M. Roberts, Uric acid
inhibits placental system A amino acid uptake, Placenta 30, 195–200
(2009).
[206] D. I. Feig, D.-H. Kang, and R. J. Johnson, Uric Acid and Cardiovascular
Risk, N. Engl. J. Med. 359, 1811–1821 (2008).
[207] G. Bellomo, S. Venanzi, C. Verdura, P. Saronio, A. Esposito, and M.
Timio, Association of uric acid with change in kidney function in healthy
normotensive individuals, Am. J. Kidney Dis. Off. J. Natl. Kidney Found.
56, 264–272 (2010).
[208] J. Galbán, Y. Andreu, M. J. Almenara, S. de Marcos, and J. R. Castillo,
Direct determination of uric acid in serum by a fluorometric-enzymatic
method based on uricase, Talanta 54, 847–854 (2001).
[209] H. M. KALCKAR and A. N. BESSMANN, Differential spectrophotometry of
purine compounds by means of specific enzymes. 2. Determination of
adenine compounds., J. Biol. Chem. 167, 445–459 (1947).

170
[210] J. Zhao, Simultaneous determination of plasma creatinine, uric acid,
kynurenine and tryptophan by high-performance liquid
chromatography: method validation and in application to the
assessment of renal function, Biomed. Chromatogr. 29, 410–415 (2015).
[211] L. Zhao, J. Blackburn, and C. L. Brosseau, Quantitative Detection of Uric
Acid by Electrochemical-Surface Enhanced Raman Spectroscopy Using a
Multilayered Au/Ag Substrate, Anal. Chem. 87, 441–447 (2015).
[212] K. Tan, G. Yang, H. Chen, P. Shen, Y. Huang, and Y. Xia, Facet dependent
binding and etching: Ultra-sensitive colorimetric visualization of blood
uric acid by unmodified silver nanoprisms, Biosens. Bioelectron. 59,
227–232 (2014).
[213] A. Bonifacio, S. D. Marta, R. Spizzo, S. Cervo, A. Steffan, A. Colombatti,
and V. Sergo, Surface-enhanced Raman spectroscopy of blood plasma
and serum using Ag and Au nanoparticles: a systematic study, Anal.
Bioanal. Chem. 406, 2355–2365 (2014).
[214] P. C. Lee and D. Meisel, Adsorption and surface-enhanced Raman of
dyes on silver and gold sols, J. Phys. Chem. 86, 3391–3395 (1982).
[215] N. Leopold and B. Lendl, A New Method for Fast Preparation of Highly
Surface-Enhanced Raman Scattering (SERS) Active Silver Colloids at
Room Temperature by Reduction of Silver Nitrate with Hydroxylamine
Hydrochloride, J. Phys. Chem. B 107, 5723–5727 (2003).
[216] D. Aherne, D. M. Ledwith, M. Gara, and J. M. Kelly, Optical Properties
and Growth Aspects of Silver Nanoprisms Produced by a Highly
Reproducible and Rapid Synthesis at Room Temperature, Adv. Funct.
Mater. 18, 2005–2016 (2008).
[217] M. Frisch, G. Trucks, H. Schlegel, G. Scuseria, M. Robb, J. Cheeseman, G.
Scalmani, V. Barone, B. Mennucci, et al., Gaussian 09, Revision B.01,
Gaussian 09 Revis. B01 Gaussian Inc Wallingford CT (2009).

171
[218] R. Dennington, T. Keith, and J. Millam, GaussView, Version 5, Semichem
Inc., Shawnee Mission, KS, (2009).
[219] M. Altarsha, G. Monard, and B. Castro, Comparative semiempirical and
ab initio study of the structural and chemical properties of uric acid and
its anions, Int. J. Quantum Chem. 107, 172–181 (2007).
[220] A. F. Routh, Drying of thin colloidal films, Rep. Prog. Phys. 76, 46603
(2013).
[221] R. D. Deegan, Pattern formation in drying drops, Phys. Rev. E 61, 475–
485 (2000).
[222] P. Šimáková, M. Procházka, Koč, iš, ová, E, P.
ŠimákoP. Šimáková, M. Procházka, E, P. Šimáková, M. Procházka, et al.,
SERS Microspectroscopy of Biomolecules on Dried Ag Colloidal Drops, J.
Spectrosc. J. Spectrosc. 27, 27, 449, 449–453, 453 (2012).
[223] P. J. Yunker, T. Still, M. A. Lohr, and A. G. Yodh, Suppression of the
coffee-ring effect by shape-dependent capillary interactions, Nature
476, 308–311 (2011).
[224] X. Shen, C.-M. Ho, and T.-S. Wong, Minimal Size of Coffee Ring
Structure, J. Phys. Chem. B 114, 5269–5274 (2010).
[225] D. J. Harris, H. Hu, J. C. Conrad, and J. A. Lewis, Patterning Colloidal
Films via Evaporative Lithography, Phys. Rev. Lett. 98, 148301 (2007).
[226] L. Cui, J. Zhang, X. Zhang, L. Huang, Z. Wang, Y. Li, H. Gao, S. Zhu, T.
Wang, et al., Suppression of the Coffee Ring Effect by Hydrosoluble
Polymer Additives, ACS Appl. Mater. Interfaces 4, 2775–2780 (2012).
[227] B. Michen, C. Geers, D. Vanhecke, C. Endes, B. Rothen-Rutishauser, S.
Balog, and A. Petri-Fink, Avoiding drying-artifacts in transmission
electron microscopy: Characterizing the size and colloidal state of
nanoparticles, Sci. Rep. 5 (2015).
[228] Y. Xie, S. Guo, C. Guo, M. He, D. Chen, Y. Ji, Z. Chen, X. Wu, Q. Liu, et al.,
Controllable Two-Stage Droplet Evaporation Method and Its

172
Nanoparticle Self-Assembly Mechanism, Langmuir 29, 6232–6241
(2013).
[229] L.-Q. Lu, Y. Zheng, W.-G. Qu, H.-Q. Yu, and A.-W. Xu, Hydrophobic
Teflon films as concentrators for single-molecule SERS detection, J.
Mater. Chem. 22, 20986 (2012).
[230] T. A. H. Nguyen, M. A. Hampton, and A. V. Nguyen, Evaporation of
Nanoparticle Droplets on Smooth Hydrophobic Surfaces: The Inner
Coffee Ring Deposits, J. Phys. Chem. C 117, 4707–4716 (2013).
[231] M. Parsa, S. Harmand, K. Sefiane, M. Bigerelle, and R. Deltombe, Effect
of Substrate Temperature on Pattern Formation of Nanoparticles from
Volatile Drops, Langmuir 31, 3354–3367 (2015).
[232] L. Mulfinger, S. D. Solomon, M. Bahadory, A. V. Jeyarajasingam, S. A.
Rutkowsky, and C. Boritz, Synthesis and study of silver nanoparticles, J
Chem Educ 84, 322 (2007).
[233] H. Hu and R. G. Larson, Analysis of the Microfluid Flow in an
Evaporating Sessile Droplet, Langmuir 21, 3963–3971 (2005).
[234] E. C. Le Ru, E. Blackie, M. Meyer, and P. G. Etchegoin, Surface Enhanced
Raman Scattering Enhancement Factors: A Comprehensive Study, J.
Phys. Chem. C 111, 13794–13803 (2007).
[235] X. Li, W. Xu, J. Zhang, H. Jia, B. Yang, B. Zhao, B. Li, and Y. Ozaki, Self-
Assembled Metal Colloid Films: Two Approaches for Preparing New
SERS Active Substrates, Langmuir 20, 1298–1304 (2004).
[236] N. Pazos-Pérez, W. Ni, A. Schweikart, R. A. Alvarez-Puebla, A. Fery, and
L. M. Liz-Marzán, Highly uniform SERS substrates formed by wrinkle-
confined drying of gold colloids, Chem. Sci. 1, 174–178 (2010).
[237] A. Saha, S. Palmal, and N. R. Jana, Highly reproducible and sensitive
surface-enhanced Raman scattering from colloidal plasmonic
nanoparticle via stabilization of hot spots in graphene oxide liquid
crystal, Nanoscale 4, 6649–6657 (2012).

173
[238] F. S. Ameer, W. Hu, S. M. Ansar, K. Siriwardana, W. E. Collier, S. Zou, and
D. Zhang, Robust and Reproducible Quantification of SERS
Enhancement Factors Using a Combination of Time-Resolved Raman
Spectroscopy and Solvent Internal Reference Method, J. Phys. Chem. C
117, 3483–3488 (2013).
[239] M. Pucetaite, M. Velicka, S. Tamosaityte, and V. Sablinskas, Application
of SERS spectroscopy for detection of trace components in urinary
deposits, SPIE Proc. 895708, 895708–8 (2014).
[240] http://www.who.int/mediacentre/factsheets/fs297/en/ (2 June 2016).
[241] http://cancerguide.org/basic.html (2 June 2016).
[242] L. H. Sobin, M. K. Gospodarowicz, and C. Wittekind, TNM Classification
of Malignant Tumours (John Wiley & Sons, 2011).
[243] P. Guinan, L. H. Sobin, F. Algaba, F. Badellino, S. Kameyama, G.
MacLennan, and A. Novick, TNM staging of renal cell carcinoma, Cancer
80, 992–993 (1997).
[244] http://urology.ucla.edu/more-about-kidney-cancer#rcc (2 June 2016).
[245] C. V. Thakar and K. Gaitonde, Kidney Function and Injury After
Nephrectomy for Kidney Cancer, in Perioper. Kidney Inj., C. V. Thakar
and C. R. Parikh, Eds. (Springer New York, 2015).
[246] M. V. Brown, J. E. McDunn, P. R. Gunst, E. M. Smith, M. V. Milburn, D. A.
Troyer, and K. A. Lawton, Cancer detection and biopsy classification
using concurrent histopathological and metabolomic analysis of core
biopsies, Genome Med. 4, 33 (2012).
[247] G. Steiner and M. Kirsch, Optical spectroscopic methods for
intraoperative diagnosis, Anal. Bioanal. Chem. 406, 21–25 (2014).
[248] O. J. Old, L. M. Fullwood, R. Scott, G. R. Lloyd, L. M. Almond, N. A.
Shepherd, N. Stone, H. Barr, and C. Kendall, Vibrational spectroscopy
for cancer diagnostics, Anal. Methods 6, 3901–3917 (2014).

174
[249] L. Dong, X. Sun, Z. Chao, S. Zhang, J. Zheng, R. Gurung, J. Du, J. Shi, Y.
Xu, et al., Evaluation of FTIR spectroscopy as diagnostic tool for
colorectal cancer using spectral analysis, Spectrochim. Acta. A. Mol.
Biomol. Spectrosc. 122, 288–294 (2014).
[250] A. Benard, C. Desmedt, M. Smolina, P. Szternfeld, M. Verdonck, G.
Rouas, N. Kheddoumi, F. Rothé, D. Larsimont, et al., Infrared imaging in
breast cancer: automated tissue component recognition and spectral
characterization of breast cancer cells as well as the tumor
microenvironment, Analyst 139, 1044–1056 (2014).
[251] B. Bird, Milo&sbreve, Miljković, S. Remiszewski, A. Akalin, M. Kon, and
M. Diem, Infrared spectral histopathology (SHP): a novel diagnostic tool
for the accurate classification of lung cancer, Lab. Invest. 92, 1358–1373
(2012).
[252] T. J. Fairchild and P. A. Fournier, Glycogen determination using periodic
acid-schiff: artifact of muscle preparation, Med. Sci. Sports Exerc. 36,
2053–2058 (2004).
[253] R. G. Jones and C. B. Thompson, Tumor suppressors and cell
metabolism: a recipe for cancer growth, Genes Dev. 23, 537–548
(2009).
[254] H. Wiig and M. A. Swartz, Interstitial Fluid and Lymph Formation and
Transport: Physiological Regulation and Roles in Inflammation and
Cancer, Physiol. Rev. 92, 1005–1060 (2012).
[255] C. R. Santos and A. Schulze, Lipid metabolism in cancer, FEBS J. 279,
2610–2623 (2012).
[256] R. J. Gillies, I. Robey, and R. A. Gatenby, Causes and Consequences of
Increased Glucose Metabolism of Cancers, J. Nucl. Med. 49, 24S–42S
(2008).
[257] C. E. Zois, E. Favaro, and A. L. Harris, Glycogen metabolism in cancer,
Biochem. Pharmacol. 92, 3–11 (2014).

175
[258] V. Urboniene, M. Pucetaite, F. Jankevicius, A. Zelvys, V. Sablinskas, and
G. Steiner, Identification of kidney tumor tissue by infrared
spectroscopy of extracellular matrix, J. Biomed. Opt. 19, 87005 (2014).
[259] Z. Bar-Joseph, D. K. Gifford, and T. S. Jaakkola, Fast optimal leaf
ordering for hierarchical clustering, Bioinforma. Oxf. Engl. 17 Suppl 1,
S22-29 (2001).
[260] A. Barth, Infrared spectroscopy of proteins, Biochim. Biophys. Acta BBA
- Bioenerg. 1767, 1073–1101 (2007).
[261] M. Diem, M. Miljković, B. Bird, A. I. Mazur, J. M. Schubert, D. Townsend,
N. Laver, M. Almond, and O. Old, Cancer screening via infrared spectral
cytopathology (SCP): results for the upper respiratory and digestive
tracts, Analyst 141, 416–428 (2016).
[262] O. Warburg, On the Origin of Cancer Cells, Science 123, 309–314 (1956).
[263] A. G. Lalkhen and A. McCluskey, Clinical tests: sensitivity and specificity,
Contin. Educ. Anaesth. Crit. Care Pain 8, 221–223 (2008).

176
Appendix I
Fig. AI-1. Block scheme of the procedure of diffuse reflection subtraction from the
experimental reflectance spectra.

177
Fig. AI-2. Optical (A) and IR chemical (B-E) images of urinary stone constituted from apatite
and COM. (B) and (C) shows distribution of apatite and COM respectively as determined by
calculating integral intensity of characteristic spectral bands in the raw spectra; (D) and (E)
shows distribution of apatite and COM respectively as determined by calculating integral
intensity of characteristic spectral bands in the KKT corrected spectra after the subtraction
of diffuse reflection.
Fig. AI-3. Optical (A) and IR chemical (B-E) images of urinary stone constituted from COM
and apatite. (B) and (C) shows distribution of COM and apatite respectively as determined
by calculating integral intensity of characteristic spectral bands in the raw spectra; (D) and
(E) shows distribution of COM and apatite respectively as determined by calculating integral
intensity of characteristic spectral bands in the KKT corrected spectra after the subtraction
of diffuse reflection.

178
Fig. AI-4. Optical (A) and IR chemical (B-E) images of urinary stone constituted from COM
and apatite. (B) and (C) shows distribution of COM and apatite respectively as determined
by calculating integral intensity of characteristic spectral bands in the raw spectra; (D) and
(E) shows distribution of COM and apatite respectively as determined by calculating integral
intensity of characteristic spectral bands in the KKT corrected spectra after the subtraction
of diffuse reflection.
Fig. AI-5. Optical (A) and IR chemical (B-E) images of urinary stone constituted from COM
and uric acid. (B) and (C) shows distribution of COM and uric acid respectively as determined
by calculating integral intensity of characteristic spectral bands in the raw spectra; (D) and
(E) shows distribution of COM and uric acid respectively as determined by calculating
integral intensity of characteristic spectral bands in the KKT corrected spectra after the
subtraction of diffuse reflection.

179
Fig. AI-6. Optical (A) and IR chemical (B-G) images of urinary stone constituted from apatite,
COM and uric acid. (B), (C) and (D) shows distribution of apatite, COM and uric acid
respectively as determined by calculating integral intensity of characteristic spectral bands
in the raw spectra; (E), (F) and (G) shows distribution of apatite, COM and uric acid
respectively as determined by calculating integral intensity of characteristic spectral bands
in the KKT corrected spectra after the subtraction of diffuse reflection.
Fig. AI-7. Optical (A) and IR chemical (B, C) images of urinary stone constituted from COM.
(B) shows distribution of COM as determined by calculating integral intensity of
characteristic spectral bands in the raw spectra; (C) shows distribution of COM as
determined by calculating integral intensity of characteristic spectral bands in the KKT
corrected spectra after the subtraction of diffuse reflection.

180
Appendix II
Fig. AII-1. Optical (A), MIR (B-D) and FIR (E-I) chemical images of urinary stone constituted
from apatite and COM. (B) and (C) shows distribution of apatite and COM respectively as
determined by calculating integral intensity of characteristic spectral bands in the raw MIR
spectra; (E) and (G) shows distribution of apatite and COM respectively as determined by
calculating integral intensity of characteristic spectral bands in the raw FIR spectra; (D) and
(H) shows MIR and FIR chemical images created based on the HCA analysis; (E) and (I) shows
characteristic spectra in each group identified by the HCA in (D) and (H) respectively.
Fig. AII-2. Optical (A), MIR (B-D) and FIR (E-I) chemical images of urinary stone constituted
from COM and apatite. (B) and (C) shows distribution of COM and apatite respectively as
determined by calculating integral intensity of characteristic spectral bands in the raw MIR
spectra; (E) and (G) shows distribution of COM and apatite respectively as determined by
calculating integral intensity of characteristic spectral bands in the raw FIR spectra; (D) and
(H) shows MIR and FIR chemical images created based on the HCA analysis; (E) and (I) shows
characteristic spectra in each group identified by the HCA in (D) and (H) respectively.

181
Fig. AII-3. Optical (A), MIR (B-D) and FIR (E-I) chemical images of urinary stone constituted
from COM and apatite. (B) and (C) shows distribution of COM and apatite respectively as
determined by calculating integral intensity of characteristic spectral bands in the raw MIR
spectra; (E) and (G) shows distribution of COM and apatite respectively as determined by
calculating integral intensity of characteristic spectral bands in the raw FIR spectra; (D) and
(H) shows MIR and FIR chemical images created based on the HCA analysis; (E) and (I) shows
characteristic spectra in each group identified by the HCA in (D) and (H) respectively.
Fig. AII-4. Optical (A), MIR (B-D) and FIR (E-I) chemical images of urinary stone constituted
from uric acid and COM. (B) and (C) shows distribution of uric acid and COM respectively as
determined by calculating integral intensity of characteristic spectral bands in the raw MIR
spectra; (E) and (G) shows distribution of uric acid and COM respectively as determined by
calculating integral intensity of characteristic spectral bands in the raw FIR spectra; (D) and
(H) shows MIR and FIR chemical images created based on the HCA analysis; (E) and (I) shows
characteristic spectra in each group identified by the HCA in (D) and (H) respectively.

182
Fig. AII-5. Optical (A), MIR (B-E) and FIR (G-J) chemical images of urinary stone constituted
from apatite, COM and uric acid. (B), (C) and (D) shows distribution of apatite, COM and uric
acid respectively as determined by calculating integral intensity of characteristic spectral
bands in the raw MIR spectra; (G), (H) and (I) shows distribution of apatite, COM and uric
acid respectively as determined by calculating integral intensity of characteristic spectral
bands in the raw FIR spectra; (E) and (J) shows MIR and FIR chemical images created based
on the HCA analysis; (F) and (K) shows characteristic spectra in each group identified by the
HCA in (E) and (J) respectively.
Fig. AII-6. Optical (A), MIR (B-D) and FIR (E-I) chemical images of urinary stone constituted
from COM and ACP. (B) and (C) shows distribution of COM and ACP respectively as
determined by calculating integral intensity of characteristic spectral bands in the raw MIR
spectra; (E) and (G) shows distribution of COM and ACP respectively as determined by
calculating integral intensity of characteristic spectral bands in the raw FIR spectra; (D) and
(H) shows MIR and FIR chemical images created based on the HCA analysis; (E) and (I) shows
characteristic spectra in each group identified by the HCA in (D) and (H) respectively.

183
Appendix III
Fig. AIII-1. Multimodal CARS images of synthetic calcium oxalate monohydrate powder
recorded with the “Stokes” laser turned on (top row) and off (bottom).
Fig. AIII-2. Multimodal CARS images of synthetic uric acid powder recorded with the
“Stokes” laser turned on (top row) and off (bottom).

184
Fig. AIII-3. Multimodal CARS images of synthetic uric acid dihydrate powder recorded with
the “Stokes” laser turned on (top row) and off (bottom).
Fig. AIII-4. Optical (A), FT-IR (B) and multimodal CARS chemical (D-I) images of one half of
urinary stone constituted from calcium oxalate monohydrate (COM) and amorphous
calcium phosphate (ACP); IR reflectance spectra in (C) correspond to areas of different color
(chemical composition) in (B). Boxes in (A) and (B) shows the areas imaged by multimodal
CARS microscopy: (D) fluorescence at 390 nm signal intensity image; (E) TPEF signal intensity
image; (F) CARS and fluorescence at 647 nm intensity image; (G) merged fluorescence at
390 nm (blue), TPEF (green) and CARS/fluorescence at 647 nm (red) intensities image. Scale
bar (D-G): 200 μm.

185
Fig. AIII-5. Optical (A), FT-IR (B) and multimodal CARS chemical (D-I) images of one half of
urinary stone constituted from calcium oxalate monohydrate (COM) and amorphous
calcium phosphate (ACP); IR reflectance spectra in (C) correspond to areas of different color
(chemical composition) in (B). Boxes in (A) and (B) shows the areas imaged by multimodal
CARS microscopy: (D) fluorescence at 390 nm signal intensity image; (E) TPEF signal intensity
image; (F) CARS and fluorescence at 647 nm intensity image; (G) merged fluorescence at
390 nm (blue), TPEF (green) and CARS/fluorescence at 647 nm (red) intensities image. Scale
bar (D-G): 250 μm.

186
Fig. AIII-6. Optical (A), FT-IR (B) and multimodal CARS chemical (D-I) images of one half of
urinary stone constituted from calcium oxalate monohydrate (COM) and amorphous
calcium phosphate (ACP); IR reflectance spectra in (C) correspond to areas of different color
(chemical composition) in (B). Boxes in (A) and (B) shows the areas imaged by multimodal
CARS microscopy: (D) fluorescence at 390 nm signal intensity image; (E) TPEF signal intensity
image; (F) CARS and fluorescence at 647 nm intensity image; (G) merged fluorescence at
390 nm (blue), TPEF (green) and CARS/fluorescence at 647 nm (red) intensities image. Scale
bar (D-G): 500 μm.

187
Fig. AIII-7. Optical (A), FT-IR (B) and multimodal CARS chemical (D-I) images of one half of
urinary stone constituted from calcium oxalate monohydrate (COM), amorphous calcium
phosphate (ACP) and uric acid; IR reflectance spectra in (C) correspond to areas of different
color (chemical composition) in (B). Boxes in (A) and (B) shows the areas imaged by
multimodal CARS microscopy: (D) fluorescence at 390 nm signal intensity image; (E) TPEF
signal intensity image; (F) CARS and fluorescence at 647 nm intensity image; (G) merged
fluorescence at 390 nm (blue), TPEF (green) and CARS/fluorescence at 647 nm (red)
intensities image. Scale bar (D-G): 200 μm.

188
Fig. AIII-8. Optical (A), FT-IR (B) and multimodal CARS chemical (D-I) images of one half of
urinary stone constituted from calcium oxalate monohydrate (COM) and apatite; IR
reflectance spectra in (C) correspond to areas of different color (chemical composition) in
(B). Boxes in (A) and (B) shows the areas imaged by multimodal CARS microscopy: (D)
fluorescence at 390 nm signal intensity image; (E) TPEF signal intensity image; (F) CARS and
fluorescence at 647 nm intensity image; (G) merged fluorescence at 390 nm (blue), TPEF
(green) and CARS/fluorescence at 647 nm (red) intensities image. Scale bar (D-G): 500 μm.

189
Fig. AIII-9. Optical (A), FT-IR (B) and multimodal CARS chemical (D-I) images of one half of
urinary stone constituted from calcium oxalate monohydrate (COM) and uric acid; IR
reflectance spectra in (C) correspond to areas of different color (chemical composition) in
(B). Boxes in (A) and (B) shows the areas imaged by multimodal CARS microscopy: (D)
fluorescence at 390 nm signal intensity image; (E) TPEF signal intensity image; (F) CARS and
fluorescence at 647 nm intensity image; (G) merged fluorescence at 390 nm (blue), TPEF
(green) and CARS/fluorescence at 647 nm (red) intensities image. Scale bar (D-G): 500 μm.

190
Fig. AIII-10. Optical (A), FT-IR (B) and multimodal CARS chemical (D-I) images of one half of
urinary stone constituted from calcium oxalate monohydrate (COM) and amorphous
calcium phosphate (ACP); IR reflectance spectra in (C) correspond to areas of different color
(chemical composition) in (B). Boxes in (A) and (B) shows the areas imaged by multimodal
CARS microscopy: (D) fluorescence at 390 nm signal intensity image; (E) TPEF signal intensity
image; (F) CARS and fluorescence at 647 nm intensity image; (G) merged fluorescence at
390 nm (blue), TPEF (green) and CARS/fluorescence at 647 nm (red) intensities image. Box in
(F) indicates the enlarged region which contains CARS active structures represented in (I).
Scale bar (D-G): 250 μm.

191
Appendix IV
Fig. AIV-1. Transmission electron micrographs of Lee-Meisel (A), Aherne et al. (B),
Leopold-Lendl (C) colloids.
Fig. AIV-2. UV-VIS spectra of Lee-Meisel (red), Leopold-Lendl (green) and Aherne et al.
(blue) concentrated colloids.

192
Fig. AIV-3. Raman spectrum of 65 mM uric acid aqueous solution.
Fig. AIV-4. Profiles of SERS enhancement factor distribution across Lee-Meisel colloidal
drops. The analytical enhancement factors were calculated as described by E. C. Le Ru et al.
[234] for the spectral band at 500 cm-1 representing CN bending/in-plane ring deformation
vibrations in uric acid. Raman spectrum of 65 mM uric acid solution was used in the
calculations.

193
Fig. AIV-5. Profiles of SERS enhancement factor distribution across Leopold-Lendl
colloidal drops. The analytical enhancement factors were calculated as described by E. C. Le
Ru et al. [234] for the spectral band at 500 cm-1 representing CN bending/in-plane ring
deformation vibrations in uric acid. Raman spectrum of 65 mM uric acid solution was used in
the calculations.
Fig. AIV-6. Profiles of SERS enhancement factor distribution across Aherne et al. colloidal
drops. The analytical enhancement factors were calculated as described by E. C. Le Ru et al.
[234] for the spectral band at 500 cm-1 representing CN bending/in-plane ring deformation
vibrations in uric acid. Raman spectrum of 65 mM uric acid solution was used in the
calculations.

194
A B C
D E F
G H
Fig. AIV-7. Uric acid, its tautomers, anions (structures named after M. Altarsha et al.[219])
and their complexes with five-atom silver cluster as calculated by DFT B3LYP functional
and LANL2DZ basis set: A – monomeric uric acid U0A (ΔE = = 0 kcal/mol); B – uric acid
tautomer U1L (ΔE = 3.45 kcal/mol); C – uric acid tautomer U1B (ΔE = 4.52 kcal/mol); D –
uric acid tautomer U2G (ΔE = = 6.32 kcal/mol); E – complex of uric acid tautomer U1L and
five-atom silver cluster (ΔE = 162.59 kcal/mol); F – complex of uric acid tautomer U1B and
five-atom silver cluster (ΔE = 161.52 kcal/mol); G – complex of uric acid tautomer U2G and
five-atom silver cluster (ΔE = 162.02 kcal/mol); H – complex of uric acid tautomer U2G and
five-atom silver cluster (ΔE = 169.05 kcal/mol). Such large ΔE of the complexes implies that
molecular bond is forming between the uric acid molecule and the silver atoms. The
corresponding uric acid anions and their complexes with silver presented much larger values
of ΔE (i.e., were less stabile) and therefore are not displayed separately.

195
Acknowledgements
The knowledge and experience gained during the years of my PhD
studies widely exceeds the content of this thesis. I would like to take the
opportunity and express my most sincere gratitude to the many people who
made it possible.
First and foremost, I would like to thank my supervisor, Prof.
Valdas Šablinskas, for introducing me to the ways of science, long before the
actual start of the PhD studies, for guidance, for the immense patience and
support, for encouraging and, sometimes, pushing me forward. Here, I would
also like to convey my appreciation to Prof. Gintaras Dikčius, for introducing
me, at that time, a lost second-year student, to my supervisor.
Second, I wish to thank my scientific advisor, Prof. Per Uvdal, for
welcoming me in MAX IV laboratory in Lund and for, together with Prof. Vivi
Vajda, challenging me with new and interesting tasks.
Third, I would like to express my gratitude to Prof. Gerald Steiner
and Dr. Roberta Galli for both their hospitality during my stay in their
laboratory in Dresden and the immense help in writing the paper. Also, to the
fellow students and researchers here in Vilnius University, Faculties of Physics
and Chemistry who kindly let me in their laboratories and offered help with
experiments. This thesis would not have existed without them. In addition, I
greatly acknowledge financial support from the Research Council of Lithuania,
Vilnius University Mobility Fund of Doctoral Students and Utrecht Network.
Further, I am grateful to all my colleagues in the Department of
General Physics and Spectroscopy for creating a nice and friendly atmosphere
to work in. Many thanks go to Justinas for always sharing his knowledge and
his manifold help in the laboratory. Especially, I would like to thank Martynas
for fun and fruitful everyday discussions and being a great office-mate.

196
Finally, I am immensely grateful to my family and friends who
always support me in all my endeavors. I give my special thanks to Neimantas
for challenging me, for listening and making a joke when I most needed it and
for taking me on inspiring adventures.