milestone report 6 - xcel energy
TRANSCRIPT
Twin Cities Campus Saint Anthony Falls Laboratory College of Science and Engineering
2 Third Ave SE Minneapolis, MN 55414 Main Office: 612-624-4363 Fax: 612-624-4398 http://www.safl.umn.edu
Project Title: Wind turbine generated sound: Targeted research to improve measurement, analysis, and annoyance thresholds based on measured human response
Contract Number: RD4-12 Milestone Number: 6 Report Date: 3/22/2018 Principal Investigator: Jeff Marr (612) 624-4427 Contract Contact: Bridget Foss (612) 624-5571 Congressional District: (Corporate office) Minnesota 5th Congressional District: (Project location) Minnesota 1st and 5th
MILESTONE REPORT 6
Executive Summary
The goals of the project are to: 1) provide technically defensible data and a coherent review of the characteristics of wind turbine noise and techniques for measuring the noise; 2) recommend best practices for pre- and post- project noise measurements for wind project development; and 3) provide usable information on how humans perceive and respond to the sound generated from wind turbines.
Acoustic measurements have been made and analyzed to characterize wind turbine noise. Milestone Report 6 covers the completed analysis of data collected in 2016 at a multi-turbine site as well as at Eolos, a single turbine site dedicated to wind energy research. Special attention was placed on infrasound and amplitude modulation (AM), the two noise characteristics that are most often cited as causing annoyance or symptoms. Blade passing frequencies (BPF) were normalized to 1 Hz in order to collapse data into a single dataset. Amplitude modulation calculated using the Institute of Acoustics Amplitude Modulation Working Group (AMWG, 2016) method showed no relation to wind shear in the data collected. Infrasound peak levels at BPF harmonics were prominent but well below human perception thresholds and infrasound at the BPF was fully masked by background infrasound.
Stimulus signals that will be used for the human response testing are based upon the measurements collected at the field sites. The characteristics of these recreated signals are based on the levels and prominence of the BPF harmonics for infrasound and modulation frequency and depth of a 50 to 800 Hz carrier frequency. The infrasound peaks and prominence of the BPF used as the stimulus are shown in Figure 8. Amplitude modulation will have a depth of 10 dB.
The human response study will use measurements from the three datasets as well as information in the literature to recreate audible sound and infrasound in the laboratory. Specifically, response to levels of infrasound and audible amplitude modulation are of interest. The physical, emotional, and psychological responses of human subjects exposed to the synthesized sound will be measured.
Results of the characterizations of wind turbine generated sounds and the response of individuals to these sounds, along with a review of literature and international regulations, will be used to write guidelines which may be used by Minnesota noise regulators. A draft research plan for the human response study with details on test equipment, sound generating technologies, sensors and measurements, and the data collection process is included. A summary report on the pilot data collected using the test set-up is also included in this report. This data validates the experimental setup.
Technical Progress
The field campaign to collect audible and infrasound noise from the Eolos and multi-turbine sites took place from June to December 2016. Acoustic measurements were collected with a Brüel and Kjær (B&K) 4193 infrasound microphone and a B&K 4191 audible range microphone. In addition to the microphones, data was collected from a weather station located near the acoustic equipment which measured wind speed, wind direction, air temperature, and pressure. The measurements were recorded at a height of 3 m; wind speed was generally extrapolated to a height of 10 m (standard reference height). Upwind velocity measurements with respect to the wind turbine of interest were taken by a LiDAR instrument. Details of the measurement equipment are given in Milestone Report 3.
Analysis Methods: Audible Noise
Audible noise data were analyzed to characterize the overall noise levels, correlations to wind conditions, frequency content, and amplitude modulation as a function of wind conditions and orientation/distance from the turbine(s). The noise measurements included both day and night recordings for a range of distances from the turbine(s).
Amplitude modulation analysis was performed on 10 second segments of data using an A-weighted 100 ms 𝐿𝐿𝑒𝑒𝑒𝑒 using a method published by the Institute of Acoustics Amplitude Modulation Working Group. The method, which distinguishes AM due to the turbine from other fluctuations in the background noise, is summarized here:
1. Raw microphone signal is processed using an A-weighting filter, followed by bandpass filters with frequency ranges of 50-200 Hz, 100-400 Hz, and 200-800 Hz.
2. The 100 ms, A-weighted 𝐿𝐿𝑒𝑒𝑒𝑒 is calculated for each filtered signal for a 10 second (s) segment of data
3. A Fourier transform of the 100 ms, A-weighted 𝐿𝐿𝑒𝑒𝑒𝑒 data is taken of each 10 s segment 4. The prominence of the blade-passing frequency (BPF) and its harmonics are assessed.
Measurements lacking a clear peak of the fundamental BPF are discarded. 5. A time domain 𝐿𝐿𝑒𝑒𝑒𝑒 signal is reconstruction, based on the spectral peak heights at the BPF and the
2nd and 3rd harmonics (if applicable). The peak-peak amplitude of the AM is measured using the 95th and 5th percentiles of the reconstructed 𝐿𝐿𝑒𝑒𝑒𝑒.
The method then assesses the number of 10 s segments with significant AM within 10 minute windows to find periods of consistently significant AM. In the present data, this final step was omitted.
Analysis Methods: Infrasound
The infrasound data were analyzed to 1) characterize the overall levels of infrasound under different wind conditions, 2) characterize the variability in spectral content of the infrasound signals and 3) distinguish between ambient infrasound and turbine-generated infrasound. In particular, the variability in the
prominence of the blade-passing frequency and harmonics in the frequency spectra were characterized to inform the infrasound waveforms used in the human response testing.
The measured infrasound signals were assumed to be composed of infrasound generated by the turbine overlaid with ambient background infrasound. To capture a sufficient number of low frequency oscillations in a sample segment, the infrasound signals were analyzed in 30 s segments. The algorithms used in the AM analysis for identifying and quantifying the prominence of the blade-passing frequency and harmonics were also used for the infrasound analysis. Fourier analysis was used to generate a frequency spectra for each 30 s segment. Multiple frequency spectra were normalized to a BPF of 1 Hz and averaged in bins of similar wind conditions to obtain characteristic spectra of turbine-generated infrasound for different wind speeds.
Results: Amplitude Modulation
There was significant variability in the AM modulation depth in the data sets, as summarized in Table 1; however, the levels of AM were rather low at both the single turbine and multi-turbine sites. Background (turbine off) noise samples contained about 10% with measureable AM and the median modulation depth of the background noise was similar to the modulation depth of turbine-on samples. The maximum measured AM depth was 3.7 dB. Literature indicates AM depth can be greater than 10 dB; however, values this high seem to be a rare event likely occurring only at certain wind farms and were not captured during our measurements.
Table 1: Summary of amplitude modulation results based on the IOA methodology. These results are for the middle frequency band (100-400 Hz), which had the highest fraction of samples with AM.
2016 Eolos 2016 Wind Farm Normal Operation Back-ground Normal Operation Back-ground
# Segments Analyzed 2040 720 3048 1080 % with AM 27% 8% 28% 8% Median AM depth 2.2 dB 2.4 dB 2.3 dB 2.4 dB Standard Deviation 0.7 dB 1.2 dB 0.6 dB 1.2 dB 90th percentile 3.1 dB 4.3 dB 3.0 dB 4.5 dB
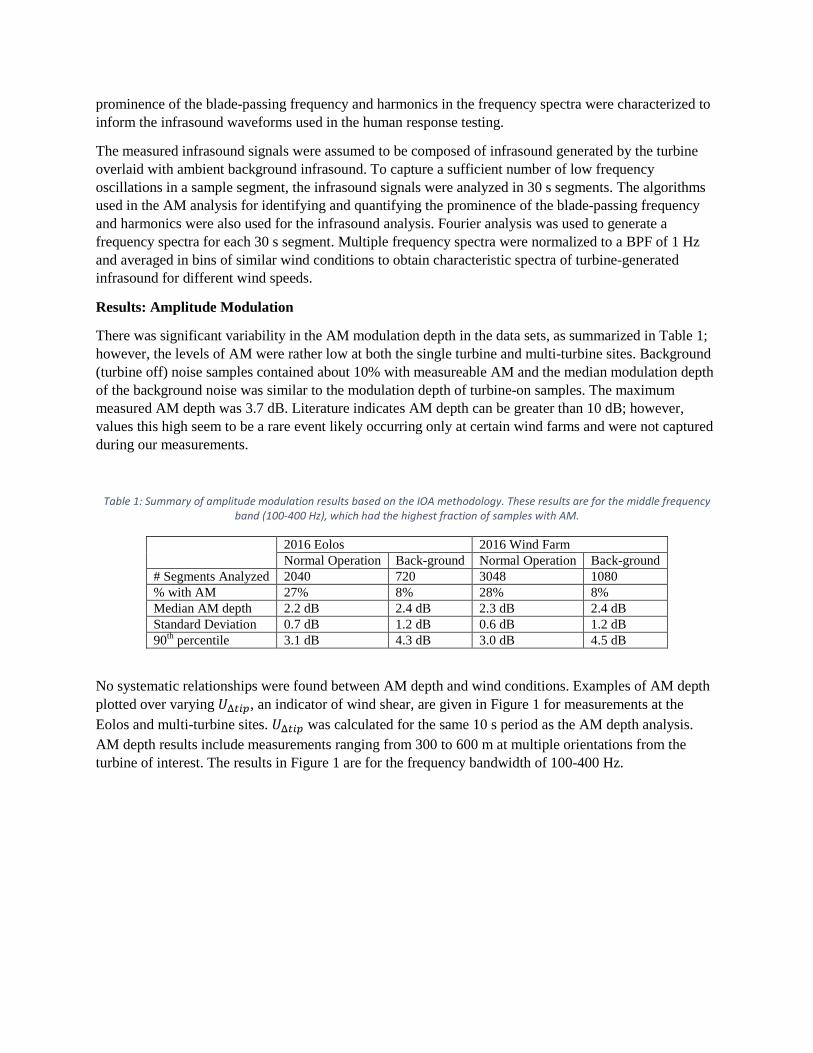
No systematic relationships were found between AM depth and wind conditions. Examples of AM depth plotted over varying 𝑈𝑈Δ𝑡𝑡𝑡𝑡𝑡𝑡, an indicator of wind shear, are given in Figure 1 for measurements at the Eolos and multi-turbine sites. 𝑈𝑈Δ𝑡𝑡𝑡𝑡𝑡𝑡 was calculated for the same 10 s period as the AM depth analysis. AM depth results include measurements ranging from 300 to 600 m at multiple orientations from the turbine of interest. The results in Figure 1 are for the frequency bandwidth of 100-400 Hz.
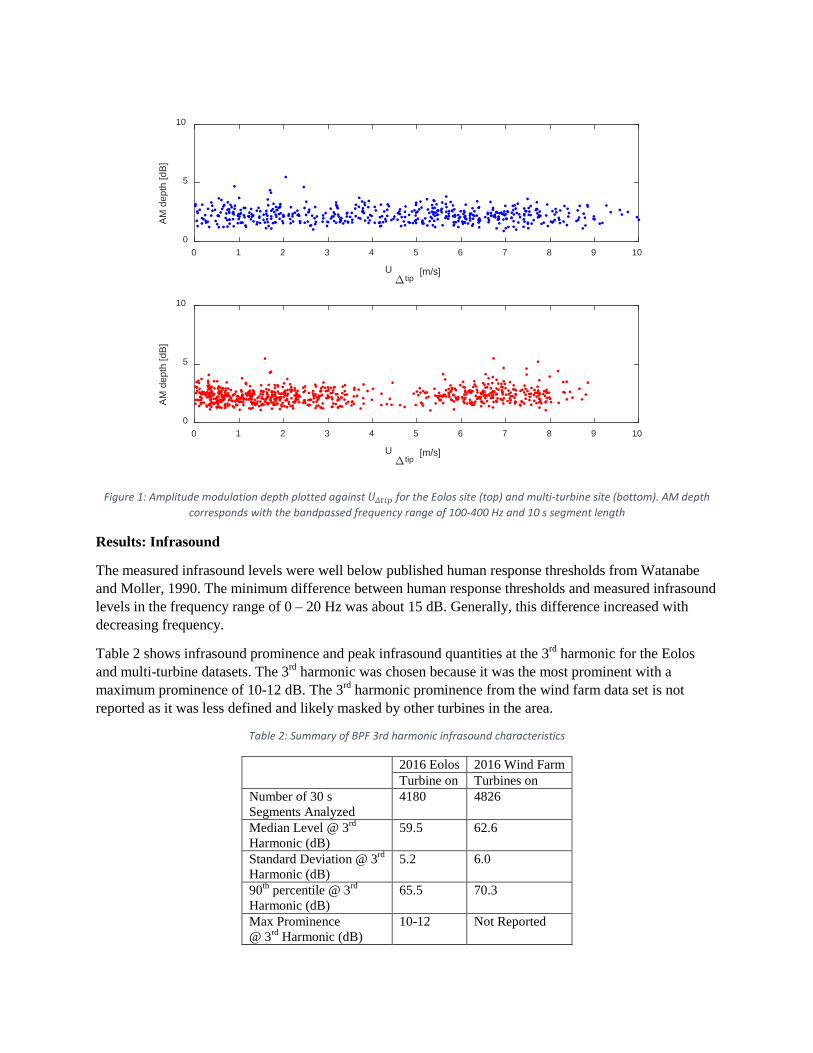
Figure 1: Amplitude modulation depth plotted against 𝑈𝑈𝛥𝛥𝑡𝑡𝑡𝑡𝑡𝑡 for the Eolos site (top) and multi-turbine site (bottom). AM depth corresponds with the bandpassed frequency range of 100-400 Hz and 10 s segment length
Results: Infrasound
The measured infrasound levels were well below published human response thresholds from Watanabe and Moller, 1990. The minimum difference between human response thresholds and measured infrasound levels in the frequency range of 0 – 20 Hz was about 15 dB. Generally, this difference increased with decreasing frequency.
Table 2 shows infrasound prominence and peak infrasound quantities at the 3rd harmonic for the Eolos and multi-turbine datasets. The 3rd harmonic was chosen because it was the most prominent with a maximum prominence of 10-12 dB. The 3rd harmonic prominence from the wind farm data set is not reported as it was less defined and likely masked by other turbines in the area.
Table 2: Summary of BPF 3rd harmonic infrasound characteristics
2016 Eolos 2016 Wind Farm Turbine on Turbines on
Number of 30 s Segments Analyzed
4180 4826
Median Level @ 3rd Harmonic (dB)
59.5 62.6
Standard Deviation @ 3rd Harmonic (dB)
5.2 6.0
90th percentile @ 3rd Harmonic (dB)
65.5 70.3
Max Prominence @ 3rd Harmonic (dB)
10-12 Not Reported
0 1 2 3 4 5 6 7 8 9 10
Utip
[m/s]
0
5
10
AM
dep
th [d
B]
0 1 2 3 4 5 6 7 8 9 10
Utip
[m/s]
0
5
10
AM
dep
th [d
B]
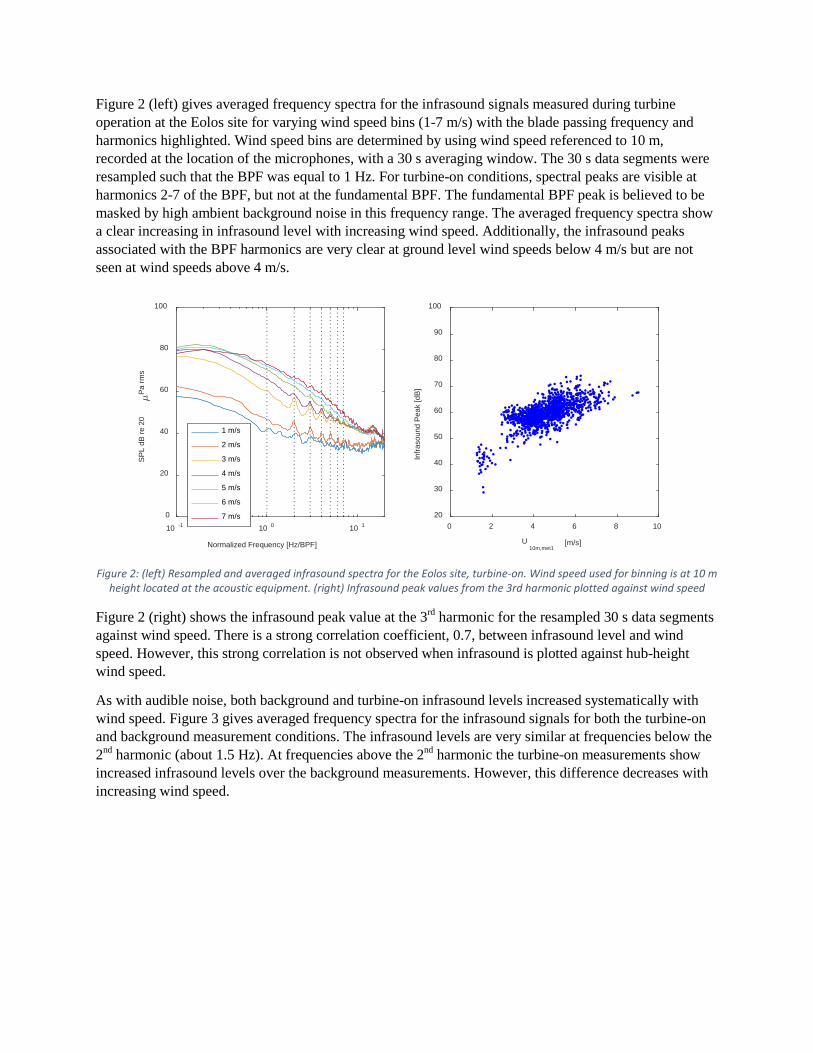
Figure 2 (left) gives averaged frequency spectra for the infrasound signals measured during turbine operation at the Eolos site for varying wind speed bins (1-7 m/s) with the blade passing frequency and harmonics highlighted. Wind speed bins are determined by using wind speed referenced to 10 m, recorded at the location of the microphones, with a 30 s averaging window. The 30 s data segments were resampled such that the BPF was equal to 1 Hz. For turbine-on conditions, spectral peaks are visible at harmonics 2-7 of the BPF, but not at the fundamental BPF. The fundamental BPF peak is believed to be masked by high ambient background noise in this frequency range. The averaged frequency spectra show a clear increasing in infrasound level with increasing wind speed. Additionally, the infrasound peaks associated with the BPF harmonics are very clear at ground level wind speeds below 4 m/s but are not seen at wind speeds above 4 m/s.
Figure 2: (left) Resampled and averaged infrasound spectra for the Eolos site, turbine-on. Wind speed used for binning is at 10 m height located at the acoustic equipment. (right) Infrasound peak values from the 3rd harmonic plotted against wind speed
Figure 2 (right) shows the infrasound peak value at the 3rd harmonic for the resampled 30 s data segments against wind speed. There is a strong correlation coefficient, 0.7, between infrasound level and wind speed. However, this strong correlation is not observed when infrasound is plotted against hub-height wind speed.
As with audible noise, both background and turbine-on infrasound levels increased systematically with wind speed. Figure 3 gives averaged frequency spectra for the infrasound signals for both the turbine-on and background measurement conditions. The infrasound levels are very similar at frequencies below the 2nd harmonic (about 1.5 Hz). At frequencies above the 2nd harmonic the turbine-on measurements show increased infrasound levels over the background measurements. However, this difference decreases with increasing wind speed.
10 -1 10 0 10 1
Normalized Frequency [Hz/BPF]
0
20
40
60
80
100
SP
L dB
re 2
0P
a rm
s
1 m/s
2 m/s
3 m/s
4 m/s
5 m/s
6 m/s
7 m/s0 2 4 6 8 10
U10m,met1
[m/s]
20
30
40
50
60
70
80
90
100
Infra
soun
d P
eak
[dB
]
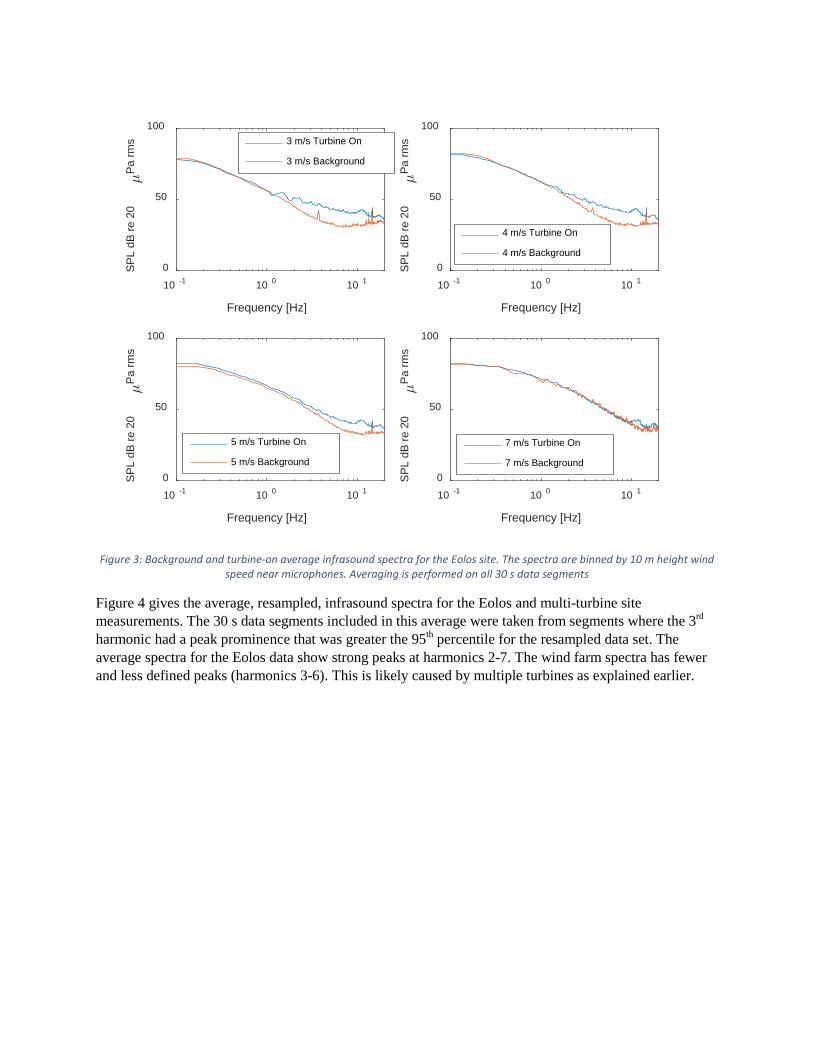
Figure 3: Background and turbine-on average infrasound spectra for the Eolos site. The spectra are binned by 10 m height wind speed near microphones. Averaging is performed on all 30 s data segments
Figure 4 gives the average, resampled, infrasound spectra for the Eolos and multi-turbine site measurements. The 30 s data segments included in this average were taken from segments where the 3rd harmonic had a peak prominence that was greater the 95th percentile for the resampled data set. The average spectra for the Eolos data show strong peaks at harmonics 2-7. The wind farm spectra has fewer and less defined peaks (harmonics 3-6). This is likely caused by multiple turbines as explained earlier.
10 -1 10 0 10 1
Frequency [Hz]
0
50
100S
PL
dB re
20
Pa
rms 3 m/s Turbine On
3 m/s Background
10 -1 10 0 10 1
Frequency [Hz]
0
50
100
SP
L dB
re 2
0P
a rm
s
4 m/s Turbine On
4 m/s Background
10 -1 10 0 10 1
Frequency [Hz]
0
50
100
SP
L dB
re 2
0P
a rm
s
5 m/s Turbine On
5 m/s Background
10 -1 10 0 10 1
Frequency [Hz]
0
50
100
SP
L dB
re 2
0P
a rm
s
7 m/s Turbine On
7 m/s Background
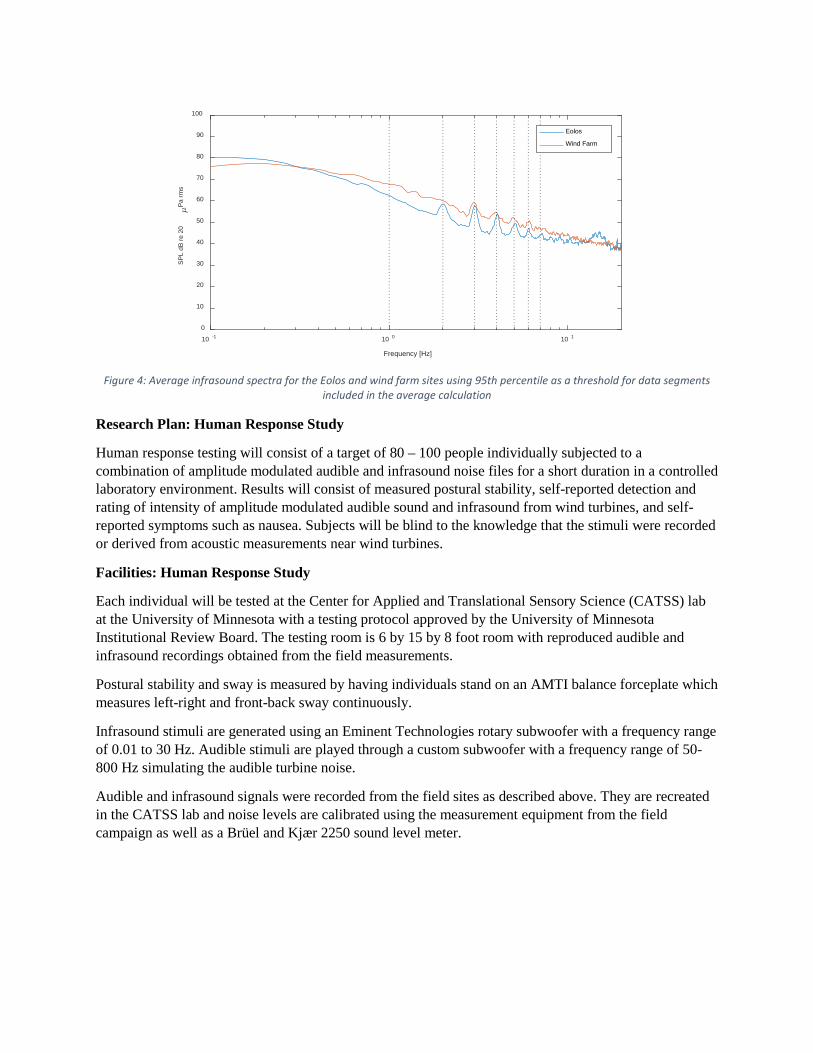
Figure 4: Average infrasound spectra for the Eolos and wind farm sites using 95th percentile as a threshold for data segments included in the average calculation
Research Plan: Human Response Study
Human response testing will consist of a target of 80 – 100 people individually subjected to a combination of amplitude modulated audible and infrasound noise files for a short duration in a controlled laboratory environment. Results will consist of measured postural stability, self-reported detection and rating of intensity of amplitude modulated audible sound and infrasound from wind turbines, and self-reported symptoms such as nausea. Subjects will be blind to the knowledge that the stimuli were recorded or derived from acoustic measurements near wind turbines.
Facilities: Human Response Study
Each individual will be tested at the Center for Applied and Translational Sensory Science (CATSS) lab at the University of Minnesota with a testing protocol approved by the University of Minnesota Institutional Review Board. The testing room is 6 by 15 by 8 foot room with reproduced audible and infrasound recordings obtained from the field measurements.
Postural stability and sway is measured by having individuals stand on an AMTI balance forceplate which measures left-right and front-back sway continuously.
Infrasound stimuli are generated using an Eminent Technologies rotary subwoofer with a frequency range of 0.01 to 30 Hz. Audible stimuli are played through a custom subwoofer with a frequency range of 50-800 Hz simulating the audible turbine noise.
Audible and infrasound signals were recorded from the field sites as described above. They are recreated in the CATSS lab and noise levels are calibrated using the measurement equipment from the field campaign as well as a Brüel and Kjær 2250 sound level meter.
10 -1 10 0 10 1
Frequency [Hz]
0
10
20
30
40
50
60
70
80
90
100
SP
L dB
re 2
0P
a rm
s
Eolos
Wind Farm
Stimuli: Human Response Study
Three types of infrasound stimuli will be presented: a) no infrasound, b) unaltered recorded infrasound obtained from field data; and c) spectrally peaky infrasound artificially generated to enhance spectral peaks.
Three types of audible stimuli will be presented: a) no audible sound, b) steady-state recorded audible turbine noise, and c) the audible turbine noise with sinusoidal amplitude modulation at the blade passing frequency superimposed on the signal with a modulation depth of 10 dB.
All exposure will be randomized and presented with eyes open and eyes closed. Each stimuli will be repeated. Each stimulus will last 40 s, including a 5 s start-up, 30 s of the stimulus, and a 5 s ramp down.
Measurements: Human Response Study
Measurement of human response include measurements from the balance force plate and self-reporting from the individuals. During exposure, postural sway is measured for front-back and left-right motion and analyzed for the area of the center of pressure (CoP) which indicates the amount of movement induced by the stimulus. After each exposure condition, listeners will be asked to indicate (Yes/No) whether they detected the acoustic noise of interest and asked to rate the pleasantness/unpleasantness of the sounds using a sliding visual scale from Very Unpleasant to Very Pleasant. Following the full procedure, participants will fill out a survey of any symptoms they experienced during the session.
Analysis: Human Response Testing
The results of the postural sway (CoP) will be analyzed using several factors:
• Pre- vs post-test baseline change in CoP indicating whether the postural stability of the individual significantly changed overall after exposure to the full range of stimuli.
• Comparison of CoP during amplitude modulated versus unmodulated audible sounds • Comparison of CoP during infrasound present versus absent
The results of the self-reporting will be used for descriptive statistics of detection and symptoms during testing.
Pilot Data Summary
Once the stimuli was chosen from the wind turbine noise field measurements, the stimuli was reproduced using the infrasound generator and subwoofer described above. The output levels were calibrated using the sound level meter. Originally, the research plan was to reproduce the infrasound in the lab at the same level as what was recorded in the field; however, the noise floor in the lab was higher than the infrasound recorded at the wind turbine site. This phenomenon is seen in Figure 8. Because of this, it would not be possible to calibrate the generated infrasound as it would be masked by the natural infrasound occurring in the building. To remedy this, we reproduced the infrasound at a higher level than what was recorded in the field. The stimuli would therefore be presented at a much higher level. If any response is observed by the test subjects to these levels, we will need to re-evaluate the location where the testing is performed so that the infrasound levels can be matched.
The audible stimulus, specifically the amplitude modulation signal, was generated as described above. The reproduced signal output was calibrated so that the amplitude modulation depth was 10 dB peak with a presentation level of 50 dBA measured at the modulation frequencies peak.

Appendix A includes details of the testing procedure and details of the stimuli such as the stimuli recorded from the wind turbine measurements and what is reproduced in the lab.
Research Plan: Clinical Trials
Laboratory assessments of individuals who have reported symptoms to wind turbine noise, or people with health/hearing issues that we believe might be affected by wind turbine noise, is a secondary task that is of interest to the research teams. These additional participants will undergo similar testing procedures as those outlined above for the healthy individuals. This new group is being termed the clinical group and therefore the testing is being called clinical trials.
We will aim to recruit a total of 20 additional participants. Ten will be people who live near wind turbines and who report experiencing symptoms and the other ten participants will be individuals who complain of general motion sickness and mild imbalance. These are subject to approval of the University of Minnesota Human Subjects Protection program, under review. As in the previous pilot testing sessions, each person will come to the CATSS lab and be tested for 60 minutes. We will measure sway for each of the stimulus (modulated audible sounds, unmodulated audible sound, and infrasound) in isolation and in pairs. Participants will stand on a force plate and measures of left-right and front-back sway will be continuously obtained. Prior to testing they will fill out symptoms questionnaires to determine their current state of health.
At any time during testing, if participants report negative symptoms, testing will discontinue. They will be referred for medical treatment if necessary.
We will analyze the results of the modulated versus unmodulated sounds to quantify the effect of the modulation patterns on the ratings of annoyance. After testing, we will further divide the participants into three groups based on their annoyance ratings (below average, average, and above average annoyance). We will then analyze the characteristics of those who report greater annoyance (age, general stress, sleep habits).
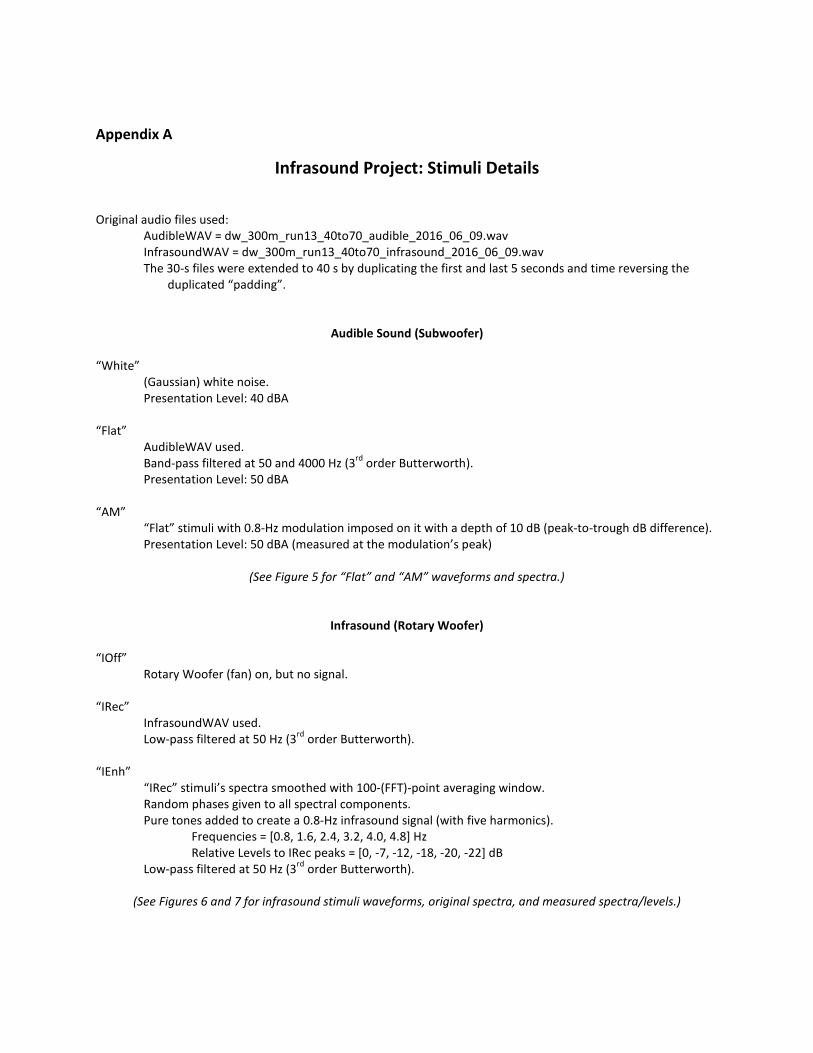
Appendix A
Infrasound Project: Stimuli Details Original audio files used:
AudibleWAV = dw_300m_run13_40to70_audible_2016_06_09.wav InfrasoundWAV = dw_300m_run13_40to70_infrasound_2016_06_09.wav The 30-s files were extended to 40 s by duplicating the first and last 5 seconds and time reversing the
duplicated “padding”.
Audible Sound (Subwoofer) “White”
(Gaussian) white noise. Presentation Level: 40 dBA
“Flat”
AudibleWAV used. Band-pass filtered at 50 and 4000 Hz (3rd order Butterworth). Presentation Level: 50 dBA
“AM”
“Flat” stimuli with 0.8-Hz modulation imposed on it with a depth of 10 dB (peak-to-trough dB difference). Presentation Level: 50 dBA (measured at the modulation’s peak)
(See Figure 5 for “Flat” and “AM” waveforms and spectra.)
Infrasound (Rotary Woofer) “IOff”
Rotary Woofer (fan) on, but no signal. “IRec”
InfrasoundWAV used. Low-pass filtered at 50 Hz (3rd order Butterworth).
“IEnh”
“IRec” stimuli’s spectra smoothed with 100-(FFT)-point averaging window. Random phases given to all spectral components. Pure tones added to create a 0.8-Hz infrasound signal (with five harmonics).
Frequencies = [0.8, 1.6, 2.4, 3.2, 4.0, 4.8] Hz Relative Levels to IRec peaks = [0, -7, -12, -18, -20, -22] dB
Low-pass filtered at 50 Hz (3rd order Butterworth).
(See Figures 6 and 7 for infrasound stimuli waveforms, original spectra, and measured spectra/levels.)
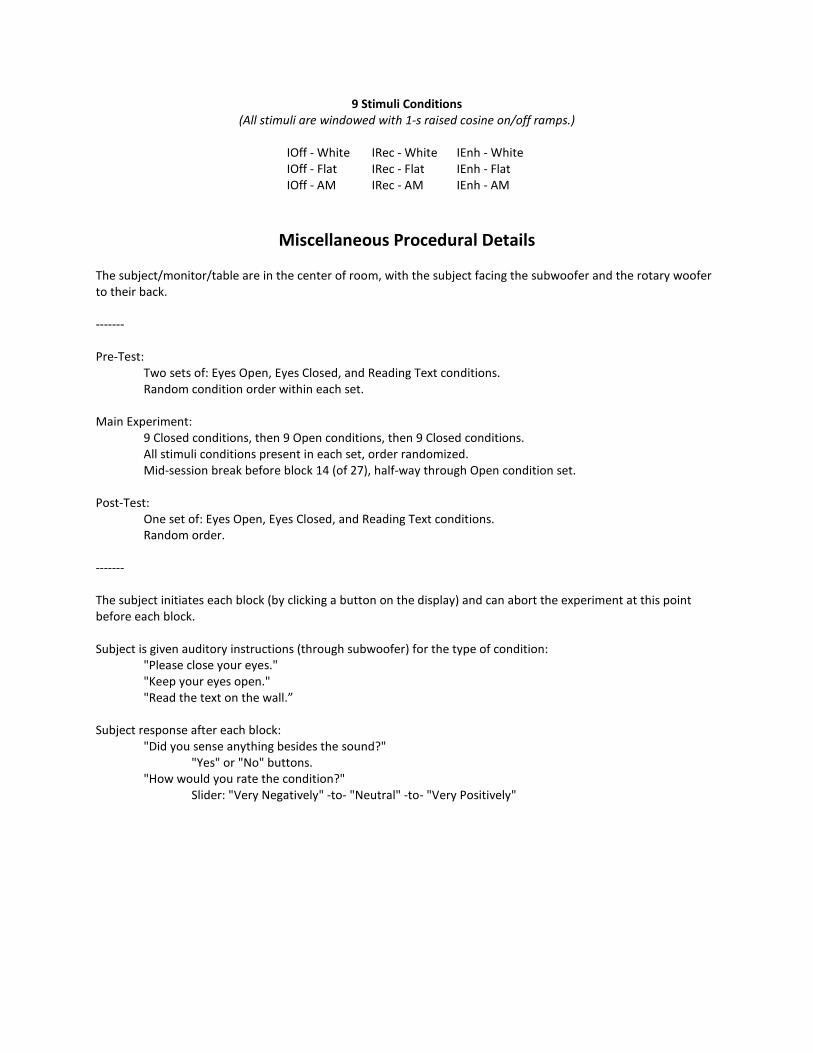
9 Stimuli Conditions (All stimuli are windowed with 1-s raised cosine on/off ramps.)
IOff - White IOff - Flat IOff - AM
IRec - White IRec - Flat IRec - AM
IEnh - White IEnh - Flat IEnh - AM
Miscellaneous Procedural Details The subject/monitor/table are in the center of room, with the subject facing the subwoofer and the rotary woofer to their back. ------- Pre-Test:
Two sets of: Eyes Open, Eyes Closed, and Reading Text conditions. Random condition order within each set.
Main Experiment:
9 Closed conditions, then 9 Open conditions, then 9 Closed conditions. All stimuli conditions present in each set, order randomized. Mid-session break before block 14 (of 27), half-way through Open condition set.
Post-Test:
One set of: Eyes Open, Eyes Closed, and Reading Text conditions. Random order.
------- The subject initiates each block (by clicking a button on the display) and can abort the experiment at this point before each block. Subject is given auditory instructions (through subwoofer) for the type of condition:
"Please close your eyes." "Keep your eyes open." "Read the text on the wall.”
Subject response after each block:
"Did you sense anything besides the sound?" "Yes" or "No" buttons.
"How would you rate the condition?" Slider: "Very Negatively" -to- "Neutral" -to- "Very Positively"
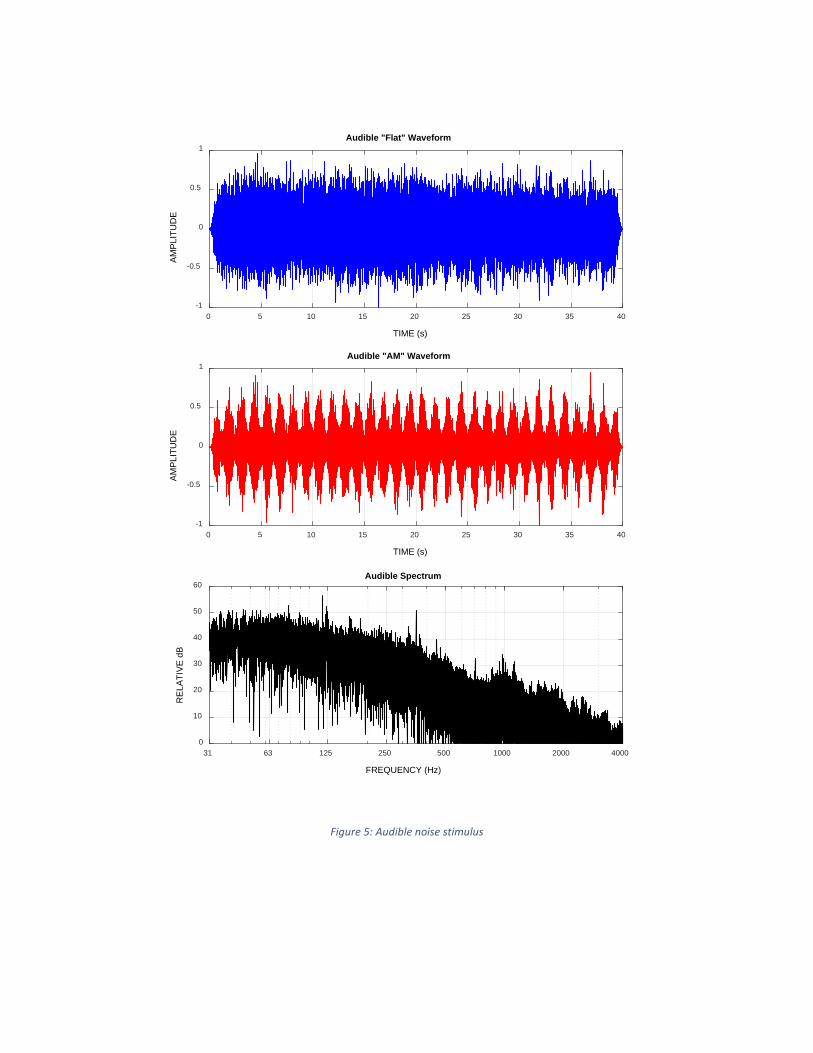
Figure 5: Audible noise stimulus
0 5 10 15 20 25 30 35 40
TIME (s)
-1
-0.5
0
0.5
1
AM
PLI
TUD
E
Audible "Flat" Waveform
0 5 10 15 20 25 30 35 40
TIME (s)
-1
-0.5
0
0.5
1
AM
PLI
TUD
E
Audible "AM" Waveform
31 63 125 250 500 1000 2000 4000
FREQUENCY (Hz)
0
10
20
30
40
50
60
RE
LATI
VE
dB
Audible Spectrum
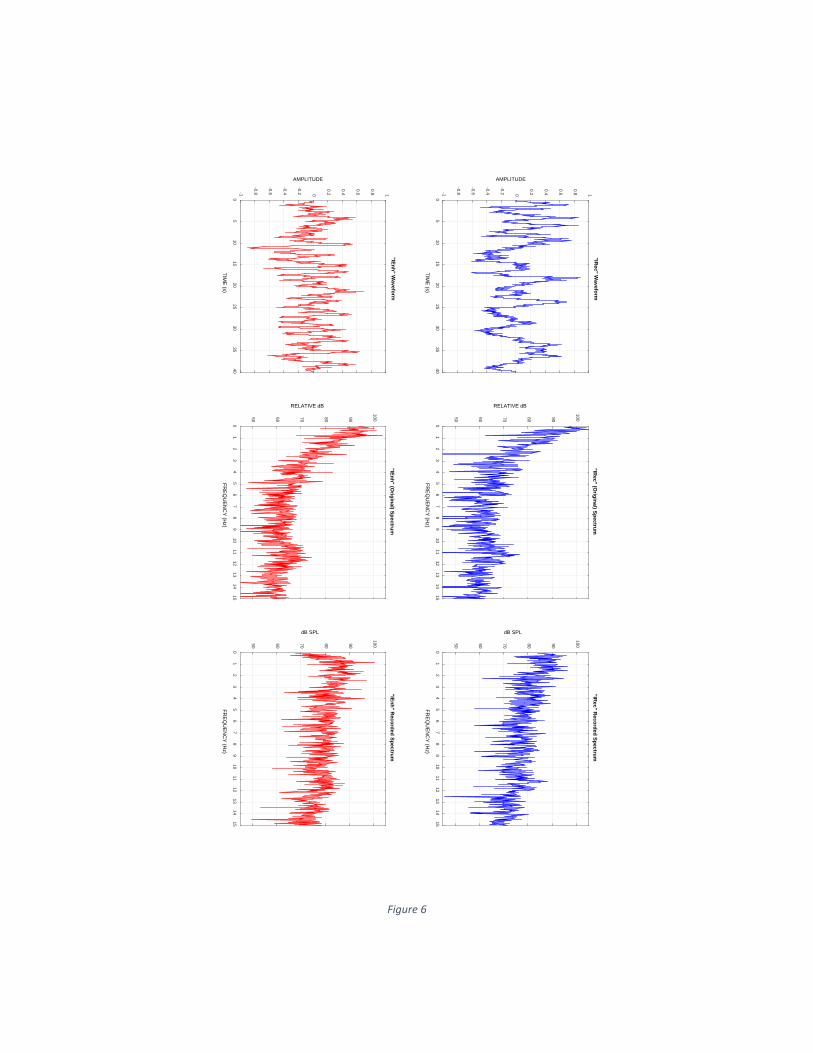
Figure 6
05
1015
2025
3035
40
TIME
(s)
-1
-0.8
-0.6
-0.4
-0.2 0
0.2
0.4
0.6
0.8 1
AMPLITUDE
"IRec" W
aveform
05
1015
2025
3035
40
TIME
(s)
-1
-0.8
-0.6
-0.4
-0.2 0
0.2
0.4
0.6
0.8 1
AMPLITUDE
"IEnh" Waveform
01
23
45
67
89
1011
1213
1415
FRE
QU
EN
CY
(Hz)
50 60 70 80 90
100
RELATIVE dB
"IRec" (O
riginal) Spectrum
01
23
45
67
89
1011
1213
1415
FRE
QU
EN
CY
(Hz)
50 60 70 80 90
100
RELATIVE dB
"IEnh" (Original) Spectrum
01
23
45
67
89
1011
1213
1415
FRE
QU
EN
CY
(Hz)
50 60 70 80 90
100
dB SPL
"IRec" R
ecorded Spectrum
01
23
45
67
89
1011
1213
1415
FRE
QU
EN
CY
(Hz)
50 60 70 80 90
100
dB SPL
"IEnh" Recorded Spectrum
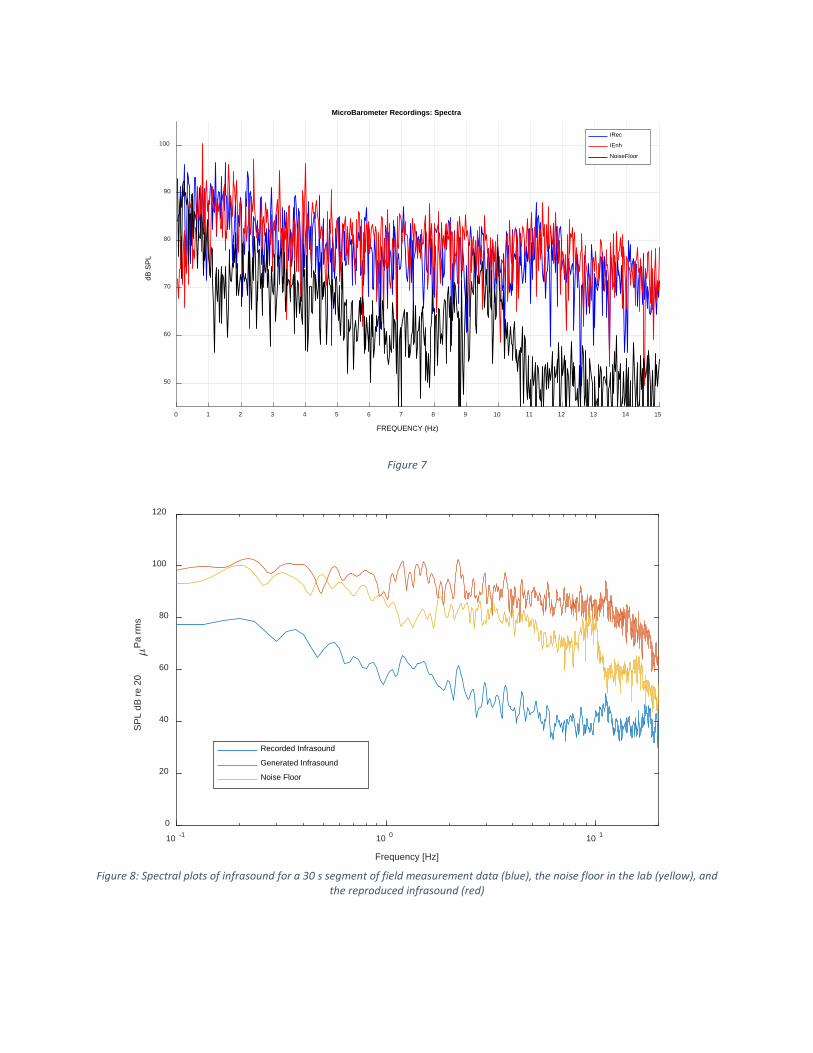
Figure 7
Figure 8: Spectral plots of infrasound for a 30 s segment of field measurement data (blue), the noise floor in the lab (yellow), and
the reproduced infrasound (red)
0 1 2 3 4 5 6 7 8 9 10 11 12 13 14 15
FREQUENCY (Hz)
50
60
70
80
90
100dB
SP
L
MicroBarometer Recordings: Spectra
IRec
IEnh
NoiseFloor
10 -1 10 0 10 1
Frequency [Hz]
0
20
40
60
80
100
120
SP
L dB
re 2
0P
a rm
s
Recorded Infrasound
Generated Infrasound
Noise Floor