milton keynes council and milton keynes development ... egels phase...milton keynes council and...
TRANSCRIPT

gva.co.uk
Milton Keynes Council and Milton Keynes Development Partnership Employment Land Review and Economic Growth Study Phase 1 Technical Analysis: Final Report
November 2015
Report
3 Brindleyplace Birmingham B1 2JB T: +44 (0)121 609 8265 F: +44 (0)121 609 8314
Milton Keynes Council and Milton Keynes Development Partnership Contents
November 2015 gva.co.uk
Contents Executive Summary ............................................................................................................................................ 1
1. Introduction ............................................................................................................................................ 3
2. Socio-Economic Baseline ..................................................................................................................... 5
3. Neighbours Policy Aspirations ............................................................................................................ 32
4. Property Market Analysis ..................................................................................................................... 41
5. The Functional Economic Area ......................................................................................................... 66
6. Employment Land Supply ................................................................................................................... 71
7. Stakeholder Engagement .................................................................................................................. 81
8. Forecast Demand Scenarios .............................................................................................................. 88
9. Emerging Quantitative Conclusions ................................................................................................ 104
Appendices Appendix A Employment Sites Assessment Matrix
Appendix B Employment Sites Assessment Matrix Sites Ranked Best to Worst
Appendix C Employment Sites Assessment Proformas
Appendix D Geographical Locations of Employment Land
Appendix E Base Forecast Changes in Employment by Sector
Appendix F Abbreviations and Glossary of terms used
Appendix G References
Prepared By: Simon Phillips Status: Final Draft Date: July 2015 ------Portrait Report.Docx For and on behalf of GVA Grimley Ltd
Milton Keynes Council and Milton Keynes Development Partnership Final Report
November 2015 gva.co.uk 1
Executive Summary
1. This Phase 1 Technical Analysis Interim Report has drawn together the key findings from the
baseline stage of work for the Milton Keynes Economic Growth and Employment Land Study.
2. The key conclusions from the work to date are provided below.
Socio-economic Baseline
3. Milton Keynes (MK) is the fastest growing city in the UK with a notably young population, and
there is a high economic activity rate and skills levels. However, unemployment rates have
increased during the last decade as a result of the economic recession.
4. There is a cluster of sector strength in Financial Services, IT Consulting, Security Related
Services, Transport and related supply chain activities and Food and Beverage
manufacturing.
5. MK has a containment rate of approximately 60% of jobs for its employed population. The rest
of its workforce travels to the neighbouring boroughs of Central Bedfordshire, Bedford,
Aylesbury Vale and Central London.
Neighbours Policy Aspirations
6. Milton Keynes works closely with its neighbouring Local Authorities under the ‘Duty to Co-
operate’ banner.
7. The key issues of relevance to Milton Keynes neighbours are the balance between
employment/housing land, commuting patterns, economic growth sectors, cross boundary
infrastructure provision and demand forecasting.
Property Market Analysis
8. The Milton Keynes commercial property market is dominated by leasehold floorspace. Much
of this stock is no longer ‘fit for purpose’ nor does it meet the needs of the modern occupiers.
9. There is significantly less freehold accommodation currently on the market but where
opportunities exist there are more industrial than office properties available freehold.
10. Consequently, in recent years there have been a smaller number of freehold transactions
across both property market sectors. The average unit size sold in freehold transactions is
greater than in leasehold deals suggesting that there remains owner occupier demand for
larger size freehold accommodation.

Milton Keynes Council and Milton Keynes Development Partnership Final Report
November 2015 gva.co.uk 2
Employment Land Supply
11. Employment land is land used for offices, factories and warehouses and is categorised as
classes B1, B2 and B8 in the planning use classes order. There is a large supply of employment
land in Milton Keynes which consists of existing employment sites, proposed sites, and potential
sites, all of which have been subject to an assessment of both market features and physical
features.
12. The existing employment sites contain a broad mix of B class employment use with the majority
of sites providing a mix of office, industrial and warehouse/distribution uses.
13. As there appears to be limited expansion space in existing employment sites, it will be
necessary for the proposed and potential sites to be brought forward in order to provide the
supply to meet market demand.
Stakeholder Workshops
14. GVA has held two workshops with key stakeholders during this baseline stage with the first
focussing on the economic baseline evidence base, and the second focussing on the
employment land supply and property market.
15. GVA has also engaged with local agents active in the property market, a range of public and
private sector stakeholders and have given all Local Authorities that neighbour Milton Keynes
the opportunity to engage with the process.
Forecast Demand Scenarios
16. Given the relationship between the Milton Keynes economy and its neighbours it is important
that the evidence base for Plan:MK provides a robust understanding of economic potential
that is consistent with the neighbouring areas.
17. In this regard GVA has prepared two ‘base’ positions utilising both the East of England
Forecasting Model EEFM and Experian forecasts. Both suggest that the majority of floorspace
will be required within the warehouse and distribution sector.
Phase 2 Delivery Strategy
18. The outcomes of this Phase 1 technical analysis provide a robust evidence base to inform the
Phase 2 Delivery Strategy which will provide advice on the Employment Land Strategy for
Milton Keynes.
Milton Keynes Council and Milton Keynes Development Partnership Final Report
November 2015 gva.co.uk 3
1. Introduction
Milton Keynes Council (MKC), together with the Milton Keynes Development Partnership 1.1
(MKDP) appointed GVA to undertake an Economic Growth and Employment Land Study
(EGELS) for the Borough of Milton Keynes, one of the fastest growing and most dynamic local
authority areas in the UK. The study will form a key part of the Council’s evidence base for its
new Local Plan, Plan:MK.
Plan:MK will replace the current MKC Core Strategy adopted in July 2013, which seeks to 1.2
provide for a minimum of 28,000 dwellings and around 42,000 jobs over the period 2010-2026.
It will also replace the saved policies in the Milton Keynes Local Plan adopted in December
2005. The new comprehensive Local Plan will cover the period up to 2031.
The current Milton Keynes Employment Land Study (prepared by GVA in 2007) is now out of 1.3
date, as its production predates the economic recession. It now has no regard to the current
situation Milton Keynes finds itself in or current economic opportunities and threats. It also does
not address the revised national policy position as set out in the National Planning Policy
Framework (NPPF) which was published on the 27th March 2012 and sets out the National
Government’s planning policies for England and how these are expected to be applied.
Further, it does not address the National Planning Practice Guidance (NPPG) which was
published on the 6th March 2014 and adds detail and clarity to the NPPF. Ultimately, therefore,
the current Employment Land Study is not fit to support the development of Plan:MK.
This new EGELS has two primary purposes. Firstly, it will establish the likely level of jobs growth 1.4
resulting from the economic growth of Milton Keynes up to 2031. Secondly, it will assess the
implications for Milton Keynes Council in planning to accommodate the anticipated level of
economic growth.
More specifically, in order to achieve this purpose, the EGELS will: 1.5
Take stock of the existing situation;
Create a picture of future requirements;
Review the supply of employment land;
Compare the supply and demand; and
Identify key development options and recommendations.
Ultimately the new EGELS will identify a justified and reasoned strategy for Plan:MK to follow. 1.6

Milton Keynes Council and Milton Keynes Development Partnership Final Report
November 2015 gva.co.uk 4
Both the NPPF and NPPG contain guidance on the preparation of economic land availability 1.7
assessments. They indicate that the main purpose of these studies is to assess the existing and
future supply of land available for economic development and its suitability to meet identified
needs. Specifically, the NPPG requires that these studies should identify sites and broad
locations with potential for development; assess their development potential; and assess their
suitability for development and the likelihood of development coming forward. Taken
together, this Phase 1 report and the Phase 2 report which follows are consistent with this
approach.
This interim report has been prepared to provide the client group with an overview of GVA’s 1.8
work on Phase 1: ‘Technical Analysis’. It is anticipated that feedback from this report will help
inform the work on Phase 2: ‘Delivery Strategy’ and production of the final EGELS.
Report Structure
The remainder of this report is structured as follows: 1.9
Section 2: Socio-Economic Baseline;
Section 3: Neighbours Policy Aspirations;
Section 4: Property Market Analysis;
Section 5: The Functional Economic Area;
Section 6: Employment Land Supply;
Section 7: Stakeholder Engagement;
Section 8: Forecast Demand Scenarios; and
Section 9: Emerging Quantitative Conclusions
If you require any further information please contact the Project Director as below: 1.10
Simon Phillips - Director
T 0121 6098265

Milton Keynes Council and Milton Keynes Development Partnership Final Report
November 2015 gva.co.uk 5
2. Socio-Economic Baseline
Introduction
The Borough of Milton Keynes has a highly urbanised population, with only 16% of its 2.1
population living outside the city in the surrounding rural areas, which include the towns of
Newport Pagnell, Olney and Woburn Sands and smaller settlements such as Hanslope (Core
Strategy, 2013). The boundary of Milton Keynes and its relationship to the wider sub region is
illustrated in the following Figure 2.1 below.
Figure 2.1: Milton Keynes regional context
Milton Keynes lies within the South East Midlands Local Enterprise Partnership area. It borders 2.2
the Local Authorities of Bedford, Central Bedfordshire, Aylesbury Vale, South Northamptonshire
and Wellingborough. The principal settlement in the borough is the City of Milton Keynes itself,
which accounts for about 33% of its area and circa 85% of its population.
Wellingborough

Milton Keynes Council and Milton Keynes Development Partnership Final Report
November 2015 gva.co.uk 6
Economic Development Strategy
Milton Keynes Economic Development Strategy sets out six priorities for the period of 2011 to 2.3
2016. The priorities provide Milton Keynes with a framework for a Long Term Economic Vision.
These are:
Create an environment that will foster business and employment growth within a diverse
and competitive knowledge based economy.
Improve access to training and job opportunity for individuals to provide sustainable
employment and facilitate economic regeneration.
Improve overall skills and profile of resident population through education and training
provision.
Encourage business growth through focussed intervention and ensuring appropriate range
of commercial space for businesses.
Promote Milton Keynes as a premier location for inward investment and as a visitor
destination.
Create, maintain and improve the appropriate infrastructure for growth, especially in
relation to transport and digital infrastructure.
Population and Labour Market Profile
To understand the labour market characteristics we have analysed the most recent socio-2.4
economic data available from the Annual Population Survey. It provides the economic
context which shapes employment land demand and supply factors in the local authority
area within the context of wider regional and national economies. For this purpose the South
East Midlands Local Enterprise Partnership (SEMLEP)1 and South East Region2 have been used
as regional comparators; England has been used as a countrywide benchmark.
1 There are 11 boroughs that constitute the SEMLEP region. These are Aylesbury Vale, Bedford, Central Bedfordshire, Cherwell, Corby, Daventry, Kettering, Luton, Milton Keynes, Northampton, and South Northamptonshire.
2 Although the regional plans have been abolished, it is used as a benchmark because of the historic influence of the policies. South East Region includes 67 districts from 9 counties.
Milton Keynes Council and Milton Keynes Development Partnership Final Report
November 2015 gva.co.uk 7
Population
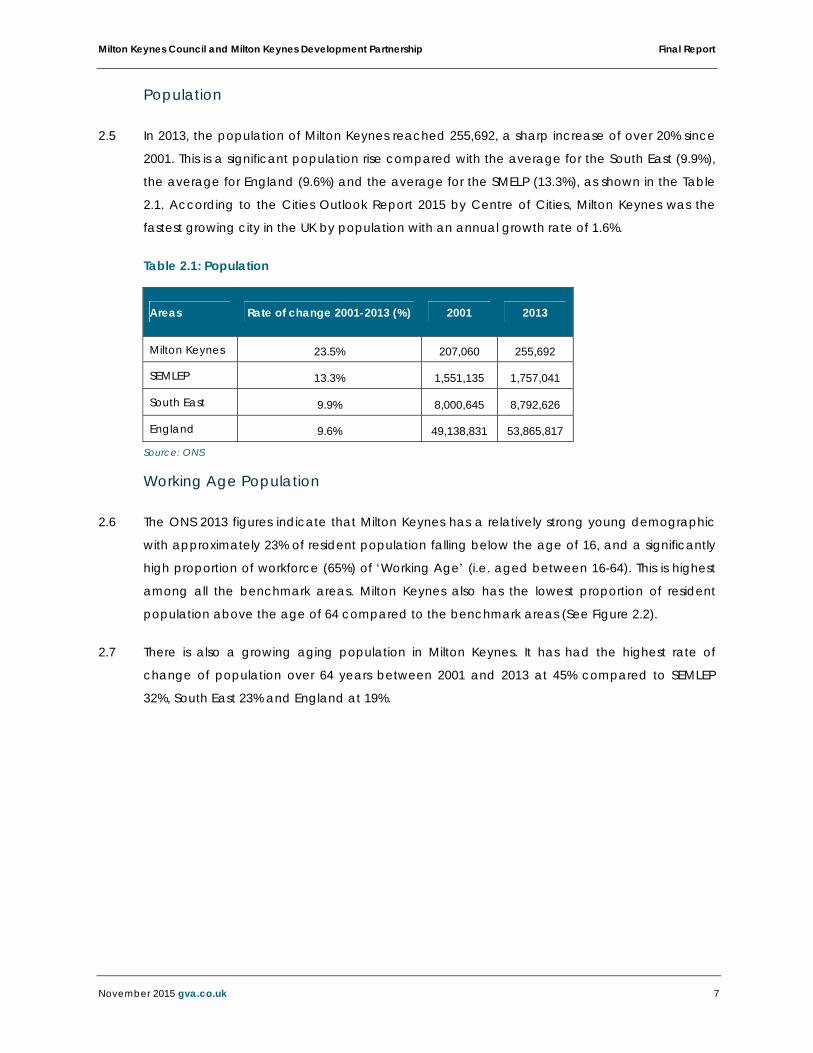
In 2013, the population of Milton Keynes reached 255,692, a sharp increase of over 20% since 2.5
2001. This is a significant population rise compared with the average for the South East (9.9%),
the average for England (9.6%) and the average for the SMELP (13.3%), as shown in the Table
2.1. According to the Cities Outlook Report 2015 by Centre of Cities, Milton Keynes was the
fastest growing city in the UK by population with an annual growth rate of 1.6%.
Table 2.1: Population
Areas Rate of change 2001-2013 (%) 2001 2013
Milton Keynes 23.5% 207,060 255,692
SEMLEP 13.3% 1,551,135 1,757,041
South East 9.9% 8,000,645 8,792,626
England 9.6% 49,138,831 53,865,817
Source: ONS
Working Age Population
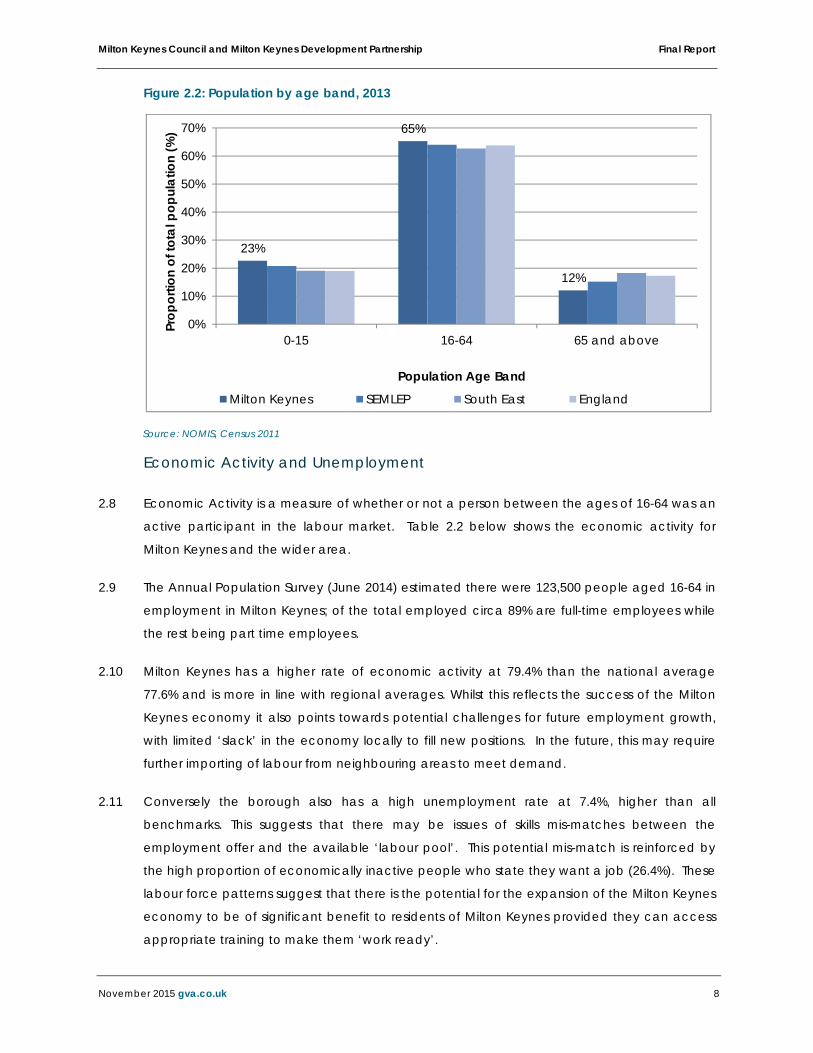
The ONS 2013 figures indicate that Milton Keynes has a relatively strong young demographic 2.6
with approximately 23% of resident population falling below the age of 16, and a significantly
high proportion of workforce (65%) of ‘Working Age’ (i.e. aged between 16-64). This is highest
among all the benchmark areas. Milton Keynes also has the lowest proportion of resident
population above the age of 64 compared to the benchmark areas (See Figure 2.2).
There is also a growing aging population in Milton Keynes. It has had the highest rate of 2.7
change of population over 64 years between 2001 and 2013 at 45% compared to SEMLEP
32%, South East 23% and England at 19%.
Milton Keynes Council and Milton Keynes Development Partnership Final Report
November 2015 gva.co.uk 8
Figure 2.2: Population by age band, 2013
Source: NOMIS, Census 2011
Economic Activity and Unemployment
Economic Activity is a measure of whether or not a person between the ages of 16-64 was an 2.8
active participant in the labour market. Table 2.2 below shows the economic activity for
Milton Keynes and the wider area.
The Annual Population Survey (June 2014) estimated there were 123,500 people aged 16-64 in 2.9
employment in Milton Keynes; of the total employed circa 89% are full-time employees while
the rest being part time employees.
Milton Keynes has a higher rate of economic activity at 79.4% than the national average 2.10
77.6% and is more in line with regional averages. Whilst this reflects the success of the Milton
Keynes economy it also points towards potential challenges for future employment growth,
with limited ‘slack’ in the economy locally to fill new positions. In the future, this may require
further importing of labour from neighbouring areas to meet demand.
Conversely the borough also has a high unemployment rate at 7.4%, higher than all 2.11
benchmarks. This suggests that there may be issues of skills mis-matches between the
employment offer and the available ‘labour pool’. This potential mis-match is reinforced by
the high proportion of economically inactive people who state they want a job (26.4%). These
labour force patterns suggest that there is the potential for the expansion of the Milton Keynes
economy to be of significant benefit to residents of Milton Keynes provided they can access
appropriate training to make them ‘work ready’.
23%
65%
12%
0%
10%
20%
30%
40%
50%
60%
70%
0-15 16-64 65 and above
Prop
ortio
n of
tota
l pop
ulat
ion
(%)
Population Age Band
Milton Keynes SEMLEP South East England
Milton Keynes Council and Milton Keynes Development Partnership Final Report
November 2015 gva.co.uk 9
Table 2.2: Economic Activity (2014)
Economic Activity Milton Keynes SEMLEP South East England
Economic activity rate - aged 16-64 (%) 79.4 80.3 79.9 77.6
In employment (%) 73.6 75.8 75.7 72.2
Unemployed (%) 7.4 5.6 5.2 6.9
Economic Inactivity- aged 16-64 (%%) 20.6 19.7 20.1 22.4
% of economically inactive who want a job 26.4 19.9 26.7 24.8
Source: NOMIS 2013
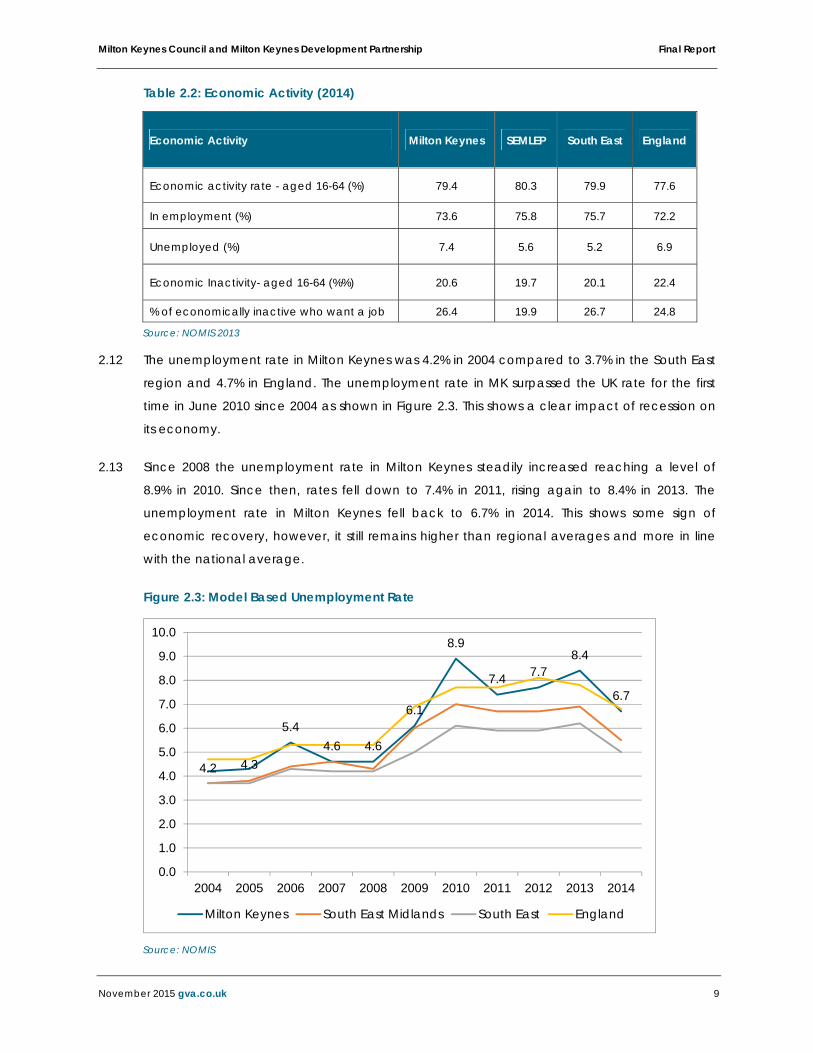
The unemployment rate in Milton Keynes was 4.2% in 2004 compared to 3.7% in the South East 2.12
region and 4.7% in England. The unemployment rate in MK surpassed the UK rate for the first
time in June 2010 since 2004 as shown in Figure 2.3. This shows a clear impact of recession on
its economy.
Since 2008 the unemployment rate in Milton Keynes steadily increased reaching a level of 2.13
8.9% in 2010. Since then, rates fell down to 7.4% in 2011, rising again to 8.4% in 2013. The
unemployment rate in Milton Keynes fell back to 6.7% in 2014. This shows some sign of
economic recovery, however, it still remains higher than regional averages and more in line
with the national average.
Figure 2.3: Model Based Unemployment Rate
Source: NOMIS
4.2 4.3
5.44.6 4.6
6.1
8.9
7.4 7.78.4
6.7
0.0
1.0
2.0
3.0
4.0
5.0
6.0
7.0
8.0
9.0
10.0
2004 2005 2006 2007 2008 2009 2010 2011 2012 2013 2014
Milton Keynes South East Midlands South East England
Milton Keynes Council and Milton Keynes Development Partnership Final Report
November 2015 gva.co.uk 10
Claimant Counts
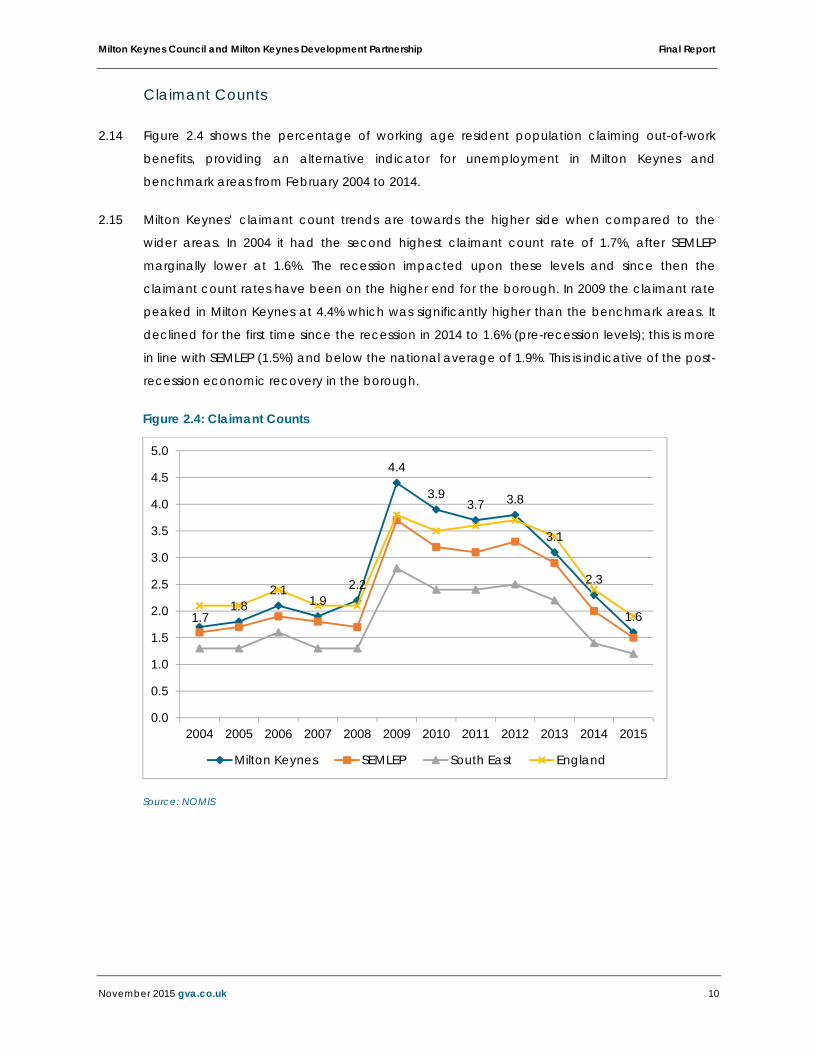
Figure 2.4 shows the percentage of working age resident population claiming out-of-work 2.14
benefits, providing an alternative indicator for unemployment in Milton Keynes and
benchmark areas from February 2004 to 2014.
Milton Keynes’ claimant count trends are towards the higher side when compared to the 2.15
wider areas. In 2004 it had the second highest claimant count rate of 1.7%, after SEMLEP
marginally lower at 1.6%. The recession impacted upon these levels and since then the
claimant count rates have been on the higher end for the borough. In 2009 the claimant rate
peaked in Milton Keynes at 4.4% which was significantly higher than the benchmark areas. It
declined for the first time since the recession in 2014 to 1.6% (pre-recession levels); this is more
in line with SEMLEP (1.5%) and below the national average of 1.9%. This is indicative of the post-
recession economic recovery in the borough.
Figure 2.4: Claimant Counts
Source: NOMIS
1.71.8
2.11.9
2.2
4.4
3.93.7 3.8
3.1
2.3
1.6
0.0
0.5
1.0
1.5
2.0
2.5
3.0
3.5
4.0
4.5
5.0
2004 2005 2006 2007 2008 2009 2010 2011 2012 2013 2014 2015
Milton Keynes SEMLEP South East England
Milton Keynes Council and Milton Keynes Development Partnership Final Report
November 2015 gva.co.uk 11
Qualifications Levels
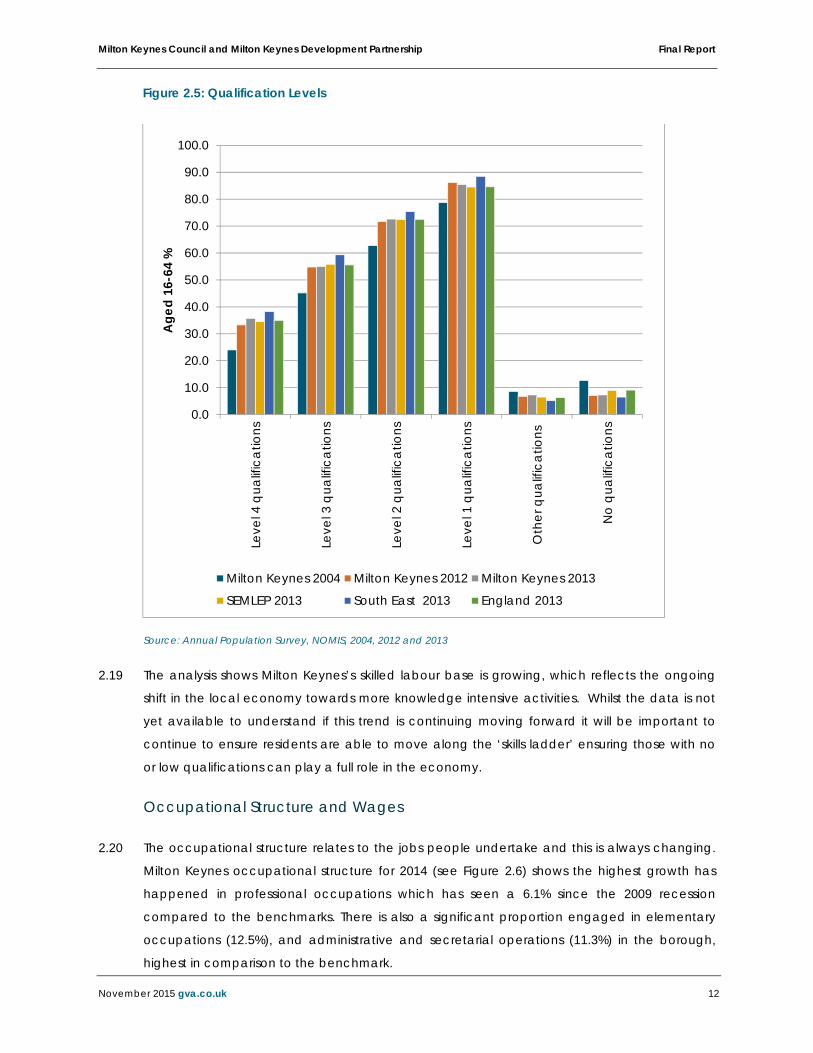
Skills and learning are central to economic growth and global competitiveness. Figure 2.5 2.16
shows the skill profile comparison of Milton Keynes between 2004 and 2013 and also the
comparison with qualifications of the benchmark areas in 2013. For detailed definitions of the
qualification levels please refer to the footnote 3 below.
There has been a significant improvement in the qualifications levels of Milton Keynes residents 2.17
and a notable reduction in the proportion of residents with no qualifications between 2004
and 2013. The proportion of residents in Milton Keynes without any qualifications fell from 12.7%
in 2001 to 7.3% in 2013. However, this is still higher than the South East regional average (6.5%)
and the national average (6.3%).
The share of the Milton Keynes population with higher level qualifications increased 2.18
significantly between 2004 and 2013, with 36% of the population holding a Level 4
Qualification. This suggests an additional 12% of the population had higher level qualifications
than in 2004, a percentage increase of some 48% from the 2004 level of 24%.
3 No Qualifications: No academic or professional qualifications Level 1 qualifications: 1-4 O Levels/CSE/GCSEs (any grades), Entry Level, Foundation Diploma, NVQ level 1, Foundation GNVQ, Basic/Essential Skills Level 2 qualifications: 5+ O Level (Passes)/CSEs (Grade 1)/GCSEs (Grades A*- C), School Certificate, 1 A Level/ 2-3 AS Levels/VCEs, Intermediate/Higher Diploma, Welsh Baccalaureate Intermediate Diploma, NVQ level 2, Intermediate GNVQ, City and Guilds Craft, BTEC First/General Diploma, RSA Diploma Level 3 qualifications: 2+ A Levels/VCEs, 4+ AS Levels, Higher School Certificate, Progression/Advanced Diploma, Welsh Baccalaureate Advanced Diploma, NVQ Level 3; Advanced GNVQ, City and Guilds Advanced Craft, ONC, OND, BTEC National, RSA Advanced Diploma Level 4+ qualifications: Degree (for example BA, BSc), Higher Degree (for example MA, PhD, PGCE), NVQ Level 4-5, HNC, HND, RSA Higher Diploma, BTEC Higher level, Foundation degree (NI), Professional qualifications (for example teaching, nursing, accountancy) Other qualifications: Vocational/Work-related Qualifications, Foreign Qualifications (Not stated/ level unknown).
Milton Keynes Council and Milton Keynes Development Partnership Final Report
November 2015 gva.co.uk 12
Figure 2.5: Qualification Levels
Source: Annual Population Survey, NOMIS, 2004, 2012 and 2013
The analysis shows Milton Keynes’s skilled labour base is growing, which reflects the ongoing 2.19
shift in the local economy towards more knowledge intensive activities. Whilst the data is not
yet available to understand if this trend is continuing moving forward it will be important to
continue to ensure residents are able to move along the ‘skills ladder’ ensuring those with no
or low qualifications can play a full role in the economy.
Occupational Structure and Wages
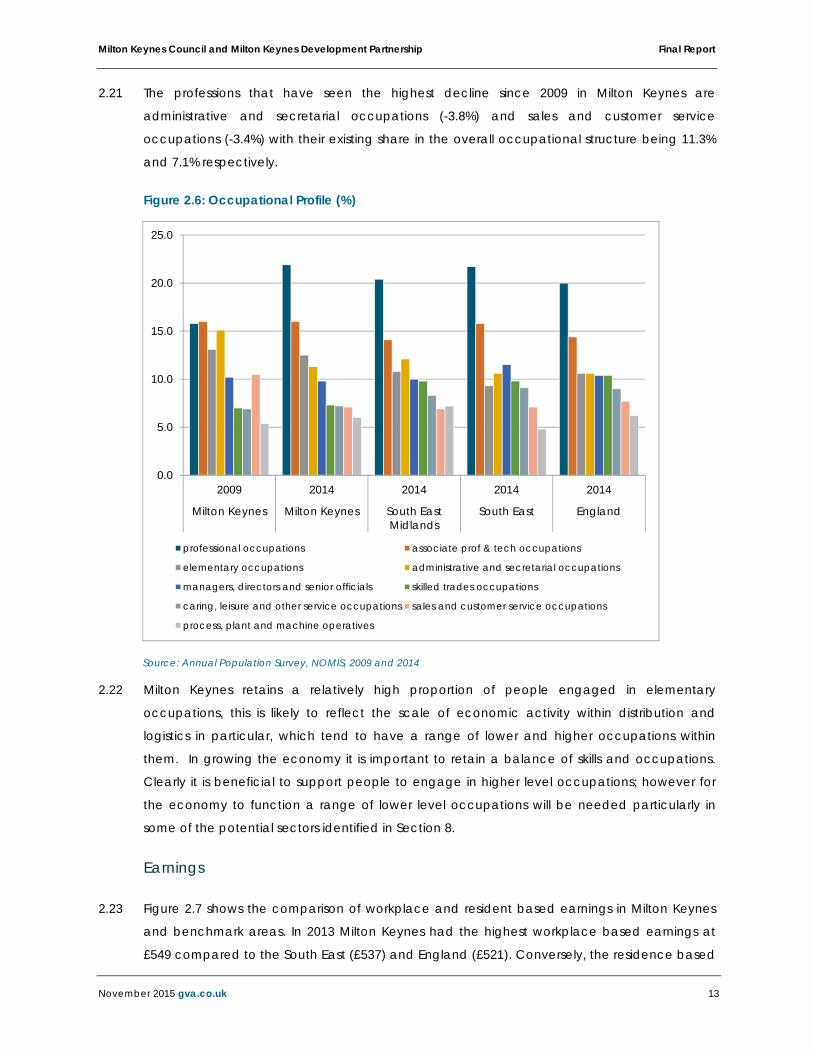
The occupational structure relates to the jobs people undertake and this is always changing. 2.20
Milton Keynes occupational structure for 2014 (see Figure 2.6) shows the highest growth has
happened in professional occupations which has seen a 6.1% since the 2009 recession
compared to the benchmarks. There is also a significant proportion engaged in elementary
occupations (12.5%), and administrative and secretarial operations (11.3%) in the borough,
highest in comparison to the benchmark.
0.0
10.0
20.0
30.0
40.0
50.0
60.0
70.0
80.0
90.0
100.0
Leve
l 4 q
ualif
icat
ions
Leve
l 3 q
ualif
icat
ions
Leve
l 2 q
ualif
icat
ions
Leve
l 1 q
ualif
icat
ions
Oth
er q
ualif
icat
ions
No
qual
ifica
tions
Age
d 16
-64
%
Milton Keynes 2004 Milton Keynes 2012 Milton Keynes 2013
SEMLEP 2013 South East 2013 England 2013
Milton Keynes Council and Milton Keynes Development Partnership Final Report
November 2015 gva.co.uk 13
The professions that have seen the highest decline since 2009 in Milton Keynes are 2.21
administrative and secretarial occupations (-3.8%) and sales and customer service
occupations (-3.4%) with their existing share in the overall occupational structure being 11.3%
and 7.1% respectively.
Figure 2.6: Occupational Profile (%)
Source: Annual Population Survey, NOMIS, 2009 and 2014
Milton Keynes retains a relatively high proportion of people engaged in elementary 2.22
occupations, this is likely to reflect the scale of economic activity within distribution and
logistics in particular, which tend to have a range of lower and higher occupations within
them. In growing the economy it is important to retain a balance of skills and occupations.
Clearly it is beneficial to support people to engage in higher level occupations; however for
the economy to function a range of lower level occupations will be needed particularly in
some of the potential sectors identified in Section 8.
Earnings
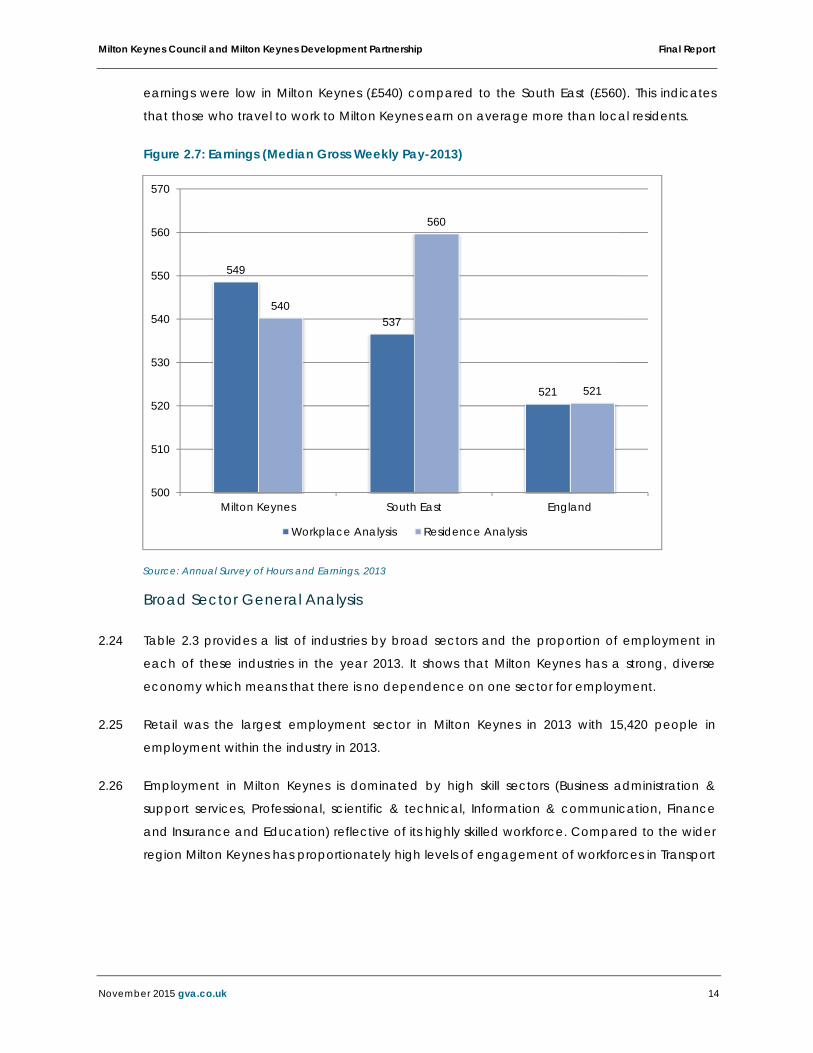
Figure 2.7 shows the comparison of workplace and resident based earnings in Milton Keynes 2.23
and benchmark areas. In 2013 Milton Keynes had the highest workplace based earnings at
£549 compared to the South East (£537) and England (£521). Conversely, the residence based
0.0
5.0
10.0
15.0
20.0
25.0
2009 2014 2014 2014 2014
Milton Keynes Milton Keynes South EastMidlands
South East England
professional occupations associate prof & tech occupations
elementary occupations administrative and secretarial occupations
managers, directors and senior officials skilled trades occupations
caring, leisure and other service occupations sales and customer service occupations
process, plant and machine operatives
Milton Keynes Council and Milton Keynes Development Partnership Final Report
November 2015 gva.co.uk 14
earnings were low in Milton Keynes (£540) compared to the South East (£560). This indicates
that those who travel to work to Milton Keynes earn on average more than local residents.
Figure 2.7: Earnings (Median Gross Weekly Pay-2013)
Source: Annual Survey of Hours and Earnings, 2013
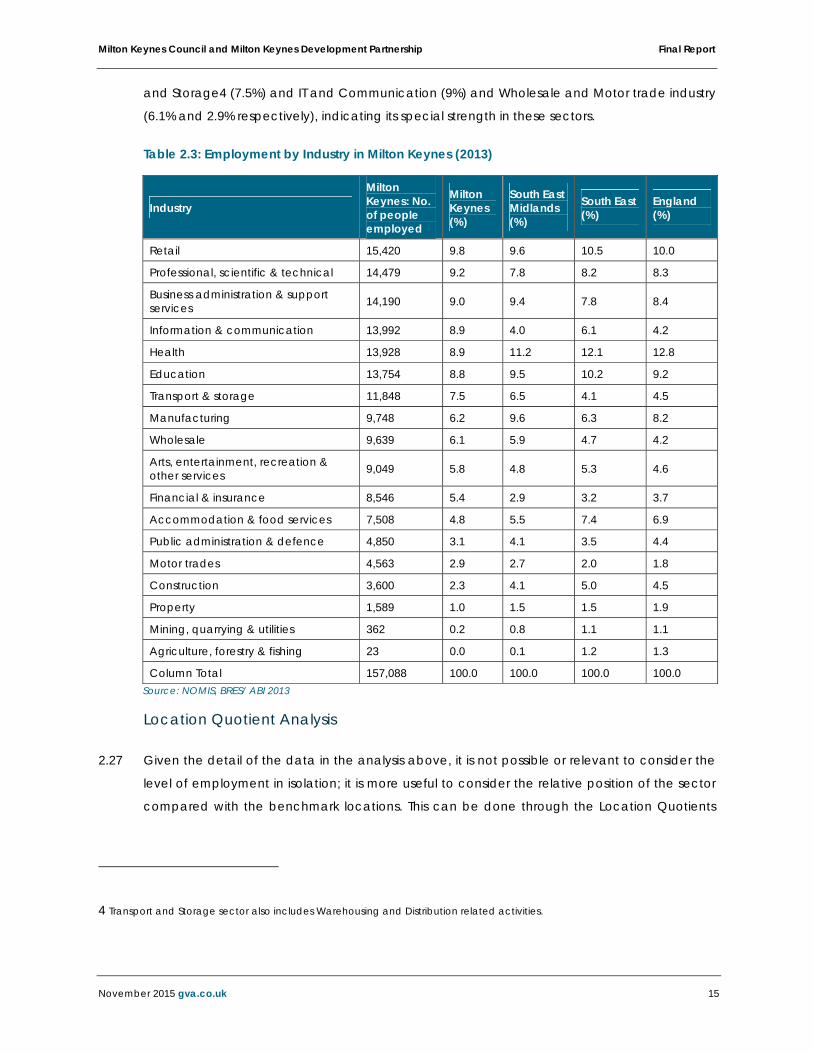
Broad Sector General Analysis
Table 2.3 provides a list of industries by broad sectors and the proportion of employment in 2.24
each of these industries in the year 2013. It shows that Milton Keynes has a strong, diverse
economy which means that there is no dependence on one sector for employment.
Retail was the largest employment sector in Milton Keynes in 2013 with 15,420 people in 2.25
employment within the industry in 2013.
Employment in Milton Keynes is dominated by high skill sectors (Business administration & 2.26
support services, Professional, scientific & technical, Information & communication, Finance
and Insurance and Education) reflective of its highly skilled workforce. Compared to the wider
region Milton Keynes has proportionately high levels of engagement of workforces in Transport
549
537
521
540
560
521
500
510
520
530
540
550
560
570
Milton Keynes South East England
Workplace Analysis Residence Analysis
Milton Keynes Council and Milton Keynes Development Partnership Final Report
November 2015 gva.co.uk 15
and Storage4 (7.5%) and IT and Communication (9%) and Wholesale and Motor trade industry
(6.1% and 2.9% respectively), indicating its special strength in these sectors.
Table 2.3: Employment by Industry in Milton Keynes (2013)
Industry
Milton Keynes: No. of people employed
Milton Keynes (%)
South East Midlands (%)
South East (%)
England (%)
Retail 15,420 9.8 9.6 10.5 10.0
Professional, scientific & technical 14,479 9.2 7.8 8.2 8.3
Business administration & support services 14,190 9.0 9.4 7.8 8.4
Information & communication 13,992 8.9 4.0 6.1 4.2
Health 13,928 8.9 11.2 12.1 12.8
Education 13,754 8.8 9.5 10.2 9.2
Transport & storage 11,848 7.5 6.5 4.1 4.5
Manufacturing 9,748 6.2 9.6 6.3 8.2
Wholesale 9,639 6.1 5.9 4.7 4.2
Arts, entertainment, recreation & other services 9,049 5.8 4.8 5.3 4.6
Financial & insurance 8,546 5.4 2.9 3.2 3.7
Accommodation & food services 7,508 4.8 5.5 7.4 6.9
Public administration & defence 4,850 3.1 4.1 3.5 4.4
Motor trades 4,563 2.9 2.7 2.0 1.8
Construction 3,600 2.3 4.1 5.0 4.5
Property 1,589 1.0 1.5 1.5 1.9
Mining, quarrying & utilities 362 0.2 0.8 1.1 1.1
Agriculture, forestry & fishing 23 0.0 0.1 1.2 1.3
Column Total 157,088 100.0 100.0 100.0 100.0 Source: NOMIS, BRES/ ABI 2013
Location Quotient Analysis
Given the detail of the data in the analysis above, it is not possible or relevant to consider the 2.27
level of employment in isolation; it is more useful to consider the relative position of the sector
compared with the benchmark locations. This can be done through the Location Quotients
4 Transport and Storage sector also includes Warehousing and Distribution related activities.
Milton Keynes Council and Milton Keynes Development Partnership Final Report
November 2015 gva.co.uk 16
(LQs) analysis, these measure the concentration (or specialism) in a particular area against a
comparator.
LQs provide a simple yet powerful tool to compare places and employment activity. A LQ of 1 2.28
shows that employment in a sector is proportionately the same as the benchmark geography
(i.e. there is no specialisms), a LQ greater than 1 shows the sector is proportionately more
strongly represented in Milton Keynes (i.e. there is a specialisation), and a LQ less than 1 shows
a sector is under represented.
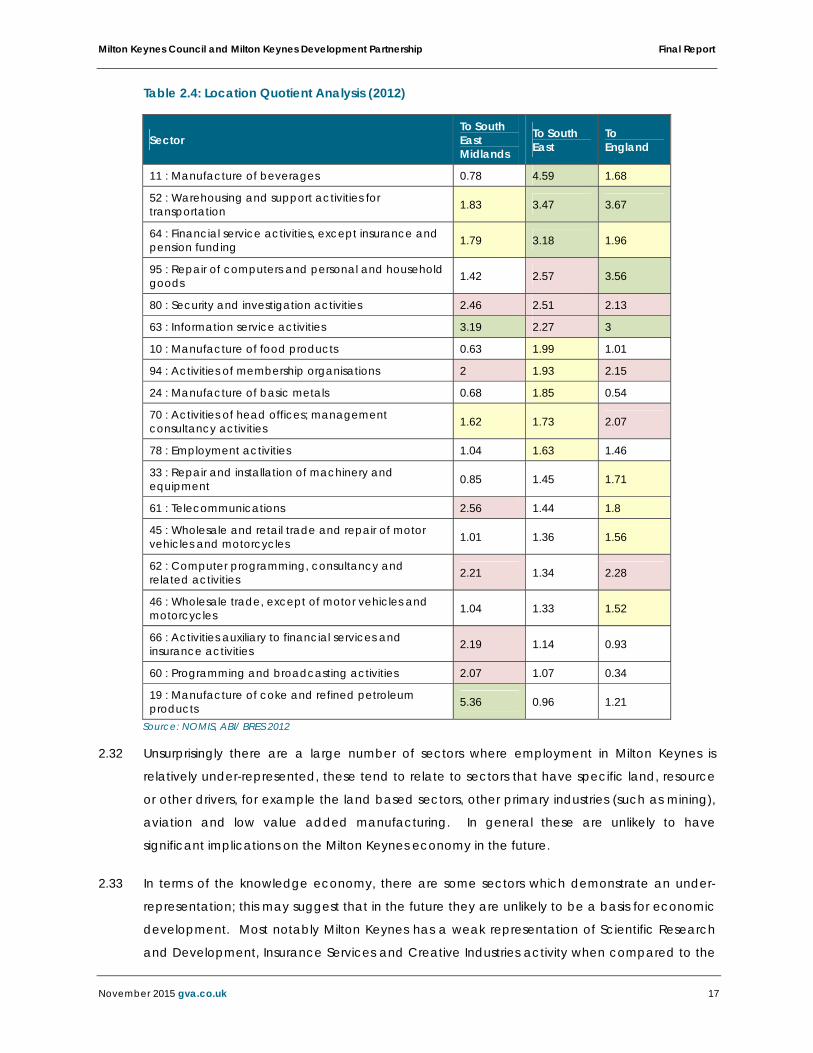
Table 2.4 compares the sectors within Milton Keynes that has comparative strength against 2.29
wider benchmarks. Green shading highlights a very strong concentration (i.e. a LQ above 3),
pink a strong concentration (i.e. a LQ between 2 and 3) and yellow a reasonably strong
specialisation (i.e. between 1.5 and 2). It should be noted that this is not an exhaustive list of
all sectors present within Milton Keynes, but focuses solely on those that have a LQ of above
1.5 against any of the benchmark areas, therefore demonstrating a particularly strong level of
concentration.
Unsurprisingly, there is a cluster of sector strength in Financial Service activity, IT, Consulting 2.30
and Security Related Services.
The analysis also shows a concentration of transport and related supply chain activities as well 2.31
as some manufacturing sectors such as food and beverages. The LQs also show a
specialisation in manufacturing and transport related activities in the borough.
Milton Keynes Council and Milton Keynes Development Partnership Final Report
November 2015 gva.co.uk 17
Table 2.4: Location Quotient Analysis (2012)
Source: NOMIS, ABI/ BRES 2012
Unsurprisingly there are a large number of sectors where employment in Milton Keynes is 2.32
relatively under-represented, these tend to relate to sectors that have specific land, resource
or other drivers, for example the land based sectors, other primary industries (such as mining),
aviation and low value added manufacturing. In general these are unlikely to have
significant implications on the Milton Keynes economy in the future.
In terms of the knowledge economy, there are some sectors which demonstrate an under-2.33
representation; this may suggest that in the future they are unlikely to be a basis for economic
development. Most notably Milton Keynes has a weak representation of Scientific Research
and Development, Insurance Services and Creative Industries activity when compared to the
Sector To South East Midlands
To South East
To England
11 : Manufacture of beverages 0.78 4.59 1.68
52 : Warehousing and support activities for transportation 1.83 3.47 3.67
64 : Financial service activities, except insurance and pension funding 1.79 3.18 1.96
95 : Repair of computers and personal and household goods 1.42 2.57 3.56
80 : Security and investigation activities 2.46 2.51 2.13
63 : Information service activities 3.19 2.27 3
10 : Manufacture of food products 0.63 1.99 1.01
94 : Activities of membership organisations 2 1.93 2.15
24 : Manufacture of basic metals 0.68 1.85 0.54
70 : Activities of head offices; management consultancy activities 1.62 1.73 2.07
78 : Employment activities 1.04 1.63 1.46
33 : Repair and installation of machinery and equipment 0.85 1.45 1.71
61 : Telecommunications 2.56 1.44 1.8
45 : Wholesale and retail trade and repair of motor vehicles and motorcycles 1.01 1.36 1.56
62 : Computer programming, consultancy and related activities 2.21 1.34 2.28
46 : Wholesale trade, except of motor vehicles and motorcycles 1.04 1.33 1.52
66 : Activities auxiliary to financial services and insurance activities 2.19 1.14 0.93
60 : Programming and broadcasting activities 2.07 1.07 0.34
19 : Manufacture of coke and refined petroleum products 5.36 0.96 1.21
Milton Keynes Council and Milton Keynes Development Partnership Final Report
November 2015 gva.co.uk 18
benchmark locations. Scientific activities are particularly weak which in part, is likely to reflect
the lack of research and science orientated higher education activity within Milton Keynes.
Moreover data may not capture the research activity that is occurring given it tends to be
linked to wider business activities. For example, significant research is undertaken by Network
Rail however as it is not a standalone activity it is likely the whole ‘business’ is captured under a
different SIC Code.
Whilst the Open University (OU) Campus is based in the city at Walton Hall and University 2.34
Campus Milton Keynes (UCMK), part of the University of Bedfordshire, is based in the city
centre these do not offer a significant research component that tends to support a wider
network of research orientated businesses..
Knowledge Economy
A knowledge based economy is one in which the production, distribution, and use of 2.35
knowledge is the main driver of growth, wealth creation and employment across all industries
(Local Economic Assessment, 2013). An OECD 2005 report identifies ‘knowledge-based’ or
intangible assets such as R&D, design, software, human and organisational capital, brand
equity and less by investment in physical assets such as machines, buildings and vehicles
The Centre for Cities Outlook 2015 noted that there is a strong presence/cluster of knowledge 2.36
intensive activity in Milton Keynes, contributing to 22% of total employment share in the City
and ranking it sixth out of the 64 cities reviewed in the UK. Whilst this performance remains
positive it does represent a slight decrease in the relative position since the 2012 Outlook,
where Milton Keynes was ranked 5th overall.
The 2011 Local Economic Assessment also estimated the presence of some 4,701 knowledge 2.37
based business units representing 45% of the total units in Milton Keynes in 2007. In employment
terms 49,200 employees (35.4% of all employees) in Milton Keynes in 2007 were working in
knowledge based business unit (LEA, 2013).
Travel to Work Area
Travel to work areas can help identify where the bulk of the resident population works. We 2.38
have analysed the commuting patterns of the residents and workers in Milton Keynes through
Office of National Statistics (ONS) data.
Milton Keynes has more jobs than working residents making it an importer of workers. This 2.39
results in a net inward commuting trend in the borough. The supply side containment rate of
Milton Keynes is 63% (2011, ONS).
Milton Keynes Council and Milton Keynes Development Partnership Final Report
November 2015 gva.co.uk 19
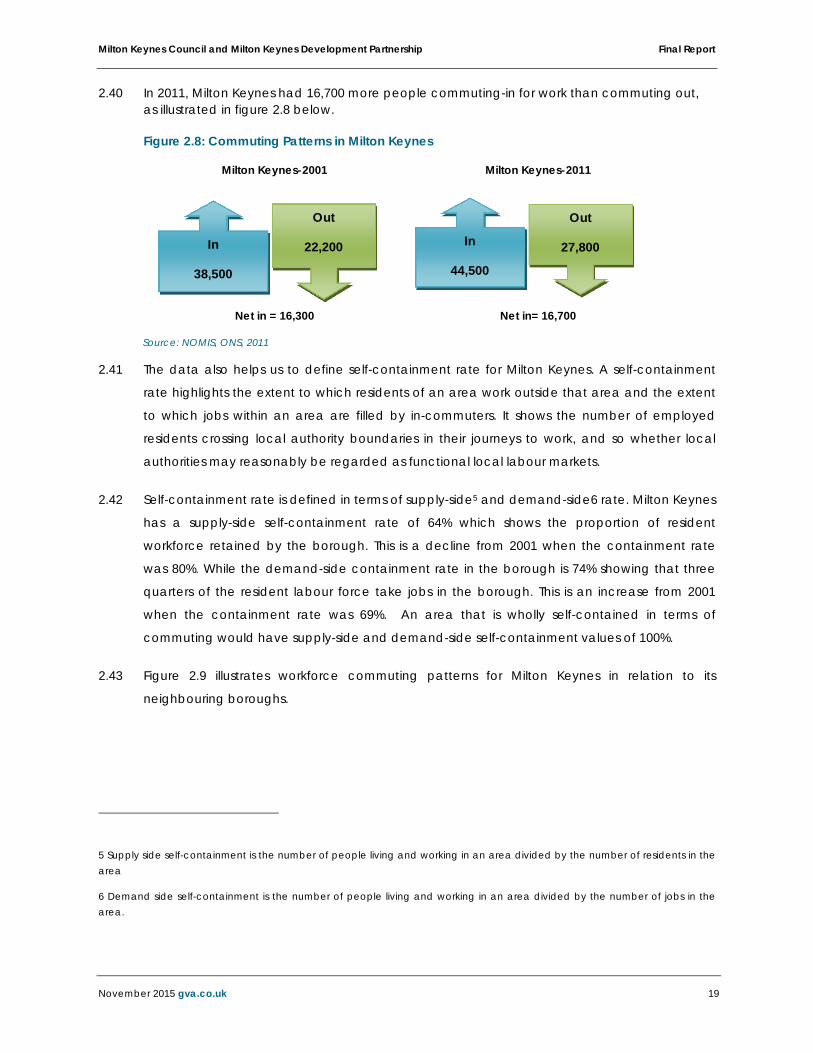
In 2011, Milton Keynes had 16,700 more people commuting-in for work than commuting out, 2.40as illustrated in figure 2.8 below.
Figure 2.8: Commuting Patterns in Milton Keynes
Milton Keynes-2001 Milton Keynes-2011
Net in = 16,300 Net in= 16,700
Source: NOMIS, ONS, 2011
The data also helps us to define self-containment rate for Milton Keynes. A self-containment 2.41
rate highlights the extent to which residents of an area work outside that area and the extent
to which jobs within an area are filled by in-commuters. It shows the number of employed
residents crossing local authority boundaries in their journeys to work, and so whether local
authorities may reasonably be regarded as functional local labour markets.
Self-containment rate is defined in terms of supply-side5 and demand-side6 rate. Milton Keynes 2.42
has a supply-side self-containment rate of 64% which shows the proportion of resident
workforce retained by the borough. This is a decline from 2001 when the containment rate
was 80%. While the demand-side containment rate in the borough is 74% showing that three
quarters of the resident labour force take jobs in the borough. This is an increase from 2001
when the containment rate was 69%. An area that is wholly self-contained in terms of
commuting would have supply-side and demand-side self-containment values of 100%.
Figure 2.9 illustrates workforce commuting patterns for Milton Keynes in relation to its 2.43
neighbouring boroughs.
5 Supply side self-containment is the number of people living and working in an area divided by the number of residents in the area
6 Demand side self-containment is the number of people living and working in an area divided by the number of jobs in the area.
In
44,500
Out
27,800 In
38,500
Out
22,200
Milton Keynes Council and Milton Keynes Development Partnership Final Report
November 2015 gva.co.uk 20
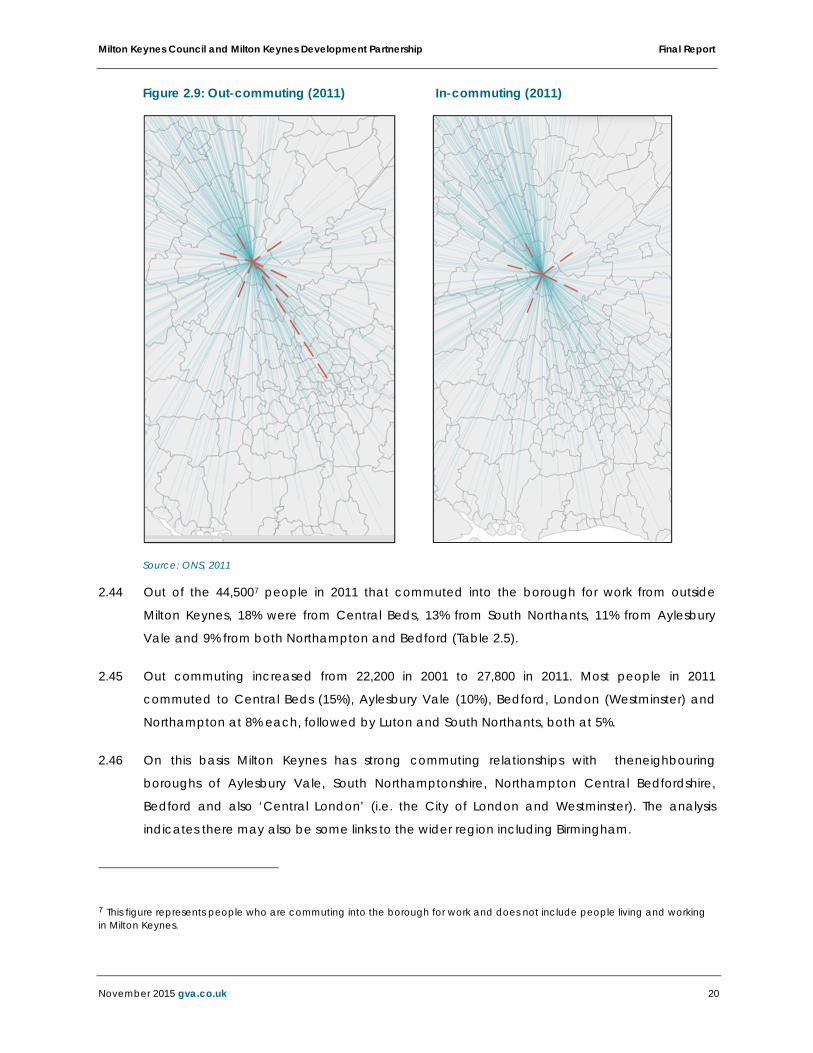
Figure 2.9: Out-commuting (2011)
In-commuting (2011)
Source: ONS, 2011
Out of the 44,5007 people in 2011 that commuted into the borough for work from outside 2.44
Milton Keynes, 18% were from Central Beds, 13% from South Northants, 11% from Aylesbury
Vale and 9% from both Northampton and Bedford (Table 2.5).
Out commuting increased from 22,200 in 2001 to 27,800 in 2011. Most people in 2011 2.45
commuted to Central Beds (15%), Aylesbury Vale (10%), Bedford, London (Westminster) and
Northampton at 8% each, followed by Luton and South Northants, both at 5%.
On this basis Milton Keynes has strong commuting relationships with theneighbouring 2.46
boroughs of Aylesbury Vale, South Northamptonshire, Northampton Central Bedfordshire,
Bedford and also ‘Central London’ (i.e. the City of London and Westminster). The analysis
indicates there may also be some links to the wider region including Birmingham.
7 This figure represents people who are commuting into the borough for work and does not include people living and working in Milton Keynes.
Milton Keynes Council and Milton Keynes Development Partnership Final Report
November 2015 gva.co.uk 21
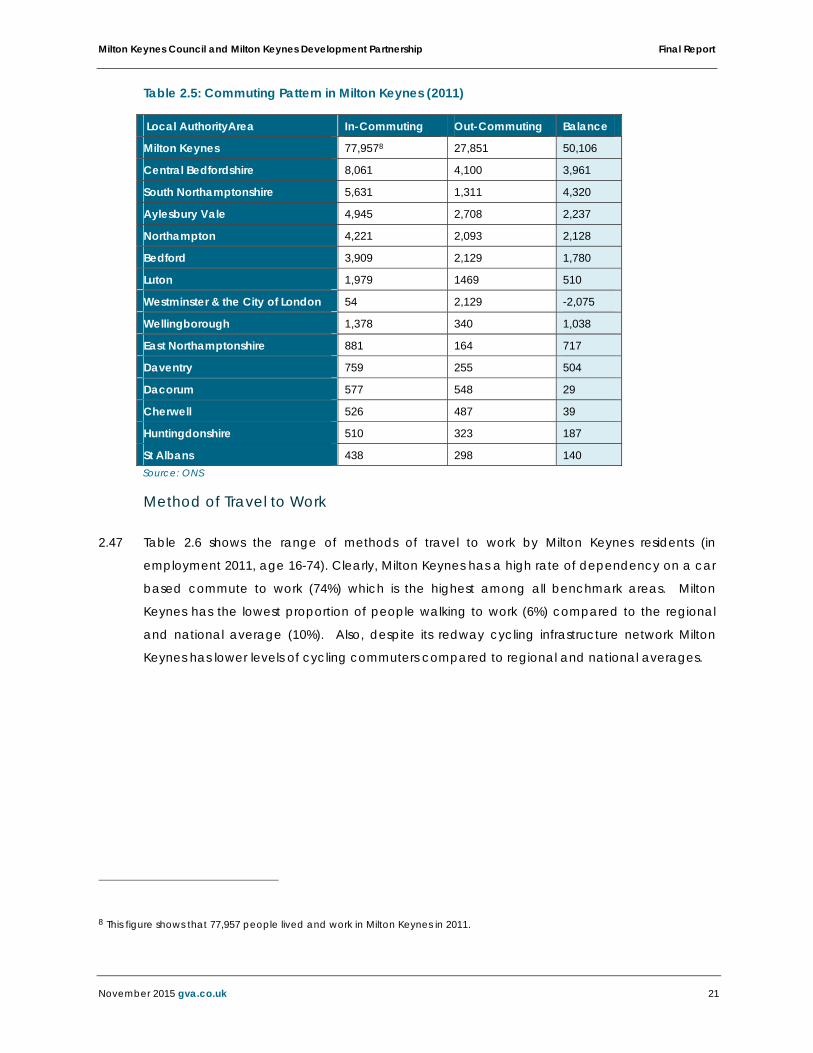
Table 2.5: Commuting Pattern in Milton Keynes (2011)
Local AuthorityArea In-Commuting Out-Commuting Balance
Milton Keynes 77,9578 27,851 50,106
Central Bedfordshire 8,061 4,100 3,961
South Northamptonshire 5,631 1,311 4,320
Aylesbury Vale 4,945 2,708 2,237
Northampton 4,221 2,093 2,128
Bedford 3,909 2,129 1,780
Luton 1,979 1469 510
Westminster & the City of London 54 2,129 -2,075
Wellingborough 1,378 340 1,038
East Northamptonshire 881 164 717
Daventry 759 255 504
Dacorum 577 548 29
Cherwell 526 487 39
Huntingdonshire 510 323 187
St Albans 438 298 140 Source: ONS
Method of Travel to Work
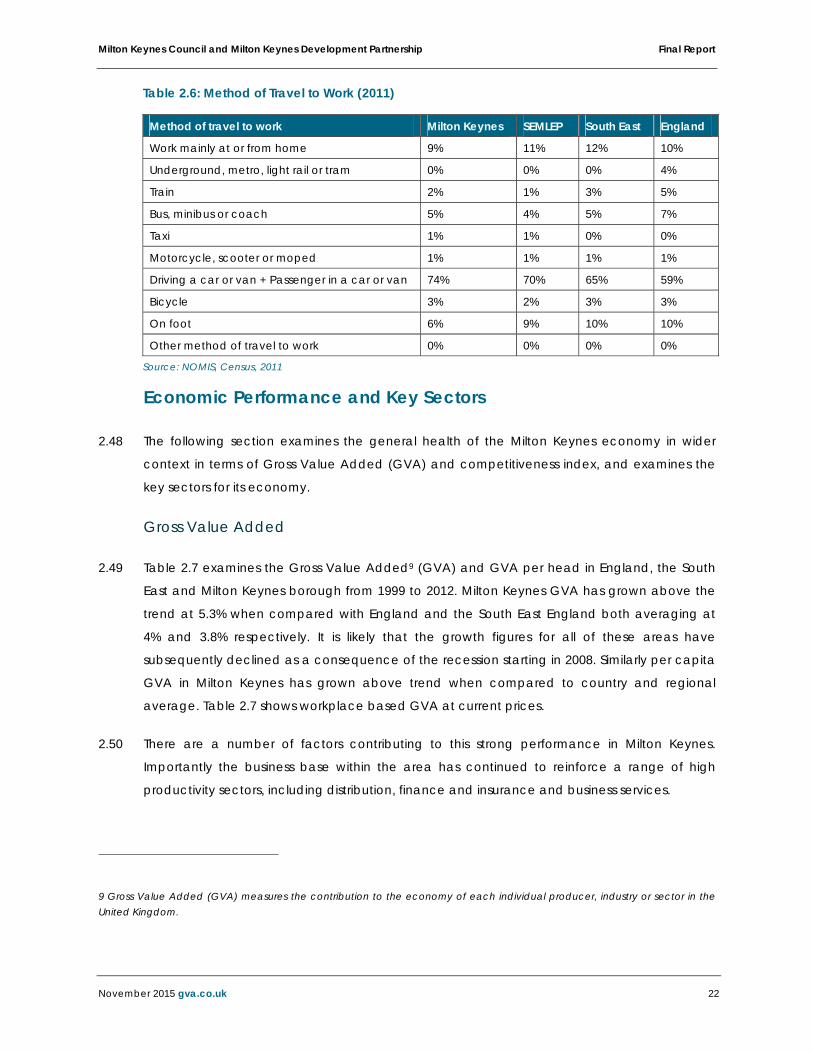
Table 2.6 shows the range of methods of travel to work by Milton Keynes residents (in 2.47
employment 2011, age 16-74). Clearly, Milton Keynes has a high rate of dependency on a car
based commute to work (74%) which is the highest among all benchmark areas. Milton
Keynes has the lowest proportion of people walking to work (6%) compared to the regional
and national average (10%). Also, despite its redway cycling infrastructure network Milton
Keynes has lower levels of cycling commuters compared to regional and national averages.
8 This figure shows that 77,957 people lived and work in Milton Keynes in 2011.
Milton Keynes Council and Milton Keynes Development Partnership Final Report
November 2015 gva.co.uk 22
Table 2.6: Method of Travel to Work (2011)
Method of travel to work Milton Keynes SEMLEP South East England
Work mainly at or from home 9% 11% 12% 10%
Underground, metro, light rail or tram 0% 0% 0% 4%
Train 2% 1% 3% 5%
Bus, minibus or coach 5% 4% 5% 7%
Taxi 1% 1% 0% 0%
Motorcycle, scooter or moped 1% 1% 1% 1%
Driving a car or van + Passenger in a car or van 74% 70% 65% 59%
Bicycle 3% 2% 3% 3%
On foot 6% 9% 10% 10%
Other method of travel to work 0% 0% 0% 0%
Source: NOMIS, Census, 2011
Economic Performance and Key Sectors
The following section examines the general health of the Milton Keynes economy in wider 2.48
context in terms of Gross Value Added (GVA) and competitiveness index, and examines the
key sectors for its economy.
Gross Value Added
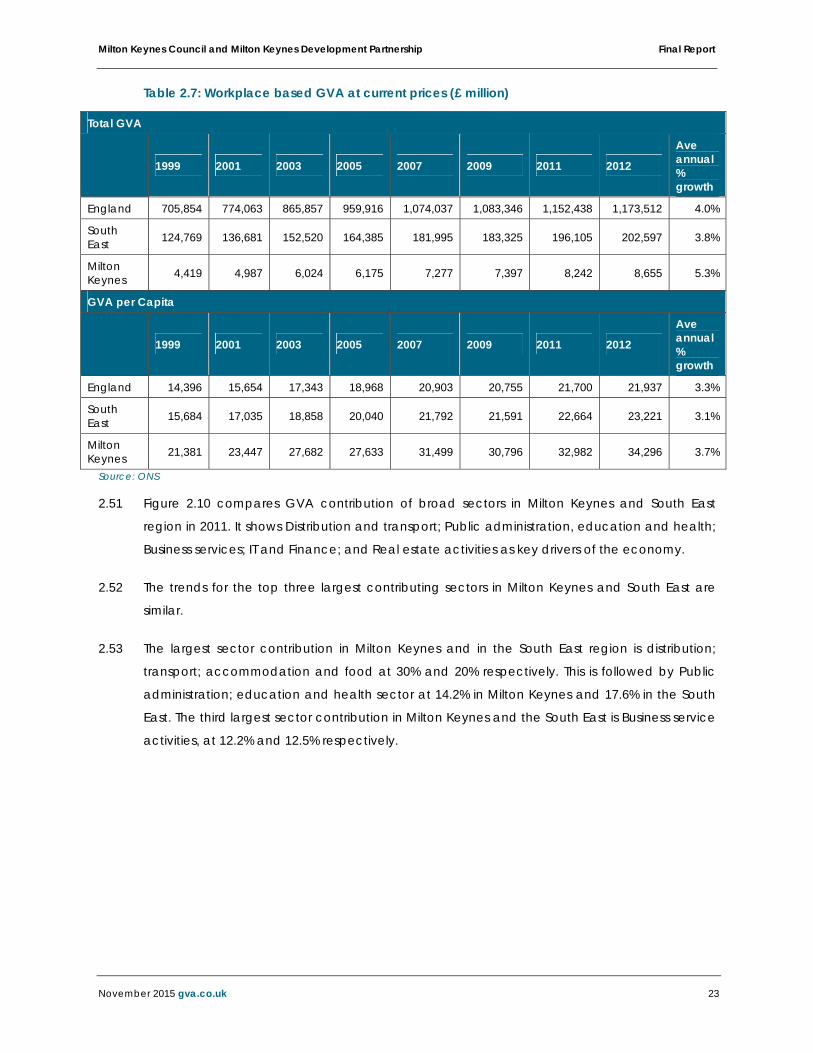
Table 2.7 examines the Gross Value Added9 (GVA) and GVA per head in England, the South 2.49
East and Milton Keynes borough from 1999 to 2012. Milton Keynes GVA has grown above the
trend at 5.3% when compared with England and the South East England both averaging at
4% and 3.8% respectively. It is likely that the growth figures for all of these areas have
subsequently declined as a consequence of the recession starting in 2008. Similarly per capita
GVA in Milton Keynes has grown above trend when compared to country and regional
average. Table 2.7 shows workplace based GVA at current prices.
There are a number of factors contributing to this strong performance in Milton Keynes. 2.50
Importantly the business base within the area has continued to reinforce a range of high
productivity sectors, including distribution, finance and insurance and business services.
9 Gross Value Added (GVA) measures the contribution to the economy of each individual producer, industry or sector in the United Kingdom.
Milton Keynes Council and Milton Keynes Development Partnership Final Report
November 2015 gva.co.uk 23
Table 2.7: Workplace based GVA at current prices (£ million)
Total GVA
1999 2001 2003 2005 2007 2009 2011 2012
Ave annual % growth
England 705,854 774,063 865,857 959,916 1,074,037 1,083,346 1,152,438 1,173,512 4.0%
South East 124,769 136,681 152,520 164,385 181,995 183,325 196,105 202,597 3.8%
Milton Keynes 4,419 4,987 6,024 6,175 7,277 7,397 8,242 8,655 5.3%
GVA per Capita
1999 2001 2003 2005 2007 2009 2011 2012
Ave annual % growth
England 14,396 15,654 17,343 18,968 20,903 20,755 21,700 21,937 3.3%
South East 15,684 17,035 18,858 20,040 21,792 21,591 22,664 23,221 3.1%
Milton Keynes 21,381 23,447 27,682 27,633 31,499 30,796 32,982 34,296 3.7%
Source: ONS
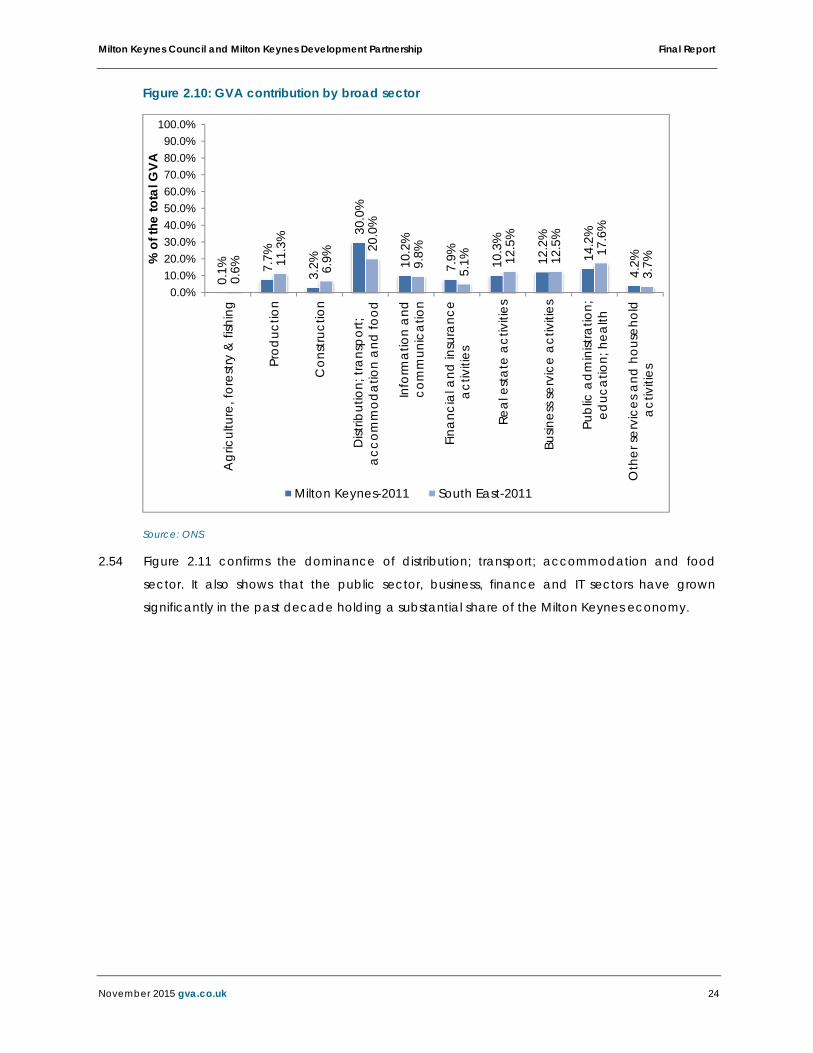
Figure 2.10 compares GVA contribution of broad sectors in Milton Keynes and South East 2.51
region in 2011. It shows Distribution and transport; Public administration, education and health;
Business services; IT and Finance; and Real estate activities as key drivers of the economy.
The trends for the top three largest contributing sectors in Milton Keynes and South East are 2.52
similar.
The largest sector contribution in Milton Keynes and in the South East region is distribution; 2.53
transport; accommodation and food at 30% and 20% respectively. This is followed by Public
administration; education and health sector at 14.2% in Milton Keynes and 17.6% in the South
East. The third largest sector contribution in Milton Keynes and the South East is Business service
activities, at 12.2% and 12.5% respectively.
Milton Keynes Council and Milton Keynes Development Partnership Final Report
November 2015 gva.co.uk 24
Figure 2.10: GVA contribution by broad sector
Source: ONS
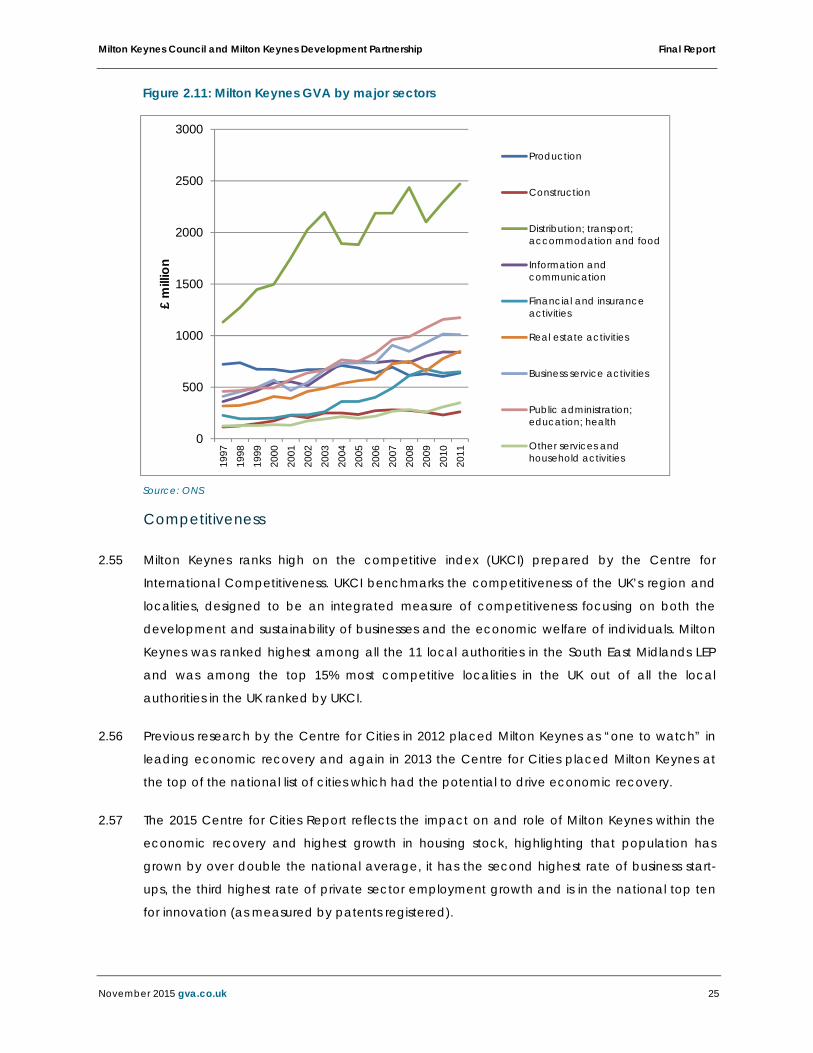
Figure 2.11 confirms the dominance of distribution; transport; accommodation and food 2.54
sector. It also shows that the public sector, business, finance and IT sectors have grown
significantly in the past decade holding a substantial share of the Milton Keynes economy.
0.1% 7.
7%
3.2%
30.0
%
10.2
%
7.9% 10
.3%
12.2
%
14.2
%
4.2%
0.6% 11
.3%
6.9%
20.0
%
9.8%
5.1% 12
.5%
12.5
%
17.6
%
3.7%
0.0%10.0%20.0%30.0%40.0%50.0%60.0%70.0%80.0%90.0%
100.0%
Agr
icul
ture
, for
estry
& fi
shin
g
Prod
uctio
n
Con
stru
ctio
n
Dist
ribut
ion;
tran
spor
t;a
ccom
mod
atio
n an
d fo
od
Info
rmat
ion
and
com
mun
ica
tion
Fina
ncia
l and
insu
ranc
eac
tiviti
es
Real
est
ate
activ
ities
Busin
ess s
ervi
ce a
ctiv
ities
Pub
lic a
dm
inist
ratio
n;ed
ucat
ion;
hea
lth
Oth
er se
rvic
es a
nd h
ouse
hold
act
iviti
es
% o
f the
tota
l GVA
Milton Keynes-2011 South East-2011
Milton Keynes Council and Milton Keynes Development Partnership Final Report
November 2015 gva.co.uk 25
Figure 2.11: Milton Keynes GVA by major sectors
Source: ONS
Competitiveness
Milton Keynes ranks high on the competitive index (UKCI) prepared by the Centre for 2.55
International Competitiveness. UKCI benchmarks the competitiveness of the UK’s region and
localities, designed to be an integrated measure of competitiveness focusing on both the
development and sustainability of businesses and the economic welfare of individuals. Milton
Keynes was ranked highest among all the 11 local authorities in the South East Midlands LEP
and was among the top 15% most competitive localities in the UK out of all the local
authorities in the UK ranked by UKCI.
Previous research by the Centre for Cities in 2012 placed Milton Keynes as “one to watch” in 2.56
leading economic recovery and again in 2013 the Centre for Cities placed Milton Keynes at
the top of the national list of cities which had the potential to drive economic recovery.
The 2015 Centre for Cities Report reflects the impact on and role of Milton Keynes within the 2.57
economic recovery and highest growth in housing stock, highlighting that population has
grown by over double the national average, it has the second highest rate of business start-
ups, the third highest rate of private sector employment growth and is in the national top ten
for innovation (as measured by patents registered).
0
500
1000
1500
2000
2500
3000
1997
1998
1999
2000
2001
2002
2003
2004
2005
2006
2007
2008
2009
2010
2011
£ m
illio
nProduction
Construction
Distribution; transport;accommodation and food
Information andcommunication
Financial and insuranceactivities
Real estate activities
Business service activities
Public administration;education; health
Other services andhousehold activities
Milton Keynes Council and Milton Keynes Development Partnership Final Report
November 2015 gva.co.uk 26
Business Demography
The following section reviews business stock and sizes, business survival rates and growth rates 2.58
to provide a context of business demography in Milton Keynes.
Business Stock
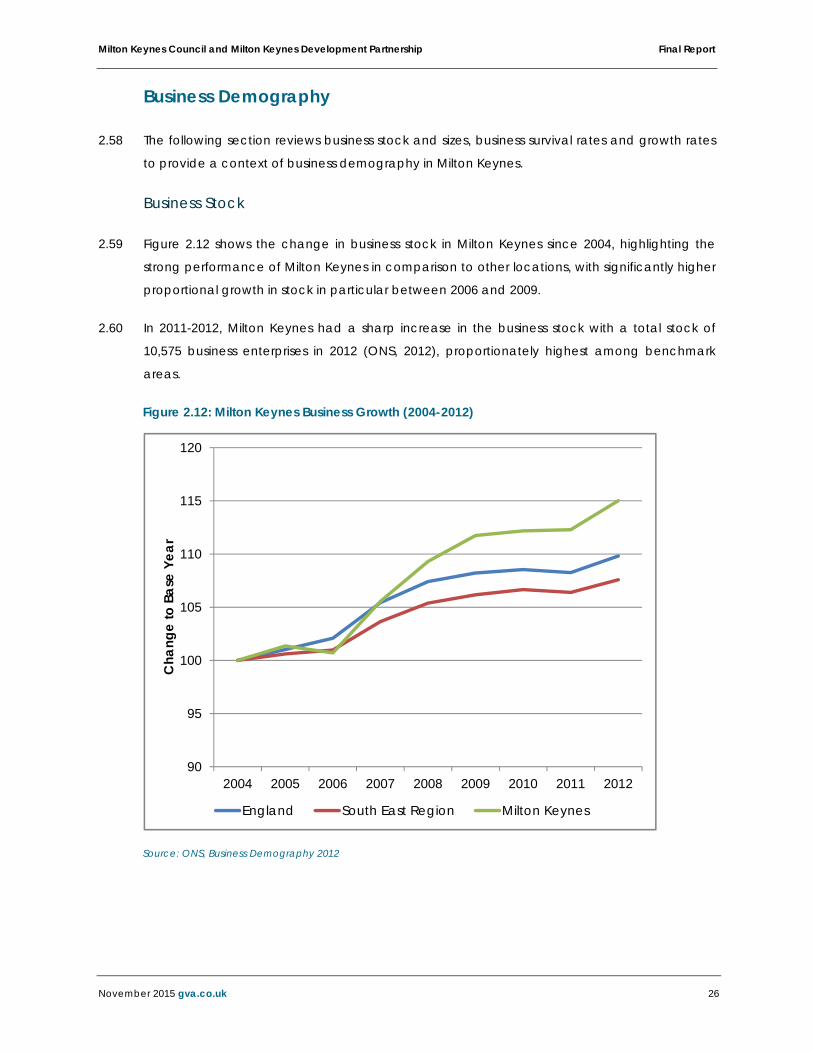
Figure 2.12 shows the change in business stock in Milton Keynes since 2004, highlighting the 2.59
strong performance of Milton Keynes in comparison to other locations, with significantly higher
proportional growth in stock in particular between 2006 and 2009.
In 2011-2012, Milton Keynes had a sharp increase in the business stock with a total stock of 2.60
10,575 business enterprises in 2012 (ONS, 2012), proportionately highest among benchmark
areas.
Figure 2.12: Milton Keynes Business Growth (2004-2012)
Source: ONS, Business Demography 2012
90
95
100
105
110
115
120
2004 2005 2006 2007 2008 2009 2010 2011 2012
Cha
nge
to B
ase
Year
England South East Region Milton Keynes
Milton Keynes Council and Milton Keynes Development Partnership Final Report
November 2015 gva.co.uk 27
Business Size
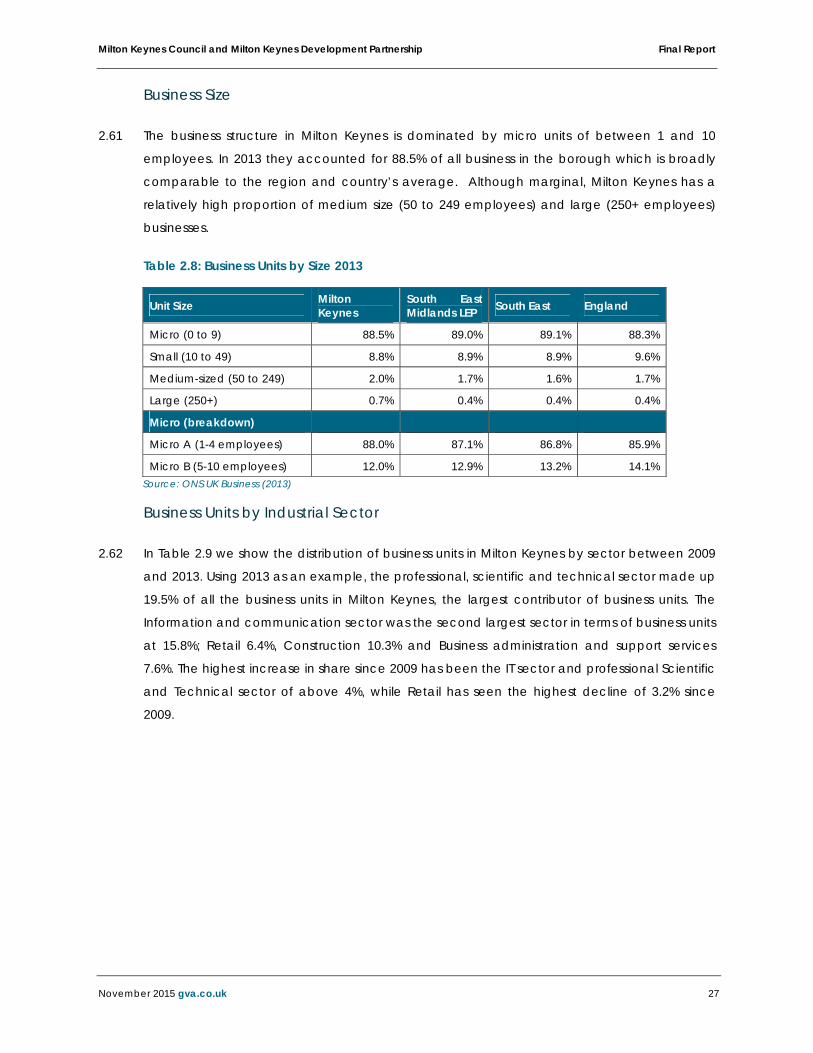
The business structure in Milton Keynes is dominated by micro units of between 1 and 10 2.61
employees. In 2013 they accounted for 88.5% of all business in the borough which is broadly
comparable to the region and country’s average. Although marginal, Milton Keynes has a
relatively high proportion of medium size (50 to 249 employees) and large (250+ employees)
businesses.
Table 2.8: Business Units by Size 2013
Unit Size Milton Keynes
South East Midlands LEP South East England
Micro (0 to 9) 88.5% 89.0% 89.1% 88.3%
Small (10 to 49) 8.8% 8.9% 8.9% 9.6%
Medium-sized (50 to 249) 2.0% 1.7% 1.6% 1.7%
Large (250+) 0.7% 0.4% 0.4% 0.4%
Micro (breakdown)
Micro A (1-4 employees) 88.0% 87.1% 86.8% 85.9%
Micro B (5-10 employees) 12.0% 12.9% 13.2% 14.1% Source: ONS UK Business (2013)
Business Units by Industrial Sector
In Table 2.9 we show the distribution of business units in Milton Keynes by sector between 2009 2.62
and 2013. Using 2013 as an example, the professional, scientific and technical sector made up
19.5% of all the business units in Milton Keynes, the largest contributor of business units. The
Information and communication sector was the second largest sector in terms of business units
at 15.8%; Retail 6.4%, Construction 10.3% and Business administration and support services
7.6%. The highest increase in share since 2009 has been the IT sector and professional Scientific
and Technical sector of above 4%, while Retail has seen the highest decline of 3.2% since
2009.
Milton Keynes Council and Milton Keynes Development Partnership Final Report
November 2015 gva.co.uk 28
Table 2.9: Percentage of Business units by Sector in Milton Keynes
2009 (%) 2010 (%) 2011 (%) 2012
(%) 2013 (%)
2009-2013 (%)
Professional, scientific & technical 15.4 15.8 15.9 16.7 19.5 4.1
Information & communication 11.1 11.6 12.4 12.8 15.8 4.7
Retail 9.6 9.3 9.6 9.3 6.4 -3.2
Construction 9.7 10 9.3 8.8 10.3 0.6
Business administration & support services 9.4 8.7 8.7 8.3 7.6 -1.8
Arts, entertainment, recreation & other services 7.0 6.6 6.5 6.4 6.3 -0.7
Wholesale 5.2 5.4 5.6 5.6 5.6 0.4
Health 4.8 5.2 5.4 5.3 3.9 -0.9
Accommodation & food services 5.3 5.9 4.7 4.8 3.7 -1.6
Manufacturing 5.2 4.9 4.6 4.6 4.9 -0.3
Transport & storage (inc postal) 3.9 3.7 3.8 3.8 3.4 -0.5
Property 3.7 3.5 3.6 3.4 3.4 -0.3
Motor trades 2.9 2.7 2.8 2.8 2.8 -0.1
Financial & insurance 2.3 2.3 2.4 2.4 2.2 -0.1
Education 2.8 2.8 2.8 2.8 2.1 -0.7
Agriculture, forestry & fishing 1.4 1.3 1.4 1.3 1.6 0.2
Source: NOMIS, 2013
Business Survival Rates
The change in business stock discussed above in part reflects the survival rates of new business 2.63
starting in MK, which are shown in Table 2.10.
The data shows early impacts of the recession significantly reducing the one and two year 2.64
survival rates of businesses started in 2009 and 2010. Milton Keynes business survival rates tend
to be below those of the comparator areas with its five year survival rate being 42.8% below
South East (47.3%) and national average (44.4%).
Milton Keynes Council and Milton Keynes Development Partnership Final Report
November 2015 gva.co.uk 29
Table 2.10: Business Survival Rates (%)
Year of Birth
Survival Rate (%)
1 year 2 year 3 year 4 year 5 year
England
2007 95.4 81.3 62.9 51.9 44.4
2008 92.1 73.9 57.9 48.8 ..
2009 90.9 73.9 59.7 .. ..
2010 86.8 72.5 .. .. ..
2011 93.1 .. .. .. ..
South East
2007 96.2 83.8 66.2 55.1 47.3
2008 93.2 76.6 61.4 52.1 ..
2009 91.6 75.7 61.9 .. ..
2010 87.9 74.5 .. .. ..
2011 93.6 .. .. .. ..
Milton Keynes
2007 97.4 84.9 63.8 51.7 42.8
2008 94.2 75.3 57.1 46.5 ..
2009 92.3 74.5 60.4 .. ..
2010 88.8 73.6 .. .. ..
2011 93.0 .. .. .. ..
Source: ONS, Business Demography 2012
Summary and SWOT Analysis
Milton Keynes is the fastest growing city in the UK by population with an annual growth rate of 2.65
1.6%.. The principal settlement in the borough is Milton Keynes itself, which accounts for 33% of
its area and approximately 85% of its population. It has a strong young population with a high
proportion of the under 16 age group (23%), and at least 65% of its population are of working
age. This is reflected in its high economic activity rate of 79%, proportionately higher than the
national context. Milton Keynes population is also aging as it has seen the highest rate of
change in population above 64 years compared to the benchmark areas.
About 48% of its total population is in employment and it has an extensive labour supply that 2.66
includes a high proportion of those economically inactive and seeking work. Milton Keynes
was significantly impacted during the recession resulting in highest proportion of
unemployment and claimant rates compared to regional and national benchmarks.
However, since then it has shown notable signs of recovery with unemployment rates lowering
to 6.7% and claimant rates bouncing back to pre-recession levels of 1.6% in 2014.
Milton Keynes has shown a significant improvement in skill levels among its population, with a 2.67
significant drop in the population with no qualifications between 2004 and 2013. The
proportion of residents with a Level 4 qualification also rose sharply between this period by
Milton Keynes Council and Milton Keynes Development Partnership Final Report
November 2015 gva.co.uk 30
11.7%. This is reflected in the occupational profile which is proportionately high for high skilled
occupations of 48%. A further analysis of employment by sector shows that there is a cluster of
sector strength in Financial Service Activity, IT, Consulting, Security related services and a
concentration of transport and related supply chain activities, and food and beverage
manufacturing showing a specialisation in these sectors in the borough. This is also reflected in
the GVA contribution trends which indicate that the distribution;transport; accommodation
and food sector (30%); public administration; education and health sector (14.2%); business
services activities sector (12.2%); information and communication sector (10.2%); financial and
insurance activities sector (7.9%); and real estate activities sector (10.3%) are key drivers of the
economy.
MK has a containment rate of 64% of jobs for its employed population. The rest of its workforce 2.68
travels to the neighbouring borough with most travelling to Central Bedfordshire, Bedford,
Aylesbury Vale, Northampton and Central London. Milton Keynes has relatively strong
workplace based earning as average earnings of those who commute in to Milton Keynes are
higher than those of resident workers as commuters tend to have higher level skills.
In terms of economic performance, GVA trends in Milton Keynes are towards the higher end 2.69
of the spectrum with a workplace based annual average growth rate of 5.3% (higher than
regional 3.8% and national 4%). It also has the highest per capita GVA growth rate trend.
Milton Keynes was ranked highest among all the 11 local authorities in the South East Midlands
LEP and was among the top 15% most competitive localities in the UK out of all the local
authorities in the UK ranked by UKCI.
Milton Keynes has shown significantly stronger business growth trends between 2004 and 2011 2.70
compared with the regional and national average in 2011. About 88% of the businesses in the
borough are micro units with a maximum of 10 employees. Despite this the city has a high
proportion of large business units given the presence of several large enterprises in Milton
Keynes. The most popular business sectors are Professional, Scientific and Technical
occupations. This is followed by IT & Communication and the Retail sector which are key
sectors in terms of business units and employment. However, despite the robust business stock,
business survival rates in Milton Keynes is quite poor with only 42% of businesses surviving for a 5
year period compared with the South East (47.3%) and national average (44.4%).
We conclude by summarising the strengths, opportunities, threats, and weaknesses of the 2.71
Milton Keynes economy in Table 2.11.

Milton Keynes Council and Milton Keynes Development Partnership Final Report
November 2015 gva.co.uk 31
Table 2.11: SWOT of the Milton Keynes Economy
Strengths/ Opportunities Threats/ Weakness
Strong Image- Fastest growing city in the UK by population, with strong young demographics.
High proportion of working age population. High economic activity rate Lowering unemployment and claimant rates. Strong set of skills among its population with
high qualification levels. High engagement of population in high skills
sectors such as professional, scientific and technical, IT & Communications, and retail.
Economically diverse with a diverse contribution by broad industrial sectors and also in terms of employee engagement.
High representation in knowledge based sectors.
High Entrepreneurial activity. Very good roads and rail accessibility. High GVA trends.
High aging population. High unemployment and claimant rates. Decline in containment rate of jobs in Milton
Keynes. 7% of loss in a decade (2001-2011). Low residence based earnings. High proportion engaged in elementary
occupations. Poor business survival rate. Competition from other large centres (such as
Reading and Swindon) who are planning for significant levels of growth
Major development proposals in the SEMLEP region which are focussed at attracting similar sectors to Milton Keynes
Car dependent City.

Milton Keynes Council and Milton Keynes Development Partnership Final Report
November 2015 gva.co.uk 32
3. Neighbours Policy Aspirations
This section of the report provides details about the planning policy aspirations of the local 3.1
authorities which surround Milton Keynes. It begins with an overview of the South East Midlands
Local Enterprise Partnership (SEMLEP) followed by details of the planning policy and economic
development priorities of the Councils which comprise the SEMLEP. We also provide comment
on the specific engagement with the neighbouring local authorities with regard to this study.
Context
Although the focus of this study is on the Borough of Milton Keynes, it is recognised that the 3.2
influence of the City extends far beyond its administrative boundaries.
The Localism Act requires that local planning authorities should co-operate on “strategic 3.3
matters”, and the NPPF also acknowledges that public bodies have a Duty to Co-operate on
planning issues that cross administrative boundaries and particularly those which relate to the
strategic priorities for the area.
As explored in detail later in this report Milton Keynes has a strong inter-relationship with the 3.4
SEMLEP area, particularly in terms of travel to work patterns, suggesting that in functional terms
it is important to understand what is happening now, and what may happen in the future to
these local authorities, due to their close economic relationships.
South East Midlands Local Enterprise Partnership
Milton Keynes Council (MKC) forms part of the South East Midlands Local Enterprise Partnership 3.5
(SEMLEP). The SEMLEP is a multi-authority grouping that covers the following ten Local
Authority areas (in addition to MKC);
Aylesbury Vale District Council;
Bedford Borough Council;
Central Bedfordshire Council;
Cherwell District Council;
Corby Borough Council;
Daventry District Council;
Kettering Borough Council;
Luton Borough Council;

Milton Keynes Council and Milton Keynes Development Partnership Final Report
November 2015 gva.co.uk 33
Northampton Borough Council; and
South Northamptonshire Council.
The extent of the SEMLEP is shown in Figure 3.1 below. 3.6
Figure 3.1 - SEMLEP Area Map
S
Source: http://www.semlep.com/area-map/

Milton Keynes Council and Milton Keynes Development Partnership Final Report
November 2015 gva.co.uk 34
The SEMLEP Strategic Economic Plan contains the following visions: 3.7
To reinforce and develop the South East Midlands as one of the most innovative,
successful and high performing economies in England by 2020;
To deliver 86,700 new homes and 111,200 new jobs accommodating an increase in
population of 151,400. As a result, by 2020 gross value added is estimated to increase by
£10.8bn above the current level; and
To stimulate economic development by demonstrating clear leadership and collaborative
approach to enable substantive private sector-led growth and capture major inward
investment.
Neighbouring Planning Policy and Economic Development Priorities
This section provides an overview of the planning policy and economic development priorities 3.8
of the SEMLEP authorities in closest proximity to Milton Keynes, as well as Wellingborough
Borough Council which is not a part of the SEMLEP but borders Milton Keynes to the north.
Aylesbury Vale District Council
The Aylesbury Vale District Local Plan (AVDLP) currently provides the planning policy context 3.9
for the local authority.
This Development Plan Document is due to be replaced by the Vale of Aylesbury Local Plan 3.10
(VALP), as the plan period (to 2011) has expired. The VALP will include the overall strategy for
the district, alongside site allocations and development management policies. The options
consultation for this emerging plan is scheduled for October to November 2015.
Contained within the current AVDLP is a mission statement, which is “to develop and promote 3.11
the local economy and establish Aylesbury Vale as a vibrant economic centre”.
The plan illustrates that the town of Aylesbury is the focus for employment in the district. It 3.12
notes that Milton Keynes has a significant influence on the travel to work patterns in Aylesbury
with approximately 20% of the local authorities’ residents out-commuting to work in Milton
Keynes.
The plan indicates that efforts to attract modern industries are required to provide the 3.13
population employment opportunities in the future.

Milton Keynes Council and Milton Keynes Development Partnership Final Report
November 2015 gva.co.uk 35
Bedford Borough Council
The Core Strategy and Rural Issues Plan (2008) currently provides the planning policy for 3.14
Bedford (together with the 2013 Allocations and Designations Local Plan, the 2008 Town
Centre Area Action Plan and ‘saved’ policies from the 2002 Local Plan).
The focus of the Core Strategy for the borough is to become “a regional centre for business, 3.15
arts, creative industries and culture”. The expansion of the local economy and transport
network infrastructure improvements are also key points of focus, which will assist with
employment development. The following objectives prove particularly relevant to
employment land in Bedford;
Deliver the planned growth in Bedford to achieve a step change in the Borough’s role in
the region;
Foster significant employment growth; and
Facilitate the regeneration of Bedford town centre to enable it to fulfil a greater role within
the region.
The Plan identifies that the distance that residents of the borough travel to work varies 3.16
considerably. Those living in the rural wards mostly travel between 0 and 20km to work, whilst
those living in the urban wards travel less than 5km to work.
The Plan also indicates that the majority of the borough’s residents both live and work in the 3.17
borough. Consequently there is a low level of commuting both into and out of the borough.
People who commute into the borough account for 26% of the workers in the borough, and
29% of the working age residents commute out of the borough. Yet of those people who
commute outside of the borough to work, one of the most popular destinations are Milton
Keynes, alongside Mid Bedfordshire and London.
Bedford Borough Council is preparing a new Local Plan that will set out how much growth 3.18
there should be in the borough in coming years (housing, jobs and associated infrastructure)
and where it should take place, up to 2032.
As at June 2015, the Council are committed to progressing the new Local Plan as soon as 3.19
possible. Once there can be greater certainty over delivery, the Local Development Scheme
will be amended to include a revised timetable for the plan’s production.

Milton Keynes Council and Milton Keynes Development Partnership Final Report
November 2015 gva.co.uk 36
Central Bedfordshire Council
Planning policies are contained within the Core Strategy and Development Management 3.20
Policies Document for the north area of the district (2009), the South Bedfordshire Local Plan
(2004), and the Mid Bedfordshire Local Plan (2005).
The 2009 Plan notes that the Mid Bedfordshire economy has key strengths, including a high 3.21
proportion of the population being economically active, high earnings, low unemployment, a
mix of sectors, and an increasing number of jobs and businesses.
However, the Plan indicates that there are also some relative weaknesses in the local 3.22
economy which may well be challenged further if high growth continues in the surrounding
areas. Particular weaknesses are identified as low levels of economic self-containment, with
high levels of out-commuting.
The Plan draws upon the 2001 census data which shows that less than half of the working 3.23
residents work within the district. The principal work destinations are Hertfordshire (17.2%),
Bedford (8.9%), London (6.6%), Luton (6.2%) and Milton Keynes (5.0%). Conversely, around 33%
of the workforce employed in Mid Bedfordshire commutes in from outside the Borough.
The Council are preparing a new Development Strategy to cover the period to 2031. At 3.24
a court hearing on 16 June the Judge declined to grant permission for the Council’s
application for Judicial Review of the Inspector’s decision that the plan has failed to comply
with the Duty to Co-operate. Thus, the progression of this is currently unknown.
Cherwell District Council
The planning policy for Cherwell District Council currently exists as ‘saved’ policies from the 3.25
1996 Local Plan. However, as this predates the 2001 census, the information contained within
the strategic policies is no longer current.
The proposed new Cherwell Local Plan (2011-2031) was submitted for Examination on 31 3.26
January 2014. Although this is not yet adopted, it provides a better context for the economic
and employment context of the district, and the implications of this for Milton Keynes.
The plan acknowledges that the district suffers from a significant imbalance between homes 3.27
and jobs. Out-commuting is a particular problem in Bicester. In 2001, Bicester South and
Bicester North wards jointly had the second highest percentage of workers in Oxfordshire
travelling 60km or over to work (8.8% each).

Milton Keynes Council and Milton Keynes Development Partnership Final Report
November 2015 gva.co.uk 37
The Plan therefore indicates that although Banbury has the largest supply of employment land 3.28
in the district and a range of available employment sites, that Bicester will be the focus for
new employment land to respond to and reduce out-commuting.
In June 2015 the Inspector's Report on the Examination into the new Cherwell Local Plan 2011-3.29
2031 was made available. The Cherwell Local Plan 2011-2031 Part 1 was formally adopted by
Cherwell District Council on 20 July 2015. The Plan provides the strategic planning policy
framework and sets out strategic site allocations for the District to 2031.
Northampton Borough Council
The Development Plan for Northampton Borough Council consists of the West 3.30
Northamptonshire Joint Core Strategy (adopted December 2014), the Central Area Action
Plan (adopted January 2013) and ‘saved’ policies from the Northampton Local Plan
(adopted in 1997). It will also include the Northampton Related Development Area Allocations
and Development Management Policies Local Plan (to be commenced during 2015).
The Joint Core Strategy provides a spatial portrait and explains that there are significant 3.31
commuter flows from Northamptonshire into Milton Keynes.
South Northamptonshire Council
The Development Plan for South Northamptonshire Council consists of the West 3.32
Northamptonshire Joint Core Strategy (adopted December 2014) and ‘saved’ policies from
the South Northamptonshire Local Plan (adopted in 1997). It will also include the Northampton
Related Development Area Allocations and Development Management Policies Local Plan
(led by Northampton Borough Council, as above), and the South Northamptonshire
Settlement and Development Management Policies Local Plan (due to be adopted in 2017).
The Joint Core Strategy provides a spatial portrait and explains that there are strong 3.33
connections between South Northamptonshire and Northampton, reflected in significant
travel to work movements.
It explains that South Northamptonshire is a largely rural district with a low job density, and 3.34
struggles with the level of out commuting. It therefore needs to address the level of out
commuting by providing employment opportunities which meet the professional profile of its
resident workforce.
Milton Keynes Council and Milton Keynes Development Partnership Final Report
November 2015 gva.co.uk 38
Wellingborough Borough Council
The North Northamptonshire Joint Core Strategy (JCS) currently provides the planning policy 3.35
for Wellingborough (as well as the Town Centre Area Action Plan (adopted 2009) and ‘saved’
policies from the Borough of Wellingborough Local Plan (adopted 1999).
The spatial portrait of North Northamptonshire contained within this document indicates that 3.36
the area falls in the northern tip of the Milton Keynes South Midlands (MKSM) Growth Area.
The JCS identifies that the population of North Northamptonshire is expected to grow to 3.37
270,000 by 2021. It also notes that there are presently some significant deficiencies in the area,
such as the lack of a University and few knowledge based businesses. This is causing North
Northamptonshire to lose wealth and skilled people who move away to work, or commute to
London, Milton Keynes, or other centres.
However, in 2001 these movements were limited to around 9,000 out-commuters, but it is likely 3.38
that the numbers will increase if North Northamptonshire delivers housing growth without new
complementary jobs.
The JCS also demonstrates the impact of the strong job growth in North Northamptonshire. The 3.39
economy generating these jobs is relatively self-contained in terms of commuting, as 76% of
residents of North Northamptonshire who work do so in North Northamptonshire.
Wellingborough imports workers primarily from East Northamptonshire and exports them to
Northampton. Therefore, there is a strong employment relationship between Wellingborough
and Northampton, but a perceived weak employment relationship between Wellingborough
and Milton Keynes.
The council is in the process of preparing the Plan for the Borough of Wellingborough, which 3.40
will include locally specific policies that will guide the future of the Borough. It is scheduled for
adoption in 2017.
Engagement with Neighbouring Local Authorities
The client group contacted the neighbouring local authorities with regards to the nature and 3.41
scope of the EGELS and this was followed up by GVA in October 2014. All local authorities
were given details of the project brief, the scope of the work, and the nature of the cross
boundary issues which GVA required input on. The neighbouring local authorities were given
the opportunity to contact GVA on any issues they felt should be addressed in the EGELS.

Milton Keynes Council and Milton Keynes Development Partnership Final Report
November 2015 gva.co.uk 39
From the limited responses received, the local authorities are content with the scope of the 3.42
study as set out in the brief, and satisfied that the proposed EGELS will meet Duty to Co-
operate issues as far as employment land is concerned.
We note that in general terms some authorities feel that it would be useful for the EGELS to 3.43
provide more information about existing commuting patterns and the characteristics of
commuters and their jobs. This could also be supported by trend and policy scenarios of how
this is expected to change in the future. They also feel that more attention could be paid to
the infrastructure investment synergies across boundaries, as well attempting to minimise
competition in key sectors.
Section 2 sets out our analysis of available travel to work data and highlights the close 3.44
relationship between Milton Keynes and the neighbouring areas. This Stage of the work also
begins to consider the scale and nature of future growth in Section 8. Phase 2 of this work will
look in more detail at the implications of this forecast growth on labour supply, comparing
population and employment forecasts to understand whether an increased need for labour
from other locations will arise.
It has been commented that the relationship of the EGELS to the housing evidence base is 3.45
unclear especially as the NPPF and NPPG now require the integration of the housing and
employment needs and availability assessments. Consequently, neighbouring authorities wish
to know how the SHMA and EGELS fit together as well as details of how these studies will be
used to inform the next stages of the Local Plan preparation.
Phase 2 of the work will consider the alignment of jobs and population growth as set out within 3.46
this study and the SHMA, this will consider whether the ratio of jobs and population will change
in the future and the potential implications of this. The new Plan:MK will then seek to reconcile
the population and employment evidence bases to set a sustainable growth strategy moving
forward.
Some authorities have questioned the proposed forecasting methodologies of the EGELS. 3.47
They suggest that it may be more successful if authorities within the Functional Economic
Market Area (FEMA) adopt a standard approach in order to gain a common understanding
of the cross boundary implications of future demand and supply for jobs and employment
space within FEMAs. Further, they suggest that the FEMAs relationship to the HMA(s) will be
difficult to assess on a consistent basis if different methodologies are used.
Each local authority within SEMLEP is at a different point in its plan making process and 3.48
therefore have evidence bases that are also at different stages of development, some are still
work in progress whilst others have been completed. As such the SEMLEP authorities have not,
to date, developed an agreed employment or economic forecast for the area which can be
Milton Keynes Council and Milton Keynes Development Partnership Final Report
November 2015 gva.co.uk 40
used as the basis for this study, and a number of forecast bases have been used. To best
address this issue we have used (in Section 8) both the EEFM and Experian employment
growth forecasts to understand potential forms of growth.
Importantly, as noted in Section 5 the functional economic area for Milton Keynes extends 3.49
beyond the SEMLEP boundaries. It would not be possible nor practical to seek to develop a
forecast across this large area within the scope of this study. However, the approach taken
aligns with NPPF and NPPG recommendations and assumptions have been clearly set out;
again these clearly align with available guidance. As such, whilst the forecasting model may
differ, the outputs and considerations will be consistent with those in other areas.
Authorities have also commented that one aspect of the Duty to Co-operate is to assist 3.50
neighbouring local authorities with any unmet objectively assessed needs for housing. In doing
so, Milton Keynes would have to consider this in the context of meeting its own needs as well.
Therefore the Milton Keynes plan-making process should consider this, and the consequent
limitations for engaging with neighbours.
At present MKC have not identified any need or desire to seek to accommodate its 3.51
objectively assessed employment need in any location outside of its administrative boundary.
It is the purpose of this study to identify future needs and also assess the capacity for this to be
accommodated within Milton Keynes, Phase 2 will make recommendations for the future
delivery strategy for jobs and employment land, the Council will then set the most appropriate
policy approach to achieve this, balancing the need to accommodate new employment
against its other needs and priorities.
In summary, the feedback received is largely positive and comments have been incorporated 3.52
(where relevant and possible) into the approach for the Study. All authorities have indicated
that they would be pleased to receive copies of the report and to provide further input as
required as the Study develops.

Milton Keynes Council and Milton Keynes Development Partnership Final Report
November 2015 gva.co.uk 41
4. Property Market Analysis
This section of the report provides a property market analysis of the Milton Keynes Borough. 4.1
The ‘employment’ market comprises both industrial (Use Classes B8, B2 and B1(c)) and office
(Use Classes B1 (a) and B1 (b)) accommodation.
Specifically, this section of the report looks at: 4.2
Employment sites and premises within Milton Keynes;
The characteristics of the properties that are currently available;
The characteristics of the deals that took place over a five year timeframe, and;
General investment market and occupier conditions.
This section begins by providing an overview of the general economic market, and is 4.3
subsequently followed by an overview of the Milton Keynes borough and detailed
employment market analysis.
General Economic Market
The most recent GVA research (GVA Economic and Property Market Review May 2015) 4.4
confirms that economic growth slowed to 0.3% in Quarter 1 of 2015, half the rate seen in
Quarter 4 2014, and the slowest pace of expansion for more than two years. Growth in the
manufacturing sector slowed for the fourth quarter in succession, registering an increase of just
0.1% in Quarter 1. The production sector saw a modest drop in output, with the fall in the oil
price having an adverse impact on North Sea production.
Despite the slowdown in Quarter 1, the economy is now 2.4% larger than in Quarter 1 2014 and 4.5
the UK remains one of the fastest growing developed economies. Further, survey evidence
continues to paint a positive picture, and we expect the growth rate to pick up again in the
coming quarters (the Quarter 1 figure may also be revised upwards a little). There was a
marked fall in construction output in Quarter 1 at -1.6%.
Although this was an improvement from the very poor performance of -2.2% in Quarter 4, it is 4.6
still surprisingly weak and growth will doubtless rebound later in 2015. In the service sector,
growth slowed to 0.5%, compared with 0.9% in Quarter 4 2014. Worryingly, the business services
and finance sector is now barely growing, at just 0.1% in Quarter 1, compared with 1.3% in
Quarter 4 last year.
Milton Keynes Council and Milton Keynes Development Partnership Final Report
November 2015 gva.co.uk 42
The economy has continued to add jobs at an impressive rate, with an increase in 4.7
employment of nearly a quarter of a million in the period December 2014 to February 2015
compared with September to November 2014. Two thirds of this was in full-time jobs, and the
vast majority was employment by businesses rather than self-employment. This bodes well for
occupier demand, particularly for offices.
Consumer spending power has been boosted in recent months by a simultaneous fall in 4.8
inflation and acceleration in wage growth. CPI inflation remained at zero in March 2015, whilst
wages (including bonuses) rose by 1.7%.
Retail sales volumes reflect this, up 0.9% during the period December 2014 to February 2015 4.9
compared with the previous three months. This was the 25th consecutive monthly increase on
this measure, and the longest period of sustained growth since November 2007.
Strong retail sales performance should continue throughout 2015, boosted by further wage 4.10
growth in real terms, strong employment growth, and rising house prices. However, retailers
remain under price pressure and growth in retail sales values will be much more subdued.
With inflation at zero, the UK is likely to see a short period of mild deflation in the coming 4.11
months. However, core inflation (which excludes volatile elements such as energy and food) is
running at 1%, and with higher wages feeding through, the risk of a harmful period of deflation
remains low. The consensus view expects a modest rise in CPI to 0.8% by the end of 2015, and
this should mean a delay in the first base rate rise until early 2016.
The uncertainty surrounding the general election did not have any marked impact on the 4.12
economy or property markets, and the decisive outcome will prevent a potentially damaging
period of uncertainty that could have adversely affected business and investor confidence.
However, the new Conservative Government will have many economic challenges. The fiscal
deficit remains large at circa 5% of GDP, despite a surge in income tax revenue during the last
financial year. There will be further austerity in the next parliament, and the Government’s
spending plans are largely unfunded.
We expect growth in 2015 as a whole to be close to the long-term trend of around 2.6% p.a. 4.13
The UK’s robust economic performance last year was driven by employment growth, whilst
total productivity actually fell by 0.1%. Output is now 4% higher than its prerecession peak in
2008, but output per worker is still 4% below that level, and raising productivity is one of the
main challenges facing the UK economy in the medium term.
Milton Keynes Council and Milton Keynes Development Partnership Final Report
November 2015 gva.co.uk 43
Milton Keynes Overview
Milton Keynes is strategically well located 54 miles north west of London, 72 miles south east of 4.14
Birmingham, and sits between Oxford and Cambridge. Data supplied by Focus suggests that
there is a population of 190,333 within 10km of the centre of Milton Keynes and a population
of 359,331 within 20km of the centre.
Data from the Office of National Statistics (ONS), via Centre for Cities, demonstrates that over 4.15
the decade to 2013, Milton Keynes had experienced average annual population growth of
1.6%, resulting in a total population of 255,700 residents. Over the same period the
employment rate has declined from 80% to 74%.
The brief for this study defines Central Milton Keynes (CMK) as the area of land between the 4.16
west coast mainline and the Grand Union canal between H5 Portway and H6 Childs way,
which includes Campbell Park. This area is also covered by the CMK Business Neighbourhood
Plan.
For the purpose of this Phase 1 report, and the Phase 2 report and their respective site 4.17
assessments, GVA has distinguished between CMK and Campbell Park, due to the different
character and infrastructure of Campbell Park to the rest of CMK.
Existing Employment Land
The following section provides a comprehensive review of employment sites and premises 4.18
within Milton Keynes. It considers the latest data provided by the Valuation Office Agency
(VOA) and provides a context to the existing employment land use in Milton Keynes.
Total Stock
Figure 4.1 below identifies the total B-class use floorspace in Milton Keynes for 2000-2012 (latest 4.19
available data). It shows that both office and warehouse floorspace have had an overall
increase of circa 19% during this period.
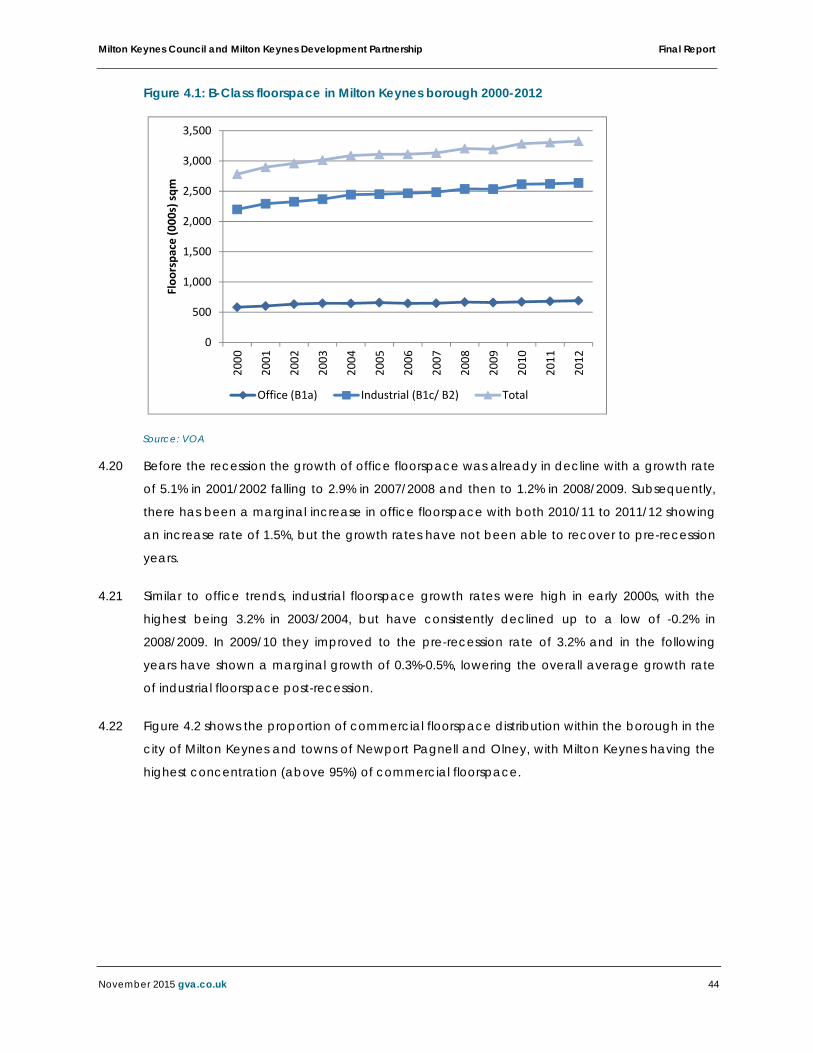
Milton Keynes Council and Milton Keynes Development Partnership Final Report
November 2015 gva.co.uk 44
Figure 4.1: B-Class floorspace in Milton Keynes borough 2000-2012
Source: VOA
Before the recession the growth of office floorspace was already in decline with a growth rate 4.20
of 5.1% in 2001/2002 falling to 2.9% in 2007/2008 and then to 1.2% in 2008/2009. Subsequently,
there has been a marginal increase in office floorspace with both 2010/11 to 2011/12 showing
an increase rate of 1.5%, but the growth rates have not been able to recover to pre-recession
years.
Similar to office trends, industrial floorspace growth rates were high in early 2000s, with the 4.21
highest being 3.2% in 2003/2004, but have consistently declined up to a low of -0.2% in
2008/2009. In 2009/10 they improved to the pre-recession rate of 3.2% and in the following
years have shown a marginal growth of 0.3%-0.5%, lowering the overall average growth rate
of industrial floorspace post-recession.
Figure 4.2 shows the proportion of commercial floorspace distribution within the borough in the 4.22
city of Milton Keynes and towns of Newport Pagnell and Olney, with Milton Keynes having the
highest concentration (above 95%) of commercial floorspace.
0
500
1,000
1,500
2,000
2,500
3,000
3,500
2000
2001
2002
2003
2004
2005
2006
2007
2008
2009
2010
2011
2012
Floorspace (000s) sqm
Office (B1a) Industrial (B1c/ B2) Total
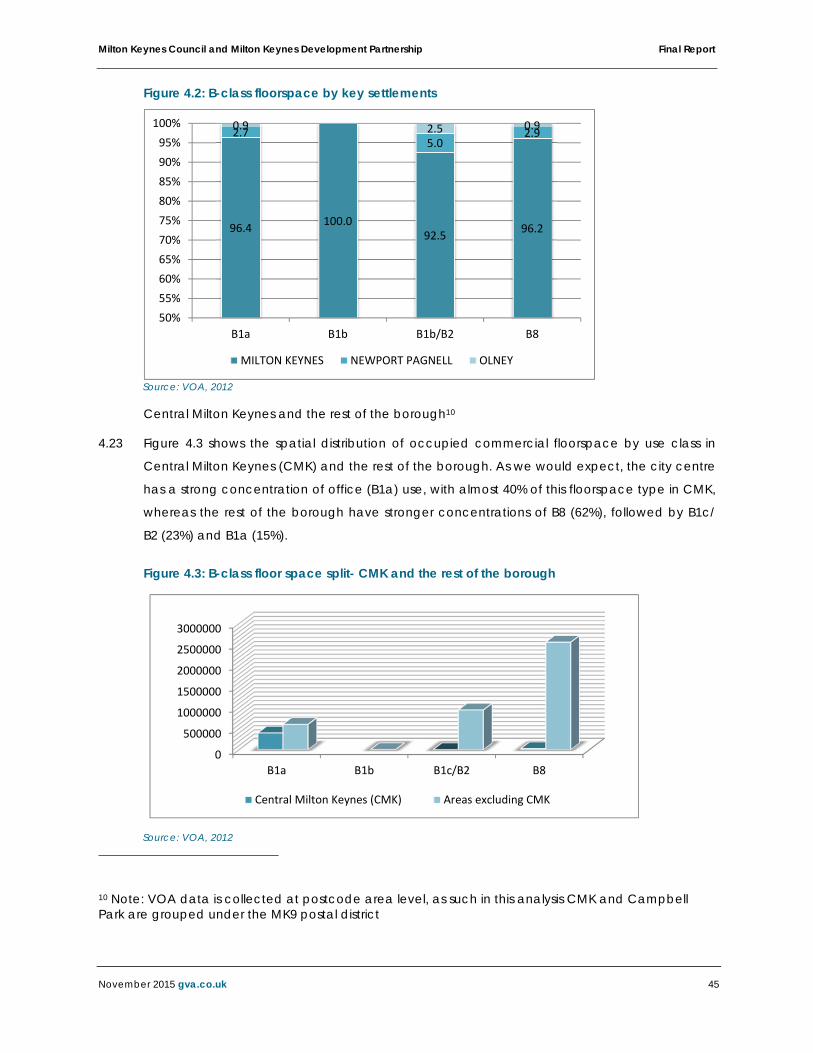
Milton Keynes Council and Milton Keynes Development Partnership Final Report
November 2015 gva.co.uk 45
96.4100.0
92.596.2
2.75.0
2.90.9 2.5 0.9
50%
55%
60%
65%
70%
75%
80%
85%
90%
95%
100%
B1a B1b B1b/B2 B8
MILTON KEYNES NEWPORT PAGNELL OLNEY
Figure 4.2: B-class floorspace by key settlements
Source: VOA, 2012
Central Milton Keynes and the rest of the borough10
Figure 4.3 shows the spatial distribution of occupied commercial floorspace by use class in 4.23
Central Milton Keynes (CMK) and the rest of the borough. As we would expect, the city centre
has a strong concentration of office (B1a) use, with almost 40% of this floorspace type in CMK,
whereas the rest of the borough have stronger concentrations of B8 (62%), followed by B1c/
B2 (23%) and B1a (15%).
Figure 4.3: B-class floor space split- CMK and the rest of the borough
Source: VOA, 2012
10 Note: VOA data is collected at postcode area level, as such in this analysis CMK and Campbell Park are grouped under the MK9 postal district
0
500000
1000000
1500000
2000000
2500000
3000000
B1a B1b B1c/B2 B8
Central Milton Keynes (CMK) Areas excluding CMK
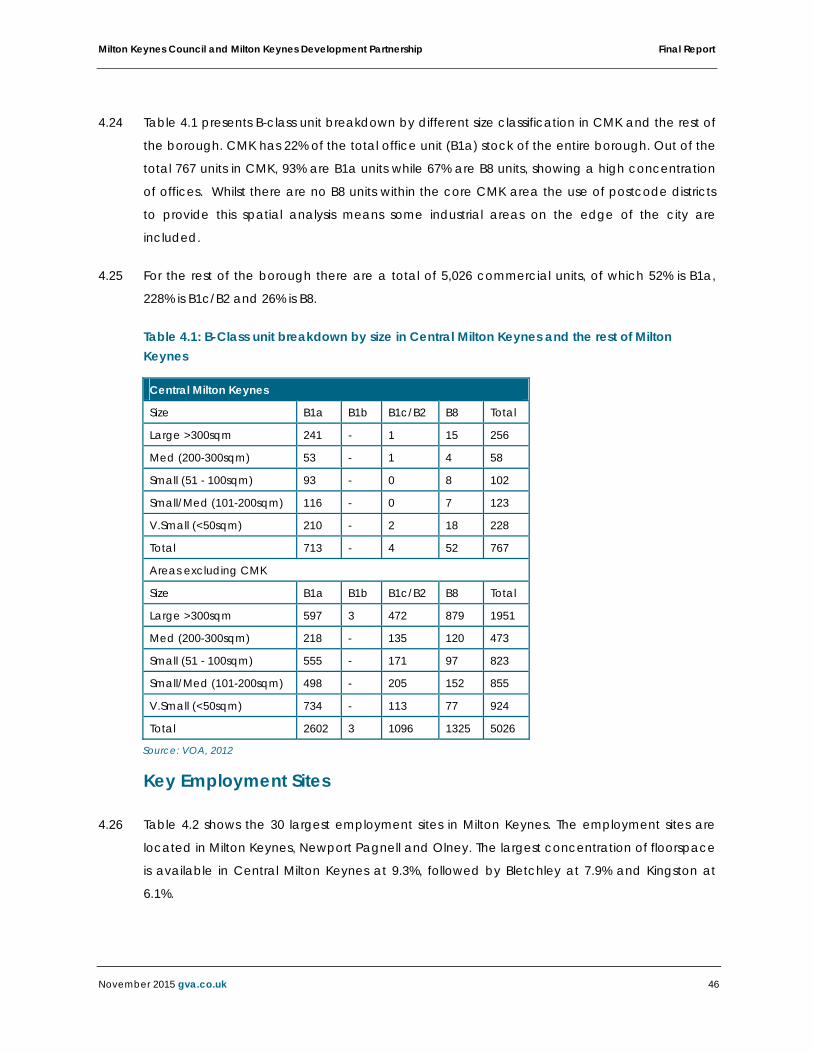
Milton Keynes Council and Milton Keynes Development Partnership Final Report
November 2015 gva.co.uk 46
Table 4.1 presents B-class unit breakdown by different size classification in CMK and the rest of 4.24
the borough. CMK has 22% of the total office unit (B1a) stock of the entire borough. Out of the
total 767 units in CMK, 93% are B1a units while 67% are B8 units, showing a high concentration
of offices. Whilst there are no B8 units within the core CMK area the use of postcode districts
to provide this spatial analysis means some industrial areas on the edge of the city are
included.
For the rest of the borough there are a total of 5,026 commercial units, of which 52% is B1a, 4.25
228% is B1c/B2 and 26% is B8.
Table 4.1: B-Class unit breakdown by size in Central Milton Keynes and the rest of Milton Keynes
Central Milton Keynes
Size B1a B1b B1c/B2 B8 Total
Large >300sqm 241 - 1 15 256
Med (200-300sqm) 53 - 1 4 58
Small (51 - 100sqm) 93 - 0 8 102
Small/Med (101-200sqm) 116 - 0 7 123
V.Small (<50sqm) 210 - 2 18 228
Total 713 - 4 52 767
Areas excluding CMK
Size B1a B1b B1c/B2 B8 Total
Large >300sqm 597 3 472 879 1951
Med (200-300sqm) 218 - 135 120 473
Small (51 - 100sqm) 555 - 171 97 823
Small/Med (101-200sqm) 498 - 205 152 855
V.Small (<50sqm) 734 - 113 77 924
Total 2602 3 1096 1325 5026
Source: VOA, 2012
Key Employment Sites
Table 4.2 shows the 30 largest employment sites in Milton Keynes. The employment sites are 4.26
located in Milton Keynes, Newport Pagnell and Olney. The largest concentration of floorspace
is available in Central Milton Keynes at 9.3%, followed by Bletchley at 7.9% and Kingston at
6.1%.
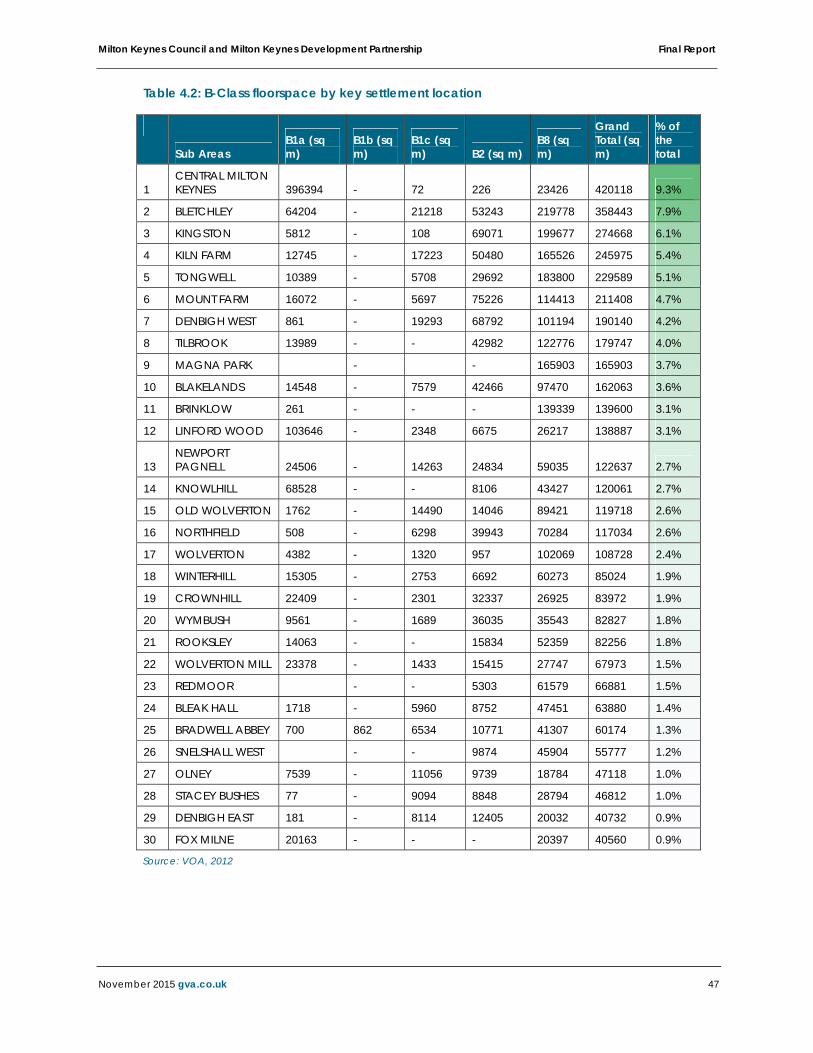
Milton Keynes Council and Milton Keynes Development Partnership Final Report
November 2015 gva.co.uk 47
Table 4.2: B-Class floorspace by key settlement location
Sub Areas B1a (sq m)
B1b (sq m)
B1c (sq m) B2 (sq m)
B8 (sq m)
Grand Total (sq m)
% of the total
1 CENTRAL MILTON KEYNES 396394 - 72 226 23426 420118 9.3%
2 BLETCHLEY 64204 - 21218 53243 219778 358443 7.9%
3 KINGSTON 5812 - 108 69071 199677 274668 6.1%
4 KILN FARM 12745 - 17223 50480 165526 245975 5.4%
5 TONGWELL 10389 - 5708 29692 183800 229589 5.1%
6 MOUNT FARM 16072 - 5697 75226 114413 211408 4.7%
7 DENBIGH WEST 861 - 19293 68792 101194 190140 4.2%
8 TILBROOK 13989 - - 42982 122776 179747 4.0%
9 MAGNA PARK - - 165903 165903 3.7%
10 BLAKELANDS 14548 - 7579 42466 97470 162063 3.6%
11 BRINKLOW 261 - - - 139339 139600 3.1%
12 LINFORD WOOD 103646 - 2348 6675 26217 138887 3.1%
13 NEWPORT PAGNELL 24506 - 14263 24834 59035 122637 2.7%
14 KNOWLHILL 68528 - - 8106 43427 120061 2.7%
15 OLD WOLVERTON 1762 - 14490 14046 89421 119718 2.6%
16 NORTHFIELD 508 - 6298 39943 70284 117034 2.6%
17 WOLVERTON 4382 - 1320 957 102069 108728 2.4%
18 WINTERHILL 15305 - 2753 6692 60273 85024 1.9%
19 CROWNHILL 22409 - 2301 32337 26925 83972 1.9%
20 WYMBUSH 9561 - 1689 36035 35543 82827 1.8%
21 ROOKSLEY 14063 - - 15834 52359 82256 1.8%
22 WOLVERTON MILL 23378 - 1433 15415 27747 67973 1.5%
23 REDMOOR - - 5303 61579 66881 1.5%
24 BLEAK HALL 1718 - 5960 8752 47451 63880 1.4%
25 BRADWELL ABBEY 700 862 6534 10771 41307 60174 1.3%
26 SNELSHALL WEST - - 9874 45904 55777 1.2%
27 OLNEY 7539 - 11056 9739 18784 47118 1.0%
28 STACEY BUSHES 77 - 9094 8848 28794 46812 1.0%
29 DENBIGH EAST 181 - 8114 12405 20032 40732 0.9%
30 FOX MILNE 20163 - - - 20397 40560 0.9%
Source: VOA, 2012
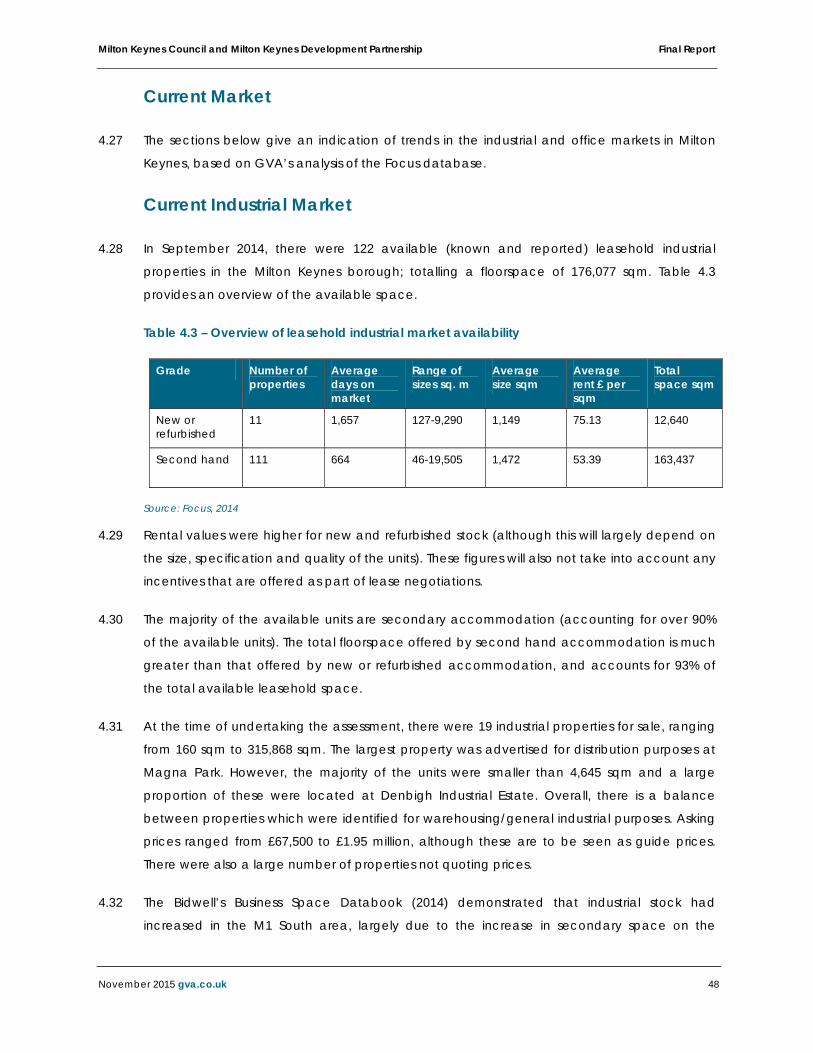
Milton Keynes Council and Milton Keynes Development Partnership Final Report
November 2015 gva.co.uk 48
Current Market
The sections below give an indication of trends in the industrial and office markets in Milton 4.27
Keynes, based on GVA’s analysis of the Focus database.
Current Industrial Market
In September 2014, there were 122 available (known and reported) leasehold industrial 4.28
properties in the Milton Keynes borough; totalling a floorspace of 176,077 sqm. Table 4.3
provides an overview of the available space.
Table 4.3 – Overview of leasehold industrial market availability
Source: Focus, 2014
Rental values were higher for new and refurbished stock (although this will largely depend on 4.29
the size, specification and quality of the units). These figures will also not take into account any
incentives that are offered as part of lease negotiations.
The majority of the available units are secondary accommodation (accounting for over 90% 4.30
of the available units). The total floorspace offered by second hand accommodation is much
greater than that offered by new or refurbished accommodation, and accounts for 93% of
the total available leasehold space.
At the time of undertaking the assessment, there were 19 industrial properties for sale, ranging 4.31
from 160 sqm to 315,868 sqm. The largest property was advertised for distribution purposes at
Magna Park. However, the majority of the units were smaller than 4,645 sqm and a large
proportion of these were located at Denbigh Industrial Estate. Overall, there is a balance
between properties which were identified for warehousing/general industrial purposes. Asking
prices ranged from £67,500 to £1.95 million, although these are to be seen as guide prices.
There were also a large number of properties not quoting prices.
The Bidwell’s Business Space Databook (2014) demonstrated that industrial stock had 4.32
increased in the M1 South area, largely due to the increase in secondary space on the
Grade Number of properties
Average days on market
Range of sizes sq. m
Average size sqm
Average rent £ per sqm
Total space sqm
New or refurbished
11 1,657 127-9,290 1,149
75.13 12,640
Second hand 111 664 46-19,505
1,472 53.39 163,437
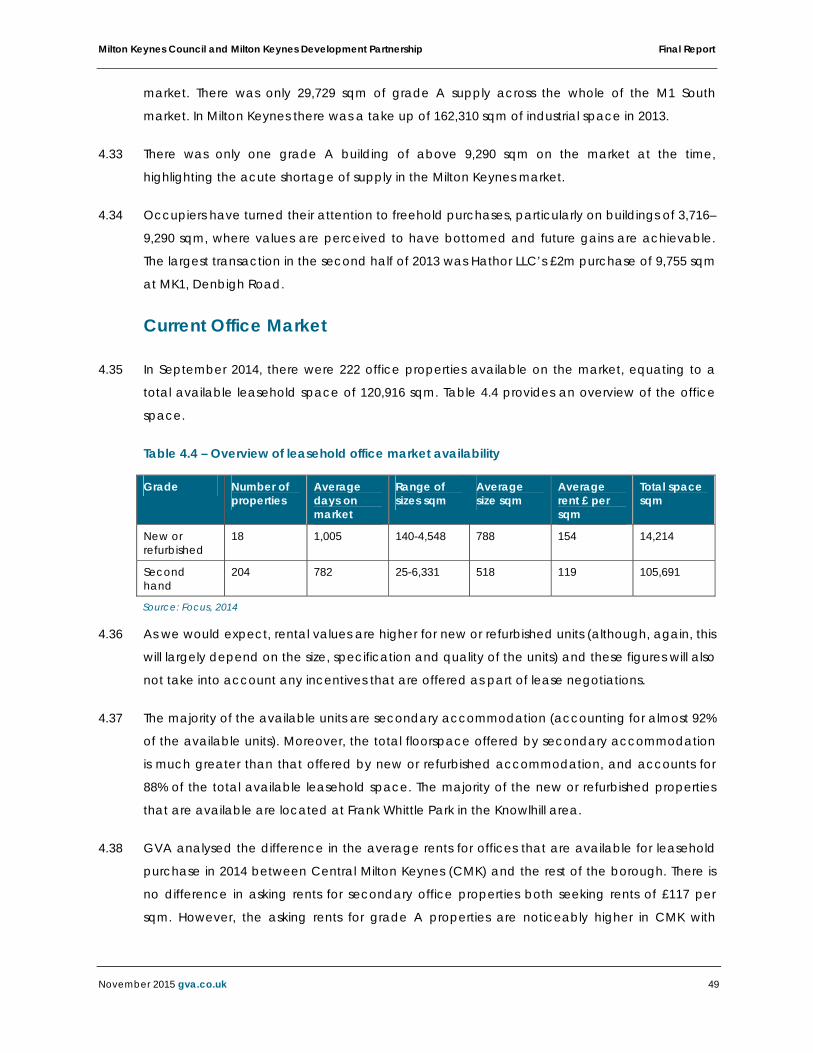
Milton Keynes Council and Milton Keynes Development Partnership Final Report
November 2015 gva.co.uk 49
market. There was only 29,729 sqm of grade A supply across the whole of the M1 South
market. In Milton Keynes there was a take up of 162,310 sqm of industrial space in 2013.
There was only one grade A building of above 9,290 sqm on the market at the time, 4.33
highlighting the acute shortage of supply in the Milton Keynes market.
Occupiers have turned their attention to freehold purchases, particularly on buildings of 3,716–4.34
9,290 sqm, where values are perceived to have bottomed and future gains are achievable.
The largest transaction in the second half of 2013 was Hathor LLC’s £2m purchase of 9,755 sqm
at MK1, Denbigh Road.
Current Office Market
In September 2014, there were 222 office properties available on the market, equating to a 4.35
total available leasehold space of 120,916 sqm. Table 4.4 provides an overview of the office
space.
Table 4.4 – Overview of leasehold office market availability
Grade Number of properties
Average days on market
Range of sizes sqm
Average size sqm
Average rent £ per sqm
Total space sqm
New or refurbished
18 1,005 140-4,548 788 154 14,214
Second hand
204 782 25-6,331 518 119 105,691
Source: Focus, 2014
As we would expect, rental values are higher for new or refurbished units (although, again, this 4.36
will largely depend on the size, specification and quality of the units) and these figures will also
not take into account any incentives that are offered as part of lease negotiations.
The majority of the available units are secondary accommodation (accounting for almost 92% 4.37
of the available units). Moreover, the total floorspace offered by secondary accommodation
is much greater than that offered by new or refurbished accommodation, and accounts for
88% of the total available leasehold space. The majority of the new or refurbished properties
that are available are located at Frank Whittle Park in the Knowlhill area.
GVA analysed the difference in the average rents for offices that are available for leasehold 4.38
purchase in 2014 between Central Milton Keynes (CMK) and the rest of the borough. There is
no difference in asking rents for secondary office properties both seeking rents of £117 per
sqm. However, the asking rents for grade A properties are noticeably higher in CMK with
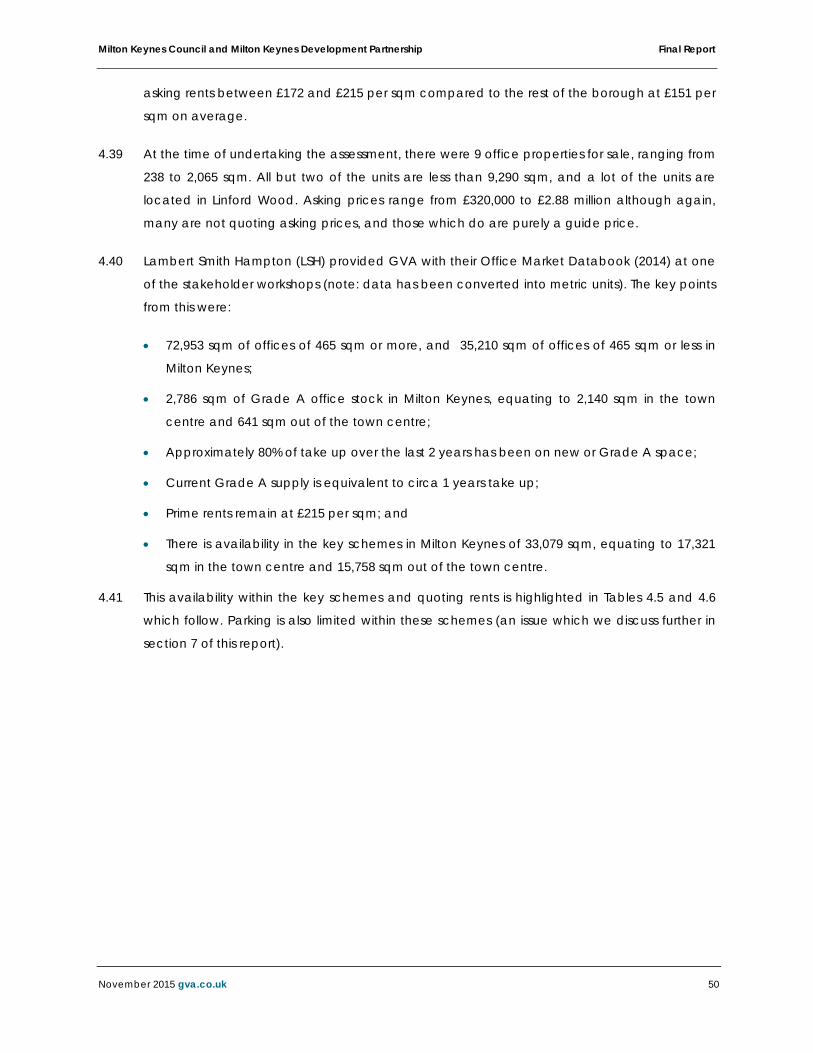
Milton Keynes Council and Milton Keynes Development Partnership Final Report
November 2015 gva.co.uk 50
asking rents between £172 and £215 per sqm compared to the rest of the borough at £151 per
sqm on average.
At the time of undertaking the assessment, there were 9 office properties for sale, ranging from 4.39
238 to 2,065 sqm. All but two of the units are less than 9,290 sqm, and a lot of the units are
located in Linford Wood. Asking prices range from £320,000 to £2.88 million although again,
many are not quoting asking prices, and those which do are purely a guide price.
Lambert Smith Hampton (LSH) provided GVA with their Office Market Databook (2014) at one 4.40
of the stakeholder workshops (note: data has been converted into metric units). The key points
from this were:
72,953 sqm of offices of 465 sqm or more, and 35,210 sqm of offices of 465 sqm or less in
Milton Keynes;
2,786 sqm of Grade A office stock in Milton Keynes, equating to 2,140 sqm in the town
centre and 641 sqm out of the town centre;
Approximately 80% of take up over the last 2 years has been on new or Grade A space;
Current Grade A supply is equivalent to circa 1 years take up;
Prime rents remain at £215 per sqm; and
There is availability in the key schemes in Milton Keynes of 33,079 sqm, equating to 17,321
sqm in the town centre and 15,758 sqm out of the town centre.
This availability within the key schemes and quoting rents is highlighted in Tables 4.5 and 4.6 4.41
which follow. Parking is also limited within these schemes (an issue which we discuss further in
section 7 of this report).
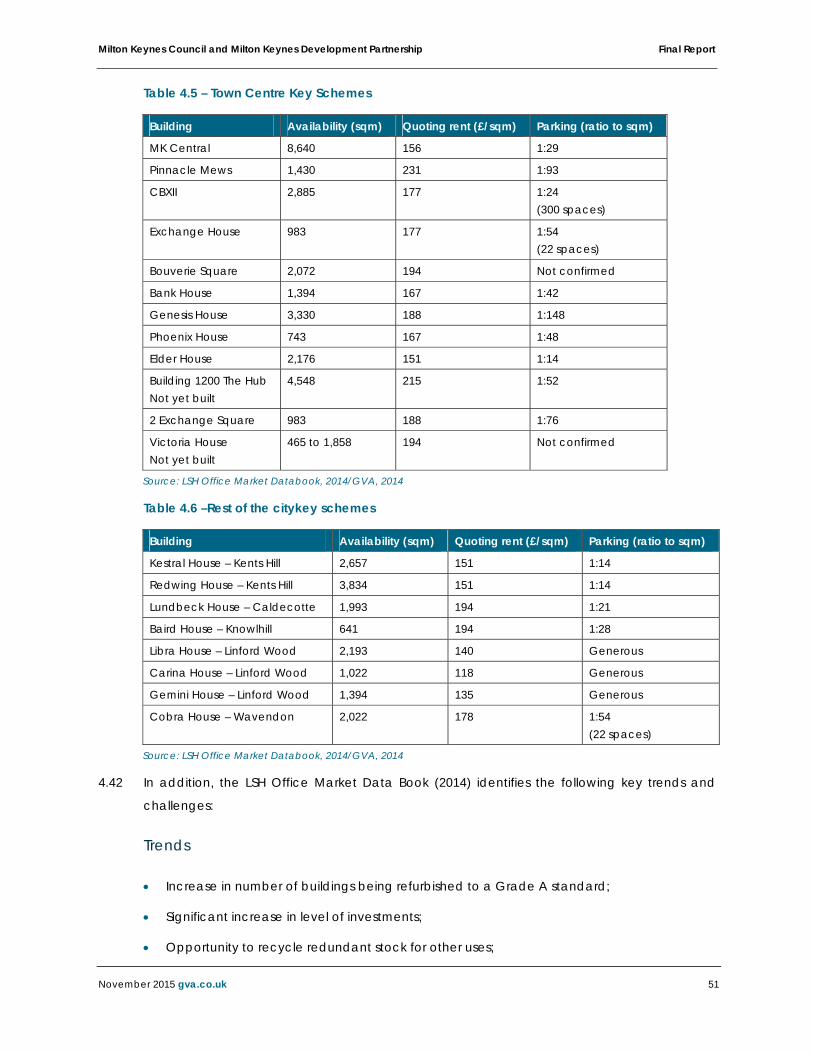
Milton Keynes Council and Milton Keynes Development Partnership Final Report
November 2015 gva.co.uk 51
Table 4.5 – Town Centre Key Schemes
Building Availability (sqm) Quoting rent (£/sqm) Parking (ratio to sqm)
MK Central 8,640 156 1:29
Pinnacle Mews 1,430 231 1:93
CBXII 2,885 177 1:24 (300 spaces)
Exchange House 983 177 1:54 (22 spaces)
Bouverie Square 2,072 194 Not confirmed
Bank House 1,394 167 1:42
Genesis House 3,330 188 1:148
Phoenix House 743 167 1:48
Elder House 2,176 151 1:14
Building 1200 The Hub Not yet built
4,548 215 1:52
2 Exchange Square 983 188 1:76
Victoria House Not yet built
465 to 1,858 194 Not confirmed
Source: LSH Office Market Databook, 2014/GVA, 2014
Table 4.6 –Rest of the citykey schemes
Building Availability (sqm) Quoting rent (£/sqm) Parking (ratio to sqm)
Kestral House – Kents Hill 2,657 151 1:14
Redwing House – Kents Hill 3,834 151 1:14
Lundbeck House – Caldecotte 1,993 194 1:21
Baird House – Knowlhill 641 194 1:28
Libra House – Linford Wood 2,193 140 Generous
Carina House – Linford Wood 1,022 118 Generous
Gemini House – Linford Wood 1,394 135 Generous
Cobra House – Wavendon 2,022 178 1:54 (22 spaces)
Source: LSH Office Market Databook, 2014/GVA, 2014
In addition, the LSH Office Market Data Book (2014) identifies the following key trends and 4.42
challenges:
Trends
Increase in number of buildings being refurbished to a Grade A standard;
Significant increase in level of investments;
Opportunity to recycle redundant stock for other uses;

Milton Keynes Council and Milton Keynes Development Partnership Final Report
November 2015 gva.co.uk 52
Relaxation in planning to ease office to residential conversion; and
Incentives have now stabilised with signs of tightening on some prime space.
Challenges
Lack of development finance, limiting new stock;
Economic growth in the service sector;
Ability to attract inward investors;
Not capitalising on connections to the wider UK and global markets; and
Milton Keynes will hit a critical tipping point in the supply/demand balance in 2015/2016.
The Bidwell’s Business Space Databook (2014) also demonstrated activity in the Milton Keynes 4.43
office market. Although activity slowed in the M1 South office market in the second half of the
2013, there was strong performance of the Milton Keynes market, which saw a take up of over
35,452 sqm of floorspace.
Almost 80% of take up has been on new or grade A space over the past two years. The most 4.44
recent examples of this have been at the Pinnacle, where Transport Systems Catapult took
3,437 sqm, with a further 2,248 sqm in the same scheme going under offer after the year end.
The Pinnacle is now fully let, and, with a lack of new build stock on the market, occupiers are
looking at design-and build options in order to satisfy requirements. The levels of demand in
the City have risen to 130,063 sqm, their highest in ten years.
Past Industrial Market
Lettings
Desk top research utilising the Focus database demonstrated that over a five year timeframe 4.45
(from July 2009 – June 2014) 411 industrial letting’s deals were completed in the Milton Keynes
borough, totalling approximately 501,672 sqm. This equated to an average take up per year
of circa 100,334sqm.
Table 4.7 below summarises the past five year’s industrial lettings activity in the borough. 4.46
Milton Keynes Council and Milton Keynes Development Partnership Final Report
November 2015 gva.co.uk 53
Table 4.7 – Industrial lettings summary table
Source: Focus, 2014
Table 4.7 shows that the average number of days for leasehold industrial properties to be on 4.47
the market was 658, although the range within this was large, with properties on the market for
as little as 3 days, and others up to 2,928 days. This will largely be driven by the quality of the
available stock. Typically, those properties which were identified as being secondary stock
were on the market for 360 days, whereas those which were identified as being new or
refurbished were on the market for 132 days.
The average rent achieved in the last five years was £86 per sqm, although it is difficult to 4.48
draw specific conclusions, as the values achieved will depend upon the size, specification
and location of the accommodation. The quality of the industrial estate and surrounding
occupiers are also likely to affect the values. In addition, it should be noted that the average
values for 2009 (pre-recession) are substantially higher than for the four following years
(economic downturn and subsequent recession), which has had the effect of increasing the
overall average. Further, many of the properties did not disclose the achieved rent, so the
averages have only been formulated using the information that was available.
The average size of the units let over the five year period was 1,181 sqm, which indicates a 4.49
stronger demand for smaller unit sizes. However, as can be seen from the range of the size of
units for each year, there has been a big difference, which will have the effect of skewing the
Number of lettings
Average days on market
Range of size of units (sqm)
Average unit size (sqm)
Range of rents achieved (£ per sqm)
Average rent achieved (£ per sqm)
2009 (part)
24 565 15-2,647 796 22-823 137
2010 69
533 51-8,176 711 26-151 58
2011 108
613 51-29,592 1,153 16-108 54
2012 83
724 67-27,587 1,341 32-215 62
2013 96
528 51-5,604 837 27-91 55
2014 (part)
31 327 45-14,118 1,068 31-101 62
Totals
411 3,290 5,905
Overall Average
82 658 1,181 86
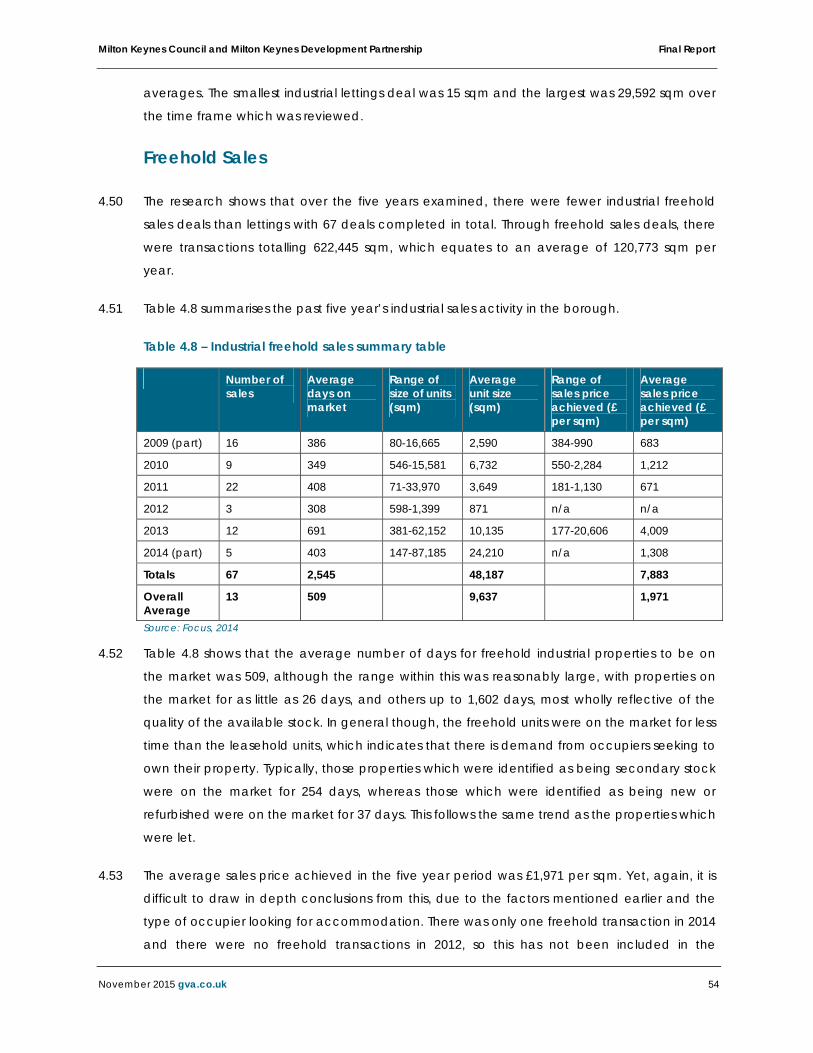
Milton Keynes Council and Milton Keynes Development Partnership Final Report
November 2015 gva.co.uk 54
averages. The smallest industrial lettings deal was 15 sqm and the largest was 29,592 sqm over
the time frame which was reviewed.
Freehold Sales
The research shows that over the five years examined, there were fewer industrial freehold 4.50
sales deals than lettings with 67 deals completed in total. Through freehold sales deals, there
were transactions totalling 622,445 sqm, which equates to an average of 120,773 sqm per
year.
Table 4.8 summarises the past five year’s industrial sales activity in the borough. 4.51
Table 4.8 – Industrial freehold sales summary table
Number of sales
Average days on market
Range of size of units (sqm)
Average unit size (sqm)
Range of sales price achieved (£ per sqm)
Average sales price achieved (£ per sqm)
2009 (part) 16 386 80-16,665 2,590 384-990 683
2010 9 349 546-15,581 6,732 550-2,284 1,212
2011 22 408 71-33,970 3,649 181-1,130 671
2012 3 308 598-1,399 871 n/a n/a
2013 12 691 381-62,152 10,135 177-20,606 4,009
2014 (part) 5 403 147-87,185 24,210 n/a 1,308
Totals 67 2,545 48,187 7,883
Overall Average
13 509 9,637 1,971
Source: Focus, 2014
Table 4.8 shows that the average number of days for freehold industrial properties to be on 4.52
the market was 509, although the range within this was reasonably large, with properties on
the market for as little as 26 days, and others up to 1,602 days, most wholly reflective of the
quality of the available stock. In general though, the freehold units were on the market for less
time than the leasehold units, which indicates that there is demand from occupiers seeking to
own their property. Typically, those properties which were identified as being secondary stock
were on the market for 254 days, whereas those which were identified as being new or
refurbished were on the market for 37 days. This follows the same trend as the properties which
were let.
The average sales price achieved in the five year period was £1,971 per sqm. Yet, again, it is 4.53
difficult to draw in depth conclusions from this, due to the factors mentioned earlier and the
type of occupier looking for accommodation. There was only one freehold transaction in 2014
and there were no freehold transactions in 2012, so this has not been included in the
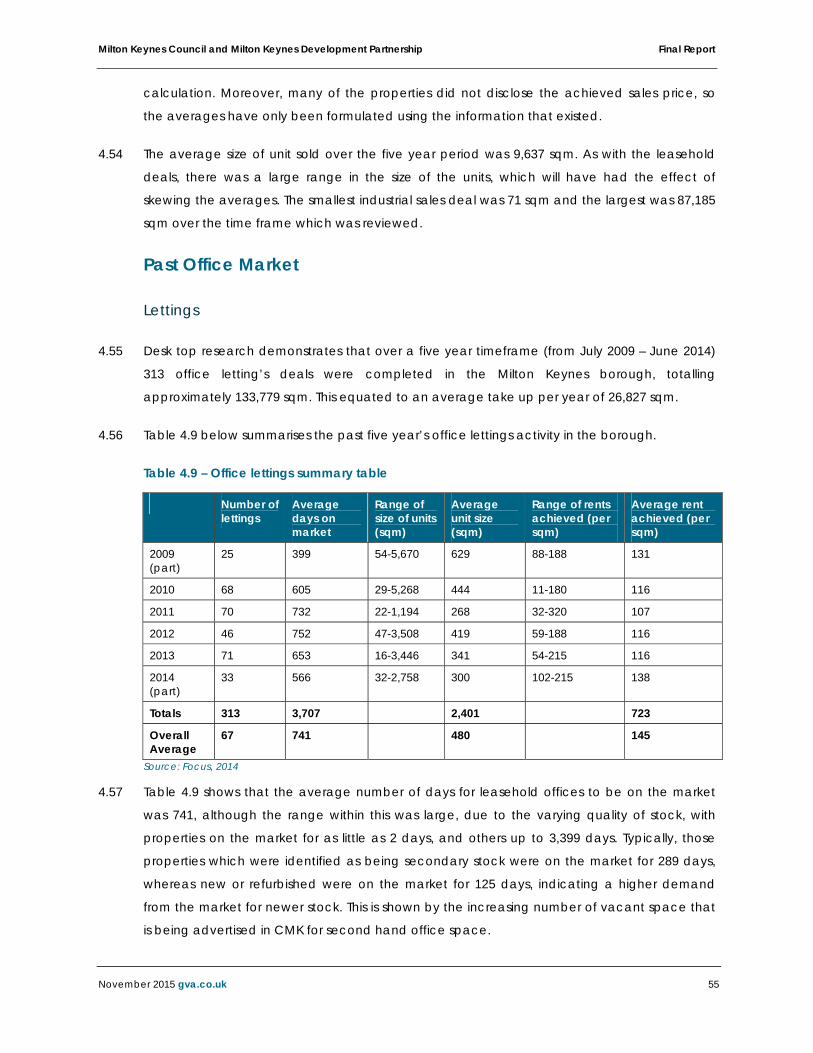
Milton Keynes Council and Milton Keynes Development Partnership Final Report
November 2015 gva.co.uk 55
calculation. Moreover, many of the properties did not disclose the achieved sales price, so
the averages have only been formulated using the information that existed.
The average size of unit sold over the five year period was 9,637 sqm. As with the leasehold 4.54
deals, there was a large range in the size of the units, which will have had the effect of
skewing the averages. The smallest industrial sales deal was 71 sqm and the largest was 87,185
sqm over the time frame which was reviewed.
Past Office Market
Lettings
Desk top research demonstrates that over a five year timeframe (from July 2009 – June 2014) 4.55
313 office letting’s deals were completed in the Milton Keynes borough, totalling
approximately 133,779 sqm. This equated to an average take up per year of 26,827 sqm.
Table 4.9 below summarises the past five year’s office lettings activity in the borough. 4.56
Table 4.9 – Office lettings summary table
Number of lettings
Average days on market
Range of size of units (sqm)
Average unit size (sqm)
Range of rents achieved (per sqm)
Average rent achieved (per sqm)
2009 (part)
25 399 54-5,670 629 88-188 131
2010 68 605 29-5,268 444 11-180 116
2011 70 732 22-1,194 268 32-320 107
2012 46 752 47-3,508 419 59-188 116
2013 71 653 16-3,446 341 54-215 116
2014 (part)
33 566 32-2,758 300 102-215 138
Totals 313 3,707 2,401 723
Overall Average
67 741 480 145
Source: Focus, 2014
Table 4.9 shows that the average number of days for leasehold offices to be on the market 4.57
was 741, although the range within this was large, due to the varying quality of stock, with
properties on the market for as little as 2 days, and others up to 3,399 days. Typically, those
properties which were identified as being secondary stock were on the market for 289 days,
whereas new or refurbished were on the market for 125 days, indicating a higher demand
from the market for newer stock. This is shown by the increasing number of vacant space that
is being advertised in CMK for second hand office space.
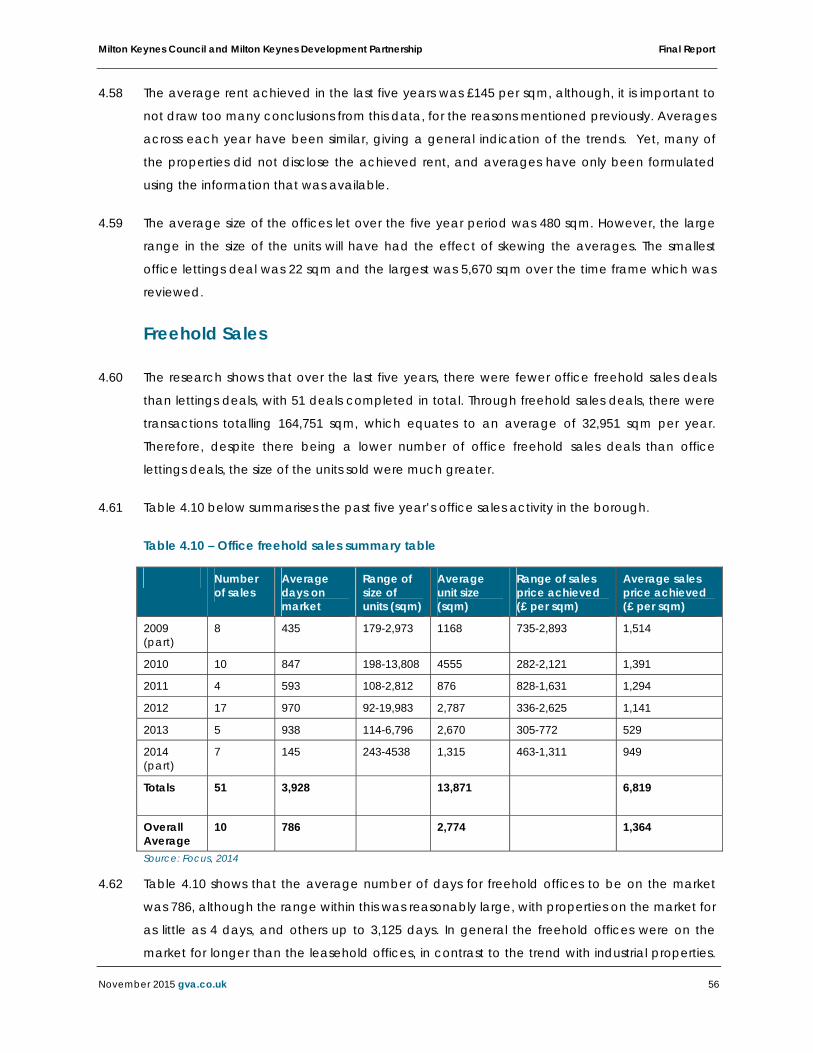
Milton Keynes Council and Milton Keynes Development Partnership Final Report
November 2015 gva.co.uk 56
The average rent achieved in the last five years was £145 per sqm, although, it is important to 4.58
not draw too many conclusions from this data, for the reasons mentioned previously. Averages
across each year have been similar, giving a general indication of the trends. Yet, many of
the properties did not disclose the achieved rent, and averages have only been formulated
using the information that was available.
The average size of the offices let over the five year period was 480 sqm. However, the large 4.59
range in the size of the units will have had the effect of skewing the averages. The smallest
office lettings deal was 22 sqm and the largest was 5,670 sqm over the time frame which was
reviewed.
Freehold Sales
The research shows that over the last five years, there were fewer office freehold sales deals 4.60
than lettings deals, with 51 deals completed in total. Through freehold sales deals, there were
transactions totalling 164,751 sqm, which equates to an average of 32,951 sqm per year.
Therefore, despite there being a lower number of office freehold sales deals than office
lettings deals, the size of the units sold were much greater.
Table 4.10 below summarises the past five year’s office sales activity in the borough. 4.61
Table 4.10 – Office freehold sales summary table
Number of sales
Average days on market
Range of size of units (sqm)
Average unit size (sqm)
Range of sales price achieved (£ per sqm)
Average sales price achieved (£ per sqm)
2009 (part)
8 435 179-2,973 1168 735-2,893 1,514
2010 10 847 198-13,808 4555 282-2,121 1,391
2011 4 593 108-2,812 876 828-1,631 1,294
2012 17 970 92-19,983 2,787 336-2,625 1,141
2013 5 938 114-6,796 2,670 305-772 529
2014 (part)
7 145 243-4538 1,315 463-1,311 949
Totals
51 3,928 13,871 6,819
Overall Average
10 786 2,774 1,364
Source: Focus, 2014
Table 4.10 shows that the average number of days for freehold offices to be on the market 4.62
was 786, although the range within this was reasonably large, with properties on the market for
as little as 4 days, and others up to 3,125 days. In general the freehold offices were on the
market for longer than the leasehold offices, in contrast to the trend with industrial properties.
Milton Keynes Council and Milton Keynes Development Partnership Final Report
November 2015 gva.co.uk 57
Typically, the offices which were identified as being secondary stock were on the market for
293 days, whereas those which were identified as being new or refurbished were on the
market for 34 days. This follows the same trend as the offices which were let.
The average sales price achieved for offices in the five year period examined was £1,364 per 4.63
sqm. Yet, again, it is important to not draw broad brush conclusions from this data. Again, as
many of the properties did not disclose the achieved sales price, the averages have only
been formulated using the information available.
The average size of the office units sold over the five year period was 13,871 sqm. As with the 4.64
leasehold deals, there was a large range in the size of the units, which will have skewed
averages. The smallest office sales deal was 92 sqm and the largest was 19,983 sqm over the
time frame reviewed.
Investment Market Summary
The most recent GVA economic and property market review confirms that the annual value 4.65
of commercial property investment transactions reached nearly £69 billion over the 12 months
to March 2015, according to Property Data. This is higher than the previous peak in 2007 when
average capital values were a third higher than today. Quarter 1 2015 was the second highest
first quarter on record, at over £17 billion, although some way below the record total of £21
billion in Quarter 4 2014.
Quarter 1 saw the highest ever proportion of purchases by overseas investors at 51%, 4.66
compared with an average of 45% over the last two years. In central London 66% of
purchases in Quarter 1 were by overseas buyers. US investors have been particularly active,
purchasing UK commercial property worth £3.6 billion in Quarter 1, accounting for 40% of all
overseas investment, and more than 20% of the total UK figure.
The seemingly insatiable demand for UK property from both domestic and overseas buyers 4.67
has continued to apply downward pressure to property yields. In central London, Quarter 1
saw prime office yields come in by 25 basis points in five out of the ten central London sub-
areas we monitor, and yield levels are now close to where they were at the peak of the last
cycle.
However, it is outside of central London where the scope for yield compression is greatest. The 4.68
average equivalent yield for regional offices has moved downwards by circa 25 basis points in
the first three months of 2015, and by 250 basis points since peaking in mid-2009 (IPD Monthly
Index). Despite this, the gap with central London remains historically wide – indeed, it is still
more than 100 basis points wider than averages over the last 20-30 years.
Milton Keynes Council and Milton Keynes Development Partnership Final Report
November 2015 gva.co.uk 58
Annual total returns on the IPD Monthly Index peaked in October 2014 at 20.1%, and have 4.69
fallen month on month to 18.3% as of March 2015. Capital value growth has fallen
correspondingly from 13% to 11.6% over the same period. Looking at more recent
performance over the three months to March 2015, the total return was 3%. This equates to
12.6% on an annualised basis, well below the 18.3% year-on-year figure.
The outlook for the next 12 months remains positive and we see no reason for the international 4.70
inflow of capital into the UK market to slow. The prospect of a referendum on the UK’s
membership of the EU over the next two years could increase the perceived level of risk of
investing in the UK, although this is unlikely to have any marked impact during 2015.
There is certainly the potential for further downward yield movement, particularly outside 4.71
London. 10-year gilt yields remain close to historic lows at below 2% (as of early May 2015), so
the gap with property yields remains wide, and all property capital values are still 25% below
their 2007 peak (and more like 40% below in real terms). However, with yield compression
easing, performance will be increasingly driven by rental growth fundamentals.
We forecast a total return from UK commercial property in 2015 of nearly 11%, suggesting a 4.72
continued deceleration throughout the rest of the year. This still represents a very strong level
of performance, especially bearing in mind the current ‘noflation’ environment, and should
prove to be a very favourable performance in comparison with equities and gilts.
B Class Floorspace
Changes in the amount of employment floorspace
Table 4.11 illustrates changes in the amount of employment floorspace for B1, B2 and B8 use 4.73
classes in the Borough of Milton Keynes from 2004/05 – 2010/11 in sqm. This information is
provided in the Milton Keynes Employment Technical Paper, which was produced in 2012.
This shows that overall floorspace gains were over 608,000 sqm and overall floorspace losses 4.74
were over 270,000 sqm. Growth in employment floorspace over this time was dominated by
warehousing or B8 storage and distribution uses and B1a office development. Between them
these two uses accounted for over 96% of all increases in ‘B’ use class net floorspace over this
period.
The largest net increase in floorspace by use class was for B8 storage and distribution uses at 4.75
over 195,000 sqm (57.8% of all net floorspace, about 32,552 sqm per annum) showing the high
demand for this type of floorspace in Milton Keynes, for example in locations similar to Magna
Milton Keynes Council and Milton Keynes Development Partnership Final Report
November 2015 gva.co.uk 59
Park. This was followed by B1a Offices at around 129,900 sqm (38.4% of all net floorspace,
around 21,651 sqm per annum).
The Employment Technical Paper estimated that if the increase in the amount of office type 4.76
floorspace B1a uses was 21,651 sqm per annum, then the number of jobs likely to be
generated by this development, if fully occupied, would be 1,443 jobs per annum.
By contrast the increase in warehousing floorspace of 32,552 sqm per annum using job 4.77
densities of 75 sqm per full time employee is estimated to generate around 434 jobs per
annum. Thus the total number of jobs generated by the development of office and
warehousing floorspace in the Borough is around 1,877 jobs per annum.
The figures in the Employment Technical Paper also illustrate a considerable amount of 4.78
demolition and change was happening during 2004/05 – 2010/11. In the case of offices an
average of around 11,000 sqm of floorspace was lost per annum and in the case of
warehouses an average of around 16,738 sqm of floorspace was lost per annum.
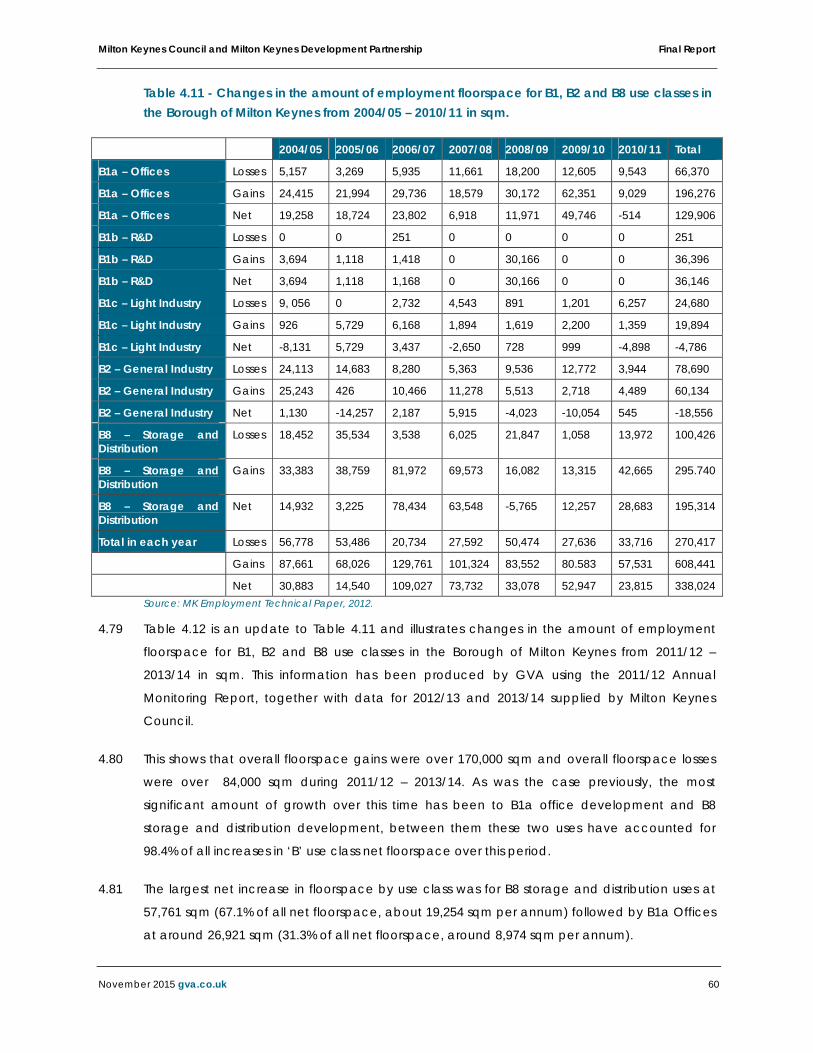
Milton Keynes Council and Milton Keynes Development Partnership Final Report
November 2015 gva.co.uk 60
Table 4.11 - Changes in the amount of employment floorspace for B1, B2 and B8 use classes in the Borough of Milton Keynes from 2004/05 – 2010/11 in sqm.
Source: MK Employment Technical Paper, 2012.
Table 4.12 is an update to Table 4.11 and illustrates changes in the amount of employment 4.79
floorspace for B1, B2 and B8 use classes in the Borough of Milton Keynes from 2011/12 –
2013/14 in sqm. This information has been produced by GVA using the 2011/12 Annual
Monitoring Report, together with data for 2012/13 and 2013/14 supplied by Milton Keynes
Council.
This shows that overall floorspace gains were over 170,000 sqm and overall floorspace losses 4.80
were over 84,000 sqm during 2011/12 – 2013/14. As was the case previously, the most
significant amount of growth over this time has been to B1a office development and B8
storage and distribution development, between them these two uses have accounted for
98.4% of all increases in ‘B’ use class net floorspace over this period.
The largest net increase in floorspace by use class was for B8 storage and distribution uses at 4.81
57,761 sqm (67.1% of all net floorspace, about 19,254 sqm per annum) followed by B1a Offices
at around 26,921 sqm (31.3% of all net floorspace, around 8,974 sqm per annum).
2004/05 2005/06 2006/07 2007/08 2008/09 2009/10 2010/11 Total
B1a – Offices Losses 5,157 3,269 5,935 11,661 18,200 12,605 9,543 66,370
B1a – Offices Gains 24,415 21,994 29,736 18,579 30,172 62,351 9,029 196,276
B1a – Offices Net 19,258 18,724 23,802 6,918 11,971 49,746 -514 129,906
B1b – R&D Losses 0 0 251 0 0 0 0 251
B1b – R&D Gains 3,694 1,118 1,418 0 30,166 0 0 36,396
B1b – R&D Net 3,694 1,118 1,168 0 30,166 0 0 36,146
B1c – Light Industry Losses 9, 056 0 2,732 4,543 891 1,201 6,257 24,680
B1c – Light Industry Gains 926 5,729 6,168 1,894 1,619 2,200 1,359 19,894
B1c – Light Industry Net -8,131 5,729 3,437 -2,650 728 999 -4,898 -4,786
B2 – General Industry Losses 24,113 14,683 8,280 5,363 9,536 12,772 3,944 78,690
B2 – General Industry Gains 25,243 426 10,466 11,278 5,513 2,718 4,489 60,134
B2 – General Industry Net 1,130 -14,257 2,187 5,915 -4,023 -10,054 545 -18,556
B8 – Storage and Distribution
Losses 18,452 35,534 3,538 6,025 21,847 1,058 13,972 100,426
B8 – Storage and Distribution
Gains 33,383 38,759 81,972 69,573 16,082 13,315 42,665 295.740
B8 – Storage and Distribution
Net 14,932 3,225 78,434 63,548 -5,765 12,257 28,683 195,314
Total in each year Losses 56,778 53,486 20,734 27,592 50,474 27,636 33,716 270,417
Gains 87,661 68,026 129,761 101,324 83,552 80.583 57,531 608,441
Net 30,883 14,540 109,027 73,732 33,078 52,947 23,815 338,024
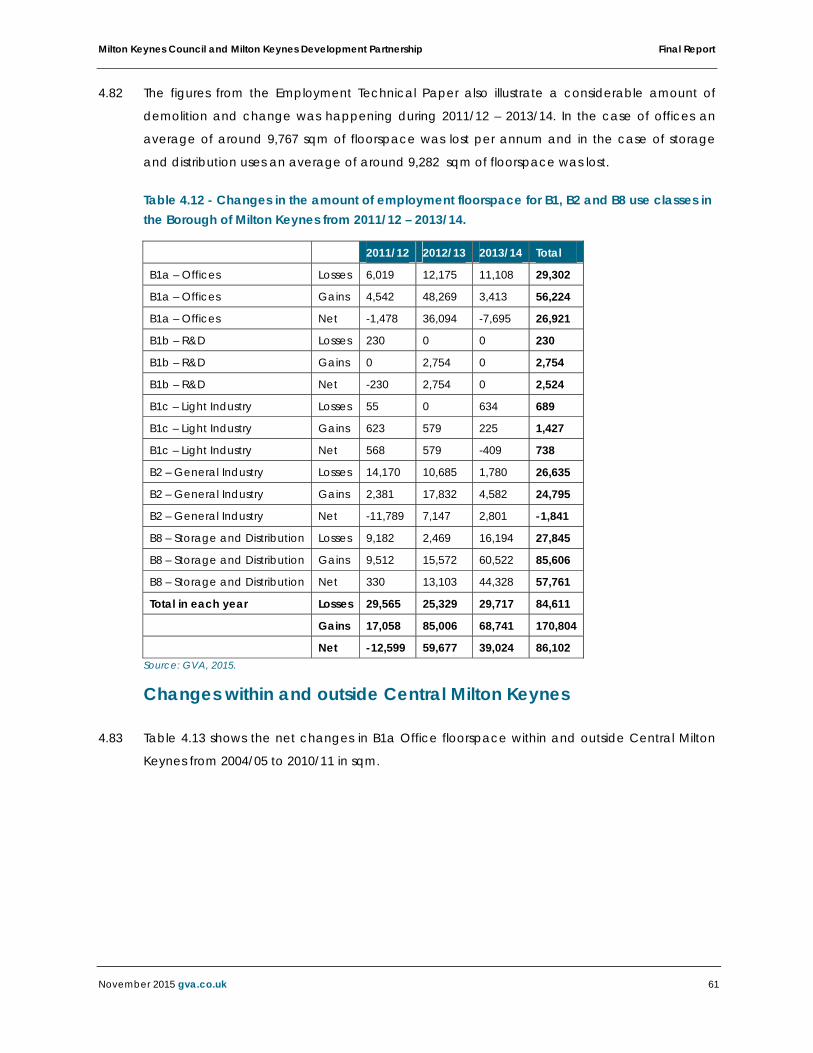
Milton Keynes Council and Milton Keynes Development Partnership Final Report
November 2015 gva.co.uk 61
The figures from the Employment Technical Paper also illustrate a considerable amount of 4.82
demolition and change was happening during 2011/12 – 2013/14. In the case of offices an
average of around 9,767 sqm of floorspace was lost per annum and in the case of storage
and distribution uses an average of around 9,282 sqm of floorspace was lost.
Table 4.12 - Changes in the amount of employment floorspace for B1, B2 and B8 use classes in the Borough of Milton Keynes from 2011/12 – 2013/14.
2011/12 2012/13 2013/14 Total
B1a – Offices Losses 6,019 12,175 11,108 29,302
B1a – Offices Gains 4,542 48,269 3,413 56,224
B1a – Offices Net -1,478 36,094 -7,695 26,921
B1b – R&D Losses 230 0 0 230
B1b – R&D Gains 0 2,754 0 2,754
B1b – R&D Net -230 2,754 0 2,524
B1c – Light Industry Losses 55 0 634 689
B1c – Light Industry Gains 623 579 225 1,427
B1c – Light Industry Net 568 579 -409 738
B2 – General Industry Losses 14,170 10,685 1,780 26,635
B2 – General Industry Gains 2,381 17,832 4,582 24,795
B2 – General Industry Net -11,789 7,147 2,801 -1,841
B8 – Storage and Distribution Losses 9,182 2,469 16,194 27,845
B8 – Storage and Distribution Gains 9,512 15,572 60,522 85,606
B8 – Storage and Distribution Net 330 13,103 44,328 57,761
Total in each year Losses 29,565 25,329 29,717 84,611
Gains 17,058 85,006 68,741 170,804
Net -12,599 59,677 39,024 86,102 Source: GVA, 2015.
Changes within and outside Central Milton Keynes
Table 4.13 shows the net changes in B1a Office floorspace within and outside Central Milton 4.83
Keynes from 2004/05 to 2010/11 in sqm.
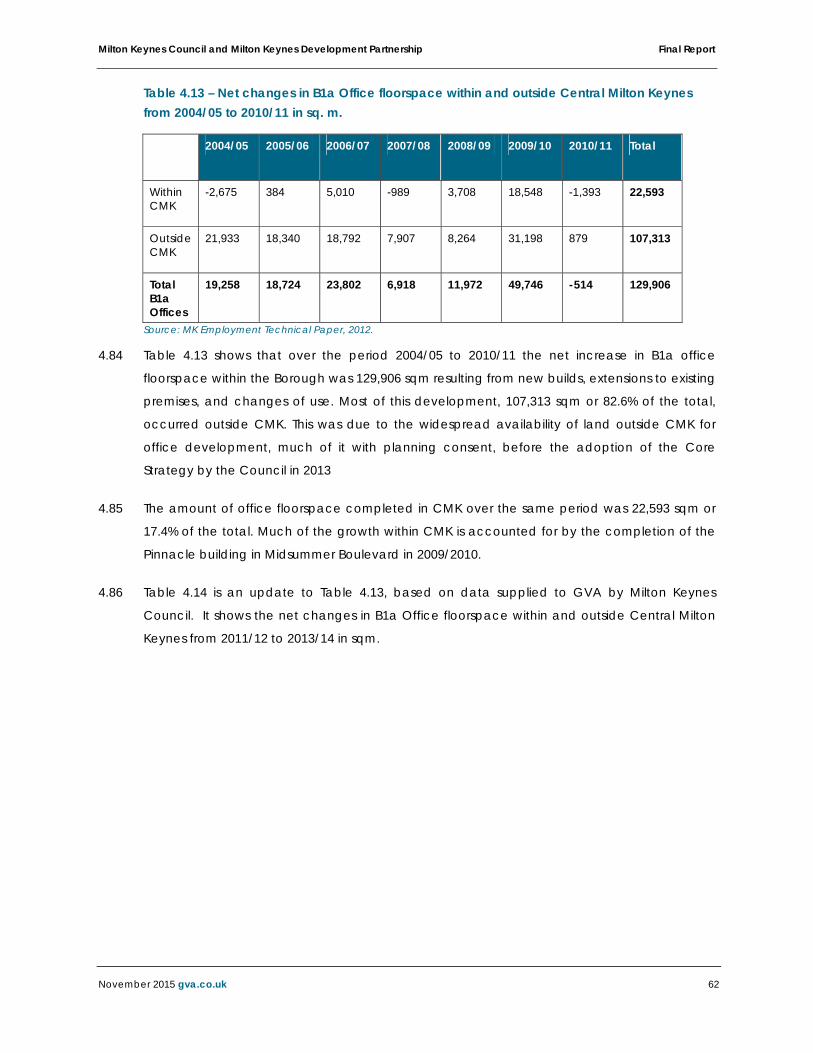
Milton Keynes Council and Milton Keynes Development Partnership Final Report
November 2015 gva.co.uk 62
Table 4.13 – Net changes in B1a Office floorspace within and outside Central Milton Keynes from 2004/05 to 2010/11 in sq. m.
2004/05 2005/06 2006/07 2007/08 2008/09 2009/10 2010/11 Total
Within CMK
-2,675 384 5,010 -989 3,708 18,548 -1,393 22,593
Outside CMK
21,933 18,340 18,792 7,907 8,264 31,198 879 107,313
Total B1a Offices
19,258 18,724 23,802 6,918 11,972 49,746 -514 129,906
Source: MK Employment Technical Paper, 2012.
Table 4.13 shows that over the period 2004/05 to 2010/11 the net increase in B1a office 4.84
floorspace within the Borough was 129,906 sqm resulting from new builds, extensions to existing
premises, and changes of use. Most of this development, 107,313 sqm or 82.6% of the total,
occurred outside CMK. This was due to the widespread availability of land outside CMK for
office development, much of it with planning consent, before the adoption of the Core
Strategy by the Council in 2013
The amount of office floorspace completed in CMK over the same period was 22,593 sqm or 4.85
17.4% of the total. Much of the growth within CMK is accounted for by the completion of the
Pinnacle building in Midsummer Boulevard in 2009/2010.
Table 4.14 is an update to Table 4.13, based on data supplied to GVA by Milton Keynes 4.86
Council. It shows the net changes in B1a Office floorspace within and outside Central Milton
Keynes from 2011/12 to 2013/14 in sqm.
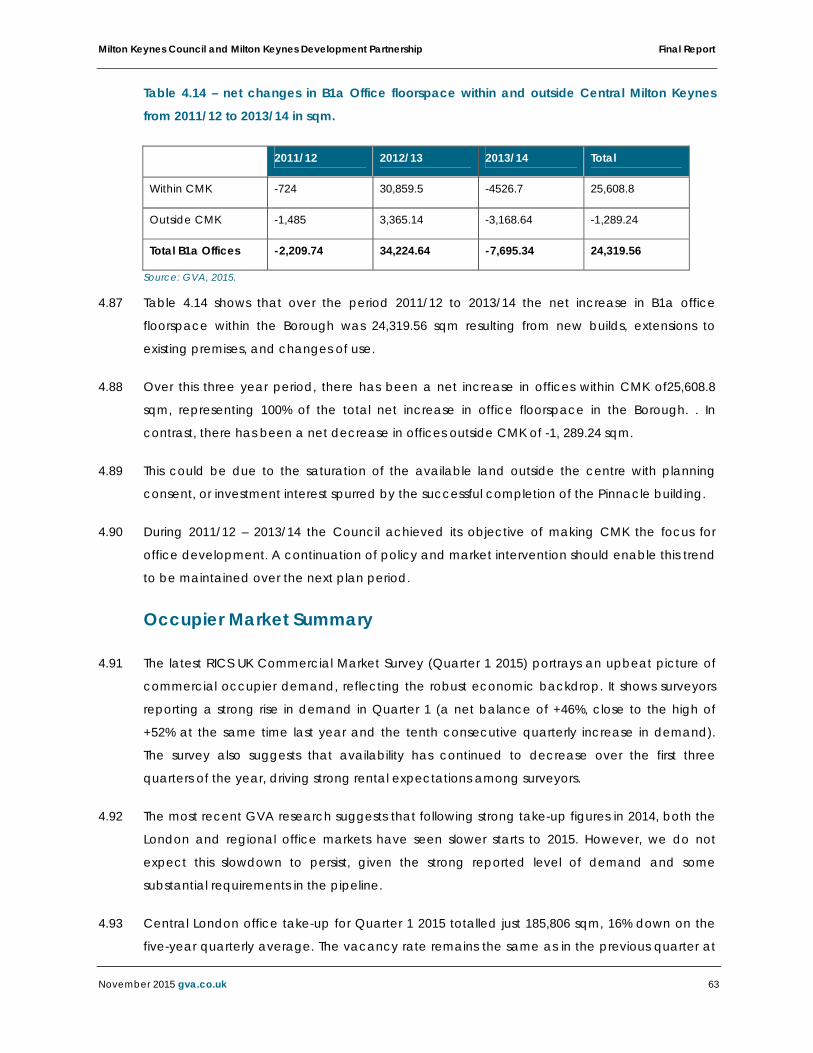
Milton Keynes Council and Milton Keynes Development Partnership Final Report
November 2015 gva.co.uk 63
Table 4.14 – net changes in B1a Office floorspace within and outside Central Milton Keynes
from 2011/12 to 2013/14 in sqm.
2011/12 2012/13 2013/14 Total
Within CMK -724 30,859.5 -4526.7 25,608.8
Outside CMK -1,485 3,365.14 -3,168.64 -1,289.24
Total B1a Offices -2,209.74 34,224.64 -7,695.34 24,319.56
Source: GVA, 2015.
Table 4.14 shows that over the period 2011/12 to 2013/14 the net increase in B1a office 4.87
floorspace within the Borough was 24,319.56 sqm resulting from new builds, extensions to
existing premises, and changes of use.
Over this three year period, there has been a net increase in offices within CMK of25,608.8 4.88
sqm, representing 100% of the total net increase in office floorspace in the Borough. . In
contrast, there has been a net decrease in offices outside CMK of -1, 289.24 sqm.
This could be due to the saturation of the available land outside the centre with planning 4.89
consent, or investment interest spurred by the successful completion of the Pinnacle building.
During 2011/12 – 2013/14 the Council achieved its objective of making CMK the focus for 4.90
office development. A continuation of policy and market intervention should enable this trend
to be maintained over the next plan period.
Occupier Market Summary
The latest RICS UK Commercial Market Survey (Quarter 1 2015) portrays an upbeat picture of 4.91
commercial occupier demand, reflecting the robust economic backdrop. It shows surveyors
reporting a strong rise in demand in Quarter 1 (a net balance of +46%, close to the high of
+52% at the same time last year and the tenth consecutive quarterly increase in demand).
The survey also suggests that availability has continued to decrease over the first three
quarters of the year, driving strong rental expectations among surveyors.
The most recent GVA research suggests that following strong take-up figures in 2014, both the 4.92
London and regional office markets have seen slower starts to 2015. However, we do not
expect this slowdown to persist, given the strong reported level of demand and some
substantial requirements in the pipeline.
Central London office take-up for Quarter 1 2015 totalled just 185,806 sqm, 16% down on the 4.93
five-year quarterly average. The vacancy rate remains the same as in the previous quarter at
Milton Keynes Council and Milton Keynes Development Partnership Final Report
November 2015 gva.co.uk 64
5.3%, but has fallen from 5.7% over the last year. Strong central London rental growth has
continued, with average rental values rising by 11.2% over the year to Quarter 1, according to
the IPD Quarterly Index. We expect further strong gains during 2015. Take-up across the ‘Big
Nine’ regional office markets amounted to 183,484 sqm in Quarter 1, 5% above the five year
quarterly average.
Average rental growth for offices outside London and the South East has gathered pace over 4.94
the past three months, with the IPD Quarterly Index recording 1.7% growth over the year to
Quarter 1 2015, compared to 1.2% to the previous quarter. We forecast 2% growth this year,
followed by 3% p.a. over the following three years.
Improvements in consumer spending power and a slowdown in retailer failures are beginning 4.95
to have a positive impact on high street retail vacancy rates. Vacancy has fallen to 13% at
March 2015, according to the Local Data Company, the lowest rate since 2010 and down
from 13.2% in December. Central London retail rental growth was 9.7% over the year to
Quarter 1 (IPD Quarterly Index) following strong growth at the end of last year. This has begun
to slow but we still expect growth of 5.4% this year. This is in marked contrast to the regional
markets. Average high street retail rental values outside London and the South East are still
falling, at -1.2% over the year to Quarter 1 and by -0.3% during Quarter 1, but we expect
growth to turn positive during the year.
Over the past six months the industrial sector has seen diminishing supply, improving demand 4.96
and a significant uplift in speculative development across the country. Take-up of modern
distribution units over 9,290 sqm amounted to 2,099,609 sqm during 2014, 11% above the five
year average. This was the highest level since 2010 and in line with pre-recessionary levels. The
last year has seen a step change in the decline of available good quality units. There is
currently less than a year’s supply of modern distribution units over 9,290 sqm across the
country based on past take-up rates. With the shortage of prime supply there is increased
interest in secondary stock in good locations. Rental growth in the industrial sector over the
year to Quarter 1 stands at 3% (IPD Quarterly Index), the highest it has been since 2001. We
forecast that rental growth will average around 3-4% p.a. for the next three years.
Milton Keynes Council and Milton Keynes Development Partnership Final Report
November 2015 gva.co.uk 65
Summary
In terms of the leasehold accommodation which is currently available, there is more in the 4.97
office sector (222 reported properties) than the industrial sector (122 reported properties).
There is no difference in asking rents between CMK and the rest of the borough for secondary 4.98
office properties, both with asking rents of circa £117 per sqm. Yet the asking rents for primary
properties are noticeably higher in CMK at £172 to £215 per sqm compared to the rest of the
borough at £151 per sqm on average.
There is significantly less freehold accommodation currently on the market across both sectors. 4.99
There are more freehold properties available in the industrial sector (19 reported), compared
to the office sector (9 reported).
Industrial accommodation saw total take up of circa 501,672 sqm for leasehold properties. This 4.100
reflects an average take up of circa 100,334 sqm a year at an average rent of £86 per sqm a
year.
Office accommodation saw total take up of 130,000 sqm for leasehold properties. This reflects 4.101
an average take up of circa 26,827 sqm a year at an average rent of £145 per sqm a year.
There have been a smaller number of freehold transactions across both sectors. The average 4.102
unit size sold in freehold transaction is greater than that in a leasehold deal, which suggests
that there is owner occupier demand for large units.
During 2011/12 – 2013/14, overall floorspace gains were in excess of 170,000 sqm and overall 4.103
floorspace losses were over 84,000 sqm. The most significant amount of growth was in B1a
office development and B8 storage and distribution development, between them these two
uses accounted for 98.4% of all increases in ‘B’ use class net floorspace.
Over the period 2011/12 – 2013/14, there has been a net increase in offices within CMK of 4.104
25,608.8 sqm, representing 100% of the total net increase in office floorspace in the Borough. In
contrast, there has been a net decrease in offices outside CMK of -1, 289.24 sqm.
During 2011/12 – 2013/14 the Council achieved its objective of making CMK the focus for 4.105
office development. A continuation of policy and market intervention should enable this trend
to be maintained over the next plan period.

Milton Keynes Council and Milton Keynes Development Partnership Final Report
November 2015 gva.co.uk 66
5. The Functional Economic Area
Despite a need to plan for the future at the Milton Keynes level, economic activity is not 5.1
restricted to administrative boundaries. As such it is important to understand how the activity
within Milton Keynes relates to and influences that within a wider geography. Most often this
geography encapsulates those areas that border the economy in question, however a city
the scale of Milton Keynes has a much wider ‘reach’.
Defining the ‘functional economic area’ is important to understand how growth and 5.2
development, labour flows and infrastructure across a larger area will influence Milton Keynes’
economic potential. As recognised by guidance published by DCLG in 2010 there is no
centrally agreed mechanism or set of metrics for identifying and defining the relevant area.
The guidance suggests that functional economic areas need to be directly linked to local 5.3
characteristics and based on a range of locally relevant information and indicators. The
guidance focuses on the labour flows and travel to work patterns as well as housing market
and business supply chain dynamics.
Given the focus of this study it is also important to understand and include commercial 5.4
property market dynamics as a reflection of business and occupier preferences and needs.
Understanding these occupier and property investment decisions will be as important to the
future of employment land in the borough as housing market and travel to work patterns.
The Commercial Market
Our analysis and consultation with local property agents has identified that the functional 5.5
property market area within Milton Keynes differs between activity sectors. There are key
differences in the ‘reach’ of the office, industrial and warehouse sectors.
What is clear across all sectors is that the scale of activity within Milton Keynes places it within 5.6
more strategic-scale markets than can be captured within the neighbouring authority
boundaries. In occupier demand terms this means that the area draws businesses from not
only its immediate hinterland but also regional, national and even international markets,
competing with a range of regional scale cities across the UK. We will consider the strengths
and competiveness of Milton Keynes in this light in the second phase of the Study, however at
this juncture it is important to recognise the potential reach to understand how the Milton
Keynes economy functions.
The strategic connections of Milton Keynes directly to the M1 place it at the heart of the 5.7
‘golden triangle’ for large scale logistics activity with north-south connections that provide
Milton Keynes Council and Milton Keynes Development Partnership Final Report
November 2015 gva.co.uk 67
quick and uncongested access to markets in London, the Midlands, Birmingham, East Anglia
and the west. Crucially Milton Keynes is centrally located to act as the fulcrum of connections
to/from the largest commercial ports and the UK’s major centres of manufacturing and
population.
Recent development at Magna Park demonstrates that the scale of demand is that of 5.8
national significance, with major retailers locating their national distribution hubs within the
development. This represents a ‘step up’ from previous activity where units within existing
estates such as the Brinklow Industrial Estate were large but more orientated to meeting
regional scale requirements.
Relatively few locations across the UK offer the nature of connections and scale of 5.9
development provided by Milton Keynes; however it is the M1 link that is key. Other junctions
on the M1 provide significant opportunities and it is our understanding that many operators
consider these to be equally attractive in many instances. Therefore, in distribution terms the
functional economic market area would extend beyond the immediate area and include the
stretch of the M1 between London and Daventry and potentially as far as Rugby.
Looking forward, in terms of development delivery and occupier demand, it is this M1 corridor 5.10
market that Milton Keynes will operate within and compete for investment from. In attracting
more logistics activity (if this is the strategy the Council pursue) Milton Keynes will need to
identify an offer that can be competitive within this market geography rather than just
considering what is provided in neighbouring areas.
The reach and influence of Milton Keynes within the manufacturing sector also extends 5.11
beyond the Council’s administrative boundary. More than any other sector businesses within
manufacturing have client and supplier bases that stretch across the UK and beyond. Key
businesses are major national and international brands and attract a range of related
businesses to the area.
Mapping business supply chains at a localised level is a complex, and often futile, exercise 5.12
and relies heavily on data provided by businesses themselves, which may by its nature be
commercially sensitive. As such it can be resource intensive but add limited value to the
definition of the economic market. We are aware (through desktop research and knowledge
from other projects) that businesses in sectors such as motorsport and transport technologies
have linkages to local locations like Bedford, other south east clusters (such as Cherwell and
Oxford) and places in other parts of the UK including East Anglia, Merseyside, Derbyshire and
the North East. The ability to connect to these places (and London) is critical for the sectors
success in Milton Keynes and will continue to provide a competitive advantage in the future.
Milton Keynes Council and Milton Keynes Development Partnership Final Report
November 2015 gva.co.uk 68
Further the nature of some of the highly specialised and high value activities have a labour 5.13
market draw way beyond the local area. Highly skilled engineers, technology specialists and
technicians are in short supply nationally and command sufficiently high wages to be
relatively ‘footloose’ or able to commute significant distances to work.
Therefore the ‘reach’ of the manufacturing sector is arguably wider than that of logistics, 5.14
potentially stretching across the country. However the core functional market is likely to be
more localised and linked to the particular specialisms and sector specific assets in the area.
Whilst it is appropriate to be mindful of the wider linkages the functional market for
manufacturing is likely to be focussed along the ‘arc’ north of London that connects the
Swindon/Oxford manufacturing hub east across the country, perhaps as far as Cambridge.
Essentially filling the gap between London and Birmingham.
This strategic positioning, lying almost equidistant between the major city economies of 5.15
London and Birmingham and the major innovation and education centres of Cambridge and
Oxford offers an ideal location for national and international businesses. The ability to access
these markets has drawn a range of head and corporate office occupiers into both the city
centre and main business parks.
These range from major professional, business and financial service businesses through to 5.16
strategically important activities such as the new Network Rail HQ. The area is increasingly
attracting a number of technology orientated businesses, particularly linked to software and
transport technology. The introduction of the western section of East-West Rail in 2019 will
create new, direct connections that can further strengthen the regional role Milton Keynes
plays as an office centre.
With increasing pricing issues in London, new supply coming forwards in Birmingham City 5.17
Centre and major growth plans for other regional cities and towns Milton Keynes (and CMK in
particular) will have both increased opportunities and competition for office occupiers. What
is clear though is that the ‘market’ within which CMK operates extends far beyond the local
authority boundary and covers much of the South East.
This greater scale of activity will become increasingly important as new growth and 5.18
infrastructure is delivered, this will allow Milton Keynes to continue to compete both for
occupiers but also labour force. The scale and nature of office based activity dominates the
local area, drawing skilled workers from across the wider sub-region.
The Functional Labour Market
The Functional Economic Area is also defined by the relationship between Milton Keynes’ 5.19
economic activity and the workforce that services it. Workforces are increasingly mobile and

Milton Keynes Council and Milton Keynes Development Partnership Final Report
November 2015 gva.co.uk 69
therefore regardless of the scale of population growth within Milton Keynes the businesses
within it will still draw workers from other areas. Likewise people living in Milton Keynes are likely
to choose to work elsewhere.
Understanding these labour flows is critical to identify the scale of influence economic growth 5.20
in Milton Keynes may have on other locations and, therefore, the interdependency of Milton
Keynes on other places to service growth.
In labour flow terms it is generally accepted that a functional labour market can be 5.21
established by identifying where the majority of residents share both a place of work and
residence. The standard assumption is, therefore, that the functional labour market is
represented by the geography within which 75% of the residents both live and work.
As established within section 2 of this report Milton Keynes is a net importer of labour and 5.22
therefore its economy has a strong relationship with the neighbouring resident communities.
The 2011 Census data estimated a total of 122,475 jobs were provided within Milton Keynes, of
which 65% were taken up by Milton Keynes residents reinforcing the wider geography of the
functional labour market.
Achieving a ‘self-containment’ rate of 75% requires the inclusion of the neighbouring areas of 5.23
Central Bedfordshire, South Northamptonshire and Aylesbury Vale – who together contribute
over 18,500 workers to the Milton Keynes economy.
Whilst this theoretical threshold for a functional labour market is helpful it is somewhat arbitrary 5.24
and does not fully reflect the real impact and influence of the Milton Keynes economy on its
neighbouring areas. For example, the 75% rate would exclude the inclusion of Northampton
and Bedford from the functional area even though they contribute over 8,000 workers to the
Milton Keynes economy.
This issue highlights the unique characteristics and context of Milton Keynes as an economic 5.25
centre, drawing large amounts of labour from a large number of neighbouring areas. Given
this characteristic a ‘standard’ definition of the functional labour market is unlikely to be
locally relevant or reflect Milton Keynes’ true impact on the wider area. We would therefore
suggest that the functional labour market area is defined by a significantly higher threshold
and linked to the scale of labour being imported.
This approach would suggest a strong labour market correlation exists at approximately 85% of 5.26
the total jobs provided within Milton Keynes and capturing locations that contribute more
than 1,500 workers to fill jobs within Milton Keynes(i.e. people living outside the MK area who
work within it). This would include the immediately bordering authorities (in order of labour

Milton Keynes Council and Milton Keynes Development Partnership Final Report
November 2015 gva.co.uk 70
force contribution) of Central Bedfordshire, South Northamptonshire, Aylesbury Vale,
Northampton, Bedford and Luton.
Conclusions
As demonstrated above the functional economic and market area within which Milton 5.27
Keynes operates is not singular, with the reach and relationship between Milton Keynes and
other local authority areas defined by a complex set of business, market and people
dynamics.
In commercial property and business orientation terms the area stretches a considerable 5.28
distance, way beyond the SEMLEP area to link up London, Oxford, Birmingham and
Cambridge. In labour market terms there is a narrower focus, with relationships primarily
extending into the neighbouring boroughs in terms of jobs within Milton Keynes i.e. the
immediately bordering authorities (in order of labour force contribution) of Central
Bedfordshire, South Northamptonshire, Aylesbury Vale, Northampton, Bedford and Luton. The
labour force contribution of Milton Keynes, however, extends to London and Birmingham.
Overall, whilst there are clear overlaps and relationships of the different market and economic 5.29
influences they share a key driver, the connections to and from Milton Keynes from local areas
and other strategic centres. These enable efficient movement of goods and people,
enabling businesses to choose to locate here, workers to access jobs in Milton Keynes but also
workers to work elsewhere.
In the future it is important that Milton Keynes thinks differently about its economic geography 5.30
in relation to the particular activity or focus. In terms of encouraging business and occupier
interest there needs to be a continued focus on understanding and exploiting the relationship
of Milton Keynes to more strategic markets, ensuring it can compete with major economic
hubs in the South East and the Midlands in particular.
However, in providing appropriately skilled workers Milton Keynes will need to work closely with 5.31
its neighbours to ensure that, whilst jobs for local residents are optimised, the wider impact and
benefits are understood.

Milton Keynes Council and Milton Keynes Development Partnership Final Report
November 2015 gva.co.uk 71
6. Employment Land Supply
This section of the report reviews the existing supply of employment land within the Milton 6.1
Keynes Council administrative area.
The supply of employment land in Milton Keynes consists of three key components: 6.2
Existing Employment Sites – mixture of existing industrial estates and office parks that
contribute to the employment land supply in Milton Keynes;
Proposed Sites – within or bordering existing employment sites that may be developed and
contribute to meeting future employment land requirements in Milton Keynes; and
Potential Sites – new undeveloped land that may be developed and contribute to
meeting future employment land requirements in Milton Keynes.
The review of these components includes both quantitative and qualitative elements. 6.3
The total site area assessed is shown in Table 6.1 below. 6.4
Table 6.1 – Summary of Employment Land Supply in Milton Keynes
Site Typology
Existing Employment Sites (ha)
Proposed Sites (ha) Potential Sites
(ha) Total (ha)
Total Area (ha) 988 36.86 160.65 1,185.51
Source: GVA, 2015.
Our employment sites assessment matrix for these sites is provided at Appendix A. Each site 6.5
has a unique reference number and is listed by settlement in the matrix. A grid square
reference number is also provided from the Official 2013 Milton Keynes City Atlas. The
employment sites have also been ranked to compare their performance and the offer across
the borough, seen at Appendix B. The details of the proformas used to create this matrix are
appended at Appendix C. The sites are spread throughout the Borough as shown in the plans
at Appendix D.
The following sections consider the findings from our employment land supply assessment for 6.6
each of the three categories of employment land.
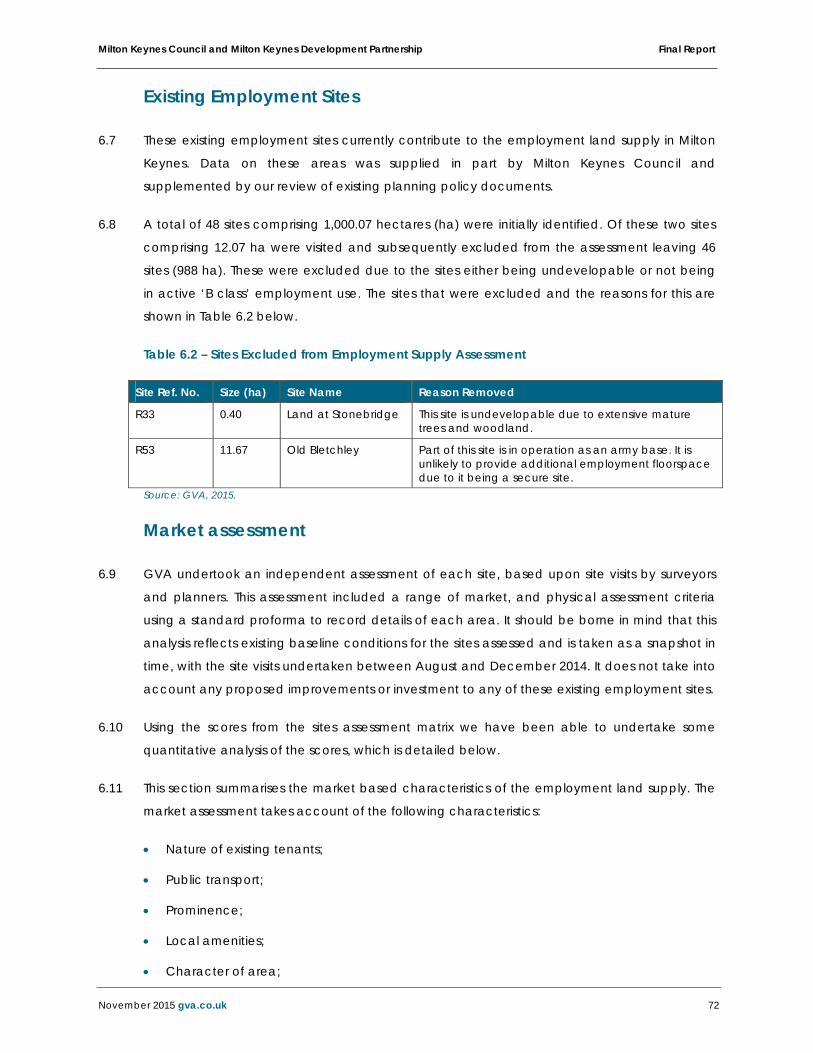
Milton Keynes Council and Milton Keynes Development Partnership Final Report
November 2015 gva.co.uk 72
Existing Employment Sites
These existing employment sites currently contribute to the employment land supply in Milton 6.7
Keynes. Data on these areas was supplied in part by Milton Keynes Council and
supplemented by our review of existing planning policy documents.
A total of 48 sites comprising 1,000.07 hectares (ha) were initially identified. Of these two sites 6.8
comprising 12.07 ha were visited and subsequently excluded from the assessment leaving 46
sites (988 ha). These were excluded due to the sites either being undevelopable or not being
in active ‘B class’ employment use. The sites that were excluded and the reasons for this are
shown in Table 6.2 below.
Table 6.2 – Sites Excluded from Employment Supply Assessment
Site Ref. No. Size (ha) Site Name Reason Removed
R33 0.40 Land at Stonebridge This site is undevelopable due to extensive mature trees and woodland.
R53 11.67 Old Bletchley Part of this site is in operation as an army base. It is unlikely to provide additional employment floorspace due to it being a secure site.
Source: GVA, 2015.
Market assessment
GVA undertook an independent assessment of each site, based upon site visits by surveyors 6.9
and planners. This assessment included a range of market, and physical assessment criteria
using a standard proforma to record details of each area. It should be borne in mind that this
analysis reflects existing baseline conditions for the sites assessed and is taken as a snapshot in
time, with the site visits undertaken between August and December 2014. It does not take into
account any proposed improvements or investment to any of these existing employment sites.
Using the scores from the sites assessment matrix we have been able to undertake some 6.10
quantitative analysis of the scores, which is detailed below.
This section summarises the market based characteristics of the employment land supply. The 6.11
market assessment takes account of the following characteristics:
Nature of existing tenants;
Public transport;
Prominence;
Local amenities;
Character of area;
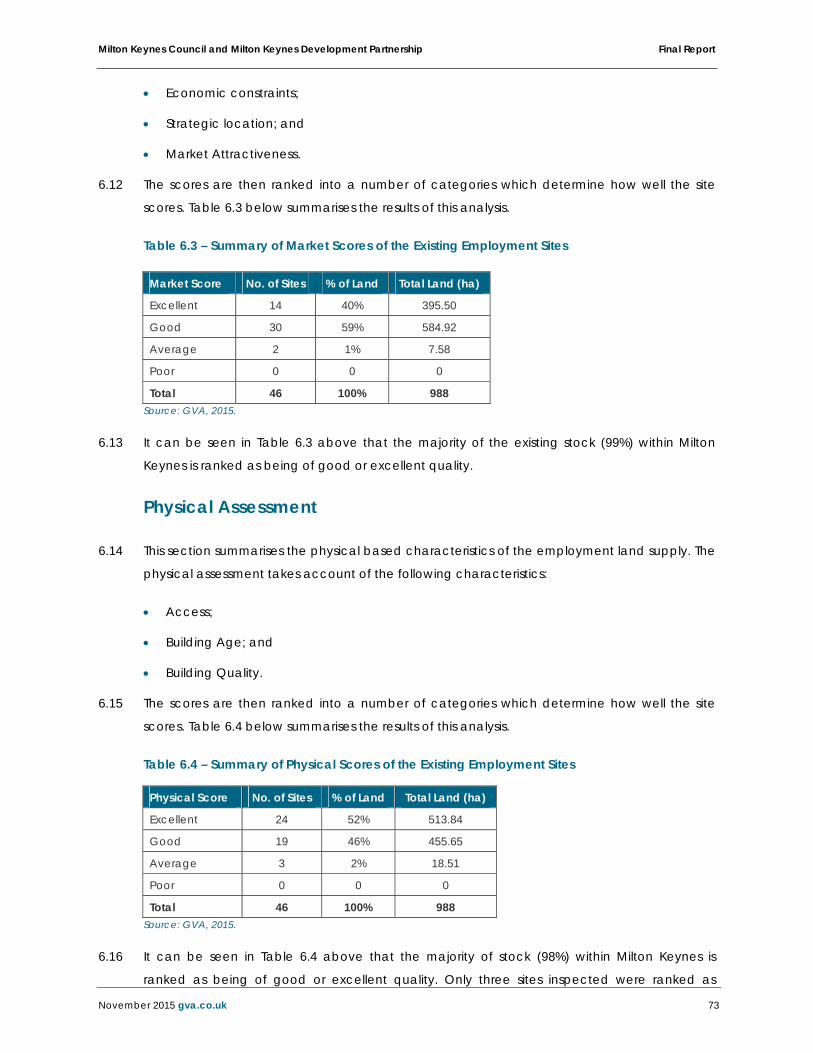
Milton Keynes Council and Milton Keynes Development Partnership Final Report
November 2015 gva.co.uk 73
Economic constraints;
Strategic location; and
Market Attractiveness.
The scores are then ranked into a number of categories which determine how well the site 6.12
scores. Table 6.3 below summarises the results of this analysis.
Table 6.3 – Summary of Market Scores of the Existing Employment Sites
Market Score No. of Sites % of Land Total Land (ha)
Excellent 14 40% 395.50
Good 30 59% 584.92
Average 2 1% 7.58
Poor 0 0 0
Total 46 100% 988 Source: GVA, 2015.
It can be seen in Table 6.3 above that the majority of the existing stock (99%) within Milton 6.13
Keynes is ranked as being of good or excellent quality.
Physical Assessment
This section summarises the physical based characteristics of the employment land supply. The 6.14
physical assessment takes account of the following characteristics:
Access;
Building Age; and
Building Quality.
The scores are then ranked into a number of categories which determine how well the site 6.15
scores. Table 6.4 below summarises the results of this analysis.
Table 6.4 – Summary of Physical Scores of the Existing Employment Sites
Physical Score No. of Sites % of Land Total Land (ha)
Excellent 24 52% 513.84
Good 19 46% 455.65
Average 3 2% 18.51
Poor 0 0 0
Total 46 100% 988 Source: GVA, 2015.
It can be seen in Table 6.4 above that the majority of stock (98%) within Milton Keynes is 6.16
ranked as being of good or excellent quality. Only three sites inspected were ranked as
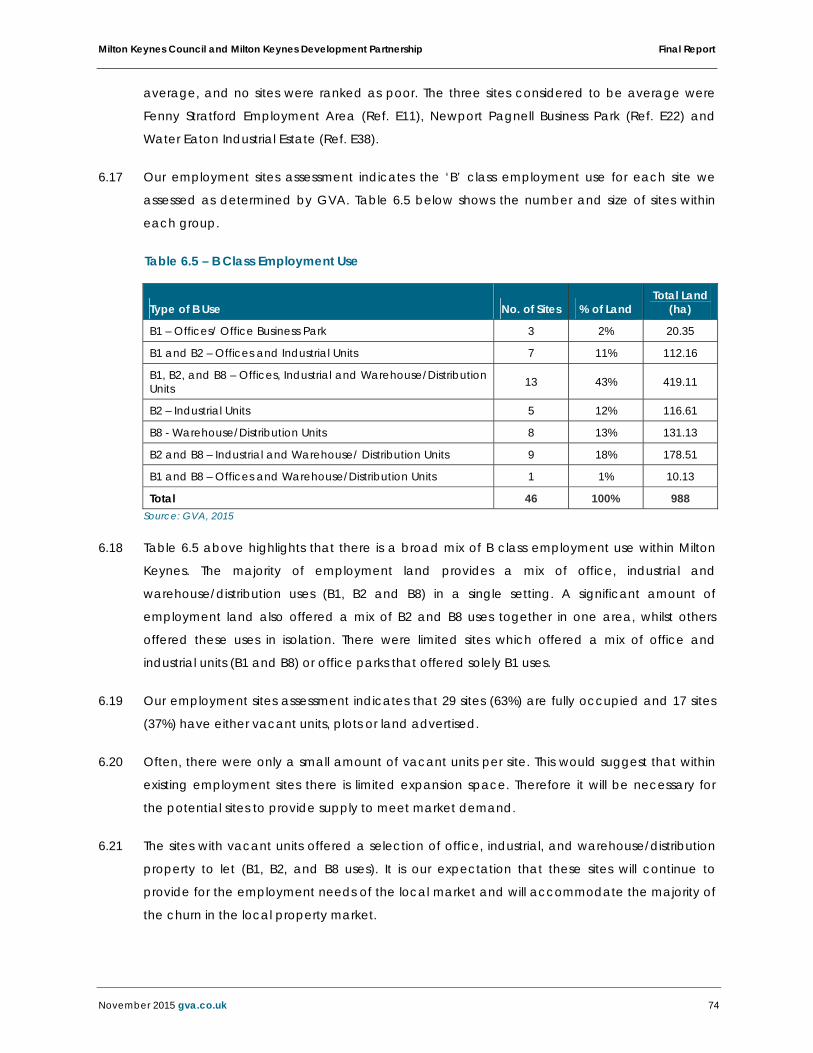
Milton Keynes Council and Milton Keynes Development Partnership Final Report
November 2015 gva.co.uk 74
average, and no sites were ranked as poor. The three sites considered to be average were
Fenny Stratford Employment Area (Ref. E11), Newport Pagnell Business Park (Ref. E22) and
Water Eaton Industrial Estate (Ref. E38).
Our employment sites assessment indicates the ‘B’ class employment use for each site we 6.17
assessed as determined by GVA. Table 6.5 below shows the number and size of sites within
each group.
Table 6.5 – B Class Employment Use
Type of B Use No. of Sites % of Land Total Land
(ha)
B1 – Offices/ Office Business Park 3 2% 20.35
B1 and B2 – Offices and Industrial Units 7 11% 112.16
B1, B2, and B8 – Offices, Industrial and Warehouse/Distribution Units 13 43% 419.11
B2 – Industrial Units 5 12% 116.61
B8 - Warehouse/Distribution Units 8 13% 131.13
B2 and B8 – Industrial and Warehouse/ Distribution Units 9 18% 178.51
B1 and B8 – Offices and Warehouse/Distribution Units 1 1% 10.13
Total 46 100% 988 Source: GVA, 2015
Table 6.5 above highlights that there is a broad mix of B class employment use within Milton 6.18
Keynes. The majority of employment land provides a mix of office, industrial and
warehouse/distribution uses (B1, B2 and B8) in a single setting. A significant amount of
employment land also offered a mix of B2 and B8 uses together in one area, whilst others
offered these uses in isolation. There were limited sites which offered a mix of office and
industrial units (B1 and B8) or office parks that offered solely B1 uses.
Our employment sites assessment indicates that 29 sites (63%) are fully occupied and 17 sites 6.19
(37%) have either vacant units, plots or land advertised.
Often, there were only a small amount of vacant units per site. This would suggest that within 6.20
existing employment sites there is limited expansion space. Therefore it will be necessary for
the potential sites to provide supply to meet market demand.
The sites with vacant units offered a selection of office, industrial, and warehouse/distribution 6.21
property to let (B1, B2, and B8 uses). It is our expectation that these sites will continue to
provide for the employment needs of the local market and will accommodate the majority of
the churn in the local property market.
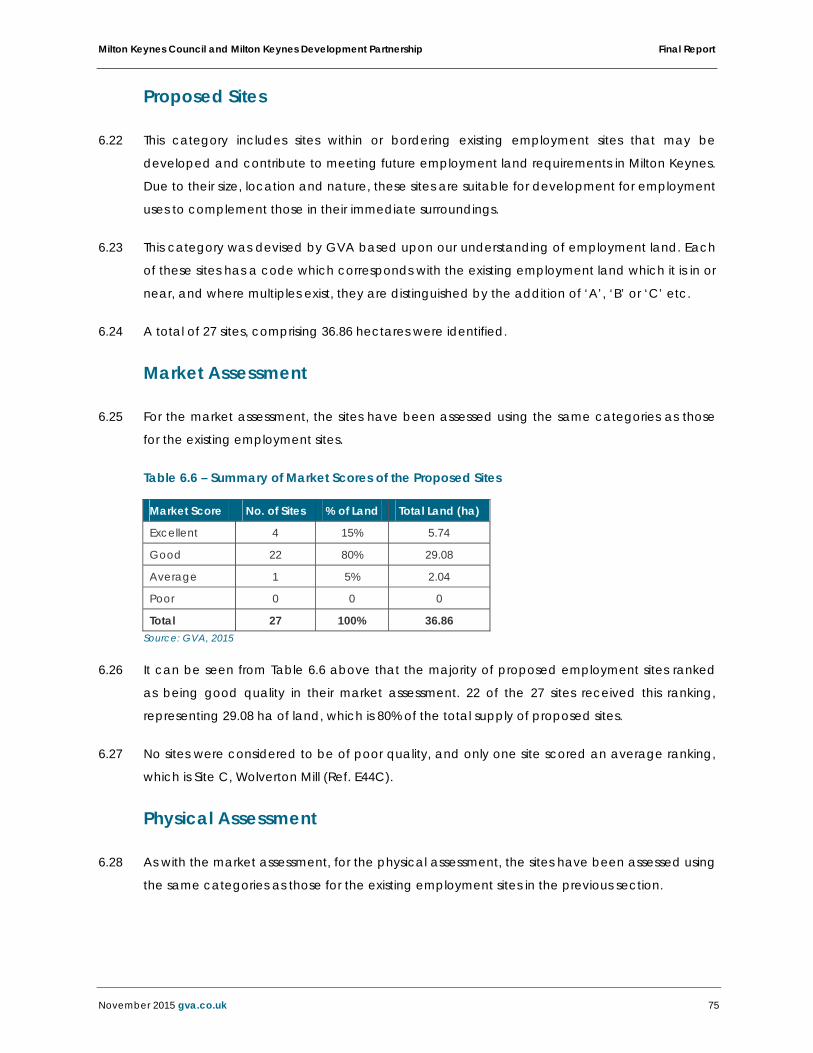
Milton Keynes Council and Milton Keynes Development Partnership Final Report
November 2015 gva.co.uk 75
Proposed Sites
This category includes sites within or bordering existing employment sites that may be 6.22
developed and contribute to meeting future employment land requirements in Milton Keynes.
Due to their size, location and nature, these sites are suitable for development for employment
uses to complement those in their immediate surroundings.
This category was devised by GVA based upon our understanding of employment land. Each 6.23
of these sites has a code which corresponds with the existing employment land which it is in or
near, and where multiples exist, they are distinguished by the addition of ‘A’, ‘B’ or ‘C’ etc.
A total of 27 sites, comprising 36.86 hectares were identified. 6.24
Market Assessment
For the market assessment, the sites have been assessed using the same categories as those 6.25
for the existing employment sites.
Table 6.6 – Summary of Market Scores of the Proposed Sites
Market Score No. of Sites % of Land Total Land (ha)
Excellent 4 15% 5.74
Good 22 80% 29.08
Average 1 5% 2.04
Poor 0 0 0
Total 27 100% 36.86 Source: GVA, 2015
It can be seen from Table 6.6 above that the majority of proposed employment sites ranked 6.26
as being good quality in their market assessment. 22 of the 27 sites received this ranking,
representing 29.08 ha of land, which is 80% of the total supply of proposed sites.
No sites were considered to be of poor quality, and only one site scored an average ranking, 6.27
which is Site C, Wolverton Mill (Ref. E44C).
Physical Assessment
As with the market assessment, for the physical assessment, the sites have been assessed using 6.28
the same categories as those for the existing employment sites in the previous section.
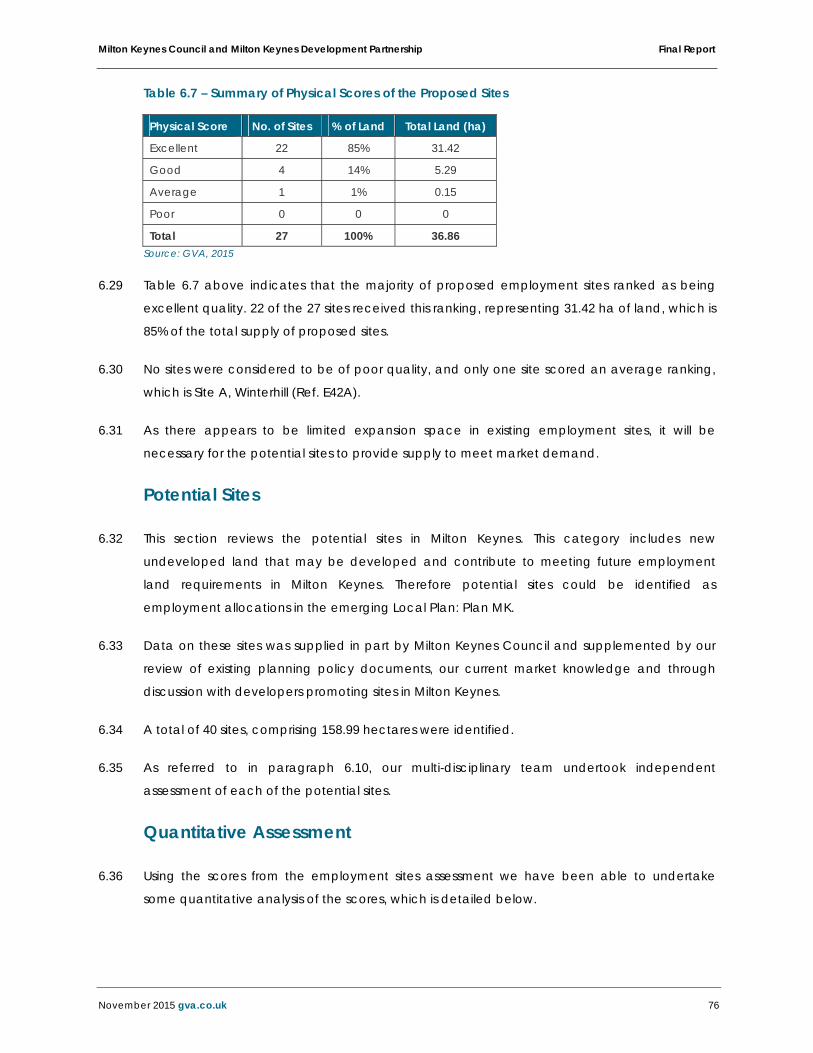
Milton Keynes Council and Milton Keynes Development Partnership Final Report
November 2015 gva.co.uk 76
Table 6.7 – Summary of Physical Scores of the Proposed Sites
Physical Score No. of Sites % of Land Total Land (ha)
Excellent 22 85% 31.42
Good 4 14% 5.29
Average 1 1% 0.15
Poor 0 0 0
Total 27 100% 36.86 Source: GVA, 2015
Table 6.7 above indicates that the majority of proposed employment sites ranked as being 6.29
excellent quality. 22 of the 27 sites received this ranking, representing 31.42 ha of land, which is
85% of the total supply of proposed sites.
No sites were considered to be of poor quality, and only one site scored an average ranking, 6.30
which is Site A, Winterhill (Ref. E42A).
As there appears to be limited expansion space in existing employment sites, it will be 6.31
necessary for the potential sites to provide supply to meet market demand.
Potential Sites
This section reviews the potential sites in Milton Keynes. This category includes new 6.32
undeveloped land that may be developed and contribute to meeting future employment
land requirements in Milton Keynes. Therefore potential sites could be identified as
employment allocations in the emerging Local Plan: Plan MK.
Data on these sites was supplied in part by Milton Keynes Council and supplemented by our 6.33
review of existing planning policy documents, our current market knowledge and through
discussion with developers promoting sites in Milton Keynes.
A total of 40 sites, comprising 158.99 hectares were identified. 6.34
As referred to in paragraph 6.10, our multi-disciplinary team undertook independent 6.35
assessment of each of the potential sites.
Quantitative Assessment
Using the scores from the employment sites assessment we have been able to undertake 6.36
some quantitative analysis of the scores, which is detailed below.
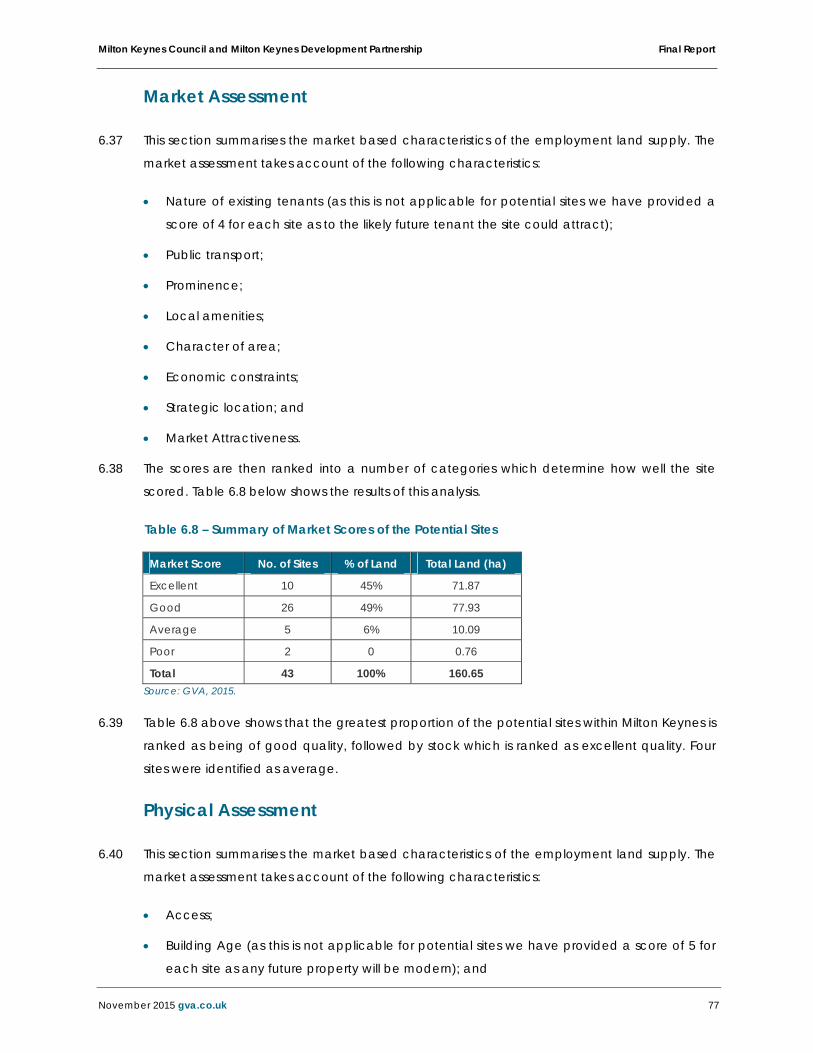
Milton Keynes Council and Milton Keynes Development Partnership Final Report
November 2015 gva.co.uk 77
Market Assessment
This section summarises the market based characteristics of the employment land supply. The 6.37
market assessment takes account of the following characteristics:
Nature of existing tenants (as this is not applicable for potential sites we have provided a
score of 4 for each site as to the likely future tenant the site could attract);
Public transport;
Prominence;
Local amenities;
Character of area;
Economic constraints;
Strategic location; and
Market Attractiveness.
The scores are then ranked into a number of categories which determine how well the site 6.38
scored. Table 6.8 below shows the results of this analysis.
Table 6.8 – Summary of Market Scores of the Potential Sites
Market Score No. of Sites % of Land Total Land (ha)
Excellent 10 45% 71.87
Good 26 49% 77.93
Average 5 6% 10.09
Poor 2 0 0.76
Total 43 100% 160.65 Source: GVA, 2015.
Table 6.8 above shows that the greatest proportion of the potential sites within Milton Keynes is 6.39
ranked as being of good quality, followed by stock which is ranked as excellent quality. Four
sites were identified as average.
Physical Assessment
This section summarises the market based characteristics of the employment land supply. The 6.40
market assessment takes account of the following characteristics:
Access;
Building Age (as this is not applicable for potential sites we have provided a score of 5 for
each site as any future property will be modern); and

Milton Keynes Council and Milton Keynes Development Partnership Final Report
November 2015 gva.co.uk 78
Building Quality (as this is not applicable for potential sites we have provided a score of 4
for each sites as any future property will be good quality good quality).
The scores are then ranked into a number of categories which determine how well the site 6.41
scored. Table 6.9 below shows the results of this analysis.
Table 6.9 – Summary of Physical Scores of the Potential Sites
Physical Score No. of Sites % of Land Total Land (ha)
Excellent 33 92% 147.47
Good 10 8% 13.18
Average 0 0 0
Poor 0 0 0
Total 43 100% 160.65 Source: GVA, 2015.
Table 6.9 above shows that the greatest proportion of potential sites within Milton Keynes is 6.42
ranked as being of excellent quality. In a lot of these cases, as the scores for building age and
quality are fixed, the high scores are determined by the sites access, with many sites located
close to a motorway junction or a junction to a main road.
Type of ‘B class’ Employment use
As these are proposed sites, they all comprise vacant land. As the sites are independent to 6.43
existing employment sites, they could come forward for any type of ‘B class’ employment use.
Summary
We provide below our conclusions from this assessment of the employment land supply within 6.44
Milton Keynes. Table 6.10 below summarises the extent of the employment land supply within
the borough which clearly shows that the Borough has a significant amount of land supply
within the three categories.

Milton Keynes Council and Milton Keynes Development Partnership Final Report
November 2015 gva.co.uk 79
Table 6.10 – Summary of Employment Land Supply in Milton Keynes
Existing Employment
Sites
Proposed Sites
Potential Sites
Supply (hectares) 988 36.86 160.65
TOTAL 1,185.51 hectares Source: GVA, 2015.
We also highlight below the key conclusions from each of the types of employment land 6.45
supply that we considered.
Existing Employment Sites
Market Assessment – the majority of existing stock (99%) within Milton Keynes is ranked as 6.46
being of good or excellent quality. 40% of sites representing 395.50 ha is identified as excellent
quality and 59% sites representing 584.92 ha is identified as good quality.
Physical Assessment – the majority of existing stock within Milton Keynes is ranked as being of 6.47
good or excellent quality. 52% of sites representing 513.84 ha is identified as excellent quality
and 46% of sites representing 455.65 ha is identified as good quality. Only 2% of sites score an
average ranking.
B Class Employment Uses – there is a broad mix of B class employment use within Milton 6.48
Keynes. The majority of employment land provides a mix of office, industrial and
warehouse/distribution uses (B1, B2 and B8) in a single setting (13 sites) or industrial and
warehouse/distribution use (B2 and B8) in a single setting (9 sites).
Vacancies – Our employment sites assessment indicates that 29 sites (63%) are fully occupied 6.49
and 17 sites (37%) have either vacant units, plots or land advertised.
Proposed Sites
Market Assessment – the majority of proposed employment sites ranked as being good 6.50
quality. 22 of the 27 sites received this ranking, representing 29.08 ha of land, which is 80% of
the total supply of proposed sites.
Physical Assessment – the majority of proposed employment sites ranked as being excellent 6.51
quality. 22 of the 27 sites received this ranking, representing 31.42 ha of land, which is 85% of
the total supply of potential sites.
As there appears to be limited expansion space in existing employment sites, it will be 6.52
necessary for the proposed sites to provide supply to meet market demand.

Milton Keynes Council and Milton Keynes Development Partnership Final Report
November 2015 gva.co.uk 80
Potential Sites
Market Assessment – the greatest proportion of the potential sites within Milton Keynes is 6.53
ranked as being of good quality (49%) closely followed by stock which is ranked as excellent
quality (45%).
Physical Assessment – the greatest proportion of the potential sites within Milton Keynes is 6.54
ranked as being of excellent quality. 33 sites representing 147.47 ha of land and representing
92% of the total area are identified as excellent quality.
B Class Employment Uses – As these are potential sites, they all comprise vacant land. As the 6.55
sites are independent to existing employment sites, they could come forward as any type of ‘B
class’ employment use.

Milton Keynes Council and Milton Keynes Development Partnership Final Report
November 2015 gva.co.uk 81
7. Stakeholder Engagement
As part of this study GVA held two workshops with key stakeholders. The first workshop took 7.1
place on the 2nd October 2014, with a focus on the economic baseline evidence base, and
the second workshop took place on the 24th October, with a focus on the employment land
supply and property market. A third stakeholder meeting took place on the 14th May 2015 with
a presentation and discussion on the key findings from the Study. The outcome of this is
discussed in the Phase 2 report.
In addition to this the consultants have engaged independently with local agents active in 7.2
the property market and a range of public and private sector stakeholders with interest in the
outcome of the study.
We have also given all Local Authorities that neighbour Milton Keynes the opportunity to 7.3
engage with the process. A summary of the views received are documented in section 3 of
this report.
We turn now to summarise the key outcomes of the first two stakeholder workshops that 7.4
informed the Phase 1 report.
Workshop 1 – The Economic Baseline
Representatives from Milton Keynes Council (MKC), Milton Keynes Development Partnership 7.5
(MKDP), GVA, The Open University, the University of Bedfordshire, the Federation of Small
Businesses (FSB), and Business Leaders attended the first workshop.
The discussions were based around the following broad themes: skills; higher education; 7.6
knowledge economy drivers; travel to work data; impact of property values; impact of retail;
small businesses; and additional socio economic analysis.
Table 7.1 below provides a summary of the key discussion points based on these themes. 7.7

Milton Keynes Council and Milton Keynes Development Partnership Final Report
November 2015 gva.co.uk 82
Table 7.1 – Workshop 1 key discussion points
Skills
There was agreement about the need to balance skills to meet those required for knowledge based
business growth in the borough. This was a general issue and also linked to the lack of ‘traditional’
Higher Education (HE) institutions in Milton Keynes.
It was recognised that while some skills performance was strong there was a mis-match between
workforce skills and business needs.
It was highlighted that MK exports its higher skilled workers but, traditionally, has imported a similar
proportion from neighbouring areas.
MK was seen as benefitting from a net inflow of graduates which was seen as a positive trend to
support future growth.
Overcoming skills issues was seen as the key challenge to economic success.
Higher Education (HE)
It was questioned how a University presence in MK would influence the economy in the medium to
long term (up to 2031) in terms of attracting high value businesses as a result of the time taken to
establish a new institution.
The role of the existing HE provision in generating business growth was raised and whether they could
‘do more’.
Looking at the opportunity to work with Cranfield, driving growth in MK linked to engineering research
specialisms was felt to be an underplayed opportunity.
The key question was if there is an alternative to having a University.
Knowledge based economy drivers
Alternative knowledge sector drivers were discussed, with key ideas and opportunities based around
exploring more locally relevant and organic approaches such as a Science Park in the City, the Smart
City initiative and innovation driven by existing businesses. How these could help with the branding of
MK’s economy and attracting business clusters was considered a more appropriate approach for MK.
It was raised that the longer term impact of the transport catapult and presence of Network Rail can
be captured as an alternative knowledge economy driver, particularly if linked to opportunities for
pilot, trial or demonstration projects within the City.
External links were also highlighted, both locally via Cranfield, and further afield such as opportunities
driven by development at Kings Cross/Euston in the digital sector.
It was felt that MK (despite the data presented) did not face a specific issue related to the scale of
public sector employment, which was felt to represent a low proportion of the overall workforce.

Milton Keynes Council and Milton Keynes Development Partnership Final Report
November 2015 gva.co.uk 83
Travel to Work Data
It was acknowledged by the participants that MK is losing skills to other districts and there is a reliance
on labour from other areas. Economically this was not seen as a disadvantage but is more reflective of
the role of MK in the sub-region and its growing maturity as an economic hub. It was recognised that
in planning and sustainability terms a greater balance between population and employment would
be beneficial.
It was suggested further analysis of Travel To Work (TTW) data could be undertaken to understand the
sectoral and occupation split of those who are travelling outside MK to understand potential in the
economy.
Property Values
Concerns were raised about the initial data on commercial values, which showed a decline in values
over the last 5 years. The impact and implications for the delivery of new space and the refurbishment
of existing space was an important consideration for future economic activity. The inability to viably
deliver good quality new stock will impact the quality of businesses attracted to MK. Also a lack of
good quality new stock will potentially deter higher value activity who seek Grade A stock.
Impact of retail
Retail is a key sector of employment in MK, it was questioned if the changing retail sector (pre and
post-recession) and changing consumer habits will have an impact on the economy. How this will
translate into B class employment was considered.
Small businesses
The failure of small businesses after 4/5 years was recognised. This was felt to be partly linked to how
the businesses themselves were set up but also the types of sectors they were active in.
Long term the start-up and small business community was seen as a major economic opportunity,
particularly in terms of increasing employment density within sites, but appropriate workspace would
be needed. This would include small start-up facilities but also larger ‘move on’ spaces. Appropriate
property products were considered including a Science Park and its potential linkages to either private
sector research based organisations/the HE sector.
Socio-economic Indicators
The following suggestions were given for inclusion in baseline (where data was available):
Comparators: It was suggested that ‘regional comparisons’ may not show MK in its true context
and the study should include more comparator cities like Reading, Swindon, Brighton,
Peterborough and Guildford as ‘benchmarks’.
Size of the business by Employment and Sector.
Business survival breakdown by sector.
TTWA: Identifying key sectors that the labour force travels out for and its influence on economy,
and impact of those working from home.
Source: GVA, 2014.

Milton Keynes Council and Milton Keynes Development Partnership Final Report
November 2015 gva.co.uk 84
Overall the first stakeholder workshop was open and informative. It was agreed that MK should 7.8
not seek to replicate what other places have done. It was felt that MK is unique and the
strategy going forward should be intrinsically tied to its strengths. The diversity of the economic
base and availability of employment land were felt to be key strengths on which to base
future success.
The discussions resulted in a series of action points for GVA, largely further analysis and the 7.9
inclusion of additional indicators, which GVA have taken forward in the preparation of this
final Phase 1 report.
Workshop 2 – Employment Land Supply/Property Market
Representatives from MKC, GVA, Milton Keynes City Centre Management (MKCCM), FSB, 7.10
Business Leaders, Brown and Lee, Bidwells, Lambert Smith Hampton (LSH), Hampton Brook, and
Kirkby and Diamond attended the second workshop.
The discussions were based around the following broad themes: parking; the property market 7.11
and competing locations; suitability of employment land supply; and proposed and potential
sites.
Table 7.2 below provides a summary of the key discussion points based on these themes. 7.12
Table 7.2 – Workshop 2 key discussion points
Parking
All of the stakeholders agreed that there is a potential lack of parking, which is a critical issue in Milton
Keynes and has the effect of deterring investors from the borough. The cost is also considered to be
too high.
It was highlighted that there is an undersupply of parking spaces in the ‘business zone’ during the week
and an undersupply in the ‘retail zone during the weekend.
The stakeholders felt that occupiers need a dedicated package where parking is a part of this.
Currently there are cases where large office developments have no parking as part of the offer.
There is also no overspill or out-of-town parking available, and the park-and-ride facility is underutilised.

Milton Keynes Council and Milton Keynes Development Partnership Final Report
November 2015 gva.co.uk 85
Market and competing locations
The stakeholders felt that Milton Keynes has a three tier market.
Luton and Northampton were cited as being competing locations, despite rental levels being lower in
Milton Keynes.
There is a lack of a consistent delivery of office stock, and it was questioned whether this was a land
supply or development management issue.
Some considered that Milton Keynes does not have a clear identity when it comes to its employment
land offer.
There is generally a backlash to any regeneration in Plan: Milton Keynes which moves the borough
away from its initial new town ‘vision’.
There was a feeling that the MKC needs to offer reduced business rates and service charges as
incentives to encourage investment, and to facilitate partnership working.
Developers are not currently considering design and build opportunities.

Milton Keynes Council and Milton Keynes Development Partnership Final Report
November 2015 gva.co.uk 86
Suitability of employment land and property
It was raised that the industrial stock is out-of-date and ‘tired’, especially in locations such as Kiln Farm.
Another issue with the industrial stock is the lack of a yard, or external open space particularly
noticeable with the second-hand premises developed in the 1970’s/1980’s. These units also have low
eave heights which are not suitable for modern occupiers.
There is an oversupply of units around the 5,000 sqft size where rents achieve about £60 psf.
Many of the employment estates are identical and there are none which particularly stand out as
having a unique offer in terms of specifications, with the exception of Magna Park.
The optimum quantum and mix within employment estates is a high proportion of industrial premises
with a small proportion of office premises (about 10%). This is what modern occupiers seek (according
to the local agents). The current multi-let nature of the estates is a legacy of the new town government
led delivery in the 1970’s/1980’s.
Major corporates prefer to have freehold ownership of their properties, causing a churn of freehold
stock.
There are only two developments which are truly Grade A office stock, and the majority of others are
30 to 40 years old, and are becoming tired and in need of refurbishment.
The borough should build at £125 to £135 psf and let at £18 to £20 psf.
Caldecott is one of the only office/out-of-town parks. Out of centre office parks are private sector led
and need additional amenities. Occupiers don’t need to be located in CMK provided the right
infrastructure and amenities are in place. Broadband provision is actually better outside of CMK.
There is also limited office stock below 1,000 sqft. There is a need to target SME’s and provide
incubation space.
EPC ratings were mentioned as a potential determining factor in occupier’s decisions.
Proposed and Potential sites
Some proposed sites will only be brought forward by the current occupier as expansion space (this is
what they were intended for). They are unlikely to be available to the wider market.
Some potential sites are constrained and may be more suitable for alternative forms of development,
such as residential (i.e. the potential sites next to Wolverton Mill). Many of the stakeholders are of the
view that the existing land allocations may need reviewing.
Source: GVA, 2014.
This workshop was extremely relevant and the discussions resulted in a series of further areas 7.13
for discussion to inform the study.
Stakeholders were asked, in light of increases in home-working, if there is a need for facilities 7.14
within residential areas for homeworkers to receive and welcome visitors and clients, such as a
space within a community centre, or at a business centre or small commercial building. The

Milton Keynes Council and Milton Keynes Development Partnership Final Report
November 2015 gva.co.uk 87
stakeholders felt that there is currently no evidence of demand for this type of facility in the
borough of Milton Keynes.
In addition to this workshop, a one-off meeting was held with a key developer in Milton Keynes 7.15
who was unable to attend either workshop. The stakeholder gave empirical evidence of
latent demand for high quality logistics sites from large footprint users. The stakeholder
expressed requirements of circa 280 acres of land over the next 10 years, which would provide
an additional 6,000 jobs in Milton Keynes.
It was noted that logistics sector occupiers typically have a few basic requirements, namely 7.16
the quality of the space, close access to a motorway junction, and separation from residential
developments. Although the stakeholder would consider developing on brownfield land in
Milton Keynes, there are not any existing places in Milton Keynes which meet these locational
criteria.
There are over 20,000 public parking spaces on CMK of which 10,500 are available to 7.17
employees, with proposals to add additional parking spaces in this financial year.
Further, in response to the concerns about cost, since this study has commenced parking in 7.18
CMK has increased to £2 per day, which equates to 25 pence per hour. There are also options
for car share, green permit, and flexible part-time parking.
There is significant parking pressure for employees in the business zone and therefore the 7.19
Council has committed to delivering an additional 1000 employee spaces in this financial year
(234 have already been provided).
Overall, the outcomes of the two workshops, the additional meeting, and the additional 7.20
correspondence, will both further influence the study and will aid in framing the
recommendations in the Phase 2 report.

Milton Keynes Council and Milton Keynes Development Partnership Final Report
November 2015 gva.co.uk 88
8. Forecast Demand Scenarios
In understanding the range and portfolio of future employment land and floorspace need it is 8.1
important to understand the potential nature of employment growth within Milton Keynes
(MK) over the plan period (and beyond) to ensure sufficient provision is made and protected
within the area’s employment land portfolio.
As discussed above Milton Keynes Council are currently preparing an updated Local Plan, 8.2
known as Plan:MK, which will set the strategic land use strategy for the local authority area.
Plan:MK will replace the current Core Strategy, at present the Strategic Housing Market
Assessment (SHMA) that will support Plan:MK considers a period from 2011 to 2031 therefore, to
ensure a consistent evidence base for Plan:MK the economic forecast has been prepared for
the same period.
This section sets out the base economic growth forecasts used within this Study as a basis for 8.3
understanding the potential scale and nature of economic growth over the Plan:MK period. In
forecasting terms MK sits in a unique position, lying on the boundary of the South East and East
of England areas. Within the East of England a bespoke employment forecast has been
developed by Cambridge Econometrics (the East of England Forecasting Model – EEFM)
which the majority of local authorities use as a basis for understanding future growth.
However, the South East does not have a centrally prepared forecast and local authorities
(and their advisers) are able to use any available forecast. In recent years a number of near
neighbours have used forecasts prepared by Experian Business Strategies.
Given the relationship between the Milton Keynes economy and its neighbours it is important 8.4
that the evidence base for Plan:MK provides a robust understanding of economic potential
that is consistent with the neighbouring areas. Therefore, as a starting point for the future
growth forecasts we have prepared two ‘base’ positions utilising both the EEFM and Experian
forecasts.
No single forecasting model provides a superior or more robust basis for assessing future 8.5
employment land needs. Whilst the models differ in their forecasting assumptions and
approach they do draw on similar base data. Both forecasts have established and accepted
methodologies and have been used to inform a wider range of planning evidence bases. As
such policy choices can be made on the basis of either approach.
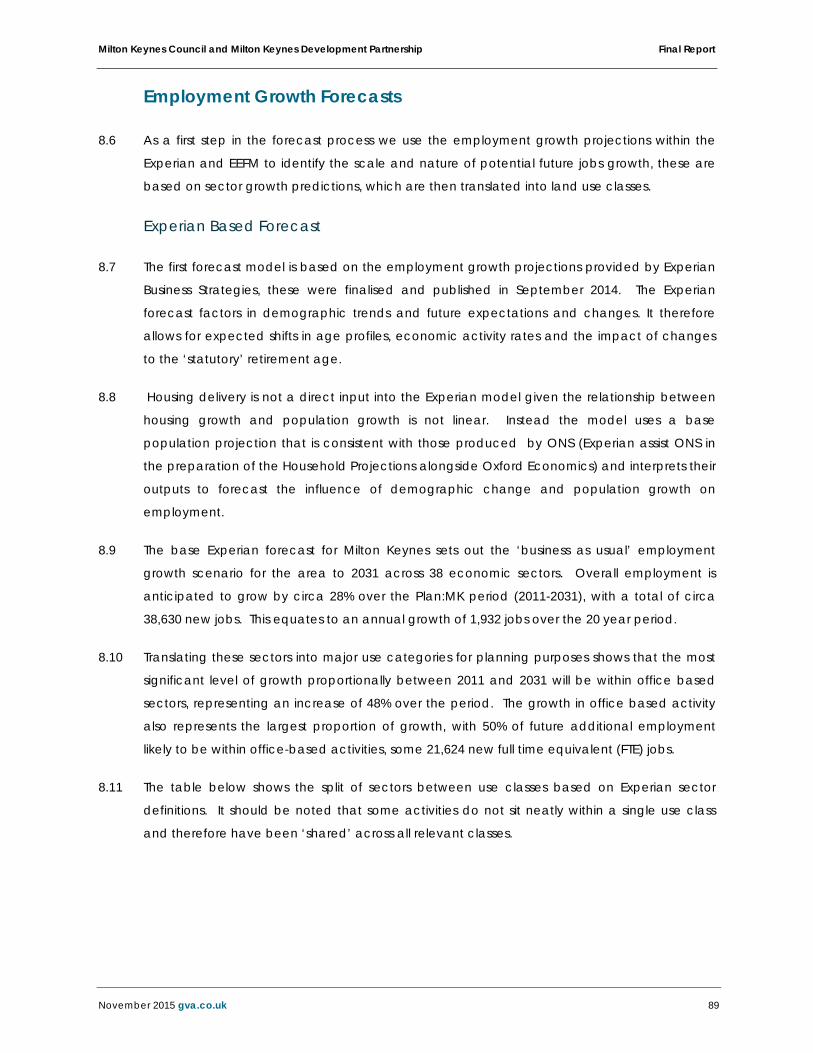
Milton Keynes Council and Milton Keynes Development Partnership Final Report
November 2015 gva.co.uk 89
Employment Growth Forecasts
As a first step in the forecast process we use the employment growth projections within the 8.6
Experian and EEFM to identify the scale and nature of potential future jobs growth, these are
based on sector growth predictions, which are then translated into land use classes.
Experian Based Forecast
The first forecast model is based on the employment growth projections provided by Experian 8.7
Business Strategies, these were finalised and published in September 2014. The Experian
forecast factors in demographic trends and future expectations and changes. It therefore
allows for expected shifts in age profiles, economic activity rates and the impact of changes
to the ‘statutory’ retirement age.
Housing delivery is not a direct input into the Experian model given the relationship between 8.8
housing growth and population growth is not linear. Instead the model uses a base
population projection that is consistent with those produced by ONS (Experian assist ONS in
the preparation of the Household Projections alongside Oxford Economics) and interprets their
outputs to forecast the influence of demographic change and population growth on
employment.
The base Experian forecast for Milton Keynes sets out the ‘business as usual’ employment 8.9
growth scenario for the area to 2031 across 38 economic sectors. Overall employment is
anticipated to grow by circa 28% over the Plan:MK period (2011-2031), with a total of circa
38,630 new jobs. This equates to an annual growth of 1,932 jobs over the 20 year period.
Translating these sectors into major use categories for planning purposes shows that the most 8.10
significant level of growth proportionally between 2011 and 2031 will be within office based
sectors, representing an increase of 48% over the period. The growth in office based activity
also represents the largest proportion of growth, with 50% of future additional employment
likely to be within office-based activities, some 21,624 new full time equivalent (FTE) jobs.
The table below shows the split of sectors between use classes based on Experian sector 8.11
definitions. It should be noted that some activities do not sit neatly within a single use class
and therefore have been ‘shared’ across all relevant classes.
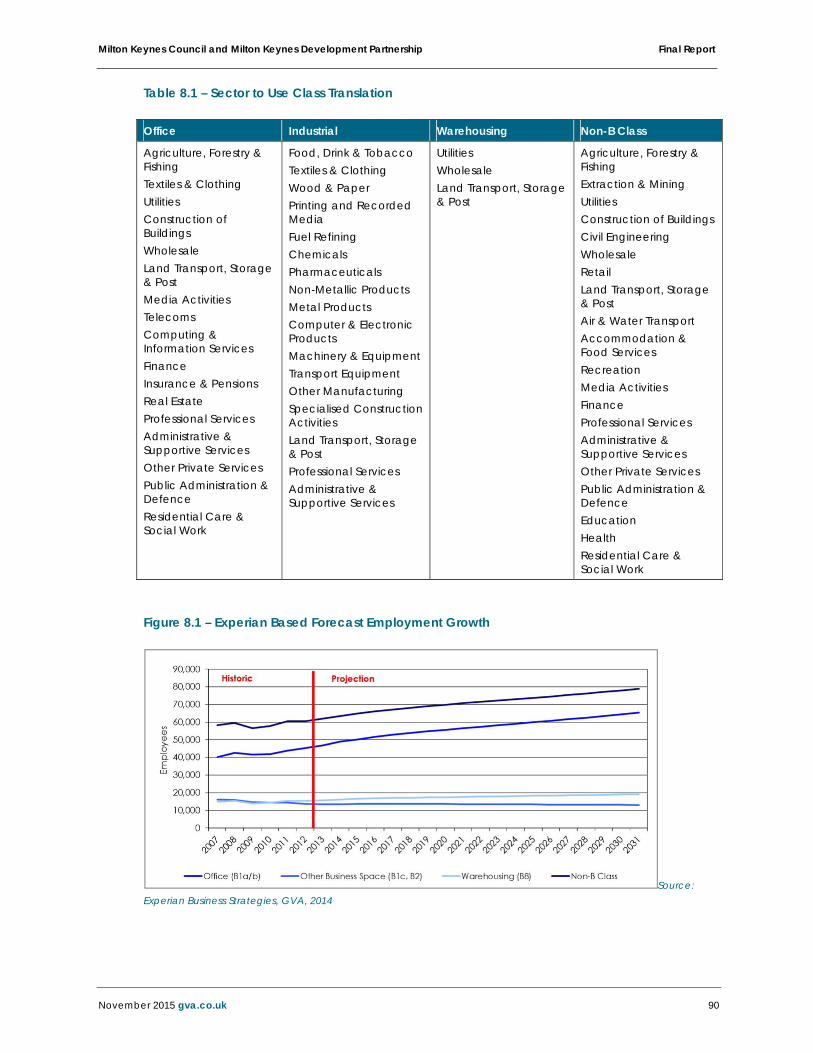
Milton Keynes Council and Milton Keynes Development Partnership Final Report
November 2015 gva.co.uk 90
Table 8.1 – Sector to Use Class Translation
Office Industrial Warehousing Non-B Class
Agriculture, Forestry & Fishing Textiles & Clothing Utilities Construction of Buildings Wholesale Land Transport, Storage & Post Media Activities Telecoms Computing & Information Services Finance Insurance & Pensions Real Estate Professional Services Administrative & Supportive Services Other Private Services Public Administration & Defence Residential Care & Social Work
Food, Drink & Tobacco Textiles & Clothing Wood & Paper Printing and Recorded Media Fuel Refining Chemicals Pharmaceuticals Non-Metallic Products Metal Products Computer & Electronic Products Machinery & Equipment Transport Equipment Other Manufacturing Specialised Construction Activities Land Transport, Storage & Post Professional Services Administrative & Supportive Services
Utilities Wholesale Land Transport, Storage & Post
Agriculture, Forestry & Fishing Extraction & Mining Utilities Construction of Buildings Civil Engineering Wholesale Retail Land Transport, Storage & Post Air & Water Transport Accommodation & Food Services Recreation Media Activities Finance Professional Services Administrative & Supportive Services Other Private Services Public Administration & Defence Education Health Residential Care & Social Work
Figure 8.1 – Experian Based Forecast Employment Growth
Source: Experian Business Strategies, GVA, 2014
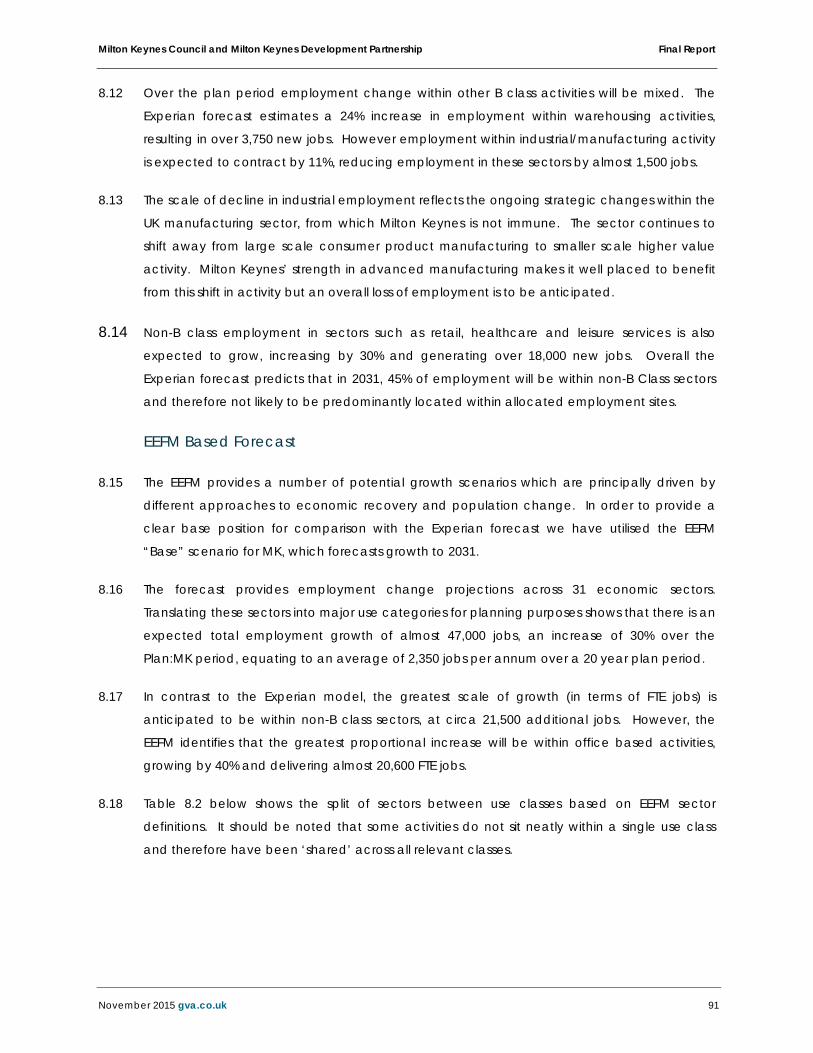
Milton Keynes Council and Milton Keynes Development Partnership Final Report
November 2015 gva.co.uk 91
Over the plan period employment change within other B class activities will be mixed. The 8.12
Experian forecast estimates a 24% increase in employment within warehousing activities,
resulting in over 3,750 new jobs. However employment within industrial/manufacturing activity
is expected to contract by 11%, reducing employment in these sectors by almost 1,500 jobs.
The scale of decline in industrial employment reflects the ongoing strategic changes within the 8.13
UK manufacturing sector, from which Milton Keynes is not immune. The sector continues to
shift away from large scale consumer product manufacturing to smaller scale higher value
activity. Milton Keynes’ strength in advanced manufacturing makes it well placed to benefit
from this shift in activity but an overall loss of employment is to be anticipated.
Non-B class employment in sectors such as retail, healthcare and leisure services is also 8.14expected to grow, increasing by 30% and generating over 18,000 new jobs. Overall the
Experian forecast predicts that in 2031, 45% of employment will be within non-B Class sectors
and therefore not likely to be predominantly located within allocated employment sites.
EEFM Based Forecast
The EEFM provides a number of potential growth scenarios which are principally driven by 8.15
different approaches to economic recovery and population change. In order to provide a
clear base position for comparison with the Experian forecast we have utilised the EEFM
“Base” scenario for MK, which forecasts growth to 2031.
The forecast provides employment change projections across 31 economic sectors. 8.16
Translating these sectors into major use categories for planning purposes shows that there is an
expected total employment growth of almost 47,000 jobs, an increase of 30% over the
Plan:MK period, equating to an average of 2,350 jobs per annum over a 20 year plan period.
In contrast to the Experian model, the greatest scale of growth (in terms of FTE jobs) is 8.17
anticipated to be within non-B class sectors, at circa 21,500 additional jobs. However, the
EEFM identifies that the greatest proportional increase will be within office based activities,
growing by 40% and delivering almost 20,600 FTE jobs.
Table 8.2 below shows the split of sectors between use classes based on EEFM sector 8.18
definitions. It should be noted that some activities do not sit neatly within a single use class
and therefore have been ‘shared’ across all relevant classes.
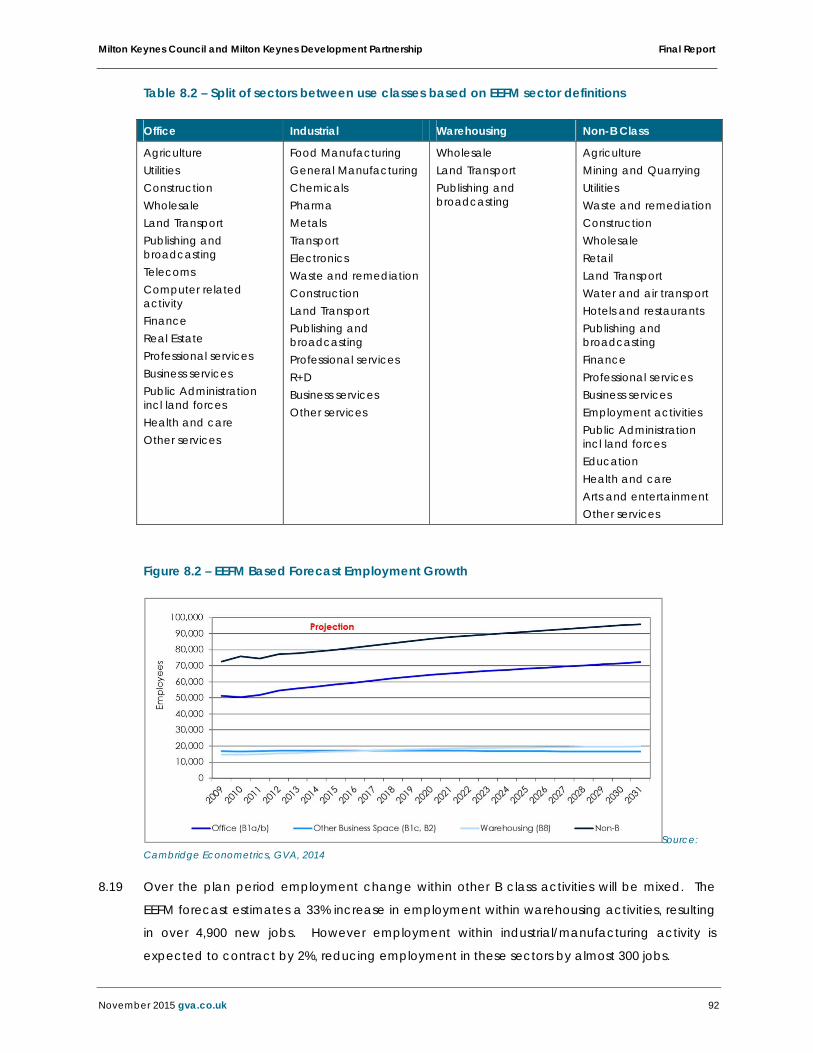
Milton Keynes Council and Milton Keynes Development Partnership Final Report
November 2015 gva.co.uk 92
Table 8.2 – Split of sectors between use classes based on EEFM sector definitions
Office Industrial Warehousing Non-B Class
Agriculture Utilities Construction Wholesale Land Transport Publishing and broadcasting Telecoms Computer related activity Finance Real Estate Professional services Business services Public Administration incl land forces Health and care Other services
Food Manufacturing General Manufacturing Chemicals Pharma Metals Transport Electronics Waste and remediation Construction Land Transport Publishing and broadcasting Professional services R+D Business services Other services
Wholesale Land Transport Publishing and broadcasting
Agriculture Mining and Quarrying Utilities Waste and remediation Construction Wholesale Retail Land Transport Water and air transport Hotels and restaurants Publishing and broadcasting Finance Professional services Business services Employment activities Public Administration incl land forces Education Health and care Arts and entertainment Other services
Figure 8.2 – EEFM Based Forecast Employment Growth
Source: Cambridge Econometrics, GVA, 2014
Over the plan period employment change within other B class activities will be mixed. The 8.19
EEFM forecast estimates a 33% increase in employment within warehousing activities, resulting
in over 4,900 new jobs. However employment within industrial/manufacturing activity is
expected to contract by 2%, reducing employment in these sectors by almost 300 jobs.

Milton Keynes Council and Milton Keynes Development Partnership Final Report
November 2015 gva.co.uk 93
As discussed above the contraction in manufacturing activity is likely to be driven by structural 8.20
changes in the sector however it is likely that Milton Keynes will continue to accommodate a
base of value added manufacturing activity.
Overall the EEFM forecast predicts that, in 2031, 47% of employment will be within non-B Class 8.21
sectors and therefore not likely to be predominantly located within allocated employment
sites.
Translating Employment into Floorspace Requirements
Using employment density assumptions we can translate the job creation forecasts into 8.22
additional floorspace requirements. We draw on a range of sources to identify the
appropriate density figures, starting with the HCA Density Guide (2010).
Office Densities
The British Council for Offices (BCO’s) 2013 Occupier Density Study surveyed the BCO 8.23
membership to identify the relationship between floorspace provision and occupancy (in
terms of employee numbers), this survey drew on occupiers themselves, building architects
and building owners. Overall the sample consisted of 2.5 million sqm of floorspace across 381
properties, providing a base dataset that covered a wide range of stock types, ages and
locations.
To supplement this sample-based approach the study also drew on data held by IPD, which 8.24
again draws on information provided by occupiers. This comprised circa 8.5 million sqm of
office floorspace shared almost equally between public and private sector occupiers. An
additional perception survey was also completed to identify future trends.
Once the data had been collated it was analysed to identify trends by sector and 8.25
geography. At the headline level the Study found that across the UK the mean density per
workplace was 10.9sqm (NIA) with 38% of the sample properties being occupied at density
below 10sqm and 58% occupied at a density between 10sqm and 12sqm.
For the South East region the average occupier density was calculated to be 12.7sqm (NIA), a 8.26
lower density than achieved within Greater London which itself had an average of 11.3sqm
(NIA). It appears from the data, and our wider experience in advising on office development,
that higher densities (between 8 and 10 sqm) tend to mainly be achieved within Central
London where the cost of floorspace and nature of business activity drives occupiers to
increase efficiency.
The BCO also identified general occupier density by broad economic sector, breaking down 8.27
the general trends to understand how certain activities utilise space.

Milton Keynes Council and Milton Keynes Development Partnership Final Report
November 2015 gva.co.uk 94
The initial forecasts identified a range of potential growth sectors within MK, highlighting the 8.28
likely opportunity for office-based growth across primarily professional services, technology
and media and potentially corporates.
Data from the BCO survey suggests that these sectors would operate at a range of densities: 8.29
Corporate activity 13.1sqm;
Professional services 12.3sqm;
Public sector 12.1sqm; and
Technology, media and telecommunications 10.5sqm.
Based on these sectors (which most closely align to the initial forecasts) the average density 8.30
for the borough would be 12sqm per employee, reflecting the average density achieved
across the South East office market.
The study also suggests that whilst there have been recent trends of increasing density, 8.31
principally driven by the need to reduce costs through the recession, occupier density has
begun to plateau suggesting that for many occupiers there are no further opportunities for
using space more efficiently.
However, the study recognises that this trend is not uniform across all sectors and that 8.32
individual circumstances will drive future changes of density. What is clear from the BCO study
is that any ‘general’ trend such as this cannot be relied upon solely to provide a definitive
indication of how occupiers may act in the future.
Warehouse Densities
Employment within the distribution sector is changing rapidly based on a number of 8.33
operational changes within the industry. On the one hand increasing automation is
decreasing the number of ‘warehouse floor’ staff as picking and packing is undertaken by
machine. However, this mechanisation also requires a number of maintenance and support
roles which are serving to offset some of the floor staff losses.
Our experience suggests that in some new build national distribution centres employment 8.34
densities can be over 100sqm per employee. However, research by Prologis suggests that

Milton Keynes Council and Milton Keynes Development Partnership Final Report
November 2015 gva.co.uk 95
changes in the nature of warehousing has actually driven up employment densities to c.
77sqm per employee, particularly in the new generation of ‘dark store’11 fulfilment centres.
It is important to get the employment density for MK correct in order to provide sufficient land 8.35
for the type of activity that will be attracted to the area. MK has a national and regional
distribution role and is one of the key hubs within the M1 corridor (the key distribution location
for the UK). This role attracts large scale distribution activities that occupy large footprint
buildings, these tend to support high levels of mechanisation and therefore employ fewer
staff.
However, given the Study considers MK as a whole, where a range of scales and types of B8 8.36
space will be required, 85 sqm therefore provides a reasonable market ‘average’ whilst
reflecting the unique strategic opportunity.
Floorspace Requirements from Economic Growth
To translate the two base forecast models into floorspace requirements we use the following 8.37
employment densities (in line with the HCA Density Guide Second Edition, 2010):
B1a/b – 12 square metres per employee (NIA);
B1c/B2 – 36 square metres per employee (GIA); and
B8 – 85 square metres per employee (GEA).
Utilising these densities the floorspace requirements from the Experian Based Forecast are 8.38
shown below.
11 A dark store is a large warehouse/distribution operated for the purpose of fulfilling online shopping orders. They are most commonly used by large food retailers to cater for online grocery orders. They carry the same scale and range of goods as a usual supermarket but are not open to the public, accessed only by company employees who pick and pack each order ready for delivery.
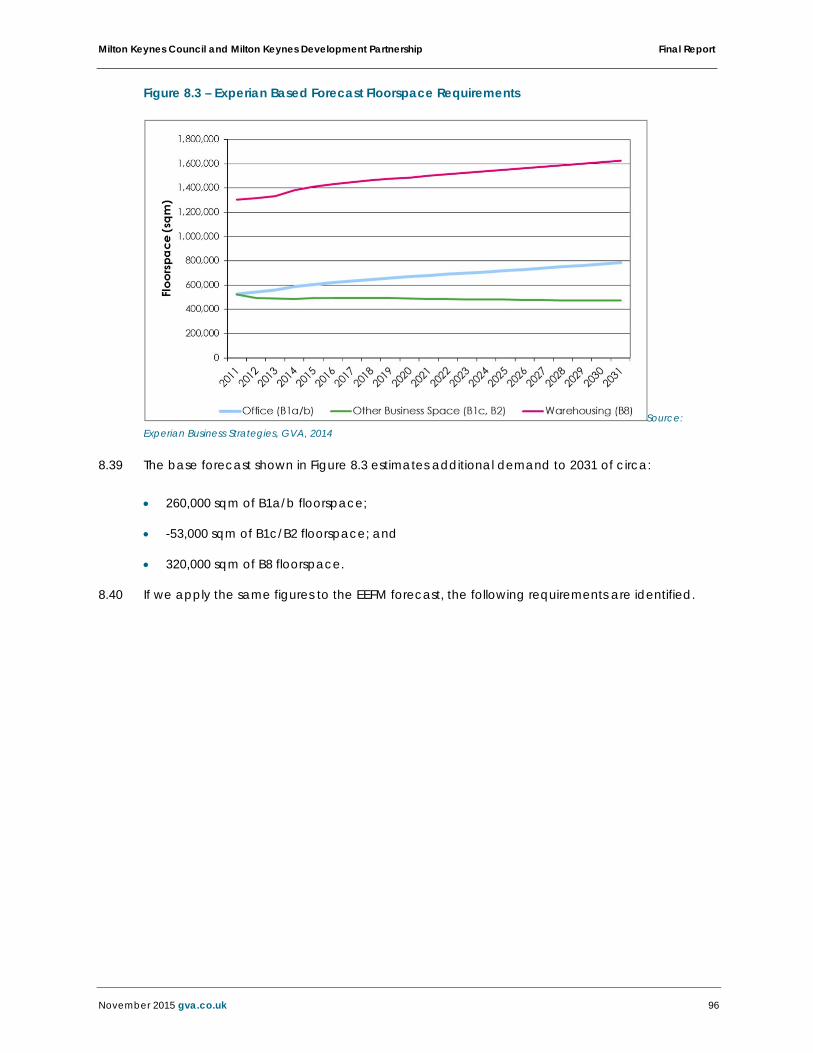
Milton Keynes Council and Milton Keynes Development Partnership Final Report
November 2015 gva.co.uk 96
Figure 8.3 – Experian Based Forecast Floorspace Requirements
Source: Experian Business Strategies, GVA, 2014
The base forecast shown in Figure 8.3 estimates additional demand to 2031 of circa: 8.39
260,000 sqm of B1a/b floorspace;
-53,000 sqm of B1c/B2 floorspace; and
320,000 sqm of B8 floorspace.
If we apply the same figures to the EEFM forecast, the following requirements are identified. 8.40
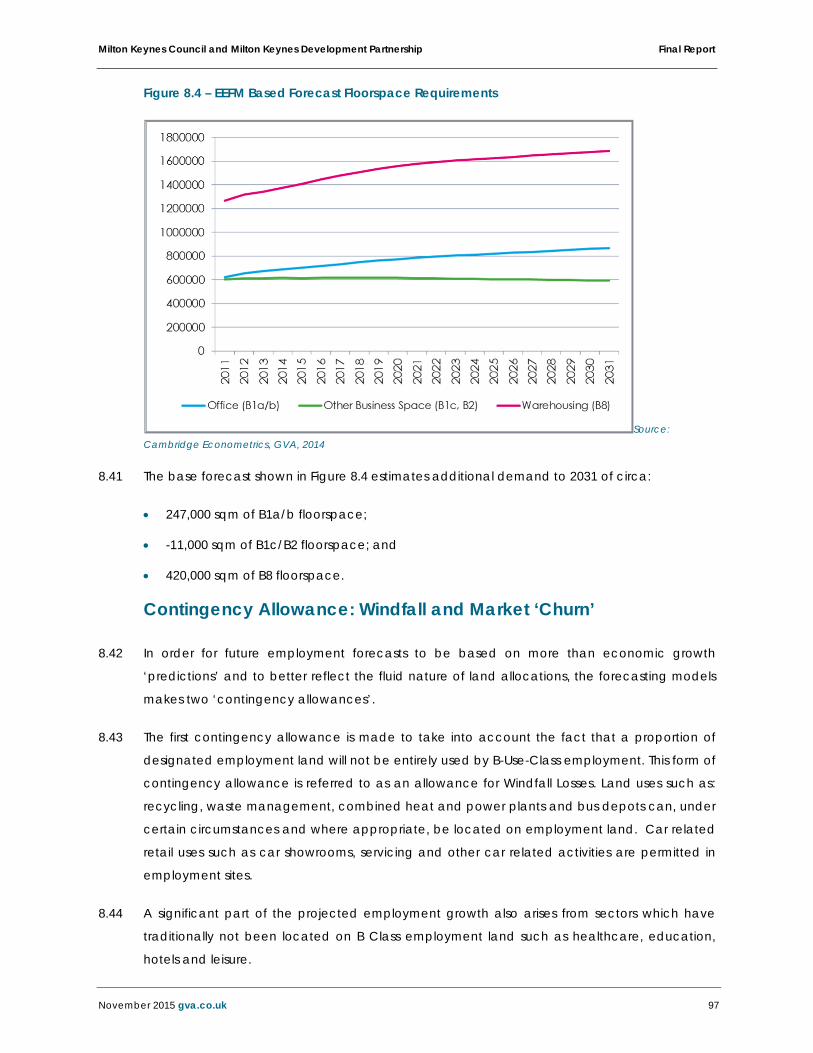
Milton Keynes Council and Milton Keynes Development Partnership Final Report
November 2015 gva.co.uk 97
Figure 8.4 – EEFM Based Forecast Floorspace Requirements
Source: Cambridge Econometrics, GVA, 2014
The base forecast shown in Figure 8.4 estimates additional demand to 2031 of circa: 8.41
247,000 sqm of B1a/b floorspace;
-11,000 sqm of B1c/B2 floorspace; and
420,000 sqm of B8 floorspace.
Contingency Allowance: Windfall and Market ‘Churn’
In order for future employment forecasts to be based on more than economic growth 8.42
‘predictions’ and to better reflect the fluid nature of land allocations, the forecasting models
makes two ‘contingency allowances’.
The first contingency allowance is made to take into account the fact that a proportion of 8.43
designated employment land will not be entirely used by B-Use-Class employment. This form of
contingency allowance is referred to as an allowance for Windfall Losses. Land uses such as:
recycling, waste management, combined heat and power plants and bus depots can, under
certain circumstances and where appropriate, be located on employment land. Car related
retail uses such as car showrooms, servicing and other car related activities are permitted in
employment sites.
A significant part of the projected employment growth also arises from sectors which have 8.44
traditionally not been located on B Class employment land such as healthcare, education,
hotels and leisure.

Milton Keynes Council and Milton Keynes Development Partnership Final Report
November 2015 gva.co.uk 98
Under specific circumstances and where appropriate, employment land might also be used 8.45
as part of a more mixed-use scheme which would enable employment development to
come forward on a proportion of it.
Further, with the extension of Permitted Development Rights (albeit only for three years initially) 8.46
making the conversion of office premises to residential use more straightforward, there is the
potential for an increase in the unexpected loss of employment floorspace. The opportunity
for redevelopment and subsequent loss of floorspace under these extended rights is likely to
become a more significant issue in the future. This will be a particular permanent risk if current
plans to make the extension to PD rights permanent (which the government consulted on in
2014) are confirmed. At present no firm commitment has been made by the government but
confirmation is expected “soon”.
To estimate the amount of land that may be used for non-B class activities (and therefore 8.47
account for a Windfall Loss), historic net losses of employment land to other uses such as
housing and leisure as reported in the Council’s Annual Monitoring Report have been used.
It is important that only land that is truly lost to B Class employment activity is included within 8.48
the Windfall allowance rather than land which is transferred between B class land uses (i.e.
land that changes from B2 activity to B8). To provide this estimate we have utilised the ‘net’
change from the Annual Monitoring Report (AMR). Where the net change has been negative
(i.e. floorspace lost is greater than floorspace gained) we have included these in the Windfall
estimate, where the opposite is true these are included within the ‘Churn’ allowance.
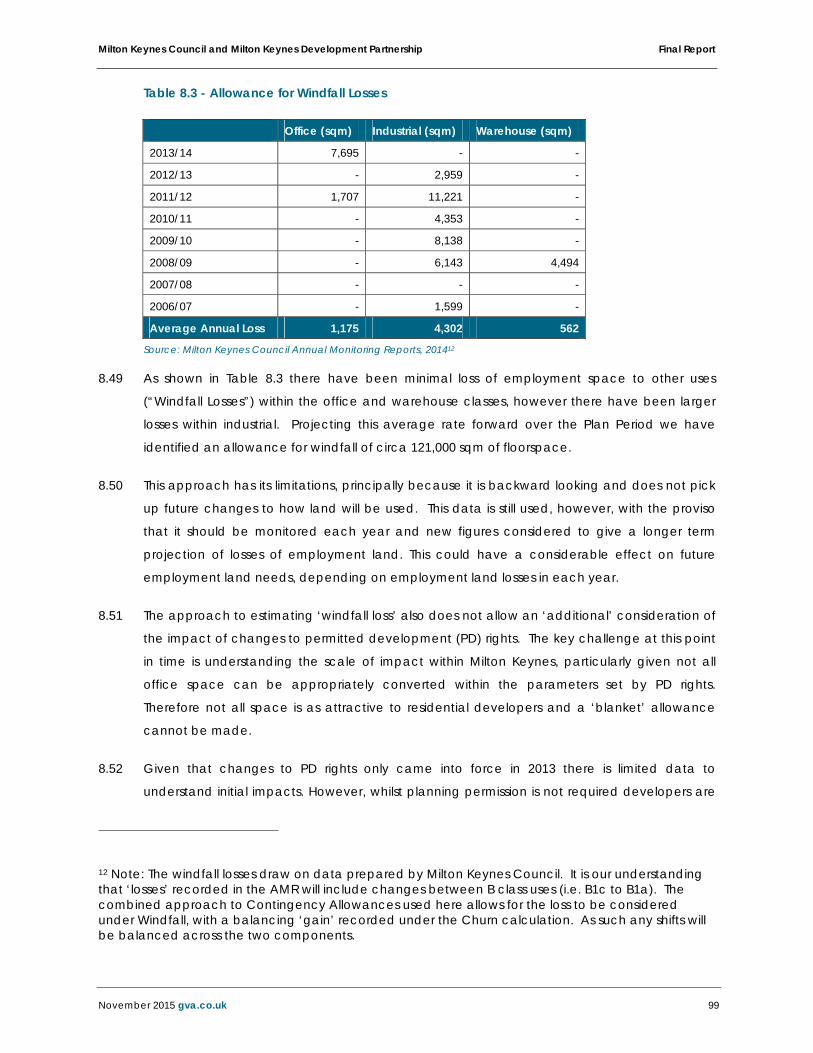
Milton Keynes Council and Milton Keynes Development Partnership Final Report
November 2015 gva.co.uk 99
Table 8.3 - Allowance for Windfall Losses
Office (sqm) Industrial (sqm) Warehouse (sqm)
2013/14 7,695 - -
2012/13 - 2,959 -
2011/12 1,707 11,221 -
2010/11 - 4,353 -
2009/10 - 8,138 -
2008/09 - 6,143 4,494
2007/08 - - -
2006/07 - 1,599 -
Average Annual Loss 1,175 4,302 562
Source: Milton Keynes Council Annual Monitoring Reports, 201412
As shown in Table 8.3 there have been minimal loss of employment space to other uses 8.49
(“Windfall Losses”) within the office and warehouse classes, however there have been larger
losses within industrial. Projecting this average rate forward over the Plan Period we have
identified an allowance for windfall of circa 121,000 sqm of floorspace.
This approach has its limitations, principally because it is backward looking and does not pick 8.50
up future changes to how land will be used. This data is still used, however, with the proviso
that it should be monitored each year and new figures considered to give a longer term
projection of losses of employment land. This could have a considerable effect on future
employment land needs, depending on employment land losses in each year.
The approach to estimating ‘windfall loss’ also does not allow an ‘additional’ consideration of 8.51
the impact of changes to permitted development (PD) rights. The key challenge at this point
in time is understanding the scale of impact within Milton Keynes, particularly given not all
office space can be appropriately converted within the parameters set by PD rights.
Therefore not all space is as attractive to residential developers and a ‘blanket’ allowance
cannot be made.
Given that changes to PD rights only came into force in 2013 there is limited data to 8.52
understand initial impacts. However, whilst planning permission is not required developers are
12 Note: The windfall losses draw on data prepared by Milton Keynes Council. It is our understanding that ‘losses’ recorded in the AMR will include changes between B class uses (i.e. B1c to B1a). The combined approach to Contingency Allowances used here allows for the loss to be considered under Windfall, with a balancing ‘gain’ recorded under the Churn calculation. As such any shifts will be balanced across the two components.

Milton Keynes Council and Milton Keynes Development Partnership Final Report
November 2015 gva.co.uk 100
required to submit a Prior Approval Notice to the planning authority, enabling them to ‘track’
changes that are occurring. Just 2 years after the legislation came into effect we are now
seeing the first indicators of the impact of the change, with the Prior Approvals now providing
some data to estimate the scale of the trend.
Between July 2013 and March 2015 there have been 35 Prior Approval Notifications submitted 8.53
to the Council (23 for residential conversion of employment space) of these which, if delivered
would see the loss of almost 18,000sqm of floorspace. Of this quantum of space five Prior
Approval Notifications were refused, reducing the scale of impact by circa 6,500sqm but still
resulting in a loss of circa 12,000sqm of employment floorspace.
Even with this initial data it is worth exercising a note of caution in extrapolating this into a 8.54
future forecast given it only reflects a short period of time and therefore a long term trend
cannot be established. The current permitted development rights are in place until 2019 but
uncertainty remains as to whether these powers will be further extended. It is likely therefore,
that in the period up to 2019, a number of land owners may be seeking to establish the
development principle to protect their future options. It remains to be seen as to whether the
stock will actually be converted and the impact that this will have on the existing capacity of
B class employment space.
Therefore, whilst there is a need to monitor the impact of conversion as more time passes and 8.55
data becomes available it would be inappropriate to forecast additional need on such time-
limited data. It is recommended that the situation is reviewed once the initial 3 year period
expires to begin to understand the longer term issues that may be created and identify
appropriate remedial actions.
As well as making an allowance for unexpected losses of employment land, allowance is 8.56
made for the fact that locational and premises needs of businesses change over time. This
requires businesses to move. In other instances an existing business might cease its operations
and a new business take over a site for redevelopment. For this to happen smoothly there is a
need for a certain level of available vacant land. This type of demand has been called
‘churn’ demand or ‘frictional vacancy’.
An allowance for ‘churn’ is calculated from the average annual construction rate of space 8.57
within the Borough as recorded within the Annual Monitoring Report, as noted above this
includes data for years where there has been a net increase in floorspace. The net annual
‘gain’ is shown in Table 8.4 below.
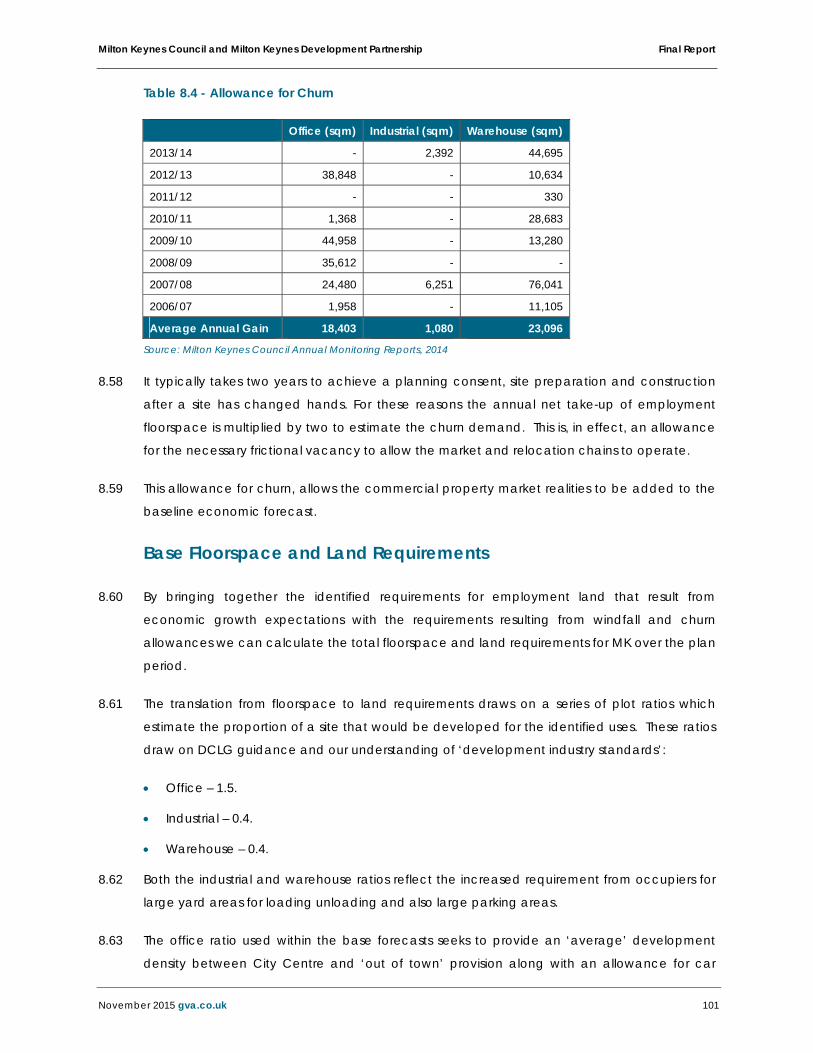
Milton Keynes Council and Milton Keynes Development Partnership Final Report
November 2015 gva.co.uk 101
Table 8.4 - Allowance for Churn
Office (sqm) Industrial (sqm) Warehouse (sqm)
2013/14 - 2,392 44,695
2012/13 38,848 - 10,634
2011/12 - - 330
2010/11 1,368 - 28,683
2009/10 44,958 - 13,280
2008/09 35,612 - -
2007/08 24,480 6,251 76,041
2006/07 1,958 - 11,105
Average Annual Gain 18,403 1,080 23,096
Source: Milton Keynes Council Annual Monitoring Reports, 2014
It typically takes two years to achieve a planning consent, site preparation and construction 8.58
after a site has changed hands. For these reasons the annual net take-up of employment
floorspace is multiplied by two to estimate the churn demand. This is, in effect, an allowance
for the necessary frictional vacancy to allow the market and relocation chains to operate.
This allowance for churn, allows the commercial property market realities to be added to the 8.59
baseline economic forecast.
Base Floorspace and Land Requirements
By bringing together the identified requirements for employment land that result from 8.60
economic growth expectations with the requirements resulting from windfall and churn
allowances we can calculate the total floorspace and land requirements for MK over the plan
period.
The translation from floorspace to land requirements draws on a series of plot ratios which 8.61
estimate the proportion of a site that would be developed for the identified uses. These ratios
draw on DCLG guidance and our understanding of ‘development industry standards’:
Office – 1.5.
Industrial – 0.4.
Warehouse – 0.4.
Both the industrial and warehouse ratios reflect the increased requirement from occupiers for 8.62
large yard areas for loading unloading and also large parking areas.
The office ratio used within the base forecasts seeks to provide an ‘average’ development 8.63
density between City Centre and ‘out of town’ provision along with an allowance for car
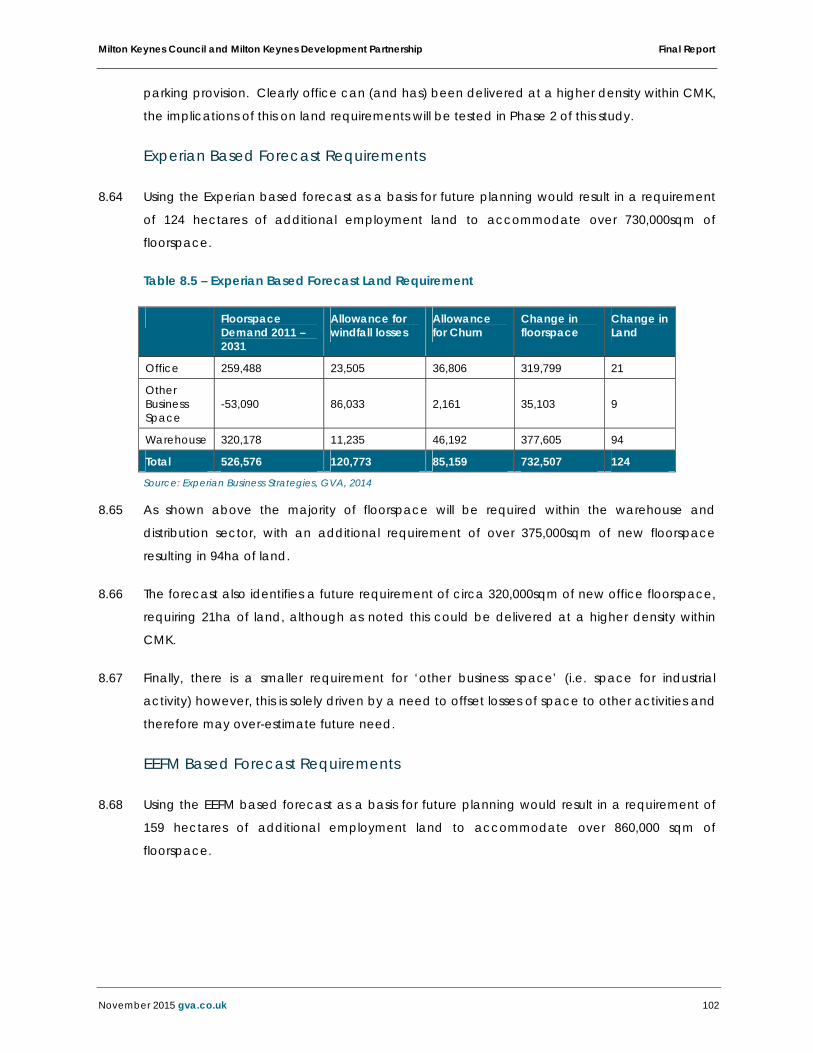
Milton Keynes Council and Milton Keynes Development Partnership Final Report
November 2015 gva.co.uk 102
parking provision. Clearly office can (and has) been delivered at a higher density within CMK,
the implications of this on land requirements will be tested in Phase 2 of this study.
Experian Based Forecast Requirements
Using the Experian based forecast as a basis for future planning would result in a requirement 8.64
of 124 hectares of additional employment land to accommodate over 730,000sqm of
floorspace.
Table 8.5 – Experian Based Forecast Land Requirement
Floorspace Demand 2011 – 2031
Allowance for windfall losses
Allowance for Churn
Change in floorspace
Change in Land
Office 259,488 23,505 36,806 319,799 21
Other Business Space
-53,090 86,033 2,161 35,103 9
Warehouse 320,178 11,235 46,192 377,605 94
Total 526,576 120,773 85,159 732,507 124
Source: Experian Business Strategies, GVA, 2014
As shown above the majority of floorspace will be required within the warehouse and 8.65
distribution sector, with an additional requirement of over 375,000sqm of new floorspace
resulting in 94ha of land.
The forecast also identifies a future requirement of circa 320,000sqm of new office floorspace, 8.66
requiring 21ha of land, although as noted this could be delivered at a higher density within
CMK.
Finally, there is a smaller requirement for ‘other business space’ (i.e. space for industrial 8.67
activity) however, this is solely driven by a need to offset losses of space to other activities and
therefore may over-estimate future need.
EEFM Based Forecast Requirements
Using the EEFM based forecast as a basis for future planning would result in a requirement of 8.68
159 hectares of additional employment land to accommodate over 860,000 sqm of
floorspace.
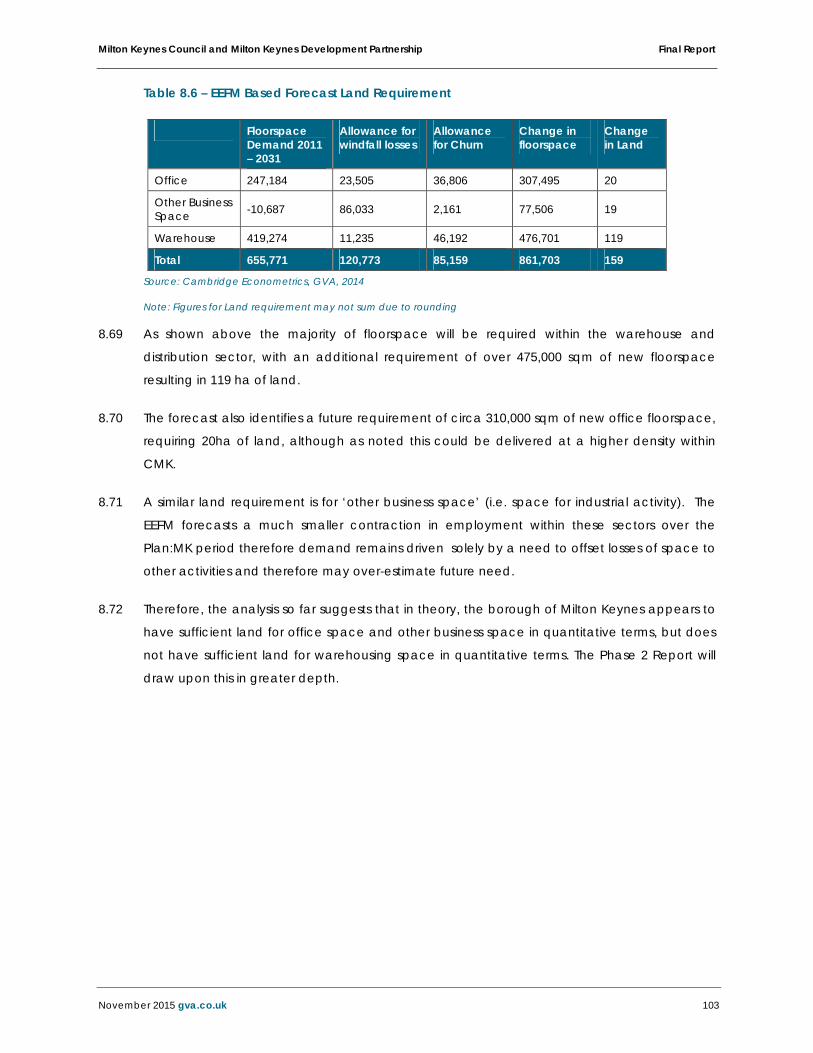
Milton Keynes Council and Milton Keynes Development Partnership Final Report
November 2015 gva.co.uk 103
Table 8.6 – EEFM Based Forecast Land Requirement
Floorspace Demand 2011 – 2031
Allowance for windfall losses
Allowance for Churn
Change in floorspace
Change in Land
Office 247,184 23,505 36,806 307,495 20
Other Business Space -10,687 86,033 2,161 77,506 19
Warehouse 419,274 11,235 46,192 476,701 119
Total 655,771 120,773 85,159 861,703 159
Source: Cambridge Econometrics, GVA, 2014
Note: Figures for Land requirement may not sum due to rounding
As shown above the majority of floorspace will be required within the warehouse and 8.69
distribution sector, with an additional requirement of over 475,000 sqm of new floorspace
resulting in 119 ha of land.
The forecast also identifies a future requirement of circa 310,000 sqm of new office floorspace, 8.70
requiring 20ha of land, although as noted this could be delivered at a higher density within
CMK.
A similar land requirement is for ‘other business space’ (i.e. space for industrial activity). The 8.71
EEFM forecasts a much smaller contraction in employment within these sectors over the
Plan:MK period therefore demand remains driven solely by a need to offset losses of space to
other activities and therefore may over-estimate future need.
Therefore, the analysis so far suggests that in theory, the borough of Milton Keynes appears to 8.72
have sufficient land for office space and other business space in quantitative terms, but does
not have sufficient land for warehousing space in quantitative terms. The Phase 2 Report will
draw upon this in greater depth.
Milton Keynes Council and Milton Keynes Development Partnership Final Report
November 2015 gva.co.uk 104
9. Emerging Quantitative Conclusions
This Phase 1 Technical Analysis Interim Report has drawn together the key findings from the 9.1
baseline stage of work for this Economic Growth and Employment Land Study.
We summarise below the key conclusions from the work to date under the main section 9.2
headings:
Socio-Economic Baseline
Milton Keynes is the fastest growing city in the UK and has seen a population increase of circa 9.3
20% between 2001 and 2011. It has a young population with a high proportion of people
under the age of 16 (22%). Notwithstanding this, at least 66% of its population are of working
age. This is reflected in its high economic activity rate of 76%, proportionately higher than the
regional context.
About 49% of its total population is in employment and its economically active rate is 68%, 9.4
which is proportionately higher than regional and national averages. Although this is a good
sign unemployment rates have increased in Milton Keynes during the last decade by 3.3%
which is higher than regional and national averages. Milton Keynes also has higher rates of
claimant count that worsened during the recession. Milton Keynes’ population has high skill
levels with at least 82% having some form of qualification and a high proportion having level 4
qualifications.
There is a cluster of sector strength in Financial Services, IT Consulting, Security Related 9.5
Services, Transport and related supply chain activities and Food and Beverage
manufacturing. This is also reflected in the GVA contribution trends which indicates that
Distribution and transport (30%); Public administration (14%); Business services (12%); IT (10%)
and Finance (5%); and Real estate activities (10%) as key drivers of the economy.
MK has a containment rate of 64% of jobs for its employed population. The rest of its workforce 9.6
travels to the neighbouring boroughs of Central Bedfordshire, Bedford, Aylesbury Vale and
Central London. Milton Keynes has relatively strong workplace based earning with average
earnings of those who commute in to Milton Keynes being higher than those of resident
workers.
In terms of economic performance Milton Keynes was ranked highest among all the 11 local 9.7
authorities in the South East Midlands LEP and was among the top 15% most competitive
localities in the UK out of all the local authorities in the UK ranked by UKCI.

Milton Keynes Council and Milton Keynes Development Partnership Final Report
November 2015 gva.co.uk 105
Milton Keynes has shown significantly stronger business growth trends between 2004 and 2011 9.8
compared with the regional and national average in 2011. About 88% of the businesses in the
borough are micro units with a maximum of 10 employees. Despite this the City has a high
proportion of large enterprises in Milton Keynes. Business survival rates in Milton Keynes are
quite poor with only 42% of businesses surviving for a 5 year period compared with the South
East (47.3%) and national average (44.4%).
Neighbours Policy Aspirations
MK works closely with its neighbouring Local Authorities under the ‘Duty to Co-operate’ 9.9
banner.
The key issues of relevance to Milton Keynes neighbours are the balance between 9.10
employment/housing land, commuting patterns, economic growth sectors, cross boundary
infrastructure provision and demand forecasting as follows:
Employment/housing land – the integration of both the housing and employment needs
and availability assessments to deliver economic growth will be critical particularly when
neighbouring authorities consider any unmet objectively assessed needs for housing;
Commuting - it would be useful for the Study to provide more information about existing
commuting patterns and the characteristics of commuters and their jobs. This could also
be supported by trend and policy scenarios of how this is expected to change in the
future;
Growth sectors – minimising competition in key growth sectors and the identification of the
unique selling points of each individual local authority area are key drivers to ensure that
market share is maintained;
Infrastructure - more attention should be paid to infrastructure investment synergies across
boundaries to mutual benefit; and
Forecasting – a level of consistency is needed between forecasting methodologies with a
standard approach required to gain a common understanding of the cross boundary
implications of future demand and supply for jobs and employment space.
Property Market Analysis
The MK property market is dominated by leasehold floorspace with a lot of this dating back to 9.11
the 1970s and 1980s when the new town was being developed. Much of this stock is no longer
‘fit for purpose’ nor does it meet the needs of the modern occupiers.
Of the available leasehold floorspace there is a greater proportion of office space compared 9.12
to industrial floorspace.

Milton Keynes Council and Milton Keynes Development Partnership Final Report
November 2015 gva.co.uk 106
Asking rents for secondary office properties are around £118 psm on average throughout MK. 9.13
There is a considerable amount of vacant stock of this type, particularly in CMK.
Grade A office rental values are on average around £151 psm outside CMK, rising to between 9.14
£16.00-20.00 psf within the city centre.
There is significantly less industrial and office freehold accommodation currently on the market 9.15
but where opportunities exist there are more industrial properties available for freehold tenure
than office properties.
Over the last five years, take up has exceeded 92,903 for both leasehold office and industrial 9.16
floorspace with office accommodation seeing, on average, the greatest take up of circa
130,102sqm p.a. as opposed to industrial at circa 92,977p.a.
As we’d expect, over a similar time period there have been a smaller number of freehold 9.17
transactions across both property market sectors. The average unit size sold in freehold
transactions is greater than that in leasehold deals. This supports our understanding that there
remains owner occupier demand for freehold accommodation of a larger size.
Employment Land Supply
The supply of employment land in Milton Keynes consists of three key components: 9.18
Existing Employment Sites – mixture of existing industrial estates and office parks that
contribute to the employment land supply in Milton Keynes;
Proposed Sites – within or bordering existing employment sites that may be developed and
contribute to meeting future employment land requirements in Milton Keynes; and
Potential Sites – new undeveloped land that may be developed and contribute to
meeting future employment land requirements in Milton Keynes.
The review of these components included both quantitative and qualitative elements. 9.19
The quantum of sites split between the existing employment sites, proposed sites and potential 9.20
sites is shown in Table 8.5 below.

Milton Keynes Council and Milton Keynes Development Partnership Final Report
November 2015 gva.co.uk 107
Table 9.1 – Overview of Employment Land Supply in Milton Keynes
Existing Employment
Sites
Proposed Sites
Potential Sites
Supply (hectares) 988 36.86 160.65
TOTAL 1,185.51 hectares Source: GVA, 2014.
This clearly shows that the Borough has a significant amount of land supply within these three 9.21
categories.
We highlight below the key conclusions from each of the types of employment land supply 9.22
that we considered.
Existing Employment Sites
Market Assessment – the majority of existing stock (99%) within Milton Keynes is ranked as 9.23
being of good or excellent quality. 40% of sites representing 395.5 ha is identified as excellent
quality and 59% sites representing 584.92 ha is identified as good quality.
Physical Assessment – the majority of existing stock within Milton Keynes is ranked as being of 9.24
good or excellent quality. 52% of sites representing 513.84 ha is identified as excellent quality
and 46% of sites representing 455.65 ha is identified as good quality. Only 2% of sites score an
average ranking.
B Class Employment Uses – there is a broad mix of B class employment use within Milton 9.25
Keynes. The majority of employment land provides a mix of office, industrial and
warehouse/distribution uses (B1, B2 and B8) in a single setting (13 sites) or industrial and
warehouse/distribution use (B2 and B8) in a single setting (9 sites).
Vacancies – Our employment sites assessment indicates that 29 sites (63%) are fully occupied 9.26
and 17 sites (37%) have either vacant units, plots or land advertised.
Proposed Sites
Market Assessment – the majority of proposed employment sites ranked as being good 9.27
quality. 22 of the 27 sites received this ranking, representing 29.08 ha of land, which is 80% of
the total supply of proposed sites.
Physical Assessment – the majority of proposed employment sites ranked as being excellent 9.28
quality. 22 of the 27 sites received this ranking, representing 31.42 ha of land, which is 85% of
the total supply of proposed sites.

Milton Keynes Council and Milton Keynes Development Partnership Final Report
November 2015 gva.co.uk 108
As there appears to be limited expansion space in existing employment sites, it will be 9.29
necessary for the potential sites to provide supply to meet market demand.
Potential Sites
Market Assessment – the greatest proportion of the potential sites within Milton Keynes is 9.30
ranked as being of good quality (49%), followed by stock which is ranked as excellent quality
(45%).
Physical Assessment – the greatest proportion of the potential sites within Milton Keynes is 9.31
ranked as being of excellent quality. 33 sites representing 147.47 ha of land and representing
92% of the total area are identified as excellent quality.
B Class Employment Uses – As these are potential sites, they all comprise vacant land. As the 9.32
sites are independent to existing employment sites, they could come forward as any type of ‘B
class’ employment use.
Stakeholder Engagement
GVA has held two workshops with key stakeholders with the first focussing on the economic 9.33
baseline evidence base, and the second focussing on the employment land supply and
property market.
In addition to this we have engaged with local agents active in the property market, a range 9.34
of public and private sector stakeholders with interest in the outcome of the study and have
given all Local Authorities that neighbour Milton Keynes the opportunity to engage with the
process.
We summarise below the key findings from this engagement: 9.35
Table 9.2 – The Economic Baseline
Skills
Need to balance skills to meet those required for knowledge based business growth;
Linked to the lack of ‘traditional’ Higher Education (HE) institutions in Milton Keynes;
Current mis-match between workforce skills and business needs;
MK both exports and imports higher skilled workers; and
Overcoming skills issues was seen as the key challenge to economic success.

Milton Keynes Council and Milton Keynes Development Partnership Final Report
November 2015 gva.co.uk 109
Higher Education (HE)
It could take up until the end of the plan period (2031) to see the benefits to the economy as a
result of a University presence – is it worth it?;
Could the existing HE provision ‘do more’ in generating business growth?;
The opportunity to work with Cranfield could drive growth in MK linked to engineering research;
and
Is there an alternative to a University as a growth driver?
Knowledge based economy drivers
More locally relevant and organic approaches such as a Science Park in the City, the Smart City
initiative and innovation driven by existing businesses was considered a more appropriate
approach for MK;
The transport sector can be captured as an alternative knowledge economy driver, particularly if
linked to opportunities for pilot, trial or demonstration projects within the City; and
External links via Cranfield provide opportunities.
Travel to Work
MK is losing skills to other districts and there is a reliance on labour from other areas;
Economically this was not seen as a disadvantage but more a sign of the role of MK in the sub-
region and its growing maturity as an economic hub;
In planning and sustainability terms a greater balance between population and employment
would be beneficial; and
Further analysis of Travel to Work data could be undertaken to understand the sectoral and
occupational split of those who are travelling outside MK.
Property Values
Impact and implications for the delivery of new space and the refurbishment of existing space was
an important consideration for future economic activity;
Inability to viably deliver good quality new stock will impact the quality of businesses attracted to
MK; and
A lack of good quality new stock will potentially deter higher value activity who seek Grade A
stock.
Retail Sector
The impact that changes in consumer habits will have on the economy were considered.

Milton Keynes Council and Milton Keynes Development Partnership Final Report
November 2015 gva.co.uk 110
Small businesses
The high failure rate after 4/5 years was recognised;
The start-up and small business community in the longer term is seen as a major economic
opportunity, particularly in terms of increasing employment density within sites; and
Appropriate workspace would be needed to include small start-up facilities but also larger ‘move
on’ spaces i.e. a Science Park and its potential linkages to either private sector research based
organisations/the HE sector.
Socio-economic Indicators
Regional comparisons may not show MK in its true context and the study should include more
comparator cities like Reading, Swindon, Brighton, Peterborough and Guildford as ‘benchmarks’.
Source: GVA, 2014.
Table 9.3 – Employment Land Supply/Property Market
Parking
Property agents feel that the lack of available parking in CMK is a deterrent to potential occupiers;
The cost is considered to be too high;
There is an undersupply of parking spaces in the ‘business zone’ during the week and in the ‘retail
zone’ during the weekend;
There is also no overspill or out-of-town parking available, and the park-and-ride facility is
underutilised.
Market and competing locations
Milton Keynes has a three tier market;
Luton and Northampton were cited as being competing locations, despite having lower rental
levels;
Insufficient new ‘Grade A’ office stock in CMK;
No clear employment land identity;
Incentives are needed i.e. reduced business rates and service charges to encourage investment,
and to facilitate partnership working;
Developers are not currently considering design and build opportunities; and
Strong, active and vocal group who oppose any regeneration that moves away from the 1970’s
new town vision.

Milton Keynes Council and Milton Keynes Development Partnership Final Report
November 2015 gva.co.uk 111
Suitability of employment land and property
The industrial stock is out-of-date and ‘tired’;
The secondary industrial stock lacks a yard, external open space and has low eave heights which
are not suitable for modern occupiers.
Over supply of small units around the 5,000 sqft size;
Many employment estates are identical and with the exception of Magna Park, none stand out as
having a unique offer in terms of specifications;
Agents stated that modern occupiers seek units with a mix of 90% industrial/10% office floorspace;
Major corporates prefer freehold ownership;
Only two Grade A office developments with the majority of others dating back to the 1970s and
1980s and are becoming tired and in need of refurbishment;
Out of centre office parks are private sector led and need additional amenities;
Occupiers don’t need to be located in CMK provided the right infrastructure and amenities are in
place;
Broadband provision is better outside of CMK;
Limited office stock below 1,000 sqft; and
There is a need to target SME’s and provide incubation space.
Proposed and potential sites
Some proposed sites will only be brought forward by the current occupier as expansion space and
are unlikely to be available to the wider market; and
Some potential sites are constrained and may be more suitable for alternative forms of
development, such as residential.
Source: GVA, 2014.
Forecast Demand Scenario
Given the relationship between the Milton Keynes economy and its neighbours it is important 9.36
that the evidence base for Plan:MK provides a robust understanding of economic potential
that is consistent with the neighbouring areas.
Therefore, as a starting point for the future growth forecasts we have prepared two ‘base’ 9.37
positions utilising both the East of England Forecasting Model EEFM and Experian forecasts as
shown in Table 8.7 below:
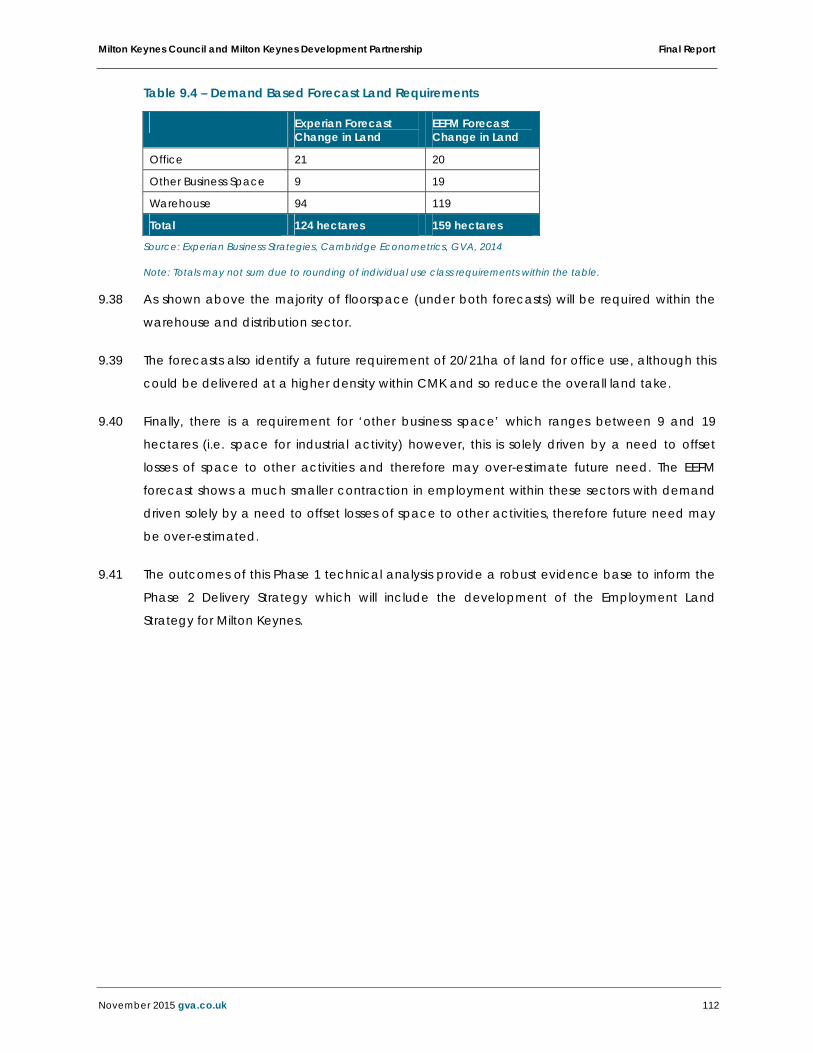
Milton Keynes Council and Milton Keynes Development Partnership Final Report
November 2015 gva.co.uk 112
Table 9.4 – Demand Based Forecast Land Requirements
Experian Forecast Change in Land
EEFM Forecast Change in Land
Office 21 20
Other Business Space 9 19
Warehouse 94 119
Total 124 hectares 159 hectares
Source: Experian Business Strategies, Cambridge Econometrics, GVA, 2014
Note: Totals may not sum due to rounding of individual use class requirements within the table.
As shown above the majority of floorspace (under both forecasts) will be required within the 9.38
warehouse and distribution sector.
The forecasts also identify a future requirement of 20/21ha of land for office use, although this 9.39
could be delivered at a higher density within CMK and so reduce the overall land take.
Finally, there is a requirement for ‘other business space’ which ranges between 9 and 19 9.40
hectares (i.e. space for industrial activity) however, this is solely driven by a need to offset
losses of space to other activities and therefore may over-estimate future need. The EEFM
forecast shows a much smaller contraction in employment within these sectors with demand
driven solely by a need to offset losses of space to other activities, therefore future need may
be over-estimated.
The outcomes of this Phase 1 technical analysis provide a robust evidence base to inform the 9.41
Phase 2 Delivery Strategy which will include the development of the Employment Land
Strategy for Milton Keynes.

gva.co.uk
Appendix A Employment Sites Assessment Matrix
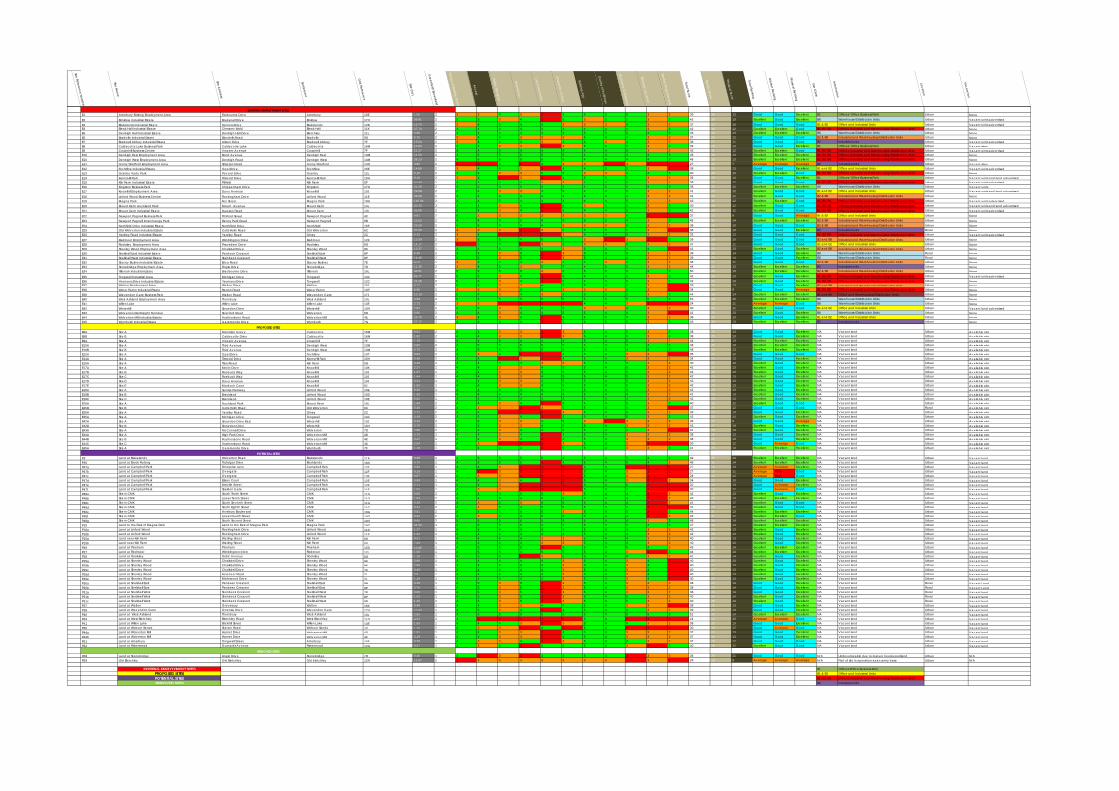
Site Reference Num
ber
Site Nam
e
Site Address
Settlement
Grid Reference
Size (ha)
Greenfield/Brow
nfield
Nature of Existing Tenna
Access
Public Transport
Prominence
Local Am
enities
Character of A
rea
Building Age
Quality of buildings
Economic C
onstraints
Strategic Location
Market A
ttractiveness
Total Score
Market Score
Physical Score
Total Ranking
Market Ranking
Physical Ranking
Use Class
Information
Location
Vacancies
EXISTING EMPLOYMENT SITES E1 Atterbury Existing Employment Area Fairbourne Drive Atterbury 15E 1.55 2 3 3 4 3 2 4 5 5 5 3 2 39 26 13 Good Good Excellent B1 Offices/ Office Business Park Urban NoneE2 Brinklow Industrial Estate Brudenell Drive Binklow 17H 36.91 2 5 5 3 4 1 5 3 5 5 3 3 42 29 13 Excellent Good Excellent B8 Warehouse/Distribution Units Urban Vacant units advertised
E3 Blakelands Industrial Estate Tanners Drive Blakelands 12B 16.73 2 3 4 4 4 4 3 3 3 4 3 2 37 27 10 Good Good Good B1 & B2 Office and Industrial Units Urban Vacant units advertised E4 Bleak Hall Industrial Estate Chesney Wold Bleak Hall 11K 27.74 2 4 4 4 4 4 4 4 4 4 3 3 42 30 12 Excellent Excellent Good B1, B2, B8 Offices, Industrial and Warehousing/Distribution Units Urban NoneE5 Denbigh Hall Industrial Estate Denbigh Hall Drive Bletchley 11L 4.96 2 4 4 4 4 4 4 5 5 5 4 3 46 32 14 Excellent Excellent Excellent B8 Warehouse/Distribution Units Urban NoneE6 Bradv ille Industrial Estate Blundells Road Bradv ille 9D 5.75 2 3 4 4 3 3 3 4 4 4 3 2 37 25 12 Good Good Good B2 & B8 Industrial and Warehousing/Distribution Units Urban NoneE7 Bradwell Abbey Industrial Estate Alston Drive Bradwell Abbey 7F 15.64 2 3 4 4 4 3 4 4 3 4 3 2 38 27 11 Good Good Good B2 Industrial units Urban Vacant units advertisedE8 Caldecotte Lake Business Park Caldecotte Lake Caldecotte 16M 10.65 2 4 4 3 3 1 3 5 5 5 3 3 39 25 14 Good Good Excellent B1 Offices/ Office Business Park Urban Vacant sitesE9 Crownhill Business Centre Vincent Avenue Crownhill 7F 21.27 2 4 4 5 4 4 4 4 4 5 3 2 43 31 12 Excellent Excellent Good B1, B2, B8 Offices, Industrial and Warehousing/Distribution Units Urban Vacant units aderv tised E10 Denbigh East Employment Area Bond Avenue Denbigh East 13M 14.50 2 4 5 5 5 5 5 4 4 4 4 3 48 35 13 Excellent Excellent Excellent B1, B2, B8 Offices, Industrial and Warehousing/Distribution Units Urban NoneE10 Denbigh West Employment Area Denbigh Road Denbigh West 14M 38.13 2 4 5 5 5 5 5 4 4 4 4 3 48 35 13 Excellent Excellent Excellent B1, B2, B8 Offices, Industrial and Warehousing/Distribution Units Urban NoneE11 Fenny Stratford Employment Area Simpson Road Fenny Stratford 14N 4.85 2 2 2 4 1 4 3 3 2 3 2 1 27 20 7 Average Average Average B2 Industrial units Urban Vacant sites E12 Fox Milne Industrial Estate Opal Drive Fox Milne 15E 14.80 2 3 4 4 3 2 4 4 5 5 3 1 38 25 13 Good Good Excellent B1 and B2 Office and Industrial Units Urban Vacant units advertisedE13 Granby Trade Park Peverel Drive Granby 12L 5.10 2 4 4 3 3 5 4 3 3 4 4 3 40 30 10 Excellent Excellent Good B1, B2, B8 Offices, Industrial and Warehousing/Distribution Units Urban NoneE14 Kents Hill Park Timbold Drive Kents Hill Park 15H 8.15 2 3 4 1 3 1 4 5 5 5 3 2 36 22 14 Good Good Excellent B1 Offices/ Office Business Park Urban Vacant units and land advertisedE15 Kiln Farm Industrial Estate Pitfield Kiln Farm 5F 50.90 2 4 4 4 4 3 3 4 4 4 3 2 39 27 12 Good Good Good B1, B2, B8 Offices, Industrial and Warehousing/Distribution Units Urban Vacant units advertised E16 Kingston Business Park Chippenham Drive Kingston 17G 55.39 2 4 5 4 5 4 4 5 5 5 4 3 48 33 15 Excellent Excellent Excellent B8 Warehouse/Distribution Units Urban Vacant units E17 Knowlhill Employment Area Davy Avenue Knowlhill 10J 29.98 2 4 4 3 3 4 5 4 4 5 3 2 41 29 12 Excellent Good Good B1 and B2 Office and Industrial Units Urban Vacant units and land advertisedE18 Linford Wood Business Centre Rockingham Drive Linford Wood 11E 38.68 2 4 4 4 4 4 4 4 4 4 3 2 41 29 12 Excellent Good Good B2 & B8 Industrial and Warehousing/Distribution Units Urban NoneE19 Magna Park Fen Street Magna Park 19G 110.04 2 4 4 5 4 4 4 4 4 5 3 2 43 31 12 Excellent Excellent Good B1, B2, B8 Offices, Industrial and Warehousing/Distribution Units Urban Vacant units aderv tised E20 Mount Farm Auckland Park Mount Avenue Mount Farm 14L 20.33 2 4 4 3 4 1 5 3 5 5 3 3 40 28 12 Excellent Good Good B1, B2, B8 Offices, Industrial and Warehousing/Distribution Units Urban Vacant units and land advertised E21 Mount Farm Industrial Estate Dawson Road Mount Farm 13L 33.90 2 5 4 3 4 1 5 4 4 5 3 3 41 29 12 Excellent Good Good B1, B2, B8 Offices, Industrial and Warehousing/Distribution Units Urban Vacant units advertised
E22 Newport Pagnell Business Park Tickford Street Newport Pagnell 4C 4.81 2 4 3 3 3 3 3 3 3 4 2 1 32 23 9 Good Good Average B1 & B2 Office and Industrial Units Urban NoneE23 Newport Pagnell Interchange Park Renny Park Road Newport Pagnell 6B 22.63 2 4 4 4 5 4 4 5 5 4 3 3 45 31 14 Excellent Excellent Excellent B2 & B8 Industrial and Warehousing/Distribution Units Urban NoneE24 Nothfield Drive Industrial Estate Northfield Drive Northfield 15E 23.26 2 4 4 4 4 4 3 3 3 4 3 2 38 28 10 Good Good Good B2 & B8 Industrial and Warehousing/Distribution Units Urban NoneE25 Old Wolverton Industrial Estate Colts Holm Road Old Wolverton 6C 57.60 2 3 3 3 2 3 5 5 5 5 3 1 38 25 13 Good Good Excellent B2 Industrial units Rural NoneE26 Yardley Road Industrial Estate Yardley Road Olney 2C 9.32 2 3 4 1 2 2 3 4 4 5 3 2 33 21 12 Good Good Good B1, B2, B8 Offices, Industrial and Warehousing/Distribution Units Urban Vacant units advertisedE27 Redmoor Employment Area Wimblington Drive Redmoor 12K 13.59 2 3 5 5 4 5 5 3 2 3 1 3 39 29 10 Good Good Good B2 and B8 Industrial and Warehousing/Distribution Units Urban NoneE28 Rooksley Employment Area Precedent Drive Rooksley 9G 14.17 2 2 5 4 2 3 5 3 3 5 3 2 37 26 11 Good Good Good B1 and B2 Office and Industrial Units Urban NoneE29 Shenley Wood Employment Area Chalkdell Drive Shenley Wood 8K 13.37 1 4 4 4 4 4 3 5 4 4 4 1 41 28 13 Excellent Good Excellent B2 and B8 Industrial and Warehousing/Distribution Units Urban NoneE30 Snelshall East Industrial Estate Pendeen Crescent Snelshall East 8P 6.30 2 4 5 3 5 1 3 5 4 4 3 2 39 25 14 Good Good Excellent B8 Warehouse/Distribution Units Rural NoneE31 Snelshall West Industrial Estate Steinbeck Crescent Snelshall West 8P 14.46 2 4 5 3 5 1 3 5 4 4 3 2 39 25 14 Good Good Excellent B8 Warehouse/Distribution Units Rural NoneE32 Stacey Bushes Industrial Estate Erica Road Stacey Bushes 7E 8.55 2 3 4 4 4 3 4 4 3 4 3 2 38 27 11 Good Good Good B2 & B8 Industrial and Warehousing/Distribution Units Urban NoneE33 Stonebridge Employment Area Fingle Drive Stonebridge 7D 11.35 2 3 4 5 3 5 5 4 5 5 3 2 44 31 13 Excellent Excellent Excellent B2 Industrial units Urban NoneE34 Tillbrook Industrial Estate Bradbourne Drive Tillbrook 16L 43.51 2 5 5 5 5 3 5 5 5 5 4 3 50 35 15 Excellent Excellent Excellent B2 & B8 Industrial and Warehousing/Distribution Units Urban None
E35 Tongwell Industrial Area Michigan Drive Tongwell 13C 56.77 2 5 5 3 4 1 5 4 4 5 3 3 42 29 13 Excellent Good Excellent B1, B2, B8 Offices, Industrial and Warehousing/Distribution Units Urban Vacant units advertisedE36 Yeomans Drive Industrial Estate Yeomans Drive Tongwell 12C 22.26 2 5 5 3 4 1 5 4 4 5 3 3 42 29 13 Excellent Good Excellent B1, B2, B8 Offices, Industrial and Warehousing/Distribution Units Urban NoneE37 Walton Employment Area Walton Drive Walton 15J 9.17 2 4 4 3 3 4 4 5 4 4 3 1 39 26 13 Good Good Excellent B2 and B8 Industrial and Warehousing/Distribution Units Urban NoneE38 Water Eaton Industrial Estate Barton Road Water Eaton 13P 8.85 2 3 3 3 4 4 3 3 3 4 3 1 34 25 9 Good Good Average B1, B2, B8 Offices, Industrial and Warehousing/Distribution Units Urban NoneE39 Wavendon Gate Business Park Walton Road Wavendon Gate 17J 10.13 2 5 4 3 4 3 4 5 5 5 3 3 44 30 14 Excellent Excellent Excellent B1 and B8 Office and Warehousing/Distribution Units Urban NoneE40 West Ashland Employment Area Thornbury West Ashland 13L 3.58 2 5 5 5 5 5 5 5 5 5 5 3 53 38 15 Excellent Excellent Excellent B8 Warehouse/Distribution Units Urban NoneE41 Willen Lake Willen Lake Willen Lake 13E 2.73 2 3 3 1 1 1 2 4 4 3 1 1 24 13 11 Average Average Good B8 Warehouse/Distribution Units Urban NoneE42 Winterhill Snowdon Drive Winterhill 10H 7.97 2 4 5 3 4 4 5 3 3 4 3 2 40 29 11 Excellent Good Good B1 and B2 Office and Industrial Units Urban Vacant land advertisedE43 Wolverton Rail Freight Terminal Stratford Road Wolverton 6D 6.80 2 4 4 3 4 4 5 5 4 4 3 1 41 28 13 Excellent Good Excellent B8 Warehouse/Distribution Units Urban NoneE44 Wolverton Mill Industrial Estate Featherstone Road Wolverton Mill 4E 23.70 2 3 4 3 4 2 4 4 5 4 3 2 38 25 13 Good Good Excellent B1 and B2 Office and Industrial Units Urban NoneE45 Wymbush Industrial Estate Garamonde Drive Wymbush 7G 27.17 1 4 4 4 4 2 5 4 5 5 3 3 43 30 13 Excellent Excellent Excellent B2 Industrial units Urban None
0 0
E8A Site A Monellan Grove Caldecotte 15M 0.61 2 4 4 3 3 1 3 5 4 5 3 3 38 25 13 Good Good Excellent NA Vacant land Urban Available plot E8B Site B Caldecotte Drive Caldecotte 16M 1.92 2 4 4 3 3 1 3 5 4 5 3 3 38 25 13 Good Good Excellent NA Vacant land Urban Available plot E9A Site A Vincent Avenue Crownhill 7F 1.19 1 4 4 5 4 4 4 5 4 5 3 2 44 31 13 Excellent Excellent Excellent NA Vacant land Urban Available plot E10A Site A Third Avenue Denbigh West 13M 2.66 2 4 5 5 5 5 5 4 4 4 4 3 48 35 13 Excellent Excellent Excellent NA Vacant land Urban Available plot E10B Site B Third Avenue Denbigh West 13M 0.70 2 4 5 5 5 5 5 4 4 4 4 3 48 35 13 Excellent Excellent Excellent NA Vacant land Urban Available plot E12A Site A Opal Drive Fox Milne 14F 0.83 2 4 3 4 2 2 4 5 4 3 3 1 35 23 12 Good Good Good NA Vacant land Urban Available plot E14A Site A Timbold Drive Kents Hill Park 15H 5.48 2 4 4 1 3 1 4 5 4 3 3 2 34 21 13 Good Good Excellent NA Vacant land Urban Available plot E15A Site A Tilers Road Kiln Farm 5G 0.20 1 4 4 4 4 3 3 5 4 4 3 2 40 27 13 Excellent Good Excellent NA Vacant land Urban Available plot E17A Site A Kelv in Drive Knowlhill 10K 2.37 1 4 4 3 3 4 5 5 4 5 3 2 42 29 13 Excellent Good Excellent NA Vacant land Urban Available plot E17B Site B Roebuck Way Knowlhill 10J 1.27 1 4 4 3 3 4 5 5 4 5 3 2 42 29 13 Excellent Good Excellent NA Vacant land Urban Available plot E17C Site C Roebuck Way Knowlhill 10J 1.64 1 4 4 3 3 4 5 5 4 5 3 2 42 29 13 Excellent Good Excellent NA Vacant land Urban Available plot E17D Site D Davy Avenue Knowlhill 10J 0.21 1 4 4 3 3 4 5 5 4 5 3 2 42 29 13 Excellent Good Excellent NA Vacant land Urban Available plot E17E Site E Murdoch Court Knowlhill 9J 1.93 1 4 4 3 3 4 5 5 4 5 3 2 42 29 13 Excellent Good Excellent NA Vacant land Urban Available plot E18A Site A Sunrise Parkway Linford Wood 10E 0.40 1 4 4 4 4 4 4 5 4 4 3 2 42 29 13 Excellent Good Excellent NA Vacant land Urban Available plot E18B Site B Breckland Linford Wood 10D 1.35 1 4 4 4 4 4 4 5 4 4 3 2 42 29 13 Excellent Good Excellent NA Vacant land Urban Available plot E18C Site C Breckland Linford Wood 10E 0.62 1 4 4 4 4 4 4 5 4 4 3 2 42 29 13 Excellent Good Excellent NA Vacant land Urban Available plot E20A Site A Auckland Park Mount Farm 14L 1.94 2 4 4 3 4 1 5 4 4 5 3 3 40 28 12 Excellent Good Good NA Vacant land Urban Available plot E25B Site B Colts Holm Road Old Wolverton 6C 0.48 2 4 3 3 2 3 5 5 4 4 3 1 37 25 12 Good Good Good NA Vacant land Rural Available plot E26A Site A Yardley Road Olney 2C 2.71 2 4 4 1 2 2 3 5 4 5 3 2 35 22 13 Good Good Excellent NA Vacant land Urban Available plot E35A Site A Michigan Drive Tongwell 14C 0.49 2 4 5 3 4 1 5 5 4 5 3 3 42 28 14 Excellent Good Excellent NA Vacant land Urban Available plot E42A Site A Snowdon Drive East Winterhill 10J 0.15 2 4 5 3 3 4 5 3 1 3 3 2 36 27 9 Good Good Average NA Vacant land Urban Available plot E42B Site B Snowdon Drive Winterhill 10H 0.75 2 4 5 3 3 4 5 5 4 3 3 2 41 27 14 Excellent Good Excellent NA Vacant land Urban Available plot E43A Site A McConnell Drive Wolverton 7D 2.56 2 4 4 3 4 4 5 5 4 4 3 1 41 28 13 Excellent Good Excellent NA Vacant land Urban Available plot E44A Site A High Park Drive Wolverton Mill 4D 0.70 1 4 4 3 4 2 4 5 4 3 3 2 38 25 13 Good Good Excellent NA Vacant land Urban Available plot E44B Site B Featherstone Road Wolverton Mill 4E 0.47 1 4 4 3 4 2 4 5 4 3 3 2 38 25 13 Good Good Excellent NA Vacant land Urban Available plot E44C Site C Featherstone Road Wolverton Mill 4E 2.04 1 4 3 2 2 2 3 5 4 3 1 1 30 18 12 Good Average Good NA Vacant land Urban Available plot E45A Site A Garamonde Drive Wymbush 7F 1.19 1 4 4 4 4 2 5 5 4 3 3 3 41 28 13 Excellent Excellent Excellent NA Vacant land Urban Available plot
0 0
P3 Land at Blakelands Wolverton Road Blakelands 11A 3.36 1 4 5 5 5 5 4 5 4 5 4 3 49 35 14 Excellent Excellent Excellent NA Vacant land Urban Vacant landP46 Land at Brook Furlong Trafalgar Drive Booklands 16D 6.70 1 4 5 5 5 1 5 5 4 5 4 2 45 31 14 Excellent Excellent Excellent NA Vacant land Urban Vacant landP47a Land at Campbell Park Enterprise Lane Campbell Park 12F 0.90 1 4 4 3 1 1 1 5 4 1 2 1 27 14 13 Average Average Excellent NA Vacant land Urban Vacant landP47b Land at Campbell Park Overgate Campbell Park 12F 0.19 1 4 2 3 2 1 1 5 4 3 1 1 27 16 11 Average Poor Good NA Vacant land Urban Vacant landP47c Land at Campbell Park Overgate Campbell Park 13F 0.57 1 4 3 3 1 2 1 5 4 3 1 1 28 16 12 Average Poor Good NA Vacant land Urban Vacant landP47d Land at Campbell Park Eskan Court Campbell Park 12E 0.88 1 4 4 3 4 1 2 5 4 3 2 2 34 21 13 Good Good Excellent NA Vacant land Urban Vacant landP47e Land at Campbell Park Melv ille Street Campbell Park 12E 2.11 1 4 4 3 2 1 1 5 4 5 2 1 32 19 13 Good Average Excellent NA Vacant land Urban Vacant landP47f Land at Campbell Park Skeldon Gate Campbell Park 11F 1.00 1 4 3 3 2 1 1 5 4 4 2 1 30 18 12 Good Average Good NA Vacant land Urban Vacant landP48a Site in CMK South Tenth Street CMK 11G 0.65 2 4 4 4 5 5 3 5 4 4 2 2 42 29 13 Excellent Good Excellent NA Vacant land Urban Vacant landP48b Site in CMK Lower Tenth Street CMK 11G 1.03 2 4 4 5 4 5 4 5 4 4 2 2 43 30 13 Excellent Excellent Excellent NA Vacant land Urban Vacant landP48c Site in CMK South Seventh Street CMK 11G 0.38 2 4 3 4 3 5 5 5 4 4 2 2 41 29 12 Excellent Good Good NA Vacant land Urban Vacant landP48d Site in CMK South Eighth Street CMK 11G 0.42 2 4 3 4 4 5 5 5 4 4 2 1 41 29 12 Excellent Good Good NA Vacant land Urban Vacant landP48e Site in CMK Avebury Boulevard CMK 10G 0.81 2 4 4 5 4 5 3 5 4 5 2 3 44 31 13 Excellent Excellent Excellent NA Vacant land Urban Vacant landP48f Site in CMK Lower Fourth Street CMK 10G 0.42 2 4 3 5 4 5 5 5 4 4 2 2 43 31 12 Excellent Excellent Good NA Vacant land Urban Vacant landP48g Site in CMK South Second Street CMK 10H 9.65 2 5 5 5 5 5 4 5 4 4 3 3 48 34 14 Excellent Excellent Excellent NA Vacant land Urban Vacant landP19 Land to the East of Magna Park Land to the East of Magna Park Magna Park 10G 34.52 1 4 5 5 5 4 4 5 4 4 4 3 47 33 14 Excellent Excellent Excellent NA Vacant land Urban Vacant landP18a Land at Linford Wood Rockingham Drive Linford Wood 11D 1.37 1 4 4 4 4 4 4 5 4 4 3 2 42 29 13 Excellent Good Excellent NA Vacant land Urban Vacant landP18b Land at Linford Wood Rockingham Drive Linford Wood 11E 1.32 1 4 4 4 4 4 4 5 4 4 3 2 42 29 13 Excellent Good Excellent NA Vacant land Urban Vacant landP15a Land near Kiln Farm Watling Street Kiln Farm 6H 9.51 1 4 4 4 4 3 3 5 4 4 3 2 40 27 13 Excellent Good Excellent NA Vacant land Urban Vacant landP15b Land near Kiln Farm Watling Street Kiln Farm 5G 7.33 1 4 4 4 4 3 3 5 4 4 3 2 40 27 13 Excellent Good Excellent NA Vacant land Urban Vacant landP49 Land at Pineham Pineham Pineham 15D 10.85 1 4 5 5 5 1 5 5 4 5 4 2 45 31 14 Excellent Excellent Excellent NA Vacant land Urban Vacant landP27 Land at Redmoor Wimblington drive Redmoor 12L 1.68 1 4 5 5 4 5 5 5 4 3 1 3 44 30 14 Excellent Excellent Excellent NA Vacant land Urban Vacant land P28 Land at Rooksley Deltic Avenue Rooksley 8G 1.28 1 4 5 4 2 3 5 5 4 4 3 2 41 27 14 Excellent Good Excellent NA Vacant land Urban Vacant land P29a Land at Shenley Wood Chalkdell Drive Shenley Wood 8K 2.96 1 4 4 4 4 4 3 5 4 3 4 1 40 27 13 Excellent Good Excellent NA Vacant land Urban Vacant land P29b Land at Shenley Wood Chalkdell Drive Shenley Wood 8K 2.95 1 4 4 4 4 4 3 5 4 3 4 1 40 27 13 Excellent Good Excellent NA Vacant land Urban Vacant land P29c Land at Shenley Wood Chalkdell Drive Shenley Wood 7K 3.49 1 4 4 4 4 4 3 5 4 3 4 1 40 27 13 Excellent Good Excellent NA Vacant land Urban Vacant land P29d Land at Shenley Wood Foxcover Road Shenley Wood 7L 2.3 1 4 4 4 4 4 3 5 4 3 4 1 40 27 13 Excellent Good Excellent NA Vacant land Urban Vacant land P29e Land at Shenley Wood Merlewood Drive Shenley Wood 7L 1.19 1 4 4 4 4 4 3 5 4 3 4 1 40 27 13 Excellent Good Excellent NA Vacant land Urban Vacant land P30a Land at Snelshall East Pendeen Crescent Snelshall East 9N 3.28 1 4 5 3 5 1 3 5 4 3 3 2 38 24 14 Good Good Excellent NA Vacant land Rural Vacant LandP30b Land at Snelshall East Pendeen Crescent Snelshall East 9P 2.76 1 4 5 3 5 1 3 5 4 3 3 2 38 24 14 Good Good Excellent NA Vacant land Rural Vacant LandP31a Land at Snelshall West Steinbeck Crescent Snelshall West 7P 3.00 1 4 5 3 5 1 3 5 4 3 3 2 38 24 14 Good Good Excellent NA Vacant land Rural Vacant landP31b Land at Snelshall West Steinbeck Crescent Snelshall West 8P 1.03 1 4 5 3 5 1 3 5 4 5 3 2 40 26 14 Excellent Good Excellent NA Vacant land Rural Vacant landP31c Land at Snelshall West Steinbeck Crescent Snelshall West 8P 1.25 1 4 5 3 5 1 3 5 4 5 3 2 40 26 14 Excellent Good Excellent NA Vacant land Rural Vacant landP37 Land at Walton Groveway Walton 15K 9.48 1 4 4 3 3 4 4 5 4 3 3 1 38 25 13 Good Good Excellent NA Vacant land Urban Vacant landP39 Land at Wavendon Gate Ortensia Drive Wavendon Gate 17H 10.83 1 4 5 3 4 1 4 5 4 4 3 2 39 25 14 Good Good Excellent NA Vacant land Urban Vacant landP40 Land at West Ashland Thornbury West Ashland 13L 2.85 1 4 5 5 5 5 5 5 4 5 5 3 51 37 14 Excellent Excellent Excellent NA Vacant land Urban Vacant landP54 Land at West Bletchley Bletchley Road West Bletchley 11Q 4.83 2 4 1 2 1 1 2 5 4 2 1 1 24 14 10 Average Average Good NA Vacant land Urban Vacant landP41 Land at Willen Lake Brickhill Street Willen Lake 13E 1.05 1 4 4 4 3 2 3 5 4 4 3 2 38 25 13 Good Good Excellent NA Vacant land Urban Vacant landP50 Land at Woburn Sands Station Road Woburn Sands 1C 1.25 2 4 3 3 1 4 2 5 4 2 1 1 30 18 12 Good Average Good NA Vacant land Urban Vacant landP44a Land at Wolverton Mill Harnet Drive Wolverton Mill 4D 1.91 1 4 4 3 3 2 4 5 4 3 3 2 37 24 13 Good Good Excellent NA Vacant land Urban Vacant land P44b Land at Wolverton Mill Harnet Drive Wolverton Mill 4E 3.19 1 4 4 3 3 2 4 5 4 3 3 2 37 24 13 Good Good Excellent NA Vacant land Urban Vacant landP51 Land at Atterbury Tongwell Street Atterbury 15F 3.75 1 4 3 3 4 2 3 5 4 4 3 2 37 25 12 Good Good Good NA Vacant land Urban Vacant land P52 Land at Fishermead Gurnards Avenue Fishermead 12G 0.37 1 4 3 5 2 5 4 5 4 3 2 3 40 28 12 Excellent Good Good NA Vacant land Urban Vacant land
0 0
R33 Land at Stonebridge Fingle Drive Stonebridge 7D 0.40 1 4 2 3 2 4 4 5 4 2 3 3 36 25 11 Good Good Good N/A Undevelopable due to mature trees/woodland Urban N/AR53 Old Bletchley Old Bletchley Old bletchley 12N 11.67 2 1 3 3 3 3 3 3 3 1 3 2 28 19 9 Average Average Average N/A Part of site in operation as an army base Urban N/A
0 0EXISTING EMPLOYMENT SITES B1 Offices/Office Business Park
PROPOSED SITES B1 & B2 Office and Industrial Units POTENTIAL SITES B1, B2, B8 Offices, Industrial and Warehousing/Distribution Units
REMOVED SITES B2 Industrial units
EXISTING EMPLOYMENT SITES
PROPOSED SITES
POTENTIAL SITES
REMOVED SITES

gva.co.uk
Appendix B Employment Sites Assessment Matrix Sites Ranked Best to Worst
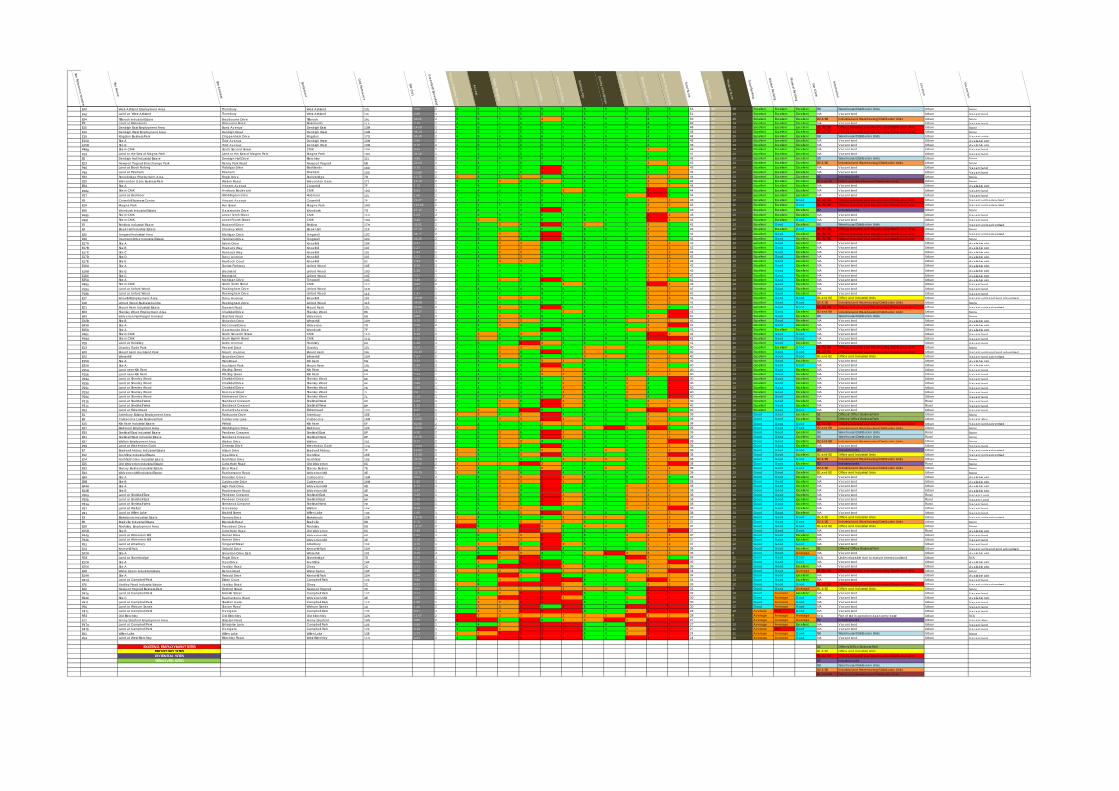
Site Reference Num
ber
Site Nam
e
Site Address
Settlement
Grid Reference
Size (ha)
Greenfield/Brow
nfield
Nature of Existing Tenna
Access
Public Transport
Prominence
Local Am
enities
Character of A
rea
Building Age
Quality of buildings
Economic C
onstraints
Strategic Location
Market A
ttractiveness
Total Score
Market Score
Physical Score
Total Ranking
Market Ranking
Physical Ranking
Use Class
Information
Location
Vacancies
E40 West Ashland Employment Area Thornbury West Ashland 13L 3.58 2 5 5 5 5 5 5 5 5 5 5 3 53 38 15 Excellent Excellent Excellent B8 Warehouse/Distribution Units Urban NoneP40 Land at West Ashland Thornbury West Ashland 13L 2.85 1 4 5 5 5 5 5 5 4 5 5 3 51 37 14 Excellent Excellent Excellent NA Vacant land Urban Vacant land
E34 Tillbrook Industrial Estate Bradbourne Drive Tillbrook 16L 43.51 2 5 5 5 5 3 5 5 5 5 4 3 50 35 15 Excellent Excellent Excellent B2 & B8 Industrial and Warehousing/Distribution Units Urban NoneP3 Land at Blakelands Wolverton Road Blakelands 11A 3.36 1 4 5 5 5 5 4 5 4 5 4 3 49 35 14 Excellent Excellent Excellent NA Vacant land Urban Vacant landE10 Denbigh East Employment Area Bond Avenue Denbigh East 13M 14.50 2 4 5 5 5 5 5 4 4 4 4 3 48 35 13 Excellent Excellent Excellent B1, B2, B8 Offices, Industrial and Warehousing/Distribution Units Urban NoneE10 Denbigh West Employment Area Denbigh Road Denbigh West 14M 38.13 2 4 5 5 5 5 5 4 4 4 4 3 48 35 13 Excellent Excellent Excellent B1, B2, B8 Offices, Industrial and Warehousing/Distribution Units Urban NoneE16 Kingston Business Park Chippenham Drive Kingston 17G 55.39 2 4 5 4 5 4 4 5 5 5 4 3 48 33 15 Excellent Excellent Excellent B8 Warehouse/Distribution Units Urban Vacant units E10A Site A Third Avenue Denbigh West 13M 2.66 2 4 5 5 5 5 5 4 4 4 4 3 48 35 13 Excellent Excellent Excellent NA Vacant land Urban Available plot E10B Site B Third Avenue Denbigh West 13M 0.70 2 4 5 5 5 5 5 4 4 4 4 3 48 35 13 Excellent Excellent Excellent NA Vacant land Urban Available plot P48g Site in CMK South Second Street CMK 10H 9.65 2 5 5 5 5 5 4 5 4 4 3 3 48 34 14 Excellent Excellent Excellent NA Vacant land Urban Vacant landP19 Land to the East of Magna Park Land to the East of Magna Park Magna Park 10G 34.52 1 4 5 5 5 4 4 5 4 4 4 3 47 33 14 Excellent Excellent Excellent NA Vacant land Urban Vacant landE5 Denbigh Hall Industrial Estate Denbigh Hall Drive Bletchley 11L 4.96 2 4 4 4 4 4 4 5 5 5 4 3 46 32 14 Excellent Excellent Excellent B8 Warehouse/Distribution Units Urban NoneE23 Newport Pagnell Interchange Park Renny Park Road Newport Pagnell 6B 22.63 2 4 4 4 5 4 4 5 5 4 3 3 45 31 14 Excellent Excellent Excellent B2 & B8 Industrial and Warehousing/Distribution Units Urban NoneP46 Land at Brook Furlong Trafalgar Drive Booklands 16D 6.70 1 4 5 5 5 1 5 5 4 5 4 2 45 31 14 Excellent Excellent Excellent NA Vacant land Urban Vacant landP49 Land at Pineham Pineham Pineham 15D 10.85 1 4 5 5 5 1 5 5 4 5 4 2 45 31 14 Excellent Excellent Excellent NA Vacant land Urban Vacant landE33 Stonebridge Employment Area Fingle Drive Stonebridge 7D 11.35 2 3 4 5 3 5 5 4 5 5 3 2 44 31 13 Excellent Excellent Excellent B2 Industrial units Urban NoneE39 Wavendon Gate Business Park Walton Road Wavendon Gate 17J 10.13 2 5 4 3 4 3 4 5 5 5 3 3 44 30 14 Excellent Excellent Excellent B1 and B8 Office and Warehousing/Distribution Units Urban NoneE9A Site A Vincent Avenue Crownhill 7F 1.19 1 4 4 5 4 4 4 5 4 5 3 2 44 31 13 Excellent Excellent Excellent NA Vacant land Urban Available plot P48e Site in CMK Avebury Boulevard CMK 10G 0.81 2 4 4 5 4 5 3 5 4 5 2 3 44 31 13 Excellent Excellent Excellent NA Vacant land Urban Vacant landP27 Land at Redmoor Wimblington drive Redmoor 12L 1.68 1 4 5 5 4 5 5 5 4 3 1 3 44 30 14 Excellent Excellent Excellent NA Vacant land Urban Vacant land E9 Crownhill Business Centre Vincent Avenue Crownhill 7F 21.27 2 4 4 5 4 4 4 4 4 5 3 2 43 31 12 Excellent Excellent Good B1, B2, B8 Offices, Industrial and Warehousing/Distribution Units Urban Vacant units aderv tised E19 Magna Park Fen Street Magna Park 19G 110.04 2 4 4 5 4 4 4 4 4 5 3 2 43 31 12 Excellent Excellent Good B1, B2, B8 Offices, Industrial and Warehousing/Distribution Units Urban Vacant units aderv tised
E45 Wymbush Industrial Estate Garamonde Drive Wymbush 7G 27.17 1 4 4 4 4 2 5 4 5 5 3 3 43 30 13 Excellent Excellent Excellent B2 Industrial units Urban NoneP48b Site in CMK Lower Tenth Street CMK 11G 1.03 2 4 4 5 4 5 4 5 4 4 2 2 43 30 13 Excellent Excellent Excellent NA Vacant land Urban Vacant landP48f Site in CMK Lower Fourth Street CMK 10G 0.42 2 4 3 5 4 5 5 5 4 4 2 2 43 31 12 Excellent Excellent Good NA Vacant land Urban Vacant landE2 Brinklow Industrial Estate Brudenell Drive Binklow 17H 36.91 2 5 5 3 4 1 5 3 5 5 3 3 42 29 13 Excellent Good Excellent B8 Warehouse/Distribution Units Urban Vacant units advertised E4 Bleak Hall Industrial Estate Chesney Wold Bleak Hall 11K 27.74 2 4 4 4 4 4 4 4 4 4 3 3 42 30 12 Excellent Excellent Good B1, B2, B8 Offices, Industrial and Warehousing/Distribution Units Urban NoneE35 Tongwell Industrial Area Michigan Drive Tongwell 13C 56.77 2 5 5 3 4 1 5 4 4 5 3 3 42 29 13 Excellent Good Excellent B1, B2, B8 Offices, Industrial and Warehousing/Distribution Units Urban Vacant units advertisedE36 Yeomans Drive Industrial Estate Yeomans Drive Tongwell 12C 22.26 2 5 5 3 4 1 5 4 4 5 3 3 42 29 13 Excellent Good Excellent B1, B2, B8 Offices, Industrial and Warehousing/Distribution Units Urban NoneE17A Site A Kelv in Drive Knowlhill 10K 2.37 1 4 4 3 3 4 5 5 4 5 3 2 42 29 13 Excellent Good Excellent NA Vacant land Urban Available plot E17B Site B Roebuck Way Knowlhill 10J 1.27 1 4 4 3 3 4 5 5 4 5 3 2 42 29 13 Excellent Good Excellent NA Vacant land Urban Available plot E17C Site C Roebuck Way Knowlhill 10J 1.64 1 4 4 3 3 4 5 5 4 5 3 2 42 29 13 Excellent Good Excellent NA Vacant land Urban Available plot E17D Site D Davy Avenue Knowlhill 10J 0.21 1 4 4 3 3 4 5 5 4 5 3 2 42 29 13 Excellent Good Excellent NA Vacant land Urban Available plot E17E Site E Murdoch Court Knowlhill 9J 1.93 1 4 4 3 3 4 5 5 4 5 3 2 42 29 13 Excellent Good Excellent NA Vacant land Urban Available plot E18A Site A Sunrise Parkway Linford Wood 10E 0.40 1 4 4 4 4 4 4 5 4 4 3 2 42 29 13 Excellent Good Excellent NA Vacant land Urban Available plot
E18B Site B Breckland Linford Wood 10D 1.35 1 4 4 4 4 4 4 5 4 4 3 2 42 29 13 Excellent Good Excellent NA Vacant land Urban Available plot E18C Site C Breckland Linford Wood 10E 0.62 1 4 4 4 4 4 4 5 4 4 3 2 42 29 13 Excellent Good Excellent NA Vacant land Urban Available plot E35A Site A Michigan Drive Tongwell 14C 0.49 2 4 5 3 4 1 5 5 4 5 3 3 42 28 14 Excellent Good Excellent NA Vacant land Urban Available plot P48a Site in CMK South Tenth Street CMK 11G 0.65 2 4 4 4 5 5 3 5 4 4 2 2 42 29 13 Excellent Good Excellent NA Vacant land Urban Vacant landP18a Land at Linford Wood Rockingham Drive Linford Wood 11D 1.37 1 4 4 4 4 4 4 5 4 4 3 2 42 29 13 Excellent Good Excellent NA Vacant land Urban Vacant landP18b Land at Linford Wood Rockingham Drive Linford Wood 11E 1.32 1 4 4 4 4 4 4 5 4 4 3 2 42 29 13 Excellent Good Excellent NA Vacant land Urban Vacant landE17 Knowlhill Employment Area Davy Avenue Knowlhill 10J 29.98 2 4 4 3 3 4 5 4 4 5 3 2 41 29 12 Excellent Good Good B1 and B2 Office and Industrial Units Urban Vacant units and land advertisedE18 Linford Wood Business Centre Rockingham Drive Linford Wood 11E 38.68 2 4 4 4 4 4 4 4 4 4 3 2 41 29 12 Excellent Good Good B2 & B8 Industrial and Warehousing/Distribution Units Urban NoneE21 Mount Farm Industrial Estate Dawson Road Mount Farm 13L 33.90 2 5 4 3 4 1 5 4 4 5 3 3 41 29 12 Excellent Good Good B1, B2, B8 Offices, Industrial and Warehousing/Distribution Units Urban Vacant units advertisedE29 Shenley Wood Employment Area Chalkdell Drive Shenley Wood 8K 13.37 1 4 4 4 4 4 3 5 4 4 4 1 41 28 13 Excellent Good Excellent B2 and B8 Industrial and Warehousing/Distribution Units Urban NoneE43 Wolverton Rail Freight Terminal Stratford Road Wolverton 6D 6.80 2 4 4 3 4 4 5 5 4 4 3 1 41 28 13 Excellent Good Excellent B8 Warehouse/Distribution Units Urban NoneE42B Site B Snowdon Drive Winterhill 10H 0.75 2 4 5 3 3 4 5 5 4 3 3 2 41 27 14 Excellent Good Excellent NA Vacant land Urban Available plot E43A Site A McConnell Drive Wolverton 7D 2.56 2 4 4 3 4 4 5 5 4 4 3 1 41 28 13 Excellent Good Excellent NA Vacant land Urban Available plot E45A Site A Garamonde Drive Wymbush 7F 1.19 1 4 4 4 4 2 5 5 4 3 3 3 41 28 13 Excellent Excellent Excellent NA Vacant land Urban Available plot P48c Site in CMK South Seventh Street CMK 11G 0.38 2 4 3 4 3 5 5 5 4 4 2 2 41 29 12 Excellent Good Good NA Vacant land Urban Vacant landP48d Site in CMK South Eighth Street CMK 11G 0.42 2 4 3 4 4 5 5 5 4 4 2 1 41 29 12 Excellent Good Good NA Vacant land Urban Vacant landP28 Land at Rooksley Deltic Avenue Rooksley 8G 1.28 1 4 5 4 2 3 5 5 4 4 3 2 41 27 14 Excellent Good Excellent NA Vacant land Urban Vacant land E13 Granby Trade Park Peverel Drive Granby 12L 5.10 2 4 4 3 3 5 4 3 3 4 4 3 40 30 10 Excellent Excellent Good B1, B2, B8 Offices, Industrial and Warehousing/Distribution Units Urban NoneE20 Mount Farm Auckland Park Mount Avenue Mount Farm 14L 20.33 2 4 4 3 4 1 5 3 5 5 3 3 40 28 12 Excellent Good Good B1, B2, B8 Offices, Industrial and Warehousing/Distribution Units Urban Vacant units and land advertised E42 Winterhill Snowdon Drive Winterhill 10H 7.97 2 4 5 3 4 4 5 3 3 4 3 2 40 29 11 Excellent Good Good B1 and B2 Office and Industrial Units Urban Vacant land advertisedE15A Site A Tilers Road Kiln Farm 5G 0.20 1 4 4 4 4 3 3 5 4 4 3 2 40 27 13 Excellent Good Excellent NA Vacant land Urban Available plot E20A Site A Auckland Park Mount Farm 14L 1.94 2 4 4 3 4 1 5 4 4 5 3 3 40 28 12 Excellent Good Good NA Vacant land Urban Available plot P15a Land near Kiln Farm Watling Street Kiln Farm 6H 9.51 1 4 4 4 4 3 3 5 4 4 3 2 40 27 13 Excellent Good Excellent NA Vacant land Urban Vacant landP15b Land near Kiln Farm Watling Street Kiln Farm 5G 7.33 1 4 4 4 4 3 3 5 4 4 3 2 40 27 13 Excellent Good Excellent NA Vacant land Urban Vacant landP29a Land at Shenley Wood Chalkdell Drive Shenley Wood 8K 2.96 1 4 4 4 4 4 3 5 4 3 4 1 40 27 13 Excellent Good Excellent NA Vacant land Urban Vacant land P29b Land at Shenley Wood Chalkdell Drive Shenley Wood 8K 2.95 1 4 4 4 4 4 3 5 4 3 4 1 40 27 13 Excellent Good Excellent NA Vacant land Urban Vacant land P29c Land at Shenley Wood Chalkdell Drive Shenley Wood 7K 3.49 1 4 4 4 4 4 3 5 4 3 4 1 40 27 13 Excellent Good Excellent NA Vacant land Urban Vacant land P29d Land at Shenley Wood Foxcover Road Shenley Wood 7L 2.3 1 4 4 4 4 4 3 5 4 3 4 1 40 27 13 Excellent Good Excellent NA Vacant land Urban Vacant land P29e Land at Shenley Wood Merlewood Drive Shenley Wood 7L 1.19 1 4 4 4 4 4 3 5 4 3 4 1 40 27 13 Excellent Good Excellent NA Vacant land Urban Vacant land P31b Land at Snelshall West Steinbeck Crescent Snelshall West 8P 1.03 1 4 5 3 5 1 3 5 4 5 3 2 40 26 14 Excellent Good Excellent NA Vacant land Rural Vacant landP31c Land at Snelshall West Steinbeck Crescent Snelshall West 8P 1.25 1 4 5 3 5 1 3 5 4 5 3 2 40 26 14 Excellent Good Excellent NA Vacant land Rural Vacant landP52 Land at Fishermead Gurnards Avenue Fishermead 12G 0.37 1 4 3 5 2 5 4 5 4 3 2 3 40 28 12 Excellent Good Good NA Vacant land Urban Vacant land E1 Atterbury Existing Employment Area Fairbourne Drive Atterbury 15E 1.55 2 3 3 4 3 2 4 5 5 5 3 2 39 26 13 Good Good Excellent B1 Offices/ Office Business Park Urban NoneE8 Caldecotte Lake Business Park Caldecotte Lake Caldecotte 16M 10.65 2 4 4 3 3 1 3 5 5 5 3 3 39 25 14 Good Good Excellent B1 Offices/ Office Business Park Urban Vacant sitesE15 Kiln Farm Industrial Estate Pitfield Kiln Farm 5F 50.90 2 4 4 4 4 3 3 4 4 4 3 2 39 27 12 Good Good Good B1, B2, B8 Offices, Industrial and Warehousing/Distribution Units Urban Vacant units advertised E27 Redmoor Employment Area Wimblington Drive Redmoor 12K 13.59 2 3 5 5 4 5 5 3 2 3 1 3 39 29 10 Good Good Good B2 and B8 Industrial and Warehousing/Distribution Units Urban NoneE30 Snelshall East Industrial Estate Pendeen Crescent Snelshall East 8P 6.30 2 4 5 3 5 1 3 5 4 4 3 2 39 25 14 Good Good Excellent B8 Warehouse/Distribution Units Rural NoneE31 Snelshall West Industrial Estate Steinbeck Crescent Snelshall West 8P 14.46 2 4 5 3 5 1 3 5 4 4 3 2 39 25 14 Good Good Excellent B8 Warehouse/Distribution Units Rural NoneE37 Walton Employment Area Walton Drive Walton 15J 9.17 2 4 4 3 3 4 4 5 4 4 3 1 39 26 13 Good Good Excellent B2 and B8 Industrial and Warehousing/Distribution Units Urban NoneP39 Land at Wavendon Gate Ortensia Drive Wavendon Gate 17H 10.83 1 4 5 3 4 1 4 5 4 4 3 2 39 25 14 Good Good Excellent NA Vacant land Urban Vacant landE7 Bradwell Abbey Industrial Estate Alston Drive Bradwell Abbey 7F 15.64 2 3 4 4 4 3 4 4 3 4 3 2 38 27 11 Good Good Good B2 Industrial units Urban Vacant units advertisedE12 Fox Milne Industrial Estate Opal Drive Fox Milne 15E 14.80 2 3 4 4 3 2 4 4 5 5 3 1 38 25 13 Good Good Excellent B1 and B2 Office and Industrial Units Urban Vacant units advertisedE24 Nothfield Drive Industrial Estate Northfield Drive Northfield 15E 23.26 2 4 4 4 4 4 3 3 3 4 3 2 38 28 10 Good Good Good B2 & B8 Industrial and Warehousing/Distribution Units Urban NoneE25 Old Wolverton Industrial Estate Colts Holm Road Old Wolverton 6C 57.60 2 3 3 3 2 3 5 5 5 5 3 1 38 25 13 Good Good Excellent B2 Industrial units Rural NoneE32 Stacey Bushes Industrial Estate Erica Road Stacey Bushes 7E 8.55 2 3 4 4 4 3 4 4 3 4 3 2 38 27 11 Good Good Good B2 & B8 Industrial and Warehousing/Distribution Units Urban NoneE44 Wolverton Mill Industrial Estate Featherstone Road Wolverton Mill 4E 23.70 2 3 4 3 4 2 4 4 5 4 3 2 38 25 13 Good Good Excellent B1 and B2 Office and Industrial Units Urban NoneE8A Site A Monellan Grove Caldecotte 15M 0.61 2 4 4 3 3 1 3 5 4 5 3 3 38 25 13 Good Good Excellent NA Vacant land Urban Available plot E8B Site B Caldecotte Drive Caldecotte 16M 1.92 2 4 4 3 3 1 3 5 4 5 3 3 38 25 13 Good Good Excellent NA Vacant land Urban Available plot E44A Site A High Park Drive Wolverton Mill 4D 0.70 1 4 4 3 4 2 4 5 4 3 3 2 38 25 13 Good Good Excellent NA Vacant land Urban Available plot E44B Site B Featherstone Road Wolverton Mill 4E 0.47 1 4 4 3 4 2 4 5 4 3 3 2 38 25 13 Good Good Excellent NA Vacant land Urban Available plot P30a Land at Snelshall East Pendeen Crescent Snelshall East 9N 3.28 1 4 5 3 5 1 3 5 4 3 3 2 38 24 14 Good Good Excellent NA Vacant land Rural Vacant LandP30b Land at Snelshall East Pendeen Crescent Snelshall East 9P 2.76 1 4 5 3 5 1 3 5 4 3 3 2 38 24 14 Good Good Excellent NA Vacant land Rural Vacant LandP31a Land at Snelshall West Steinbeck Crescent Snelshall West 7P 3.00 1 4 5 3 5 1 3 5 4 3 3 2 38 24 14 Good Good Excellent NA Vacant land Rural Vacant landP37 Land at Walton Groveway Walton 15K 9.48 1 4 4 3 3 4 4 5 4 3 3 1 38 25 13 Good Good Excellent NA Vacant land Urban Vacant landP41 Land at Willen Lake Brickhill Street Willen Lake 13E 1.05 1 4 4 4 3 2 3 5 4 4 3 2 38 25 13 Good Good Excellent NA Vacant land Urban Vacant landE3 Blakelands Industrial Estate Tanners Drive Blakelands 12B 16.73 2 3 4 4 4 4 3 3 3 4 3 2 37 27 10 Good Good Good B1 & B2 Office and Industrial Units Urban Vacant units advertised E6 Bradv ille Industrial Estate Blundells Road Bradv ille 9D 5.75 2 3 4 4 3 3 3 4 4 4 3 2 37 25 12 Good Good Good B2 & B8 Industrial and Warehousing/Distribution Units Urban NoneE28 Rooksley Employment Area Precedent Drive Rooksley 9G 14.17 2 2 5 4 2 3 5 3 3 5 3 2 37 26 11 Good Good Good B1 and B2 Office and Industrial Units Urban NoneE25B Site B Colts Holm Road Old Wolverton 6C 0.48 2 4 3 3 2 3 5 5 4 4 3 1 37 25 12 Good Good Good NA Vacant land Rural Available plot P44a Land at Wolverton Mill Harnet Drive Wolverton Mill 4D 1.91 1 4 4 3 3 2 4 5 4 3 3 2 37 24 13 Good Good Excellent NA Vacant land Urban Vacant land P44b Land at Wolverton Mill Harnet Drive Wolverton Mill 4E 3.19 1 4 4 3 3 2 4 5 4 3 3 2 37 24 13 Good Good Excellent NA Vacant land Urban Vacant landP51 Land at Atterbury Tongwell Street Atterbury 15F 3.75 1 4 3 3 4 2 3 5 4 4 3 2 37 25 12 Good Good Good NA Vacant land Urban Vacant land E14 Kents Hill Park Timbold Drive Kents Hill Park 15H 8.15 2 3 4 1 3 1 4 5 5 5 3 2 36 22 14 Good Good Excellent B1 Offices/ Office Business Park Urban Vacant units and land advertisedE42A Site A Snowdon Drive East Winterhill 10J 0.15 2 4 5 3 3 4 5 3 1 3 3 2 36 27 9 Good Good Average NA Vacant land Urban Available plot R33 Land at Stonebridge Fingle Drive Stonebridge 7D 0.40 1 4 2 3 2 4 4 5 4 2 3 3 36 25 11 Good Good Good N/A Undevelopable due to mature trees/woodland Urban N/AE12A Site A Opal Drive Fox Milne 14F 0.83 2 4 3 4 2 2 4 5 4 3 3 1 35 23 12 Good Good Good NA Vacant land Urban Available plot E26A Site A Yardley Road Olney 2C 2.71 2 4 4 1 2 2 3 5 4 5 3 2 35 22 13 Good Good Excellent NA Vacant land Urban Available plot E38 Water Eaton Industrial Estate Barton Road Water Eaton 13P 8.85 2 3 3 3 4 4 3 3 3 4 3 1 34 25 9 Good Good Average B1, B2, B8 Offices, Industrial and Warehousing/Distribution Units Urban NoneE14A Site A Timbold Drive Kents Hill Park 15H 5.48 2 4 4 1 3 1 4 5 4 3 3 2 34 21 13 Good Good Excellent NA Vacant land Urban Available plot P47d Land at Campbell Park Eskan Court Campbell Park 12E 0.88 1 4 4 3 4 1 2 5 4 3 2 2 34 21 13 Good Good Excellent NA Vacant land Urban Vacant landE26 Yardley Road Industrial Estate Yardley Road Olney 2C 9.32 2 3 4 1 2 2 3 4 4 5 3 2 33 21 12 Good Good Good B1, B2, B8 Offices, Industrial and Warehousing/Distribution Units Urban Vacant units advertisedE22 Newport Pagnell Business Park Tickford Street Newport Pagnell 4C 4.81 2 4 3 3 3 3 3 3 3 4 2 1 32 23 9 Good Good Average B1 & B2 Office and Industrial Units Urban NoneP47e Land at Campbell Park Melv ille Street Campbell Park 12E 2.11 1 4 4 3 2 1 1 5 4 5 2 1 32 19 13 Good Average Excellent NA Vacant land Urban Vacant landE44C Site C Featherstone Road Wolverton Mill 4E 2.04 1 4 3 2 2 2 3 5 4 3 1 1 30 18 12 Good Average Good NA Vacant land Urban Available plot P47f Land at Campbell Park Skeldon Gate Campbell Park 11F 1.00 1 4 3 3 2 1 1 5 4 4 2 1 30 18 12 Good Average Good NA Vacant land Urban Vacant landP50 Land at Woburn Sands Station Road Woburn Sands 1C 1.25 2 4 3 3 1 4 2 5 4 2 1 1 30 18 12 Good Average Good NA Vacant land Urban Vacant landP47c Land at Campbell Park Overgate Campbell Park 13F 0.57 1 4 3 3 1 2 1 5 4 3 1 1 28 16 12 Average Poor Good NA Vacant land Urban Vacant landR53 Old Bletchley Old Bletchley Old bletchley 12N 11.67 2 1 3 3 3 3 3 3 3 1 3 2 28 19 9 Average Average Average N/A Part of site in operation as an army base Urban N/AE11 Fenny Stratford Employment Area Simpson Road Fenny Stratford 14N 4.85 2 2 2 4 1 4 3 3 2 3 2 1 27 20 7 Average Average Average B2 Industrial units Urban Vacant sites P47a Land at Campbell Park Enterprise Lane Campbell Park 12F 0.90 1 4 4 3 1 1 1 5 4 1 2 1 27 14 13 Average Average Excellent NA Vacant land Urban Vacant landP47b Land at Campbell Park Overgate Campbell Park 12F 0.19 1 4 2 3 2 1 1 5 4 3 1 1 27 16 11 Average Poor Good NA Vacant land Urban Vacant landE41 Willen Lake Willen Lake Willen Lake 13E 2.73 2 3 3 1 1 1 2 4 4 3 1 1 24 13 11 Average Average Good B8 Warehouse/Distribution Units Urban NoneP54 Land at West Bletchley Bletchley Road West Bletchley 11Q 4.83 2 4 1 2 1 1 2 5 4 2 1 1 24 14 10 Average Average Good NA Vacant land Urban Vacant land
0 0EXISTING EMPLOYMENT SITES B1 Offices/Office Business Park
PROPOSED SITES B1 & B2 Office and Industrial Units POTENTIAL SITES B1, B2, B8 Offices, Industrial and Warehousing/Distribution Units
REMOVED SITES B2 Industrial unitsB8 Warehouse/Distribution Units B2 & B8 Industrial and Warehousing/Distribution Units B1 and B8 Office and Warehousing/Distribution Units

gva.co.uk
Appendix C Employment Sites Assessment Proformas

Milton Keynes Council – Economic Growth and Employment Land Study Proforma – Existing Employment/Developed Areas
Site Ref No Address
The site is best described as a: Out of Town Office Campus Town Centre
High Quality Business Park Incubator/SME Cluster Site
Research and Technology/Science Park Specialised Freight Terminals
Warehouse/Distribution Park Sites for Specific Occupiers
General Industry/Business Area Recycling/Environmental Industries Sites
Heavy/Specialist Industrial Site Other - Storage
General comments / description of site
Proportion of Floorspace in Non-B-class uses
0-25% 25-50% 50-75% 75-100%
Housing
Retail
Community
Other
All B-Class Neighbouring Taylor Wimpey housing development Nature of Existing Tenants 5 – National /international names: significant presence.
4 – Some national /international names present, but majority of occupiers from drawn from regional companies. 3 – No national /international names companies exclusively Milton Keynes based. 2 – Companies drawn from local area but could be seen as having choice of locations in local area. 1 – Very local companies who by nature of their business would be expected to have very limited choices in terms of alternative location.
Availability Yes – Site is advertised as being available, or there are no obvious
obstructions to immediately develop the site. No – Site is not immediately available (please state reason why in space below)

Milton Keynes Council – Economic Growth and Employment Land Study Proforma – Existing Employment/Developed Areas
Market Activity (any in last 5 years) Yes – Evidence of recent development in the immediate surrounding
area (e.g. on the same part of an estate or road) No – No evidence of recent development. If the site is a new (Greenfield) site please state below whether it would be attractive to the market at present
Access 5. Either adjoining main road or motorway junction with easy site
access for all vehicles or access to rail, air and sea networks 4. Close to major road network; easy site access for all vehicles 3. Easy site access for all vehicles; indirect or restricted access to major road network 2. Restricted access for HGVs; restricted access to major road network 1. Restricted access for all commercial vehicles, severely restricted access to major road network
Parking is adequate for the uses within the site Yes No Don’t know Public Transport 5. Close to a station, peak time bus route and cycle route; on a
pedestrian route 4. Close to a station or peak time bus route, close to cycle route, on a pedestrian route 3. Close to either a station or peak time bus route or cycle route; on a pedestrian route 2. Not near a station, peak time bus route or cycle route; on a pedestrian route 1. Not on a pedestrian route; not near a station, peak time bus route or cycle route NB. “Close” = within about 10 minutes walk NB2. Peak time bus routes defined as more than 2 buses per hour
Prominence 5. Gateway site to a prominent estate, visible from major road
network 4. Visible site, on a main road or prominent estate 3. On a main road or prominent estate, tucked away from view 2. Visible, on a minor road or estate 1. On a minor road or estate, tucked away from view
On-site amenities
Convenience retail Comparison retail
Restaurant/cafe Hotel
Gym/sports Crèche
Bank Education
None Other
Local Amenities 5. Close to a town centre with a wide range and quantity of services 4. Close to local centre with a reasonable range and quantity of services 3. Close to a limited range and quantity of basic services 2. Close to one or two services 1. No services in close proximity NB1: Employment related services such as banks, travel agents, shops, leisure/recreation, pubs/restaurants NB2: “Close” = within about 10 minutes walk
Quality of environment for current use
Very good Good
Poor Very poor
Environment appropriate for current uses?
Yes No

Milton Keynes Council – Economic Growth and Employment Land Study Proforma – Existing Employment/Developed Areas
Neighbouring uses
Residential Leisure
Retail Town centre
Airport Rail
Road Office
Industrial Warehousing
Higher Education Further Education
Character of Area 5. Well established commercial area
4. Established commercial area, with residential area or rural area nearby 3. Mixed commercial and residential area 2. Mainly residential or rural area with few commercial uses 1. Mainly residential or rural area with no existing commercial uses
Planning Status 5. Detailed planning permission
4. Outline planning permission 3. Published development brief 2. Local Plan allocation 1. Allocation in Deposit Draft Local Plan, or reserve site
Planning Considerations: Flood Risk (Zone ) Heritage & Conservation (Listed Building, SAM, Cons Area)
Environmental Designation (SPA, SAC, SSSI, Ramsar) Tree Preservation Order
Physical Considerations: Topography
Contamination
Other
Redevelopment Opportunities Yes No Vacant Land Yes No
Vacant Buildings Yes No Approx % _________ and number of vacant buildings _________
Age of Buildings (C1-5) Quality of Buildings (C6-9) 0-25% 25-50% 50-75% 75-100% 0-25% 25-50% 50-75% 75-100%
Pre 1940 Very good
1940 - 1969 Good
1970 - 1989 Poor
1990 - 1999 Very poor
since 2000
Bad neighbourhood uses Businesses in the business cluster cause: None
Noise pollution
Air pollution
Smell
HGV traffic (D8)
Possibly contamination from historic landfill use

Milton Keynes Council – Economic Growth and Employment Land Study Proforma – Existing Employment/Developed Areas
Significant car traffic
Other (please comment)
Economic Constraints 5. No obstacles to development 4. Minor obstacles to development; relatively easy, quick and cheap to resolve 3. Minor obstacles to development; more difficult, expensive and time-consuming to resolve 2. Major obstacles to development; very difficult, expensive and time-consuming to resolve 1. Major obstacles to development; extremely difficult, expensive and time-consuming to resolve NB: Obstacles to development would include access difficulties, infrastructure requirements, contamination remediation costs, multiple ownership etc.
Strategic Location 4. Motorway Corridor 3. Other Strategic Roads 2. Elsewhere in Built up Area 1. All other sites
Greenfield/ Brownfield 1. Site is on Greenfield Land
2. Site is on Brownfield Land
Market Attractiveness 3. Site attractive to National companies 2. Site attractive to Sub-regional companies 1. Site attractive to Local companies
CONCLUSIONS
Other Comments / Observations
Recommendations on future use/potential

Milton Keynes Council – Economic Growth and Employment Land Study Proforma – Proposed Employment Sites (clear land)
Site Ref No Address Greenfield/ Brownfield 1. Site is on Greenfield Land
2. Site is on Brownfield Land
General comments / description of site
Availability Yes – Site is advertised as being available, or there are no obvious
obstructions to immediately develop the site. No – Site is not immediately available (please state reason why in space below)
Market Activity (any in last 5 years) Yes – Evidence of recent development in the immediate surrounding
area (e.g. on the same part of an estate or road) No – No evidence of recent development. If the site is a new (Greenfield) site please state below whether it would be attractive to the market at present
Access 5. Either adjoining main road or motorway junction with easy site
access for all vehicles or access to rail, air and sea networks 4. Close to major road network; easy site access for all vehicles 3. Easy site access for all vehicles; indirect or restricted access to major road network 2. Restricted access for HGVs; restricted access to major road network 1. Restricted access for all commercial vehicles, severely restricted access to major road network
Public Transport 5. Close to a station, peak time bus route and cycle route; on a pedestrian route 4. Close to a station or peak time bus route, close to cycle route, on a pedestrian route 3. Close to either a station or peak time bus route or cycle route; on a pedestrian route 2. Not near a station, peak time bus route or cycle route; on a pedestrian route 1. Not on a pedestrian route; not near a station, peak time bus route or cycle route NB. “Close” = within about 10 minutes walk NB2. Peak time bus routes defined as more than 2 buses per hour
Prominence 5. Gateway site to a prominent estate, visible from major road
network 4. Visible site, on a main road or prominent estate 3. On a main road or prominent estate, tucked away from view 2. Visible, on a minor road or estate 1. On a minor road or estate, tucked away from view

Milton Keynes Council – Economic Growth and Employment Land Study Proforma – Proposed Employment Sites (clear land)
Local Amenities 5. Close to a town centre with a wide range and quantity of services 4. Close to local centre with a reasonable range and quantity of services 3. Close to a limited range and quantity of basic services 2. Close to one or two services 1. No services in close proximity NB1: Employment related services such as banks, travel agents, shops, leisure/recreation, pubs/restaurants NB2: “Close” = within about 10 minutes walk
Neighbouring uses
Residential Leisure Rural
Retail Town centre
Airport Rail
Road Office
Industrial Warehousing
Higher Education Further Education
Character of Area 5. Well established commercial area
4. Established commercial area, with residential area or rural area nearby 3. Mixed commercial and residential area 2. Mainly residential or rural area with few commercial uses 1. Mainly residential or rural area with no existing commercial uses
Planning Status 5. Detailed planning permission
4. Outline planning permission 3. Published development brief 2. Local Plan allocation 1. Allocation in Deposit Draft Local Plan, or reserve site
Planning Considerations: Flood Risk (Zone ) Heritage & Conservation (Listed Building, SAM, Cons Area)
Environmental Designation (SPA, SAC, SSSI, Ramsar) Tree Preservation Order
Physical Considerations: Topography
Contamination
Other
Redevelopment Opportunities Yes No Vacant Land Yes No
Bad neighbourhood uses Businesses in the business cluster cause: None
Noise pollution
Air pollution
Smell
HGV traffic
Significant car traffic
Other (please comment)

Milton Keynes Council – Economic Growth and Employment Land Study Proforma – Proposed Employment Sites (clear land)
Economic Constraints 5. No obstacles to development 4. Minor obstacles to development; relatively easy, quick and cheap to resolve 3. Minor obstacles to development; more difficult, expensive and time-consuming to resolve 2. Major obstacles to development; very difficult, expensive and time-consuming to resolve 1. Major obstacles to development; extremely difficult, expensive and time-consuming to resolve
NB: Obstacles to development would include access difficulties, infrastructure requirements, contamination remediation costs, multiple ownership etc.
Strategic Location 4. Motorway Corridor 3. Other Strategic Roads 2. Elsewhere in Built up Area 1. All other sites
Market Attractiveness 3. Site attractive to National companies
2. Site attractive to Sub-regional companies 1. Site attractive to Local companies
CONCLUSIONS
Other Comments / Observations
Recommendations on future use/potential

gva.co.uk
Appendix D Geographical Locations of Employment Land
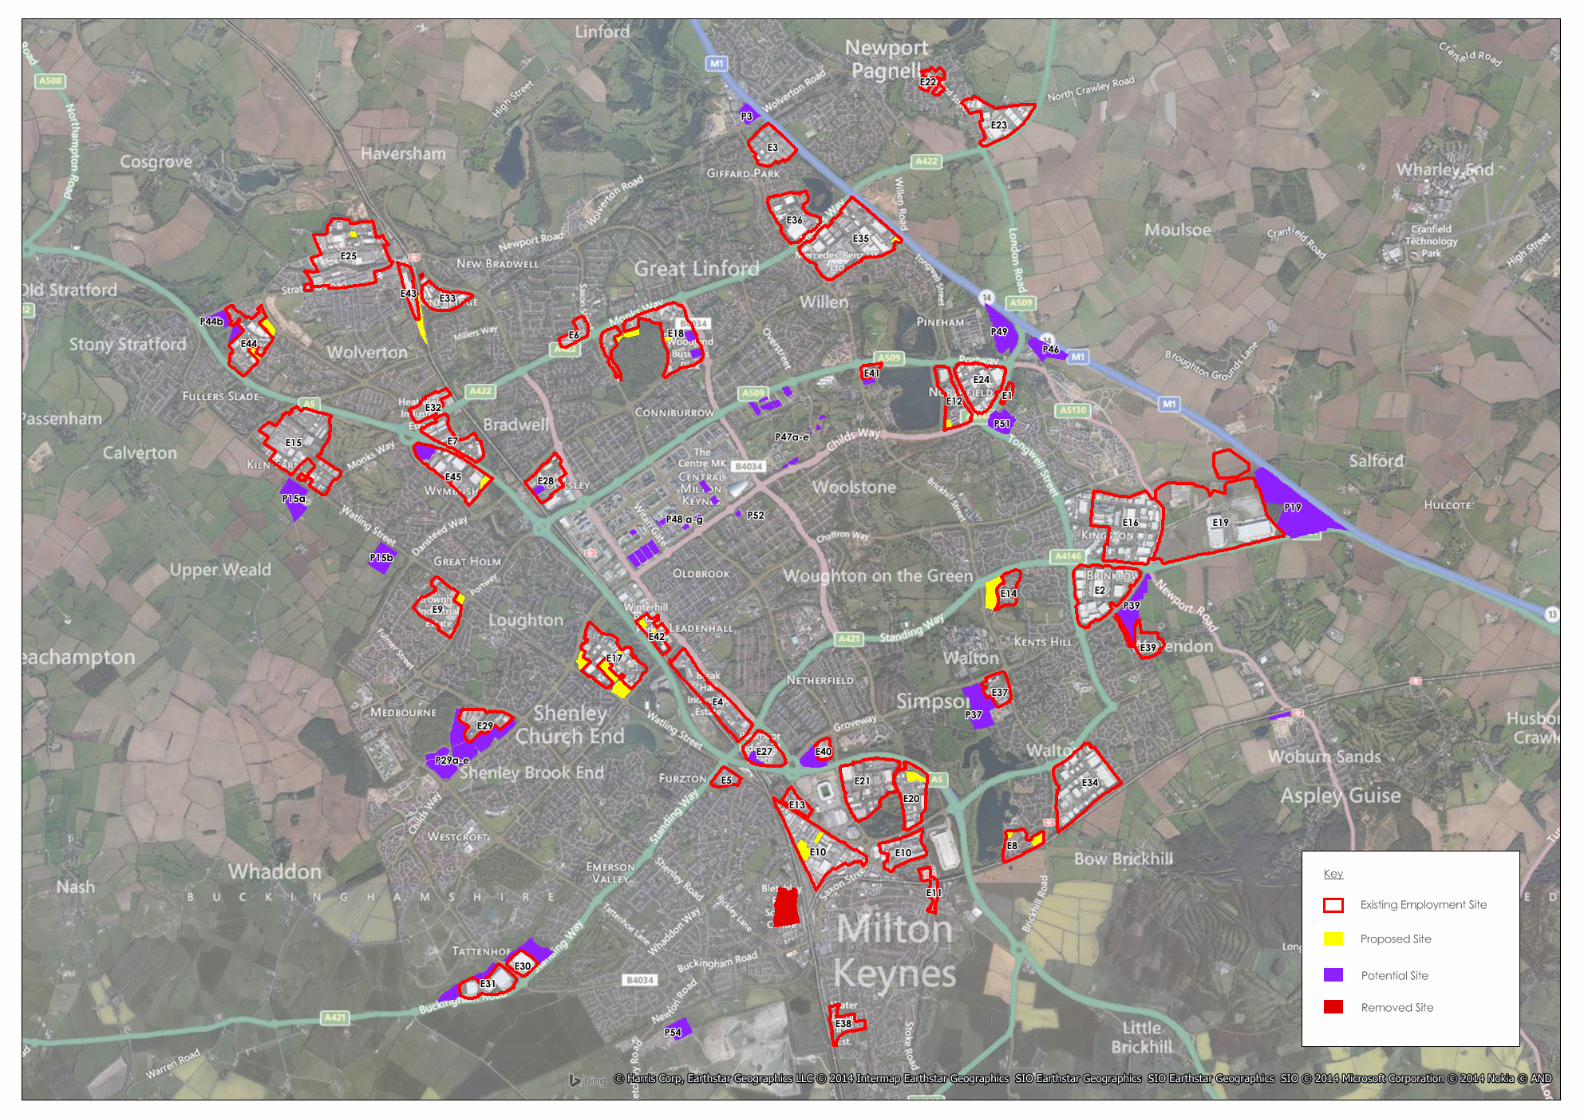

gva.co.uk
Appendix E Base Forecast Changes in Employment by Sector
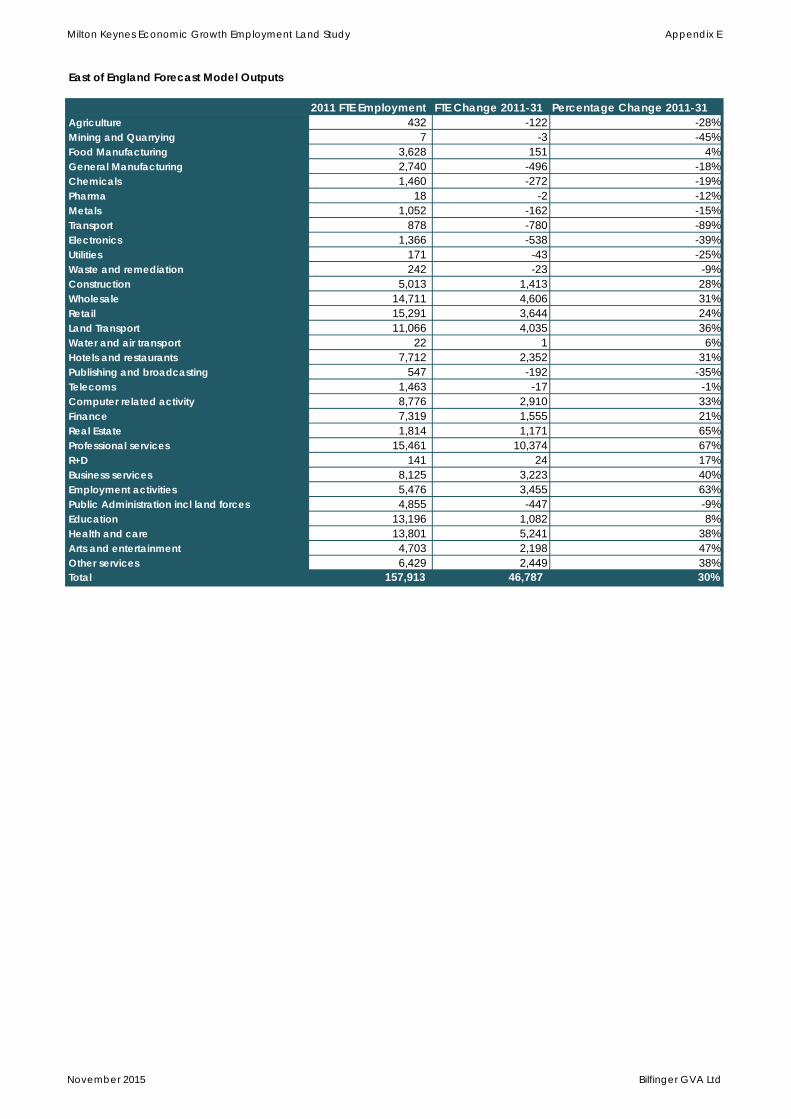
Milton Keynes Economic Growth Employment Land Study Appendix E
November 2015 Bilfinger GVA Ltd
East of England Forecast Model Outputs
2011 FTE Employment FTE Change 2011-31 Percentage Change 2011-31Agriculture 432 -122 -28%Mining and Quarrying 7 -3 -45%Food Manufacturing 3,628 151 4%General Manufacturing 2,740 -496 -18%Chemicals 1,460 -272 -19%Pharma 18 -2 -12%Metals 1,052 -162 -15%Transport 878 -780 -89%Electronics 1,366 -538 -39%Utilities 171 -43 -25%Waste and remediation 242 -23 -9%Construction 5,013 1,413 28%Wholesale 14,711 4,606 31%Retail 15,291 3,644 24%Land Transport 11,066 4,035 36%Water and air transport 22 1 6%Hotels and restaurants 7,712 2,352 31%Publishing and broadcasting 547 -192 -35%Telecoms 1,463 -17 -1%Computer related activity 8,776 2,910 33%Finance 7,319 1,555 21%Real Estate 1,814 1,171 65%Professional services 15,461 10,374 67%R+D 141 24 17%Business services 8,125 3,223 40%Employment activities 5,476 3,455 63%Public Administration incl land forces 4,855 -447 -9%Education 13,196 1,082 8%Health and care 13,801 5,241 38%Arts and entertainment 4,703 2,198 47%Other services 6,429 2,449 38%Total 157,913 46,787 30%
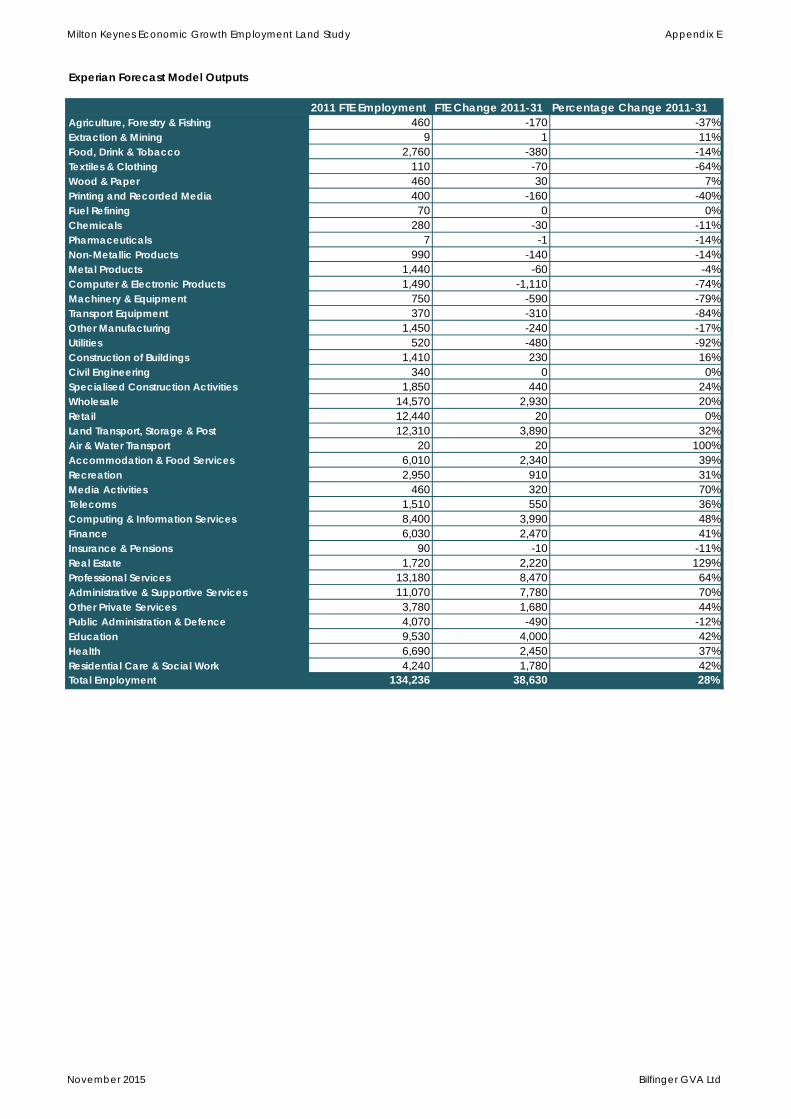
Milton Keynes Economic Growth Employment Land Study Appendix E
November 2015 Bilfinger GVA Ltd
Experian Forecast Model Outputs
2011 FTE Employment FTE Change 2011-31 Percentage Change 2011-31Agriculture, Forestry & Fishing 460 -170 -37%Extraction & Mining 9 1 11%Food, Drink & Tobacco 2,760 -380 -14%Textiles & Clothing 110 -70 -64%Wood & Paper 460 30 7%Printing and Recorded Media 400 -160 -40%Fuel Refining 70 0 0%Chemicals 280 -30 -11%Pharmaceuticals 7 -1 -14%Non-Metallic Products 990 -140 -14%Metal Products 1,440 -60 -4%Computer & Electronic Products 1,490 -1,110 -74%Machinery & Equipment 750 -590 -79%Transport Equipment 370 -310 -84%Other Manufacturing 1,450 -240 -17%Utilities 520 -480 -92%Construction of Buildings 1,410 230 16%Civil Engineering 340 0 0%Specialised Construction Activities 1,850 440 24%Wholesale 14,570 2,930 20%Retail 12,440 20 0%Land Transport, Storage & Post 12,310 3,890 32%Air & Water Transport 20 20 100%Accommodation & Food Services 6,010 2,340 39%Recreation 2,950 910 31%Media Activities 460 320 70%Telecoms 1,510 550 36%Computing & Information Services 8,400 3,990 48%Finance 6,030 2,470 41%Insurance & Pensions 90 -10 -11%Real Estate 1,720 2,220 129%Professional Services 13,180 8,470 64%Administrative & Supportive Services 11,070 7,780 70%Other Private Services 3,780 1,680 44%Public Administration & Defence 4,070 -490 -12%Education 9,530 4,000 42%Health 6,690 2,450 37%Residential Care & Social Work 4,240 1,780 42%Total Employment 134,236 38,630 28%

East of England Forecasting Model
Technical Report:
Model description and data sources
January 2015
2
Contents
1: Introduction .......................................................................................... 4
History of the EEFM .......................................................................................... 4
Report structure ................................................................................................ 5
2: Description of the Model ...................................................................... 6
Structure of the EEFM ....................................................................................... 6
Geography .......................................................................................................... 7
Time periods ...................................................................................................... 7
Things to Remember When Using the Model ................................................. 7
Coverage ............................................................................................................ 9
Links with other models ................................................................................. 10
3: Model overview ................................................................................... 11
Variables in the EEFM ..................................................................................... 11
Economic variables ......................................................................................... 12
Demographic variables ................................................................................... 18
Housing variables ............................................................................................ 20
Carbon emissions ........................................................................................... 21
4: Data used ............................................................................................ 23
Labour market .................................................................................................. 23
Demography ..................................................................................................... 34
Output ............................................................................................................... 39
Housing ............................................................................................................ 39
Demand for dwellings ..................................................................................... 39
Carbon emissions ........................................................................................... 43
5: Outliers and data validity ................................................................... 48
BRES outliers ................................................................................................... 48
Census vs APS / LFS employment rates ...................................................... 49
6: Performance monitoring .................................................................... 52
What’s changed ............................................................................................... 52
7: Employment land use methodology ................................................. 61
Key outputs ........................................................................................................ 61
Measure of employment .................................................................................... 61
Employment densities ....................................................................................... 61
Allocating employment sectors to use classes .................................................. 63
Detailed office uses ........................................................................................... 66

EEFM Technical Report
January 2015
3
This report has been prepared solely for the East of England local authorities as a technical note for the East of England Forecasting Model. We do not accept or assume any liability or duty of care for any other purpose or to any other person to whom this document is shown or into whose hands it may come, save where expressly agreed by our prior consent in writing. In the event that, pursuant to a request which has been received under the Freedom of Information Act 2000 (The Act), it is required to disclose any information contained in a report or any deliverable prepared by us, it will notify Oxford Economics promptly and consult with Oxford Economics prior to disclosing such information.
© 2014 Oxford Economics. All rights reserved
EEFM Technical Report
January 2015
4
1: Introduction
The East of England Forecasting Model (EEFM) was developed by Oxford Economics to project economic,
demographic and housing trends in a consistent fashion and in a way that would help in the development of
both the Regional Economic Strategy and the Regional Spatial Strategy for the East of England. The Model
is based in Excel spreadsheets, allowing users to produce scenarios under which the impacts of a given
scenario can be monitored.
This report provides technical information on the EEFM’s coverage, methodology and data sources. The
latest forecast results are presented separately, on the Cambridgeshire Insight website.
The Model’s outputs are just one piece of evidence to assist in making strategic decisions. As in all models,
forecasts are subject to margins of error which increase at more detailed geographical levels. In addition, the
EEFM relies heavily on published data, with BRES / ABI employment data in particular containing multiple
errors at local sector level, though the Model does attempt to correct for these.
The development of a model, though a largely quantitative exercise, also requires past modelling experience
and a degree of local knowledge if it is to produce plausible long-term projections. The EEFM and wider suite
of Oxford models have been developed by a team of senior staff (Graham Gudgin, Kerry Houston and Mark
Britton) who have a long history in model-building and forecasting at both local and regional level. The team
has built up considerable knowledge of the East of England’s local economies, but the feedback of local
partners is essential. Discussions with local stakeholders and the EEFM Model Steering Group, and a BRES
consultation exercise with local authority representatives, are key inputs to each run of the Model.
History of the EEFM
A number of EEFM baseline forecasts have been published to date, or are programmed for the future. The
timings are:
August 2007 - First EEFM release
February 2008 - Second EEFM release
November 2008 - Third EEFM release
March 2009 – ‘Spring 2009 release’
October 2009 – ‘Autumn 2009 release’
March 2010 – ‘ Spring 2010 release’
October 2010 – ‘Autumn 2010 release’
Spring 2012 – ‘EEFM 2012 release’
Summer 2013 – ‘EEFM 2013 release’
Autumn 2014 – ‘EEFM 2014 release’
In addition, a number of alternative scenarios were generated using the Model to inform the development of
the RES and RSS. The EEFM Model Steering Group has oversight of the scenario process. An advantage of
the Model is that it is sufficiently flexible to generate a variety of scenarios. With each model update, these
scenarios are produced by Oxford Economics. However, representatives at Cambridgeshire County Council
have been trained to use the model to generate bespoke scenarios using the model which is delivered with
each update.
Key outputs associated with the development of the EEFM and its forecasts so far include:

EEFM Technical Report
January 2015
5
East of England: Joint Modelling for the RES and RSS – August 2007
East of England: Joint Modelling for the RES and RSS (update) – November 2008
East of England Forecasting Model, Spring 2009 forecasts – May 2009
East of England Forecasting Model, Autumn 2009 forecasts – November 2009
East of England Forecasting Model, Spring 2010 forecasts – June 2010
East of England Forecasting Model Technical Report (Spring 2010 update) – June 2010
East of England Forecasting Model, Autumn 2010 forecasts – November 2010
East of England Forecasting Model Technical Report (Autumn 2010 update) – December 2010
East of England Forecasting Model, EEFM 2012 forecasts – June 2012
East of England Forecasting Model Technical Report – June 2012
East of England Forecasting Model, EEFM 2013 forecasts – July 2013
East of England Forecasting Model Technical Report – August 2013
East of England Forecasting Model, EEFM 2014 forecasts – November 2014
East of England Forecasting Model Technical Report – January 2015
The outputs released are available on the Cambridgeshire Insight website. A number of other related
resources can also be accessed on the site (see below).
Report structure
The purpose of this document is to provide a description of the Model’s methodology and the data sources
used, and act as a companion reference guide to the published results. It will be updated as the Model itself
is developed, improved and updated. The report is structured as follows:
Chapter 2: Description of the Model – This chapter summarises the EEFM coverage with respect
to geography, time periods and linkages with other models produced by Oxford Economics.
Chapter 3: Model Overview – This chapter summarises the structure of the EEFM, and the
linkages and relationships between variables.
Chapter 4: Data Used – This chapter lists the variables in the Model, and indicates the latest data
used. It also explains any processing of the data carried out prior to its use in the EEFM.
Chapter 5: Outliers and Data Validity – This chapter summarises Oxford Economics’ approach to
anomalous data (so-called “outliers”) and the methods used to check that the EEFM is internally
consistent.
Chapter 6: Performance Monitoring – This chapter explores the accuracy of the Model over
previous forecasting cycles. It will be updated with each run of the Model in order to monitor its
performance.
Chapter 7: Employment Land Module – This chapter outlines our methodology for calculating
employment land use forecasts under the 2014 update of the East of England Forecasting Model
(EEFM).
This report does not provide EEFM forecast results. These can be found on the Cambridgeshire Insight
website www.cambridgeshireinsight.org.uk/EEFM. The detailed forecasts are available in Excel
spreadsheets, accompanied by an Oxford Economics PowerPoint report which is also available from the
Cambridgeshire Insight website.

EEFM Technical Report
January 2015
6
2: Description of the Model
This chapter provides an overview of the East of England Forecasting Model (EEFM) and summarises its
coverage and links to other Oxford Economics models. It also contains a list of the variables and
geographies used. The forecasting methods and data sources are described in subsequent chapters.
Structure of the EEFM
The East of England Forecasting Model (previously the EEDA-EERA Forecasting Model) is a spreadsheet-
based model originally designed to help inform and monitor the development and review of the RES and
RSS. It covers a wide range of variables, and is designed to be flexible so that alternative scenarios can be
run and the impacts of different assumptions can be measured.
In addition to the Excel spreadsheet version, Oxford Economics has designed a ‘front-end’ version of the
Model (see figure 2.1 below) providing an easy way for users to input scenario assumptions for testing. The
Model software processes these scenario assumptions and produces outputs in Excel. Unfortunately, this
facility is not available through the Cambridgeshire Insight website, and anyone wanting to test their own
scenarios should discuss with Cambridgeshire County Council first.
Figure 2.1: Screen shot of an indicative scenario interaction screen
Key features of the Model are:
A full database including over 150 separate variables for each of the East of England’s 48 pre-April
2009 local authorities, as well as for historic counties, strategic authorities, selected other local
authority groupings, the East as a whole, 8 local authorities in the East Midlands and the region as a
whole, 21 local authorities in the South East and the region itself, and the UK;
EEFM software allowing users to produce scenarios tailored to their needs (not available over the
web);
A comprehensive set of tables, charts and PowerPoint slides allowing users to select and assemble
data on the variables, localities, scenarios and results they want; and
EEFM Technical Report
January 2015
7
A spreadsheet system containing:
o Linked worksheets, to facilitate faster updating;
o Worksheets structured to generate forecasts and scenarios;
o Worksheets designed to produce tables, charts and PowerPoint presentations.
The overall Model structure captures the interdependence of the economy, demographic change and
housing at a local level, as well as reflecting the impact of broader economic trends on the East of England.
The employment forecasts take account of the supply and demand for labour, the demographic forecasts
reflect labour market trends as they are reflected in migration (and natural change indirectly), and the
housing forecasts take account of both economic and demographic factors. This structure allows scenarios
which test the impact of variables upon each other – for example, the impact of housing supply on economic
variables.
Geography
The Model produces forecasts for each local authority district and unitary authority in the East of England,
and selected local authorities in the East Midlands and South East region to allow for LEP aggregation. For
the EEFM 2014 forecasts, that equates to 77 local authorities, including the former Mid Bedfordshire and
South Bedfordshire districts which have been retained at the request of regional partners - the new Central
Bedfordshire unitary authority is one of the strategic groupings for which forecasts are also provided.
Forecasts are also available for selected groupings of local authority districts and unitaries. These were
decided in consultation with regional partners through the EEFM Model Steering Group, and also include the
new Local Enterprise Partnerships (LEPs). For a full list of the groupings available, refer to the EEFM section
of the Cambridgeshire Insight website.
In addition to these geographies, forecasts for the East of England, East Midlands and South East regions,
and for the UK, are available.
Time periods
The EEFM is constructed on an annual basis. Historic data for most variables has been collected over 20
years to provide a basis for estimating the relationships between variables and for forecasting future trends.
Forecasts are currently made up to 2031, reflecting the available global, national and regional forecasts. But
the longer-term forecasts should be treated with some caution, as unforeseen - but inevitable - future change
in the underlying drivers will affect forecast accuracy. Medium-term forecasts are actually more likely to be
better approximations than shorter-term ones, as we can usually be more confident about medium-term
trends than about short-term random fluctuations around the trend.
Things to Remember When Using the Model
EEFM forecasts are based on observed past trends only
Past trends reflect past infrastructure and policy environments. Even where major new investments or policy
changes are known and have actually started, they can only affect EEFM forecasts to the extent that they
are reflected in the currently available data. If they have not yet impacted on the available data, they will not
be reflected in the forecasts.

EEFM Technical Report
January 2015
8
There are two sets of exceptional circumstances in which the currently available data need to be
supplemented by other information. The first is where there are concerns about data quality. This issue is
explored in Chapter 5. The second is where the Model produces unrealistic forecasts - for example,
continuing an employment decline in a particular sector in a particular area until it reaches zero or even
negative values. Manual adjustments to the Model are necessary in these situations, and here professional
judgement inevitably comes into play. This is discussed further below.
The forecasts are unconstrained
This means that the forecast numbers do not take into account any policy or other constraints that might
prevent their actual realisation on the ground. Forecasts of the demand for dwellings, for example, are the
outcome of projected changes in employment, population, etc. If in reality planning constraints were to
prevent this demand being satisfied, the associated forecast levels of economic, labour market and
demographic variables would be less likely to materialise.
The forecasts are subject to margins of error
As with all kinds of forecasting, there are margins of error associated with the results which tend to widen
over time. Furthermore, the quality and reliability of data decreases at more detailed levels of geography.
Under current data-quality conditions, models are most helpful for identifying trends, average growth rates
and broad differentials between areas and sectors. Accordingly, users are encouraged to focus on the
patterns over time, not figures for individual years.
Reality is more complex than any model
Several of the modelled relationships are complicated and their treatment in the EEFM is necessarily
simplified, despite its large size. In particular, the demand for housing is complex and not all the factors may
be fully captured. Questions such as whether migrants’ apparent willingness to live at higher densities than
the existing population is merely a temporary state which requires much more investigation.
Forecasting models will not all agree
The EEFM’s baseline forecasts can be compared with other published forecasts, but close agreement should
not be expected and sometimes there can be wide divergences. These can arise from even small differences
in underlying assumptions and in the timing and definitions of the data used. But with an awareness of these
factors, the EEFM forecasts provide a useful starting point for an understanding of regional and local
economic trends in the East of England, particularly when the baseline is accompanied by alternative
scenario forecasts with which it can be compared.
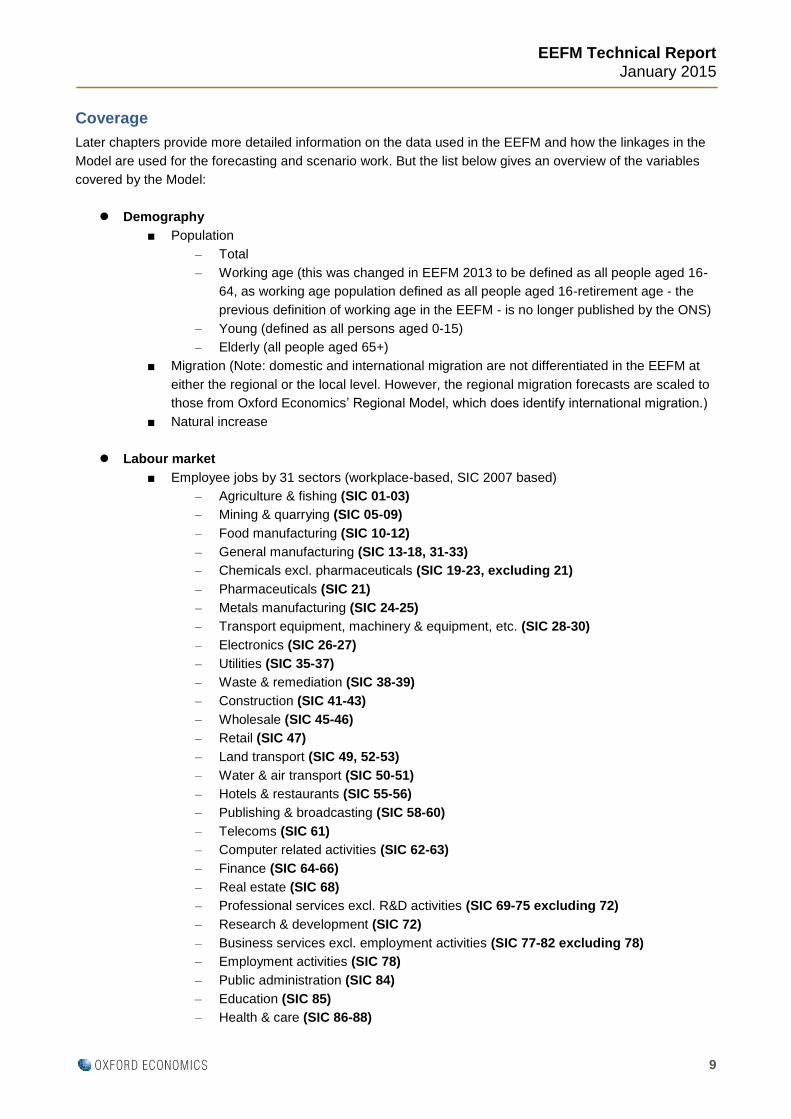
EEFM Technical Report
January 2015
9
Coverage
Later chapters provide more detailed information on the data used in the EEFM and how the linkages in the
Model are used for the forecasting and scenario work. But the list below gives an overview of the variables
covered by the Model:
Demography
■ Population
– Total
– Working age (this was changed in EEFM 2013 to be defined as all people aged 16-
64, as working age population defined as all people aged 16-retirement age - the
previous definition of working age in the EEFM - is no longer published by the ONS)
– Young (defined as all persons aged 0-15)
– Elderly (all people aged 65+)
■ Migration (Note: domestic and international migration are not differentiated in the EEFM at
either the regional or the local level. However, the regional migration forecasts are scaled to
those from Oxford Economics’ Regional Model, which does identify international migration.)
■ Natural increase
Labour market
■ Employee jobs by 31 sectors (workplace-based, SIC 2007 based)
– Agriculture & fishing (SIC 01-03)
– Mining & quarrying (SIC 05-09)
– Food manufacturing (SIC 10-12)
– General manufacturing (SIC 13-18, 31-33)
– Chemicals excl. pharmaceuticals (SIC 19-23, excluding 21)
– Pharmaceuticals (SIC 21)
– Metals manufacturing (SIC 24-25)
– Transport equipment, machinery & equipment, etc. (SIC 28-30)
– Electronics (SIC 26-27)
– Utilities (SIC 35-37)
– Waste & remediation (SIC 38-39)
– Construction (SIC 41-43)
– Wholesale (SIC 45-46)
– Retail (SIC 47)
– Land transport (SIC 49, 52-53)
– Water & air transport (SIC 50-51)
– Hotels & restaurants (SIC 55-56)
– Publishing & broadcasting (SIC 58-60)
– Telecoms (SIC 61)
– Computer related activities (SIC 62-63)
– Finance (SIC 64-66)
– Real estate (SIC 68)
– Professional services excl. R&D activities (SIC 69-75 excluding 72)
– Research & development (SIC 72)
– Business services excl. employment activities (SIC 77-82 excluding 78)
– Employment activities (SIC 78)
– Public administration (SIC 84)
– Education (SIC 85)
– Health & care (SIC 86-88)
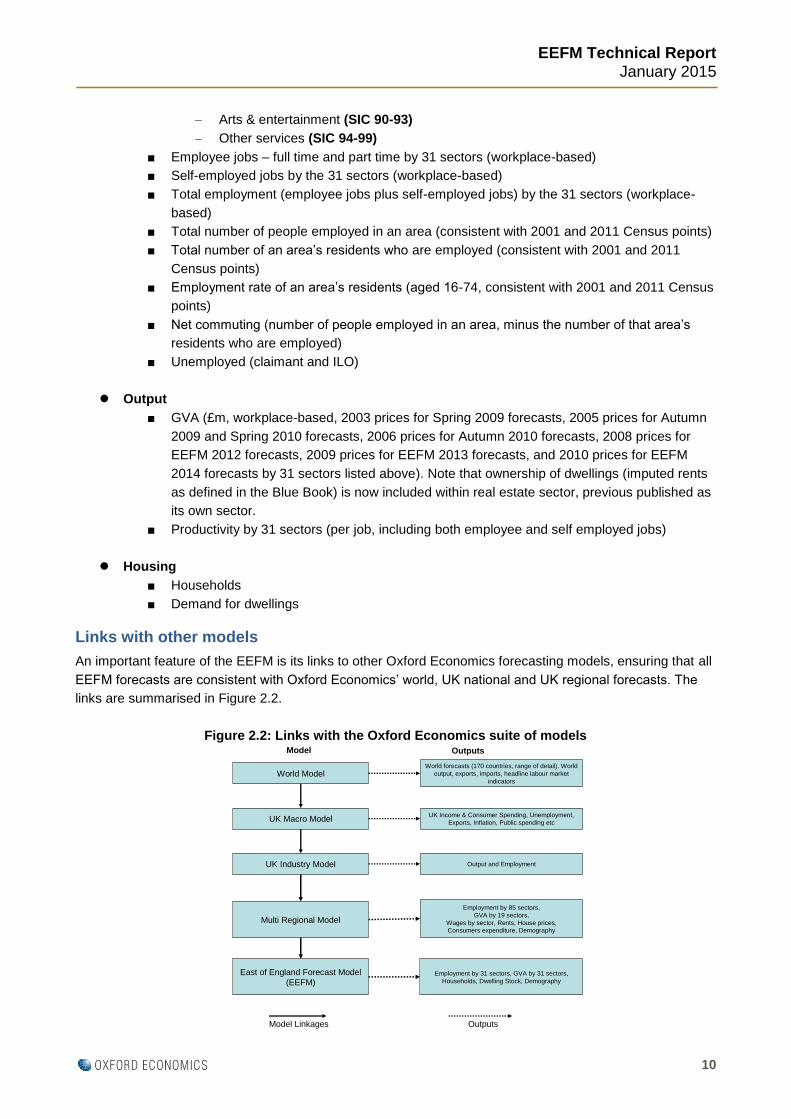
EEFM Technical Report
January 2015
10
– Arts & entertainment (SIC 90-93)
– Other services (SIC 94-99)
■ Employee jobs – full time and part time by 31 sectors (workplace-based)
■ Self-employed jobs by the 31 sectors (workplace-based)
■ Total employment (employee jobs plus self-employed jobs) by the 31 sectors (workplace-
based)
■ Total number of people employed in an area (consistent with 2001 and 2011 Census points)
■ Total number of an area’s residents who are employed (consistent with 2001 and 2011
Census points)
■ Employment rate of an area’s residents (aged 16-74, consistent with 2001 and 2011 Census
points)
■ Net commuting (number of people employed in an area, minus the number of that area’s
residents who are employed)
■ Unemployed (claimant and ILO)
Output
■ GVA (£m, workplace-based, 2003 prices for Spring 2009 forecasts, 2005 prices for Autumn
2009 and Spring 2010 forecasts, 2006 prices for Autumn 2010 forecasts, 2008 prices for
EEFM 2012 forecasts, 2009 prices for EEFM 2013 forecasts, and 2010 prices for EEFM
2014 forecasts by 31 sectors listed above). Note that ownership of dwellings (imputed rents
as defined in the Blue Book) is now included within real estate sector, previous published as
its own sector.
■ Productivity by 31 sectors (per job, including both employee and self employed jobs)
Housing
■ Households
■ Demand for dwellings
Links with other models
An important feature of the EEFM is its links to other Oxford Economics forecasting models, ensuring that all
EEFM forecasts are consistent with Oxford Economics’ world, UK national and UK regional forecasts. The
links are summarised in Figure 2.2.
Figure 2.2: Links with the Oxford Economics suite of models
World Model
UK Macro Model
UK Industry Model
Model Outputs
Model Linkages Outputs
Multi Regional Model
East of England Forecast Model
(EEFM)Employment by 31 sectors, GVA by 31 sectors,
Households, Dwelling Stock, Demography
Employment by 85 sectors,
GVA by 19 sectors,
Wages by sector, Rents, House prices,
Consumers expenditure, Demography
Output and Employment
UK Income & Consumer Spending, Unemployment,
Exports, Inflation, Public spending etc
World forecasts (170 countries, range of detail). World
output, exports, imports, headline labour market
indicators
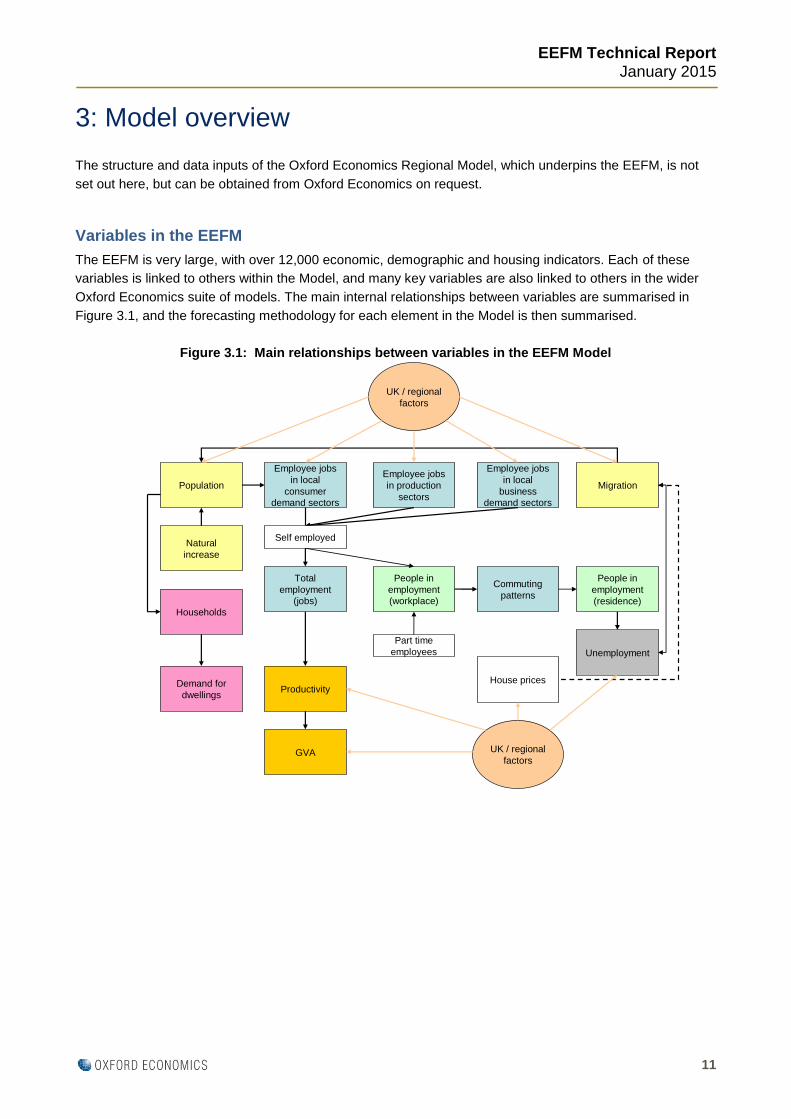
EEFM Technical Report
January 2015
11
3: Model overview
The structure and data inputs of the Oxford Economics Regional Model, which underpins the EEFM, is not
set out here, but can be obtained from Oxford Economics on request.
Variables in the EEFM
The EEFM is very large, with over 12,000 economic, demographic and housing indicators. Each of these
variables is linked to others within the Model, and many key variables are also linked to others in the wider
Oxford Economics suite of models. The main internal relationships between variables are summarised in
Figure 3.1, and the forecasting methodology for each element in the Model is then summarised.
Figure 3.1: Main relationships between variables in the EEFM Model
UK / regional
factors
Population
Employee jobs
in local
consumer
demand sectors
Employee jobs
in production
sectors
Employee jobs
in local
business
demand sectors
Migration
Natural
increase
Households
Demand for
dwellings
Total
employment
(jobs)
People in
employment
(workplace)
Commuting
patterns
People in
employment
(residence)
Unemployment
House prices
UK / regional
factors
Productivity
GVA
Part time
employees
Self employed

EEFM Technical Report
January 2015
12
Economic variables
Workplace employees (jobs)
The total number of employee jobs in an area, whether full- or part-time. These can be taken by residents or
by commuters from outside. Note that this is a measure of jobs, not workers, so if one person has two part-
time jobs, for example, they are counted twice.
This is forecast separately in every area for each of the 31 sectors listed on page 9. The forecasts begin with
something called a “location quotient” (LQ). This is a ratio which summarises the concentration of a
particular sector in a particular area, relative to the regional average. So an LQ of 0.8 (or 80%) for a given
sector and area means that that sector is under-represented in the area. An LQ of 1.25 (or 125%) means
that the sector is overrepresented in the area.
The EEFM contains location quotients for every local authority in the East region including the additional
local authorities in the East Midlands and South East region required to construct LEP aggregates, for each
of the 31 sectors, and for every year since 1991. Forecast trends in the LQs are based on how they have
changed over time. So if the LQ for a given sector in a given area has been rising in recent years, the
forecasts will project this to continue, and vice versa. LQs which have been stable for a long time (including
at zero) will be forecast to remain so.
Three forms of location quotient are used in the EEFM. In the first, the LQ is based on an area’s share of the
region’s employees in a particular sector. This is most appropriate for sectors which are essentially
independent of the local economy (e.g., manufacturing). Their activities are largely driven by regional,
national or international suppliers and customers, and the goods and services they produce are typically
traded over long distances. The EEFM treats the following sectors in this way:
Agriculture
Mining & quarrying
Food manufacturing
General manufacturing
Chemicals excluding pharmaceuticals
Pharmaceuticals
Metals manufacturing
Transport equipment, machinery & equipment, etc.
Electronics
Utilities
Waste & remediation
Water & air transport
Publishing & broadcasting
Telecoms
Computer related activity
Research & development
Other services
For this group, the local employee growth forecasts in the EEFM come from the interaction of the relevant
LQ forecasts with the regional sector employee forecasts from Oxford’s Regional Model. To take a
hypothetical example, if the Regional Model forecasts a 5% increase in air transport employees in the East of
England, this filters down to the local area forecasts in the EEFM. If the LQ for air transport in a given area is
forecast to remain stable, the employee forecasts for air transport in that area will tend to show a 5%

EEFM Technical Report
January 2015
13
increase. (In absolute terms, this means many new jobs in areas with high LQs and relatively few in areas
with low LQs.) If the LQ is forecast to increase (or decrease) in an area, the local employee growth forecasts
for air transport will tend to be more than (or less than) 5%.
The LQ in an area can also be based on the number of employees in a given sector per head of the local
population, relative to the regional average. This is most appropriate for sectors in which employment
change is primarily (but rarely exclusively) driven by changes in the local population (e.g., health and
education). In the EEFM, this group includes:
Wholesale
Retailing
Hotels & restaurants
Public administration
Education
Heath & care
Arts & entertainment
For this group, the local employee growth forecasts in the EEFM come from the interaction of the relevant
LQ forecasts with the demographic forecasts for the area (which are also in the EEFM) and for the region as
a whole (from the Regional Model). To take the example of education, consider an area which has an
education LQ of 1.3 (or 130%) - perhaps because it has a university. Suppose that that LQ has been
unchanged for a long time and is forecast to stay the same. And suppose that the area’s population is also
forecast to remain stable. But if the region’s population is forecast to increase, education employees in this
area will have to increase as well to keep the equation in balance (all other things being equal). This makes
sense inasmuch as the area’s education institutions clearly serve a market wider than the local area.
Finally, a sector’s LQ can be based on the number of its employees relative to all jobs in the area, relative to
the regional average. This is most appropriate for sectors where changes in employment arise primarily from
changes in total employment locally - where the latter is effectively a proxy for business activity. (As might be
expected, business services sectors tend to be in this group.) In the EEFM, the following are included:
Construction
Land transport
Finance
Real estate
Professional services
Business services
Employment activities
In this group, the local employee growth forecasts in the EEFM come from the interaction of the relevant LQ
forecasts with the regional sector employment forecasts from the Regional Model.
It is important to stress that the process of making these forecasts cannot be wholly automated. That is,
some professional judgement is required to manually adjust the forecasts in cases where simply
extrapolating the trend in location quotients from 1991 produces results which appear unrealistic for
whatever reason. Altogether, around three-quarters of local sector LQ trends in the EEFM are subject to
some kind of manual adjustment. The need for this is illustrated in Figures 3.2 and 3.3 below. Figure 3.2
shows two LQ trends for labour recruitment in Babergh - an automated extrapolation of past trends and a
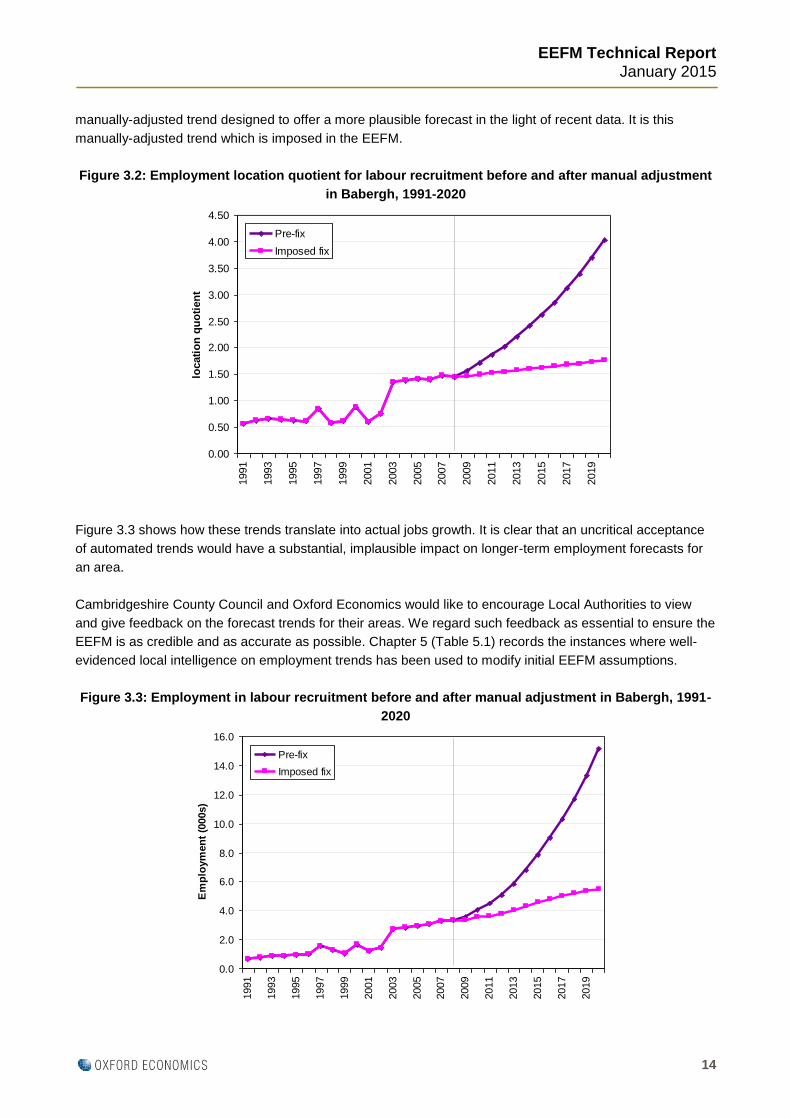
EEFM Technical Report
January 2015
14
manually-adjusted trend designed to offer a more plausible forecast in the light of recent data. It is this
manually-adjusted trend which is imposed in the EEFM.
Figure 3.2: Employment location quotient for labour recruitment before and after manual adjustment
in Babergh, 1991-2020
Figure 3.3 shows how these trends translate into actual jobs growth. It is clear that an uncritical acceptance
of automated trends would have a substantial, implausible impact on longer-term employment forecasts for
an area.
Cambridgeshire County Council and Oxford Economics would like to encourage Local Authorities to view
and give feedback on the forecast trends for their areas. We regard such feedback as essential to ensure the
EEFM is as credible and as accurate as possible. Chapter 5 (Table 5.1) records the instances where well-
evidenced local intelligence on employment trends has been used to modify initial EEFM assumptions.
Figure 3.3: Employment in labour recruitment before and after manual adjustment in Babergh, 1991-
2020
0.00
0.50
1.00
1.50
2.00
2.50
3.00
3.50
4.00
4.50
1991
1993
1995
1997
1999
2001
2003
2005
2007
2009
2011
2013
2015
2017
2019
locati
on
qu
oti
en
t
Pre-fix
Imposed fix
0.0
2.0
4.0
6.0
8.0
10.0
12.0
14.0
16.0
1991
1993
1995
1997
1999
2001
2003
2005
2007
2009
2011
2013
2015
2017
2019
Em
plo
ym
en
t (0
00s)
Pre-fix
Imposed fix

EEFM Technical Report
January 2015
15
Oxford Economics’ Regional Model has employee forecasts linked to a wide range of variables - for
example, a region’s wages and rents relative to those in London, which is particularly important as an
influence on financial and business services employment. These are not replicated in the EEFM, although
there is obviously an indirect link in that Regional Model employee growth forecasts in a given sector in the
East of England must be allocated by the EEFM to the region’s local authorities.
Both the Regional Model and the EEFM incorporate links between employment, migration and
unemployment. The details of this are explained below.
Full-time and part-time employment
The total number of jobs in an area, broken down into full- and part-time jobs.
East of England shares of part-time employees among all employees in the 31 EEFM sectors (which are
trend forecasts linked to regional and national projections) are applied to the workplace employee estimates
described above. Full-time employees are simply the total of employees minus the part-time employees for
each of the 31 sectors.
Workplace self-employment (jobs)
The total number of self-employed jobs in an area.
Self-employment data for the East of England in Oxford Economics’ Regional Model comes from ONS’s
Labour Force Survey / Annual Population Survey. Previously, self employment data at a regional level was
not available by sector, however the ONS now publishes this information.
Self-employment data for local authorities is Census-based, and scaled to the East of England self-employed
jobs estimates from the Regional Model. It is broken down by the 31 EEFM sectors. The sectors are forecast
using the growth in the sectoral employees in employment data and the estimates are scaled to the Regional
Model’s estimate of self-employment by sector for the East of England.
Total workplace employment (people)
The total number of people in employment in an area, including both residents and commuters. A person
who has more than one job is only counted once, so total workplace employed people is smaller than total
workplace employment.
The employment data from the Business Register and Employment Survey (BRES) over the years 2008-12
(and the Annual Business Inquiry (ABI) for earlier years) which is used in the Model measures jobs rather
than workers. Because a model aiming to simulate housing demand needs to focus on people, we have to
convert the total number of jobs in an area into numbers of employed people.
The 2001 and 2011 Census results give the number of people in employment in an area. For other years, we
use BRES / ABI data to estimate residents in employment using the full-time and part-time projections (see
above). Individuals are assumed to hold only one full-time job each. Part-time jobs are assumed to account
for 0.75 of a full-time job, and self-employed people are assumed to account for 0.93 of a self-employed job.
A simple adjustment is made to scale the indicator so it is consistent with the Census.
This measure is not forecast, but derived from the forecasts of jobs discussed above.

EEFM Technical Report
January 2015
16
Total workplace employment (jobs)
The total number of employee jobs and self-employed jobs in an area. These can be taken by residents or
commuters from outside. Note that this includes all full- and part-time jobs, so if someone has two part-time
jobs, they are counted twice.
This is not forecast separately in the EEFM, but derived by summing the workplace-based employee jobs
and self-employed jobs forecasts described above, and then adding in a constant for the Armed Forces (see
below). (Note: Armed Forces data are added to the public administration & defence sector.)
Residence employment
The total number of employed people living in an area. This includes residents who commute elsewhere to
work.
Residence employment is based on a commuting matrix taken from the 2011 Census. This matrix tells us,
for any given area, where its residents work. Using this information, each available job (see workplace
employment (people) above) is allocated to a resident of one of the authorities with which the area has
commuting links, in proportion to the strength of that link. This method assumes that commuting patterns do
not change over time.
Net Commuting
The number of people commuting into an area for work, less the number of residents commuting out.
Net commuting requires no specific forecasting method. It is the residual between an area’s residence-based
and workplace-based estimates of numbers of people in employment. (These variables are used to check
the realism of the EEFM’s workplace- and residence-based employment forecasts, and can occasionally
lead to manual adjustments to the Model.)
Our broad assumption is that commuting flows over the forecast period are in line with past trends. Major
changes in transport infrastructure, or significant new housebuilding in an area, may bring about changes in
commuting patterns, but as indicated in Chapter 2, the EEFM can only take account of such changes if they
are reflected in the available data.
Claimant unemployed
The total number of people in an area without a job and claiming unemployment benefits
The number of unemployed people is projected as:
the previous year’s value
plus 0.55 X (projected change in working-age population)
minus 0.45 X (projected change in resident employment)
The two coefficients were obtained by Oxford Economics after an iterative process to produce the most
plausible forecasts for unemployment – and, indirectly, migration. Both are less than one, reflecting the fact
that many people adding to the local working age population go into education (e.g., students) or directly into
employment (e.g., by moving to the area specifically to take up a new job), and the fact that many new job
vacancies in the area will not necessarily be filled by the local unemployed (e.g., migrants, commuters).
EEFM Technical Report
January 2015
17
(Note: in some districts, the coefficient of working-age population, 0.55, produces implausible results – for
example, in suburban areas where population change may be unrelated to employment change. In these
situations, a different value is manually introduced into the Model.)
ILO unemployment is also included in the Model and comes from the Annual Population Survey. This data is
available for 2004-2013 and is both back-cast and forecast, using growth rates in the claimant series.
Gross Value Added (GVA)
The total sum of income generated in an area over a specified period, usually a year. It is the sum of wages,
profits and rents. An alternative and equivalent definition is the value of gross output less purchases of
intermediate goods and services.
GVA forecasts are available for 31 sectors in Oxford Economics’ Regional Model. Previously, a sector
entitled ‘ownership of dwelling’ (imputed rents in the ONS National Accounts) was excluded from the overall
business services sector and published as its own sector. In Summer 2011, the ONS changed its
methodology to publish data which included imputed rents within the business services sector. To remain
consistent with National data, the EEFM now includes this measure of GVA within the real estate sector.
Sub-regionally, limited sector GVA data is available at NUTS 3 level (i.e. for unitaries and shire counties) but
not for local authorities. Our initial forecasts at this level are obtained by multiplying forecast regional GVA
per job in a sector (from the Regional Model) by forecast total workplace employment (jobs) in that sector
(from the EEFM) for each local authority.
These initial forecasts are then subject to two adjustments. The first is for wage differentials (from ONS’s
Annual Survey of Hours and Earnings), which has the effect of increasing GVA disproportionately in areas
where wages are higher. The second scales local sector GVA to the most recent published NUTS 3 level
GVA estimates for the relevant base year (2010).
Productivity
GVA divided by total workplace employment (jobs). It measures the average amount of income generated in
each area by every person working there.
Productivity estimates do not require specific forecasting. They are simply forecast sector GVA divided by
forecast total jobs (both employee and self-employed) in that sector.
Relative productivity is simply productivity in a specified area, divided by productivity in the region. A relative
productivity value greater than 1.0 implies that productivity in that area (and sector) is higher than the
regional average, and vice versa.

EEFM Technical Report
January 2015
18
Demographic variables
Total population
The total number of people living in an area
All population data is taken from ONS’s mid-year estimates (MYE). Population at regional level is forecast
using official projections of natural increase, plus Oxford’s projected numbers of migrants (broken down by
domestic and international). At local level, total population is forecast as last year’s population plus natural
increase plus net migration (domestic and international).
Working age population
The total number of people in an area that are aged 16-64 (note: in the EEFM 2013 update the definition of
working age was changed, previously it was defined as all people aged 16-retirement age, however this data
is no longer published by the ONS leading to the decision being made to change the definition of working
age)
Working age population for the region is calculated using official projections of natural increase in the
working age population and Oxford’s forecast of net migration of working age people (see below).
For local areas, forecast working age population is forecast total population multiplied by a ratio of working
age to total population. This ratio is forecast for each year of the forecast period, and calculated as the
previous year’s ratio multiplied by the growth in the ratio regionally according to the ONS (2012-based)
projections.
Young population
The total number of children in an area (defined as all people aged 0-15)
The population aged under 16 years is forecast at local authority level using an annual ratio of children to
working age people. This ratio is forecast for each year of the forecast period, and calculated as the previous
year’s ratio multiplied by the growth in the ratio regionally according to the ONS (2012-based) projections.
The regional forecast for this variable is simply the sum of these local area forecasts.
Elderly population
The total number of elderly people in a given area (defined as all people aged 65+). Note this definition has
changed in line with the changes to the definition of working age people (see above)
The local elderly population forecasts are simply the residual of the total population when the young and
working age populations are subtracted. The regional forecast for this variable is simply the sum of these
local area forecasts.
Migration
The net flow of people moving into and out of an area, whether this be to/from other parts of the region, the
UK or the world. A negative number signifies a net outflow of people from an area, a positive number a net
inflow.
Regional migration:

EEFM Technical Report
January 2015
19
This comes from the Oxford Economics Regional Model, in which forecast net migration of working
age people into the East of England in any given year is a function of:
Working age net migration into the UK
Difference in unemployment rates between the East of England and the UK
Ratio of the East of England’s house prices to those in London
Ratio of the East of England’s average wages to those in London
Total net migration into the region in any given year is forecast as the sum of forecast working age
migration, plus a constant annual figure for other migrants.
Local migration:
Migration data is sourced from ONS’s population mid-year estimates ‘Components of Change’ data.
The forecasting methodology is more complex, and not the same as the regional forecasting
methodology described above. At local authority level, the number of migrants is the sum of two
components: economic migrants and non-economic migrants.
Note: in the EEFM 2014 update, we have re-estimated the coefficients used in the economic migrant
equations to reflect recent trends in migration.
The number of economic migrants into each area in any given year equals:
previous year’s population
multiplied by ([0.01 - (0.0016 X previous year’s relative unemployment rate differential from the
region unemployment rate)] where the unemployment rate has working age population as the
denominator)
This formula implies that the number of migrants into a district will equate to 1.0% of last year’s population if
the difference between local and regional unemployment rate then was zero. Unemployment rates below 3%
will result in net in-migration, whereas unemployment rates above 3% will lead to net out-migration. To
illustrate with a worked example, in an area with 100,000 people and a 0.1pp positive difference in relative
unemployment rate, net migration the following year will be 100,000 X [0.01 - (0.0016 X 0.1)], or 100,000 X
[0.01 – 0.00016], or 100,000 X 0.00984, or 984.
So any change in employment or population in the EEFM which affects unemployment - whether the change
is externally-sourced or internally generated within the Model - will affect net migration.
Non-economic migrants are set as a constant - unique to every area - for all future years. The constant for a
given local authority is selected on the basis that it both reflects the actual population trend for the area over
1991-2013 (from ONS) and implies a local employment rate trend consistent with that for the region as a
whole.

EEFM Technical Report
January 2015
20
Housing variables
Households
The total number of households (as defined in official statistics) in an area
Demand for dwellings
The total number of dwellings (as defined in official statistics) in an area
The initial household data are as presented in the official DCLG series. The initial dwellings data are the
stock data presented in the official DCLG series (table 125 provides total dwelling stock, whilst table 615
provides vacant stock, the residual between these series therefore represents occupied dwelling stock). The
methodology for forecasting households and dwellings has undergone two key changes from that which was
applied when the model was originally developed. When the EEFM was first developed, household numbers
were originally forecast by projecting both population (using the methodology described earlier) and the ratio
of households to population (from the Chelmer forecasts). From this it projected dwellings (using Chelmer
forecasts of the number of dwellings per household, allowing for empty dwellings, second homes, etc.).
However, in the EEFM’s Autumn 2008 run, Oxford Economics felt the Chelmer-based projections lacked
credibility and the process of forecasting these two variables was modified, which became as follows:
First, we forecast the number of occupied dwellings directly from population by projecting the ratio of
occupied dwellings to population using the linear trend identified by Oxford Economics for the period 1997 –
2007.
Having calculated occupied dwellings, we use a ratio of total to occupied dwellings (calculated by Oxford
Economics from the most recent data available) in order to project total dwelling stock. We call this “demand
for dwellings.” It is intended to proxy dwelling stock, but it is not a conventional stock or supply figure. Rather
it tries to estimate what stock might be needed to accommodate the projected number of people, using
Oxford Economics’ occupancy rate assumptions.
Meanwhile, to produce household forecasts, we divide the forecast numbers of occupied dwellings by
Chelmer estimates of the ratio of occupied dwellings to households. (Note that although there is a separate
Chelmer estimate for each local authority, it is a constant, so will not capture possible changes locally over
time.)
In the EEFM 2013 update, we made one further adjustment to the forecast for these two variables. In recent
years, the occupancy ratio of dwelling stock in the East has stalled its downward trend. This has largely been
brought about by the impact of the recession and sluggish economic growth since. We believe that this trend
in occupancy rates is due to rising unemployment, falling real incomes and the resulting lower levels of
house-building as well as lower rates of mortgage lending. These factors are of course interrelated, but the
impact on occupancy rates are clear where young people are staying at home for longer due to the inability
to obtain a mortgage. Another factor is the recent influx of migrants who tend to live at higher densities
despite the impacts of the recession.
As such, Oxford Economics estimate that occupancy rates are likely to fall at a slower pace for a number of
years, before reverting to the pre-recession downward trend over the longer term. We believe that by once
the economic recovery is more sustained, unemployment rates will have decreased sufficiently such that
banks will be starting to lend at a similar rate to the period prior to the recession and the rate of house-
building is likely to pick up again to meet the demand for housing from the local population.

EEFM Technical Report
January 2015
21
Carbon emissions
Industry, commercial & energy emissions
The amount of CO2 emissions produced by the industrial, commercial & energy sector in an area in any
given year
Data for the amount of CO2 emissions produced by the industry, commercial & energy sector is published by
the Department of Energy and Climate Change (DECC) by local authority.
Local authority CO2 emissions forecasts within the industry, commercial & energy sectors were produced by
first creating UK carbon weights by industrial sector. This was done using sectoral employment and carbon
emissions forecasts from the Oxford Economics Industry Model (OEIM) (note that OE UK carbon emissions
forecasts are consistent with the DECC projections). By dividing the emissions in a sector by the number of
people in employment in that sector, then dividing this by the emissions for the average UK worker (total UK
emissions divided by total UK employment), we are able to get weights showing how carbon intensive
specific sectors are.
For each local authority, we then calculate a carbon weighted employment figure based on what the
employment breakdown in that area is. So a district which employs significantly more of their workforce in the
emissions intensive chemicals and processing industries sector would be forecast to have a higher carbon
weighted employment figure than a district which had a large agricultural sector.
This carbon weighted figure is then multiplied by the average emissions per UK employee, to give a pre-
adjusted industrial & commercial emissions forecast. The pre-adjusted forecast also takes into account
emissions from the energy sector. These emissions are forecast from the OEIM, and we have modelled the
energy sector as having no employees as such. Otherwise, we could have a problem where a district with a
high number of energy sector employees could be a head office and not really emitting much carbon. So we
share the energy sector emissions across districts by multiplying UK energy sector emissions by each
district’s share of total UK employment.
Finally, we adjust our forecasts based on scaling factors capturing the differences between our calculations
for 2005-12 and the 2005-12 DECC data.
Domestic emissions
The total number of emissions produced by households in an area in any given year
Data for the amount of CO2 emissions produced by the domestic sector is published by the Department of
Energy and Climate Change (DECC) by local authority.
Local authority CO2 emissions forecasts within the domestic sector are assumed to be a function of
population (for example, more people means more households and therefore more domestic energy use).
We have calculated the UK average level of domestic emissions per person by taking the total UK household
emissions and dividing by UK total population from the OEIM. Then we applied this UK domestic emissions
per person ratio to the local authority population forecasts in the EEFM to estimate a pre-adjusted domestic
emissions forecast by local authority. Then we adjusted the forecasts based on scaling factors capturing the
differences between our calculations for 2005-12 and the DECC data during the same years.
Transport emissions
The total number of emissions produced by the transport sector in an area in any given year
EEFM Technical Report
January 2015
22
Data for the amount of CO2 emissions produced by the transport sector is published by the Department of
Energy and Climate Change (DECC) by local authority.
Local authority CO2 emissions forecasts within the transport sector are assumed to be a function of GVA (for
example, more output means more transport use and therefore more emissions from transport). We have
calculated the UK average level of transport emissions per unit of GDP by taking the total UK transport
emissions and dividing by UK total GDP from the OEIM. Then we applied this UK transport emissions per
person ratio to the local authority GVA forecasts in the EEFM to estimate a pre-adjusted transport emissions
forecast by local authority. Then we adjusted the forecasts based on scaling factors capturing the differences
between our calculations for 2005-12 and the DECC data during the same years.
Land use, land use change and forestry (LULUCF) emissions
The total number of emissions produced via land use (e.g. deforestation, emissions from soils, etc.) in an
area in any given year
Data for the amount of CO2 emissions produced by the LULUCF sector is published by the Department of
Energy and Climate Change (DECC) by local authority.
Local authority CO2 emissions forecasts within the LULUCF sector are assumed to be a function of land
area i.e. more land gives more potential for deforestation, emissions from soils, etc. We have taken land area
data, measured in hectares, from the UK Standard Area Measurements for 2007, and assumed that these
values have not changed over time. Then we took UK LULUCF emissions data from DECC for 2005-12, and
DEFRA forecasts for 2010, 2015 and 2020. For the years in between, we assumed a straight line and
extrapolated annual data points and beyond 2020 we assumed a continuation of the trend. Then, using data
from DECC for 2005-12, we projected the local authority LULUCF emissions by taking the previous year’s
emissions, and adding the local authority share (calculated by taking each area’s share of total UK land area)
of the net change in UK LULUCF emissions in each year.
Total emissions
The total number of CO2 emissions produced in an area in any given year
This is calculated as an aggregate of industry, commercial & energy emissions, domestic emissions,
transport emissions and LULUCF emissions.
EEFM Technical Report
January 2015
23
4: Data used
Labour market
Employees in employment
Description: Annual average employee job estimates
Data: 1991 – 1995 Annual Employment Survey (AES)
1995 – 1997 Annual Employment Survey rescaled to ABI
1998 – 2008 Annual Business Inquiry (ABI)
2008 – 2012 Business Register and Employment Survey (BRES)
2013 – ONS Workforce Jobs (WFJ)
Latest data:
Regional and UK data: 2013
Local authority data: 2012
Next release:
Regional data: BRES 2013 results, available September 2014
ONS Workforce Jobs Q2 2014, available September 2014
Local authority data: BRES 2013 results, available September 2014
There are two key sources for the employee jobs data used in the EEFM – ONS Workforce Jobs (WFJ) and
the Business Register and Employment Survey (BRES).
The WFJ series is reported on a quarterly basis, providing estimates of employee jobs by sector
(based on the 2007 Standard Industrial Classification – SIC 2007) for the UK and its constituent
government office regions, over the period 1981 Q3 to 2014 Q1.
The BRES is an employment survey which has replaced the Annual Business Inquiry (ABI). Similar
to WFJ, BRES data is based upon the SIC 2007, but it is only published for the years 2008-12. Prior
to this, ABI data is available for employee jobs data, however this is based on the old industrial
classification (SIC 2003). In contrast with WFJ, BRES data are available at a more disaggregated
level of detail – i.e. estimates of employee jobs are available at local authority level and more
detailed sector definitions. It is worth noting that the BRES is first and foremost a survey and is
therefore subject to volatility, particularly when the level of detail becomes more refined (this is
discussed in more detail in Chapter 5). The survey is collected in September of each year and not
seasonally adjusted.
UK employee jobs data is taken directly from the ONS WFJ series, where annual averages are estimated
from the quarterly data.
There are a number of steps in constructing regional employee jobs, due to changes in sectoral
classifications across the various sources, and restrictions on data availability over particular periods of time.
Initially, we take employee jobs data for each sector directly from the BRES over the years 2008-12. This
relates to September figures and is based upon SIC 2007 sectors.
WFJ data of employee jobs by SIC 2007 sector is available between 1981 Q1 and 2014 Q1. Using this, we
are able to construct an annual series of employee jobs by sector for each region over the period 1981-2013
(annual averages are estimated by taking the average of the quarterly data for each year). This, in turn,
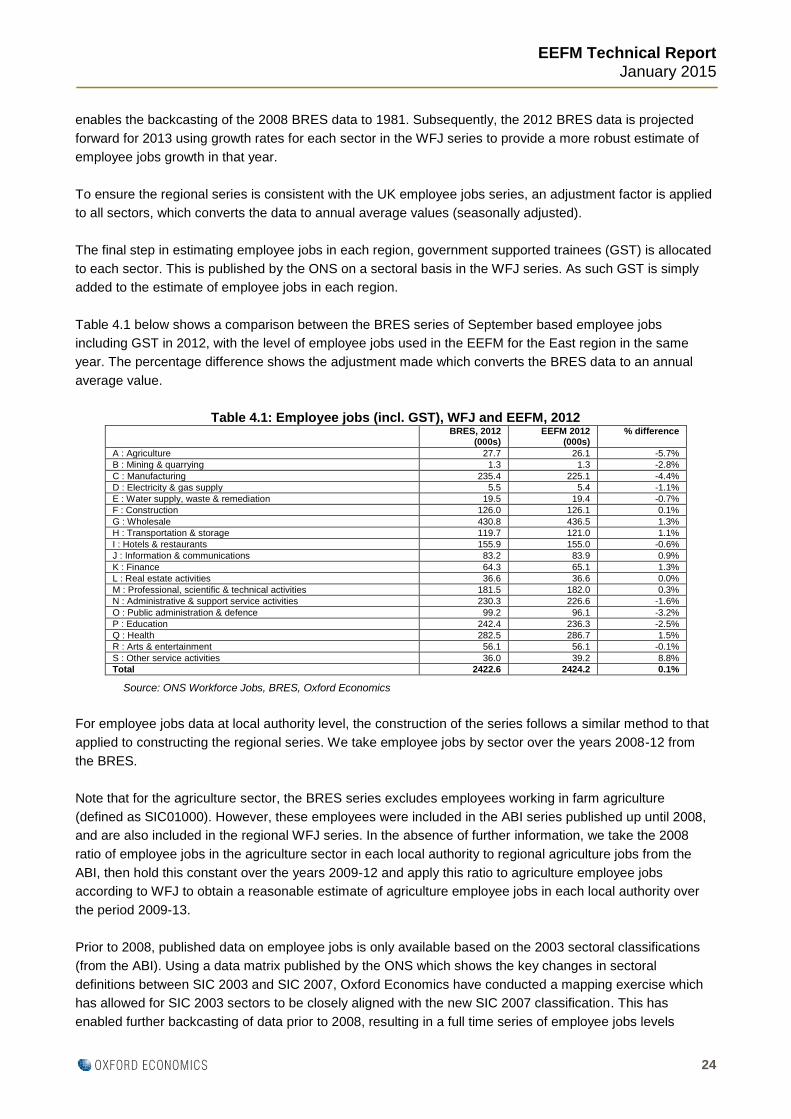
EEFM Technical Report
January 2015
24
enables the backcasting of the 2008 BRES data to 1981. Subsequently, the 2012 BRES data is projected
forward for 2013 using growth rates for each sector in the WFJ series to provide a more robust estimate of
employee jobs growth in that year.
To ensure the regional series is consistent with the UK employee jobs series, an adjustment factor is applied
to all sectors, which converts the data to annual average values (seasonally adjusted).
The final step in estimating employee jobs in each region, government supported trainees (GST) is allocated
to each sector. This is published by the ONS on a sectoral basis in the WFJ series. As such GST is simply
added to the estimate of employee jobs in each region.
Table 4.1 below shows a comparison between the BRES series of September based employee jobs
including GST in 2012, with the level of employee jobs used in the EEFM for the East region in the same
year. The percentage difference shows the adjustment made which converts the BRES data to an annual
average value.
Table 4.1: Employee jobs (incl. GST), WFJ and EEFM, 2012 BRES, 2012
(000s) EEFM 2012
(000s) % difference
A : Agriculture 27.7 26.1 -5.7%
B : Mining & quarrying 1.3 1.3 -2.8%
C : Manufacturing 235.4 225.1 -4.4%
D : Electricity & gas supply 5.5 5.4 -1.1%
E : Water supply, waste & remediation 19.5 19.4 -0.7%
F : Construction 126.0 126.1 0.1%
G : Wholesale 430.8 436.5 1.3%
H : Transportation & storage 119.7 121.0 1.1%
I : Hotels & restaurants 155.9 155.0 -0.6%
J : Information & communications 83.2 83.9 0.9%
K : Finance 64.3 65.1 1.3%
L : Real estate activities 36.6 36.6 0.0%
M : Professional, scientific & technical activities 181.5 182.0 0.3%
N : Administrative & support service activities 230.3 226.6 -1.6%
O : Public administration & defence 99.2 96.1 -3.2%
P : Education 242.4 236.3 -2.5%
Q : Health 282.5 286.7 1.5%
R : Arts & entertainment 56.1 56.1 -0.1%
S : Other service activities 36.0 39.2 8.8%
Total 2422.6 2424.2 0.1%
Source: ONS Workforce Jobs, BRES, Oxford Economics
For employee jobs data at local authority level, the construction of the series follows a similar method to that
applied to constructing the regional series. We take employee jobs by sector over the years 2008-12 from
the BRES.
Note that for the agriculture sector, the BRES series excludes employees working in farm agriculture
(defined as SIC01000). However, these employees were included in the ABI series published up until 2008,
and are also included in the regional WFJ series. In the absence of further information, we take the 2008
ratio of employee jobs in the agriculture sector in each local authority to regional agriculture jobs from the
ABI, then hold this constant over the years 2009-12 and apply this ratio to agriculture employee jobs
according to WFJ to obtain a reasonable estimate of agriculture employee jobs in each local authority over
the period 2009-13.
Prior to 2008, published data on employee jobs is only available based on the 2003 sectoral classifications
(from the ABI). Using a data matrix published by the ONS which shows the key changes in sectoral
definitions between SIC 2003 and SIC 2007, Oxford Economics have conducted a mapping exercise which
has allowed for SIC 2003 sectors to be closely aligned with the new SIC 2007 classification. This has
enabled further backcasting of data prior to 2008, resulting in a full time series of employee jobs levels
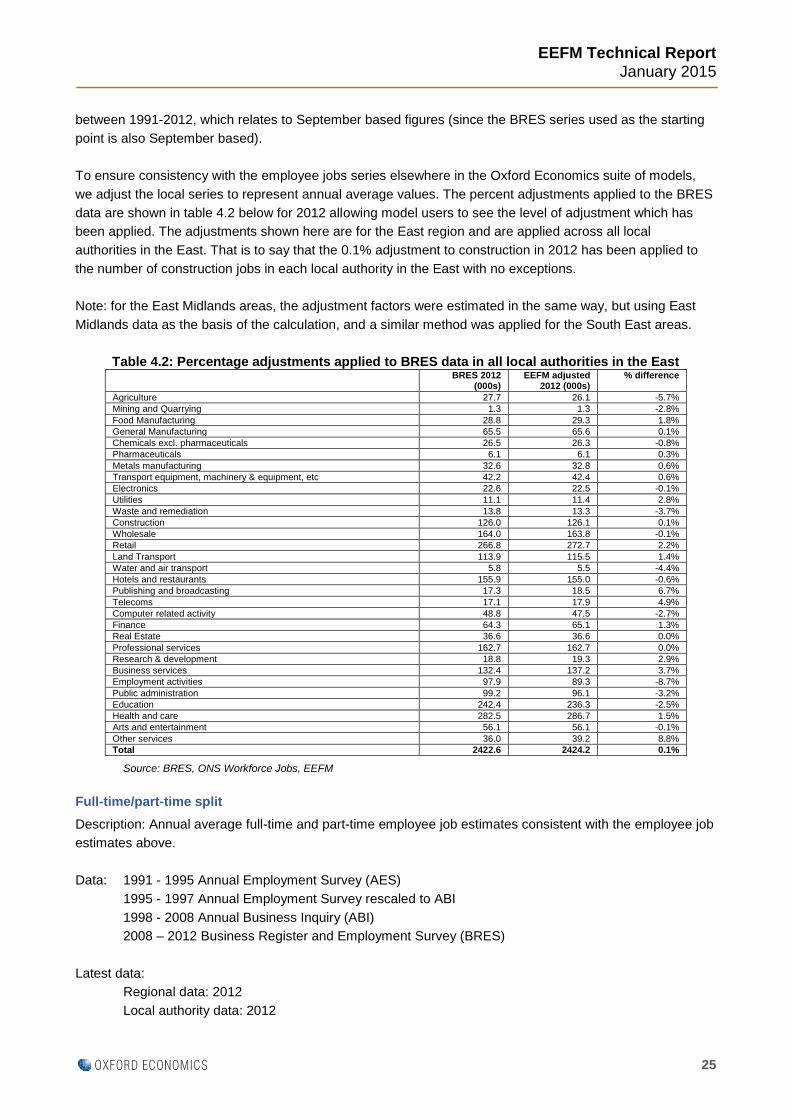
EEFM Technical Report
January 2015
25
between 1991-2012, which relates to September based figures (since the BRES series used as the starting
point is also September based).
To ensure consistency with the employee jobs series elsewhere in the Oxford Economics suite of models,
we adjust the local series to represent annual average values. The percent adjustments applied to the BRES
data are shown in table 4.2 below for 2012 allowing model users to see the level of adjustment which has
been applied. The adjustments shown here are for the East region and are applied across all local
authorities in the East. That is to say that the 0.1% adjustment to construction in 2012 has been applied to
the number of construction jobs in each local authority in the East with no exceptions.
Note: for the East Midlands areas, the adjustment factors were estimated in the same way, but using East
Midlands data as the basis of the calculation, and a similar method was applied for the South East areas.
Table 4.2: Percentage adjustments applied to BRES data in all local authorities in the East BRES 2012
(000s) EEFM adjusted
2012 (000s) % difference
Agriculture 27.7 26.1 -5.7%
Mining and Quarrying 1.3 1.3 -2.8%
Food Manufacturing 28.8 29.3 1.8%
General Manufacturing 65.5 65.6 0.1%
Chemicals excl. pharmaceuticals 26.5 26.3 -0.8%
Pharmaceuticals 6.1 6.1 0.3%
Metals manufacturing 32.6 32.8 0.6%
Transport equipment, machinery & equipment, etc 42.2 42.4 0.6%
Electronics 22.6 22.5 -0.1%
Utilities 11.1 11.4 2.8%
Waste and remediation 13.8 13.3 -3.7%
Construction 126.0 126.1 0.1%
Wholesale 164.0 163.8 -0.1%
Retail 266.8 272.7 2.2%
Land Transport 113.9 115.5 1.4%
Water and air transport 5.8 5.5 -4.4%
Hotels and restaurants 155.9 155.0 -0.6%
Publishing and broadcasting 17.3 18.5 6.7%
Telecoms 17.1 17.9 4.9%
Computer related activity 48.8 47.5 -2.7%
Finance 64.3 65.1 1.3%
Real Estate 36.6 36.6 0.0%
Professional services 162.7 162.7 0.0%
Research & development 18.8 19.3 2.9%
Business services 132.4 137.2 3.7%
Employment activities 97.9 89.3 -8.7%
Public administration 99.2 96.1 -3.2%
Education 242.4 236.3 -2.5%
Health and care 282.5 286.7 1.5%
Arts and entertainment 56.1 56.1 -0.1%
Other services 36.0 39.2 8.8%
Total 2422.6 2424.2 0.1%
Source: BRES, ONS Workforce Jobs, EEFM
Full-time/part-time split
Description: Annual average full-time and part-time employee job estimates consistent with the employee job
estimates above.
Data: 1991 - 1995 Annual Employment Survey (AES)
1995 - 1997 Annual Employment Survey rescaled to ABI
1998 - 2008 Annual Business Inquiry (ABI)
2008 – 2012 Business Register and Employment Survey (BRES)
Latest data:
Regional data: 2012
Local authority data: 2012
EEFM Technical Report
January 2015
26
Next release:
Regional data: BRES 2013 results available September 2014
Local authority data: BRES 2013 results available September 2014
The EEFM draws its data on full-time and part-time employees in employment from the BRES over the years
2008-12, and the ABI in earlier years. These figures relate to September, whereas those in the Oxford
Regional Model use annual average figures (from WFJ). The proportion of part-time employees within each
sector is applied to the scaled employees estimates described above. This produces estimates of part-time
employee jobs, and since the employee jobs which the part times shares are applied to are themselves
annual averages, this converts the estimates of part time employee jobs to annual average values. Full-time
employee jobs are calculated by subtracting the part-time estimates from the total, and are therefore annual
average values.
Self-employment
Description: Annual average self-employment job estimates
Data: ONS Workforce Jobs (WFJ)
Census 2001 and 2011 for local area estimates
Latest data: Regional - 2013
Local authorities - 2012
Next release: Regional data: ONS Workforce Jobs Q2 2014, available September 2014
Local authorities: 2013 data available September 2014
Self-employment data at local level is published in the Annual Population Survey. However, due to sampling
errors, the data are volatile, and even in cases where moving averages are used to smooth them out, the
level of inaccuracy in the series remains a problem. Oxford Economics estimates self-employment at a
sectoral level, using regional employee jobs / self-employment ratios, applying them to the local authority
employee jobs series, and finally scaling to total self-employment figures from the Census 2001 and 2011
results.
Self-employment data by sector for the UK and its regions is now published by the ONS in its Workforce
Jobs series (WFJ) where data is available on a quarterly basis over the period 1996 Q1 until 2014 Q1.
Annual average self employment levels are estimated by taking the average of jobs levels in each quarter of
each year. Previously this was estimated by Oxford Economics as sectoral level data was not publicly
available.
Prior to 1996, Oxford Economics backcast data by applying growth rates in the self employment series which
were used previously in the OE Regional Model. Since the previous self employment series was based on
SIC 2003 definitions, we apply the growth rates in the sector which is most closely aligned with the new SIC
2007 sector. For example, the professional services and real estate sectors (both SIC 2007 based) are
backcast using growth rates in the overall (SIC 2003 based) business services sector.
Self-employment data for local areas in the EEFM is constructed as follows:
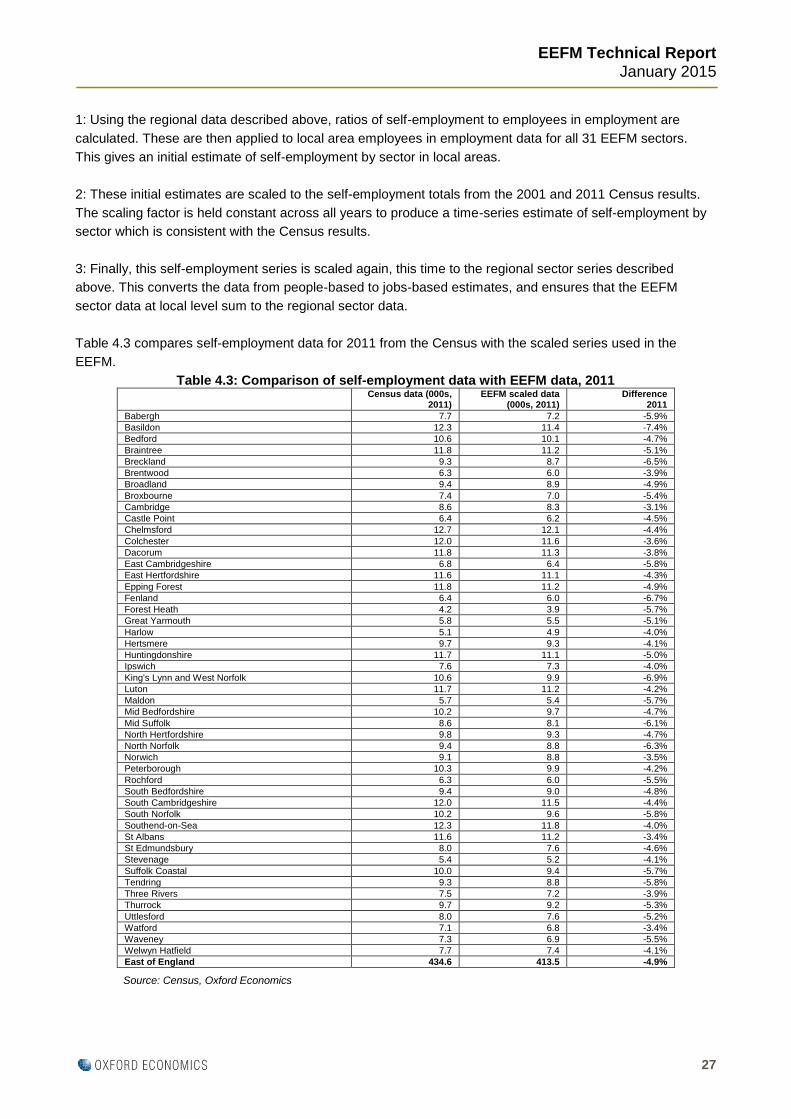
EEFM Technical Report
January 2015
27
1: Using the regional data described above, ratios of self-employment to employees in employment are
calculated. These are then applied to local area employees in employment data for all 31 EEFM sectors.
This gives an initial estimate of self-employment by sector in local areas.
2: These initial estimates are scaled to the self-employment totals from the 2001 and 2011 Census results.
The scaling factor is held constant across all years to produce a time-series estimate of self-employment by
sector which is consistent with the Census results.
3: Finally, this self-employment series is scaled again, this time to the regional sector series described
above. This converts the data from people-based to jobs-based estimates, and ensures that the EEFM
sector data at local level sum to the regional sector data.
Table 4.3 compares self-employment data for 2011 from the Census with the scaled series used in the
EEFM.
Table 4.3: Comparison of self-employment data with EEFM data, 2011 Census data (000s,
2011) EEFM scaled data
(000s, 2011) Difference
2011
Babergh 7.7 7.2 -5.9%
Basildon 12.3 11.4 -7.4%
Bedford 10.6 10.1 -4.7%
Braintree 11.8 11.2 -5.1%
Breckland 9.3 8.7 -6.5%
Brentwood 6.3 6.0 -3.9%
Broadland 9.4 8.9 -4.9%
Broxbourne 7.4 7.0 -5.4%
Cambridge 8.6 8.3 -3.1%
Castle Point 6.4 6.2 -4.5%
Chelmsford 12.7 12.1 -4.4%
Colchester 12.0 11.6 -3.6%
Dacorum 11.8 11.3 -3.8%
East Cambridgeshire 6.8 6.4 -5.8%
East Hertfordshire 11.6 11.1 -4.3%
Epping Forest 11.8 11.2 -4.9%
Fenland 6.4 6.0 -6.7%
Forest Heath 4.2 3.9 -5.7%
Great Yarmouth 5.8 5.5 -5.1%
Harlow 5.1 4.9 -4.0%
Hertsmere 9.7 9.3 -4.1%
Huntingdonshire 11.7 11.1 -5.0%
Ipswich 7.6 7.3 -4.0%
King's Lynn and West Norfolk 10.6 9.9 -6.9%
Luton 11.7 11.2 -4.2%
Maldon 5.7 5.4 -5.7%
Mid Bedfordshire 10.2 9.7 -4.7%
Mid Suffolk 8.6 8.1 -6.1%
North Hertfordshire 9.8 9.3 -4.7%
North Norfolk 9.4 8.8 -6.3%
Norwich 9.1 8.8 -3.5%
Peterborough 10.3 9.9 -4.2%
Rochford 6.3 6.0 -5.5%
South Bedfordshire 9.4 9.0 -4.8%
South Cambridgeshire 12.0 11.5 -4.4%
South Norfolk 10.2 9.6 -5.8%
Southend-on-Sea 12.3 11.8 -4.0%
St Albans 11.6 11.2 -3.4%
St Edmundsbury 8.0 7.6 -4.6%
Stevenage 5.4 5.2 -4.1%
Suffolk Coastal 10.0 9.4 -5.7%
Tendring 9.3 8.8 -5.8%
Three Rivers 7.5 7.2 -3.9%
Thurrock 9.7 9.2 -5.3%
Uttlesford 8.0 7.6 -5.2%
Watford 7.1 6.8 -3.4%
Waveney 7.3 6.9 -5.5%
Welwyn Hatfield 7.7 7.4 -4.1%
East of England 434.6 413.5 -4.9%
Source: Census, Oxford Economics
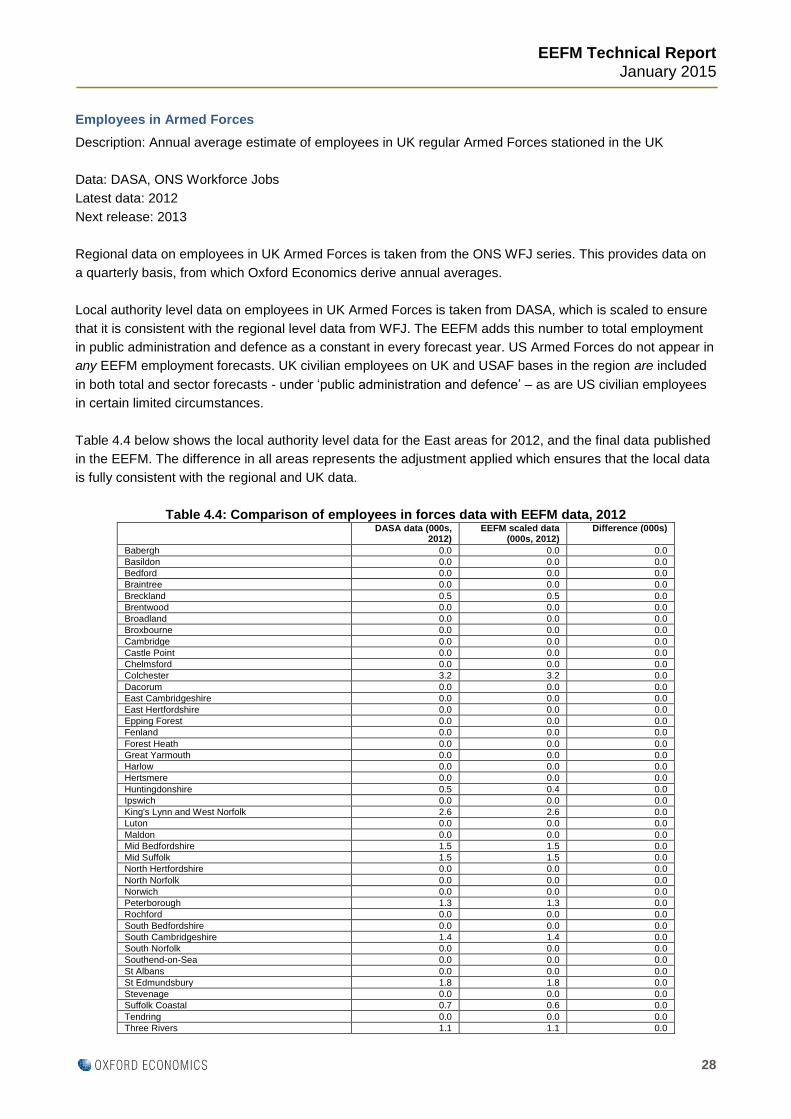
EEFM Technical Report
January 2015
28
Employees in Armed Forces
Description: Annual average estimate of employees in UK regular Armed Forces stationed in the UK
Data: DASA, ONS Workforce Jobs
Latest data: 2012
Next release: 2013
Regional data on employees in UK Armed Forces is taken from the ONS WFJ series. This provides data on
a quarterly basis, from which Oxford Economics derive annual averages.
Local authority level data on employees in UK Armed Forces is taken from DASA, which is scaled to ensure
that it is consistent with the regional level data from WFJ. The EEFM adds this number to total employment
in public administration and defence as a constant in every forecast year. US Armed Forces do not appear in
any EEFM employment forecasts. UK civilian employees on UK and USAF bases in the region are included
in both total and sector forecasts - under ‘public administration and defence’ – as are US civilian employees
in certain limited circumstances.
Table 4.4 below shows the local authority level data for the East areas for 2012, and the final data published
in the EEFM. The difference in all areas represents the adjustment applied which ensures that the local data
is fully consistent with the regional and UK data.
Table 4.4: Comparison of employees in forces data with EEFM data, 2012 DASA data (000s,
2012) EEFM scaled data
(000s, 2012) Difference (000s)
Babergh 0.0 0.0 0.0
Basildon 0.0 0.0 0.0
Bedford 0.0 0.0 0.0
Braintree 0.0 0.0 0.0
Breckland 0.5 0.5 0.0
Brentwood 0.0 0.0 0.0
Broadland 0.0 0.0 0.0
Broxbourne 0.0 0.0 0.0
Cambridge 0.0 0.0 0.0
Castle Point 0.0 0.0 0.0
Chelmsford 0.0 0.0 0.0
Colchester 3.2 3.2 0.0
Dacorum 0.0 0.0 0.0
East Cambridgeshire 0.0 0.0 0.0
East Hertfordshire 0.0 0.0 0.0
Epping Forest 0.0 0.0 0.0
Fenland 0.0 0.0 0.0
Forest Heath 0.0 0.0 0.0
Great Yarmouth 0.0 0.0 0.0
Harlow 0.0 0.0 0.0
Hertsmere 0.0 0.0 0.0
Huntingdonshire 0.5 0.4 0.0
Ipswich 0.0 0.0 0.0
King's Lynn and West Norfolk 2.6 2.6 0.0
Luton 0.0 0.0 0.0
Maldon 0.0 0.0 0.0
Mid Bedfordshire 1.5 1.5 0.0
Mid Suffolk 1.5 1.5 0.0
North Hertfordshire 0.0 0.0 0.0
North Norfolk 0.0 0.0 0.0
Norwich 0.0 0.0 0.0
Peterborough 1.3 1.3 0.0
Rochford 0.0 0.0 0.0
South Bedfordshire 0.0 0.0 0.0
South Cambridgeshire 1.4 1.4 0.0
South Norfolk 0.0 0.0 0.0
Southend-on-Sea 0.0 0.0 0.0
St Albans 0.0 0.0 0.0
St Edmundsbury 1.8 1.8 0.0
Stevenage 0.0 0.0 0.0
Suffolk Coastal 0.7 0.6 0.0
Tendring 0.0 0.0 0.0
Three Rivers 1.1 1.1 0.0
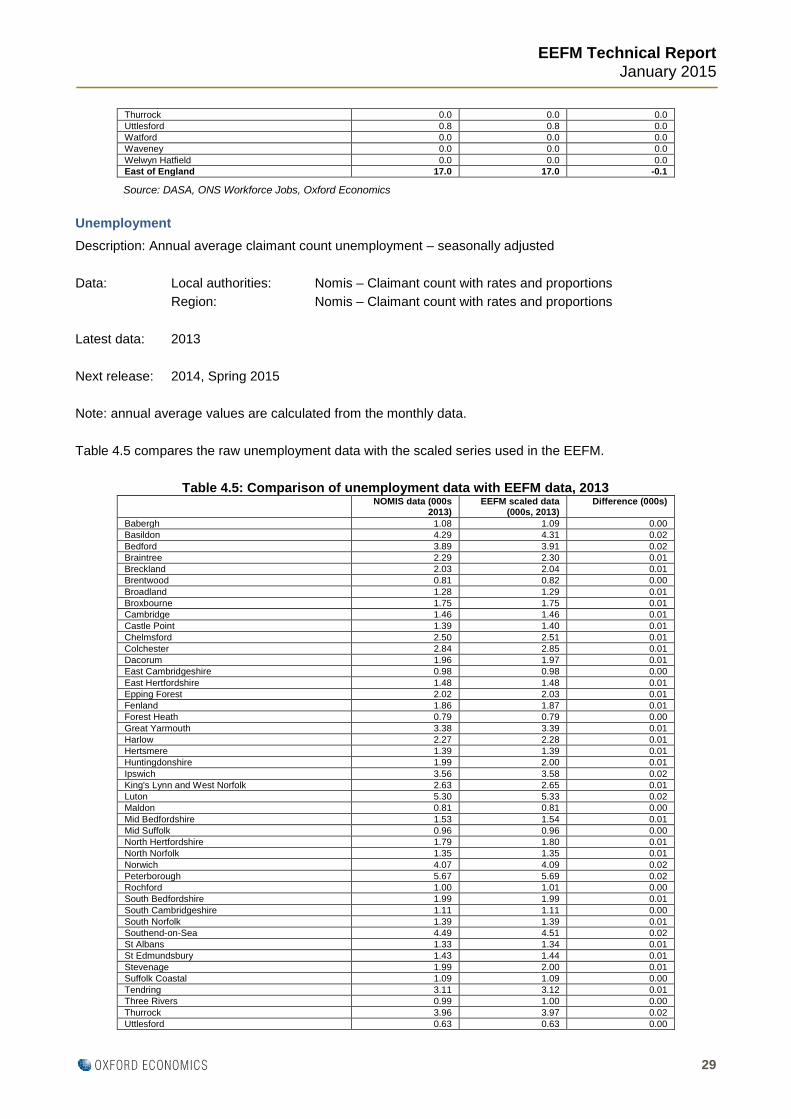
EEFM Technical Report
January 2015
29
Thurrock 0.0 0.0 0.0
Uttlesford 0.8 0.8 0.0
Watford 0.0 0.0 0.0
Waveney 0.0 0.0 0.0
Welwyn Hatfield 0.0 0.0 0.0
East of England 17.0 17.0 -0.1
Source: DASA, ONS Workforce Jobs, Oxford Economics
Unemployment
Description: Annual average claimant count unemployment – seasonally adjusted
Data: Local authorities: Nomis – Claimant count with rates and proportions
Region: Nomis – Claimant count with rates and proportions
Latest data: 2013
Next release: 2014, Spring 2015
Note: annual average values are calculated from the monthly data.
Table 4.5 compares the raw unemployment data with the scaled series used in the EEFM.
Table 4.5: Comparison of unemployment data with EEFM data, 2013 NOMIS data (000s
2013) EEFM scaled data
(000s, 2013) Difference (000s)
Babergh 1.08 1.09 0.00
Basildon 4.29 4.31 0.02
Bedford 3.89 3.91 0.02
Braintree 2.29 2.30 0.01
Breckland 2.03 2.04 0.01
Brentwood 0.81 0.82 0.00
Broadland 1.28 1.29 0.01
Broxbourne 1.75 1.75 0.01
Cambridge 1.46 1.46 0.01
Castle Point 1.39 1.40 0.01
Chelmsford 2.50 2.51 0.01
Colchester 2.84 2.85 0.01
Dacorum 1.96 1.97 0.01
East Cambridgeshire 0.98 0.98 0.00
East Hertfordshire 1.48 1.48 0.01
Epping Forest 2.02 2.03 0.01
Fenland 1.86 1.87 0.01
Forest Heath 0.79 0.79 0.00
Great Yarmouth 3.38 3.39 0.01
Harlow 2.27 2.28 0.01
Hertsmere 1.39 1.39 0.01
Huntingdonshire 1.99 2.00 0.01
Ipswich 3.56 3.58 0.02
King's Lynn and West Norfolk 2.63 2.65 0.01
Luton 5.30 5.33 0.02
Maldon 0.81 0.81 0.00
Mid Bedfordshire 1.53 1.54 0.01
Mid Suffolk 0.96 0.96 0.00
North Hertfordshire 1.79 1.80 0.01
North Norfolk 1.35 1.35 0.01
Norwich 4.07 4.09 0.02
Peterborough 5.67 5.69 0.02
Rochford 1.00 1.01 0.00
South Bedfordshire 1.99 1.99 0.01
South Cambridgeshire 1.11 1.11 0.00
South Norfolk 1.39 1.39 0.01
Southend-on-Sea 4.49 4.51 0.02
St Albans 1.33 1.34 0.01
St Edmundsbury 1.43 1.44 0.01
Stevenage 1.99 2.00 0.01
Suffolk Coastal 1.09 1.09 0.00
Tendring 3.11 3.12 0.01
Three Rivers 0.99 1.00 0.00
Thurrock 3.96 3.97 0.02
Uttlesford 0.63 0.63 0.00
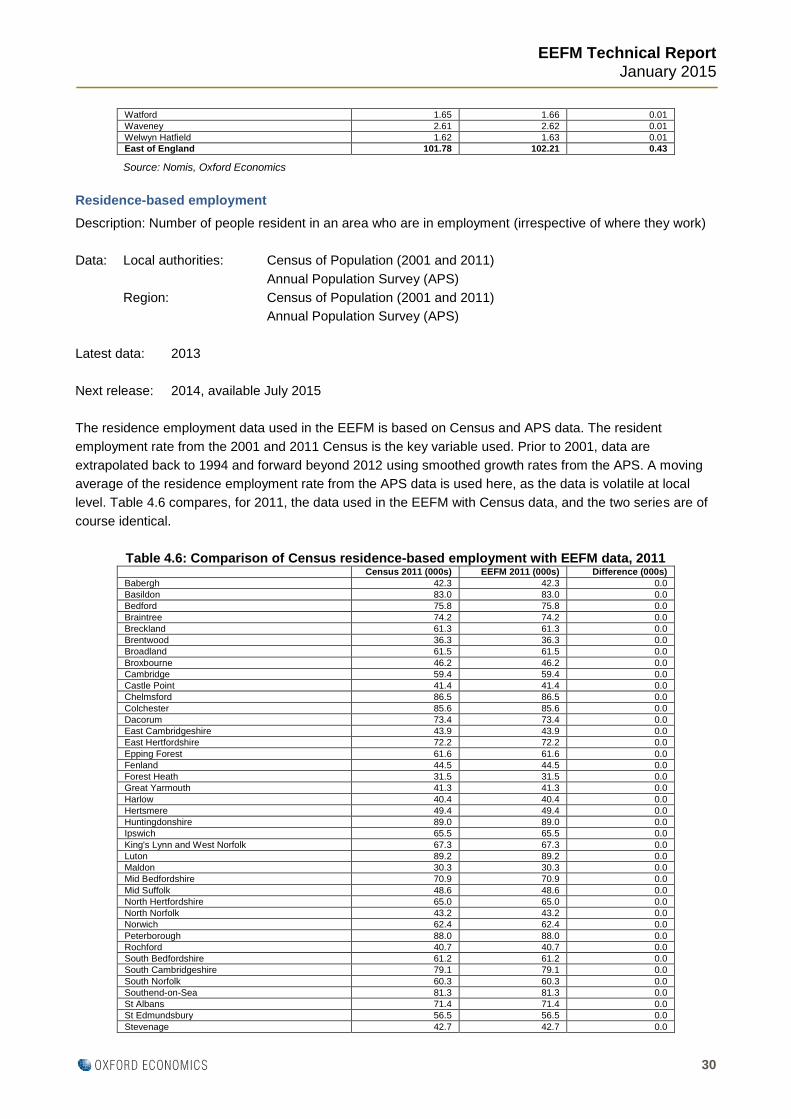
EEFM Technical Report
January 2015
30
Watford 1.65 1.66 0.01
Waveney 2.61 2.62 0.01
Welwyn Hatfield 1.62 1.63 0.01
East of England 101.78 102.21 0.43
Source: Nomis, Oxford Economics
Residence-based employment
Description: Number of people resident in an area who are in employment (irrespective of where they work)
Data: Local authorities: Census of Population (2001 and 2011)
Annual Population Survey (APS)
Region: Census of Population (2001 and 2011)
Annual Population Survey (APS)
Latest data: 2013
Next release: 2014, available July 2015
The residence employment data used in the EEFM is based on Census and APS data. The resident
employment rate from the 2001 and 2011 Census is the key variable used. Prior to 2001, data are
extrapolated back to 1994 and forward beyond 2012 using smoothed growth rates from the APS. A moving
average of the residence employment rate from the APS data is used here, as the data is volatile at local
level. Table 4.6 compares, for 2011, the data used in the EEFM with Census data, and the two series are of
course identical.
Table 4.6: Comparison of Census residence-based employment with EEFM data, 2011 Census 2011 (000s) EEFM 2011 (000s) Difference (000s)
Babergh 42.3 42.3 0.0
Basildon 83.0 83.0 0.0
Bedford 75.8 75.8 0.0
Braintree 74.2 74.2 0.0
Breckland 61.3 61.3 0.0
Brentwood 36.3 36.3 0.0
Broadland 61.5 61.5 0.0
Broxbourne 46.2 46.2 0.0
Cambridge 59.4 59.4 0.0
Castle Point 41.4 41.4 0.0
Chelmsford 86.5 86.5 0.0
Colchester 85.6 85.6 0.0
Dacorum 73.4 73.4 0.0
East Cambridgeshire 43.9 43.9 0.0
East Hertfordshire 72.2 72.2 0.0
Epping Forest 61.6 61.6 0.0
Fenland 44.5 44.5 0.0
Forest Heath 31.5 31.5 0.0
Great Yarmouth 41.3 41.3 0.0
Harlow 40.4 40.4 0.0
Hertsmere 49.4 49.4 0.0
Huntingdonshire 89.0 89.0 0.0
Ipswich 65.5 65.5 0.0
King's Lynn and West Norfolk 67.3 67.3 0.0
Luton 89.2 89.2 0.0
Maldon 30.3 30.3 0.0
Mid Bedfordshire 70.9 70.9 0.0
Mid Suffolk 48.6 48.6 0.0
North Hertfordshire 65.0 65.0 0.0
North Norfolk 43.2 43.2 0.0
Norwich 62.4 62.4 0.0
Peterborough 88.0 88.0 0.0
Rochford 40.7 40.7 0.0
South Bedfordshire 61.2 61.2 0.0
South Cambridgeshire 79.1 79.1 0.0
South Norfolk 60.3 60.3 0.0
Southend-on-Sea 81.3 81.3 0.0
St Albans 71.4 71.4 0.0
St Edmundsbury 56.5 56.5 0.0
Stevenage 42.7 42.7 0.0
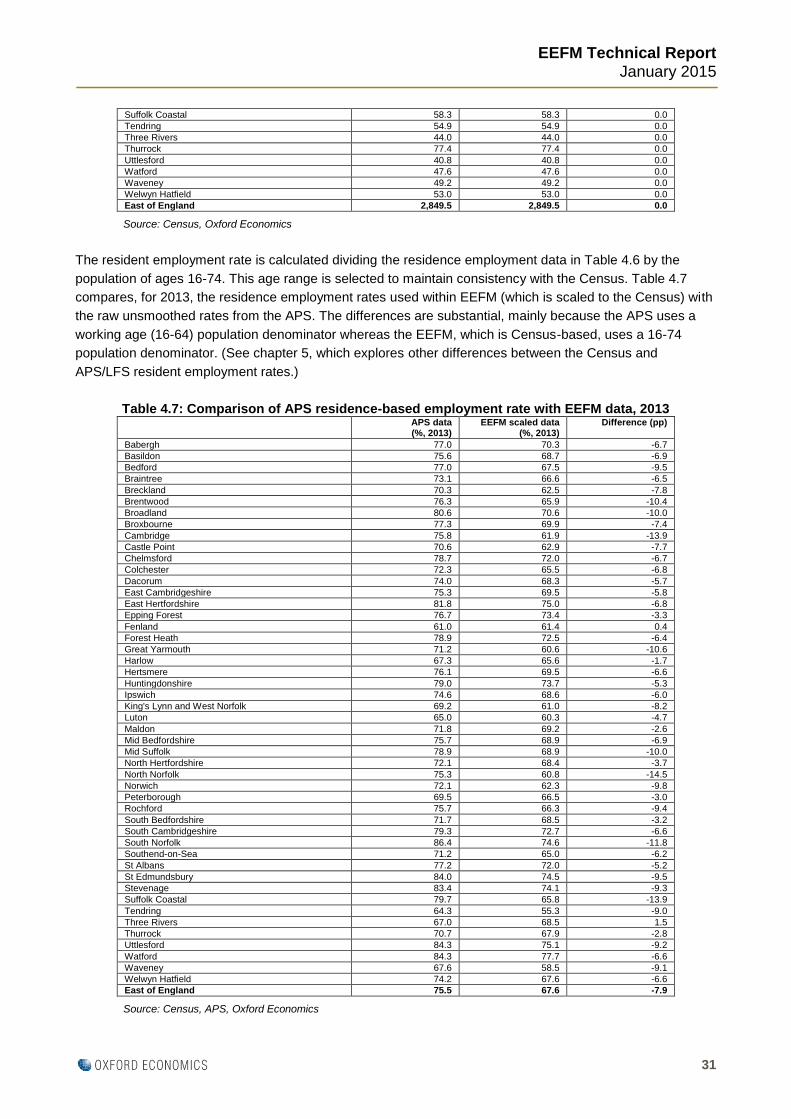
EEFM Technical Report
January 2015
31
Suffolk Coastal 58.3 58.3 0.0
Tendring 54.9 54.9 0.0
Three Rivers 44.0 44.0 0.0
Thurrock 77.4 77.4 0.0
Uttlesford 40.8 40.8 0.0
Watford 47.6 47.6 0.0
Waveney 49.2 49.2 0.0
Welwyn Hatfield 53.0 53.0 0.0
East of England 2,849.5 2,849.5 0.0
Source: Census, Oxford Economics
The resident employment rate is calculated dividing the residence employment data in Table 4.6 by the
population of ages 16-74. This age range is selected to maintain consistency with the Census. Table 4.7
compares, for 2013, the residence employment rates used within EEFM (which is scaled to the Census) with
the raw unsmoothed rates from the APS. The differences are substantial, mainly because the APS uses a
working age (16-64) population denominator whereas the EEFM, which is Census-based, uses a 16-74
population denominator. (See chapter 5, which explores other differences between the Census and
APS/LFS resident employment rates.)
Table 4.7: Comparison of APS residence-based employment rate with EEFM data, 2013 APS data
(%, 2013) EEFM scaled data
(%, 2013) Difference (pp)
Babergh 77.0 70.3 -6.7
Basildon 75.6 68.7 -6.9
Bedford 77.0 67.5 -9.5
Braintree 73.1 66.6 -6.5
Breckland 70.3 62.5 -7.8
Brentwood 76.3 65.9 -10.4
Broadland 80.6 70.6 -10.0
Broxbourne 77.3 69.9 -7.4
Cambridge 75.8 61.9 -13.9
Castle Point 70.6 62.9 -7.7
Chelmsford 78.7 72.0 -6.7
Colchester 72.3 65.5 -6.8
Dacorum 74.0 68.3 -5.7
East Cambridgeshire 75.3 69.5 -5.8
East Hertfordshire 81.8 75.0 -6.8
Epping Forest 76.7 73.4 -3.3
Fenland 61.0 61.4 0.4
Forest Heath 78.9 72.5 -6.4
Great Yarmouth 71.2 60.6 -10.6
Harlow 67.3 65.6 -1.7
Hertsmere 76.1 69.5 -6.6
Huntingdonshire 79.0 73.7 -5.3
Ipswich 74.6 68.6 -6.0
King's Lynn and West Norfolk 69.2 61.0 -8.2
Luton 65.0 60.3 -4.7
Maldon 71.8 69.2 -2.6
Mid Bedfordshire 75.7 68.9 -6.9
Mid Suffolk 78.9 68.9 -10.0
North Hertfordshire 72.1 68.4 -3.7
North Norfolk 75.3 60.8 -14.5
Norwich 72.1 62.3 -9.8
Peterborough 69.5 66.5 -3.0
Rochford 75.7 66.3 -9.4
South Bedfordshire 71.7 68.5 -3.2
South Cambridgeshire 79.3 72.7 -6.6
South Norfolk 86.4 74.6 -11.8
Southend-on-Sea 71.2 65.0 -6.2
St Albans 77.2 72.0 -5.2
St Edmundsbury 84.0 74.5 -9.5
Stevenage 83.4 74.1 -9.3
Suffolk Coastal 79.7 65.8 -13.9
Tendring 64.3 55.3 -9.0
Three Rivers 67.0 68.5 1.5
Thurrock 70.7 67.9 -2.8
Uttlesford 84.3 75.1 -9.2
Watford 84.3 77.7 -6.6
Waveney 67.6 58.5 -9.1
Welwyn Hatfield 74.2 67.6 -6.6
East of England 75.5 67.6 -7.9
Source: Census, APS, Oxford Economics

EEFM Technical Report
January 2015
32
Total workplace employment (people)
Description: the number of people who work in an area (irrespective of where they live)
Data: Local authorities: Census of Population
Region: Census of Population
Latest data: 2011
This series is constructed on the basis that all full-time employee jobs are filled by one person only, but that
one person could have two or more part-time jobs. For this reason, we apply a ratio of 0.75 people per part-
time job to the total part-time jobs estimate. In other words, 100 part-time jobs implies 75 people in
employment, with the remaining 25 part-time jobs taken by people with other part-time (or full-time) jobs.
(This ratio is the one most consistent with Census results.)
We convert the self-employed jobs series to a people-based series in a similar way. In this case, we assume
a jobs / people ratio of 0.93 – that is, 100 self-employment jobs equates to 93 (self-employed) people in
employment. (This ratio is generated from Census data.)
Finally, these estimates are scaled for 2011 to ensure they are consistent with the Census.
Table 4.8: Comparison of Census employment data with EEFM data, 2011 Census employment,
(000s, 2011) EEFM data (000s,
2011) Difference (%)
Babergh 35.7 35.7 0.0%
Basildon 82.8 82.8 0.0%
Bedford 74.5 74.5 0.0%
Braintree 57.6 57.6 0.0%
Breckland 50.5 50.5 0.0%
Brentwood 33.9 33.9 0.0%
Broadland 47.3 47.3 0.0%
Broxbourne 38.9 38.9 0.0%
Cambridge 94.2 94.2 0.0%
Castle Point 25.4 25.4 0.0%
Chelmsford 82.6 82.6 0.0%
Colchester 83.7 83.7 0.0%
Dacorum 66.2 66.2 0.0%
East Cambridgeshire 31.1 31.1 0.0%
East Hertfordshire 58.2 58.2 0.0%
Epping Forest 47.6 47.6 0.0%
Fenland 38.2 38.2 0.0%
Forest Heath 32.9 32.9 0.0%
Great Yarmouth 40.0 40.0 0.0%
Harlow 39.8 39.8 0.0%
Hertsmere 46.4 46.4 0.0%
Huntingdonshire 77.4 77.4 0.0%
Ipswich 71.6 71.6 0.0%
King's Lynn and West Norfolk 63.5 63.5 0.0%
Luton 90.0 90.0 0.0%
Maldon 23.0 23.0 0.0%
Mid Bedfordshire 50.9 50.9 0.0%
Mid Suffolk 41.7 41.7 0.0%
North Hertfordshire 52.4 52.4 0.0%
North Norfolk 39.6 39.6 0.0%
Norwich 89.2 89.2 0.0%
Peterborough 101.2 101.2 0.0%
Rochford 26.7 26.7 0.0%
South Bedfordshire 47.3 47.3 0.0%
South Cambridgeshire 74.4 74.4 0.0%
South Norfolk 54.4 54.4 0.0%
Southend-on-Sea 72.1 72.1 0.0%
St Albans 61.5 61.5 0.0%
St Edmundsbury 58.4 58.4 0.0%
Stevenage 44.8 44.8 0.0%
Suffolk Coastal 54.4 54.4 0.0%
Tendring 44.3 44.3 0.0%
Three Rivers 35.4 35.4 0.0%
Thurrock 64.2 64.2 0.0%
Uttlesford 40.3 40.3 0.0%
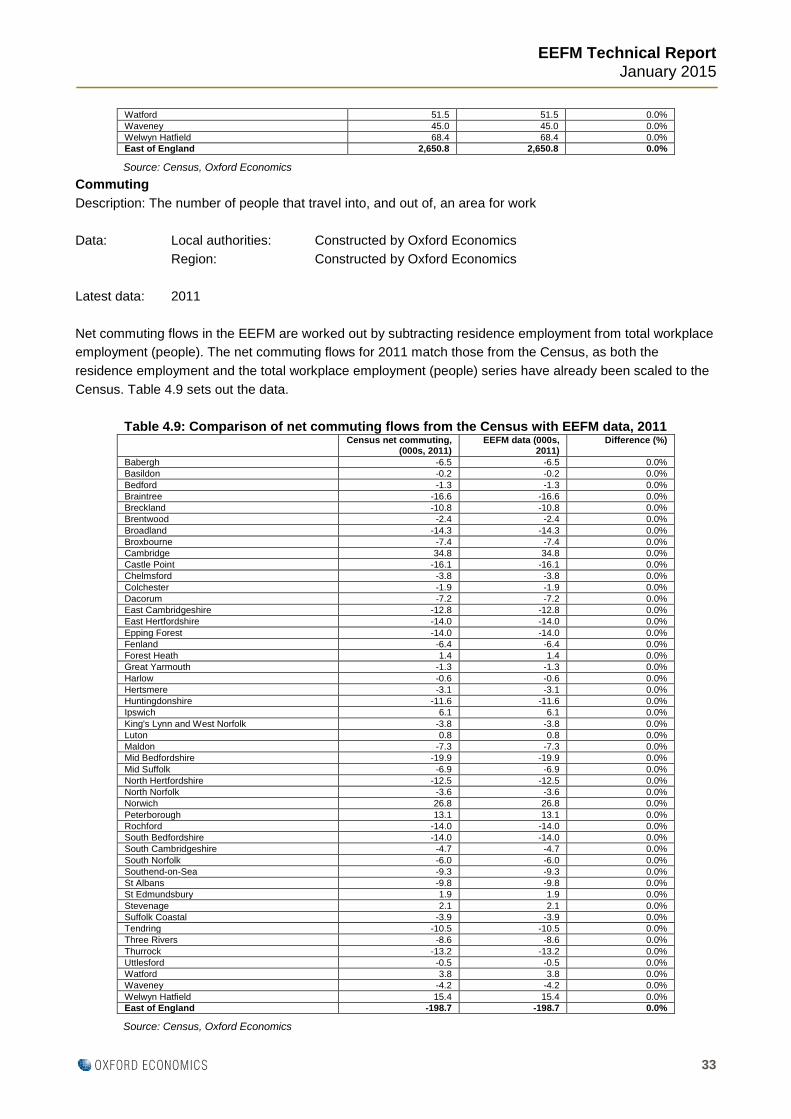
EEFM Technical Report
January 2015
33
Watford 51.5 51.5 0.0%
Waveney 45.0 45.0 0.0%
Welwyn Hatfield 68.4 68.4 0.0%
East of England 2,650.8 2,650.8 0.0%
Source: Census, Oxford Economics
Commuting
Description: The number of people that travel into, and out of, an area for work
Data: Local authorities: Constructed by Oxford Economics
Region: Constructed by Oxford Economics
Latest data: 2011
Net commuting flows in the EEFM are worked out by subtracting residence employment from total workplace
employment (people). The net commuting flows for 2011 match those from the Census, as both the
residence employment and the total workplace employment (people) series have already been scaled to the
Census. Table 4.9 sets out the data.
Table 4.9: Comparison of net commuting flows from the Census with EEFM data, 2011 Census net commuting,
(000s, 2011) EEFM data (000s,
2011) Difference (%)
Babergh -6.5 -6.5 0.0%
Basildon -0.2 -0.2 0.0%
Bedford -1.3 -1.3 0.0%
Braintree -16.6 -16.6 0.0%
Breckland -10.8 -10.8 0.0%
Brentwood -2.4 -2.4 0.0%
Broadland -14.3 -14.3 0.0%
Broxbourne -7.4 -7.4 0.0%
Cambridge 34.8 34.8 0.0%
Castle Point -16.1 -16.1 0.0%
Chelmsford -3.8 -3.8 0.0%
Colchester -1.9 -1.9 0.0%
Dacorum -7.2 -7.2 0.0%
East Cambridgeshire -12.8 -12.8 0.0%
East Hertfordshire -14.0 -14.0 0.0%
Epping Forest -14.0 -14.0 0.0%
Fenland -6.4 -6.4 0.0%
Forest Heath 1.4 1.4 0.0%
Great Yarmouth -1.3 -1.3 0.0%
Harlow -0.6 -0.6 0.0%
Hertsmere -3.1 -3.1 0.0%
Huntingdonshire -11.6 -11.6 0.0%
Ipswich 6.1 6.1 0.0%
King's Lynn and West Norfolk -3.8 -3.8 0.0%
Luton 0.8 0.8 0.0%
Maldon -7.3 -7.3 0.0%
Mid Bedfordshire -19.9 -19.9 0.0%
Mid Suffolk -6.9 -6.9 0.0%
North Hertfordshire -12.5 -12.5 0.0%
North Norfolk -3.6 -3.6 0.0%
Norwich 26.8 26.8 0.0%
Peterborough 13.1 13.1 0.0%
Rochford -14.0 -14.0 0.0%
South Bedfordshire -14.0 -14.0 0.0%
South Cambridgeshire -4.7 -4.7 0.0%
South Norfolk -6.0 -6.0 0.0%
Southend-on-Sea -9.3 -9.3 0.0%
St Albans -9.8 -9.8 0.0%
St Edmundsbury 1.9 1.9 0.0%
Stevenage 2.1 2.1 0.0%
Suffolk Coastal -3.9 -3.9 0.0%
Tendring -10.5 -10.5 0.0%
Three Rivers -8.6 -8.6 0.0%
Thurrock -13.2 -13.2 0.0%
Uttlesford -0.5 -0.5 0.0%
Watford 3.8 3.8 0.0%
Waveney -4.2 -4.2 0.0%
Welwyn Hatfield 15.4 15.4 0.0%
East of England -198.7 -198.7 0.0%
Source: Census, Oxford Economics
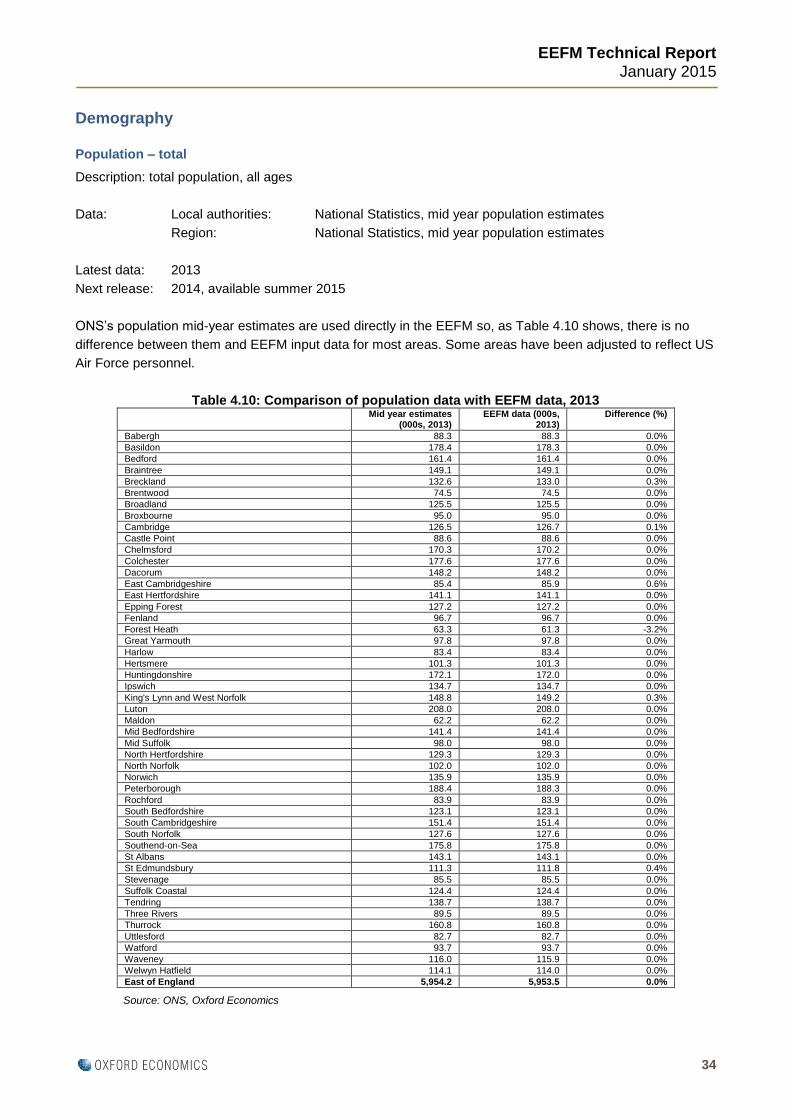
EEFM Technical Report
January 2015
34
Demography
Population – total
Description: total population, all ages
Data: Local authorities: National Statistics, mid year population estimates
Region: National Statistics, mid year population estimates
Latest data: 2013
Next release: 2014, available summer 2015
ONS’s population mid-year estimates are used directly in the EEFM so, as Table 4.10 shows, there is no
difference between them and EEFM input data for most areas. Some areas have been adjusted to reflect US
Air Force personnel.
Table 4.10: Comparison of population data with EEFM data, 2013 Mid year estimates
(000s, 2013) EEFM data (000s,
2013) Difference (%)
Babergh 88.3 88.3 0.0%
Basildon 178.4 178.3 0.0%
Bedford 161.4 161.4 0.0%
Braintree 149.1 149.1 0.0%
Breckland 132.6 133.0 0.3%
Brentwood 74.5 74.5 0.0%
Broadland 125.5 125.5 0.0%
Broxbourne 95.0 95.0 0.0%
Cambridge 126.5 126.7 0.1%
Castle Point 88.6 88.6 0.0%
Chelmsford 170.3 170.2 0.0%
Colchester 177.6 177.6 0.0%
Dacorum 148.2 148.2 0.0%
East Cambridgeshire 85.4 85.9 0.6%
East Hertfordshire 141.1 141.1 0.0%
Epping Forest 127.2 127.2 0.0%
Fenland 96.7 96.7 0.0%
Forest Heath 63.3 61.3 -3.2%
Great Yarmouth 97.8 97.8 0.0%
Harlow 83.4 83.4 0.0%
Hertsmere 101.3 101.3 0.0%
Huntingdonshire 172.1 172.0 0.0%
Ipswich 134.7 134.7 0.0%
King's Lynn and West Norfolk 148.8 149.2 0.3%
Luton 208.0 208.0 0.0%
Maldon 62.2 62.2 0.0%
Mid Bedfordshire 141.4 141.4 0.0%
Mid Suffolk 98.0 98.0 0.0%
North Hertfordshire 129.3 129.3 0.0%
North Norfolk 102.0 102.0 0.0%
Norwich 135.9 135.9 0.0%
Peterborough 188.4 188.3 0.0%
Rochford 83.9 83.9 0.0%
South Bedfordshire 123.1 123.1 0.0%
South Cambridgeshire 151.4 151.4 0.0%
South Norfolk 127.6 127.6 0.0%
Southend-on-Sea 175.8 175.8 0.0%
St Albans 143.1 143.1 0.0%
St Edmundsbury 111.3 111.8 0.4%
Stevenage 85.5 85.5 0.0%
Suffolk Coastal 124.4 124.4 0.0%
Tendring 138.7 138.7 0.0%
Three Rivers 89.5 89.5 0.0%
Thurrock 160.8 160.8 0.0%
Uttlesford 82.7 82.7 0.0%
Watford 93.7 93.7 0.0%
Waveney 116.0 115.9 0.0%
Welwyn Hatfield 114.1 114.0 0.0%
East of England 5,954.2 5,953.5 0.0%
Source: ONS, Oxford Economics
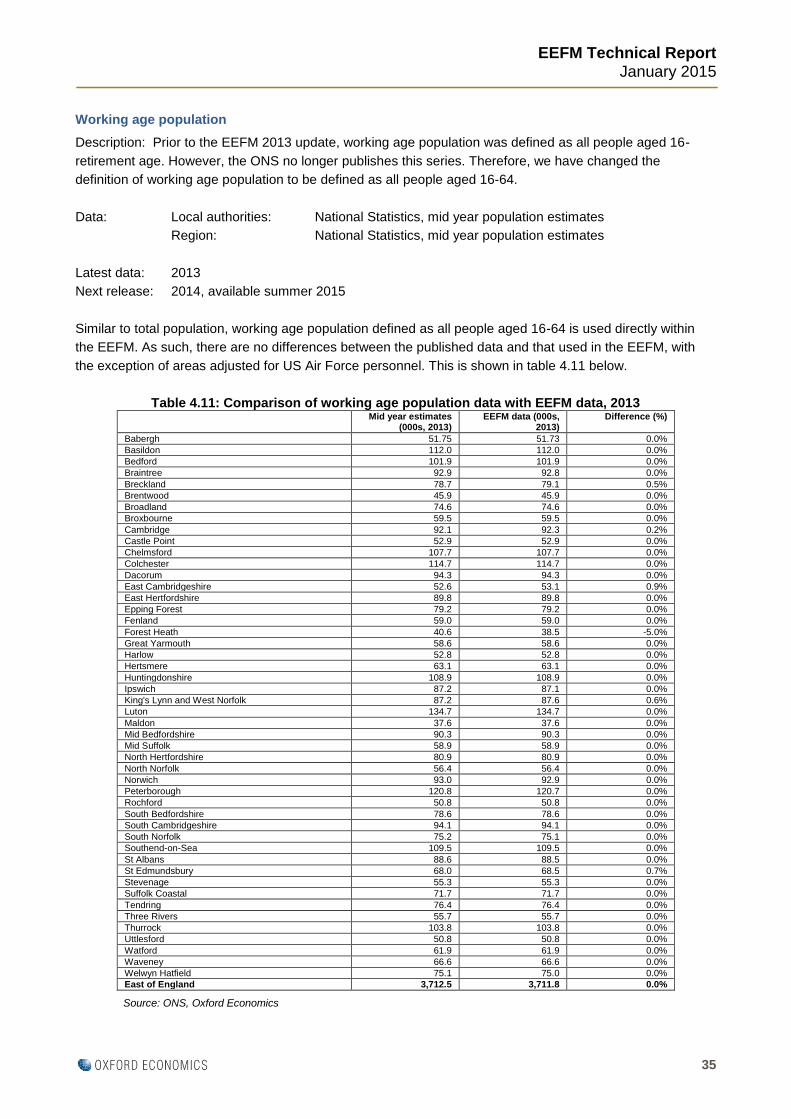
EEFM Technical Report
January 2015
35
Working age population
Description: Prior to the EEFM 2013 update, working age population was defined as all people aged 16-
retirement age. However, the ONS no longer publishes this series. Therefore, we have changed the
definition of working age population to be defined as all people aged 16-64.
Data: Local authorities: National Statistics, mid year population estimates
Region: National Statistics, mid year population estimates
Latest data: 2013
Next release: 2014, available summer 2015
Similar to total population, working age population defined as all people aged 16-64 is used directly within
the EEFM. As such, there are no differences between the published data and that used in the EEFM, with
the exception of areas adjusted for US Air Force personnel. This is shown in table 4.11 below.
Table 4.11: Comparison of working age population data with EEFM data, 2013 Mid year estimates
(000s, 2013) EEFM data (000s,
2013) Difference (%)
Babergh 51.75 51.73 0.0%
Basildon 112.0 112.0 0.0%
Bedford 101.9 101.9 0.0%
Braintree 92.9 92.8 0.0%
Breckland 78.7 79.1 0.5%
Brentwood 45.9 45.9 0.0%
Broadland 74.6 74.6 0.0%
Broxbourne 59.5 59.5 0.0%
Cambridge 92.1 92.3 0.2%
Castle Point 52.9 52.9 0.0%
Chelmsford 107.7 107.7 0.0%
Colchester 114.7 114.7 0.0%
Dacorum 94.3 94.3 0.0%
East Cambridgeshire 52.6 53.1 0.9%
East Hertfordshire 89.8 89.8 0.0%
Epping Forest 79.2 79.2 0.0%
Fenland 59.0 59.0 0.0%
Forest Heath 40.6 38.5 -5.0%
Great Yarmouth 58.6 58.6 0.0%
Harlow 52.8 52.8 0.0%
Hertsmere 63.1 63.1 0.0%
Huntingdonshire 108.9 108.9 0.0%
Ipswich 87.2 87.1 0.0%
King's Lynn and West Norfolk 87.2 87.6 0.6%
Luton 134.7 134.7 0.0%
Maldon 37.6 37.6 0.0%
Mid Bedfordshire 90.3 90.3 0.0%
Mid Suffolk 58.9 58.9 0.0%
North Hertfordshire 80.9 80.9 0.0%
North Norfolk 56.4 56.4 0.0%
Norwich 93.0 92.9 0.0%
Peterborough 120.8 120.7 0.0%
Rochford 50.8 50.8 0.0%
South Bedfordshire 78.6 78.6 0.0%
South Cambridgeshire 94.1 94.1 0.0%
South Norfolk 75.2 75.1 0.0%
Southend-on-Sea 109.5 109.5 0.0%
St Albans 88.6 88.5 0.0%
St Edmundsbury 68.0 68.5 0.7%
Stevenage 55.3 55.3 0.0%
Suffolk Coastal 71.7 71.7 0.0%
Tendring 76.4 76.4 0.0%
Three Rivers 55.7 55.7 0.0%
Thurrock 103.8 103.8 0.0%
Uttlesford 50.8 50.8 0.0%
Watford 61.9 61.9 0.0%
Waveney 66.6 66.6 0.0%
Welwyn Hatfield 75.1 75.0 0.0%
East of England 3,712.5 3,711.8 0.0%
Source: ONS, Oxford Economics
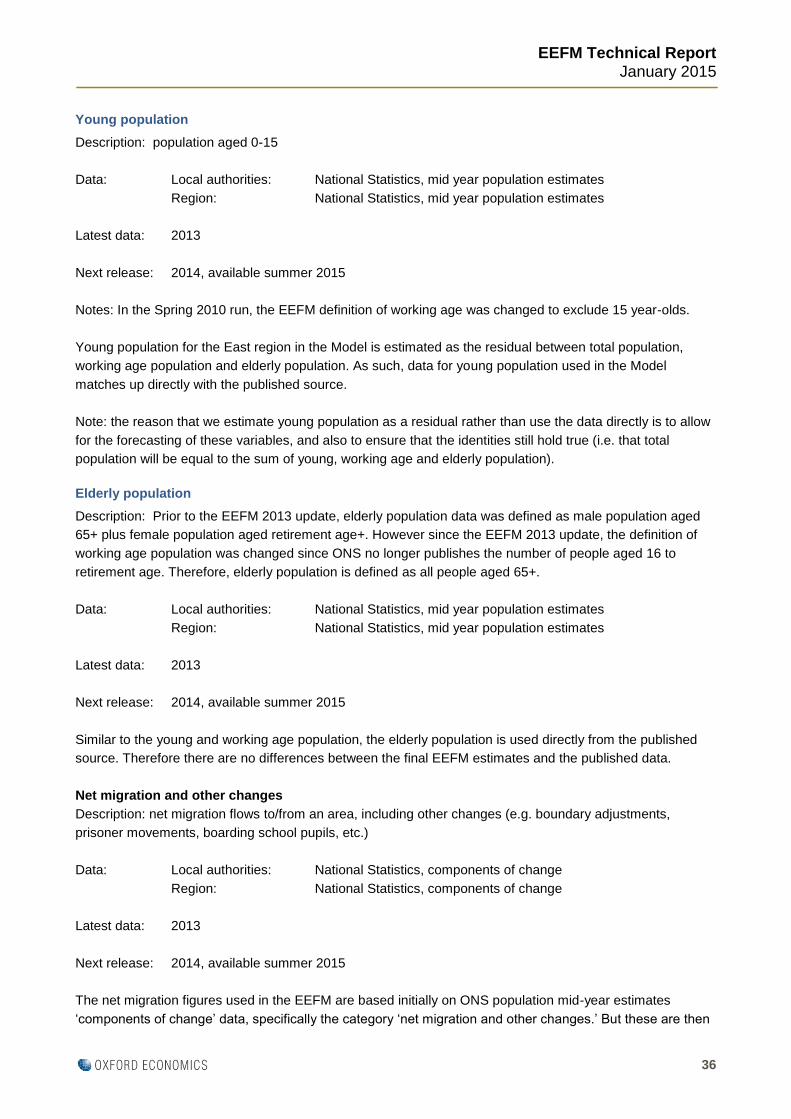
EEFM Technical Report
January 2015
36
Young population
Description: population aged 0-15
Data: Local authorities: National Statistics, mid year population estimates
Region: National Statistics, mid year population estimates
Latest data: 2013
Next release: 2014, available summer 2015
Notes: In the Spring 2010 run, the EEFM definition of working age was changed to exclude 15 year-olds.
Young population for the East region in the Model is estimated as the residual between total population,
working age population and elderly population. As such, data for young population used in the Model
matches up directly with the published source.
Note: the reason that we estimate young population as a residual rather than use the data directly is to allow
for the forecasting of these variables, and also to ensure that the identities still hold true (i.e. that total
population will be equal to the sum of young, working age and elderly population).
Elderly population
Description: Prior to the EEFM 2013 update, elderly population data was defined as male population aged
65+ plus female population aged retirement age+. However since the EEFM 2013 update, the definition of
working age population was changed since ONS no longer publishes the number of people aged 16 to
retirement age. Therefore, elderly population is defined as all people aged 65+.
Data: Local authorities: National Statistics, mid year population estimates
Region: National Statistics, mid year population estimates
Latest data: 2013
Next release: 2014, available summer 2015
Similar to the young and working age population, the elderly population is used directly from the published
source. Therefore there are no differences between the final EEFM estimates and the published data.
Net migration and other changes
Description: net migration flows to/from an area, including other changes (e.g. boundary adjustments,
prisoner movements, boarding school pupils, etc.)
Data: Local authorities: National Statistics, components of change
Region: National Statistics, components of change
Latest data: 2013
Next release: 2014, available summer 2015
The net migration figures used in the EEFM are based initially on ONS population mid-year estimates
‘components of change’ data, specifically the category ‘net migration and other changes.’ But these are then

EEFM Technical Report
January 2015
37
scaled upwards to the regional net migration data for the East of England used in the Oxford Regional
Model, which are sourced from Population Trends and differ slightly from the ‘components of change’ data
due to minor methodological differences. Table 4.12 shows that the difference regionally between the
‘components of change’ series and the data actually used in the EEFM is only 1,480 migrants in 2013. (The
scaling process allocates these to local authorities in accordance with their share of the region’s total
population.)
Table 4.12: Comparison of ‘net migration and other changes’ data with EEFM data, 2013
Net migration and other changes
(000s, 2013)
EEFM data (000s, 2013)
Difference (000s)
Babergh 0.50 0.52 0.02
Basildon 1.00 1.04 0.04
Bedford 1.40 1.44 0.04
Braintree 0.40 0.43 0.03
Breckland 0.70 1.13 0.43
Brentwood 0.30 0.32 0.02
Broadland 0.60 0.63 0.03
Broxbourne 0.00 0.02 0.02
Cambridge 0.80 1.03 0.23
Castle Point 0.50 0.52 0.02
Chelmsford 0.40 0.44 0.04
Colchester 0.80 0.84 0.04
Dacorum 0.90 0.93 0.03
East Cambridgeshire -0.20 0.32 0.52
East Hertfordshire 1.20 1.23 0.03
Epping Forest 0.60 0.63 0.03
Fenland 0.60 0.62 0.02
Forest Heath 2.00 0.01 -1.99
Great Yarmouth 0.30 0.32 0.02
Harlow 0.00 0.02 0.02
Hertsmere 0.20 0.22 0.02
Huntingdonshire 0.30 0.34 0.04
Ipswich -0.60 -0.57 0.03
King's Lynn and West Norfolk 0.10 0.63 0.53
Luton 0.10 0.15 0.05
Maldon 0.30 0.31 0.01
Mid Bedfordshire 1.76 1.80 0.03
Mid Suffolk 0.40 0.42 0.02
North Hertfordshire 0.50 0.53 0.03
North Norfolk 0.90 0.92 0.02
Norwich 0.80 0.83 0.03
Peterborough 0.20 0.24 0.04
Rochford 0.10 0.12 0.02
South Bedfordshire 1.54 1.56 0.03
South Cambridgeshire -0.30 -0.26 0.04
South Norfolk 1.50 1.53 0.03
Southend-on-Sea 0.50 0.54 0.04
St Albans 0.40 0.43 0.03
St Edmundsbury -0.50 0.03 0.53
Stevenage 0.20 0.22 0.02
Suffolk Coastal 0.50 0.53 0.03
Tendring 1.20 1.23 0.03
Three Rivers 0.50 0.52 0.02
Thurrock 0.10 0.14 0.04
Uttlesford 1.20 1.22 0.02
Watford 1.20 1.22 0.02
Waveney 0.50 0.53 0.03
Welwyn Hatfield 1.60 1.63 0.03
East of England 28.00 29.48 1.48
Source: ONS, Oxford Economics
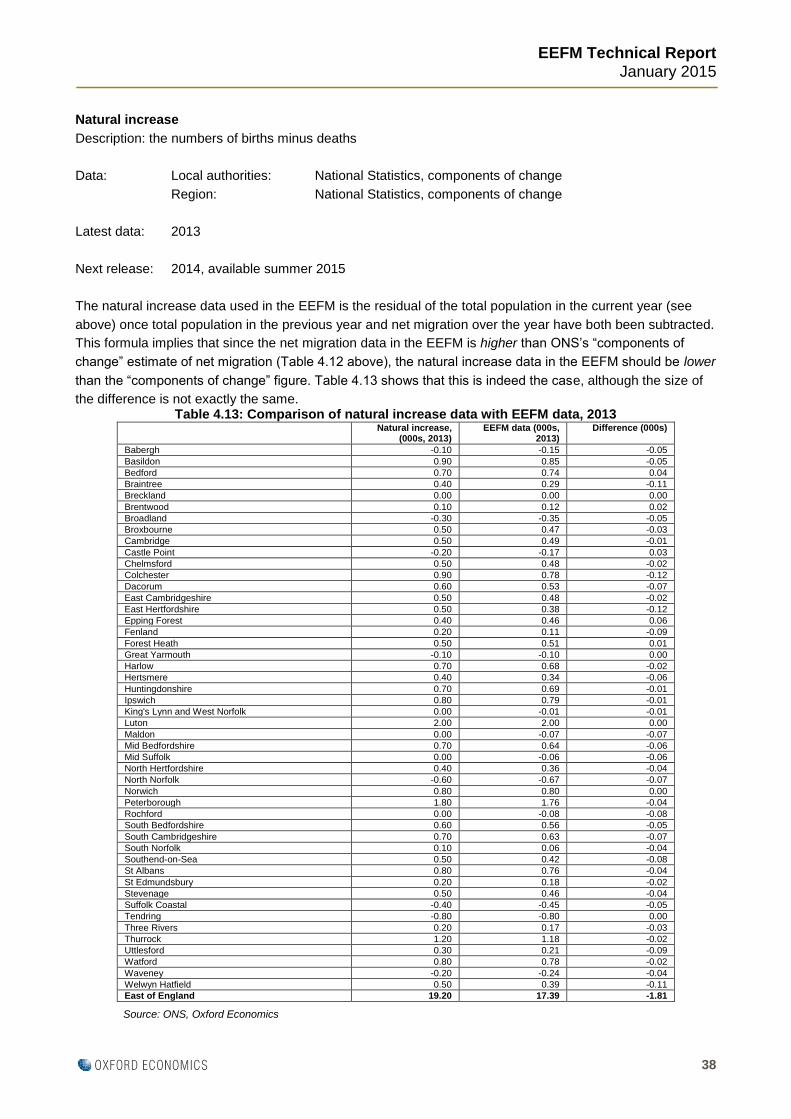
EEFM Technical Report
January 2015
38
Natural increase
Description: the numbers of births minus deaths
Data: Local authorities: National Statistics, components of change
Region: National Statistics, components of change
Latest data: 2013
Next release: 2014, available summer 2015
The natural increase data used in the EEFM is the residual of the total population in the current year (see
above) once total population in the previous year and net migration over the year have both been subtracted.
This formula implies that since the net migration data in the EEFM is higher than ONS’s “components of
change” estimate of net migration (Table 4.12 above), the natural increase data in the EEFM should be lower
than the “components of change” figure. Table 4.13 shows that this is indeed the case, although the size of
the difference is not exactly the same. Table 4.13: Comparison of natural increase data with EEFM data, 2013
Natural increase, (000s, 2013)
EEFM data (000s, 2013)
Difference (000s)
Babergh -0.10 -0.15 -0.05
Basildon 0.90 0.85 -0.05
Bedford 0.70 0.74 0.04
Braintree 0.40 0.29 -0.11
Breckland 0.00 0.00 0.00
Brentwood 0.10 0.12 0.02
Broadland -0.30 -0.35 -0.05
Broxbourne 0.50 0.47 -0.03
Cambridge 0.50 0.49 -0.01
Castle Point -0.20 -0.17 0.03
Chelmsford 0.50 0.48 -0.02
Colchester 0.90 0.78 -0.12
Dacorum 0.60 0.53 -0.07
East Cambridgeshire 0.50 0.48 -0.02
East Hertfordshire 0.50 0.38 -0.12
Epping Forest 0.40 0.46 0.06
Fenland 0.20 0.11 -0.09
Forest Heath 0.50 0.51 0.01
Great Yarmouth -0.10 -0.10 0.00
Harlow 0.70 0.68 -0.02
Hertsmere 0.40 0.34 -0.06
Huntingdonshire 0.70 0.69 -0.01
Ipswich 0.80 0.79 -0.01
King's Lynn and West Norfolk 0.00 -0.01 -0.01
Luton 2.00 2.00 0.00
Maldon 0.00 -0.07 -0.07
Mid Bedfordshire 0.70 0.64 -0.06
Mid Suffolk 0.00 -0.06 -0.06
North Hertfordshire 0.40 0.36 -0.04
North Norfolk -0.60 -0.67 -0.07
Norwich 0.80 0.80 0.00
Peterborough 1.80 1.76 -0.04
Rochford 0.00 -0.08 -0.08
South Bedfordshire 0.60 0.56 -0.05
South Cambridgeshire 0.70 0.63 -0.07
South Norfolk 0.10 0.06 -0.04
Southend-on-Sea 0.50 0.42 -0.08
St Albans 0.80 0.76 -0.04
St Edmundsbury 0.20 0.18 -0.02
Stevenage 0.50 0.46 -0.04
Suffolk Coastal -0.40 -0.45 -0.05
Tendring -0.80 -0.80 0.00
Three Rivers 0.20 0.17 -0.03
Thurrock 1.20 1.18 -0.02
Uttlesford 0.30 0.21 -0.09
Watford 0.80 0.78 -0.02
Waveney -0.20 -0.24 -0.04
Welwyn Hatfield 0.50 0.39 -0.11
East of England 19.20 17.39 -1.81
Source: ONS, Oxford Economics
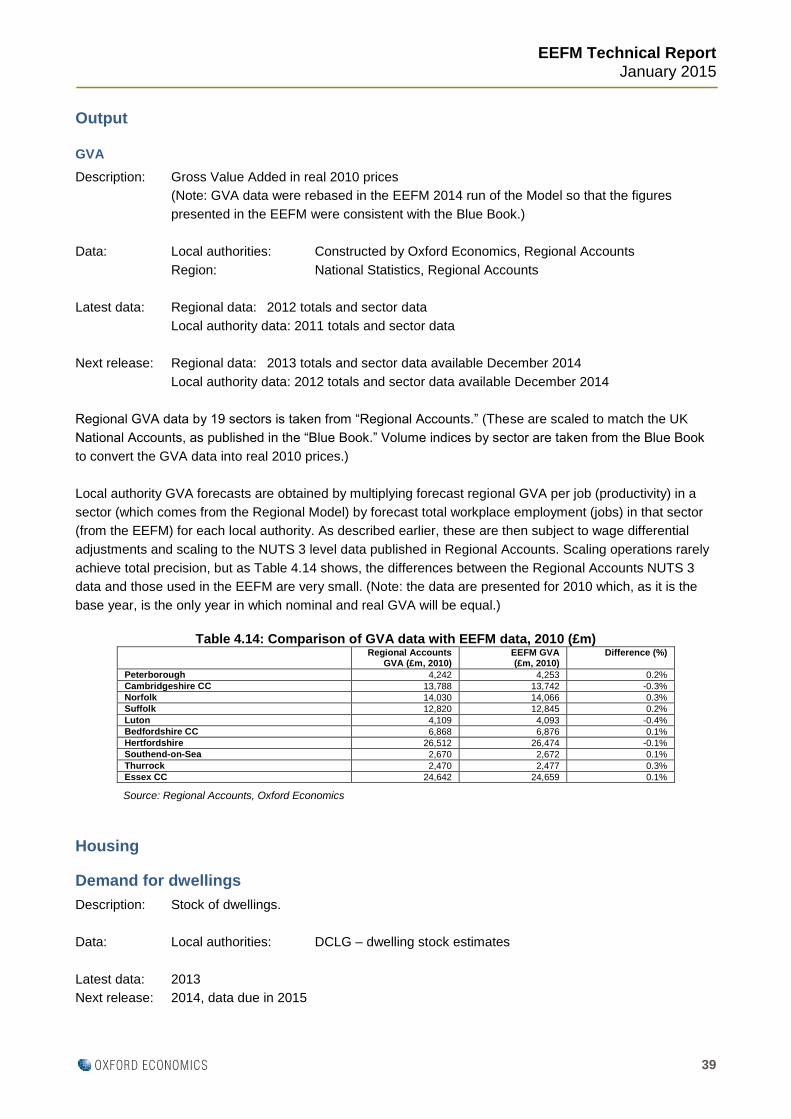
EEFM Technical Report
January 2015
39
Output
GVA
Description: Gross Value Added in real 2010 prices
(Note: GVA data were rebased in the EEFM 2014 run of the Model so that the figures
presented in the EEFM were consistent with the Blue Book.)
Data: Local authorities: Constructed by Oxford Economics, Regional Accounts
Region: National Statistics, Regional Accounts
Latest data: Regional data: 2012 totals and sector data
Local authority data: 2011 totals and sector data
Next release: Regional data: 2013 totals and sector data available December 2014
Local authority data: 2012 totals and sector data available December 2014
Regional GVA data by 19 sectors is taken from “Regional Accounts.” (These are scaled to match the UK
National Accounts, as published in the “Blue Book.” Volume indices by sector are taken from the Blue Book
to convert the GVA data into real 2010 prices.)
Local authority GVA forecasts are obtained by multiplying forecast regional GVA per job (productivity) in a
sector (which comes from the Regional Model) by forecast total workplace employment (jobs) in that sector
(from the EEFM) for each local authority. As described earlier, these are then subject to wage differential
adjustments and scaling to the NUTS 3 level data published in Regional Accounts. Scaling operations rarely
achieve total precision, but as Table 4.14 shows, the differences between the Regional Accounts NUTS 3
data and those used in the EEFM are very small. (Note: the data are presented for 2010 which, as it is the
base year, is the only year in which nominal and real GVA will be equal.)
Table 4.14: Comparison of GVA data with EEFM data, 2010 (£m)
Regional Accounts GVA (£m, 2010)
EEFM GVA (£m, 2010)
Difference (%)
Peterborough 4,242 4,253 0.2%
Cambridgeshire CC 13,788 13,742 -0.3%
Norfolk 14,030 14,066 0.3%
Suffolk 12,820 12,845 0.2%
Luton 4,109 4,093 -0.4%
Bedfordshire CC 6,868 6,876 0.1%
Hertfordshire 26,512 26,474 -0.1%
Southend-on-Sea 2,670 2,672 0.1%
Thurrock 2,470 2,477 0.3%
Essex CC 24,642 24,659 0.1%
Source: Regional Accounts, Oxford Economics
Housing
Demand for dwellings
Description: Stock of dwellings.
Data: Local authorities: DCLG – dwelling stock estimates
Latest data: 2013
Next release: 2014, data due in 2015

EEFM Technical Report
January 2015
40
The source of data for dwelling stock changed in the EEFM 2013 update. Previously, we took data from the
Housing Strategy Statistical Appendix, however this no longer includes estimates of private dwelling stock.
Therefore, based on recommendations by DCLG, dwelling stock data are sourced from table 125 which
provides estimates of total dwelling stock, and table 615 which provides estimates of vacant dwelling stock.
The difference between these two series is therefore occupied dwelling stock.
DCLG data on the stock of dwellings by local authority is used directly in the EEFM, so the two series match
exactly, as shown in Table 4.15. The forecast variable “demand for dwellings” seeks to accommodate
forecast new households using Oxford Economics occupancy rate assumptions.
Table 4.15: Comparison of DCLG dwelling stock data with EEFM data, 2013 DCLG data (000s,
2013) EEFM data (000s,
2013) Difference (%)
Babergh 39.5 39.5 0.0%
Basildon 75.3 75.3 0.0%
Bedford 68.9 68.9 0.0%
Braintree 63.2 63.2 0.0%
Breckland 58.1 58.1 0.0%
Brentwood 32.4 32.4 0.0%
Broadland 55.3 55.3 0.0%
Broxbourne 39.6 39.6 0.0%
Cambridge 49.1 49.1 0.0%
Castle Point 37.9 37.9 0.0%
Chelmsford 71.7 71.7 0.0%
Colchester 76.2 76.2 0.0%
Dacorum 62.6 62.6 0.0%
East Cambridgeshire 36.4 36.4 0.0%
East Hertfordshire 59.4 59.4 0.0%
Epping Forest 54.8 54.8 0.0%
Fenland 42.6 42.6 0.0%
Forest Heath 28.2 28.2 0.0%
Great Yarmouth 44.7 44.7 0.0%
Harlow 36.3 36.3 0.0%
Hertsmere 41.5 41.5 0.0%
Huntingdonshire 72.7 72.7 0.0%
Ipswich 59.7 59.7 0.0%
King's Lynn and West Norfolk 74.9 74.9 0.0%
Luton 76.7 76.7 0.0%
Maldon 27.4 27.4 0.0%
Mid Bedfordshire 58.1 58.1 0.0%
Mid Suffolk 42.6 42.6 0.0%
North Hertfordshire 55.7 55.7 0.0%
North Norfolk 53.8 53.8 0.0%
Norwich 64.0 64.0 0.0%
Peterborough 78.3 78.3 0.0%
Rochford 34.6 34.6 0.0%
South Bedfordshire 52.8 52.8 0.0%
South Cambridgeshire 63.0 63.0 0.0%
South Norfolk 56.0 56.0 0.0%
Southend-on-Sea 79.2 79.2 0.0%
St Albans 58.6 58.6 0.0%
St Edmundsbury 47.5 47.5 0.0%
Stevenage 35.8 35.8 0.0%
Suffolk Coastal 58.9 58.9 0.0%
Tendring 67.4 67.4 0.0%
Three Rivers 36.5 36.5 0.0%
Thurrock 64.5 64.5 0.0%
Uttlesford 33.9 33.9 0.0%
Watford 38.4 38.4 0.0%
Waveney 54.9 54.9 0.0%
Welwyn Hatfield 46.0 46.0 0.0%
East of England 2,565.6 2,565.6 0.0%
Source: DCLG, Oxford Economics
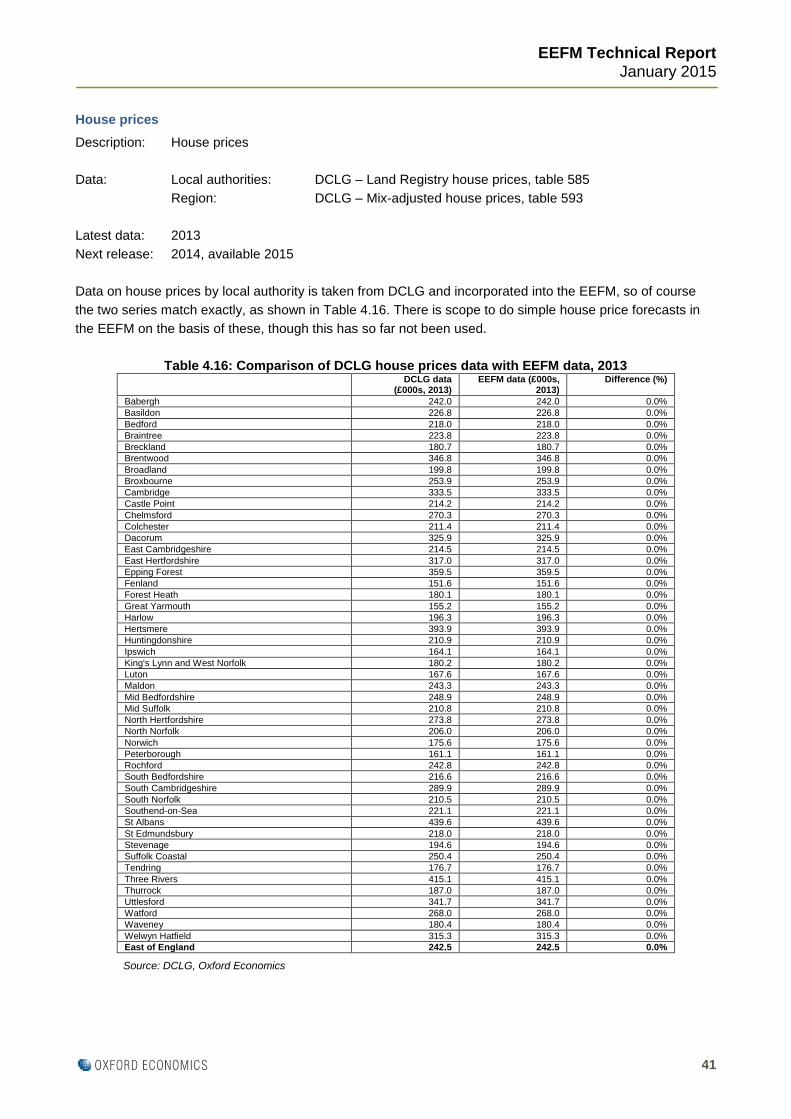
EEFM Technical Report
January 2015
41
House prices
Description: House prices
Data: Local authorities: DCLG – Land Registry house prices, table 585
Region: DCLG – Mix-adjusted house prices, table 593
Latest data: 2013
Next release: 2014, available 2015
Data on house prices by local authority is taken from DCLG and incorporated into the EEFM, so of course
the two series match exactly, as shown in Table 4.16. There is scope to do simple house price forecasts in
the EEFM on the basis of these, though this has so far not been used.
Table 4.16: Comparison of DCLG house prices data with EEFM data, 2013 DCLG data
(£000s, 2013) EEFM data (£000s,
2013) Difference (%)
Babergh 242.0 242.0 0.0%
Basildon 226.8 226.8 0.0%
Bedford 218.0 218.0 0.0%
Braintree 223.8 223.8 0.0%
Breckland 180.7 180.7 0.0%
Brentwood 346.8 346.8 0.0%
Broadland 199.8 199.8 0.0%
Broxbourne 253.9 253.9 0.0%
Cambridge 333.5 333.5 0.0%
Castle Point 214.2 214.2 0.0%
Chelmsford 270.3 270.3 0.0%
Colchester 211.4 211.4 0.0%
Dacorum 325.9 325.9 0.0%
East Cambridgeshire 214.5 214.5 0.0%
East Hertfordshire 317.0 317.0 0.0%
Epping Forest 359.5 359.5 0.0%
Fenland 151.6 151.6 0.0%
Forest Heath 180.1 180.1 0.0%
Great Yarmouth 155.2 155.2 0.0%
Harlow 196.3 196.3 0.0%
Hertsmere 393.9 393.9 0.0%
Huntingdonshire 210.9 210.9 0.0%
Ipswich 164.1 164.1 0.0%
King's Lynn and West Norfolk 180.2 180.2 0.0%
Luton 167.6 167.6 0.0%
Maldon 243.3 243.3 0.0%
Mid Bedfordshire 248.9 248.9 0.0%
Mid Suffolk 210.8 210.8 0.0%
North Hertfordshire 273.8 273.8 0.0%
North Norfolk 206.0 206.0 0.0%
Norwich 175.6 175.6 0.0%
Peterborough 161.1 161.1 0.0%
Rochford 242.8 242.8 0.0%
South Bedfordshire 216.6 216.6 0.0%
South Cambridgeshire 289.9 289.9 0.0%
South Norfolk 210.5 210.5 0.0%
Southend-on-Sea 221.1 221.1 0.0%
St Albans 439.6 439.6 0.0%
St Edmundsbury 218.0 218.0 0.0%
Stevenage 194.6 194.6 0.0%
Suffolk Coastal 250.4 250.4 0.0%
Tendring 176.7 176.7 0.0%
Three Rivers 415.1 415.1 0.0%
Thurrock 187.0 187.0 0.0%
Uttlesford 341.7 341.7 0.0%
Watford 268.0 268.0 0.0%
Waveney 180.4 180.4 0.0%
Welwyn Hatfield 315.3 315.3 0.0%
East of England 242.5 242.5 0.0%
Source: DCLG, Oxford Economics
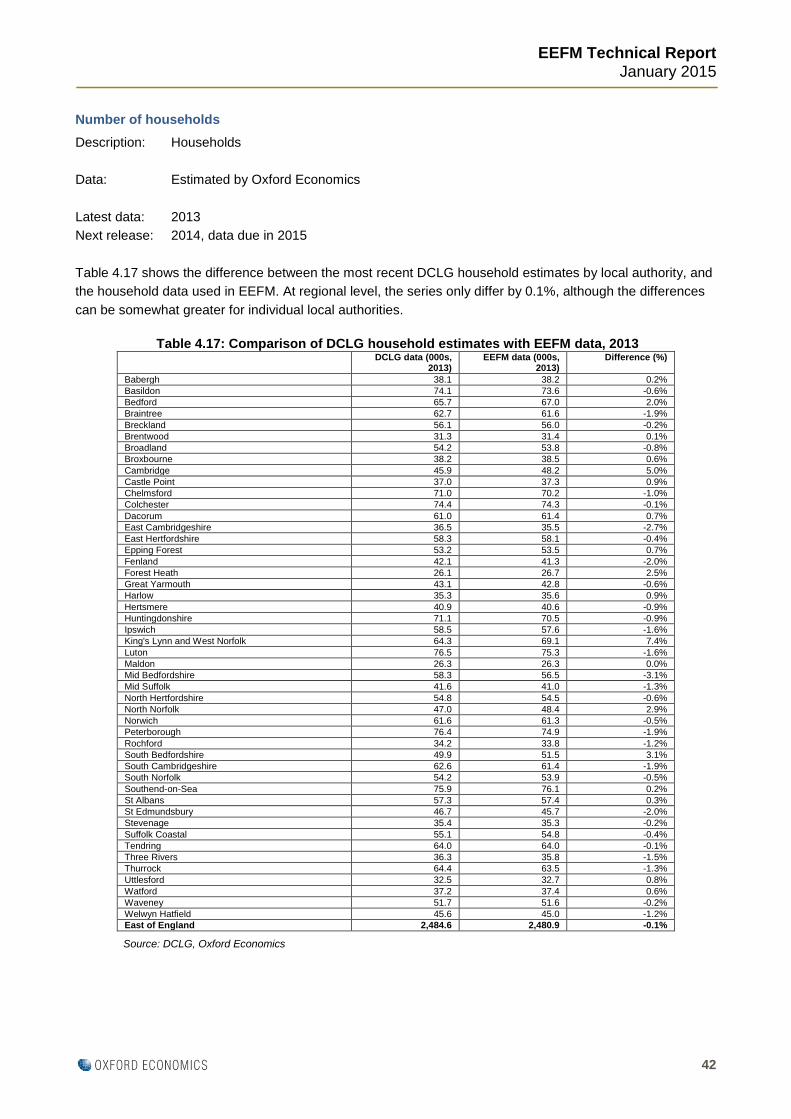
EEFM Technical Report
January 2015
42
Number of households
Description: Households
Data: Estimated by Oxford Economics
Latest data: 2013
Next release: 2014, data due in 2015
Table 4.17 shows the difference between the most recent DCLG household estimates by local authority, and
the household data used in EEFM. At regional level, the series only differ by 0.1%, although the differences
can be somewhat greater for individual local authorities.
Table 4.17: Comparison of DCLG household estimates with EEFM data, 2013
DCLG data (000s, 2013)
EEFM data (000s, 2013)
Difference (%)
Babergh 38.1 38.2 0.2%
Basildon 74.1 73.6 -0.6%
Bedford 65.7 67.0 2.0%
Braintree 62.7 61.6 -1.9%
Breckland 56.1 56.0 -0.2%
Brentwood 31.3 31.4 0.1%
Broadland 54.2 53.8 -0.8%
Broxbourne 38.2 38.5 0.6%
Cambridge 45.9 48.2 5.0%
Castle Point 37.0 37.3 0.9%
Chelmsford 71.0 70.2 -1.0%
Colchester 74.4 74.3 -0.1%
Dacorum 61.0 61.4 0.7%
East Cambridgeshire 36.5 35.5 -2.7%
East Hertfordshire 58.3 58.1 -0.4%
Epping Forest 53.2 53.5 0.7%
Fenland 42.1 41.3 -2.0%
Forest Heath 26.1 26.7 2.5%
Great Yarmouth 43.1 42.8 -0.6%
Harlow 35.3 35.6 0.9%
Hertsmere 40.9 40.6 -0.9%
Huntingdonshire 71.1 70.5 -0.9%
Ipswich 58.5 57.6 -1.6%
King's Lynn and West Norfolk 64.3 69.1 7.4%
Luton 76.5 75.3 -1.6%
Maldon 26.3 26.3 0.0%
Mid Bedfordshire 58.3 56.5 -3.1%
Mid Suffolk 41.6 41.0 -1.3%
North Hertfordshire 54.8 54.5 -0.6%
North Norfolk 47.0 48.4 2.9%
Norwich 61.6 61.3 -0.5%
Peterborough 76.4 74.9 -1.9%
Rochford 34.2 33.8 -1.2%
South Bedfordshire 49.9 51.5 3.1%
South Cambridgeshire 62.6 61.4 -1.9%
South Norfolk 54.2 53.9 -0.5%
Southend-on-Sea 75.9 76.1 0.2%
St Albans 57.3 57.4 0.3%
St Edmundsbury 46.7 45.7 -2.0%
Stevenage 35.4 35.3 -0.2%
Suffolk Coastal 55.1 54.8 -0.4%
Tendring 64.0 64.0 -0.1%
Three Rivers 36.3 35.8 -1.5%
Thurrock 64.4 63.5 -1.3%
Uttlesford 32.5 32.7 0.8%
Watford 37.2 37.4 0.6%
Waveney 51.7 51.6 -0.2%
Welwyn Hatfield 45.6 45.0 -1.2%
East of England 2,484.6 2,480.9 -0.1%
Source: DCLG, Oxford Economics
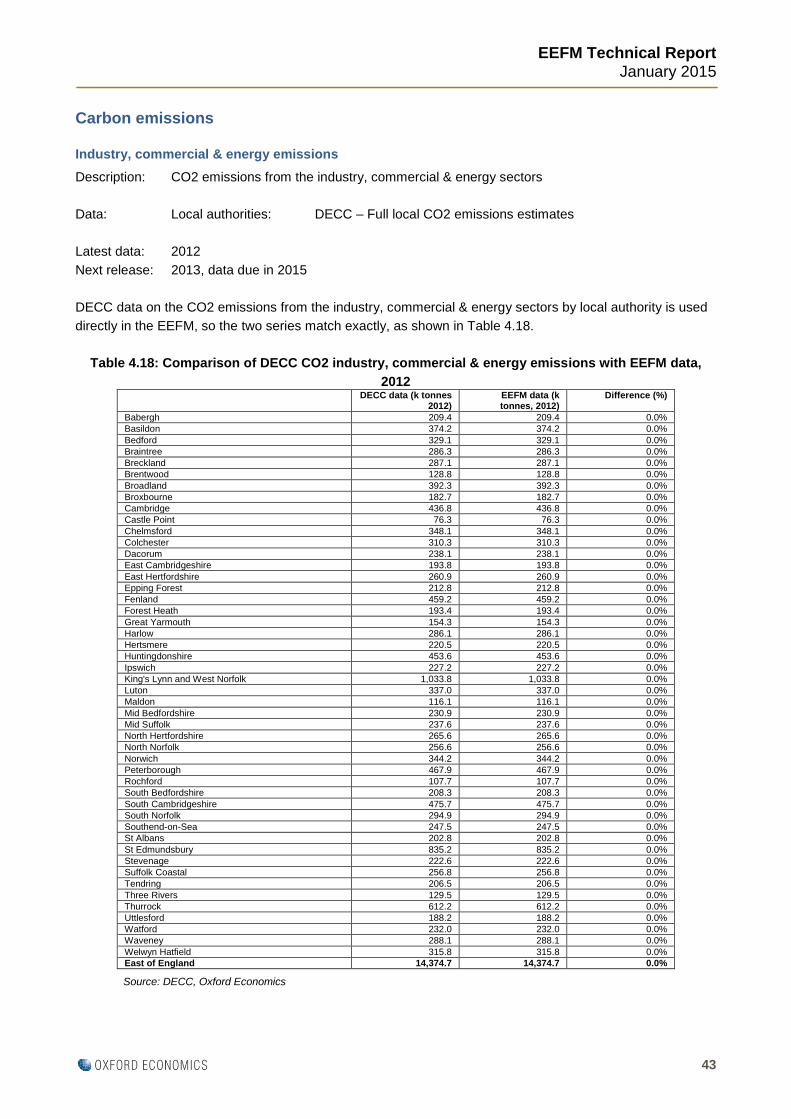
EEFM Technical Report
January 2015
43
Carbon emissions
Industry, commercial & energy emissions
Description: CO2 emissions from the industry, commercial & energy sectors
Data: Local authorities: DECC – Full local CO2 emissions estimates
Latest data: 2012
Next release: 2013, data due in 2015
DECC data on the CO2 emissions from the industry, commercial & energy sectors by local authority is used
directly in the EEFM, so the two series match exactly, as shown in Table 4.18.
Table 4.18: Comparison of DECC CO2 industry, commercial & energy emissions with EEFM data,
2012 DECC data (k tonnes
2012) EEFM data (k tonnes, 2012)
Difference (%)
Babergh 209.4 209.4 0.0%
Basildon 374.2 374.2 0.0%
Bedford 329.1 329.1 0.0%
Braintree 286.3 286.3 0.0%
Breckland 287.1 287.1 0.0%
Brentwood 128.8 128.8 0.0%
Broadland 392.3 392.3 0.0%
Broxbourne 182.7 182.7 0.0%
Cambridge 436.8 436.8 0.0%
Castle Point 76.3 76.3 0.0%
Chelmsford 348.1 348.1 0.0%
Colchester 310.3 310.3 0.0%
Dacorum 238.1 238.1 0.0%
East Cambridgeshire 193.8 193.8 0.0%
East Hertfordshire 260.9 260.9 0.0%
Epping Forest 212.8 212.8 0.0%
Fenland 459.2 459.2 0.0%
Forest Heath 193.4 193.4 0.0%
Great Yarmouth 154.3 154.3 0.0%
Harlow 286.1 286.1 0.0%
Hertsmere 220.5 220.5 0.0%
Huntingdonshire 453.6 453.6 0.0%
Ipswich 227.2 227.2 0.0%
King's Lynn and West Norfolk 1,033.8 1,033.8 0.0%
Luton 337.0 337.0 0.0%
Maldon 116.1 116.1 0.0%
Mid Bedfordshire 230.9 230.9 0.0%
Mid Suffolk 237.6 237.6 0.0%
North Hertfordshire 265.6 265.6 0.0%
North Norfolk 256.6 256.6 0.0%
Norwich 344.2 344.2 0.0%
Peterborough 467.9 467.9 0.0%
Rochford 107.7 107.7 0.0%
South Bedfordshire 208.3 208.3 0.0%
South Cambridgeshire 475.7 475.7 0.0%
South Norfolk 294.9 294.9 0.0%
Southend-on-Sea 247.5 247.5 0.0%
St Albans 202.8 202.8 0.0%
St Edmundsbury 835.2 835.2 0.0%
Stevenage 222.6 222.6 0.0%
Suffolk Coastal 256.8 256.8 0.0%
Tendring 206.5 206.5 0.0%
Three Rivers 129.5 129.5 0.0%
Thurrock 612.2 612.2 0.0%
Uttlesford 188.2 188.2 0.0%
Watford 232.0 232.0 0.0%
Waveney 288.1 288.1 0.0%
Welwyn Hatfield 315.8 315.8 0.0%
East of England 14,374.7 14,374.7 0.0%
Source: DECC, Oxford Economics
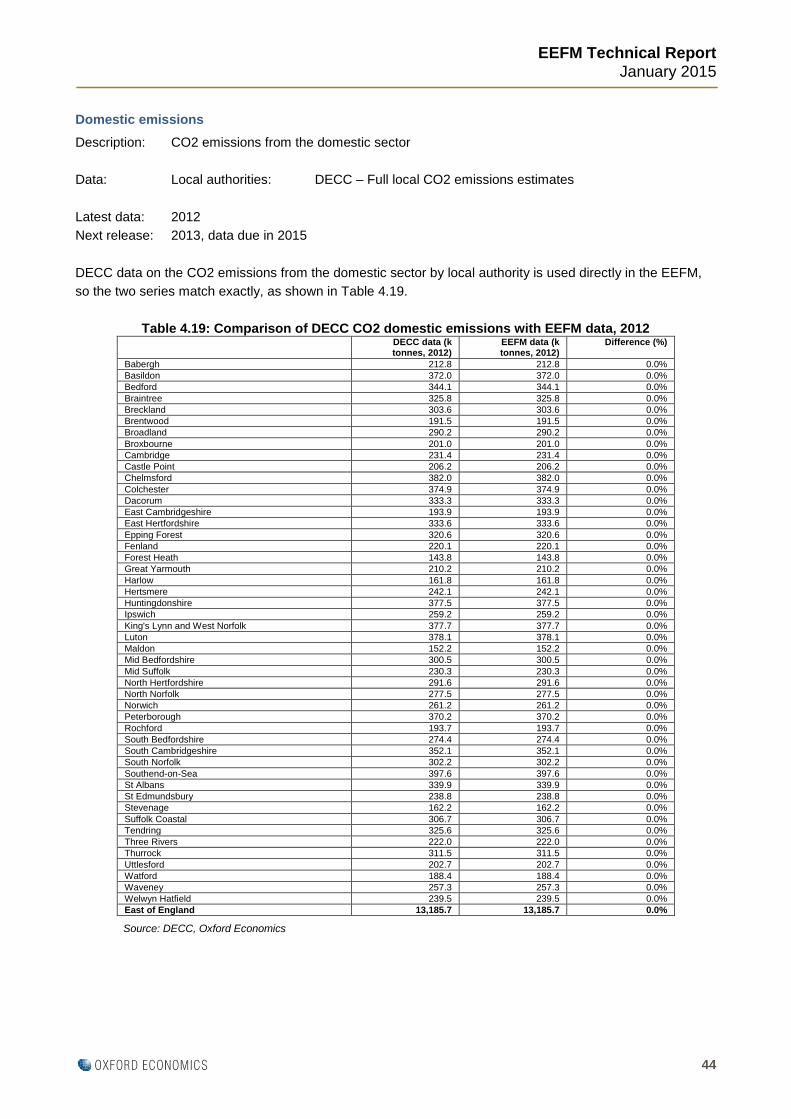
EEFM Technical Report
January 2015
44
Domestic emissions
Description: CO2 emissions from the domestic sector
Data: Local authorities: DECC – Full local CO2 emissions estimates
Latest data: 2012
Next release: 2013, data due in 2015
DECC data on the CO2 emissions from the domestic sector by local authority is used directly in the EEFM,
so the two series match exactly, as shown in Table 4.19.
Table 4.19: Comparison of DECC CO2 domestic emissions with EEFM data, 2012 DECC data (k
tonnes, 2012) EEFM data (k tonnes, 2012)
Difference (%)
Babergh 212.8 212.8 0.0%
Basildon 372.0 372.0 0.0%
Bedford 344.1 344.1 0.0%
Braintree 325.8 325.8 0.0%
Breckland 303.6 303.6 0.0%
Brentwood 191.5 191.5 0.0%
Broadland 290.2 290.2 0.0%
Broxbourne 201.0 201.0 0.0%
Cambridge 231.4 231.4 0.0%
Castle Point 206.2 206.2 0.0%
Chelmsford 382.0 382.0 0.0%
Colchester 374.9 374.9 0.0%
Dacorum 333.3 333.3 0.0%
East Cambridgeshire 193.9 193.9 0.0%
East Hertfordshire 333.6 333.6 0.0%
Epping Forest 320.6 320.6 0.0%
Fenland 220.1 220.1 0.0%
Forest Heath 143.8 143.8 0.0%
Great Yarmouth 210.2 210.2 0.0%
Harlow 161.8 161.8 0.0%
Hertsmere 242.1 242.1 0.0%
Huntingdonshire 377.5 377.5 0.0%
Ipswich 259.2 259.2 0.0%
King's Lynn and West Norfolk 377.7 377.7 0.0%
Luton 378.1 378.1 0.0%
Maldon 152.2 152.2 0.0%
Mid Bedfordshire 300.5 300.5 0.0%
Mid Suffolk 230.3 230.3 0.0%
North Hertfordshire 291.6 291.6 0.0%
North Norfolk 277.5 277.5 0.0%
Norwich 261.2 261.2 0.0%
Peterborough 370.2 370.2 0.0%
Rochford 193.7 193.7 0.0%
South Bedfordshire 274.4 274.4 0.0%
South Cambridgeshire 352.1 352.1 0.0%
South Norfolk 302.2 302.2 0.0%
Southend-on-Sea 397.6 397.6 0.0%
St Albans 339.9 339.9 0.0%
St Edmundsbury 238.8 238.8 0.0%
Stevenage 162.2 162.2 0.0%
Suffolk Coastal 306.7 306.7 0.0%
Tendring 325.6 325.6 0.0%
Three Rivers 222.0 222.0 0.0%
Thurrock 311.5 311.5 0.0%
Uttlesford 202.7 202.7 0.0%
Watford 188.4 188.4 0.0%
Waveney 257.3 257.3 0.0%
Welwyn Hatfield 239.5 239.5 0.0%
East of England 13,185.7 13,185.7 0.0%
Source: DECC, Oxford Economics

EEFM Technical Report
January 2015
45
Transport emissions
Description: CO2 emissions from the transport sector
Data: Local authorities: DECC – Full local CO2 emissions estimates
Latest data: 2012
Next release: 2013, data due in 2015
DECC data on the CO2 emissions from the transport sector by local authority is used directly in the EEFM,
so the two series match exactly, as shown in Table 4.20.
Table 4.20: Comparison of DECC CO2 transport emissions with EEFM data, 2012 DECC data (k
tonnes, 2012) EEFM data (k tonnes, 2012)
Difference (%)
Babergh 229.8 229.8 0.0%
Basildon 275.4 275.4 0.0%
Bedford 313.5 313.5 0.0%
Braintree 342.9 342.9 0.0%
Breckland 380.8 380.8 0.0%
Brentwood 264.9 264.9 0.0%
Broadland 238.5 238.5 0.0%
Broxbourne 118.1 118.1 0.0%
Cambridge 107.3 107.3 0.0%
Castle Point 105.6 105.6 0.0%
Chelmsford 367.4 367.4 0.0%
Colchester 338.2 338.2 0.0%
Dacorum 266.9 266.9 0.0%
East Cambridgeshire 258.2 258.2 0.0%
East Hertfordshire 271.6 271.6 0.0%
Epping Forest 592.7 592.7 0.0%
Fenland 188.6 188.6 0.0%
Forest Heath 183.5 183.5 0.0%
Great Yarmouth 137.2 137.2 0.0%
Harlow 97.3 97.3 0.0%
Hertsmere 363.9 363.9 0.0%
Huntingdonshire 709.5 709.5 0.0%
Ipswich 113.4 113.4 0.0%
King's Lynn and West Norfolk 397.3 397.3 0.0%
Luton 206.1 206.1 0.0%
Maldon 78.5 78.5 0.0%
Mid Bedfordshire 410.9 410.9 0.0%
Mid Suffolk 273.9 273.9 0.0%
North Hertfordshire 278.2 278.2 0.0%
North Norfolk 221.4 221.4 0.0%
Norwich 139.4 139.4 0.0%
Peterborough 411.3 411.3 0.0%
Rochford 98.4 98.4 0.0%
South Bedfordshire 319.5 319.5 0.0%
South Cambridgeshire 586.6 586.6 0.0%
South Norfolk 396.2 396.2 0.0%
Southend-on-Sea 162.0 162.0 0.0%
St Albans 486.8 486.8 0.0%
St Edmundsbury 252.5 252.5 0.0%
Stevenage 128.5 128.5 0.0%
Suffolk Coastal 260.6 260.6 0.0%
Tendring 234.9 234.9 0.0%
Three Rivers 321.3 321.3 0.0%
Thurrock 410.8 410.8 0.0%
Uttlesford 463.6 463.6 0.0%
Watford 96.8 96.8 0.0%
Waveney 152.5 152.5 0.0%
Welwyn Hatfield 268.9 268.9 0.0%
East of England 13,321.8 13,321.8 0.0%
Source: DECC, Oxford Economics
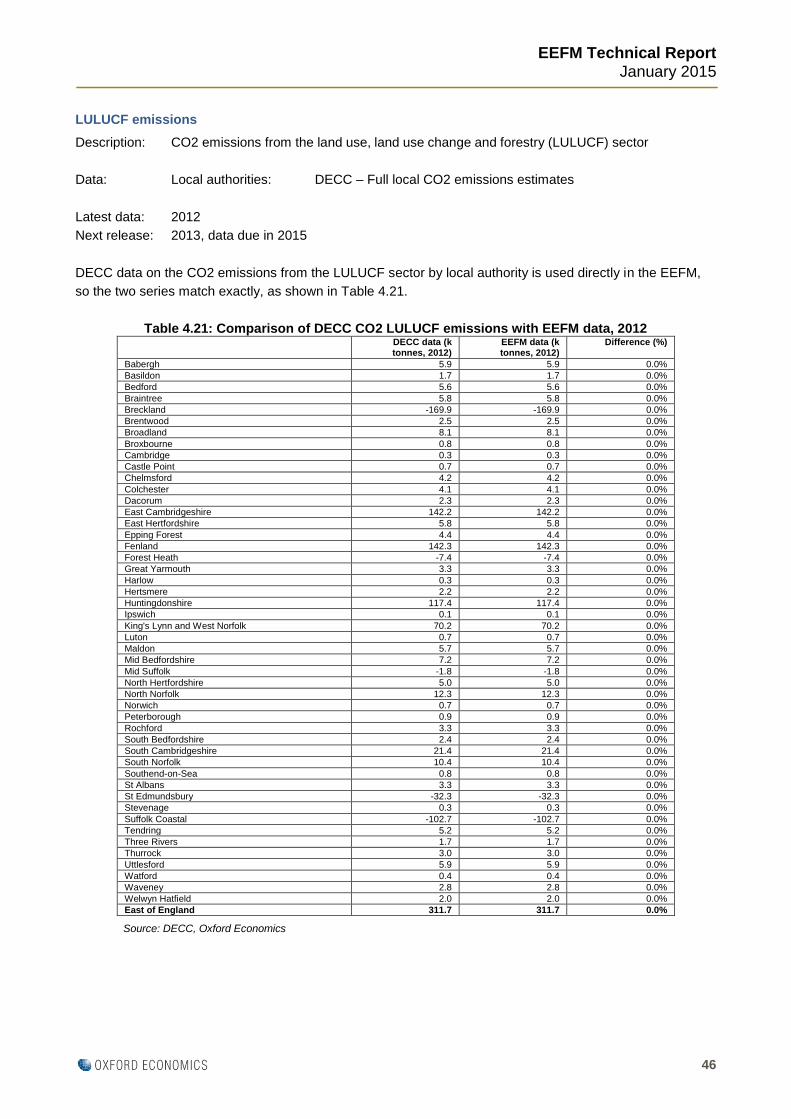
EEFM Technical Report
January 2015
46
LULUCF emissions
Description: CO2 emissions from the land use, land use change and forestry (LULUCF) sector
Data: Local authorities: DECC – Full local CO2 emissions estimates
Latest data: 2012
Next release: 2013, data due in 2015
DECC data on the CO2 emissions from the LULUCF sector by local authority is used directly in the EEFM,
so the two series match exactly, as shown in Table 4.21.
Table 4.21: Comparison of DECC CO2 LULUCF emissions with EEFM data, 2012 DECC data (k
tonnes, 2012) EEFM data (k tonnes, 2012)
Difference (%)
Babergh 5.9 5.9 0.0%
Basildon 1.7 1.7 0.0%
Bedford 5.6 5.6 0.0%
Braintree 5.8 5.8 0.0%
Breckland -169.9 -169.9 0.0%
Brentwood 2.5 2.5 0.0%
Broadland 8.1 8.1 0.0%
Broxbourne 0.8 0.8 0.0%
Cambridge 0.3 0.3 0.0%
Castle Point 0.7 0.7 0.0%
Chelmsford 4.2 4.2 0.0%
Colchester 4.1 4.1 0.0%
Dacorum 2.3 2.3 0.0%
East Cambridgeshire 142.2 142.2 0.0%
East Hertfordshire 5.8 5.8 0.0%
Epping Forest 4.4 4.4 0.0%
Fenland 142.3 142.3 0.0%
Forest Heath -7.4 -7.4 0.0%
Great Yarmouth 3.3 3.3 0.0%
Harlow 0.3 0.3 0.0%
Hertsmere 2.2 2.2 0.0%
Huntingdonshire 117.4 117.4 0.0%
Ipswich 0.1 0.1 0.0%
King's Lynn and West Norfolk 70.2 70.2 0.0%
Luton 0.7 0.7 0.0%
Maldon 5.7 5.7 0.0%
Mid Bedfordshire 7.2 7.2 0.0%
Mid Suffolk -1.8 -1.8 0.0%
North Hertfordshire 5.0 5.0 0.0%
North Norfolk 12.3 12.3 0.0%
Norwich 0.7 0.7 0.0%
Peterborough 0.9 0.9 0.0%
Rochford 3.3 3.3 0.0%
South Bedfordshire 2.4 2.4 0.0%
South Cambridgeshire 21.4 21.4 0.0%
South Norfolk 10.4 10.4 0.0%
Southend-on-Sea 0.8 0.8 0.0%
St Albans 3.3 3.3 0.0%
St Edmundsbury -32.3 -32.3 0.0%
Stevenage 0.3 0.3 0.0%
Suffolk Coastal -102.7 -102.7 0.0%
Tendring 5.2 5.2 0.0%
Three Rivers 1.7 1.7 0.0%
Thurrock 3.0 3.0 0.0%
Uttlesford 5.9 5.9 0.0%
Watford 0.4 0.4 0.0%
Waveney 2.8 2.8 0.0%
Welwyn Hatfield 2.0 2.0 0.0%
East of England 311.7 311.7 0.0%
Source: DECC, Oxford Economics
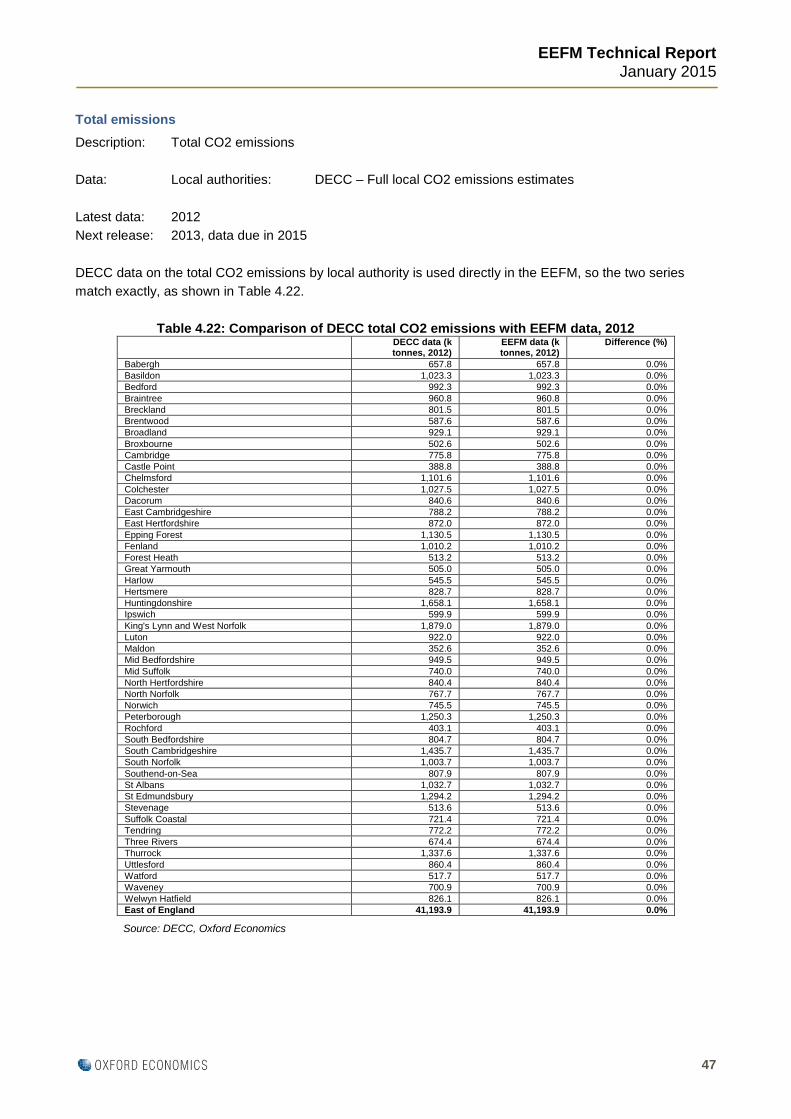
EEFM Technical Report
January 2015
47
Total emissions
Description: Total CO2 emissions
Data: Local authorities: DECC – Full local CO2 emissions estimates
Latest data: 2012
Next release: 2013, data due in 2015
DECC data on the total CO2 emissions by local authority is used directly in the EEFM, so the two series
match exactly, as shown in Table 4.22.
Table 4.22: Comparison of DECC total CO2 emissions with EEFM data, 2012 DECC data (k
tonnes, 2012) EEFM data (k tonnes, 2012)
Difference (%)
Babergh 657.8 657.8 0.0%
Basildon 1,023.3 1,023.3 0.0%
Bedford 992.3 992.3 0.0%
Braintree 960.8 960.8 0.0%
Breckland 801.5 801.5 0.0%
Brentwood 587.6 587.6 0.0%
Broadland 929.1 929.1 0.0%
Broxbourne 502.6 502.6 0.0%
Cambridge 775.8 775.8 0.0%
Castle Point 388.8 388.8 0.0%
Chelmsford 1,101.6 1,101.6 0.0%
Colchester 1,027.5 1,027.5 0.0%
Dacorum 840.6 840.6 0.0%
East Cambridgeshire 788.2 788.2 0.0%
East Hertfordshire 872.0 872.0 0.0%
Epping Forest 1,130.5 1,130.5 0.0%
Fenland 1,010.2 1,010.2 0.0%
Forest Heath 513.2 513.2 0.0%
Great Yarmouth 505.0 505.0 0.0%
Harlow 545.5 545.5 0.0%
Hertsmere 828.7 828.7 0.0%
Huntingdonshire 1,658.1 1,658.1 0.0%
Ipswich 599.9 599.9 0.0%
King's Lynn and West Norfolk 1,879.0 1,879.0 0.0%
Luton 922.0 922.0 0.0%
Maldon 352.6 352.6 0.0%
Mid Bedfordshire 949.5 949.5 0.0%
Mid Suffolk 740.0 740.0 0.0%
North Hertfordshire 840.4 840.4 0.0%
North Norfolk 767.7 767.7 0.0%
Norwich 745.5 745.5 0.0%
Peterborough 1,250.3 1,250.3 0.0%
Rochford 403.1 403.1 0.0%
South Bedfordshire 804.7 804.7 0.0%
South Cambridgeshire 1,435.7 1,435.7 0.0%
South Norfolk 1,003.7 1,003.7 0.0%
Southend-on-Sea 807.9 807.9 0.0%
St Albans 1,032.7 1,032.7 0.0%
St Edmundsbury 1,294.2 1,294.2 0.0%
Stevenage 513.6 513.6 0.0%
Suffolk Coastal 721.4 721.4 0.0%
Tendring 772.2 772.2 0.0%
Three Rivers 674.4 674.4 0.0%
Thurrock 1,337.6 1,337.6 0.0%
Uttlesford 860.4 860.4 0.0%
Watford 517.7 517.7 0.0%
Waveney 700.9 700.9 0.0%
Welwyn Hatfield 826.1 826.1 0.0%
East of England 41,193.9 41,193.9 0.0%
Source: DECC, Oxford Economics

EEFM Technical Report
January 2015
48
5: Outliers and data validity
Oxford Economics adheres to the principle of incorporating published data unchanged into the EEFM as the
crucial starting point upon which local economic data are founded. Data is then adjusted to be consistent
with key regional and national series which offer more timely information around recent economic trends (see
section 4 for further detail). This process allows Model users to reference key variables at the published
source, however as data are adjusted this means that users cannot reference data directly, although the
broad levels will remain consistent with the published source. Tables published in section 4 are provided to
give a sense of the level of adjustment made to the published data.
However, in some cases the data can be anomalous - so-called “outliers.” This could be because of errors in
measuring or recording it. Or perhaps the data is “true” but reflects an unusual circumstance and so does not
accurately represent the local situation or local trends. Because of the smaller numbers of observations,
data-reporting errors or unusual “outlier” values can be a particular problem at more detailed levels of
analysis - for example, when looking at individual sectors in individual local authorities.
This section explores these issues in respect of the BRES (note: prior to 2008, ABI data is used and subject
to similar levels of volatility), and outlines Oxford Economics’ approach to BRES data outliers. In summary,
this is to keep them unchanged within the EEFM spreadsheets, but to adjust them when making forecasts
such that the first year of a forecast would incorporate a correction for an outlier value in the BRES data in a
previous year.
BRES outliers
The latest published BRES data is for 2012 and was released in September 2013. Since BRES data is
collected by survey whereby individuals / firms complete the questionnaires, there can sometimes be
significant discontinuities in the sector data at local level from year to year. Such discontinuities may - or may
not - reflect real events. Consider the effects on the data series of an incomplete return from a firm - or an
error interpreting or recording it - in one year preceded (or followed) by a complete or correct return in the
previous (or subsequent) year. Any recorded change in employees associated with this would be fictitious,
and any trend extrapolated from it into the future would be misleading. But equally, a dramatic change could
reflect the opening, expansion, contraction or closure of a major business in an area (with potential longer-
term effects on other local businesses).
If a discontinuity occurred in say 2008, but was corrected in 2009, producing a “spike” in the time-series data,
it can essentially be ignored as it will not affect the forecasting process. Equally, if it were confirmed the
following year, it would suggest a ‘real’ change in the local economy has indeed taken place. In the
meantime, local authorities’ input is vital to identify whether discontinuities in the data reflect ‘real’ events or
not.
Focussing on the 2 digit SIC 2007 sectors for employee jobs at local authority level, we identified
discontinuities showing more than a 10% change in number of employees in a single year where this
change involved more than 1,000 employees. These outliers were sent to appropriate local authority
representatives for their reaction and input.
Oxford Economics’ response to this consultation was as follows: where we were satisfied that a discontinuity
genuinely reflected the opening or closure of a firm, or major expansion or contraction, we accepted the
change as the correct starting point for the EEFM forecasts. But if we were given evidence by the steering
group that there was an error in the BRES data or that an outlier gave a misleading picture of the local
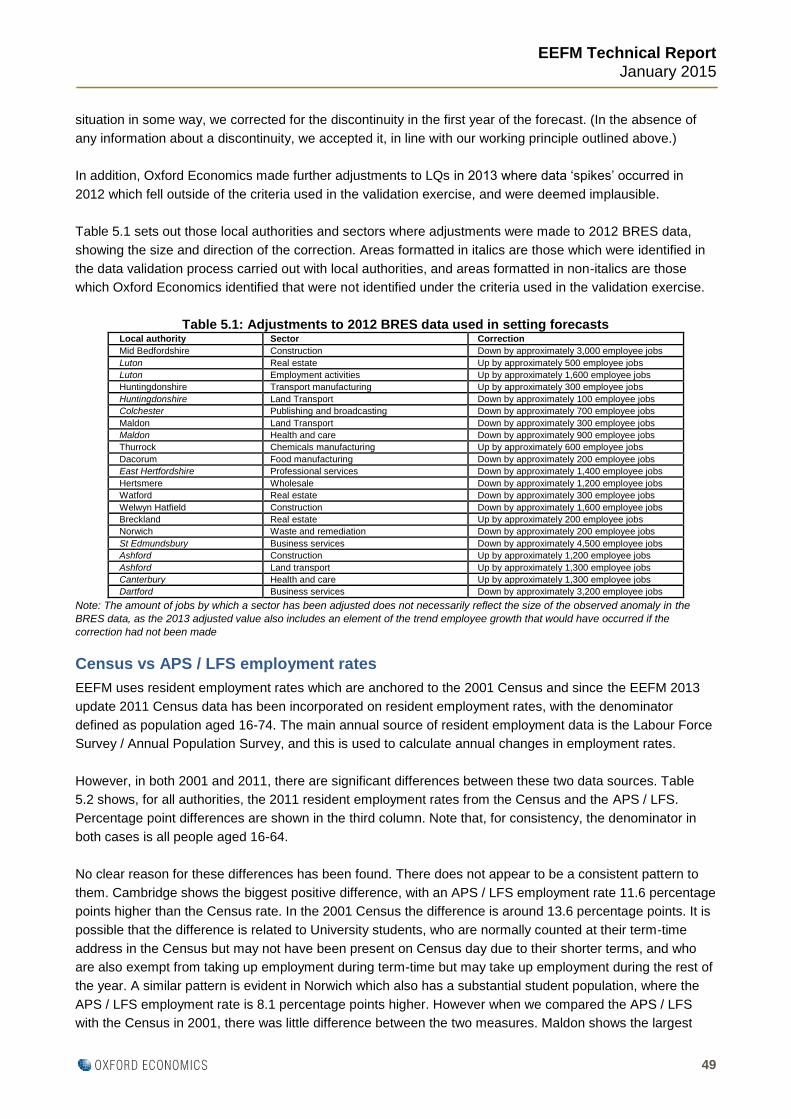
EEFM Technical Report
January 2015
49
situation in some way, we corrected for the discontinuity in the first year of the forecast. (In the absence of
any information about a discontinuity, we accepted it, in line with our working principle outlined above.)
In addition, Oxford Economics made further adjustments to LQs in 2013 where data ‘spikes’ occurred in
2012 which fell outside of the criteria used in the validation exercise, and were deemed implausible.
Table 5.1 sets out those local authorities and sectors where adjustments were made to 2012 BRES data,
showing the size and direction of the correction. Areas formatted in italics are those which were identified in
the data validation process carried out with local authorities, and areas formatted in non-italics are those
which Oxford Economics identified that were not identified under the criteria used in the validation exercise.
Table 5.1: Adjustments to 2012 BRES data used in setting forecasts Local authority Sector Correction
Mid Bedfordshire Construction Down by approximately 3,000 employee jobs
Luton Real estate Up by approximately 500 employee jobs
Luton Employment activities Up by approximately 1,600 employee jobs
Huntingdonshire Transport manufacturing Up by approximately 300 employee jobs
Huntingdonshire Land Transport Down by approximately 100 employee jobs
Colchester Publishing and broadcasting Down by approximately 700 employee jobs
Maldon Land Transport Down by approximately 300 employee jobs
Maldon Health and care Down by approximately 900 employee jobs
Thurrock Chemicals manufacturing Up by approximately 600 employee jobs
Dacorum Food manufacturing Down by approximately 200 employee jobs
East Hertfordshire Professional services Down by approximately 1,400 employee jobs
Hertsmere Wholesale Down by approximately 1,200 employee jobs
Watford Real estate Down by approximately 300 employee jobs
Welwyn Hatfield Construction Down by approximately 1,600 employee jobs
Breckland Real estate Up by approximately 200 employee jobs
Norwich Waste and remediation Down by approximately 200 employee jobs
St Edmundsbury Business services Down by approximately 4,500 employee jobs
Ashford Construction Up by approximately 1,200 employee jobs
Ashford Land transport Up by approximately 1,300 employee jobs
Canterbury Health and care Up by approximately 1,300 employee jobs
Dartford Business services Down by approximately 3,200 employee jobs
Note: The amount of jobs by which a sector has been adjusted does not necessarily reflect the size of the observed anomaly in the
BRES data, as the 2013 adjusted value also includes an element of the trend employee growth that would have occurred if the
correction had not been made
Census vs APS / LFS employment rates
EEFM uses resident employment rates which are anchored to the 2001 Census and since the EEFM 2013
update 2011 Census data has been incorporated on resident employment rates, with the denominator
defined as population aged 16-74. The main annual source of resident employment data is the Labour Force
Survey / Annual Population Survey, and this is used to calculate annual changes in employment rates.
However, in both 2001 and 2011, there are significant differences between these two data sources. Table
5.2 shows, for all authorities, the 2011 resident employment rates from the Census and the APS / LFS.
Percentage point differences are shown in the third column. Note that, for consistency, the denominator in
both cases is all people aged 16-64.
No clear reason for these differences has been found. There does not appear to be a consistent pattern to
them. Cambridge shows the biggest positive difference, with an APS / LFS employment rate 11.6 percentage
points higher than the Census rate. In the 2001 Census the difference is around 13.6 percentage points. It is
possible that the difference is related to University students, who are normally counted at their term-time
address in the Census but may not have been present on Census day due to their shorter terms, and who
are also exempt from taking up employment during term-time but may take up employment during the rest of
the year. A similar pattern is evident in Norwich which also has a substantial student population, where the
APS / LFS employment rate is 8.1 percentage points higher. However when we compared the APS / LFS
with the Census in 2001, there was little difference between the two measures. Maldon shows the largest
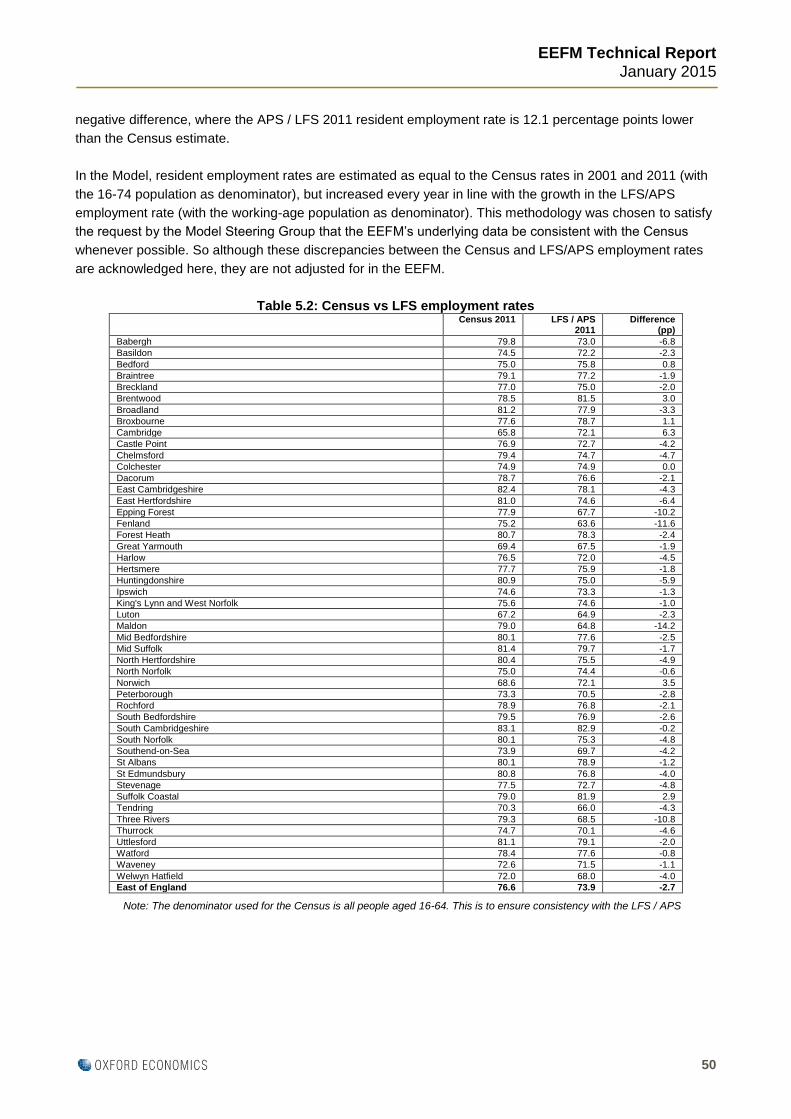
EEFM Technical Report
January 2015
50
negative difference, where the APS / LFS 2011 resident employment rate is 12.1 percentage points lower
than the Census estimate.
In the Model, resident employment rates are estimated as equal to the Census rates in 2001 and 2011 (with
the 16-74 population as denominator), but increased every year in line with the growth in the LFS/APS
employment rate (with the working-age population as denominator). This methodology was chosen to satisfy
the request by the Model Steering Group that the EEFM’s underlying data be consistent with the Census
whenever possible. So although these discrepancies between the Census and LFS/APS employment rates
are acknowledged here, they are not adjusted for in the EEFM.
Table 5.2: Census vs LFS employment rates Census 2011 LFS / APS
2011 Difference
(pp)
Babergh 79.8 73.0 -6.8
Basildon 74.5 72.2 -2.3
Bedford 75.0 75.8 0.8
Braintree 79.1 77.2 -1.9
Breckland 77.0 75.0 -2.0
Brentwood 78.5 81.5 3.0
Broadland 81.2 77.9 -3.3
Broxbourne 77.6 78.7 1.1
Cambridge 65.8 72.1 6.3
Castle Point 76.9 72.7 -4.2
Chelmsford 79.4 74.7 -4.7
Colchester 74.9 74.9 0.0
Dacorum 78.7 76.6 -2.1
East Cambridgeshire 82.4 78.1 -4.3
East Hertfordshire 81.0 74.6 -6.4
Epping Forest 77.9 67.7 -10.2
Fenland 75.2 63.6 -11.6
Forest Heath 80.7 78.3 -2.4
Great Yarmouth 69.4 67.5 -1.9
Harlow 76.5 72.0 -4.5
Hertsmere 77.7 75.9 -1.8
Huntingdonshire 80.9 75.0 -5.9
Ipswich 74.6 73.3 -1.3
King's Lynn and West Norfolk 75.6 74.6 -1.0
Luton 67.2 64.9 -2.3
Maldon 79.0 64.8 -14.2
Mid Bedfordshire 80.1 77.6 -2.5
Mid Suffolk 81.4 79.7 -1.7
North Hertfordshire 80.4 75.5 -4.9
North Norfolk 75.0 74.4 -0.6
Norwich 68.6 72.1 3.5
Peterborough 73.3 70.5 -2.8
Rochford 78.9 76.8 -2.1
South Bedfordshire 79.5 76.9 -2.6
South Cambridgeshire 83.1 82.9 -0.2
South Norfolk 80.1 75.3 -4.8
Southend-on-Sea 73.9 69.7 -4.2
St Albans 80.1 78.9 -1.2
St Edmundsbury 80.8 76.8 -4.0
Stevenage 77.5 72.7 -4.8
Suffolk Coastal 79.0 81.9 2.9
Tendring 70.3 66.0 -4.3
Three Rivers 79.3 68.5 -10.8
Thurrock 74.7 70.1 -4.6
Uttlesford 81.1 79.1 -2.0
Watford 78.4 77.6 -0.8
Waveney 72.6 71.5 -1.1
Welwyn Hatfield 72.0 68.0 -4.0
East of England 76.6 73.9 -2.7
Note: The denominator used for the Census is all people aged 16-64. This is to ensure consistency with the LFS / APS

EEFM Technical Report
January 2015
51
Data checking and validity procedures
A vital foundation of any economic modelling and forecasting work is ensuring that data is correctly sourced
and accurately fed into the model. Oxford Economics has a policy of meticulously summing checking
variables and carrying out visual checks throughout the process of updating the EEFM to ensure that the
data is fully internally consistent.
Data is entered electronically from original official sources and is checked automatically to make sure
identities are maintained. It is also checked visually to assess whether trends look plausible and magnitudes
are correct.
There are a number of key identities in the EEFM which must hold for the Model to be fully realised, and we
have a spreadsheet within it designed specifically to check that this is the case. These identities are:
Employee jobs by sector = total employee jobs
Self-employed jobs by sector = total self-employed jobs
Employment by sector = total employment
All indicators in each local authority = Eastern totals (note that this does not apply to house prices,
productivity, and unemployment / resident employment rates)
Total employment = employee jobs + self employed jobs + HM Armed Forces
Total population = working age population + young population + elderly population
Change in population = net migration + natural increase
People-based employment = net commuting + resident-based employment
Labour force = employment + unemployment
There are two principal methods that we apply to our models to ensure variables add up correctly over the
forecast period:
1. Scaling: it is often the case that model input or output variables which are theoretically identical
actually have different values. This is usually due to errors or incompleteness in the underlying data
or methodological differences in gathering them. Scaling is the process by which two such variables
are made equal by raising one to the value of the other, and the procedure can either be
multiplicative or additive. Additive scaling takes the difference between the variables and adds it pro
rata to the components of the lower of the two (for example, to local authority values when the total
of these is less than a regional value to which it should theoretically be equal). Multiplicative scaling
takes the ratio of the “target” total to the actual total, and multiplies each component of the actual
total by that ratio. In this way, the actual total is shifted upwards (or downwards) to meet a target
total which it should theoretically equal.
2. Residual: this procedure is used when the value of one component (or a small number of them) can
be approximately deduced from the known values of other components and a known total. For
example, estimating full time jobs as the residual between total jobs and part time jobs.
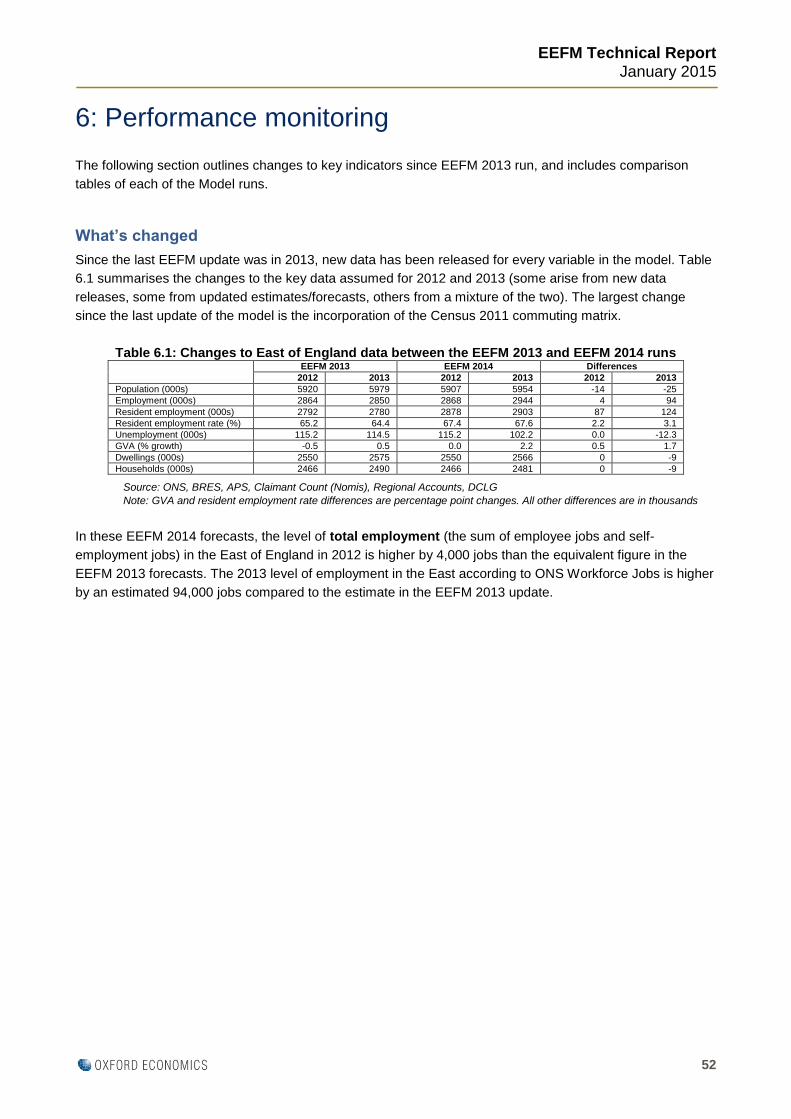
EEFM Technical Report
January 2015
52
6: Performance monitoring
The following section outlines changes to key indicators since EEFM 2013 run, and includes comparison
tables of each of the Model runs.
What’s changed
Since the last EEFM update was in 2013, new data has been released for every variable in the model. Table
6.1 summarises the changes to the key data assumed for 2012 and 2013 (some arise from new data
releases, some from updated estimates/forecasts, others from a mixture of the two). The largest change
since the last update of the model is the incorporation of the Census 2011 commuting matrix.
Table 6.1: Changes to East of England data between the EEFM 2013 and EEFM 2014 runs EEFM 2013 EEFM 2014 Differences
2012 2013 2012 2013 2012 2013
Population (000s) 5920 5979 5907 5954 -14 -25
Employment (000s) 2864 2850 2868 2944 4 94
Resident employment (000s) 2792 2780 2878 2903 87 124
Resident employment rate (%) 65.2 64.4 67.4 67.6 2.2 3.1
Unemployment (000s) 115.2 114.5 115.2 102.2 0.0 -12.3
GVA (% growth) -0.5 0.5 0.0 2.2 0.5 1.7
Dwellings (000s) 2550 2575 2550 2566 0 -9
Households (000s) 2466 2490 2466 2481 0 -9
Source: ONS, BRES, APS, Claimant Count (Nomis), Regional Accounts, DCLG
Note: GVA and resident employment rate differences are percentage point changes. All other differences are in thousands
In these EEFM 2014 forecasts, the level of total employment (the sum of employee jobs and self-
employment jobs) in the East of England in 2012 is higher by 4,000 jobs than the equivalent figure in the
EEFM 2013 forecasts. The 2013 level of employment in the East according to ONS Workforce Jobs is higher
by an estimated 94,000 jobs compared to the estimate in the EEFM 2013 update.
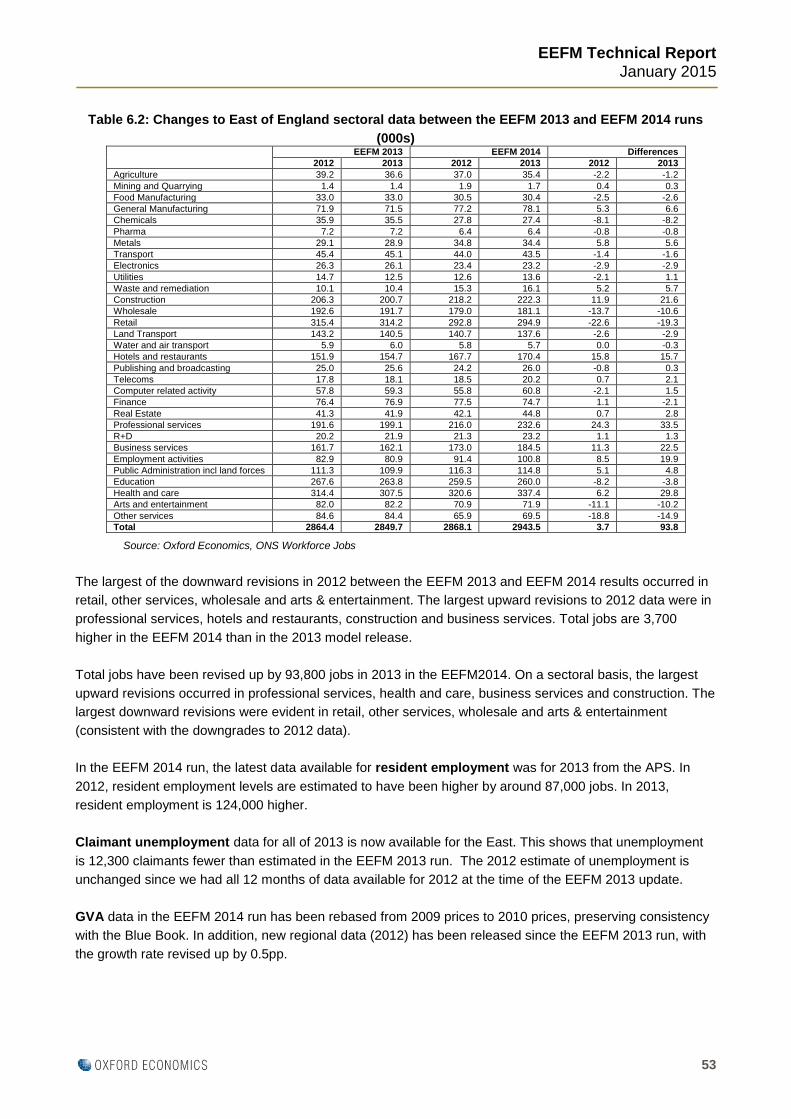
EEFM Technical Report
January 2015
53
Table 6.2: Changes to East of England sectoral data between the EEFM 2013 and EEFM 2014 runs
(000s) EEFM 2013 EEFM 2014 Differences
2012 2013 2012 2013 2012 2013
Agriculture 39.2 36.6 37.0 35.4 -2.2 -1.2
Mining and Quarrying 1.4 1.4 1.9 1.7 0.4 0.3
Food Manufacturing 33.0 33.0 30.5 30.4 -2.5 -2.6
General Manufacturing 71.9 71.5 77.2 78.1 5.3 6.6
Chemicals 35.9 35.5 27.8 27.4 -8.1 -8.2
Pharma 7.2 7.2 6.4 6.4 -0.8 -0.8
Metals 29.1 28.9 34.8 34.4 5.8 5.6
Transport 45.4 45.1 44.0 43.5 -1.4 -1.6
Electronics 26.3 26.1 23.4 23.2 -2.9 -2.9
Utilities 14.7 12.5 12.6 13.6 -2.1 1.1
Waste and remediation 10.1 10.4 15.3 16.1 5.2 5.7
Construction 206.3 200.7 218.2 222.3 11.9 21.6
Wholesale 192.6 191.7 179.0 181.1 -13.7 -10.6
Retail 315.4 314.2 292.8 294.9 -22.6 -19.3
Land Transport 143.2 140.5 140.7 137.6 -2.6 -2.9
Water and air transport 5.9 6.0 5.8 5.7 0.0 -0.3
Hotels and restaurants 151.9 154.7 167.7 170.4 15.8 15.7
Publishing and broadcasting 25.0 25.6 24.2 26.0 -0.8 0.3
Telecoms 17.8 18.1 18.5 20.2 0.7 2.1
Computer related activity 57.8 59.3 55.8 60.8 -2.1 1.5
Finance 76.4 76.9 77.5 74.7 1.1 -2.1
Real Estate 41.3 41.9 42.1 44.8 0.7 2.8
Professional services 191.6 199.1 216.0 232.6 24.3 33.5
R+D 20.2 21.9 21.3 23.2 1.1 1.3
Business services 161.7 162.1 173.0 184.5 11.3 22.5
Employment activities 82.9 80.9 91.4 100.8 8.5 19.9
Public Administration incl land forces 111.3 109.9 116.3 114.8 5.1 4.8
Education 267.6 263.8 259.5 260.0 -8.2 -3.8
Health and care 314.4 307.5 320.6 337.4 6.2 29.8
Arts and entertainment 82.0 82.2 70.9 71.9 -11.1 -10.2
Other services 84.6 84.4 65.9 69.5 -18.8 -14.9
Total 2864.4 2849.7 2868.1 2943.5 3.7 93.8
Source: Oxford Economics, ONS Workforce Jobs
The largest of the downward revisions in 2012 between the EEFM 2013 and EEFM 2014 results occurred in
retail, other services, wholesale and arts & entertainment. The largest upward revisions to 2012 data were in
professional services, hotels and restaurants, construction and business services. Total jobs are 3,700
higher in the EEFM 2014 than in the 2013 model release.
Total jobs have been revised up by 93,800 jobs in 2013 in the EEFM2014. On a sectoral basis, the largest
upward revisions occurred in professional services, health and care, business services and construction. The
largest downward revisions were evident in retail, other services, wholesale and arts & entertainment
(consistent with the downgrades to 2012 data).
In the EEFM 2014 run, the latest data available for resident employment was for 2013 from the APS. In
2012, resident employment levels are estimated to have been higher by around 87,000 jobs. In 2013,
resident employment is 124,000 higher.
Claimant unemployment data for all of 2013 is now available for the East. This shows that unemployment
is 12,300 claimants fewer than estimated in the EEFM 2013 run. The 2012 estimate of unemployment is
unchanged since we had all 12 months of data available for 2012 at the time of the EEFM 2013 update.
GVA data in the EEFM 2014 run has been rebased from 2009 prices to 2010 prices, preserving consistency
with the Blue Book. In addition, new regional data (2012) has been released since the EEFM 2013 run, with
the growth rate revised up by 0.5pp.
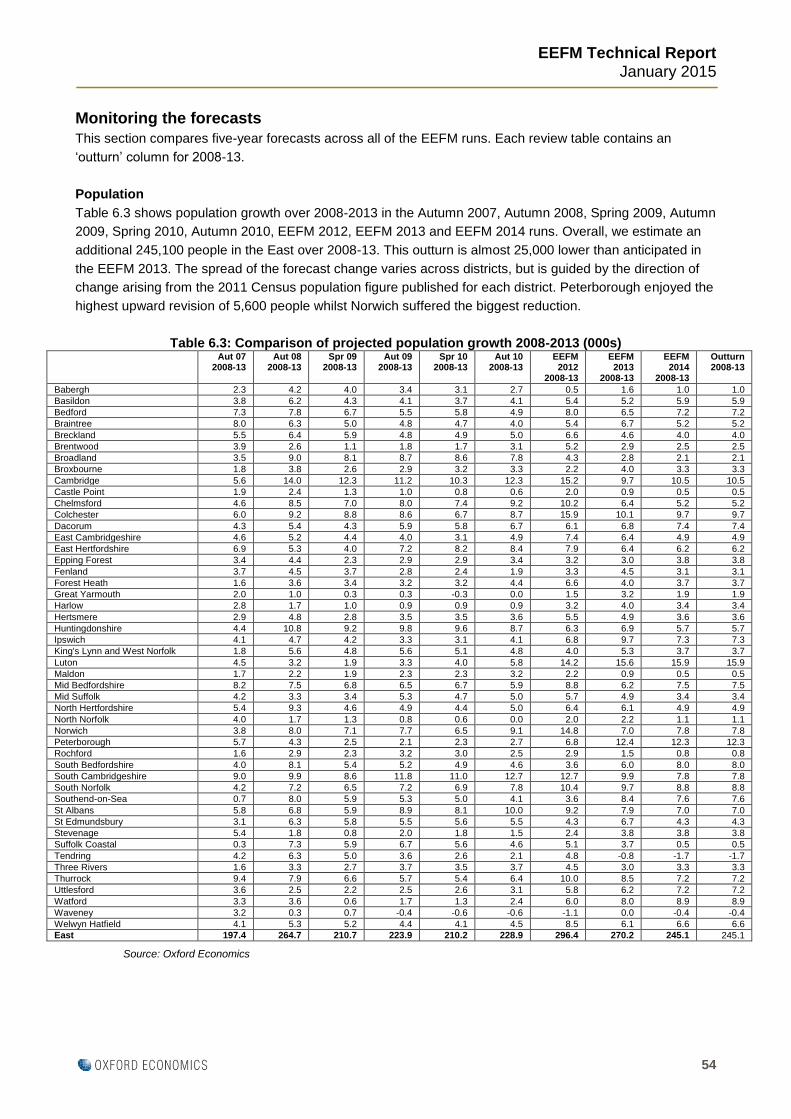
EEFM Technical Report
January 2015
54
Monitoring the forecasts
This section compares five-year forecasts across all of the EEFM runs. Each review table contains an
‘outturn’ column for 2008-13.
Population
Table 6.3 shows population growth over 2008-2013 in the Autumn 2007, Autumn 2008, Spring 2009, Autumn
2009, Spring 2010, Autumn 2010, EEFM 2012, EEFM 2013 and EEFM 2014 runs. Overall, we estimate an
additional 245,100 people in the East over 2008-13. This outturn is almost 25,000 lower than anticipated in
the EEFM 2013. The spread of the forecast change varies across districts, but is guided by the direction of
change arising from the 2011 Census population figure published for each district. Peterborough enjoyed the
highest upward revision of 5,600 people whilst Norwich suffered the biggest reduction.
Table 6.3: Comparison of projected population growth 2008-2013 (000s)
Aut 07
2008-13 Aut 08
2008-13 Spr 09
2008-13 Aut 09
2008-13 Spr 10
2008-13 Aut 10
2008-13 EEFM 2012
2008-13
EEFM 2013
2008-13
EEFM 2014
2008-13
Outturn 2008-13
Babergh 2.3 4.2 4.0 3.4 3.1 2.7 0.5 1.6 1.0 1.0
Basildon 3.8 6.2 4.3 4.1 3.7 4.1 5.4 5.2 5.9 5.9
Bedford 7.3 7.8 6.7 5.5 5.8 4.9 8.0 6.5 7.2 7.2
Braintree 8.0 6.3 5.0 4.8 4.7 4.0 5.4 6.7 5.2 5.2
Breckland 5.5 6.4 5.9 4.8 4.9 5.0 6.6 4.6 4.0 4.0
Brentwood 3.9 2.6 1.1 1.8 1.7 3.1 5.2 2.9 2.5 2.5
Broadland 3.5 9.0 8.1 8.7 8.6 7.8 4.3 2.8 2.1 2.1
Broxbourne 1.8 3.8 2.6 2.9 3.2 3.3 2.2 4.0 3.3 3.3
Cambridge 5.6 14.0 12.3 11.2 10.3 12.3 15.2 9.7 10.5 10.5
Castle Point 1.9 2.4 1.3 1.0 0.8 0.6 2.0 0.9 0.5 0.5
Chelmsford 4.6 8.5 7.0 8.0 7.4 9.2 10.2 6.4 5.2 5.2
Colchester 6.0 9.2 8.8 8.6 6.7 8.7 15.9 10.1 9.7 9.7
Dacorum 4.3 5.4 4.3 5.9 5.8 6.7 6.1 6.8 7.4 7.4
East Cambridgeshire 4.6 5.2 4.4 4.0 3.1 4.9 7.4 6.4 4.9 4.9
East Hertfordshire 6.9 5.3 4.0 7.2 8.2 8.4 7.9 6.4 6.2 6.2
Epping Forest 3.4 4.4 2.3 2.9 2.9 3.4 3.2 3.0 3.8 3.8
Fenland 3.7 4.5 3.7 2.8 2.4 1.9 3.3 4.5 3.1 3.1
Forest Heath 1.6 3.6 3.4 3.2 3.2 4.4 6.6 4.0 3.7 3.7
Great Yarmouth 2.0 1.0 0.3 0.3 -0.3 0.0 1.5 3.2 1.9 1.9
Harlow 2.8 1.7 1.0 0.9 0.9 0.9 3.2 4.0 3.4 3.4
Hertsmere 2.9 4.8 2.8 3.5 3.5 3.6 5.5 4.9 3.6 3.6
Huntingdonshire 4.4 10.8 9.2 9.8 9.6 8.7 6.3 6.9 5.7 5.7
Ipswich 4.1 4.7 4.2 3.3 3.1 4.1 6.8 9.7 7.3 7.3
King's Lynn and West Norfolk 1.8 5.6 4.8 5.6 5.1 4.8 4.0 5.3 3.7 3.7
Luton 4.5 3.2 1.9 3.3 4.0 5.8 14.2 15.6 15.9 15.9
Maldon 1.7 2.2 1.9 2.3 2.3 3.2 2.2 0.9 0.5 0.5
Mid Bedfordshire 8.2 7.5 6.8 6.5 6.7 5.9 8.8 6.2 7.5 7.5
Mid Suffolk 4.2 3.3 3.4 5.3 4.7 5.0 5.7 4.9 3.4 3.4
North Hertfordshire 5.4 9.3 4.6 4.9 4.4 5.0 6.4 6.1 4.9 4.9
North Norfolk 4.0 1.7 1.3 0.8 0.6 0.0 2.0 2.2 1.1 1.1
Norwich 3.8 8.0 7.1 7.7 6.5 9.1 14.8 7.0 7.8 7.8
Peterborough 5.7 4.3 2.5 2.1 2.3 2.7 6.8 12.4 12.3 12.3
Rochford 1.6 2.9 2.3 3.2 3.0 2.5 2.9 1.5 0.8 0.8
South Bedfordshire 4.0 8.1 5.4 5.2 4.9 4.6 3.6 6.0 8.0 8.0
South Cambridgeshire 9.0 9.9 8.6 11.8 11.0 12.7 12.7 9.9 7.8 7.8
South Norfolk 4.2 7.2 6.5 7.2 6.9 7.8 10.4 9.7 8.8 8.8
Southend-on-Sea 0.7 8.0 5.9 5.3 5.0 4.1 3.6 8.4 7.6 7.6
St Albans 5.8 6.8 5.9 8.9 8.1 10.0 9.2 7.9 7.0 7.0
St Edmundsbury 3.1 6.3 5.8 5.5 5.6 5.5 4.3 6.7 4.3 4.3
Stevenage 5.4 1.8 0.8 2.0 1.8 1.5 2.4 3.8 3.8 3.8
Suffolk Coastal 0.3 7.3 5.9 6.7 5.6 4.6 5.1 3.7 0.5 0.5
Tendring 4.2 6.3 5.0 3.6 2.6 2.1 4.8 -0.8 -1.7 -1.7
Three Rivers 1.6 3.3 2.7 3.7 3.5 3.7 4.5 3.0 3.3 3.3
Thurrock 9.4 7.9 6.6 5.7 5.4 6.4 10.0 8.5 7.2 7.2
Uttlesford 3.6 2.5 2.2 2.5 2.6 3.1 5.8 6.2 7.2 7.2
Watford 3.3 3.6 0.6 1.7 1.3 2.4 6.0 8.0 8.9 8.9
Waveney 3.2 0.3 0.7 -0.4 -0.6 -0.6 -1.1 0.0 -0.4 -0.4
Welwyn Hatfield 4.1 5.3 5.2 4.4 4.1 4.5 8.5 6.1 6.6 6.6
East 197.4 264.7 210.7 223.9 210.2 228.9 296.4 270.2 245.1 245.1
Source: Oxford Economics
EEFM Technical Report
January 2015
55
Employment
Table 6.4 shows five-year data/forecasts for jobs growth over 2008-13 in the Autumn 2007, Autumn 2008,
Spring 2009, Autumn 2009, Spring 2010, Autumn 2010, EEFM 2012, EEFM 2013 and EEFM 2014 runs.
Between the Autumn 2007 and Spring 2009 runs, the jobs growth forecast had gradually reduced, echoing
the downward revisions being made by Oxford Economics to its UK forecasts as more information about the
developing recession became available. However, by the time of the Autumn 2009 run, the employment data
was showing that the impact of the recession on the labour market was mild in comparison with previous
recessions, perhaps reflecting changes in the structure of the economy since then. Consequently, the
Autumn 2009, Spring 2010 and Autumn 2010 EEFM runs all showed an improved position on 2008-13 jobs
change relative to the previous forecasts, particularly as new published data had constantly been subject to
upward revisions for the East. In the EEFM 2012 update, revisions to published data by the ONS resulted in
a downward revision to the medium term outlook of jobs growth. This also reflected ongoing problems in the
Eurozone and the continued impact of spending cuts. In the EEFM 2013 update, a contraction in jobs levels
over the period 2008-13 was forecast of around 28,900 jobs. This is due to persistent problems in the
Eurozone which appeared to be stalling the export led recovery. In the 2014 update, we have incorporated
2013 data at the regional level, which suggests a much faster labour market recovery than previously
expected. Over the 2008-13 period, the number of jobs in the East of England are estimated to have risen by
77,000.
The areas estimated to have witnessed the largest gains during this 2008-13 period include South Norfolk,
Hertsmere, Broxbourne, Basildon and Watford. The areas with the weakest job gains during this period
include Norwich, Ipswich, Harlow and Bedford. The pace of recovery in each area ultimately depends on its
sector mix, and in areas with more industry and manufacturing the recovery is likely to be weaker, with more
positive outlooks in areas with a bigger professional services sector.
Over the 2008-13 period, the largest upward revisions to employment gains between the EEFM 2013 update
and EEFM 2014 release are evident in Peterborough, Basildon and Hertsmere. Conversely, Welwyn
Hatfield, South Cambridgeshire and Chelmsford have experienced the largest downgrades.
GVA
Table 6.5 shows five-year data/forecasts for GVA growth over 2008-13 in the Autumn 2007, Autumn 2008,
Spring 2009, Autumn 2009, Spring 2010, Autumn 2010, EEFM 2012, EEFM 2013 and EEFM 2014 runs. As
with employment, the five-year estimates became more negative as the recession gathered pace. In the
EEFM 2014 run, we estimate that GVA growth contracted by 0.3% per annum over the period 2008-13.
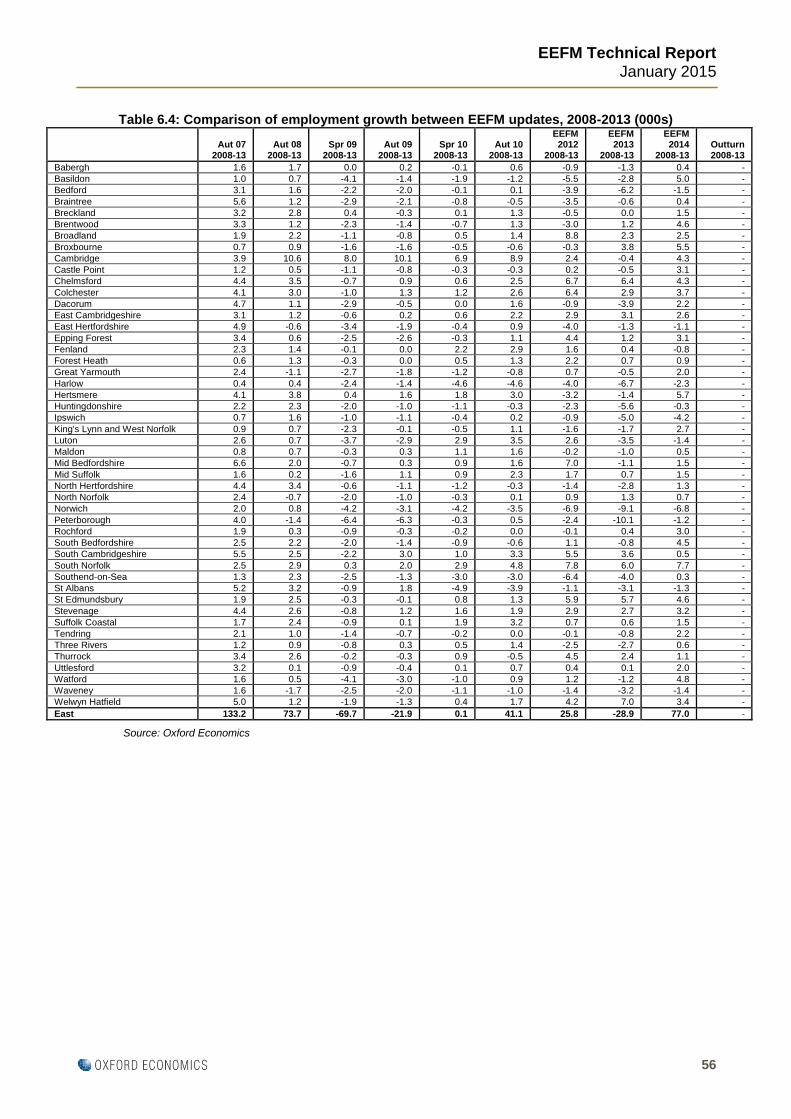
EEFM Technical Report
January 2015
56
Table 6.4: Comparison of employment growth between EEFM updates, 2008-2013 (000s)
Aut 07 2008-13
Aut 08 2008-13
Spr 09 2008-13
Aut 09 2008-13
Spr 10 2008-13
Aut 10 2008-13
EEFM 2012
2008-13
EEFM 2013
2008-13
EEFM 2014
2008-13 Outturn 2008-13
Babergh 1.6 1.7 0.0 0.2 -0.1 0.6 -0.9 -1.3 0.4 -
Basildon 1.0 0.7 -4.1 -1.4 -1.9 -1.2 -5.5 -2.8 5.0 -
Bedford 3.1 1.6 -2.2 -2.0 -0.1 0.1 -3.9 -6.2 -1.5 -
Braintree 5.6 1.2 -2.9 -2.1 -0.8 -0.5 -3.5 -0.6 0.4 -
Breckland 3.2 2.8 0.4 -0.3 0.1 1.3 -0.5 0.0 1.5 -
Brentwood 3.3 1.2 -2.3 -1.4 -0.7 1.3 -3.0 1.2 4.6 -
Broadland 1.9 2.2 -1.1 -0.8 0.5 1.4 8.8 2.3 2.5 -
Broxbourne 0.7 0.9 -1.6 -1.6 -0.5 -0.6 -0.3 3.8 5.5 -
Cambridge 3.9 10.6 8.0 10.1 6.9 8.9 2.4 -0.4 4.3 -
Castle Point 1.2 0.5 -1.1 -0.8 -0.3 -0.3 0.2 -0.5 3.1 -
Chelmsford 4.4 3.5 -0.7 0.9 0.6 2.5 6.7 6.4 4.3 -
Colchester 4.1 3.0 -1.0 1.3 1.2 2.6 6.4 2.9 3.7 -
Dacorum 4.7 1.1 -2.9 -0.5 0.0 1.6 -0.9 -3.9 2.2 -
East Cambridgeshire 3.1 1.2 -0.6 0.2 0.6 2.2 2.9 3.1 2.6 -
East Hertfordshire 4.9 -0.6 -3.4 -1.9 -0.4 0.9 -4.0 -1.3 -1.1 -
Epping Forest 3.4 0.6 -2.5 -2.6 -0.3 1.1 4.4 1.2 3.1 -
Fenland 2.3 1.4 -0.1 0.0 2.2 2.9 1.6 0.4 -0.8 -
Forest Heath 0.6 1.3 -0.3 0.0 0.5 1.3 2.2 0.7 0.9 -
Great Yarmouth 2.4 -1.1 -2.7 -1.8 -1.2 -0.8 0.7 -0.5 2.0 -
Harlow 0.4 0.4 -2.4 -1.4 -4.6 -4.6 -4.0 -6.7 -2.3 -
Hertsmere 4.1 3.8 0.4 1.6 1.8 3.0 -3.2 -1.4 5.7 -
Huntingdonshire 2.2 2.3 -2.0 -1.0 -1.1 -0.3 -2.3 -5.6 -0.3 -
Ipswich 0.7 1.6 -1.0 -1.1 -0.4 0.2 -0.9 -5.0 -4.2 -
King's Lynn and West Norfolk 0.9 0.7 -2.3 -0.1 -0.5 1.1 -1.6 -1.7 2.7 -
Luton 2.6 0.7 -3.7 -2.9 2.9 3.5 2.6 -3.5 -1.4 -
Maldon 0.8 0.7 -0.3 0.3 1.1 1.6 -0.2 -1.0 0.5 -
Mid Bedfordshire 6.6 2.0 -0.7 0.3 0.9 1.6 7.0 -1.1 1.5 -
Mid Suffolk 1.6 0.2 -1.6 1.1 0.9 2.3 1.7 0.7 1.5 -
North Hertfordshire 4.4 3.4 -0.6 -1.1 -1.2 -0.3 -1.4 -2.8 1.3 -
North Norfolk 2.4 -0.7 -2.0 -1.0 -0.3 0.1 0.9 1.3 0.7 -
Norwich 2.0 0.8 -4.2 -3.1 -4.2 -3.5 -6.9 -9.1 -6.8 -
Peterborough 4.0 -1.4 -6.4 -6.3 -0.3 0.5 -2.4 -10.1 -1.2 -
Rochford 1.9 0.3 -0.9 -0.3 -0.2 0.0 -0.1 0.4 3.0 -
South Bedfordshire 2.5 2.2 -2.0 -1.4 -0.9 -0.6 1.1 -0.8 4.5 -
South Cambridgeshire 5.5 2.5 -2.2 3.0 1.0 3.3 5.5 3.6 0.5 -
South Norfolk 2.5 2.9 0.3 2.0 2.9 4.8 7.8 6.0 7.7 -
Southend-on-Sea 1.3 2.3 -2.5 -1.3 -3.0 -3.0 -6.4 -4.0 0.3 -
St Albans 5.2 3.2 -0.9 1.8 -4.9 -3.9 -1.1 -3.1 -1.3 -
St Edmundsbury 1.9 2.5 -0.3 -0.1 0.8 1.3 5.9 5.7 4.6 -
Stevenage 4.4 2.6 -0.8 1.2 1.6 1.9 2.9 2.7 3.2 -
Suffolk Coastal 1.7 2.4 -0.9 0.1 1.9 3.2 0.7 0.6 1.5 -
Tendring 2.1 1.0 -1.4 -0.7 -0.2 0.0 -0.1 -0.8 2.2 -
Three Rivers 1.2 0.9 -0.8 0.3 0.5 1.4 -2.5 -2.7 0.6 -
Thurrock 3.4 2.6 -0.2 -0.3 0.9 -0.5 4.5 2.4 1.1 -
Uttlesford 3.2 0.1 -0.9 -0.4 0.1 0.7 0.4 0.1 2.0 -
Watford 1.6 0.5 -4.1 -3.0 -1.0 0.9 1.2 -1.2 4.8 -
Waveney 1.6 -1.7 -2.5 -2.0 -1.1 -1.0 -1.4 -3.2 -1.4 -
Welwyn Hatfield 5.0 1.2 -1.9 -1.3 0.4 1.7 4.2 7.0 3.4 -
East 133.2 73.7 -69.7 -21.9 0.1 41.1 25.8 -28.9 77.0 -
Source: Oxford Economics
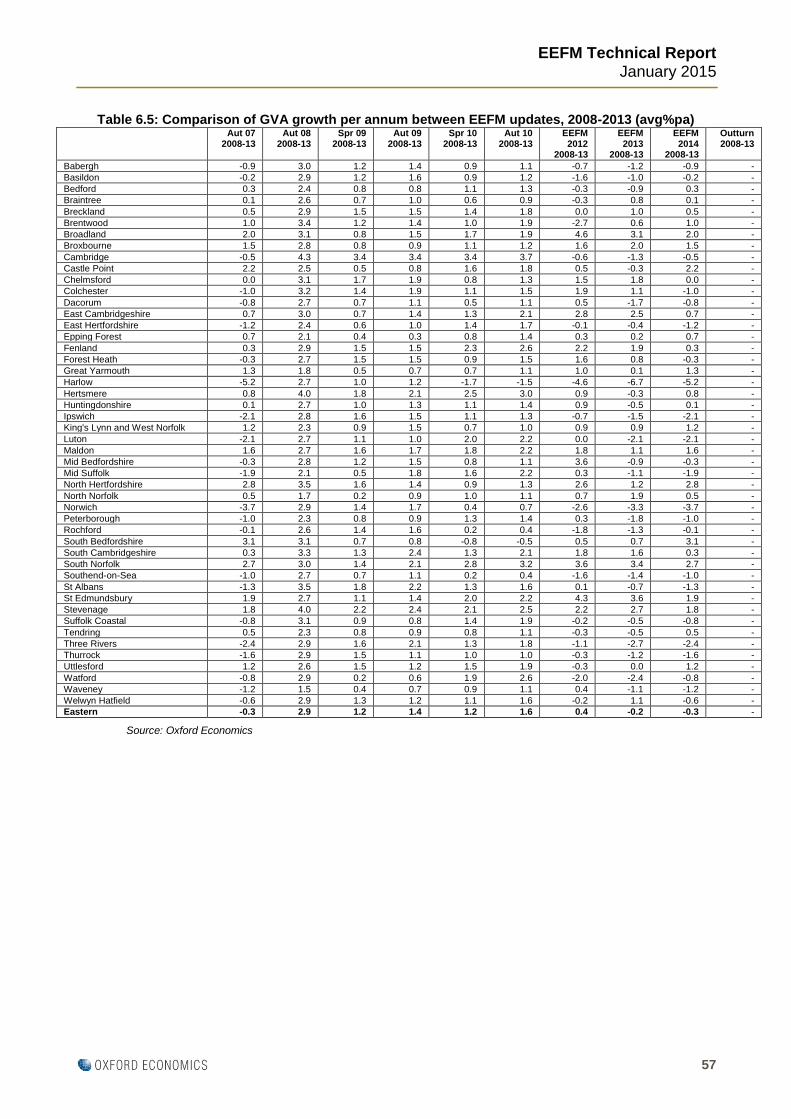
EEFM Technical Report
January 2015
57
Table 6.5: Comparison of GVA growth per annum between EEFM updates, 2008-2013 (avg%pa)
Aut 07
2008-13 Aut 08
2008-13 Spr 09
2008-13 Aut 09
2008-13 Spr 10
2008-13 Aut 10
2008-13 EEFM 2012
2008-13
EEFM 2013
2008-13
EEFM 2014
2008-13
Outturn 2008-13
Babergh -0.9 3.0 1.2 1.4 0.9 1.1 -0.7 -1.2 -0.9 -
Basildon -0.2 2.9 1.2 1.6 0.9 1.2 -1.6 -1.0 -0.2 -
Bedford 0.3 2.4 0.8 0.8 1.1 1.3 -0.3 -0.9 0.3 -
Braintree 0.1 2.6 0.7 1.0 0.6 0.9 -0.3 0.8 0.1 -
Breckland 0.5 2.9 1.5 1.5 1.4 1.8 0.0 1.0 0.5 -
Brentwood 1.0 3.4 1.2 1.4 1.0 1.9 -2.7 0.6 1.0 -
Broadland 2.0 3.1 0.8 1.5 1.7 1.9 4.6 3.1 2.0 -
Broxbourne 1.5 2.8 0.8 0.9 1.1 1.2 1.6 2.0 1.5 -
Cambridge -0.5 4.3 3.4 3.4 3.4 3.7 -0.6 -1.3 -0.5 -
Castle Point 2.2 2.5 0.5 0.8 1.6 1.8 0.5 -0.3 2.2 -
Chelmsford 0.0 3.1 1.7 1.9 0.8 1.3 1.5 1.8 0.0 -
Colchester -1.0 3.2 1.4 1.9 1.1 1.5 1.9 1.1 -1.0 -
Dacorum -0.8 2.7 0.7 1.1 0.5 1.1 0.5 -1.7 -0.8 -
East Cambridgeshire 0.7 3.0 0.7 1.4 1.3 2.1 2.8 2.5 0.7 -
East Hertfordshire -1.2 2.4 0.6 1.0 1.4 1.7 -0.1 -0.4 -1.2 -
Epping Forest 0.7 2.1 0.4 0.3 0.8 1.4 0.3 0.2 0.7 -
Fenland 0.3 2.9 1.5 1.5 2.3 2.6 2.2 1.9 0.3 -
Forest Heath -0.3 2.7 1.5 1.5 0.9 1.5 1.6 0.8 -0.3 -
Great Yarmouth 1.3 1.8 0.5 0.7 0.7 1.1 1.0 0.1 1.3 -
Harlow -5.2 2.7 1.0 1.2 -1.7 -1.5 -4.6 -6.7 -5.2 -
Hertsmere 0.8 4.0 1.8 2.1 2.5 3.0 0.9 -0.3 0.8 -
Huntingdonshire 0.1 2.7 1.0 1.3 1.1 1.4 0.9 -0.5 0.1 -
Ipswich -2.1 2.8 1.6 1.5 1.1 1.3 -0.7 -1.5 -2.1 -
King's Lynn and West Norfolk 1.2 2.3 0.9 1.5 0.7 1.0 0.9 0.9 1.2 -
Luton -2.1 2.7 1.1 1.0 2.0 2.2 0.0 -2.1 -2.1 -
Maldon 1.6 2.7 1.6 1.7 1.8 2.2 1.8 1.1 1.6 -
Mid Bedfordshire -0.3 2.8 1.2 1.5 0.8 1.1 3.6 -0.9 -0.3 -
Mid Suffolk -1.9 2.1 0.5 1.8 1.6 2.2 0.3 -1.1 -1.9 -
North Hertfordshire 2.8 3.5 1.6 1.4 0.9 1.3 2.6 1.2 2.8 -
North Norfolk 0.5 1.7 0.2 0.9 1.0 1.1 0.7 1.9 0.5 -
Norwich -3.7 2.9 1.4 1.7 0.4 0.7 -2.6 -3.3 -3.7 -
Peterborough -1.0 2.3 0.8 0.9 1.3 1.4 0.3 -1.8 -1.0 -
Rochford -0.1 2.6 1.4 1.6 0.2 0.4 -1.8 -1.3 -0.1 -
South Bedfordshire 3.1 3.1 0.7 0.8 -0.8 -0.5 0.5 0.7 3.1 -
South Cambridgeshire 0.3 3.3 1.3 2.4 1.3 2.1 1.8 1.6 0.3 -
South Norfolk 2.7 3.0 1.4 2.1 2.8 3.2 3.6 3.4 2.7 -
Southend-on-Sea -1.0 2.7 0.7 1.1 0.2 0.4 -1.6 -1.4 -1.0 -
St Albans -1.3 3.5 1.8 2.2 1.3 1.6 0.1 -0.7 -1.3 -
St Edmundsbury 1.9 2.7 1.1 1.4 2.0 2.2 4.3 3.6 1.9 -
Stevenage 1.8 4.0 2.2 2.4 2.1 2.5 2.2 2.7 1.8 -
Suffolk Coastal -0.8 3.1 0.9 0.8 1.4 1.9 -0.2 -0.5 -0.8 -
Tendring 0.5 2.3 0.8 0.9 0.8 1.1 -0.3 -0.5 0.5 -
Three Rivers -2.4 2.9 1.6 2.1 1.3 1.8 -1.1 -2.7 -2.4 -
Thurrock -1.6 2.9 1.5 1.1 1.0 1.0 -0.3 -1.2 -1.6 -
Uttlesford 1.2 2.6 1.5 1.2 1.5 1.9 -0.3 0.0 1.2 -
Watford -0.8 2.9 0.2 0.6 1.9 2.6 -2.0 -2.4 -0.8 -
Waveney -1.2 1.5 0.4 0.7 0.9 1.1 0.4 -1.1 -1.2 -
Welwyn Hatfield -0.6 2.9 1.3 1.2 1.1 1.6 -0.2 1.1 -0.6 -
Eastern -0.3 2.9 1.2 1.4 1.2 1.6 0.4 -0.2 -0.3 -
Source: Oxford Economics
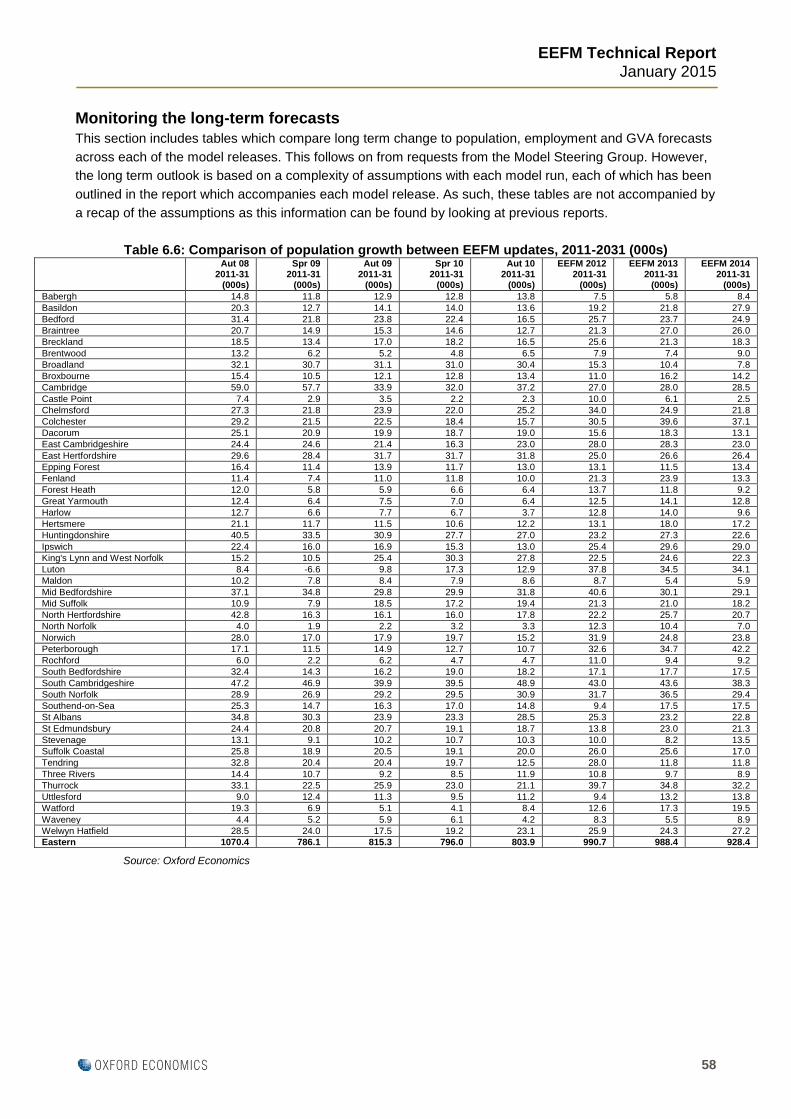
EEFM Technical Report
January 2015
58
Monitoring the long-term forecasts
This section includes tables which compare long term change to population, employment and GVA forecasts
across each of the model releases. This follows on from requests from the Model Steering Group. However,
the long term outlook is based on a complexity of assumptions with each model run, each of which has been
outlined in the report which accompanies each model release. As such, these tables are not accompanied by
a recap of the assumptions as this information can be found by looking at previous reports.
Table 6.6: Comparison of population growth between EEFM updates, 2011-2031 (000s) Aut 08
2011-31 (000s)
Spr 09 2011-31
(000s)
Aut 09 2011-31
(000s)
Spr 10 2011-31
(000s)
Aut 10 2011-31
(000s)
EEFM 2012 2011-31
(000s)
EEFM 2013 2011-31
(000s)
EEFM 2014 2011-31
(000s)
Babergh 14.8 11.8 12.9 12.8 13.8 7.5 5.8 8.4
Basildon 20.3 12.7 14.1 14.0 13.6 19.2 21.8 27.9
Bedford 31.4 21.8 23.8 22.4 16.5 25.7 23.7 24.9
Braintree 20.7 14.9 15.3 14.6 12.7 21.3 27.0 26.0
Breckland 18.5 13.4 17.0 18.2 16.5 25.6 21.3 18.3
Brentwood 13.2 6.2 5.2 4.8 6.5 7.9 7.4 9.0
Broadland 32.1 30.7 31.1 31.0 30.4 15.3 10.4 7.8
Broxbourne 15.4 10.5 12.1 12.8 13.4 11.0 16.2 14.2
Cambridge 59.0 57.7 33.9 32.0 37.2 27.0 28.0 28.5
Castle Point 7.4 2.9 3.5 2.2 2.3 10.0 6.1 2.5
Chelmsford 27.3 21.8 23.9 22.0 25.2 34.0 24.9 21.8
Colchester 29.2 21.5 22.5 18.4 15.7 30.5 39.6 37.1
Dacorum 25.1 20.9 19.9 18.7 19.0 15.6 18.3 13.1
East Cambridgeshire 24.4 24.6 21.4 16.3 23.0 28.0 28.3 23.0
East Hertfordshire 29.6 28.4 31.7 31.7 31.8 25.0 26.6 26.4
Epping Forest 16.4 11.4 13.9 11.7 13.0 13.1 11.5 13.4
Fenland 11.4 7.4 11.0 11.8 10.0 21.3 23.9 13.3
Forest Heath 12.0 5.8 5.9 6.6 6.4 13.7 11.8 9.2
Great Yarmouth 12.4 6.4 7.5 7.0 6.4 12.5 14.1 12.8
Harlow 12.7 6.6 7.7 6.7 3.7 12.8 14.0 9.6
Hertsmere 21.1 11.7 11.5 10.6 12.2 13.1 18.0 17.2
Huntingdonshire 40.5 33.5 30.9 27.7 27.0 23.2 27.3 22.6
Ipswich 22.4 16.0 16.9 15.3 13.0 25.4 29.6 29.0
King's Lynn and West Norfolk 15.2 10.5 25.4 30.3 27.8 22.5 24.6 22.3
Luton 8.4 -6.6 9.8 17.3 12.9 37.8 34.5 34.1
Maldon 10.2 7.8 8.4 7.9 8.6 8.7 5.4 5.9
Mid Bedfordshire 37.1 34.8 29.8 29.9 31.8 40.6 30.1 29.1
Mid Suffolk 10.9 7.9 18.5 17.2 19.4 21.3 21.0 18.2
North Hertfordshire 42.8 16.3 16.1 16.0 17.8 22.2 25.7 20.7
North Norfolk 4.0 1.9 2.2 3.2 3.3 12.3 10.4 7.0
Norwich 28.0 17.0 17.9 19.7 15.2 31.9 24.8 23.8
Peterborough 17.1 11.5 14.9 12.7 10.7 32.6 34.7 42.2
Rochford 6.0 2.2 6.2 4.7 4.7 11.0 9.4 9.2
South Bedfordshire 32.4 14.3 16.2 19.0 18.2 17.1 17.7 17.5
South Cambridgeshire 47.2 46.9 39.9 39.5 48.9 43.0 43.6 38.3
South Norfolk 28.9 26.9 29.2 29.5 30.9 31.7 36.5 29.4
Southend-on-Sea 25.3 14.7 16.3 17.0 14.8 9.4 17.5 17.5
St Albans 34.8 30.3 23.9 23.3 28.5 25.3 23.2 22.8
St Edmundsbury 24.4 20.8 20.7 19.1 18.7 13.8 23.0 21.3
Stevenage 13.1 9.1 10.2 10.7 10.3 10.0 8.2 13.5
Suffolk Coastal 25.8 18.9 20.5 19.1 20.0 26.0 25.6 17.0
Tendring 32.8 20.4 20.4 19.7 12.5 28.0 11.8 11.8
Three Rivers 14.4 10.7 9.2 8.5 11.9 10.8 9.7 8.9
Thurrock 33.1 22.5 25.9 23.0 21.1 39.7 34.8 32.2
Uttlesford 9.0 12.4 11.3 9.5 11.2 9.4 13.2 13.8
Watford 19.3 6.9 5.1 4.1 8.4 12.6 17.3 19.5
Waveney 4.4 5.2 5.9 6.1 4.2 8.3 5.5 8.9
Welwyn Hatfield 28.5 24.0 17.5 19.2 23.1 25.9 24.3 27.2
Eastern 1070.4 786.1 815.3 796.0 803.9 990.7 988.4 928.4
Source: Oxford Economics
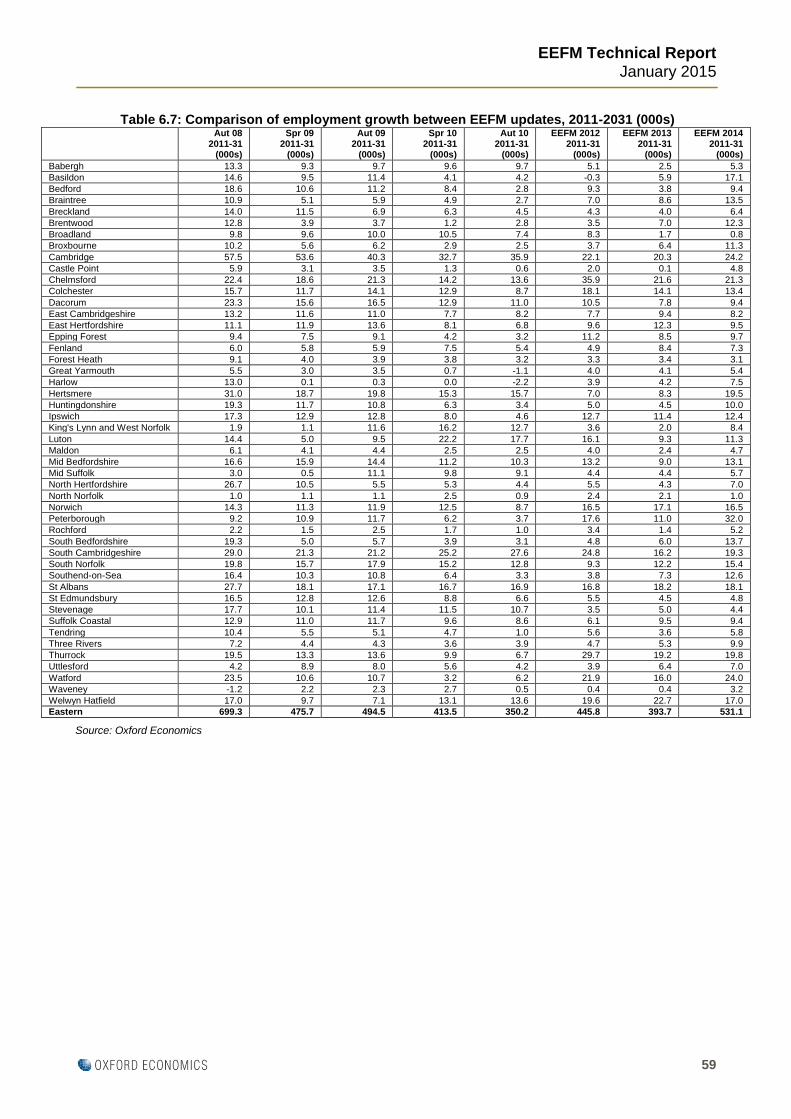
EEFM Technical Report
January 2015
59
Table 6.7: Comparison of employment growth between EEFM updates, 2011-2031 (000s) Aut 08
2011-31 (000s)
Spr 09 2011-31
(000s)
Aut 09 2011-31
(000s)
Spr 10 2011-31
(000s)
Aut 10 2011-31
(000s)
EEFM 2012 2011-31
(000s)
EEFM 2013 2011-31
(000s)
EEFM 2014 2011-31
(000s)
Babergh 13.3 9.3 9.7 9.6 9.7 5.1 2.5 5.3
Basildon 14.6 9.5 11.4 4.1 4.2 -0.3 5.9 17.1
Bedford 18.6 10.6 11.2 8.4 2.8 9.3 3.8 9.4
Braintree 10.9 5.1 5.9 4.9 2.7 7.0 8.6 13.5
Breckland 14.0 11.5 6.9 6.3 4.5 4.3 4.0 6.4
Brentwood 12.8 3.9 3.7 1.2 2.8 3.5 7.0 12.3
Broadland 9.8 9.6 10.0 10.5 7.4 8.3 1.7 0.8
Broxbourne 10.2 5.6 6.2 2.9 2.5 3.7 6.4 11.3
Cambridge 57.5 53.6 40.3 32.7 35.9 22.1 20.3 24.2
Castle Point 5.9 3.1 3.5 1.3 0.6 2.0 0.1 4.8
Chelmsford 22.4 18.6 21.3 14.2 13.6 35.9 21.6 21.3
Colchester 15.7 11.7 14.1 12.9 8.7 18.1 14.1 13.4
Dacorum 23.3 15.6 16.5 12.9 11.0 10.5 7.8 9.4
East Cambridgeshire 13.2 11.6 11.0 7.7 8.2 7.7 9.4 8.2
East Hertfordshire 11.1 11.9 13.6 8.1 6.8 9.6 12.3 9.5
Epping Forest 9.4 7.5 9.1 4.2 3.2 11.2 8.5 9.7
Fenland 6.0 5.8 5.9 7.5 5.4 4.9 8.4 7.3
Forest Heath 9.1 4.0 3.9 3.8 3.2 3.3 3.4 3.1
Great Yarmouth 5.5 3.0 3.5 0.7 -1.1 4.0 4.1 5.4
Harlow 13.0 0.1 0.3 0.0 -2.2 3.9 4.2 7.5
Hertsmere 31.0 18.7 19.8 15.3 15.7 7.0 8.3 19.5
Huntingdonshire 19.3 11.7 10.8 6.3 3.4 5.0 4.5 10.0
Ipswich 17.3 12.9 12.8 8.0 4.6 12.7 11.4 12.4
King's Lynn and West Norfolk 1.9 1.1 11.6 16.2 12.7 3.6 2.0 8.4
Luton 14.4 5.0 9.5 22.2 17.7 16.1 9.3 11.3
Maldon 6.1 4.1 4.4 2.5 2.5 4.0 2.4 4.7
Mid Bedfordshire 16.6 15.9 14.4 11.2 10.3 13.2 9.0 13.1
Mid Suffolk 3.0 0.5 11.1 9.8 9.1 4.4 4.4 5.7
North Hertfordshire 26.7 10.5 5.5 5.3 4.4 5.5 4.3 7.0
North Norfolk 1.0 1.1 1.1 2.5 0.9 2.4 2.1 1.0
Norwich 14.3 11.3 11.9 12.5 8.7 16.5 17.1 16.5
Peterborough 9.2 10.9 11.7 6.2 3.7 17.6 11.0 32.0
Rochford 2.2 1.5 2.5 1.7 1.0 3.4 1.4 5.2
South Bedfordshire 19.3 5.0 5.7 3.9 3.1 4.8 6.0 13.7
South Cambridgeshire 29.0 21.3 21.2 25.2 27.6 24.8 16.2 19.3
South Norfolk 19.8 15.7 17.9 15.2 12.8 9.3 12.2 15.4
Southend-on-Sea 16.4 10.3 10.8 6.4 3.3 3.8 7.3 12.6
St Albans 27.7 18.1 17.1 16.7 16.9 16.8 18.2 18.1
St Edmundsbury 16.5 12.8 12.6 8.8 6.6 5.5 4.5 4.8
Stevenage 17.7 10.1 11.4 11.5 10.7 3.5 5.0 4.4
Suffolk Coastal 12.9 11.0 11.7 9.6 8.6 6.1 9.5 9.4
Tendring 10.4 5.5 5.1 4.7 1.0 5.6 3.6 5.8
Three Rivers 7.2 4.4 4.3 3.6 3.9 4.7 5.3 9.9
Thurrock 19.5 13.3 13.6 9.9 6.7 29.7 19.2 19.8
Uttlesford 4.2 8.9 8.0 5.6 4.2 3.9 6.4 7.0
Watford 23.5 10.6 10.7 3.2 6.2 21.9 16.0 24.0
Waveney -1.2 2.2 2.3 2.7 0.5 0.4 0.4 3.2
Welwyn Hatfield 17.0 9.7 7.1 13.1 13.6 19.6 22.7 17.0
Eastern 699.3 475.7 494.5 413.5 350.2 445.8 393.7 531.1
Source: Oxford Economics

EEFM Technical Report
January 2015
60
Table 6.8: Comparison of GVA growth per annum between EEFM updates, 2011-2031 (% pa) Aut 08
2011-31 (% pa)
Spr 09 2011-31
(% pa)
Aut 09 2011-31
(% pa)
Spr 10 2011-31
(% pa)
Aut 10 2011-31
(% pa)
EEFM 2012 2011-31
(% pa)
EEFM 2013 2011-31
(% pa)
EEFM 2014 2011-31
(% pa)
Babergh 2.9 2.8 2.7 2.9 3.0 2.7 2.3 2.3
Basildon 2.8 3.0 2.9 2.2 2.2 1.9 2.4 2.7
Bedford 2.5 2.5 2.3 2.2 2.0 2.4 2.1 2.2
Braintree 2.5 2.6 2.4 2.0 2.0 2.4 2.6 2.5
Breckland 2.6 2.9 2.4 2.2 2.2 2.2 2.3 2.2
Brentwood 3.3 3.1 2.6 2.1 2.2 2.4 2.9 3.1
Broadland 2.7 2.8 2.8 2.6 2.6 2.8 2.1 1.8
Broxbourne 2.7 2.8 2.5 2.1 2.2 2.4 2.6 2.6
Cambridge 3.9 4.6 3.6 3.3 3.2 2.8 2.9 2.9
Castle Point 2.7 2.7 2.4 1.8 1.9 2.0 1.8 2.5
Chelmsford 2.9 3.2 3.0 2.3 2.3 3.2 2.9 2.3
Colchester 2.8 2.7 2.5 2.3 2.2 2.7 2.7 2.0
Dacorum 3.0 3.0 2.6 2.5 2.5 2.7 2.6 2.2
East Cambridgeshire 3.4 3.4 3.3 2.8 3.1 3.0 3.1 2.5
East Hertfordshire 2.5 2.8 2.5 2.4 2.4 2.6 2.7 2.2
Epping Forest 2.2 2.5 2.3 1.9 2.0 2.7 2.7 2.5
Fenland 2.5 2.8 2.5 2.5 2.4 2.5 2.9 2.5
Forest Heath 2.8 2.8 2.3 2.3 2.3 2.5 2.6 2.2
Great Yarmouth 2.5 2.6 2.2 1.8 1.7 2.1 2.1 2.3
Harlow 3.0 2.6 2.4 1.9 1.7 2.2 2.3 2.4
Hertsmere 4.0 3.7 3.5 3.2 3.3 2.7 2.5 2.7
Huntingdonshire 2.7 2.7 2.5 2.0 2.0 2.2 2.2 2.2
Ipswich 2.8 2.9 2.8 2.3 2.1 2.6 2.6 2.3
King's Lynn and West Norfolk 2.0 2.3 2.7 2.8 2.7 2.0 2.0 2.1
Luton 2.4 2.5 2.4 2.9 2.8 2.7 2.3 1.7
Maldon 2.6 2.9 2.5 2.1 2.2 2.7 2.4 2.5
Mid Bedfordshire 2.9 3.2 2.8 2.7 2.7 2.8 2.4 2.5
Mid Suffolk 2.0 1.9 2.9 2.8 2.9 2.3 2.2 1.9
North Hertfordshire 3.5 3.1 2.5 2.3 2.4 2.5 2.3 2.3
North Norfolk 1.8 1.9 1.8 1.9 1.9 2.1 2.2 1.6
Norwich 2.5 2.9 2.8 2.5 2.4 2.7 2.8 2.3
Peterborough 2.2 2.9 2.8 2.4 2.2 2.7 2.5 3.1
Rochford 2.4 2.9 2.5 2.0 2.1 2.4 2.0 2.4
South Bedfordshire 3.2 2.6 2.3 2.0 2.0 2.4 2.8 3.3
South Cambridgeshire 3.4 3.6 3.4 3.5 3.5 3.2 3.0 2.9
South Norfolk 3.2 3.2 3.1 2.9 2.8 2.5 2.9 2.7
Southend-on-Sea 2.7 2.8 2.5 2.2 2.0 2.0 2.3 2.4
St Albans 3.4 3.6 3.1 3.0 2.9 2.9 3.1 2.6
St Edmundsbury 2.7 2.8 2.6 2.4 2.3 2.3 2.3 1.8
Stevenage 3.6 3.7 3.4 3.0 2.9 2.2 2.6 2.1
Suffolk Coastal 2.7 2.5 2.4 2.4 2.4 2.4 2.5 2.3
Tendring 2.6 2.4 2.1 1.9 1.9 2.2 2.1 2.1
Three Rivers 2.7 3.0 2.7 2.3 2.4 2.6 2.5 2.3
Thurrock 2.9 3.0 2.7 2.3 2.3 3.9 3.1 2.9
Uttlesford 2.3 3.2 2.8 2.4 2.4 2.3 2.5 2.4
Watford 3.4 3.1 2.8 2.2 2.4 3.3 3.1 3.4
Waveney 1.8 2.3 2.0 2.0 2.0 1.9 1.8 1.7
Welwyn Hatfield 2.9 2.9 2.4 2.7 2.8 3.0 3.1 2.3
Eastern 2.8 3.0 2.7 2.5 2.5 2.6 2.6 2.4
Source: Oxford Economics
EEFM Technical Report
January 2015
61
7: Employment land use methodology This chapter outlines our methodology for calculating employment land use forecasts under the 2014 update
of the East of England Forecasting Model (EEFM).
Key outputs
The summary outputs under the employment land module for EEFM 2014 for the East of England and each
district include:
Industrial floorspace (B1c/B2), thousands m²
Warehouse floorspace (B8), thousands m²
Office floorspace (B1a/b), thousands m²
Detailed outputs including the variables above split by sector are available on the website.
Measure of employment
The employment forecasts used in the calculation to estimate employment land requirements are:
Jobs-based
Workplace-based
Full-time equivalents (estimated as the number of full-time employed, plus 75% of the
number of part-time employed)
Employment densities
The employment densities used within the EEFM are based on the Employment Densities Guide, published
in 20101, which provides guidelines on employment densities by use class. The guide presents densities on
a range of different floorspace measures: gross external area (GEA), gross internal area (GIA) or net internal
area (NIA). Therefore, it has been necessary to convert all employment densities to the same measure –
GIA.
1 Employment Densities Guide, Homes & Communities Agency, 2010
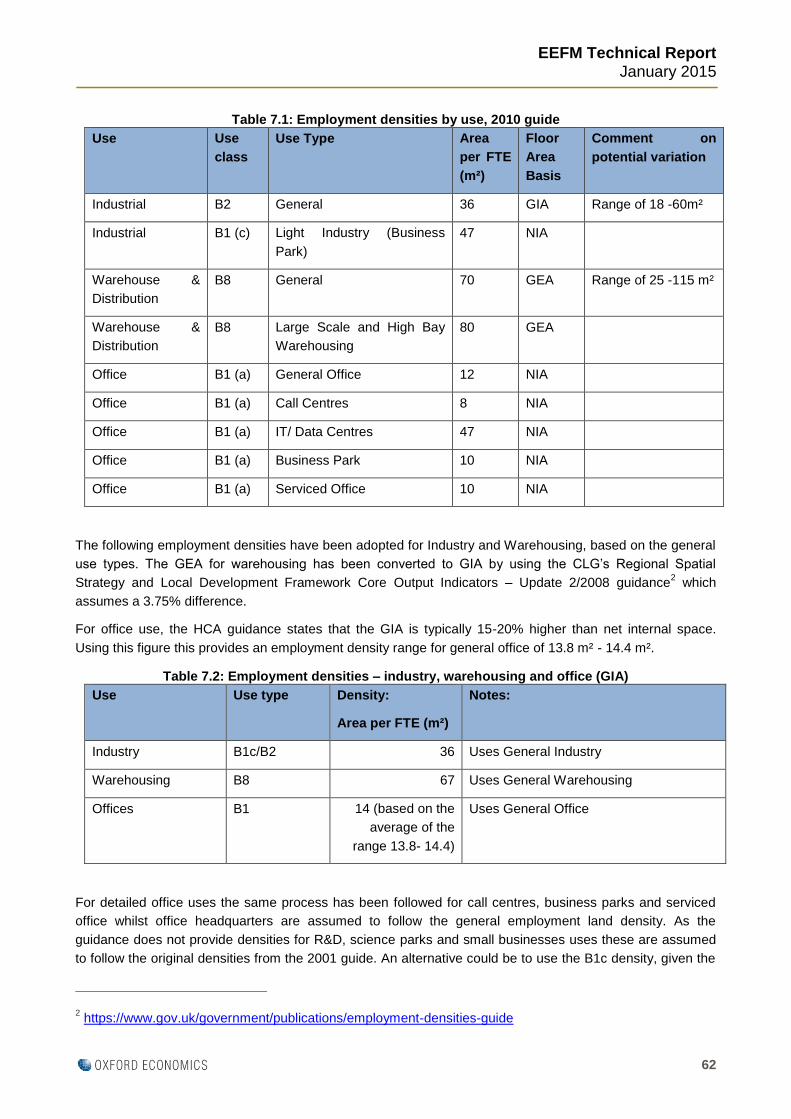
EEFM Technical Report
January 2015
62
Table 7.1: Employment densities by use, 2010 guide
Use Use
class
Use Type Area
per FTE
(m²)
Floor
Area
Basis
Comment on
potential variation
Industrial B2 General 36 GIA Range of 18 -60m²
Industrial B1 (c) Light Industry (Business
Park)
47 NIA
Warehouse &
Distribution
B8 General 70 GEA Range of 25 -115 m²
Warehouse &
Distribution
B8 Large Scale and High Bay
Warehousing
80 GEA
Office B1 (a) General Office 12 NIA
Office B1 (a) Call Centres 8 NIA
Office B1 (a) IT/ Data Centres 47 NIA
Office B1 (a) Business Park 10 NIA
Office B1 (a) Serviced Office 10 NIA
The following employment densities have been adopted for Industry and Warehousing, based on the general
use types. The GEA for warehousing has been converted to GIA by using the CLG’s Regional Spatial
Strategy and Local Development Framework Core Output Indicators – Update 2/2008 guidance2 which
assumes a 3.75% difference.
For office use, the HCA guidance states that the GIA is typically 15-20% higher than net internal space.
Using this figure this provides an employment density range for general office of 13.8 m² - 14.4 m².
Table 7.2: Employment densities – industry, warehousing and office (GIA)
Use Use type Density:
Area per FTE (m²)
Notes:
Industry B1c/B2 36 Uses General Industry
Warehousing B8 67 Uses General Warehousing
Offices B1 14 (based on the
average of the
range 13.8- 14.4)
Uses General Office
For detailed office uses the same process has been followed for call centres, business parks and serviced
office whilst office headquarters are assumed to follow the general employment land density. As the
guidance does not provide densities for R&D, science parks and small businesses uses these are assumed
to follow the original densities from the 2001 guide. An alternative could be to use the B1c density, given the
2 https://www.gov.uk/government/publications/employment-densities-guide
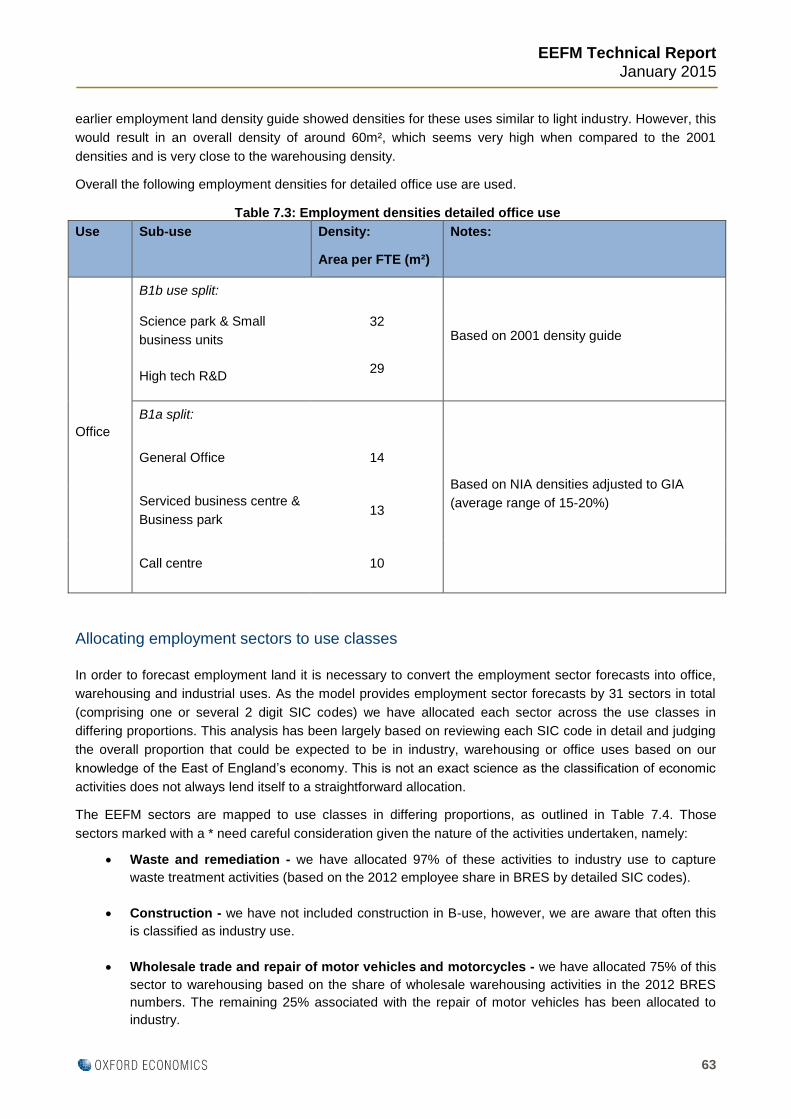
EEFM Technical Report
January 2015
63
earlier employment land density guide showed densities for these uses similar to light industry. However, this
would result in an overall density of around 60m², which seems very high when compared to the 2001
densities and is very close to the warehousing density.
Overall the following employment densities for detailed office use are used.
Table 7.3: Employment densities detailed office use
Use Sub-use Density:
Area per FTE (m²)
Notes:
Office
B1b use split:
Based on 2001 density guide Science park & Small
business units
32
High tech R&D 29
B1a split:
Based on NIA densities adjusted to GIA
(average range of 15-20%)
General Office 14
Serviced business centre &
Business park 13
Call centre 10
Allocating employment sectors to use classes
In order to forecast employment land it is necessary to convert the employment sector forecasts into office,
warehousing and industrial uses. As the model provides employment sector forecasts by 31 sectors in total
(comprising one or several 2 digit SIC codes) we have allocated each sector across the use classes in
differing proportions. This analysis has been largely based on reviewing each SIC code in detail and judging
the overall proportion that could be expected to be in industry, warehousing or office uses based on our
knowledge of the East of England’s economy. This is not an exact science as the classification of economic
activities does not always lend itself to a straightforward allocation.
The EEFM sectors are mapped to use classes in differing proportions, as outlined in Table 7.4. Those
sectors marked with a * need careful consideration given the nature of the activities undertaken, namely:
Waste and remediation - we have allocated 97% of these activities to industry use to capture
waste treatment activities (based on the 2012 employee share in BRES by detailed SIC codes).
Construction - we have not included construction in B-use, however, we are aware that often this
is classified as industry use.
Wholesale trade and repair of motor vehicles and motorcycles - we have allocated 75% of this
sector to warehousing based on the share of wholesale warehousing activities in the 2012 BRES
numbers. The remaining 25% associated with the repair of motor vehicles has been allocated to
industry.

EEFM Technical Report
January 2015
64
Land transport - we have allocated 39% of this sector to warehousing based on the share of
warehousing and support activities for transportation in the 2012 employee BRES numbers.
Professional services - we have allocated 96% of this sector to offices. We have excluded
veterinary activities based on the share of employees in the 2012 BRES numbers.
Business services - we have allocated 93% of this sector to offices. We have excluded travel
agency, tour operator and other reservation services based on the share of employees in the 2012
BRES numbers.
Employment activities - given that this sector includes temporary workers that may work in any
industry we have allocated employment based on the weighted shares of all the other sectors’
allocations to industry, warehousing and offices.
Publishing & broadcasting activities - we have allocated all publishing activity to industry. For
motion picture, video and television programme production, sound recording and music publishing
activities which captures the production side of film and TV we have assigned 80% to warehousing
given the large scale production sets often required and 20% to office use. For programming and
broadcasting activities which incorporates broadcasting activities which are most likely to be studio
based we have assigned 80% of these activities to office use and 20% to warehousing use. The
proportions are then scaled depending on the relative employment shares in the 2012 BRES data.
Telecoms - we have allocated 80% of telecoms to warehousing and the remaining 20% to offices.
Public administration - we have allocated 61% of this sector to offices to take account of the
share of general public administration activities; regulation of the activities of providing health care,
education, cultural services and other social services, excluding social security; regulation of and
contribution to more efficient operation of businesses; and foreign affairs. We have excluded
defence activities; justice and judicial activities; public order and safety activities; fire service
activities; and compulsory social security activities. The shares are based on the 2012 BRES data.
We would appreciate feedback on these sectors or any others, bearing in mind that a simple calculation is
applied across the East of England. Densities and allocations are static across the decades in the
spreadsheets, as we have made no assumptions about the impacts of changing working practices. We have
applied assumptions across the whole region, rather than reflecting any local circumstances. An interactive
version of the spreadsheets is available so that users can apply their own assumptions to reflect any specific
local circumstances. Please see the Cambridgeshire Insight website for more information.
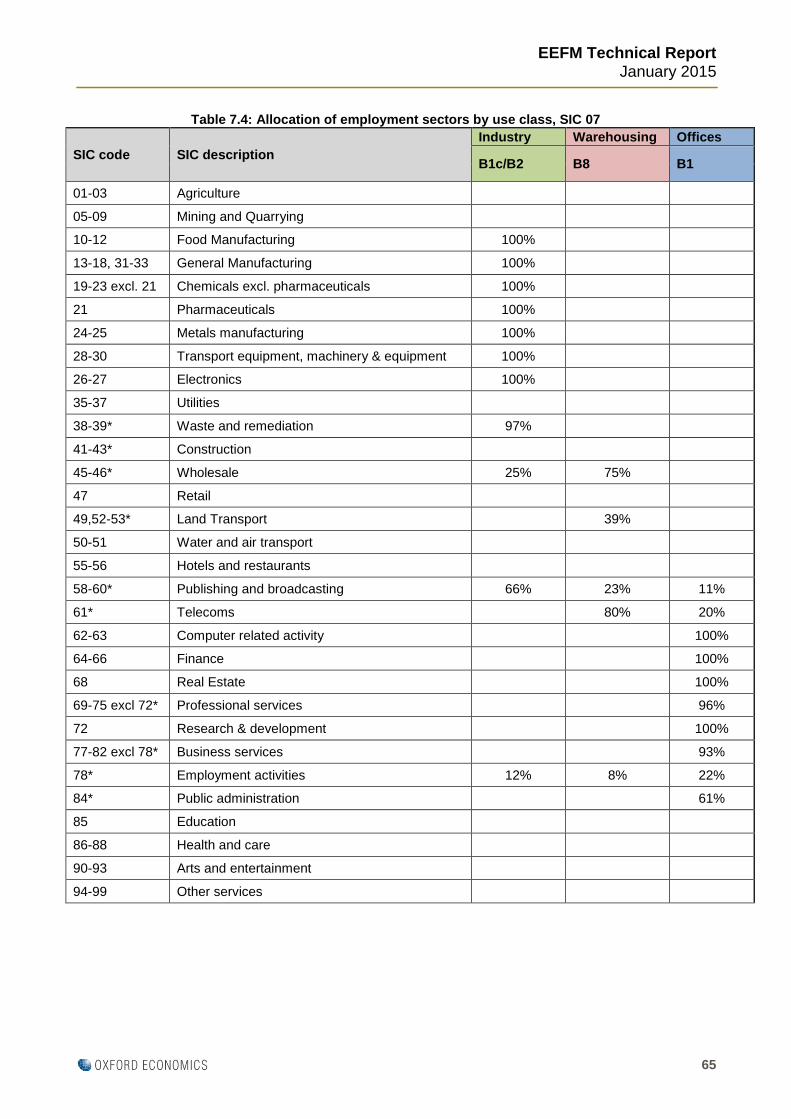
EEFM Technical Report
January 2015
65
Table 7.4: Allocation of employment sectors by use class, SIC 07
SIC code SIC description
Industry Warehousing Offices
B1c/B2 B8 B1
01-03 Agriculture
05-09 Mining and Quarrying
10-12 Food Manufacturing 100%
13-18, 31-33 General Manufacturing 100%
19-23 excl. 21 Chemicals excl. pharmaceuticals 100%
21 Pharmaceuticals 100%
24-25 Metals manufacturing 100%
28-30 Transport equipment, machinery & equipment 100%
26-27 Electronics 100%
35-37 Utilities
38-39* Waste and remediation 97%
41-43* Construction
45-46* Wholesale 25% 75%
47 Retail
49,52-53* Land Transport 39%
50-51 Water and air transport
55-56 Hotels and restaurants
58-60* Publishing and broadcasting 66% 23% 11%
61* Telecoms 80% 20%
62-63 Computer related activity 100%
64-66 Finance 100%
68 Real Estate 100%
69-75 excl 72* Professional services 96%
72 Research & development 100%
77-82 excl 78* Business services 93%
78* Employment activities 12% 8% 22%
84* Public administration 61%
85 Education
86-88 Health and care
90-93 Arts and entertainment
94-99 Other services
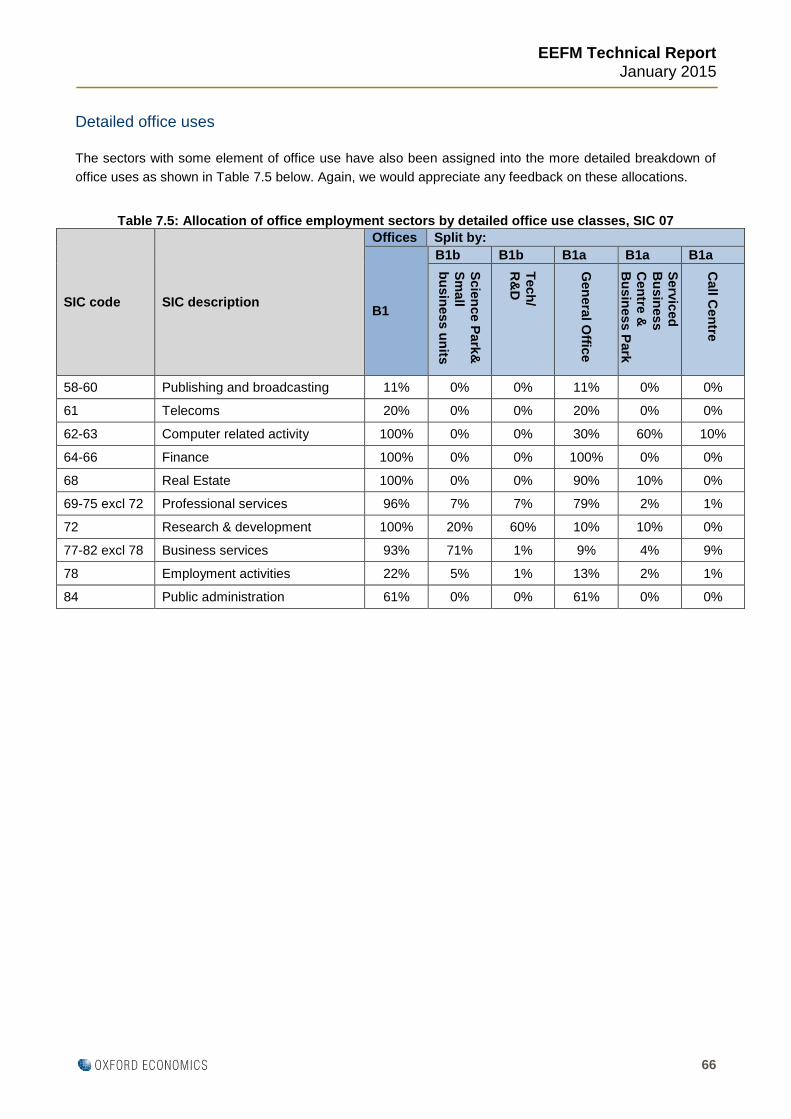
EEFM Technical Report
January 2015
66
Detailed office uses
The sectors with some element of office use have also been assigned into the more detailed breakdown of
office uses as shown in Table 7.5 below. Again, we would appreciate any feedback on these allocations.
Table 7.5: Allocation of office employment sectors by detailed office use classes, SIC 07
SIC code SIC description
Offices Split by:
B1
B1b B1b B1a B1a B1a
Scie
nce P
ark
&
Sm
all
bu
sin
ess u
nits
Tech
/
R&
D
Gen
era
l Offic
e
Serv
iced
B
usin
es
s
Cen
tre &
B
usin
es
s P
ark
Call C
en
tre
58-60 Publishing and broadcasting 11% 0% 0% 11% 0% 0%
61 Telecoms 20% 0% 0% 20% 0% 0%
62-63 Computer related activity 100% 0% 0% 30% 60% 10%
64-66 Finance 100% 0% 0% 100% 0% 0%
68 Real Estate 100% 0% 0% 90% 10% 0%
69-75 excl 72 Professional services 96% 7% 7% 79% 2% 1%
72 Research & development 100% 20% 60% 10% 10% 0%
77-82 excl 78 Business services 93% 71% 1% 9% 4% 9%
78 Employment activities 22% 5% 1% 13% 2% 1%
84 Public administration 61% 0% 0% 61% 0% 0%

EEFM Technical Report
January 2015
67
OXFORD
Abbey House, 121 St Aldates
Oxford, OX1 1HB, UK
Tel: +44 1865 268900
LONDON
Broadwall House,
21 Broadwall
London, SE1 9PL, UK
Tel: +44 207 803 1400
BELFAST
Lagan House, Sackville Street
Lisburn, BT27 4AB, UK
Tel: +44 28 9266 0669
NEW YORK
817 Broadway, 10th Floor
New York, NY 10003, USA
Tel: +1 646 786 1863
PHILADELPHIA
303 Lancaster Avenue, Suite
1b
Wayne PA 19087, USA
Tel: +1 610 995 9600
SINGAPORE
No.1 North Bridge Road
High Street Centre #22-07
Singapore 179094
Tel: +65 6338 1235
PARIS
9 rue Huysmans
75006 Paris, France
Tel: + 33 6 79 900 846
email:
www.oxfordeconomics.com

F ful
Our main subscription website:
http://economics.experian.co.uk/
Our latest views:
http://www.experian.co.uk/economics/latest-views-weekly-topic-of-focus.html
Data Guide UK Regional Planning Service September 2015
Data Guide UK Regional Planning Service September 2015
Contents
______________________________________________________________________
Executive summary ....................................................................................................... 1
1 Variable Coverage ............................................................................................... 2
2 Historical End-points .......................................................................................... 3
3 Methodology ........................................................................................................ 5 3.1 UK Methodology .................................................................................................... 5 3.2 Regional methodology .......................................................................................... 6 3.3 Local methodology .............................................................................................. 10
4 Key changes since June 2015 RPS ................................................................. 13 4.1 UK forecast ......................................................................................................... 13 4.2 Regional Forecast ............................................................................................... 14 4.3 Local Forecast ..................................................................................................... 15
5 A note from the ONS on volatility .................................................................... 17
Appendix A….Glossary of terms ............................................................................... 18
Appendix B…Sector definitions ................................................................................. 21
Appendix C…Geography definitions ......................................................................... 25
Appendix D…FAQ’s .................................................................................................... 26
Appendix E…Activity Rates & the Ageing Population ............................................. 29
Appendix F…About us ................................................................................................ 33

© Experian Plc 2015 1
Executive summary
This document outlines the current variable coverage in the September 2015 version of the UK
Regional Planning Service, and the methodology behind the history and forecast.
Appendix A includes a glossary of terms.
Appendix B includes our definitions of the sectors.
Appendix C has the geography definitions.
Appendix D contains the most common Frequently Asked Questions
_____________________________________________________________________
This output is based on and comprises both your input and information sourced from third parties (which may include public data sources). Whilst
we will use all reasonable care and skill in the collection and collation of this output we cannot warrant or guarantee the accuracy of the output. You
acknowledge that outputs which use empirical data and/or statistical data and/or data modelling techniques cannot be taken as a guarantee of any
particular outcome and are not intended to be the sole basis of your business decisions. Our standard terms of business apply.
Contact us
Stephen Adams
Managing Economist
T 44 (0) 207 746 8219
Rebecca Snow
Managing Economist
T 44 (0) 7966 874 720
Peter Gutmann
Managing Economist
T 44 (0) 207 746 8250
Thomas Crowdy
Senior Economist
T 44 (0) 207 746 8250
Sunil Joshi
Managing Economist
T 44 (0) 207 746 8230
Jon Rawson
Business Development Director
T 44 (0) 7811 270 989
Experian
Cardinal Place
6th Floor
80 Victoria Street
London SW1E 5JL
www.experian.co.uk/economics
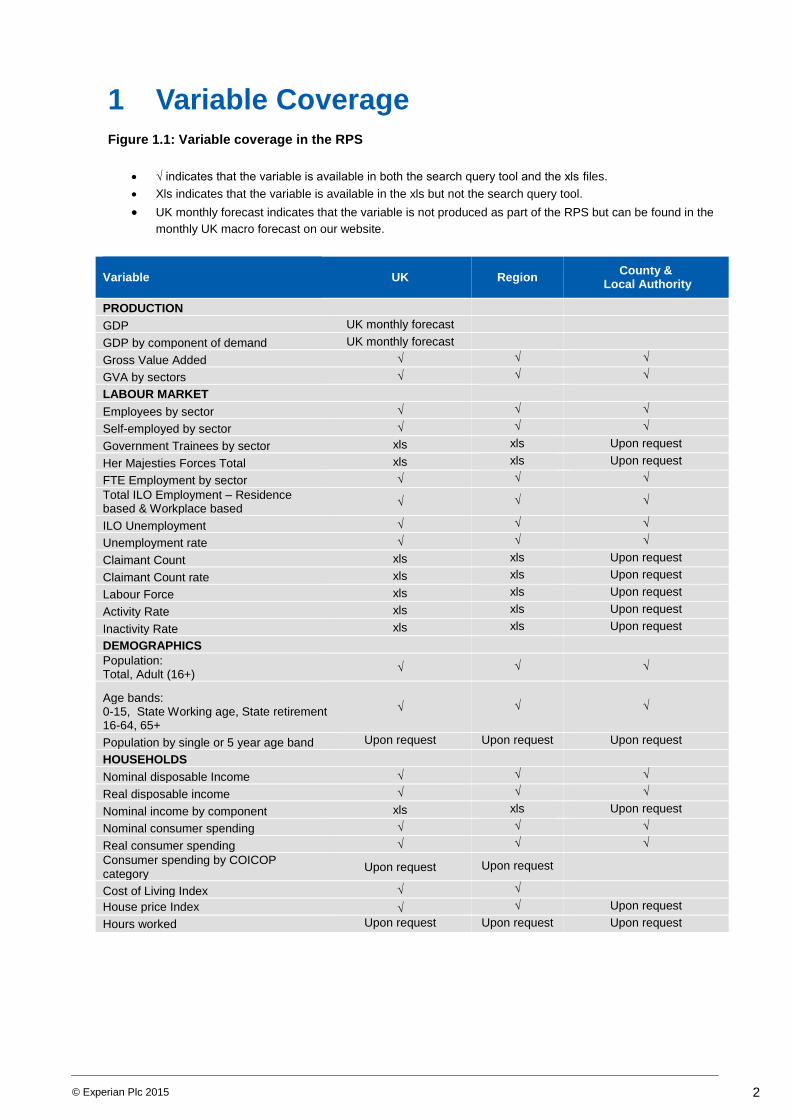
© Experian Plc 2015 2
1 Variable Coverage
Figure 1.1: Variable coverage in the RPS
√ indicates that the variable is available in both the search query tool and the xls files.
Xls indicates that the variable is available in the xls but not the search query tool.
UK monthly forecast indicates that the variable is not produced as part of the RPS but can be found in the
monthly UK macro forecast on our website.
Variable
UK Region County &
Local Authority
PRODUCTION
GDP UK monthly forecast
GDP by component of demand UK monthly forecast
Gross Value Added √ √ √
GVA by sectors √ √ √
LABOUR MARKET
Employees by sector √ √ √
Self-employed by sector √ √ √
Government Trainees by sector xls xls Upon request
Her Majesties Forces Total xls xls Upon request
FTE Employment by sector √ √ √
Total ILO Employment – Residence based & Workplace based
√ √ √
ILO Unemployment √ √ √
Unemployment rate √ √ √
Claimant Count xls xls Upon request
Claimant Count rate xls xls Upon request
Labour Force xls xls Upon request
Activity Rate xls xls Upon request
Inactivity Rate xls xls Upon request
DEMOGRAPHICS
Population: Total, Adult (16+)
√ √ √
Age bands: 0-15, State Working age, State retirement 16-64, 65+
√ √ √
Population by single or 5 year age band Upon request Upon request Upon request
HOUSEHOLDS
Nominal disposable Income √ √ √
Real disposable income √ √ √
Nominal income by component xls xls Upon request
Nominal consumer spending √ √ √
Real consumer spending √ √ √
Consumer spending by COICOP category
Upon request Upon request
Cost of Living Index √ √
House price Index √ √ Upon request
Hours worked Upon request Upon request Upon request
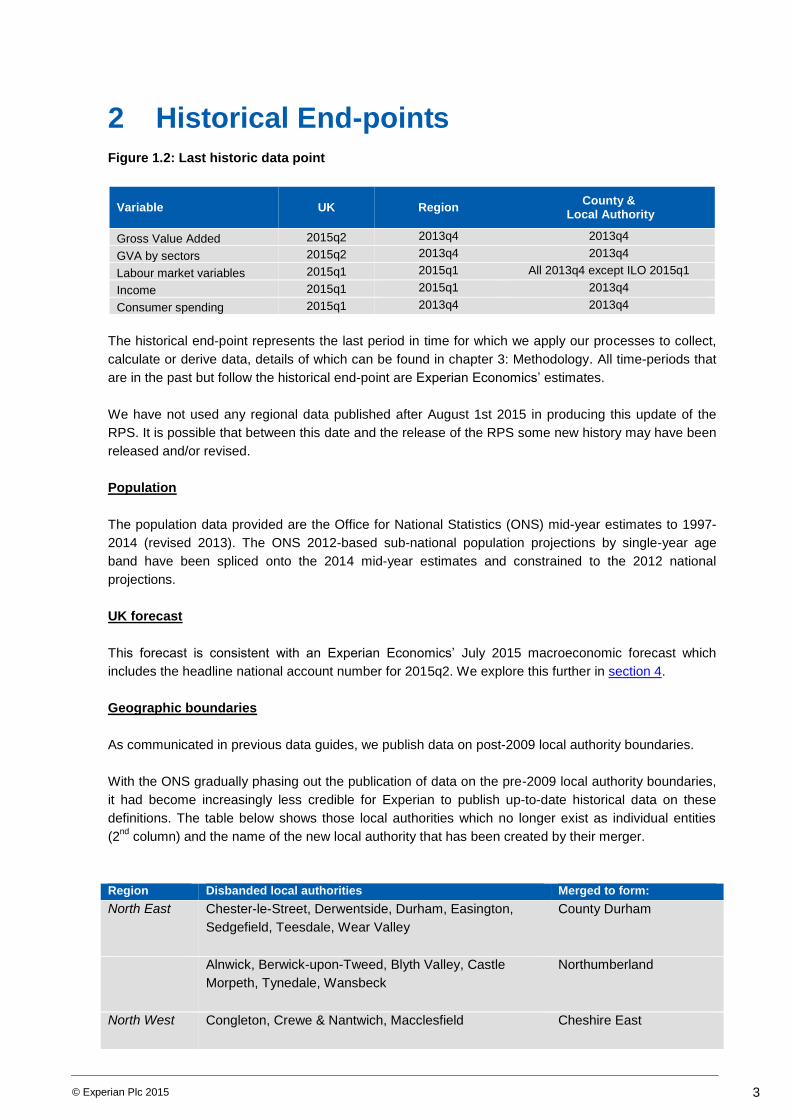
© Experian Plc 2015 3
2 Historical End-points
Figure 1.2: Last historic data point
Variable
UK Region County &
Local Authority
Gross Value Added 2015q2 2013q4 2013q4
GVA by sectors 2015q2 2013q4 2013q4
Labour market variables 2015q1 2015q1 All 2013q4 except ILO 2015q1
Income 2015q1 2015q1 2013q4
Consumer spending 2015q1 2013q4 2013q4
The historical end-point represents the last period in time for which we apply our processes to collect,
calculate or derive data, details of which can be found in chapter 3: Methodology. All time-periods that
are in the past but follow the historical end-point are Experian Economics’ estimates.
We have not used any regional data published after August 1st 2015 in producing this update of the
RPS. It is possible that between this date and the release of the RPS some new history may have been
released and/or revised.
Population
The population data provided are the Office for National Statistics (ONS) mid-year estimates to 1997-
2014 (revised 2013). The ONS 2012-based sub-national population projections by single-year age
band have been spliced onto the 2014 mid-year estimates and constrained to the 2012 national
projections.
UK forecast
This forecast is consistent with an Experian Economics’ July 2015 macroeconomic forecast which
includes the headline national account number for 2015q2. We explore this further in section 4.
Geographic boundaries
As communicated in previous data guides, we publish data on post-2009 local authority boundaries.
With the ONS gradually phasing out the publication of data on the pre-2009 local authority boundaries,
it had become increasingly less credible for Experian to publish up-to-date historical data on these
definitions. The table below shows those local authorities which no longer exist as individual entities
(2nd
column) and the name of the new local authority that has been created by their merger.
Region Disbanded local authorities Merged to form:
North East
Chester-le-Street, Derwentside, Durham, Easington,
Sedgefield, Teesdale, Wear Valley
County Durham
Alnwick, Berwick-upon-Tweed, Blyth Valley, Castle
Morpeth, Tynedale, Wansbeck
Northumberland
North West
Congleton, Crewe & Nantwich, Macclesfield
Cheshire East

© Experian Plc 2015 4
Chester, Ellesmere Port & Neston, Vale Royal
Cheshire West & Chester
West
Midlands
Bridgnorth, North Shropshire, Oswestry, Shrewsbury &
Atcham, South Shropshire
Shropshire
East of
England:
Mid Bedfordshire, South Bedfordshire
Central Bedfordshire
South West Caradon, Carrick, Kerrier North Cornwall, Penwith,
Restormel
Cornwall
Kennet, North Wiltshire, Salisbury, West Wiltshire Wiltshire
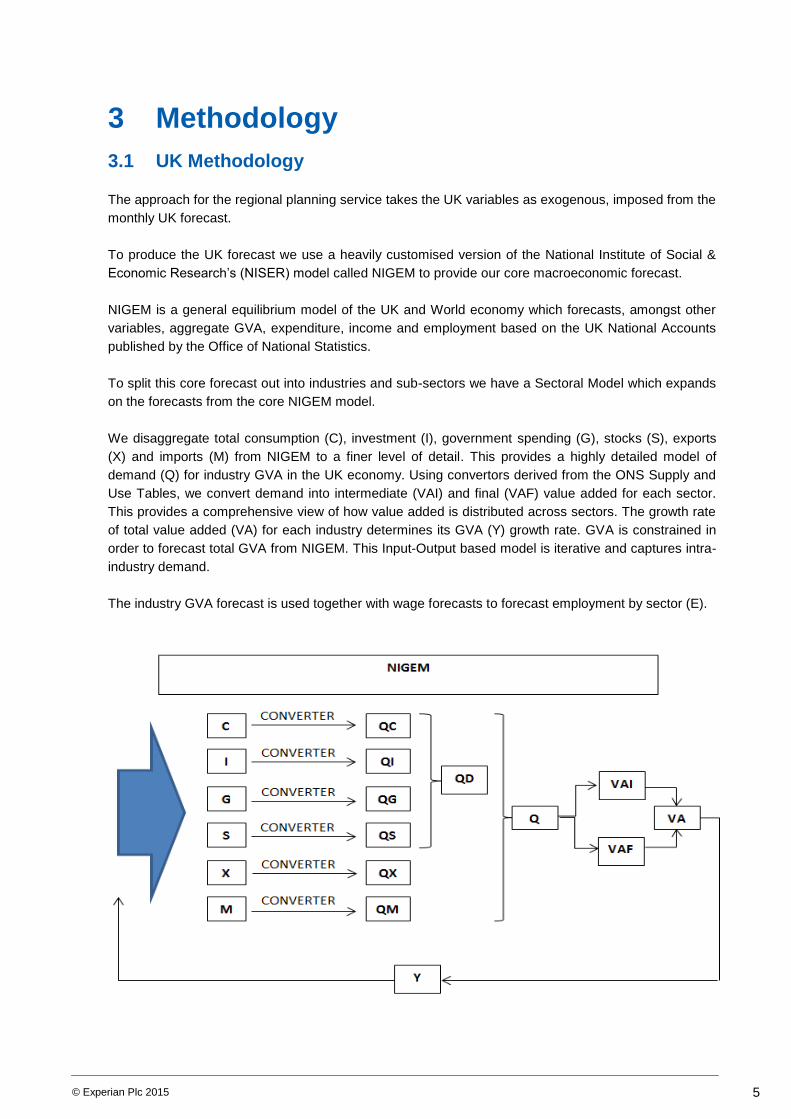
© Experian Plc 2015 5
3 Methodology
3.1 UK Methodology
The approach for the regional planning service takes the UK variables as exogenous, imposed from the
monthly UK forecast.
To produce the UK forecast we use a heavily customised version of the National Institute of Social &
Economic Research’s (NISER) model called NIGEM to provide our core macroeconomic forecast.
NIGEM is a general equilibrium model of the UK and World economy which forecasts, amongst other
variables, aggregate GVA, expenditure, income and employment based on the UK National Accounts
published by the Office of National Statistics.
To split this core forecast out into industries and sub-sectors we have a Sectoral Model which expands
on the forecasts from the core NIGEM model.
We disaggregate total consumption (C), investment (I), government spending (G), stocks (S), exports
(X) and imports (M) from NIGEM to a finer level of detail. This provides a highly detailed model of
demand (Q) for industry GVA in the UK economy. Using convertors derived from the ONS Supply and
Use Tables, we convert demand into intermediate (VAI) and final (VAF) value added for each sector.
This provides a comprehensive view of how value added is distributed across sectors. The growth rate
of total value added (VA) for each industry determines its GVA (Y) growth rate. GVA is constrained in
order to forecast total GVA from NIGEM. This Input-Output based model is iterative and captures intra-
industry demand.
The industry GVA forecast is used together with wage forecasts to forecast employment by sector (E).
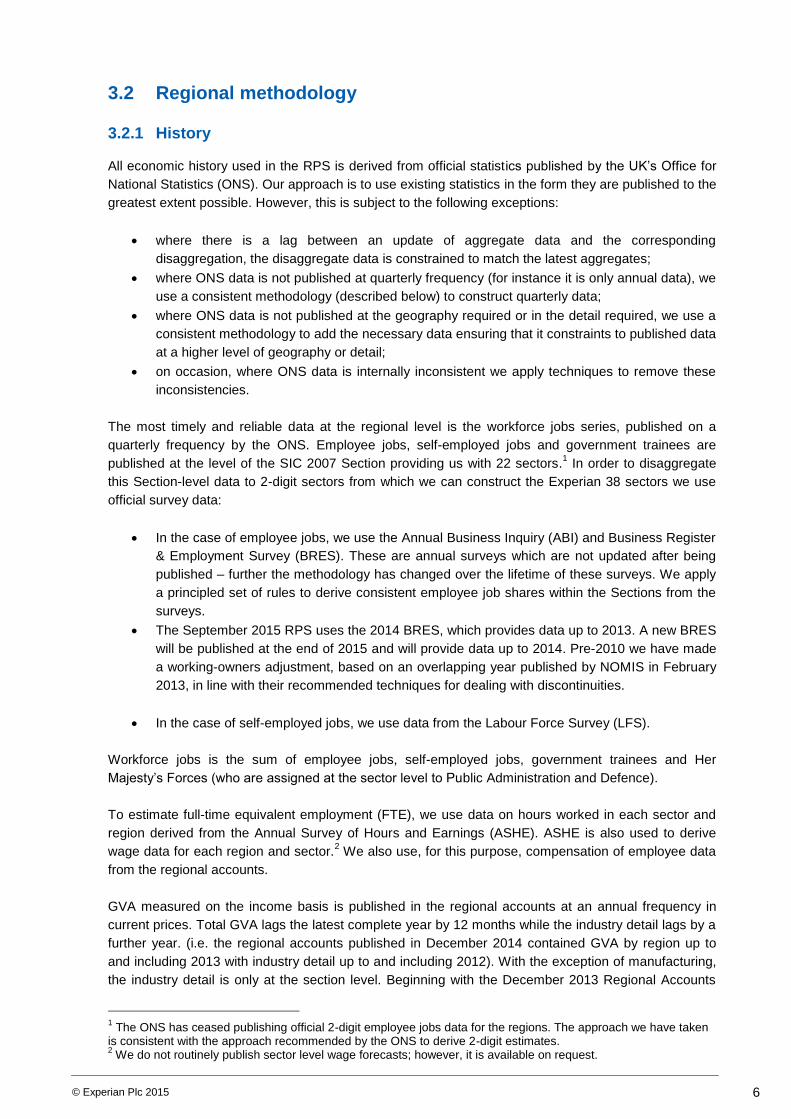
© Experian Plc 2015 6
3.2 Regional methodology
3.2.1 History
All economic history used in the RPS is derived from official statistics published by the UK’s Office for
National Statistics (ONS). Our approach is to use existing statistics in the form they are published to the
greatest extent possible. However, this is subject to the following exceptions:
where there is a lag between an update of aggregate data and the corresponding
disaggregation, the disaggregate data is constrained to match the latest aggregates;
where ONS data is not published at quarterly frequency (for instance it is only annual data), we
use a consistent methodology (described below) to construct quarterly data;
where ONS data is not published at the geography required or in the detail required, we use a
consistent methodology to add the necessary data ensuring that it constraints to published data
at a higher level of geography or detail;
on occasion, where ONS data is internally inconsistent we apply techniques to remove these
inconsistencies.
The most timely and reliable data at the regional level is the workforce jobs series, published on a
quarterly frequency by the ONS. Employee jobs, self-employed jobs and government trainees are
published at the level of the SIC 2007 Section providing us with 22 sectors.1 In order to disaggregate
this Section-level data to 2-digit sectors from which we can construct the Experian 38 sectors we use
official survey data:
In the case of employee jobs, we use the Annual Business Inquiry (ABI) and Business Register
& Employment Survey (BRES). These are annual surveys which are not updated after being
published – further the methodology has changed over the lifetime of these surveys. We apply
a principled set of rules to derive consistent employee job shares within the Sections from the
surveys.
The September 2015 RPS uses the 2014 BRES, which provides data up to 2013. A new BRES
will be published at the end of 2015 and will provide data up to 2014. Pre-2010 we have made
a working-owners adjustment, based on an overlapping year published by NOMIS in February
2013, in line with their recommended techniques for dealing with discontinuities.
In the case of self-employed jobs, we use data from the Labour Force Survey (LFS).
Workforce jobs is the sum of employee jobs, self-employed jobs, government trainees and Her
Majesty’s Forces (who are assigned at the sector level to Public Administration and Defence).
To estimate full-time equivalent employment (FTE), we use data on hours worked in each sector and
region derived from the Annual Survey of Hours and Earnings (ASHE). ASHE is also used to derive
wage data for each region and sector.2 We also use, for this purpose, compensation of employee data
from the regional accounts.
GVA measured on the income basis is published in the regional accounts at an annual frequency in
current prices. Total GVA lags the latest complete year by 12 months while the industry detail lags by a
further year. (i.e. the regional accounts published in December 2014 contained GVA by region up to
and including 2013 with industry detail up to and including 2012). With the exception of manufacturing,
the industry detail is only at the section level. Beginning with the December 2013 Regional Accounts
1 The ONS has ceased publishing official 2-digit employee jobs data for the regions. The approach we have taken
is consistent with the approach recommended by the ONS to derive 2-digit estimates. 2 We do not routinely publish sector level wage forecasts; however, it is available on request.

© Experian Plc 2015 7
(which were first incorporated in the March 2014 RPS), manufacturing GVA is available at the sub-
section level. To construct the Chain Volume Measure data we follow these steps:
the data is disaggregated and made quarterly using workforce jobs data;
the data is deflated at the industry level using the UK deflators for the industries;
the data is aggregated to produce a regional total – this implicitly creates a regional deflator by
taking into account the different weightings of industries within a region.
In the Regional Accounts, the ONS has published experimental alternate GVA accounts on the
production basis; these accounts include an estimate of chain volume measure (CVM) GVA for the
regions. We have not incorporated these data for the reasons given in the FAQs (Appendix D.)
Income is published in the regional accounts on an annual basis with a full breakdown of income
sources and deductions. Income sources are:
compensation of employees : wages and salaries plus employers social contributions
self-employment income
Net Property Income : made up of property income received less income paid
transfers from the State (i.e. benefits and pensions)
other Transfers
Income deductions are:
taxes
social contributions
transfers to others
The sum of income sources less income deductions constitutes disposable income. To convert this
annual data to quarterly jobs we use (depending on the component) employee jobs, self-employee jobs
or the UK quarterly pattern. We constrain these quarterly series to the official UK published data. Real
disposable income is obtained by deflating disposable income by the consumer price deflator.
Household spending is derived by sharing out UK nominal expenditure using regional shares of
expenditure reported in the Living Costs and Food Survey by type of expenditure. Nominal regional
spending is deflated by published UK deflators and then aggregated to produce a regional total. This
again implicitly creates a regional cost of living measure which we also publish.
Population projections are obtained from the ONS (2012 projections) and spliced onto the 2014 mid-
year estimates, constrained to the latest national 2012 projections. The revision back to 2002 due to
the 2011 census were taken into account in the December 2014 RPS. This September 2015 RPS
includes small revision to 2013 estimates, mainly due to the reallocation of Foreign Armed Forces as
well as the new 2014 mid-year estimates.
Our working-age definition incorporates all announced future changes in the state pension age:
The state pension age for women is rising from 60 to 65, equal with males. Both will then rise in
step to 67 in our current forecast period.
Female state retirement age started to increase from 60 in April 2012 and will reach 65 by
2018q4.
From April 2019, both men and women will see their state retirement age rise from 65 to 66,
with men reaching 66 by April 2020, and women a few months later in October 2020.
The move from 66 to 67 is scheduled from April 2026 until April 2028 for both men and women.
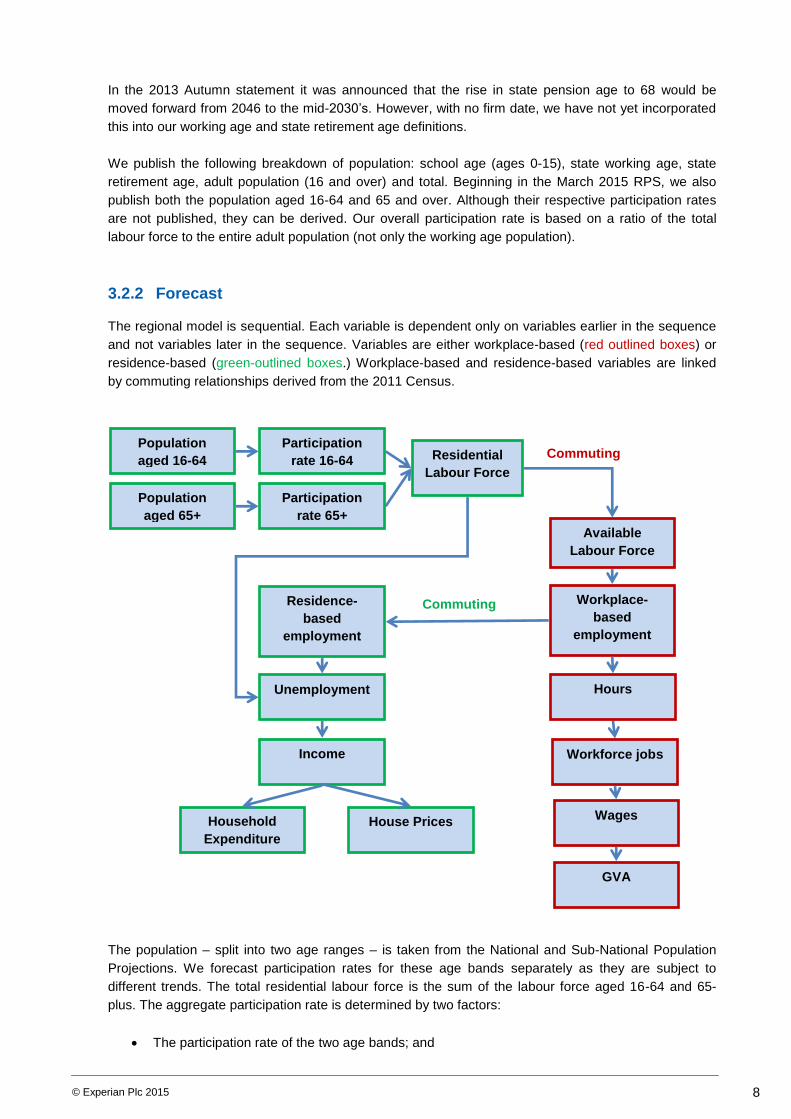
© Experian Plc 2015 8
In the 2013 Autumn statement it was announced that the rise in state pension age to 68 would be
moved forward from 2046 to the mid-2030’s. However, with no firm date, we have not yet incorporated
this into our working age and state retirement age definitions.
We publish the following breakdown of population: school age (ages 0-15), state working age, state
retirement age, adult population (16 and over) and total. Beginning in the March 2015 RPS, we also
publish both the population aged 16-64 and 65 and over. Although their respective participation rates
are not published, they can be derived. Our overall participation rate is based on a ratio of the total
labour force to the entire adult population (not only the working age population).
3.2.2 Forecast
The regional model is sequential. Each variable is dependent only on variables earlier in the sequence
and not variables later in the sequence. Variables are either workplace-based (red outlined boxes) or
residence-based (green-outlined boxes.) Workplace-based and residence-based variables are linked
by commuting relationships derived from the 2011 Census.
The population – split into two age ranges – is taken from the National and Sub-National Population
Projections. We forecast participation rates for these age bands separately as they are subject to
different trends. The total residential labour force is the sum of the labour force aged 16-64 and 65-
plus. The aggregate participation rate is determined by two factors:
The participation rate of the two age bands; and
Commuting
Participation
rate 16-64
Population
aged 16-64
Participation
rate 65+
Residential
Labour Force
Workplace-
based
employment
Hours
Workforce jobs
Wages
GVA
Residence-
based
employment
Income
Unemployment
Household
Expenditure
Population
aged 65+ Available
Labour Force
Commuting
House Prices

© Experian Plc 2015 9
The share of each of the two age bands in the adult population.
The participation rate for those aged 16-64 is expected to remain relatively stable throughout the
forecasting period. However, the rate for those aged 65 and over will grow strongly due to factors such
as increasing life expectancy and rising state pension ages.
At the UK level, the share of the adult population aged 65 and over is projected to rise sharply over the
next twenty years. There is, however, considerable variation at the regional level. Greater London – the
youngest region in the UK – is projected to have a stable share.
These factors combine to produce substantial variation in the labour force forecasts for different
regions.
Commuting flows are used to derive the available labour force for a region. This is:
Workers Resident in the Region – Workers Commuting Out + Workers Commuting In
In the case of Greater London, the South East and the East of England, these flows lead to a
substantial difference between the residential labour force and the available labour force. The effect is
still present but less pronounced in other regions.
The available labour force is one of the drivers in forecasting workplace-based employment. The other
drivers include the industry mix and the performance of industries at the UK level. If industries with a
high share in the region are performing well at the UK level, this will benefit the region.
The workplace-based employment is converted back into residence-based employment. This is:
Workplace-based Employment – Workers Living Elsewhere + Residents Working Elsewhere
From this point, residence and workplace based variables are solved in parallel with residence-based
variables dependent on residence-based employment and workplace-based variables dependent on
workplace-based employment.
The residential labour force and residence-based employment are used to calculate unemployment.
Residential income is driven by employment; and itself drives house price and household expenditure
forecasts.
Workplace-based employment drives aggregate hours worked, wages and GVA. These aggregate
variables feed into the detailed part of the model, which produces forecasts for each industry:
In each case, we forecast shares of the region within the UK industry. We then share out the UK
industry data subject to the constraint of the total that has already been determined and the UK total.
© Experian Plc 2015 10
3.3 Local methodology
3.3.1 History
As at the regional level, all local economic history used in the RPS is derived from official statistics
published by the ONS. Our approach to using this data is identical to that given above at 3.2.1.
However, data at the local level is more likely to be incomplete1 or inconsistent
2 than is the case at the
regional level. For this reason, there is greater call for the application of techniques to construct missing
data and to remove inconsistencies than is the case at the regional level.
In all cases, local area data in a particular region is constrained to match the regional total for the same
variable. This has two particular advantages:
Local data is made consistent with regional data of the same vintage.
Where local data has been estimated or constructed, the regional data ensure that the
estimates together are consistent with more reliable data.
The ONS do not publish a workforce jobs series at the local level. Accordingly, we construct workforce
jobs series for each local area using BRES/ABI in the same way that BRES is used at the regional level
to disaggregate section estimates. The BRES share for a particular industry of a local area in its parent
region is used to disaggregate the regional workforce jobs series for that industry. As BRES is a
survey, the figures over time for a particular local area industry combination can be volatile3. Further,
certain years’ results may be withheld to prevent disclosure of confidential data. Accordingly, to obtain
sensible data it is necessary for us to smooth out this volatility and to interpolate over the gaps.
At the local level, the most timely and comprehensive data are ILO data for residence and workplace-
based employment and unemployment data on both the ILO4 and claimant count basis. These data is
obtained directly from NOMIS.
Regional accounts data is provided at sub-regional level for both GVA and income as it is at the
regional level. The same methods are used at the local level as at the regional level to process these
data. However, sub-regional data is only published for NUTS2 and NUTS3. Since not all local
authorities constitute a NUTS3, it is necessary to disaggregate these data to local level. Further, the
data provided at NUTS3 are less comprehensive than those provided at NUTS25. We make use of this
NUTS2 data by constraining our disaggregated NUTS3 estimates to their parent NUTS2. We then
disaggregate these constrained NUTS3 data to local data3.
In the case of GVA, the data provided at NUTS2 is at the section level with sub-sectional data for
manufacturing. For NUTS3, several sections are aggregated. In particular, there is less detail in the
service sectors. Disaggregation (of industrial data and from NUTS3 to local data) takes place using
workforce jobs data at the industry level.
In the case of Income, the data provided at NUTS2 has the same level of detail as at the regional level.
For NUTS3, the ONS has previously only released data at the primary and secondary level. They have
now produced the full breakdown of income which we have included in our September 2015 RPS.
1 For some local areas, publication of certain data by the ONS is restricted because to do so would effectively
disclose individual responses to ONS data-collection surveys (e.g. if there are only one or two firms in a certain industry in a particular locality.) 2 In some cases, sample sizes in ONS data-collection surveys at the local level are very small. This leads to data
of comparatively poor quality and relatively high volatility. 3 The volatility represents sampling variability rather than actual volatility in the population data.
4 In line with ONS guidelines, we use the official model-based estimates of local unemployment that are more
accurate than survey data which suffers from volatility. 5 NUTS2 is provided at the same level of detail as NUTS1 (i.e. regional) level.
© Experian Plc 2015 11
Disaggregation from NUTS3 to local level takes place using employee jobs, self-employed jobs,
unemployment or population.
No estimates of household spending are provided at the local level. Household spending is, therefore,
derived by using the share of local disposable income in regional disposable income.
3.3.2 Forecast
The local authority model is run separately for the local authorities in each region and takes the
regional forecast as given. Accordingly, as with local history, local forecasts are constrained to the
regional forecasts of the parent region.
Our local model is based on the resolution of demand and supply for labour and takes into account
commuting between local areas within a region and across the regional boundary. The properties of the
model are these:
When unemployment is low, labour supply growth is the key determinant of growth.
When unemployment is high, growth in demand for labour is the key determinant of growth.
As unemployment decreases,
o Labour supply growth becomes relatively more important
o Growth in demand for labour becomes relatively less important
An area’s workplace employment growth depends on labour supply not only in the area but also
o Labour supply growth in other local areas in the region from which it has historically
drawn inward commuters.
o Its historic share of incoming workers across the regional boundary.
An area’s residence based employment growth depends on demand for labour not only in the
area but also
o Growth in demand for labour in other local areas in the region to which it has historically
supplied commuters.
o Its historic share of outgoing workers commuting across the regional boundary.
Workplace based employment drives GVA growth.
Residence based employment drives Income and, accordingly, spending growth.
The starting point is an estimate of the growth in the participation rate of those aged 16-64 and 65-plus
in a local area. These are used to derive labour force growth.
In parallel, demand for labour is estimated. This is done at the industry level by linking job growth1 in a
local area to growth in the same industry at the regional level and then constraining demand for jobs by
industry to demand for jobs for the same industry at the regional level. The effect of this is:
Demand for jobs at the local level is fastest in those industries which are performing best at the
regional level.
Total demand for jobs at the local level depends on its industrial structure. Those local areas
which have a more than proportionate share of the best performing industries will perform best
overall.
The supply and demand for labour is then resolved in the following way:
Total demand2 for jobs for each local area is converted into demand for workers according to
the historic ratio between jobs and workers into that local area.
The inflow and outflow of workers across the regional boundary is shared out between local
areas according to their historic commuting patterns leading to an adjustment in
1 Separately for employee jobs, self-employee jobs, government trainee jobs and Her Majesty’s Forces.
2 i.e. all industries and job types aggregated.
© Experian Plc 2015 12
o The remaining demand for labour for a local area (inflow)
o The remaining available labour for a local area (outflow)
Workplace demands for workers are converted into residence-based demands according to
historic commuting patterns.
o If unemployment is sufficiently high, these demands are satisfied out of the growth in
the labour supply and the pool of available (unemployed) workers.
o If unemployment is sufficiently low, these demands can only be satisfied out of the
growth in the labour supply.
o If unemployment is above its lower bound but not too high, a proportion of demands are
satisfied out of the pool of available workers and the rest are satisfied out of the growth
in the labour supply.
o The model makes short-term adjustments in the labour supply in response to demand
conditions to reflect the economic reality that
When demand is high, the participation rate rises as potential workers are
drawn into the labour force by the relatively buoyant conditions;
When demand is low, the participation rate declines as disillusioned workers
leave the labour force because of the poor job market conditions;
o The unemployment rate, accordingly, behaves as expected.
The satisfied residence supply for labour is converted back into workplace demands and
workplace based employment is calculated for each local area. This is then converted back into
jobs and used to produce final workforce jobs estimates for each local area.
The consequence of this is that:
Local areas with high demand may not see all of that demand satisfied if there is insufficient
available labour supply to meet those needs. Jobs growth will, accordingly, be slower.
Local areas with high labour supply may not see higher growth in residence employment if
there is insufficient demand for labour to use it up.
GVA growth is then forecast based on growth in workplace-based employment according to equations
which link GVA growth to workplace-based employment. Income is forecast by component based on
residence based employment (in the case of compensation for employees or self-employment),
unemployment (in the case of benefits) and population in any other case. Spending depends on
income by component.
© Experian Plc 2015 13
4 Key changes since June 2015 RPS
4.1 UK forecast
The September 2015 RPS forecast is consistent with the July 2015 UK macro forecast.
The second estimate of GDP released at the end of August confirmed that growth had picked up to
0.7% q-o-q in 2015q2, from 0.4% in 2015q1. The details revealed a more balanced picture than in most
recent quarters, with solid growth in consumer spending and business investment, alongside a rebound
in exports. Consumer spending remained a key engine of growth in q2, expanding by a healthy 0.7%,
following a rise of 0.9% in 2015q1. Strong confidence, recovering household incomes, low borrowing
costs and very subdued inflation should continue to buoy spending for the rest of this year.
The June 2015 RPS was consistent with the May 2015 UK macro forecast. The main change to our
forecast is a slight downgrade in our participation rate. Based on our analysis of LFS economic activity
rates by 5-year age bands, we forecast that the overall UK participation rate will fall to just below 62%
by 2035. For more details please see Appendix E.
The labour force consequently reaches almost 37 million people by the end of the forecast. Although
many more people aged 65 and over will be working over the next 20 years, the majority will be
working reduced hours.
Given these changes to the labour market we now forecast long-term annual GDP growth to settle at a
rate of 2.3%, slightly below its recent historic average. We have also revised down our longer-term
consumer spending profile; we now expect consumer spending growth to average 2.1% a year beyond
2019.
September RPS forecast. Previous forecast (May 2015 macro = June RPS) in brackets.
UK 2014 2015 2016 2017 2018-2025 2026-2035
GDP growth 3.0% 2.6% 2.2% 2.3% 2.4% 2.3%
(2.8%) (2.4%) (2.3%) (2.3%) (2.4%) (2.4%)
Workforce Jobs growth
3.3% 1.4% 0.0% 0.7% 0.5% 0.6%
(3.3%) (1.5%) (1%) (0.7%) (0.7%) (0.7%)
Unemployment rate 6.2% 5.4% 5.2% 5.1% 5.1% 5.2%
(6.2%) (5.5%) (5.2%) (5.1%) (5%) (5.1%)
Real Income growth 0.8% 3.4% 1.9% 2.2% 2.2% 2.4%
(0.6%) (3.4%) (2.2%) (2.3%) (2.3%) (2.6%)
Spending Volumes growth
2.5% 2.7% 2.2% 2.3% 2.2% 2.1%
(2.5%) (2.6%) (2.3%) (2.1%) (2.3%) (2.3%)
House price growth 10.0% 5.0% 3.4% 3.3% 3.1% 3.9%
(10%) (4%) (3%) (2.8%) (2.6%) (3.5%)
July UK Outlook
The following was the outlook in July, consistent with the regional forecast. Our UK macro view is
updated monthly and can be found on our website http://economics.experian.co.uk.

© Experian Plc 2015 14
The third estimate of GDP for the first quarter of 2015 showed that the economy grew by 0.4% q-o-q in
real terms, an upward revision of 0.1 percentage points from the previous estimate.
Despite the loss of momentum in the first quarter of this year, consumer spending seems set to sustain
GDP growth at a healthy pace, 2.5%, in 2015 as a whole. Spending is buoyed by zero inflation and the
steady increase in wage growth which reached 2.8% excluding bonuses in the year to March-May.
The two-year run of very positive developments in the labour market was interrupted with the
publication of figures for March-May. Unemployment rose slightly while the number of self-employed
people fell by 55,000, driving the change in employment into negative territory. Nevertheless, the
underlying strength of the labour market is still intact and will continue to strengthen household
budgets.
With the first rise in interest rates expected to be in late 2015 or early 2016, a significant impact on
exposed households and on consumer demand will not be felt until 2017 or even 2018.
The strong economic performance of the past two years means that the UK economy has recovered
ground lost during the great recession and its aftermath more quickly than seemed likely a few years
ago. But the repercussions of the recession and the ongoing travails of the eurozone are set to hamper
economic progress for a few years yet.
Key risks
The eurozone’s problems still cast a cloud over future performance. The fundamentally unresolved
Greek crisis poses a downside risk to European and UK growth prospects.
Export weakness is a continuing source of concern. Net trade is likely to remain a drag on UK growth
prospects with weak overseas demand and a strong pound dampening the outlook for UK exports.
There is an upside risk to the forecast if a eurozone recovery boosts exports.
The recovery looks reasonably secure but there are pitfalls ahead, notably the need to extend fiscal
restraint. The impact of tighter monetary policy from early 2016 at a time of fiscal restraint could
constrain growth.
Uncertainty regarding the UK’s future in the EU could depress investment, especially from foreign
investors.
4.2 Regional Forecast
Given revisions at the UK level to which our regional data is constrained, changes to the history can be
traced back to the following new data (June 2015 RPS endpoint in brackets):
Population: Mid-Year estimates revised 2013, new 2014.
2011 Census Commuting data (previously used the 2011 Annual Population Survey estimates)
Regional Workforce Jobs 2015q1 (previously 2014q4)
ILO data for 2015q1 (previously 2014q4)
The mean revision to 2013 population MYE was +0.01%. The change was due to the reallocation of
Foreign Armed Forces in England and at the regional level this made very little difference with East of
England and South East revised up the most, by 0.02%, and Yorkshire & Humber down by 0.01%.
The 2014 mid-year population estimate for the UK was 0.1% higher than the projection for the year
(56k people). The East of England saw the biggest under-estimation in the original projections with the
2014 MYE out-turn 0.23% higher and while Yorkshire & Humber out-turn was 0.09% lower.
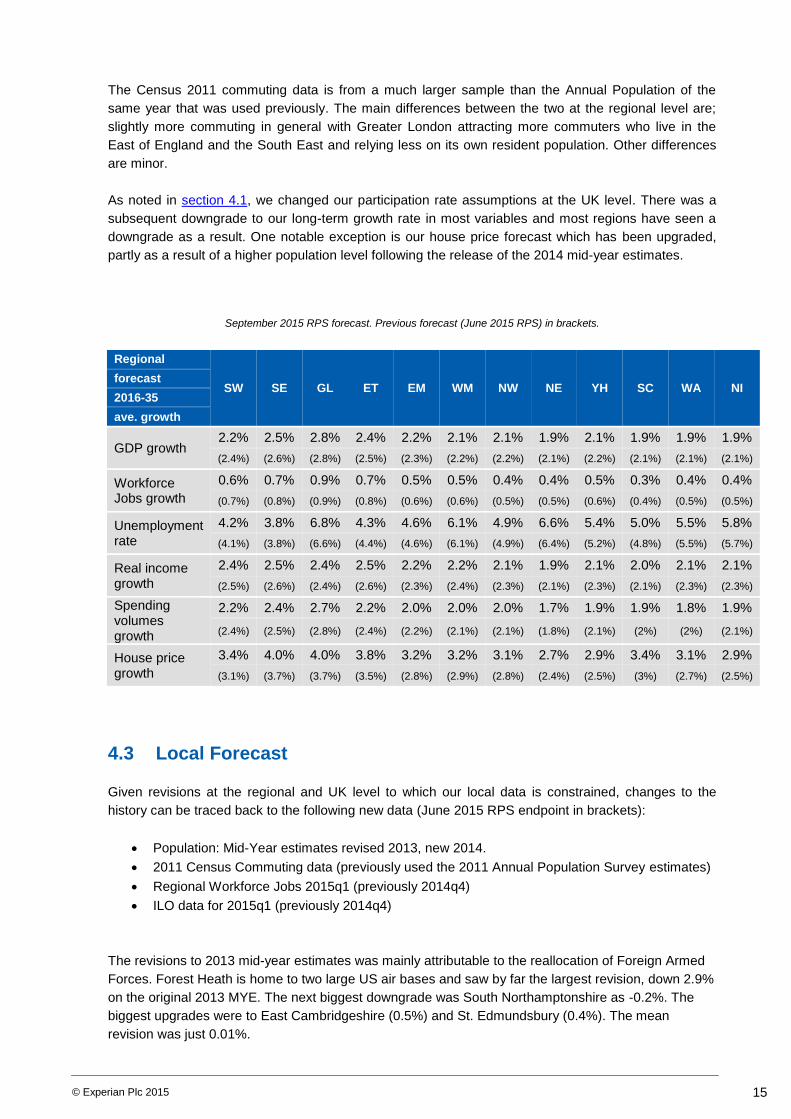
© Experian Plc 2015 15
The Census 2011 commuting data is from a much larger sample than the Annual Population of the
same year that was used previously. The main differences between the two at the regional level are;
slightly more commuting in general with Greater London attracting more commuters who live in the
East of England and the South East and relying less on its own resident population. Other differences
are minor.
As noted in section 4.1, we changed our participation rate assumptions at the UK level. There was a
subsequent downgrade to our long-term growth rate in most variables and most regions have seen a
downgrade as a result. One notable exception is our house price forecast which has been upgraded,
partly as a result of a higher population level following the release of the 2014 mid-year estimates.
September 2015 RPS forecast. Previous forecast (June 2015 RPS) in brackets.
Regional
SW SE GL ET EM WM NW NE YH SC WA NI forecast
2016-35
ave. growth
GDP growth 2.2% 2.5% 2.8% 2.4% 2.2% 2.1% 2.1% 1.9% 2.1% 1.9% 1.9% 1.9%
(2.4%) (2.6%) (2.8%) (2.5%) (2.3%) (2.2%) (2.2%) (2.1%) (2.2%) (2.1%) (2.1%) (2.1%)
Workforce Jobs growth
0.6% 0.7% 0.9% 0.7% 0.5% 0.5% 0.4% 0.4% 0.5% 0.3% 0.4% 0.4%
(0.7%) (0.8%) (0.9%) (0.8%) (0.6%) (0.6%) (0.5%) (0.5%) (0.6%) (0.4%) (0.5%) (0.5%)
Unemployment rate
4.2% 3.8% 6.8% 4.3% 4.6% 6.1% 4.9% 6.6% 5.4% 5.0% 5.5% 5.8%
(4.1%) (3.8%) (6.6%) (4.4%) (4.6%) (6.1%) (4.9%) (6.4%) (5.2%) (4.8%) (5.5%) (5.7%)
Real income growth
2.4% 2.5% 2.4% 2.5% 2.2% 2.2% 2.1% 1.9% 2.1% 2.0% 2.1% 2.1%
(2.5%) (2.6%) (2.4%) (2.6%) (2.3%) (2.4%) (2.3%) (2.1%) (2.3%) (2.1%) (2.3%) (2.3%)
Spending volumes growth
2.2% 2.4% 2.7% 2.2% 2.0% 2.0% 2.0% 1.7% 1.9% 1.9% 1.8% 1.9%
(2.4%) (2.5%) (2.8%) (2.4%) (2.2%) (2.1%) (2.1%) (1.8%) (2.1%) (2%) (2%) (2.1%)
House price growth
3.4% 4.0% 4.0% 3.8% 3.2% 3.2% 3.1% 2.7% 2.9% 3.4% 3.1% 2.9%
(3.1%) (3.7%) (3.7%) (3.5%) (2.8%) (2.9%) (2.8%) (2.4%) (2.5%) (3%) (2.7%) (2.5%)
4.3 Local Forecast
Given revisions at the regional and UK level to which our local data is constrained, changes to the
history can be traced back to the following new data (June 2015 RPS endpoint in brackets):
Population: Mid-Year estimates revised 2013, new 2014.
2011 Census Commuting data (previously used the 2011 Annual Population Survey estimates)
Regional Workforce Jobs 2015q1 (previously 2014q4)
ILO data for 2015q1 (previously 2014q4)
The revisions to 2013 mid-year estimates was mainly attributable to the reallocation of Foreign Armed
Forces. Forest Heath is home to two large US air bases and saw by far the largest revision, down 2.9%
on the original 2013 MYE. The next biggest downgrade was South Northamptonshire as -0.2%. The
biggest upgrades were to East Cambridgeshire (0.5%) and St. Edmundsbury (0.4%). The mean
revision was just 0.01%.
© Experian Plc 2015 16
The 2014 MYE compared to the previous projections saw a mean upgrade of 0.12%. Isles of Scilly was
the biggest upgrade (2.8%) while the City of London saw an out-turn 2.6% higher than anticpated.
Other notable upgrades in the top 10 (in % terms) were Exeter (1.5%), Cambridge (1.5%), Tower
Hamlets (1.5%), Westminster (1.4%) and Oxford (1.4%). The biggest downgrades were to Forest
Heath (-2.4%), Richmondshire (-2.1%), Merton (-1.1%), Ealing (-1.1%), Harrogate (-0.8%).
We have re-visited the relationship between local workforce jobs and workplace-based employment.
The local workforce jobs (which make use of BRES shares) have been benchmarked to the ILO
workplace-based employment which itself has first been benchmarked to the Census 2011 point with
the pattern in years either side preserved.
The 2011 Census is drawn from a much larger sample than the previously used 2011 APS. If you have
a request about a particular local authority then please contact us but in general there is slightly more
intra-regional commuting highlighted in the Census.
As mentioned in section 3, our model makes use of commuting, participation rates whose starting
points will be different due to new population estimates, the relationship between workforce jobs and
workplace-based employment, and residence-based employment and workplace-based employment so
changes will impact upon our forecasts.
For more information about how the history is constructed refer to section 3.2.1 for regions and section
3.3.1 for local authorities.
© Experian Plc 2015 17
5 A note from the ONS on volatility
A change in methodology behind Office for National Statistics (ONS) employment surveys has
produced widespread volatility in the historical data, particularly from 2010.
The following is an explanation directly from the ONS, please see section 3 for more
information on how we deal with volatility in the official data:
“A fundamental redevelopment of Workforce Jobs sources, classifications, methods and
systems was recently undertaken and is explained clearly in the article ‘Revisions to
Workforce Jobs’ (Barford 2010). One of the key changes highlighted in this article was the
replacement of a matched-pairs estimator with a point-in-time ratio estimator, ONS’s
standard method. This change was aimed at removing the bias caused by the matched-pairs
method. A matched-pairs method tends to underestimate change over time, as it excludes
the births and deaths of businesses in the sample. In essence, only those businesses
sampled in two consecutive periods are used to produce estimates of change. This bias used
to cause large revisions when the short-term employment surveys series were benchmarked
retrospectively to Business Register Employment Survey (BRES) estimates. BRES is an
annual survey which selects a larger sample and also uses a point-in-time ratio estimator.
The point-in-time estimator includes all sampled businesses in each and every period, which
reduces the bias over-time. The trade-off is an increase in volatility caused by the inclusion of
the rotated part of the sample for small and medium sized businesses. Sample rotation
spreads the administrative burden; ensuring businesses are selected for a limited number of
periods.
Unfortunately, the volatility of regional estimates at an industry level has been far greater
than anyone anticipated and in general has been met unfavourably by users, particularly
those that are interested in regional data. There are a number of instances, for example,
whereby businesses have been ‘rotated in’ to a particular region and served to distort the
level of jobs for a particular industry, usually for a period of 5 quarters, which is the time a
rotated business remains in the sample of the STES.”
Regional employment is the most timely and only source of quarterly data at this level of geography
and is used to derive the quarterly profile of other variables in our regional models. Therefore this
volatility is reflected in output as well as employment. Please see section 3 for more information on how
we deal with volatility in the official data.
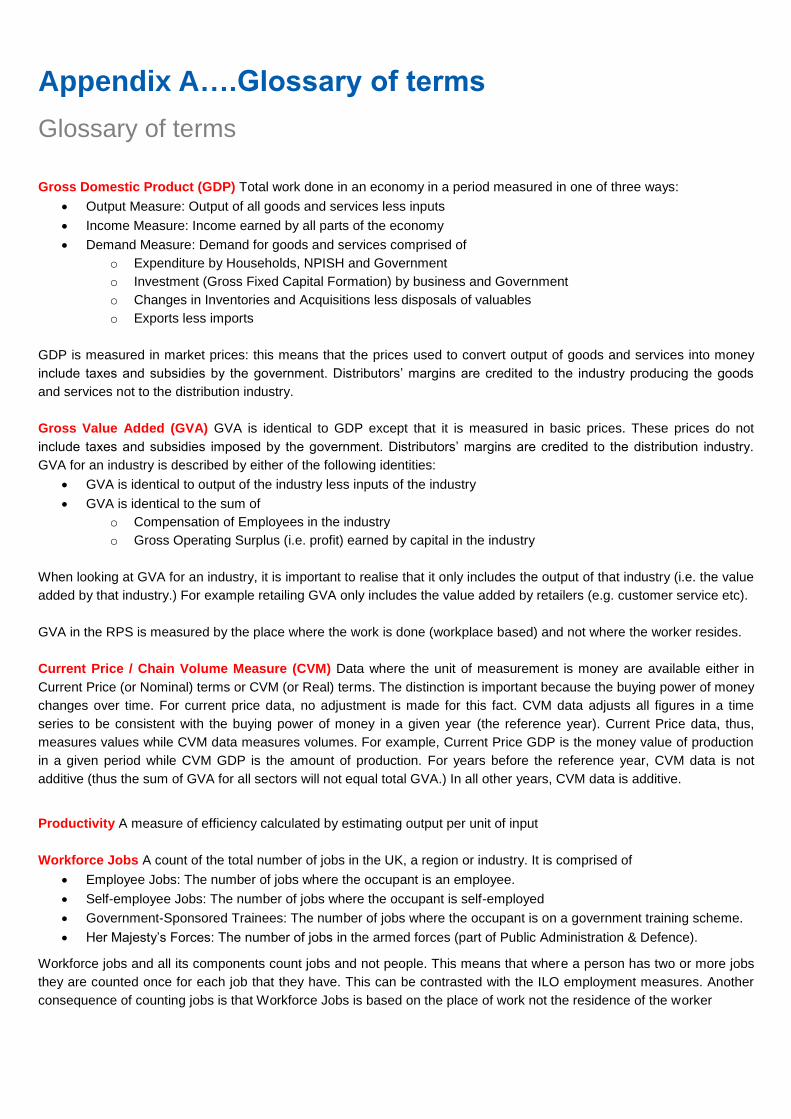
Appendix A….Glossary of terms
Glossary of terms
Gross Domestic Product (GDP) Total work done in an economy in a period measured in one of three ways:
Output Measure: Output of all goods and services less inputs
Income Measure: Income earned by all parts of the economy
Demand Measure: Demand for goods and services comprised of
o Expenditure by Households, NPISH and Government
o Investment (Gross Fixed Capital Formation) by business and Government
o Changes in Inventories and Acquisitions less disposals of valuables
o Exports less imports
GDP is measured in market prices: this means that the prices used to convert output of goods and services into money
include taxes and subsidies by the government. Distributors’ margins are credited to the industry producing the goods
and services not to the distribution industry.
Gross Value Added (GVA) GVA is identical to GDP except that it is measured in basic prices. These prices do not
include taxes and subsidies imposed by the government. Distributors’ margins are credited to the distribution industry.
GVA for an industry is described by either of the following identities:
GVA is identical to output of the industry less inputs of the industry
GVA is identical to the sum of
o Compensation of Employees in the industry
o Gross Operating Surplus (i.e. profit) earned by capital in the industry
When looking at GVA for an industry, it is important to realise that it only includes the output of that industry (i.e. the value
added by that industry.) For example retailing GVA only includes the value added by retailers (e.g. customer service etc).
GVA in the RPS is measured by the place where the work is done (workplace based) and not where the worker resides.
Current Price / Chain Volume Measure (CVM) Data where the unit of measurement is money are available either in
Current Price (or Nominal) terms or CVM (or Real) terms. The distinction is important because the buying power of money
changes over time. For current price data, no adjustment is made for this fact. CVM data adjusts all figures in a time
series to be consistent with the buying power of money in a given year (the reference year). Current Price data, thus,
measures values while CVM data measures volumes. For example, Current Price GDP is the money value of production
in a given period while CVM GDP is the amount of production. For years before the reference year, CVM data is not
additive (thus the sum of GVA for all sectors will not equal total GVA.) In all other years, CVM data is additive.
Productivity A measure of efficiency calculated by estimating output per unit of input
Workforce Jobs A count of the total number of jobs in the UK, a region or industry. It is comprised of
Employee Jobs: The number of jobs where the occupant is an employee.
Self-employee Jobs: The number of jobs where the occupant is self-employed
Government-Sponsored Trainees: The number of jobs where the occupant is on a government training scheme.
Her Majesty’s Forces: The number of jobs in the armed forces (part of Public Administration & Defence).
Workforce jobs and all its components count jobs and not people. This means that where a person has two or more jobs
they are counted once for each job that they have. This can be contrasted with the ILO employment measures. Another
consequence of counting jobs is that Workforce Jobs is based on the place of work not the residence of the worker

Full Time Equivalent Employment: Our definition is based on total hours worked and is as follows:
FTE = (HOURS) divided by (37.8*13)
Here a constant yard-stick of full-time employment for all industries, regions and industry-region based on thirteen
working weeks in a quarter at 37.8 hours a week. 37.8 hours is the average hours worked by a full-time worker in the UK
between 1990 and 2009.
ILO Employment The International Labour Organisation (ILO) provides an international standard method of measuring
employment. In the UK this is implemented by means of a survey known as the Labour Force Survey (LFS) or Annual
Population Survey (APS). It is a people count based on the main job that a person has. Employment comprises:
Employees: People whose main job is as an employee.
Self-employed: People whose main job is as a self-employed person.
Government-Sponsored Trainees: People whose main job is on a government training scheme.
Unpaid Family Workers: People whose main job is as an unpaid worker in a business owned by their own family.
There are two measures:
Residence based, which depends on the place of residence of the worker (irrespective of where they work.)
Workplace based, which depends on the place of work of the worker (irrespective of where they reside.)
The ILO Employment reported is based on the entire population in work ages 16+.
ILO Unemployment The International Labour Organisation (ILO) definition of unemployment covers people who are: out
of work, want a job, have actively sought work in the previous four weeks and are available to start work within the next
fortnight; or out of work and have accepted a job that they are waiting to start in the next fortnight.
ILO unemployment is only available on a place of residence basis and is based on the entire unemployed population
ages 16+.
Labour Force / Economically Active The sum of ILO Unemployment and ILO Employment. That is all people who are in
work or who are looking for a work. A person who is in the labour force is said to be Economically Active.
The Labour Force includes the entire Economically Active population ages 16+.
Economically Inactive A person who is not economically active. The principle categories are retirees, students, children,
long-term sick or disabled, homemakers and carers. This does not include school-aged people.
Claimant Count Unemployment Measures the number of people who are claiming Jobseekers’ Allowance (JSA). This is
always less than ILO Unemployment because not everyone who is ILO unemployed is eligible to claim JSA and not all
who are eligible claim. Particular important cases are:
People whose partners work more than 16 hours a week – they cannot claim JSA but may be ILO unemployed.
People who are past state retirement age – they cannot claim JSA but may be ILO unemployed.
Extra Regio In addition to the 9 English regions and the nations of Scotland, Wales and Northern Ireland, the UK’s
economic boundary includes the continental shelf and UK government operations abroad (i.e. embassies and HMF
abroad). The ONS does not assign income or GVA attributable to these sources to any region or nation. Therefore, the
sum of regional Income or GVA does not equal the UK. This also impacts on two industries Extraction & Mining and
Public Administration & Defence.
School Age Population Population aged 0-15.

Working Age Population Population above the age of 15 but below the current state retirement age for their gender.
Retirement Age Population The population above state retirement age. The precise retirement date depends on date of
birth and, for those born before 6th November 1953, on gender. At present, there is a phased equalisation in progress.
After 6th November 2018, both men and women will retire at 65. This will rise to 66 between 6
th March 2019 and 6
th
September 2020 and 67 between 6th April 2026 and 6
th March 2027. Our forecasts take account of these changes to
retirement legislation.
Adult (16+) Population Number of all people aged 16 and above.
Household Consumer Spending The accounts relate to consumption expenditure by UK resident households, either in
the UK or the rest of the world. Spending by non-residents in the UK is excluded from the total
Household consumption includes goods and services received by households as income in kind, in lieu of cash, imputed
rent for the provision of owner-occupied housing services and consumption of own production
For national accounting purposes, households are individuals or groups of people sharing living accommodation
Household Disposable Income Household disposable income is the total payment to households (from wages, interest,
property income and dividends) less taxes, social security, council payments and interest
Cost of living index Regional consumer spending deflator. Gives an indication of how the value of consumer spending
has grown in comparison to the volume.
NUTS (Nomenclature des Unités Territoriales Statistiques – Nomeclature of Territorial Units for Statistics) A
European Union standard for classifying the subdivisions of member states. In the case of the UK, the English regions
and the three nations are classified as NUTS1. The next level – NUTS2 – typically consists of aggregations of local
authorities in the same region. The level below that, NUTS3 consists either of single local authorities or a small
aggregation of local authorities in the same NUTS2. In Scotland, some local authorities are divided between NUTS3.
NUTS4 and NUTS5 also exist but are not used in the RPS.
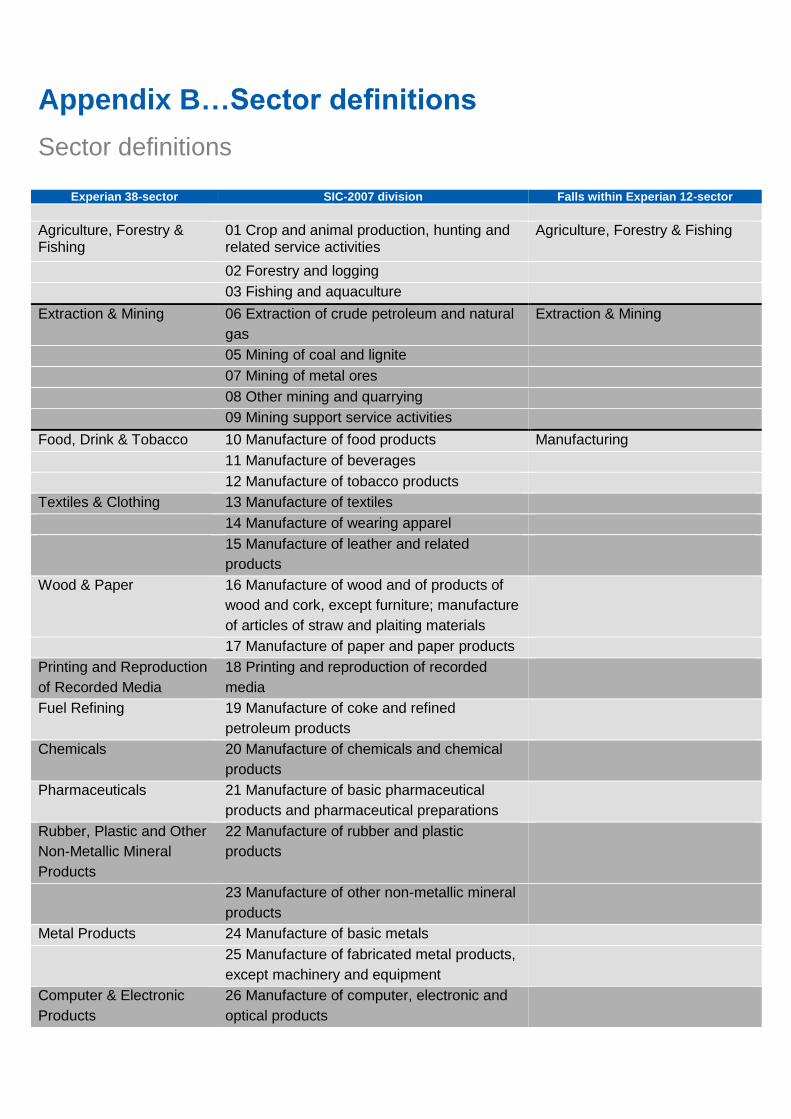
Appendix B…Sector definitions
Sector definitions
Experian 38-sector SIC-2007 division Falls within Experian 12-sector
Agriculture, Forestry & Fishing
01 Crop and animal production, hunting and related service activities
Agriculture, Forestry & Fishing
02 Forestry and logging
03 Fishing and aquaculture
Extraction & Mining 06 Extraction of crude petroleum and natural
gas
Extraction & Mining
05 Mining of coal and lignite
07 Mining of metal ores
08 Other mining and quarrying
09 Mining support service activities
Food, Drink & Tobacco 10 Manufacture of food products Manufacturing
11 Manufacture of beverages
12 Manufacture of tobacco products
Textiles & Clothing 13 Manufacture of textiles
14 Manufacture of wearing apparel
15 Manufacture of leather and related
products
Wood & Paper
16 Manufacture of wood and of products of
wood and cork, except furniture; manufacture
of articles of straw and plaiting materials
17 Manufacture of paper and paper products
Printing and Reproduction
of Recorded Media
18 Printing and reproduction of recorded
media
Fuel Refining
19 Manufacture of coke and refined
petroleum products
Chemicals
20 Manufacture of chemicals and chemical
products
Pharmaceuticals
21 Manufacture of basic pharmaceutical
products and pharmaceutical preparations
Rubber, Plastic and Other
Non-Metallic Mineral
Products
22 Manufacture of rubber and plastic
products
23 Manufacture of other non-metallic mineral
products
Metal Products 24 Manufacture of basic metals
25 Manufacture of fabricated metal products,
except machinery and equipment
Computer & Electronic
Products
26 Manufacture of computer, electronic and
optical products

27 Manufacture of electrical equipment
Machinery & Equipment
28 Manufacture of machinery and equipment
n.e.c.
Machinery & Equipment
29 Manufacture of motor vehicles, trailers
and semi-trailers
30 Manufacture of other transport equipment
Other Manufacturing 31 Manufacture of furniture
32 Other manufacturing
33 Repair and installation of machinery and
equipment
Utilities
35 Electricity, gas, steam and air conditioning
supply
Utilities
36 Water collection, treatment and supply
37 Sewerage
38 Waste collection, treatment and disposal
activities; materials recovery
39 Remediation activities and other waste
management services. This division includes
the provision of remediation services, i.e. the
cleanup of contaminated buildings and sites,
soil, surface or ground water.
Construction of Buildings 41 Construction of buildings Construction
Civil Engineering 42 Civil engineering
Specialised Construction
Activities
43 Specialised construction activities
Wholesale 45 Wholesale and retail trade and repair of
motor vehicles and motorcycles
Wholesale & Retail
46 Wholesale trade, except of motor vehicles
and motorcycles
Retail
47 Retail trade, except of motor vehicles and
motorcycles
Land Transport, Storage &
Post
49 Land transport and transport via pipelines Transport & Storage
52 Warehousing and support activities for
transportation
53 Postal and courier activities
Air & Water Transport 50 Water transport
51 Air transport
Accommodation & Food
Services
55 Accommodation Accommodation, Food Services
& Recreation
56 Food and beverage service activities
Recreation 90 Creative, arts and entertainment activities
91 Libraries, archives, museums and other
cultural activities
92 Gambling and betting activities
93 Sports activities and amusement and

recreation activities
Media Activities 58 Publishing activities Information & communication
59 Motion picture, video and television
programme production, sound recording and
music publishing activities
60 Programming and broadcasting activities
Telecoms 61 Telecommunications
Computing & Information
Services
62 Computer programming, consultancy and
related activities
63 Information service activities
Finance
64 Financial service activities, except
insurance and pension funding
Finance & Insurance
66 Activities auxiliary to financial services
and insurance activities
Insurance & Pensions
65 Insurance, reinsurance and pension
funding, except compulsory social security
Real Estate 68 Real estate activities Professional & Other Private
Services
Professional Services 69 Legal and accounting activities
70 Activities of head offices; management
consultancy activities
71 Architectural and engineering activities;
technical testing and analysis
72 Scientific research and development
73 Advertising and market research
74 Other professional, scientific and technical
activities
75 Veterinary activities
Administrative &
Supportive Service
Activities
77 Rental and leasing activities
78 Employment activities
79 Travel agency, tour operator and other
reservation service and related activities
80 Security and investigation activities
81 Services to buildings and landscape
activities
82 Office administrative, office support and
other business support activities
Other Private Services 94 Activities of membership organisations
95 Repair of computers and personal and
household goods
96 Other personal service activities
97 Activities of households as employers of
domestic personnel
98 Undifferentiated goods- and services-
producing activities of private households for

own use
Public Administration &
Defence
84 Public administration and defence;
compulsory social security
Public Services
99 Activities of extraterritorial organisations
and bodies
Education 85 Education
Health 86 Human health activities
Residential Care & Social
Work
87 Residential care activities
88 Social work activities without
accommodation

Appendix C…Geography definitions
We forecast at the following geographic breakdowns:
UK
Regions (12)
Counties (64)
Local authorities…post-2009 boundaries (347+33 London boroughs)
A full lookup in excel form can be found here

Appendix D…FAQ’s
Why does Experian’s history for variable x differ from another source / raw survey data?
o There are several possible reasons.
o The first is a vintage mismatch. The ONS frequently revises its economic data in order to take account of
new information or improved methodology. The date at which Experian has taken data for the current
RPS is given in the body of this guide. Another source may have used earlier or later data.
o The second relates to data processing. As explained in the body of this guide, it is sometimes necessary
at the regional level and (particularly) at the local level to process or construct data. Our approach to
doing this is explained in the body of this guide. We apply consistent methodologies to process the data.
Other sources may carry this out in different ways. When compared against the raw source, our data may
differ because, for example:
It has been constrained to other sources.
It has been converted into CVM data or quarterly data.
It has been made consistent with other data or a later vintage of data.
o The third relates to raw survey data. Raw survey data is often volatile and does not take into account
information outside the survey. Official statistics and our data are constructed from the raw survey data to
take into account volatility, sampling issues and all available data sources.
Why does Experian’s job history differ from the ABI or BRES?
o The ABI/BRES are surveys taken from a particular year; they are not updated.
o ABI/BRES is a source for ONS’ workforce jobs but it is not the only source.
o Experian’s workforce job history is designed to be consistent with the latest available ONS workforce jobs
estimates (which may represent additional data or improved methodology.)
o Raw survey is often incomplete and suffers from sampling variability, which does not represent true
volatility in the underlying population data. This must be removed to ensure high quality data.
How often are data updated?
o We always use the latest available data at the cut-off date for history.
o New GVA data is available from the ONS
At the UK Level, three times a quarter.
At the Regional and Local level, annually (normally in December.)
o New Expenditure data is available from the ONS at the UK level twice a quarter.
o New LFS Employment data is available from the ONS once a quarter.
o New Workforce Jobs data is available from the ONS once a quarter.
o New BRES is published once a year (normally in December.)
o New Income data is available from the ONS
At the UK level, once a quarter.
At the Regional and Local level, once a year (normally in April.)
o Population projections are published once every two years.
o New mid-year population estimates are published annually.
o New LCFS is published annually.
How do revisions to historical data affect your history and forecasts?
o As explained above, we always take into account the latest historical data.
o The monthly UK macro forecast is updated after each ONS revision of GDP for a quarter.
o The RPS is based on a particular UK macro forecast and includes the latest available regional and local
data.
o Forecasts are updated to be consistent with the latest historical data. While this will typically only affect the
short-to-medium term, there are times when the long-run is necessarily affected. This will usually be
when there has been a substantial revision to history.
How are past growth trends captured in the forecasts?
o All our models are econometric models.
o An econometric model is a model estimated on historical data.

o The coefficients (i.e. interactions) in the model embed historical relationships between variables and
historical growth rates in a variable.
o Where we believe that the forecast relationships may differ from history, we make appropriate adjustments
to the forecast. This may be the case, for example, where an area has been substantially redeveloped in
recent years.
How are industry/regional/local developments and policies reflected in forecasts?
o If past developments and policies are reflected in model inputs (for example population) or in history then
they will be automatically captured by the model.
o Our forecasts are policy-neutral in the sense that in our baseline assumes that sufficient projects,
infrastructure, jobs etc. will be provided in order to meet the needs of the population in the long term.
Thus although the project may not be explicitly included, an assumption that a project of its nature may
have been included in the baseline.
o It is important to realise that many developments or policies may not be sufficiently large enough to affect
growth rates or may be implicitly included in the forecast from a higher level of aggregation.
o We are able to make appropriate adjustments to the forecast to take into account certain large projects.
o At the industry level we can take into account announced developments in that industry which are large
enough to affect the growth in the industry at the national, regional or local level (as the case may be).
o At the regional and local, we taken into account announced developments or policies which are large
enough to affect growth at the regional or local level. The local model, in particular, has the facility to take
into account the impact of additional population or jobs in a particular area.
o The final forecast will show the net effect of the adjustment, after the effects of population constraints, job
cannibalisation, commuting patterns etc.
How does population relate to the employment forecasts?
o This is discussed in detail in the methodology section above for the regions and the locals.
o It is important to remember that employment is forecast on both a residence and workplace basis.
o Residence based employment depends on local population (labour supply) growth but also on demand for
work throughout the region and across the regional boundary.
o Workplace based employment depends on labour supply throughout the region and across the regional
boundary.
What is working age?
o The definition of working age used based on the state pension age.
o As the state pension age for men and women changes in line with announced policy, the working age
population will change to take this into account.
o The key changes to the state pension age that have been announced are:
A gradual equality in state pension age for men and women.
A gradual rise in state pension age for both men and women to 67 (and 68 after the forecast
horizon.)
What is the participation rate / economic activity rate?
o The participation rate or economic activity rate is the proportion of the population who are either employed
or seeking employment (i.e. unemployed.)
o The participation rate used in our models is based on the entire adult population (16+). This differs from
earlier versions of our models which used only the working age population.
o The participation rate is an endogenous variable in all our models. It is not a fixed assumption.
What assumptions have been made regarding commuting in the local model?
o Commuting in the local model is based on estimates given by the ONS.
o These are based on the Census 2011.
o Commuting assumptions are fixed over the forecast.
o However, the outcome for commuting may differ from the assumption because (for example) there is
insufficient demand or supply for labour to provide as many workers across a particular commuting
relationship.
How is Full-Time Equivalent employment derived?

o This is based on the total hours worked (please see the glossary.)
o The relationship between FTEs and hours is fixed by definition.
o In different industries, the hours worked per job will differ.
o Historical data for this is taken from ASHE (please see the body of the guide.)
o The forecast takes into account changing trends in hours per job. This will necessarily alter the
relationship between Full-Time Equivalent employment and jobs.
How does the weighting of different factors change over the forecast period?
o There is no fixed rule about the changes in this time.
o The coefficients of the econometric equations are fixed over time
o However, at the local level population growth becomes more important as unemployment decreases.
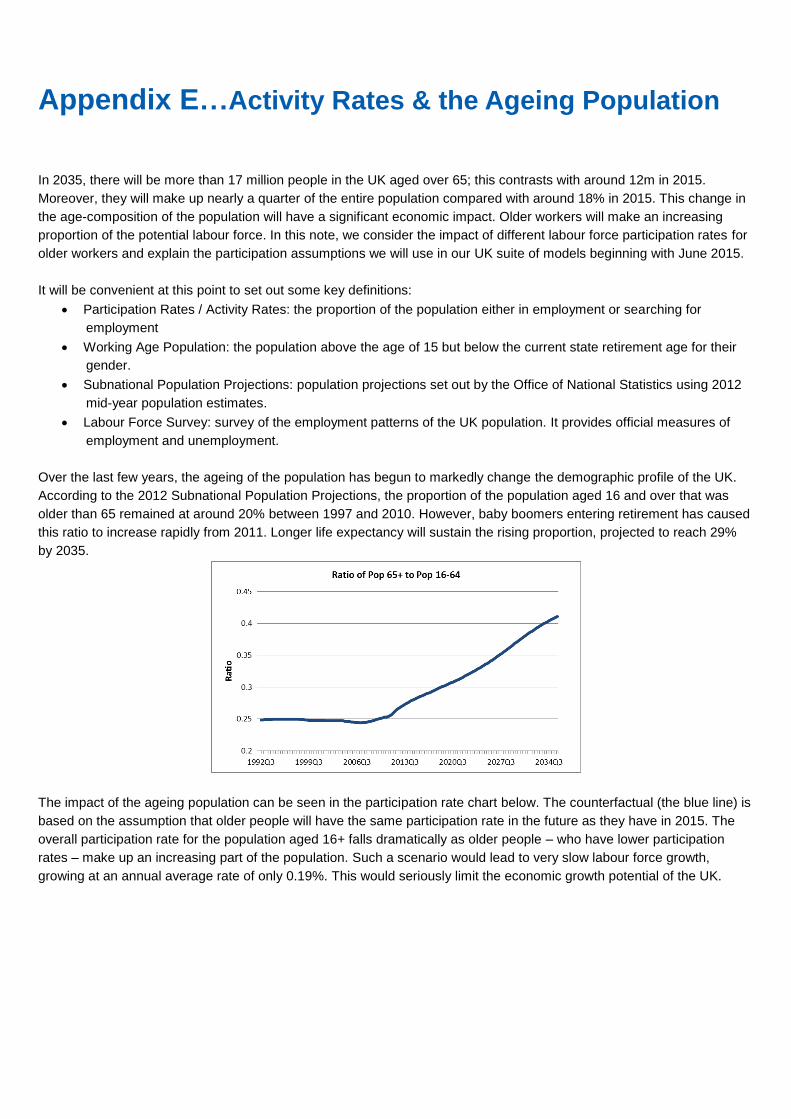
Appendix E…Activity Rates & the Ageing Population
In 2035, there will be more than 17 million people in the UK aged over 65; this contrasts with around 12m in 2015.
Moreover, they will make up nearly a quarter of the entire population compared with around 18% in 2015. This change in
the age-composition of the population will have a significant economic impact. Older workers will make an increasing
proportion of the potential labour force. In this note, we consider the impact of different labour force participation rates for
older workers and explain the participation assumptions we will use in our UK suite of models beginning with June 2015.
It will be convenient at this point to set out some key definitions:
Participation Rates / Activity Rates: the proportion of the population either in employment or searching for
employment
Working Age Population: the population above the age of 15 but below the current state retirement age for their
gender.
Subnational Population Projections: population projections set out by the Office of National Statistics using 2012
mid-year population estimates.
Labour Force Survey: survey of the employment patterns of the UK population. It provides official measures of
employment and unemployment.
Over the last few years, the ageing of the population has begun to markedly change the demographic profile of the UK.
According to the 2012 Subnational Population Projections, the proportion of the population aged 16 and over that was
older than 65 remained at around 20% between 1997 and 2010. However, baby boomers entering retirement has caused
this ratio to increase rapidly from 2011. Longer life expectancy will sustain the rising proportion, projected to reach 29%
by 2035.
The impact of the ageing population can be seen in the participation rate chart below. The counterfactual (the blue line) is
based on the assumption that older people will have the same participation rate in the future as they have in 2015. The
overall participation rate for the population aged 16+ falls dramatically as older people – who have lower participation
rates – make up an increasing part of the population. Such a scenario would lead to very slow labour force growth,
growing at an annual average rate of only 0.19%. This would seriously limit the economic growth potential of the UK.

Based on our analysis of LFS economic activity rates by 5-year age bands below, we instead forecast that the overall UK
participation rate will fall to just below 62%. The labour force is 8% larger than in the counterfactual scenario by the end of
the forecast, reaching almost 37 million people.
We expect to see increasing participation rates across all older bands for both men and women. As the UK economy
becomes increasingly service-oriented, older people are inclined to continue working. Improving health standards also
mean that people are able to participate in the labour force for longer and need to build up enough savings ahead of
longer retirements. The option to receive pensions as a lump sum may even leave people needing to return to the labour
force at a later stage should they fail to adequately manage their finances.
Policy changes have also begun to influence participation rates. The default retirement age has already been phased out
and the State Pension Age (SPA) is gradually being increased. The SPA for women began to increase from 60 to 65 in
2010. An increase in the female participation rate for those aged 60-65 can be seen in the historical LFS data from
around 2011. We have forecast that the rate will grow such that the gender gap in this age band approaches the
corresponding gap for the 55-59 age band. The female participation rate also grows because cohorts displace one
another over time and women born in later generations have had a higher propensity to work. As the SPA for both
genders reaches 67 by 2028 and health standards improve, we see fewer people leaving the labour force between the
ages of 60-64. The impact of the SPA policy changes can also be seen on the 65-69 age band.
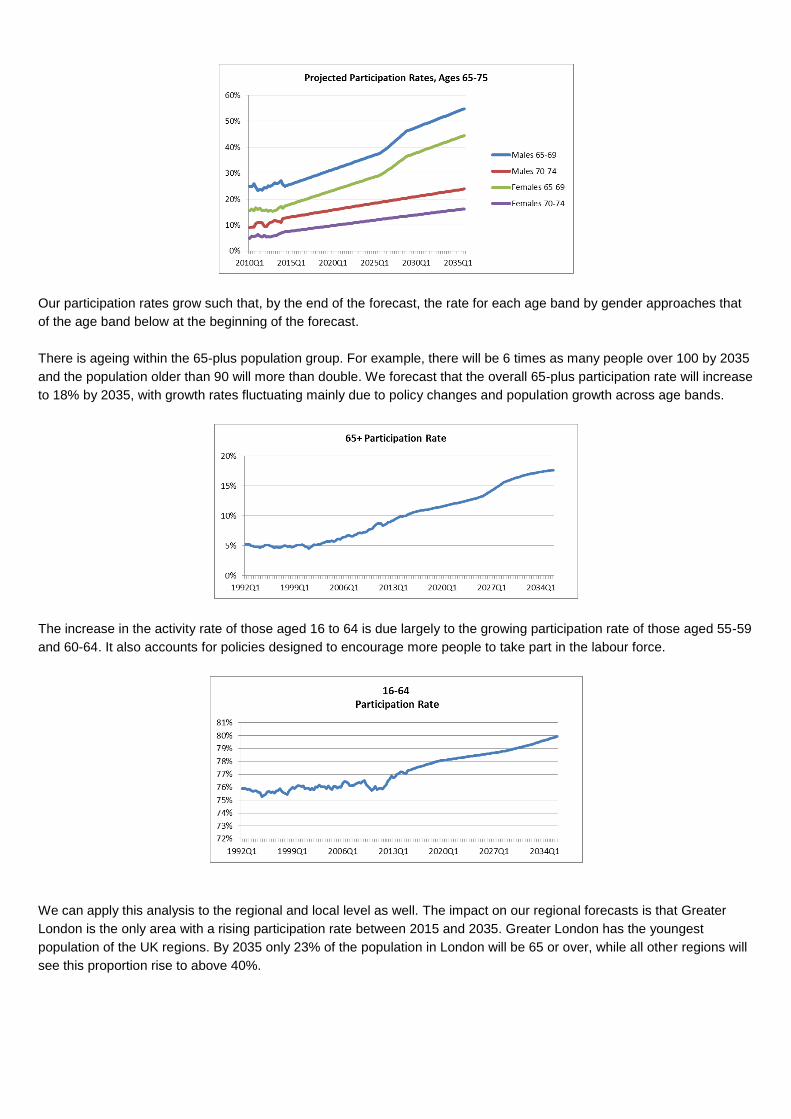
Our participation rates grow such that, by the end of the forecast, the rate for each age band by gender approaches that
of the age band below at the beginning of the forecast.
There is ageing within the 65-plus population group. For example, there will be 6 times as many people over 100 by 2035
and the population older than 90 will more than double. We forecast that the overall 65-plus participation rate will increase
to 18% by 2035, with growth rates fluctuating mainly due to policy changes and population growth across age bands.
The increase in the activity rate of those aged 16 to 64 is due largely to the growing participation rate of those aged 55-59
and 60-64. It also accounts for policies designed to encourage more people to take part in the labour force.
We can apply this analysis to the regional and local level as well. The impact on our regional forecasts is that Greater
London is the only area with a rising participation rate between 2015 and 2035. Greater London has the youngest
population of the UK regions. By 2035 only 23% of the population in London will be 65 or over, while all other regions will
see this proportion rise to above 40%.

Although many more people aged 65 and over will be working over the next 20 years, the majority will be working
reduced hours. The relative distribution of hours worked by age, taken from the Labour Force Survey for 2014Q2, shows
that most people younger than 65 work at least 35 hours per week. When we separate the age bands of those aged 65
and over, we see that people work fewer hours the older they get. We would expect the distribution for the 65-plus
population to shift towards slightly longer hours over time.
.00
.04
.08
.12
.16
.20
.24
0 5 10 15 20 25 30 35 40 45 50 55 60
16-59yrs 60-64yrs65-69yrs 70-99 yrs
Re
lati
ve F
req
ue
ncy
Weekly Hours Worked by Age Group (LFS, 2014q2)
We will be implementing these revised projections in our July 2015 UK macro forecast and in our September 2015
Regional and Local Forecasts.

Appendix F…About us
Our economic forecasting expertise
Experian's team of 18 economists is a leading provider of global, national, regional and local economic forecasts and
analysis to the commercial and public sectors. Our foresight helps organisations predict the future of their markets,
identify new business opportunities, quantify risk and make informed decisions.
Experian’s economics team is part of a 140-strong analytics division, which provides an understanding of consumers,
markets and economies in the UK and around the world, past, present and future. As part of the Experian group, the
analytics division has access to a wealth of research data and innovative software solutions. Its statisticians,
econometricians, sociologists, geographers, market researchers and economists carry out extensive research into the
underlying drivers of social, economic and market change.
For more information, visit www.experian.co.uk/economics
Experian
Experian is a global leader in providing information, analytical and marketing services to organisations and consumers to
help manage the risk and reward of commercial and financial decisions.
Combining its unique information tools and deep understanding of individuals, markets and economies, Experian partners
with organisations around the world to establish and strengthen customer relationships and provide their businesses with
competitive advantage.
For consumers, Experian delivers critical information that enables them to make financial and purchasing decisions with
greater control and confidence.
Clients include organisations from financial services, retail and catalogue, telecommunications, utilities, media, insurance,
automotive, leisure, e-commerce, manufacturing, property and government sectors.
Experian Group Limited is listed on the London Stock Exchange (EXPN) and is a constituent of the FTSE 100 index. It
has corporate headquarters in Dublin, Ireland, and operational headquarters in Costa Mesa, California and Nottingham,
UK. Experian employs around 15,500 people in 36 countries worldwide, supporting clients in more than 65 countries.
Annual sales are in excess of $3.8 billion (£1.9 billion/€2.8 billion).
For more information, visit the Group's website on www.experiangroup.com
The word 'Experian' is a registered trademark in the EU and other countries and is owned by Experian Ltd and/or its associated companies.

gva.co.uk
Appendix F Abbreviations and Glossary of terms used

gva.co.uk
Appendix F – Abbreviations and Glossary of terms used ABI – The Association of British Insurers collects extensive data from across the insurance industry including property data. ABI data has been used in this study. BRES – The Business Register and Employment Survey is the official source of employee and employment estimates by detailed geography and industry, which have been used in this study. EEFM – The East of England Forecasting Model (EEFM) was developed by Oxford Economics to project economic, demographic and housing trends in a consistent fashion. It covers a wide range of variables, and is designed to be flexible so that alternative scenarios can be run. The EEFM provides forecasts for the East of England region and sub-regions (counties, unitary and district authorities), including the South East Midlands Local Enterprise Partnership area (East of England Local Government Association, 2013). FEMA – The Functional Economic Market Area (FEMA) is a key economic market that broadly corresponds to sub-regions or city regions, rather than administrative boundaries, as flows often overlap local authority boundaries. There is no universal approach to defining FEMAs, and they are often developed using census commuting data, and supplementing this with data from other key markets: such as housing markets; supply chains in industry and commerce; and service markets for consumers. The 2010 CLG Report ‘Functional Economic Market Areas – and Economic Note’ provides further information on FEMAs. GDP – Gross Domestic Product is the monetary value of all the finished goods and services produced within a country's borders in a specific time period, usually calculated on an annual basis. Nomis – This is a service provided by the Office for National Statistics, which provides access to the most detailed and up-to-date UK labour market statistics, which have been used in this study. MKC – Milton Keynes Council is the Local Authority for Milton Keynes which has commissioned this study, together with Milton Keynes Development Partnership. MKDP – Milton Keynes Development Partnership is an independent legal entity wholly owned by Milton Keynes Council to facilitate Milton Keynes’ continued growth and economic success. It does this by promoting the development of its land assets in line with the Council’s Corporate Plan and Economic Development Strategy. ONS –The Office for National Statistics is the UK’s largest independent producer of official statistics and is the recognised national statistical institute for the UK, which conducts the Census for England. It is responsible for collecting and publishing statistics related to the economy, population and society at national, regional and local levels. ONS data has been used in this study. NPPF - The National Planning Policy Framework sets out the government’s planning policies for England and how they are expected to be applied. It provides guidance for local planning authorities and decision-takers, both in drawing up plans and making decisions about planning applications (CLG, 2012). NPPG – The National Planning Practice Guidance helps to put the strategic vision set out in the NPPF into practice. It contains practical information for local authorities such as what the policies in development plans should and should not include. SEMLEP – The South East Midlands Local Enterprise Partnership is collaboration between local authority and private sector partners, committed to delivering the strategic infrastructure and skills projects that are essential for economic growth, new jobs and new homes, in the South East Midlands. VOA – The Valuation Office Agency is an executive agency, sponsored by HM Revenue and Customs. It provides the government with valuations and property advice, and produces statistics, which have been used in this study.

gva.co.uk
Appendix G References
gva.co.uk
Appendix G – References Milton Keynes Annual Monitoring Report 2011/2012 Milton Keynes Core Strategy Employment Technical Paper 2012 MKC/MKDP data on employment site allocations Milton Keynes Core Strategy submissions by third parties on employment site allocations SEMLEP Strategic Economic Plan 2014 GVA Economic and Property Market Review May 2015 LSH Office Market Databook 2014 Bidwells Business Space Databook 2014 Focus database – Milton Keynes office and industrial data 2014 Milton Keynes Council Local Economic Assessment, 2013 Centre for Cities Outlook 2015 Annual Monitoring Report 2014