mindanao poverty reduction: integrated agricultural
TRANSCRIPT

MINDANAO POVERTY REDUCTION: INTEGRATED AGRICULTURAL DEVELOPMENT
Glenn P. Jenkins, Queen’s University, Kingston, Canada.
Eastern Mediterranean University, North Cyprus.
Gangadhar P. Shukla
Harvard Institute for International Development
Development Discussion Paper Number: 1996-4
Abstract The Bukidnon Province in Mindanao Island is a rural area with one of the highest poverty levels in the Philippines. About 60 percent of the farm families lives below the poverty line. Nonetheless, the Buckidnon Province offers location and climatic advantages for the development of a high-value horticultural industry. Bukidnon Resource Company Inc. (BRCI) proposes to exploit the potential of the region by setting up a plant for the production of tomato paste. This paper study the project from various points of view (BRCI, tomato growers, the economy) illustrates the advantages that an integrated financial-economic-distributive approach brings to project evaluation.
Report prepared by: Harvard Institute for International Development JEL code(s): H43 Key words: Philippines, integrated investment appraisal, poverty alleviation, tomato paste production.
1
MINDANAO POVERTY REDUCTION:
INTEGRATED AGRICULTURAL DEVELOPMENT
by
Glenn P. Jenkins
Gangadhar P. Shukla
Harvard Institute for International Development February 1996

2
Acknowledgments
The authors are grateful to George Whitlam and Jess Zarandin of the Asian Development
Bank for all their help in making this case study possible. Their comments and suggestions have
proved very valuable. The assistance of Mario Marchesini, Jennifer Cannell, Baher El-Hifnawi
and Pastor Lorenzo Jr. on the completion of this report are greatly appreciated. The authors also
like to thank the Asian Development Bank for providing the data and information used in the
study.

ii
Glenn P. Jenkins is an Institute Fellow at the Harvard Institute for International Development (HIID) at Harvard University, Director of HIID Program on Investment Appraisal and Management (PIAM), and Director of Harvard’s International Tax Program. Gangadhar P. Shukla is a Research Associate at HIID.

iii
TABLE OF CONTENTS Overview v I. Introduction 1 II. Project Description 3 A. Project Rationale and Scope 3 B. Project Cost and Financing 4 III. The Philippines’ Tomato Paste Market 6 IV. Financial Analysis 8 A. Assumptions 8 B. Methodology 10 C. Cash Flows and Results 11 V. Economic Analysis 16 A. Estimation of Conversion Factors 16 B. Results 21 VI. Sensitivity of Financial NPV and Risk Analyses 25 A. Sensitivity Analysis 25 B. Risk Analysis 29 VII. Distributive Analysis 36 VIII. Conclusions 39
iv
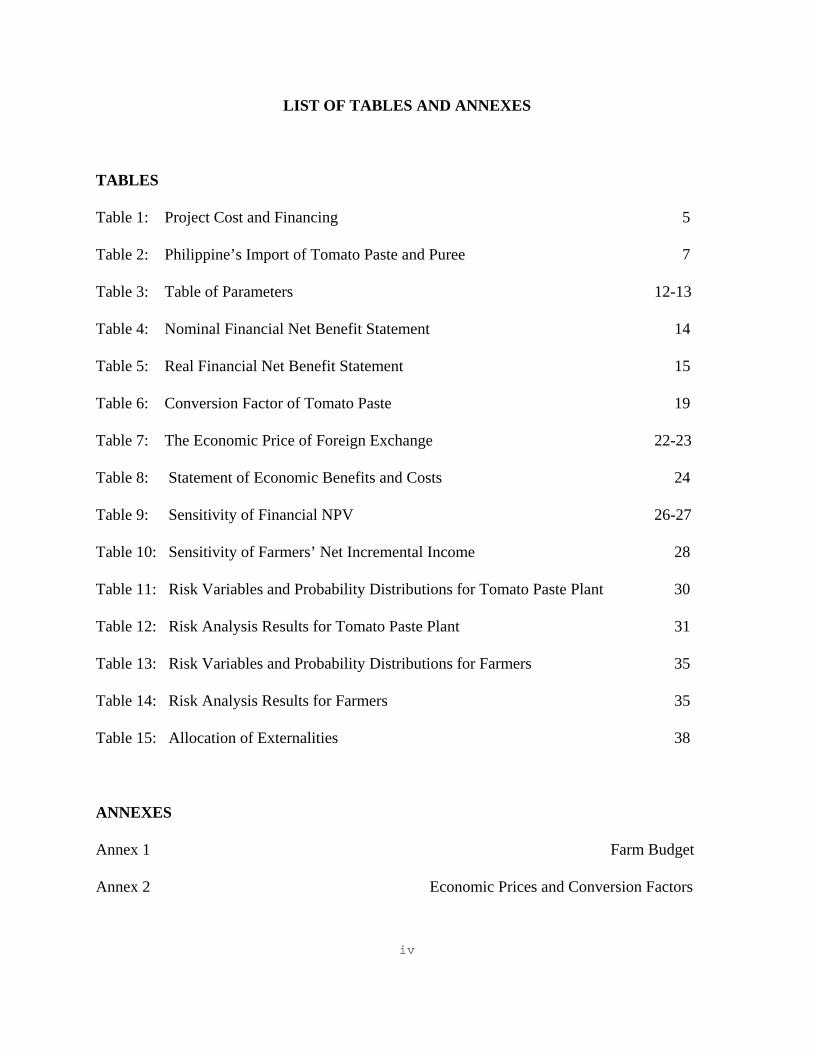
LIST OF TABLES AND ANNEXES TABLES Table 1: Project Cost and Financing 5 Table 2: Philippine’s Import of Tomato Paste and Puree 7 Table 3: Table of Parameters 12-13 Table 4: Nominal Financial Net Benefit Statement 14 Table 5: Real Financial Net Benefit Statement 15 Table 6: Conversion Factor of Tomato Paste 19 Table 7: The Economic Price of Foreign Exchange 22-23 Table 8: Statement of Economic Benefits and Costs 24 Table 9: Sensitivity of Financial NPV 26-27 Table 10: Sensitivity of Farmers’ Net Incremental Income 28 Table 11: Risk Variables and Probability Distributions for Tomato Paste Plant 30 Table 12: Risk Analysis Results for Tomato Paste Plant 31 Table 13: Risk Variables and Probability Distributions for Farmers 35 Table 14: Risk Analysis Results for Farmers 35 Table 15: Allocation of Externalities 38 ANNEXES Annex 1 Farm Budget Annex 2 Economic Prices and Conversion Factors

1
MINDANAO POVERTY REDUCTION:
INTEGRATED AGRICULTURAL DEVELOPMENT
I. Introduction
The agriculture sector in the Philippine grew at an annual rate of about 2 per cent between
1987 and 1992. During this period, some important policy reforms were implemented in the sector,
including the dismantling of trading monopolies in the coconut and sugar industries, the removal of
export taxes on agricultural commodities, and the liberalization of regulations on imports of
feedstock and feed ingredients. Despite these policy reforms, growth in the sector fell short of the
projected average annual growth rate of 5 per cent. The dismal performance of the agricultural
sector was partly due to its poor linkages with the rest of the economy, particularly the industrial
sector. A lack of coordinated development initiatives in various sectors of the economy has
resulted in an agricultural sector that is focused on the production of primary products, and an
industrial sector that is dominated by import-dependent manufacturing and processing industries.1
Under the Medium-Term Philippine Development Plan (MTPDP) for 1993-1998, the
government is committed to stabilizing the country's investment climate in order to improve
investor confidence and to reinforce structural reforms. The major goals relating to the agro-
industrial development for the current MTPDP include: (i) restructuring industry to increase
international competitiveness and expand the production of goods and services for the domestic
and export markets; (ii) strengthening the production and ecological links between agriculture and
industry; and (iii) increasing the income, productivity and access to resources of the small
entrepreneurs, farmers, and fishermen.2
Under the current MTPDP the government is committed to promote industrial
decentralization to less developed areas of the country. The industrial ventures set up in these areas
1 Asian Development Bank (ADB),”Loan Report - Bukidnon Resources Co., Inc. (Philippines)”, Manila, Philippines, August 1993, pp. 1-2.
2 Ibidem, p. 2.

2
will benefit from fiscal incentives such as tax-free imports of plant and equipment and income-tax
holidays during the early years of operation.3
3 Ibidem, p. 2.
3
II. Project Description
A. Project Rationale and Scope
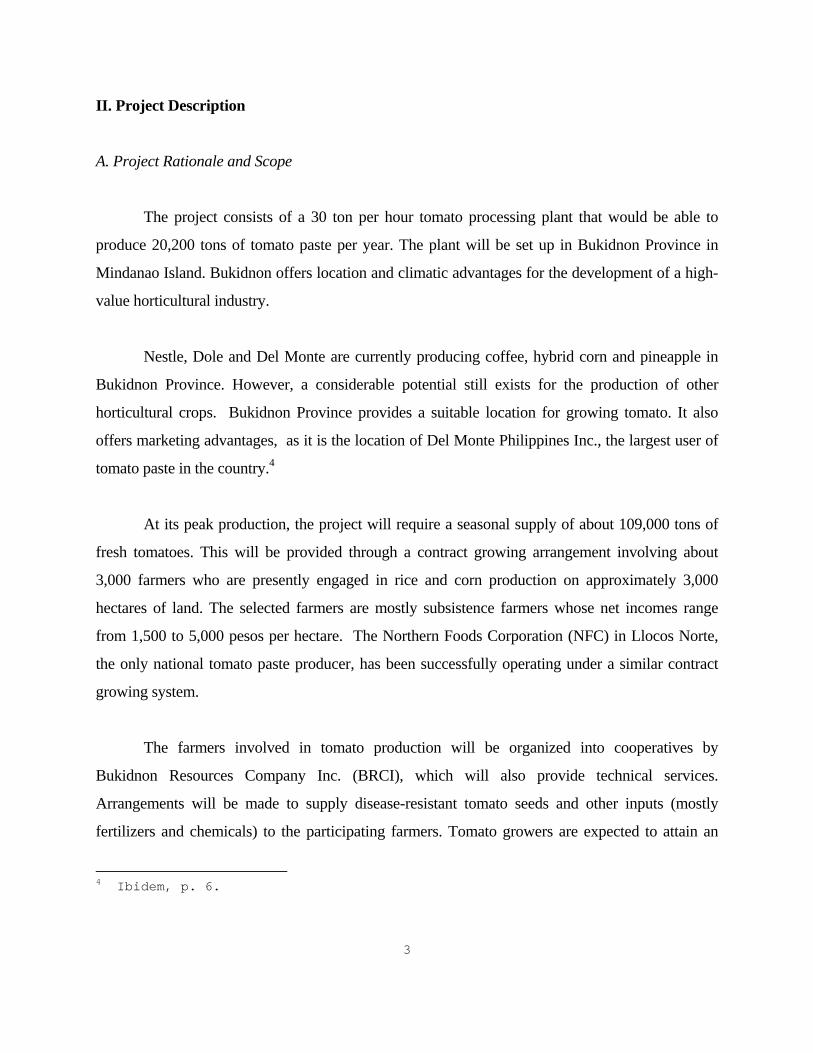
The project consists of a 30 ton per hour tomato processing plant that would be able to
produce 20,200 tons of tomato paste per year. The plant will be set up in Bukidnon Province in
Mindanao Island. Bukidnon offers location and climatic advantages for the development of a high-
value horticultural industry.
Nestle, Dole and Del Monte are currently producing coffee, hybrid corn and pineapple in
Bukidnon Province. However, a considerable potential still exists for the production of other
horticultural crops. Bukidnon Province provides a suitable location for growing tomato. It also
offers marketing advantages, as it is the location of Del Monte Philippines Inc., the largest user of
tomato paste in the country.4
4 Ibidem, p. 6.
At its peak production, the project will require a seasonal supply of about 109,000 tons of
fresh tomatoes. This will be provided through a contract growing arrangement involving about
3,000 farmers who are presently engaged in rice and corn production on approximately 3,000
hectares of land. The selected farmers are mostly subsistence farmers whose net incomes range
from 1,500 to 5,000 pesos per hectare. The Northern Foods Corporation (NFC) in Llocos Norte,
the only national tomato paste producer, has been successfully operating under a similar contract
growing system.
The farmers involved in tomato production will be organized into cooperatives by
Bukidnon Resources Company Inc. (BRCI), which will also provide technical services.
Arrangements will be made to supply disease-resistant tomato seeds and other inputs (mostly
fertilizers and chemicals) to the participating farmers. Tomato growers are expected to attain an

4
average yield of 40 tons per hectare, which will increase to 52 ton per hectare at full development
in the fifth year of project implementation.
The contract growing arrangement will also include a credit package under a tripartite
agreement among the farmers, the Land Bank of the Philippines and BRCI. The credit package will
be provided to farmers for the purchase of production and irrigation equipment and farm supplies.
BRCI will act as the conduit for delivery of inputs and collection of loan repayments.
The analysis of a typical farm budget under the contract growing arrangement indicates
that a tomato grower should earn a net return of about 25,850 pesos per hectare after debt servicing
(Annex 1, p. 43).
B. Project Cost and Financing
The total project cost at the 1993 price level (the starting year of the venture) is estimated at
about US$ 22 million with a foreign exchange component of US$ 9.2 million. A breakdown of the
project cost and financing is presented in Table 1. As BRCI provides a credit package to tomato
growers starting from 1994, the project cost includes as initial working capital about 121 million
pesos of advances to farmers.

5

6
III. The Philippines’ Tomato Paste Market
The domestic market for tomato paste in the Philippines is dominated by sardine canneries,
which account for about 60 per cent of the total paste consumption in the country. Del Monte
Philippines Inc. and Hunts Philippines Inc. account for about 26 and 6 per cent respectively of the
entire consumption. These companies and other small food processors use tomato paste as a raw
material in the production of tomato catsup, tomato puree and tomato sauce, as well as in canned
beans, soup, and other meat and vegetable products. The annual domestic consumption of tomato
paste averaged at about 11,880 tons in the last five years.
The domestic demand for tomato paste traditionally has been met by local production and
imports. Local production accounts for about 40% of the country's total consumption. Northern
Foods Corporation, currently the only national tomato paste producer, has an annual production
capacity of 5,000 tons.
The imports of tomato paste and puree have ranged from 3,381 to 13,534 tons in the
1984-1991 period (Table 2). The country's major suppliers are Turkey, Chile, United States and
Taiwan.
The domestic consumption of tomato paste has been growing at an annual average rate of
about 16% from 2,300 tons in 1980 to 11,800 tons in 1991. The high growth rate is due to a rapid
rise in demand by the middle and high income class for products such as pasta, tomato catchup, and
other food preparations using tomato paste.
Based on the past pattern, the domestic consumption of tomato paste is expected to grow at
an average annual rate of 7.7% in the next ten years. Given this projected demand, the company is
expected to export from 47 to 20 percent of its production in the early years of operations. By the
year 2,000 domestic demand will again outstrip domestic production if production capacity in the
country does not increase. The percentage of exports is therefore expected to decline to 3.5% of the
total sales in later years of operations.

7
Table 2
Philippine’s Imports of Tomato Paste and Puree
Year
Volume (tons)
Value (‘000 dollars)
1982 5318 3914 1983 5115 3388 1984 3381 2407 1985 3556 2290 1986 6550 4224 1987 7034 4854 1988 13534 9798 1989 8605 6245 1990 6520 4762 1991 5157 3671
Source: National Census and Statistics Office, Philippine Foreign
Trade Statistics, 1983-1992.

8
IV. Financial Analysis
A. Assumptions
The financial viability of the project is calculated from the equity and total investment
points of view. A financial analysis is also conducted from the point of view of the suppliers of
tomato to the project. The parameters used to develop the cash flow statements in the deterministic
base case are detailed in Table 3 (pp. 12-13). The main assumptions underlying the analysis
include:
Capacity utilization - The plant is projected to operate at 30 per cent capacity during its first year of
operation, 83 per cent in the second year, and 90 per cent from the third year onwards. The first
year production will be constrained by the volume of fresh tomatoes available for processing due to
the start-up time required for establishing tomato production. The second year's capacity utilization
will be constrained again by farm yields. It is nonetheless expected that almost all the targeted
3,000 hectares will be planted by then. A capacity utilization of 90 per cent is conservatively
assumed for the project life, as a full supply of good qualities tomatoes may not be guaranteed
every year.
Domestic sales - Three varieties of tomato paste are planned for production. Manila Premium is
primarily meant to be sold in metropolitan Manila. A second variety, Del Monte, will be produced
specifically for Del Monte Philippines Inc., the largest consumer of tomato paste in the country.
BRCI has already reached a preliminary agreement with Del Monte Philippines on this regard. A
third brand, Manila Standards, is planned to be sold in and around Manila. It is of a slightly
inferior quality, particularly in term of packaging, and will be sold at a lower price (91.57% of the
price of Manila Premium).
Export - The company will start exporting in the second year of production. Exports are expected
to vary between 46 to 20 per cent of the total sales from 1996 to 2000. The percentage of exports is
progressively expected to decline to a level of about 3.5% of the total production in later years as

9
domestic consumption increases. Japan is expected to be the major export market because of the
Philippine's competitive advantage over North American and European suppliers currently serving
the Japanese market.
Tomato paste price - The FOB prices for exports to Japan are used as the basis for computing the
price for export and domestic sales. The export price is based on the CIF Japan price of $877/ton.5
The company is estimated to realize a price of $838/ton ($877 less the transport/insurance cost of
$39/ton from Cagayan de Oro to Japan). At present, domestic prices are determined by the import
prices (the CIF Manila price of $842/ton) plus tariff, transport costs, and VAT. When the project is
implemented, domestic supply of tomato paste will exceed demand. Therefore, part of production
will be exported, making the domestic price fall until it equals the export price. Each of the
national producers will have an incentive to lower its price and sell in the domestic market as long
as the domestic price is above the FOB price.
Fresh tomato price - The farmers under the contract growing arrangement will be growing
tomatoes for the purpose of supplying raw material to the project. The price of raw tomatoes is
based on the currently prevailing price in Metro Manila, and the price being paid by Northern
Foods Corporation (NFC) to its own contract growing farmers.
Terms of borrowing - The two loans from ADB and the other institutional investors are is in US
dollars at a fixed nominal interest rate of 8.8 per cent plus a commitment fee of 1 per cent per
annum. Loan repayment is set for five years with a grace period of one year.
Corporate income tax - The company starts paying income tax in year 2001, as it benefits from a
six year tax holiday due to its nature (preferred area of investment) and location (rural area).
Income tax is levied at a rate of 35 per cent.
5 The CIF Japan price of $877/ton is based on the FOB San Francisco price of $737/ton and the freight/insurance cost of $140/ton.
10
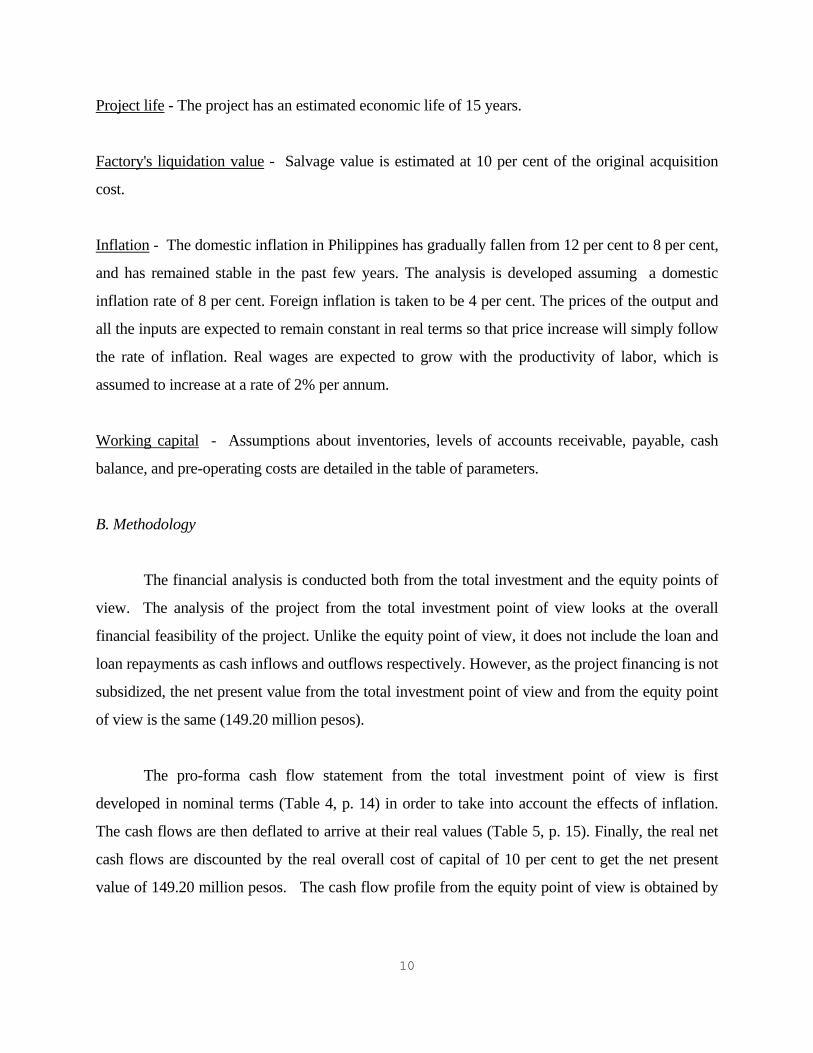
Project life - The project has an estimated economic life of 15 years.
Factory's liquidation value - Salvage value is estimated at 10 per cent of the original acquisition
cost.
Inflation - The domestic inflation in Philippines has gradually fallen from 12 per cent to 8 per cent,
and has remained stable in the past few years. The analysis is developed assuming a domestic
inflation rate of 8 per cent. Foreign inflation is taken to be 4 per cent. The prices of the output and
all the inputs are expected to remain constant in real terms so that price increase will simply follow
the rate of inflation. Real wages are expected to grow with the productivity of labor, which is
assumed to increase at a rate of 2% per annum.
Working capital - Assumptions about inventories, levels of accounts receivable, payable, cash
balance, and pre-operating costs are detailed in the table of parameters.
B. Methodology
The financial analysis is conducted both from the total investment and the equity points of
view. The analysis of the project from the total investment point of view looks at the overall
financial feasibility of the project. Unlike the equity point of view, it does not include the loan and
loan repayments as cash inflows and outflows respectively. However, as the project financing is not
subsidized, the net present value from the total investment point of view and from the equity point
of view is the same (149.20 million pesos).
The pro-forma cash flow statement from the total investment point of view is first
developed in nominal terms (Table 4, p. 14) in order to take into account the effects of inflation.
The cash flows are then deflated to arrive at their real values (Table 5, p. 15). Finally, the real net
cash flows are discounted by the real overall cost of capital of 10 per cent to get the net present
value of 149.20 million pesos. The cash flow profile from the equity point of view is obtained by

adding the debt cash flow to the net cash flow from the total investment point of view. The real
return on equity of 11.26 per cent real is used as the discount rate.
C. Cash Flows and Results
The cash flow profile of the project from the total investment and equity points of view is
presented in Figure 1. The project is quite profitable as shown by the high net present value.
Tomato growers will also gain from the project, as their net income per hectare increases more than
seven times up to 25,850 pesos (Annex 1, p. 43).
FIGURE 1 Cash Flow Profiles
Equity and Total Investment point of view
(300)
(250)
(200)
(150)
(100)
(50)
0
50
100
150
1993 1995 1997 1999 2001 2003 2005 2007 2009
Yearsmill
ion
peso
s
NCF equity NCF tot. inv.
11

12

13

14

15

16
V. Economic Analysis
Real economic flows are computed by adjusting the real financial cash flows from the total
investment point of view using appropriate conversion factors. Both the financial and the
economic analyses are expressed in domestic prices. This allows the distributional impacts of the
project to be estimated, by subtracting the financial values of inputs and outputs from the
corresponding economic values.
A. Estimation of Conversion Factors
The economic cost of foreign exchange used to calculate the conversion factors is found to
be worth 24.6% more than the market exchange rate6. This foreign exchange premium is mainly
due to the high level of import tariffs, and to the current account deficit which can be considered
only partially sustainable in the long run (Table 7, pp. 22-23). The conversion factors for the major
input and output variables were computed as follows:
Conversion factor for the output - The full economic benefit of tomato paste production by the
project may be seen from figure 2 (p. 18). Before the proposed plant comes into production, the
price that domestic suppliers receive (Ps1) is determined by the CIF price of imports plus tariff and
port charges, minus transport cost from the Northern Food Corporation (NFC) factory to Manila.
Domestic consumers pay Pd1 at the factory gate, which is Ps
1 plus a value added tax of 10 per cent.
The current domestic production is Q1, while the domestic consumption is Q2. The gap is met by
imports (Q2-Q1) of tomato paste. With the project in place, tomato paste becomes an exportable,
and the price domestic producers receive falls from Ps1 to Ps
2, which is the FOB price minus the
cost of local transport from project to port. The price domestic consumers pay falls to Pd2, which is
the factory gate price Ps2 plus the 10% VAT. As a result of the falling consumer and producer
prices, the domestic consumption increases to Q4 while the production by the previous producers,
6 Jenkins-Hifnawi, Economic parameters for the appraisal of investment projects: Bangladesh,Indonesia and the Philippines, HIID 1993.

NFC in this case, is reduced to Q3. The production beyond the domestically consumed quantity Q4,
i.e. Q5-Q4, will be exported.
The economic benefits of the project’s output fall into four categories: a) The economic
benefit of the quantity exported (Q5-Q4) equals the FOB value of the exports, FJQ5Q4, plus the
foreign exchange premium on the FOB value, minus the transportation costs from the factory to the
port (FJLK). b) The benefit of the additional consumption Q4-Q2 by the new domestic consumers
is the area under demand curve, BZQ4Q2. c) The benefit of the quantity Q2-Q1, which was
originally imported, is the benefit of import substitution. The country is now producing this
quantity rather than importing it. Its economic value equals the CIF value of the imports, GHQ2Q1,
plus the foreign exchange premium, minus the transportation costs from the factory to the port
(VWNM). d) Finally, the benefit of the quantity Q1-Q3, which is the cutback in production by the
other producers, is the savings in production inputs. This is shown by the area under the supply
curve, EAQ1Q3. The economic conversion factor for the project’s output is the weighted average
of these four components of the market response to the additional production.
These benefits may be quantified. The quantity produced by NFC (Q1) was 5,000 tons
before the project. The quantity consumed (Q2) was 11,880 tons, the difference of 6,880 tons was
imported. After the project, the producer’s price falls 17.39% from Ps1 to Ps
2. The cut back (Q1-Q3)
by the other domestic producers may be estimated if we know the price elasticity of supply of
tomato paste. For example, with an elasticity of supply of 1.5, a reduction in price by 17.39 percent
will mean a reduction of 26.08 per cent in production. This means that domestic producers will
lower their production of 1,304 tons, from 5,000 to 3,696 tons. As the total production by the
project is 20,200 tons, total domestic production will be 23,896 tons. Similarly, after the project,
the price consumers pay falls 17.39 per cent, and, if the price elasticity of demand of tomato paste
is -1, there will be a 17.39 per cent increase in the quantity consumed (i.e. (Q4-Q2) will be 2,066
tons) and domestic consumption will rise to 13,946 tons. With domestic production at 23,896 and
domestic consumption at 13,946 the Philippines will export 9,950 tons of tomato paste.
17

The calculation of the conversion factor is outlined in Table 6 (p. 19). The economic values
of these four components are estimated and their total is divided by the financial value of the output
of the project, which is simply the quantity of output multiplied by the new producer price Ps2. The
value of the conversion factor is 1.238. The conversion factor for the year 1995 (tomato paste is
not exported) is 1.038 (Annex 2D, p. 47).
FIGURE 2
Economic Benefit of Tomato Paste
23,144 = CIF
S+Project 27,577= Ps1
30,335= Pd1
23,045 = FOB 22,782 = Ps
2
25,060 = Pd2
S D
A
G H
Q1
B
E
F J WV
Q4
Q5
Z
Q3
LKNM
Q2
18

19

20
Conversion factor for the input - The conversion factor for tomatoes is based on the farm budget
(Annex 2, p. 44). The financial cost of cultivating one hectare is calculated. The economic cost of
cultivating one hectare is computed by adjusting the financial cost of the various production
components using their corresponding conversion factors. The opportunity cost of growing
tomatoes is also included as a financial/economic cost. This allows to take into account the
foregone benefits that have to be given up by not using the land to grow corn or rice. The
conversion factor of 0.651 is calculated by dividing the total economic cost per hectare by the
financial supply price of fresh tomatoes to the project.
Investment cost - The investment cost is broken down by its items (Annex 2B, p. 45). Each item is
further subdivided into imported and domestic components. The economic cost of imported and
domestic components of each item is then determined by multiplying the financial cost by the
appropriate conversion factor. The conversion factor for the total investment cost of 1.12 is finally
computed by dividing the total economic cost by the total financial cost.
Operating costs - Operating costs include labor, energy, processing overhead costs, packaging
materials, selling and administrative costs (Annex 2C, p. 46). The conversion factors for energy is
taken from the Jenkins-Hifnawi study. Labor is assumed to receive its market price and, therefore,
its conversion factor is 1. The conversion factor for processing overheads, which mainly involves
use of chemicals, is calculated based on the assumption that 30 percent of its components are
imported and the rest are domestic. The conversion factor for chemicals is taken from the Jenkins-
Hifnawi study.
Working capital - The conversion factor for accounts receivable is the same as the conversion
factor for tomato paste. The conversion factor for accounts payable is a weighted average of the
conversion factors of the direct costs (Annex 2C, p. 46). The conversion factors for changes in
cash balance and advances to farmers are taken as 1.
B. Results

21
The economic cost of capital for the Philippines used to discount the economic flow profile
of the project is estimated to be 10.3%7. This is a weighted sum of the gross-of-tax returns on
investment for various sectors, the net-of-tax saving rates for different categories of savers and the
marginal cost of foreign borrowing.
The economic statement of costs and benefits of the project is shown in Table 8 (p. 24). It
has a net present value of about 1,135 million pesos. The economic net present value is much
higher than the financial net present value mainly because of two reasons. First, the economic
value of the output is higher than the financial value. This is mostly due to a substantial premium
on the foreign exchange generated by export sales as well as on the foreign exchange saved by
local sales displacing imports. Second, the economic cost of producing tomatoes is much lower
than the financial supply price to the project.
7 Jenkins-Hifnawi, Economic Parameters for the Appraisal of Investment Projects: Bangladesh, Indonesia, and the Philippines, Hiid 1993. pp. 68-70.

22

23

24

25
VI. Sensitivity of Financial NPV and Risk Analyses
A. Sensitivity Analysis
Sensitivity analysis was performed to find the critical variables of the project. The
variables tested are: tomato paste price, fresh tomato price, domestic inflation, share of exports in
sales, capacity utilization, investment cost overrun. Results of the analysis are presented in Table
9.
Tomato paste price (FOB San Francisco) - The net present value of the project does not become
negative unless the international price in real terms falls below $640 per ton.
Fresh tomato price - The net present value does not become negative unless the raw material price
rises to 1,750 pesos per ton.
Capacity utilization - The project yields a positive net present value as long as it operates at more
than 80 per cent of the designed capacity. The production capacity is primarily a function of the
availability of raw tomatoes.
Investment cost overrun - The net present value remains positive even if there is an overrun of
more than 40 percent in the projected investment cost.
Exports share in sales - A rising share of exports in sales improves the project performance. This
is because the Manila Standard sells at a lower price as compared to the other two varieties sold
domestically.
Domestic inflation - The project loses with a rise in the level of domestic inflation, although the
impact is not dramatic. The net present value falls at a rate of approximately 2 per cent for each
percentage point increase in inflation.
Table 9

26
Sensitivity of Financial NPV to Changes in Tomato Paste and Fresh Tomato Prices
Tomato paste price
(pesos/ton)
Financial NPV
(million pesos)
Fresh tomato price
(pesos/ton)
Financial NPV
(million pesos)
587 -197 1050 364 637 -81 1150 311 687 34 1250 257 737 149 1350 203 787 265 1450 149 837 380 1550 95 887 495 1650 42 937 610 1750 -12 987 726 1850 -66 1037 841 1950 -120 1087 956 2050 -173
Table 9 (contd.)
Sensitivity of Financial NPV to Capacity Utilization and Investment Cost Over-runs
Capacity utilization percent of determ.
value
Financial NPV(million pesos)
Divergence from original cost
estimate
Financial NPV(million pesos)
60% -160 -10% 182 65% -121 -5% 165 70% -83 0% 149 75% -44 5% 133 80% -5 10% 117 85% 33 15% 101 90% 72 20% 85 95% 111 25% 68 100% 149 30% 52 105% 188 35% 36 110% 226 40% 20
Table 9 (contd.)
Sensitivity of Financial NPV to Domestic Inflation and Share of Exports in Sales

27
Domestic inflation Financial NPV
(million pesos) Actual exports as
percent of forecasted exports
Financial NPV (million pesos)
` 5% 161 10% 131 8% 149 20% 133 11% 140 30% 135 14% 132 40% 137 17% 125 50% 139 20% 120 60% 141 23% 114 70% 143 26% 109 80% 145 29% 105 90% 147 32% 100 100% 149 35% 96 110% 151
A sensitivity analysis was also conducted on the farmer's incremental net profit from
growing tomatoes. The variables tested were: price of fresh tomato, yield per hectare, and the cost
of production. The results are shown in Table 10.
The incremental income to the farmers remains positive for yields as low as 35 tons per
hectare (The average yield per hectare is expected to be around 52 tons per hectare). The net
returns per hectare are also positive for tomato price of 1,050 pesos per ton and a cost overrun of
more than 20 per cent. Therefore, the farmers face very little risk by participating in this project.
Table 10
Sensitivity of Farmers’ Net Incremental Income to Yield, Fresh Tomato Price, and Production Cost Over-run

28
Yield per hectare Incremental net
income (pesos)
Fresh tomato price(pesos/ton)
Incremental net income (pesos)
22 -17650 750 -10550 27 -10400 850 -5350 32 -3150 950 -150 37 4100 1050 5050 42 11350 1150 10250 47 18600 1250 15450 52 25850 1350 20650 57 33100 1450 25850 62 40350 1550 31050 67 47600 1650 36250 72 54850 1750 41450
Table 10 (contd.)
Production cost overrun
Incremental net income (pesos)
-4% 27478 -2% 26664 0% 25850 2% 25036 4% 24222 6% 23408 8% 22594 10% 21780 12% 20966 14% 20152 16% 19338
B. Risk Analysis
Risk analysis, using the Monte Carlo simulation technique, is applied to observe how the
financial and economic NPVs of the project respond to possible variations in the values of the

29
critical variables. After conducting the sensitivity analysis, we find the variables that have the
largest impact on the project’s profitability are: price of tomato paste, price of fresh tomato,
capacity utilization, and investment cost overruns. The domestic inflation rate and the real
exchange rate are also identified as risk variables. In this way, the analysis takes into consideration
the possibility that the real exchange rate in the Philippines may move through time by the forces of
the country’s demand and supply for foreign exchange or due to delays in the adjustment of
nominal exchange rate for cumulated inflation. The change in the real exchange rate is modeled by
multiplying the deterministic exchange rate by a coefficient of appreciation/depreciation (1+k),
where k is normally distributed with a mean of 0.
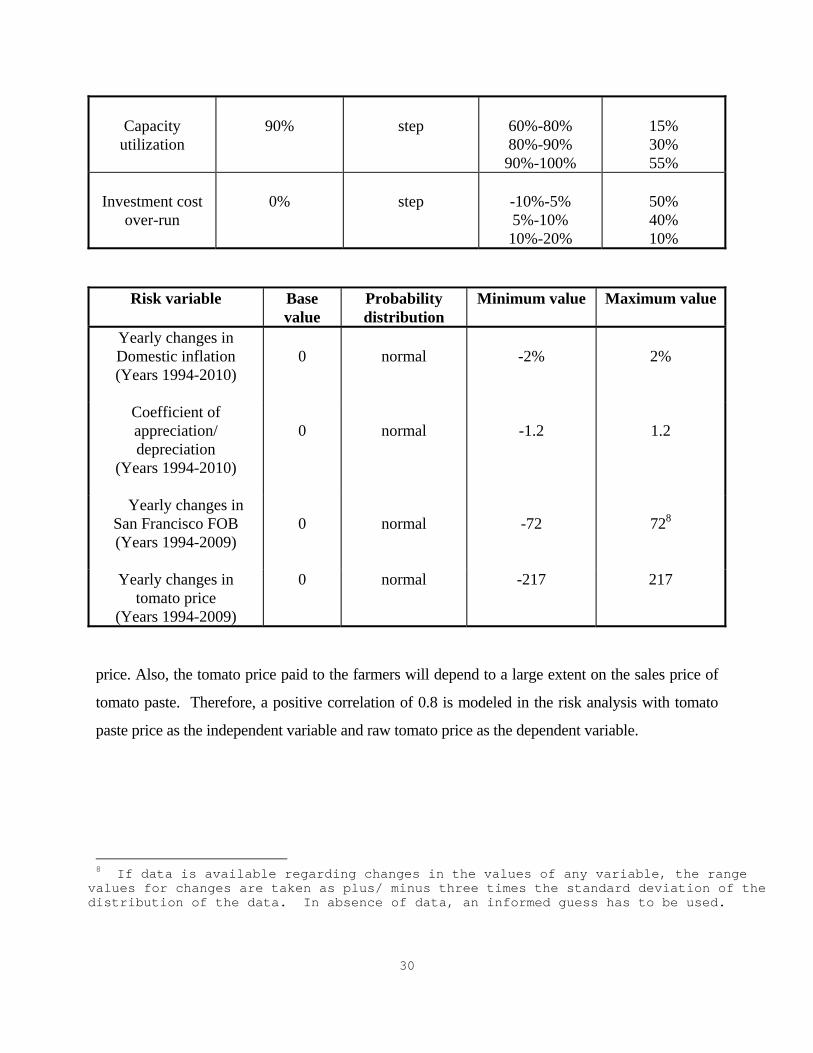
The probability distributions and range limits of the risk variables are shown in Table 11.
The changes in values of tomato paste price, raw tomato price and domestic inflation are
taken as risk variables with normal distributions. The actual value of tomato paste price, tomato
price and inflation in each year is partially correlated to its value in the preceding year, while the
change in variable is randomly taken every year.
The range of possible annual changes in nominal tomato paste price is based on the
historical average FOB San Francisco price of tomato paste. No such historical data is available
for raw tomato prices. Yearly changes will be in the range of plus or minus 15 per cent of the base
Table 11
Risk Variables, Probability Distributions, and Range Values For Tomato Paste Plant
Risk variable Base value Probability
distribution Range value Probability
30
Capacity
utilization
90%
step
60%-80% 80%-90% 90%-100%
15% 30% 55%
Investment cost
over-run
0%
step
-10%-5% 5%-10% 10%-20%
50% 40% 10%
Risk variable Base value
Probability distribution
Minimum value Maximum value
Yearly changes in Domestic inflation (Years 1994-2010)
0
normal
-2%
2%
Coefficient of appreciation/ depreciation
(Years 1994-2010)
0
normal
-1.2
1.2
Yearly changes in San Francisco FOB (Years 1994-2009)
0
normal
-72
728
Yearly changes in tomato price
(Years 1994-2009)
0 normal -217 217
price. Also, the tomato price paid to the farmers will depend to a large extent on the sales price of
tomato paste. Therefore, a positive correlation of 0.8 is modeled in the risk analysis with tomato
paste price as the independent variable and raw tomato price as the dependent variable.
8 If data is available regarding changes in the values of any variable, the range values for changes are taken as plus/ minus three times the standard deviation of the distribution of the data. In absence of data, an informed guess has to be used.

31
The rate of inflation is assumed to vary within the band of 5% to 11% with a mean value of
8%. It is also presumed that the yearly changes in domestic inflation will be in the range of plus
and minus 2 per cent.
Capacity utilization is modeled with a step distribution. The step values and the
probabilities are so chosen that the weighted average is the same as the one used in the
deterministic analysis. The range of values for capacity utilization from 1997 onwards takes into
consideration the possibility that the plant may not attain full capacity utilization because of
possible inadequate supply of fresh tomatoes. The expected value of the probability distribution is
equal to the deterministic value of 90%. Investment cost overrun is also modeled with a step
distribution.
The results of the risk analysis are shown in Table 12. Table 12 Risk Analysis Results for Tomato Paste Plant
Financial NPV
Economic NPV
NCF Year 1996
NCF Year 1997
NCF Year 1998
Expected value 106 1102 -32 23 36 Standard deviation 74 110 13 19 21
Coefficient of variation
0.7 0.1 -0.4 0.82 0.57
Minimum value -113 795 -70 -27 -24 Maximum value 346 1475 8 74 102
Prob. of neg.ve return 6% 0% 99% 10% 3%
The financial net present value has a small probability (6.0%) of becoming negative. On
the other hand, the risk analysis confirms the results of the economic evaluation, indicating that the
project has no chance of obtaining a negative economic return.
32
The distribution of possible values for the annual cash flows was also computed. In this
way, risk analysis also evaluates the year to year sustainability of the project. It turns out that in the
early years of production there is a substantial chance of ending up with negative net cash flows.
The probability of obtaining a negative cash flow in year 1996 is 99%. This is because the plant
does not achieve its full capacity and the loan repayment also begins in year 1996. There still
remains a small probability of the cash flows becoming negative (from 10% to 3.0%) from year
1997 to 2000, but there is no such probability in the subsequent years when the repayment of loan
is complete. A restructuring of the financing plan or, alternatively, further financing arrangements
would have to be made to cover the cash flows deficits.
The probability distributions for the financial and the economic net present values are
shown in Figure 3. The probability distributions of the net cash flows from year 1996 to 1998 are
presented in Figure 4.

33

34
A risk analysis was also conducted on the farmer's incremental net profit per hectare. The
risk variables used to run the simulation and the details of their distributions of probability are
shown in Table 13.
Table 13
Risk Variables, Probab. Distributions, and Range Values for Farmer's Increm. Net Income
Risk variable Base value Probability distribution
Minimum value Maximum value
Fresh tomato price
1450 (pesos per ton)
normal 1015 1885
Yield
52 tons per hectare
Step
Range value
32-42 42-52 52-62 62-72
Probability
10% 40% 40% 10%
Production cost factor
0
Step 0%-10% 10%-20% 20%-30%
60% 30% 10%
The results show that there is a 6 per cent probability that the farmer's incremental net
income would be negative (Table 14). The coefficient of variation is 0.675 per cent.
Table 14
Risk Analysis Results for Farmers’ Incremental Net Income (in pesos)
Expected value 21919
Standard deviation 14787
Coeff. of variation 0.675
Minimum value -14588
Maximum value 67210
Probab. of negative return 6%
VII. Distributive Analysis

35
A project generates externalities when its financial cash inflows and outflows differ from
their respective economic values. The purpose of distributive analysis is to establish who is gaining
or losing by the implementation of the project.
The steps followed in distributive analysis are:
i) identification of externalities item by item by subtracting the financial (total investment
perspective) from the economic flows.
ii) reduction of each item’s flow of externality into a single figure by computing the present value
of each stream at the economic discount rate.
iii) allocation of the externalities to various affected groups in the economy.
The net present value (at the economic cost of capital) of the externalities generated by the
project amounts about 1,000 million pesos. The analysis of the allocation of externalities is
presented in Table 15.
The farmers will realize a gain of 369 million pesos. This externality results from the huge
difference between the price farmers actually receive and the economic cost of production.
The fall of tomato paste price in the domestic market due to the project generates important
distributional impacts. The consumers of tomato paste will realize an externality of 346 million
pesos. Existing producers will have a loss of 106 million pesos9. The government will have a total
9 The annual distributive impacts of producing tomato paste calculated at the
1993 price level amount about 109 million Pesos. Consumers gain from the
project a surplus of 68.1 million Pesos. The loss in producer surplus from
reduced production of existing suppliers is equal to 20.8 million Pesos. The
government will realize a net gain of 62.3 million Pesos. The ratios of the
net gain/loss of each party out of the total distributive impacts of tomato
paste production have been calculated. These ratios are used in Table 15 to
allocate the present value of the externalities of producing tomato paste (557
million pesos) among consumers, existing suppliers and the government.

36
gain of about 390 million pesos. The government loses VAT and tariff revenues from imports as a
result of the import substitution. However, the government is a net gainer, as the premium on the
foreign exchange generated from additional exports and imports replaced plus the VAT revenue
on the expansion of domestic consumption after the project are larger than the loss.

37

38
VIII. Conclusions
The project is attractive both from the financial and economic points of view.
The economic net present value is much higher than the financial net present value because
of the premium on the foreign exchange generated by export sales, the premium on the foreign
exchange saved by domestic sales displacing imports, and the low economic cost of production of
tomatoes vis-à-vis the financial supply price to the project.
The main variables that affect the project's profitability are tomato paste, fresh tomato
prices and capacity utilization. The risk analysis reveals that the financial net present value has a
negligible chance of becoming negative while the economic net present value will remain positive
over the chosen range of values for the risk variables. However, there is a substantial probability of
ending up with negative net cash flows in the early years of production due to the loan repayment.
Hence, a restructuring of the financing plan or, alternatively, further financing arrangements would
have to be made to cover the cash flows deficits.
The farmers have a very high net incremental income from their participation in the project.
Their current annual earning per hectare is about 3,250 pesos, and increases more than seven times
to 25,850 pesos as a result of the project. The risk analysis shows that the farmers face very little by
participating to the project.
The farmers, the government and the consumers would gain if the project were
implemented. The farmers would realize externalities amounting to 369 million pesos while the
government would have a net gain of 390 million pesos. Because of the fall in domestic tomato
paste prices, consumers would gain 346 million pesos, while existing competitors would lose 106
million pesos.

39