minds & machines
TRANSCRIPT
Imagination at work
Jeff Immelt October 9 2014
GE Minds amp Machines
This document contains ldquoforward-looking statementsrdquo ndash that is statements related to future not past events In this context forward-looking statements often address our expected future business and financial performance and financial
condition and often contain words such as ldquoexpectrdquo ldquoanticipaterdquo ldquointendrdquo ldquoplanrdquo ldquobelieverdquo ldquoseekrdquo ldquoseerdquo ldquowillrdquo ldquowouldrdquo or ldquotargetrdquo Forward-looking statements by their nature address matters that are to different degrees uncertain
such as statements about expected income earnings per share revenues organic growth margins cost structure restructuring charges cash flows return on capital capital expenditures capital allocation or capital structure dividends
and the split between Industrial and GE Capital earnings For us particular uncertainties that could cause our actual results to be materially different than those expressed in our forward-looking statements include current economic and
financial conditions including interest and exchange rate volatility commodity and equity prices and the value of financial assets the impact of conditions in the financial and credit markets on the availability and cost of General Electric
Capital Corporationrsquos (GECC) funding and its exposure to counterparties the impact of conditions in the housing market and unemployment rates on the level of commercial and consumer credit defaults pending and future mortgage
securitization claims and litigation in connection with WMC which may affect our estimates of liability including possible loss estimates our ability to maintain our current credit rating and the impact on our funding costs and competitive
position if we do not do so the adequacy of our cash flows and earnings and other conditions which may affect our ability to pay our quarterly dividend at the planned level or to repurchase shares at planned levels GECCrsquos ability to pay
dividends to GE at the planned level which may be affected by GECCs cash flows and earnings financial services regulation and oversight and other factors our ability to convert pre-order commitmentswins into orders the price we
realize on orders since commitmentswins are stated at list prices customer actions or developments such as early aircraft retirements or reduced energy demand and other factors that may affect the level of demand and financial
performance of the major industries and customers we serve the effectiveness of our risk management framework the impact of regulation and regulatory investigative and legal proceedings and legal compliance risks including the
impact of financial services regulation adverse market conditions timing of and ability to obtain required bank regulatory approvals or other factors relating to us or Synchrony Financial that could prevent us from completing the
Synchrony split-off as planned our capital allocation plans as such plans may change including with respect to the timing and size of share repurchases acquisitions joint ventures dispositions and other strategic actions our success in
completing announced transactions such as the proposed transactions and alliances with Alstom and our ability to realize anticipated earnings and savings our success in integrating acquired businesses and operating joint ventures the
impact of potential information technology or data security breaches and the other factors that are described in ldquoRisk Factorsrdquo in our Annual Report on Form 10-K for the year ended December 31 2013 These uncertainties may cause our
actual future results to be materially different than those expressed in our forward-looking statements We do not undertake to update our forward-looking statements
This document includes certain forward-looking projected financial information that is based on current estimates and forecasts Actual results could differ materially This document may also contain non-GAAP financial information
Management uses this information in its internal analysis of results and believes that this information may be informative to investors in gauging the quality of our financial performance identifying trends in our results and providing
meaningful period-to-period comparisons For a reconciliation of non-GAAP measures presented in this document see the accompanying supplemental information posted to the investor relations section of our website at wwwgecomrdquo
In this document ldquoGErdquo refers to the Industrial businesses of the Company including GECC on an equity basis ldquoGE (ex-GECC)rdquo andor ldquoIndustrialrdquo refer to GE excluding Financial Services
GErsquos Investor Relations website at wwwgecominvestor and our corporate blog at wwwgereportscom as well as GErsquos Facebook page and Twitter accounts contain a significant amount of information about GE including financial and
other information for investors GE encourages investors to visit these websites from time to time as information is updated and new information is posted
2
Summary
A different company Execution in 2014
+ Execute on financial framework
+ Achieve 75 Industrial by 2016 amp
grow EPS
+ Invest in restructuring to drive Industrial earnings
+ Disciplined amp balanced capital allocation
On track
+ Alstom ndash Appliances
ndash Synchrony IPO
$4B+ since 2012 2014 restructuring
gt gains (~$09)
Dividend +16 Synchrony split hellip
shares to lt95B
Much better portfolio
Tangible technology advantage
Superior global position
Way ahead on analytics
Culture of simplification
1
2
3
4
5
Status
3
Portfolio transformation
Actions taken in 2014 hellip
44 53
56 47
2003 2013 2016F
GE earnings mix
Industrial
GE Capital
Divest
Insurance
Reinsurance
Global consumer
Red assets
Media
Plastics
Silicones
Supply
Appliances
Rebuild Industrial
Dist Power
Life Sciences
Renewables
Oil amp Gas
Water
Av Systems
Power Conv
Services + IT
Completed 15 IPO in 3Q
Well received by market
On track for split-off
Acquiring Power amp Grid
Strong synergies
Targeting close in rsquo15
Sale to Electrolux for $33B
Continued use of GE brand
Targeting close in rsquo15
Premier
Infrastructure
Specialty
Finance ~25
~75
GE Appliances
Actions taken
(Operating earnings-a))
(a- Continuing earnings adjusted for non-operating pension income(expense) in 2003 and 2013 of $16B and $(17)B respectively
4
GE Industrial enterprise advantages
GE businesses
Power amp Water
Aviation
Oil amp Gas
Healthcare
Transportation
Energy Management
All businesses benefit from GErsquos enterprise scale
Enterprise scale
TechnologyNPI (GRC)
Growth markets
(GGO)
Service amp Analytics (Services Council)
Lean structure (Simplification)
Performance
Organic growth gt peers
Margins at ~17 by rsquo16
Returns at ~17 by rsquo16
Consistent earnings growth
5
Leadership in technology ($ in billions)
RampD spend
2012 2013 2014E
$55 $52 =minus
5 of
revenue =minus 5
Key wins
Worldrsquos largest amp most efficient
H-class hellip 614 in combined cycle
13 units in backlog
First to market hellip 1000+ Tier 4
compliant locos on order for 2015+
Won 77 of all narrowbody
competitions since launch
Industryrsquos first 20000-psi hellip reliable
performance in ultra-deep water
Image quality amp capability from low dose
Best-in-class next gen products Advanced manufacturing solutions
to grow margins Leadership across core amp new
product markets
HA gas turbine
Tier 4 loco
LEAP
20k psi
Revolution CT
FastWorks driving speed amp efficiency
6
Scalable across other businesses
Innovation for cost amp speed
1 2 3 4 5 6
Changing the traditional learning curve
Yr
Traditional
Start
Lower
Accelerate
Faster Redefine
Entitlement
Product cost focus areas
Lean labs amp additive technology
Data in the factory
Services delivery cost
Sourcing relationshipsmake vs buy
Footprint and organizational focus
Driving cost with analytics
Full flight data ( of flights)
2 340 1500 Data Volume (Tera Bytes)
GErsquos analytics advantage hellip
15k
Segment by severity of operations
Segment by part
performance
Customized maintenance
cycle + =
Aviation product cost
2013 2014E 2015F
34M
~10M
7
Accelerating in growth markets
10 13 14E Post-Alstom
Driving growth
$29
++
++
Strategic imperatives
Be first mover in localization
Plant new flags Invest in local capability Leadership Manufacturing strength GRC amp innovation Customer support ldquoConnect the dotsrdquo of GE Healthcare amp Oil amp Gas lead Every facility ldquomulti-productrdquo Best partners brand amp risk
management Financing knowledge
1
2
3
$46
Growth market orders
36 44 + +
+ Premier scale amp reach + Best capability
17 AAGR
of
total
($ in billions)
8
Simplification
+
+
+
Lean management Do fewer things better hellip with less structure
Speed amp competitiveness
Get faster amp smarter amp more efficient in everything we do using FastWorks
Commercial intensity
Connect every job to winning in the market while empowering the commercial team amp holding them accountable
Digital capability
Modernize our information technology so we can achieve the speed amp efficiency our scale
should allow
World-class structural cost
More NPI faster with less investment
Global market success
Accelerate margin enhancement
Worldrsquos most competitive company
9
Lower cost
Industrial SGampA sales
175
rsquo12
~12
159 ~14
rsquo13 rsquo14E rsquo16F rsquo15F
~13
($ in billions)
rsquo11
185
Enablers
ERP
90 reduction
Shared services
65 penetration
Corporate
$500MM cost out
+ of PampLs
Layersspan
Product cost
rsquo12-rsquo14E investment
Gains ~$25
Restructuring ~$(43)
10
Technology is evolving
PHYSICAL ANALYTICAL
Multiple materials in complex systemshellip hundreds of patents in each product
Operating with high efficiency amp durability in extreme conditions
1 gas turbine compressor blade monitoring potential 500 gigabytes per day
Combination of physical amp analytical drives next evolution of services
Customers will value data because it improves their efficiency
GE is well positioned to lead this wave of change
Investors will benefit through services growth amp margins + product share + IT-driven efficiency
1
2
3
4
Key messages
+
11
Transforming services
bull Partners amp field
technicians 80rsquos
Big iron
Airlines 1 fuel $2-3B
Utility 1 fuel $4-5B
Oil amp Gas 1 uptime $5-7B
Healthcare 1 productivity $4-5B
Transportation 1 mile velocity $1-2B
Driving customer outcomes
bull Risk sharing
service contract 00rsquos
CSA
bull Asset amp
operations
optimization
Today
bull Science applied
to repairs amp
upgrades 90rsquos
Repair
Power of 1
Annual impact-a)
Small changes in hellip fuel maintenance uptime productivity flexibility safety
labor effectiveness hellip have a big
impact on profitability
(a - Global industry estimates based on ldquoIndustrial Internet Pushing the Boundaries of Minds amp Machinesrdquo ndash Nov 26 2012
Analytics
12
GE leadership
Large high-tech installed base
Customer trust amp connection hellip ~$180B services backlog
Deep domain knowledge
GE advantages What it takes to win
bull Sensors
bull Service robotics
bull Connectivity
Enabling technologies
bull Connected IB
bull Physicsmaterials bull Smart devices
bull Global reach
Installed base
+
+
bull Software capability bull Industrial big data
bull Operating platform
bull Security
Data amp analytics Attracting new talent hellip
ldquohorizontal capabilityrdquo
Connecting domain amp data hellip CSA
Operating platform in place (PredixTM)
Large research capability
Industry partnerships
Collecting 50MM data elements
GE has all essential elements
Have
Have
Investing
13
Improving the service model
Asset optimization
Operations optimization
CSA productivity
CSA + Connected asset + Software revenue value ($IB) outcome sales
Data-driven execution
Maximize performance with no unplanned downtime
Increased system efficiency across GE
amp non-GE assets
Optimize material amp repair cycles
across IB
Make versus buy hellip build internal team
Launch new offerings hellip PredictivityTM
Build on existing CSA relationships hellip ldquowin-winrdquo
Develop a broader ecosystem
1
2
3
4
Investments 2010-14
Focus of innovation
How we execute
14
Asset performance management
Impact for GE hellip $IB productivity for customers hellip velocity productivity
SENSORSANALYTICS
On-site oil analysis Predict remaining life Prevent road failures
SERVICE ROBOTICS
Productivity safety Remote monitoring Tough environment
AUTOMATED DECISIONING
Optimize yard ops Reduce dwell 10 Depart on time up 50
ADVANCED CONTROLS
Auto Train Operation 10 fuel savings
15
Impacting GErsquos 1
$94B of cost
$12B of working capital
$20B of PampE investments
GErsquos 1
Analytics amp
security
IT investment ($2B+year)
+
Reduce structure
Lower product cost
Improve margins
Enhance engineering productivity
Faster amp safer
Impact
Every Industrial company a Software amp Analytical company
16
Investor value
Increase services growth rate
+ More $installed base
+ $08B PredictivityTM solutions revenue growing to $4-5B
+ Penetrate aged GE fleet
+ Grow beyond the GE IB
Improve services margins
+ CSA productivity
+ Improve quality
Potential for industry value
+ Scale beyond GE installed base Backlog Revenue Margins
Services franchise
~$180B
~$45B
~30
Value creation
+
1
2
3
Software amp analytics accelerate services growth margins amp returns
Revenue growth ~5 Margin expansion ~50 bps Limited by IB growth
Historic performance
Services overview
18
Services growth
05 08 11 13
($ in billions)
Revenue
~26 ~30
OP
GE advantages
+ Installed base
+ Technology
+ CSA model
+ Footprint amp scale
+ Software COE
+ Fleet data
$27
$35
$42 $45
Services imperatives
Backlog
1
2
3
Deliver on customer value + Link services to outcomes + Global deployment
Grow $installed base + Drive analytics amp PredixTM value + Penetrate aged installed base
Expand margins + Leverage analytics to manage
performance + Invest in productivity tools
Improve service execution amp delivery + Enhance commercial capabilities + Increase field services capability
Spread ideas across GE
$87 $121 $147 $180
4
5
19
Services Council
Driving differentiated advantage
Cross-business initiatives
20+ services leaders
Teams aligned to 9 themes
Quarterly executive updates hellip operational rigor
Spreading ideas hellip
bull Core growth
bull Operations
bull Tools + process
bull CSA excellence
Data +
Outcomes
bull PredixTM + Cloud
bull PredictivityTM solutions
bull Strategic alliances + BD
Hardware amp domain expertise
Software analytics based
Healthcare Inspection technology
Aviation Repair technology
Power amp Water Global footprint
bull Multimodal ndash service amp repair shops
bull Customer training centers
bull Additive manufacturing
bull Robotic welding
bull Advanced coatings
bull Parts inspection amp measurement
bull Condition-based maintenance
Pune India
20
Enabling technologies Service Robotics Sensing amp Controls Advanced Manufacturing
Inspection Repair Mobile Tools
Launch amp learn hellip then accelerate to all GE businesses
Automated adaptive + Productivity + Less downtime
High tech integrated + Lower fuel usage + Higher efficiency
Productivity safety + Repetitive tasks + Tough environment
Additive new materials + Repair vs scrap + Longer service life
Deployable fast accurate + More digital data + Less downtime
Connected digital + Instant expert access + Lower service costs
21
Increase value of CSA
Benefits for Customers Benefits for GE
Monitoring amp diagnostics
$180B Services backlog
Fuel efficiency
Hardware amp software upgrades
Condition-based work scope
Mobile amp analytical tools
Material productivity
Optimized asset performance
Predictive analytics ndash lower downtime
More output
Lower costs
Lower emissions
Better payback on hardware upgrades
Instant software upgrade capability
Shorter duration outages
Less material usage
Ask an Expert ndash COE
Field Service productivity
Analytics driven parts life extension + performance
Repair vs scrap
22
Segment services dynamics (Services revenue $ in billions)
Power amp Water $125
Oil amp Gas $83
Energy Management
2013
$21
+ Sustained passenger growth
+ Improving airline profitability
+ Upgrades amp analytics
Aviation $108
+ Growth markets strong
+ Improving HCIT
minus Developed challenging
Healthcare $80
+ North America utilization
+ Analytics penetration
minus Mining parts
Transportation
$28
2013
2013
2013
2013
2013
2013
+ Continued AGP growth
+ Upgrades amp analytics
Europe
+ Strong Subsea
+ MampC improving
+ Analytics penetration
+ Marine offshore
minus Mining amp motor repairs
23
Presentation
Common capability Software COE
Analytics commercialization
Bill Ruh
Kate Johnson
Business execution
Strategy overview
Customer outcomes
Examples of analytics driving growth amp productivity
Competitive advantage
Power amp Water
Healthcare
Aviation
Oil amp Gas
Transportation
Paul McElhinney
Jan De Witte
Kevin McAllister
Brian Palmer
Pete McCabe
Common capability GErsquos 1 Jamie Miller
Software amp PredixTM
Bill Ruh - VP Global Software Center
- 3 years with GE
- 32 years of industry experience
Kate Johnson - VP GE Commercial Officer
- 1 year with GE
- 15 years of industry experience
25
The Industrial Internet
3 Hyper connectivity a living network of the worldrsquos machines data amp people
Internet
Increasing system intelligence through embedded software hellip advanced sensors
controls and software applications
Brilliant Machines
Democratization of data hellip high frequency real-time data
Big Data
Predictive algorithms hellip physics-based analytics hellip deep domain expertise on big industrial data
Analytics
People at work Connecting people at work or on
the move Supporting more
intelligent design higher service
quality operations amp safety
maintenance
1
2
3
4
5
26
61
45
31 28 31 40 42
29
29
45 63
56 56
47 45
41
10 6 6
16 9 10 9
24
Software outlook Customer survey Importance of
Big Data analytics relative to other priorities
Source Accenture 2015 Trend Report Gartner Big Data Survey
Aviation
3 3 3 3 6
Wind
Power Generation
Power Distribution
Oil amp Gas
Rail
Manufacturing
Healthcare
Highest priority Within the top 3 priorities Within the top 5 priorities Not a top priority
Opex is becoming a deciding
factor for IT investments as
80 of budget is allocated to
managing and running
complex technologies Source Gartner
Advanced analytics and
analytical applications
expected to see double digit
revenue growth Source Gartner
APM market category
expected to reach $300B
by 2020 Source Gartner
27
Industrial customersrsquo perspective Survey of GErsquos customers regarding applications
Real-Time Operator Intelligence
Remote Monitoring amp Diagnostics
Condition-Based Maintenance
Asset Lifecycle Management
Schedule Optimization
Energy Management
Process Control Automation
Field Force Automation 32
38
42
43
49
59
66
70 Tailor Pre-Built Applications
Have A Systems Integrator Build
Your Apps
Build My Own Custom Apps 15
54
85
HOW do you want to consume it WHAT functionality is most valuable
Asset performance management is the killer industrial app
28
What industrial customers want
SDM
SDM
SDM
SDM SDM
Software Defined Machines (SDMs)
ldquoLink up all my assets and devicesrdquo
REAL-TIME
OPERATIONAL
INTELLIGENCE
CONDITION-
BASED
MONITORING
ASSET LIFECYCLE
MANAGEMENT
MONITORING amp
DIAGNOSTICS
Industrial Apps
SDM Non-GE Assets enabled by PredixTM Machine SDM
SDM GE Assets enabled by PredixTM Machine SDM
PredixTM powers Asset Performance Management (APM)
29
Insights into value
Improving safety and
productivity across 15K miles
of interstate natural gas
pipelines
Potential Savings
77 gallons of fuel and 1628
lbs of CO2 per approach
10 increase in network
velocity 50 reduction in
expired crews amp significant
improvements in on-time
performance
Up to 4 increase in power
output across 283 wind
turbines hellip 40+ GWhr annual
increase
Asset Performance Management (APM)
REAL-TIME OPERATIONAL
INTELLIGENCE
CONDITION-BASED
MONITORING
ASSET LIFECYCLE MANAGEMENT
MONITORING amp
DIAGNOSTICS
Operations Optimization
INSIGHT PROCESS
INTEGRATION
AUTOMATION COLLABORATION
PredixTM Platform
PredixTM Machine PredixTM Net
GE
Non-GE
PredixTM Asset PredixTM Insight
PredixTM Fabric PredixTM Core
PredixTM Experience
Predixtrade hellip the GE advantage
Release in 2015
Public Cloud Private Cloud
Commercially available to connect more machines more data amp more people
TR
AN
SF
OR
MS
PO
WE
RS
PredictivityTM Solutions
30
Predictivitytrade hellip app factory
Asset optimization (28)
Operations optimization (14)
Productivity tools (77)
Approach Development process
Agile amp Extreme Programming
Design Center for delivering
compelling user interface
Cyber security Blue team to build
and Red team to test
90-120 day service engagement to production roll out
+
+
+
Co-innovation process to design
build transfer and iterate
Actionable insight on equipment based
on physics and analytic modeling
with industrial data
Outcome based process improvements
to plants pipelines fleets fields facilities
grids shops
Increase service throughput efficiency
and quality at optimized cost of
delivery
Delivering industry apps at speed and scale
31
World-class Software amp Analytics organization
Investing in Leadership Talent
Colin Parris (IBM)
SW Research
Co-located SW CTOs for business alignment
D Bartlett
(IBM)
Aviation
World-class technical resources
Computational amp analytics scientists
Platform developers
Software engineers
~10000
1000+ Biz
COE
Product Dev Software CTO
Brad Surak (SAP)
Harel Kodesh (Microsoft
Start Up Veteran)
Trans S Chotai
(HP)
OampG J Demesa
(Siemens)
PampW G Bell
(ServiceSource)
EM J Stone
(SAP)
HC E Eryurek
(GE)
+
+
- Cyber UX Data Science Agile development
Four deep core competencies ecosystem
1
Leading edge platform + world-
class ecosystem 2
Advanced research for building
the future 3
Advanced process to drive adoption amp enablement
4
Software Site
Organization
Technology amp Ecosystem
32
Wurldtech protecting critical infrastructure
World-class cyber security to operate assets + operations safely
About A GE Company acquired in May 2014 providing top cyber talent
Capability Assess protect amp certify critical infrastructure from cyber attack
Key Customers 4 of 6 top global OampG companies 9 of top 10 automation vendors
Security enhancements delivered through PredixTM and GE Products
Certify GE and non-GE products and customer environments
Identify vulnerabilities in OT products (GE and 3rd party)
Assess and prioritize risks for system operators
Achilles Industrial Next Gen Firewall to inspect and control
Industrial network traffic
Leverage industry leading threat intelligence
Protect operational
environments
Secure amp certify industrial products
Assess products amp operations for vulnerabilities
33
Partnerships amp Alliances
Intel ATampT AWS Cisco others
Venture Capital
Mergers amp Acquisitions
ThetaRay Mocana Frost
Strategic Moves
Wurldtech Austin Digital
Acquire capability to fill gaps
Pivotal Softbank Industrial Internet Consortium
Industrial internet ecosystem
Industry Ecosphere
Establish interoperable amp scalable solutions
Co-development amp go-to-market
Accelerate innovation amp success
Positioned to create value
Open PredixTM beyond GE
GE will sell
+ + Connected devices
Data Under Management
Performance Applications
PredixTM Machine Services
PredixTM Data Services
PredixTM Asset Services
Connect assets regardless of vendor or
vintage and provide value-added services
Aggregate and analyze data to produce
actionable business insights
Sell horizontal apps that maximize return
on assets and people
1
2
3
34
Competitive advantage
$1T Connected
Machines
managed by GE
replacement value
10M Sensors
collecting
50M Data
Elements
$20B Potential
Annual Customer Savings
50B Machines will be connected on the internet by 2020
2X Industrial data growth within next 10 years
Big Iron + Big Data = Big Outcomes
INDUSTRY GE
35
New ways to sell Services
2 Making Markets Different Economics
3 Co-creation amp Agile Development
4 Solution Architecture
5 Value Based Deal Shapes
6 New Industry Ecosystems
1 New Buyers and Influencers
GE Commercial Center of Excellence
Needs Target Architect Close
Qualification amp Pipeline Management
Sales Process
HireTrain Community of Experts
Enablement Toolkit
36
Accelerating time to value across channels
APM Subscription Services
Enterprise Analytics Projects
Upgrade value in CSAs
GE Sales Model
Existing Services sales team
New standalone software sales specialists
New outcome sellers + existing service sales team
Sales
acceleration
Expert SWAT
teams to
support deal
SW experts compelling
offer target one outcome
to land and expand
Ecosystem partners
SW COE app factory
Offering RMampD in CSA upside
and productivity Per well subscription
Enterprise SW deal
solution co-creation
ReliabilityMaxtrade FieldVantageTM Intelligent PipelineTM
GE OampG Example
Market
Opportunity $2B $600MM $27B
37
Measuring commercial success
Services revenue
Past Future
~5
+
rsquo13 rsquo17F
Assets under management $1T+ ++
PredictivityTM solutions revenue $08B ~$4-5B
Services backlog $180B ++
bull Adding more value to existing service relationships hellip training team to get more out of the installed base
bull Creating new revenue streams and building new commercial skills and incentive plans to accelerate growth
Outcome sellers solution architects product management amp marketing
bull Cultivate ecosystem to help accelerate commercially with access to CIOCTO relationships and system integration skills
Power amp Water Paul McElhinney - President amp CEO Power
Generation Services
- In current role since May 2014
- 26 years with GE
39
Power amp Water Services
Growing services amp delivering greater customer value
Key metrics Services imperatives ($ in billions)
13 14E
+
Backlog $53 +
Revenue $125
Installed base dynamics
1
2
3
4
Deliver on customer value + Develop flexible solutions
+ Reduce customer operating cost
Grow $installed base + Maximize impact of Alstom alliance + Invest in new service offerings
Expand margins + Tech upgrades amp software solutions + Outage excellence
Improve service execution amp delivery + Improved customer service levels
+ Optimize field service amp repair network
Unit growth up ~24X from 2008
Strong DP amp Wind growthhellip up ~1Kyear
~4000+ gas turbines in service
40
Global power industry is facing complex challengeshellip Offering innovative solutions to address customersrsquo needs
Fuel price uncertainty
Increasing regulation
Slow demand growth
Aging installed base
~15 years Average age of ~4K global GE gas turbines
Output
Efficiency
Reliability
Availability
Flexibility
Improving customersrsquo outcomes while decreasing costs
~$7B
Customer challenges
~$8B
~$2B
~$1B
~$2B
GE Predictivitytrade solutions amp industry benefit
~60+ Increase in US natural gas price since 2012
~(30) Thermal capacity in Europe since lsquorsquo08
Based on 10 year NPV
41
Investing in technology
Addressing multiple customer value levers
Advanced Gas Path (AGP) Industry leading output hellip up to +64 Industry leading efficiency hellip up to +18 Extends asset amp parts life hellip 96K hours
1
Op Flex Delivers flexibility to costs amp revenue Reduces start up time amp fuel consumption Expands fuel source opportunity
3
Dry Low NOx 26+ (DLN) Reduces NOx emissions by 40 Delivers industry leading flexibility Increases maintenance intervals to ~1250 starts
2
42
Power FlexEfficiencytrade Advanced Gas Path
Expanding the operating envelope
Ambient Temperature
Ou
tpu
t (M
W)
Op Flex
7FA03 baseline
AGP
+ ndash
+
Combining hardware and software hellip creating 2X the value
$17
$30
Op Flex
Average Customer Annual Value Per Unit ($MM)
Improving customer outcomes
AGP (Hardware)
AGP PredictivityTM
Solution
125+ AGPs with software sold to date
650000+ operating hours to date
43
Wind PowerUp hellip generating more output
Customer Outcome Up to 4
increase in power output across 283
wind turbines hellip 40+ GWhr annual increase ldquoThe PowerUp system offers a great chance for owners like us who are investing literally billions of dollars in this market to try and get more production out of existing assets GE took a lot of risk out of this for usrdquo
ndash Patrick Woodson CEO EON Climate amp Renewables
Opportunity for up to
20 more profit from up to
5 more output
A performance based
cooperative approach
with a holistic view of the
assets system and network
Flexible payment options
aligned to customer needs
+1400 turbines under contract since launch
Customer opportunity
Software enabled
Flexible platform
Proven results
Scale out
1
2
3
Healthcare Jan De Witte - President amp CEO Healthcare IT
- In current role since 2011
- 15 years with GE
45
Healthcare Services
Delivering value = higher quality outcomes at lower cost
Key metrics Services imperatives ($ in billions)
Backlog $11 +
Installed base dynamics
1
2
3
4
Deliver on customer value + Asset and workflow optimization + Analytics around EMRs amp Devices
Grow $installed base
+ Quality and analytics offerings + Solutions architecture amp delivery
Expand margins + Remote service amp SaaS models + Field services productivity Improve service execution amp delivery + Remote monitoring technologies + Field force deployment optimization
Emerging markets infrastructure build
Mature markets quality upgrades
ACA amp Enterprise Solutions IT penetration
13 14E
=+ Revenue $80
46
Healthcare industry shifting to value-based care GE software analytics and services are uniquely positioned to help
Customer challenges
Integrated Care Solutions hellip turning data into actionable insight Improving healthcare outcomes
Diagnostic quality
Patient-centric care
System profitability
Chronic Disease Management
Sources Institute of Medicine 2013 Porter Research 2013 McKinsey IHS Global Insight
29 Healthcare spend wasted each year
$260B Annual value creation through healthcare IT
59 US lives covered in value-based care model by 2015
Clinical Quality
Financial Performance
Operational Efficiency
Configurable Workflows
47
GEHC Software portfolio positioned along main outcome drivers for care systems
Diagnostic speed amp confidence
Productive care pathways
Wellness amp chronic disease management
Risk amp margin management
Costworkforce optimization
Population Health Management
Workflow
Archiving
Visualization
Financial Management
Care Delivery Management
Enterprise Imaging
Operations Management
Revenue Cycle
Risk assessment
Margin analytics
Workforce optimization
Asset Management
Integrated Care Solutions
Ambulatory Care
High Acuity Care
Cardiology
Analytics
Care coordin
Engagement
Providing caregivers the right actionable insight ndash when amp where they need it
Large GE device footprint generating
clinical data
HCIT domain in clinical workflow amp analytics
SW CoEPredixTM capabilities + +
48
Enterprise Imaging Improving diagnostic workflow in the cloud
Customer Challenges Cloud Case Exchange CentricityTM 360
Sample Customers Solution Architecture
Clinical Collaboration amp Advanced Analytics
Imaging Cost Control
Archive
Workflow
19 Time spent
gathering data
Workflow
velocity
Diagnostic
confidence
Cases diagnosed
incorrectly 35
~$2B segment by rsquo18 growing 25+
30 turn-around time
3 duplicate exams
Customer value $10MM+ cost pa
Image-as-a-Service lifecycle value $20MM+
Care quality
Cost
Source Research from the Journal of the American College of Radiology and the Journal of American Medicine
49
Customer Challenges Workforce management
Sample Customers
Operations Management Optimizing workforce productivity with API Healthcare
54 Hospital
operating cost
spent on labor
Solution Architecture
Real-Time Analytics Labor amp Patient Workflows
Time amp Attendance
Staffing amp Scheduling
HR amp Payroll
~$2B segment by rsquo18 growing 12+
20 Workforce productivity
Customer value $4MM cost pa
Workforce-mgmt services lifecycle $4MM+
80 Overtime wages
Matching care-giver capacity
amp patient need
Care quality
Labor
productivity
Source Beckerrsquos Hospital Review
50
Population Health Management Lowering the cost of chronic disease
Customer Challenges
Solution Architecture
Caradigm Analytics amp Care Mgt
Proactive
intervention
Care protocol
compliance
75 Cents of every
healthcare dollar
spent on chronic
disease
Care Mgt Analytics Risk Cohort
25
Customer value $5MM+ cost pa
Caradigm lifecycle value $18MM+
Patients per care manager
~$30B segment by 2025 growing 19+
Sample Customers
40 Hospitalization for chronic patients
Chronic disease
treatment cost
Source National Diabetes Fact Sheet
51
Software enabling productivity in service process
Wo
rkfo
rce
Pla
nn
ing
amp
Dis
pa
tch
Historically up to 40 FE travel time hellip utilize analytics to optimize allocation
Smart dispatch with effective job-skill matching
Optimize field force capacity and response time to customers
Call Generation (Planned amp Unplanned)
Deploy
RepairFix
Diagnose
CloseDebriefBill
Pe
rfo
rma
nce
M
on
ito
rin
g 110k GEHC devices connected remotely
MR hellip 900 data points monitored per machine 30k alertsyear proactively fixed
Improves GE productivity while minimizing customer down-time
Healthcare Services margins improving
Aviation Kevin McAllister - President amp CEO Aviation Services
- In current role since May 2014
- 25 years with GE
53
Aviation Services
13 14E
+ $108
Backlog $97 +
Revenue
Key metrics Services imperatives
Commercial IB hellip 34000 engines
Young hellip 46 havenrsquot had 1st shop visit
Fuel cost driving investment hellip GE well
positioned hellip 787 737MAX A320NEO 777X
Installed base dynamics
1
2
3
4
Deliver on customer value
+ Lowest cost of ownership
+ PredictivityTM outcomes
Grow $installed base
+ Winwin providing technology upgrades and analytics
Expand margins
+ Time-on-wing for GE and customers
+ Cost productivity hellip for GE
Best service execution and delivery
+ Position to support service entry for next-gen products
($ in billions)
54
Solid growth fundamentals
Shop visits Environment Departures
Source IATA amp GE analysis
Passengers IATA RPK YoY
Utilization Avg cycles day YoY
Departures GE and JV-powered flights (MM)
0
5
10
15
20
25
30
35
40
lsquo10 lsquo15F lsquo95 lsquo00 lsquo05
4100
5500
4400
2100
2000
3000
2300 2000
2300
200
100
-1 09 02
2012 2013 2014E
53 52 58
20 21 22
2 of 3 daily flights
powered by GE or GE JVs
46 have not
had 1st shop visit
4 CAGR Number of departures (MM)
lsquo13 rsquo15F rsquo20F
CFM is a 5050 JV between GE and Snecma EA is a 5050 JV between GE and Pratt amp Whitney
55
Solving our customers toughest challenges
Airline direct operating costs
Fuel
40
Delays and cancellations
8
Maintenance
9
Services analytics offerings
Flight Efficiency Services
Performance-based Navigation
Analytics-enabled workscoping
Product and Services strategy
Provide lowest cost-of-ownership through OEM technology
Lead in on-wing reliability
Lead in technology
Best-in-class fuel burn and retention
Engine diagnostic and prognostics
Intelligent Operations
$200Byr
$40Byr
Taleris is a 5050 JV between GE and Accenture
+
56
Services technologies hellip improving value through the lifecycle
Installed base (lsquo13) Upgrades
Fuel Burn improvement
Time- on-wing
8 8 2x
8 3 3x
5 2 2x
A culture of technology insertion Tailored to customer wants
CFM is a 5050 JV between GE and Snecma
Risk transfer $hour coverage
Overhaul Time and material
Materials New used and repaired parts
Asset optimization TRUEngineTM program diagnostics
+
CF6-80C (lsquo86 EIS)
GE90 (lsquo95 EIS)
CFM56 (lsquo84 EIS)
3000
1500
18500
57
Minds amp Machines at GE Aviation
+ Ex
po
sure
Operator A Operator B Part Temperature Cruise Takeoff
Te
mp
era
ture
Threshold
Climb
1000+ software engineers GE Software COE
6300 applied engineers GE Aviation
Data Secure continuous accessible
Physics Apply engine expertise
+ =
Customer and GE benefits
+
Statistics Unlock trends segment
ldquoPhysicsrdquo ldquoAnalyticsrdquo
Time-on-wing
Reliability and availability
Fuel cost
Repair and overhaul
58
Lead in on-wing reliability
Applied analytics to detect engines at risk of removal
Cu
mu
lati
ve
dis
tre
ss
Cycles
Recent successes hellip
CFM is a 5050 JV between GE and Snecma
Segment
GE90
120 CFM56
40 Water wash
$7Myr fuel savings at one GE90 operator
removals saved
removals saved
Nominal environment
Abate
Harsh environment
59
$30MMyr savings
Flight Efficiency Services App
Performance-based Navigation App
Attacking fuel spend with analytics
Joint marketing hellip
ldquoPerfect flightrdquo video
In the news
Newsletter
Oil amp Gas Brian Palmer - Vice President Measurement amp Control Solutions
- In current role since 2010
- 29 years with GE
61
Oil amp Gas Services
Software amp Services as a key differentiator
Key metrics Strategic imperatives ($ in billions)
13 14E
++
Backlog $58 ++
$83 Revenue
1
2
3
4
Deliver on customer value + Customer co-creation
+ Outcome based solutions
Grow $installed base + Drive analytics amp PredixTM
+ Penetrate the installed base
Expand margins + More software and contract offerings
+ Continue to grow backlog double digits
+ Partnerships to accelerate journeyhellip
Meridium
Improve service execution amp delivery + Full lifecycle productivity
+ Simplifying structure
IB growing TMS and Subsea with 13K+ units Software investments creating new IB revenue
streams in addition to traditional parts and service New contractual (CSA) offerings developedlaunched
Installed base dynamics
62
Oil amp gas industry is faced with expanding challenges GE software data and analytics are uniquely positioned to help
Customer challenges Equipment Availability
Equipment Reliability
Operational Efficiency
Production Optimization
Industrial Internet hellip turning data into actionable information Enable no unplanned downtime
Increasing complex operations
Tighter regulations
Skills gap
Machines with data potential
Sources GE OampG analysis based on Wood Mackenzie Rystad Barclays IHS CERA PFC Energy IEA httpwwwgecomstoriesoil-and-gas-innovation Oil and Gas Facilities 2013 httpwwwspeorgogfprintarchives201306
$800B+ Annual industry CAPEX (6-8 growth per year)
$150MM Average annual cost for mid-size LNG facility due to unplanned downtime
5-10 Range of OampG industryrsquos estimated downtime
63
Predixtrade hellip Unified Operations Improved throughput connecting people machines and data
Customer outcomes
Unified Operations ndash A customer co-creation success story
Enhanced safety
Increased availability
Operational visibility
Efficient workforce enablement
Partnering with to tackle these industry challenges and create a solution that increases production and lowers cost driving improved customer outcomes
Unified Customer
Portal
129000 Pieces of equipment in operation globally in
the industry
50 Industry retirement rate in next 10 years
7X Industry fatality rate
above norm
people
machines
data
64
FieldVantagetrade hellip Asset Performance Management (APM) for Onshore
APM ndash Bringing GE expertise from all industries to deliver system level value
Customer outcomes
Enhanced safety
Operational visibility
Improved availability
Optimized performance
Monitoring amp
Diagnostics
Condition Based
Maintenance
Real time Operations
Intelligence
Asset LifeCycle
Management
bull Providing field level visibility and optimization across multiple forms of artificial lift technologies bull Integrated insights provided through common single scalable platform bull 2 year service contract on 200+ wells
Solution Overview
39 NAM OampG Upstream Vehicle Fatalities
hellipby improving
116K New wells in 2014
5 Days Back to production (NAM Avg)
1MM+ Artificially Lifted Wells (Global)
65
Intelligent Pipeline hellip Operations optimization software for pipelines
2TB of data for every
30K miles of pipeline
3-4 annual growth
2MMmiles of
pipelines globally
$40B invested by pipeline companies per year
Source 2TB - Average data volume based on GE internal analysis of multiple pipeline customers Rest - GE OampG analysis based on Douglas Westwood IHS CERA FERC CIA World Factbook PII Pipeline Database (Summary of Infield Systems Global Data DOT databases)
bull 5 year service contract
bull Setting the industry standards for
pipelines real-time intelligence
First customer Customer outcomes
Enhanced safety Proactive versus reactive decisions
Visibility Complete geospatial view and situational awareness
Optimized Ops Effective data driven resource allocation
Efficient OampM Prioritize spending for assets and resources
Moving to proactive solutions with our customers
66
Customer Benefits
Zero unplanned downtime
Increased availability
Increased reliability
Decreased production losses
$14B Additional opportunity driven by
availability and reliability increase (1 of capacity)
Industry Opportunities
Outcome base service bonus
GE Productivity Improvements
Inventory through parts flow optimization
Outage durationfrequency driven by condition- based maintenance
Services Optimization hellip Creating optimal value for GE equipment customers
Journey to 100 reliability through our Contractual Services Agreements (CSA)
Transportation Pete McCabe - Vice President Global Services amp Solutions
- In current role since 2013
- 20 years with GE
68
Transportation Services ($ in billions)
13 14E
+
Revenue $28
Backlog $12B+ +
1
2
3
4
Deliver on customer value
+ Outcomes - velocity fuel reliability
+ System solutions ndash RailConnectTM 360
Grow $installed base
+ Increase penetration ndash Parts amp Smarts
+ Extend asset life ndash modernizations
+ Broaden software solutions ndash rOS
Expand margins
+ Deploy advanced analytics ndash PredixTM
Improve service execution amp delivery
+ Enhance commercial capabilities
+ Expand domain amp IT project expertise
Installed base dynamics
1000+ Tier 4-compliant loco orders
~650 locomotives un-parking in rsquo14
450 new locomotives in South Africa
Key metrics Services imperatives
69
Railroad industry is faced with expanding challenges and customers require a solution provider
Customer challenges
RailConnecttrade360 delivering customer focused outcomes
Asset utilization
Capacity limited
Resource constraints
Ops Complexity
$80B+ N American operating revenue (~4 growth)
7 year high Traffic volumes require unparalleled investment
$56B Annual industrial benefit through 1 improvement
Sources American Association of Railroads (AAR) 2013 industry statistics
70
Asset optimization ndash fuel efficiency
Customer Dynamics RailConnect 360 ndash Trip Optimizer
bull Real-time embedded optimization algorithms
bull Advanced data acquisition enabling train health monitoring
bull Automated train handling reduces wheel amp rail wear
bull $1M diesel locoyear 22K GE locos
bull Emissions
bull Huge operating variation operators trains topography
Trip Optimizer with CSX
Implementation on 1500 CSX locomotives
Reduced fuel use by 7 on average Decreased 3rd largest operating expense
- CSX Sustainability Report 2013
Tr ip Opt imizer Quick Star t Guide (1) Train Speed is available on the speedometer during an active trip during auto and Manual Control
(2) Trip Plan Speed displays a green Trip plan speed pointer on the speed indicator dial in Auto and Manual
modes of operation
(3) Trip Optimizer Status Box is visible when Trip Optimizer system is ACTIVE and provides three types of messages Status Request for Operator InputAction and Error
(4) TrackCivil Speed Limit plot line is Cyan shown the entire horizontal range data permitting
(5) Train Speed (Actual) plot line is White shown only from the head of the train on back
(6) Train Head is shown as a thick White line to allow the operator to see the position of the Train relative to the
terrain The horizontal scale of the rolling chart is zero-referenced to the Head of the Train (corresponds to the forward-facing end of the lead locomotive)
(7) Train Milepost has an associated location and name Its representation on the screen consists of a graphical
pointer and an identifier
(8) OMB Message Box displays operator messages
(9) Consist Notches displays Lead and Trailing locomotive notches
(10) Throttle Handle Notch represents the Master Control-ler handle position During TO Auto Control it will indicate
N8 as TO automatic control requires notch eight (N8) set-ting
(11) Auto Control Notch displays on screen as a White box to denote TO Auto Control engagement and throttle out-
put control
(12) Trip Plan Speed has a Green plot line shown as the entire horizontal range when available and data permit-
ting
(13) Manual Control Zones is shown as a Gray rectangle on the terrain plot extending across the entire vertical range of this section of the chart
(14) Planned Braking depicts Blue areas where Trip Opti-mizer expects that dynamic andor air braking will be
required to maintain the plan speed
(15) Key Locations are softkey states that constitute a unique mapping of functionality to key locations
1 How do I get started To start a trip you will push the Trip Optimizer key on the Main operator screen
2 Do I have to be stopped to request a trip through Trip Optimizer It is preferred to perform a trip init at zero speed however unless otherwise provided by
local ruleinstruction maximum speed for initialization is 15 mph
3 I have performed the Trip Init process and see the rolling map When will I get prompted for Auto Control
Auto Control will become available when the speed is greater than 12 mph and the Throttle handle is N1 or higher
4 Why does the Locomotive Status matter to Trip Optimizer Trip Optimizer will always monitor in train forces speed braking and fuel efficiency To best optimize all of these Train dynamics Trip Optimizer must be told by the operator what the
status of each locomotive in the train The three modes are defined as follows
Running The locomotive is fully operational and is used for calculating TPOB
Isolated The locomotive is either shut-down or is mechanically isolated from produc-
ing Tractive Effort
DB Cutout The locomotive has no Dynamic Braking available but is being used for
producing Tractive Effort
5 What is the recommended way to disengage Auto Control The most fuel efficient way is to decrease the throttle notches in 2 second intervals until
you get to the required speed
6 Trip Optimizer is disengaging from Auto mode and tells the opera-tor Manual Control is required I am already in Notch 8 throttle
What do I do
Press the Current Throttle key on the screen Moving the Master Controller from Notch 8 to
Notch 7 and back could result in un-safe train handling practices
7 Why does Trip Optimizer not always travel at Track speed Trip Optimizer will use the forces of the train and momentum to achieve the optimal speed to save fuel In some cases Idle will be used to meet a planned slow order Trip Optimizer is
always looking out a few miles ahead to plan for the ideal speed while maintaining safe train handling
8 How do I report an inaccuracy on the civil speed limits posted on the rolling map
Contract your Road Manager to report the case
9 The dispatcher has issued an enroute slow order Will Trip Opti-
mizer automatically take this into account
No If an enroute slow order is issued it will be the train crewrsquos responsibility to protect the
train in Manual mode during this affected zone
10 Why does Trip Optimizer automatically end the trip when I still have distance remaining before the preset crew change point
The subdivision has a GPS controlled end point that will automatically end the trip based off of recommendations from the railroad
Follow the steps on the backside of this document to walk you through performing a Trip Init
Trip Optimizer Top Ten List
GE Proprietary Information The information contained in this document is GE Proprietary Information and is disclosed in confidence It is the property of GE and shall not be used disclosed to others or repro-
duced without the express written consent of GE If consent is given for reproduction in whole or in part this notice and the notice set forth on each page of this document shall appear in any such reproduction in whole or in part The information contained in this document may also be controlled by the US export control laws Unauthorized export or re-export is
prohibited Document 5005807 Rev mdash
Before engaging the TO AUTO throttle the operator must meet certain train conditions and under-stand the data displayed on the Trip Optimizer Running Screen
Doc No 5005890 Rev -
71
Operations optimization ndash velocity
Movement Planner with Norfolk Southern
RailConnect 360 - Movement Planner
bull Systems problem hellip beyond human capabilities
bull Majority single track
bull Point solutions have plateaued
bull Integrated suite of day of operations software apps
bull Predixtrade platform - connectivity big data and security
bull Advanced algorithms and automatic routing
bull Proven in class 1 revenue service
Norfolk Southern and Movement Planner
Automated routing decisions
10+ increase in velocity
50+ reduction in expired crews Significant improvement in
schedule adherence
1MPH = ~$200MM estimated
annual savings in capital amp expenses
Based on 3 year study in NS GA division
Customer Dynamics
72
bull Co-development GE Transportation amp GE Intelligent Platforms
minus Enhanced sensor coverage
minus Improved data acquisition higher resolution
minus Advanced analytics
bull Asset specific insight drives fault reduction and enables CBM
(SmartSignal)
bull 20K+ overhauls in backlog
bull OH interval based on average expected condition
bull $1B+ capital expenditure in North America every year
Impact Reduced unplanned
downtime amp avoid road failures
Reduce unscheduled material consumption
Extended periodicity and associated expenses
ldquoPhysicsrdquo change
Real Time Engine Performance
Bearing Temp
Bearing Temp
Load
Ambient
To
da
y
To
mo
rro
w
Alarm trigger
Savings
CSA ndash shared productivity
Lifecycle Cost Dynamics ndash Engine Overhauls RailConnect 360 ndash Advanced Analytics
GErsquos 1 Jamie Miller - Senior Vice President Chief Information Officer
- In current role since 2013
- 9 years with GE
74
Digital opportunity
Simplifying structure
More valuable GE resources with fully integrated approach
+ Utilize data from products
+ Field services tools
+ CRM configurators
+ Brilliant Factory
Benefits
ERPmanufacturing 90
Data Centers 80
Applications 30
Shared Services 65
Cloud 70
Product Cost
RampD
SGampA
+ Engineering tools
+ Shared Services GL
+ Cyber Security
IT plays
-a)
(a - Target percent of new applications that are Cloud enabled
~$94B
Industrial cost
75
Three opportunities to power manufacturing
Digital Foundation 1
Unlocking Big Data
minus Sourcing
minus Productivity
2
Powering the Brilliant Factory
minus Design for manufacturing
minus Sensor enablement
minus Plantsupply chain optimization
3
minus 90 reduction in ERPs
Supply Chain Network
Virtual Mfg
Virtual Product Design
76
Product Cost ERP investments paying off
Inventory turns 6x 7x
Shipment on time 58 85
Foundation for business to deliver $1B+ savings over past 5 years
GE Healthcare
of revenue on target ERP ~75
~95
2009 Today
Today 219 ERPs 2016 34 ERPs
GE Water
2008 Today
22
1
of ERPs
SGampA of sales ~10 pts
Past dues 60
Finance headcount 50
77
Product Cost Using big data to run GE
Ingest Store Clean Consume
1 OampG data lake $8B direct materials buy
Real time More cheaper Faster GE-wide Analytics Data science
$60B total material buy across GE hellip $1B+ cash amp deflation opportunities
bull 23 source systems
bull Full visibility ndash 3 weeks
bull Commodity part supplier
bull Data lake technology
bull Machine learning for data cleansing
bull EM PampW underway (Alstom)
Oil amp Gas
Xxxxx Xxxxx Xxxxx xxxxx
78
Product Cost Technology powering the Brilliant Factory
20 NPI cycle hellip 20 efficiency
16 pilots launched hellip Fastworks 2020 Vision
FastWorks approach
Virtual design for manufacturing
30 NPI cycle time
Eliminated quality escapes
Wilmington NC
Aviation Machining
Factory optimization
25 productivity
PampE avoidance Greenville SC
PampW Nozzle Cell
machine downtime
25 opportunity
Sensor Enablement
Grove City PA
Transportation Remanufacturing
79
Smart Outage Full deployment at PGS
Changing the way we deliver Services
On track for $1B CSA productivity over 3 years and 10 customer uptime
+ +
Predictive Workscope Aviation 4 customers
full roll-out mid-2015
=
Field services optimization
Predictive workscope
Next generation modeling
Advanced technology
Accelerating productivity
80
We can do more ldquoSrdquo with less ldquoG+Ardquo
45 win rate
80 in quote time
5400+ SalesComm Ops hoursweek
QuickQuote
40K+ GE Commercial FTE
Highly manual long-cycle-time
More ldquoshots on goalrdquo lower cost
Investing in digital tools for commercial teams
Wrap up
82
Value for investors
Payback through most reliable revenue source Services
+ Increase revenue growth
+ Improve margins
+ CSA productivity
Funded software amp analytics through simplification amp reallocation
Potential upside beyond the GE installed base
Scale amp intellect Return on investment
1
2
3
GE Software COE
+ COE can accomplish scale hellip none of
our businesses could do this on their
own hellip attract talent amp spread ideas
+ Advantage to being an early mover hellip
right partnerships amp scale
+ Changing GE Industrial DNA hellip
greater impact from digital amp
analytical investments
83
Why GE
+ More valuable portfolio hellip 75 Industrial while growing EPS
+ Tangible evidence of winning NPI hellip Tier 4 LEAP etc
+ Strong amp diversified global footprint hellip best-in-class
+ Transforming service for next generation of growth
+ Culture of simplification impacting every part of GE
LEAP is a trademark of CFM International

2
Summary
A different company Execution in 2014
+ Execute on financial framework
+ Achieve 75 Industrial by 2016 amp
grow EPS
+ Invest in restructuring to drive Industrial earnings
+ Disciplined amp balanced capital allocation
On track
+ Alstom ndash Appliances
ndash Synchrony IPO
$4B+ since 2012 2014 restructuring
gt gains (~$09)
Dividend +16 Synchrony split hellip
shares to lt95B
Much better portfolio
Tangible technology advantage
Superior global position
Way ahead on analytics
Culture of simplification
1
2
3
4
5
Status
3
Portfolio transformation
Actions taken in 2014 hellip
44 53
56 47
2003 2013 2016F
GE earnings mix
Industrial
GE Capital
Divest
Insurance
Reinsurance
Global consumer
Red assets
Media
Plastics
Silicones
Supply
Appliances
Rebuild Industrial
Dist Power
Life Sciences
Renewables
Oil amp Gas
Water
Av Systems
Power Conv
Services + IT
Completed 15 IPO in 3Q
Well received by market
On track for split-off
Acquiring Power amp Grid
Strong synergies
Targeting close in rsquo15
Sale to Electrolux for $33B
Continued use of GE brand
Targeting close in rsquo15
Premier
Infrastructure
Specialty
Finance ~25
~75
GE Appliances
Actions taken
(Operating earnings-a))
(a- Continuing earnings adjusted for non-operating pension income(expense) in 2003 and 2013 of $16B and $(17)B respectively
4
GE Industrial enterprise advantages
GE businesses
Power amp Water
Aviation
Oil amp Gas
Healthcare
Transportation
Energy Management
All businesses benefit from GErsquos enterprise scale
Enterprise scale
TechnologyNPI (GRC)
Growth markets
(GGO)
Service amp Analytics (Services Council)
Lean structure (Simplification)
Performance
Organic growth gt peers
Margins at ~17 by rsquo16
Returns at ~17 by rsquo16
Consistent earnings growth
5
Leadership in technology ($ in billions)
RampD spend
2012 2013 2014E
$55 $52 =minus
5 of
revenue =minus 5
Key wins
Worldrsquos largest amp most efficient
H-class hellip 614 in combined cycle
13 units in backlog
First to market hellip 1000+ Tier 4
compliant locos on order for 2015+
Won 77 of all narrowbody
competitions since launch
Industryrsquos first 20000-psi hellip reliable
performance in ultra-deep water
Image quality amp capability from low dose
Best-in-class next gen products Advanced manufacturing solutions
to grow margins Leadership across core amp new
product markets
HA gas turbine
Tier 4 loco
LEAP
20k psi
Revolution CT
FastWorks driving speed amp efficiency
6
Scalable across other businesses
Innovation for cost amp speed
1 2 3 4 5 6
Changing the traditional learning curve
Yr
Traditional
Start
Lower
Accelerate
Faster Redefine
Entitlement
Product cost focus areas
Lean labs amp additive technology
Data in the factory
Services delivery cost
Sourcing relationshipsmake vs buy
Footprint and organizational focus
Driving cost with analytics
Full flight data ( of flights)
2 340 1500 Data Volume (Tera Bytes)
GErsquos analytics advantage hellip
15k
Segment by severity of operations
Segment by part
performance
Customized maintenance
cycle + =
Aviation product cost
2013 2014E 2015F
34M
~10M
7
Accelerating in growth markets
10 13 14E Post-Alstom
Driving growth
$29
++
++
Strategic imperatives
Be first mover in localization
Plant new flags Invest in local capability Leadership Manufacturing strength GRC amp innovation Customer support ldquoConnect the dotsrdquo of GE Healthcare amp Oil amp Gas lead Every facility ldquomulti-productrdquo Best partners brand amp risk
management Financing knowledge
1
2
3
$46
Growth market orders
36 44 + +
+ Premier scale amp reach + Best capability
17 AAGR
of
total
($ in billions)
8
Simplification
+
+
+
Lean management Do fewer things better hellip with less structure
Speed amp competitiveness
Get faster amp smarter amp more efficient in everything we do using FastWorks
Commercial intensity
Connect every job to winning in the market while empowering the commercial team amp holding them accountable
Digital capability
Modernize our information technology so we can achieve the speed amp efficiency our scale
should allow
World-class structural cost
More NPI faster with less investment
Global market success
Accelerate margin enhancement
Worldrsquos most competitive company
9
Lower cost
Industrial SGampA sales
175
rsquo12
~12
159 ~14
rsquo13 rsquo14E rsquo16F rsquo15F
~13
($ in billions)
rsquo11
185
Enablers
ERP
90 reduction
Shared services
65 penetration
Corporate
$500MM cost out
+ of PampLs
Layersspan
Product cost
rsquo12-rsquo14E investment
Gains ~$25
Restructuring ~$(43)
10
Technology is evolving
PHYSICAL ANALYTICAL
Multiple materials in complex systemshellip hundreds of patents in each product
Operating with high efficiency amp durability in extreme conditions
1 gas turbine compressor blade monitoring potential 500 gigabytes per day
Combination of physical amp analytical drives next evolution of services
Customers will value data because it improves their efficiency
GE is well positioned to lead this wave of change
Investors will benefit through services growth amp margins + product share + IT-driven efficiency
1
2
3
4
Key messages
+
11
Transforming services
bull Partners amp field
technicians 80rsquos
Big iron
Airlines 1 fuel $2-3B
Utility 1 fuel $4-5B
Oil amp Gas 1 uptime $5-7B
Healthcare 1 productivity $4-5B
Transportation 1 mile velocity $1-2B
Driving customer outcomes
bull Risk sharing
service contract 00rsquos
CSA
bull Asset amp
operations
optimization
Today
bull Science applied
to repairs amp
upgrades 90rsquos
Repair
Power of 1
Annual impact-a)
Small changes in hellip fuel maintenance uptime productivity flexibility safety
labor effectiveness hellip have a big
impact on profitability
(a - Global industry estimates based on ldquoIndustrial Internet Pushing the Boundaries of Minds amp Machinesrdquo ndash Nov 26 2012
Analytics
12
GE leadership
Large high-tech installed base
Customer trust amp connection hellip ~$180B services backlog
Deep domain knowledge
GE advantages What it takes to win
bull Sensors
bull Service robotics
bull Connectivity
Enabling technologies
bull Connected IB
bull Physicsmaterials bull Smart devices
bull Global reach
Installed base
+
+
bull Software capability bull Industrial big data
bull Operating platform
bull Security
Data amp analytics Attracting new talent hellip
ldquohorizontal capabilityrdquo
Connecting domain amp data hellip CSA
Operating platform in place (PredixTM)
Large research capability
Industry partnerships
Collecting 50MM data elements
GE has all essential elements
Have
Have
Investing
13
Improving the service model
Asset optimization
Operations optimization
CSA productivity
CSA + Connected asset + Software revenue value ($IB) outcome sales
Data-driven execution
Maximize performance with no unplanned downtime
Increased system efficiency across GE
amp non-GE assets
Optimize material amp repair cycles
across IB
Make versus buy hellip build internal team
Launch new offerings hellip PredictivityTM
Build on existing CSA relationships hellip ldquowin-winrdquo
Develop a broader ecosystem
1
2
3
4
Investments 2010-14
Focus of innovation
How we execute
14
Asset performance management
Impact for GE hellip $IB productivity for customers hellip velocity productivity
SENSORSANALYTICS
On-site oil analysis Predict remaining life Prevent road failures
SERVICE ROBOTICS
Productivity safety Remote monitoring Tough environment
AUTOMATED DECISIONING
Optimize yard ops Reduce dwell 10 Depart on time up 50
ADVANCED CONTROLS
Auto Train Operation 10 fuel savings
15
Impacting GErsquos 1
$94B of cost
$12B of working capital
$20B of PampE investments
GErsquos 1
Analytics amp
security
IT investment ($2B+year)
+
Reduce structure
Lower product cost
Improve margins
Enhance engineering productivity
Faster amp safer
Impact
Every Industrial company a Software amp Analytical company
16
Investor value
Increase services growth rate
+ More $installed base
+ $08B PredictivityTM solutions revenue growing to $4-5B
+ Penetrate aged GE fleet
+ Grow beyond the GE IB
Improve services margins
+ CSA productivity
+ Improve quality
Potential for industry value
+ Scale beyond GE installed base Backlog Revenue Margins
Services franchise
~$180B
~$45B
~30
Value creation
+
1
2
3
Software amp analytics accelerate services growth margins amp returns
Revenue growth ~5 Margin expansion ~50 bps Limited by IB growth
Historic performance
Services overview
18
Services growth
05 08 11 13
($ in billions)
Revenue
~26 ~30
OP
GE advantages
+ Installed base
+ Technology
+ CSA model
+ Footprint amp scale
+ Software COE
+ Fleet data
$27
$35
$42 $45
Services imperatives
Backlog
1
2
3
Deliver on customer value + Link services to outcomes + Global deployment
Grow $installed base + Drive analytics amp PredixTM value + Penetrate aged installed base
Expand margins + Leverage analytics to manage
performance + Invest in productivity tools
Improve service execution amp delivery + Enhance commercial capabilities + Increase field services capability
Spread ideas across GE
$87 $121 $147 $180
4
5
19
Services Council
Driving differentiated advantage
Cross-business initiatives
20+ services leaders
Teams aligned to 9 themes
Quarterly executive updates hellip operational rigor
Spreading ideas hellip
bull Core growth
bull Operations
bull Tools + process
bull CSA excellence
Data +
Outcomes
bull PredixTM + Cloud
bull PredictivityTM solutions
bull Strategic alliances + BD
Hardware amp domain expertise
Software analytics based
Healthcare Inspection technology
Aviation Repair technology
Power amp Water Global footprint
bull Multimodal ndash service amp repair shops
bull Customer training centers
bull Additive manufacturing
bull Robotic welding
bull Advanced coatings
bull Parts inspection amp measurement
bull Condition-based maintenance
Pune India
20
Enabling technologies Service Robotics Sensing amp Controls Advanced Manufacturing
Inspection Repair Mobile Tools
Launch amp learn hellip then accelerate to all GE businesses
Automated adaptive + Productivity + Less downtime
High tech integrated + Lower fuel usage + Higher efficiency
Productivity safety + Repetitive tasks + Tough environment
Additive new materials + Repair vs scrap + Longer service life
Deployable fast accurate + More digital data + Less downtime
Connected digital + Instant expert access + Lower service costs
21
Increase value of CSA
Benefits for Customers Benefits for GE
Monitoring amp diagnostics
$180B Services backlog
Fuel efficiency
Hardware amp software upgrades
Condition-based work scope
Mobile amp analytical tools
Material productivity
Optimized asset performance
Predictive analytics ndash lower downtime
More output
Lower costs
Lower emissions
Better payback on hardware upgrades
Instant software upgrade capability
Shorter duration outages
Less material usage
Ask an Expert ndash COE
Field Service productivity
Analytics driven parts life extension + performance
Repair vs scrap
22
Segment services dynamics (Services revenue $ in billions)
Power amp Water $125
Oil amp Gas $83
Energy Management
2013
$21
+ Sustained passenger growth
+ Improving airline profitability
+ Upgrades amp analytics
Aviation $108
+ Growth markets strong
+ Improving HCIT
minus Developed challenging
Healthcare $80
+ North America utilization
+ Analytics penetration
minus Mining parts
Transportation
$28
2013
2013
2013
2013
2013
2013
+ Continued AGP growth
+ Upgrades amp analytics
Europe
+ Strong Subsea
+ MampC improving
+ Analytics penetration
+ Marine offshore
minus Mining amp motor repairs
23
Presentation
Common capability Software COE
Analytics commercialization
Bill Ruh
Kate Johnson
Business execution
Strategy overview
Customer outcomes
Examples of analytics driving growth amp productivity
Competitive advantage
Power amp Water
Healthcare
Aviation
Oil amp Gas
Transportation
Paul McElhinney
Jan De Witte
Kevin McAllister
Brian Palmer
Pete McCabe
Common capability GErsquos 1 Jamie Miller
Software amp PredixTM
Bill Ruh - VP Global Software Center
- 3 years with GE
- 32 years of industry experience
Kate Johnson - VP GE Commercial Officer
- 1 year with GE
- 15 years of industry experience
25
The Industrial Internet
3 Hyper connectivity a living network of the worldrsquos machines data amp people
Internet
Increasing system intelligence through embedded software hellip advanced sensors
controls and software applications
Brilliant Machines
Democratization of data hellip high frequency real-time data
Big Data
Predictive algorithms hellip physics-based analytics hellip deep domain expertise on big industrial data
Analytics
People at work Connecting people at work or on
the move Supporting more
intelligent design higher service
quality operations amp safety
maintenance
1
2
3
4
5
26
61
45
31 28 31 40 42
29
29
45 63
56 56
47 45
41
10 6 6
16 9 10 9
24
Software outlook Customer survey Importance of
Big Data analytics relative to other priorities
Source Accenture 2015 Trend Report Gartner Big Data Survey
Aviation
3 3 3 3 6
Wind
Power Generation
Power Distribution
Oil amp Gas
Rail
Manufacturing
Healthcare
Highest priority Within the top 3 priorities Within the top 5 priorities Not a top priority
Opex is becoming a deciding
factor for IT investments as
80 of budget is allocated to
managing and running
complex technologies Source Gartner
Advanced analytics and
analytical applications
expected to see double digit
revenue growth Source Gartner
APM market category
expected to reach $300B
by 2020 Source Gartner
27
Industrial customersrsquo perspective Survey of GErsquos customers regarding applications
Real-Time Operator Intelligence
Remote Monitoring amp Diagnostics
Condition-Based Maintenance
Asset Lifecycle Management
Schedule Optimization
Energy Management
Process Control Automation
Field Force Automation 32
38
42
43
49
59
66
70 Tailor Pre-Built Applications
Have A Systems Integrator Build
Your Apps
Build My Own Custom Apps 15
54
85
HOW do you want to consume it WHAT functionality is most valuable
Asset performance management is the killer industrial app
28
What industrial customers want
SDM
SDM
SDM
SDM SDM
Software Defined Machines (SDMs)
ldquoLink up all my assets and devicesrdquo
REAL-TIME
OPERATIONAL
INTELLIGENCE
CONDITION-
BASED
MONITORING
ASSET LIFECYCLE
MANAGEMENT
MONITORING amp
DIAGNOSTICS
Industrial Apps
SDM Non-GE Assets enabled by PredixTM Machine SDM
SDM GE Assets enabled by PredixTM Machine SDM
PredixTM powers Asset Performance Management (APM)
29
Insights into value
Improving safety and
productivity across 15K miles
of interstate natural gas
pipelines
Potential Savings
77 gallons of fuel and 1628
lbs of CO2 per approach
10 increase in network
velocity 50 reduction in
expired crews amp significant
improvements in on-time
performance
Up to 4 increase in power
output across 283 wind
turbines hellip 40+ GWhr annual
increase
Asset Performance Management (APM)
REAL-TIME OPERATIONAL
INTELLIGENCE
CONDITION-BASED
MONITORING
ASSET LIFECYCLE MANAGEMENT
MONITORING amp
DIAGNOSTICS
Operations Optimization
INSIGHT PROCESS
INTEGRATION
AUTOMATION COLLABORATION
PredixTM Platform
PredixTM Machine PredixTM Net
GE
Non-GE
PredixTM Asset PredixTM Insight
PredixTM Fabric PredixTM Core
PredixTM Experience
Predixtrade hellip the GE advantage
Release in 2015
Public Cloud Private Cloud
Commercially available to connect more machines more data amp more people
TR
AN
SF
OR
MS
PO
WE
RS
PredictivityTM Solutions
30
Predictivitytrade hellip app factory
Asset optimization (28)
Operations optimization (14)
Productivity tools (77)
Approach Development process
Agile amp Extreme Programming
Design Center for delivering
compelling user interface
Cyber security Blue team to build
and Red team to test
90-120 day service engagement to production roll out
+
+
+
Co-innovation process to design
build transfer and iterate
Actionable insight on equipment based
on physics and analytic modeling
with industrial data
Outcome based process improvements
to plants pipelines fleets fields facilities
grids shops
Increase service throughput efficiency
and quality at optimized cost of
delivery
Delivering industry apps at speed and scale
31
World-class Software amp Analytics organization
Investing in Leadership Talent
Colin Parris (IBM)
SW Research
Co-located SW CTOs for business alignment
D Bartlett
(IBM)
Aviation
World-class technical resources
Computational amp analytics scientists
Platform developers
Software engineers
~10000
1000+ Biz
COE
Product Dev Software CTO
Brad Surak (SAP)
Harel Kodesh (Microsoft
Start Up Veteran)
Trans S Chotai
(HP)
OampG J Demesa
(Siemens)
PampW G Bell
(ServiceSource)
EM J Stone
(SAP)
HC E Eryurek
(GE)
+
+
- Cyber UX Data Science Agile development
Four deep core competencies ecosystem
1
Leading edge platform + world-
class ecosystem 2
Advanced research for building
the future 3
Advanced process to drive adoption amp enablement
4
Software Site
Organization
Technology amp Ecosystem
32
Wurldtech protecting critical infrastructure
World-class cyber security to operate assets + operations safely
About A GE Company acquired in May 2014 providing top cyber talent
Capability Assess protect amp certify critical infrastructure from cyber attack
Key Customers 4 of 6 top global OampG companies 9 of top 10 automation vendors
Security enhancements delivered through PredixTM and GE Products
Certify GE and non-GE products and customer environments
Identify vulnerabilities in OT products (GE and 3rd party)
Assess and prioritize risks for system operators
Achilles Industrial Next Gen Firewall to inspect and control
Industrial network traffic
Leverage industry leading threat intelligence
Protect operational
environments
Secure amp certify industrial products
Assess products amp operations for vulnerabilities
33
Partnerships amp Alliances
Intel ATampT AWS Cisco others
Venture Capital
Mergers amp Acquisitions
ThetaRay Mocana Frost
Strategic Moves
Wurldtech Austin Digital
Acquire capability to fill gaps
Pivotal Softbank Industrial Internet Consortium
Industrial internet ecosystem
Industry Ecosphere
Establish interoperable amp scalable solutions
Co-development amp go-to-market
Accelerate innovation amp success
Positioned to create value
Open PredixTM beyond GE
GE will sell
+ + Connected devices
Data Under Management
Performance Applications
PredixTM Machine Services
PredixTM Data Services
PredixTM Asset Services
Connect assets regardless of vendor or
vintage and provide value-added services
Aggregate and analyze data to produce
actionable business insights
Sell horizontal apps that maximize return
on assets and people
1
2
3
34
Competitive advantage
$1T Connected
Machines
managed by GE
replacement value
10M Sensors
collecting
50M Data
Elements
$20B Potential
Annual Customer Savings
50B Machines will be connected on the internet by 2020
2X Industrial data growth within next 10 years
Big Iron + Big Data = Big Outcomes
INDUSTRY GE
35
New ways to sell Services
2 Making Markets Different Economics
3 Co-creation amp Agile Development
4 Solution Architecture
5 Value Based Deal Shapes
6 New Industry Ecosystems
1 New Buyers and Influencers
GE Commercial Center of Excellence
Needs Target Architect Close
Qualification amp Pipeline Management
Sales Process
HireTrain Community of Experts
Enablement Toolkit
36
Accelerating time to value across channels
APM Subscription Services
Enterprise Analytics Projects
Upgrade value in CSAs
GE Sales Model
Existing Services sales team
New standalone software sales specialists
New outcome sellers + existing service sales team
Sales
acceleration
Expert SWAT
teams to
support deal
SW experts compelling
offer target one outcome
to land and expand
Ecosystem partners
SW COE app factory
Offering RMampD in CSA upside
and productivity Per well subscription
Enterprise SW deal
solution co-creation
ReliabilityMaxtrade FieldVantageTM Intelligent PipelineTM
GE OampG Example
Market
Opportunity $2B $600MM $27B
37
Measuring commercial success
Services revenue
Past Future
~5
+
rsquo13 rsquo17F
Assets under management $1T+ ++
PredictivityTM solutions revenue $08B ~$4-5B
Services backlog $180B ++
bull Adding more value to existing service relationships hellip training team to get more out of the installed base
bull Creating new revenue streams and building new commercial skills and incentive plans to accelerate growth
Outcome sellers solution architects product management amp marketing
bull Cultivate ecosystem to help accelerate commercially with access to CIOCTO relationships and system integration skills
Power amp Water Paul McElhinney - President amp CEO Power
Generation Services
- In current role since May 2014
- 26 years with GE
39
Power amp Water Services
Growing services amp delivering greater customer value
Key metrics Services imperatives ($ in billions)
13 14E
+
Backlog $53 +
Revenue $125
Installed base dynamics
1
2
3
4
Deliver on customer value + Develop flexible solutions
+ Reduce customer operating cost
Grow $installed base + Maximize impact of Alstom alliance + Invest in new service offerings
Expand margins + Tech upgrades amp software solutions + Outage excellence
Improve service execution amp delivery + Improved customer service levels
+ Optimize field service amp repair network
Unit growth up ~24X from 2008
Strong DP amp Wind growthhellip up ~1Kyear
~4000+ gas turbines in service
40
Global power industry is facing complex challengeshellip Offering innovative solutions to address customersrsquo needs
Fuel price uncertainty
Increasing regulation
Slow demand growth
Aging installed base
~15 years Average age of ~4K global GE gas turbines
Output
Efficiency
Reliability
Availability
Flexibility
Improving customersrsquo outcomes while decreasing costs
~$7B
Customer challenges
~$8B
~$2B
~$1B
~$2B
GE Predictivitytrade solutions amp industry benefit
~60+ Increase in US natural gas price since 2012
~(30) Thermal capacity in Europe since lsquorsquo08
Based on 10 year NPV
41
Investing in technology
Addressing multiple customer value levers
Advanced Gas Path (AGP) Industry leading output hellip up to +64 Industry leading efficiency hellip up to +18 Extends asset amp parts life hellip 96K hours
1
Op Flex Delivers flexibility to costs amp revenue Reduces start up time amp fuel consumption Expands fuel source opportunity
3
Dry Low NOx 26+ (DLN) Reduces NOx emissions by 40 Delivers industry leading flexibility Increases maintenance intervals to ~1250 starts
2
42
Power FlexEfficiencytrade Advanced Gas Path
Expanding the operating envelope
Ambient Temperature
Ou
tpu
t (M
W)
Op Flex
7FA03 baseline
AGP
+ ndash
+
Combining hardware and software hellip creating 2X the value
$17
$30
Op Flex
Average Customer Annual Value Per Unit ($MM)
Improving customer outcomes
AGP (Hardware)
AGP PredictivityTM
Solution
125+ AGPs with software sold to date
650000+ operating hours to date
43
Wind PowerUp hellip generating more output
Customer Outcome Up to 4
increase in power output across 283
wind turbines hellip 40+ GWhr annual increase ldquoThe PowerUp system offers a great chance for owners like us who are investing literally billions of dollars in this market to try and get more production out of existing assets GE took a lot of risk out of this for usrdquo
ndash Patrick Woodson CEO EON Climate amp Renewables
Opportunity for up to
20 more profit from up to
5 more output
A performance based
cooperative approach
with a holistic view of the
assets system and network
Flexible payment options
aligned to customer needs
+1400 turbines under contract since launch
Customer opportunity
Software enabled
Flexible platform
Proven results
Scale out
1
2
3
Healthcare Jan De Witte - President amp CEO Healthcare IT
- In current role since 2011
- 15 years with GE
45
Healthcare Services
Delivering value = higher quality outcomes at lower cost
Key metrics Services imperatives ($ in billions)
Backlog $11 +
Installed base dynamics
1
2
3
4
Deliver on customer value + Asset and workflow optimization + Analytics around EMRs amp Devices
Grow $installed base
+ Quality and analytics offerings + Solutions architecture amp delivery
Expand margins + Remote service amp SaaS models + Field services productivity Improve service execution amp delivery + Remote monitoring technologies + Field force deployment optimization
Emerging markets infrastructure build
Mature markets quality upgrades
ACA amp Enterprise Solutions IT penetration
13 14E
=+ Revenue $80
46
Healthcare industry shifting to value-based care GE software analytics and services are uniquely positioned to help
Customer challenges
Integrated Care Solutions hellip turning data into actionable insight Improving healthcare outcomes
Diagnostic quality
Patient-centric care
System profitability
Chronic Disease Management
Sources Institute of Medicine 2013 Porter Research 2013 McKinsey IHS Global Insight
29 Healthcare spend wasted each year
$260B Annual value creation through healthcare IT
59 US lives covered in value-based care model by 2015
Clinical Quality
Financial Performance
Operational Efficiency
Configurable Workflows
47
GEHC Software portfolio positioned along main outcome drivers for care systems
Diagnostic speed amp confidence
Productive care pathways
Wellness amp chronic disease management
Risk amp margin management
Costworkforce optimization
Population Health Management
Workflow
Archiving
Visualization
Financial Management
Care Delivery Management
Enterprise Imaging
Operations Management
Revenue Cycle
Risk assessment
Margin analytics
Workforce optimization
Asset Management
Integrated Care Solutions
Ambulatory Care
High Acuity Care
Cardiology
Analytics
Care coordin
Engagement
Providing caregivers the right actionable insight ndash when amp where they need it
Large GE device footprint generating
clinical data
HCIT domain in clinical workflow amp analytics
SW CoEPredixTM capabilities + +
48
Enterprise Imaging Improving diagnostic workflow in the cloud
Customer Challenges Cloud Case Exchange CentricityTM 360
Sample Customers Solution Architecture
Clinical Collaboration amp Advanced Analytics
Imaging Cost Control
Archive
Workflow
19 Time spent
gathering data
Workflow
velocity
Diagnostic
confidence
Cases diagnosed
incorrectly 35
~$2B segment by rsquo18 growing 25+
30 turn-around time
3 duplicate exams
Customer value $10MM+ cost pa
Image-as-a-Service lifecycle value $20MM+
Care quality
Cost
Source Research from the Journal of the American College of Radiology and the Journal of American Medicine
49
Customer Challenges Workforce management
Sample Customers
Operations Management Optimizing workforce productivity with API Healthcare
54 Hospital
operating cost
spent on labor
Solution Architecture
Real-Time Analytics Labor amp Patient Workflows
Time amp Attendance
Staffing amp Scheduling
HR amp Payroll
~$2B segment by rsquo18 growing 12+
20 Workforce productivity
Customer value $4MM cost pa
Workforce-mgmt services lifecycle $4MM+
80 Overtime wages
Matching care-giver capacity
amp patient need
Care quality
Labor
productivity
Source Beckerrsquos Hospital Review
50
Population Health Management Lowering the cost of chronic disease
Customer Challenges
Solution Architecture
Caradigm Analytics amp Care Mgt
Proactive
intervention
Care protocol
compliance
75 Cents of every
healthcare dollar
spent on chronic
disease
Care Mgt Analytics Risk Cohort
25
Customer value $5MM+ cost pa
Caradigm lifecycle value $18MM+
Patients per care manager
~$30B segment by 2025 growing 19+
Sample Customers
40 Hospitalization for chronic patients
Chronic disease
treatment cost
Source National Diabetes Fact Sheet
51
Software enabling productivity in service process
Wo
rkfo
rce
Pla
nn
ing
amp
Dis
pa
tch
Historically up to 40 FE travel time hellip utilize analytics to optimize allocation
Smart dispatch with effective job-skill matching
Optimize field force capacity and response time to customers
Call Generation (Planned amp Unplanned)
Deploy
RepairFix
Diagnose
CloseDebriefBill
Pe
rfo
rma
nce
M
on
ito
rin
g 110k GEHC devices connected remotely
MR hellip 900 data points monitored per machine 30k alertsyear proactively fixed
Improves GE productivity while minimizing customer down-time
Healthcare Services margins improving
Aviation Kevin McAllister - President amp CEO Aviation Services
- In current role since May 2014
- 25 years with GE
53
Aviation Services
13 14E
+ $108
Backlog $97 +
Revenue
Key metrics Services imperatives
Commercial IB hellip 34000 engines
Young hellip 46 havenrsquot had 1st shop visit
Fuel cost driving investment hellip GE well
positioned hellip 787 737MAX A320NEO 777X
Installed base dynamics
1
2
3
4
Deliver on customer value
+ Lowest cost of ownership
+ PredictivityTM outcomes
Grow $installed base
+ Winwin providing technology upgrades and analytics
Expand margins
+ Time-on-wing for GE and customers
+ Cost productivity hellip for GE
Best service execution and delivery
+ Position to support service entry for next-gen products
($ in billions)
54
Solid growth fundamentals
Shop visits Environment Departures
Source IATA amp GE analysis
Passengers IATA RPK YoY
Utilization Avg cycles day YoY
Departures GE and JV-powered flights (MM)
0
5
10
15
20
25
30
35
40
lsquo10 lsquo15F lsquo95 lsquo00 lsquo05
4100
5500
4400
2100
2000
3000
2300 2000
2300
200
100
-1 09 02
2012 2013 2014E
53 52 58
20 21 22
2 of 3 daily flights
powered by GE or GE JVs
46 have not
had 1st shop visit
4 CAGR Number of departures (MM)
lsquo13 rsquo15F rsquo20F
CFM is a 5050 JV between GE and Snecma EA is a 5050 JV between GE and Pratt amp Whitney
55
Solving our customers toughest challenges
Airline direct operating costs
Fuel
40
Delays and cancellations
8
Maintenance
9
Services analytics offerings
Flight Efficiency Services
Performance-based Navigation
Analytics-enabled workscoping
Product and Services strategy
Provide lowest cost-of-ownership through OEM technology
Lead in on-wing reliability
Lead in technology
Best-in-class fuel burn and retention
Engine diagnostic and prognostics
Intelligent Operations
$200Byr
$40Byr
Taleris is a 5050 JV between GE and Accenture
+
56
Services technologies hellip improving value through the lifecycle
Installed base (lsquo13) Upgrades
Fuel Burn improvement
Time- on-wing
8 8 2x
8 3 3x
5 2 2x
A culture of technology insertion Tailored to customer wants
CFM is a 5050 JV between GE and Snecma
Risk transfer $hour coverage
Overhaul Time and material
Materials New used and repaired parts
Asset optimization TRUEngineTM program diagnostics
+
CF6-80C (lsquo86 EIS)
GE90 (lsquo95 EIS)
CFM56 (lsquo84 EIS)
3000
1500
18500
57
Minds amp Machines at GE Aviation
+ Ex
po
sure
Operator A Operator B Part Temperature Cruise Takeoff
Te
mp
era
ture
Threshold
Climb
1000+ software engineers GE Software COE
6300 applied engineers GE Aviation
Data Secure continuous accessible
Physics Apply engine expertise
+ =
Customer and GE benefits
+
Statistics Unlock trends segment
ldquoPhysicsrdquo ldquoAnalyticsrdquo
Time-on-wing
Reliability and availability
Fuel cost
Repair and overhaul
58
Lead in on-wing reliability
Applied analytics to detect engines at risk of removal
Cu
mu
lati
ve
dis
tre
ss
Cycles
Recent successes hellip
CFM is a 5050 JV between GE and Snecma
Segment
GE90
120 CFM56
40 Water wash
$7Myr fuel savings at one GE90 operator
removals saved
removals saved
Nominal environment
Abate
Harsh environment
59
$30MMyr savings
Flight Efficiency Services App
Performance-based Navigation App
Attacking fuel spend with analytics
Joint marketing hellip
ldquoPerfect flightrdquo video
In the news
Newsletter
Oil amp Gas Brian Palmer - Vice President Measurement amp Control Solutions
- In current role since 2010
- 29 years with GE
61
Oil amp Gas Services
Software amp Services as a key differentiator
Key metrics Strategic imperatives ($ in billions)
13 14E
++
Backlog $58 ++
$83 Revenue
1
2
3
4
Deliver on customer value + Customer co-creation
+ Outcome based solutions
Grow $installed base + Drive analytics amp PredixTM
+ Penetrate the installed base
Expand margins + More software and contract offerings
+ Continue to grow backlog double digits
+ Partnerships to accelerate journeyhellip
Meridium
Improve service execution amp delivery + Full lifecycle productivity
+ Simplifying structure
IB growing TMS and Subsea with 13K+ units Software investments creating new IB revenue
streams in addition to traditional parts and service New contractual (CSA) offerings developedlaunched
Installed base dynamics
62
Oil amp gas industry is faced with expanding challenges GE software data and analytics are uniquely positioned to help
Customer challenges Equipment Availability
Equipment Reliability
Operational Efficiency
Production Optimization
Industrial Internet hellip turning data into actionable information Enable no unplanned downtime
Increasing complex operations
Tighter regulations
Skills gap
Machines with data potential
Sources GE OampG analysis based on Wood Mackenzie Rystad Barclays IHS CERA PFC Energy IEA httpwwwgecomstoriesoil-and-gas-innovation Oil and Gas Facilities 2013 httpwwwspeorgogfprintarchives201306
$800B+ Annual industry CAPEX (6-8 growth per year)
$150MM Average annual cost for mid-size LNG facility due to unplanned downtime
5-10 Range of OampG industryrsquos estimated downtime
63
Predixtrade hellip Unified Operations Improved throughput connecting people machines and data
Customer outcomes
Unified Operations ndash A customer co-creation success story
Enhanced safety
Increased availability
Operational visibility
Efficient workforce enablement
Partnering with to tackle these industry challenges and create a solution that increases production and lowers cost driving improved customer outcomes
Unified Customer
Portal
129000 Pieces of equipment in operation globally in
the industry
50 Industry retirement rate in next 10 years
7X Industry fatality rate
above norm
people
machines
data
64
FieldVantagetrade hellip Asset Performance Management (APM) for Onshore
APM ndash Bringing GE expertise from all industries to deliver system level value
Customer outcomes
Enhanced safety
Operational visibility
Improved availability
Optimized performance
Monitoring amp
Diagnostics
Condition Based
Maintenance
Real time Operations
Intelligence
Asset LifeCycle
Management
bull Providing field level visibility and optimization across multiple forms of artificial lift technologies bull Integrated insights provided through common single scalable platform bull 2 year service contract on 200+ wells
Solution Overview
39 NAM OampG Upstream Vehicle Fatalities
hellipby improving
116K New wells in 2014
5 Days Back to production (NAM Avg)
1MM+ Artificially Lifted Wells (Global)
65
Intelligent Pipeline hellip Operations optimization software for pipelines
2TB of data for every
30K miles of pipeline
3-4 annual growth
2MMmiles of
pipelines globally
$40B invested by pipeline companies per year
Source 2TB - Average data volume based on GE internal analysis of multiple pipeline customers Rest - GE OampG analysis based on Douglas Westwood IHS CERA FERC CIA World Factbook PII Pipeline Database (Summary of Infield Systems Global Data DOT databases)
bull 5 year service contract
bull Setting the industry standards for
pipelines real-time intelligence
First customer Customer outcomes
Enhanced safety Proactive versus reactive decisions
Visibility Complete geospatial view and situational awareness
Optimized Ops Effective data driven resource allocation
Efficient OampM Prioritize spending for assets and resources
Moving to proactive solutions with our customers
66
Customer Benefits
Zero unplanned downtime
Increased availability
Increased reliability
Decreased production losses
$14B Additional opportunity driven by
availability and reliability increase (1 of capacity)
Industry Opportunities
Outcome base service bonus
GE Productivity Improvements
Inventory through parts flow optimization
Outage durationfrequency driven by condition- based maintenance
Services Optimization hellip Creating optimal value for GE equipment customers
Journey to 100 reliability through our Contractual Services Agreements (CSA)
Transportation Pete McCabe - Vice President Global Services amp Solutions
- In current role since 2013
- 20 years with GE
68
Transportation Services ($ in billions)
13 14E
+
Revenue $28
Backlog $12B+ +
1
2
3
4
Deliver on customer value
+ Outcomes - velocity fuel reliability
+ System solutions ndash RailConnectTM 360
Grow $installed base
+ Increase penetration ndash Parts amp Smarts
+ Extend asset life ndash modernizations
+ Broaden software solutions ndash rOS
Expand margins
+ Deploy advanced analytics ndash PredixTM
Improve service execution amp delivery
+ Enhance commercial capabilities
+ Expand domain amp IT project expertise
Installed base dynamics
1000+ Tier 4-compliant loco orders
~650 locomotives un-parking in rsquo14
450 new locomotives in South Africa
Key metrics Services imperatives
69
Railroad industry is faced with expanding challenges and customers require a solution provider
Customer challenges
RailConnecttrade360 delivering customer focused outcomes
Asset utilization
Capacity limited
Resource constraints
Ops Complexity
$80B+ N American operating revenue (~4 growth)
7 year high Traffic volumes require unparalleled investment
$56B Annual industrial benefit through 1 improvement
Sources American Association of Railroads (AAR) 2013 industry statistics
70
Asset optimization ndash fuel efficiency
Customer Dynamics RailConnect 360 ndash Trip Optimizer
bull Real-time embedded optimization algorithms
bull Advanced data acquisition enabling train health monitoring
bull Automated train handling reduces wheel amp rail wear
bull $1M diesel locoyear 22K GE locos
bull Emissions
bull Huge operating variation operators trains topography
Trip Optimizer with CSX
Implementation on 1500 CSX locomotives
Reduced fuel use by 7 on average Decreased 3rd largest operating expense
- CSX Sustainability Report 2013
Tr ip Opt imizer Quick Star t Guide (1) Train Speed is available on the speedometer during an active trip during auto and Manual Control
(2) Trip Plan Speed displays a green Trip plan speed pointer on the speed indicator dial in Auto and Manual
modes of operation
(3) Trip Optimizer Status Box is visible when Trip Optimizer system is ACTIVE and provides three types of messages Status Request for Operator InputAction and Error
(4) TrackCivil Speed Limit plot line is Cyan shown the entire horizontal range data permitting
(5) Train Speed (Actual) plot line is White shown only from the head of the train on back
(6) Train Head is shown as a thick White line to allow the operator to see the position of the Train relative to the
terrain The horizontal scale of the rolling chart is zero-referenced to the Head of the Train (corresponds to the forward-facing end of the lead locomotive)
(7) Train Milepost has an associated location and name Its representation on the screen consists of a graphical
pointer and an identifier
(8) OMB Message Box displays operator messages
(9) Consist Notches displays Lead and Trailing locomotive notches
(10) Throttle Handle Notch represents the Master Control-ler handle position During TO Auto Control it will indicate
N8 as TO automatic control requires notch eight (N8) set-ting
(11) Auto Control Notch displays on screen as a White box to denote TO Auto Control engagement and throttle out-
put control
(12) Trip Plan Speed has a Green plot line shown as the entire horizontal range when available and data permit-
ting
(13) Manual Control Zones is shown as a Gray rectangle on the terrain plot extending across the entire vertical range of this section of the chart
(14) Planned Braking depicts Blue areas where Trip Opti-mizer expects that dynamic andor air braking will be
required to maintain the plan speed
(15) Key Locations are softkey states that constitute a unique mapping of functionality to key locations
1 How do I get started To start a trip you will push the Trip Optimizer key on the Main operator screen
2 Do I have to be stopped to request a trip through Trip Optimizer It is preferred to perform a trip init at zero speed however unless otherwise provided by
local ruleinstruction maximum speed for initialization is 15 mph
3 I have performed the Trip Init process and see the rolling map When will I get prompted for Auto Control
Auto Control will become available when the speed is greater than 12 mph and the Throttle handle is N1 or higher
4 Why does the Locomotive Status matter to Trip Optimizer Trip Optimizer will always monitor in train forces speed braking and fuel efficiency To best optimize all of these Train dynamics Trip Optimizer must be told by the operator what the
status of each locomotive in the train The three modes are defined as follows
Running The locomotive is fully operational and is used for calculating TPOB
Isolated The locomotive is either shut-down or is mechanically isolated from produc-
ing Tractive Effort
DB Cutout The locomotive has no Dynamic Braking available but is being used for
producing Tractive Effort
5 What is the recommended way to disengage Auto Control The most fuel efficient way is to decrease the throttle notches in 2 second intervals until
you get to the required speed
6 Trip Optimizer is disengaging from Auto mode and tells the opera-tor Manual Control is required I am already in Notch 8 throttle
What do I do
Press the Current Throttle key on the screen Moving the Master Controller from Notch 8 to
Notch 7 and back could result in un-safe train handling practices
7 Why does Trip Optimizer not always travel at Track speed Trip Optimizer will use the forces of the train and momentum to achieve the optimal speed to save fuel In some cases Idle will be used to meet a planned slow order Trip Optimizer is
always looking out a few miles ahead to plan for the ideal speed while maintaining safe train handling
8 How do I report an inaccuracy on the civil speed limits posted on the rolling map
Contract your Road Manager to report the case
9 The dispatcher has issued an enroute slow order Will Trip Opti-
mizer automatically take this into account
No If an enroute slow order is issued it will be the train crewrsquos responsibility to protect the
train in Manual mode during this affected zone
10 Why does Trip Optimizer automatically end the trip when I still have distance remaining before the preset crew change point
The subdivision has a GPS controlled end point that will automatically end the trip based off of recommendations from the railroad
Follow the steps on the backside of this document to walk you through performing a Trip Init
Trip Optimizer Top Ten List
GE Proprietary Information The information contained in this document is GE Proprietary Information and is disclosed in confidence It is the property of GE and shall not be used disclosed to others or repro-
duced without the express written consent of GE If consent is given for reproduction in whole or in part this notice and the notice set forth on each page of this document shall appear in any such reproduction in whole or in part The information contained in this document may also be controlled by the US export control laws Unauthorized export or re-export is
prohibited Document 5005807 Rev mdash
Before engaging the TO AUTO throttle the operator must meet certain train conditions and under-stand the data displayed on the Trip Optimizer Running Screen
Doc No 5005890 Rev -
71
Operations optimization ndash velocity
Movement Planner with Norfolk Southern
RailConnect 360 - Movement Planner
bull Systems problem hellip beyond human capabilities
bull Majority single track
bull Point solutions have plateaued
bull Integrated suite of day of operations software apps
bull Predixtrade platform - connectivity big data and security
bull Advanced algorithms and automatic routing
bull Proven in class 1 revenue service
Norfolk Southern and Movement Planner
Automated routing decisions
10+ increase in velocity
50+ reduction in expired crews Significant improvement in
schedule adherence
1MPH = ~$200MM estimated
annual savings in capital amp expenses
Based on 3 year study in NS GA division
Customer Dynamics
72
bull Co-development GE Transportation amp GE Intelligent Platforms
minus Enhanced sensor coverage
minus Improved data acquisition higher resolution
minus Advanced analytics
bull Asset specific insight drives fault reduction and enables CBM
(SmartSignal)
bull 20K+ overhauls in backlog
bull OH interval based on average expected condition
bull $1B+ capital expenditure in North America every year
Impact Reduced unplanned
downtime amp avoid road failures
Reduce unscheduled material consumption
Extended periodicity and associated expenses
ldquoPhysicsrdquo change
Real Time Engine Performance
Bearing Temp
Bearing Temp
Load
Ambient
To
da
y
To
mo
rro
w
Alarm trigger
Savings
CSA ndash shared productivity
Lifecycle Cost Dynamics ndash Engine Overhauls RailConnect 360 ndash Advanced Analytics
GErsquos 1 Jamie Miller - Senior Vice President Chief Information Officer
- In current role since 2013
- 9 years with GE
74
Digital opportunity
Simplifying structure
More valuable GE resources with fully integrated approach
+ Utilize data from products
+ Field services tools
+ CRM configurators
+ Brilliant Factory
Benefits
ERPmanufacturing 90
Data Centers 80
Applications 30
Shared Services 65
Cloud 70
Product Cost
RampD
SGampA
+ Engineering tools
+ Shared Services GL
+ Cyber Security
IT plays
-a)
(a - Target percent of new applications that are Cloud enabled
~$94B
Industrial cost
75
Three opportunities to power manufacturing
Digital Foundation 1
Unlocking Big Data
minus Sourcing
minus Productivity
2
Powering the Brilliant Factory
minus Design for manufacturing
minus Sensor enablement
minus Plantsupply chain optimization
3
minus 90 reduction in ERPs
Supply Chain Network
Virtual Mfg
Virtual Product Design
76
Product Cost ERP investments paying off
Inventory turns 6x 7x
Shipment on time 58 85
Foundation for business to deliver $1B+ savings over past 5 years
GE Healthcare
of revenue on target ERP ~75
~95
2009 Today
Today 219 ERPs 2016 34 ERPs
GE Water
2008 Today
22
1
of ERPs
SGampA of sales ~10 pts
Past dues 60
Finance headcount 50
77
Product Cost Using big data to run GE
Ingest Store Clean Consume
1 OampG data lake $8B direct materials buy
Real time More cheaper Faster GE-wide Analytics Data science
$60B total material buy across GE hellip $1B+ cash amp deflation opportunities
bull 23 source systems
bull Full visibility ndash 3 weeks
bull Commodity part supplier
bull Data lake technology
bull Machine learning for data cleansing
bull EM PampW underway (Alstom)
Oil amp Gas
Xxxxx Xxxxx Xxxxx xxxxx
78
Product Cost Technology powering the Brilliant Factory
20 NPI cycle hellip 20 efficiency
16 pilots launched hellip Fastworks 2020 Vision
FastWorks approach
Virtual design for manufacturing
30 NPI cycle time
Eliminated quality escapes
Wilmington NC
Aviation Machining
Factory optimization
25 productivity
PampE avoidance Greenville SC
PampW Nozzle Cell
machine downtime
25 opportunity
Sensor Enablement
Grove City PA
Transportation Remanufacturing
79
Smart Outage Full deployment at PGS
Changing the way we deliver Services
On track for $1B CSA productivity over 3 years and 10 customer uptime
+ +
Predictive Workscope Aviation 4 customers
full roll-out mid-2015
=
Field services optimization
Predictive workscope
Next generation modeling
Advanced technology
Accelerating productivity
80
We can do more ldquoSrdquo with less ldquoG+Ardquo
45 win rate
80 in quote time
5400+ SalesComm Ops hoursweek
QuickQuote
40K+ GE Commercial FTE
Highly manual long-cycle-time
More ldquoshots on goalrdquo lower cost
Investing in digital tools for commercial teams
Wrap up
82
Value for investors
Payback through most reliable revenue source Services
+ Increase revenue growth
+ Improve margins
+ CSA productivity
Funded software amp analytics through simplification amp reallocation
Potential upside beyond the GE installed base
Scale amp intellect Return on investment
1
2
3
GE Software COE
+ COE can accomplish scale hellip none of
our businesses could do this on their
own hellip attract talent amp spread ideas
+ Advantage to being an early mover hellip
right partnerships amp scale
+ Changing GE Industrial DNA hellip
greater impact from digital amp
analytical investments
83
Why GE
+ More valuable portfolio hellip 75 Industrial while growing EPS
+ Tangible evidence of winning NPI hellip Tier 4 LEAP etc
+ Strong amp diversified global footprint hellip best-in-class
+ Transforming service for next generation of growth
+ Culture of simplification impacting every part of GE
LEAP is a trademark of CFM International

3
Portfolio transformation
Actions taken in 2014 hellip
44 53
56 47
2003 2013 2016F
GE earnings mix
Industrial
GE Capital
Divest
Insurance
Reinsurance
Global consumer
Red assets
Media
Plastics
Silicones
Supply
Appliances
Rebuild Industrial
Dist Power
Life Sciences
Renewables
Oil amp Gas
Water
Av Systems
Power Conv
Services + IT
Completed 15 IPO in 3Q
Well received by market
On track for split-off
Acquiring Power amp Grid
Strong synergies
Targeting close in rsquo15
Sale to Electrolux for $33B
Continued use of GE brand
Targeting close in rsquo15
Premier
Infrastructure
Specialty
Finance ~25
~75
GE Appliances
Actions taken
(Operating earnings-a))
(a- Continuing earnings adjusted for non-operating pension income(expense) in 2003 and 2013 of $16B and $(17)B respectively
4
GE Industrial enterprise advantages
GE businesses
Power amp Water
Aviation
Oil amp Gas
Healthcare
Transportation
Energy Management
All businesses benefit from GErsquos enterprise scale
Enterprise scale
TechnologyNPI (GRC)
Growth markets
(GGO)
Service amp Analytics (Services Council)
Lean structure (Simplification)
Performance
Organic growth gt peers
Margins at ~17 by rsquo16
Returns at ~17 by rsquo16
Consistent earnings growth
5
Leadership in technology ($ in billions)
RampD spend
2012 2013 2014E
$55 $52 =minus
5 of
revenue =minus 5
Key wins
Worldrsquos largest amp most efficient
H-class hellip 614 in combined cycle
13 units in backlog
First to market hellip 1000+ Tier 4
compliant locos on order for 2015+
Won 77 of all narrowbody
competitions since launch
Industryrsquos first 20000-psi hellip reliable
performance in ultra-deep water
Image quality amp capability from low dose
Best-in-class next gen products Advanced manufacturing solutions
to grow margins Leadership across core amp new
product markets
HA gas turbine
Tier 4 loco
LEAP
20k psi
Revolution CT
FastWorks driving speed amp efficiency
6
Scalable across other businesses
Innovation for cost amp speed
1 2 3 4 5 6
Changing the traditional learning curve
Yr
Traditional
Start
Lower
Accelerate
Faster Redefine
Entitlement
Product cost focus areas
Lean labs amp additive technology
Data in the factory
Services delivery cost
Sourcing relationshipsmake vs buy
Footprint and organizational focus
Driving cost with analytics
Full flight data ( of flights)
2 340 1500 Data Volume (Tera Bytes)
GErsquos analytics advantage hellip
15k
Segment by severity of operations
Segment by part
performance
Customized maintenance
cycle + =
Aviation product cost
2013 2014E 2015F
34M
~10M
7
Accelerating in growth markets
10 13 14E Post-Alstom
Driving growth
$29
++
++
Strategic imperatives
Be first mover in localization
Plant new flags Invest in local capability Leadership Manufacturing strength GRC amp innovation Customer support ldquoConnect the dotsrdquo of GE Healthcare amp Oil amp Gas lead Every facility ldquomulti-productrdquo Best partners brand amp risk
management Financing knowledge
1
2
3
$46
Growth market orders
36 44 + +
+ Premier scale amp reach + Best capability
17 AAGR
of
total
($ in billions)
8
Simplification
+
+
+
Lean management Do fewer things better hellip with less structure
Speed amp competitiveness
Get faster amp smarter amp more efficient in everything we do using FastWorks
Commercial intensity
Connect every job to winning in the market while empowering the commercial team amp holding them accountable
Digital capability
Modernize our information technology so we can achieve the speed amp efficiency our scale
should allow
World-class structural cost
More NPI faster with less investment
Global market success
Accelerate margin enhancement
Worldrsquos most competitive company
9
Lower cost
Industrial SGampA sales
175
rsquo12
~12
159 ~14
rsquo13 rsquo14E rsquo16F rsquo15F
~13
($ in billions)
rsquo11
185
Enablers
ERP
90 reduction
Shared services
65 penetration
Corporate
$500MM cost out
+ of PampLs
Layersspan
Product cost
rsquo12-rsquo14E investment
Gains ~$25
Restructuring ~$(43)
10
Technology is evolving
PHYSICAL ANALYTICAL
Multiple materials in complex systemshellip hundreds of patents in each product
Operating with high efficiency amp durability in extreme conditions
1 gas turbine compressor blade monitoring potential 500 gigabytes per day
Combination of physical amp analytical drives next evolution of services
Customers will value data because it improves their efficiency
GE is well positioned to lead this wave of change
Investors will benefit through services growth amp margins + product share + IT-driven efficiency
1
2
3
4
Key messages
+
11
Transforming services
bull Partners amp field
technicians 80rsquos
Big iron
Airlines 1 fuel $2-3B
Utility 1 fuel $4-5B
Oil amp Gas 1 uptime $5-7B
Healthcare 1 productivity $4-5B
Transportation 1 mile velocity $1-2B
Driving customer outcomes
bull Risk sharing
service contract 00rsquos
CSA
bull Asset amp
operations
optimization
Today
bull Science applied
to repairs amp
upgrades 90rsquos
Repair
Power of 1
Annual impact-a)
Small changes in hellip fuel maintenance uptime productivity flexibility safety
labor effectiveness hellip have a big
impact on profitability
(a - Global industry estimates based on ldquoIndustrial Internet Pushing the Boundaries of Minds amp Machinesrdquo ndash Nov 26 2012
Analytics
12
GE leadership
Large high-tech installed base
Customer trust amp connection hellip ~$180B services backlog
Deep domain knowledge
GE advantages What it takes to win
bull Sensors
bull Service robotics
bull Connectivity
Enabling technologies
bull Connected IB
bull Physicsmaterials bull Smart devices
bull Global reach
Installed base
+
+
bull Software capability bull Industrial big data
bull Operating platform
bull Security
Data amp analytics Attracting new talent hellip
ldquohorizontal capabilityrdquo
Connecting domain amp data hellip CSA
Operating platform in place (PredixTM)
Large research capability
Industry partnerships
Collecting 50MM data elements
GE has all essential elements
Have
Have
Investing
13
Improving the service model
Asset optimization
Operations optimization
CSA productivity
CSA + Connected asset + Software revenue value ($IB) outcome sales
Data-driven execution
Maximize performance with no unplanned downtime
Increased system efficiency across GE
amp non-GE assets
Optimize material amp repair cycles
across IB
Make versus buy hellip build internal team
Launch new offerings hellip PredictivityTM
Build on existing CSA relationships hellip ldquowin-winrdquo
Develop a broader ecosystem
1
2
3
4
Investments 2010-14
Focus of innovation
How we execute
14
Asset performance management
Impact for GE hellip $IB productivity for customers hellip velocity productivity
SENSORSANALYTICS
On-site oil analysis Predict remaining life Prevent road failures
SERVICE ROBOTICS
Productivity safety Remote monitoring Tough environment
AUTOMATED DECISIONING
Optimize yard ops Reduce dwell 10 Depart on time up 50
ADVANCED CONTROLS
Auto Train Operation 10 fuel savings
15
Impacting GErsquos 1
$94B of cost
$12B of working capital
$20B of PampE investments
GErsquos 1
Analytics amp
security
IT investment ($2B+year)
+
Reduce structure
Lower product cost
Improve margins
Enhance engineering productivity
Faster amp safer
Impact
Every Industrial company a Software amp Analytical company
16
Investor value
Increase services growth rate
+ More $installed base
+ $08B PredictivityTM solutions revenue growing to $4-5B
+ Penetrate aged GE fleet
+ Grow beyond the GE IB
Improve services margins
+ CSA productivity
+ Improve quality
Potential for industry value
+ Scale beyond GE installed base Backlog Revenue Margins
Services franchise
~$180B
~$45B
~30
Value creation
+
1
2
3
Software amp analytics accelerate services growth margins amp returns
Revenue growth ~5 Margin expansion ~50 bps Limited by IB growth
Historic performance
Services overview
18
Services growth
05 08 11 13
($ in billions)
Revenue
~26 ~30
OP
GE advantages
+ Installed base
+ Technology
+ CSA model
+ Footprint amp scale
+ Software COE
+ Fleet data
$27
$35
$42 $45
Services imperatives
Backlog
1
2
3
Deliver on customer value + Link services to outcomes + Global deployment
Grow $installed base + Drive analytics amp PredixTM value + Penetrate aged installed base
Expand margins + Leverage analytics to manage
performance + Invest in productivity tools
Improve service execution amp delivery + Enhance commercial capabilities + Increase field services capability
Spread ideas across GE
$87 $121 $147 $180
4
5
19
Services Council
Driving differentiated advantage
Cross-business initiatives
20+ services leaders
Teams aligned to 9 themes
Quarterly executive updates hellip operational rigor
Spreading ideas hellip
bull Core growth
bull Operations
bull Tools + process
bull CSA excellence
Data +
Outcomes
bull PredixTM + Cloud
bull PredictivityTM solutions
bull Strategic alliances + BD
Hardware amp domain expertise
Software analytics based
Healthcare Inspection technology
Aviation Repair technology
Power amp Water Global footprint
bull Multimodal ndash service amp repair shops
bull Customer training centers
bull Additive manufacturing
bull Robotic welding
bull Advanced coatings
bull Parts inspection amp measurement
bull Condition-based maintenance
Pune India
20
Enabling technologies Service Robotics Sensing amp Controls Advanced Manufacturing
Inspection Repair Mobile Tools
Launch amp learn hellip then accelerate to all GE businesses
Automated adaptive + Productivity + Less downtime
High tech integrated + Lower fuel usage + Higher efficiency
Productivity safety + Repetitive tasks + Tough environment
Additive new materials + Repair vs scrap + Longer service life
Deployable fast accurate + More digital data + Less downtime
Connected digital + Instant expert access + Lower service costs
21
Increase value of CSA
Benefits for Customers Benefits for GE
Monitoring amp diagnostics
$180B Services backlog
Fuel efficiency
Hardware amp software upgrades
Condition-based work scope
Mobile amp analytical tools
Material productivity
Optimized asset performance
Predictive analytics ndash lower downtime
More output
Lower costs
Lower emissions
Better payback on hardware upgrades
Instant software upgrade capability
Shorter duration outages
Less material usage
Ask an Expert ndash COE
Field Service productivity
Analytics driven parts life extension + performance
Repair vs scrap
22
Segment services dynamics (Services revenue $ in billions)
Power amp Water $125
Oil amp Gas $83
Energy Management
2013
$21
+ Sustained passenger growth
+ Improving airline profitability
+ Upgrades amp analytics
Aviation $108
+ Growth markets strong
+ Improving HCIT
minus Developed challenging
Healthcare $80
+ North America utilization
+ Analytics penetration
minus Mining parts
Transportation
$28
2013
2013
2013
2013
2013
2013
+ Continued AGP growth
+ Upgrades amp analytics
Europe
+ Strong Subsea
+ MampC improving
+ Analytics penetration
+ Marine offshore
minus Mining amp motor repairs
23
Presentation
Common capability Software COE
Analytics commercialization
Bill Ruh
Kate Johnson
Business execution
Strategy overview
Customer outcomes
Examples of analytics driving growth amp productivity
Competitive advantage
Power amp Water
Healthcare
Aviation
Oil amp Gas
Transportation
Paul McElhinney
Jan De Witte
Kevin McAllister
Brian Palmer
Pete McCabe
Common capability GErsquos 1 Jamie Miller
Software amp PredixTM
Bill Ruh - VP Global Software Center
- 3 years with GE
- 32 years of industry experience
Kate Johnson - VP GE Commercial Officer
- 1 year with GE
- 15 years of industry experience
25
The Industrial Internet
3 Hyper connectivity a living network of the worldrsquos machines data amp people
Internet
Increasing system intelligence through embedded software hellip advanced sensors
controls and software applications
Brilliant Machines
Democratization of data hellip high frequency real-time data
Big Data
Predictive algorithms hellip physics-based analytics hellip deep domain expertise on big industrial data
Analytics
People at work Connecting people at work or on
the move Supporting more
intelligent design higher service
quality operations amp safety
maintenance
1
2
3
4
5
26
61
45
31 28 31 40 42
29
29
45 63
56 56
47 45
41
10 6 6
16 9 10 9
24
Software outlook Customer survey Importance of
Big Data analytics relative to other priorities
Source Accenture 2015 Trend Report Gartner Big Data Survey
Aviation
3 3 3 3 6
Wind
Power Generation
Power Distribution
Oil amp Gas
Rail
Manufacturing
Healthcare
Highest priority Within the top 3 priorities Within the top 5 priorities Not a top priority
Opex is becoming a deciding
factor for IT investments as
80 of budget is allocated to
managing and running
complex technologies Source Gartner
Advanced analytics and
analytical applications
expected to see double digit
revenue growth Source Gartner
APM market category
expected to reach $300B
by 2020 Source Gartner
27
Industrial customersrsquo perspective Survey of GErsquos customers regarding applications
Real-Time Operator Intelligence
Remote Monitoring amp Diagnostics
Condition-Based Maintenance
Asset Lifecycle Management
Schedule Optimization
Energy Management
Process Control Automation
Field Force Automation 32
38
42
43
49
59
66
70 Tailor Pre-Built Applications
Have A Systems Integrator Build
Your Apps
Build My Own Custom Apps 15
54
85
HOW do you want to consume it WHAT functionality is most valuable
Asset performance management is the killer industrial app
28
What industrial customers want
SDM
SDM
SDM
SDM SDM
Software Defined Machines (SDMs)
ldquoLink up all my assets and devicesrdquo
REAL-TIME
OPERATIONAL
INTELLIGENCE
CONDITION-
BASED
MONITORING
ASSET LIFECYCLE
MANAGEMENT
MONITORING amp
DIAGNOSTICS
Industrial Apps
SDM Non-GE Assets enabled by PredixTM Machine SDM
SDM GE Assets enabled by PredixTM Machine SDM
PredixTM powers Asset Performance Management (APM)
29
Insights into value
Improving safety and
productivity across 15K miles
of interstate natural gas
pipelines
Potential Savings
77 gallons of fuel and 1628
lbs of CO2 per approach
10 increase in network
velocity 50 reduction in
expired crews amp significant
improvements in on-time
performance
Up to 4 increase in power
output across 283 wind
turbines hellip 40+ GWhr annual
increase
Asset Performance Management (APM)
REAL-TIME OPERATIONAL
INTELLIGENCE
CONDITION-BASED
MONITORING
ASSET LIFECYCLE MANAGEMENT
MONITORING amp
DIAGNOSTICS
Operations Optimization
INSIGHT PROCESS
INTEGRATION
AUTOMATION COLLABORATION
PredixTM Platform
PredixTM Machine PredixTM Net
GE
Non-GE
PredixTM Asset PredixTM Insight
PredixTM Fabric PredixTM Core
PredixTM Experience
Predixtrade hellip the GE advantage
Release in 2015
Public Cloud Private Cloud
Commercially available to connect more machines more data amp more people
TR
AN
SF
OR
MS
PO
WE
RS
PredictivityTM Solutions
30
Predictivitytrade hellip app factory
Asset optimization (28)
Operations optimization (14)
Productivity tools (77)
Approach Development process
Agile amp Extreme Programming
Design Center for delivering
compelling user interface
Cyber security Blue team to build
and Red team to test
90-120 day service engagement to production roll out
+
+
+
Co-innovation process to design
build transfer and iterate
Actionable insight on equipment based
on physics and analytic modeling
with industrial data
Outcome based process improvements
to plants pipelines fleets fields facilities
grids shops
Increase service throughput efficiency
and quality at optimized cost of
delivery
Delivering industry apps at speed and scale
31
World-class Software amp Analytics organization
Investing in Leadership Talent
Colin Parris (IBM)
SW Research
Co-located SW CTOs for business alignment
D Bartlett
(IBM)
Aviation
World-class technical resources
Computational amp analytics scientists
Platform developers
Software engineers
~10000
1000+ Biz
COE
Product Dev Software CTO
Brad Surak (SAP)
Harel Kodesh (Microsoft
Start Up Veteran)
Trans S Chotai
(HP)
OampG J Demesa
(Siemens)
PampW G Bell
(ServiceSource)
EM J Stone
(SAP)
HC E Eryurek
(GE)
+
+
- Cyber UX Data Science Agile development
Four deep core competencies ecosystem
1
Leading edge platform + world-
class ecosystem 2
Advanced research for building
the future 3
Advanced process to drive adoption amp enablement
4
Software Site
Organization
Technology amp Ecosystem
32
Wurldtech protecting critical infrastructure
World-class cyber security to operate assets + operations safely
About A GE Company acquired in May 2014 providing top cyber talent
Capability Assess protect amp certify critical infrastructure from cyber attack
Key Customers 4 of 6 top global OampG companies 9 of top 10 automation vendors
Security enhancements delivered through PredixTM and GE Products
Certify GE and non-GE products and customer environments
Identify vulnerabilities in OT products (GE and 3rd party)
Assess and prioritize risks for system operators
Achilles Industrial Next Gen Firewall to inspect and control
Industrial network traffic
Leverage industry leading threat intelligence
Protect operational
environments
Secure amp certify industrial products
Assess products amp operations for vulnerabilities
33
Partnerships amp Alliances
Intel ATampT AWS Cisco others
Venture Capital
Mergers amp Acquisitions
ThetaRay Mocana Frost
Strategic Moves
Wurldtech Austin Digital
Acquire capability to fill gaps
Pivotal Softbank Industrial Internet Consortium
Industrial internet ecosystem
Industry Ecosphere
Establish interoperable amp scalable solutions
Co-development amp go-to-market
Accelerate innovation amp success
Positioned to create value
Open PredixTM beyond GE
GE will sell
+ + Connected devices
Data Under Management
Performance Applications
PredixTM Machine Services
PredixTM Data Services
PredixTM Asset Services
Connect assets regardless of vendor or
vintage and provide value-added services
Aggregate and analyze data to produce
actionable business insights
Sell horizontal apps that maximize return
on assets and people
1
2
3
34
Competitive advantage
$1T Connected
Machines
managed by GE
replacement value
10M Sensors
collecting
50M Data
Elements
$20B Potential
Annual Customer Savings
50B Machines will be connected on the internet by 2020
2X Industrial data growth within next 10 years
Big Iron + Big Data = Big Outcomes
INDUSTRY GE
35
New ways to sell Services
2 Making Markets Different Economics
3 Co-creation amp Agile Development
4 Solution Architecture
5 Value Based Deal Shapes
6 New Industry Ecosystems
1 New Buyers and Influencers
GE Commercial Center of Excellence
Needs Target Architect Close
Qualification amp Pipeline Management
Sales Process
HireTrain Community of Experts
Enablement Toolkit
36
Accelerating time to value across channels
APM Subscription Services
Enterprise Analytics Projects
Upgrade value in CSAs
GE Sales Model
Existing Services sales team
New standalone software sales specialists
New outcome sellers + existing service sales team
Sales
acceleration
Expert SWAT
teams to
support deal
SW experts compelling
offer target one outcome
to land and expand
Ecosystem partners
SW COE app factory
Offering RMampD in CSA upside
and productivity Per well subscription
Enterprise SW deal
solution co-creation
ReliabilityMaxtrade FieldVantageTM Intelligent PipelineTM
GE OampG Example
Market
Opportunity $2B $600MM $27B
37
Measuring commercial success
Services revenue
Past Future
~5
+
rsquo13 rsquo17F
Assets under management $1T+ ++
PredictivityTM solutions revenue $08B ~$4-5B
Services backlog $180B ++
bull Adding more value to existing service relationships hellip training team to get more out of the installed base
bull Creating new revenue streams and building new commercial skills and incentive plans to accelerate growth
Outcome sellers solution architects product management amp marketing
bull Cultivate ecosystem to help accelerate commercially with access to CIOCTO relationships and system integration skills
Power amp Water Paul McElhinney - President amp CEO Power
Generation Services
- In current role since May 2014
- 26 years with GE
39
Power amp Water Services
Growing services amp delivering greater customer value
Key metrics Services imperatives ($ in billions)
13 14E
+
Backlog $53 +
Revenue $125
Installed base dynamics
1
2
3
4
Deliver on customer value + Develop flexible solutions
+ Reduce customer operating cost
Grow $installed base + Maximize impact of Alstom alliance + Invest in new service offerings
Expand margins + Tech upgrades amp software solutions + Outage excellence
Improve service execution amp delivery + Improved customer service levels
+ Optimize field service amp repair network
Unit growth up ~24X from 2008
Strong DP amp Wind growthhellip up ~1Kyear
~4000+ gas turbines in service
40
Global power industry is facing complex challengeshellip Offering innovative solutions to address customersrsquo needs
Fuel price uncertainty
Increasing regulation
Slow demand growth
Aging installed base
~15 years Average age of ~4K global GE gas turbines
Output
Efficiency
Reliability
Availability
Flexibility
Improving customersrsquo outcomes while decreasing costs
~$7B
Customer challenges
~$8B
~$2B
~$1B
~$2B
GE Predictivitytrade solutions amp industry benefit
~60+ Increase in US natural gas price since 2012
~(30) Thermal capacity in Europe since lsquorsquo08
Based on 10 year NPV
41
Investing in technology
Addressing multiple customer value levers
Advanced Gas Path (AGP) Industry leading output hellip up to +64 Industry leading efficiency hellip up to +18 Extends asset amp parts life hellip 96K hours
1
Op Flex Delivers flexibility to costs amp revenue Reduces start up time amp fuel consumption Expands fuel source opportunity
3
Dry Low NOx 26+ (DLN) Reduces NOx emissions by 40 Delivers industry leading flexibility Increases maintenance intervals to ~1250 starts
2
42
Power FlexEfficiencytrade Advanced Gas Path
Expanding the operating envelope
Ambient Temperature
Ou
tpu
t (M
W)
Op Flex
7FA03 baseline
AGP
+ ndash
+
Combining hardware and software hellip creating 2X the value
$17
$30
Op Flex
Average Customer Annual Value Per Unit ($MM)
Improving customer outcomes
AGP (Hardware)
AGP PredictivityTM
Solution
125+ AGPs with software sold to date
650000+ operating hours to date
43
Wind PowerUp hellip generating more output
Customer Outcome Up to 4
increase in power output across 283
wind turbines hellip 40+ GWhr annual increase ldquoThe PowerUp system offers a great chance for owners like us who are investing literally billions of dollars in this market to try and get more production out of existing assets GE took a lot of risk out of this for usrdquo
ndash Patrick Woodson CEO EON Climate amp Renewables
Opportunity for up to
20 more profit from up to
5 more output
A performance based
cooperative approach
with a holistic view of the
assets system and network
Flexible payment options
aligned to customer needs
+1400 turbines under contract since launch
Customer opportunity
Software enabled
Flexible platform
Proven results
Scale out
1
2
3
Healthcare Jan De Witte - President amp CEO Healthcare IT
- In current role since 2011
- 15 years with GE
45
Healthcare Services
Delivering value = higher quality outcomes at lower cost
Key metrics Services imperatives ($ in billions)
Backlog $11 +
Installed base dynamics
1
2
3
4
Deliver on customer value + Asset and workflow optimization + Analytics around EMRs amp Devices
Grow $installed base
+ Quality and analytics offerings + Solutions architecture amp delivery
Expand margins + Remote service amp SaaS models + Field services productivity Improve service execution amp delivery + Remote monitoring technologies + Field force deployment optimization
Emerging markets infrastructure build
Mature markets quality upgrades
ACA amp Enterprise Solutions IT penetration
13 14E
=+ Revenue $80
46
Healthcare industry shifting to value-based care GE software analytics and services are uniquely positioned to help
Customer challenges
Integrated Care Solutions hellip turning data into actionable insight Improving healthcare outcomes
Diagnostic quality
Patient-centric care
System profitability
Chronic Disease Management
Sources Institute of Medicine 2013 Porter Research 2013 McKinsey IHS Global Insight
29 Healthcare spend wasted each year
$260B Annual value creation through healthcare IT
59 US lives covered in value-based care model by 2015
Clinical Quality
Financial Performance
Operational Efficiency
Configurable Workflows
47
GEHC Software portfolio positioned along main outcome drivers for care systems
Diagnostic speed amp confidence
Productive care pathways
Wellness amp chronic disease management
Risk amp margin management
Costworkforce optimization
Population Health Management
Workflow
Archiving
Visualization
Financial Management
Care Delivery Management
Enterprise Imaging
Operations Management
Revenue Cycle
Risk assessment
Margin analytics
Workforce optimization
Asset Management
Integrated Care Solutions
Ambulatory Care
High Acuity Care
Cardiology
Analytics
Care coordin
Engagement
Providing caregivers the right actionable insight ndash when amp where they need it
Large GE device footprint generating
clinical data
HCIT domain in clinical workflow amp analytics
SW CoEPredixTM capabilities + +
48
Enterprise Imaging Improving diagnostic workflow in the cloud
Customer Challenges Cloud Case Exchange CentricityTM 360
Sample Customers Solution Architecture
Clinical Collaboration amp Advanced Analytics
Imaging Cost Control
Archive
Workflow
19 Time spent
gathering data
Workflow
velocity
Diagnostic
confidence
Cases diagnosed
incorrectly 35
~$2B segment by rsquo18 growing 25+
30 turn-around time
3 duplicate exams
Customer value $10MM+ cost pa
Image-as-a-Service lifecycle value $20MM+
Care quality
Cost
Source Research from the Journal of the American College of Radiology and the Journal of American Medicine
49
Customer Challenges Workforce management
Sample Customers
Operations Management Optimizing workforce productivity with API Healthcare
54 Hospital
operating cost
spent on labor
Solution Architecture
Real-Time Analytics Labor amp Patient Workflows
Time amp Attendance
Staffing amp Scheduling
HR amp Payroll
~$2B segment by rsquo18 growing 12+
20 Workforce productivity
Customer value $4MM cost pa
Workforce-mgmt services lifecycle $4MM+
80 Overtime wages
Matching care-giver capacity
amp patient need
Care quality
Labor
productivity
Source Beckerrsquos Hospital Review
50
Population Health Management Lowering the cost of chronic disease
Customer Challenges
Solution Architecture
Caradigm Analytics amp Care Mgt
Proactive
intervention
Care protocol
compliance
75 Cents of every
healthcare dollar
spent on chronic
disease
Care Mgt Analytics Risk Cohort
25
Customer value $5MM+ cost pa
Caradigm lifecycle value $18MM+
Patients per care manager
~$30B segment by 2025 growing 19+
Sample Customers
40 Hospitalization for chronic patients
Chronic disease
treatment cost
Source National Diabetes Fact Sheet
51
Software enabling productivity in service process
Wo
rkfo
rce
Pla
nn
ing
amp
Dis
pa
tch
Historically up to 40 FE travel time hellip utilize analytics to optimize allocation
Smart dispatch with effective job-skill matching
Optimize field force capacity and response time to customers
Call Generation (Planned amp Unplanned)
Deploy
RepairFix
Diagnose
CloseDebriefBill
Pe
rfo
rma
nce
M
on
ito
rin
g 110k GEHC devices connected remotely
MR hellip 900 data points monitored per machine 30k alertsyear proactively fixed
Improves GE productivity while minimizing customer down-time
Healthcare Services margins improving
Aviation Kevin McAllister - President amp CEO Aviation Services
- In current role since May 2014
- 25 years with GE
53
Aviation Services
13 14E
+ $108
Backlog $97 +
Revenue
Key metrics Services imperatives
Commercial IB hellip 34000 engines
Young hellip 46 havenrsquot had 1st shop visit
Fuel cost driving investment hellip GE well
positioned hellip 787 737MAX A320NEO 777X
Installed base dynamics
1
2
3
4
Deliver on customer value
+ Lowest cost of ownership
+ PredictivityTM outcomes
Grow $installed base
+ Winwin providing technology upgrades and analytics
Expand margins
+ Time-on-wing for GE and customers
+ Cost productivity hellip for GE
Best service execution and delivery
+ Position to support service entry for next-gen products
($ in billions)
54
Solid growth fundamentals
Shop visits Environment Departures
Source IATA amp GE analysis
Passengers IATA RPK YoY
Utilization Avg cycles day YoY
Departures GE and JV-powered flights (MM)
0
5
10
15
20
25
30
35
40
lsquo10 lsquo15F lsquo95 lsquo00 lsquo05
4100
5500
4400
2100
2000
3000
2300 2000
2300
200
100
-1 09 02
2012 2013 2014E
53 52 58
20 21 22
2 of 3 daily flights
powered by GE or GE JVs
46 have not
had 1st shop visit
4 CAGR Number of departures (MM)
lsquo13 rsquo15F rsquo20F
CFM is a 5050 JV between GE and Snecma EA is a 5050 JV between GE and Pratt amp Whitney
55
Solving our customers toughest challenges
Airline direct operating costs
Fuel
40
Delays and cancellations
8
Maintenance
9
Services analytics offerings
Flight Efficiency Services
Performance-based Navigation
Analytics-enabled workscoping
Product and Services strategy
Provide lowest cost-of-ownership through OEM technology
Lead in on-wing reliability
Lead in technology
Best-in-class fuel burn and retention
Engine diagnostic and prognostics
Intelligent Operations
$200Byr
$40Byr
Taleris is a 5050 JV between GE and Accenture
+
56
Services technologies hellip improving value through the lifecycle
Installed base (lsquo13) Upgrades
Fuel Burn improvement
Time- on-wing
8 8 2x
8 3 3x
5 2 2x
A culture of technology insertion Tailored to customer wants
CFM is a 5050 JV between GE and Snecma
Risk transfer $hour coverage
Overhaul Time and material
Materials New used and repaired parts
Asset optimization TRUEngineTM program diagnostics
+
CF6-80C (lsquo86 EIS)
GE90 (lsquo95 EIS)
CFM56 (lsquo84 EIS)
3000
1500
18500
57
Minds amp Machines at GE Aviation
+ Ex
po
sure
Operator A Operator B Part Temperature Cruise Takeoff
Te
mp
era
ture
Threshold
Climb
1000+ software engineers GE Software COE
6300 applied engineers GE Aviation
Data Secure continuous accessible
Physics Apply engine expertise
+ =
Customer and GE benefits
+
Statistics Unlock trends segment
ldquoPhysicsrdquo ldquoAnalyticsrdquo
Time-on-wing
Reliability and availability
Fuel cost
Repair and overhaul
58
Lead in on-wing reliability
Applied analytics to detect engines at risk of removal
Cu
mu
lati
ve
dis
tre
ss
Cycles
Recent successes hellip
CFM is a 5050 JV between GE and Snecma
Segment
GE90
120 CFM56
40 Water wash
$7Myr fuel savings at one GE90 operator
removals saved
removals saved
Nominal environment
Abate
Harsh environment
59
$30MMyr savings
Flight Efficiency Services App
Performance-based Navigation App
Attacking fuel spend with analytics
Joint marketing hellip
ldquoPerfect flightrdquo video
In the news
Newsletter
Oil amp Gas Brian Palmer - Vice President Measurement amp Control Solutions
- In current role since 2010
- 29 years with GE
61
Oil amp Gas Services
Software amp Services as a key differentiator
Key metrics Strategic imperatives ($ in billions)
13 14E
++
Backlog $58 ++
$83 Revenue
1
2
3
4
Deliver on customer value + Customer co-creation
+ Outcome based solutions
Grow $installed base + Drive analytics amp PredixTM
+ Penetrate the installed base
Expand margins + More software and contract offerings
+ Continue to grow backlog double digits
+ Partnerships to accelerate journeyhellip
Meridium
Improve service execution amp delivery + Full lifecycle productivity
+ Simplifying structure
IB growing TMS and Subsea with 13K+ units Software investments creating new IB revenue
streams in addition to traditional parts and service New contractual (CSA) offerings developedlaunched
Installed base dynamics
62
Oil amp gas industry is faced with expanding challenges GE software data and analytics are uniquely positioned to help
Customer challenges Equipment Availability
Equipment Reliability
Operational Efficiency
Production Optimization
Industrial Internet hellip turning data into actionable information Enable no unplanned downtime
Increasing complex operations
Tighter regulations
Skills gap
Machines with data potential
Sources GE OampG analysis based on Wood Mackenzie Rystad Barclays IHS CERA PFC Energy IEA httpwwwgecomstoriesoil-and-gas-innovation Oil and Gas Facilities 2013 httpwwwspeorgogfprintarchives201306
$800B+ Annual industry CAPEX (6-8 growth per year)
$150MM Average annual cost for mid-size LNG facility due to unplanned downtime
5-10 Range of OampG industryrsquos estimated downtime
63
Predixtrade hellip Unified Operations Improved throughput connecting people machines and data
Customer outcomes
Unified Operations ndash A customer co-creation success story
Enhanced safety
Increased availability
Operational visibility
Efficient workforce enablement
Partnering with to tackle these industry challenges and create a solution that increases production and lowers cost driving improved customer outcomes
Unified Customer
Portal
129000 Pieces of equipment in operation globally in
the industry
50 Industry retirement rate in next 10 years
7X Industry fatality rate
above norm
people
machines
data
64
FieldVantagetrade hellip Asset Performance Management (APM) for Onshore
APM ndash Bringing GE expertise from all industries to deliver system level value
Customer outcomes
Enhanced safety
Operational visibility
Improved availability
Optimized performance
Monitoring amp
Diagnostics
Condition Based
Maintenance
Real time Operations
Intelligence
Asset LifeCycle
Management
bull Providing field level visibility and optimization across multiple forms of artificial lift technologies bull Integrated insights provided through common single scalable platform bull 2 year service contract on 200+ wells
Solution Overview
39 NAM OampG Upstream Vehicle Fatalities
hellipby improving
116K New wells in 2014
5 Days Back to production (NAM Avg)
1MM+ Artificially Lifted Wells (Global)
65
Intelligent Pipeline hellip Operations optimization software for pipelines
2TB of data for every
30K miles of pipeline
3-4 annual growth
2MMmiles of
pipelines globally
$40B invested by pipeline companies per year
Source 2TB - Average data volume based on GE internal analysis of multiple pipeline customers Rest - GE OampG analysis based on Douglas Westwood IHS CERA FERC CIA World Factbook PII Pipeline Database (Summary of Infield Systems Global Data DOT databases)
bull 5 year service contract
bull Setting the industry standards for
pipelines real-time intelligence
First customer Customer outcomes
Enhanced safety Proactive versus reactive decisions
Visibility Complete geospatial view and situational awareness
Optimized Ops Effective data driven resource allocation
Efficient OampM Prioritize spending for assets and resources
Moving to proactive solutions with our customers
66
Customer Benefits
Zero unplanned downtime
Increased availability
Increased reliability
Decreased production losses
$14B Additional opportunity driven by
availability and reliability increase (1 of capacity)
Industry Opportunities
Outcome base service bonus
GE Productivity Improvements
Inventory through parts flow optimization
Outage durationfrequency driven by condition- based maintenance
Services Optimization hellip Creating optimal value for GE equipment customers
Journey to 100 reliability through our Contractual Services Agreements (CSA)
Transportation Pete McCabe - Vice President Global Services amp Solutions
- In current role since 2013
- 20 years with GE
68
Transportation Services ($ in billions)
13 14E
+
Revenue $28
Backlog $12B+ +
1
2
3
4
Deliver on customer value
+ Outcomes - velocity fuel reliability
+ System solutions ndash RailConnectTM 360
Grow $installed base
+ Increase penetration ndash Parts amp Smarts
+ Extend asset life ndash modernizations
+ Broaden software solutions ndash rOS
Expand margins
+ Deploy advanced analytics ndash PredixTM
Improve service execution amp delivery
+ Enhance commercial capabilities
+ Expand domain amp IT project expertise
Installed base dynamics
1000+ Tier 4-compliant loco orders
~650 locomotives un-parking in rsquo14
450 new locomotives in South Africa
Key metrics Services imperatives
69
Railroad industry is faced with expanding challenges and customers require a solution provider
Customer challenges
RailConnecttrade360 delivering customer focused outcomes
Asset utilization
Capacity limited
Resource constraints
Ops Complexity
$80B+ N American operating revenue (~4 growth)
7 year high Traffic volumes require unparalleled investment
$56B Annual industrial benefit through 1 improvement
Sources American Association of Railroads (AAR) 2013 industry statistics
70
Asset optimization ndash fuel efficiency
Customer Dynamics RailConnect 360 ndash Trip Optimizer
bull Real-time embedded optimization algorithms
bull Advanced data acquisition enabling train health monitoring
bull Automated train handling reduces wheel amp rail wear
bull $1M diesel locoyear 22K GE locos
bull Emissions
bull Huge operating variation operators trains topography
Trip Optimizer with CSX
Implementation on 1500 CSX locomotives
Reduced fuel use by 7 on average Decreased 3rd largest operating expense
- CSX Sustainability Report 2013
Tr ip Opt imizer Quick Star t Guide (1) Train Speed is available on the speedometer during an active trip during auto and Manual Control
(2) Trip Plan Speed displays a green Trip plan speed pointer on the speed indicator dial in Auto and Manual
modes of operation
(3) Trip Optimizer Status Box is visible when Trip Optimizer system is ACTIVE and provides three types of messages Status Request for Operator InputAction and Error
(4) TrackCivil Speed Limit plot line is Cyan shown the entire horizontal range data permitting
(5) Train Speed (Actual) plot line is White shown only from the head of the train on back
(6) Train Head is shown as a thick White line to allow the operator to see the position of the Train relative to the
terrain The horizontal scale of the rolling chart is zero-referenced to the Head of the Train (corresponds to the forward-facing end of the lead locomotive)
(7) Train Milepost has an associated location and name Its representation on the screen consists of a graphical
pointer and an identifier
(8) OMB Message Box displays operator messages
(9) Consist Notches displays Lead and Trailing locomotive notches
(10) Throttle Handle Notch represents the Master Control-ler handle position During TO Auto Control it will indicate
N8 as TO automatic control requires notch eight (N8) set-ting
(11) Auto Control Notch displays on screen as a White box to denote TO Auto Control engagement and throttle out-
put control
(12) Trip Plan Speed has a Green plot line shown as the entire horizontal range when available and data permit-
ting
(13) Manual Control Zones is shown as a Gray rectangle on the terrain plot extending across the entire vertical range of this section of the chart
(14) Planned Braking depicts Blue areas where Trip Opti-mizer expects that dynamic andor air braking will be
required to maintain the plan speed
(15) Key Locations are softkey states that constitute a unique mapping of functionality to key locations
1 How do I get started To start a trip you will push the Trip Optimizer key on the Main operator screen
2 Do I have to be stopped to request a trip through Trip Optimizer It is preferred to perform a trip init at zero speed however unless otherwise provided by
local ruleinstruction maximum speed for initialization is 15 mph
3 I have performed the Trip Init process and see the rolling map When will I get prompted for Auto Control
Auto Control will become available when the speed is greater than 12 mph and the Throttle handle is N1 or higher
4 Why does the Locomotive Status matter to Trip Optimizer Trip Optimizer will always monitor in train forces speed braking and fuel efficiency To best optimize all of these Train dynamics Trip Optimizer must be told by the operator what the
status of each locomotive in the train The three modes are defined as follows
Running The locomotive is fully operational and is used for calculating TPOB
Isolated The locomotive is either shut-down or is mechanically isolated from produc-
ing Tractive Effort
DB Cutout The locomotive has no Dynamic Braking available but is being used for
producing Tractive Effort
5 What is the recommended way to disengage Auto Control The most fuel efficient way is to decrease the throttle notches in 2 second intervals until
you get to the required speed
6 Trip Optimizer is disengaging from Auto mode and tells the opera-tor Manual Control is required I am already in Notch 8 throttle
What do I do
Press the Current Throttle key on the screen Moving the Master Controller from Notch 8 to
Notch 7 and back could result in un-safe train handling practices
7 Why does Trip Optimizer not always travel at Track speed Trip Optimizer will use the forces of the train and momentum to achieve the optimal speed to save fuel In some cases Idle will be used to meet a planned slow order Trip Optimizer is
always looking out a few miles ahead to plan for the ideal speed while maintaining safe train handling
8 How do I report an inaccuracy on the civil speed limits posted on the rolling map
Contract your Road Manager to report the case
9 The dispatcher has issued an enroute slow order Will Trip Opti-
mizer automatically take this into account
No If an enroute slow order is issued it will be the train crewrsquos responsibility to protect the
train in Manual mode during this affected zone
10 Why does Trip Optimizer automatically end the trip when I still have distance remaining before the preset crew change point
The subdivision has a GPS controlled end point that will automatically end the trip based off of recommendations from the railroad
Follow the steps on the backside of this document to walk you through performing a Trip Init
Trip Optimizer Top Ten List
GE Proprietary Information The information contained in this document is GE Proprietary Information and is disclosed in confidence It is the property of GE and shall not be used disclosed to others or repro-
duced without the express written consent of GE If consent is given for reproduction in whole or in part this notice and the notice set forth on each page of this document shall appear in any such reproduction in whole or in part The information contained in this document may also be controlled by the US export control laws Unauthorized export or re-export is
prohibited Document 5005807 Rev mdash
Before engaging the TO AUTO throttle the operator must meet certain train conditions and under-stand the data displayed on the Trip Optimizer Running Screen
Doc No 5005890 Rev -
71
Operations optimization ndash velocity
Movement Planner with Norfolk Southern
RailConnect 360 - Movement Planner
bull Systems problem hellip beyond human capabilities
bull Majority single track
bull Point solutions have plateaued
bull Integrated suite of day of operations software apps
bull Predixtrade platform - connectivity big data and security
bull Advanced algorithms and automatic routing
bull Proven in class 1 revenue service
Norfolk Southern and Movement Planner
Automated routing decisions
10+ increase in velocity
50+ reduction in expired crews Significant improvement in
schedule adherence
1MPH = ~$200MM estimated
annual savings in capital amp expenses
Based on 3 year study in NS GA division
Customer Dynamics
72
bull Co-development GE Transportation amp GE Intelligent Platforms
minus Enhanced sensor coverage
minus Improved data acquisition higher resolution
minus Advanced analytics
bull Asset specific insight drives fault reduction and enables CBM
(SmartSignal)
bull 20K+ overhauls in backlog
bull OH interval based on average expected condition
bull $1B+ capital expenditure in North America every year
Impact Reduced unplanned
downtime amp avoid road failures
Reduce unscheduled material consumption
Extended periodicity and associated expenses
ldquoPhysicsrdquo change
Real Time Engine Performance
Bearing Temp
Bearing Temp
Load
Ambient
To
da
y
To
mo
rro
w
Alarm trigger
Savings
CSA ndash shared productivity
Lifecycle Cost Dynamics ndash Engine Overhauls RailConnect 360 ndash Advanced Analytics
GErsquos 1 Jamie Miller - Senior Vice President Chief Information Officer
- In current role since 2013
- 9 years with GE
74
Digital opportunity
Simplifying structure
More valuable GE resources with fully integrated approach
+ Utilize data from products
+ Field services tools
+ CRM configurators
+ Brilliant Factory
Benefits
ERPmanufacturing 90
Data Centers 80
Applications 30
Shared Services 65
Cloud 70
Product Cost
RampD
SGampA
+ Engineering tools
+ Shared Services GL
+ Cyber Security
IT plays
-a)
(a - Target percent of new applications that are Cloud enabled
~$94B
Industrial cost
75
Three opportunities to power manufacturing
Digital Foundation 1
Unlocking Big Data
minus Sourcing
minus Productivity
2
Powering the Brilliant Factory
minus Design for manufacturing
minus Sensor enablement
minus Plantsupply chain optimization
3
minus 90 reduction in ERPs
Supply Chain Network
Virtual Mfg
Virtual Product Design
76
Product Cost ERP investments paying off
Inventory turns 6x 7x
Shipment on time 58 85
Foundation for business to deliver $1B+ savings over past 5 years
GE Healthcare
of revenue on target ERP ~75
~95
2009 Today
Today 219 ERPs 2016 34 ERPs
GE Water
2008 Today
22
1
of ERPs
SGampA of sales ~10 pts
Past dues 60
Finance headcount 50
77
Product Cost Using big data to run GE
Ingest Store Clean Consume
1 OampG data lake $8B direct materials buy
Real time More cheaper Faster GE-wide Analytics Data science
$60B total material buy across GE hellip $1B+ cash amp deflation opportunities
bull 23 source systems
bull Full visibility ndash 3 weeks
bull Commodity part supplier
bull Data lake technology
bull Machine learning for data cleansing
bull EM PampW underway (Alstom)
Oil amp Gas
Xxxxx Xxxxx Xxxxx xxxxx
78
Product Cost Technology powering the Brilliant Factory
20 NPI cycle hellip 20 efficiency
16 pilots launched hellip Fastworks 2020 Vision
FastWorks approach
Virtual design for manufacturing
30 NPI cycle time
Eliminated quality escapes
Wilmington NC
Aviation Machining
Factory optimization
25 productivity
PampE avoidance Greenville SC
PampW Nozzle Cell
machine downtime
25 opportunity
Sensor Enablement
Grove City PA
Transportation Remanufacturing
79
Smart Outage Full deployment at PGS
Changing the way we deliver Services
On track for $1B CSA productivity over 3 years and 10 customer uptime
+ +
Predictive Workscope Aviation 4 customers
full roll-out mid-2015
=
Field services optimization
Predictive workscope
Next generation modeling
Advanced technology
Accelerating productivity
80
We can do more ldquoSrdquo with less ldquoG+Ardquo
45 win rate
80 in quote time
5400+ SalesComm Ops hoursweek
QuickQuote
40K+ GE Commercial FTE
Highly manual long-cycle-time
More ldquoshots on goalrdquo lower cost
Investing in digital tools for commercial teams
Wrap up
82
Value for investors
Payback through most reliable revenue source Services
+ Increase revenue growth
+ Improve margins
+ CSA productivity
Funded software amp analytics through simplification amp reallocation
Potential upside beyond the GE installed base
Scale amp intellect Return on investment
1
2
3
GE Software COE
+ COE can accomplish scale hellip none of
our businesses could do this on their
own hellip attract talent amp spread ideas
+ Advantage to being an early mover hellip
right partnerships amp scale
+ Changing GE Industrial DNA hellip
greater impact from digital amp
analytical investments
83
Why GE
+ More valuable portfolio hellip 75 Industrial while growing EPS
+ Tangible evidence of winning NPI hellip Tier 4 LEAP etc
+ Strong amp diversified global footprint hellip best-in-class
+ Transforming service for next generation of growth
+ Culture of simplification impacting every part of GE
LEAP is a trademark of CFM International

4
GE Industrial enterprise advantages
GE businesses
Power amp Water
Aviation
Oil amp Gas
Healthcare
Transportation
Energy Management
All businesses benefit from GErsquos enterprise scale
Enterprise scale
TechnologyNPI (GRC)
Growth markets
(GGO)
Service amp Analytics (Services Council)
Lean structure (Simplification)
Performance
Organic growth gt peers
Margins at ~17 by rsquo16
Returns at ~17 by rsquo16
Consistent earnings growth
5
Leadership in technology ($ in billions)
RampD spend
2012 2013 2014E
$55 $52 =minus
5 of
revenue =minus 5
Key wins
Worldrsquos largest amp most efficient
H-class hellip 614 in combined cycle
13 units in backlog
First to market hellip 1000+ Tier 4
compliant locos on order for 2015+
Won 77 of all narrowbody
competitions since launch
Industryrsquos first 20000-psi hellip reliable
performance in ultra-deep water
Image quality amp capability from low dose
Best-in-class next gen products Advanced manufacturing solutions
to grow margins Leadership across core amp new
product markets
HA gas turbine
Tier 4 loco
LEAP
20k psi
Revolution CT
FastWorks driving speed amp efficiency
6
Scalable across other businesses
Innovation for cost amp speed
1 2 3 4 5 6
Changing the traditional learning curve
Yr
Traditional
Start
Lower
Accelerate
Faster Redefine
Entitlement
Product cost focus areas
Lean labs amp additive technology
Data in the factory
Services delivery cost
Sourcing relationshipsmake vs buy
Footprint and organizational focus
Driving cost with analytics
Full flight data ( of flights)
2 340 1500 Data Volume (Tera Bytes)
GErsquos analytics advantage hellip
15k
Segment by severity of operations
Segment by part
performance
Customized maintenance
cycle + =
Aviation product cost
2013 2014E 2015F
34M
~10M
7
Accelerating in growth markets
10 13 14E Post-Alstom
Driving growth
$29
++
++
Strategic imperatives
Be first mover in localization
Plant new flags Invest in local capability Leadership Manufacturing strength GRC amp innovation Customer support ldquoConnect the dotsrdquo of GE Healthcare amp Oil amp Gas lead Every facility ldquomulti-productrdquo Best partners brand amp risk
management Financing knowledge
1
2
3
$46
Growth market orders
36 44 + +
+ Premier scale amp reach + Best capability
17 AAGR
of
total
($ in billions)
8
Simplification
+
+
+
Lean management Do fewer things better hellip with less structure
Speed amp competitiveness
Get faster amp smarter amp more efficient in everything we do using FastWorks
Commercial intensity
Connect every job to winning in the market while empowering the commercial team amp holding them accountable
Digital capability
Modernize our information technology so we can achieve the speed amp efficiency our scale
should allow
World-class structural cost
More NPI faster with less investment
Global market success
Accelerate margin enhancement
Worldrsquos most competitive company
9
Lower cost
Industrial SGampA sales
175
rsquo12
~12
159 ~14
rsquo13 rsquo14E rsquo16F rsquo15F
~13
($ in billions)
rsquo11
185
Enablers
ERP
90 reduction
Shared services
65 penetration
Corporate
$500MM cost out
+ of PampLs
Layersspan
Product cost
rsquo12-rsquo14E investment
Gains ~$25
Restructuring ~$(43)
10
Technology is evolving
PHYSICAL ANALYTICAL
Multiple materials in complex systemshellip hundreds of patents in each product
Operating with high efficiency amp durability in extreme conditions
1 gas turbine compressor blade monitoring potential 500 gigabytes per day
Combination of physical amp analytical drives next evolution of services
Customers will value data because it improves their efficiency
GE is well positioned to lead this wave of change
Investors will benefit through services growth amp margins + product share + IT-driven efficiency
1
2
3
4
Key messages
+
11
Transforming services
bull Partners amp field
technicians 80rsquos
Big iron
Airlines 1 fuel $2-3B
Utility 1 fuel $4-5B
Oil amp Gas 1 uptime $5-7B
Healthcare 1 productivity $4-5B
Transportation 1 mile velocity $1-2B
Driving customer outcomes
bull Risk sharing
service contract 00rsquos
CSA
bull Asset amp
operations
optimization
Today
bull Science applied
to repairs amp
upgrades 90rsquos
Repair
Power of 1
Annual impact-a)
Small changes in hellip fuel maintenance uptime productivity flexibility safety
labor effectiveness hellip have a big
impact on profitability
(a - Global industry estimates based on ldquoIndustrial Internet Pushing the Boundaries of Minds amp Machinesrdquo ndash Nov 26 2012
Analytics
12
GE leadership
Large high-tech installed base
Customer trust amp connection hellip ~$180B services backlog
Deep domain knowledge
GE advantages What it takes to win
bull Sensors
bull Service robotics
bull Connectivity
Enabling technologies
bull Connected IB
bull Physicsmaterials bull Smart devices
bull Global reach
Installed base
+
+
bull Software capability bull Industrial big data
bull Operating platform
bull Security
Data amp analytics Attracting new talent hellip
ldquohorizontal capabilityrdquo
Connecting domain amp data hellip CSA
Operating platform in place (PredixTM)
Large research capability
Industry partnerships
Collecting 50MM data elements
GE has all essential elements
Have
Have
Investing
13
Improving the service model
Asset optimization
Operations optimization
CSA productivity
CSA + Connected asset + Software revenue value ($IB) outcome sales
Data-driven execution
Maximize performance with no unplanned downtime
Increased system efficiency across GE
amp non-GE assets
Optimize material amp repair cycles
across IB
Make versus buy hellip build internal team
Launch new offerings hellip PredictivityTM
Build on existing CSA relationships hellip ldquowin-winrdquo
Develop a broader ecosystem
1
2
3
4
Investments 2010-14
Focus of innovation
How we execute
14
Asset performance management
Impact for GE hellip $IB productivity for customers hellip velocity productivity
SENSORSANALYTICS
On-site oil analysis Predict remaining life Prevent road failures
SERVICE ROBOTICS
Productivity safety Remote monitoring Tough environment
AUTOMATED DECISIONING
Optimize yard ops Reduce dwell 10 Depart on time up 50
ADVANCED CONTROLS
Auto Train Operation 10 fuel savings
15
Impacting GErsquos 1
$94B of cost
$12B of working capital
$20B of PampE investments
GErsquos 1
Analytics amp
security
IT investment ($2B+year)
+
Reduce structure
Lower product cost
Improve margins
Enhance engineering productivity
Faster amp safer
Impact
Every Industrial company a Software amp Analytical company
16
Investor value
Increase services growth rate
+ More $installed base
+ $08B PredictivityTM solutions revenue growing to $4-5B
+ Penetrate aged GE fleet
+ Grow beyond the GE IB
Improve services margins
+ CSA productivity
+ Improve quality
Potential for industry value
+ Scale beyond GE installed base Backlog Revenue Margins
Services franchise
~$180B
~$45B
~30
Value creation
+
1
2
3
Software amp analytics accelerate services growth margins amp returns
Revenue growth ~5 Margin expansion ~50 bps Limited by IB growth
Historic performance
Services overview
18
Services growth
05 08 11 13
($ in billions)
Revenue
~26 ~30
OP
GE advantages
+ Installed base
+ Technology
+ CSA model
+ Footprint amp scale
+ Software COE
+ Fleet data
$27
$35
$42 $45
Services imperatives
Backlog
1
2
3
Deliver on customer value + Link services to outcomes + Global deployment
Grow $installed base + Drive analytics amp PredixTM value + Penetrate aged installed base
Expand margins + Leverage analytics to manage
performance + Invest in productivity tools
Improve service execution amp delivery + Enhance commercial capabilities + Increase field services capability
Spread ideas across GE
$87 $121 $147 $180
4
5
19
Services Council
Driving differentiated advantage
Cross-business initiatives
20+ services leaders
Teams aligned to 9 themes
Quarterly executive updates hellip operational rigor
Spreading ideas hellip
bull Core growth
bull Operations
bull Tools + process
bull CSA excellence
Data +
Outcomes
bull PredixTM + Cloud
bull PredictivityTM solutions
bull Strategic alliances + BD
Hardware amp domain expertise
Software analytics based
Healthcare Inspection technology
Aviation Repair technology
Power amp Water Global footprint
bull Multimodal ndash service amp repair shops
bull Customer training centers
bull Additive manufacturing
bull Robotic welding
bull Advanced coatings
bull Parts inspection amp measurement
bull Condition-based maintenance
Pune India
20
Enabling technologies Service Robotics Sensing amp Controls Advanced Manufacturing
Inspection Repair Mobile Tools
Launch amp learn hellip then accelerate to all GE businesses
Automated adaptive + Productivity + Less downtime
High tech integrated + Lower fuel usage + Higher efficiency
Productivity safety + Repetitive tasks + Tough environment
Additive new materials + Repair vs scrap + Longer service life
Deployable fast accurate + More digital data + Less downtime
Connected digital + Instant expert access + Lower service costs
21
Increase value of CSA
Benefits for Customers Benefits for GE
Monitoring amp diagnostics
$180B Services backlog
Fuel efficiency
Hardware amp software upgrades
Condition-based work scope
Mobile amp analytical tools
Material productivity
Optimized asset performance
Predictive analytics ndash lower downtime
More output
Lower costs
Lower emissions
Better payback on hardware upgrades
Instant software upgrade capability
Shorter duration outages
Less material usage
Ask an Expert ndash COE
Field Service productivity
Analytics driven parts life extension + performance
Repair vs scrap
22
Segment services dynamics (Services revenue $ in billions)
Power amp Water $125
Oil amp Gas $83
Energy Management
2013
$21
+ Sustained passenger growth
+ Improving airline profitability
+ Upgrades amp analytics
Aviation $108
+ Growth markets strong
+ Improving HCIT
minus Developed challenging
Healthcare $80
+ North America utilization
+ Analytics penetration
minus Mining parts
Transportation
$28
2013
2013
2013
2013
2013
2013
+ Continued AGP growth
+ Upgrades amp analytics
Europe
+ Strong Subsea
+ MampC improving
+ Analytics penetration
+ Marine offshore
minus Mining amp motor repairs
23
Presentation
Common capability Software COE
Analytics commercialization
Bill Ruh
Kate Johnson
Business execution
Strategy overview
Customer outcomes
Examples of analytics driving growth amp productivity
Competitive advantage
Power amp Water
Healthcare
Aviation
Oil amp Gas
Transportation
Paul McElhinney
Jan De Witte
Kevin McAllister
Brian Palmer
Pete McCabe
Common capability GErsquos 1 Jamie Miller
Software amp PredixTM
Bill Ruh - VP Global Software Center
- 3 years with GE
- 32 years of industry experience
Kate Johnson - VP GE Commercial Officer
- 1 year with GE
- 15 years of industry experience
25
The Industrial Internet
3 Hyper connectivity a living network of the worldrsquos machines data amp people
Internet
Increasing system intelligence through embedded software hellip advanced sensors
controls and software applications
Brilliant Machines
Democratization of data hellip high frequency real-time data
Big Data
Predictive algorithms hellip physics-based analytics hellip deep domain expertise on big industrial data
Analytics
People at work Connecting people at work or on
the move Supporting more
intelligent design higher service
quality operations amp safety
maintenance
1
2
3
4
5
26
61
45
31 28 31 40 42
29
29
45 63
56 56
47 45
41
10 6 6
16 9 10 9
24
Software outlook Customer survey Importance of
Big Data analytics relative to other priorities
Source Accenture 2015 Trend Report Gartner Big Data Survey
Aviation
3 3 3 3 6
Wind
Power Generation
Power Distribution
Oil amp Gas
Rail
Manufacturing
Healthcare
Highest priority Within the top 3 priorities Within the top 5 priorities Not a top priority
Opex is becoming a deciding
factor for IT investments as
80 of budget is allocated to
managing and running
complex technologies Source Gartner
Advanced analytics and
analytical applications
expected to see double digit
revenue growth Source Gartner
APM market category
expected to reach $300B
by 2020 Source Gartner
27
Industrial customersrsquo perspective Survey of GErsquos customers regarding applications
Real-Time Operator Intelligence
Remote Monitoring amp Diagnostics
Condition-Based Maintenance
Asset Lifecycle Management
Schedule Optimization
Energy Management
Process Control Automation
Field Force Automation 32
38
42
43
49
59
66
70 Tailor Pre-Built Applications
Have A Systems Integrator Build
Your Apps
Build My Own Custom Apps 15
54
85
HOW do you want to consume it WHAT functionality is most valuable
Asset performance management is the killer industrial app
28
What industrial customers want
SDM
SDM
SDM
SDM SDM
Software Defined Machines (SDMs)
ldquoLink up all my assets and devicesrdquo
REAL-TIME
OPERATIONAL
INTELLIGENCE
CONDITION-
BASED
MONITORING
ASSET LIFECYCLE
MANAGEMENT
MONITORING amp
DIAGNOSTICS
Industrial Apps
SDM Non-GE Assets enabled by PredixTM Machine SDM
SDM GE Assets enabled by PredixTM Machine SDM
PredixTM powers Asset Performance Management (APM)
29
Insights into value
Improving safety and
productivity across 15K miles
of interstate natural gas
pipelines
Potential Savings
77 gallons of fuel and 1628
lbs of CO2 per approach
10 increase in network
velocity 50 reduction in
expired crews amp significant
improvements in on-time
performance
Up to 4 increase in power
output across 283 wind
turbines hellip 40+ GWhr annual
increase
Asset Performance Management (APM)
REAL-TIME OPERATIONAL
INTELLIGENCE
CONDITION-BASED
MONITORING
ASSET LIFECYCLE MANAGEMENT
MONITORING amp
DIAGNOSTICS
Operations Optimization
INSIGHT PROCESS
INTEGRATION
AUTOMATION COLLABORATION
PredixTM Platform
PredixTM Machine PredixTM Net
GE
Non-GE
PredixTM Asset PredixTM Insight
PredixTM Fabric PredixTM Core
PredixTM Experience
Predixtrade hellip the GE advantage
Release in 2015
Public Cloud Private Cloud
Commercially available to connect more machines more data amp more people
TR
AN
SF
OR
MS
PO
WE
RS
PredictivityTM Solutions
30
Predictivitytrade hellip app factory
Asset optimization (28)
Operations optimization (14)
Productivity tools (77)
Approach Development process
Agile amp Extreme Programming
Design Center for delivering
compelling user interface
Cyber security Blue team to build
and Red team to test
90-120 day service engagement to production roll out
+
+
+
Co-innovation process to design
build transfer and iterate
Actionable insight on equipment based
on physics and analytic modeling
with industrial data
Outcome based process improvements
to plants pipelines fleets fields facilities
grids shops
Increase service throughput efficiency
and quality at optimized cost of
delivery
Delivering industry apps at speed and scale
31
World-class Software amp Analytics organization
Investing in Leadership Talent
Colin Parris (IBM)
SW Research
Co-located SW CTOs for business alignment
D Bartlett
(IBM)
Aviation
World-class technical resources
Computational amp analytics scientists
Platform developers
Software engineers
~10000
1000+ Biz
COE
Product Dev Software CTO
Brad Surak (SAP)
Harel Kodesh (Microsoft
Start Up Veteran)
Trans S Chotai
(HP)
OampG J Demesa
(Siemens)
PampW G Bell
(ServiceSource)
EM J Stone
(SAP)
HC E Eryurek
(GE)
+
+
- Cyber UX Data Science Agile development
Four deep core competencies ecosystem
1
Leading edge platform + world-
class ecosystem 2
Advanced research for building
the future 3
Advanced process to drive adoption amp enablement
4
Software Site
Organization
Technology amp Ecosystem
32
Wurldtech protecting critical infrastructure
World-class cyber security to operate assets + operations safely
About A GE Company acquired in May 2014 providing top cyber talent
Capability Assess protect amp certify critical infrastructure from cyber attack
Key Customers 4 of 6 top global OampG companies 9 of top 10 automation vendors
Security enhancements delivered through PredixTM and GE Products
Certify GE and non-GE products and customer environments
Identify vulnerabilities in OT products (GE and 3rd party)
Assess and prioritize risks for system operators
Achilles Industrial Next Gen Firewall to inspect and control
Industrial network traffic
Leverage industry leading threat intelligence
Protect operational
environments
Secure amp certify industrial products
Assess products amp operations for vulnerabilities
33
Partnerships amp Alliances
Intel ATampT AWS Cisco others
Venture Capital
Mergers amp Acquisitions
ThetaRay Mocana Frost
Strategic Moves
Wurldtech Austin Digital
Acquire capability to fill gaps
Pivotal Softbank Industrial Internet Consortium
Industrial internet ecosystem
Industry Ecosphere
Establish interoperable amp scalable solutions
Co-development amp go-to-market
Accelerate innovation amp success
Positioned to create value
Open PredixTM beyond GE
GE will sell
+ + Connected devices
Data Under Management
Performance Applications
PredixTM Machine Services
PredixTM Data Services
PredixTM Asset Services
Connect assets regardless of vendor or
vintage and provide value-added services
Aggregate and analyze data to produce
actionable business insights
Sell horizontal apps that maximize return
on assets and people
1
2
3
34
Competitive advantage
$1T Connected
Machines
managed by GE
replacement value
10M Sensors
collecting
50M Data
Elements
$20B Potential
Annual Customer Savings
50B Machines will be connected on the internet by 2020
2X Industrial data growth within next 10 years
Big Iron + Big Data = Big Outcomes
INDUSTRY GE
35
New ways to sell Services
2 Making Markets Different Economics
3 Co-creation amp Agile Development
4 Solution Architecture
5 Value Based Deal Shapes
6 New Industry Ecosystems
1 New Buyers and Influencers
GE Commercial Center of Excellence
Needs Target Architect Close
Qualification amp Pipeline Management
Sales Process
HireTrain Community of Experts
Enablement Toolkit
36
Accelerating time to value across channels
APM Subscription Services
Enterprise Analytics Projects
Upgrade value in CSAs
GE Sales Model
Existing Services sales team
New standalone software sales specialists
New outcome sellers + existing service sales team
Sales
acceleration
Expert SWAT
teams to
support deal
SW experts compelling
offer target one outcome
to land and expand
Ecosystem partners
SW COE app factory
Offering RMampD in CSA upside
and productivity Per well subscription
Enterprise SW deal
solution co-creation
ReliabilityMaxtrade FieldVantageTM Intelligent PipelineTM
GE OampG Example
Market
Opportunity $2B $600MM $27B
37
Measuring commercial success
Services revenue
Past Future
~5
+
rsquo13 rsquo17F
Assets under management $1T+ ++
PredictivityTM solutions revenue $08B ~$4-5B
Services backlog $180B ++
bull Adding more value to existing service relationships hellip training team to get more out of the installed base
bull Creating new revenue streams and building new commercial skills and incentive plans to accelerate growth
Outcome sellers solution architects product management amp marketing
bull Cultivate ecosystem to help accelerate commercially with access to CIOCTO relationships and system integration skills
Power amp Water Paul McElhinney - President amp CEO Power
Generation Services
- In current role since May 2014
- 26 years with GE
39
Power amp Water Services
Growing services amp delivering greater customer value
Key metrics Services imperatives ($ in billions)
13 14E
+
Backlog $53 +
Revenue $125
Installed base dynamics
1
2
3
4
Deliver on customer value + Develop flexible solutions
+ Reduce customer operating cost
Grow $installed base + Maximize impact of Alstom alliance + Invest in new service offerings
Expand margins + Tech upgrades amp software solutions + Outage excellence
Improve service execution amp delivery + Improved customer service levels
+ Optimize field service amp repair network
Unit growth up ~24X from 2008
Strong DP amp Wind growthhellip up ~1Kyear
~4000+ gas turbines in service
40
Global power industry is facing complex challengeshellip Offering innovative solutions to address customersrsquo needs
Fuel price uncertainty
Increasing regulation
Slow demand growth
Aging installed base
~15 years Average age of ~4K global GE gas turbines
Output
Efficiency
Reliability
Availability
Flexibility
Improving customersrsquo outcomes while decreasing costs
~$7B
Customer challenges
~$8B
~$2B
~$1B
~$2B
GE Predictivitytrade solutions amp industry benefit
~60+ Increase in US natural gas price since 2012
~(30) Thermal capacity in Europe since lsquorsquo08
Based on 10 year NPV
41
Investing in technology
Addressing multiple customer value levers
Advanced Gas Path (AGP) Industry leading output hellip up to +64 Industry leading efficiency hellip up to +18 Extends asset amp parts life hellip 96K hours
1
Op Flex Delivers flexibility to costs amp revenue Reduces start up time amp fuel consumption Expands fuel source opportunity
3
Dry Low NOx 26+ (DLN) Reduces NOx emissions by 40 Delivers industry leading flexibility Increases maintenance intervals to ~1250 starts
2
42
Power FlexEfficiencytrade Advanced Gas Path
Expanding the operating envelope
Ambient Temperature
Ou
tpu
t (M
W)
Op Flex
7FA03 baseline
AGP
+ ndash
+
Combining hardware and software hellip creating 2X the value
$17
$30
Op Flex
Average Customer Annual Value Per Unit ($MM)
Improving customer outcomes
AGP (Hardware)
AGP PredictivityTM
Solution
125+ AGPs with software sold to date
650000+ operating hours to date
43
Wind PowerUp hellip generating more output
Customer Outcome Up to 4
increase in power output across 283
wind turbines hellip 40+ GWhr annual increase ldquoThe PowerUp system offers a great chance for owners like us who are investing literally billions of dollars in this market to try and get more production out of existing assets GE took a lot of risk out of this for usrdquo
ndash Patrick Woodson CEO EON Climate amp Renewables
Opportunity for up to
20 more profit from up to
5 more output
A performance based
cooperative approach
with a holistic view of the
assets system and network
Flexible payment options
aligned to customer needs
+1400 turbines under contract since launch
Customer opportunity
Software enabled
Flexible platform
Proven results
Scale out
1
2
3
Healthcare Jan De Witte - President amp CEO Healthcare IT
- In current role since 2011
- 15 years with GE
45
Healthcare Services
Delivering value = higher quality outcomes at lower cost
Key metrics Services imperatives ($ in billions)
Backlog $11 +
Installed base dynamics
1
2
3
4
Deliver on customer value + Asset and workflow optimization + Analytics around EMRs amp Devices
Grow $installed base
+ Quality and analytics offerings + Solutions architecture amp delivery
Expand margins + Remote service amp SaaS models + Field services productivity Improve service execution amp delivery + Remote monitoring technologies + Field force deployment optimization
Emerging markets infrastructure build
Mature markets quality upgrades
ACA amp Enterprise Solutions IT penetration
13 14E
=+ Revenue $80
46
Healthcare industry shifting to value-based care GE software analytics and services are uniquely positioned to help
Customer challenges
Integrated Care Solutions hellip turning data into actionable insight Improving healthcare outcomes
Diagnostic quality
Patient-centric care
System profitability
Chronic Disease Management
Sources Institute of Medicine 2013 Porter Research 2013 McKinsey IHS Global Insight
29 Healthcare spend wasted each year
$260B Annual value creation through healthcare IT
59 US lives covered in value-based care model by 2015
Clinical Quality
Financial Performance
Operational Efficiency
Configurable Workflows
47
GEHC Software portfolio positioned along main outcome drivers for care systems
Diagnostic speed amp confidence
Productive care pathways
Wellness amp chronic disease management
Risk amp margin management
Costworkforce optimization
Population Health Management
Workflow
Archiving
Visualization
Financial Management
Care Delivery Management
Enterprise Imaging
Operations Management
Revenue Cycle
Risk assessment
Margin analytics
Workforce optimization
Asset Management
Integrated Care Solutions
Ambulatory Care
High Acuity Care
Cardiology
Analytics
Care coordin
Engagement
Providing caregivers the right actionable insight ndash when amp where they need it
Large GE device footprint generating
clinical data
HCIT domain in clinical workflow amp analytics
SW CoEPredixTM capabilities + +
48
Enterprise Imaging Improving diagnostic workflow in the cloud
Customer Challenges Cloud Case Exchange CentricityTM 360
Sample Customers Solution Architecture
Clinical Collaboration amp Advanced Analytics
Imaging Cost Control
Archive
Workflow
19 Time spent
gathering data
Workflow
velocity
Diagnostic
confidence
Cases diagnosed
incorrectly 35
~$2B segment by rsquo18 growing 25+
30 turn-around time
3 duplicate exams
Customer value $10MM+ cost pa
Image-as-a-Service lifecycle value $20MM+
Care quality
Cost
Source Research from the Journal of the American College of Radiology and the Journal of American Medicine
49
Customer Challenges Workforce management
Sample Customers
Operations Management Optimizing workforce productivity with API Healthcare
54 Hospital
operating cost
spent on labor
Solution Architecture
Real-Time Analytics Labor amp Patient Workflows
Time amp Attendance
Staffing amp Scheduling
HR amp Payroll
~$2B segment by rsquo18 growing 12+
20 Workforce productivity
Customer value $4MM cost pa
Workforce-mgmt services lifecycle $4MM+
80 Overtime wages
Matching care-giver capacity
amp patient need
Care quality
Labor
productivity
Source Beckerrsquos Hospital Review
50
Population Health Management Lowering the cost of chronic disease
Customer Challenges
Solution Architecture
Caradigm Analytics amp Care Mgt
Proactive
intervention
Care protocol
compliance
75 Cents of every
healthcare dollar
spent on chronic
disease
Care Mgt Analytics Risk Cohort
25
Customer value $5MM+ cost pa
Caradigm lifecycle value $18MM+
Patients per care manager
~$30B segment by 2025 growing 19+
Sample Customers
40 Hospitalization for chronic patients
Chronic disease
treatment cost
Source National Diabetes Fact Sheet
51
Software enabling productivity in service process
Wo
rkfo
rce
Pla
nn
ing
amp
Dis
pa
tch
Historically up to 40 FE travel time hellip utilize analytics to optimize allocation
Smart dispatch with effective job-skill matching
Optimize field force capacity and response time to customers
Call Generation (Planned amp Unplanned)
Deploy
RepairFix
Diagnose
CloseDebriefBill
Pe
rfo
rma
nce
M
on
ito
rin
g 110k GEHC devices connected remotely
MR hellip 900 data points monitored per machine 30k alertsyear proactively fixed
Improves GE productivity while minimizing customer down-time
Healthcare Services margins improving
Aviation Kevin McAllister - President amp CEO Aviation Services
- In current role since May 2014
- 25 years with GE
53
Aviation Services
13 14E
+ $108
Backlog $97 +
Revenue
Key metrics Services imperatives
Commercial IB hellip 34000 engines
Young hellip 46 havenrsquot had 1st shop visit
Fuel cost driving investment hellip GE well
positioned hellip 787 737MAX A320NEO 777X
Installed base dynamics
1
2
3
4
Deliver on customer value
+ Lowest cost of ownership
+ PredictivityTM outcomes
Grow $installed base
+ Winwin providing technology upgrades and analytics
Expand margins
+ Time-on-wing for GE and customers
+ Cost productivity hellip for GE
Best service execution and delivery
+ Position to support service entry for next-gen products
($ in billions)
54
Solid growth fundamentals
Shop visits Environment Departures
Source IATA amp GE analysis
Passengers IATA RPK YoY
Utilization Avg cycles day YoY
Departures GE and JV-powered flights (MM)
0
5
10
15
20
25
30
35
40
lsquo10 lsquo15F lsquo95 lsquo00 lsquo05
4100
5500
4400
2100
2000
3000
2300 2000
2300
200
100
-1 09 02
2012 2013 2014E
53 52 58
20 21 22
2 of 3 daily flights
powered by GE or GE JVs
46 have not
had 1st shop visit
4 CAGR Number of departures (MM)
lsquo13 rsquo15F rsquo20F
CFM is a 5050 JV between GE and Snecma EA is a 5050 JV between GE and Pratt amp Whitney
55
Solving our customers toughest challenges
Airline direct operating costs
Fuel
40
Delays and cancellations
8
Maintenance
9
Services analytics offerings
Flight Efficiency Services
Performance-based Navigation
Analytics-enabled workscoping
Product and Services strategy
Provide lowest cost-of-ownership through OEM technology
Lead in on-wing reliability
Lead in technology
Best-in-class fuel burn and retention
Engine diagnostic and prognostics
Intelligent Operations
$200Byr
$40Byr
Taleris is a 5050 JV between GE and Accenture
+
56
Services technologies hellip improving value through the lifecycle
Installed base (lsquo13) Upgrades
Fuel Burn improvement
Time- on-wing
8 8 2x
8 3 3x
5 2 2x
A culture of technology insertion Tailored to customer wants
CFM is a 5050 JV between GE and Snecma
Risk transfer $hour coverage
Overhaul Time and material
Materials New used and repaired parts
Asset optimization TRUEngineTM program diagnostics
+
CF6-80C (lsquo86 EIS)
GE90 (lsquo95 EIS)
CFM56 (lsquo84 EIS)
3000
1500
18500
57
Minds amp Machines at GE Aviation
+ Ex
po
sure
Operator A Operator B Part Temperature Cruise Takeoff
Te
mp
era
ture
Threshold
Climb
1000+ software engineers GE Software COE
6300 applied engineers GE Aviation
Data Secure continuous accessible
Physics Apply engine expertise
+ =
Customer and GE benefits
+
Statistics Unlock trends segment
ldquoPhysicsrdquo ldquoAnalyticsrdquo
Time-on-wing
Reliability and availability
Fuel cost
Repair and overhaul
58
Lead in on-wing reliability
Applied analytics to detect engines at risk of removal
Cu
mu
lati
ve
dis
tre
ss
Cycles
Recent successes hellip
CFM is a 5050 JV between GE and Snecma
Segment
GE90
120 CFM56
40 Water wash
$7Myr fuel savings at one GE90 operator
removals saved
removals saved
Nominal environment
Abate
Harsh environment
59
$30MMyr savings
Flight Efficiency Services App
Performance-based Navigation App
Attacking fuel spend with analytics
Joint marketing hellip
ldquoPerfect flightrdquo video
In the news
Newsletter
Oil amp Gas Brian Palmer - Vice President Measurement amp Control Solutions
- In current role since 2010
- 29 years with GE
61
Oil amp Gas Services
Software amp Services as a key differentiator
Key metrics Strategic imperatives ($ in billions)
13 14E
++
Backlog $58 ++
$83 Revenue
1
2
3
4
Deliver on customer value + Customer co-creation
+ Outcome based solutions
Grow $installed base + Drive analytics amp PredixTM
+ Penetrate the installed base
Expand margins + More software and contract offerings
+ Continue to grow backlog double digits
+ Partnerships to accelerate journeyhellip
Meridium
Improve service execution amp delivery + Full lifecycle productivity
+ Simplifying structure
IB growing TMS and Subsea with 13K+ units Software investments creating new IB revenue
streams in addition to traditional parts and service New contractual (CSA) offerings developedlaunched
Installed base dynamics
62
Oil amp gas industry is faced with expanding challenges GE software data and analytics are uniquely positioned to help
Customer challenges Equipment Availability
Equipment Reliability
Operational Efficiency
Production Optimization
Industrial Internet hellip turning data into actionable information Enable no unplanned downtime
Increasing complex operations
Tighter regulations
Skills gap
Machines with data potential
Sources GE OampG analysis based on Wood Mackenzie Rystad Barclays IHS CERA PFC Energy IEA httpwwwgecomstoriesoil-and-gas-innovation Oil and Gas Facilities 2013 httpwwwspeorgogfprintarchives201306
$800B+ Annual industry CAPEX (6-8 growth per year)
$150MM Average annual cost for mid-size LNG facility due to unplanned downtime
5-10 Range of OampG industryrsquos estimated downtime
63
Predixtrade hellip Unified Operations Improved throughput connecting people machines and data
Customer outcomes
Unified Operations ndash A customer co-creation success story
Enhanced safety
Increased availability
Operational visibility
Efficient workforce enablement
Partnering with to tackle these industry challenges and create a solution that increases production and lowers cost driving improved customer outcomes
Unified Customer
Portal
129000 Pieces of equipment in operation globally in
the industry
50 Industry retirement rate in next 10 years
7X Industry fatality rate
above norm
people
machines
data
64
FieldVantagetrade hellip Asset Performance Management (APM) for Onshore
APM ndash Bringing GE expertise from all industries to deliver system level value
Customer outcomes
Enhanced safety
Operational visibility
Improved availability
Optimized performance
Monitoring amp
Diagnostics
Condition Based
Maintenance
Real time Operations
Intelligence
Asset LifeCycle
Management
bull Providing field level visibility and optimization across multiple forms of artificial lift technologies bull Integrated insights provided through common single scalable platform bull 2 year service contract on 200+ wells
Solution Overview
39 NAM OampG Upstream Vehicle Fatalities
hellipby improving
116K New wells in 2014
5 Days Back to production (NAM Avg)
1MM+ Artificially Lifted Wells (Global)
65
Intelligent Pipeline hellip Operations optimization software for pipelines
2TB of data for every
30K miles of pipeline
3-4 annual growth
2MMmiles of
pipelines globally
$40B invested by pipeline companies per year
Source 2TB - Average data volume based on GE internal analysis of multiple pipeline customers Rest - GE OampG analysis based on Douglas Westwood IHS CERA FERC CIA World Factbook PII Pipeline Database (Summary of Infield Systems Global Data DOT databases)
bull 5 year service contract
bull Setting the industry standards for
pipelines real-time intelligence
First customer Customer outcomes
Enhanced safety Proactive versus reactive decisions
Visibility Complete geospatial view and situational awareness
Optimized Ops Effective data driven resource allocation
Efficient OampM Prioritize spending for assets and resources
Moving to proactive solutions with our customers
66
Customer Benefits
Zero unplanned downtime
Increased availability
Increased reliability
Decreased production losses
$14B Additional opportunity driven by
availability and reliability increase (1 of capacity)
Industry Opportunities
Outcome base service bonus
GE Productivity Improvements
Inventory through parts flow optimization
Outage durationfrequency driven by condition- based maintenance
Services Optimization hellip Creating optimal value for GE equipment customers
Journey to 100 reliability through our Contractual Services Agreements (CSA)
Transportation Pete McCabe - Vice President Global Services amp Solutions
- In current role since 2013
- 20 years with GE
68
Transportation Services ($ in billions)
13 14E
+
Revenue $28
Backlog $12B+ +
1
2
3
4
Deliver on customer value
+ Outcomes - velocity fuel reliability
+ System solutions ndash RailConnectTM 360
Grow $installed base
+ Increase penetration ndash Parts amp Smarts
+ Extend asset life ndash modernizations
+ Broaden software solutions ndash rOS
Expand margins
+ Deploy advanced analytics ndash PredixTM
Improve service execution amp delivery
+ Enhance commercial capabilities
+ Expand domain amp IT project expertise
Installed base dynamics
1000+ Tier 4-compliant loco orders
~650 locomotives un-parking in rsquo14
450 new locomotives in South Africa
Key metrics Services imperatives
69
Railroad industry is faced with expanding challenges and customers require a solution provider
Customer challenges
RailConnecttrade360 delivering customer focused outcomes
Asset utilization
Capacity limited
Resource constraints
Ops Complexity
$80B+ N American operating revenue (~4 growth)
7 year high Traffic volumes require unparalleled investment
$56B Annual industrial benefit through 1 improvement
Sources American Association of Railroads (AAR) 2013 industry statistics
70
Asset optimization ndash fuel efficiency
Customer Dynamics RailConnect 360 ndash Trip Optimizer
bull Real-time embedded optimization algorithms
bull Advanced data acquisition enabling train health monitoring
bull Automated train handling reduces wheel amp rail wear
bull $1M diesel locoyear 22K GE locos
bull Emissions
bull Huge operating variation operators trains topography
Trip Optimizer with CSX
Implementation on 1500 CSX locomotives
Reduced fuel use by 7 on average Decreased 3rd largest operating expense
- CSX Sustainability Report 2013
Tr ip Opt imizer Quick Star t Guide (1) Train Speed is available on the speedometer during an active trip during auto and Manual Control
(2) Trip Plan Speed displays a green Trip plan speed pointer on the speed indicator dial in Auto and Manual
modes of operation
(3) Trip Optimizer Status Box is visible when Trip Optimizer system is ACTIVE and provides three types of messages Status Request for Operator InputAction and Error
(4) TrackCivil Speed Limit plot line is Cyan shown the entire horizontal range data permitting
(5) Train Speed (Actual) plot line is White shown only from the head of the train on back
(6) Train Head is shown as a thick White line to allow the operator to see the position of the Train relative to the
terrain The horizontal scale of the rolling chart is zero-referenced to the Head of the Train (corresponds to the forward-facing end of the lead locomotive)
(7) Train Milepost has an associated location and name Its representation on the screen consists of a graphical
pointer and an identifier
(8) OMB Message Box displays operator messages
(9) Consist Notches displays Lead and Trailing locomotive notches
(10) Throttle Handle Notch represents the Master Control-ler handle position During TO Auto Control it will indicate
N8 as TO automatic control requires notch eight (N8) set-ting
(11) Auto Control Notch displays on screen as a White box to denote TO Auto Control engagement and throttle out-
put control
(12) Trip Plan Speed has a Green plot line shown as the entire horizontal range when available and data permit-
ting
(13) Manual Control Zones is shown as a Gray rectangle on the terrain plot extending across the entire vertical range of this section of the chart
(14) Planned Braking depicts Blue areas where Trip Opti-mizer expects that dynamic andor air braking will be
required to maintain the plan speed
(15) Key Locations are softkey states that constitute a unique mapping of functionality to key locations
1 How do I get started To start a trip you will push the Trip Optimizer key on the Main operator screen
2 Do I have to be stopped to request a trip through Trip Optimizer It is preferred to perform a trip init at zero speed however unless otherwise provided by
local ruleinstruction maximum speed for initialization is 15 mph
3 I have performed the Trip Init process and see the rolling map When will I get prompted for Auto Control
Auto Control will become available when the speed is greater than 12 mph and the Throttle handle is N1 or higher
4 Why does the Locomotive Status matter to Trip Optimizer Trip Optimizer will always monitor in train forces speed braking and fuel efficiency To best optimize all of these Train dynamics Trip Optimizer must be told by the operator what the
status of each locomotive in the train The three modes are defined as follows
Running The locomotive is fully operational and is used for calculating TPOB
Isolated The locomotive is either shut-down or is mechanically isolated from produc-
ing Tractive Effort
DB Cutout The locomotive has no Dynamic Braking available but is being used for
producing Tractive Effort
5 What is the recommended way to disengage Auto Control The most fuel efficient way is to decrease the throttle notches in 2 second intervals until
you get to the required speed
6 Trip Optimizer is disengaging from Auto mode and tells the opera-tor Manual Control is required I am already in Notch 8 throttle
What do I do
Press the Current Throttle key on the screen Moving the Master Controller from Notch 8 to
Notch 7 and back could result in un-safe train handling practices
7 Why does Trip Optimizer not always travel at Track speed Trip Optimizer will use the forces of the train and momentum to achieve the optimal speed to save fuel In some cases Idle will be used to meet a planned slow order Trip Optimizer is
always looking out a few miles ahead to plan for the ideal speed while maintaining safe train handling
8 How do I report an inaccuracy on the civil speed limits posted on the rolling map
Contract your Road Manager to report the case
9 The dispatcher has issued an enroute slow order Will Trip Opti-
mizer automatically take this into account
No If an enroute slow order is issued it will be the train crewrsquos responsibility to protect the
train in Manual mode during this affected zone
10 Why does Trip Optimizer automatically end the trip when I still have distance remaining before the preset crew change point
The subdivision has a GPS controlled end point that will automatically end the trip based off of recommendations from the railroad
Follow the steps on the backside of this document to walk you through performing a Trip Init
Trip Optimizer Top Ten List
GE Proprietary Information The information contained in this document is GE Proprietary Information and is disclosed in confidence It is the property of GE and shall not be used disclosed to others or repro-
duced without the express written consent of GE If consent is given for reproduction in whole or in part this notice and the notice set forth on each page of this document shall appear in any such reproduction in whole or in part The information contained in this document may also be controlled by the US export control laws Unauthorized export or re-export is
prohibited Document 5005807 Rev mdash
Before engaging the TO AUTO throttle the operator must meet certain train conditions and under-stand the data displayed on the Trip Optimizer Running Screen
Doc No 5005890 Rev -
71
Operations optimization ndash velocity
Movement Planner with Norfolk Southern
RailConnect 360 - Movement Planner
bull Systems problem hellip beyond human capabilities
bull Majority single track
bull Point solutions have plateaued
bull Integrated suite of day of operations software apps
bull Predixtrade platform - connectivity big data and security
bull Advanced algorithms and automatic routing
bull Proven in class 1 revenue service
Norfolk Southern and Movement Planner
Automated routing decisions
10+ increase in velocity
50+ reduction in expired crews Significant improvement in
schedule adherence
1MPH = ~$200MM estimated
annual savings in capital amp expenses
Based on 3 year study in NS GA division
Customer Dynamics
72
bull Co-development GE Transportation amp GE Intelligent Platforms
minus Enhanced sensor coverage
minus Improved data acquisition higher resolution
minus Advanced analytics
bull Asset specific insight drives fault reduction and enables CBM
(SmartSignal)
bull 20K+ overhauls in backlog
bull OH interval based on average expected condition
bull $1B+ capital expenditure in North America every year
Impact Reduced unplanned
downtime amp avoid road failures
Reduce unscheduled material consumption
Extended periodicity and associated expenses
ldquoPhysicsrdquo change
Real Time Engine Performance
Bearing Temp
Bearing Temp
Load
Ambient
To
da
y
To
mo
rro
w
Alarm trigger
Savings
CSA ndash shared productivity
Lifecycle Cost Dynamics ndash Engine Overhauls RailConnect 360 ndash Advanced Analytics
GErsquos 1 Jamie Miller - Senior Vice President Chief Information Officer
- In current role since 2013
- 9 years with GE
74
Digital opportunity
Simplifying structure
More valuable GE resources with fully integrated approach
+ Utilize data from products
+ Field services tools
+ CRM configurators
+ Brilliant Factory
Benefits
ERPmanufacturing 90
Data Centers 80
Applications 30
Shared Services 65
Cloud 70
Product Cost
RampD
SGampA
+ Engineering tools
+ Shared Services GL
+ Cyber Security
IT plays
-a)
(a - Target percent of new applications that are Cloud enabled
~$94B
Industrial cost
75
Three opportunities to power manufacturing
Digital Foundation 1
Unlocking Big Data
minus Sourcing
minus Productivity
2
Powering the Brilliant Factory
minus Design for manufacturing
minus Sensor enablement
minus Plantsupply chain optimization
3
minus 90 reduction in ERPs
Supply Chain Network
Virtual Mfg
Virtual Product Design
76
Product Cost ERP investments paying off
Inventory turns 6x 7x
Shipment on time 58 85
Foundation for business to deliver $1B+ savings over past 5 years
GE Healthcare
of revenue on target ERP ~75
~95
2009 Today
Today 219 ERPs 2016 34 ERPs
GE Water
2008 Today
22
1
of ERPs
SGampA of sales ~10 pts
Past dues 60
Finance headcount 50
77
Product Cost Using big data to run GE
Ingest Store Clean Consume
1 OampG data lake $8B direct materials buy
Real time More cheaper Faster GE-wide Analytics Data science
$60B total material buy across GE hellip $1B+ cash amp deflation opportunities
bull 23 source systems
bull Full visibility ndash 3 weeks
bull Commodity part supplier
bull Data lake technology
bull Machine learning for data cleansing
bull EM PampW underway (Alstom)
Oil amp Gas
Xxxxx Xxxxx Xxxxx xxxxx
78
Product Cost Technology powering the Brilliant Factory
20 NPI cycle hellip 20 efficiency
16 pilots launched hellip Fastworks 2020 Vision
FastWorks approach
Virtual design for manufacturing
30 NPI cycle time
Eliminated quality escapes
Wilmington NC
Aviation Machining
Factory optimization
25 productivity
PampE avoidance Greenville SC
PampW Nozzle Cell
machine downtime
25 opportunity
Sensor Enablement
Grove City PA
Transportation Remanufacturing
79
Smart Outage Full deployment at PGS
Changing the way we deliver Services
On track for $1B CSA productivity over 3 years and 10 customer uptime
+ +
Predictive Workscope Aviation 4 customers
full roll-out mid-2015
=
Field services optimization
Predictive workscope
Next generation modeling
Advanced technology
Accelerating productivity
80
We can do more ldquoSrdquo with less ldquoG+Ardquo
45 win rate
80 in quote time
5400+ SalesComm Ops hoursweek
QuickQuote
40K+ GE Commercial FTE
Highly manual long-cycle-time
More ldquoshots on goalrdquo lower cost
Investing in digital tools for commercial teams
Wrap up
82
Value for investors
Payback through most reliable revenue source Services
+ Increase revenue growth
+ Improve margins
+ CSA productivity
Funded software amp analytics through simplification amp reallocation
Potential upside beyond the GE installed base
Scale amp intellect Return on investment
1
2
3
GE Software COE
+ COE can accomplish scale hellip none of
our businesses could do this on their
own hellip attract talent amp spread ideas
+ Advantage to being an early mover hellip
right partnerships amp scale
+ Changing GE Industrial DNA hellip
greater impact from digital amp
analytical investments
83
Why GE
+ More valuable portfolio hellip 75 Industrial while growing EPS
+ Tangible evidence of winning NPI hellip Tier 4 LEAP etc
+ Strong amp diversified global footprint hellip best-in-class
+ Transforming service for next generation of growth
+ Culture of simplification impacting every part of GE
LEAP is a trademark of CFM International

5
Leadership in technology ($ in billions)
RampD spend
2012 2013 2014E
$55 $52 =minus
5 of
revenue =minus 5
Key wins
Worldrsquos largest amp most efficient
H-class hellip 614 in combined cycle
13 units in backlog
First to market hellip 1000+ Tier 4
compliant locos on order for 2015+
Won 77 of all narrowbody
competitions since launch
Industryrsquos first 20000-psi hellip reliable
performance in ultra-deep water
Image quality amp capability from low dose
Best-in-class next gen products Advanced manufacturing solutions
to grow margins Leadership across core amp new
product markets
HA gas turbine
Tier 4 loco
LEAP
20k psi
Revolution CT
FastWorks driving speed amp efficiency
6
Scalable across other businesses
Innovation for cost amp speed
1 2 3 4 5 6
Changing the traditional learning curve
Yr
Traditional
Start
Lower
Accelerate
Faster Redefine
Entitlement
Product cost focus areas
Lean labs amp additive technology
Data in the factory
Services delivery cost
Sourcing relationshipsmake vs buy
Footprint and organizational focus
Driving cost with analytics
Full flight data ( of flights)
2 340 1500 Data Volume (Tera Bytes)
GErsquos analytics advantage hellip
15k
Segment by severity of operations
Segment by part
performance
Customized maintenance
cycle + =
Aviation product cost
2013 2014E 2015F
34M
~10M
7
Accelerating in growth markets
10 13 14E Post-Alstom
Driving growth
$29
++
++
Strategic imperatives
Be first mover in localization
Plant new flags Invest in local capability Leadership Manufacturing strength GRC amp innovation Customer support ldquoConnect the dotsrdquo of GE Healthcare amp Oil amp Gas lead Every facility ldquomulti-productrdquo Best partners brand amp risk
management Financing knowledge
1
2
3
$46
Growth market orders
36 44 + +
+ Premier scale amp reach + Best capability
17 AAGR
of
total
($ in billions)
8
Simplification
+
+
+
Lean management Do fewer things better hellip with less structure
Speed amp competitiveness
Get faster amp smarter amp more efficient in everything we do using FastWorks
Commercial intensity
Connect every job to winning in the market while empowering the commercial team amp holding them accountable
Digital capability
Modernize our information technology so we can achieve the speed amp efficiency our scale
should allow
World-class structural cost
More NPI faster with less investment
Global market success
Accelerate margin enhancement
Worldrsquos most competitive company
9
Lower cost
Industrial SGampA sales
175
rsquo12
~12
159 ~14
rsquo13 rsquo14E rsquo16F rsquo15F
~13
($ in billions)
rsquo11
185
Enablers
ERP
90 reduction
Shared services
65 penetration
Corporate
$500MM cost out
+ of PampLs
Layersspan
Product cost
rsquo12-rsquo14E investment
Gains ~$25
Restructuring ~$(43)
10
Technology is evolving
PHYSICAL ANALYTICAL
Multiple materials in complex systemshellip hundreds of patents in each product
Operating with high efficiency amp durability in extreme conditions
1 gas turbine compressor blade monitoring potential 500 gigabytes per day
Combination of physical amp analytical drives next evolution of services
Customers will value data because it improves their efficiency
GE is well positioned to lead this wave of change
Investors will benefit through services growth amp margins + product share + IT-driven efficiency
1
2
3
4
Key messages
+
11
Transforming services
bull Partners amp field
technicians 80rsquos
Big iron
Airlines 1 fuel $2-3B
Utility 1 fuel $4-5B
Oil amp Gas 1 uptime $5-7B
Healthcare 1 productivity $4-5B
Transportation 1 mile velocity $1-2B
Driving customer outcomes
bull Risk sharing
service contract 00rsquos
CSA
bull Asset amp
operations
optimization
Today
bull Science applied
to repairs amp
upgrades 90rsquos
Repair
Power of 1
Annual impact-a)
Small changes in hellip fuel maintenance uptime productivity flexibility safety
labor effectiveness hellip have a big
impact on profitability
(a - Global industry estimates based on ldquoIndustrial Internet Pushing the Boundaries of Minds amp Machinesrdquo ndash Nov 26 2012
Analytics
12
GE leadership
Large high-tech installed base
Customer trust amp connection hellip ~$180B services backlog
Deep domain knowledge
GE advantages What it takes to win
bull Sensors
bull Service robotics
bull Connectivity
Enabling technologies
bull Connected IB
bull Physicsmaterials bull Smart devices
bull Global reach
Installed base
+
+
bull Software capability bull Industrial big data
bull Operating platform
bull Security
Data amp analytics Attracting new talent hellip
ldquohorizontal capabilityrdquo
Connecting domain amp data hellip CSA
Operating platform in place (PredixTM)
Large research capability
Industry partnerships
Collecting 50MM data elements
GE has all essential elements
Have
Have
Investing
13
Improving the service model
Asset optimization
Operations optimization
CSA productivity
CSA + Connected asset + Software revenue value ($IB) outcome sales
Data-driven execution
Maximize performance with no unplanned downtime
Increased system efficiency across GE
amp non-GE assets
Optimize material amp repair cycles
across IB
Make versus buy hellip build internal team
Launch new offerings hellip PredictivityTM
Build on existing CSA relationships hellip ldquowin-winrdquo
Develop a broader ecosystem
1
2
3
4
Investments 2010-14
Focus of innovation
How we execute
14
Asset performance management
Impact for GE hellip $IB productivity for customers hellip velocity productivity
SENSORSANALYTICS
On-site oil analysis Predict remaining life Prevent road failures
SERVICE ROBOTICS
Productivity safety Remote monitoring Tough environment
AUTOMATED DECISIONING
Optimize yard ops Reduce dwell 10 Depart on time up 50
ADVANCED CONTROLS
Auto Train Operation 10 fuel savings
15
Impacting GErsquos 1
$94B of cost
$12B of working capital
$20B of PampE investments
GErsquos 1
Analytics amp
security
IT investment ($2B+year)
+
Reduce structure
Lower product cost
Improve margins
Enhance engineering productivity
Faster amp safer
Impact
Every Industrial company a Software amp Analytical company
16
Investor value
Increase services growth rate
+ More $installed base
+ $08B PredictivityTM solutions revenue growing to $4-5B
+ Penetrate aged GE fleet
+ Grow beyond the GE IB
Improve services margins
+ CSA productivity
+ Improve quality
Potential for industry value
+ Scale beyond GE installed base Backlog Revenue Margins
Services franchise
~$180B
~$45B
~30
Value creation
+
1
2
3
Software amp analytics accelerate services growth margins amp returns
Revenue growth ~5 Margin expansion ~50 bps Limited by IB growth
Historic performance
Services overview
18
Services growth
05 08 11 13
($ in billions)
Revenue
~26 ~30
OP
GE advantages
+ Installed base
+ Technology
+ CSA model
+ Footprint amp scale
+ Software COE
+ Fleet data
$27
$35
$42 $45
Services imperatives
Backlog
1
2
3
Deliver on customer value + Link services to outcomes + Global deployment
Grow $installed base + Drive analytics amp PredixTM value + Penetrate aged installed base
Expand margins + Leverage analytics to manage
performance + Invest in productivity tools
Improve service execution amp delivery + Enhance commercial capabilities + Increase field services capability
Spread ideas across GE
$87 $121 $147 $180
4
5
19
Services Council
Driving differentiated advantage
Cross-business initiatives
20+ services leaders
Teams aligned to 9 themes
Quarterly executive updates hellip operational rigor
Spreading ideas hellip
bull Core growth
bull Operations
bull Tools + process
bull CSA excellence
Data +
Outcomes
bull PredixTM + Cloud
bull PredictivityTM solutions
bull Strategic alliances + BD
Hardware amp domain expertise
Software analytics based
Healthcare Inspection technology
Aviation Repair technology
Power amp Water Global footprint
bull Multimodal ndash service amp repair shops
bull Customer training centers
bull Additive manufacturing
bull Robotic welding
bull Advanced coatings
bull Parts inspection amp measurement
bull Condition-based maintenance
Pune India
20
Enabling technologies Service Robotics Sensing amp Controls Advanced Manufacturing
Inspection Repair Mobile Tools
Launch amp learn hellip then accelerate to all GE businesses
Automated adaptive + Productivity + Less downtime
High tech integrated + Lower fuel usage + Higher efficiency
Productivity safety + Repetitive tasks + Tough environment
Additive new materials + Repair vs scrap + Longer service life
Deployable fast accurate + More digital data + Less downtime
Connected digital + Instant expert access + Lower service costs
21
Increase value of CSA
Benefits for Customers Benefits for GE
Monitoring amp diagnostics
$180B Services backlog
Fuel efficiency
Hardware amp software upgrades
Condition-based work scope
Mobile amp analytical tools
Material productivity
Optimized asset performance
Predictive analytics ndash lower downtime
More output
Lower costs
Lower emissions
Better payback on hardware upgrades
Instant software upgrade capability
Shorter duration outages
Less material usage
Ask an Expert ndash COE
Field Service productivity
Analytics driven parts life extension + performance
Repair vs scrap
22
Segment services dynamics (Services revenue $ in billions)
Power amp Water $125
Oil amp Gas $83
Energy Management
2013
$21
+ Sustained passenger growth
+ Improving airline profitability
+ Upgrades amp analytics
Aviation $108
+ Growth markets strong
+ Improving HCIT
minus Developed challenging
Healthcare $80
+ North America utilization
+ Analytics penetration
minus Mining parts
Transportation
$28
2013
2013
2013
2013
2013
2013
+ Continued AGP growth
+ Upgrades amp analytics
Europe
+ Strong Subsea
+ MampC improving
+ Analytics penetration
+ Marine offshore
minus Mining amp motor repairs
23
Presentation
Common capability Software COE
Analytics commercialization
Bill Ruh
Kate Johnson
Business execution
Strategy overview
Customer outcomes
Examples of analytics driving growth amp productivity
Competitive advantage
Power amp Water
Healthcare
Aviation
Oil amp Gas
Transportation
Paul McElhinney
Jan De Witte
Kevin McAllister
Brian Palmer
Pete McCabe
Common capability GErsquos 1 Jamie Miller
Software amp PredixTM
Bill Ruh - VP Global Software Center
- 3 years with GE
- 32 years of industry experience
Kate Johnson - VP GE Commercial Officer
- 1 year with GE
- 15 years of industry experience
25
The Industrial Internet
3 Hyper connectivity a living network of the worldrsquos machines data amp people
Internet
Increasing system intelligence through embedded software hellip advanced sensors
controls and software applications
Brilliant Machines
Democratization of data hellip high frequency real-time data
Big Data
Predictive algorithms hellip physics-based analytics hellip deep domain expertise on big industrial data
Analytics
People at work Connecting people at work or on
the move Supporting more
intelligent design higher service
quality operations amp safety
maintenance
1
2
3
4
5
26
61
45
31 28 31 40 42
29
29
45 63
56 56
47 45
41
10 6 6
16 9 10 9
24
Software outlook Customer survey Importance of
Big Data analytics relative to other priorities
Source Accenture 2015 Trend Report Gartner Big Data Survey
Aviation
3 3 3 3 6
Wind
Power Generation
Power Distribution
Oil amp Gas
Rail
Manufacturing
Healthcare
Highest priority Within the top 3 priorities Within the top 5 priorities Not a top priority
Opex is becoming a deciding
factor for IT investments as
80 of budget is allocated to
managing and running
complex technologies Source Gartner
Advanced analytics and
analytical applications
expected to see double digit
revenue growth Source Gartner
APM market category
expected to reach $300B
by 2020 Source Gartner
27
Industrial customersrsquo perspective Survey of GErsquos customers regarding applications
Real-Time Operator Intelligence
Remote Monitoring amp Diagnostics
Condition-Based Maintenance
Asset Lifecycle Management
Schedule Optimization
Energy Management
Process Control Automation
Field Force Automation 32
38
42
43
49
59
66
70 Tailor Pre-Built Applications
Have A Systems Integrator Build
Your Apps
Build My Own Custom Apps 15
54
85
HOW do you want to consume it WHAT functionality is most valuable
Asset performance management is the killer industrial app
28
What industrial customers want
SDM
SDM
SDM
SDM SDM
Software Defined Machines (SDMs)
ldquoLink up all my assets and devicesrdquo
REAL-TIME
OPERATIONAL
INTELLIGENCE
CONDITION-
BASED
MONITORING
ASSET LIFECYCLE
MANAGEMENT
MONITORING amp
DIAGNOSTICS
Industrial Apps
SDM Non-GE Assets enabled by PredixTM Machine SDM
SDM GE Assets enabled by PredixTM Machine SDM
PredixTM powers Asset Performance Management (APM)
29
Insights into value
Improving safety and
productivity across 15K miles
of interstate natural gas
pipelines
Potential Savings
77 gallons of fuel and 1628
lbs of CO2 per approach
10 increase in network
velocity 50 reduction in
expired crews amp significant
improvements in on-time
performance
Up to 4 increase in power
output across 283 wind
turbines hellip 40+ GWhr annual
increase
Asset Performance Management (APM)
REAL-TIME OPERATIONAL
INTELLIGENCE
CONDITION-BASED
MONITORING
ASSET LIFECYCLE MANAGEMENT
MONITORING amp
DIAGNOSTICS
Operations Optimization
INSIGHT PROCESS
INTEGRATION
AUTOMATION COLLABORATION
PredixTM Platform
PredixTM Machine PredixTM Net
GE
Non-GE
PredixTM Asset PredixTM Insight
PredixTM Fabric PredixTM Core
PredixTM Experience
Predixtrade hellip the GE advantage
Release in 2015
Public Cloud Private Cloud
Commercially available to connect more machines more data amp more people
TR
AN
SF
OR
MS
PO
WE
RS
PredictivityTM Solutions
30
Predictivitytrade hellip app factory
Asset optimization (28)
Operations optimization (14)
Productivity tools (77)
Approach Development process
Agile amp Extreme Programming
Design Center for delivering
compelling user interface
Cyber security Blue team to build
and Red team to test
90-120 day service engagement to production roll out
+
+
+
Co-innovation process to design
build transfer and iterate
Actionable insight on equipment based
on physics and analytic modeling
with industrial data
Outcome based process improvements
to plants pipelines fleets fields facilities
grids shops
Increase service throughput efficiency
and quality at optimized cost of
delivery
Delivering industry apps at speed and scale
31
World-class Software amp Analytics organization
Investing in Leadership Talent
Colin Parris (IBM)
SW Research
Co-located SW CTOs for business alignment
D Bartlett
(IBM)
Aviation
World-class technical resources
Computational amp analytics scientists
Platform developers
Software engineers
~10000
1000+ Biz
COE
Product Dev Software CTO
Brad Surak (SAP)
Harel Kodesh (Microsoft
Start Up Veteran)
Trans S Chotai
(HP)
OampG J Demesa
(Siemens)
PampW G Bell
(ServiceSource)
EM J Stone
(SAP)
HC E Eryurek
(GE)
+
+
- Cyber UX Data Science Agile development
Four deep core competencies ecosystem
1
Leading edge platform + world-
class ecosystem 2
Advanced research for building
the future 3
Advanced process to drive adoption amp enablement
4
Software Site
Organization
Technology amp Ecosystem
32
Wurldtech protecting critical infrastructure
World-class cyber security to operate assets + operations safely
About A GE Company acquired in May 2014 providing top cyber talent
Capability Assess protect amp certify critical infrastructure from cyber attack
Key Customers 4 of 6 top global OampG companies 9 of top 10 automation vendors
Security enhancements delivered through PredixTM and GE Products
Certify GE and non-GE products and customer environments
Identify vulnerabilities in OT products (GE and 3rd party)
Assess and prioritize risks for system operators
Achilles Industrial Next Gen Firewall to inspect and control
Industrial network traffic
Leverage industry leading threat intelligence
Protect operational
environments
Secure amp certify industrial products
Assess products amp operations for vulnerabilities
33
Partnerships amp Alliances
Intel ATampT AWS Cisco others
Venture Capital
Mergers amp Acquisitions
ThetaRay Mocana Frost
Strategic Moves
Wurldtech Austin Digital
Acquire capability to fill gaps
Pivotal Softbank Industrial Internet Consortium
Industrial internet ecosystem
Industry Ecosphere
Establish interoperable amp scalable solutions
Co-development amp go-to-market
Accelerate innovation amp success
Positioned to create value
Open PredixTM beyond GE
GE will sell
+ + Connected devices
Data Under Management
Performance Applications
PredixTM Machine Services
PredixTM Data Services
PredixTM Asset Services
Connect assets regardless of vendor or
vintage and provide value-added services
Aggregate and analyze data to produce
actionable business insights
Sell horizontal apps that maximize return
on assets and people
1
2
3
34
Competitive advantage
$1T Connected
Machines
managed by GE
replacement value
10M Sensors
collecting
50M Data
Elements
$20B Potential
Annual Customer Savings
50B Machines will be connected on the internet by 2020
2X Industrial data growth within next 10 years
Big Iron + Big Data = Big Outcomes
INDUSTRY GE
35
New ways to sell Services
2 Making Markets Different Economics
3 Co-creation amp Agile Development
4 Solution Architecture
5 Value Based Deal Shapes
6 New Industry Ecosystems
1 New Buyers and Influencers
GE Commercial Center of Excellence
Needs Target Architect Close
Qualification amp Pipeline Management
Sales Process
HireTrain Community of Experts
Enablement Toolkit
36
Accelerating time to value across channels
APM Subscription Services
Enterprise Analytics Projects
Upgrade value in CSAs
GE Sales Model
Existing Services sales team
New standalone software sales specialists
New outcome sellers + existing service sales team
Sales
acceleration
Expert SWAT
teams to
support deal
SW experts compelling
offer target one outcome
to land and expand
Ecosystem partners
SW COE app factory
Offering RMampD in CSA upside
and productivity Per well subscription
Enterprise SW deal
solution co-creation
ReliabilityMaxtrade FieldVantageTM Intelligent PipelineTM
GE OampG Example
Market
Opportunity $2B $600MM $27B
37
Measuring commercial success
Services revenue
Past Future
~5
+
rsquo13 rsquo17F
Assets under management $1T+ ++
PredictivityTM solutions revenue $08B ~$4-5B
Services backlog $180B ++
bull Adding more value to existing service relationships hellip training team to get more out of the installed base
bull Creating new revenue streams and building new commercial skills and incentive plans to accelerate growth
Outcome sellers solution architects product management amp marketing
bull Cultivate ecosystem to help accelerate commercially with access to CIOCTO relationships and system integration skills
Power amp Water Paul McElhinney - President amp CEO Power
Generation Services
- In current role since May 2014
- 26 years with GE
39
Power amp Water Services
Growing services amp delivering greater customer value
Key metrics Services imperatives ($ in billions)
13 14E
+
Backlog $53 +
Revenue $125
Installed base dynamics
1
2
3
4
Deliver on customer value + Develop flexible solutions
+ Reduce customer operating cost
Grow $installed base + Maximize impact of Alstom alliance + Invest in new service offerings
Expand margins + Tech upgrades amp software solutions + Outage excellence
Improve service execution amp delivery + Improved customer service levels
+ Optimize field service amp repair network
Unit growth up ~24X from 2008
Strong DP amp Wind growthhellip up ~1Kyear
~4000+ gas turbines in service
40
Global power industry is facing complex challengeshellip Offering innovative solutions to address customersrsquo needs
Fuel price uncertainty
Increasing regulation
Slow demand growth
Aging installed base
~15 years Average age of ~4K global GE gas turbines
Output
Efficiency
Reliability
Availability
Flexibility
Improving customersrsquo outcomes while decreasing costs
~$7B
Customer challenges
~$8B
~$2B
~$1B
~$2B
GE Predictivitytrade solutions amp industry benefit
~60+ Increase in US natural gas price since 2012
~(30) Thermal capacity in Europe since lsquorsquo08
Based on 10 year NPV
41
Investing in technology
Addressing multiple customer value levers
Advanced Gas Path (AGP) Industry leading output hellip up to +64 Industry leading efficiency hellip up to +18 Extends asset amp parts life hellip 96K hours
1
Op Flex Delivers flexibility to costs amp revenue Reduces start up time amp fuel consumption Expands fuel source opportunity
3
Dry Low NOx 26+ (DLN) Reduces NOx emissions by 40 Delivers industry leading flexibility Increases maintenance intervals to ~1250 starts
2
42
Power FlexEfficiencytrade Advanced Gas Path
Expanding the operating envelope
Ambient Temperature
Ou
tpu
t (M
W)
Op Flex
7FA03 baseline
AGP
+ ndash
+
Combining hardware and software hellip creating 2X the value
$17
$30
Op Flex
Average Customer Annual Value Per Unit ($MM)
Improving customer outcomes
AGP (Hardware)
AGP PredictivityTM
Solution
125+ AGPs with software sold to date
650000+ operating hours to date
43
Wind PowerUp hellip generating more output
Customer Outcome Up to 4
increase in power output across 283
wind turbines hellip 40+ GWhr annual increase ldquoThe PowerUp system offers a great chance for owners like us who are investing literally billions of dollars in this market to try and get more production out of existing assets GE took a lot of risk out of this for usrdquo
ndash Patrick Woodson CEO EON Climate amp Renewables
Opportunity for up to
20 more profit from up to
5 more output
A performance based
cooperative approach
with a holistic view of the
assets system and network
Flexible payment options
aligned to customer needs
+1400 turbines under contract since launch
Customer opportunity
Software enabled
Flexible platform
Proven results
Scale out
1
2
3
Healthcare Jan De Witte - President amp CEO Healthcare IT
- In current role since 2011
- 15 years with GE
45
Healthcare Services
Delivering value = higher quality outcomes at lower cost
Key metrics Services imperatives ($ in billions)
Backlog $11 +
Installed base dynamics
1
2
3
4
Deliver on customer value + Asset and workflow optimization + Analytics around EMRs amp Devices
Grow $installed base
+ Quality and analytics offerings + Solutions architecture amp delivery
Expand margins + Remote service amp SaaS models + Field services productivity Improve service execution amp delivery + Remote monitoring technologies + Field force deployment optimization
Emerging markets infrastructure build
Mature markets quality upgrades
ACA amp Enterprise Solutions IT penetration
13 14E
=+ Revenue $80
46
Healthcare industry shifting to value-based care GE software analytics and services are uniquely positioned to help
Customer challenges
Integrated Care Solutions hellip turning data into actionable insight Improving healthcare outcomes
Diagnostic quality
Patient-centric care
System profitability
Chronic Disease Management
Sources Institute of Medicine 2013 Porter Research 2013 McKinsey IHS Global Insight
29 Healthcare spend wasted each year
$260B Annual value creation through healthcare IT
59 US lives covered in value-based care model by 2015
Clinical Quality
Financial Performance
Operational Efficiency
Configurable Workflows
47
GEHC Software portfolio positioned along main outcome drivers for care systems
Diagnostic speed amp confidence
Productive care pathways
Wellness amp chronic disease management
Risk amp margin management
Costworkforce optimization
Population Health Management
Workflow
Archiving
Visualization
Financial Management
Care Delivery Management
Enterprise Imaging
Operations Management
Revenue Cycle
Risk assessment
Margin analytics
Workforce optimization
Asset Management
Integrated Care Solutions
Ambulatory Care
High Acuity Care
Cardiology
Analytics
Care coordin
Engagement
Providing caregivers the right actionable insight ndash when amp where they need it
Large GE device footprint generating
clinical data
HCIT domain in clinical workflow amp analytics
SW CoEPredixTM capabilities + +
48
Enterprise Imaging Improving diagnostic workflow in the cloud
Customer Challenges Cloud Case Exchange CentricityTM 360
Sample Customers Solution Architecture
Clinical Collaboration amp Advanced Analytics
Imaging Cost Control
Archive
Workflow
19 Time spent
gathering data
Workflow
velocity
Diagnostic
confidence
Cases diagnosed
incorrectly 35
~$2B segment by rsquo18 growing 25+
30 turn-around time
3 duplicate exams
Customer value $10MM+ cost pa
Image-as-a-Service lifecycle value $20MM+
Care quality
Cost
Source Research from the Journal of the American College of Radiology and the Journal of American Medicine
49
Customer Challenges Workforce management
Sample Customers
Operations Management Optimizing workforce productivity with API Healthcare
54 Hospital
operating cost
spent on labor
Solution Architecture
Real-Time Analytics Labor amp Patient Workflows
Time amp Attendance
Staffing amp Scheduling
HR amp Payroll
~$2B segment by rsquo18 growing 12+
20 Workforce productivity
Customer value $4MM cost pa
Workforce-mgmt services lifecycle $4MM+
80 Overtime wages
Matching care-giver capacity
amp patient need
Care quality
Labor
productivity
Source Beckerrsquos Hospital Review
50
Population Health Management Lowering the cost of chronic disease
Customer Challenges
Solution Architecture
Caradigm Analytics amp Care Mgt
Proactive
intervention
Care protocol
compliance
75 Cents of every
healthcare dollar
spent on chronic
disease
Care Mgt Analytics Risk Cohort
25
Customer value $5MM+ cost pa
Caradigm lifecycle value $18MM+
Patients per care manager
~$30B segment by 2025 growing 19+
Sample Customers
40 Hospitalization for chronic patients
Chronic disease
treatment cost
Source National Diabetes Fact Sheet
51
Software enabling productivity in service process
Wo
rkfo
rce
Pla
nn
ing
amp
Dis
pa
tch
Historically up to 40 FE travel time hellip utilize analytics to optimize allocation
Smart dispatch with effective job-skill matching
Optimize field force capacity and response time to customers
Call Generation (Planned amp Unplanned)
Deploy
RepairFix
Diagnose
CloseDebriefBill
Pe
rfo
rma
nce
M
on
ito
rin
g 110k GEHC devices connected remotely
MR hellip 900 data points monitored per machine 30k alertsyear proactively fixed
Improves GE productivity while minimizing customer down-time
Healthcare Services margins improving
Aviation Kevin McAllister - President amp CEO Aviation Services
- In current role since May 2014
- 25 years with GE
53
Aviation Services
13 14E
+ $108
Backlog $97 +
Revenue
Key metrics Services imperatives
Commercial IB hellip 34000 engines
Young hellip 46 havenrsquot had 1st shop visit
Fuel cost driving investment hellip GE well
positioned hellip 787 737MAX A320NEO 777X
Installed base dynamics
1
2
3
4
Deliver on customer value
+ Lowest cost of ownership
+ PredictivityTM outcomes
Grow $installed base
+ Winwin providing technology upgrades and analytics
Expand margins
+ Time-on-wing for GE and customers
+ Cost productivity hellip for GE
Best service execution and delivery
+ Position to support service entry for next-gen products
($ in billions)
54
Solid growth fundamentals
Shop visits Environment Departures
Source IATA amp GE analysis
Passengers IATA RPK YoY
Utilization Avg cycles day YoY
Departures GE and JV-powered flights (MM)
0
5
10
15
20
25
30
35
40
lsquo10 lsquo15F lsquo95 lsquo00 lsquo05
4100
5500
4400
2100
2000
3000
2300 2000
2300
200
100
-1 09 02
2012 2013 2014E
53 52 58
20 21 22
2 of 3 daily flights
powered by GE or GE JVs
46 have not
had 1st shop visit
4 CAGR Number of departures (MM)
lsquo13 rsquo15F rsquo20F
CFM is a 5050 JV between GE and Snecma EA is a 5050 JV between GE and Pratt amp Whitney
55
Solving our customers toughest challenges
Airline direct operating costs
Fuel
40
Delays and cancellations
8
Maintenance
9
Services analytics offerings
Flight Efficiency Services
Performance-based Navigation
Analytics-enabled workscoping
Product and Services strategy
Provide lowest cost-of-ownership through OEM technology
Lead in on-wing reliability
Lead in technology
Best-in-class fuel burn and retention
Engine diagnostic and prognostics
Intelligent Operations
$200Byr
$40Byr
Taleris is a 5050 JV between GE and Accenture
+
56
Services technologies hellip improving value through the lifecycle
Installed base (lsquo13) Upgrades
Fuel Burn improvement
Time- on-wing
8 8 2x
8 3 3x
5 2 2x
A culture of technology insertion Tailored to customer wants
CFM is a 5050 JV between GE and Snecma
Risk transfer $hour coverage
Overhaul Time and material
Materials New used and repaired parts
Asset optimization TRUEngineTM program diagnostics
+
CF6-80C (lsquo86 EIS)
GE90 (lsquo95 EIS)
CFM56 (lsquo84 EIS)
3000
1500
18500
57
Minds amp Machines at GE Aviation
+ Ex
po
sure
Operator A Operator B Part Temperature Cruise Takeoff
Te
mp
era
ture
Threshold
Climb
1000+ software engineers GE Software COE
6300 applied engineers GE Aviation
Data Secure continuous accessible
Physics Apply engine expertise
+ =
Customer and GE benefits
+
Statistics Unlock trends segment
ldquoPhysicsrdquo ldquoAnalyticsrdquo
Time-on-wing
Reliability and availability
Fuel cost
Repair and overhaul
58
Lead in on-wing reliability
Applied analytics to detect engines at risk of removal
Cu
mu
lati
ve
dis
tre
ss
Cycles
Recent successes hellip
CFM is a 5050 JV between GE and Snecma
Segment
GE90
120 CFM56
40 Water wash
$7Myr fuel savings at one GE90 operator
removals saved
removals saved
Nominal environment
Abate
Harsh environment
59
$30MMyr savings
Flight Efficiency Services App
Performance-based Navigation App
Attacking fuel spend with analytics
Joint marketing hellip
ldquoPerfect flightrdquo video
In the news
Newsletter
Oil amp Gas Brian Palmer - Vice President Measurement amp Control Solutions
- In current role since 2010
- 29 years with GE
61
Oil amp Gas Services
Software amp Services as a key differentiator
Key metrics Strategic imperatives ($ in billions)
13 14E
++
Backlog $58 ++
$83 Revenue
1
2
3
4
Deliver on customer value + Customer co-creation
+ Outcome based solutions
Grow $installed base + Drive analytics amp PredixTM
+ Penetrate the installed base
Expand margins + More software and contract offerings
+ Continue to grow backlog double digits
+ Partnerships to accelerate journeyhellip
Meridium
Improve service execution amp delivery + Full lifecycle productivity
+ Simplifying structure
IB growing TMS and Subsea with 13K+ units Software investments creating new IB revenue
streams in addition to traditional parts and service New contractual (CSA) offerings developedlaunched
Installed base dynamics
62
Oil amp gas industry is faced with expanding challenges GE software data and analytics are uniquely positioned to help
Customer challenges Equipment Availability
Equipment Reliability
Operational Efficiency
Production Optimization
Industrial Internet hellip turning data into actionable information Enable no unplanned downtime
Increasing complex operations
Tighter regulations
Skills gap
Machines with data potential
Sources GE OampG analysis based on Wood Mackenzie Rystad Barclays IHS CERA PFC Energy IEA httpwwwgecomstoriesoil-and-gas-innovation Oil and Gas Facilities 2013 httpwwwspeorgogfprintarchives201306
$800B+ Annual industry CAPEX (6-8 growth per year)
$150MM Average annual cost for mid-size LNG facility due to unplanned downtime
5-10 Range of OampG industryrsquos estimated downtime
63
Predixtrade hellip Unified Operations Improved throughput connecting people machines and data
Customer outcomes
Unified Operations ndash A customer co-creation success story
Enhanced safety
Increased availability
Operational visibility
Efficient workforce enablement
Partnering with to tackle these industry challenges and create a solution that increases production and lowers cost driving improved customer outcomes
Unified Customer
Portal
129000 Pieces of equipment in operation globally in
the industry
50 Industry retirement rate in next 10 years
7X Industry fatality rate
above norm
people
machines
data
64
FieldVantagetrade hellip Asset Performance Management (APM) for Onshore
APM ndash Bringing GE expertise from all industries to deliver system level value
Customer outcomes
Enhanced safety
Operational visibility
Improved availability
Optimized performance
Monitoring amp
Diagnostics
Condition Based
Maintenance
Real time Operations
Intelligence
Asset LifeCycle
Management
bull Providing field level visibility and optimization across multiple forms of artificial lift technologies bull Integrated insights provided through common single scalable platform bull 2 year service contract on 200+ wells
Solution Overview
39 NAM OampG Upstream Vehicle Fatalities
hellipby improving
116K New wells in 2014
5 Days Back to production (NAM Avg)
1MM+ Artificially Lifted Wells (Global)
65
Intelligent Pipeline hellip Operations optimization software for pipelines
2TB of data for every
30K miles of pipeline
3-4 annual growth
2MMmiles of
pipelines globally
$40B invested by pipeline companies per year
Source 2TB - Average data volume based on GE internal analysis of multiple pipeline customers Rest - GE OampG analysis based on Douglas Westwood IHS CERA FERC CIA World Factbook PII Pipeline Database (Summary of Infield Systems Global Data DOT databases)
bull 5 year service contract
bull Setting the industry standards for
pipelines real-time intelligence
First customer Customer outcomes
Enhanced safety Proactive versus reactive decisions
Visibility Complete geospatial view and situational awareness
Optimized Ops Effective data driven resource allocation
Efficient OampM Prioritize spending for assets and resources
Moving to proactive solutions with our customers
66
Customer Benefits
Zero unplanned downtime
Increased availability
Increased reliability
Decreased production losses
$14B Additional opportunity driven by
availability and reliability increase (1 of capacity)
Industry Opportunities
Outcome base service bonus
GE Productivity Improvements
Inventory through parts flow optimization
Outage durationfrequency driven by condition- based maintenance
Services Optimization hellip Creating optimal value for GE equipment customers
Journey to 100 reliability through our Contractual Services Agreements (CSA)
Transportation Pete McCabe - Vice President Global Services amp Solutions
- In current role since 2013
- 20 years with GE
68
Transportation Services ($ in billions)
13 14E
+
Revenue $28
Backlog $12B+ +
1
2
3
4
Deliver on customer value
+ Outcomes - velocity fuel reliability
+ System solutions ndash RailConnectTM 360
Grow $installed base
+ Increase penetration ndash Parts amp Smarts
+ Extend asset life ndash modernizations
+ Broaden software solutions ndash rOS
Expand margins
+ Deploy advanced analytics ndash PredixTM
Improve service execution amp delivery
+ Enhance commercial capabilities
+ Expand domain amp IT project expertise
Installed base dynamics
1000+ Tier 4-compliant loco orders
~650 locomotives un-parking in rsquo14
450 new locomotives in South Africa
Key metrics Services imperatives
69
Railroad industry is faced with expanding challenges and customers require a solution provider
Customer challenges
RailConnecttrade360 delivering customer focused outcomes
Asset utilization
Capacity limited
Resource constraints
Ops Complexity
$80B+ N American operating revenue (~4 growth)
7 year high Traffic volumes require unparalleled investment
$56B Annual industrial benefit through 1 improvement
Sources American Association of Railroads (AAR) 2013 industry statistics
70
Asset optimization ndash fuel efficiency
Customer Dynamics RailConnect 360 ndash Trip Optimizer
bull Real-time embedded optimization algorithms
bull Advanced data acquisition enabling train health monitoring
bull Automated train handling reduces wheel amp rail wear
bull $1M diesel locoyear 22K GE locos
bull Emissions
bull Huge operating variation operators trains topography
Trip Optimizer with CSX
Implementation on 1500 CSX locomotives
Reduced fuel use by 7 on average Decreased 3rd largest operating expense
- CSX Sustainability Report 2013
Tr ip Opt imizer Quick Star t Guide (1) Train Speed is available on the speedometer during an active trip during auto and Manual Control
(2) Trip Plan Speed displays a green Trip plan speed pointer on the speed indicator dial in Auto and Manual
modes of operation
(3) Trip Optimizer Status Box is visible when Trip Optimizer system is ACTIVE and provides three types of messages Status Request for Operator InputAction and Error
(4) TrackCivil Speed Limit plot line is Cyan shown the entire horizontal range data permitting
(5) Train Speed (Actual) plot line is White shown only from the head of the train on back
(6) Train Head is shown as a thick White line to allow the operator to see the position of the Train relative to the
terrain The horizontal scale of the rolling chart is zero-referenced to the Head of the Train (corresponds to the forward-facing end of the lead locomotive)
(7) Train Milepost has an associated location and name Its representation on the screen consists of a graphical
pointer and an identifier
(8) OMB Message Box displays operator messages
(9) Consist Notches displays Lead and Trailing locomotive notches
(10) Throttle Handle Notch represents the Master Control-ler handle position During TO Auto Control it will indicate
N8 as TO automatic control requires notch eight (N8) set-ting
(11) Auto Control Notch displays on screen as a White box to denote TO Auto Control engagement and throttle out-
put control
(12) Trip Plan Speed has a Green plot line shown as the entire horizontal range when available and data permit-
ting
(13) Manual Control Zones is shown as a Gray rectangle on the terrain plot extending across the entire vertical range of this section of the chart
(14) Planned Braking depicts Blue areas where Trip Opti-mizer expects that dynamic andor air braking will be
required to maintain the plan speed
(15) Key Locations are softkey states that constitute a unique mapping of functionality to key locations
1 How do I get started To start a trip you will push the Trip Optimizer key on the Main operator screen
2 Do I have to be stopped to request a trip through Trip Optimizer It is preferred to perform a trip init at zero speed however unless otherwise provided by
local ruleinstruction maximum speed for initialization is 15 mph
3 I have performed the Trip Init process and see the rolling map When will I get prompted for Auto Control
Auto Control will become available when the speed is greater than 12 mph and the Throttle handle is N1 or higher
4 Why does the Locomotive Status matter to Trip Optimizer Trip Optimizer will always monitor in train forces speed braking and fuel efficiency To best optimize all of these Train dynamics Trip Optimizer must be told by the operator what the
status of each locomotive in the train The three modes are defined as follows
Running The locomotive is fully operational and is used for calculating TPOB
Isolated The locomotive is either shut-down or is mechanically isolated from produc-
ing Tractive Effort
DB Cutout The locomotive has no Dynamic Braking available but is being used for
producing Tractive Effort
5 What is the recommended way to disengage Auto Control The most fuel efficient way is to decrease the throttle notches in 2 second intervals until
you get to the required speed
6 Trip Optimizer is disengaging from Auto mode and tells the opera-tor Manual Control is required I am already in Notch 8 throttle
What do I do
Press the Current Throttle key on the screen Moving the Master Controller from Notch 8 to
Notch 7 and back could result in un-safe train handling practices
7 Why does Trip Optimizer not always travel at Track speed Trip Optimizer will use the forces of the train and momentum to achieve the optimal speed to save fuel In some cases Idle will be used to meet a planned slow order Trip Optimizer is
always looking out a few miles ahead to plan for the ideal speed while maintaining safe train handling
8 How do I report an inaccuracy on the civil speed limits posted on the rolling map
Contract your Road Manager to report the case
9 The dispatcher has issued an enroute slow order Will Trip Opti-
mizer automatically take this into account
No If an enroute slow order is issued it will be the train crewrsquos responsibility to protect the
train in Manual mode during this affected zone
10 Why does Trip Optimizer automatically end the trip when I still have distance remaining before the preset crew change point
The subdivision has a GPS controlled end point that will automatically end the trip based off of recommendations from the railroad
Follow the steps on the backside of this document to walk you through performing a Trip Init
Trip Optimizer Top Ten List
GE Proprietary Information The information contained in this document is GE Proprietary Information and is disclosed in confidence It is the property of GE and shall not be used disclosed to others or repro-
duced without the express written consent of GE If consent is given for reproduction in whole or in part this notice and the notice set forth on each page of this document shall appear in any such reproduction in whole or in part The information contained in this document may also be controlled by the US export control laws Unauthorized export or re-export is
prohibited Document 5005807 Rev mdash
Before engaging the TO AUTO throttle the operator must meet certain train conditions and under-stand the data displayed on the Trip Optimizer Running Screen
Doc No 5005890 Rev -
71
Operations optimization ndash velocity
Movement Planner with Norfolk Southern
RailConnect 360 - Movement Planner
bull Systems problem hellip beyond human capabilities
bull Majority single track
bull Point solutions have plateaued
bull Integrated suite of day of operations software apps
bull Predixtrade platform - connectivity big data and security
bull Advanced algorithms and automatic routing
bull Proven in class 1 revenue service
Norfolk Southern and Movement Planner
Automated routing decisions
10+ increase in velocity
50+ reduction in expired crews Significant improvement in
schedule adherence
1MPH = ~$200MM estimated
annual savings in capital amp expenses
Based on 3 year study in NS GA division
Customer Dynamics
72
bull Co-development GE Transportation amp GE Intelligent Platforms
minus Enhanced sensor coverage
minus Improved data acquisition higher resolution
minus Advanced analytics
bull Asset specific insight drives fault reduction and enables CBM
(SmartSignal)
bull 20K+ overhauls in backlog
bull OH interval based on average expected condition
bull $1B+ capital expenditure in North America every year
Impact Reduced unplanned
downtime amp avoid road failures
Reduce unscheduled material consumption
Extended periodicity and associated expenses
ldquoPhysicsrdquo change
Real Time Engine Performance
Bearing Temp
Bearing Temp
Load
Ambient
To
da
y
To
mo
rro
w
Alarm trigger
Savings
CSA ndash shared productivity
Lifecycle Cost Dynamics ndash Engine Overhauls RailConnect 360 ndash Advanced Analytics
GErsquos 1 Jamie Miller - Senior Vice President Chief Information Officer
- In current role since 2013
- 9 years with GE
74
Digital opportunity
Simplifying structure
More valuable GE resources with fully integrated approach
+ Utilize data from products
+ Field services tools
+ CRM configurators
+ Brilliant Factory
Benefits
ERPmanufacturing 90
Data Centers 80
Applications 30
Shared Services 65
Cloud 70
Product Cost
RampD
SGampA
+ Engineering tools
+ Shared Services GL
+ Cyber Security
IT plays
-a)
(a - Target percent of new applications that are Cloud enabled
~$94B
Industrial cost
75
Three opportunities to power manufacturing
Digital Foundation 1
Unlocking Big Data
minus Sourcing
minus Productivity
2
Powering the Brilliant Factory
minus Design for manufacturing
minus Sensor enablement
minus Plantsupply chain optimization
3
minus 90 reduction in ERPs
Supply Chain Network
Virtual Mfg
Virtual Product Design
76
Product Cost ERP investments paying off
Inventory turns 6x 7x
Shipment on time 58 85
Foundation for business to deliver $1B+ savings over past 5 years
GE Healthcare
of revenue on target ERP ~75
~95
2009 Today
Today 219 ERPs 2016 34 ERPs
GE Water
2008 Today
22
1
of ERPs
SGampA of sales ~10 pts
Past dues 60
Finance headcount 50
77
Product Cost Using big data to run GE
Ingest Store Clean Consume
1 OampG data lake $8B direct materials buy
Real time More cheaper Faster GE-wide Analytics Data science
$60B total material buy across GE hellip $1B+ cash amp deflation opportunities
bull 23 source systems
bull Full visibility ndash 3 weeks
bull Commodity part supplier
bull Data lake technology
bull Machine learning for data cleansing
bull EM PampW underway (Alstom)
Oil amp Gas
Xxxxx Xxxxx Xxxxx xxxxx
78
Product Cost Technology powering the Brilliant Factory
20 NPI cycle hellip 20 efficiency
16 pilots launched hellip Fastworks 2020 Vision
FastWorks approach
Virtual design for manufacturing
30 NPI cycle time
Eliminated quality escapes
Wilmington NC
Aviation Machining
Factory optimization
25 productivity
PampE avoidance Greenville SC
PampW Nozzle Cell
machine downtime
25 opportunity
Sensor Enablement
Grove City PA
Transportation Remanufacturing
79
Smart Outage Full deployment at PGS
Changing the way we deliver Services
On track for $1B CSA productivity over 3 years and 10 customer uptime
+ +
Predictive Workscope Aviation 4 customers
full roll-out mid-2015
=
Field services optimization
Predictive workscope
Next generation modeling
Advanced technology
Accelerating productivity
80
We can do more ldquoSrdquo with less ldquoG+Ardquo
45 win rate
80 in quote time
5400+ SalesComm Ops hoursweek
QuickQuote
40K+ GE Commercial FTE
Highly manual long-cycle-time
More ldquoshots on goalrdquo lower cost
Investing in digital tools for commercial teams
Wrap up
82
Value for investors
Payback through most reliable revenue source Services
+ Increase revenue growth
+ Improve margins
+ CSA productivity
Funded software amp analytics through simplification amp reallocation
Potential upside beyond the GE installed base
Scale amp intellect Return on investment
1
2
3
GE Software COE
+ COE can accomplish scale hellip none of
our businesses could do this on their
own hellip attract talent amp spread ideas
+ Advantage to being an early mover hellip
right partnerships amp scale
+ Changing GE Industrial DNA hellip
greater impact from digital amp
analytical investments
83
Why GE
+ More valuable portfolio hellip 75 Industrial while growing EPS
+ Tangible evidence of winning NPI hellip Tier 4 LEAP etc
+ Strong amp diversified global footprint hellip best-in-class
+ Transforming service for next generation of growth
+ Culture of simplification impacting every part of GE
LEAP is a trademark of CFM International
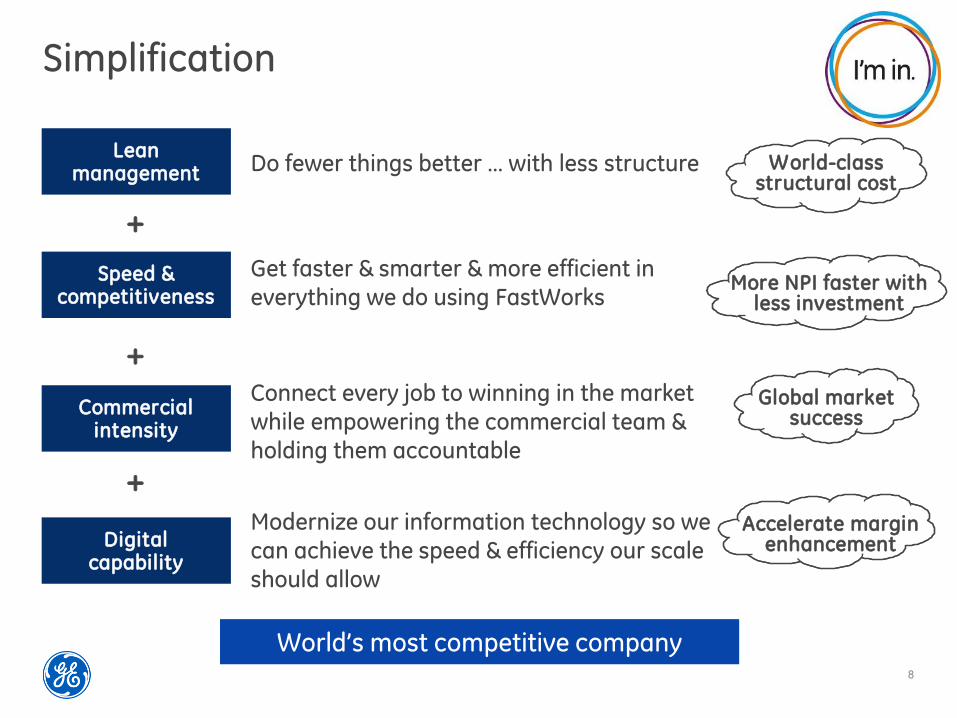
8
Simplification
+
+
+
Lean management Do fewer things better hellip with less structure
Speed amp competitiveness
Get faster amp smarter amp more efficient in everything we do using FastWorks
Commercial intensity
Connect every job to winning in the market while empowering the commercial team amp holding them accountable
Digital capability
Modernize our information technology so we can achieve the speed amp efficiency our scale
should allow
World-class structural cost
More NPI faster with less investment
Global market success
Accelerate margin enhancement
Worldrsquos most competitive company
9
Lower cost
Industrial SGampA sales
175
rsquo12
~12
159 ~14
rsquo13 rsquo14E rsquo16F rsquo15F
~13
($ in billions)
rsquo11
185
Enablers
ERP
90 reduction
Shared services
65 penetration
Corporate
$500MM cost out
+ of PampLs
Layersspan
Product cost
rsquo12-rsquo14E investment
Gains ~$25
Restructuring ~$(43)
10
Technology is evolving
PHYSICAL ANALYTICAL
Multiple materials in complex systemshellip hundreds of patents in each product
Operating with high efficiency amp durability in extreme conditions
1 gas turbine compressor blade monitoring potential 500 gigabytes per day
Combination of physical amp analytical drives next evolution of services
Customers will value data because it improves their efficiency
GE is well positioned to lead this wave of change
Investors will benefit through services growth amp margins + product share + IT-driven efficiency
1
2
3
4
Key messages
+
11
Transforming services
bull Partners amp field
technicians 80rsquos
Big iron
Airlines 1 fuel $2-3B
Utility 1 fuel $4-5B
Oil amp Gas 1 uptime $5-7B
Healthcare 1 productivity $4-5B
Transportation 1 mile velocity $1-2B
Driving customer outcomes
bull Risk sharing
service contract 00rsquos
CSA
bull Asset amp
operations
optimization
Today
bull Science applied
to repairs amp
upgrades 90rsquos
Repair
Power of 1
Annual impact-a)
Small changes in hellip fuel maintenance uptime productivity flexibility safety
labor effectiveness hellip have a big
impact on profitability
(a - Global industry estimates based on ldquoIndustrial Internet Pushing the Boundaries of Minds amp Machinesrdquo ndash Nov 26 2012
Analytics
12
GE leadership
Large high-tech installed base
Customer trust amp connection hellip ~$180B services backlog
Deep domain knowledge
GE advantages What it takes to win
bull Sensors
bull Service robotics
bull Connectivity
Enabling technologies
bull Connected IB
bull Physicsmaterials bull Smart devices
bull Global reach
Installed base
+
+
bull Software capability bull Industrial big data
bull Operating platform
bull Security
Data amp analytics Attracting new talent hellip
ldquohorizontal capabilityrdquo
Connecting domain amp data hellip CSA
Operating platform in place (PredixTM)
Large research capability
Industry partnerships
Collecting 50MM data elements
GE has all essential elements
Have
Have
Investing
13
Improving the service model
Asset optimization
Operations optimization
CSA productivity
CSA + Connected asset + Software revenue value ($IB) outcome sales
Data-driven execution
Maximize performance with no unplanned downtime
Increased system efficiency across GE
amp non-GE assets
Optimize material amp repair cycles
across IB
Make versus buy hellip build internal team
Launch new offerings hellip PredictivityTM
Build on existing CSA relationships hellip ldquowin-winrdquo
Develop a broader ecosystem
1
2
3
4
Investments 2010-14
Focus of innovation
How we execute
14
Asset performance management
Impact for GE hellip $IB productivity for customers hellip velocity productivity
SENSORSANALYTICS
On-site oil analysis Predict remaining life Prevent road failures
SERVICE ROBOTICS
Productivity safety Remote monitoring Tough environment
AUTOMATED DECISIONING
Optimize yard ops Reduce dwell 10 Depart on time up 50
ADVANCED CONTROLS
Auto Train Operation 10 fuel savings
15
Impacting GErsquos 1
$94B of cost
$12B of working capital
$20B of PampE investments
GErsquos 1
Analytics amp
security
IT investment ($2B+year)
+
Reduce structure
Lower product cost
Improve margins
Enhance engineering productivity
Faster amp safer
Impact
Every Industrial company a Software amp Analytical company
16
Investor value
Increase services growth rate
+ More $installed base
+ $08B PredictivityTM solutions revenue growing to $4-5B
+ Penetrate aged GE fleet
+ Grow beyond the GE IB
Improve services margins
+ CSA productivity
+ Improve quality
Potential for industry value
+ Scale beyond GE installed base Backlog Revenue Margins
Services franchise
~$180B
~$45B
~30
Value creation
+
1
2
3
Software amp analytics accelerate services growth margins amp returns
Revenue growth ~5 Margin expansion ~50 bps Limited by IB growth
Historic performance
Services overview
18
Services growth
05 08 11 13
($ in billions)
Revenue
~26 ~30
OP
GE advantages
+ Installed base
+ Technology
+ CSA model
+ Footprint amp scale
+ Software COE
+ Fleet data
$27
$35
$42 $45
Services imperatives
Backlog
1
2
3
Deliver on customer value + Link services to outcomes + Global deployment
Grow $installed base + Drive analytics amp PredixTM value + Penetrate aged installed base
Expand margins + Leverage analytics to manage
performance + Invest in productivity tools
Improve service execution amp delivery + Enhance commercial capabilities + Increase field services capability
Spread ideas across GE
$87 $121 $147 $180
4
5
19
Services Council
Driving differentiated advantage
Cross-business initiatives
20+ services leaders
Teams aligned to 9 themes
Quarterly executive updates hellip operational rigor
Spreading ideas hellip
bull Core growth
bull Operations
bull Tools + process
bull CSA excellence
Data +
Outcomes
bull PredixTM + Cloud
bull PredictivityTM solutions
bull Strategic alliances + BD
Hardware amp domain expertise
Software analytics based
Healthcare Inspection technology
Aviation Repair technology
Power amp Water Global footprint
bull Multimodal ndash service amp repair shops
bull Customer training centers
bull Additive manufacturing
bull Robotic welding
bull Advanced coatings
bull Parts inspection amp measurement
bull Condition-based maintenance
Pune India
20
Enabling technologies Service Robotics Sensing amp Controls Advanced Manufacturing
Inspection Repair Mobile Tools
Launch amp learn hellip then accelerate to all GE businesses
Automated adaptive + Productivity + Less downtime
High tech integrated + Lower fuel usage + Higher efficiency
Productivity safety + Repetitive tasks + Tough environment
Additive new materials + Repair vs scrap + Longer service life
Deployable fast accurate + More digital data + Less downtime
Connected digital + Instant expert access + Lower service costs
21
Increase value of CSA
Benefits for Customers Benefits for GE
Monitoring amp diagnostics
$180B Services backlog
Fuel efficiency
Hardware amp software upgrades
Condition-based work scope
Mobile amp analytical tools
Material productivity
Optimized asset performance
Predictive analytics ndash lower downtime
More output
Lower costs
Lower emissions
Better payback on hardware upgrades
Instant software upgrade capability
Shorter duration outages
Less material usage
Ask an Expert ndash COE
Field Service productivity
Analytics driven parts life extension + performance
Repair vs scrap
22
Segment services dynamics (Services revenue $ in billions)
Power amp Water $125
Oil amp Gas $83
Energy Management
2013
$21
+ Sustained passenger growth
+ Improving airline profitability
+ Upgrades amp analytics
Aviation $108
+ Growth markets strong
+ Improving HCIT
minus Developed challenging
Healthcare $80
+ North America utilization
+ Analytics penetration
minus Mining parts
Transportation
$28
2013
2013
2013
2013
2013
2013
+ Continued AGP growth
+ Upgrades amp analytics
Europe
+ Strong Subsea
+ MampC improving
+ Analytics penetration
+ Marine offshore
minus Mining amp motor repairs
23
Presentation
Common capability Software COE
Analytics commercialization
Bill Ruh
Kate Johnson
Business execution
Strategy overview
Customer outcomes
Examples of analytics driving growth amp productivity
Competitive advantage
Power amp Water
Healthcare
Aviation
Oil amp Gas
Transportation
Paul McElhinney
Jan De Witte
Kevin McAllister
Brian Palmer
Pete McCabe
Common capability GErsquos 1 Jamie Miller
Software amp PredixTM
Bill Ruh - VP Global Software Center
- 3 years with GE
- 32 years of industry experience
Kate Johnson - VP GE Commercial Officer
- 1 year with GE
- 15 years of industry experience
25
The Industrial Internet
3 Hyper connectivity a living network of the worldrsquos machines data amp people
Internet
Increasing system intelligence through embedded software hellip advanced sensors
controls and software applications
Brilliant Machines
Democratization of data hellip high frequency real-time data
Big Data
Predictive algorithms hellip physics-based analytics hellip deep domain expertise on big industrial data
Analytics
People at work Connecting people at work or on
the move Supporting more
intelligent design higher service
quality operations amp safety
maintenance
1
2
3
4
5
26
61
45
31 28 31 40 42
29
29
45 63
56 56
47 45
41
10 6 6
16 9 10 9
24
Software outlook Customer survey Importance of
Big Data analytics relative to other priorities
Source Accenture 2015 Trend Report Gartner Big Data Survey
Aviation
3 3 3 3 6
Wind
Power Generation
Power Distribution
Oil amp Gas
Rail
Manufacturing
Healthcare
Highest priority Within the top 3 priorities Within the top 5 priorities Not a top priority
Opex is becoming a deciding
factor for IT investments as
80 of budget is allocated to
managing and running
complex technologies Source Gartner
Advanced analytics and
analytical applications
expected to see double digit
revenue growth Source Gartner
APM market category
expected to reach $300B
by 2020 Source Gartner
27
Industrial customersrsquo perspective Survey of GErsquos customers regarding applications
Real-Time Operator Intelligence
Remote Monitoring amp Diagnostics
Condition-Based Maintenance
Asset Lifecycle Management
Schedule Optimization
Energy Management
Process Control Automation
Field Force Automation 32
38
42
43
49
59
66
70 Tailor Pre-Built Applications
Have A Systems Integrator Build
Your Apps
Build My Own Custom Apps 15
54
85
HOW do you want to consume it WHAT functionality is most valuable
Asset performance management is the killer industrial app
28
What industrial customers want
SDM
SDM
SDM
SDM SDM
Software Defined Machines (SDMs)
ldquoLink up all my assets and devicesrdquo
REAL-TIME
OPERATIONAL
INTELLIGENCE
CONDITION-
BASED
MONITORING
ASSET LIFECYCLE
MANAGEMENT
MONITORING amp
DIAGNOSTICS
Industrial Apps
SDM Non-GE Assets enabled by PredixTM Machine SDM
SDM GE Assets enabled by PredixTM Machine SDM
PredixTM powers Asset Performance Management (APM)
29
Insights into value
Improving safety and
productivity across 15K miles
of interstate natural gas
pipelines
Potential Savings
77 gallons of fuel and 1628
lbs of CO2 per approach
10 increase in network
velocity 50 reduction in
expired crews amp significant
improvements in on-time
performance
Up to 4 increase in power
output across 283 wind
turbines hellip 40+ GWhr annual
increase
Asset Performance Management (APM)
REAL-TIME OPERATIONAL
INTELLIGENCE
CONDITION-BASED
MONITORING
ASSET LIFECYCLE MANAGEMENT
MONITORING amp
DIAGNOSTICS
Operations Optimization
INSIGHT PROCESS
INTEGRATION
AUTOMATION COLLABORATION
PredixTM Platform
PredixTM Machine PredixTM Net
GE
Non-GE
PredixTM Asset PredixTM Insight
PredixTM Fabric PredixTM Core
PredixTM Experience
Predixtrade hellip the GE advantage
Release in 2015
Public Cloud Private Cloud
Commercially available to connect more machines more data amp more people
TR
AN
SF
OR
MS
PO
WE
RS
PredictivityTM Solutions
30
Predictivitytrade hellip app factory
Asset optimization (28)
Operations optimization (14)
Productivity tools (77)
Approach Development process
Agile amp Extreme Programming
Design Center for delivering
compelling user interface
Cyber security Blue team to build
and Red team to test
90-120 day service engagement to production roll out
+
+
+
Co-innovation process to design
build transfer and iterate
Actionable insight on equipment based
on physics and analytic modeling
with industrial data
Outcome based process improvements
to plants pipelines fleets fields facilities
grids shops
Increase service throughput efficiency
and quality at optimized cost of
delivery
Delivering industry apps at speed and scale
31
World-class Software amp Analytics organization
Investing in Leadership Talent
Colin Parris (IBM)
SW Research
Co-located SW CTOs for business alignment
D Bartlett
(IBM)
Aviation
World-class technical resources
Computational amp analytics scientists
Platform developers
Software engineers
~10000
1000+ Biz
COE
Product Dev Software CTO
Brad Surak (SAP)
Harel Kodesh (Microsoft
Start Up Veteran)
Trans S Chotai
(HP)
OampG J Demesa
(Siemens)
PampW G Bell
(ServiceSource)
EM J Stone
(SAP)
HC E Eryurek
(GE)
+
+
- Cyber UX Data Science Agile development
Four deep core competencies ecosystem
1
Leading edge platform + world-
class ecosystem 2
Advanced research for building
the future 3
Advanced process to drive adoption amp enablement
4
Software Site
Organization
Technology amp Ecosystem
32
Wurldtech protecting critical infrastructure
World-class cyber security to operate assets + operations safely
About A GE Company acquired in May 2014 providing top cyber talent
Capability Assess protect amp certify critical infrastructure from cyber attack
Key Customers 4 of 6 top global OampG companies 9 of top 10 automation vendors
Security enhancements delivered through PredixTM and GE Products
Certify GE and non-GE products and customer environments
Identify vulnerabilities in OT products (GE and 3rd party)
Assess and prioritize risks for system operators
Achilles Industrial Next Gen Firewall to inspect and control
Industrial network traffic
Leverage industry leading threat intelligence
Protect operational
environments
Secure amp certify industrial products
Assess products amp operations for vulnerabilities
33
Partnerships amp Alliances
Intel ATampT AWS Cisco others
Venture Capital
Mergers amp Acquisitions
ThetaRay Mocana Frost
Strategic Moves
Wurldtech Austin Digital
Acquire capability to fill gaps
Pivotal Softbank Industrial Internet Consortium
Industrial internet ecosystem
Industry Ecosphere
Establish interoperable amp scalable solutions
Co-development amp go-to-market
Accelerate innovation amp success
Positioned to create value
Open PredixTM beyond GE
GE will sell
+ + Connected devices
Data Under Management
Performance Applications
PredixTM Machine Services
PredixTM Data Services
PredixTM Asset Services
Connect assets regardless of vendor or
vintage and provide value-added services
Aggregate and analyze data to produce
actionable business insights
Sell horizontal apps that maximize return
on assets and people
1
2
3
34
Competitive advantage
$1T Connected
Machines
managed by GE
replacement value
10M Sensors
collecting
50M Data
Elements
$20B Potential
Annual Customer Savings
50B Machines will be connected on the internet by 2020
2X Industrial data growth within next 10 years
Big Iron + Big Data = Big Outcomes
INDUSTRY GE
35
New ways to sell Services
2 Making Markets Different Economics
3 Co-creation amp Agile Development
4 Solution Architecture
5 Value Based Deal Shapes
6 New Industry Ecosystems
1 New Buyers and Influencers
GE Commercial Center of Excellence
Needs Target Architect Close
Qualification amp Pipeline Management
Sales Process
HireTrain Community of Experts
Enablement Toolkit
36
Accelerating time to value across channels
APM Subscription Services
Enterprise Analytics Projects
Upgrade value in CSAs
GE Sales Model
Existing Services sales team
New standalone software sales specialists
New outcome sellers + existing service sales team
Sales
acceleration
Expert SWAT
teams to
support deal
SW experts compelling
offer target one outcome
to land and expand
Ecosystem partners
SW COE app factory
Offering RMampD in CSA upside
and productivity Per well subscription
Enterprise SW deal
solution co-creation
ReliabilityMaxtrade FieldVantageTM Intelligent PipelineTM
GE OampG Example
Market
Opportunity $2B $600MM $27B
37
Measuring commercial success
Services revenue
Past Future
~5
+
rsquo13 rsquo17F
Assets under management $1T+ ++
PredictivityTM solutions revenue $08B ~$4-5B
Services backlog $180B ++
bull Adding more value to existing service relationships hellip training team to get more out of the installed base
bull Creating new revenue streams and building new commercial skills and incentive plans to accelerate growth
Outcome sellers solution architects product management amp marketing
bull Cultivate ecosystem to help accelerate commercially with access to CIOCTO relationships and system integration skills
Power amp Water Paul McElhinney - President amp CEO Power
Generation Services
- In current role since May 2014
- 26 years with GE
39
Power amp Water Services
Growing services amp delivering greater customer value
Key metrics Services imperatives ($ in billions)
13 14E
+
Backlog $53 +
Revenue $125
Installed base dynamics
1
2
3
4
Deliver on customer value + Develop flexible solutions
+ Reduce customer operating cost
Grow $installed base + Maximize impact of Alstom alliance + Invest in new service offerings
Expand margins + Tech upgrades amp software solutions + Outage excellence
Improve service execution amp delivery + Improved customer service levels
+ Optimize field service amp repair network
Unit growth up ~24X from 2008
Strong DP amp Wind growthhellip up ~1Kyear
~4000+ gas turbines in service
40
Global power industry is facing complex challengeshellip Offering innovative solutions to address customersrsquo needs
Fuel price uncertainty
Increasing regulation
Slow demand growth
Aging installed base
~15 years Average age of ~4K global GE gas turbines
Output
Efficiency
Reliability
Availability
Flexibility
Improving customersrsquo outcomes while decreasing costs
~$7B
Customer challenges
~$8B
~$2B
~$1B
~$2B
GE Predictivitytrade solutions amp industry benefit
~60+ Increase in US natural gas price since 2012
~(30) Thermal capacity in Europe since lsquorsquo08
Based on 10 year NPV
41
Investing in technology
Addressing multiple customer value levers
Advanced Gas Path (AGP) Industry leading output hellip up to +64 Industry leading efficiency hellip up to +18 Extends asset amp parts life hellip 96K hours
1
Op Flex Delivers flexibility to costs amp revenue Reduces start up time amp fuel consumption Expands fuel source opportunity
3
Dry Low NOx 26+ (DLN) Reduces NOx emissions by 40 Delivers industry leading flexibility Increases maintenance intervals to ~1250 starts
2
42
Power FlexEfficiencytrade Advanced Gas Path
Expanding the operating envelope
Ambient Temperature
Ou
tpu
t (M
W)
Op Flex
7FA03 baseline
AGP
+ ndash
+
Combining hardware and software hellip creating 2X the value
$17
$30
Op Flex
Average Customer Annual Value Per Unit ($MM)
Improving customer outcomes
AGP (Hardware)
AGP PredictivityTM
Solution
125+ AGPs with software sold to date
650000+ operating hours to date
43
Wind PowerUp hellip generating more output
Customer Outcome Up to 4
increase in power output across 283
wind turbines hellip 40+ GWhr annual increase ldquoThe PowerUp system offers a great chance for owners like us who are investing literally billions of dollars in this market to try and get more production out of existing assets GE took a lot of risk out of this for usrdquo
ndash Patrick Woodson CEO EON Climate amp Renewables
Opportunity for up to
20 more profit from up to
5 more output
A performance based
cooperative approach
with a holistic view of the
assets system and network
Flexible payment options
aligned to customer needs
+1400 turbines under contract since launch
Customer opportunity
Software enabled
Flexible platform
Proven results
Scale out
1
2
3
Healthcare Jan De Witte - President amp CEO Healthcare IT
- In current role since 2011
- 15 years with GE
45
Healthcare Services
Delivering value = higher quality outcomes at lower cost
Key metrics Services imperatives ($ in billions)
Backlog $11 +
Installed base dynamics
1
2
3
4
Deliver on customer value + Asset and workflow optimization + Analytics around EMRs amp Devices
Grow $installed base
+ Quality and analytics offerings + Solutions architecture amp delivery
Expand margins + Remote service amp SaaS models + Field services productivity Improve service execution amp delivery + Remote monitoring technologies + Field force deployment optimization
Emerging markets infrastructure build
Mature markets quality upgrades
ACA amp Enterprise Solutions IT penetration
13 14E
=+ Revenue $80
46
Healthcare industry shifting to value-based care GE software analytics and services are uniquely positioned to help
Customer challenges
Integrated Care Solutions hellip turning data into actionable insight Improving healthcare outcomes
Diagnostic quality
Patient-centric care
System profitability
Chronic Disease Management
Sources Institute of Medicine 2013 Porter Research 2013 McKinsey IHS Global Insight
29 Healthcare spend wasted each year
$260B Annual value creation through healthcare IT
59 US lives covered in value-based care model by 2015
Clinical Quality
Financial Performance
Operational Efficiency
Configurable Workflows
47
GEHC Software portfolio positioned along main outcome drivers for care systems
Diagnostic speed amp confidence
Productive care pathways
Wellness amp chronic disease management
Risk amp margin management
Costworkforce optimization
Population Health Management
Workflow
Archiving
Visualization
Financial Management
Care Delivery Management
Enterprise Imaging
Operations Management
Revenue Cycle
Risk assessment
Margin analytics
Workforce optimization
Asset Management
Integrated Care Solutions
Ambulatory Care
High Acuity Care
Cardiology
Analytics
Care coordin
Engagement
Providing caregivers the right actionable insight ndash when amp where they need it
Large GE device footprint generating
clinical data
HCIT domain in clinical workflow amp analytics
SW CoEPredixTM capabilities + +
48
Enterprise Imaging Improving diagnostic workflow in the cloud
Customer Challenges Cloud Case Exchange CentricityTM 360
Sample Customers Solution Architecture
Clinical Collaboration amp Advanced Analytics
Imaging Cost Control
Archive
Workflow
19 Time spent
gathering data
Workflow
velocity
Diagnostic
confidence
Cases diagnosed
incorrectly 35
~$2B segment by rsquo18 growing 25+
30 turn-around time
3 duplicate exams
Customer value $10MM+ cost pa
Image-as-a-Service lifecycle value $20MM+
Care quality
Cost
Source Research from the Journal of the American College of Radiology and the Journal of American Medicine
49
Customer Challenges Workforce management
Sample Customers
Operations Management Optimizing workforce productivity with API Healthcare
54 Hospital
operating cost
spent on labor
Solution Architecture
Real-Time Analytics Labor amp Patient Workflows
Time amp Attendance
Staffing amp Scheduling
HR amp Payroll
~$2B segment by rsquo18 growing 12+
20 Workforce productivity
Customer value $4MM cost pa
Workforce-mgmt services lifecycle $4MM+
80 Overtime wages
Matching care-giver capacity
amp patient need
Care quality
Labor
productivity
Source Beckerrsquos Hospital Review
50
Population Health Management Lowering the cost of chronic disease
Customer Challenges
Solution Architecture
Caradigm Analytics amp Care Mgt
Proactive
intervention
Care protocol
compliance
75 Cents of every
healthcare dollar
spent on chronic
disease
Care Mgt Analytics Risk Cohort
25
Customer value $5MM+ cost pa
Caradigm lifecycle value $18MM+
Patients per care manager
~$30B segment by 2025 growing 19+
Sample Customers
40 Hospitalization for chronic patients
Chronic disease
treatment cost
Source National Diabetes Fact Sheet
51
Software enabling productivity in service process
Wo
rkfo
rce
Pla
nn
ing
amp
Dis
pa
tch
Historically up to 40 FE travel time hellip utilize analytics to optimize allocation
Smart dispatch with effective job-skill matching
Optimize field force capacity and response time to customers
Call Generation (Planned amp Unplanned)
Deploy
RepairFix
Diagnose
CloseDebriefBill
Pe
rfo
rma
nce
M
on
ito
rin
g 110k GEHC devices connected remotely
MR hellip 900 data points monitored per machine 30k alertsyear proactively fixed
Improves GE productivity while minimizing customer down-time
Healthcare Services margins improving
Aviation Kevin McAllister - President amp CEO Aviation Services
- In current role since May 2014
- 25 years with GE
53
Aviation Services
13 14E
+ $108
Backlog $97 +
Revenue
Key metrics Services imperatives
Commercial IB hellip 34000 engines
Young hellip 46 havenrsquot had 1st shop visit
Fuel cost driving investment hellip GE well
positioned hellip 787 737MAX A320NEO 777X
Installed base dynamics
1
2
3
4
Deliver on customer value
+ Lowest cost of ownership
+ PredictivityTM outcomes
Grow $installed base
+ Winwin providing technology upgrades and analytics
Expand margins
+ Time-on-wing for GE and customers
+ Cost productivity hellip for GE
Best service execution and delivery
+ Position to support service entry for next-gen products
($ in billions)
54
Solid growth fundamentals
Shop visits Environment Departures
Source IATA amp GE analysis
Passengers IATA RPK YoY
Utilization Avg cycles day YoY
Departures GE and JV-powered flights (MM)
0
5
10
15
20
25
30
35
40
lsquo10 lsquo15F lsquo95 lsquo00 lsquo05
4100
5500
4400
2100
2000
3000
2300 2000
2300
200
100
-1 09 02
2012 2013 2014E
53 52 58
20 21 22
2 of 3 daily flights
powered by GE or GE JVs
46 have not
had 1st shop visit
4 CAGR Number of departures (MM)
lsquo13 rsquo15F rsquo20F
CFM is a 5050 JV between GE and Snecma EA is a 5050 JV between GE and Pratt amp Whitney
55
Solving our customers toughest challenges
Airline direct operating costs
Fuel
40
Delays and cancellations
8
Maintenance
9
Services analytics offerings
Flight Efficiency Services
Performance-based Navigation
Analytics-enabled workscoping
Product and Services strategy
Provide lowest cost-of-ownership through OEM technology
Lead in on-wing reliability
Lead in technology
Best-in-class fuel burn and retention
Engine diagnostic and prognostics
Intelligent Operations
$200Byr
$40Byr
Taleris is a 5050 JV between GE and Accenture
+
56
Services technologies hellip improving value through the lifecycle
Installed base (lsquo13) Upgrades
Fuel Burn improvement
Time- on-wing
8 8 2x
8 3 3x
5 2 2x
A culture of technology insertion Tailored to customer wants
CFM is a 5050 JV between GE and Snecma
Risk transfer $hour coverage
Overhaul Time and material
Materials New used and repaired parts
Asset optimization TRUEngineTM program diagnostics
+
CF6-80C (lsquo86 EIS)
GE90 (lsquo95 EIS)
CFM56 (lsquo84 EIS)
3000
1500
18500
57
Minds amp Machines at GE Aviation
+ Ex
po
sure
Operator A Operator B Part Temperature Cruise Takeoff
Te
mp
era
ture
Threshold
Climb
1000+ software engineers GE Software COE
6300 applied engineers GE Aviation
Data Secure continuous accessible
Physics Apply engine expertise
+ =
Customer and GE benefits
+
Statistics Unlock trends segment
ldquoPhysicsrdquo ldquoAnalyticsrdquo
Time-on-wing
Reliability and availability
Fuel cost
Repair and overhaul
58
Lead in on-wing reliability
Applied analytics to detect engines at risk of removal
Cu
mu
lati
ve
dis
tre
ss
Cycles
Recent successes hellip
CFM is a 5050 JV between GE and Snecma
Segment
GE90
120 CFM56
40 Water wash
$7Myr fuel savings at one GE90 operator
removals saved
removals saved
Nominal environment
Abate
Harsh environment
59
$30MMyr savings
Flight Efficiency Services App
Performance-based Navigation App
Attacking fuel spend with analytics
Joint marketing hellip
ldquoPerfect flightrdquo video
In the news
Newsletter
Oil amp Gas Brian Palmer - Vice President Measurement amp Control Solutions
- In current role since 2010
- 29 years with GE
61
Oil amp Gas Services
Software amp Services as a key differentiator
Key metrics Strategic imperatives ($ in billions)
13 14E
++
Backlog $58 ++
$83 Revenue
1
2
3
4
Deliver on customer value + Customer co-creation
+ Outcome based solutions
Grow $installed base + Drive analytics amp PredixTM
+ Penetrate the installed base
Expand margins + More software and contract offerings
+ Continue to grow backlog double digits
+ Partnerships to accelerate journeyhellip
Meridium
Improve service execution amp delivery + Full lifecycle productivity
+ Simplifying structure
IB growing TMS and Subsea with 13K+ units Software investments creating new IB revenue
streams in addition to traditional parts and service New contractual (CSA) offerings developedlaunched
Installed base dynamics
62
Oil amp gas industry is faced with expanding challenges GE software data and analytics are uniquely positioned to help
Customer challenges Equipment Availability
Equipment Reliability
Operational Efficiency
Production Optimization
Industrial Internet hellip turning data into actionable information Enable no unplanned downtime
Increasing complex operations
Tighter regulations
Skills gap
Machines with data potential
Sources GE OampG analysis based on Wood Mackenzie Rystad Barclays IHS CERA PFC Energy IEA httpwwwgecomstoriesoil-and-gas-innovation Oil and Gas Facilities 2013 httpwwwspeorgogfprintarchives201306
$800B+ Annual industry CAPEX (6-8 growth per year)
$150MM Average annual cost for mid-size LNG facility due to unplanned downtime
5-10 Range of OampG industryrsquos estimated downtime
63
Predixtrade hellip Unified Operations Improved throughput connecting people machines and data
Customer outcomes
Unified Operations ndash A customer co-creation success story
Enhanced safety
Increased availability
Operational visibility
Efficient workforce enablement
Partnering with to tackle these industry challenges and create a solution that increases production and lowers cost driving improved customer outcomes
Unified Customer
Portal
129000 Pieces of equipment in operation globally in
the industry
50 Industry retirement rate in next 10 years
7X Industry fatality rate
above norm
people
machines
data
64
FieldVantagetrade hellip Asset Performance Management (APM) for Onshore
APM ndash Bringing GE expertise from all industries to deliver system level value
Customer outcomes
Enhanced safety
Operational visibility
Improved availability
Optimized performance
Monitoring amp
Diagnostics
Condition Based
Maintenance
Real time Operations
Intelligence
Asset LifeCycle
Management
bull Providing field level visibility and optimization across multiple forms of artificial lift technologies bull Integrated insights provided through common single scalable platform bull 2 year service contract on 200+ wells
Solution Overview
39 NAM OampG Upstream Vehicle Fatalities
hellipby improving
116K New wells in 2014
5 Days Back to production (NAM Avg)
1MM+ Artificially Lifted Wells (Global)
65
Intelligent Pipeline hellip Operations optimization software for pipelines
2TB of data for every
30K miles of pipeline
3-4 annual growth
2MMmiles of
pipelines globally
$40B invested by pipeline companies per year
Source 2TB - Average data volume based on GE internal analysis of multiple pipeline customers Rest - GE OampG analysis based on Douglas Westwood IHS CERA FERC CIA World Factbook PII Pipeline Database (Summary of Infield Systems Global Data DOT databases)
bull 5 year service contract
bull Setting the industry standards for
pipelines real-time intelligence
First customer Customer outcomes
Enhanced safety Proactive versus reactive decisions
Visibility Complete geospatial view and situational awareness
Optimized Ops Effective data driven resource allocation
Efficient OampM Prioritize spending for assets and resources
Moving to proactive solutions with our customers
66
Customer Benefits
Zero unplanned downtime
Increased availability
Increased reliability
Decreased production losses
$14B Additional opportunity driven by
availability and reliability increase (1 of capacity)
Industry Opportunities
Outcome base service bonus
GE Productivity Improvements
Inventory through parts flow optimization
Outage durationfrequency driven by condition- based maintenance
Services Optimization hellip Creating optimal value for GE equipment customers
Journey to 100 reliability through our Contractual Services Agreements (CSA)
Transportation Pete McCabe - Vice President Global Services amp Solutions
- In current role since 2013
- 20 years with GE
68
Transportation Services ($ in billions)
13 14E
+
Revenue $28
Backlog $12B+ +
1
2
3
4
Deliver on customer value
+ Outcomes - velocity fuel reliability
+ System solutions ndash RailConnectTM 360
Grow $installed base
+ Increase penetration ndash Parts amp Smarts
+ Extend asset life ndash modernizations
+ Broaden software solutions ndash rOS
Expand margins
+ Deploy advanced analytics ndash PredixTM
Improve service execution amp delivery
+ Enhance commercial capabilities
+ Expand domain amp IT project expertise
Installed base dynamics
1000+ Tier 4-compliant loco orders
~650 locomotives un-parking in rsquo14
450 new locomotives in South Africa
Key metrics Services imperatives
69
Railroad industry is faced with expanding challenges and customers require a solution provider
Customer challenges
RailConnecttrade360 delivering customer focused outcomes
Asset utilization
Capacity limited
Resource constraints
Ops Complexity
$80B+ N American operating revenue (~4 growth)
7 year high Traffic volumes require unparalleled investment
$56B Annual industrial benefit through 1 improvement
Sources American Association of Railroads (AAR) 2013 industry statistics
70
Asset optimization ndash fuel efficiency
Customer Dynamics RailConnect 360 ndash Trip Optimizer
bull Real-time embedded optimization algorithms
bull Advanced data acquisition enabling train health monitoring
bull Automated train handling reduces wheel amp rail wear
bull $1M diesel locoyear 22K GE locos
bull Emissions
bull Huge operating variation operators trains topography
Trip Optimizer with CSX
Implementation on 1500 CSX locomotives
Reduced fuel use by 7 on average Decreased 3rd largest operating expense
- CSX Sustainability Report 2013
Tr ip Opt imizer Quick Star t Guide (1) Train Speed is available on the speedometer during an active trip during auto and Manual Control
(2) Trip Plan Speed displays a green Trip plan speed pointer on the speed indicator dial in Auto and Manual
modes of operation
(3) Trip Optimizer Status Box is visible when Trip Optimizer system is ACTIVE and provides three types of messages Status Request for Operator InputAction and Error
(4) TrackCivil Speed Limit plot line is Cyan shown the entire horizontal range data permitting
(5) Train Speed (Actual) plot line is White shown only from the head of the train on back
(6) Train Head is shown as a thick White line to allow the operator to see the position of the Train relative to the
terrain The horizontal scale of the rolling chart is zero-referenced to the Head of the Train (corresponds to the forward-facing end of the lead locomotive)
(7) Train Milepost has an associated location and name Its representation on the screen consists of a graphical
pointer and an identifier
(8) OMB Message Box displays operator messages
(9) Consist Notches displays Lead and Trailing locomotive notches
(10) Throttle Handle Notch represents the Master Control-ler handle position During TO Auto Control it will indicate
N8 as TO automatic control requires notch eight (N8) set-ting
(11) Auto Control Notch displays on screen as a White box to denote TO Auto Control engagement and throttle out-
put control
(12) Trip Plan Speed has a Green plot line shown as the entire horizontal range when available and data permit-
ting
(13) Manual Control Zones is shown as a Gray rectangle on the terrain plot extending across the entire vertical range of this section of the chart
(14) Planned Braking depicts Blue areas where Trip Opti-mizer expects that dynamic andor air braking will be
required to maintain the plan speed
(15) Key Locations are softkey states that constitute a unique mapping of functionality to key locations
1 How do I get started To start a trip you will push the Trip Optimizer key on the Main operator screen
2 Do I have to be stopped to request a trip through Trip Optimizer It is preferred to perform a trip init at zero speed however unless otherwise provided by
local ruleinstruction maximum speed for initialization is 15 mph
3 I have performed the Trip Init process and see the rolling map When will I get prompted for Auto Control
Auto Control will become available when the speed is greater than 12 mph and the Throttle handle is N1 or higher
4 Why does the Locomotive Status matter to Trip Optimizer Trip Optimizer will always monitor in train forces speed braking and fuel efficiency To best optimize all of these Train dynamics Trip Optimizer must be told by the operator what the
status of each locomotive in the train The three modes are defined as follows
Running The locomotive is fully operational and is used for calculating TPOB
Isolated The locomotive is either shut-down or is mechanically isolated from produc-
ing Tractive Effort
DB Cutout The locomotive has no Dynamic Braking available but is being used for
producing Tractive Effort
5 What is the recommended way to disengage Auto Control The most fuel efficient way is to decrease the throttle notches in 2 second intervals until
you get to the required speed
6 Trip Optimizer is disengaging from Auto mode and tells the opera-tor Manual Control is required I am already in Notch 8 throttle
What do I do
Press the Current Throttle key on the screen Moving the Master Controller from Notch 8 to
Notch 7 and back could result in un-safe train handling practices
7 Why does Trip Optimizer not always travel at Track speed Trip Optimizer will use the forces of the train and momentum to achieve the optimal speed to save fuel In some cases Idle will be used to meet a planned slow order Trip Optimizer is
always looking out a few miles ahead to plan for the ideal speed while maintaining safe train handling
8 How do I report an inaccuracy on the civil speed limits posted on the rolling map
Contract your Road Manager to report the case
9 The dispatcher has issued an enroute slow order Will Trip Opti-
mizer automatically take this into account
No If an enroute slow order is issued it will be the train crewrsquos responsibility to protect the
train in Manual mode during this affected zone
10 Why does Trip Optimizer automatically end the trip when I still have distance remaining before the preset crew change point
The subdivision has a GPS controlled end point that will automatically end the trip based off of recommendations from the railroad
Follow the steps on the backside of this document to walk you through performing a Trip Init
Trip Optimizer Top Ten List
GE Proprietary Information The information contained in this document is GE Proprietary Information and is disclosed in confidence It is the property of GE and shall not be used disclosed to others or repro-
duced without the express written consent of GE If consent is given for reproduction in whole or in part this notice and the notice set forth on each page of this document shall appear in any such reproduction in whole or in part The information contained in this document may also be controlled by the US export control laws Unauthorized export or re-export is
prohibited Document 5005807 Rev mdash
Before engaging the TO AUTO throttle the operator must meet certain train conditions and under-stand the data displayed on the Trip Optimizer Running Screen
Doc No 5005890 Rev -
71
Operations optimization ndash velocity
Movement Planner with Norfolk Southern
RailConnect 360 - Movement Planner
bull Systems problem hellip beyond human capabilities
bull Majority single track
bull Point solutions have plateaued
bull Integrated suite of day of operations software apps
bull Predixtrade platform - connectivity big data and security
bull Advanced algorithms and automatic routing
bull Proven in class 1 revenue service
Norfolk Southern and Movement Planner
Automated routing decisions
10+ increase in velocity
50+ reduction in expired crews Significant improvement in
schedule adherence
1MPH = ~$200MM estimated
annual savings in capital amp expenses
Based on 3 year study in NS GA division
Customer Dynamics
72
bull Co-development GE Transportation amp GE Intelligent Platforms
minus Enhanced sensor coverage
minus Improved data acquisition higher resolution
minus Advanced analytics
bull Asset specific insight drives fault reduction and enables CBM
(SmartSignal)
bull 20K+ overhauls in backlog
bull OH interval based on average expected condition
bull $1B+ capital expenditure in North America every year
Impact Reduced unplanned
downtime amp avoid road failures
Reduce unscheduled material consumption
Extended periodicity and associated expenses
ldquoPhysicsrdquo change
Real Time Engine Performance
Bearing Temp
Bearing Temp
Load
Ambient
To
da
y
To
mo
rro
w
Alarm trigger
Savings
CSA ndash shared productivity
Lifecycle Cost Dynamics ndash Engine Overhauls RailConnect 360 ndash Advanced Analytics
GErsquos 1 Jamie Miller - Senior Vice President Chief Information Officer
- In current role since 2013
- 9 years with GE
74
Digital opportunity
Simplifying structure
More valuable GE resources with fully integrated approach
+ Utilize data from products
+ Field services tools
+ CRM configurators
+ Brilliant Factory
Benefits
ERPmanufacturing 90
Data Centers 80
Applications 30
Shared Services 65
Cloud 70
Product Cost
RampD
SGampA
+ Engineering tools
+ Shared Services GL
+ Cyber Security
IT plays
-a)
(a - Target percent of new applications that are Cloud enabled
~$94B
Industrial cost
75
Three opportunities to power manufacturing
Digital Foundation 1
Unlocking Big Data
minus Sourcing
minus Productivity
2
Powering the Brilliant Factory
minus Design for manufacturing
minus Sensor enablement
minus Plantsupply chain optimization
3
minus 90 reduction in ERPs
Supply Chain Network
Virtual Mfg
Virtual Product Design
76
Product Cost ERP investments paying off
Inventory turns 6x 7x
Shipment on time 58 85
Foundation for business to deliver $1B+ savings over past 5 years
GE Healthcare
of revenue on target ERP ~75
~95
2009 Today
Today 219 ERPs 2016 34 ERPs
GE Water
2008 Today
22
1
of ERPs
SGampA of sales ~10 pts
Past dues 60
Finance headcount 50
77
Product Cost Using big data to run GE
Ingest Store Clean Consume
1 OampG data lake $8B direct materials buy
Real time More cheaper Faster GE-wide Analytics Data science
$60B total material buy across GE hellip $1B+ cash amp deflation opportunities
bull 23 source systems
bull Full visibility ndash 3 weeks
bull Commodity part supplier
bull Data lake technology
bull Machine learning for data cleansing
bull EM PampW underway (Alstom)
Oil amp Gas
Xxxxx Xxxxx Xxxxx xxxxx
78
Product Cost Technology powering the Brilliant Factory
20 NPI cycle hellip 20 efficiency
16 pilots launched hellip Fastworks 2020 Vision
FastWorks approach
Virtual design for manufacturing
30 NPI cycle time
Eliminated quality escapes
Wilmington NC
Aviation Machining
Factory optimization
25 productivity
PampE avoidance Greenville SC
PampW Nozzle Cell
machine downtime
25 opportunity
Sensor Enablement
Grove City PA
Transportation Remanufacturing
79
Smart Outage Full deployment at PGS
Changing the way we deliver Services
On track for $1B CSA productivity over 3 years and 10 customer uptime
+ +
Predictive Workscope Aviation 4 customers
full roll-out mid-2015
=
Field services optimization
Predictive workscope
Next generation modeling
Advanced technology
Accelerating productivity
80
We can do more ldquoSrdquo with less ldquoG+Ardquo
45 win rate
80 in quote time
5400+ SalesComm Ops hoursweek
QuickQuote
40K+ GE Commercial FTE
Highly manual long-cycle-time
More ldquoshots on goalrdquo lower cost
Investing in digital tools for commercial teams
Wrap up
82
Value for investors
Payback through most reliable revenue source Services
+ Increase revenue growth
+ Improve margins
+ CSA productivity
Funded software amp analytics through simplification amp reallocation
Potential upside beyond the GE installed base
Scale amp intellect Return on investment
1
2
3
GE Software COE
+ COE can accomplish scale hellip none of
our businesses could do this on their
own hellip attract talent amp spread ideas
+ Advantage to being an early mover hellip
right partnerships amp scale
+ Changing GE Industrial DNA hellip
greater impact from digital amp
analytical investments
83
Why GE
+ More valuable portfolio hellip 75 Industrial while growing EPS
+ Tangible evidence of winning NPI hellip Tier 4 LEAP etc
+ Strong amp diversified global footprint hellip best-in-class
+ Transforming service for next generation of growth
+ Culture of simplification impacting every part of GE
LEAP is a trademark of CFM International
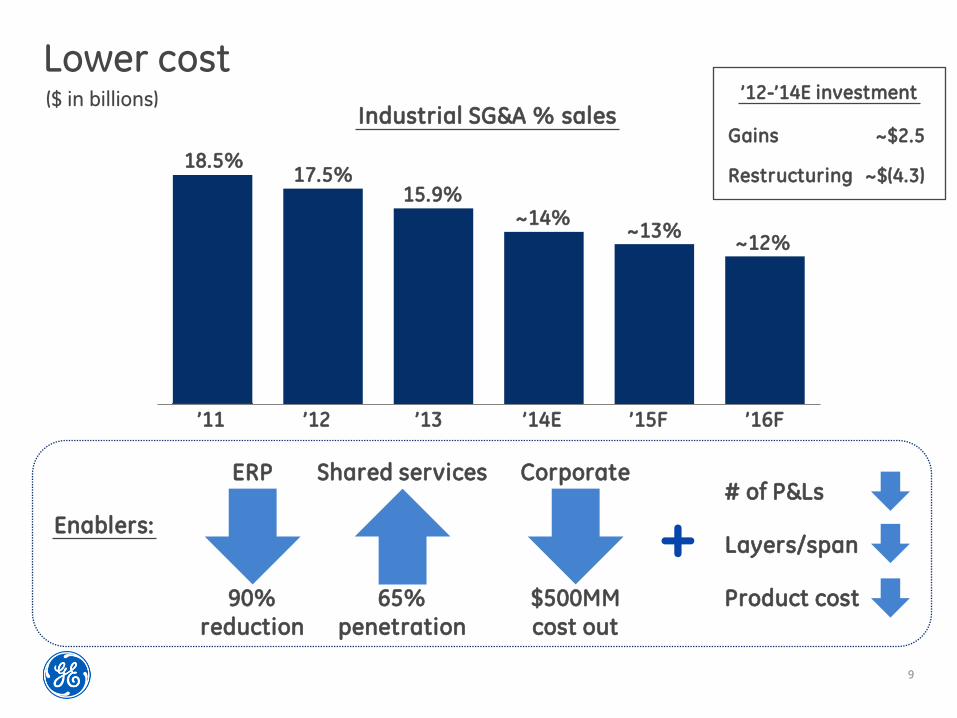
9
Lower cost
Industrial SGampA sales
175
rsquo12
~12
159 ~14
rsquo13 rsquo14E rsquo16F rsquo15F
~13
($ in billions)
rsquo11
185
Enablers
ERP
90 reduction
Shared services
65 penetration
Corporate
$500MM cost out
+ of PampLs
Layersspan
Product cost
rsquo12-rsquo14E investment
Gains ~$25
Restructuring ~$(43)
10
Technology is evolving
PHYSICAL ANALYTICAL
Multiple materials in complex systemshellip hundreds of patents in each product
Operating with high efficiency amp durability in extreme conditions
1 gas turbine compressor blade monitoring potential 500 gigabytes per day
Combination of physical amp analytical drives next evolution of services
Customers will value data because it improves their efficiency
GE is well positioned to lead this wave of change
Investors will benefit through services growth amp margins + product share + IT-driven efficiency
1
2
3
4
Key messages
+
11
Transforming services
bull Partners amp field
technicians 80rsquos
Big iron
Airlines 1 fuel $2-3B
Utility 1 fuel $4-5B
Oil amp Gas 1 uptime $5-7B
Healthcare 1 productivity $4-5B
Transportation 1 mile velocity $1-2B
Driving customer outcomes
bull Risk sharing
service contract 00rsquos
CSA
bull Asset amp
operations
optimization
Today
bull Science applied
to repairs amp
upgrades 90rsquos
Repair
Power of 1
Annual impact-a)
Small changes in hellip fuel maintenance uptime productivity flexibility safety
labor effectiveness hellip have a big
impact on profitability
(a - Global industry estimates based on ldquoIndustrial Internet Pushing the Boundaries of Minds amp Machinesrdquo ndash Nov 26 2012
Analytics
12
GE leadership
Large high-tech installed base
Customer trust amp connection hellip ~$180B services backlog
Deep domain knowledge
GE advantages What it takes to win
bull Sensors
bull Service robotics
bull Connectivity
Enabling technologies
bull Connected IB
bull Physicsmaterials bull Smart devices
bull Global reach
Installed base
+
+
bull Software capability bull Industrial big data
bull Operating platform
bull Security
Data amp analytics Attracting new talent hellip
ldquohorizontal capabilityrdquo
Connecting domain amp data hellip CSA
Operating platform in place (PredixTM)
Large research capability
Industry partnerships
Collecting 50MM data elements
GE has all essential elements
Have
Have
Investing
13
Improving the service model
Asset optimization
Operations optimization
CSA productivity
CSA + Connected asset + Software revenue value ($IB) outcome sales
Data-driven execution
Maximize performance with no unplanned downtime
Increased system efficiency across GE
amp non-GE assets
Optimize material amp repair cycles
across IB
Make versus buy hellip build internal team
Launch new offerings hellip PredictivityTM
Build on existing CSA relationships hellip ldquowin-winrdquo
Develop a broader ecosystem
1
2
3
4
Investments 2010-14
Focus of innovation
How we execute
14
Asset performance management
Impact for GE hellip $IB productivity for customers hellip velocity productivity
SENSORSANALYTICS
On-site oil analysis Predict remaining life Prevent road failures
SERVICE ROBOTICS
Productivity safety Remote monitoring Tough environment
AUTOMATED DECISIONING
Optimize yard ops Reduce dwell 10 Depart on time up 50
ADVANCED CONTROLS
Auto Train Operation 10 fuel savings
15
Impacting GErsquos 1
$94B of cost
$12B of working capital
$20B of PampE investments
GErsquos 1
Analytics amp
security
IT investment ($2B+year)
+
Reduce structure
Lower product cost
Improve margins
Enhance engineering productivity
Faster amp safer
Impact
Every Industrial company a Software amp Analytical company
16
Investor value
Increase services growth rate
+ More $installed base
+ $08B PredictivityTM solutions revenue growing to $4-5B
+ Penetrate aged GE fleet
+ Grow beyond the GE IB
Improve services margins
+ CSA productivity
+ Improve quality
Potential for industry value
+ Scale beyond GE installed base Backlog Revenue Margins
Services franchise
~$180B
~$45B
~30
Value creation
+
1
2
3
Software amp analytics accelerate services growth margins amp returns
Revenue growth ~5 Margin expansion ~50 bps Limited by IB growth
Historic performance
Services overview
18
Services growth
05 08 11 13
($ in billions)
Revenue
~26 ~30
OP
GE advantages
+ Installed base
+ Technology
+ CSA model
+ Footprint amp scale
+ Software COE
+ Fleet data
$27
$35
$42 $45
Services imperatives
Backlog
1
2
3
Deliver on customer value + Link services to outcomes + Global deployment
Grow $installed base + Drive analytics amp PredixTM value + Penetrate aged installed base
Expand margins + Leverage analytics to manage
performance + Invest in productivity tools
Improve service execution amp delivery + Enhance commercial capabilities + Increase field services capability
Spread ideas across GE
$87 $121 $147 $180
4
5
19
Services Council
Driving differentiated advantage
Cross-business initiatives
20+ services leaders
Teams aligned to 9 themes
Quarterly executive updates hellip operational rigor
Spreading ideas hellip
bull Core growth
bull Operations
bull Tools + process
bull CSA excellence
Data +
Outcomes
bull PredixTM + Cloud
bull PredictivityTM solutions
bull Strategic alliances + BD
Hardware amp domain expertise
Software analytics based
Healthcare Inspection technology
Aviation Repair technology
Power amp Water Global footprint
bull Multimodal ndash service amp repair shops
bull Customer training centers
bull Additive manufacturing
bull Robotic welding
bull Advanced coatings
bull Parts inspection amp measurement
bull Condition-based maintenance
Pune India
20
Enabling technologies Service Robotics Sensing amp Controls Advanced Manufacturing
Inspection Repair Mobile Tools
Launch amp learn hellip then accelerate to all GE businesses
Automated adaptive + Productivity + Less downtime
High tech integrated + Lower fuel usage + Higher efficiency
Productivity safety + Repetitive tasks + Tough environment
Additive new materials + Repair vs scrap + Longer service life
Deployable fast accurate + More digital data + Less downtime
Connected digital + Instant expert access + Lower service costs
21
Increase value of CSA
Benefits for Customers Benefits for GE
Monitoring amp diagnostics
$180B Services backlog
Fuel efficiency
Hardware amp software upgrades
Condition-based work scope
Mobile amp analytical tools
Material productivity
Optimized asset performance
Predictive analytics ndash lower downtime
More output
Lower costs
Lower emissions
Better payback on hardware upgrades
Instant software upgrade capability
Shorter duration outages
Less material usage
Ask an Expert ndash COE
Field Service productivity
Analytics driven parts life extension + performance
Repair vs scrap
22
Segment services dynamics (Services revenue $ in billions)
Power amp Water $125
Oil amp Gas $83
Energy Management
2013
$21
+ Sustained passenger growth
+ Improving airline profitability
+ Upgrades amp analytics
Aviation $108
+ Growth markets strong
+ Improving HCIT
minus Developed challenging
Healthcare $80
+ North America utilization
+ Analytics penetration
minus Mining parts
Transportation
$28
2013
2013
2013
2013
2013
2013
+ Continued AGP growth
+ Upgrades amp analytics
Europe
+ Strong Subsea
+ MampC improving
+ Analytics penetration
+ Marine offshore
minus Mining amp motor repairs
23
Presentation
Common capability Software COE
Analytics commercialization
Bill Ruh
Kate Johnson
Business execution
Strategy overview
Customer outcomes
Examples of analytics driving growth amp productivity
Competitive advantage
Power amp Water
Healthcare
Aviation
Oil amp Gas
Transportation
Paul McElhinney
Jan De Witte
Kevin McAllister
Brian Palmer
Pete McCabe
Common capability GErsquos 1 Jamie Miller
Software amp PredixTM
Bill Ruh - VP Global Software Center
- 3 years with GE
- 32 years of industry experience
Kate Johnson - VP GE Commercial Officer
- 1 year with GE
- 15 years of industry experience
25
The Industrial Internet
3 Hyper connectivity a living network of the worldrsquos machines data amp people
Internet
Increasing system intelligence through embedded software hellip advanced sensors
controls and software applications
Brilliant Machines
Democratization of data hellip high frequency real-time data
Big Data
Predictive algorithms hellip physics-based analytics hellip deep domain expertise on big industrial data
Analytics
People at work Connecting people at work or on
the move Supporting more
intelligent design higher service
quality operations amp safety
maintenance
1
2
3
4
5
26
61
45
31 28 31 40 42
29
29
45 63
56 56
47 45
41
10 6 6
16 9 10 9
24
Software outlook Customer survey Importance of
Big Data analytics relative to other priorities
Source Accenture 2015 Trend Report Gartner Big Data Survey
Aviation
3 3 3 3 6
Wind
Power Generation
Power Distribution
Oil amp Gas
Rail
Manufacturing
Healthcare
Highest priority Within the top 3 priorities Within the top 5 priorities Not a top priority
Opex is becoming a deciding
factor for IT investments as
80 of budget is allocated to
managing and running
complex technologies Source Gartner
Advanced analytics and
analytical applications
expected to see double digit
revenue growth Source Gartner
APM market category
expected to reach $300B
by 2020 Source Gartner
27
Industrial customersrsquo perspective Survey of GErsquos customers regarding applications
Real-Time Operator Intelligence
Remote Monitoring amp Diagnostics
Condition-Based Maintenance
Asset Lifecycle Management
Schedule Optimization
Energy Management
Process Control Automation
Field Force Automation 32
38
42
43
49
59
66
70 Tailor Pre-Built Applications
Have A Systems Integrator Build
Your Apps
Build My Own Custom Apps 15
54
85
HOW do you want to consume it WHAT functionality is most valuable
Asset performance management is the killer industrial app
28
What industrial customers want
SDM
SDM
SDM
SDM SDM
Software Defined Machines (SDMs)
ldquoLink up all my assets and devicesrdquo
REAL-TIME
OPERATIONAL
INTELLIGENCE
CONDITION-
BASED
MONITORING
ASSET LIFECYCLE
MANAGEMENT
MONITORING amp
DIAGNOSTICS
Industrial Apps
SDM Non-GE Assets enabled by PredixTM Machine SDM
SDM GE Assets enabled by PredixTM Machine SDM
PredixTM powers Asset Performance Management (APM)
29
Insights into value
Improving safety and
productivity across 15K miles
of interstate natural gas
pipelines
Potential Savings
77 gallons of fuel and 1628
lbs of CO2 per approach
10 increase in network
velocity 50 reduction in
expired crews amp significant
improvements in on-time
performance
Up to 4 increase in power
output across 283 wind
turbines hellip 40+ GWhr annual
increase
Asset Performance Management (APM)
REAL-TIME OPERATIONAL
INTELLIGENCE
CONDITION-BASED
MONITORING
ASSET LIFECYCLE MANAGEMENT
MONITORING amp
DIAGNOSTICS
Operations Optimization
INSIGHT PROCESS
INTEGRATION
AUTOMATION COLLABORATION
PredixTM Platform
PredixTM Machine PredixTM Net
GE
Non-GE
PredixTM Asset PredixTM Insight
PredixTM Fabric PredixTM Core
PredixTM Experience
Predixtrade hellip the GE advantage
Release in 2015
Public Cloud Private Cloud
Commercially available to connect more machines more data amp more people
TR
AN
SF
OR
MS
PO
WE
RS
PredictivityTM Solutions
30
Predictivitytrade hellip app factory
Asset optimization (28)
Operations optimization (14)
Productivity tools (77)
Approach Development process
Agile amp Extreme Programming
Design Center for delivering
compelling user interface
Cyber security Blue team to build
and Red team to test
90-120 day service engagement to production roll out
+
+
+
Co-innovation process to design
build transfer and iterate
Actionable insight on equipment based
on physics and analytic modeling
with industrial data
Outcome based process improvements
to plants pipelines fleets fields facilities
grids shops
Increase service throughput efficiency
and quality at optimized cost of
delivery
Delivering industry apps at speed and scale
31
World-class Software amp Analytics organization
Investing in Leadership Talent
Colin Parris (IBM)
SW Research
Co-located SW CTOs for business alignment
D Bartlett
(IBM)
Aviation
World-class technical resources
Computational amp analytics scientists
Platform developers
Software engineers
~10000
1000+ Biz
COE
Product Dev Software CTO
Brad Surak (SAP)
Harel Kodesh (Microsoft
Start Up Veteran)
Trans S Chotai
(HP)
OampG J Demesa
(Siemens)
PampW G Bell
(ServiceSource)
EM J Stone
(SAP)
HC E Eryurek
(GE)
+
+
- Cyber UX Data Science Agile development
Four deep core competencies ecosystem
1
Leading edge platform + world-
class ecosystem 2
Advanced research for building
the future 3
Advanced process to drive adoption amp enablement
4
Software Site
Organization
Technology amp Ecosystem
32
Wurldtech protecting critical infrastructure
World-class cyber security to operate assets + operations safely
About A GE Company acquired in May 2014 providing top cyber talent
Capability Assess protect amp certify critical infrastructure from cyber attack
Key Customers 4 of 6 top global OampG companies 9 of top 10 automation vendors
Security enhancements delivered through PredixTM and GE Products
Certify GE and non-GE products and customer environments
Identify vulnerabilities in OT products (GE and 3rd party)
Assess and prioritize risks for system operators
Achilles Industrial Next Gen Firewall to inspect and control
Industrial network traffic
Leverage industry leading threat intelligence
Protect operational
environments
Secure amp certify industrial products
Assess products amp operations for vulnerabilities
33
Partnerships amp Alliances
Intel ATampT AWS Cisco others
Venture Capital
Mergers amp Acquisitions
ThetaRay Mocana Frost
Strategic Moves
Wurldtech Austin Digital
Acquire capability to fill gaps
Pivotal Softbank Industrial Internet Consortium
Industrial internet ecosystem
Industry Ecosphere
Establish interoperable amp scalable solutions
Co-development amp go-to-market
Accelerate innovation amp success
Positioned to create value
Open PredixTM beyond GE
GE will sell
+ + Connected devices
Data Under Management
Performance Applications
PredixTM Machine Services
PredixTM Data Services
PredixTM Asset Services
Connect assets regardless of vendor or
vintage and provide value-added services
Aggregate and analyze data to produce
actionable business insights
Sell horizontal apps that maximize return
on assets and people
1
2
3
34
Competitive advantage
$1T Connected
Machines
managed by GE
replacement value
10M Sensors
collecting
50M Data
Elements
$20B Potential
Annual Customer Savings
50B Machines will be connected on the internet by 2020
2X Industrial data growth within next 10 years
Big Iron + Big Data = Big Outcomes
INDUSTRY GE
35
New ways to sell Services
2 Making Markets Different Economics
3 Co-creation amp Agile Development
4 Solution Architecture
5 Value Based Deal Shapes
6 New Industry Ecosystems
1 New Buyers and Influencers
GE Commercial Center of Excellence
Needs Target Architect Close
Qualification amp Pipeline Management
Sales Process
HireTrain Community of Experts
Enablement Toolkit
36
Accelerating time to value across channels
APM Subscription Services
Enterprise Analytics Projects
Upgrade value in CSAs
GE Sales Model
Existing Services sales team
New standalone software sales specialists
New outcome sellers + existing service sales team
Sales
acceleration
Expert SWAT
teams to
support deal
SW experts compelling
offer target one outcome
to land and expand
Ecosystem partners
SW COE app factory
Offering RMampD in CSA upside
and productivity Per well subscription
Enterprise SW deal
solution co-creation
ReliabilityMaxtrade FieldVantageTM Intelligent PipelineTM
GE OampG Example
Market
Opportunity $2B $600MM $27B
37
Measuring commercial success
Services revenue
Past Future
~5
+
rsquo13 rsquo17F
Assets under management $1T+ ++
PredictivityTM solutions revenue $08B ~$4-5B
Services backlog $180B ++
bull Adding more value to existing service relationships hellip training team to get more out of the installed base
bull Creating new revenue streams and building new commercial skills and incentive plans to accelerate growth
Outcome sellers solution architects product management amp marketing
bull Cultivate ecosystem to help accelerate commercially with access to CIOCTO relationships and system integration skills
Power amp Water Paul McElhinney - President amp CEO Power
Generation Services
- In current role since May 2014
- 26 years with GE
39
Power amp Water Services
Growing services amp delivering greater customer value
Key metrics Services imperatives ($ in billions)
13 14E
+
Backlog $53 +
Revenue $125
Installed base dynamics
1
2
3
4
Deliver on customer value + Develop flexible solutions
+ Reduce customer operating cost
Grow $installed base + Maximize impact of Alstom alliance + Invest in new service offerings
Expand margins + Tech upgrades amp software solutions + Outage excellence
Improve service execution amp delivery + Improved customer service levels
+ Optimize field service amp repair network
Unit growth up ~24X from 2008
Strong DP amp Wind growthhellip up ~1Kyear
~4000+ gas turbines in service
40
Global power industry is facing complex challengeshellip Offering innovative solutions to address customersrsquo needs
Fuel price uncertainty
Increasing regulation
Slow demand growth
Aging installed base
~15 years Average age of ~4K global GE gas turbines
Output
Efficiency
Reliability
Availability
Flexibility
Improving customersrsquo outcomes while decreasing costs
~$7B
Customer challenges
~$8B
~$2B
~$1B
~$2B
GE Predictivitytrade solutions amp industry benefit
~60+ Increase in US natural gas price since 2012
~(30) Thermal capacity in Europe since lsquorsquo08
Based on 10 year NPV
41
Investing in technology
Addressing multiple customer value levers
Advanced Gas Path (AGP) Industry leading output hellip up to +64 Industry leading efficiency hellip up to +18 Extends asset amp parts life hellip 96K hours
1
Op Flex Delivers flexibility to costs amp revenue Reduces start up time amp fuel consumption Expands fuel source opportunity
3
Dry Low NOx 26+ (DLN) Reduces NOx emissions by 40 Delivers industry leading flexibility Increases maintenance intervals to ~1250 starts
2
42
Power FlexEfficiencytrade Advanced Gas Path
Expanding the operating envelope
Ambient Temperature
Ou
tpu
t (M
W)
Op Flex
7FA03 baseline
AGP
+ ndash
+
Combining hardware and software hellip creating 2X the value
$17
$30
Op Flex
Average Customer Annual Value Per Unit ($MM)
Improving customer outcomes
AGP (Hardware)
AGP PredictivityTM
Solution
125+ AGPs with software sold to date
650000+ operating hours to date
43
Wind PowerUp hellip generating more output
Customer Outcome Up to 4
increase in power output across 283
wind turbines hellip 40+ GWhr annual increase ldquoThe PowerUp system offers a great chance for owners like us who are investing literally billions of dollars in this market to try and get more production out of existing assets GE took a lot of risk out of this for usrdquo
ndash Patrick Woodson CEO EON Climate amp Renewables
Opportunity for up to
20 more profit from up to
5 more output
A performance based
cooperative approach
with a holistic view of the
assets system and network
Flexible payment options
aligned to customer needs
+1400 turbines under contract since launch
Customer opportunity
Software enabled
Flexible platform
Proven results
Scale out
1
2
3
Healthcare Jan De Witte - President amp CEO Healthcare IT
- In current role since 2011
- 15 years with GE
45
Healthcare Services
Delivering value = higher quality outcomes at lower cost
Key metrics Services imperatives ($ in billions)
Backlog $11 +
Installed base dynamics
1
2
3
4
Deliver on customer value + Asset and workflow optimization + Analytics around EMRs amp Devices
Grow $installed base
+ Quality and analytics offerings + Solutions architecture amp delivery
Expand margins + Remote service amp SaaS models + Field services productivity Improve service execution amp delivery + Remote monitoring technologies + Field force deployment optimization
Emerging markets infrastructure build
Mature markets quality upgrades
ACA amp Enterprise Solutions IT penetration
13 14E
=+ Revenue $80
46
Healthcare industry shifting to value-based care GE software analytics and services are uniquely positioned to help
Customer challenges
Integrated Care Solutions hellip turning data into actionable insight Improving healthcare outcomes
Diagnostic quality
Patient-centric care
System profitability
Chronic Disease Management
Sources Institute of Medicine 2013 Porter Research 2013 McKinsey IHS Global Insight
29 Healthcare spend wasted each year
$260B Annual value creation through healthcare IT
59 US lives covered in value-based care model by 2015
Clinical Quality
Financial Performance
Operational Efficiency
Configurable Workflows
47
GEHC Software portfolio positioned along main outcome drivers for care systems
Diagnostic speed amp confidence
Productive care pathways
Wellness amp chronic disease management
Risk amp margin management
Costworkforce optimization
Population Health Management
Workflow
Archiving
Visualization
Financial Management
Care Delivery Management
Enterprise Imaging
Operations Management
Revenue Cycle
Risk assessment
Margin analytics
Workforce optimization
Asset Management
Integrated Care Solutions
Ambulatory Care
High Acuity Care
Cardiology
Analytics
Care coordin
Engagement
Providing caregivers the right actionable insight ndash when amp where they need it
Large GE device footprint generating
clinical data
HCIT domain in clinical workflow amp analytics
SW CoEPredixTM capabilities + +
48
Enterprise Imaging Improving diagnostic workflow in the cloud
Customer Challenges Cloud Case Exchange CentricityTM 360
Sample Customers Solution Architecture
Clinical Collaboration amp Advanced Analytics
Imaging Cost Control
Archive
Workflow
19 Time spent
gathering data
Workflow
velocity
Diagnostic
confidence
Cases diagnosed
incorrectly 35
~$2B segment by rsquo18 growing 25+
30 turn-around time
3 duplicate exams
Customer value $10MM+ cost pa
Image-as-a-Service lifecycle value $20MM+
Care quality
Cost
Source Research from the Journal of the American College of Radiology and the Journal of American Medicine
49
Customer Challenges Workforce management
Sample Customers
Operations Management Optimizing workforce productivity with API Healthcare
54 Hospital
operating cost
spent on labor
Solution Architecture
Real-Time Analytics Labor amp Patient Workflows
Time amp Attendance
Staffing amp Scheduling
HR amp Payroll
~$2B segment by rsquo18 growing 12+
20 Workforce productivity
Customer value $4MM cost pa
Workforce-mgmt services lifecycle $4MM+
80 Overtime wages
Matching care-giver capacity
amp patient need
Care quality
Labor
productivity
Source Beckerrsquos Hospital Review
50
Population Health Management Lowering the cost of chronic disease
Customer Challenges
Solution Architecture
Caradigm Analytics amp Care Mgt
Proactive
intervention
Care protocol
compliance
75 Cents of every
healthcare dollar
spent on chronic
disease
Care Mgt Analytics Risk Cohort
25
Customer value $5MM+ cost pa
Caradigm lifecycle value $18MM+
Patients per care manager
~$30B segment by 2025 growing 19+
Sample Customers
40 Hospitalization for chronic patients
Chronic disease
treatment cost
Source National Diabetes Fact Sheet
51
Software enabling productivity in service process
Wo
rkfo
rce
Pla
nn
ing
amp
Dis
pa
tch
Historically up to 40 FE travel time hellip utilize analytics to optimize allocation
Smart dispatch with effective job-skill matching
Optimize field force capacity and response time to customers
Call Generation (Planned amp Unplanned)
Deploy
RepairFix
Diagnose
CloseDebriefBill
Pe
rfo
rma
nce
M
on
ito
rin
g 110k GEHC devices connected remotely
MR hellip 900 data points monitored per machine 30k alertsyear proactively fixed
Improves GE productivity while minimizing customer down-time
Healthcare Services margins improving
Aviation Kevin McAllister - President amp CEO Aviation Services
- In current role since May 2014
- 25 years with GE
53
Aviation Services
13 14E
+ $108
Backlog $97 +
Revenue
Key metrics Services imperatives
Commercial IB hellip 34000 engines
Young hellip 46 havenrsquot had 1st shop visit
Fuel cost driving investment hellip GE well
positioned hellip 787 737MAX A320NEO 777X
Installed base dynamics
1
2
3
4
Deliver on customer value
+ Lowest cost of ownership
+ PredictivityTM outcomes
Grow $installed base
+ Winwin providing technology upgrades and analytics
Expand margins
+ Time-on-wing for GE and customers
+ Cost productivity hellip for GE
Best service execution and delivery
+ Position to support service entry for next-gen products
($ in billions)
54
Solid growth fundamentals
Shop visits Environment Departures
Source IATA amp GE analysis
Passengers IATA RPK YoY
Utilization Avg cycles day YoY
Departures GE and JV-powered flights (MM)
0
5
10
15
20
25
30
35
40
lsquo10 lsquo15F lsquo95 lsquo00 lsquo05
4100
5500
4400
2100
2000
3000
2300 2000
2300
200
100
-1 09 02
2012 2013 2014E
53 52 58
20 21 22
2 of 3 daily flights
powered by GE or GE JVs
46 have not
had 1st shop visit
4 CAGR Number of departures (MM)
lsquo13 rsquo15F rsquo20F
CFM is a 5050 JV between GE and Snecma EA is a 5050 JV between GE and Pratt amp Whitney
55
Solving our customers toughest challenges
Airline direct operating costs
Fuel
40
Delays and cancellations
8
Maintenance
9
Services analytics offerings
Flight Efficiency Services
Performance-based Navigation
Analytics-enabled workscoping
Product and Services strategy
Provide lowest cost-of-ownership through OEM technology
Lead in on-wing reliability
Lead in technology
Best-in-class fuel burn and retention
Engine diagnostic and prognostics
Intelligent Operations
$200Byr
$40Byr
Taleris is a 5050 JV between GE and Accenture
+
56
Services technologies hellip improving value through the lifecycle
Installed base (lsquo13) Upgrades
Fuel Burn improvement
Time- on-wing
8 8 2x
8 3 3x
5 2 2x
A culture of technology insertion Tailored to customer wants
CFM is a 5050 JV between GE and Snecma
Risk transfer $hour coverage
Overhaul Time and material
Materials New used and repaired parts
Asset optimization TRUEngineTM program diagnostics
+
CF6-80C (lsquo86 EIS)
GE90 (lsquo95 EIS)
CFM56 (lsquo84 EIS)
3000
1500
18500
57
Minds amp Machines at GE Aviation
+ Ex
po
sure
Operator A Operator B Part Temperature Cruise Takeoff
Te
mp
era
ture
Threshold
Climb
1000+ software engineers GE Software COE
6300 applied engineers GE Aviation
Data Secure continuous accessible
Physics Apply engine expertise
+ =
Customer and GE benefits
+
Statistics Unlock trends segment
ldquoPhysicsrdquo ldquoAnalyticsrdquo
Time-on-wing
Reliability and availability
Fuel cost
Repair and overhaul
58
Lead in on-wing reliability
Applied analytics to detect engines at risk of removal
Cu
mu
lati
ve
dis
tre
ss
Cycles
Recent successes hellip
CFM is a 5050 JV between GE and Snecma
Segment
GE90
120 CFM56
40 Water wash
$7Myr fuel savings at one GE90 operator
removals saved
removals saved
Nominal environment
Abate
Harsh environment
59
$30MMyr savings
Flight Efficiency Services App
Performance-based Navigation App
Attacking fuel spend with analytics
Joint marketing hellip
ldquoPerfect flightrdquo video
In the news
Newsletter
Oil amp Gas Brian Palmer - Vice President Measurement amp Control Solutions
- In current role since 2010
- 29 years with GE
61
Oil amp Gas Services
Software amp Services as a key differentiator
Key metrics Strategic imperatives ($ in billions)
13 14E
++
Backlog $58 ++
$83 Revenue
1
2
3
4
Deliver on customer value + Customer co-creation
+ Outcome based solutions
Grow $installed base + Drive analytics amp PredixTM
+ Penetrate the installed base
Expand margins + More software and contract offerings
+ Continue to grow backlog double digits
+ Partnerships to accelerate journeyhellip
Meridium
Improve service execution amp delivery + Full lifecycle productivity
+ Simplifying structure
IB growing TMS and Subsea with 13K+ units Software investments creating new IB revenue
streams in addition to traditional parts and service New contractual (CSA) offerings developedlaunched
Installed base dynamics
62
Oil amp gas industry is faced with expanding challenges GE software data and analytics are uniquely positioned to help
Customer challenges Equipment Availability
Equipment Reliability
Operational Efficiency
Production Optimization
Industrial Internet hellip turning data into actionable information Enable no unplanned downtime
Increasing complex operations
Tighter regulations
Skills gap
Machines with data potential
Sources GE OampG analysis based on Wood Mackenzie Rystad Barclays IHS CERA PFC Energy IEA httpwwwgecomstoriesoil-and-gas-innovation Oil and Gas Facilities 2013 httpwwwspeorgogfprintarchives201306
$800B+ Annual industry CAPEX (6-8 growth per year)
$150MM Average annual cost for mid-size LNG facility due to unplanned downtime
5-10 Range of OampG industryrsquos estimated downtime
63
Predixtrade hellip Unified Operations Improved throughput connecting people machines and data
Customer outcomes
Unified Operations ndash A customer co-creation success story
Enhanced safety
Increased availability
Operational visibility
Efficient workforce enablement
Partnering with to tackle these industry challenges and create a solution that increases production and lowers cost driving improved customer outcomes
Unified Customer
Portal
129000 Pieces of equipment in operation globally in
the industry
50 Industry retirement rate in next 10 years
7X Industry fatality rate
above norm
people
machines
data
64
FieldVantagetrade hellip Asset Performance Management (APM) for Onshore
APM ndash Bringing GE expertise from all industries to deliver system level value
Customer outcomes
Enhanced safety
Operational visibility
Improved availability
Optimized performance
Monitoring amp
Diagnostics
Condition Based
Maintenance
Real time Operations
Intelligence
Asset LifeCycle
Management
bull Providing field level visibility and optimization across multiple forms of artificial lift technologies bull Integrated insights provided through common single scalable platform bull 2 year service contract on 200+ wells
Solution Overview
39 NAM OampG Upstream Vehicle Fatalities
hellipby improving
116K New wells in 2014
5 Days Back to production (NAM Avg)
1MM+ Artificially Lifted Wells (Global)
65
Intelligent Pipeline hellip Operations optimization software for pipelines
2TB of data for every
30K miles of pipeline
3-4 annual growth
2MMmiles of
pipelines globally
$40B invested by pipeline companies per year
Source 2TB - Average data volume based on GE internal analysis of multiple pipeline customers Rest - GE OampG analysis based on Douglas Westwood IHS CERA FERC CIA World Factbook PII Pipeline Database (Summary of Infield Systems Global Data DOT databases)
bull 5 year service contract
bull Setting the industry standards for
pipelines real-time intelligence
First customer Customer outcomes
Enhanced safety Proactive versus reactive decisions
Visibility Complete geospatial view and situational awareness
Optimized Ops Effective data driven resource allocation
Efficient OampM Prioritize spending for assets and resources
Moving to proactive solutions with our customers
66
Customer Benefits
Zero unplanned downtime
Increased availability
Increased reliability
Decreased production losses
$14B Additional opportunity driven by
availability and reliability increase (1 of capacity)
Industry Opportunities
Outcome base service bonus
GE Productivity Improvements
Inventory through parts flow optimization
Outage durationfrequency driven by condition- based maintenance
Services Optimization hellip Creating optimal value for GE equipment customers
Journey to 100 reliability through our Contractual Services Agreements (CSA)
Transportation Pete McCabe - Vice President Global Services amp Solutions
- In current role since 2013
- 20 years with GE
68
Transportation Services ($ in billions)
13 14E
+
Revenue $28
Backlog $12B+ +
1
2
3
4
Deliver on customer value
+ Outcomes - velocity fuel reliability
+ System solutions ndash RailConnectTM 360
Grow $installed base
+ Increase penetration ndash Parts amp Smarts
+ Extend asset life ndash modernizations
+ Broaden software solutions ndash rOS
Expand margins
+ Deploy advanced analytics ndash PredixTM
Improve service execution amp delivery
+ Enhance commercial capabilities
+ Expand domain amp IT project expertise
Installed base dynamics
1000+ Tier 4-compliant loco orders
~650 locomotives un-parking in rsquo14
450 new locomotives in South Africa
Key metrics Services imperatives
69
Railroad industry is faced with expanding challenges and customers require a solution provider
Customer challenges
RailConnecttrade360 delivering customer focused outcomes
Asset utilization
Capacity limited
Resource constraints
Ops Complexity
$80B+ N American operating revenue (~4 growth)
7 year high Traffic volumes require unparalleled investment
$56B Annual industrial benefit through 1 improvement
Sources American Association of Railroads (AAR) 2013 industry statistics
70
Asset optimization ndash fuel efficiency
Customer Dynamics RailConnect 360 ndash Trip Optimizer
bull Real-time embedded optimization algorithms
bull Advanced data acquisition enabling train health monitoring
bull Automated train handling reduces wheel amp rail wear
bull $1M diesel locoyear 22K GE locos
bull Emissions
bull Huge operating variation operators trains topography
Trip Optimizer with CSX
Implementation on 1500 CSX locomotives
Reduced fuel use by 7 on average Decreased 3rd largest operating expense
- CSX Sustainability Report 2013
Tr ip Opt imizer Quick Star t Guide (1) Train Speed is available on the speedometer during an active trip during auto and Manual Control
(2) Trip Plan Speed displays a green Trip plan speed pointer on the speed indicator dial in Auto and Manual
modes of operation
(3) Trip Optimizer Status Box is visible when Trip Optimizer system is ACTIVE and provides three types of messages Status Request for Operator InputAction and Error
(4) TrackCivil Speed Limit plot line is Cyan shown the entire horizontal range data permitting
(5) Train Speed (Actual) plot line is White shown only from the head of the train on back
(6) Train Head is shown as a thick White line to allow the operator to see the position of the Train relative to the
terrain The horizontal scale of the rolling chart is zero-referenced to the Head of the Train (corresponds to the forward-facing end of the lead locomotive)
(7) Train Milepost has an associated location and name Its representation on the screen consists of a graphical
pointer and an identifier
(8) OMB Message Box displays operator messages
(9) Consist Notches displays Lead and Trailing locomotive notches
(10) Throttle Handle Notch represents the Master Control-ler handle position During TO Auto Control it will indicate
N8 as TO automatic control requires notch eight (N8) set-ting
(11) Auto Control Notch displays on screen as a White box to denote TO Auto Control engagement and throttle out-
put control
(12) Trip Plan Speed has a Green plot line shown as the entire horizontal range when available and data permit-
ting
(13) Manual Control Zones is shown as a Gray rectangle on the terrain plot extending across the entire vertical range of this section of the chart
(14) Planned Braking depicts Blue areas where Trip Opti-mizer expects that dynamic andor air braking will be
required to maintain the plan speed
(15) Key Locations are softkey states that constitute a unique mapping of functionality to key locations
1 How do I get started To start a trip you will push the Trip Optimizer key on the Main operator screen
2 Do I have to be stopped to request a trip through Trip Optimizer It is preferred to perform a trip init at zero speed however unless otherwise provided by
local ruleinstruction maximum speed for initialization is 15 mph
3 I have performed the Trip Init process and see the rolling map When will I get prompted for Auto Control
Auto Control will become available when the speed is greater than 12 mph and the Throttle handle is N1 or higher
4 Why does the Locomotive Status matter to Trip Optimizer Trip Optimizer will always monitor in train forces speed braking and fuel efficiency To best optimize all of these Train dynamics Trip Optimizer must be told by the operator what the
status of each locomotive in the train The three modes are defined as follows
Running The locomotive is fully operational and is used for calculating TPOB
Isolated The locomotive is either shut-down or is mechanically isolated from produc-
ing Tractive Effort
DB Cutout The locomotive has no Dynamic Braking available but is being used for
producing Tractive Effort
5 What is the recommended way to disengage Auto Control The most fuel efficient way is to decrease the throttle notches in 2 second intervals until
you get to the required speed
6 Trip Optimizer is disengaging from Auto mode and tells the opera-tor Manual Control is required I am already in Notch 8 throttle
What do I do
Press the Current Throttle key on the screen Moving the Master Controller from Notch 8 to
Notch 7 and back could result in un-safe train handling practices
7 Why does Trip Optimizer not always travel at Track speed Trip Optimizer will use the forces of the train and momentum to achieve the optimal speed to save fuel In some cases Idle will be used to meet a planned slow order Trip Optimizer is
always looking out a few miles ahead to plan for the ideal speed while maintaining safe train handling
8 How do I report an inaccuracy on the civil speed limits posted on the rolling map
Contract your Road Manager to report the case
9 The dispatcher has issued an enroute slow order Will Trip Opti-
mizer automatically take this into account
No If an enroute slow order is issued it will be the train crewrsquos responsibility to protect the
train in Manual mode during this affected zone
10 Why does Trip Optimizer automatically end the trip when I still have distance remaining before the preset crew change point
The subdivision has a GPS controlled end point that will automatically end the trip based off of recommendations from the railroad
Follow the steps on the backside of this document to walk you through performing a Trip Init
Trip Optimizer Top Ten List
GE Proprietary Information The information contained in this document is GE Proprietary Information and is disclosed in confidence It is the property of GE and shall not be used disclosed to others or repro-
duced without the express written consent of GE If consent is given for reproduction in whole or in part this notice and the notice set forth on each page of this document shall appear in any such reproduction in whole or in part The information contained in this document may also be controlled by the US export control laws Unauthorized export or re-export is
prohibited Document 5005807 Rev mdash
Before engaging the TO AUTO throttle the operator must meet certain train conditions and under-stand the data displayed on the Trip Optimizer Running Screen
Doc No 5005890 Rev -
71
Operations optimization ndash velocity
Movement Planner with Norfolk Southern
RailConnect 360 - Movement Planner
bull Systems problem hellip beyond human capabilities
bull Majority single track
bull Point solutions have plateaued
bull Integrated suite of day of operations software apps
bull Predixtrade platform - connectivity big data and security
bull Advanced algorithms and automatic routing
bull Proven in class 1 revenue service
Norfolk Southern and Movement Planner
Automated routing decisions
10+ increase in velocity
50+ reduction in expired crews Significant improvement in
schedule adherence
1MPH = ~$200MM estimated
annual savings in capital amp expenses
Based on 3 year study in NS GA division
Customer Dynamics
72
bull Co-development GE Transportation amp GE Intelligent Platforms
minus Enhanced sensor coverage
minus Improved data acquisition higher resolution
minus Advanced analytics
bull Asset specific insight drives fault reduction and enables CBM
(SmartSignal)
bull 20K+ overhauls in backlog
bull OH interval based on average expected condition
bull $1B+ capital expenditure in North America every year
Impact Reduced unplanned
downtime amp avoid road failures
Reduce unscheduled material consumption
Extended periodicity and associated expenses
ldquoPhysicsrdquo change
Real Time Engine Performance
Bearing Temp
Bearing Temp
Load
Ambient
To
da
y
To
mo
rro
w
Alarm trigger
Savings
CSA ndash shared productivity
Lifecycle Cost Dynamics ndash Engine Overhauls RailConnect 360 ndash Advanced Analytics
GErsquos 1 Jamie Miller - Senior Vice President Chief Information Officer
- In current role since 2013
- 9 years with GE
74
Digital opportunity
Simplifying structure
More valuable GE resources with fully integrated approach
+ Utilize data from products
+ Field services tools
+ CRM configurators
+ Brilliant Factory
Benefits
ERPmanufacturing 90
Data Centers 80
Applications 30
Shared Services 65
Cloud 70
Product Cost
RampD
SGampA
+ Engineering tools
+ Shared Services GL
+ Cyber Security
IT plays
-a)
(a - Target percent of new applications that are Cloud enabled
~$94B
Industrial cost
75
Three opportunities to power manufacturing
Digital Foundation 1
Unlocking Big Data
minus Sourcing
minus Productivity
2
Powering the Brilliant Factory
minus Design for manufacturing
minus Sensor enablement
minus Plantsupply chain optimization
3
minus 90 reduction in ERPs
Supply Chain Network
Virtual Mfg
Virtual Product Design
76
Product Cost ERP investments paying off
Inventory turns 6x 7x
Shipment on time 58 85
Foundation for business to deliver $1B+ savings over past 5 years
GE Healthcare
of revenue on target ERP ~75
~95
2009 Today
Today 219 ERPs 2016 34 ERPs
GE Water
2008 Today
22
1
of ERPs
SGampA of sales ~10 pts
Past dues 60
Finance headcount 50
77
Product Cost Using big data to run GE
Ingest Store Clean Consume
1 OampG data lake $8B direct materials buy
Real time More cheaper Faster GE-wide Analytics Data science
$60B total material buy across GE hellip $1B+ cash amp deflation opportunities
bull 23 source systems
bull Full visibility ndash 3 weeks
bull Commodity part supplier
bull Data lake technology
bull Machine learning for data cleansing
bull EM PampW underway (Alstom)
Oil amp Gas
Xxxxx Xxxxx Xxxxx xxxxx
78
Product Cost Technology powering the Brilliant Factory
20 NPI cycle hellip 20 efficiency
16 pilots launched hellip Fastworks 2020 Vision
FastWorks approach
Virtual design for manufacturing
30 NPI cycle time
Eliminated quality escapes
Wilmington NC
Aviation Machining
Factory optimization
25 productivity
PampE avoidance Greenville SC
PampW Nozzle Cell
machine downtime
25 opportunity
Sensor Enablement
Grove City PA
Transportation Remanufacturing
79
Smart Outage Full deployment at PGS
Changing the way we deliver Services
On track for $1B CSA productivity over 3 years and 10 customer uptime
+ +
Predictive Workscope Aviation 4 customers
full roll-out mid-2015
=
Field services optimization
Predictive workscope
Next generation modeling
Advanced technology
Accelerating productivity
80
We can do more ldquoSrdquo with less ldquoG+Ardquo
45 win rate
80 in quote time
5400+ SalesComm Ops hoursweek
QuickQuote
40K+ GE Commercial FTE
Highly manual long-cycle-time
More ldquoshots on goalrdquo lower cost
Investing in digital tools for commercial teams
Wrap up
82
Value for investors
Payback through most reliable revenue source Services
+ Increase revenue growth
+ Improve margins
+ CSA productivity
Funded software amp analytics through simplification amp reallocation
Potential upside beyond the GE installed base
Scale amp intellect Return on investment
1
2
3
GE Software COE
+ COE can accomplish scale hellip none of
our businesses could do this on their
own hellip attract talent amp spread ideas
+ Advantage to being an early mover hellip
right partnerships amp scale
+ Changing GE Industrial DNA hellip
greater impact from digital amp
analytical investments
83
Why GE
+ More valuable portfolio hellip 75 Industrial while growing EPS
+ Tangible evidence of winning NPI hellip Tier 4 LEAP etc
+ Strong amp diversified global footprint hellip best-in-class
+ Transforming service for next generation of growth
+ Culture of simplification impacting every part of GE
LEAP is a trademark of CFM International
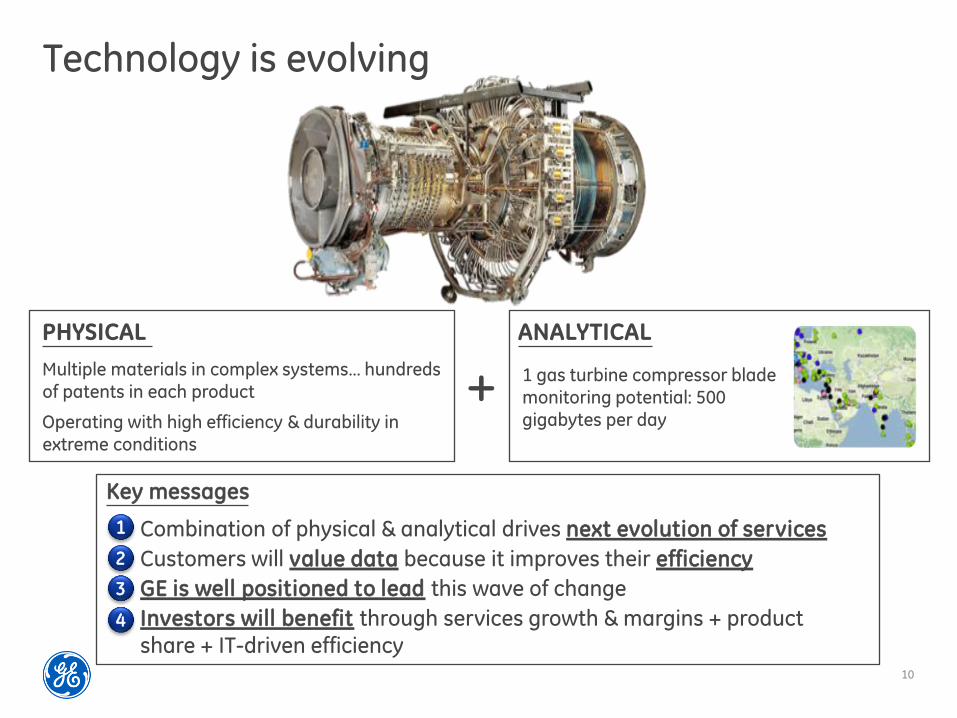
10
Technology is evolving
PHYSICAL ANALYTICAL
Multiple materials in complex systemshellip hundreds of patents in each product
Operating with high efficiency amp durability in extreme conditions
1 gas turbine compressor blade monitoring potential 500 gigabytes per day
Combination of physical amp analytical drives next evolution of services
Customers will value data because it improves their efficiency
GE is well positioned to lead this wave of change
Investors will benefit through services growth amp margins + product share + IT-driven efficiency
1
2
3
4
Key messages
+
11
Transforming services
bull Partners amp field
technicians 80rsquos
Big iron
Airlines 1 fuel $2-3B
Utility 1 fuel $4-5B
Oil amp Gas 1 uptime $5-7B
Healthcare 1 productivity $4-5B
Transportation 1 mile velocity $1-2B
Driving customer outcomes
bull Risk sharing
service contract 00rsquos
CSA
bull Asset amp
operations
optimization
Today
bull Science applied
to repairs amp
upgrades 90rsquos
Repair
Power of 1
Annual impact-a)
Small changes in hellip fuel maintenance uptime productivity flexibility safety
labor effectiveness hellip have a big
impact on profitability
(a - Global industry estimates based on ldquoIndustrial Internet Pushing the Boundaries of Minds amp Machinesrdquo ndash Nov 26 2012
Analytics
12
GE leadership
Large high-tech installed base
Customer trust amp connection hellip ~$180B services backlog
Deep domain knowledge
GE advantages What it takes to win
bull Sensors
bull Service robotics
bull Connectivity
Enabling technologies
bull Connected IB
bull Physicsmaterials bull Smart devices
bull Global reach
Installed base
+
+
bull Software capability bull Industrial big data
bull Operating platform
bull Security
Data amp analytics Attracting new talent hellip
ldquohorizontal capabilityrdquo
Connecting domain amp data hellip CSA
Operating platform in place (PredixTM)
Large research capability
Industry partnerships
Collecting 50MM data elements
GE has all essential elements
Have
Have
Investing
13
Improving the service model
Asset optimization
Operations optimization
CSA productivity
CSA + Connected asset + Software revenue value ($IB) outcome sales
Data-driven execution
Maximize performance with no unplanned downtime
Increased system efficiency across GE
amp non-GE assets
Optimize material amp repair cycles
across IB
Make versus buy hellip build internal team
Launch new offerings hellip PredictivityTM
Build on existing CSA relationships hellip ldquowin-winrdquo
Develop a broader ecosystem
1
2
3
4
Investments 2010-14
Focus of innovation
How we execute
14
Asset performance management
Impact for GE hellip $IB productivity for customers hellip velocity productivity
SENSORSANALYTICS
On-site oil analysis Predict remaining life Prevent road failures
SERVICE ROBOTICS
Productivity safety Remote monitoring Tough environment
AUTOMATED DECISIONING
Optimize yard ops Reduce dwell 10 Depart on time up 50
ADVANCED CONTROLS
Auto Train Operation 10 fuel savings
15
Impacting GErsquos 1
$94B of cost
$12B of working capital
$20B of PampE investments
GErsquos 1
Analytics amp
security
IT investment ($2B+year)
+
Reduce structure
Lower product cost
Improve margins
Enhance engineering productivity
Faster amp safer
Impact
Every Industrial company a Software amp Analytical company
16
Investor value
Increase services growth rate
+ More $installed base
+ $08B PredictivityTM solutions revenue growing to $4-5B
+ Penetrate aged GE fleet
+ Grow beyond the GE IB
Improve services margins
+ CSA productivity
+ Improve quality
Potential for industry value
+ Scale beyond GE installed base Backlog Revenue Margins
Services franchise
~$180B
~$45B
~30
Value creation
+
1
2
3
Software amp analytics accelerate services growth margins amp returns
Revenue growth ~5 Margin expansion ~50 bps Limited by IB growth
Historic performance
Services overview
18
Services growth
05 08 11 13
($ in billions)
Revenue
~26 ~30
OP
GE advantages
+ Installed base
+ Technology
+ CSA model
+ Footprint amp scale
+ Software COE
+ Fleet data
$27
$35
$42 $45
Services imperatives
Backlog
1
2
3
Deliver on customer value + Link services to outcomes + Global deployment
Grow $installed base + Drive analytics amp PredixTM value + Penetrate aged installed base
Expand margins + Leverage analytics to manage
performance + Invest in productivity tools
Improve service execution amp delivery + Enhance commercial capabilities + Increase field services capability
Spread ideas across GE
$87 $121 $147 $180
4
5
19
Services Council
Driving differentiated advantage
Cross-business initiatives
20+ services leaders
Teams aligned to 9 themes
Quarterly executive updates hellip operational rigor
Spreading ideas hellip
bull Core growth
bull Operations
bull Tools + process
bull CSA excellence
Data +
Outcomes
bull PredixTM + Cloud
bull PredictivityTM solutions
bull Strategic alliances + BD
Hardware amp domain expertise
Software analytics based
Healthcare Inspection technology
Aviation Repair technology
Power amp Water Global footprint
bull Multimodal ndash service amp repair shops
bull Customer training centers
bull Additive manufacturing
bull Robotic welding
bull Advanced coatings
bull Parts inspection amp measurement
bull Condition-based maintenance
Pune India
20
Enabling technologies Service Robotics Sensing amp Controls Advanced Manufacturing
Inspection Repair Mobile Tools
Launch amp learn hellip then accelerate to all GE businesses
Automated adaptive + Productivity + Less downtime
High tech integrated + Lower fuel usage + Higher efficiency
Productivity safety + Repetitive tasks + Tough environment
Additive new materials + Repair vs scrap + Longer service life
Deployable fast accurate + More digital data + Less downtime
Connected digital + Instant expert access + Lower service costs
21
Increase value of CSA
Benefits for Customers Benefits for GE
Monitoring amp diagnostics
$180B Services backlog
Fuel efficiency
Hardware amp software upgrades
Condition-based work scope
Mobile amp analytical tools
Material productivity
Optimized asset performance
Predictive analytics ndash lower downtime
More output
Lower costs
Lower emissions
Better payback on hardware upgrades
Instant software upgrade capability
Shorter duration outages
Less material usage
Ask an Expert ndash COE
Field Service productivity
Analytics driven parts life extension + performance
Repair vs scrap
22
Segment services dynamics (Services revenue $ in billions)
Power amp Water $125
Oil amp Gas $83
Energy Management
2013
$21
+ Sustained passenger growth
+ Improving airline profitability
+ Upgrades amp analytics
Aviation $108
+ Growth markets strong
+ Improving HCIT
minus Developed challenging
Healthcare $80
+ North America utilization
+ Analytics penetration
minus Mining parts
Transportation
$28
2013
2013
2013
2013
2013
2013
+ Continued AGP growth
+ Upgrades amp analytics
Europe
+ Strong Subsea
+ MampC improving
+ Analytics penetration
+ Marine offshore
minus Mining amp motor repairs
23
Presentation
Common capability Software COE
Analytics commercialization
Bill Ruh
Kate Johnson
Business execution
Strategy overview
Customer outcomes
Examples of analytics driving growth amp productivity
Competitive advantage
Power amp Water
Healthcare
Aviation
Oil amp Gas
Transportation
Paul McElhinney
Jan De Witte
Kevin McAllister
Brian Palmer
Pete McCabe
Common capability GErsquos 1 Jamie Miller
Software amp PredixTM
Bill Ruh - VP Global Software Center
- 3 years with GE
- 32 years of industry experience
Kate Johnson - VP GE Commercial Officer
- 1 year with GE
- 15 years of industry experience
25
The Industrial Internet
3 Hyper connectivity a living network of the worldrsquos machines data amp people
Internet
Increasing system intelligence through embedded software hellip advanced sensors
controls and software applications
Brilliant Machines
Democratization of data hellip high frequency real-time data
Big Data
Predictive algorithms hellip physics-based analytics hellip deep domain expertise on big industrial data
Analytics
People at work Connecting people at work or on
the move Supporting more
intelligent design higher service
quality operations amp safety
maintenance
1
2
3
4
5
26
61
45
31 28 31 40 42
29
29
45 63
56 56
47 45
41
10 6 6
16 9 10 9
24
Software outlook Customer survey Importance of
Big Data analytics relative to other priorities
Source Accenture 2015 Trend Report Gartner Big Data Survey
Aviation
3 3 3 3 6
Wind
Power Generation
Power Distribution
Oil amp Gas
Rail
Manufacturing
Healthcare
Highest priority Within the top 3 priorities Within the top 5 priorities Not a top priority
Opex is becoming a deciding
factor for IT investments as
80 of budget is allocated to
managing and running
complex technologies Source Gartner
Advanced analytics and
analytical applications
expected to see double digit
revenue growth Source Gartner
APM market category
expected to reach $300B
by 2020 Source Gartner
27
Industrial customersrsquo perspective Survey of GErsquos customers regarding applications
Real-Time Operator Intelligence
Remote Monitoring amp Diagnostics
Condition-Based Maintenance
Asset Lifecycle Management
Schedule Optimization
Energy Management
Process Control Automation
Field Force Automation 32
38
42
43
49
59
66
70 Tailor Pre-Built Applications
Have A Systems Integrator Build
Your Apps
Build My Own Custom Apps 15
54
85
HOW do you want to consume it WHAT functionality is most valuable
Asset performance management is the killer industrial app
28
What industrial customers want
SDM
SDM
SDM
SDM SDM
Software Defined Machines (SDMs)
ldquoLink up all my assets and devicesrdquo
REAL-TIME
OPERATIONAL
INTELLIGENCE
CONDITION-
BASED
MONITORING
ASSET LIFECYCLE
MANAGEMENT
MONITORING amp
DIAGNOSTICS
Industrial Apps
SDM Non-GE Assets enabled by PredixTM Machine SDM
SDM GE Assets enabled by PredixTM Machine SDM
PredixTM powers Asset Performance Management (APM)
29
Insights into value
Improving safety and
productivity across 15K miles
of interstate natural gas
pipelines
Potential Savings
77 gallons of fuel and 1628
lbs of CO2 per approach
10 increase in network
velocity 50 reduction in
expired crews amp significant
improvements in on-time
performance
Up to 4 increase in power
output across 283 wind
turbines hellip 40+ GWhr annual
increase
Asset Performance Management (APM)
REAL-TIME OPERATIONAL
INTELLIGENCE
CONDITION-BASED
MONITORING
ASSET LIFECYCLE MANAGEMENT
MONITORING amp
DIAGNOSTICS
Operations Optimization
INSIGHT PROCESS
INTEGRATION
AUTOMATION COLLABORATION
PredixTM Platform
PredixTM Machine PredixTM Net
GE
Non-GE
PredixTM Asset PredixTM Insight
PredixTM Fabric PredixTM Core
PredixTM Experience
Predixtrade hellip the GE advantage
Release in 2015
Public Cloud Private Cloud
Commercially available to connect more machines more data amp more people
TR
AN
SF
OR
MS
PO
WE
RS
PredictivityTM Solutions
30
Predictivitytrade hellip app factory
Asset optimization (28)
Operations optimization (14)
Productivity tools (77)
Approach Development process
Agile amp Extreme Programming
Design Center for delivering
compelling user interface
Cyber security Blue team to build
and Red team to test
90-120 day service engagement to production roll out
+
+
+
Co-innovation process to design
build transfer and iterate
Actionable insight on equipment based
on physics and analytic modeling
with industrial data
Outcome based process improvements
to plants pipelines fleets fields facilities
grids shops
Increase service throughput efficiency
and quality at optimized cost of
delivery
Delivering industry apps at speed and scale
31
World-class Software amp Analytics organization
Investing in Leadership Talent
Colin Parris (IBM)
SW Research
Co-located SW CTOs for business alignment
D Bartlett
(IBM)
Aviation
World-class technical resources
Computational amp analytics scientists
Platform developers
Software engineers
~10000
1000+ Biz
COE
Product Dev Software CTO
Brad Surak (SAP)
Harel Kodesh (Microsoft
Start Up Veteran)
Trans S Chotai
(HP)
OampG J Demesa
(Siemens)
PampW G Bell
(ServiceSource)
EM J Stone
(SAP)
HC E Eryurek
(GE)
+
+
- Cyber UX Data Science Agile development
Four deep core competencies ecosystem
1
Leading edge platform + world-
class ecosystem 2
Advanced research for building
the future 3
Advanced process to drive adoption amp enablement
4
Software Site
Organization
Technology amp Ecosystem
32
Wurldtech protecting critical infrastructure
World-class cyber security to operate assets + operations safely
About A GE Company acquired in May 2014 providing top cyber talent
Capability Assess protect amp certify critical infrastructure from cyber attack
Key Customers 4 of 6 top global OampG companies 9 of top 10 automation vendors
Security enhancements delivered through PredixTM and GE Products
Certify GE and non-GE products and customer environments
Identify vulnerabilities in OT products (GE and 3rd party)
Assess and prioritize risks for system operators
Achilles Industrial Next Gen Firewall to inspect and control
Industrial network traffic
Leverage industry leading threat intelligence
Protect operational
environments
Secure amp certify industrial products
Assess products amp operations for vulnerabilities
33
Partnerships amp Alliances
Intel ATampT AWS Cisco others
Venture Capital
Mergers amp Acquisitions
ThetaRay Mocana Frost
Strategic Moves
Wurldtech Austin Digital
Acquire capability to fill gaps
Pivotal Softbank Industrial Internet Consortium
Industrial internet ecosystem
Industry Ecosphere
Establish interoperable amp scalable solutions
Co-development amp go-to-market
Accelerate innovation amp success
Positioned to create value
Open PredixTM beyond GE
GE will sell
+ + Connected devices
Data Under Management
Performance Applications
PredixTM Machine Services
PredixTM Data Services
PredixTM Asset Services
Connect assets regardless of vendor or
vintage and provide value-added services
Aggregate and analyze data to produce
actionable business insights
Sell horizontal apps that maximize return
on assets and people
1
2
3
34
Competitive advantage
$1T Connected
Machines
managed by GE
replacement value
10M Sensors
collecting
50M Data
Elements
$20B Potential
Annual Customer Savings
50B Machines will be connected on the internet by 2020
2X Industrial data growth within next 10 years
Big Iron + Big Data = Big Outcomes
INDUSTRY GE
35
New ways to sell Services
2 Making Markets Different Economics
3 Co-creation amp Agile Development
4 Solution Architecture
5 Value Based Deal Shapes
6 New Industry Ecosystems
1 New Buyers and Influencers
GE Commercial Center of Excellence
Needs Target Architect Close
Qualification amp Pipeline Management
Sales Process
HireTrain Community of Experts
Enablement Toolkit
36
Accelerating time to value across channels
APM Subscription Services
Enterprise Analytics Projects
Upgrade value in CSAs
GE Sales Model
Existing Services sales team
New standalone software sales specialists
New outcome sellers + existing service sales team
Sales
acceleration
Expert SWAT
teams to
support deal
SW experts compelling
offer target one outcome
to land and expand
Ecosystem partners
SW COE app factory
Offering RMampD in CSA upside
and productivity Per well subscription
Enterprise SW deal
solution co-creation
ReliabilityMaxtrade FieldVantageTM Intelligent PipelineTM
GE OampG Example
Market
Opportunity $2B $600MM $27B
37
Measuring commercial success
Services revenue
Past Future
~5
+
rsquo13 rsquo17F
Assets under management $1T+ ++
PredictivityTM solutions revenue $08B ~$4-5B
Services backlog $180B ++
bull Adding more value to existing service relationships hellip training team to get more out of the installed base
bull Creating new revenue streams and building new commercial skills and incentive plans to accelerate growth
Outcome sellers solution architects product management amp marketing
bull Cultivate ecosystem to help accelerate commercially with access to CIOCTO relationships and system integration skills
Power amp Water Paul McElhinney - President amp CEO Power
Generation Services
- In current role since May 2014
- 26 years with GE
39
Power amp Water Services
Growing services amp delivering greater customer value
Key metrics Services imperatives ($ in billions)
13 14E
+
Backlog $53 +
Revenue $125
Installed base dynamics
1
2
3
4
Deliver on customer value + Develop flexible solutions
+ Reduce customer operating cost
Grow $installed base + Maximize impact of Alstom alliance + Invest in new service offerings
Expand margins + Tech upgrades amp software solutions + Outage excellence
Improve service execution amp delivery + Improved customer service levels
+ Optimize field service amp repair network
Unit growth up ~24X from 2008
Strong DP amp Wind growthhellip up ~1Kyear
~4000+ gas turbines in service
40
Global power industry is facing complex challengeshellip Offering innovative solutions to address customersrsquo needs
Fuel price uncertainty
Increasing regulation
Slow demand growth
Aging installed base
~15 years Average age of ~4K global GE gas turbines
Output
Efficiency
Reliability
Availability
Flexibility
Improving customersrsquo outcomes while decreasing costs
~$7B
Customer challenges
~$8B
~$2B
~$1B
~$2B
GE Predictivitytrade solutions amp industry benefit
~60+ Increase in US natural gas price since 2012
~(30) Thermal capacity in Europe since lsquorsquo08
Based on 10 year NPV
41
Investing in technology
Addressing multiple customer value levers
Advanced Gas Path (AGP) Industry leading output hellip up to +64 Industry leading efficiency hellip up to +18 Extends asset amp parts life hellip 96K hours
1
Op Flex Delivers flexibility to costs amp revenue Reduces start up time amp fuel consumption Expands fuel source opportunity
3
Dry Low NOx 26+ (DLN) Reduces NOx emissions by 40 Delivers industry leading flexibility Increases maintenance intervals to ~1250 starts
2
42
Power FlexEfficiencytrade Advanced Gas Path
Expanding the operating envelope
Ambient Temperature
Ou
tpu
t (M
W)
Op Flex
7FA03 baseline
AGP
+ ndash
+
Combining hardware and software hellip creating 2X the value
$17
$30
Op Flex
Average Customer Annual Value Per Unit ($MM)
Improving customer outcomes
AGP (Hardware)
AGP PredictivityTM
Solution
125+ AGPs with software sold to date
650000+ operating hours to date
43
Wind PowerUp hellip generating more output
Customer Outcome Up to 4
increase in power output across 283
wind turbines hellip 40+ GWhr annual increase ldquoThe PowerUp system offers a great chance for owners like us who are investing literally billions of dollars in this market to try and get more production out of existing assets GE took a lot of risk out of this for usrdquo
ndash Patrick Woodson CEO EON Climate amp Renewables
Opportunity for up to
20 more profit from up to
5 more output
A performance based
cooperative approach
with a holistic view of the
assets system and network
Flexible payment options
aligned to customer needs
+1400 turbines under contract since launch
Customer opportunity
Software enabled
Flexible platform
Proven results
Scale out
1
2
3
Healthcare Jan De Witte - President amp CEO Healthcare IT
- In current role since 2011
- 15 years with GE
45
Healthcare Services
Delivering value = higher quality outcomes at lower cost
Key metrics Services imperatives ($ in billions)
Backlog $11 +
Installed base dynamics
1
2
3
4
Deliver on customer value + Asset and workflow optimization + Analytics around EMRs amp Devices
Grow $installed base
+ Quality and analytics offerings + Solutions architecture amp delivery
Expand margins + Remote service amp SaaS models + Field services productivity Improve service execution amp delivery + Remote monitoring technologies + Field force deployment optimization
Emerging markets infrastructure build
Mature markets quality upgrades
ACA amp Enterprise Solutions IT penetration
13 14E
=+ Revenue $80
46
Healthcare industry shifting to value-based care GE software analytics and services are uniquely positioned to help
Customer challenges
Integrated Care Solutions hellip turning data into actionable insight Improving healthcare outcomes
Diagnostic quality
Patient-centric care
System profitability
Chronic Disease Management
Sources Institute of Medicine 2013 Porter Research 2013 McKinsey IHS Global Insight
29 Healthcare spend wasted each year
$260B Annual value creation through healthcare IT
59 US lives covered in value-based care model by 2015
Clinical Quality
Financial Performance
Operational Efficiency
Configurable Workflows
47
GEHC Software portfolio positioned along main outcome drivers for care systems
Diagnostic speed amp confidence
Productive care pathways
Wellness amp chronic disease management
Risk amp margin management
Costworkforce optimization
Population Health Management
Workflow
Archiving
Visualization
Financial Management
Care Delivery Management
Enterprise Imaging
Operations Management
Revenue Cycle
Risk assessment
Margin analytics
Workforce optimization
Asset Management
Integrated Care Solutions
Ambulatory Care
High Acuity Care
Cardiology
Analytics
Care coordin
Engagement
Providing caregivers the right actionable insight ndash when amp where they need it
Large GE device footprint generating
clinical data
HCIT domain in clinical workflow amp analytics
SW CoEPredixTM capabilities + +
48
Enterprise Imaging Improving diagnostic workflow in the cloud
Customer Challenges Cloud Case Exchange CentricityTM 360
Sample Customers Solution Architecture
Clinical Collaboration amp Advanced Analytics
Imaging Cost Control
Archive
Workflow
19 Time spent
gathering data
Workflow
velocity
Diagnostic
confidence
Cases diagnosed
incorrectly 35
~$2B segment by rsquo18 growing 25+
30 turn-around time
3 duplicate exams
Customer value $10MM+ cost pa
Image-as-a-Service lifecycle value $20MM+
Care quality
Cost
Source Research from the Journal of the American College of Radiology and the Journal of American Medicine
49
Customer Challenges Workforce management
Sample Customers
Operations Management Optimizing workforce productivity with API Healthcare
54 Hospital
operating cost
spent on labor
Solution Architecture
Real-Time Analytics Labor amp Patient Workflows
Time amp Attendance
Staffing amp Scheduling
HR amp Payroll
~$2B segment by rsquo18 growing 12+
20 Workforce productivity
Customer value $4MM cost pa
Workforce-mgmt services lifecycle $4MM+
80 Overtime wages
Matching care-giver capacity
amp patient need
Care quality
Labor
productivity
Source Beckerrsquos Hospital Review
50
Population Health Management Lowering the cost of chronic disease
Customer Challenges
Solution Architecture
Caradigm Analytics amp Care Mgt
Proactive
intervention
Care protocol
compliance
75 Cents of every
healthcare dollar
spent on chronic
disease
Care Mgt Analytics Risk Cohort
25
Customer value $5MM+ cost pa
Caradigm lifecycle value $18MM+
Patients per care manager
~$30B segment by 2025 growing 19+
Sample Customers
40 Hospitalization for chronic patients
Chronic disease
treatment cost
Source National Diabetes Fact Sheet
51
Software enabling productivity in service process
Wo
rkfo
rce
Pla
nn
ing
amp
Dis
pa
tch
Historically up to 40 FE travel time hellip utilize analytics to optimize allocation
Smart dispatch with effective job-skill matching
Optimize field force capacity and response time to customers
Call Generation (Planned amp Unplanned)
Deploy
RepairFix
Diagnose
CloseDebriefBill
Pe
rfo
rma
nce
M
on
ito
rin
g 110k GEHC devices connected remotely
MR hellip 900 data points monitored per machine 30k alertsyear proactively fixed
Improves GE productivity while minimizing customer down-time
Healthcare Services margins improving
Aviation Kevin McAllister - President amp CEO Aviation Services
- In current role since May 2014
- 25 years with GE
53
Aviation Services
13 14E
+ $108
Backlog $97 +
Revenue
Key metrics Services imperatives
Commercial IB hellip 34000 engines
Young hellip 46 havenrsquot had 1st shop visit
Fuel cost driving investment hellip GE well
positioned hellip 787 737MAX A320NEO 777X
Installed base dynamics
1
2
3
4
Deliver on customer value
+ Lowest cost of ownership
+ PredictivityTM outcomes
Grow $installed base
+ Winwin providing technology upgrades and analytics
Expand margins
+ Time-on-wing for GE and customers
+ Cost productivity hellip for GE
Best service execution and delivery
+ Position to support service entry for next-gen products
($ in billions)
54
Solid growth fundamentals
Shop visits Environment Departures
Source IATA amp GE analysis
Passengers IATA RPK YoY
Utilization Avg cycles day YoY
Departures GE and JV-powered flights (MM)
0
5
10
15
20
25
30
35
40
lsquo10 lsquo15F lsquo95 lsquo00 lsquo05
4100
5500
4400
2100
2000
3000
2300 2000
2300
200
100
-1 09 02
2012 2013 2014E
53 52 58
20 21 22
2 of 3 daily flights
powered by GE or GE JVs
46 have not
had 1st shop visit
4 CAGR Number of departures (MM)
lsquo13 rsquo15F rsquo20F
CFM is a 5050 JV between GE and Snecma EA is a 5050 JV between GE and Pratt amp Whitney
55
Solving our customers toughest challenges
Airline direct operating costs
Fuel
40
Delays and cancellations
8
Maintenance
9
Services analytics offerings
Flight Efficiency Services
Performance-based Navigation
Analytics-enabled workscoping
Product and Services strategy
Provide lowest cost-of-ownership through OEM technology
Lead in on-wing reliability
Lead in technology
Best-in-class fuel burn and retention
Engine diagnostic and prognostics
Intelligent Operations
$200Byr
$40Byr
Taleris is a 5050 JV between GE and Accenture
+
56
Services technologies hellip improving value through the lifecycle
Installed base (lsquo13) Upgrades
Fuel Burn improvement
Time- on-wing
8 8 2x
8 3 3x
5 2 2x
A culture of technology insertion Tailored to customer wants
CFM is a 5050 JV between GE and Snecma
Risk transfer $hour coverage
Overhaul Time and material
Materials New used and repaired parts
Asset optimization TRUEngineTM program diagnostics
+
CF6-80C (lsquo86 EIS)
GE90 (lsquo95 EIS)
CFM56 (lsquo84 EIS)
3000
1500
18500
57
Minds amp Machines at GE Aviation
+ Ex
po
sure
Operator A Operator B Part Temperature Cruise Takeoff
Te
mp
era
ture
Threshold
Climb
1000+ software engineers GE Software COE
6300 applied engineers GE Aviation
Data Secure continuous accessible
Physics Apply engine expertise
+ =
Customer and GE benefits
+
Statistics Unlock trends segment
ldquoPhysicsrdquo ldquoAnalyticsrdquo
Time-on-wing
Reliability and availability
Fuel cost
Repair and overhaul
58
Lead in on-wing reliability
Applied analytics to detect engines at risk of removal
Cu
mu
lati
ve
dis
tre
ss
Cycles
Recent successes hellip
CFM is a 5050 JV between GE and Snecma
Segment
GE90
120 CFM56
40 Water wash
$7Myr fuel savings at one GE90 operator
removals saved
removals saved
Nominal environment
Abate
Harsh environment
59
$30MMyr savings
Flight Efficiency Services App
Performance-based Navigation App
Attacking fuel spend with analytics
Joint marketing hellip
ldquoPerfect flightrdquo video
In the news
Newsletter
Oil amp Gas Brian Palmer - Vice President Measurement amp Control Solutions
- In current role since 2010
- 29 years with GE
61
Oil amp Gas Services
Software amp Services as a key differentiator
Key metrics Strategic imperatives ($ in billions)
13 14E
++
Backlog $58 ++
$83 Revenue
1
2
3
4
Deliver on customer value + Customer co-creation
+ Outcome based solutions
Grow $installed base + Drive analytics amp PredixTM
+ Penetrate the installed base
Expand margins + More software and contract offerings
+ Continue to grow backlog double digits
+ Partnerships to accelerate journeyhellip
Meridium
Improve service execution amp delivery + Full lifecycle productivity
+ Simplifying structure
IB growing TMS and Subsea with 13K+ units Software investments creating new IB revenue
streams in addition to traditional parts and service New contractual (CSA) offerings developedlaunched
Installed base dynamics
62
Oil amp gas industry is faced with expanding challenges GE software data and analytics are uniquely positioned to help
Customer challenges Equipment Availability
Equipment Reliability
Operational Efficiency
Production Optimization
Industrial Internet hellip turning data into actionable information Enable no unplanned downtime
Increasing complex operations
Tighter regulations
Skills gap
Machines with data potential
Sources GE OampG analysis based on Wood Mackenzie Rystad Barclays IHS CERA PFC Energy IEA httpwwwgecomstoriesoil-and-gas-innovation Oil and Gas Facilities 2013 httpwwwspeorgogfprintarchives201306
$800B+ Annual industry CAPEX (6-8 growth per year)
$150MM Average annual cost for mid-size LNG facility due to unplanned downtime
5-10 Range of OampG industryrsquos estimated downtime
63
Predixtrade hellip Unified Operations Improved throughput connecting people machines and data
Customer outcomes
Unified Operations ndash A customer co-creation success story
Enhanced safety
Increased availability
Operational visibility
Efficient workforce enablement
Partnering with to tackle these industry challenges and create a solution that increases production and lowers cost driving improved customer outcomes
Unified Customer
Portal
129000 Pieces of equipment in operation globally in
the industry
50 Industry retirement rate in next 10 years
7X Industry fatality rate
above norm
people
machines
data
64
FieldVantagetrade hellip Asset Performance Management (APM) for Onshore
APM ndash Bringing GE expertise from all industries to deliver system level value
Customer outcomes
Enhanced safety
Operational visibility
Improved availability
Optimized performance
Monitoring amp
Diagnostics
Condition Based
Maintenance
Real time Operations
Intelligence
Asset LifeCycle
Management
bull Providing field level visibility and optimization across multiple forms of artificial lift technologies bull Integrated insights provided through common single scalable platform bull 2 year service contract on 200+ wells
Solution Overview
39 NAM OampG Upstream Vehicle Fatalities
hellipby improving
116K New wells in 2014
5 Days Back to production (NAM Avg)
1MM+ Artificially Lifted Wells (Global)
65
Intelligent Pipeline hellip Operations optimization software for pipelines
2TB of data for every
30K miles of pipeline
3-4 annual growth
2MMmiles of
pipelines globally
$40B invested by pipeline companies per year
Source 2TB - Average data volume based on GE internal analysis of multiple pipeline customers Rest - GE OampG analysis based on Douglas Westwood IHS CERA FERC CIA World Factbook PII Pipeline Database (Summary of Infield Systems Global Data DOT databases)
bull 5 year service contract
bull Setting the industry standards for
pipelines real-time intelligence
First customer Customer outcomes
Enhanced safety Proactive versus reactive decisions
Visibility Complete geospatial view and situational awareness
Optimized Ops Effective data driven resource allocation
Efficient OampM Prioritize spending for assets and resources
Moving to proactive solutions with our customers
66
Customer Benefits
Zero unplanned downtime
Increased availability
Increased reliability
Decreased production losses
$14B Additional opportunity driven by
availability and reliability increase (1 of capacity)
Industry Opportunities
Outcome base service bonus
GE Productivity Improvements
Inventory through parts flow optimization
Outage durationfrequency driven by condition- based maintenance
Services Optimization hellip Creating optimal value for GE equipment customers
Journey to 100 reliability through our Contractual Services Agreements (CSA)
Transportation Pete McCabe - Vice President Global Services amp Solutions
- In current role since 2013
- 20 years with GE
68
Transportation Services ($ in billions)
13 14E
+
Revenue $28
Backlog $12B+ +
1
2
3
4
Deliver on customer value
+ Outcomes - velocity fuel reliability
+ System solutions ndash RailConnectTM 360
Grow $installed base
+ Increase penetration ndash Parts amp Smarts
+ Extend asset life ndash modernizations
+ Broaden software solutions ndash rOS
Expand margins
+ Deploy advanced analytics ndash PredixTM
Improve service execution amp delivery
+ Enhance commercial capabilities
+ Expand domain amp IT project expertise
Installed base dynamics
1000+ Tier 4-compliant loco orders
~650 locomotives un-parking in rsquo14
450 new locomotives in South Africa
Key metrics Services imperatives
69
Railroad industry is faced with expanding challenges and customers require a solution provider
Customer challenges
RailConnecttrade360 delivering customer focused outcomes
Asset utilization
Capacity limited
Resource constraints
Ops Complexity
$80B+ N American operating revenue (~4 growth)
7 year high Traffic volumes require unparalleled investment
$56B Annual industrial benefit through 1 improvement
Sources American Association of Railroads (AAR) 2013 industry statistics
70
Asset optimization ndash fuel efficiency
Customer Dynamics RailConnect 360 ndash Trip Optimizer
bull Real-time embedded optimization algorithms
bull Advanced data acquisition enabling train health monitoring
bull Automated train handling reduces wheel amp rail wear
bull $1M diesel locoyear 22K GE locos
bull Emissions
bull Huge operating variation operators trains topography
Trip Optimizer with CSX
Implementation on 1500 CSX locomotives
Reduced fuel use by 7 on average Decreased 3rd largest operating expense
- CSX Sustainability Report 2013
Tr ip Opt imizer Quick Star t Guide (1) Train Speed is available on the speedometer during an active trip during auto and Manual Control
(2) Trip Plan Speed displays a green Trip plan speed pointer on the speed indicator dial in Auto and Manual
modes of operation
(3) Trip Optimizer Status Box is visible when Trip Optimizer system is ACTIVE and provides three types of messages Status Request for Operator InputAction and Error
(4) TrackCivil Speed Limit plot line is Cyan shown the entire horizontal range data permitting
(5) Train Speed (Actual) plot line is White shown only from the head of the train on back
(6) Train Head is shown as a thick White line to allow the operator to see the position of the Train relative to the
terrain The horizontal scale of the rolling chart is zero-referenced to the Head of the Train (corresponds to the forward-facing end of the lead locomotive)
(7) Train Milepost has an associated location and name Its representation on the screen consists of a graphical
pointer and an identifier
(8) OMB Message Box displays operator messages
(9) Consist Notches displays Lead and Trailing locomotive notches
(10) Throttle Handle Notch represents the Master Control-ler handle position During TO Auto Control it will indicate
N8 as TO automatic control requires notch eight (N8) set-ting
(11) Auto Control Notch displays on screen as a White box to denote TO Auto Control engagement and throttle out-
put control
(12) Trip Plan Speed has a Green plot line shown as the entire horizontal range when available and data permit-
ting
(13) Manual Control Zones is shown as a Gray rectangle on the terrain plot extending across the entire vertical range of this section of the chart
(14) Planned Braking depicts Blue areas where Trip Opti-mizer expects that dynamic andor air braking will be
required to maintain the plan speed
(15) Key Locations are softkey states that constitute a unique mapping of functionality to key locations
1 How do I get started To start a trip you will push the Trip Optimizer key on the Main operator screen
2 Do I have to be stopped to request a trip through Trip Optimizer It is preferred to perform a trip init at zero speed however unless otherwise provided by
local ruleinstruction maximum speed for initialization is 15 mph
3 I have performed the Trip Init process and see the rolling map When will I get prompted for Auto Control
Auto Control will become available when the speed is greater than 12 mph and the Throttle handle is N1 or higher
4 Why does the Locomotive Status matter to Trip Optimizer Trip Optimizer will always monitor in train forces speed braking and fuel efficiency To best optimize all of these Train dynamics Trip Optimizer must be told by the operator what the
status of each locomotive in the train The three modes are defined as follows
Running The locomotive is fully operational and is used for calculating TPOB
Isolated The locomotive is either shut-down or is mechanically isolated from produc-
ing Tractive Effort
DB Cutout The locomotive has no Dynamic Braking available but is being used for
producing Tractive Effort
5 What is the recommended way to disengage Auto Control The most fuel efficient way is to decrease the throttle notches in 2 second intervals until
you get to the required speed
6 Trip Optimizer is disengaging from Auto mode and tells the opera-tor Manual Control is required I am already in Notch 8 throttle
What do I do
Press the Current Throttle key on the screen Moving the Master Controller from Notch 8 to
Notch 7 and back could result in un-safe train handling practices
7 Why does Trip Optimizer not always travel at Track speed Trip Optimizer will use the forces of the train and momentum to achieve the optimal speed to save fuel In some cases Idle will be used to meet a planned slow order Trip Optimizer is
always looking out a few miles ahead to plan for the ideal speed while maintaining safe train handling
8 How do I report an inaccuracy on the civil speed limits posted on the rolling map
Contract your Road Manager to report the case
9 The dispatcher has issued an enroute slow order Will Trip Opti-
mizer automatically take this into account
No If an enroute slow order is issued it will be the train crewrsquos responsibility to protect the
train in Manual mode during this affected zone
10 Why does Trip Optimizer automatically end the trip when I still have distance remaining before the preset crew change point
The subdivision has a GPS controlled end point that will automatically end the trip based off of recommendations from the railroad
Follow the steps on the backside of this document to walk you through performing a Trip Init
Trip Optimizer Top Ten List
GE Proprietary Information The information contained in this document is GE Proprietary Information and is disclosed in confidence It is the property of GE and shall not be used disclosed to others or repro-
duced without the express written consent of GE If consent is given for reproduction in whole or in part this notice and the notice set forth on each page of this document shall appear in any such reproduction in whole or in part The information contained in this document may also be controlled by the US export control laws Unauthorized export or re-export is
prohibited Document 5005807 Rev mdash
Before engaging the TO AUTO throttle the operator must meet certain train conditions and under-stand the data displayed on the Trip Optimizer Running Screen
Doc No 5005890 Rev -
71
Operations optimization ndash velocity
Movement Planner with Norfolk Southern
RailConnect 360 - Movement Planner
bull Systems problem hellip beyond human capabilities
bull Majority single track
bull Point solutions have plateaued
bull Integrated suite of day of operations software apps
bull Predixtrade platform - connectivity big data and security
bull Advanced algorithms and automatic routing
bull Proven in class 1 revenue service
Norfolk Southern and Movement Planner
Automated routing decisions
10+ increase in velocity
50+ reduction in expired crews Significant improvement in
schedule adherence
1MPH = ~$200MM estimated
annual savings in capital amp expenses
Based on 3 year study in NS GA division
Customer Dynamics
72
bull Co-development GE Transportation amp GE Intelligent Platforms
minus Enhanced sensor coverage
minus Improved data acquisition higher resolution
minus Advanced analytics
bull Asset specific insight drives fault reduction and enables CBM
(SmartSignal)
bull 20K+ overhauls in backlog
bull OH interval based on average expected condition
bull $1B+ capital expenditure in North America every year
Impact Reduced unplanned
downtime amp avoid road failures
Reduce unscheduled material consumption
Extended periodicity and associated expenses
ldquoPhysicsrdquo change
Real Time Engine Performance
Bearing Temp
Bearing Temp
Load
Ambient
To
da
y
To
mo
rro
w
Alarm trigger
Savings
CSA ndash shared productivity
Lifecycle Cost Dynamics ndash Engine Overhauls RailConnect 360 ndash Advanced Analytics
GErsquos 1 Jamie Miller - Senior Vice President Chief Information Officer
- In current role since 2013
- 9 years with GE
74
Digital opportunity
Simplifying structure
More valuable GE resources with fully integrated approach
+ Utilize data from products
+ Field services tools
+ CRM configurators
+ Brilliant Factory
Benefits
ERPmanufacturing 90
Data Centers 80
Applications 30
Shared Services 65
Cloud 70
Product Cost
RampD
SGampA
+ Engineering tools
+ Shared Services GL
+ Cyber Security
IT plays
-a)
(a - Target percent of new applications that are Cloud enabled
~$94B
Industrial cost
75
Three opportunities to power manufacturing
Digital Foundation 1
Unlocking Big Data
minus Sourcing
minus Productivity
2
Powering the Brilliant Factory
minus Design for manufacturing
minus Sensor enablement
minus Plantsupply chain optimization
3
minus 90 reduction in ERPs
Supply Chain Network
Virtual Mfg
Virtual Product Design
76
Product Cost ERP investments paying off
Inventory turns 6x 7x
Shipment on time 58 85
Foundation for business to deliver $1B+ savings over past 5 years
GE Healthcare
of revenue on target ERP ~75
~95
2009 Today
Today 219 ERPs 2016 34 ERPs
GE Water
2008 Today
22
1
of ERPs
SGampA of sales ~10 pts
Past dues 60
Finance headcount 50
77
Product Cost Using big data to run GE
Ingest Store Clean Consume
1 OampG data lake $8B direct materials buy
Real time More cheaper Faster GE-wide Analytics Data science
$60B total material buy across GE hellip $1B+ cash amp deflation opportunities
bull 23 source systems
bull Full visibility ndash 3 weeks
bull Commodity part supplier
bull Data lake technology
bull Machine learning for data cleansing
bull EM PampW underway (Alstom)
Oil amp Gas
Xxxxx Xxxxx Xxxxx xxxxx
78
Product Cost Technology powering the Brilliant Factory
20 NPI cycle hellip 20 efficiency
16 pilots launched hellip Fastworks 2020 Vision
FastWorks approach
Virtual design for manufacturing
30 NPI cycle time
Eliminated quality escapes
Wilmington NC
Aviation Machining
Factory optimization
25 productivity
PampE avoidance Greenville SC
PampW Nozzle Cell
machine downtime
25 opportunity
Sensor Enablement
Grove City PA
Transportation Remanufacturing
79
Smart Outage Full deployment at PGS
Changing the way we deliver Services
On track for $1B CSA productivity over 3 years and 10 customer uptime
+ +
Predictive Workscope Aviation 4 customers
full roll-out mid-2015
=
Field services optimization
Predictive workscope
Next generation modeling
Advanced technology
Accelerating productivity
80
We can do more ldquoSrdquo with less ldquoG+Ardquo
45 win rate
80 in quote time
5400+ SalesComm Ops hoursweek
QuickQuote
40K+ GE Commercial FTE
Highly manual long-cycle-time
More ldquoshots on goalrdquo lower cost
Investing in digital tools for commercial teams
Wrap up
82
Value for investors
Payback through most reliable revenue source Services
+ Increase revenue growth
+ Improve margins
+ CSA productivity
Funded software amp analytics through simplification amp reallocation
Potential upside beyond the GE installed base
Scale amp intellect Return on investment
1
2
3
GE Software COE
+ COE can accomplish scale hellip none of
our businesses could do this on their
own hellip attract talent amp spread ideas
+ Advantage to being an early mover hellip
right partnerships amp scale
+ Changing GE Industrial DNA hellip
greater impact from digital amp
analytical investments
83
Why GE
+ More valuable portfolio hellip 75 Industrial while growing EPS
+ Tangible evidence of winning NPI hellip Tier 4 LEAP etc
+ Strong amp diversified global footprint hellip best-in-class
+ Transforming service for next generation of growth
+ Culture of simplification impacting every part of GE
LEAP is a trademark of CFM International
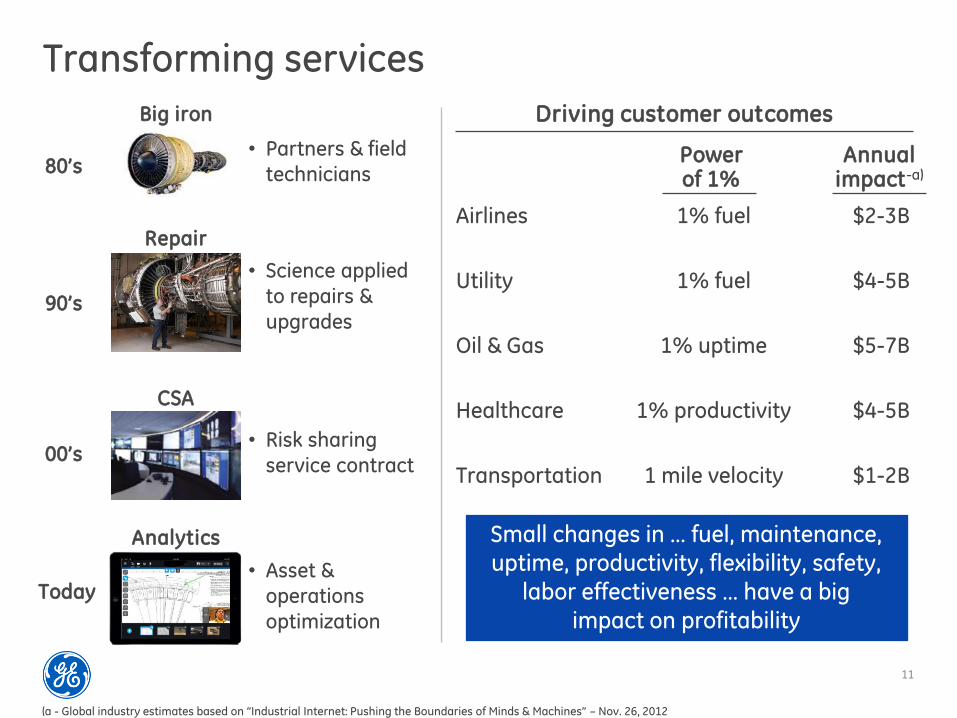
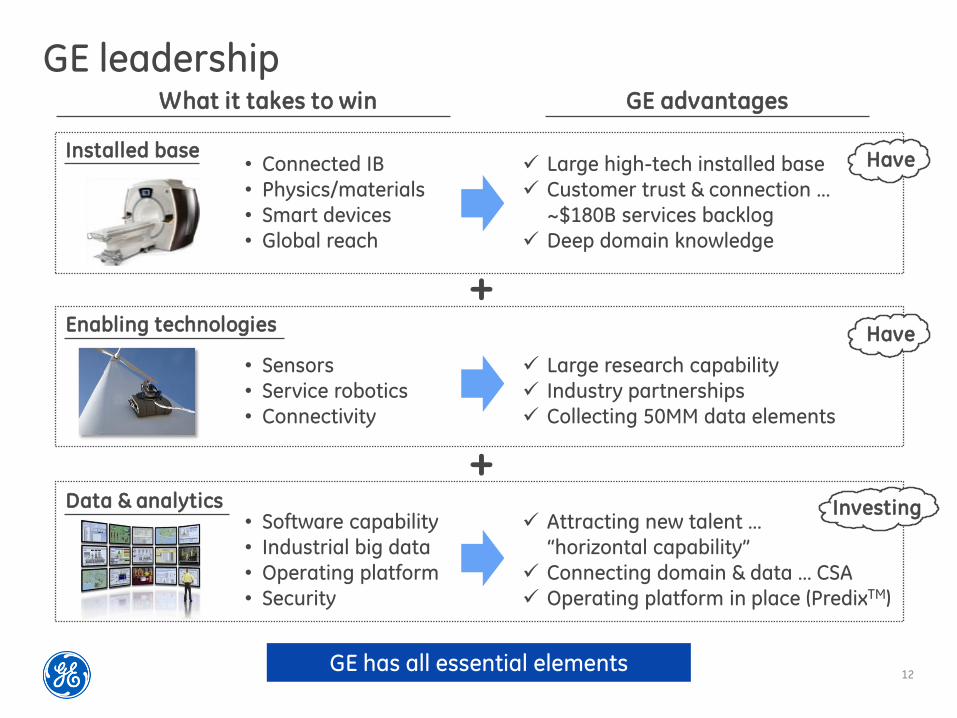
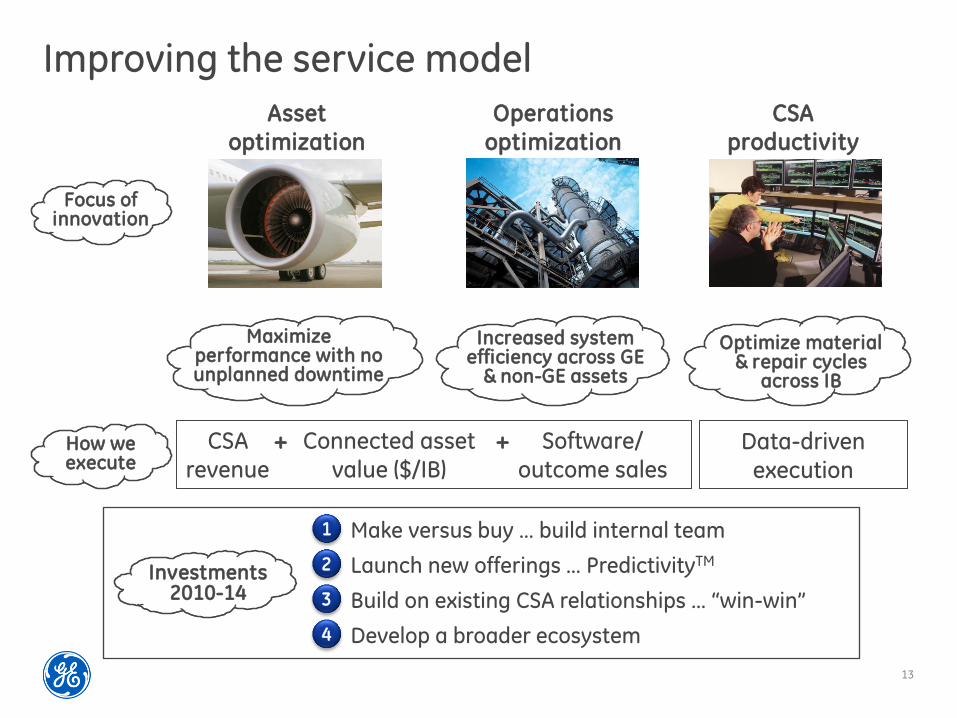

15
Impacting GErsquos 1
$94B of cost
$12B of working capital
$20B of PampE investments
GErsquos 1
Analytics amp
security
IT investment ($2B+year)
+
Reduce structure
Lower product cost
Improve margins
Enhance engineering productivity
Faster amp safer
Impact
Every Industrial company a Software amp Analytical company
16
Investor value
Increase services growth rate
+ More $installed base
+ $08B PredictivityTM solutions revenue growing to $4-5B
+ Penetrate aged GE fleet
+ Grow beyond the GE IB
Improve services margins
+ CSA productivity
+ Improve quality
Potential for industry value
+ Scale beyond GE installed base Backlog Revenue Margins
Services franchise
~$180B
~$45B
~30
Value creation
+
1
2
3
Software amp analytics accelerate services growth margins amp returns
Revenue growth ~5 Margin expansion ~50 bps Limited by IB growth
Historic performance
Services overview
18
Services growth
05 08 11 13
($ in billions)
Revenue
~26 ~30
OP
GE advantages
+ Installed base
+ Technology
+ CSA model
+ Footprint amp scale
+ Software COE
+ Fleet data
$27
$35
$42 $45
Services imperatives
Backlog
1
2
3
Deliver on customer value + Link services to outcomes + Global deployment
Grow $installed base + Drive analytics amp PredixTM value + Penetrate aged installed base
Expand margins + Leverage analytics to manage
performance + Invest in productivity tools
Improve service execution amp delivery + Enhance commercial capabilities + Increase field services capability
Spread ideas across GE
$87 $121 $147 $180
4
5
19
Services Council
Driving differentiated advantage
Cross-business initiatives
20+ services leaders
Teams aligned to 9 themes
Quarterly executive updates hellip operational rigor
Spreading ideas hellip
bull Core growth
bull Operations
bull Tools + process
bull CSA excellence
Data +
Outcomes
bull PredixTM + Cloud
bull PredictivityTM solutions
bull Strategic alliances + BD
Hardware amp domain expertise
Software analytics based
Healthcare Inspection technology
Aviation Repair technology
Power amp Water Global footprint
bull Multimodal ndash service amp repair shops
bull Customer training centers
bull Additive manufacturing
bull Robotic welding
bull Advanced coatings
bull Parts inspection amp measurement
bull Condition-based maintenance
Pune India
20
Enabling technologies Service Robotics Sensing amp Controls Advanced Manufacturing
Inspection Repair Mobile Tools
Launch amp learn hellip then accelerate to all GE businesses
Automated adaptive + Productivity + Less downtime
High tech integrated + Lower fuel usage + Higher efficiency
Productivity safety + Repetitive tasks + Tough environment
Additive new materials + Repair vs scrap + Longer service life
Deployable fast accurate + More digital data + Less downtime
Connected digital + Instant expert access + Lower service costs
21
Increase value of CSA
Benefits for Customers Benefits for GE
Monitoring amp diagnostics
$180B Services backlog
Fuel efficiency
Hardware amp software upgrades
Condition-based work scope
Mobile amp analytical tools
Material productivity
Optimized asset performance
Predictive analytics ndash lower downtime
More output
Lower costs
Lower emissions
Better payback on hardware upgrades
Instant software upgrade capability
Shorter duration outages
Less material usage
Ask an Expert ndash COE
Field Service productivity
Analytics driven parts life extension + performance
Repair vs scrap
22
Segment services dynamics (Services revenue $ in billions)
Power amp Water $125
Oil amp Gas $83
Energy Management
2013
$21
+ Sustained passenger growth
+ Improving airline profitability
+ Upgrades amp analytics
Aviation $108
+ Growth markets strong
+ Improving HCIT
minus Developed challenging
Healthcare $80
+ North America utilization
+ Analytics penetration
minus Mining parts
Transportation
$28
2013
2013
2013
2013
2013
2013
+ Continued AGP growth
+ Upgrades amp analytics
Europe
+ Strong Subsea
+ MampC improving
+ Analytics penetration
+ Marine offshore
minus Mining amp motor repairs
23
Presentation
Common capability Software COE
Analytics commercialization
Bill Ruh
Kate Johnson
Business execution
Strategy overview
Customer outcomes
Examples of analytics driving growth amp productivity
Competitive advantage
Power amp Water
Healthcare
Aviation
Oil amp Gas
Transportation
Paul McElhinney
Jan De Witte
Kevin McAllister
Brian Palmer
Pete McCabe
Common capability GErsquos 1 Jamie Miller
Software amp PredixTM
Bill Ruh - VP Global Software Center
- 3 years with GE
- 32 years of industry experience
Kate Johnson - VP GE Commercial Officer
- 1 year with GE
- 15 years of industry experience
25
The Industrial Internet
3 Hyper connectivity a living network of the worldrsquos machines data amp people
Internet
Increasing system intelligence through embedded software hellip advanced sensors
controls and software applications
Brilliant Machines
Democratization of data hellip high frequency real-time data
Big Data
Predictive algorithms hellip physics-based analytics hellip deep domain expertise on big industrial data
Analytics
People at work Connecting people at work or on
the move Supporting more
intelligent design higher service
quality operations amp safety
maintenance
1
2
3
4
5
26
61
45
31 28 31 40 42
29
29
45 63
56 56
47 45
41
10 6 6
16 9 10 9
24
Software outlook Customer survey Importance of
Big Data analytics relative to other priorities
Source Accenture 2015 Trend Report Gartner Big Data Survey
Aviation
3 3 3 3 6
Wind
Power Generation
Power Distribution
Oil amp Gas
Rail
Manufacturing
Healthcare
Highest priority Within the top 3 priorities Within the top 5 priorities Not a top priority
Opex is becoming a deciding
factor for IT investments as
80 of budget is allocated to
managing and running
complex technologies Source Gartner
Advanced analytics and
analytical applications
expected to see double digit
revenue growth Source Gartner
APM market category
expected to reach $300B
by 2020 Source Gartner
27
Industrial customersrsquo perspective Survey of GErsquos customers regarding applications
Real-Time Operator Intelligence
Remote Monitoring amp Diagnostics
Condition-Based Maintenance
Asset Lifecycle Management
Schedule Optimization
Energy Management
Process Control Automation
Field Force Automation 32
38
42
43
49
59
66
70 Tailor Pre-Built Applications
Have A Systems Integrator Build
Your Apps
Build My Own Custom Apps 15
54
85
HOW do you want to consume it WHAT functionality is most valuable
Asset performance management is the killer industrial app
28
What industrial customers want
SDM
SDM
SDM
SDM SDM
Software Defined Machines (SDMs)
ldquoLink up all my assets and devicesrdquo
REAL-TIME
OPERATIONAL
INTELLIGENCE
CONDITION-
BASED
MONITORING
ASSET LIFECYCLE
MANAGEMENT
MONITORING amp
DIAGNOSTICS
Industrial Apps
SDM Non-GE Assets enabled by PredixTM Machine SDM
SDM GE Assets enabled by PredixTM Machine SDM
PredixTM powers Asset Performance Management (APM)
29
Insights into value
Improving safety and
productivity across 15K miles
of interstate natural gas
pipelines
Potential Savings
77 gallons of fuel and 1628
lbs of CO2 per approach
10 increase in network
velocity 50 reduction in
expired crews amp significant
improvements in on-time
performance
Up to 4 increase in power
output across 283 wind
turbines hellip 40+ GWhr annual
increase
Asset Performance Management (APM)
REAL-TIME OPERATIONAL
INTELLIGENCE
CONDITION-BASED
MONITORING
ASSET LIFECYCLE MANAGEMENT
MONITORING amp
DIAGNOSTICS
Operations Optimization
INSIGHT PROCESS
INTEGRATION
AUTOMATION COLLABORATION
PredixTM Platform
PredixTM Machine PredixTM Net
GE
Non-GE
PredixTM Asset PredixTM Insight
PredixTM Fabric PredixTM Core
PredixTM Experience
Predixtrade hellip the GE advantage
Release in 2015
Public Cloud Private Cloud
Commercially available to connect more machines more data amp more people
TR
AN
SF
OR
MS
PO
WE
RS
PredictivityTM Solutions
30
Predictivitytrade hellip app factory
Asset optimization (28)
Operations optimization (14)
Productivity tools (77)
Approach Development process
Agile amp Extreme Programming
Design Center for delivering
compelling user interface
Cyber security Blue team to build
and Red team to test
90-120 day service engagement to production roll out
+
+
+
Co-innovation process to design
build transfer and iterate
Actionable insight on equipment based
on physics and analytic modeling
with industrial data
Outcome based process improvements
to plants pipelines fleets fields facilities
grids shops
Increase service throughput efficiency
and quality at optimized cost of
delivery
Delivering industry apps at speed and scale
31
World-class Software amp Analytics organization
Investing in Leadership Talent
Colin Parris (IBM)
SW Research
Co-located SW CTOs for business alignment
D Bartlett
(IBM)
Aviation
World-class technical resources
Computational amp analytics scientists
Platform developers
Software engineers
~10000
1000+ Biz
COE
Product Dev Software CTO
Brad Surak (SAP)
Harel Kodesh (Microsoft
Start Up Veteran)
Trans S Chotai
(HP)
OampG J Demesa
(Siemens)
PampW G Bell
(ServiceSource)
EM J Stone
(SAP)
HC E Eryurek
(GE)
+
+
- Cyber UX Data Science Agile development
Four deep core competencies ecosystem
1
Leading edge platform + world-
class ecosystem 2
Advanced research for building
the future 3
Advanced process to drive adoption amp enablement
4
Software Site
Organization
Technology amp Ecosystem
32
Wurldtech protecting critical infrastructure
World-class cyber security to operate assets + operations safely
About A GE Company acquired in May 2014 providing top cyber talent
Capability Assess protect amp certify critical infrastructure from cyber attack
Key Customers 4 of 6 top global OampG companies 9 of top 10 automation vendors
Security enhancements delivered through PredixTM and GE Products
Certify GE and non-GE products and customer environments
Identify vulnerabilities in OT products (GE and 3rd party)
Assess and prioritize risks for system operators
Achilles Industrial Next Gen Firewall to inspect and control
Industrial network traffic
Leverage industry leading threat intelligence
Protect operational
environments
Secure amp certify industrial products
Assess products amp operations for vulnerabilities
33
Partnerships amp Alliances
Intel ATampT AWS Cisco others
Venture Capital
Mergers amp Acquisitions
ThetaRay Mocana Frost
Strategic Moves
Wurldtech Austin Digital
Acquire capability to fill gaps
Pivotal Softbank Industrial Internet Consortium
Industrial internet ecosystem
Industry Ecosphere
Establish interoperable amp scalable solutions
Co-development amp go-to-market
Accelerate innovation amp success
Positioned to create value
Open PredixTM beyond GE
GE will sell
+ + Connected devices
Data Under Management
Performance Applications
PredixTM Machine Services
PredixTM Data Services
PredixTM Asset Services
Connect assets regardless of vendor or
vintage and provide value-added services
Aggregate and analyze data to produce
actionable business insights
Sell horizontal apps that maximize return
on assets and people
1
2
3
34
Competitive advantage
$1T Connected
Machines
managed by GE
replacement value
10M Sensors
collecting
50M Data
Elements
$20B Potential
Annual Customer Savings
50B Machines will be connected on the internet by 2020
2X Industrial data growth within next 10 years
Big Iron + Big Data = Big Outcomes
INDUSTRY GE
35
New ways to sell Services
2 Making Markets Different Economics
3 Co-creation amp Agile Development
4 Solution Architecture
5 Value Based Deal Shapes
6 New Industry Ecosystems
1 New Buyers and Influencers
GE Commercial Center of Excellence
Needs Target Architect Close
Qualification amp Pipeline Management
Sales Process
HireTrain Community of Experts
Enablement Toolkit
36
Accelerating time to value across channels
APM Subscription Services
Enterprise Analytics Projects
Upgrade value in CSAs
GE Sales Model
Existing Services sales team
New standalone software sales specialists
New outcome sellers + existing service sales team
Sales
acceleration
Expert SWAT
teams to
support deal
SW experts compelling
offer target one outcome
to land and expand
Ecosystem partners
SW COE app factory
Offering RMampD in CSA upside
and productivity Per well subscription
Enterprise SW deal
solution co-creation
ReliabilityMaxtrade FieldVantageTM Intelligent PipelineTM
GE OampG Example
Market
Opportunity $2B $600MM $27B
37
Measuring commercial success
Services revenue
Past Future
~5
+
rsquo13 rsquo17F
Assets under management $1T+ ++
PredictivityTM solutions revenue $08B ~$4-5B
Services backlog $180B ++
bull Adding more value to existing service relationships hellip training team to get more out of the installed base
bull Creating new revenue streams and building new commercial skills and incentive plans to accelerate growth
Outcome sellers solution architects product management amp marketing
bull Cultivate ecosystem to help accelerate commercially with access to CIOCTO relationships and system integration skills
Power amp Water Paul McElhinney - President amp CEO Power
Generation Services
- In current role since May 2014
- 26 years with GE
39
Power amp Water Services
Growing services amp delivering greater customer value
Key metrics Services imperatives ($ in billions)
13 14E
+
Backlog $53 +
Revenue $125
Installed base dynamics
1
2
3
4
Deliver on customer value + Develop flexible solutions
+ Reduce customer operating cost
Grow $installed base + Maximize impact of Alstom alliance + Invest in new service offerings
Expand margins + Tech upgrades amp software solutions + Outage excellence
Improve service execution amp delivery + Improved customer service levels
+ Optimize field service amp repair network
Unit growth up ~24X from 2008
Strong DP amp Wind growthhellip up ~1Kyear
~4000+ gas turbines in service
40
Global power industry is facing complex challengeshellip Offering innovative solutions to address customersrsquo needs
Fuel price uncertainty
Increasing regulation
Slow demand growth
Aging installed base
~15 years Average age of ~4K global GE gas turbines
Output
Efficiency
Reliability
Availability
Flexibility
Improving customersrsquo outcomes while decreasing costs
~$7B
Customer challenges
~$8B
~$2B
~$1B
~$2B
GE Predictivitytrade solutions amp industry benefit
~60+ Increase in US natural gas price since 2012
~(30) Thermal capacity in Europe since lsquorsquo08
Based on 10 year NPV
41
Investing in technology
Addressing multiple customer value levers
Advanced Gas Path (AGP) Industry leading output hellip up to +64 Industry leading efficiency hellip up to +18 Extends asset amp parts life hellip 96K hours
1
Op Flex Delivers flexibility to costs amp revenue Reduces start up time amp fuel consumption Expands fuel source opportunity
3
Dry Low NOx 26+ (DLN) Reduces NOx emissions by 40 Delivers industry leading flexibility Increases maintenance intervals to ~1250 starts
2
42
Power FlexEfficiencytrade Advanced Gas Path
Expanding the operating envelope
Ambient Temperature
Ou
tpu
t (M
W)
Op Flex
7FA03 baseline
AGP
+ ndash
+
Combining hardware and software hellip creating 2X the value
$17
$30
Op Flex
Average Customer Annual Value Per Unit ($MM)
Improving customer outcomes
AGP (Hardware)
AGP PredictivityTM
Solution
125+ AGPs with software sold to date
650000+ operating hours to date
43
Wind PowerUp hellip generating more output
Customer Outcome Up to 4
increase in power output across 283
wind turbines hellip 40+ GWhr annual increase ldquoThe PowerUp system offers a great chance for owners like us who are investing literally billions of dollars in this market to try and get more production out of existing assets GE took a lot of risk out of this for usrdquo
ndash Patrick Woodson CEO EON Climate amp Renewables
Opportunity for up to
20 more profit from up to
5 more output
A performance based
cooperative approach
with a holistic view of the
assets system and network
Flexible payment options
aligned to customer needs
+1400 turbines under contract since launch
Customer opportunity
Software enabled
Flexible platform
Proven results
Scale out
1
2
3
Healthcare Jan De Witte - President amp CEO Healthcare IT
- In current role since 2011
- 15 years with GE
45
Healthcare Services
Delivering value = higher quality outcomes at lower cost
Key metrics Services imperatives ($ in billions)
Backlog $11 +
Installed base dynamics
1
2
3
4
Deliver on customer value + Asset and workflow optimization + Analytics around EMRs amp Devices
Grow $installed base
+ Quality and analytics offerings + Solutions architecture amp delivery
Expand margins + Remote service amp SaaS models + Field services productivity Improve service execution amp delivery + Remote monitoring technologies + Field force deployment optimization
Emerging markets infrastructure build
Mature markets quality upgrades
ACA amp Enterprise Solutions IT penetration
13 14E
=+ Revenue $80
46
Healthcare industry shifting to value-based care GE software analytics and services are uniquely positioned to help
Customer challenges
Integrated Care Solutions hellip turning data into actionable insight Improving healthcare outcomes
Diagnostic quality
Patient-centric care
System profitability
Chronic Disease Management
Sources Institute of Medicine 2013 Porter Research 2013 McKinsey IHS Global Insight
29 Healthcare spend wasted each year
$260B Annual value creation through healthcare IT
59 US lives covered in value-based care model by 2015
Clinical Quality
Financial Performance
Operational Efficiency
Configurable Workflows
47
GEHC Software portfolio positioned along main outcome drivers for care systems
Diagnostic speed amp confidence
Productive care pathways
Wellness amp chronic disease management
Risk amp margin management
Costworkforce optimization
Population Health Management
Workflow
Archiving
Visualization
Financial Management
Care Delivery Management
Enterprise Imaging
Operations Management
Revenue Cycle
Risk assessment
Margin analytics
Workforce optimization
Asset Management
Integrated Care Solutions
Ambulatory Care
High Acuity Care
Cardiology
Analytics
Care coordin
Engagement
Providing caregivers the right actionable insight ndash when amp where they need it
Large GE device footprint generating
clinical data
HCIT domain in clinical workflow amp analytics
SW CoEPredixTM capabilities + +
48
Enterprise Imaging Improving diagnostic workflow in the cloud
Customer Challenges Cloud Case Exchange CentricityTM 360
Sample Customers Solution Architecture
Clinical Collaboration amp Advanced Analytics
Imaging Cost Control
Archive
Workflow
19 Time spent
gathering data
Workflow
velocity
Diagnostic
confidence
Cases diagnosed
incorrectly 35
~$2B segment by rsquo18 growing 25+
30 turn-around time
3 duplicate exams
Customer value $10MM+ cost pa
Image-as-a-Service lifecycle value $20MM+
Care quality
Cost
Source Research from the Journal of the American College of Radiology and the Journal of American Medicine
49
Customer Challenges Workforce management
Sample Customers
Operations Management Optimizing workforce productivity with API Healthcare
54 Hospital
operating cost
spent on labor
Solution Architecture
Real-Time Analytics Labor amp Patient Workflows
Time amp Attendance
Staffing amp Scheduling
HR amp Payroll
~$2B segment by rsquo18 growing 12+
20 Workforce productivity
Customer value $4MM cost pa
Workforce-mgmt services lifecycle $4MM+
80 Overtime wages
Matching care-giver capacity
amp patient need
Care quality
Labor
productivity
Source Beckerrsquos Hospital Review
50
Population Health Management Lowering the cost of chronic disease
Customer Challenges
Solution Architecture
Caradigm Analytics amp Care Mgt
Proactive
intervention
Care protocol
compliance
75 Cents of every
healthcare dollar
spent on chronic
disease
Care Mgt Analytics Risk Cohort
25
Customer value $5MM+ cost pa
Caradigm lifecycle value $18MM+
Patients per care manager
~$30B segment by 2025 growing 19+
Sample Customers
40 Hospitalization for chronic patients
Chronic disease
treatment cost
Source National Diabetes Fact Sheet
51
Software enabling productivity in service process
Wo
rkfo
rce
Pla
nn
ing
amp
Dis
pa
tch
Historically up to 40 FE travel time hellip utilize analytics to optimize allocation
Smart dispatch with effective job-skill matching
Optimize field force capacity and response time to customers
Call Generation (Planned amp Unplanned)
Deploy
RepairFix
Diagnose
CloseDebriefBill
Pe
rfo
rma
nce
M
on
ito
rin
g 110k GEHC devices connected remotely
MR hellip 900 data points monitored per machine 30k alertsyear proactively fixed
Improves GE productivity while minimizing customer down-time
Healthcare Services margins improving
Aviation Kevin McAllister - President amp CEO Aviation Services
- In current role since May 2014
- 25 years with GE
53
Aviation Services
13 14E
+ $108
Backlog $97 +
Revenue
Key metrics Services imperatives
Commercial IB hellip 34000 engines
Young hellip 46 havenrsquot had 1st shop visit
Fuel cost driving investment hellip GE well
positioned hellip 787 737MAX A320NEO 777X
Installed base dynamics
1
2
3
4
Deliver on customer value
+ Lowest cost of ownership
+ PredictivityTM outcomes
Grow $installed base
+ Winwin providing technology upgrades and analytics
Expand margins
+ Time-on-wing for GE and customers
+ Cost productivity hellip for GE
Best service execution and delivery
+ Position to support service entry for next-gen products
($ in billions)
54
Solid growth fundamentals
Shop visits Environment Departures
Source IATA amp GE analysis
Passengers IATA RPK YoY
Utilization Avg cycles day YoY
Departures GE and JV-powered flights (MM)
0
5
10
15
20
25
30
35
40
lsquo10 lsquo15F lsquo95 lsquo00 lsquo05
4100
5500
4400
2100
2000
3000
2300 2000
2300
200
100
-1 09 02
2012 2013 2014E
53 52 58
20 21 22
2 of 3 daily flights
powered by GE or GE JVs
46 have not
had 1st shop visit
4 CAGR Number of departures (MM)
lsquo13 rsquo15F rsquo20F
CFM is a 5050 JV between GE and Snecma EA is a 5050 JV between GE and Pratt amp Whitney
55
Solving our customers toughest challenges
Airline direct operating costs
Fuel
40
Delays and cancellations
8
Maintenance
9
Services analytics offerings
Flight Efficiency Services
Performance-based Navigation
Analytics-enabled workscoping
Product and Services strategy
Provide lowest cost-of-ownership through OEM technology
Lead in on-wing reliability
Lead in technology
Best-in-class fuel burn and retention
Engine diagnostic and prognostics
Intelligent Operations
$200Byr
$40Byr
Taleris is a 5050 JV between GE and Accenture
+
56
Services technologies hellip improving value through the lifecycle
Installed base (lsquo13) Upgrades
Fuel Burn improvement
Time- on-wing
8 8 2x
8 3 3x
5 2 2x
A culture of technology insertion Tailored to customer wants
CFM is a 5050 JV between GE and Snecma
Risk transfer $hour coverage
Overhaul Time and material
Materials New used and repaired parts
Asset optimization TRUEngineTM program diagnostics
+
CF6-80C (lsquo86 EIS)
GE90 (lsquo95 EIS)
CFM56 (lsquo84 EIS)
3000
1500
18500
57
Minds amp Machines at GE Aviation
+ Ex
po
sure
Operator A Operator B Part Temperature Cruise Takeoff
Te
mp
era
ture
Threshold
Climb
1000+ software engineers GE Software COE
6300 applied engineers GE Aviation
Data Secure continuous accessible
Physics Apply engine expertise
+ =
Customer and GE benefits
+
Statistics Unlock trends segment
ldquoPhysicsrdquo ldquoAnalyticsrdquo
Time-on-wing
Reliability and availability
Fuel cost
Repair and overhaul
58
Lead in on-wing reliability
Applied analytics to detect engines at risk of removal
Cu
mu
lati
ve
dis
tre
ss
Cycles
Recent successes hellip
CFM is a 5050 JV between GE and Snecma
Segment
GE90
120 CFM56
40 Water wash
$7Myr fuel savings at one GE90 operator
removals saved
removals saved
Nominal environment
Abate
Harsh environment
59
$30MMyr savings
Flight Efficiency Services App
Performance-based Navigation App
Attacking fuel spend with analytics
Joint marketing hellip
ldquoPerfect flightrdquo video
In the news
Newsletter
Oil amp Gas Brian Palmer - Vice President Measurement amp Control Solutions
- In current role since 2010
- 29 years with GE
61
Oil amp Gas Services
Software amp Services as a key differentiator
Key metrics Strategic imperatives ($ in billions)
13 14E
++
Backlog $58 ++
$83 Revenue
1
2
3
4
Deliver on customer value + Customer co-creation
+ Outcome based solutions
Grow $installed base + Drive analytics amp PredixTM
+ Penetrate the installed base
Expand margins + More software and contract offerings
+ Continue to grow backlog double digits
+ Partnerships to accelerate journeyhellip
Meridium
Improve service execution amp delivery + Full lifecycle productivity
+ Simplifying structure
IB growing TMS and Subsea with 13K+ units Software investments creating new IB revenue
streams in addition to traditional parts and service New contractual (CSA) offerings developedlaunched
Installed base dynamics
62
Oil amp gas industry is faced with expanding challenges GE software data and analytics are uniquely positioned to help
Customer challenges Equipment Availability
Equipment Reliability
Operational Efficiency
Production Optimization
Industrial Internet hellip turning data into actionable information Enable no unplanned downtime
Increasing complex operations
Tighter regulations
Skills gap
Machines with data potential
Sources GE OampG analysis based on Wood Mackenzie Rystad Barclays IHS CERA PFC Energy IEA httpwwwgecomstoriesoil-and-gas-innovation Oil and Gas Facilities 2013 httpwwwspeorgogfprintarchives201306
$800B+ Annual industry CAPEX (6-8 growth per year)
$150MM Average annual cost for mid-size LNG facility due to unplanned downtime
5-10 Range of OampG industryrsquos estimated downtime
63
Predixtrade hellip Unified Operations Improved throughput connecting people machines and data
Customer outcomes
Unified Operations ndash A customer co-creation success story
Enhanced safety
Increased availability
Operational visibility
Efficient workforce enablement
Partnering with to tackle these industry challenges and create a solution that increases production and lowers cost driving improved customer outcomes
Unified Customer
Portal
129000 Pieces of equipment in operation globally in
the industry
50 Industry retirement rate in next 10 years
7X Industry fatality rate
above norm
people
machines
data
64
FieldVantagetrade hellip Asset Performance Management (APM) for Onshore
APM ndash Bringing GE expertise from all industries to deliver system level value
Customer outcomes
Enhanced safety
Operational visibility
Improved availability
Optimized performance
Monitoring amp
Diagnostics
Condition Based
Maintenance
Real time Operations
Intelligence
Asset LifeCycle
Management
bull Providing field level visibility and optimization across multiple forms of artificial lift technologies bull Integrated insights provided through common single scalable platform bull 2 year service contract on 200+ wells
Solution Overview
39 NAM OampG Upstream Vehicle Fatalities
hellipby improving
116K New wells in 2014
5 Days Back to production (NAM Avg)
1MM+ Artificially Lifted Wells (Global)
65
Intelligent Pipeline hellip Operations optimization software for pipelines
2TB of data for every
30K miles of pipeline
3-4 annual growth
2MMmiles of
pipelines globally
$40B invested by pipeline companies per year
Source 2TB - Average data volume based on GE internal analysis of multiple pipeline customers Rest - GE OampG analysis based on Douglas Westwood IHS CERA FERC CIA World Factbook PII Pipeline Database (Summary of Infield Systems Global Data DOT databases)
bull 5 year service contract
bull Setting the industry standards for
pipelines real-time intelligence
First customer Customer outcomes
Enhanced safety Proactive versus reactive decisions
Visibility Complete geospatial view and situational awareness
Optimized Ops Effective data driven resource allocation
Efficient OampM Prioritize spending for assets and resources
Moving to proactive solutions with our customers
66
Customer Benefits
Zero unplanned downtime
Increased availability
Increased reliability
Decreased production losses
$14B Additional opportunity driven by
availability and reliability increase (1 of capacity)
Industry Opportunities
Outcome base service bonus
GE Productivity Improvements
Inventory through parts flow optimization
Outage durationfrequency driven by condition- based maintenance
Services Optimization hellip Creating optimal value for GE equipment customers
Journey to 100 reliability through our Contractual Services Agreements (CSA)
Transportation Pete McCabe - Vice President Global Services amp Solutions
- In current role since 2013
- 20 years with GE
68
Transportation Services ($ in billions)
13 14E
+
Revenue $28
Backlog $12B+ +
1
2
3
4
Deliver on customer value
+ Outcomes - velocity fuel reliability
+ System solutions ndash RailConnectTM 360
Grow $installed base
+ Increase penetration ndash Parts amp Smarts
+ Extend asset life ndash modernizations
+ Broaden software solutions ndash rOS
Expand margins
+ Deploy advanced analytics ndash PredixTM
Improve service execution amp delivery
+ Enhance commercial capabilities
+ Expand domain amp IT project expertise
Installed base dynamics
1000+ Tier 4-compliant loco orders
~650 locomotives un-parking in rsquo14
450 new locomotives in South Africa
Key metrics Services imperatives
69
Railroad industry is faced with expanding challenges and customers require a solution provider
Customer challenges
RailConnecttrade360 delivering customer focused outcomes
Asset utilization
Capacity limited
Resource constraints
Ops Complexity
$80B+ N American operating revenue (~4 growth)
7 year high Traffic volumes require unparalleled investment
$56B Annual industrial benefit through 1 improvement
Sources American Association of Railroads (AAR) 2013 industry statistics
70
Asset optimization ndash fuel efficiency
Customer Dynamics RailConnect 360 ndash Trip Optimizer
bull Real-time embedded optimization algorithms
bull Advanced data acquisition enabling train health monitoring
bull Automated train handling reduces wheel amp rail wear
bull $1M diesel locoyear 22K GE locos
bull Emissions
bull Huge operating variation operators trains topography
Trip Optimizer with CSX
Implementation on 1500 CSX locomotives
Reduced fuel use by 7 on average Decreased 3rd largest operating expense
- CSX Sustainability Report 2013
Tr ip Opt imizer Quick Star t Guide (1) Train Speed is available on the speedometer during an active trip during auto and Manual Control
(2) Trip Plan Speed displays a green Trip plan speed pointer on the speed indicator dial in Auto and Manual
modes of operation
(3) Trip Optimizer Status Box is visible when Trip Optimizer system is ACTIVE and provides three types of messages Status Request for Operator InputAction and Error
(4) TrackCivil Speed Limit plot line is Cyan shown the entire horizontal range data permitting
(5) Train Speed (Actual) plot line is White shown only from the head of the train on back
(6) Train Head is shown as a thick White line to allow the operator to see the position of the Train relative to the
terrain The horizontal scale of the rolling chart is zero-referenced to the Head of the Train (corresponds to the forward-facing end of the lead locomotive)
(7) Train Milepost has an associated location and name Its representation on the screen consists of a graphical
pointer and an identifier
(8) OMB Message Box displays operator messages
(9) Consist Notches displays Lead and Trailing locomotive notches
(10) Throttle Handle Notch represents the Master Control-ler handle position During TO Auto Control it will indicate
N8 as TO automatic control requires notch eight (N8) set-ting
(11) Auto Control Notch displays on screen as a White box to denote TO Auto Control engagement and throttle out-
put control
(12) Trip Plan Speed has a Green plot line shown as the entire horizontal range when available and data permit-
ting
(13) Manual Control Zones is shown as a Gray rectangle on the terrain plot extending across the entire vertical range of this section of the chart
(14) Planned Braking depicts Blue areas where Trip Opti-mizer expects that dynamic andor air braking will be
required to maintain the plan speed
(15) Key Locations are softkey states that constitute a unique mapping of functionality to key locations
1 How do I get started To start a trip you will push the Trip Optimizer key on the Main operator screen
2 Do I have to be stopped to request a trip through Trip Optimizer It is preferred to perform a trip init at zero speed however unless otherwise provided by
local ruleinstruction maximum speed for initialization is 15 mph
3 I have performed the Trip Init process and see the rolling map When will I get prompted for Auto Control
Auto Control will become available when the speed is greater than 12 mph and the Throttle handle is N1 or higher
4 Why does the Locomotive Status matter to Trip Optimizer Trip Optimizer will always monitor in train forces speed braking and fuel efficiency To best optimize all of these Train dynamics Trip Optimizer must be told by the operator what the
status of each locomotive in the train The three modes are defined as follows
Running The locomotive is fully operational and is used for calculating TPOB
Isolated The locomotive is either shut-down or is mechanically isolated from produc-
ing Tractive Effort
DB Cutout The locomotive has no Dynamic Braking available but is being used for
producing Tractive Effort
5 What is the recommended way to disengage Auto Control The most fuel efficient way is to decrease the throttle notches in 2 second intervals until
you get to the required speed
6 Trip Optimizer is disengaging from Auto mode and tells the opera-tor Manual Control is required I am already in Notch 8 throttle
What do I do
Press the Current Throttle key on the screen Moving the Master Controller from Notch 8 to
Notch 7 and back could result in un-safe train handling practices
7 Why does Trip Optimizer not always travel at Track speed Trip Optimizer will use the forces of the train and momentum to achieve the optimal speed to save fuel In some cases Idle will be used to meet a planned slow order Trip Optimizer is
always looking out a few miles ahead to plan for the ideal speed while maintaining safe train handling
8 How do I report an inaccuracy on the civil speed limits posted on the rolling map
Contract your Road Manager to report the case
9 The dispatcher has issued an enroute slow order Will Trip Opti-
mizer automatically take this into account
No If an enroute slow order is issued it will be the train crewrsquos responsibility to protect the
train in Manual mode during this affected zone
10 Why does Trip Optimizer automatically end the trip when I still have distance remaining before the preset crew change point
The subdivision has a GPS controlled end point that will automatically end the trip based off of recommendations from the railroad
Follow the steps on the backside of this document to walk you through performing a Trip Init
Trip Optimizer Top Ten List
GE Proprietary Information The information contained in this document is GE Proprietary Information and is disclosed in confidence It is the property of GE and shall not be used disclosed to others or repro-
duced without the express written consent of GE If consent is given for reproduction in whole or in part this notice and the notice set forth on each page of this document shall appear in any such reproduction in whole or in part The information contained in this document may also be controlled by the US export control laws Unauthorized export or re-export is
prohibited Document 5005807 Rev mdash
Before engaging the TO AUTO throttle the operator must meet certain train conditions and under-stand the data displayed on the Trip Optimizer Running Screen
Doc No 5005890 Rev -
71
Operations optimization ndash velocity
Movement Planner with Norfolk Southern
RailConnect 360 - Movement Planner
bull Systems problem hellip beyond human capabilities
bull Majority single track
bull Point solutions have plateaued
bull Integrated suite of day of operations software apps
bull Predixtrade platform - connectivity big data and security
bull Advanced algorithms and automatic routing
bull Proven in class 1 revenue service
Norfolk Southern and Movement Planner
Automated routing decisions
10+ increase in velocity
50+ reduction in expired crews Significant improvement in
schedule adherence
1MPH = ~$200MM estimated
annual savings in capital amp expenses
Based on 3 year study in NS GA division
Customer Dynamics
72
bull Co-development GE Transportation amp GE Intelligent Platforms
minus Enhanced sensor coverage
minus Improved data acquisition higher resolution
minus Advanced analytics
bull Asset specific insight drives fault reduction and enables CBM
(SmartSignal)
bull 20K+ overhauls in backlog
bull OH interval based on average expected condition
bull $1B+ capital expenditure in North America every year
Impact Reduced unplanned
downtime amp avoid road failures
Reduce unscheduled material consumption
Extended periodicity and associated expenses
ldquoPhysicsrdquo change
Real Time Engine Performance
Bearing Temp
Bearing Temp
Load
Ambient
To
da
y
To
mo
rro
w
Alarm trigger
Savings
CSA ndash shared productivity
Lifecycle Cost Dynamics ndash Engine Overhauls RailConnect 360 ndash Advanced Analytics
GErsquos 1 Jamie Miller - Senior Vice President Chief Information Officer
- In current role since 2013
- 9 years with GE
74
Digital opportunity
Simplifying structure
More valuable GE resources with fully integrated approach
+ Utilize data from products
+ Field services tools
+ CRM configurators
+ Brilliant Factory
Benefits
ERPmanufacturing 90
Data Centers 80
Applications 30
Shared Services 65
Cloud 70
Product Cost
RampD
SGampA
+ Engineering tools
+ Shared Services GL
+ Cyber Security
IT plays
-a)
(a - Target percent of new applications that are Cloud enabled
~$94B
Industrial cost
75
Three opportunities to power manufacturing
Digital Foundation 1
Unlocking Big Data
minus Sourcing
minus Productivity
2
Powering the Brilliant Factory
minus Design for manufacturing
minus Sensor enablement
minus Plantsupply chain optimization
3
minus 90 reduction in ERPs
Supply Chain Network
Virtual Mfg
Virtual Product Design
76
Product Cost ERP investments paying off
Inventory turns 6x 7x
Shipment on time 58 85
Foundation for business to deliver $1B+ savings over past 5 years
GE Healthcare
of revenue on target ERP ~75
~95
2009 Today
Today 219 ERPs 2016 34 ERPs
GE Water
2008 Today
22
1
of ERPs
SGampA of sales ~10 pts
Past dues 60
Finance headcount 50
77
Product Cost Using big data to run GE
Ingest Store Clean Consume
1 OampG data lake $8B direct materials buy
Real time More cheaper Faster GE-wide Analytics Data science
$60B total material buy across GE hellip $1B+ cash amp deflation opportunities
bull 23 source systems
bull Full visibility ndash 3 weeks
bull Commodity part supplier
bull Data lake technology
bull Machine learning for data cleansing
bull EM PampW underway (Alstom)
Oil amp Gas
Xxxxx Xxxxx Xxxxx xxxxx
78
Product Cost Technology powering the Brilliant Factory
20 NPI cycle hellip 20 efficiency
16 pilots launched hellip Fastworks 2020 Vision
FastWorks approach
Virtual design for manufacturing
30 NPI cycle time
Eliminated quality escapes
Wilmington NC
Aviation Machining
Factory optimization
25 productivity
PampE avoidance Greenville SC
PampW Nozzle Cell
machine downtime
25 opportunity
Sensor Enablement
Grove City PA
Transportation Remanufacturing
79
Smart Outage Full deployment at PGS
Changing the way we deliver Services
On track for $1B CSA productivity over 3 years and 10 customer uptime
+ +
Predictive Workscope Aviation 4 customers
full roll-out mid-2015
=
Field services optimization
Predictive workscope
Next generation modeling
Advanced technology
Accelerating productivity
80
We can do more ldquoSrdquo with less ldquoG+Ardquo
45 win rate
80 in quote time
5400+ SalesComm Ops hoursweek
QuickQuote
40K+ GE Commercial FTE
Highly manual long-cycle-time
More ldquoshots on goalrdquo lower cost
Investing in digital tools for commercial teams
Wrap up
82
Value for investors
Payback through most reliable revenue source Services
+ Increase revenue growth
+ Improve margins
+ CSA productivity
Funded software amp analytics through simplification amp reallocation
Potential upside beyond the GE installed base
Scale amp intellect Return on investment
1
2
3
GE Software COE
+ COE can accomplish scale hellip none of
our businesses could do this on their
own hellip attract talent amp spread ideas
+ Advantage to being an early mover hellip
right partnerships amp scale
+ Changing GE Industrial DNA hellip
greater impact from digital amp
analytical investments
83
Why GE
+ More valuable portfolio hellip 75 Industrial while growing EPS
+ Tangible evidence of winning NPI hellip Tier 4 LEAP etc
+ Strong amp diversified global footprint hellip best-in-class
+ Transforming service for next generation of growth
+ Culture of simplification impacting every part of GE
LEAP is a trademark of CFM International
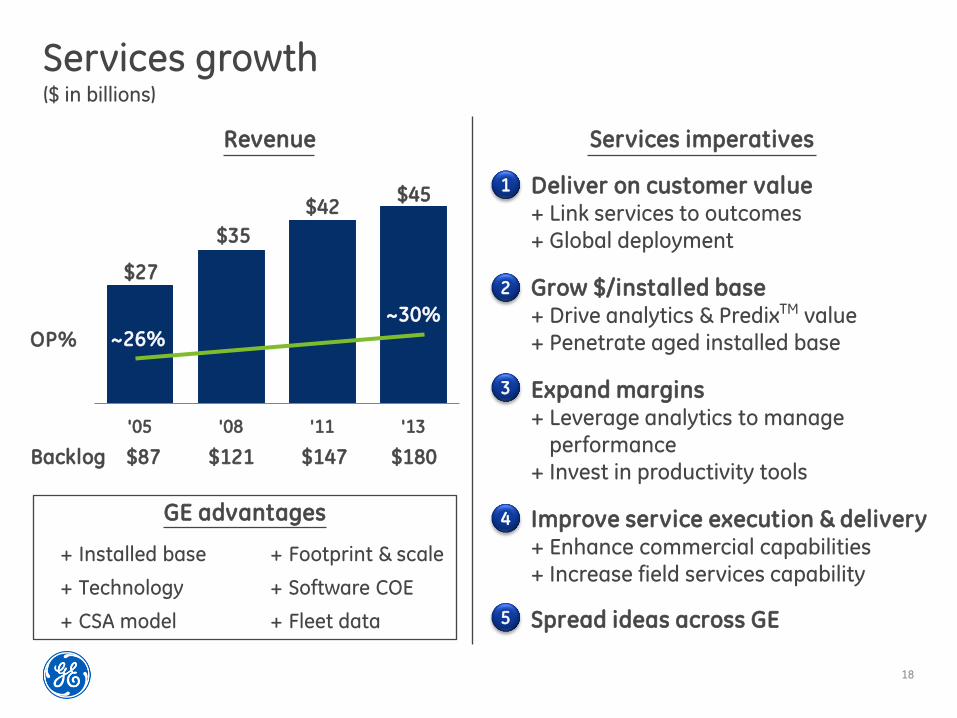

20
Enabling technologies Service Robotics Sensing amp Controls Advanced Manufacturing
Inspection Repair Mobile Tools
Launch amp learn hellip then accelerate to all GE businesses
Automated adaptive + Productivity + Less downtime
High tech integrated + Lower fuel usage + Higher efficiency
Productivity safety + Repetitive tasks + Tough environment
Additive new materials + Repair vs scrap + Longer service life
Deployable fast accurate + More digital data + Less downtime
Connected digital + Instant expert access + Lower service costs
21
Increase value of CSA
Benefits for Customers Benefits for GE
Monitoring amp diagnostics
$180B Services backlog
Fuel efficiency
Hardware amp software upgrades
Condition-based work scope
Mobile amp analytical tools
Material productivity
Optimized asset performance
Predictive analytics ndash lower downtime
More output
Lower costs
Lower emissions
Better payback on hardware upgrades
Instant software upgrade capability
Shorter duration outages
Less material usage
Ask an Expert ndash COE
Field Service productivity
Analytics driven parts life extension + performance
Repair vs scrap
22
Segment services dynamics (Services revenue $ in billions)
Power amp Water $125
Oil amp Gas $83
Energy Management
2013
$21
+ Sustained passenger growth
+ Improving airline profitability
+ Upgrades amp analytics
Aviation $108
+ Growth markets strong
+ Improving HCIT
minus Developed challenging
Healthcare $80
+ North America utilization
+ Analytics penetration
minus Mining parts
Transportation
$28
2013
2013
2013
2013
2013
2013
+ Continued AGP growth
+ Upgrades amp analytics
Europe
+ Strong Subsea
+ MampC improving
+ Analytics penetration
+ Marine offshore
minus Mining amp motor repairs
23
Presentation
Common capability Software COE
Analytics commercialization
Bill Ruh
Kate Johnson
Business execution
Strategy overview
Customer outcomes
Examples of analytics driving growth amp productivity
Competitive advantage
Power amp Water
Healthcare
Aviation
Oil amp Gas
Transportation
Paul McElhinney
Jan De Witte
Kevin McAllister
Brian Palmer
Pete McCabe
Common capability GErsquos 1 Jamie Miller
Software amp PredixTM
Bill Ruh - VP Global Software Center
- 3 years with GE
- 32 years of industry experience
Kate Johnson - VP GE Commercial Officer
- 1 year with GE
- 15 years of industry experience
25
The Industrial Internet
3 Hyper connectivity a living network of the worldrsquos machines data amp people
Internet
Increasing system intelligence through embedded software hellip advanced sensors
controls and software applications
Brilliant Machines
Democratization of data hellip high frequency real-time data
Big Data
Predictive algorithms hellip physics-based analytics hellip deep domain expertise on big industrial data
Analytics
People at work Connecting people at work or on
the move Supporting more
intelligent design higher service
quality operations amp safety
maintenance
1
2
3
4
5
26
61
45
31 28 31 40 42
29
29
45 63
56 56
47 45
41
10 6 6
16 9 10 9
24
Software outlook Customer survey Importance of
Big Data analytics relative to other priorities
Source Accenture 2015 Trend Report Gartner Big Data Survey
Aviation
3 3 3 3 6
Wind
Power Generation
Power Distribution
Oil amp Gas
Rail
Manufacturing
Healthcare
Highest priority Within the top 3 priorities Within the top 5 priorities Not a top priority
Opex is becoming a deciding
factor for IT investments as
80 of budget is allocated to
managing and running
complex technologies Source Gartner
Advanced analytics and
analytical applications
expected to see double digit
revenue growth Source Gartner
APM market category
expected to reach $300B
by 2020 Source Gartner
27
Industrial customersrsquo perspective Survey of GErsquos customers regarding applications
Real-Time Operator Intelligence
Remote Monitoring amp Diagnostics
Condition-Based Maintenance
Asset Lifecycle Management
Schedule Optimization
Energy Management
Process Control Automation
Field Force Automation 32
38
42
43
49
59
66
70 Tailor Pre-Built Applications
Have A Systems Integrator Build
Your Apps
Build My Own Custom Apps 15
54
85
HOW do you want to consume it WHAT functionality is most valuable
Asset performance management is the killer industrial app
28
What industrial customers want
SDM
SDM
SDM
SDM SDM
Software Defined Machines (SDMs)
ldquoLink up all my assets and devicesrdquo
REAL-TIME
OPERATIONAL
INTELLIGENCE
CONDITION-
BASED
MONITORING
ASSET LIFECYCLE
MANAGEMENT
MONITORING amp
DIAGNOSTICS
Industrial Apps
SDM Non-GE Assets enabled by PredixTM Machine SDM
SDM GE Assets enabled by PredixTM Machine SDM
PredixTM powers Asset Performance Management (APM)
29
Insights into value
Improving safety and
productivity across 15K miles
of interstate natural gas
pipelines
Potential Savings
77 gallons of fuel and 1628
lbs of CO2 per approach
10 increase in network
velocity 50 reduction in
expired crews amp significant
improvements in on-time
performance
Up to 4 increase in power
output across 283 wind
turbines hellip 40+ GWhr annual
increase
Asset Performance Management (APM)
REAL-TIME OPERATIONAL
INTELLIGENCE
CONDITION-BASED
MONITORING
ASSET LIFECYCLE MANAGEMENT
MONITORING amp
DIAGNOSTICS
Operations Optimization
INSIGHT PROCESS
INTEGRATION
AUTOMATION COLLABORATION
PredixTM Platform
PredixTM Machine PredixTM Net
GE
Non-GE
PredixTM Asset PredixTM Insight
PredixTM Fabric PredixTM Core
PredixTM Experience
Predixtrade hellip the GE advantage
Release in 2015
Public Cloud Private Cloud
Commercially available to connect more machines more data amp more people
TR
AN
SF
OR
MS
PO
WE
RS
PredictivityTM Solutions
30
Predictivitytrade hellip app factory
Asset optimization (28)
Operations optimization (14)
Productivity tools (77)
Approach Development process
Agile amp Extreme Programming
Design Center for delivering
compelling user interface
Cyber security Blue team to build
and Red team to test
90-120 day service engagement to production roll out
+
+
+
Co-innovation process to design
build transfer and iterate
Actionable insight on equipment based
on physics and analytic modeling
with industrial data
Outcome based process improvements
to plants pipelines fleets fields facilities
grids shops
Increase service throughput efficiency
and quality at optimized cost of
delivery
Delivering industry apps at speed and scale
31
World-class Software amp Analytics organization
Investing in Leadership Talent
Colin Parris (IBM)
SW Research
Co-located SW CTOs for business alignment
D Bartlett
(IBM)
Aviation
World-class technical resources
Computational amp analytics scientists
Platform developers
Software engineers
~10000
1000+ Biz
COE
Product Dev Software CTO
Brad Surak (SAP)
Harel Kodesh (Microsoft
Start Up Veteran)
Trans S Chotai
(HP)
OampG J Demesa
(Siemens)
PampW G Bell
(ServiceSource)
EM J Stone
(SAP)
HC E Eryurek
(GE)
+
+
- Cyber UX Data Science Agile development
Four deep core competencies ecosystem
1
Leading edge platform + world-
class ecosystem 2
Advanced research for building
the future 3
Advanced process to drive adoption amp enablement
4
Software Site
Organization
Technology amp Ecosystem
32
Wurldtech protecting critical infrastructure
World-class cyber security to operate assets + operations safely
About A GE Company acquired in May 2014 providing top cyber talent
Capability Assess protect amp certify critical infrastructure from cyber attack
Key Customers 4 of 6 top global OampG companies 9 of top 10 automation vendors
Security enhancements delivered through PredixTM and GE Products
Certify GE and non-GE products and customer environments
Identify vulnerabilities in OT products (GE and 3rd party)
Assess and prioritize risks for system operators
Achilles Industrial Next Gen Firewall to inspect and control
Industrial network traffic
Leverage industry leading threat intelligence
Protect operational
environments
Secure amp certify industrial products
Assess products amp operations for vulnerabilities
33
Partnerships amp Alliances
Intel ATampT AWS Cisco others
Venture Capital
Mergers amp Acquisitions
ThetaRay Mocana Frost
Strategic Moves
Wurldtech Austin Digital
Acquire capability to fill gaps
Pivotal Softbank Industrial Internet Consortium
Industrial internet ecosystem
Industry Ecosphere
Establish interoperable amp scalable solutions
Co-development amp go-to-market
Accelerate innovation amp success
Positioned to create value
Open PredixTM beyond GE
GE will sell
+ + Connected devices
Data Under Management
Performance Applications
PredixTM Machine Services
PredixTM Data Services
PredixTM Asset Services
Connect assets regardless of vendor or
vintage and provide value-added services
Aggregate and analyze data to produce
actionable business insights
Sell horizontal apps that maximize return
on assets and people
1
2
3
34
Competitive advantage
$1T Connected
Machines
managed by GE
replacement value
10M Sensors
collecting
50M Data
Elements
$20B Potential
Annual Customer Savings
50B Machines will be connected on the internet by 2020
2X Industrial data growth within next 10 years
Big Iron + Big Data = Big Outcomes
INDUSTRY GE
35
New ways to sell Services
2 Making Markets Different Economics
3 Co-creation amp Agile Development
4 Solution Architecture
5 Value Based Deal Shapes
6 New Industry Ecosystems
1 New Buyers and Influencers
GE Commercial Center of Excellence
Needs Target Architect Close
Qualification amp Pipeline Management
Sales Process
HireTrain Community of Experts
Enablement Toolkit
36
Accelerating time to value across channels
APM Subscription Services
Enterprise Analytics Projects
Upgrade value in CSAs
GE Sales Model
Existing Services sales team
New standalone software sales specialists
New outcome sellers + existing service sales team
Sales
acceleration
Expert SWAT
teams to
support deal
SW experts compelling
offer target one outcome
to land and expand
Ecosystem partners
SW COE app factory
Offering RMampD in CSA upside
and productivity Per well subscription
Enterprise SW deal
solution co-creation
ReliabilityMaxtrade FieldVantageTM Intelligent PipelineTM
GE OampG Example
Market
Opportunity $2B $600MM $27B
37
Measuring commercial success
Services revenue
Past Future
~5
+
rsquo13 rsquo17F
Assets under management $1T+ ++
PredictivityTM solutions revenue $08B ~$4-5B
Services backlog $180B ++
bull Adding more value to existing service relationships hellip training team to get more out of the installed base
bull Creating new revenue streams and building new commercial skills and incentive plans to accelerate growth
Outcome sellers solution architects product management amp marketing
bull Cultivate ecosystem to help accelerate commercially with access to CIOCTO relationships and system integration skills
Power amp Water Paul McElhinney - President amp CEO Power
Generation Services
- In current role since May 2014
- 26 years with GE
39
Power amp Water Services
Growing services amp delivering greater customer value
Key metrics Services imperatives ($ in billions)
13 14E
+
Backlog $53 +
Revenue $125
Installed base dynamics
1
2
3
4
Deliver on customer value + Develop flexible solutions
+ Reduce customer operating cost
Grow $installed base + Maximize impact of Alstom alliance + Invest in new service offerings
Expand margins + Tech upgrades amp software solutions + Outage excellence
Improve service execution amp delivery + Improved customer service levels
+ Optimize field service amp repair network
Unit growth up ~24X from 2008
Strong DP amp Wind growthhellip up ~1Kyear
~4000+ gas turbines in service
40
Global power industry is facing complex challengeshellip Offering innovative solutions to address customersrsquo needs
Fuel price uncertainty
Increasing regulation
Slow demand growth
Aging installed base
~15 years Average age of ~4K global GE gas turbines
Output
Efficiency
Reliability
Availability
Flexibility
Improving customersrsquo outcomes while decreasing costs
~$7B
Customer challenges
~$8B
~$2B
~$1B
~$2B
GE Predictivitytrade solutions amp industry benefit
~60+ Increase in US natural gas price since 2012
~(30) Thermal capacity in Europe since lsquorsquo08
Based on 10 year NPV
41
Investing in technology
Addressing multiple customer value levers
Advanced Gas Path (AGP) Industry leading output hellip up to +64 Industry leading efficiency hellip up to +18 Extends asset amp parts life hellip 96K hours
1
Op Flex Delivers flexibility to costs amp revenue Reduces start up time amp fuel consumption Expands fuel source opportunity
3
Dry Low NOx 26+ (DLN) Reduces NOx emissions by 40 Delivers industry leading flexibility Increases maintenance intervals to ~1250 starts
2
42
Power FlexEfficiencytrade Advanced Gas Path
Expanding the operating envelope
Ambient Temperature
Ou
tpu
t (M
W)
Op Flex
7FA03 baseline
AGP
+ ndash
+
Combining hardware and software hellip creating 2X the value
$17
$30
Op Flex
Average Customer Annual Value Per Unit ($MM)
Improving customer outcomes
AGP (Hardware)
AGP PredictivityTM
Solution
125+ AGPs with software sold to date
650000+ operating hours to date
43
Wind PowerUp hellip generating more output
Customer Outcome Up to 4
increase in power output across 283
wind turbines hellip 40+ GWhr annual increase ldquoThe PowerUp system offers a great chance for owners like us who are investing literally billions of dollars in this market to try and get more production out of existing assets GE took a lot of risk out of this for usrdquo
ndash Patrick Woodson CEO EON Climate amp Renewables
Opportunity for up to
20 more profit from up to
5 more output
A performance based
cooperative approach
with a holistic view of the
assets system and network
Flexible payment options
aligned to customer needs
+1400 turbines under contract since launch
Customer opportunity
Software enabled
Flexible platform
Proven results
Scale out
1
2
3
Healthcare Jan De Witte - President amp CEO Healthcare IT
- In current role since 2011
- 15 years with GE
45
Healthcare Services
Delivering value = higher quality outcomes at lower cost
Key metrics Services imperatives ($ in billions)
Backlog $11 +
Installed base dynamics
1
2
3
4
Deliver on customer value + Asset and workflow optimization + Analytics around EMRs amp Devices
Grow $installed base
+ Quality and analytics offerings + Solutions architecture amp delivery
Expand margins + Remote service amp SaaS models + Field services productivity Improve service execution amp delivery + Remote monitoring technologies + Field force deployment optimization
Emerging markets infrastructure build
Mature markets quality upgrades
ACA amp Enterprise Solutions IT penetration
13 14E
=+ Revenue $80
46
Healthcare industry shifting to value-based care GE software analytics and services are uniquely positioned to help
Customer challenges
Integrated Care Solutions hellip turning data into actionable insight Improving healthcare outcomes
Diagnostic quality
Patient-centric care
System profitability
Chronic Disease Management
Sources Institute of Medicine 2013 Porter Research 2013 McKinsey IHS Global Insight
29 Healthcare spend wasted each year
$260B Annual value creation through healthcare IT
59 US lives covered in value-based care model by 2015
Clinical Quality
Financial Performance
Operational Efficiency
Configurable Workflows
47
GEHC Software portfolio positioned along main outcome drivers for care systems
Diagnostic speed amp confidence
Productive care pathways
Wellness amp chronic disease management
Risk amp margin management
Costworkforce optimization
Population Health Management
Workflow
Archiving
Visualization
Financial Management
Care Delivery Management
Enterprise Imaging
Operations Management
Revenue Cycle
Risk assessment
Margin analytics
Workforce optimization
Asset Management
Integrated Care Solutions
Ambulatory Care
High Acuity Care
Cardiology
Analytics
Care coordin
Engagement
Providing caregivers the right actionable insight ndash when amp where they need it
Large GE device footprint generating
clinical data
HCIT domain in clinical workflow amp analytics
SW CoEPredixTM capabilities + +
48
Enterprise Imaging Improving diagnostic workflow in the cloud
Customer Challenges Cloud Case Exchange CentricityTM 360
Sample Customers Solution Architecture
Clinical Collaboration amp Advanced Analytics
Imaging Cost Control
Archive
Workflow
19 Time spent
gathering data
Workflow
velocity
Diagnostic
confidence
Cases diagnosed
incorrectly 35
~$2B segment by rsquo18 growing 25+
30 turn-around time
3 duplicate exams
Customer value $10MM+ cost pa
Image-as-a-Service lifecycle value $20MM+
Care quality
Cost
Source Research from the Journal of the American College of Radiology and the Journal of American Medicine
49
Customer Challenges Workforce management
Sample Customers
Operations Management Optimizing workforce productivity with API Healthcare
54 Hospital
operating cost
spent on labor
Solution Architecture
Real-Time Analytics Labor amp Patient Workflows
Time amp Attendance
Staffing amp Scheduling
HR amp Payroll
~$2B segment by rsquo18 growing 12+
20 Workforce productivity
Customer value $4MM cost pa
Workforce-mgmt services lifecycle $4MM+
80 Overtime wages
Matching care-giver capacity
amp patient need
Care quality
Labor
productivity
Source Beckerrsquos Hospital Review
50
Population Health Management Lowering the cost of chronic disease
Customer Challenges
Solution Architecture
Caradigm Analytics amp Care Mgt
Proactive
intervention
Care protocol
compliance
75 Cents of every
healthcare dollar
spent on chronic
disease
Care Mgt Analytics Risk Cohort
25
Customer value $5MM+ cost pa
Caradigm lifecycle value $18MM+
Patients per care manager
~$30B segment by 2025 growing 19+
Sample Customers
40 Hospitalization for chronic patients
Chronic disease
treatment cost
Source National Diabetes Fact Sheet
51
Software enabling productivity in service process
Wo
rkfo
rce
Pla
nn
ing
amp
Dis
pa
tch
Historically up to 40 FE travel time hellip utilize analytics to optimize allocation
Smart dispatch with effective job-skill matching
Optimize field force capacity and response time to customers
Call Generation (Planned amp Unplanned)
Deploy
RepairFix
Diagnose
CloseDebriefBill
Pe
rfo
rma
nce
M
on
ito
rin
g 110k GEHC devices connected remotely
MR hellip 900 data points monitored per machine 30k alertsyear proactively fixed
Improves GE productivity while minimizing customer down-time
Healthcare Services margins improving
Aviation Kevin McAllister - President amp CEO Aviation Services
- In current role since May 2014
- 25 years with GE
53
Aviation Services
13 14E
+ $108
Backlog $97 +
Revenue
Key metrics Services imperatives
Commercial IB hellip 34000 engines
Young hellip 46 havenrsquot had 1st shop visit
Fuel cost driving investment hellip GE well
positioned hellip 787 737MAX A320NEO 777X
Installed base dynamics
1
2
3
4
Deliver on customer value
+ Lowest cost of ownership
+ PredictivityTM outcomes
Grow $installed base
+ Winwin providing technology upgrades and analytics
Expand margins
+ Time-on-wing for GE and customers
+ Cost productivity hellip for GE
Best service execution and delivery
+ Position to support service entry for next-gen products
($ in billions)
54
Solid growth fundamentals
Shop visits Environment Departures
Source IATA amp GE analysis
Passengers IATA RPK YoY
Utilization Avg cycles day YoY
Departures GE and JV-powered flights (MM)
0
5
10
15
20
25
30
35
40
lsquo10 lsquo15F lsquo95 lsquo00 lsquo05
4100
5500
4400
2100
2000
3000
2300 2000
2300
200
100
-1 09 02
2012 2013 2014E
53 52 58
20 21 22
2 of 3 daily flights
powered by GE or GE JVs
46 have not
had 1st shop visit
4 CAGR Number of departures (MM)
lsquo13 rsquo15F rsquo20F
CFM is a 5050 JV between GE and Snecma EA is a 5050 JV between GE and Pratt amp Whitney
55
Solving our customers toughest challenges
Airline direct operating costs
Fuel
40
Delays and cancellations
8
Maintenance
9
Services analytics offerings
Flight Efficiency Services
Performance-based Navigation
Analytics-enabled workscoping
Product and Services strategy
Provide lowest cost-of-ownership through OEM technology
Lead in on-wing reliability
Lead in technology
Best-in-class fuel burn and retention
Engine diagnostic and prognostics
Intelligent Operations
$200Byr
$40Byr
Taleris is a 5050 JV between GE and Accenture
+
56
Services technologies hellip improving value through the lifecycle
Installed base (lsquo13) Upgrades
Fuel Burn improvement
Time- on-wing
8 8 2x
8 3 3x
5 2 2x
A culture of technology insertion Tailored to customer wants
CFM is a 5050 JV between GE and Snecma
Risk transfer $hour coverage
Overhaul Time and material
Materials New used and repaired parts
Asset optimization TRUEngineTM program diagnostics
+
CF6-80C (lsquo86 EIS)
GE90 (lsquo95 EIS)
CFM56 (lsquo84 EIS)
3000
1500
18500
57
Minds amp Machines at GE Aviation
+ Ex
po
sure
Operator A Operator B Part Temperature Cruise Takeoff
Te
mp
era
ture
Threshold
Climb
1000+ software engineers GE Software COE
6300 applied engineers GE Aviation
Data Secure continuous accessible
Physics Apply engine expertise
+ =
Customer and GE benefits
+
Statistics Unlock trends segment
ldquoPhysicsrdquo ldquoAnalyticsrdquo
Time-on-wing
Reliability and availability
Fuel cost
Repair and overhaul
58
Lead in on-wing reliability
Applied analytics to detect engines at risk of removal
Cu
mu
lati
ve
dis
tre
ss
Cycles
Recent successes hellip
CFM is a 5050 JV between GE and Snecma
Segment
GE90
120 CFM56
40 Water wash
$7Myr fuel savings at one GE90 operator
removals saved
removals saved
Nominal environment
Abate
Harsh environment
59
$30MMyr savings
Flight Efficiency Services App
Performance-based Navigation App
Attacking fuel spend with analytics
Joint marketing hellip
ldquoPerfect flightrdquo video
In the news
Newsletter
Oil amp Gas Brian Palmer - Vice President Measurement amp Control Solutions
- In current role since 2010
- 29 years with GE
61
Oil amp Gas Services
Software amp Services as a key differentiator
Key metrics Strategic imperatives ($ in billions)
13 14E
++
Backlog $58 ++
$83 Revenue
1
2
3
4
Deliver on customer value + Customer co-creation
+ Outcome based solutions
Grow $installed base + Drive analytics amp PredixTM
+ Penetrate the installed base
Expand margins + More software and contract offerings
+ Continue to grow backlog double digits
+ Partnerships to accelerate journeyhellip
Meridium
Improve service execution amp delivery + Full lifecycle productivity
+ Simplifying structure
IB growing TMS and Subsea with 13K+ units Software investments creating new IB revenue
streams in addition to traditional parts and service New contractual (CSA) offerings developedlaunched
Installed base dynamics
62
Oil amp gas industry is faced with expanding challenges GE software data and analytics are uniquely positioned to help
Customer challenges Equipment Availability
Equipment Reliability
Operational Efficiency
Production Optimization
Industrial Internet hellip turning data into actionable information Enable no unplanned downtime
Increasing complex operations
Tighter regulations
Skills gap
Machines with data potential
Sources GE OampG analysis based on Wood Mackenzie Rystad Barclays IHS CERA PFC Energy IEA httpwwwgecomstoriesoil-and-gas-innovation Oil and Gas Facilities 2013 httpwwwspeorgogfprintarchives201306
$800B+ Annual industry CAPEX (6-8 growth per year)
$150MM Average annual cost for mid-size LNG facility due to unplanned downtime
5-10 Range of OampG industryrsquos estimated downtime
63
Predixtrade hellip Unified Operations Improved throughput connecting people machines and data
Customer outcomes
Unified Operations ndash A customer co-creation success story
Enhanced safety
Increased availability
Operational visibility
Efficient workforce enablement
Partnering with to tackle these industry challenges and create a solution that increases production and lowers cost driving improved customer outcomes
Unified Customer
Portal
129000 Pieces of equipment in operation globally in
the industry
50 Industry retirement rate in next 10 years
7X Industry fatality rate
above norm
people
machines
data
64
FieldVantagetrade hellip Asset Performance Management (APM) for Onshore
APM ndash Bringing GE expertise from all industries to deliver system level value
Customer outcomes
Enhanced safety
Operational visibility
Improved availability
Optimized performance
Monitoring amp
Diagnostics
Condition Based
Maintenance
Real time Operations
Intelligence
Asset LifeCycle
Management
bull Providing field level visibility and optimization across multiple forms of artificial lift technologies bull Integrated insights provided through common single scalable platform bull 2 year service contract on 200+ wells
Solution Overview
39 NAM OampG Upstream Vehicle Fatalities
hellipby improving
116K New wells in 2014
5 Days Back to production (NAM Avg)
1MM+ Artificially Lifted Wells (Global)
65
Intelligent Pipeline hellip Operations optimization software for pipelines
2TB of data for every
30K miles of pipeline
3-4 annual growth
2MMmiles of
pipelines globally
$40B invested by pipeline companies per year
Source 2TB - Average data volume based on GE internal analysis of multiple pipeline customers Rest - GE OampG analysis based on Douglas Westwood IHS CERA FERC CIA World Factbook PII Pipeline Database (Summary of Infield Systems Global Data DOT databases)
bull 5 year service contract
bull Setting the industry standards for
pipelines real-time intelligence
First customer Customer outcomes
Enhanced safety Proactive versus reactive decisions
Visibility Complete geospatial view and situational awareness
Optimized Ops Effective data driven resource allocation
Efficient OampM Prioritize spending for assets and resources
Moving to proactive solutions with our customers
66
Customer Benefits
Zero unplanned downtime
Increased availability
Increased reliability
Decreased production losses
$14B Additional opportunity driven by
availability and reliability increase (1 of capacity)
Industry Opportunities
Outcome base service bonus
GE Productivity Improvements
Inventory through parts flow optimization
Outage durationfrequency driven by condition- based maintenance
Services Optimization hellip Creating optimal value for GE equipment customers
Journey to 100 reliability through our Contractual Services Agreements (CSA)
Transportation Pete McCabe - Vice President Global Services amp Solutions
- In current role since 2013
- 20 years with GE
68
Transportation Services ($ in billions)
13 14E
+
Revenue $28
Backlog $12B+ +
1
2
3
4
Deliver on customer value
+ Outcomes - velocity fuel reliability
+ System solutions ndash RailConnectTM 360
Grow $installed base
+ Increase penetration ndash Parts amp Smarts
+ Extend asset life ndash modernizations
+ Broaden software solutions ndash rOS
Expand margins
+ Deploy advanced analytics ndash PredixTM
Improve service execution amp delivery
+ Enhance commercial capabilities
+ Expand domain amp IT project expertise
Installed base dynamics
1000+ Tier 4-compliant loco orders
~650 locomotives un-parking in rsquo14
450 new locomotives in South Africa
Key metrics Services imperatives
69
Railroad industry is faced with expanding challenges and customers require a solution provider
Customer challenges
RailConnecttrade360 delivering customer focused outcomes
Asset utilization
Capacity limited
Resource constraints
Ops Complexity
$80B+ N American operating revenue (~4 growth)
7 year high Traffic volumes require unparalleled investment
$56B Annual industrial benefit through 1 improvement
Sources American Association of Railroads (AAR) 2013 industry statistics
70
Asset optimization ndash fuel efficiency
Customer Dynamics RailConnect 360 ndash Trip Optimizer
bull Real-time embedded optimization algorithms
bull Advanced data acquisition enabling train health monitoring
bull Automated train handling reduces wheel amp rail wear
bull $1M diesel locoyear 22K GE locos
bull Emissions
bull Huge operating variation operators trains topography
Trip Optimizer with CSX
Implementation on 1500 CSX locomotives
Reduced fuel use by 7 on average Decreased 3rd largest operating expense
- CSX Sustainability Report 2013
Tr ip Opt imizer Quick Star t Guide (1) Train Speed is available on the speedometer during an active trip during auto and Manual Control
(2) Trip Plan Speed displays a green Trip plan speed pointer on the speed indicator dial in Auto and Manual
modes of operation
(3) Trip Optimizer Status Box is visible when Trip Optimizer system is ACTIVE and provides three types of messages Status Request for Operator InputAction and Error
(4) TrackCivil Speed Limit plot line is Cyan shown the entire horizontal range data permitting
(5) Train Speed (Actual) plot line is White shown only from the head of the train on back
(6) Train Head is shown as a thick White line to allow the operator to see the position of the Train relative to the
terrain The horizontal scale of the rolling chart is zero-referenced to the Head of the Train (corresponds to the forward-facing end of the lead locomotive)
(7) Train Milepost has an associated location and name Its representation on the screen consists of a graphical
pointer and an identifier
(8) OMB Message Box displays operator messages
(9) Consist Notches displays Lead and Trailing locomotive notches
(10) Throttle Handle Notch represents the Master Control-ler handle position During TO Auto Control it will indicate
N8 as TO automatic control requires notch eight (N8) set-ting
(11) Auto Control Notch displays on screen as a White box to denote TO Auto Control engagement and throttle out-
put control
(12) Trip Plan Speed has a Green plot line shown as the entire horizontal range when available and data permit-
ting
(13) Manual Control Zones is shown as a Gray rectangle on the terrain plot extending across the entire vertical range of this section of the chart
(14) Planned Braking depicts Blue areas where Trip Opti-mizer expects that dynamic andor air braking will be
required to maintain the plan speed
(15) Key Locations are softkey states that constitute a unique mapping of functionality to key locations
1 How do I get started To start a trip you will push the Trip Optimizer key on the Main operator screen
2 Do I have to be stopped to request a trip through Trip Optimizer It is preferred to perform a trip init at zero speed however unless otherwise provided by
local ruleinstruction maximum speed for initialization is 15 mph
3 I have performed the Trip Init process and see the rolling map When will I get prompted for Auto Control
Auto Control will become available when the speed is greater than 12 mph and the Throttle handle is N1 or higher
4 Why does the Locomotive Status matter to Trip Optimizer Trip Optimizer will always monitor in train forces speed braking and fuel efficiency To best optimize all of these Train dynamics Trip Optimizer must be told by the operator what the
status of each locomotive in the train The three modes are defined as follows
Running The locomotive is fully operational and is used for calculating TPOB
Isolated The locomotive is either shut-down or is mechanically isolated from produc-
ing Tractive Effort
DB Cutout The locomotive has no Dynamic Braking available but is being used for
producing Tractive Effort
5 What is the recommended way to disengage Auto Control The most fuel efficient way is to decrease the throttle notches in 2 second intervals until
you get to the required speed
6 Trip Optimizer is disengaging from Auto mode and tells the opera-tor Manual Control is required I am already in Notch 8 throttle
What do I do
Press the Current Throttle key on the screen Moving the Master Controller from Notch 8 to
Notch 7 and back could result in un-safe train handling practices
7 Why does Trip Optimizer not always travel at Track speed Trip Optimizer will use the forces of the train and momentum to achieve the optimal speed to save fuel In some cases Idle will be used to meet a planned slow order Trip Optimizer is
always looking out a few miles ahead to plan for the ideal speed while maintaining safe train handling
8 How do I report an inaccuracy on the civil speed limits posted on the rolling map
Contract your Road Manager to report the case
9 The dispatcher has issued an enroute slow order Will Trip Opti-
mizer automatically take this into account
No If an enroute slow order is issued it will be the train crewrsquos responsibility to protect the
train in Manual mode during this affected zone
10 Why does Trip Optimizer automatically end the trip when I still have distance remaining before the preset crew change point
The subdivision has a GPS controlled end point that will automatically end the trip based off of recommendations from the railroad
Follow the steps on the backside of this document to walk you through performing a Trip Init
Trip Optimizer Top Ten List
GE Proprietary Information The information contained in this document is GE Proprietary Information and is disclosed in confidence It is the property of GE and shall not be used disclosed to others or repro-
duced without the express written consent of GE If consent is given for reproduction in whole or in part this notice and the notice set forth on each page of this document shall appear in any such reproduction in whole or in part The information contained in this document may also be controlled by the US export control laws Unauthorized export or re-export is
prohibited Document 5005807 Rev mdash
Before engaging the TO AUTO throttle the operator must meet certain train conditions and under-stand the data displayed on the Trip Optimizer Running Screen
Doc No 5005890 Rev -
71
Operations optimization ndash velocity
Movement Planner with Norfolk Southern
RailConnect 360 - Movement Planner
bull Systems problem hellip beyond human capabilities
bull Majority single track
bull Point solutions have plateaued
bull Integrated suite of day of operations software apps
bull Predixtrade platform - connectivity big data and security
bull Advanced algorithms and automatic routing
bull Proven in class 1 revenue service
Norfolk Southern and Movement Planner
Automated routing decisions
10+ increase in velocity
50+ reduction in expired crews Significant improvement in
schedule adherence
1MPH = ~$200MM estimated
annual savings in capital amp expenses
Based on 3 year study in NS GA division
Customer Dynamics
72
bull Co-development GE Transportation amp GE Intelligent Platforms
minus Enhanced sensor coverage
minus Improved data acquisition higher resolution
minus Advanced analytics
bull Asset specific insight drives fault reduction and enables CBM
(SmartSignal)
bull 20K+ overhauls in backlog
bull OH interval based on average expected condition
bull $1B+ capital expenditure in North America every year
Impact Reduced unplanned
downtime amp avoid road failures
Reduce unscheduled material consumption
Extended periodicity and associated expenses
ldquoPhysicsrdquo change
Real Time Engine Performance
Bearing Temp
Bearing Temp
Load
Ambient
To
da
y
To
mo
rro
w
Alarm trigger
Savings
CSA ndash shared productivity
Lifecycle Cost Dynamics ndash Engine Overhauls RailConnect 360 ndash Advanced Analytics
GErsquos 1 Jamie Miller - Senior Vice President Chief Information Officer
- In current role since 2013
- 9 years with GE
74
Digital opportunity
Simplifying structure
More valuable GE resources with fully integrated approach
+ Utilize data from products
+ Field services tools
+ CRM configurators
+ Brilliant Factory
Benefits
ERPmanufacturing 90
Data Centers 80
Applications 30
Shared Services 65
Cloud 70
Product Cost
RampD
SGampA
+ Engineering tools
+ Shared Services GL
+ Cyber Security
IT plays
-a)
(a - Target percent of new applications that are Cloud enabled
~$94B
Industrial cost
75
Three opportunities to power manufacturing
Digital Foundation 1
Unlocking Big Data
minus Sourcing
minus Productivity
2
Powering the Brilliant Factory
minus Design for manufacturing
minus Sensor enablement
minus Plantsupply chain optimization
3
minus 90 reduction in ERPs
Supply Chain Network
Virtual Mfg
Virtual Product Design
76
Product Cost ERP investments paying off
Inventory turns 6x 7x
Shipment on time 58 85
Foundation for business to deliver $1B+ savings over past 5 years
GE Healthcare
of revenue on target ERP ~75
~95
2009 Today
Today 219 ERPs 2016 34 ERPs
GE Water
2008 Today
22
1
of ERPs
SGampA of sales ~10 pts
Past dues 60
Finance headcount 50
77
Product Cost Using big data to run GE
Ingest Store Clean Consume
1 OampG data lake $8B direct materials buy
Real time More cheaper Faster GE-wide Analytics Data science
$60B total material buy across GE hellip $1B+ cash amp deflation opportunities
bull 23 source systems
bull Full visibility ndash 3 weeks
bull Commodity part supplier
bull Data lake technology
bull Machine learning for data cleansing
bull EM PampW underway (Alstom)
Oil amp Gas
Xxxxx Xxxxx Xxxxx xxxxx
78
Product Cost Technology powering the Brilliant Factory
20 NPI cycle hellip 20 efficiency
16 pilots launched hellip Fastworks 2020 Vision
FastWorks approach
Virtual design for manufacturing
30 NPI cycle time
Eliminated quality escapes
Wilmington NC
Aviation Machining
Factory optimization
25 productivity
PampE avoidance Greenville SC
PampW Nozzle Cell
machine downtime
25 opportunity
Sensor Enablement
Grove City PA
Transportation Remanufacturing
79
Smart Outage Full deployment at PGS
Changing the way we deliver Services
On track for $1B CSA productivity over 3 years and 10 customer uptime
+ +
Predictive Workscope Aviation 4 customers
full roll-out mid-2015
=
Field services optimization
Predictive workscope
Next generation modeling
Advanced technology
Accelerating productivity
80
We can do more ldquoSrdquo with less ldquoG+Ardquo
45 win rate
80 in quote time
5400+ SalesComm Ops hoursweek
QuickQuote
40K+ GE Commercial FTE
Highly manual long-cycle-time
More ldquoshots on goalrdquo lower cost
Investing in digital tools for commercial teams
Wrap up
82
Value for investors
Payback through most reliable revenue source Services
+ Increase revenue growth
+ Improve margins
+ CSA productivity
Funded software amp analytics through simplification amp reallocation
Potential upside beyond the GE installed base
Scale amp intellect Return on investment
1
2
3
GE Software COE
+ COE can accomplish scale hellip none of
our businesses could do this on their
own hellip attract talent amp spread ideas
+ Advantage to being an early mover hellip
right partnerships amp scale
+ Changing GE Industrial DNA hellip
greater impact from digital amp
analytical investments
83
Why GE
+ More valuable portfolio hellip 75 Industrial while growing EPS
+ Tangible evidence of winning NPI hellip Tier 4 LEAP etc
+ Strong amp diversified global footprint hellip best-in-class
+ Transforming service for next generation of growth
+ Culture of simplification impacting every part of GE
LEAP is a trademark of CFM International
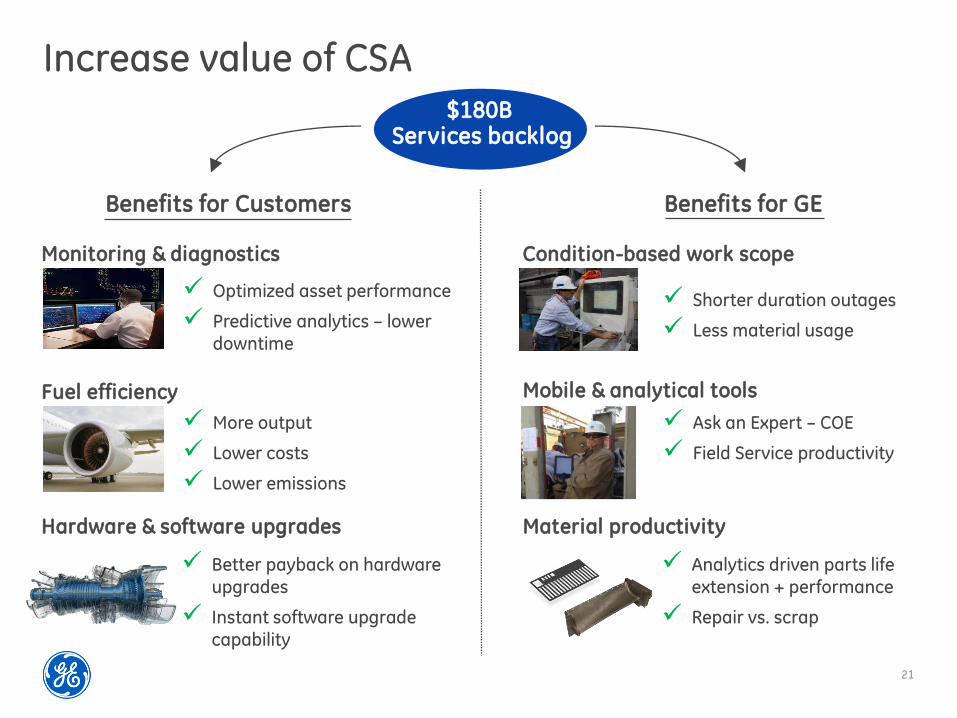
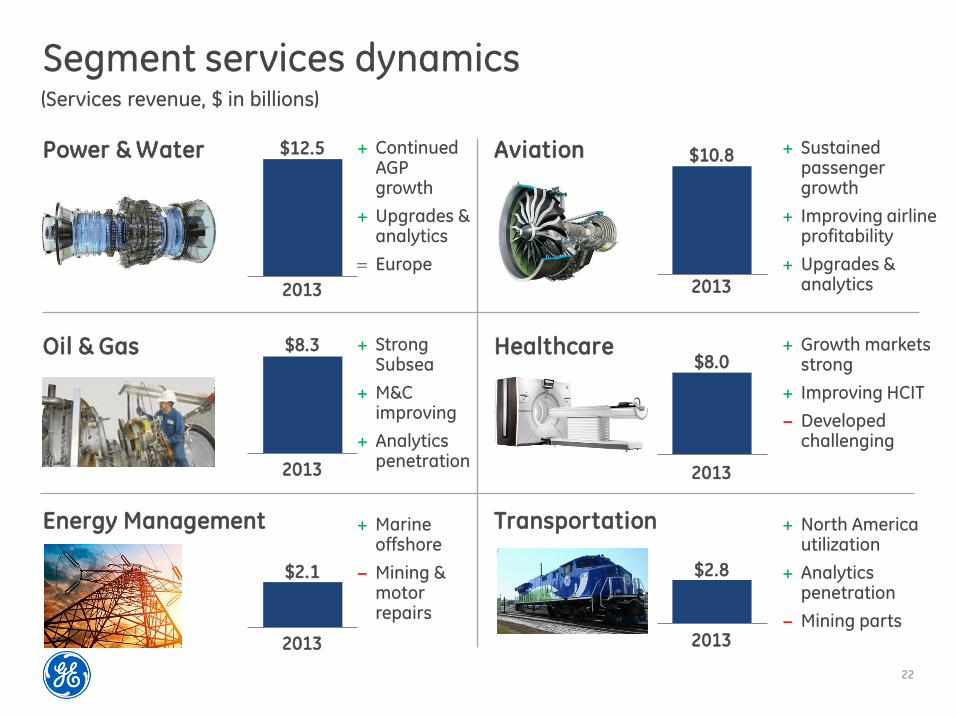
22
Segment services dynamics (Services revenue $ in billions)
Power amp Water $125
Oil amp Gas $83
Energy Management
2013
$21
+ Sustained passenger growth
+ Improving airline profitability
+ Upgrades amp analytics
Aviation $108
+ Growth markets strong
+ Improving HCIT
minus Developed challenging
Healthcare $80
+ North America utilization
+ Analytics penetration
minus Mining parts
Transportation
$28
2013
2013
2013
2013
2013
2013
+ Continued AGP growth
+ Upgrades amp analytics
Europe
+ Strong Subsea
+ MampC improving
+ Analytics penetration
+ Marine offshore
minus Mining amp motor repairs
23
Presentation
Common capability Software COE
Analytics commercialization
Bill Ruh
Kate Johnson
Business execution
Strategy overview
Customer outcomes
Examples of analytics driving growth amp productivity
Competitive advantage
Power amp Water
Healthcare
Aviation
Oil amp Gas
Transportation
Paul McElhinney
Jan De Witte
Kevin McAllister
Brian Palmer
Pete McCabe
Common capability GErsquos 1 Jamie Miller
Software amp PredixTM
Bill Ruh - VP Global Software Center
- 3 years with GE
- 32 years of industry experience
Kate Johnson - VP GE Commercial Officer
- 1 year with GE
- 15 years of industry experience
25
The Industrial Internet
3 Hyper connectivity a living network of the worldrsquos machines data amp people
Internet
Increasing system intelligence through embedded software hellip advanced sensors
controls and software applications
Brilliant Machines
Democratization of data hellip high frequency real-time data
Big Data
Predictive algorithms hellip physics-based analytics hellip deep domain expertise on big industrial data
Analytics
People at work Connecting people at work or on
the move Supporting more
intelligent design higher service
quality operations amp safety
maintenance
1
2
3
4
5
26
61
45
31 28 31 40 42
29
29
45 63
56 56
47 45
41
10 6 6
16 9 10 9
24
Software outlook Customer survey Importance of
Big Data analytics relative to other priorities
Source Accenture 2015 Trend Report Gartner Big Data Survey
Aviation
3 3 3 3 6
Wind
Power Generation
Power Distribution
Oil amp Gas
Rail
Manufacturing
Healthcare
Highest priority Within the top 3 priorities Within the top 5 priorities Not a top priority
Opex is becoming a deciding
factor for IT investments as
80 of budget is allocated to
managing and running
complex technologies Source Gartner
Advanced analytics and
analytical applications
expected to see double digit
revenue growth Source Gartner
APM market category
expected to reach $300B
by 2020 Source Gartner
27
Industrial customersrsquo perspective Survey of GErsquos customers regarding applications
Real-Time Operator Intelligence
Remote Monitoring amp Diagnostics
Condition-Based Maintenance
Asset Lifecycle Management
Schedule Optimization
Energy Management
Process Control Automation
Field Force Automation 32
38
42
43
49
59
66
70 Tailor Pre-Built Applications
Have A Systems Integrator Build
Your Apps
Build My Own Custom Apps 15
54
85
HOW do you want to consume it WHAT functionality is most valuable
Asset performance management is the killer industrial app
28
What industrial customers want
SDM
SDM
SDM
SDM SDM
Software Defined Machines (SDMs)
ldquoLink up all my assets and devicesrdquo
REAL-TIME
OPERATIONAL
INTELLIGENCE
CONDITION-
BASED
MONITORING
ASSET LIFECYCLE
MANAGEMENT
MONITORING amp
DIAGNOSTICS
Industrial Apps
SDM Non-GE Assets enabled by PredixTM Machine SDM
SDM GE Assets enabled by PredixTM Machine SDM
PredixTM powers Asset Performance Management (APM)
29
Insights into value
Improving safety and
productivity across 15K miles
of interstate natural gas
pipelines
Potential Savings
77 gallons of fuel and 1628
lbs of CO2 per approach
10 increase in network
velocity 50 reduction in
expired crews amp significant
improvements in on-time
performance
Up to 4 increase in power
output across 283 wind
turbines hellip 40+ GWhr annual
increase
Asset Performance Management (APM)
REAL-TIME OPERATIONAL
INTELLIGENCE
CONDITION-BASED
MONITORING
ASSET LIFECYCLE MANAGEMENT
MONITORING amp
DIAGNOSTICS
Operations Optimization
INSIGHT PROCESS
INTEGRATION
AUTOMATION COLLABORATION
PredixTM Platform
PredixTM Machine PredixTM Net
GE
Non-GE
PredixTM Asset PredixTM Insight
PredixTM Fabric PredixTM Core
PredixTM Experience
Predixtrade hellip the GE advantage
Release in 2015
Public Cloud Private Cloud
Commercially available to connect more machines more data amp more people
TR
AN
SF
OR
MS
PO
WE
RS
PredictivityTM Solutions
30
Predictivitytrade hellip app factory
Asset optimization (28)
Operations optimization (14)
Productivity tools (77)
Approach Development process
Agile amp Extreme Programming
Design Center for delivering
compelling user interface
Cyber security Blue team to build
and Red team to test
90-120 day service engagement to production roll out
+
+
+
Co-innovation process to design
build transfer and iterate
Actionable insight on equipment based
on physics and analytic modeling
with industrial data
Outcome based process improvements
to plants pipelines fleets fields facilities
grids shops
Increase service throughput efficiency
and quality at optimized cost of
delivery
Delivering industry apps at speed and scale
31
World-class Software amp Analytics organization
Investing in Leadership Talent
Colin Parris (IBM)
SW Research
Co-located SW CTOs for business alignment
D Bartlett
(IBM)
Aviation
World-class technical resources
Computational amp analytics scientists
Platform developers
Software engineers
~10000
1000+ Biz
COE
Product Dev Software CTO
Brad Surak (SAP)
Harel Kodesh (Microsoft
Start Up Veteran)
Trans S Chotai
(HP)
OampG J Demesa
(Siemens)
PampW G Bell
(ServiceSource)
EM J Stone
(SAP)
HC E Eryurek
(GE)
+
+
- Cyber UX Data Science Agile development
Four deep core competencies ecosystem
1
Leading edge platform + world-
class ecosystem 2
Advanced research for building
the future 3
Advanced process to drive adoption amp enablement
4
Software Site
Organization
Technology amp Ecosystem
32
Wurldtech protecting critical infrastructure
World-class cyber security to operate assets + operations safely
About A GE Company acquired in May 2014 providing top cyber talent
Capability Assess protect amp certify critical infrastructure from cyber attack
Key Customers 4 of 6 top global OampG companies 9 of top 10 automation vendors
Security enhancements delivered through PredixTM and GE Products
Certify GE and non-GE products and customer environments
Identify vulnerabilities in OT products (GE and 3rd party)
Assess and prioritize risks for system operators
Achilles Industrial Next Gen Firewall to inspect and control
Industrial network traffic
Leverage industry leading threat intelligence
Protect operational
environments
Secure amp certify industrial products
Assess products amp operations for vulnerabilities
33
Partnerships amp Alliances
Intel ATampT AWS Cisco others
Venture Capital
Mergers amp Acquisitions
ThetaRay Mocana Frost
Strategic Moves
Wurldtech Austin Digital
Acquire capability to fill gaps
Pivotal Softbank Industrial Internet Consortium
Industrial internet ecosystem
Industry Ecosphere
Establish interoperable amp scalable solutions
Co-development amp go-to-market
Accelerate innovation amp success
Positioned to create value
Open PredixTM beyond GE
GE will sell
+ + Connected devices
Data Under Management
Performance Applications
PredixTM Machine Services
PredixTM Data Services
PredixTM Asset Services
Connect assets regardless of vendor or
vintage and provide value-added services
Aggregate and analyze data to produce
actionable business insights
Sell horizontal apps that maximize return
on assets and people
1
2
3
34
Competitive advantage
$1T Connected
Machines
managed by GE
replacement value
10M Sensors
collecting
50M Data
Elements
$20B Potential
Annual Customer Savings
50B Machines will be connected on the internet by 2020
2X Industrial data growth within next 10 years
Big Iron + Big Data = Big Outcomes
INDUSTRY GE
35
New ways to sell Services
2 Making Markets Different Economics
3 Co-creation amp Agile Development
4 Solution Architecture
5 Value Based Deal Shapes
6 New Industry Ecosystems
1 New Buyers and Influencers
GE Commercial Center of Excellence
Needs Target Architect Close
Qualification amp Pipeline Management
Sales Process
HireTrain Community of Experts
Enablement Toolkit
36
Accelerating time to value across channels
APM Subscription Services
Enterprise Analytics Projects
Upgrade value in CSAs
GE Sales Model
Existing Services sales team
New standalone software sales specialists
New outcome sellers + existing service sales team
Sales
acceleration
Expert SWAT
teams to
support deal
SW experts compelling
offer target one outcome
to land and expand
Ecosystem partners
SW COE app factory
Offering RMampD in CSA upside
and productivity Per well subscription
Enterprise SW deal
solution co-creation
ReliabilityMaxtrade FieldVantageTM Intelligent PipelineTM
GE OampG Example
Market
Opportunity $2B $600MM $27B
37
Measuring commercial success
Services revenue
Past Future
~5
+
rsquo13 rsquo17F
Assets under management $1T+ ++
PredictivityTM solutions revenue $08B ~$4-5B
Services backlog $180B ++
bull Adding more value to existing service relationships hellip training team to get more out of the installed base
bull Creating new revenue streams and building new commercial skills and incentive plans to accelerate growth
Outcome sellers solution architects product management amp marketing
bull Cultivate ecosystem to help accelerate commercially with access to CIOCTO relationships and system integration skills
Power amp Water Paul McElhinney - President amp CEO Power
Generation Services
- In current role since May 2014
- 26 years with GE
39
Power amp Water Services
Growing services amp delivering greater customer value
Key metrics Services imperatives ($ in billions)
13 14E
+
Backlog $53 +
Revenue $125
Installed base dynamics
1
2
3
4
Deliver on customer value + Develop flexible solutions
+ Reduce customer operating cost
Grow $installed base + Maximize impact of Alstom alliance + Invest in new service offerings
Expand margins + Tech upgrades amp software solutions + Outage excellence
Improve service execution amp delivery + Improved customer service levels
+ Optimize field service amp repair network
Unit growth up ~24X from 2008
Strong DP amp Wind growthhellip up ~1Kyear
~4000+ gas turbines in service
40
Global power industry is facing complex challengeshellip Offering innovative solutions to address customersrsquo needs
Fuel price uncertainty
Increasing regulation
Slow demand growth
Aging installed base
~15 years Average age of ~4K global GE gas turbines
Output
Efficiency
Reliability
Availability
Flexibility
Improving customersrsquo outcomes while decreasing costs
~$7B
Customer challenges
~$8B
~$2B
~$1B
~$2B
GE Predictivitytrade solutions amp industry benefit
~60+ Increase in US natural gas price since 2012
~(30) Thermal capacity in Europe since lsquorsquo08
Based on 10 year NPV
41
Investing in technology
Addressing multiple customer value levers
Advanced Gas Path (AGP) Industry leading output hellip up to +64 Industry leading efficiency hellip up to +18 Extends asset amp parts life hellip 96K hours
1
Op Flex Delivers flexibility to costs amp revenue Reduces start up time amp fuel consumption Expands fuel source opportunity
3
Dry Low NOx 26+ (DLN) Reduces NOx emissions by 40 Delivers industry leading flexibility Increases maintenance intervals to ~1250 starts
2
42
Power FlexEfficiencytrade Advanced Gas Path
Expanding the operating envelope
Ambient Temperature
Ou
tpu
t (M
W)
Op Flex
7FA03 baseline
AGP
+ ndash
+
Combining hardware and software hellip creating 2X the value
$17
$30
Op Flex
Average Customer Annual Value Per Unit ($MM)
Improving customer outcomes
AGP (Hardware)
AGP PredictivityTM
Solution
125+ AGPs with software sold to date
650000+ operating hours to date
43
Wind PowerUp hellip generating more output
Customer Outcome Up to 4
increase in power output across 283
wind turbines hellip 40+ GWhr annual increase ldquoThe PowerUp system offers a great chance for owners like us who are investing literally billions of dollars in this market to try and get more production out of existing assets GE took a lot of risk out of this for usrdquo
ndash Patrick Woodson CEO EON Climate amp Renewables
Opportunity for up to
20 more profit from up to
5 more output
A performance based
cooperative approach
with a holistic view of the
assets system and network
Flexible payment options
aligned to customer needs
+1400 turbines under contract since launch
Customer opportunity
Software enabled
Flexible platform
Proven results
Scale out
1
2
3
Healthcare Jan De Witte - President amp CEO Healthcare IT
- In current role since 2011
- 15 years with GE
45
Healthcare Services
Delivering value = higher quality outcomes at lower cost
Key metrics Services imperatives ($ in billions)
Backlog $11 +
Installed base dynamics
1
2
3
4
Deliver on customer value + Asset and workflow optimization + Analytics around EMRs amp Devices
Grow $installed base
+ Quality and analytics offerings + Solutions architecture amp delivery
Expand margins + Remote service amp SaaS models + Field services productivity Improve service execution amp delivery + Remote monitoring technologies + Field force deployment optimization
Emerging markets infrastructure build
Mature markets quality upgrades
ACA amp Enterprise Solutions IT penetration
13 14E
=+ Revenue $80
46
Healthcare industry shifting to value-based care GE software analytics and services are uniquely positioned to help
Customer challenges
Integrated Care Solutions hellip turning data into actionable insight Improving healthcare outcomes
Diagnostic quality
Patient-centric care
System profitability
Chronic Disease Management
Sources Institute of Medicine 2013 Porter Research 2013 McKinsey IHS Global Insight
29 Healthcare spend wasted each year
$260B Annual value creation through healthcare IT
59 US lives covered in value-based care model by 2015
Clinical Quality
Financial Performance
Operational Efficiency
Configurable Workflows
47
GEHC Software portfolio positioned along main outcome drivers for care systems
Diagnostic speed amp confidence
Productive care pathways
Wellness amp chronic disease management
Risk amp margin management
Costworkforce optimization
Population Health Management
Workflow
Archiving
Visualization
Financial Management
Care Delivery Management
Enterprise Imaging
Operations Management
Revenue Cycle
Risk assessment
Margin analytics
Workforce optimization
Asset Management
Integrated Care Solutions
Ambulatory Care
High Acuity Care
Cardiology
Analytics
Care coordin
Engagement
Providing caregivers the right actionable insight ndash when amp where they need it
Large GE device footprint generating
clinical data
HCIT domain in clinical workflow amp analytics
SW CoEPredixTM capabilities + +
48
Enterprise Imaging Improving diagnostic workflow in the cloud
Customer Challenges Cloud Case Exchange CentricityTM 360
Sample Customers Solution Architecture
Clinical Collaboration amp Advanced Analytics
Imaging Cost Control
Archive
Workflow
19 Time spent
gathering data
Workflow
velocity
Diagnostic
confidence
Cases diagnosed
incorrectly 35
~$2B segment by rsquo18 growing 25+
30 turn-around time
3 duplicate exams
Customer value $10MM+ cost pa
Image-as-a-Service lifecycle value $20MM+
Care quality
Cost
Source Research from the Journal of the American College of Radiology and the Journal of American Medicine
49
Customer Challenges Workforce management
Sample Customers
Operations Management Optimizing workforce productivity with API Healthcare
54 Hospital
operating cost
spent on labor
Solution Architecture
Real-Time Analytics Labor amp Patient Workflows
Time amp Attendance
Staffing amp Scheduling
HR amp Payroll
~$2B segment by rsquo18 growing 12+
20 Workforce productivity
Customer value $4MM cost pa
Workforce-mgmt services lifecycle $4MM+
80 Overtime wages
Matching care-giver capacity
amp patient need
Care quality
Labor
productivity
Source Beckerrsquos Hospital Review
50
Population Health Management Lowering the cost of chronic disease
Customer Challenges
Solution Architecture
Caradigm Analytics amp Care Mgt
Proactive
intervention
Care protocol
compliance
75 Cents of every
healthcare dollar
spent on chronic
disease
Care Mgt Analytics Risk Cohort
25
Customer value $5MM+ cost pa
Caradigm lifecycle value $18MM+
Patients per care manager
~$30B segment by 2025 growing 19+
Sample Customers
40 Hospitalization for chronic patients
Chronic disease
treatment cost
Source National Diabetes Fact Sheet
51
Software enabling productivity in service process
Wo
rkfo
rce
Pla
nn
ing
amp
Dis
pa
tch
Historically up to 40 FE travel time hellip utilize analytics to optimize allocation
Smart dispatch with effective job-skill matching
Optimize field force capacity and response time to customers
Call Generation (Planned amp Unplanned)
Deploy
RepairFix
Diagnose
CloseDebriefBill
Pe
rfo
rma
nce
M
on
ito
rin
g 110k GEHC devices connected remotely
MR hellip 900 data points monitored per machine 30k alertsyear proactively fixed
Improves GE productivity while minimizing customer down-time
Healthcare Services margins improving
Aviation Kevin McAllister - President amp CEO Aviation Services
- In current role since May 2014
- 25 years with GE
53
Aviation Services
13 14E
+ $108
Backlog $97 +
Revenue
Key metrics Services imperatives
Commercial IB hellip 34000 engines
Young hellip 46 havenrsquot had 1st shop visit
Fuel cost driving investment hellip GE well
positioned hellip 787 737MAX A320NEO 777X
Installed base dynamics
1
2
3
4
Deliver on customer value
+ Lowest cost of ownership
+ PredictivityTM outcomes
Grow $installed base
+ Winwin providing technology upgrades and analytics
Expand margins
+ Time-on-wing for GE and customers
+ Cost productivity hellip for GE
Best service execution and delivery
+ Position to support service entry for next-gen products
($ in billions)
54
Solid growth fundamentals
Shop visits Environment Departures
Source IATA amp GE analysis
Passengers IATA RPK YoY
Utilization Avg cycles day YoY
Departures GE and JV-powered flights (MM)
0
5
10
15
20
25
30
35
40
lsquo10 lsquo15F lsquo95 lsquo00 lsquo05
4100
5500
4400
2100
2000
3000
2300 2000
2300
200
100
-1 09 02
2012 2013 2014E
53 52 58
20 21 22
2 of 3 daily flights
powered by GE or GE JVs
46 have not
had 1st shop visit
4 CAGR Number of departures (MM)
lsquo13 rsquo15F rsquo20F
CFM is a 5050 JV between GE and Snecma EA is a 5050 JV between GE and Pratt amp Whitney
55
Solving our customers toughest challenges
Airline direct operating costs
Fuel
40
Delays and cancellations
8
Maintenance
9
Services analytics offerings
Flight Efficiency Services
Performance-based Navigation
Analytics-enabled workscoping
Product and Services strategy
Provide lowest cost-of-ownership through OEM technology
Lead in on-wing reliability
Lead in technology
Best-in-class fuel burn and retention
Engine diagnostic and prognostics
Intelligent Operations
$200Byr
$40Byr
Taleris is a 5050 JV between GE and Accenture
+
56
Services technologies hellip improving value through the lifecycle
Installed base (lsquo13) Upgrades
Fuel Burn improvement
Time- on-wing
8 8 2x
8 3 3x
5 2 2x
A culture of technology insertion Tailored to customer wants
CFM is a 5050 JV between GE and Snecma
Risk transfer $hour coverage
Overhaul Time and material
Materials New used and repaired parts
Asset optimization TRUEngineTM program diagnostics
+
CF6-80C (lsquo86 EIS)
GE90 (lsquo95 EIS)
CFM56 (lsquo84 EIS)
3000
1500
18500
57
Minds amp Machines at GE Aviation
+ Ex
po
sure
Operator A Operator B Part Temperature Cruise Takeoff
Te
mp
era
ture
Threshold
Climb
1000+ software engineers GE Software COE
6300 applied engineers GE Aviation
Data Secure continuous accessible
Physics Apply engine expertise
+ =
Customer and GE benefits
+
Statistics Unlock trends segment
ldquoPhysicsrdquo ldquoAnalyticsrdquo
Time-on-wing
Reliability and availability
Fuel cost
Repair and overhaul
58
Lead in on-wing reliability
Applied analytics to detect engines at risk of removal
Cu
mu
lati
ve
dis
tre
ss
Cycles
Recent successes hellip
CFM is a 5050 JV between GE and Snecma
Segment
GE90
120 CFM56
40 Water wash
$7Myr fuel savings at one GE90 operator
removals saved
removals saved
Nominal environment
Abate
Harsh environment
59
$30MMyr savings
Flight Efficiency Services App
Performance-based Navigation App
Attacking fuel spend with analytics
Joint marketing hellip
ldquoPerfect flightrdquo video
In the news
Newsletter
Oil amp Gas Brian Palmer - Vice President Measurement amp Control Solutions
- In current role since 2010
- 29 years with GE
61
Oil amp Gas Services
Software amp Services as a key differentiator
Key metrics Strategic imperatives ($ in billions)
13 14E
++
Backlog $58 ++
$83 Revenue
1
2
3
4
Deliver on customer value + Customer co-creation
+ Outcome based solutions
Grow $installed base + Drive analytics amp PredixTM
+ Penetrate the installed base
Expand margins + More software and contract offerings
+ Continue to grow backlog double digits
+ Partnerships to accelerate journeyhellip
Meridium
Improve service execution amp delivery + Full lifecycle productivity
+ Simplifying structure
IB growing TMS and Subsea with 13K+ units Software investments creating new IB revenue
streams in addition to traditional parts and service New contractual (CSA) offerings developedlaunched
Installed base dynamics
62
Oil amp gas industry is faced with expanding challenges GE software data and analytics are uniquely positioned to help
Customer challenges Equipment Availability
Equipment Reliability
Operational Efficiency
Production Optimization
Industrial Internet hellip turning data into actionable information Enable no unplanned downtime
Increasing complex operations
Tighter regulations
Skills gap
Machines with data potential
Sources GE OampG analysis based on Wood Mackenzie Rystad Barclays IHS CERA PFC Energy IEA httpwwwgecomstoriesoil-and-gas-innovation Oil and Gas Facilities 2013 httpwwwspeorgogfprintarchives201306
$800B+ Annual industry CAPEX (6-8 growth per year)
$150MM Average annual cost for mid-size LNG facility due to unplanned downtime
5-10 Range of OampG industryrsquos estimated downtime
63
Predixtrade hellip Unified Operations Improved throughput connecting people machines and data
Customer outcomes
Unified Operations ndash A customer co-creation success story
Enhanced safety
Increased availability
Operational visibility
Efficient workforce enablement
Partnering with to tackle these industry challenges and create a solution that increases production and lowers cost driving improved customer outcomes
Unified Customer
Portal
129000 Pieces of equipment in operation globally in
the industry
50 Industry retirement rate in next 10 years
7X Industry fatality rate
above norm
people
machines
data
64
FieldVantagetrade hellip Asset Performance Management (APM) for Onshore
APM ndash Bringing GE expertise from all industries to deliver system level value
Customer outcomes
Enhanced safety
Operational visibility
Improved availability
Optimized performance
Monitoring amp
Diagnostics
Condition Based
Maintenance
Real time Operations
Intelligence
Asset LifeCycle
Management
bull Providing field level visibility and optimization across multiple forms of artificial lift technologies bull Integrated insights provided through common single scalable platform bull 2 year service contract on 200+ wells
Solution Overview
39 NAM OampG Upstream Vehicle Fatalities
hellipby improving
116K New wells in 2014
5 Days Back to production (NAM Avg)
1MM+ Artificially Lifted Wells (Global)
65
Intelligent Pipeline hellip Operations optimization software for pipelines
2TB of data for every
30K miles of pipeline
3-4 annual growth
2MMmiles of
pipelines globally
$40B invested by pipeline companies per year
Source 2TB - Average data volume based on GE internal analysis of multiple pipeline customers Rest - GE OampG analysis based on Douglas Westwood IHS CERA FERC CIA World Factbook PII Pipeline Database (Summary of Infield Systems Global Data DOT databases)
bull 5 year service contract
bull Setting the industry standards for
pipelines real-time intelligence
First customer Customer outcomes
Enhanced safety Proactive versus reactive decisions
Visibility Complete geospatial view and situational awareness
Optimized Ops Effective data driven resource allocation
Efficient OampM Prioritize spending for assets and resources
Moving to proactive solutions with our customers
66
Customer Benefits
Zero unplanned downtime
Increased availability
Increased reliability
Decreased production losses
$14B Additional opportunity driven by
availability and reliability increase (1 of capacity)
Industry Opportunities
Outcome base service bonus
GE Productivity Improvements
Inventory through parts flow optimization
Outage durationfrequency driven by condition- based maintenance
Services Optimization hellip Creating optimal value for GE equipment customers
Journey to 100 reliability through our Contractual Services Agreements (CSA)
Transportation Pete McCabe - Vice President Global Services amp Solutions
- In current role since 2013
- 20 years with GE
68
Transportation Services ($ in billions)
13 14E
+
Revenue $28
Backlog $12B+ +
1
2
3
4
Deliver on customer value
+ Outcomes - velocity fuel reliability
+ System solutions ndash RailConnectTM 360
Grow $installed base
+ Increase penetration ndash Parts amp Smarts
+ Extend asset life ndash modernizations
+ Broaden software solutions ndash rOS
Expand margins
+ Deploy advanced analytics ndash PredixTM
Improve service execution amp delivery
+ Enhance commercial capabilities
+ Expand domain amp IT project expertise
Installed base dynamics
1000+ Tier 4-compliant loco orders
~650 locomotives un-parking in rsquo14
450 new locomotives in South Africa
Key metrics Services imperatives
69
Railroad industry is faced with expanding challenges and customers require a solution provider
Customer challenges
RailConnecttrade360 delivering customer focused outcomes
Asset utilization
Capacity limited
Resource constraints
Ops Complexity
$80B+ N American operating revenue (~4 growth)
7 year high Traffic volumes require unparalleled investment
$56B Annual industrial benefit through 1 improvement
Sources American Association of Railroads (AAR) 2013 industry statistics
70
Asset optimization ndash fuel efficiency
Customer Dynamics RailConnect 360 ndash Trip Optimizer
bull Real-time embedded optimization algorithms
bull Advanced data acquisition enabling train health monitoring
bull Automated train handling reduces wheel amp rail wear
bull $1M diesel locoyear 22K GE locos
bull Emissions
bull Huge operating variation operators trains topography
Trip Optimizer with CSX
Implementation on 1500 CSX locomotives
Reduced fuel use by 7 on average Decreased 3rd largest operating expense
- CSX Sustainability Report 2013
Tr ip Opt imizer Quick Star t Guide (1) Train Speed is available on the speedometer during an active trip during auto and Manual Control
(2) Trip Plan Speed displays a green Trip plan speed pointer on the speed indicator dial in Auto and Manual
modes of operation
(3) Trip Optimizer Status Box is visible when Trip Optimizer system is ACTIVE and provides three types of messages Status Request for Operator InputAction and Error
(4) TrackCivil Speed Limit plot line is Cyan shown the entire horizontal range data permitting
(5) Train Speed (Actual) plot line is White shown only from the head of the train on back
(6) Train Head is shown as a thick White line to allow the operator to see the position of the Train relative to the
terrain The horizontal scale of the rolling chart is zero-referenced to the Head of the Train (corresponds to the forward-facing end of the lead locomotive)
(7) Train Milepost has an associated location and name Its representation on the screen consists of a graphical
pointer and an identifier
(8) OMB Message Box displays operator messages
(9) Consist Notches displays Lead and Trailing locomotive notches
(10) Throttle Handle Notch represents the Master Control-ler handle position During TO Auto Control it will indicate
N8 as TO automatic control requires notch eight (N8) set-ting
(11) Auto Control Notch displays on screen as a White box to denote TO Auto Control engagement and throttle out-
put control
(12) Trip Plan Speed has a Green plot line shown as the entire horizontal range when available and data permit-
ting
(13) Manual Control Zones is shown as a Gray rectangle on the terrain plot extending across the entire vertical range of this section of the chart
(14) Planned Braking depicts Blue areas where Trip Opti-mizer expects that dynamic andor air braking will be
required to maintain the plan speed
(15) Key Locations are softkey states that constitute a unique mapping of functionality to key locations
1 How do I get started To start a trip you will push the Trip Optimizer key on the Main operator screen
2 Do I have to be stopped to request a trip through Trip Optimizer It is preferred to perform a trip init at zero speed however unless otherwise provided by
local ruleinstruction maximum speed for initialization is 15 mph
3 I have performed the Trip Init process and see the rolling map When will I get prompted for Auto Control
Auto Control will become available when the speed is greater than 12 mph and the Throttle handle is N1 or higher
4 Why does the Locomotive Status matter to Trip Optimizer Trip Optimizer will always monitor in train forces speed braking and fuel efficiency To best optimize all of these Train dynamics Trip Optimizer must be told by the operator what the
status of each locomotive in the train The three modes are defined as follows
Running The locomotive is fully operational and is used for calculating TPOB
Isolated The locomotive is either shut-down or is mechanically isolated from produc-
ing Tractive Effort
DB Cutout The locomotive has no Dynamic Braking available but is being used for
producing Tractive Effort
5 What is the recommended way to disengage Auto Control The most fuel efficient way is to decrease the throttle notches in 2 second intervals until
you get to the required speed
6 Trip Optimizer is disengaging from Auto mode and tells the opera-tor Manual Control is required I am already in Notch 8 throttle
What do I do
Press the Current Throttle key on the screen Moving the Master Controller from Notch 8 to
Notch 7 and back could result in un-safe train handling practices
7 Why does Trip Optimizer not always travel at Track speed Trip Optimizer will use the forces of the train and momentum to achieve the optimal speed to save fuel In some cases Idle will be used to meet a planned slow order Trip Optimizer is
always looking out a few miles ahead to plan for the ideal speed while maintaining safe train handling
8 How do I report an inaccuracy on the civil speed limits posted on the rolling map
Contract your Road Manager to report the case
9 The dispatcher has issued an enroute slow order Will Trip Opti-
mizer automatically take this into account
No If an enroute slow order is issued it will be the train crewrsquos responsibility to protect the
train in Manual mode during this affected zone
10 Why does Trip Optimizer automatically end the trip when I still have distance remaining before the preset crew change point
The subdivision has a GPS controlled end point that will automatically end the trip based off of recommendations from the railroad
Follow the steps on the backside of this document to walk you through performing a Trip Init
Trip Optimizer Top Ten List
GE Proprietary Information The information contained in this document is GE Proprietary Information and is disclosed in confidence It is the property of GE and shall not be used disclosed to others or repro-
duced without the express written consent of GE If consent is given for reproduction in whole or in part this notice and the notice set forth on each page of this document shall appear in any such reproduction in whole or in part The information contained in this document may also be controlled by the US export control laws Unauthorized export or re-export is
prohibited Document 5005807 Rev mdash
Before engaging the TO AUTO throttle the operator must meet certain train conditions and under-stand the data displayed on the Trip Optimizer Running Screen
Doc No 5005890 Rev -
71
Operations optimization ndash velocity
Movement Planner with Norfolk Southern
RailConnect 360 - Movement Planner
bull Systems problem hellip beyond human capabilities
bull Majority single track
bull Point solutions have plateaued
bull Integrated suite of day of operations software apps
bull Predixtrade platform - connectivity big data and security
bull Advanced algorithms and automatic routing
bull Proven in class 1 revenue service
Norfolk Southern and Movement Planner
Automated routing decisions
10+ increase in velocity
50+ reduction in expired crews Significant improvement in
schedule adherence
1MPH = ~$200MM estimated
annual savings in capital amp expenses
Based on 3 year study in NS GA division
Customer Dynamics
72
bull Co-development GE Transportation amp GE Intelligent Platforms
minus Enhanced sensor coverage
minus Improved data acquisition higher resolution
minus Advanced analytics
bull Asset specific insight drives fault reduction and enables CBM
(SmartSignal)
bull 20K+ overhauls in backlog
bull OH interval based on average expected condition
bull $1B+ capital expenditure in North America every year
Impact Reduced unplanned
downtime amp avoid road failures
Reduce unscheduled material consumption
Extended periodicity and associated expenses
ldquoPhysicsrdquo change
Real Time Engine Performance
Bearing Temp
Bearing Temp
Load
Ambient
To
da
y
To
mo
rro
w
Alarm trigger
Savings
CSA ndash shared productivity
Lifecycle Cost Dynamics ndash Engine Overhauls RailConnect 360 ndash Advanced Analytics
GErsquos 1 Jamie Miller - Senior Vice President Chief Information Officer
- In current role since 2013
- 9 years with GE
74
Digital opportunity
Simplifying structure
More valuable GE resources with fully integrated approach
+ Utilize data from products
+ Field services tools
+ CRM configurators
+ Brilliant Factory
Benefits
ERPmanufacturing 90
Data Centers 80
Applications 30
Shared Services 65
Cloud 70
Product Cost
RampD
SGampA
+ Engineering tools
+ Shared Services GL
+ Cyber Security
IT plays
-a)
(a - Target percent of new applications that are Cloud enabled
~$94B
Industrial cost
75
Three opportunities to power manufacturing
Digital Foundation 1
Unlocking Big Data
minus Sourcing
minus Productivity
2
Powering the Brilliant Factory
minus Design for manufacturing
minus Sensor enablement
minus Plantsupply chain optimization
3
minus 90 reduction in ERPs
Supply Chain Network
Virtual Mfg
Virtual Product Design
76
Product Cost ERP investments paying off
Inventory turns 6x 7x
Shipment on time 58 85
Foundation for business to deliver $1B+ savings over past 5 years
GE Healthcare
of revenue on target ERP ~75
~95
2009 Today
Today 219 ERPs 2016 34 ERPs
GE Water
2008 Today
22
1
of ERPs
SGampA of sales ~10 pts
Past dues 60
Finance headcount 50
77
Product Cost Using big data to run GE
Ingest Store Clean Consume
1 OampG data lake $8B direct materials buy
Real time More cheaper Faster GE-wide Analytics Data science
$60B total material buy across GE hellip $1B+ cash amp deflation opportunities
bull 23 source systems
bull Full visibility ndash 3 weeks
bull Commodity part supplier
bull Data lake technology
bull Machine learning for data cleansing
bull EM PampW underway (Alstom)
Oil amp Gas
Xxxxx Xxxxx Xxxxx xxxxx
78
Product Cost Technology powering the Brilliant Factory
20 NPI cycle hellip 20 efficiency
16 pilots launched hellip Fastworks 2020 Vision
FastWorks approach
Virtual design for manufacturing
30 NPI cycle time
Eliminated quality escapes
Wilmington NC
Aviation Machining
Factory optimization
25 productivity
PampE avoidance Greenville SC
PampW Nozzle Cell
machine downtime
25 opportunity
Sensor Enablement
Grove City PA
Transportation Remanufacturing
79
Smart Outage Full deployment at PGS
Changing the way we deliver Services
On track for $1B CSA productivity over 3 years and 10 customer uptime
+ +
Predictive Workscope Aviation 4 customers
full roll-out mid-2015
=
Field services optimization
Predictive workscope
Next generation modeling
Advanced technology
Accelerating productivity
80
We can do more ldquoSrdquo with less ldquoG+Ardquo
45 win rate
80 in quote time
5400+ SalesComm Ops hoursweek
QuickQuote
40K+ GE Commercial FTE
Highly manual long-cycle-time
More ldquoshots on goalrdquo lower cost
Investing in digital tools for commercial teams
Wrap up
82
Value for investors
Payback through most reliable revenue source Services
+ Increase revenue growth
+ Improve margins
+ CSA productivity
Funded software amp analytics through simplification amp reallocation
Potential upside beyond the GE installed base
Scale amp intellect Return on investment
1
2
3
GE Software COE
+ COE can accomplish scale hellip none of
our businesses could do this on their
own hellip attract talent amp spread ideas
+ Advantage to being an early mover hellip
right partnerships amp scale
+ Changing GE Industrial DNA hellip
greater impact from digital amp
analytical investments
83
Why GE
+ More valuable portfolio hellip 75 Industrial while growing EPS
+ Tangible evidence of winning NPI hellip Tier 4 LEAP etc
+ Strong amp diversified global footprint hellip best-in-class
+ Transforming service for next generation of growth
+ Culture of simplification impacting every part of GE
LEAP is a trademark of CFM International
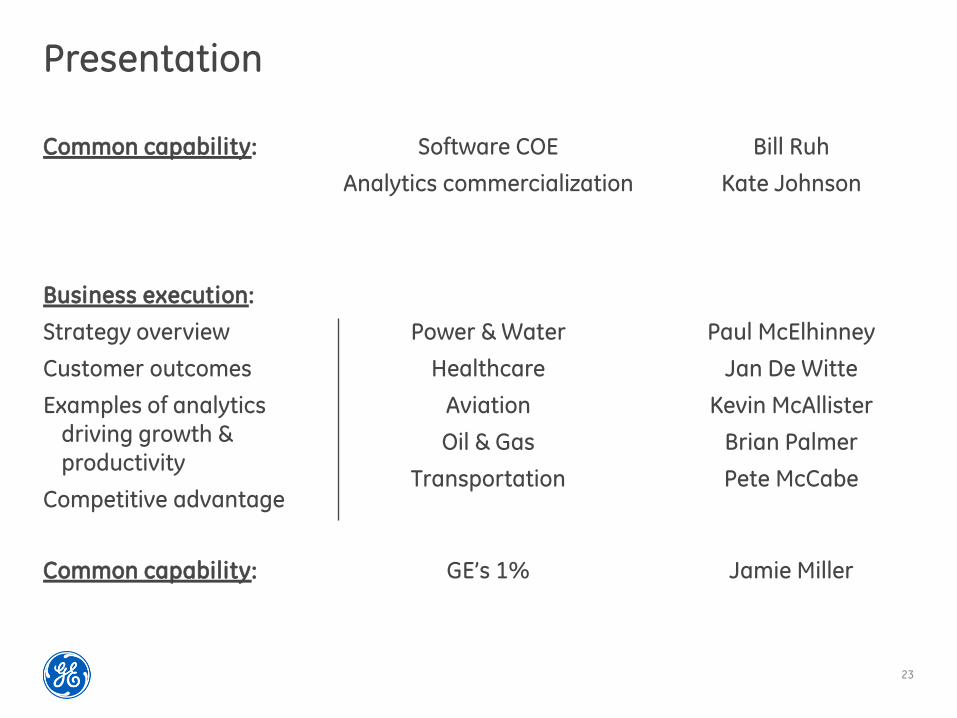

25
The Industrial Internet
3 Hyper connectivity a living network of the worldrsquos machines data amp people
Internet
Increasing system intelligence through embedded software hellip advanced sensors
controls and software applications
Brilliant Machines
Democratization of data hellip high frequency real-time data
Big Data
Predictive algorithms hellip physics-based analytics hellip deep domain expertise on big industrial data
Analytics
People at work Connecting people at work or on
the move Supporting more
intelligent design higher service
quality operations amp safety
maintenance
1
2
3
4
5
26
61
45
31 28 31 40 42
29
29
45 63
56 56
47 45
41
10 6 6
16 9 10 9
24
Software outlook Customer survey Importance of
Big Data analytics relative to other priorities
Source Accenture 2015 Trend Report Gartner Big Data Survey
Aviation
3 3 3 3 6
Wind
Power Generation
Power Distribution
Oil amp Gas
Rail
Manufacturing
Healthcare
Highest priority Within the top 3 priorities Within the top 5 priorities Not a top priority
Opex is becoming a deciding
factor for IT investments as
80 of budget is allocated to
managing and running
complex technologies Source Gartner
Advanced analytics and
analytical applications
expected to see double digit
revenue growth Source Gartner
APM market category
expected to reach $300B
by 2020 Source Gartner
27
Industrial customersrsquo perspective Survey of GErsquos customers regarding applications
Real-Time Operator Intelligence
Remote Monitoring amp Diagnostics
Condition-Based Maintenance
Asset Lifecycle Management
Schedule Optimization
Energy Management
Process Control Automation
Field Force Automation 32
38
42
43
49
59
66
70 Tailor Pre-Built Applications
Have A Systems Integrator Build
Your Apps
Build My Own Custom Apps 15
54
85
HOW do you want to consume it WHAT functionality is most valuable
Asset performance management is the killer industrial app
28
What industrial customers want
SDM
SDM
SDM
SDM SDM
Software Defined Machines (SDMs)
ldquoLink up all my assets and devicesrdquo
REAL-TIME
OPERATIONAL
INTELLIGENCE
CONDITION-
BASED
MONITORING
ASSET LIFECYCLE
MANAGEMENT
MONITORING amp
DIAGNOSTICS
Industrial Apps
SDM Non-GE Assets enabled by PredixTM Machine SDM
SDM GE Assets enabled by PredixTM Machine SDM
PredixTM powers Asset Performance Management (APM)
29
Insights into value
Improving safety and
productivity across 15K miles
of interstate natural gas
pipelines
Potential Savings
77 gallons of fuel and 1628
lbs of CO2 per approach
10 increase in network
velocity 50 reduction in
expired crews amp significant
improvements in on-time
performance
Up to 4 increase in power
output across 283 wind
turbines hellip 40+ GWhr annual
increase
Asset Performance Management (APM)
REAL-TIME OPERATIONAL
INTELLIGENCE
CONDITION-BASED
MONITORING
ASSET LIFECYCLE MANAGEMENT
MONITORING amp
DIAGNOSTICS
Operations Optimization
INSIGHT PROCESS
INTEGRATION
AUTOMATION COLLABORATION
PredixTM Platform
PredixTM Machine PredixTM Net
GE
Non-GE
PredixTM Asset PredixTM Insight
PredixTM Fabric PredixTM Core
PredixTM Experience
Predixtrade hellip the GE advantage
Release in 2015
Public Cloud Private Cloud
Commercially available to connect more machines more data amp more people
TR
AN
SF
OR
MS
PO
WE
RS
PredictivityTM Solutions
30
Predictivitytrade hellip app factory
Asset optimization (28)
Operations optimization (14)
Productivity tools (77)
Approach Development process
Agile amp Extreme Programming
Design Center for delivering
compelling user interface
Cyber security Blue team to build
and Red team to test
90-120 day service engagement to production roll out
+
+
+
Co-innovation process to design
build transfer and iterate
Actionable insight on equipment based
on physics and analytic modeling
with industrial data
Outcome based process improvements
to plants pipelines fleets fields facilities
grids shops
Increase service throughput efficiency
and quality at optimized cost of
delivery
Delivering industry apps at speed and scale
31
World-class Software amp Analytics organization
Investing in Leadership Talent
Colin Parris (IBM)
SW Research
Co-located SW CTOs for business alignment
D Bartlett
(IBM)
Aviation
World-class technical resources
Computational amp analytics scientists
Platform developers
Software engineers
~10000
1000+ Biz
COE
Product Dev Software CTO
Brad Surak (SAP)
Harel Kodesh (Microsoft
Start Up Veteran)
Trans S Chotai
(HP)
OampG J Demesa
(Siemens)
PampW G Bell
(ServiceSource)
EM J Stone
(SAP)
HC E Eryurek
(GE)
+
+
- Cyber UX Data Science Agile development
Four deep core competencies ecosystem
1
Leading edge platform + world-
class ecosystem 2
Advanced research for building
the future 3
Advanced process to drive adoption amp enablement
4
Software Site
Organization
Technology amp Ecosystem
32
Wurldtech protecting critical infrastructure
World-class cyber security to operate assets + operations safely
About A GE Company acquired in May 2014 providing top cyber talent
Capability Assess protect amp certify critical infrastructure from cyber attack
Key Customers 4 of 6 top global OampG companies 9 of top 10 automation vendors
Security enhancements delivered through PredixTM and GE Products
Certify GE and non-GE products and customer environments
Identify vulnerabilities in OT products (GE and 3rd party)
Assess and prioritize risks for system operators
Achilles Industrial Next Gen Firewall to inspect and control
Industrial network traffic
Leverage industry leading threat intelligence
Protect operational
environments
Secure amp certify industrial products
Assess products amp operations for vulnerabilities
33
Partnerships amp Alliances
Intel ATampT AWS Cisco others
Venture Capital
Mergers amp Acquisitions
ThetaRay Mocana Frost
Strategic Moves
Wurldtech Austin Digital
Acquire capability to fill gaps
Pivotal Softbank Industrial Internet Consortium
Industrial internet ecosystem
Industry Ecosphere
Establish interoperable amp scalable solutions
Co-development amp go-to-market
Accelerate innovation amp success
Positioned to create value
Open PredixTM beyond GE
GE will sell
+ + Connected devices
Data Under Management
Performance Applications
PredixTM Machine Services
PredixTM Data Services
PredixTM Asset Services
Connect assets regardless of vendor or
vintage and provide value-added services
Aggregate and analyze data to produce
actionable business insights
Sell horizontal apps that maximize return
on assets and people
1
2
3
34
Competitive advantage
$1T Connected
Machines
managed by GE
replacement value
10M Sensors
collecting
50M Data
Elements
$20B Potential
Annual Customer Savings
50B Machines will be connected on the internet by 2020
2X Industrial data growth within next 10 years
Big Iron + Big Data = Big Outcomes
INDUSTRY GE
35
New ways to sell Services
2 Making Markets Different Economics
3 Co-creation amp Agile Development
4 Solution Architecture
5 Value Based Deal Shapes
6 New Industry Ecosystems
1 New Buyers and Influencers
GE Commercial Center of Excellence
Needs Target Architect Close
Qualification amp Pipeline Management
Sales Process
HireTrain Community of Experts
Enablement Toolkit
36
Accelerating time to value across channels
APM Subscription Services
Enterprise Analytics Projects
Upgrade value in CSAs
GE Sales Model
Existing Services sales team
New standalone software sales specialists
New outcome sellers + existing service sales team
Sales
acceleration
Expert SWAT
teams to
support deal
SW experts compelling
offer target one outcome
to land and expand
Ecosystem partners
SW COE app factory
Offering RMampD in CSA upside
and productivity Per well subscription
Enterprise SW deal
solution co-creation
ReliabilityMaxtrade FieldVantageTM Intelligent PipelineTM
GE OampG Example
Market
Opportunity $2B $600MM $27B
37
Measuring commercial success
Services revenue
Past Future
~5
+
rsquo13 rsquo17F
Assets under management $1T+ ++
PredictivityTM solutions revenue $08B ~$4-5B
Services backlog $180B ++
bull Adding more value to existing service relationships hellip training team to get more out of the installed base
bull Creating new revenue streams and building new commercial skills and incentive plans to accelerate growth
Outcome sellers solution architects product management amp marketing
bull Cultivate ecosystem to help accelerate commercially with access to CIOCTO relationships and system integration skills
Power amp Water Paul McElhinney - President amp CEO Power
Generation Services
- In current role since May 2014
- 26 years with GE
39
Power amp Water Services
Growing services amp delivering greater customer value
Key metrics Services imperatives ($ in billions)
13 14E
+
Backlog $53 +
Revenue $125
Installed base dynamics
1
2
3
4
Deliver on customer value + Develop flexible solutions
+ Reduce customer operating cost
Grow $installed base + Maximize impact of Alstom alliance + Invest in new service offerings
Expand margins + Tech upgrades amp software solutions + Outage excellence
Improve service execution amp delivery + Improved customer service levels
+ Optimize field service amp repair network
Unit growth up ~24X from 2008
Strong DP amp Wind growthhellip up ~1Kyear
~4000+ gas turbines in service
40
Global power industry is facing complex challengeshellip Offering innovative solutions to address customersrsquo needs
Fuel price uncertainty
Increasing regulation
Slow demand growth
Aging installed base
~15 years Average age of ~4K global GE gas turbines
Output
Efficiency
Reliability
Availability
Flexibility
Improving customersrsquo outcomes while decreasing costs
~$7B
Customer challenges
~$8B
~$2B
~$1B
~$2B
GE Predictivitytrade solutions amp industry benefit
~60+ Increase in US natural gas price since 2012
~(30) Thermal capacity in Europe since lsquorsquo08
Based on 10 year NPV
41
Investing in technology
Addressing multiple customer value levers
Advanced Gas Path (AGP) Industry leading output hellip up to +64 Industry leading efficiency hellip up to +18 Extends asset amp parts life hellip 96K hours
1
Op Flex Delivers flexibility to costs amp revenue Reduces start up time amp fuel consumption Expands fuel source opportunity
3
Dry Low NOx 26+ (DLN) Reduces NOx emissions by 40 Delivers industry leading flexibility Increases maintenance intervals to ~1250 starts
2
42
Power FlexEfficiencytrade Advanced Gas Path
Expanding the operating envelope
Ambient Temperature
Ou
tpu
t (M
W)
Op Flex
7FA03 baseline
AGP
+ ndash
+
Combining hardware and software hellip creating 2X the value
$17
$30
Op Flex
Average Customer Annual Value Per Unit ($MM)
Improving customer outcomes
AGP (Hardware)
AGP PredictivityTM
Solution
125+ AGPs with software sold to date
650000+ operating hours to date
43
Wind PowerUp hellip generating more output
Customer Outcome Up to 4
increase in power output across 283
wind turbines hellip 40+ GWhr annual increase ldquoThe PowerUp system offers a great chance for owners like us who are investing literally billions of dollars in this market to try and get more production out of existing assets GE took a lot of risk out of this for usrdquo
ndash Patrick Woodson CEO EON Climate amp Renewables
Opportunity for up to
20 more profit from up to
5 more output
A performance based
cooperative approach
with a holistic view of the
assets system and network
Flexible payment options
aligned to customer needs
+1400 turbines under contract since launch
Customer opportunity
Software enabled
Flexible platform
Proven results
Scale out
1
2
3
Healthcare Jan De Witte - President amp CEO Healthcare IT
- In current role since 2011
- 15 years with GE
45
Healthcare Services
Delivering value = higher quality outcomes at lower cost
Key metrics Services imperatives ($ in billions)
Backlog $11 +
Installed base dynamics
1
2
3
4
Deliver on customer value + Asset and workflow optimization + Analytics around EMRs amp Devices
Grow $installed base
+ Quality and analytics offerings + Solutions architecture amp delivery
Expand margins + Remote service amp SaaS models + Field services productivity Improve service execution amp delivery + Remote monitoring technologies + Field force deployment optimization
Emerging markets infrastructure build
Mature markets quality upgrades
ACA amp Enterprise Solutions IT penetration
13 14E
=+ Revenue $80
46
Healthcare industry shifting to value-based care GE software analytics and services are uniquely positioned to help
Customer challenges
Integrated Care Solutions hellip turning data into actionable insight Improving healthcare outcomes
Diagnostic quality
Patient-centric care
System profitability
Chronic Disease Management
Sources Institute of Medicine 2013 Porter Research 2013 McKinsey IHS Global Insight
29 Healthcare spend wasted each year
$260B Annual value creation through healthcare IT
59 US lives covered in value-based care model by 2015
Clinical Quality
Financial Performance
Operational Efficiency
Configurable Workflows
47
GEHC Software portfolio positioned along main outcome drivers for care systems
Diagnostic speed amp confidence
Productive care pathways
Wellness amp chronic disease management
Risk amp margin management
Costworkforce optimization
Population Health Management
Workflow
Archiving
Visualization
Financial Management
Care Delivery Management
Enterprise Imaging
Operations Management
Revenue Cycle
Risk assessment
Margin analytics
Workforce optimization
Asset Management
Integrated Care Solutions
Ambulatory Care
High Acuity Care
Cardiology
Analytics
Care coordin
Engagement
Providing caregivers the right actionable insight ndash when amp where they need it
Large GE device footprint generating
clinical data
HCIT domain in clinical workflow amp analytics
SW CoEPredixTM capabilities + +
48
Enterprise Imaging Improving diagnostic workflow in the cloud
Customer Challenges Cloud Case Exchange CentricityTM 360
Sample Customers Solution Architecture
Clinical Collaboration amp Advanced Analytics
Imaging Cost Control
Archive
Workflow
19 Time spent
gathering data
Workflow
velocity
Diagnostic
confidence
Cases diagnosed
incorrectly 35
~$2B segment by rsquo18 growing 25+
30 turn-around time
3 duplicate exams
Customer value $10MM+ cost pa
Image-as-a-Service lifecycle value $20MM+
Care quality
Cost
Source Research from the Journal of the American College of Radiology and the Journal of American Medicine
49
Customer Challenges Workforce management
Sample Customers
Operations Management Optimizing workforce productivity with API Healthcare
54 Hospital
operating cost
spent on labor
Solution Architecture
Real-Time Analytics Labor amp Patient Workflows
Time amp Attendance
Staffing amp Scheduling
HR amp Payroll
~$2B segment by rsquo18 growing 12+
20 Workforce productivity
Customer value $4MM cost pa
Workforce-mgmt services lifecycle $4MM+
80 Overtime wages
Matching care-giver capacity
amp patient need
Care quality
Labor
productivity
Source Beckerrsquos Hospital Review
50
Population Health Management Lowering the cost of chronic disease
Customer Challenges
Solution Architecture
Caradigm Analytics amp Care Mgt
Proactive
intervention
Care protocol
compliance
75 Cents of every
healthcare dollar
spent on chronic
disease
Care Mgt Analytics Risk Cohort
25
Customer value $5MM+ cost pa
Caradigm lifecycle value $18MM+
Patients per care manager
~$30B segment by 2025 growing 19+
Sample Customers
40 Hospitalization for chronic patients
Chronic disease
treatment cost
Source National Diabetes Fact Sheet
51
Software enabling productivity in service process
Wo
rkfo
rce
Pla
nn
ing
amp
Dis
pa
tch
Historically up to 40 FE travel time hellip utilize analytics to optimize allocation
Smart dispatch with effective job-skill matching
Optimize field force capacity and response time to customers
Call Generation (Planned amp Unplanned)
Deploy
RepairFix
Diagnose
CloseDebriefBill
Pe
rfo
rma
nce
M
on
ito
rin
g 110k GEHC devices connected remotely
MR hellip 900 data points monitored per machine 30k alertsyear proactively fixed
Improves GE productivity while minimizing customer down-time
Healthcare Services margins improving
Aviation Kevin McAllister - President amp CEO Aviation Services
- In current role since May 2014
- 25 years with GE
53
Aviation Services
13 14E
+ $108
Backlog $97 +
Revenue
Key metrics Services imperatives
Commercial IB hellip 34000 engines
Young hellip 46 havenrsquot had 1st shop visit
Fuel cost driving investment hellip GE well
positioned hellip 787 737MAX A320NEO 777X
Installed base dynamics
1
2
3
4
Deliver on customer value
+ Lowest cost of ownership
+ PredictivityTM outcomes
Grow $installed base
+ Winwin providing technology upgrades and analytics
Expand margins
+ Time-on-wing for GE and customers
+ Cost productivity hellip for GE
Best service execution and delivery
+ Position to support service entry for next-gen products
($ in billions)
54
Solid growth fundamentals
Shop visits Environment Departures
Source IATA amp GE analysis
Passengers IATA RPK YoY
Utilization Avg cycles day YoY
Departures GE and JV-powered flights (MM)
0
5
10
15
20
25
30
35
40
lsquo10 lsquo15F lsquo95 lsquo00 lsquo05
4100
5500
4400
2100
2000
3000
2300 2000
2300
200
100
-1 09 02
2012 2013 2014E
53 52 58
20 21 22
2 of 3 daily flights
powered by GE or GE JVs
46 have not
had 1st shop visit
4 CAGR Number of departures (MM)
lsquo13 rsquo15F rsquo20F
CFM is a 5050 JV between GE and Snecma EA is a 5050 JV between GE and Pratt amp Whitney
55
Solving our customers toughest challenges
Airline direct operating costs
Fuel
40
Delays and cancellations
8
Maintenance
9
Services analytics offerings
Flight Efficiency Services
Performance-based Navigation
Analytics-enabled workscoping
Product and Services strategy
Provide lowest cost-of-ownership through OEM technology
Lead in on-wing reliability
Lead in technology
Best-in-class fuel burn and retention
Engine diagnostic and prognostics
Intelligent Operations
$200Byr
$40Byr
Taleris is a 5050 JV between GE and Accenture
+
56
Services technologies hellip improving value through the lifecycle
Installed base (lsquo13) Upgrades
Fuel Burn improvement
Time- on-wing
8 8 2x
8 3 3x
5 2 2x
A culture of technology insertion Tailored to customer wants
CFM is a 5050 JV between GE and Snecma
Risk transfer $hour coverage
Overhaul Time and material
Materials New used and repaired parts
Asset optimization TRUEngineTM program diagnostics
+
CF6-80C (lsquo86 EIS)
GE90 (lsquo95 EIS)
CFM56 (lsquo84 EIS)
3000
1500
18500
57
Minds amp Machines at GE Aviation
+ Ex
po
sure
Operator A Operator B Part Temperature Cruise Takeoff
Te
mp
era
ture
Threshold
Climb
1000+ software engineers GE Software COE
6300 applied engineers GE Aviation
Data Secure continuous accessible
Physics Apply engine expertise
+ =
Customer and GE benefits
+
Statistics Unlock trends segment
ldquoPhysicsrdquo ldquoAnalyticsrdquo
Time-on-wing
Reliability and availability
Fuel cost
Repair and overhaul
58
Lead in on-wing reliability
Applied analytics to detect engines at risk of removal
Cu
mu
lati
ve
dis
tre
ss
Cycles
Recent successes hellip
CFM is a 5050 JV between GE and Snecma
Segment
GE90
120 CFM56
40 Water wash
$7Myr fuel savings at one GE90 operator
removals saved
removals saved
Nominal environment
Abate
Harsh environment
59
$30MMyr savings
Flight Efficiency Services App
Performance-based Navigation App
Attacking fuel spend with analytics
Joint marketing hellip
ldquoPerfect flightrdquo video
In the news
Newsletter
Oil amp Gas Brian Palmer - Vice President Measurement amp Control Solutions
- In current role since 2010
- 29 years with GE
61
Oil amp Gas Services
Software amp Services as a key differentiator
Key metrics Strategic imperatives ($ in billions)
13 14E
++
Backlog $58 ++
$83 Revenue
1
2
3
4
Deliver on customer value + Customer co-creation
+ Outcome based solutions
Grow $installed base + Drive analytics amp PredixTM
+ Penetrate the installed base
Expand margins + More software and contract offerings
+ Continue to grow backlog double digits
+ Partnerships to accelerate journeyhellip
Meridium
Improve service execution amp delivery + Full lifecycle productivity
+ Simplifying structure
IB growing TMS and Subsea with 13K+ units Software investments creating new IB revenue
streams in addition to traditional parts and service New contractual (CSA) offerings developedlaunched
Installed base dynamics
62
Oil amp gas industry is faced with expanding challenges GE software data and analytics are uniquely positioned to help
Customer challenges Equipment Availability
Equipment Reliability
Operational Efficiency
Production Optimization
Industrial Internet hellip turning data into actionable information Enable no unplanned downtime
Increasing complex operations
Tighter regulations
Skills gap
Machines with data potential
Sources GE OampG analysis based on Wood Mackenzie Rystad Barclays IHS CERA PFC Energy IEA httpwwwgecomstoriesoil-and-gas-innovation Oil and Gas Facilities 2013 httpwwwspeorgogfprintarchives201306
$800B+ Annual industry CAPEX (6-8 growth per year)
$150MM Average annual cost for mid-size LNG facility due to unplanned downtime
5-10 Range of OampG industryrsquos estimated downtime
63
Predixtrade hellip Unified Operations Improved throughput connecting people machines and data
Customer outcomes
Unified Operations ndash A customer co-creation success story
Enhanced safety
Increased availability
Operational visibility
Efficient workforce enablement
Partnering with to tackle these industry challenges and create a solution that increases production and lowers cost driving improved customer outcomes
Unified Customer
Portal
129000 Pieces of equipment in operation globally in
the industry
50 Industry retirement rate in next 10 years
7X Industry fatality rate
above norm
people
machines
data
64
FieldVantagetrade hellip Asset Performance Management (APM) for Onshore
APM ndash Bringing GE expertise from all industries to deliver system level value
Customer outcomes
Enhanced safety
Operational visibility
Improved availability
Optimized performance
Monitoring amp
Diagnostics
Condition Based
Maintenance
Real time Operations
Intelligence
Asset LifeCycle
Management
bull Providing field level visibility and optimization across multiple forms of artificial lift technologies bull Integrated insights provided through common single scalable platform bull 2 year service contract on 200+ wells
Solution Overview
39 NAM OampG Upstream Vehicle Fatalities
hellipby improving
116K New wells in 2014
5 Days Back to production (NAM Avg)
1MM+ Artificially Lifted Wells (Global)
65
Intelligent Pipeline hellip Operations optimization software for pipelines
2TB of data for every
30K miles of pipeline
3-4 annual growth
2MMmiles of
pipelines globally
$40B invested by pipeline companies per year
Source 2TB - Average data volume based on GE internal analysis of multiple pipeline customers Rest - GE OampG analysis based on Douglas Westwood IHS CERA FERC CIA World Factbook PII Pipeline Database (Summary of Infield Systems Global Data DOT databases)
bull 5 year service contract
bull Setting the industry standards for
pipelines real-time intelligence
First customer Customer outcomes
Enhanced safety Proactive versus reactive decisions
Visibility Complete geospatial view and situational awareness
Optimized Ops Effective data driven resource allocation
Efficient OampM Prioritize spending for assets and resources
Moving to proactive solutions with our customers
66
Customer Benefits
Zero unplanned downtime
Increased availability
Increased reliability
Decreased production losses
$14B Additional opportunity driven by
availability and reliability increase (1 of capacity)
Industry Opportunities
Outcome base service bonus
GE Productivity Improvements
Inventory through parts flow optimization
Outage durationfrequency driven by condition- based maintenance
Services Optimization hellip Creating optimal value for GE equipment customers
Journey to 100 reliability through our Contractual Services Agreements (CSA)
Transportation Pete McCabe - Vice President Global Services amp Solutions
- In current role since 2013
- 20 years with GE
68
Transportation Services ($ in billions)
13 14E
+
Revenue $28
Backlog $12B+ +
1
2
3
4
Deliver on customer value
+ Outcomes - velocity fuel reliability
+ System solutions ndash RailConnectTM 360
Grow $installed base
+ Increase penetration ndash Parts amp Smarts
+ Extend asset life ndash modernizations
+ Broaden software solutions ndash rOS
Expand margins
+ Deploy advanced analytics ndash PredixTM
Improve service execution amp delivery
+ Enhance commercial capabilities
+ Expand domain amp IT project expertise
Installed base dynamics
1000+ Tier 4-compliant loco orders
~650 locomotives un-parking in rsquo14
450 new locomotives in South Africa
Key metrics Services imperatives
69
Railroad industry is faced with expanding challenges and customers require a solution provider
Customer challenges
RailConnecttrade360 delivering customer focused outcomes
Asset utilization
Capacity limited
Resource constraints
Ops Complexity
$80B+ N American operating revenue (~4 growth)
7 year high Traffic volumes require unparalleled investment
$56B Annual industrial benefit through 1 improvement
Sources American Association of Railroads (AAR) 2013 industry statistics
70
Asset optimization ndash fuel efficiency
Customer Dynamics RailConnect 360 ndash Trip Optimizer
bull Real-time embedded optimization algorithms
bull Advanced data acquisition enabling train health monitoring
bull Automated train handling reduces wheel amp rail wear
bull $1M diesel locoyear 22K GE locos
bull Emissions
bull Huge operating variation operators trains topography
Trip Optimizer with CSX
Implementation on 1500 CSX locomotives
Reduced fuel use by 7 on average Decreased 3rd largest operating expense
- CSX Sustainability Report 2013
Tr ip Opt imizer Quick Star t Guide (1) Train Speed is available on the speedometer during an active trip during auto and Manual Control
(2) Trip Plan Speed displays a green Trip plan speed pointer on the speed indicator dial in Auto and Manual
modes of operation
(3) Trip Optimizer Status Box is visible when Trip Optimizer system is ACTIVE and provides three types of messages Status Request for Operator InputAction and Error
(4) TrackCivil Speed Limit plot line is Cyan shown the entire horizontal range data permitting
(5) Train Speed (Actual) plot line is White shown only from the head of the train on back
(6) Train Head is shown as a thick White line to allow the operator to see the position of the Train relative to the
terrain The horizontal scale of the rolling chart is zero-referenced to the Head of the Train (corresponds to the forward-facing end of the lead locomotive)
(7) Train Milepost has an associated location and name Its representation on the screen consists of a graphical
pointer and an identifier
(8) OMB Message Box displays operator messages
(9) Consist Notches displays Lead and Trailing locomotive notches
(10) Throttle Handle Notch represents the Master Control-ler handle position During TO Auto Control it will indicate
N8 as TO automatic control requires notch eight (N8) set-ting
(11) Auto Control Notch displays on screen as a White box to denote TO Auto Control engagement and throttle out-
put control
(12) Trip Plan Speed has a Green plot line shown as the entire horizontal range when available and data permit-
ting
(13) Manual Control Zones is shown as a Gray rectangle on the terrain plot extending across the entire vertical range of this section of the chart
(14) Planned Braking depicts Blue areas where Trip Opti-mizer expects that dynamic andor air braking will be
required to maintain the plan speed
(15) Key Locations are softkey states that constitute a unique mapping of functionality to key locations
1 How do I get started To start a trip you will push the Trip Optimizer key on the Main operator screen
2 Do I have to be stopped to request a trip through Trip Optimizer It is preferred to perform a trip init at zero speed however unless otherwise provided by
local ruleinstruction maximum speed for initialization is 15 mph
3 I have performed the Trip Init process and see the rolling map When will I get prompted for Auto Control
Auto Control will become available when the speed is greater than 12 mph and the Throttle handle is N1 or higher
4 Why does the Locomotive Status matter to Trip Optimizer Trip Optimizer will always monitor in train forces speed braking and fuel efficiency To best optimize all of these Train dynamics Trip Optimizer must be told by the operator what the
status of each locomotive in the train The three modes are defined as follows
Running The locomotive is fully operational and is used for calculating TPOB
Isolated The locomotive is either shut-down or is mechanically isolated from produc-
ing Tractive Effort
DB Cutout The locomotive has no Dynamic Braking available but is being used for
producing Tractive Effort
5 What is the recommended way to disengage Auto Control The most fuel efficient way is to decrease the throttle notches in 2 second intervals until
you get to the required speed
6 Trip Optimizer is disengaging from Auto mode and tells the opera-tor Manual Control is required I am already in Notch 8 throttle
What do I do
Press the Current Throttle key on the screen Moving the Master Controller from Notch 8 to
Notch 7 and back could result in un-safe train handling practices
7 Why does Trip Optimizer not always travel at Track speed Trip Optimizer will use the forces of the train and momentum to achieve the optimal speed to save fuel In some cases Idle will be used to meet a planned slow order Trip Optimizer is
always looking out a few miles ahead to plan for the ideal speed while maintaining safe train handling
8 How do I report an inaccuracy on the civil speed limits posted on the rolling map
Contract your Road Manager to report the case
9 The dispatcher has issued an enroute slow order Will Trip Opti-
mizer automatically take this into account
No If an enroute slow order is issued it will be the train crewrsquos responsibility to protect the
train in Manual mode during this affected zone
10 Why does Trip Optimizer automatically end the trip when I still have distance remaining before the preset crew change point
The subdivision has a GPS controlled end point that will automatically end the trip based off of recommendations from the railroad
Follow the steps on the backside of this document to walk you through performing a Trip Init
Trip Optimizer Top Ten List
GE Proprietary Information The information contained in this document is GE Proprietary Information and is disclosed in confidence It is the property of GE and shall not be used disclosed to others or repro-
duced without the express written consent of GE If consent is given for reproduction in whole or in part this notice and the notice set forth on each page of this document shall appear in any such reproduction in whole or in part The information contained in this document may also be controlled by the US export control laws Unauthorized export or re-export is
prohibited Document 5005807 Rev mdash
Before engaging the TO AUTO throttle the operator must meet certain train conditions and under-stand the data displayed on the Trip Optimizer Running Screen
Doc No 5005890 Rev -
71
Operations optimization ndash velocity
Movement Planner with Norfolk Southern
RailConnect 360 - Movement Planner
bull Systems problem hellip beyond human capabilities
bull Majority single track
bull Point solutions have plateaued
bull Integrated suite of day of operations software apps
bull Predixtrade platform - connectivity big data and security
bull Advanced algorithms and automatic routing
bull Proven in class 1 revenue service
Norfolk Southern and Movement Planner
Automated routing decisions
10+ increase in velocity
50+ reduction in expired crews Significant improvement in
schedule adherence
1MPH = ~$200MM estimated
annual savings in capital amp expenses
Based on 3 year study in NS GA division
Customer Dynamics
72
bull Co-development GE Transportation amp GE Intelligent Platforms
minus Enhanced sensor coverage
minus Improved data acquisition higher resolution
minus Advanced analytics
bull Asset specific insight drives fault reduction and enables CBM
(SmartSignal)
bull 20K+ overhauls in backlog
bull OH interval based on average expected condition
bull $1B+ capital expenditure in North America every year
Impact Reduced unplanned
downtime amp avoid road failures
Reduce unscheduled material consumption
Extended periodicity and associated expenses
ldquoPhysicsrdquo change
Real Time Engine Performance
Bearing Temp
Bearing Temp
Load
Ambient
To
da
y
To
mo
rro
w
Alarm trigger
Savings
CSA ndash shared productivity
Lifecycle Cost Dynamics ndash Engine Overhauls RailConnect 360 ndash Advanced Analytics
GErsquos 1 Jamie Miller - Senior Vice President Chief Information Officer
- In current role since 2013
- 9 years with GE
74
Digital opportunity
Simplifying structure
More valuable GE resources with fully integrated approach
+ Utilize data from products
+ Field services tools
+ CRM configurators
+ Brilliant Factory
Benefits
ERPmanufacturing 90
Data Centers 80
Applications 30
Shared Services 65
Cloud 70
Product Cost
RampD
SGampA
+ Engineering tools
+ Shared Services GL
+ Cyber Security
IT plays
-a)
(a - Target percent of new applications that are Cloud enabled
~$94B
Industrial cost
75
Three opportunities to power manufacturing
Digital Foundation 1
Unlocking Big Data
minus Sourcing
minus Productivity
2
Powering the Brilliant Factory
minus Design for manufacturing
minus Sensor enablement
minus Plantsupply chain optimization
3
minus 90 reduction in ERPs
Supply Chain Network
Virtual Mfg
Virtual Product Design
76
Product Cost ERP investments paying off
Inventory turns 6x 7x
Shipment on time 58 85
Foundation for business to deliver $1B+ savings over past 5 years
GE Healthcare
of revenue on target ERP ~75
~95
2009 Today
Today 219 ERPs 2016 34 ERPs
GE Water
2008 Today
22
1
of ERPs
SGampA of sales ~10 pts
Past dues 60
Finance headcount 50
77
Product Cost Using big data to run GE
Ingest Store Clean Consume
1 OampG data lake $8B direct materials buy
Real time More cheaper Faster GE-wide Analytics Data science
$60B total material buy across GE hellip $1B+ cash amp deflation opportunities
bull 23 source systems
bull Full visibility ndash 3 weeks
bull Commodity part supplier
bull Data lake technology
bull Machine learning for data cleansing
bull EM PampW underway (Alstom)
Oil amp Gas
Xxxxx Xxxxx Xxxxx xxxxx
78
Product Cost Technology powering the Brilliant Factory
20 NPI cycle hellip 20 efficiency
16 pilots launched hellip Fastworks 2020 Vision
FastWorks approach
Virtual design for manufacturing
30 NPI cycle time
Eliminated quality escapes
Wilmington NC
Aviation Machining
Factory optimization
25 productivity
PampE avoidance Greenville SC
PampW Nozzle Cell
machine downtime
25 opportunity
Sensor Enablement
Grove City PA
Transportation Remanufacturing
79
Smart Outage Full deployment at PGS
Changing the way we deliver Services
On track for $1B CSA productivity over 3 years and 10 customer uptime
+ +
Predictive Workscope Aviation 4 customers
full roll-out mid-2015
=
Field services optimization
Predictive workscope
Next generation modeling
Advanced technology
Accelerating productivity
80
We can do more ldquoSrdquo with less ldquoG+Ardquo
45 win rate
80 in quote time
5400+ SalesComm Ops hoursweek
QuickQuote
40K+ GE Commercial FTE
Highly manual long-cycle-time
More ldquoshots on goalrdquo lower cost
Investing in digital tools for commercial teams
Wrap up
82
Value for investors
Payback through most reliable revenue source Services
+ Increase revenue growth
+ Improve margins
+ CSA productivity
Funded software amp analytics through simplification amp reallocation
Potential upside beyond the GE installed base
Scale amp intellect Return on investment
1
2
3
GE Software COE
+ COE can accomplish scale hellip none of
our businesses could do this on their
own hellip attract talent amp spread ideas
+ Advantage to being an early mover hellip
right partnerships amp scale
+ Changing GE Industrial DNA hellip
greater impact from digital amp
analytical investments
83
Why GE
+ More valuable portfolio hellip 75 Industrial while growing EPS
+ Tangible evidence of winning NPI hellip Tier 4 LEAP etc
+ Strong amp diversified global footprint hellip best-in-class
+ Transforming service for next generation of growth
+ Culture of simplification impacting every part of GE
LEAP is a trademark of CFM International
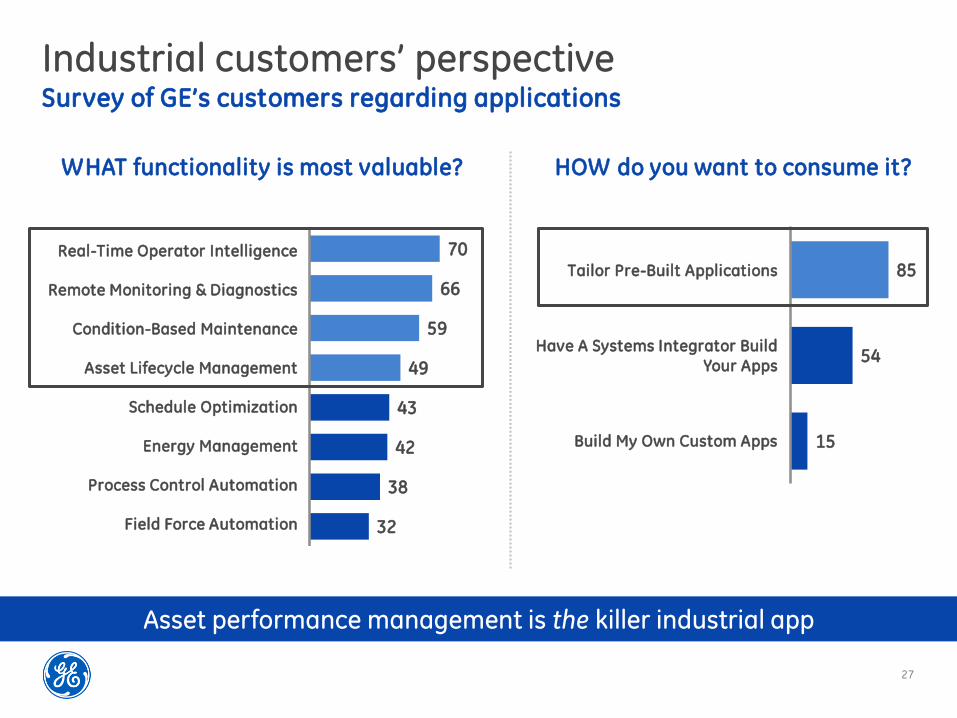
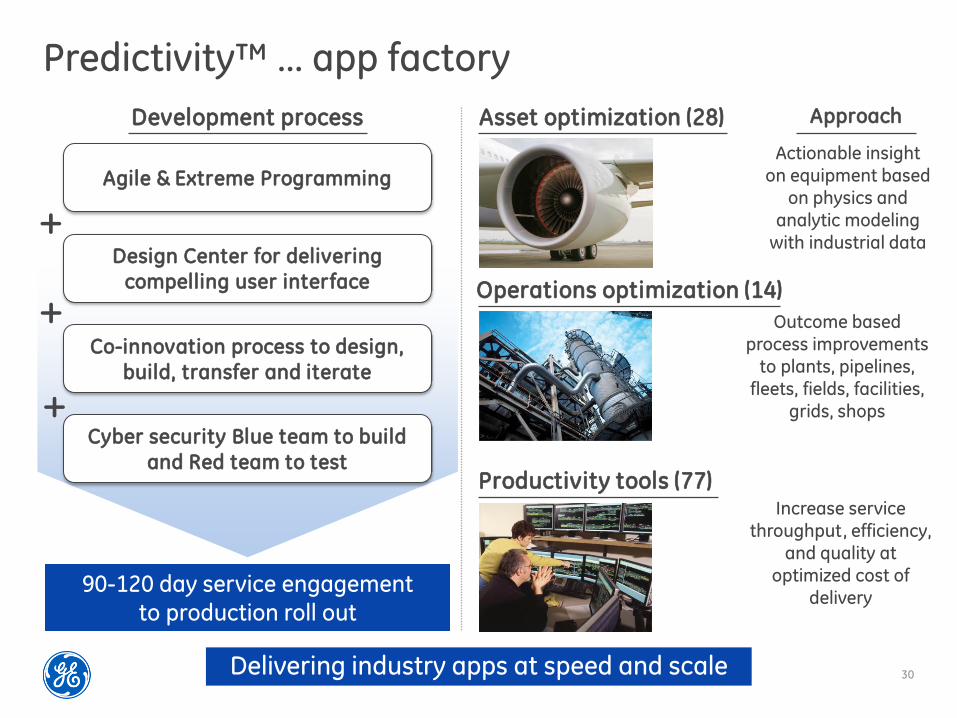
30
Predictivitytrade hellip app factory
Asset optimization (28)
Operations optimization (14)
Productivity tools (77)
Approach Development process
Agile amp Extreme Programming
Design Center for delivering
compelling user interface
Cyber security Blue team to build
and Red team to test
90-120 day service engagement to production roll out
+
+
+
Co-innovation process to design
build transfer and iterate
Actionable insight on equipment based
on physics and analytic modeling
with industrial data
Outcome based process improvements
to plants pipelines fleets fields facilities
grids shops
Increase service throughput efficiency
and quality at optimized cost of
delivery
Delivering industry apps at speed and scale
31
World-class Software amp Analytics organization
Investing in Leadership Talent
Colin Parris (IBM)
SW Research
Co-located SW CTOs for business alignment
D Bartlett
(IBM)
Aviation
World-class technical resources
Computational amp analytics scientists
Platform developers
Software engineers
~10000
1000+ Biz
COE
Product Dev Software CTO
Brad Surak (SAP)
Harel Kodesh (Microsoft
Start Up Veteran)
Trans S Chotai
(HP)
OampG J Demesa
(Siemens)
PampW G Bell
(ServiceSource)
EM J Stone
(SAP)
HC E Eryurek
(GE)
+
+
- Cyber UX Data Science Agile development
Four deep core competencies ecosystem
1
Leading edge platform + world-
class ecosystem 2
Advanced research for building
the future 3
Advanced process to drive adoption amp enablement
4
Software Site
Organization
Technology amp Ecosystem
32
Wurldtech protecting critical infrastructure
World-class cyber security to operate assets + operations safely
About A GE Company acquired in May 2014 providing top cyber talent
Capability Assess protect amp certify critical infrastructure from cyber attack
Key Customers 4 of 6 top global OampG companies 9 of top 10 automation vendors
Security enhancements delivered through PredixTM and GE Products
Certify GE and non-GE products and customer environments
Identify vulnerabilities in OT products (GE and 3rd party)
Assess and prioritize risks for system operators
Achilles Industrial Next Gen Firewall to inspect and control
Industrial network traffic
Leverage industry leading threat intelligence
Protect operational
environments
Secure amp certify industrial products
Assess products amp operations for vulnerabilities
33
Partnerships amp Alliances
Intel ATampT AWS Cisco others
Venture Capital
Mergers amp Acquisitions
ThetaRay Mocana Frost
Strategic Moves
Wurldtech Austin Digital
Acquire capability to fill gaps
Pivotal Softbank Industrial Internet Consortium
Industrial internet ecosystem
Industry Ecosphere
Establish interoperable amp scalable solutions
Co-development amp go-to-market
Accelerate innovation amp success
Positioned to create value
Open PredixTM beyond GE
GE will sell
+ + Connected devices
Data Under Management
Performance Applications
PredixTM Machine Services
PredixTM Data Services
PredixTM Asset Services
Connect assets regardless of vendor or
vintage and provide value-added services
Aggregate and analyze data to produce
actionable business insights
Sell horizontal apps that maximize return
on assets and people
1
2
3
34
Competitive advantage
$1T Connected
Machines
managed by GE
replacement value
10M Sensors
collecting
50M Data
Elements
$20B Potential
Annual Customer Savings
50B Machines will be connected on the internet by 2020
2X Industrial data growth within next 10 years
Big Iron + Big Data = Big Outcomes
INDUSTRY GE
35
New ways to sell Services
2 Making Markets Different Economics
3 Co-creation amp Agile Development
4 Solution Architecture
5 Value Based Deal Shapes
6 New Industry Ecosystems
1 New Buyers and Influencers
GE Commercial Center of Excellence
Needs Target Architect Close
Qualification amp Pipeline Management
Sales Process
HireTrain Community of Experts
Enablement Toolkit
36
Accelerating time to value across channels
APM Subscription Services
Enterprise Analytics Projects
Upgrade value in CSAs
GE Sales Model
Existing Services sales team
New standalone software sales specialists
New outcome sellers + existing service sales team
Sales
acceleration
Expert SWAT
teams to
support deal
SW experts compelling
offer target one outcome
to land and expand
Ecosystem partners
SW COE app factory
Offering RMampD in CSA upside
and productivity Per well subscription
Enterprise SW deal
solution co-creation
ReliabilityMaxtrade FieldVantageTM Intelligent PipelineTM
GE OampG Example
Market
Opportunity $2B $600MM $27B
37
Measuring commercial success
Services revenue
Past Future
~5
+
rsquo13 rsquo17F
Assets under management $1T+ ++
PredictivityTM solutions revenue $08B ~$4-5B
Services backlog $180B ++
bull Adding more value to existing service relationships hellip training team to get more out of the installed base
bull Creating new revenue streams and building new commercial skills and incentive plans to accelerate growth
Outcome sellers solution architects product management amp marketing
bull Cultivate ecosystem to help accelerate commercially with access to CIOCTO relationships and system integration skills
Power amp Water Paul McElhinney - President amp CEO Power
Generation Services
- In current role since May 2014
- 26 years with GE
39
Power amp Water Services
Growing services amp delivering greater customer value
Key metrics Services imperatives ($ in billions)
13 14E
+
Backlog $53 +
Revenue $125
Installed base dynamics
1
2
3
4
Deliver on customer value + Develop flexible solutions
+ Reduce customer operating cost
Grow $installed base + Maximize impact of Alstom alliance + Invest in new service offerings
Expand margins + Tech upgrades amp software solutions + Outage excellence
Improve service execution amp delivery + Improved customer service levels
+ Optimize field service amp repair network
Unit growth up ~24X from 2008
Strong DP amp Wind growthhellip up ~1Kyear
~4000+ gas turbines in service
40
Global power industry is facing complex challengeshellip Offering innovative solutions to address customersrsquo needs
Fuel price uncertainty
Increasing regulation
Slow demand growth
Aging installed base
~15 years Average age of ~4K global GE gas turbines
Output
Efficiency
Reliability
Availability
Flexibility
Improving customersrsquo outcomes while decreasing costs
~$7B
Customer challenges
~$8B
~$2B
~$1B
~$2B
GE Predictivitytrade solutions amp industry benefit
~60+ Increase in US natural gas price since 2012
~(30) Thermal capacity in Europe since lsquorsquo08
Based on 10 year NPV
41
Investing in technology
Addressing multiple customer value levers
Advanced Gas Path (AGP) Industry leading output hellip up to +64 Industry leading efficiency hellip up to +18 Extends asset amp parts life hellip 96K hours
1
Op Flex Delivers flexibility to costs amp revenue Reduces start up time amp fuel consumption Expands fuel source opportunity
3
Dry Low NOx 26+ (DLN) Reduces NOx emissions by 40 Delivers industry leading flexibility Increases maintenance intervals to ~1250 starts
2
42
Power FlexEfficiencytrade Advanced Gas Path
Expanding the operating envelope
Ambient Temperature
Ou
tpu
t (M
W)
Op Flex
7FA03 baseline
AGP
+ ndash
+
Combining hardware and software hellip creating 2X the value
$17
$30
Op Flex
Average Customer Annual Value Per Unit ($MM)
Improving customer outcomes
AGP (Hardware)
AGP PredictivityTM
Solution
125+ AGPs with software sold to date
650000+ operating hours to date
43
Wind PowerUp hellip generating more output
Customer Outcome Up to 4
increase in power output across 283
wind turbines hellip 40+ GWhr annual increase ldquoThe PowerUp system offers a great chance for owners like us who are investing literally billions of dollars in this market to try and get more production out of existing assets GE took a lot of risk out of this for usrdquo
ndash Patrick Woodson CEO EON Climate amp Renewables
Opportunity for up to
20 more profit from up to
5 more output
A performance based
cooperative approach
with a holistic view of the
assets system and network
Flexible payment options
aligned to customer needs
+1400 turbines under contract since launch
Customer opportunity
Software enabled
Flexible platform
Proven results
Scale out
1
2
3
Healthcare Jan De Witte - President amp CEO Healthcare IT
- In current role since 2011
- 15 years with GE
45
Healthcare Services
Delivering value = higher quality outcomes at lower cost
Key metrics Services imperatives ($ in billions)
Backlog $11 +
Installed base dynamics
1
2
3
4
Deliver on customer value + Asset and workflow optimization + Analytics around EMRs amp Devices
Grow $installed base
+ Quality and analytics offerings + Solutions architecture amp delivery
Expand margins + Remote service amp SaaS models + Field services productivity Improve service execution amp delivery + Remote monitoring technologies + Field force deployment optimization
Emerging markets infrastructure build
Mature markets quality upgrades
ACA amp Enterprise Solutions IT penetration
13 14E
=+ Revenue $80
46
Healthcare industry shifting to value-based care GE software analytics and services are uniquely positioned to help
Customer challenges
Integrated Care Solutions hellip turning data into actionable insight Improving healthcare outcomes
Diagnostic quality
Patient-centric care
System profitability
Chronic Disease Management
Sources Institute of Medicine 2013 Porter Research 2013 McKinsey IHS Global Insight
29 Healthcare spend wasted each year
$260B Annual value creation through healthcare IT
59 US lives covered in value-based care model by 2015
Clinical Quality
Financial Performance
Operational Efficiency
Configurable Workflows
47
GEHC Software portfolio positioned along main outcome drivers for care systems
Diagnostic speed amp confidence
Productive care pathways
Wellness amp chronic disease management
Risk amp margin management
Costworkforce optimization
Population Health Management
Workflow
Archiving
Visualization
Financial Management
Care Delivery Management
Enterprise Imaging
Operations Management
Revenue Cycle
Risk assessment
Margin analytics
Workforce optimization
Asset Management
Integrated Care Solutions
Ambulatory Care
High Acuity Care
Cardiology
Analytics
Care coordin
Engagement
Providing caregivers the right actionable insight ndash when amp where they need it
Large GE device footprint generating
clinical data
HCIT domain in clinical workflow amp analytics
SW CoEPredixTM capabilities + +
48
Enterprise Imaging Improving diagnostic workflow in the cloud
Customer Challenges Cloud Case Exchange CentricityTM 360
Sample Customers Solution Architecture
Clinical Collaboration amp Advanced Analytics
Imaging Cost Control
Archive
Workflow
19 Time spent
gathering data
Workflow
velocity
Diagnostic
confidence
Cases diagnosed
incorrectly 35
~$2B segment by rsquo18 growing 25+
30 turn-around time
3 duplicate exams
Customer value $10MM+ cost pa
Image-as-a-Service lifecycle value $20MM+
Care quality
Cost
Source Research from the Journal of the American College of Radiology and the Journal of American Medicine
49
Customer Challenges Workforce management
Sample Customers
Operations Management Optimizing workforce productivity with API Healthcare
54 Hospital
operating cost
spent on labor
Solution Architecture
Real-Time Analytics Labor amp Patient Workflows
Time amp Attendance
Staffing amp Scheduling
HR amp Payroll
~$2B segment by rsquo18 growing 12+
20 Workforce productivity
Customer value $4MM cost pa
Workforce-mgmt services lifecycle $4MM+
80 Overtime wages
Matching care-giver capacity
amp patient need
Care quality
Labor
productivity
Source Beckerrsquos Hospital Review
50
Population Health Management Lowering the cost of chronic disease
Customer Challenges
Solution Architecture
Caradigm Analytics amp Care Mgt
Proactive
intervention
Care protocol
compliance
75 Cents of every
healthcare dollar
spent on chronic
disease
Care Mgt Analytics Risk Cohort
25
Customer value $5MM+ cost pa
Caradigm lifecycle value $18MM+
Patients per care manager
~$30B segment by 2025 growing 19+
Sample Customers
40 Hospitalization for chronic patients
Chronic disease
treatment cost
Source National Diabetes Fact Sheet
51
Software enabling productivity in service process
Wo
rkfo
rce
Pla
nn
ing
amp
Dis
pa
tch
Historically up to 40 FE travel time hellip utilize analytics to optimize allocation
Smart dispatch with effective job-skill matching
Optimize field force capacity and response time to customers
Call Generation (Planned amp Unplanned)
Deploy
RepairFix
Diagnose
CloseDebriefBill
Pe
rfo
rma
nce
M
on
ito
rin
g 110k GEHC devices connected remotely
MR hellip 900 data points monitored per machine 30k alertsyear proactively fixed
Improves GE productivity while minimizing customer down-time
Healthcare Services margins improving
Aviation Kevin McAllister - President amp CEO Aviation Services
- In current role since May 2014
- 25 years with GE
53
Aviation Services
13 14E
+ $108
Backlog $97 +
Revenue
Key metrics Services imperatives
Commercial IB hellip 34000 engines
Young hellip 46 havenrsquot had 1st shop visit
Fuel cost driving investment hellip GE well
positioned hellip 787 737MAX A320NEO 777X
Installed base dynamics
1
2
3
4
Deliver on customer value
+ Lowest cost of ownership
+ PredictivityTM outcomes
Grow $installed base
+ Winwin providing technology upgrades and analytics
Expand margins
+ Time-on-wing for GE and customers
+ Cost productivity hellip for GE
Best service execution and delivery
+ Position to support service entry for next-gen products
($ in billions)
54
Solid growth fundamentals
Shop visits Environment Departures
Source IATA amp GE analysis
Passengers IATA RPK YoY
Utilization Avg cycles day YoY
Departures GE and JV-powered flights (MM)
0
5
10
15
20
25
30
35
40
lsquo10 lsquo15F lsquo95 lsquo00 lsquo05
4100
5500
4400
2100
2000
3000
2300 2000
2300
200
100
-1 09 02
2012 2013 2014E
53 52 58
20 21 22
2 of 3 daily flights
powered by GE or GE JVs
46 have not
had 1st shop visit
4 CAGR Number of departures (MM)
lsquo13 rsquo15F rsquo20F
CFM is a 5050 JV between GE and Snecma EA is a 5050 JV between GE and Pratt amp Whitney
55
Solving our customers toughest challenges
Airline direct operating costs
Fuel
40
Delays and cancellations
8
Maintenance
9
Services analytics offerings
Flight Efficiency Services
Performance-based Navigation
Analytics-enabled workscoping
Product and Services strategy
Provide lowest cost-of-ownership through OEM technology
Lead in on-wing reliability
Lead in technology
Best-in-class fuel burn and retention
Engine diagnostic and prognostics
Intelligent Operations
$200Byr
$40Byr
Taleris is a 5050 JV between GE and Accenture
+
56
Services technologies hellip improving value through the lifecycle
Installed base (lsquo13) Upgrades
Fuel Burn improvement
Time- on-wing
8 8 2x
8 3 3x
5 2 2x
A culture of technology insertion Tailored to customer wants
CFM is a 5050 JV between GE and Snecma
Risk transfer $hour coverage
Overhaul Time and material
Materials New used and repaired parts
Asset optimization TRUEngineTM program diagnostics
+
CF6-80C (lsquo86 EIS)
GE90 (lsquo95 EIS)
CFM56 (lsquo84 EIS)
3000
1500
18500
57
Minds amp Machines at GE Aviation
+ Ex
po
sure
Operator A Operator B Part Temperature Cruise Takeoff
Te
mp
era
ture
Threshold
Climb
1000+ software engineers GE Software COE
6300 applied engineers GE Aviation
Data Secure continuous accessible
Physics Apply engine expertise
+ =
Customer and GE benefits
+
Statistics Unlock trends segment
ldquoPhysicsrdquo ldquoAnalyticsrdquo
Time-on-wing
Reliability and availability
Fuel cost
Repair and overhaul
58
Lead in on-wing reliability
Applied analytics to detect engines at risk of removal
Cu
mu
lati
ve
dis
tre
ss
Cycles
Recent successes hellip
CFM is a 5050 JV between GE and Snecma
Segment
GE90
120 CFM56
40 Water wash
$7Myr fuel savings at one GE90 operator
removals saved
removals saved
Nominal environment
Abate
Harsh environment
59
$30MMyr savings
Flight Efficiency Services App
Performance-based Navigation App
Attacking fuel spend with analytics
Joint marketing hellip
ldquoPerfect flightrdquo video
In the news
Newsletter
Oil amp Gas Brian Palmer - Vice President Measurement amp Control Solutions
- In current role since 2010
- 29 years with GE
61
Oil amp Gas Services
Software amp Services as a key differentiator
Key metrics Strategic imperatives ($ in billions)
13 14E
++
Backlog $58 ++
$83 Revenue
1
2
3
4
Deliver on customer value + Customer co-creation
+ Outcome based solutions
Grow $installed base + Drive analytics amp PredixTM
+ Penetrate the installed base
Expand margins + More software and contract offerings
+ Continue to grow backlog double digits
+ Partnerships to accelerate journeyhellip
Meridium
Improve service execution amp delivery + Full lifecycle productivity
+ Simplifying structure
IB growing TMS and Subsea with 13K+ units Software investments creating new IB revenue
streams in addition to traditional parts and service New contractual (CSA) offerings developedlaunched
Installed base dynamics
62
Oil amp gas industry is faced with expanding challenges GE software data and analytics are uniquely positioned to help
Customer challenges Equipment Availability
Equipment Reliability
Operational Efficiency
Production Optimization
Industrial Internet hellip turning data into actionable information Enable no unplanned downtime
Increasing complex operations
Tighter regulations
Skills gap
Machines with data potential
Sources GE OampG analysis based on Wood Mackenzie Rystad Barclays IHS CERA PFC Energy IEA httpwwwgecomstoriesoil-and-gas-innovation Oil and Gas Facilities 2013 httpwwwspeorgogfprintarchives201306
$800B+ Annual industry CAPEX (6-8 growth per year)
$150MM Average annual cost for mid-size LNG facility due to unplanned downtime
5-10 Range of OampG industryrsquos estimated downtime
63
Predixtrade hellip Unified Operations Improved throughput connecting people machines and data
Customer outcomes
Unified Operations ndash A customer co-creation success story
Enhanced safety
Increased availability
Operational visibility
Efficient workforce enablement
Partnering with to tackle these industry challenges and create a solution that increases production and lowers cost driving improved customer outcomes
Unified Customer
Portal
129000 Pieces of equipment in operation globally in
the industry
50 Industry retirement rate in next 10 years
7X Industry fatality rate
above norm
people
machines
data
64
FieldVantagetrade hellip Asset Performance Management (APM) for Onshore
APM ndash Bringing GE expertise from all industries to deliver system level value
Customer outcomes
Enhanced safety
Operational visibility
Improved availability
Optimized performance
Monitoring amp
Diagnostics
Condition Based
Maintenance
Real time Operations
Intelligence
Asset LifeCycle
Management
bull Providing field level visibility and optimization across multiple forms of artificial lift technologies bull Integrated insights provided through common single scalable platform bull 2 year service contract on 200+ wells
Solution Overview
39 NAM OampG Upstream Vehicle Fatalities
hellipby improving
116K New wells in 2014
5 Days Back to production (NAM Avg)
1MM+ Artificially Lifted Wells (Global)
65
Intelligent Pipeline hellip Operations optimization software for pipelines
2TB of data for every
30K miles of pipeline
3-4 annual growth
2MMmiles of
pipelines globally
$40B invested by pipeline companies per year
Source 2TB - Average data volume based on GE internal analysis of multiple pipeline customers Rest - GE OampG analysis based on Douglas Westwood IHS CERA FERC CIA World Factbook PII Pipeline Database (Summary of Infield Systems Global Data DOT databases)
bull 5 year service contract
bull Setting the industry standards for
pipelines real-time intelligence
First customer Customer outcomes
Enhanced safety Proactive versus reactive decisions
Visibility Complete geospatial view and situational awareness
Optimized Ops Effective data driven resource allocation
Efficient OampM Prioritize spending for assets and resources
Moving to proactive solutions with our customers
66
Customer Benefits
Zero unplanned downtime
Increased availability
Increased reliability
Decreased production losses
$14B Additional opportunity driven by
availability and reliability increase (1 of capacity)
Industry Opportunities
Outcome base service bonus
GE Productivity Improvements
Inventory through parts flow optimization
Outage durationfrequency driven by condition- based maintenance
Services Optimization hellip Creating optimal value for GE equipment customers
Journey to 100 reliability through our Contractual Services Agreements (CSA)
Transportation Pete McCabe - Vice President Global Services amp Solutions
- In current role since 2013
- 20 years with GE
68
Transportation Services ($ in billions)
13 14E
+
Revenue $28
Backlog $12B+ +
1
2
3
4
Deliver on customer value
+ Outcomes - velocity fuel reliability
+ System solutions ndash RailConnectTM 360
Grow $installed base
+ Increase penetration ndash Parts amp Smarts
+ Extend asset life ndash modernizations
+ Broaden software solutions ndash rOS
Expand margins
+ Deploy advanced analytics ndash PredixTM
Improve service execution amp delivery
+ Enhance commercial capabilities
+ Expand domain amp IT project expertise
Installed base dynamics
1000+ Tier 4-compliant loco orders
~650 locomotives un-parking in rsquo14
450 new locomotives in South Africa
Key metrics Services imperatives
69
Railroad industry is faced with expanding challenges and customers require a solution provider
Customer challenges
RailConnecttrade360 delivering customer focused outcomes
Asset utilization
Capacity limited
Resource constraints
Ops Complexity
$80B+ N American operating revenue (~4 growth)
7 year high Traffic volumes require unparalleled investment
$56B Annual industrial benefit through 1 improvement
Sources American Association of Railroads (AAR) 2013 industry statistics
70
Asset optimization ndash fuel efficiency
Customer Dynamics RailConnect 360 ndash Trip Optimizer
bull Real-time embedded optimization algorithms
bull Advanced data acquisition enabling train health monitoring
bull Automated train handling reduces wheel amp rail wear
bull $1M diesel locoyear 22K GE locos
bull Emissions
bull Huge operating variation operators trains topography
Trip Optimizer with CSX
Implementation on 1500 CSX locomotives
Reduced fuel use by 7 on average Decreased 3rd largest operating expense
- CSX Sustainability Report 2013
Tr ip Opt imizer Quick Star t Guide (1) Train Speed is available on the speedometer during an active trip during auto and Manual Control
(2) Trip Plan Speed displays a green Trip plan speed pointer on the speed indicator dial in Auto and Manual
modes of operation
(3) Trip Optimizer Status Box is visible when Trip Optimizer system is ACTIVE and provides three types of messages Status Request for Operator InputAction and Error
(4) TrackCivil Speed Limit plot line is Cyan shown the entire horizontal range data permitting
(5) Train Speed (Actual) plot line is White shown only from the head of the train on back
(6) Train Head is shown as a thick White line to allow the operator to see the position of the Train relative to the
terrain The horizontal scale of the rolling chart is zero-referenced to the Head of the Train (corresponds to the forward-facing end of the lead locomotive)
(7) Train Milepost has an associated location and name Its representation on the screen consists of a graphical
pointer and an identifier
(8) OMB Message Box displays operator messages
(9) Consist Notches displays Lead and Trailing locomotive notches
(10) Throttle Handle Notch represents the Master Control-ler handle position During TO Auto Control it will indicate
N8 as TO automatic control requires notch eight (N8) set-ting
(11) Auto Control Notch displays on screen as a White box to denote TO Auto Control engagement and throttle out-
put control
(12) Trip Plan Speed has a Green plot line shown as the entire horizontal range when available and data permit-
ting
(13) Manual Control Zones is shown as a Gray rectangle on the terrain plot extending across the entire vertical range of this section of the chart
(14) Planned Braking depicts Blue areas where Trip Opti-mizer expects that dynamic andor air braking will be
required to maintain the plan speed
(15) Key Locations are softkey states that constitute a unique mapping of functionality to key locations
1 How do I get started To start a trip you will push the Trip Optimizer key on the Main operator screen
2 Do I have to be stopped to request a trip through Trip Optimizer It is preferred to perform a trip init at zero speed however unless otherwise provided by
local ruleinstruction maximum speed for initialization is 15 mph
3 I have performed the Trip Init process and see the rolling map When will I get prompted for Auto Control
Auto Control will become available when the speed is greater than 12 mph and the Throttle handle is N1 or higher
4 Why does the Locomotive Status matter to Trip Optimizer Trip Optimizer will always monitor in train forces speed braking and fuel efficiency To best optimize all of these Train dynamics Trip Optimizer must be told by the operator what the
status of each locomotive in the train The three modes are defined as follows
Running The locomotive is fully operational and is used for calculating TPOB
Isolated The locomotive is either shut-down or is mechanically isolated from produc-
ing Tractive Effort
DB Cutout The locomotive has no Dynamic Braking available but is being used for
producing Tractive Effort
5 What is the recommended way to disengage Auto Control The most fuel efficient way is to decrease the throttle notches in 2 second intervals until
you get to the required speed
6 Trip Optimizer is disengaging from Auto mode and tells the opera-tor Manual Control is required I am already in Notch 8 throttle
What do I do
Press the Current Throttle key on the screen Moving the Master Controller from Notch 8 to
Notch 7 and back could result in un-safe train handling practices
7 Why does Trip Optimizer not always travel at Track speed Trip Optimizer will use the forces of the train and momentum to achieve the optimal speed to save fuel In some cases Idle will be used to meet a planned slow order Trip Optimizer is
always looking out a few miles ahead to plan for the ideal speed while maintaining safe train handling
8 How do I report an inaccuracy on the civil speed limits posted on the rolling map
Contract your Road Manager to report the case
9 The dispatcher has issued an enroute slow order Will Trip Opti-
mizer automatically take this into account
No If an enroute slow order is issued it will be the train crewrsquos responsibility to protect the
train in Manual mode during this affected zone
10 Why does Trip Optimizer automatically end the trip when I still have distance remaining before the preset crew change point
The subdivision has a GPS controlled end point that will automatically end the trip based off of recommendations from the railroad
Follow the steps on the backside of this document to walk you through performing a Trip Init
Trip Optimizer Top Ten List
GE Proprietary Information The information contained in this document is GE Proprietary Information and is disclosed in confidence It is the property of GE and shall not be used disclosed to others or repro-
duced without the express written consent of GE If consent is given for reproduction in whole or in part this notice and the notice set forth on each page of this document shall appear in any such reproduction in whole or in part The information contained in this document may also be controlled by the US export control laws Unauthorized export or re-export is
prohibited Document 5005807 Rev mdash
Before engaging the TO AUTO throttle the operator must meet certain train conditions and under-stand the data displayed on the Trip Optimizer Running Screen
Doc No 5005890 Rev -
71
Operations optimization ndash velocity
Movement Planner with Norfolk Southern
RailConnect 360 - Movement Planner
bull Systems problem hellip beyond human capabilities
bull Majority single track
bull Point solutions have plateaued
bull Integrated suite of day of operations software apps
bull Predixtrade platform - connectivity big data and security
bull Advanced algorithms and automatic routing
bull Proven in class 1 revenue service
Norfolk Southern and Movement Planner
Automated routing decisions
10+ increase in velocity
50+ reduction in expired crews Significant improvement in
schedule adherence
1MPH = ~$200MM estimated
annual savings in capital amp expenses
Based on 3 year study in NS GA division
Customer Dynamics
72
bull Co-development GE Transportation amp GE Intelligent Platforms
minus Enhanced sensor coverage
minus Improved data acquisition higher resolution
minus Advanced analytics
bull Asset specific insight drives fault reduction and enables CBM
(SmartSignal)
bull 20K+ overhauls in backlog
bull OH interval based on average expected condition
bull $1B+ capital expenditure in North America every year
Impact Reduced unplanned
downtime amp avoid road failures
Reduce unscheduled material consumption
Extended periodicity and associated expenses
ldquoPhysicsrdquo change
Real Time Engine Performance
Bearing Temp
Bearing Temp
Load
Ambient
To
da
y
To
mo
rro
w
Alarm trigger
Savings
CSA ndash shared productivity
Lifecycle Cost Dynamics ndash Engine Overhauls RailConnect 360 ndash Advanced Analytics
GErsquos 1 Jamie Miller - Senior Vice President Chief Information Officer
- In current role since 2013
- 9 years with GE
74
Digital opportunity
Simplifying structure
More valuable GE resources with fully integrated approach
+ Utilize data from products
+ Field services tools
+ CRM configurators
+ Brilliant Factory
Benefits
ERPmanufacturing 90
Data Centers 80
Applications 30
Shared Services 65
Cloud 70
Product Cost
RampD
SGampA
+ Engineering tools
+ Shared Services GL
+ Cyber Security
IT plays
-a)
(a - Target percent of new applications that are Cloud enabled
~$94B
Industrial cost
75
Three opportunities to power manufacturing
Digital Foundation 1
Unlocking Big Data
minus Sourcing
minus Productivity
2
Powering the Brilliant Factory
minus Design for manufacturing
minus Sensor enablement
minus Plantsupply chain optimization
3
minus 90 reduction in ERPs
Supply Chain Network
Virtual Mfg
Virtual Product Design
76
Product Cost ERP investments paying off
Inventory turns 6x 7x
Shipment on time 58 85
Foundation for business to deliver $1B+ savings over past 5 years
GE Healthcare
of revenue on target ERP ~75
~95
2009 Today
Today 219 ERPs 2016 34 ERPs
GE Water
2008 Today
22
1
of ERPs
SGampA of sales ~10 pts
Past dues 60
Finance headcount 50
77
Product Cost Using big data to run GE
Ingest Store Clean Consume
1 OampG data lake $8B direct materials buy
Real time More cheaper Faster GE-wide Analytics Data science
$60B total material buy across GE hellip $1B+ cash amp deflation opportunities
bull 23 source systems
bull Full visibility ndash 3 weeks
bull Commodity part supplier
bull Data lake technology
bull Machine learning for data cleansing
bull EM PampW underway (Alstom)
Oil amp Gas
Xxxxx Xxxxx Xxxxx xxxxx
78
Product Cost Technology powering the Brilliant Factory
20 NPI cycle hellip 20 efficiency
16 pilots launched hellip Fastworks 2020 Vision
FastWorks approach
Virtual design for manufacturing
30 NPI cycle time
Eliminated quality escapes
Wilmington NC
Aviation Machining
Factory optimization
25 productivity
PampE avoidance Greenville SC
PampW Nozzle Cell
machine downtime
25 opportunity
Sensor Enablement
Grove City PA
Transportation Remanufacturing
79
Smart Outage Full deployment at PGS
Changing the way we deliver Services
On track for $1B CSA productivity over 3 years and 10 customer uptime
+ +
Predictive Workscope Aviation 4 customers
full roll-out mid-2015
=
Field services optimization
Predictive workscope
Next generation modeling
Advanced technology
Accelerating productivity
80
We can do more ldquoSrdquo with less ldquoG+Ardquo
45 win rate
80 in quote time
5400+ SalesComm Ops hoursweek
QuickQuote
40K+ GE Commercial FTE
Highly manual long-cycle-time
More ldquoshots on goalrdquo lower cost
Investing in digital tools for commercial teams
Wrap up
82
Value for investors
Payback through most reliable revenue source Services
+ Increase revenue growth
+ Improve margins
+ CSA productivity
Funded software amp analytics through simplification amp reallocation
Potential upside beyond the GE installed base
Scale amp intellect Return on investment
1
2
3
GE Software COE
+ COE can accomplish scale hellip none of
our businesses could do this on their
own hellip attract talent amp spread ideas
+ Advantage to being an early mover hellip
right partnerships amp scale
+ Changing GE Industrial DNA hellip
greater impact from digital amp
analytical investments
83
Why GE
+ More valuable portfolio hellip 75 Industrial while growing EPS
+ Tangible evidence of winning NPI hellip Tier 4 LEAP etc
+ Strong amp diversified global footprint hellip best-in-class
+ Transforming service for next generation of growth
+ Culture of simplification impacting every part of GE
LEAP is a trademark of CFM International
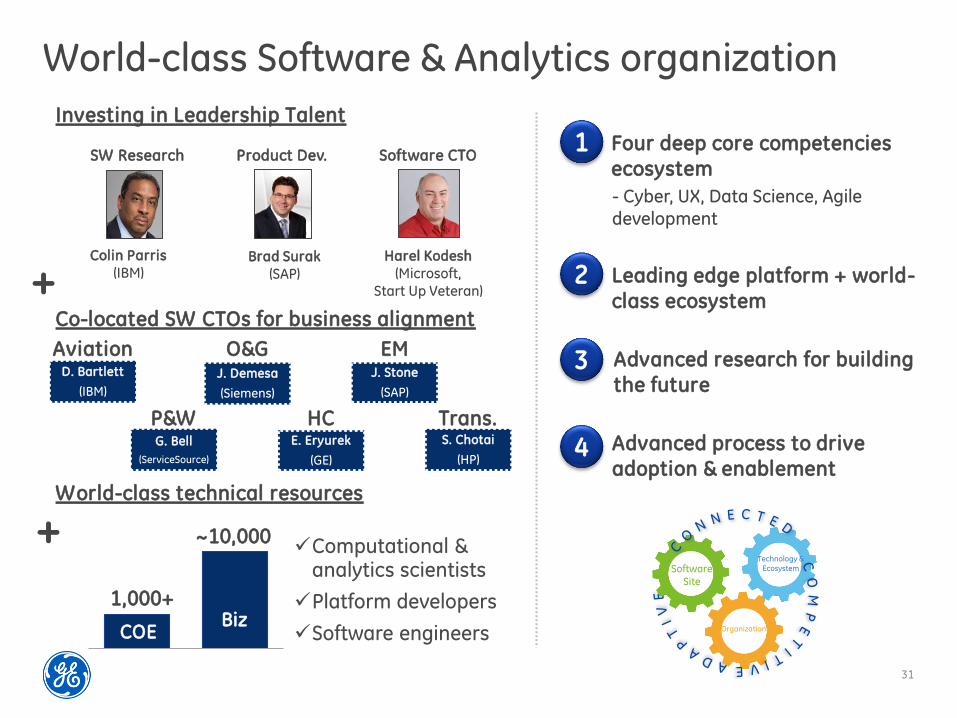
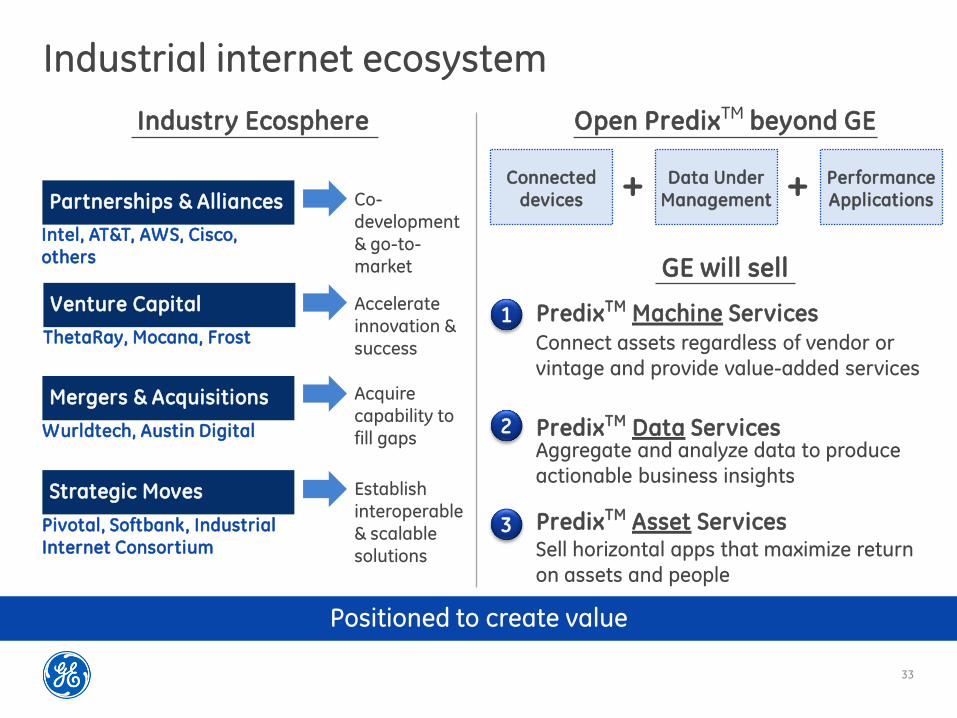
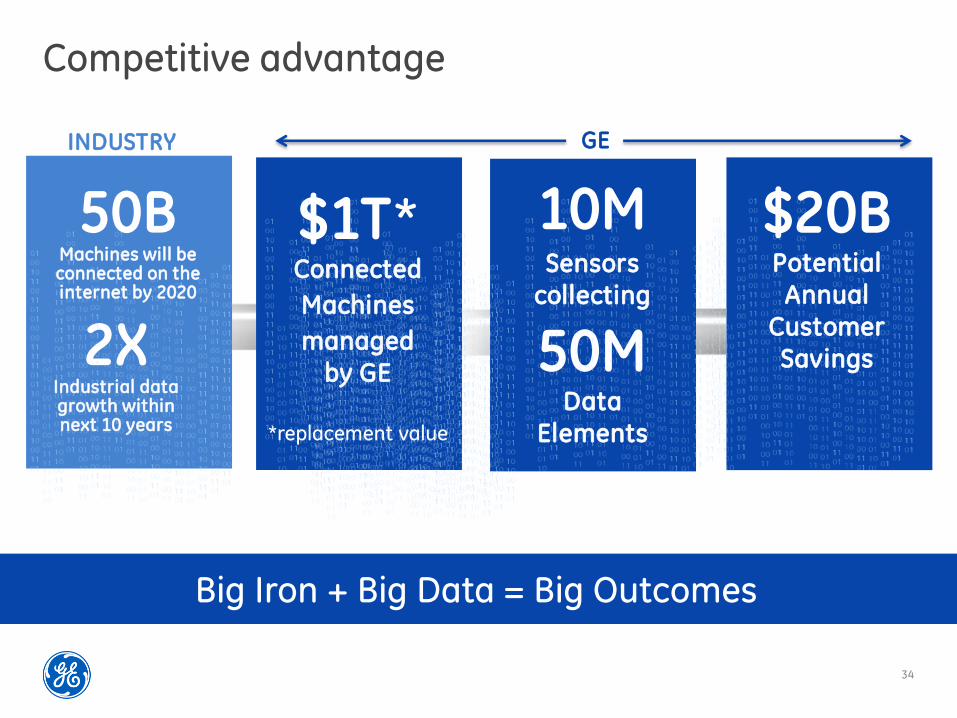
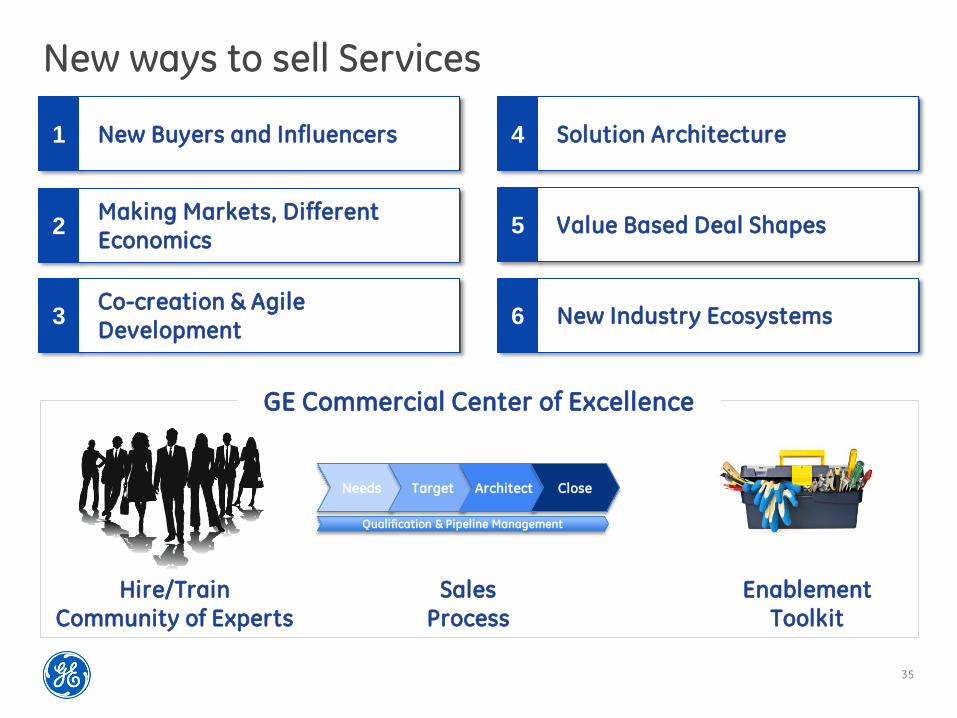
35
New ways to sell Services
2 Making Markets Different Economics
3 Co-creation amp Agile Development
4 Solution Architecture
5 Value Based Deal Shapes
6 New Industry Ecosystems
1 New Buyers and Influencers
GE Commercial Center of Excellence
Needs Target Architect Close
Qualification amp Pipeline Management
Sales Process
HireTrain Community of Experts
Enablement Toolkit
36
Accelerating time to value across channels
APM Subscription Services
Enterprise Analytics Projects
Upgrade value in CSAs
GE Sales Model
Existing Services sales team
New standalone software sales specialists
New outcome sellers + existing service sales team
Sales
acceleration
Expert SWAT
teams to
support deal
SW experts compelling
offer target one outcome
to land and expand
Ecosystem partners
SW COE app factory
Offering RMampD in CSA upside
and productivity Per well subscription
Enterprise SW deal
solution co-creation
ReliabilityMaxtrade FieldVantageTM Intelligent PipelineTM
GE OampG Example
Market
Opportunity $2B $600MM $27B
37
Measuring commercial success
Services revenue
Past Future
~5
+
rsquo13 rsquo17F
Assets under management $1T+ ++
PredictivityTM solutions revenue $08B ~$4-5B
Services backlog $180B ++
bull Adding more value to existing service relationships hellip training team to get more out of the installed base
bull Creating new revenue streams and building new commercial skills and incentive plans to accelerate growth
Outcome sellers solution architects product management amp marketing
bull Cultivate ecosystem to help accelerate commercially with access to CIOCTO relationships and system integration skills
Power amp Water Paul McElhinney - President amp CEO Power
Generation Services
- In current role since May 2014
- 26 years with GE
39
Power amp Water Services
Growing services amp delivering greater customer value
Key metrics Services imperatives ($ in billions)
13 14E
+
Backlog $53 +
Revenue $125
Installed base dynamics
1
2
3
4
Deliver on customer value + Develop flexible solutions
+ Reduce customer operating cost
Grow $installed base + Maximize impact of Alstom alliance + Invest in new service offerings
Expand margins + Tech upgrades amp software solutions + Outage excellence
Improve service execution amp delivery + Improved customer service levels
+ Optimize field service amp repair network
Unit growth up ~24X from 2008
Strong DP amp Wind growthhellip up ~1Kyear
~4000+ gas turbines in service
40
Global power industry is facing complex challengeshellip Offering innovative solutions to address customersrsquo needs
Fuel price uncertainty
Increasing regulation
Slow demand growth
Aging installed base
~15 years Average age of ~4K global GE gas turbines
Output
Efficiency
Reliability
Availability
Flexibility
Improving customersrsquo outcomes while decreasing costs
~$7B
Customer challenges
~$8B
~$2B
~$1B
~$2B
GE Predictivitytrade solutions amp industry benefit
~60+ Increase in US natural gas price since 2012
~(30) Thermal capacity in Europe since lsquorsquo08
Based on 10 year NPV
41
Investing in technology
Addressing multiple customer value levers
Advanced Gas Path (AGP) Industry leading output hellip up to +64 Industry leading efficiency hellip up to +18 Extends asset amp parts life hellip 96K hours
1
Op Flex Delivers flexibility to costs amp revenue Reduces start up time amp fuel consumption Expands fuel source opportunity
3
Dry Low NOx 26+ (DLN) Reduces NOx emissions by 40 Delivers industry leading flexibility Increases maintenance intervals to ~1250 starts
2
42
Power FlexEfficiencytrade Advanced Gas Path
Expanding the operating envelope
Ambient Temperature
Ou
tpu
t (M
W)
Op Flex
7FA03 baseline
AGP
+ ndash
+
Combining hardware and software hellip creating 2X the value
$17
$30
Op Flex
Average Customer Annual Value Per Unit ($MM)
Improving customer outcomes
AGP (Hardware)
AGP PredictivityTM
Solution
125+ AGPs with software sold to date
650000+ operating hours to date
43
Wind PowerUp hellip generating more output
Customer Outcome Up to 4
increase in power output across 283
wind turbines hellip 40+ GWhr annual increase ldquoThe PowerUp system offers a great chance for owners like us who are investing literally billions of dollars in this market to try and get more production out of existing assets GE took a lot of risk out of this for usrdquo
ndash Patrick Woodson CEO EON Climate amp Renewables
Opportunity for up to
20 more profit from up to
5 more output
A performance based
cooperative approach
with a holistic view of the
assets system and network
Flexible payment options
aligned to customer needs
+1400 turbines under contract since launch
Customer opportunity
Software enabled
Flexible platform
Proven results
Scale out
1
2
3
Healthcare Jan De Witte - President amp CEO Healthcare IT
- In current role since 2011
- 15 years with GE
45
Healthcare Services
Delivering value = higher quality outcomes at lower cost
Key metrics Services imperatives ($ in billions)
Backlog $11 +
Installed base dynamics
1
2
3
4
Deliver on customer value + Asset and workflow optimization + Analytics around EMRs amp Devices
Grow $installed base
+ Quality and analytics offerings + Solutions architecture amp delivery
Expand margins + Remote service amp SaaS models + Field services productivity Improve service execution amp delivery + Remote monitoring technologies + Field force deployment optimization
Emerging markets infrastructure build
Mature markets quality upgrades
ACA amp Enterprise Solutions IT penetration
13 14E
=+ Revenue $80
46
Healthcare industry shifting to value-based care GE software analytics and services are uniquely positioned to help
Customer challenges
Integrated Care Solutions hellip turning data into actionable insight Improving healthcare outcomes
Diagnostic quality
Patient-centric care
System profitability
Chronic Disease Management
Sources Institute of Medicine 2013 Porter Research 2013 McKinsey IHS Global Insight
29 Healthcare spend wasted each year
$260B Annual value creation through healthcare IT
59 US lives covered in value-based care model by 2015
Clinical Quality
Financial Performance
Operational Efficiency
Configurable Workflows
47
GEHC Software portfolio positioned along main outcome drivers for care systems
Diagnostic speed amp confidence
Productive care pathways
Wellness amp chronic disease management
Risk amp margin management
Costworkforce optimization
Population Health Management
Workflow
Archiving
Visualization
Financial Management
Care Delivery Management
Enterprise Imaging
Operations Management
Revenue Cycle
Risk assessment
Margin analytics
Workforce optimization
Asset Management
Integrated Care Solutions
Ambulatory Care
High Acuity Care
Cardiology
Analytics
Care coordin
Engagement
Providing caregivers the right actionable insight ndash when amp where they need it
Large GE device footprint generating
clinical data
HCIT domain in clinical workflow amp analytics
SW CoEPredixTM capabilities + +
48
Enterprise Imaging Improving diagnostic workflow in the cloud
Customer Challenges Cloud Case Exchange CentricityTM 360
Sample Customers Solution Architecture
Clinical Collaboration amp Advanced Analytics
Imaging Cost Control
Archive
Workflow
19 Time spent
gathering data
Workflow
velocity
Diagnostic
confidence
Cases diagnosed
incorrectly 35
~$2B segment by rsquo18 growing 25+
30 turn-around time
3 duplicate exams
Customer value $10MM+ cost pa
Image-as-a-Service lifecycle value $20MM+
Care quality
Cost
Source Research from the Journal of the American College of Radiology and the Journal of American Medicine
49
Customer Challenges Workforce management
Sample Customers
Operations Management Optimizing workforce productivity with API Healthcare
54 Hospital
operating cost
spent on labor
Solution Architecture
Real-Time Analytics Labor amp Patient Workflows
Time amp Attendance
Staffing amp Scheduling
HR amp Payroll
~$2B segment by rsquo18 growing 12+
20 Workforce productivity
Customer value $4MM cost pa
Workforce-mgmt services lifecycle $4MM+
80 Overtime wages
Matching care-giver capacity
amp patient need
Care quality
Labor
productivity
Source Beckerrsquos Hospital Review
50
Population Health Management Lowering the cost of chronic disease
Customer Challenges
Solution Architecture
Caradigm Analytics amp Care Mgt
Proactive
intervention
Care protocol
compliance
75 Cents of every
healthcare dollar
spent on chronic
disease
Care Mgt Analytics Risk Cohort
25
Customer value $5MM+ cost pa
Caradigm lifecycle value $18MM+
Patients per care manager
~$30B segment by 2025 growing 19+
Sample Customers
40 Hospitalization for chronic patients
Chronic disease
treatment cost
Source National Diabetes Fact Sheet
51
Software enabling productivity in service process
Wo
rkfo
rce
Pla
nn
ing
amp
Dis
pa
tch
Historically up to 40 FE travel time hellip utilize analytics to optimize allocation
Smart dispatch with effective job-skill matching
Optimize field force capacity and response time to customers
Call Generation (Planned amp Unplanned)
Deploy
RepairFix
Diagnose
CloseDebriefBill
Pe
rfo
rma
nce
M
on
ito
rin
g 110k GEHC devices connected remotely
MR hellip 900 data points monitored per machine 30k alertsyear proactively fixed
Improves GE productivity while minimizing customer down-time
Healthcare Services margins improving
Aviation Kevin McAllister - President amp CEO Aviation Services
- In current role since May 2014
- 25 years with GE
53
Aviation Services
13 14E
+ $108
Backlog $97 +
Revenue
Key metrics Services imperatives
Commercial IB hellip 34000 engines
Young hellip 46 havenrsquot had 1st shop visit
Fuel cost driving investment hellip GE well
positioned hellip 787 737MAX A320NEO 777X
Installed base dynamics
1
2
3
4
Deliver on customer value
+ Lowest cost of ownership
+ PredictivityTM outcomes
Grow $installed base
+ Winwin providing technology upgrades and analytics
Expand margins
+ Time-on-wing for GE and customers
+ Cost productivity hellip for GE
Best service execution and delivery
+ Position to support service entry for next-gen products
($ in billions)
54
Solid growth fundamentals
Shop visits Environment Departures
Source IATA amp GE analysis
Passengers IATA RPK YoY
Utilization Avg cycles day YoY
Departures GE and JV-powered flights (MM)
0
5
10
15
20
25
30
35
40
lsquo10 lsquo15F lsquo95 lsquo00 lsquo05
4100
5500
4400
2100
2000
3000
2300 2000
2300
200
100
-1 09 02
2012 2013 2014E
53 52 58
20 21 22
2 of 3 daily flights
powered by GE or GE JVs
46 have not
had 1st shop visit
4 CAGR Number of departures (MM)
lsquo13 rsquo15F rsquo20F
CFM is a 5050 JV between GE and Snecma EA is a 5050 JV between GE and Pratt amp Whitney
55
Solving our customers toughest challenges
Airline direct operating costs
Fuel
40
Delays and cancellations
8
Maintenance
9
Services analytics offerings
Flight Efficiency Services
Performance-based Navigation
Analytics-enabled workscoping
Product and Services strategy
Provide lowest cost-of-ownership through OEM technology
Lead in on-wing reliability
Lead in technology
Best-in-class fuel burn and retention
Engine diagnostic and prognostics
Intelligent Operations
$200Byr
$40Byr
Taleris is a 5050 JV between GE and Accenture
+
56
Services technologies hellip improving value through the lifecycle
Installed base (lsquo13) Upgrades
Fuel Burn improvement
Time- on-wing
8 8 2x
8 3 3x
5 2 2x
A culture of technology insertion Tailored to customer wants
CFM is a 5050 JV between GE and Snecma
Risk transfer $hour coverage
Overhaul Time and material
Materials New used and repaired parts
Asset optimization TRUEngineTM program diagnostics
+
CF6-80C (lsquo86 EIS)
GE90 (lsquo95 EIS)
CFM56 (lsquo84 EIS)
3000
1500
18500
57
Minds amp Machines at GE Aviation
+ Ex
po
sure
Operator A Operator B Part Temperature Cruise Takeoff
Te
mp
era
ture
Threshold
Climb
1000+ software engineers GE Software COE
6300 applied engineers GE Aviation
Data Secure continuous accessible
Physics Apply engine expertise
+ =
Customer and GE benefits
+
Statistics Unlock trends segment
ldquoPhysicsrdquo ldquoAnalyticsrdquo
Time-on-wing
Reliability and availability
Fuel cost
Repair and overhaul
58
Lead in on-wing reliability
Applied analytics to detect engines at risk of removal
Cu
mu
lati
ve
dis
tre
ss
Cycles
Recent successes hellip
CFM is a 5050 JV between GE and Snecma
Segment
GE90
120 CFM56
40 Water wash
$7Myr fuel savings at one GE90 operator
removals saved
removals saved
Nominal environment
Abate
Harsh environment
59
$30MMyr savings
Flight Efficiency Services App
Performance-based Navigation App
Attacking fuel spend with analytics
Joint marketing hellip
ldquoPerfect flightrdquo video
In the news
Newsletter
Oil amp Gas Brian Palmer - Vice President Measurement amp Control Solutions
- In current role since 2010
- 29 years with GE
61
Oil amp Gas Services
Software amp Services as a key differentiator
Key metrics Strategic imperatives ($ in billions)
13 14E
++
Backlog $58 ++
$83 Revenue
1
2
3
4
Deliver on customer value + Customer co-creation
+ Outcome based solutions
Grow $installed base + Drive analytics amp PredixTM
+ Penetrate the installed base
Expand margins + More software and contract offerings
+ Continue to grow backlog double digits
+ Partnerships to accelerate journeyhellip
Meridium
Improve service execution amp delivery + Full lifecycle productivity
+ Simplifying structure
IB growing TMS and Subsea with 13K+ units Software investments creating new IB revenue
streams in addition to traditional parts and service New contractual (CSA) offerings developedlaunched
Installed base dynamics
62
Oil amp gas industry is faced with expanding challenges GE software data and analytics are uniquely positioned to help
Customer challenges Equipment Availability
Equipment Reliability
Operational Efficiency
Production Optimization
Industrial Internet hellip turning data into actionable information Enable no unplanned downtime
Increasing complex operations
Tighter regulations
Skills gap
Machines with data potential
Sources GE OampG analysis based on Wood Mackenzie Rystad Barclays IHS CERA PFC Energy IEA httpwwwgecomstoriesoil-and-gas-innovation Oil and Gas Facilities 2013 httpwwwspeorgogfprintarchives201306
$800B+ Annual industry CAPEX (6-8 growth per year)
$150MM Average annual cost for mid-size LNG facility due to unplanned downtime
5-10 Range of OampG industryrsquos estimated downtime
63
Predixtrade hellip Unified Operations Improved throughput connecting people machines and data
Customer outcomes
Unified Operations ndash A customer co-creation success story
Enhanced safety
Increased availability
Operational visibility
Efficient workforce enablement
Partnering with to tackle these industry challenges and create a solution that increases production and lowers cost driving improved customer outcomes
Unified Customer
Portal
129000 Pieces of equipment in operation globally in
the industry
50 Industry retirement rate in next 10 years
7X Industry fatality rate
above norm
people
machines
data
64
FieldVantagetrade hellip Asset Performance Management (APM) for Onshore
APM ndash Bringing GE expertise from all industries to deliver system level value
Customer outcomes
Enhanced safety
Operational visibility
Improved availability
Optimized performance
Monitoring amp
Diagnostics
Condition Based
Maintenance
Real time Operations
Intelligence
Asset LifeCycle
Management
bull Providing field level visibility and optimization across multiple forms of artificial lift technologies bull Integrated insights provided through common single scalable platform bull 2 year service contract on 200+ wells
Solution Overview
39 NAM OampG Upstream Vehicle Fatalities
hellipby improving
116K New wells in 2014
5 Days Back to production (NAM Avg)
1MM+ Artificially Lifted Wells (Global)
65
Intelligent Pipeline hellip Operations optimization software for pipelines
2TB of data for every
30K miles of pipeline
3-4 annual growth
2MMmiles of
pipelines globally
$40B invested by pipeline companies per year
Source 2TB - Average data volume based on GE internal analysis of multiple pipeline customers Rest - GE OampG analysis based on Douglas Westwood IHS CERA FERC CIA World Factbook PII Pipeline Database (Summary of Infield Systems Global Data DOT databases)
bull 5 year service contract
bull Setting the industry standards for
pipelines real-time intelligence
First customer Customer outcomes
Enhanced safety Proactive versus reactive decisions
Visibility Complete geospatial view and situational awareness
Optimized Ops Effective data driven resource allocation
Efficient OampM Prioritize spending for assets and resources
Moving to proactive solutions with our customers
66
Customer Benefits
Zero unplanned downtime
Increased availability
Increased reliability
Decreased production losses
$14B Additional opportunity driven by
availability and reliability increase (1 of capacity)
Industry Opportunities
Outcome base service bonus
GE Productivity Improvements
Inventory through parts flow optimization
Outage durationfrequency driven by condition- based maintenance
Services Optimization hellip Creating optimal value for GE equipment customers
Journey to 100 reliability through our Contractual Services Agreements (CSA)
Transportation Pete McCabe - Vice President Global Services amp Solutions
- In current role since 2013
- 20 years with GE
68
Transportation Services ($ in billions)
13 14E
+
Revenue $28
Backlog $12B+ +
1
2
3
4
Deliver on customer value
+ Outcomes - velocity fuel reliability
+ System solutions ndash RailConnectTM 360
Grow $installed base
+ Increase penetration ndash Parts amp Smarts
+ Extend asset life ndash modernizations
+ Broaden software solutions ndash rOS
Expand margins
+ Deploy advanced analytics ndash PredixTM
Improve service execution amp delivery
+ Enhance commercial capabilities
+ Expand domain amp IT project expertise
Installed base dynamics
1000+ Tier 4-compliant loco orders
~650 locomotives un-parking in rsquo14
450 new locomotives in South Africa
Key metrics Services imperatives
69
Railroad industry is faced with expanding challenges and customers require a solution provider
Customer challenges
RailConnecttrade360 delivering customer focused outcomes
Asset utilization
Capacity limited
Resource constraints
Ops Complexity
$80B+ N American operating revenue (~4 growth)
7 year high Traffic volumes require unparalleled investment
$56B Annual industrial benefit through 1 improvement
Sources American Association of Railroads (AAR) 2013 industry statistics
70
Asset optimization ndash fuel efficiency
Customer Dynamics RailConnect 360 ndash Trip Optimizer
bull Real-time embedded optimization algorithms
bull Advanced data acquisition enabling train health monitoring
bull Automated train handling reduces wheel amp rail wear
bull $1M diesel locoyear 22K GE locos
bull Emissions
bull Huge operating variation operators trains topography
Trip Optimizer with CSX
Implementation on 1500 CSX locomotives
Reduced fuel use by 7 on average Decreased 3rd largest operating expense
- CSX Sustainability Report 2013
Tr ip Opt imizer Quick Star t Guide (1) Train Speed is available on the speedometer during an active trip during auto and Manual Control
(2) Trip Plan Speed displays a green Trip plan speed pointer on the speed indicator dial in Auto and Manual
modes of operation
(3) Trip Optimizer Status Box is visible when Trip Optimizer system is ACTIVE and provides three types of messages Status Request for Operator InputAction and Error
(4) TrackCivil Speed Limit plot line is Cyan shown the entire horizontal range data permitting
(5) Train Speed (Actual) plot line is White shown only from the head of the train on back
(6) Train Head is shown as a thick White line to allow the operator to see the position of the Train relative to the
terrain The horizontal scale of the rolling chart is zero-referenced to the Head of the Train (corresponds to the forward-facing end of the lead locomotive)
(7) Train Milepost has an associated location and name Its representation on the screen consists of a graphical
pointer and an identifier
(8) OMB Message Box displays operator messages
(9) Consist Notches displays Lead and Trailing locomotive notches
(10) Throttle Handle Notch represents the Master Control-ler handle position During TO Auto Control it will indicate
N8 as TO automatic control requires notch eight (N8) set-ting
(11) Auto Control Notch displays on screen as a White box to denote TO Auto Control engagement and throttle out-
put control
(12) Trip Plan Speed has a Green plot line shown as the entire horizontal range when available and data permit-
ting
(13) Manual Control Zones is shown as a Gray rectangle on the terrain plot extending across the entire vertical range of this section of the chart
(14) Planned Braking depicts Blue areas where Trip Opti-mizer expects that dynamic andor air braking will be
required to maintain the plan speed
(15) Key Locations are softkey states that constitute a unique mapping of functionality to key locations
1 How do I get started To start a trip you will push the Trip Optimizer key on the Main operator screen
2 Do I have to be stopped to request a trip through Trip Optimizer It is preferred to perform a trip init at zero speed however unless otherwise provided by
local ruleinstruction maximum speed for initialization is 15 mph
3 I have performed the Trip Init process and see the rolling map When will I get prompted for Auto Control
Auto Control will become available when the speed is greater than 12 mph and the Throttle handle is N1 or higher
4 Why does the Locomotive Status matter to Trip Optimizer Trip Optimizer will always monitor in train forces speed braking and fuel efficiency To best optimize all of these Train dynamics Trip Optimizer must be told by the operator what the
status of each locomotive in the train The three modes are defined as follows
Running The locomotive is fully operational and is used for calculating TPOB
Isolated The locomotive is either shut-down or is mechanically isolated from produc-
ing Tractive Effort
DB Cutout The locomotive has no Dynamic Braking available but is being used for
producing Tractive Effort
5 What is the recommended way to disengage Auto Control The most fuel efficient way is to decrease the throttle notches in 2 second intervals until
you get to the required speed
6 Trip Optimizer is disengaging from Auto mode and tells the opera-tor Manual Control is required I am already in Notch 8 throttle
What do I do
Press the Current Throttle key on the screen Moving the Master Controller from Notch 8 to
Notch 7 and back could result in un-safe train handling practices
7 Why does Trip Optimizer not always travel at Track speed Trip Optimizer will use the forces of the train and momentum to achieve the optimal speed to save fuel In some cases Idle will be used to meet a planned slow order Trip Optimizer is
always looking out a few miles ahead to plan for the ideal speed while maintaining safe train handling
8 How do I report an inaccuracy on the civil speed limits posted on the rolling map
Contract your Road Manager to report the case
9 The dispatcher has issued an enroute slow order Will Trip Opti-
mizer automatically take this into account
No If an enroute slow order is issued it will be the train crewrsquos responsibility to protect the
train in Manual mode during this affected zone
10 Why does Trip Optimizer automatically end the trip when I still have distance remaining before the preset crew change point
The subdivision has a GPS controlled end point that will automatically end the trip based off of recommendations from the railroad
Follow the steps on the backside of this document to walk you through performing a Trip Init
Trip Optimizer Top Ten List
GE Proprietary Information The information contained in this document is GE Proprietary Information and is disclosed in confidence It is the property of GE and shall not be used disclosed to others or repro-
duced without the express written consent of GE If consent is given for reproduction in whole or in part this notice and the notice set forth on each page of this document shall appear in any such reproduction in whole or in part The information contained in this document may also be controlled by the US export control laws Unauthorized export or re-export is
prohibited Document 5005807 Rev mdash
Before engaging the TO AUTO throttle the operator must meet certain train conditions and under-stand the data displayed on the Trip Optimizer Running Screen
Doc No 5005890 Rev -
71
Operations optimization ndash velocity
Movement Planner with Norfolk Southern
RailConnect 360 - Movement Planner
bull Systems problem hellip beyond human capabilities
bull Majority single track
bull Point solutions have plateaued
bull Integrated suite of day of operations software apps
bull Predixtrade platform - connectivity big data and security
bull Advanced algorithms and automatic routing
bull Proven in class 1 revenue service
Norfolk Southern and Movement Planner
Automated routing decisions
10+ increase in velocity
50+ reduction in expired crews Significant improvement in
schedule adherence
1MPH = ~$200MM estimated
annual savings in capital amp expenses
Based on 3 year study in NS GA division
Customer Dynamics
72
bull Co-development GE Transportation amp GE Intelligent Platforms
minus Enhanced sensor coverage
minus Improved data acquisition higher resolution
minus Advanced analytics
bull Asset specific insight drives fault reduction and enables CBM
(SmartSignal)
bull 20K+ overhauls in backlog
bull OH interval based on average expected condition
bull $1B+ capital expenditure in North America every year
Impact Reduced unplanned
downtime amp avoid road failures
Reduce unscheduled material consumption
Extended periodicity and associated expenses
ldquoPhysicsrdquo change
Real Time Engine Performance
Bearing Temp
Bearing Temp
Load
Ambient
To
da
y
To
mo
rro
w
Alarm trigger
Savings
CSA ndash shared productivity
Lifecycle Cost Dynamics ndash Engine Overhauls RailConnect 360 ndash Advanced Analytics
GErsquos 1 Jamie Miller - Senior Vice President Chief Information Officer
- In current role since 2013
- 9 years with GE
74
Digital opportunity
Simplifying structure
More valuable GE resources with fully integrated approach
+ Utilize data from products
+ Field services tools
+ CRM configurators
+ Brilliant Factory
Benefits
ERPmanufacturing 90
Data Centers 80
Applications 30
Shared Services 65
Cloud 70
Product Cost
RampD
SGampA
+ Engineering tools
+ Shared Services GL
+ Cyber Security
IT plays
-a)
(a - Target percent of new applications that are Cloud enabled
~$94B
Industrial cost
75
Three opportunities to power manufacturing
Digital Foundation 1
Unlocking Big Data
minus Sourcing
minus Productivity
2
Powering the Brilliant Factory
minus Design for manufacturing
minus Sensor enablement
minus Plantsupply chain optimization
3
minus 90 reduction in ERPs
Supply Chain Network
Virtual Mfg
Virtual Product Design
76
Product Cost ERP investments paying off
Inventory turns 6x 7x
Shipment on time 58 85
Foundation for business to deliver $1B+ savings over past 5 years
GE Healthcare
of revenue on target ERP ~75
~95
2009 Today
Today 219 ERPs 2016 34 ERPs
GE Water
2008 Today
22
1
of ERPs
SGampA of sales ~10 pts
Past dues 60
Finance headcount 50
77
Product Cost Using big data to run GE
Ingest Store Clean Consume
1 OampG data lake $8B direct materials buy
Real time More cheaper Faster GE-wide Analytics Data science
$60B total material buy across GE hellip $1B+ cash amp deflation opportunities
bull 23 source systems
bull Full visibility ndash 3 weeks
bull Commodity part supplier
bull Data lake technology
bull Machine learning for data cleansing
bull EM PampW underway (Alstom)
Oil amp Gas
Xxxxx Xxxxx Xxxxx xxxxx
78
Product Cost Technology powering the Brilliant Factory
20 NPI cycle hellip 20 efficiency
16 pilots launched hellip Fastworks 2020 Vision
FastWorks approach
Virtual design for manufacturing
30 NPI cycle time
Eliminated quality escapes
Wilmington NC
Aviation Machining
Factory optimization
25 productivity
PampE avoidance Greenville SC
PampW Nozzle Cell
machine downtime
25 opportunity
Sensor Enablement
Grove City PA
Transportation Remanufacturing
79
Smart Outage Full deployment at PGS
Changing the way we deliver Services
On track for $1B CSA productivity over 3 years and 10 customer uptime
+ +
Predictive Workscope Aviation 4 customers
full roll-out mid-2015
=
Field services optimization
Predictive workscope
Next generation modeling
Advanced technology
Accelerating productivity
80
We can do more ldquoSrdquo with less ldquoG+Ardquo
45 win rate
80 in quote time
5400+ SalesComm Ops hoursweek
QuickQuote
40K+ GE Commercial FTE
Highly manual long-cycle-time
More ldquoshots on goalrdquo lower cost
Investing in digital tools for commercial teams
Wrap up
82
Value for investors
Payback through most reliable revenue source Services
+ Increase revenue growth
+ Improve margins
+ CSA productivity
Funded software amp analytics through simplification amp reallocation
Potential upside beyond the GE installed base
Scale amp intellect Return on investment
1
2
3
GE Software COE
+ COE can accomplish scale hellip none of
our businesses could do this on their
own hellip attract talent amp spread ideas
+ Advantage to being an early mover hellip
right partnerships amp scale
+ Changing GE Industrial DNA hellip
greater impact from digital amp
analytical investments
83
Why GE
+ More valuable portfolio hellip 75 Industrial while growing EPS
+ Tangible evidence of winning NPI hellip Tier 4 LEAP etc
+ Strong amp diversified global footprint hellip best-in-class
+ Transforming service for next generation of growth
+ Culture of simplification impacting every part of GE
LEAP is a trademark of CFM International
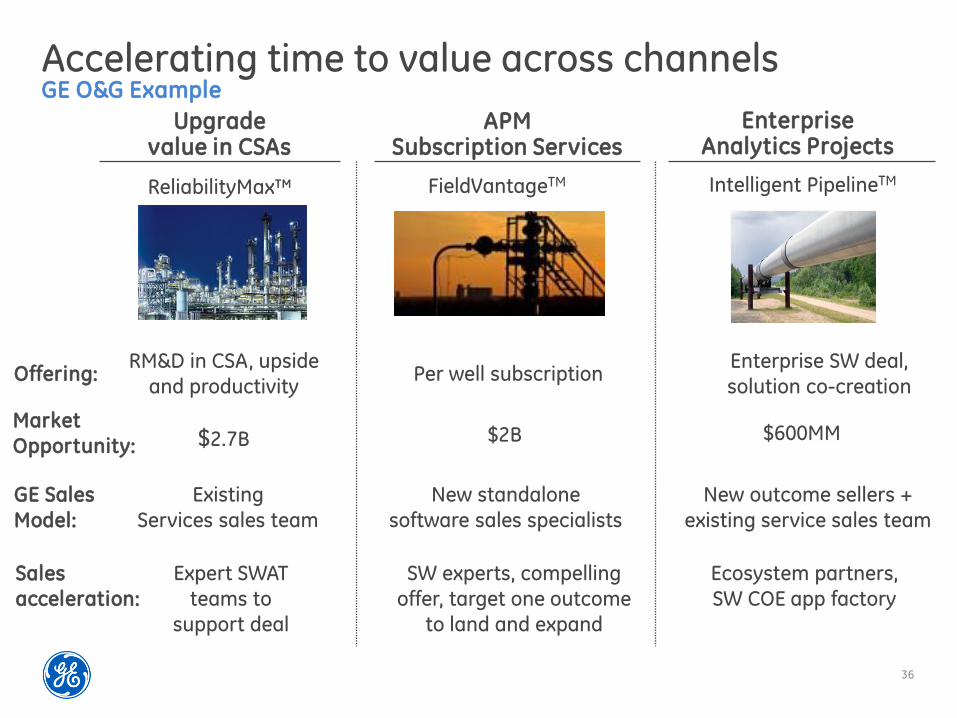
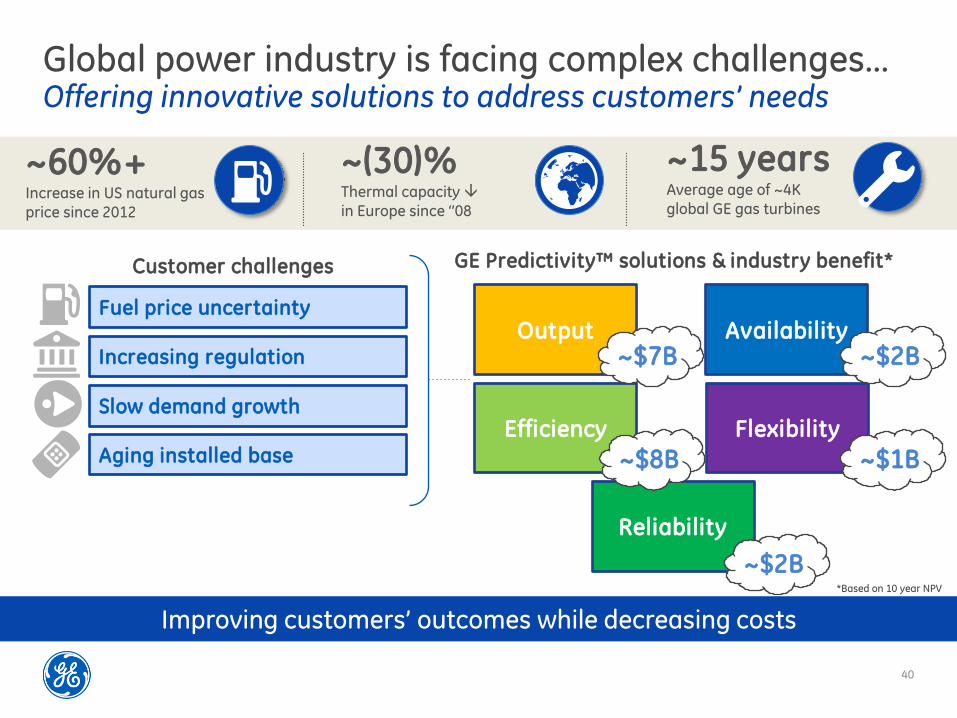
40
Global power industry is facing complex challengeshellip Offering innovative solutions to address customersrsquo needs
Fuel price uncertainty
Increasing regulation
Slow demand growth
Aging installed base
~15 years Average age of ~4K global GE gas turbines
Output
Efficiency
Reliability
Availability
Flexibility
Improving customersrsquo outcomes while decreasing costs
~$7B
Customer challenges
~$8B
~$2B
~$1B
~$2B
GE Predictivitytrade solutions amp industry benefit
~60+ Increase in US natural gas price since 2012
~(30) Thermal capacity in Europe since lsquorsquo08
Based on 10 year NPV
41
Investing in technology
Addressing multiple customer value levers
Advanced Gas Path (AGP) Industry leading output hellip up to +64 Industry leading efficiency hellip up to +18 Extends asset amp parts life hellip 96K hours
1
Op Flex Delivers flexibility to costs amp revenue Reduces start up time amp fuel consumption Expands fuel source opportunity
3
Dry Low NOx 26+ (DLN) Reduces NOx emissions by 40 Delivers industry leading flexibility Increases maintenance intervals to ~1250 starts
2
42
Power FlexEfficiencytrade Advanced Gas Path
Expanding the operating envelope
Ambient Temperature
Ou
tpu
t (M
W)
Op Flex
7FA03 baseline
AGP
+ ndash
+
Combining hardware and software hellip creating 2X the value
$17
$30
Op Flex
Average Customer Annual Value Per Unit ($MM)
Improving customer outcomes
AGP (Hardware)
AGP PredictivityTM
Solution
125+ AGPs with software sold to date
650000+ operating hours to date
43
Wind PowerUp hellip generating more output
Customer Outcome Up to 4
increase in power output across 283
wind turbines hellip 40+ GWhr annual increase ldquoThe PowerUp system offers a great chance for owners like us who are investing literally billions of dollars in this market to try and get more production out of existing assets GE took a lot of risk out of this for usrdquo
ndash Patrick Woodson CEO EON Climate amp Renewables
Opportunity for up to
20 more profit from up to
5 more output
A performance based
cooperative approach
with a holistic view of the
assets system and network
Flexible payment options
aligned to customer needs
+1400 turbines under contract since launch
Customer opportunity
Software enabled
Flexible platform
Proven results
Scale out
1
2
3
Healthcare Jan De Witte - President amp CEO Healthcare IT
- In current role since 2011
- 15 years with GE
45
Healthcare Services
Delivering value = higher quality outcomes at lower cost
Key metrics Services imperatives ($ in billions)
Backlog $11 +
Installed base dynamics
1
2
3
4
Deliver on customer value + Asset and workflow optimization + Analytics around EMRs amp Devices
Grow $installed base
+ Quality and analytics offerings + Solutions architecture amp delivery
Expand margins + Remote service amp SaaS models + Field services productivity Improve service execution amp delivery + Remote monitoring technologies + Field force deployment optimization
Emerging markets infrastructure build
Mature markets quality upgrades
ACA amp Enterprise Solutions IT penetration
13 14E
=+ Revenue $80
46
Healthcare industry shifting to value-based care GE software analytics and services are uniquely positioned to help
Customer challenges
Integrated Care Solutions hellip turning data into actionable insight Improving healthcare outcomes
Diagnostic quality
Patient-centric care
System profitability
Chronic Disease Management
Sources Institute of Medicine 2013 Porter Research 2013 McKinsey IHS Global Insight
29 Healthcare spend wasted each year
$260B Annual value creation through healthcare IT
59 US lives covered in value-based care model by 2015
Clinical Quality
Financial Performance
Operational Efficiency
Configurable Workflows
47
GEHC Software portfolio positioned along main outcome drivers for care systems
Diagnostic speed amp confidence
Productive care pathways
Wellness amp chronic disease management
Risk amp margin management
Costworkforce optimization
Population Health Management
Workflow
Archiving
Visualization
Financial Management
Care Delivery Management
Enterprise Imaging
Operations Management
Revenue Cycle
Risk assessment
Margin analytics
Workforce optimization
Asset Management
Integrated Care Solutions
Ambulatory Care
High Acuity Care
Cardiology
Analytics
Care coordin
Engagement
Providing caregivers the right actionable insight ndash when amp where they need it
Large GE device footprint generating
clinical data
HCIT domain in clinical workflow amp analytics
SW CoEPredixTM capabilities + +
48
Enterprise Imaging Improving diagnostic workflow in the cloud
Customer Challenges Cloud Case Exchange CentricityTM 360
Sample Customers Solution Architecture
Clinical Collaboration amp Advanced Analytics
Imaging Cost Control
Archive
Workflow
19 Time spent
gathering data
Workflow
velocity
Diagnostic
confidence
Cases diagnosed
incorrectly 35
~$2B segment by rsquo18 growing 25+
30 turn-around time
3 duplicate exams
Customer value $10MM+ cost pa
Image-as-a-Service lifecycle value $20MM+
Care quality
Cost
Source Research from the Journal of the American College of Radiology and the Journal of American Medicine
49
Customer Challenges Workforce management
Sample Customers
Operations Management Optimizing workforce productivity with API Healthcare
54 Hospital
operating cost
spent on labor
Solution Architecture
Real-Time Analytics Labor amp Patient Workflows
Time amp Attendance
Staffing amp Scheduling
HR amp Payroll
~$2B segment by rsquo18 growing 12+
20 Workforce productivity
Customer value $4MM cost pa
Workforce-mgmt services lifecycle $4MM+
80 Overtime wages
Matching care-giver capacity
amp patient need
Care quality
Labor
productivity
Source Beckerrsquos Hospital Review
50
Population Health Management Lowering the cost of chronic disease
Customer Challenges
Solution Architecture
Caradigm Analytics amp Care Mgt
Proactive
intervention
Care protocol
compliance
75 Cents of every
healthcare dollar
spent on chronic
disease
Care Mgt Analytics Risk Cohort
25
Customer value $5MM+ cost pa
Caradigm lifecycle value $18MM+
Patients per care manager
~$30B segment by 2025 growing 19+
Sample Customers
40 Hospitalization for chronic patients
Chronic disease
treatment cost
Source National Diabetes Fact Sheet
51
Software enabling productivity in service process
Wo
rkfo
rce
Pla
nn
ing
amp
Dis
pa
tch
Historically up to 40 FE travel time hellip utilize analytics to optimize allocation
Smart dispatch with effective job-skill matching
Optimize field force capacity and response time to customers
Call Generation (Planned amp Unplanned)
Deploy
RepairFix
Diagnose
CloseDebriefBill
Pe
rfo
rma
nce
M
on
ito
rin
g 110k GEHC devices connected remotely
MR hellip 900 data points monitored per machine 30k alertsyear proactively fixed
Improves GE productivity while minimizing customer down-time
Healthcare Services margins improving
Aviation Kevin McAllister - President amp CEO Aviation Services
- In current role since May 2014
- 25 years with GE
53
Aviation Services
13 14E
+ $108
Backlog $97 +
Revenue
Key metrics Services imperatives
Commercial IB hellip 34000 engines
Young hellip 46 havenrsquot had 1st shop visit
Fuel cost driving investment hellip GE well
positioned hellip 787 737MAX A320NEO 777X
Installed base dynamics
1
2
3
4
Deliver on customer value
+ Lowest cost of ownership
+ PredictivityTM outcomes
Grow $installed base
+ Winwin providing technology upgrades and analytics
Expand margins
+ Time-on-wing for GE and customers
+ Cost productivity hellip for GE
Best service execution and delivery
+ Position to support service entry for next-gen products
($ in billions)
54
Solid growth fundamentals
Shop visits Environment Departures
Source IATA amp GE analysis
Passengers IATA RPK YoY
Utilization Avg cycles day YoY
Departures GE and JV-powered flights (MM)
0
5
10
15
20
25
30
35
40
lsquo10 lsquo15F lsquo95 lsquo00 lsquo05
4100
5500
4400
2100
2000
3000
2300 2000
2300
200
100
-1 09 02
2012 2013 2014E
53 52 58
20 21 22
2 of 3 daily flights
powered by GE or GE JVs
46 have not
had 1st shop visit
4 CAGR Number of departures (MM)
lsquo13 rsquo15F rsquo20F
CFM is a 5050 JV between GE and Snecma EA is a 5050 JV between GE and Pratt amp Whitney
55
Solving our customers toughest challenges
Airline direct operating costs
Fuel
40
Delays and cancellations
8
Maintenance
9
Services analytics offerings
Flight Efficiency Services
Performance-based Navigation
Analytics-enabled workscoping
Product and Services strategy
Provide lowest cost-of-ownership through OEM technology
Lead in on-wing reliability
Lead in technology
Best-in-class fuel burn and retention
Engine diagnostic and prognostics
Intelligent Operations
$200Byr
$40Byr
Taleris is a 5050 JV between GE and Accenture
+
56
Services technologies hellip improving value through the lifecycle
Installed base (lsquo13) Upgrades
Fuel Burn improvement
Time- on-wing
8 8 2x
8 3 3x
5 2 2x
A culture of technology insertion Tailored to customer wants
CFM is a 5050 JV between GE and Snecma
Risk transfer $hour coverage
Overhaul Time and material
Materials New used and repaired parts
Asset optimization TRUEngineTM program diagnostics
+
CF6-80C (lsquo86 EIS)
GE90 (lsquo95 EIS)
CFM56 (lsquo84 EIS)
3000
1500
18500
57
Minds amp Machines at GE Aviation
+ Ex
po
sure
Operator A Operator B Part Temperature Cruise Takeoff
Te
mp
era
ture
Threshold
Climb
1000+ software engineers GE Software COE
6300 applied engineers GE Aviation
Data Secure continuous accessible
Physics Apply engine expertise
+ =
Customer and GE benefits
+
Statistics Unlock trends segment
ldquoPhysicsrdquo ldquoAnalyticsrdquo
Time-on-wing
Reliability and availability
Fuel cost
Repair and overhaul
58
Lead in on-wing reliability
Applied analytics to detect engines at risk of removal
Cu
mu
lati
ve
dis
tre
ss
Cycles
Recent successes hellip
CFM is a 5050 JV between GE and Snecma
Segment
GE90
120 CFM56
40 Water wash
$7Myr fuel savings at one GE90 operator
removals saved
removals saved
Nominal environment
Abate
Harsh environment
59
$30MMyr savings
Flight Efficiency Services App
Performance-based Navigation App
Attacking fuel spend with analytics
Joint marketing hellip
ldquoPerfect flightrdquo video
In the news
Newsletter
Oil amp Gas Brian Palmer - Vice President Measurement amp Control Solutions
- In current role since 2010
- 29 years with GE
61
Oil amp Gas Services
Software amp Services as a key differentiator
Key metrics Strategic imperatives ($ in billions)
13 14E
++
Backlog $58 ++
$83 Revenue
1
2
3
4
Deliver on customer value + Customer co-creation
+ Outcome based solutions
Grow $installed base + Drive analytics amp PredixTM
+ Penetrate the installed base
Expand margins + More software and contract offerings
+ Continue to grow backlog double digits
+ Partnerships to accelerate journeyhellip
Meridium
Improve service execution amp delivery + Full lifecycle productivity
+ Simplifying structure
IB growing TMS and Subsea with 13K+ units Software investments creating new IB revenue
streams in addition to traditional parts and service New contractual (CSA) offerings developedlaunched
Installed base dynamics
62
Oil amp gas industry is faced with expanding challenges GE software data and analytics are uniquely positioned to help
Customer challenges Equipment Availability
Equipment Reliability
Operational Efficiency
Production Optimization
Industrial Internet hellip turning data into actionable information Enable no unplanned downtime
Increasing complex operations
Tighter regulations
Skills gap
Machines with data potential
Sources GE OampG analysis based on Wood Mackenzie Rystad Barclays IHS CERA PFC Energy IEA httpwwwgecomstoriesoil-and-gas-innovation Oil and Gas Facilities 2013 httpwwwspeorgogfprintarchives201306
$800B+ Annual industry CAPEX (6-8 growth per year)
$150MM Average annual cost for mid-size LNG facility due to unplanned downtime
5-10 Range of OampG industryrsquos estimated downtime
63
Predixtrade hellip Unified Operations Improved throughput connecting people machines and data
Customer outcomes
Unified Operations ndash A customer co-creation success story
Enhanced safety
Increased availability
Operational visibility
Efficient workforce enablement
Partnering with to tackle these industry challenges and create a solution that increases production and lowers cost driving improved customer outcomes
Unified Customer
Portal
129000 Pieces of equipment in operation globally in
the industry
50 Industry retirement rate in next 10 years
7X Industry fatality rate
above norm
people
machines
data
64
FieldVantagetrade hellip Asset Performance Management (APM) for Onshore
APM ndash Bringing GE expertise from all industries to deliver system level value
Customer outcomes
Enhanced safety
Operational visibility
Improved availability
Optimized performance
Monitoring amp
Diagnostics
Condition Based
Maintenance
Real time Operations
Intelligence
Asset LifeCycle
Management
bull Providing field level visibility and optimization across multiple forms of artificial lift technologies bull Integrated insights provided through common single scalable platform bull 2 year service contract on 200+ wells
Solution Overview
39 NAM OampG Upstream Vehicle Fatalities
hellipby improving
116K New wells in 2014
5 Days Back to production (NAM Avg)
1MM+ Artificially Lifted Wells (Global)
65
Intelligent Pipeline hellip Operations optimization software for pipelines
2TB of data for every
30K miles of pipeline
3-4 annual growth
2MMmiles of
pipelines globally
$40B invested by pipeline companies per year
Source 2TB - Average data volume based on GE internal analysis of multiple pipeline customers Rest - GE OampG analysis based on Douglas Westwood IHS CERA FERC CIA World Factbook PII Pipeline Database (Summary of Infield Systems Global Data DOT databases)
bull 5 year service contract
bull Setting the industry standards for
pipelines real-time intelligence
First customer Customer outcomes
Enhanced safety Proactive versus reactive decisions
Visibility Complete geospatial view and situational awareness
Optimized Ops Effective data driven resource allocation
Efficient OampM Prioritize spending for assets and resources
Moving to proactive solutions with our customers
66
Customer Benefits
Zero unplanned downtime
Increased availability
Increased reliability
Decreased production losses
$14B Additional opportunity driven by
availability and reliability increase (1 of capacity)
Industry Opportunities
Outcome base service bonus
GE Productivity Improvements
Inventory through parts flow optimization
Outage durationfrequency driven by condition- based maintenance
Services Optimization hellip Creating optimal value for GE equipment customers
Journey to 100 reliability through our Contractual Services Agreements (CSA)
Transportation Pete McCabe - Vice President Global Services amp Solutions
- In current role since 2013
- 20 years with GE
68
Transportation Services ($ in billions)
13 14E
+
Revenue $28
Backlog $12B+ +
1
2
3
4
Deliver on customer value
+ Outcomes - velocity fuel reliability
+ System solutions ndash RailConnectTM 360
Grow $installed base
+ Increase penetration ndash Parts amp Smarts
+ Extend asset life ndash modernizations
+ Broaden software solutions ndash rOS
Expand margins
+ Deploy advanced analytics ndash PredixTM
Improve service execution amp delivery
+ Enhance commercial capabilities
+ Expand domain amp IT project expertise
Installed base dynamics
1000+ Tier 4-compliant loco orders
~650 locomotives un-parking in rsquo14
450 new locomotives in South Africa
Key metrics Services imperatives
69
Railroad industry is faced with expanding challenges and customers require a solution provider
Customer challenges
RailConnecttrade360 delivering customer focused outcomes
Asset utilization
Capacity limited
Resource constraints
Ops Complexity
$80B+ N American operating revenue (~4 growth)
7 year high Traffic volumes require unparalleled investment
$56B Annual industrial benefit through 1 improvement
Sources American Association of Railroads (AAR) 2013 industry statistics
70
Asset optimization ndash fuel efficiency
Customer Dynamics RailConnect 360 ndash Trip Optimizer
bull Real-time embedded optimization algorithms
bull Advanced data acquisition enabling train health monitoring
bull Automated train handling reduces wheel amp rail wear
bull $1M diesel locoyear 22K GE locos
bull Emissions
bull Huge operating variation operators trains topography
Trip Optimizer with CSX
Implementation on 1500 CSX locomotives
Reduced fuel use by 7 on average Decreased 3rd largest operating expense
- CSX Sustainability Report 2013
Tr ip Opt imizer Quick Star t Guide (1) Train Speed is available on the speedometer during an active trip during auto and Manual Control
(2) Trip Plan Speed displays a green Trip plan speed pointer on the speed indicator dial in Auto and Manual
modes of operation
(3) Trip Optimizer Status Box is visible when Trip Optimizer system is ACTIVE and provides three types of messages Status Request for Operator InputAction and Error
(4) TrackCivil Speed Limit plot line is Cyan shown the entire horizontal range data permitting
(5) Train Speed (Actual) plot line is White shown only from the head of the train on back
(6) Train Head is shown as a thick White line to allow the operator to see the position of the Train relative to the
terrain The horizontal scale of the rolling chart is zero-referenced to the Head of the Train (corresponds to the forward-facing end of the lead locomotive)
(7) Train Milepost has an associated location and name Its representation on the screen consists of a graphical
pointer and an identifier
(8) OMB Message Box displays operator messages
(9) Consist Notches displays Lead and Trailing locomotive notches
(10) Throttle Handle Notch represents the Master Control-ler handle position During TO Auto Control it will indicate
N8 as TO automatic control requires notch eight (N8) set-ting
(11) Auto Control Notch displays on screen as a White box to denote TO Auto Control engagement and throttle out-
put control
(12) Trip Plan Speed has a Green plot line shown as the entire horizontal range when available and data permit-
ting
(13) Manual Control Zones is shown as a Gray rectangle on the terrain plot extending across the entire vertical range of this section of the chart
(14) Planned Braking depicts Blue areas where Trip Opti-mizer expects that dynamic andor air braking will be
required to maintain the plan speed
(15) Key Locations are softkey states that constitute a unique mapping of functionality to key locations
1 How do I get started To start a trip you will push the Trip Optimizer key on the Main operator screen
2 Do I have to be stopped to request a trip through Trip Optimizer It is preferred to perform a trip init at zero speed however unless otherwise provided by
local ruleinstruction maximum speed for initialization is 15 mph
3 I have performed the Trip Init process and see the rolling map When will I get prompted for Auto Control
Auto Control will become available when the speed is greater than 12 mph and the Throttle handle is N1 or higher
4 Why does the Locomotive Status matter to Trip Optimizer Trip Optimizer will always monitor in train forces speed braking and fuel efficiency To best optimize all of these Train dynamics Trip Optimizer must be told by the operator what the
status of each locomotive in the train The three modes are defined as follows
Running The locomotive is fully operational and is used for calculating TPOB
Isolated The locomotive is either shut-down or is mechanically isolated from produc-
ing Tractive Effort
DB Cutout The locomotive has no Dynamic Braking available but is being used for
producing Tractive Effort
5 What is the recommended way to disengage Auto Control The most fuel efficient way is to decrease the throttle notches in 2 second intervals until
you get to the required speed
6 Trip Optimizer is disengaging from Auto mode and tells the opera-tor Manual Control is required I am already in Notch 8 throttle
What do I do
Press the Current Throttle key on the screen Moving the Master Controller from Notch 8 to
Notch 7 and back could result in un-safe train handling practices
7 Why does Trip Optimizer not always travel at Track speed Trip Optimizer will use the forces of the train and momentum to achieve the optimal speed to save fuel In some cases Idle will be used to meet a planned slow order Trip Optimizer is
always looking out a few miles ahead to plan for the ideal speed while maintaining safe train handling
8 How do I report an inaccuracy on the civil speed limits posted on the rolling map
Contract your Road Manager to report the case
9 The dispatcher has issued an enroute slow order Will Trip Opti-
mizer automatically take this into account
No If an enroute slow order is issued it will be the train crewrsquos responsibility to protect the
train in Manual mode during this affected zone
10 Why does Trip Optimizer automatically end the trip when I still have distance remaining before the preset crew change point
The subdivision has a GPS controlled end point that will automatically end the trip based off of recommendations from the railroad
Follow the steps on the backside of this document to walk you through performing a Trip Init
Trip Optimizer Top Ten List
GE Proprietary Information The information contained in this document is GE Proprietary Information and is disclosed in confidence It is the property of GE and shall not be used disclosed to others or repro-
duced without the express written consent of GE If consent is given for reproduction in whole or in part this notice and the notice set forth on each page of this document shall appear in any such reproduction in whole or in part The information contained in this document may also be controlled by the US export control laws Unauthorized export or re-export is
prohibited Document 5005807 Rev mdash
Before engaging the TO AUTO throttle the operator must meet certain train conditions and under-stand the data displayed on the Trip Optimizer Running Screen
Doc No 5005890 Rev -
71
Operations optimization ndash velocity
Movement Planner with Norfolk Southern
RailConnect 360 - Movement Planner
bull Systems problem hellip beyond human capabilities
bull Majority single track
bull Point solutions have plateaued
bull Integrated suite of day of operations software apps
bull Predixtrade platform - connectivity big data and security
bull Advanced algorithms and automatic routing
bull Proven in class 1 revenue service
Norfolk Southern and Movement Planner
Automated routing decisions
10+ increase in velocity
50+ reduction in expired crews Significant improvement in
schedule adherence
1MPH = ~$200MM estimated
annual savings in capital amp expenses
Based on 3 year study in NS GA division
Customer Dynamics
72
bull Co-development GE Transportation amp GE Intelligent Platforms
minus Enhanced sensor coverage
minus Improved data acquisition higher resolution
minus Advanced analytics
bull Asset specific insight drives fault reduction and enables CBM
(SmartSignal)
bull 20K+ overhauls in backlog
bull OH interval based on average expected condition
bull $1B+ capital expenditure in North America every year
Impact Reduced unplanned
downtime amp avoid road failures
Reduce unscheduled material consumption
Extended periodicity and associated expenses
ldquoPhysicsrdquo change
Real Time Engine Performance
Bearing Temp
Bearing Temp
Load
Ambient
To
da
y
To
mo
rro
w
Alarm trigger
Savings
CSA ndash shared productivity
Lifecycle Cost Dynamics ndash Engine Overhauls RailConnect 360 ndash Advanced Analytics
GErsquos 1 Jamie Miller - Senior Vice President Chief Information Officer
- In current role since 2013
- 9 years with GE
74
Digital opportunity
Simplifying structure
More valuable GE resources with fully integrated approach
+ Utilize data from products
+ Field services tools
+ CRM configurators
+ Brilliant Factory
Benefits
ERPmanufacturing 90
Data Centers 80
Applications 30
Shared Services 65
Cloud 70
Product Cost
RampD
SGampA
+ Engineering tools
+ Shared Services GL
+ Cyber Security
IT plays
-a)
(a - Target percent of new applications that are Cloud enabled
~$94B
Industrial cost
75
Three opportunities to power manufacturing
Digital Foundation 1
Unlocking Big Data
minus Sourcing
minus Productivity
2
Powering the Brilliant Factory
minus Design for manufacturing
minus Sensor enablement
minus Plantsupply chain optimization
3
minus 90 reduction in ERPs
Supply Chain Network
Virtual Mfg
Virtual Product Design
76
Product Cost ERP investments paying off
Inventory turns 6x 7x
Shipment on time 58 85
Foundation for business to deliver $1B+ savings over past 5 years
GE Healthcare
of revenue on target ERP ~75
~95
2009 Today
Today 219 ERPs 2016 34 ERPs
GE Water
2008 Today
22
1
of ERPs
SGampA of sales ~10 pts
Past dues 60
Finance headcount 50
77
Product Cost Using big data to run GE
Ingest Store Clean Consume
1 OampG data lake $8B direct materials buy
Real time More cheaper Faster GE-wide Analytics Data science
$60B total material buy across GE hellip $1B+ cash amp deflation opportunities
bull 23 source systems
bull Full visibility ndash 3 weeks
bull Commodity part supplier
bull Data lake technology
bull Machine learning for data cleansing
bull EM PampW underway (Alstom)
Oil amp Gas
Xxxxx Xxxxx Xxxxx xxxxx
78
Product Cost Technology powering the Brilliant Factory
20 NPI cycle hellip 20 efficiency
16 pilots launched hellip Fastworks 2020 Vision
FastWorks approach
Virtual design for manufacturing
30 NPI cycle time
Eliminated quality escapes
Wilmington NC
Aviation Machining
Factory optimization
25 productivity
PampE avoidance Greenville SC
PampW Nozzle Cell
machine downtime
25 opportunity
Sensor Enablement
Grove City PA
Transportation Remanufacturing
79
Smart Outage Full deployment at PGS
Changing the way we deliver Services
On track for $1B CSA productivity over 3 years and 10 customer uptime
+ +
Predictive Workscope Aviation 4 customers
full roll-out mid-2015
=
Field services optimization
Predictive workscope
Next generation modeling
Advanced technology
Accelerating productivity
80
We can do more ldquoSrdquo with less ldquoG+Ardquo
45 win rate
80 in quote time
5400+ SalesComm Ops hoursweek
QuickQuote
40K+ GE Commercial FTE
Highly manual long-cycle-time
More ldquoshots on goalrdquo lower cost
Investing in digital tools for commercial teams
Wrap up
82
Value for investors
Payback through most reliable revenue source Services
+ Increase revenue growth
+ Improve margins
+ CSA productivity
Funded software amp analytics through simplification amp reallocation
Potential upside beyond the GE installed base
Scale amp intellect Return on investment
1
2
3
GE Software COE
+ COE can accomplish scale hellip none of
our businesses could do this on their
own hellip attract talent amp spread ideas
+ Advantage to being an early mover hellip
right partnerships amp scale
+ Changing GE Industrial DNA hellip
greater impact from digital amp
analytical investments
83
Why GE
+ More valuable portfolio hellip 75 Industrial while growing EPS
+ Tangible evidence of winning NPI hellip Tier 4 LEAP etc
+ Strong amp diversified global footprint hellip best-in-class
+ Transforming service for next generation of growth
+ Culture of simplification impacting every part of GE
LEAP is a trademark of CFM International
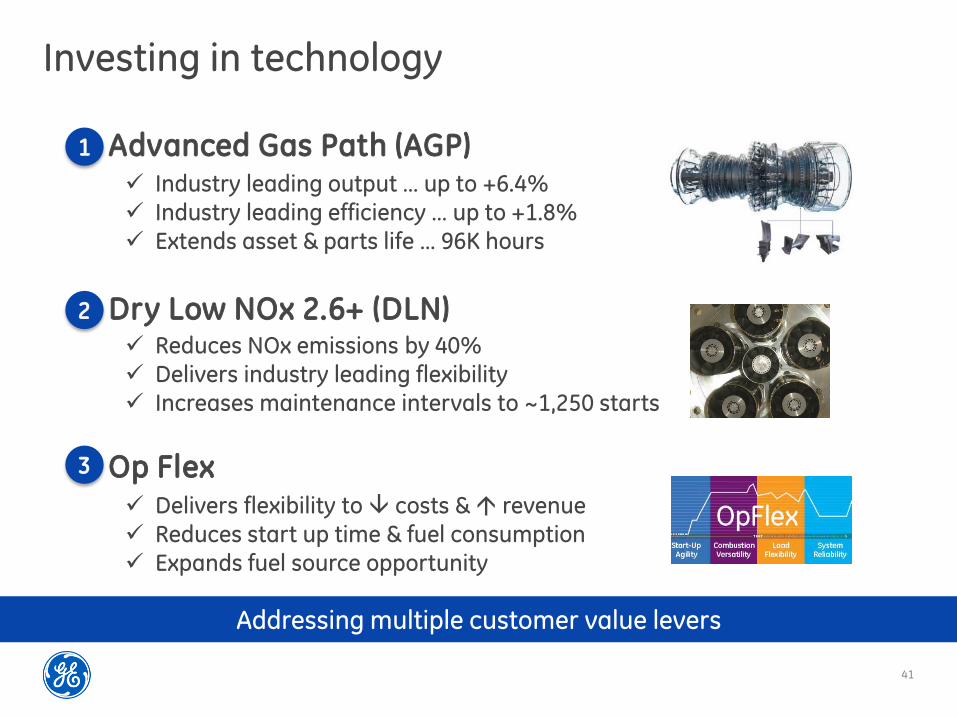
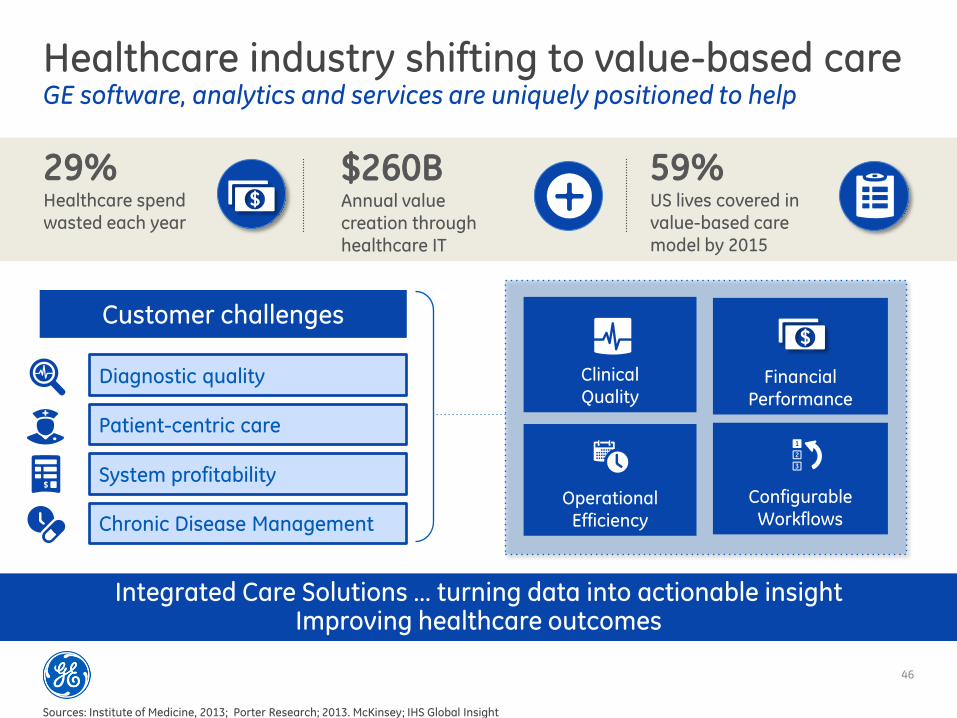
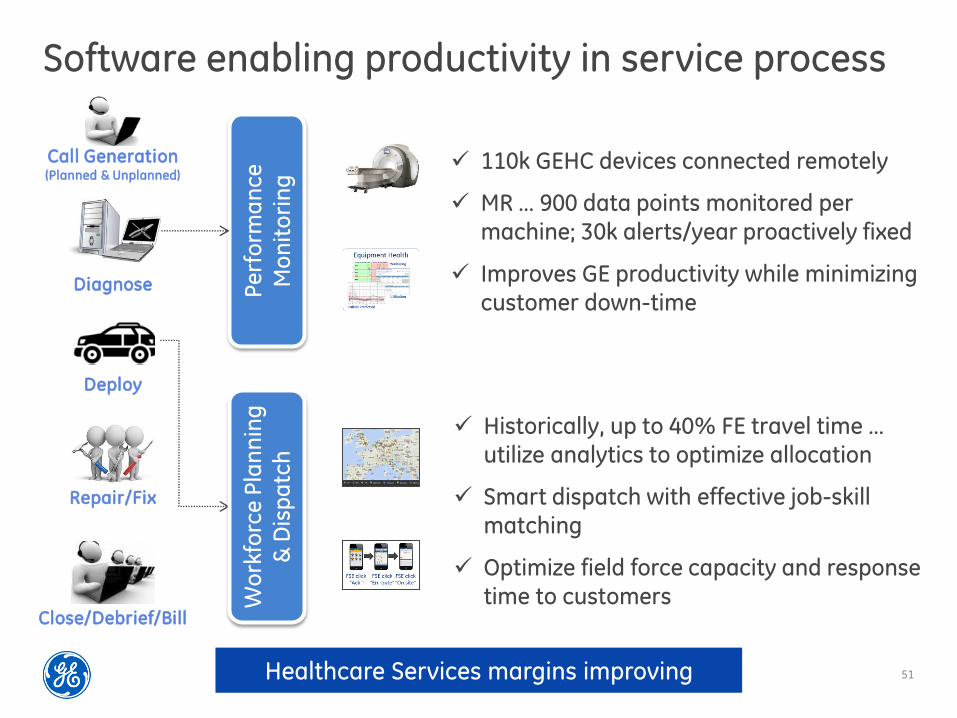
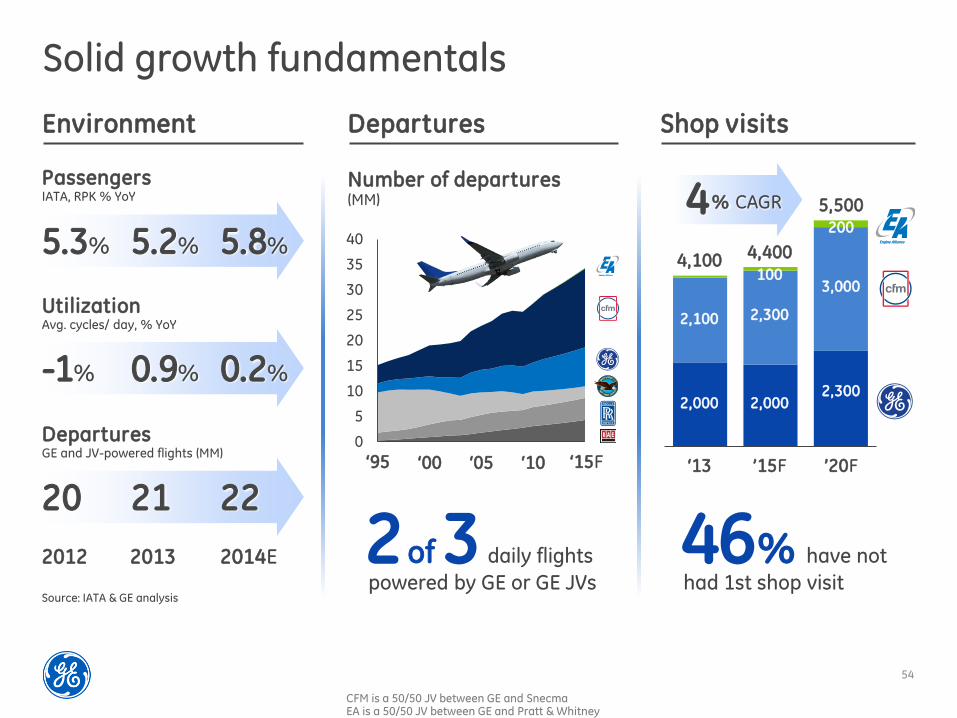
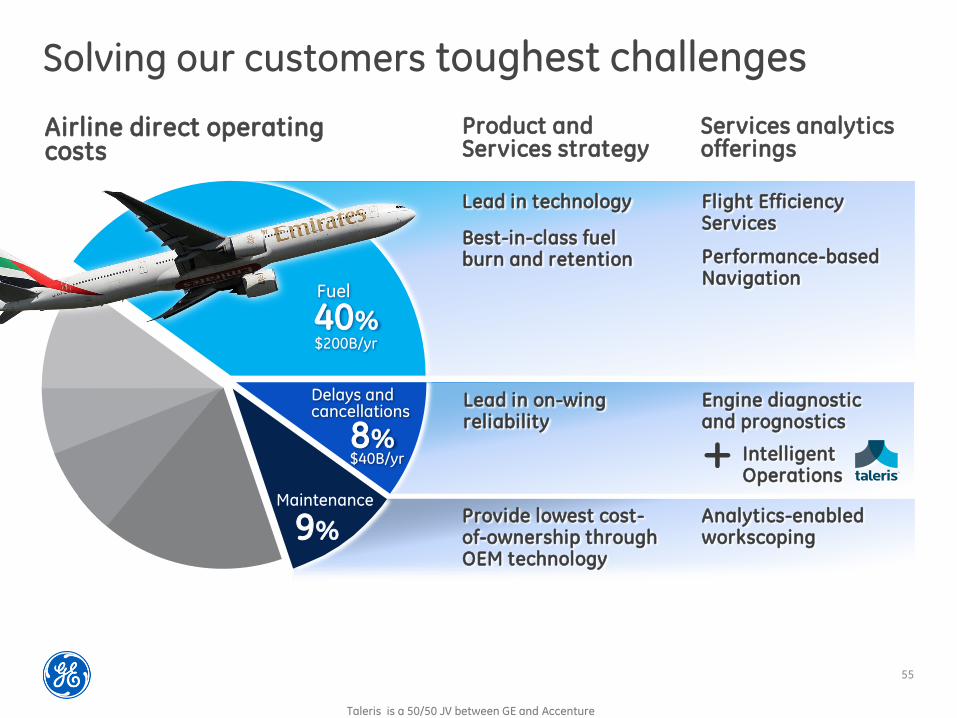
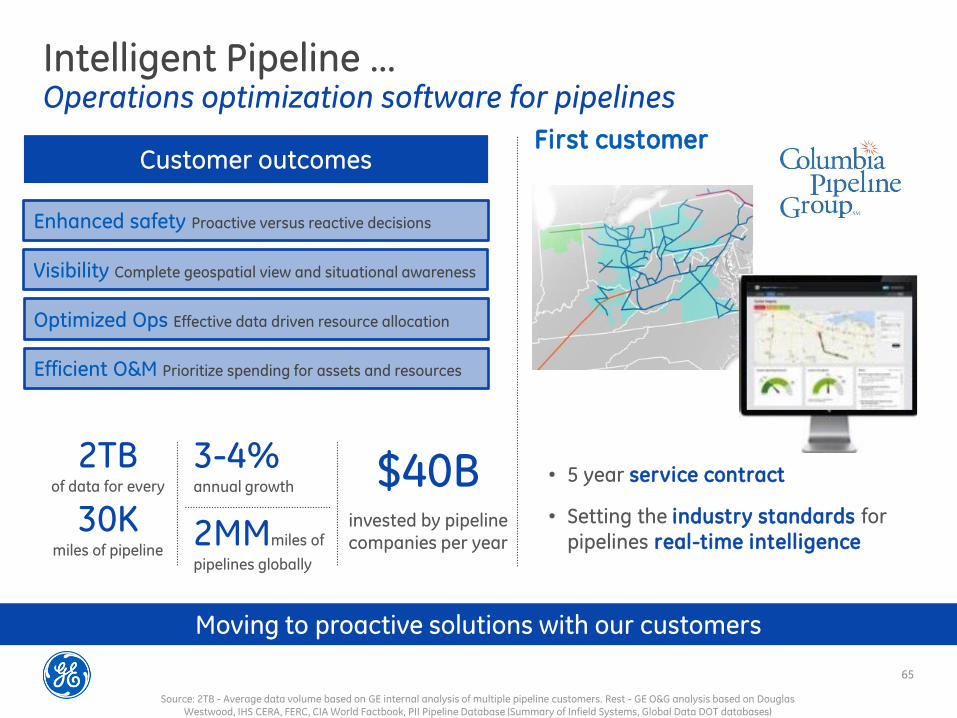
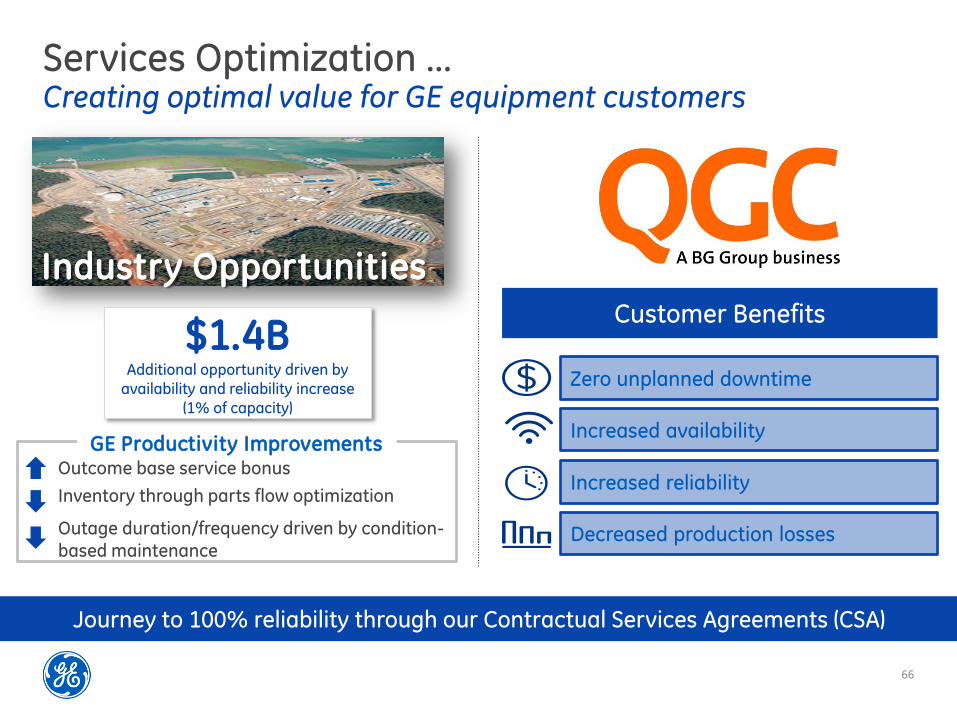
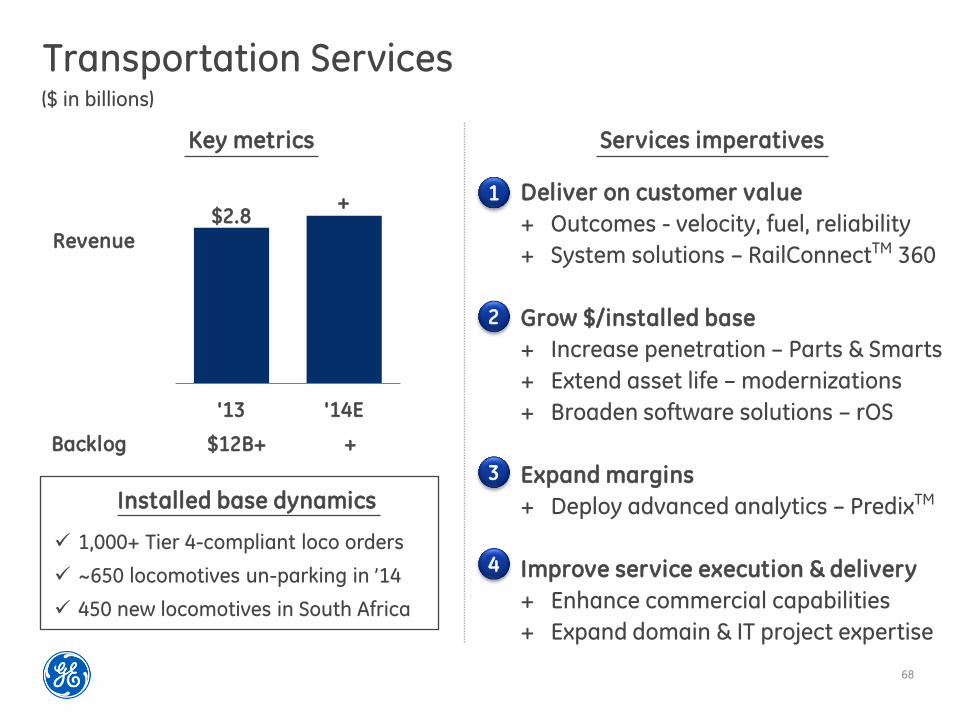
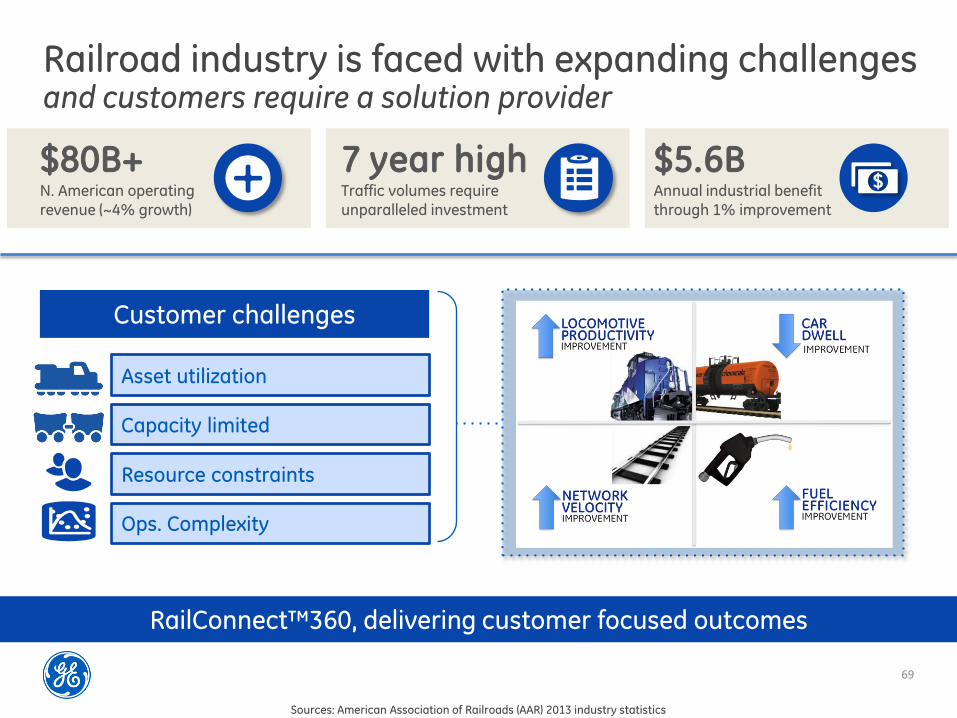
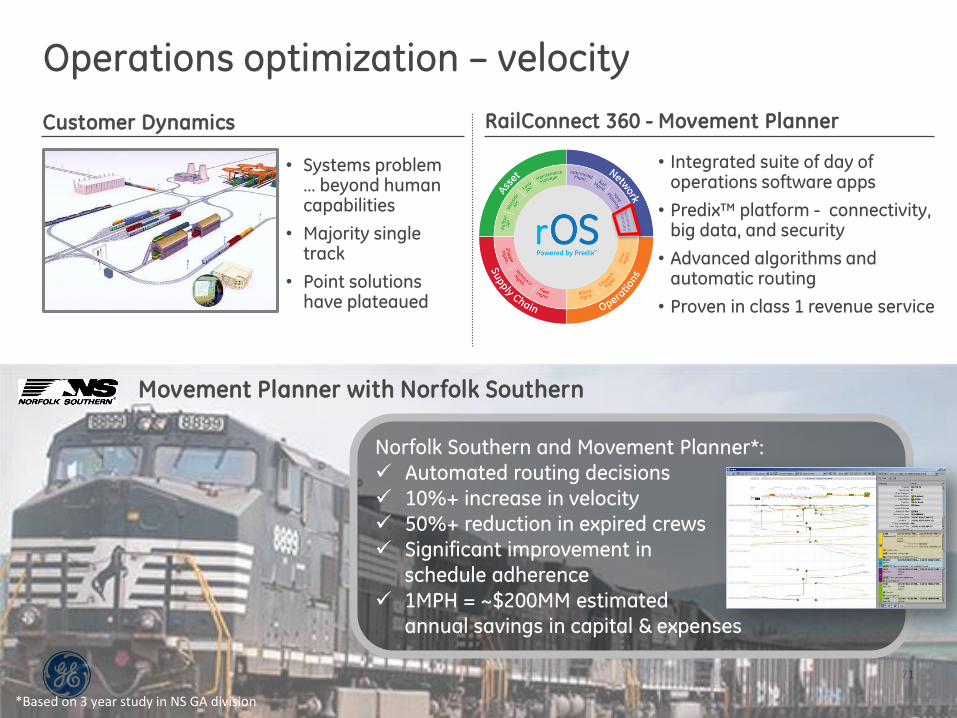
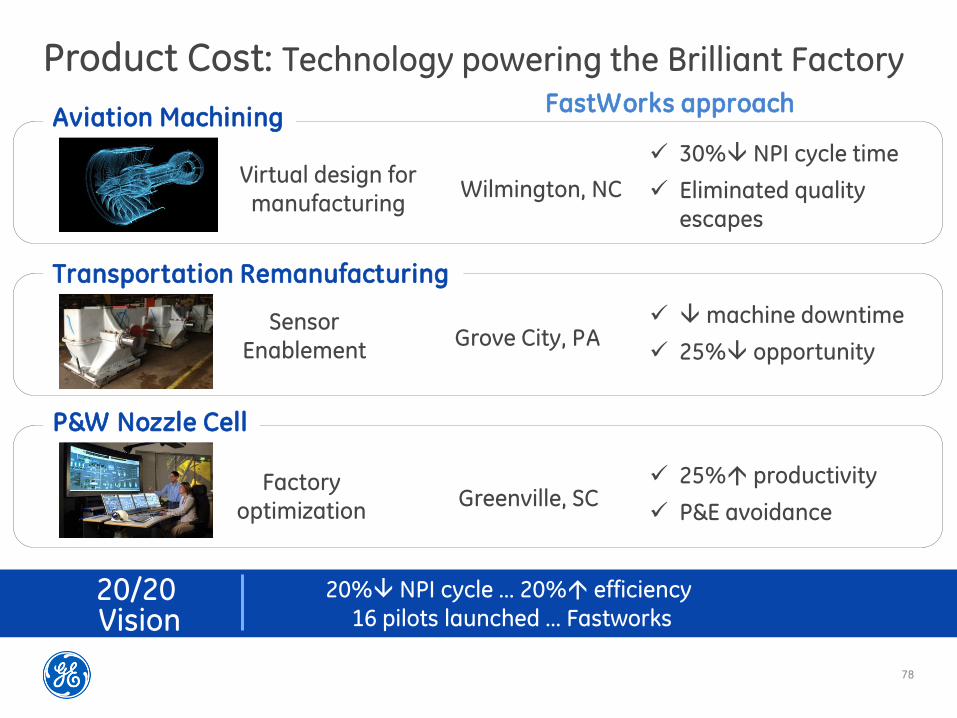
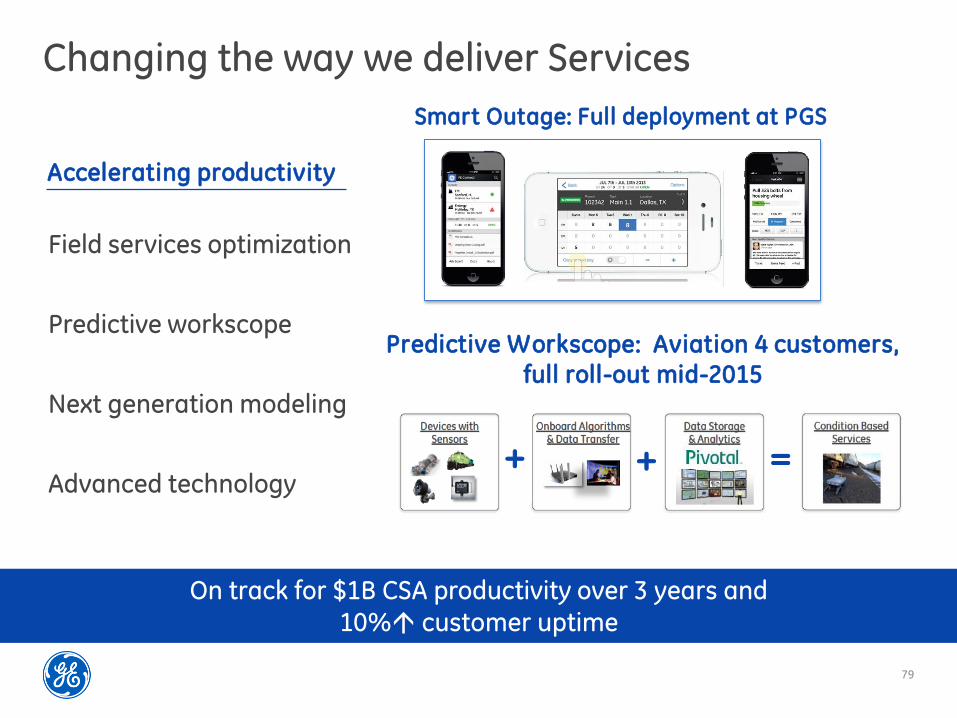
