mindyourprivacy: design and implementation of a visualization system for third-party web tracking
TRANSCRIPT

IEEE, 12th Annual Conference on Privacy Security Trust, PST 2014
MindYourPrivacy: Design and Implementation of a Visualization System for Third-Party Web Tracking
Yuuki Takano, Satoshi Ohta, Takeshi Takahashi, Ruo Ando, Tomoya Inoue
1

Introduction❖ The number of third-party Web tracking is growing each year.!
❖ online privacy is now significant issue!
❖ SNSs and targeted ads can associate real names of individuals with tracking information!
❖ Propose MindYourPrivacy to visualize and show third-party web tracking.!
❖ deep-packet-inspection based architecture!
❖ to support heterogeneous browsers and devices!
❖ Experimented MindYourPrivacy at the Workshop (WIDE Camp 2014 Autumn in JAPAN), which has 129 attendees.!
❖ reveal that clustering web graph helps to detect ads’ sites by analyzing user traffic!
❖ some graph theory features also help to heuristically detect ads sites
2

Related Work Web Tracking Mechanism
❖ Third-party Web tracker typically tracks by cookie, Etags or flash storage
web bug (1x1 pict)adssocial widgets
First-party Web servers
Third-party Web tracker
tracking id (cookie, Etags, flash storage, etc...)
contents
contents
3
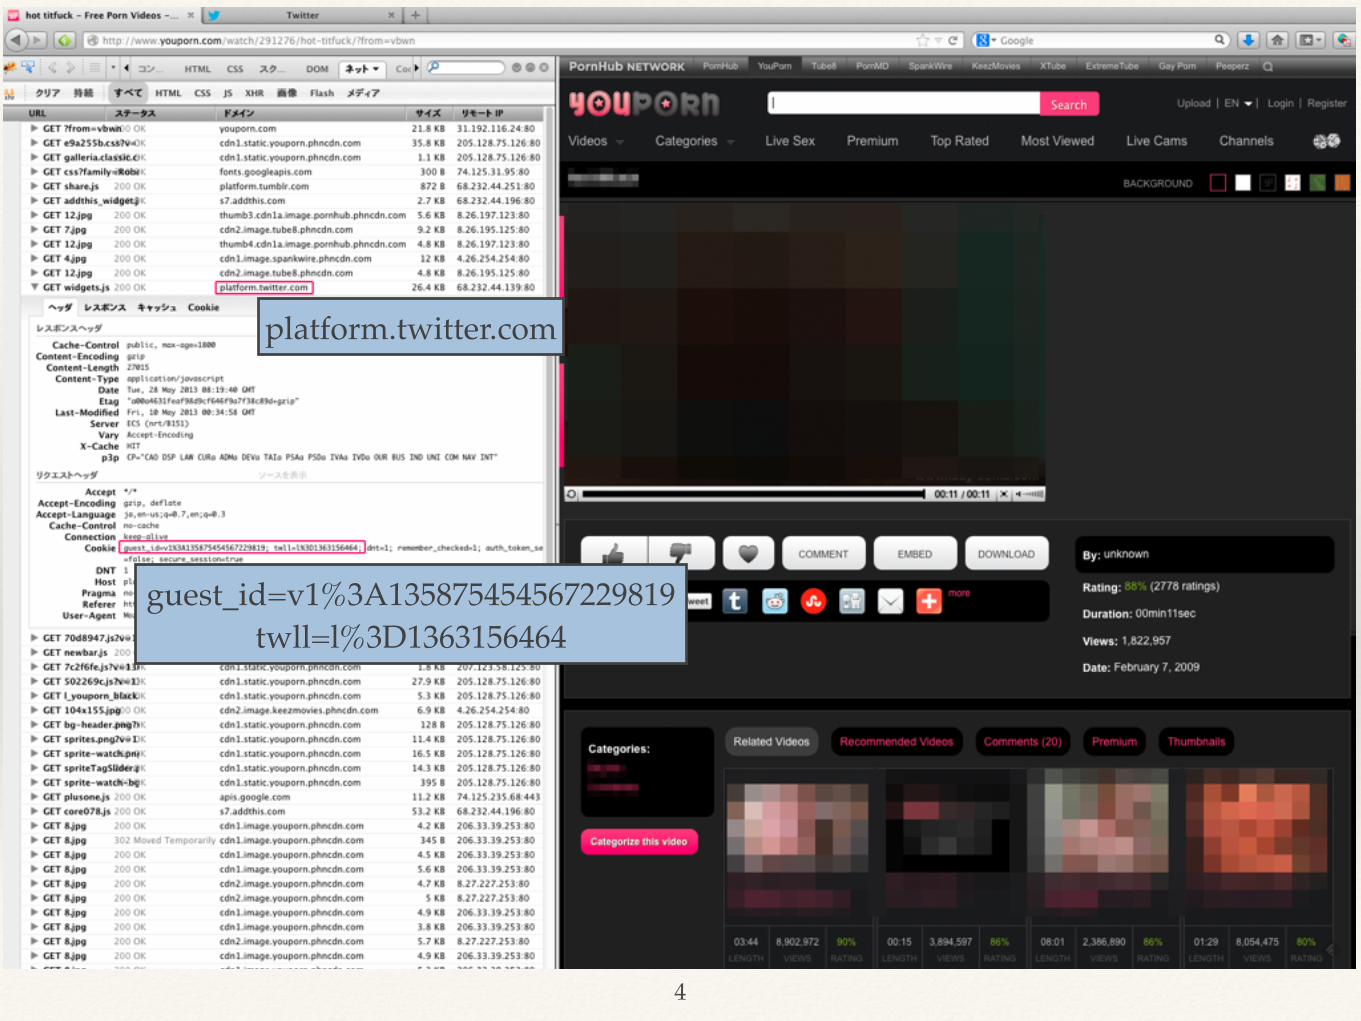
platform.twitter.com
guest_id=v1%3A135875454567229819!twll=l%3D1363156464
4
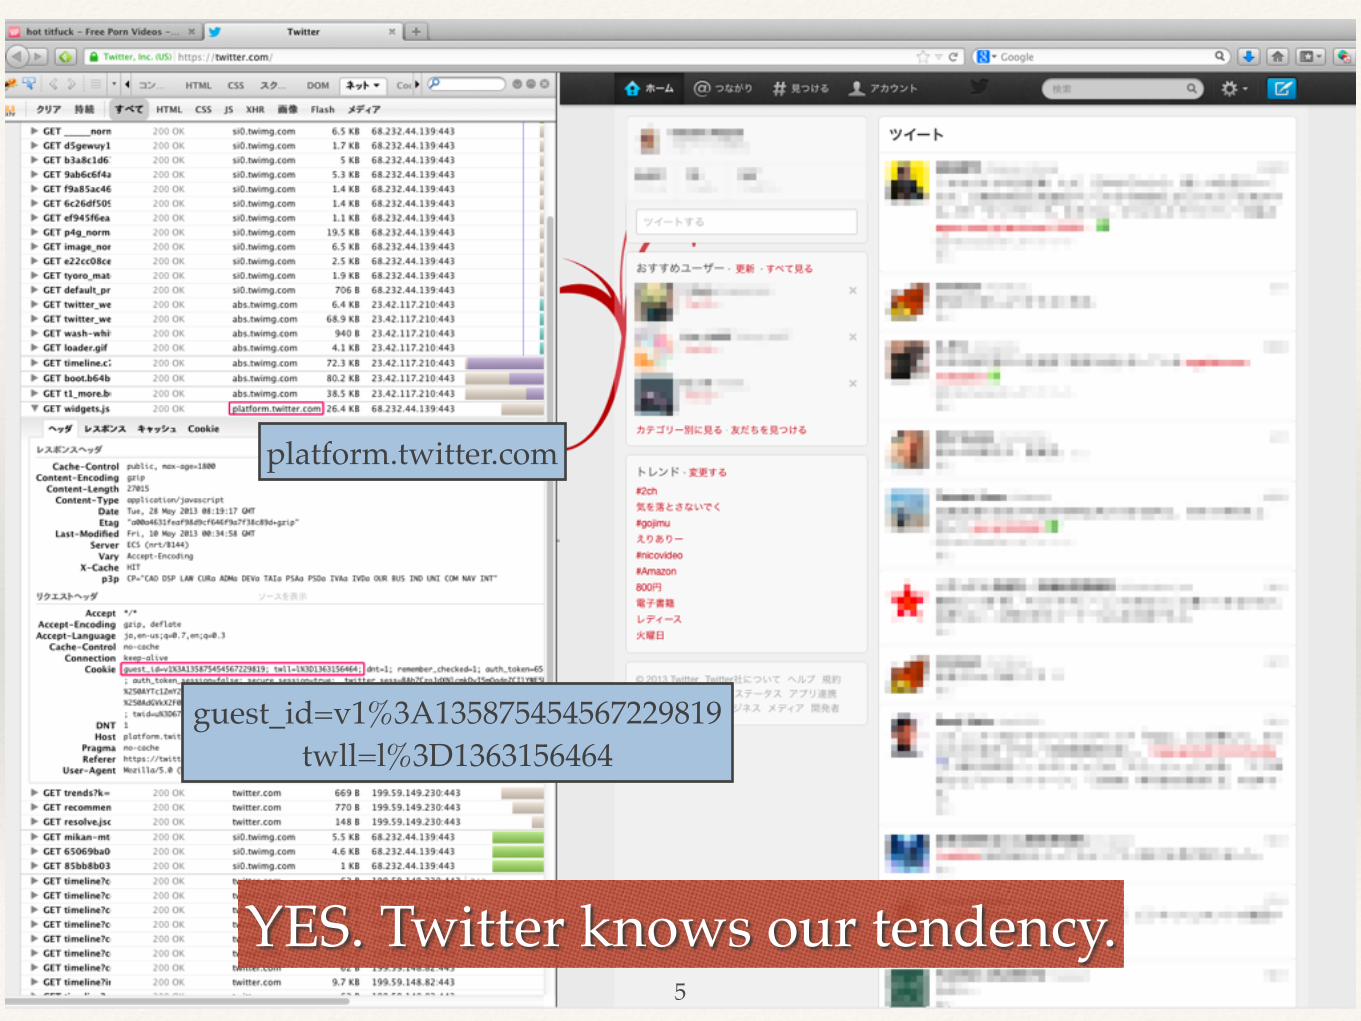
platform.twitter.com
guest_id=v1%3A135875454567229819!twll=l%3D1363156464
YES. Twitter knows our tendency.5

Related Work Web Tracking Detection Techniques
❖ ShareMeNot!
❖ swap a link to known data-collection sites such as Facebook!
❖ Roesner et al. “Detecting and defending against third-party tracking on the web”, USENIX NSDI 2012!
❖ Lightbeam!
❖ visualize web graph between first and third-party sites!
❖ https://www.mozilla.org/lightbeam/!
❖ AdBlock Plus!
❖ signature based ads detection and blocking!
❖ https://adblockplus.org/en/firefox
6

Related Work Measurements
❖ Several researchers reported on third party web tracker.!
❖ One of the research reported third-party trackers within Alexa’s top 500 domains.!
❖ Roesner et al, “Detecting and defending against third-party tracking on the web”, USENIX NSDI 2012!
observation is further evidence of the fact that the trackingecosystem is complicated and that it is thus difficult tocreate simple, sweeping technical or policy solutions.Robustness. We stress that this classification is ag-nostic of the practical manifestation of the mechanismsdescribed above — that is, client-side storage may be donevia cookies or any other mechanism, and information maybe communicated back to the tracker in any way. Thisseparation of semantics from mechanism makes the clas-sification robust in the face of the evolution of specificclient-side storage techniques used by trackers.
4 Detecting TrackersBased on this classification framework, we created atool — TrackingTracker — that automatically classifiestrackers according to behavior observed on the client-side.TrackingTracker runs as a Firefox add-on, interposeson all HTTP(S) requests, and examines conventionalcookies, HTML5 Local Storage, and Flash LSOs to detectand categorize trackers. It has support for crawling a listof websites to an arbitrary link depth and for performing aseries of search engine keyword searches and visiting thetop hit of the returned search results. We used this toolto perform a series of analyses between September andOctober of 2011; unless otherwise noted, our discussionreflects only behaviors observed during that time.
In presenting the results of these measurements,we make a distinction between pages and domains.Two pages may belong to the same domain (e.g.,www.cnn.com/article1 and www.cnn.com/article2).Which we use depends on whether we are interested inthe characteristics of websites (domains) or in specificinstances of tracking behavior (pages).
Note that the tracking behavior that we observe in ourmeasurements is a lower bound, for several reasons. First,we do not log into any sites or click any ads or socialwidgets, which we have observed in small case studiesto occasionally trigger additional tracking behavior.Second, we have observed that tracking behavior can benondeterministic, largely due to the interplay of BehaviorB (Vanilla) and Behavior D (Referred) trackers; wegenerally visit pages only twice (see below), which maynot trigger all trackers embedded by a given website.
Finally, the mere presence of a cookie (or other storageitem) does not by itself give a tracker the ability to create abrowsing profile — the storage item must contain a uniqueidentifier. It is difficult or impossible to identify uniqueidentifiers with complete certainty (we do not reverse-engineer cookie strings), but we identify and remove anysuspected trackers whose cookies or other storage containidentical values across multiple measurements that startedwith a clean browser. We also remove trackers that onlyuse session cookies, though we note that these can equallybe used for tracking as long as the browser remains open.
Figure 6: Prevalence of Trackers on Top 500 Domains.Trackers are counted on domains, i.e., if a particular trackerappears on two pages of a domain, it is counted once.
4.1 Tracking on Popular SitesWe collected a data set using the top 500 websites (inter-national) from Alexa as published on September 19, 2011.We also visited four random links on each of the 500 sitesthat stayed within that site’s domain. We visited and an-alyzed a total of 2098 unique pages for this data set; wedid not visit a full 2500 unique pages because some web-sites do not have four within-domain links, some links arebroken or redirect to other domains or to the same page,etc. This process was repeated twice: once starting with aclean browser, and once more after priming the cache andcookie database (i.e., without first clearing browser state).This experimental design aims to ensure that trackers thatmay only set but not read state the first time they are en-countered are properly accounted for by TrackingTrackeron the second run. The results we report include trackingbehavior measured only on the second run.
Most of the 2098 pages (500 domains) embed trackers,often several. Indeed, the average number of trackers onthe 1655 pages (457 domains) that embed at least onetracker is over 4.5 (over 7). Of these, 1469 pages (445domains) include at least one cross-site tracker.
Overall, we found a total of 524 unique trackersappearing a cumulative 7264 times. Figure 6 shows thetwenty top trackers across the 500 top domains. Thisgraph considers websites as domains — that is, if a giventracker was encountered on two pages of a domain, itis only counted once in this graph. The most prevalenttracker is Google Analytics, appearing on almost 300 ofthe 500 domains — recall that it is a within-site tracker,meaning that it cannot link users’ visits across thesepages using cookies. The most popular cross-site trackerthat users don’t otherwise visit directly is Doubleclick(also owned by Google), which can track users acrossalmost 40% of the 500 most popular sites. The mostpopular Behavior E tracker (domains that are themselvesin the top 500) is Facebook, followed closely by Google,both of which are found on almost 30% of the top sites.
Top 20 Trackers on Alexa’s Top 500 Domains![Roesner et al. NSDI 2012]
7

MindYourPrivacy Design Principle
❖ We designed and implemented a visualization system for third-party web tracking called MindYourPrivacy.!
❖ To clearly show third-party web trackers to users.!
❖ Design Principles of MindYourPrivacy!
❖ Independence from browsers and devices!
❖ the existence of various OSes or devices such as Linux, Windows, MacOS, and smartphone OSes such as Android and iOS complicates the problem!
❖ adopt a deep-packet-inspection based approach to support heterogeneous browsers and devices!
❖ Accessibility and comprehensiveness of the analysis results!
❖ easy to access: MindYourPrivacy provides analysis results in the form of an HTML file via an HTTP server to facilitate users’ access to them!
❖ easy to understand: visualize trackers by tag cloud fashion, and provide web graph’s file further analysis
8

Design and Implementation Web Tracker Identification Methodology (1)
❖ HTTP Referrer Web Graph Analysis!
❖ generate a web graph by using HTTP referrer tag!
❖ if an site is referred by many other sites, MindYourPrivacy assumes that it is a suspicious site tracking users!
❖ Domain Aggregation!
❖ to show users which organizations track them, MindYourPrivacy aggregates domains as either second or third level!
❖ platform.twitter.com and platform0.twitter.com are aggregated to twitter.com
9
Design and Implementation Web Tracker Identification Methodology (2)
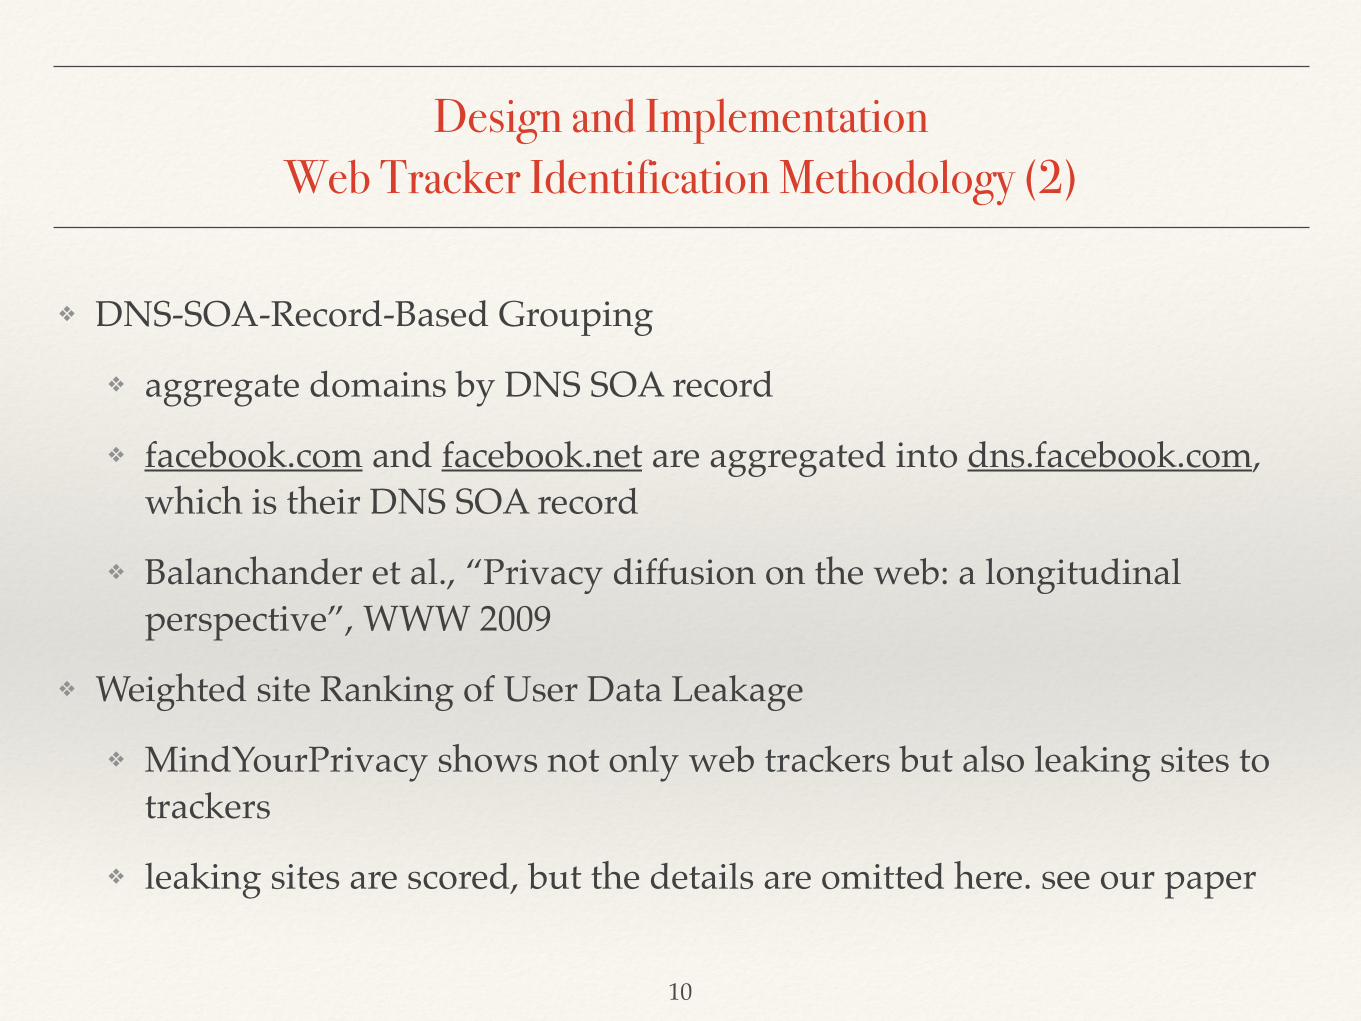
❖ DNS-SOA-Record-Based Grouping!
❖ aggregate domains by DNS SOA record!
❖ facebook.com and facebook.net are aggregated into dns.facebook.com, which is their DNS SOA record!
❖ Balanchander et al., “Privacy diffusion on the web: a longitudinal perspective”, WWW 2009!
❖ Weighted site Ranking of User Data Leakage!
❖ MindYourPrivacy shows not only web trackers but also leaking sites to trackers!
❖ leaking sites are scored, but the details are omitted here. see our paper
10

Design and Implementation System Model
❖ MindYourPrivacy captures traffic of users’ web access!
❖ show analyzed results via MindYourPrivacy’s web server!
❖ users need not install or configure specific applications
MindYourPrivacy
The InternetTraffic Capture
Web Access
Analyzed Result via HTTP
Outgoing Traffic
Router・・・
Users
11

Design and Implementation Implementation Architecture
❖ Catenaccio DPI!
❖ capture traffic from network IF!
❖ reconstruct TCP stream and store captured data into NoSQL DB!
❖ written in C++!
❖ NoSQL DB!
❖ use MongoDB as a database!
❖ Tracking Analyzer!
❖ analyze measurement data!
❖ written in JavaScript and Python!
❖ HTML/Graph File Generator!
❖ generate visualized results!
❖ written in Python!
❖ HTML Server!
❖ serve HTML/Graph files to users
Catenaccio DPI NoSQL DB
Tracking Analyzer HTML/Graph FileGenerator
HTML Server
NW/IF
L2 DatagramMeasurement Data
Analyzed Result
Measurement Data
HTML/Graph Files
Analyzing Result
12

Design and Implementation Web User Interface
❖ visualize suspicious web trackers as tag cloud fashion!
❖ domains are grouped by DNS SOA records!
❖ referring sites are shown in right pane

Experiment at WIDE Camp 2013 Autumn
❖ We experimented MindYourPrivacy at WIDE camp 2013 autumn.!
❖ WIDE Camp 2013 Autumn (Sep. 10 - Sep. 13)!
❖ a workshop for Internet researchers, operators and developers!
❖ 129 attendees, most of whom are either IT specialists or students majoring IT!
❖ the experiment is agreed by every attendees (for only research purpose)!
❖ We captured the attendees’ web browsing traffic and analyzed.
14

Experiment User Traffic Analysis (1)
❖ Obtained 734,194 HTTP requests and 1,661 individual source IP addresses (IPv4 and IPv6).!
❖ A directed web graph is generated by using HTTP referrer header.!
❖ There are 3,966 nodes and 12,941 edges.!
❖ Analyze this web graph to find web trackers.
15

Experiment User Traffic Analysis (2)
❖ To find web trackers, we extract top most-referred sites from the web graph!
❖ Advertisements and social sites, which tend to track users, have many incoming links.
TABLE I: WIDE Camp (2013 Autumn) Attendees
Working Adult Student TotalMale 78 39 117
Female 1 11 12Total 79 50 129
not operated by the same organization. These URLs are onlyoperated on Amazon’s hosting service.
Displayed URLs are clickable, and details of a URL areshown in the upper-right area of the Web user inerface.The area shows sites referring to the URL in clicked andaggregated URLs. In Figure 1, for example, facebook.comis referred by coreblog.org, cyberciti.biz, etc., andstatic.ak.facebook.com, www.facebook.com, etc. areaggregated to facebook.com.
2) Sites Referring Most-referred URLs Pane: This paneshows which sites definitely leak user browsing data to track-ing sites. The leaking sites are listed using the notation of theweighted score of data leakage discussed in Section III-B. InFigure 1, for example, livedoor.jp’s leakage score is 4.34because it is denoted as “livedoor.jp(4.34).”
These displayed URLs are also clickable. Users can obtainmore detailed information on URLs—referring sites, DNSSOA RNAME, and aggregated URLs—and this is shown atthe lower-right area of the Web user inerface. For example,through Figure 1, one can learn that livedoor.jp’s DNSSOA RNAME is hostmaster.data-hotel.net, it refers2-d.jp, 2ch.net, etc., and parts.blog.livedoor.jp,image.profile.livedoor.jp, and blog.livedoor.jp areaggregated to livedoor.jp.
3) HTTP-referred Graph Pane: This pane provides referredgraph files in .dot and .sif formats. Users can download thesefiles from here and analyze or visualize the referred graph byusing Graphviz, Cytoscape, etc. Figures 5 and Figure 6 showvisualization examples using Cytoscape. Through this sort ofvisualization users can easily find to which sites many othersites refer.
IV. Experiment
To demonstrate the usability and effectiveness of the pro-posed system, we conducted an experiment at WIDE campheld during September 10–13 2013.
A. Setup
The WIDE project [19] is a research and developmentproject in Japan aimed at developing a widely integrateddistributed environment. It organizes camps every spring andautumn, with many researchers, developers, and students tak-ing part and discussing Internet technologies. Table I lists thebreakdown of the camp attendees. There were 129 attendees,most of whom are either IT specialists or students majoring inIT. We have conducted two types of experiments: user trafficanalysis and questionnaire-based use analysis.
TABLE II: Top-five Most-referred Sites
Site # of incoming linksgoogle-analytics.com 847
facebook.com 437twitter.com 393
doubleclick.net 380google.com 356
B. User Traffic Analysis
We captured all the attendee’s network traffic, with whichwe analyzed cookie and ad sites. Figure 5 shows the over-all HTTP referrer graph generated by MindYourPrivacy andCytoscape. The graph has a total of 3,966 nodes and 12,941edges. In this experiment, we obtained 734,194 HTTP requestsand 1,661 individual source IP addresses including IPv4 andIPv6. We observed only 40,650 (40, 650/734, 194 ≈ 6%) DoNot Track–flag enabled HTTP requests. Although modern Webbrowsers provide users with a Do Not Track option, almostno one uses it.
Table II lists the top-five most-referred sites in Figure 5of the HTTP referrer graph. From this table, we found thatGoogleAnalytics, Google’s Web site analyzer, has the largestnumber of incoming links, and SNSs, such as Facebook,Twitter, and Google+, and DoubleClick, Google’s ad site, havemany incoming links.
We then analyzed the cookies of Twitter and Face-book, the most popular SNSs. platform.twitter.com andwww.facebook.com are used for Web widgets (“Tweet” and“Like” buttons). Table III lists suspected tracking cookies,whose values are random text strings, the number of cookievalues we observed, and examples. In total we observed2,309 and 2,671 requests for platform.twitter.com andwww.facebook.com, respectively. However, we found onlyabout 100 unique values for each cookie, though fr ofwww.facebook.com is 397. fr thus does not seem to betracking cookies, and the 100 likely indicates the number ofattendees (which was also around 100) or devices. The resultsreveal that tracking cookies can also be used for per-useranalysis and visualization.
We then applied MCODE clustering [20] to the graph inFigure 5 to find further features. This allowed us to observemany ad sites clustered into the rank 1 cluster by MCODE.The following domains were ad sites found in the rank 1cluster of Figure 6:
doubleclick.net, amazon-adsystem.com,googleadservices.com, i-mobile.co.jp,advg.jp, adingo.jp, iogous.com, admeld.com,criteo.com.
Ad sites generally tend to collect user information for businesspurposes. We therefore should be concerned with the privacyissues they present. This discovery should help further analysisand visualization concerning such sites. Table IV lists thefeature vector of ads and other sites that appeared in Figure 6.
16
Top-Five Most-referred Sites

Experiment User Traffic Analysis (3)
❖ We then adopted a clustering technique (M-CODE) to the web graph.!
❖ As a result of clustering, many ad-sites are found in cluster.
TABLE I: WIDE Camp (2013 Autumn) Attendees
Working Adult Student TotalMale 78 39 117
Female 1 11 12Total 79 50 129
not operated by the same organization. These URLs are onlyoperated on Amazon’s hosting service.
Displayed URLs are clickable, and details of a URL areshown in the upper-right area of the Web user inerface.The area shows sites referring to the URL in clicked andaggregated URLs. In Figure 1, for example, facebook.comis referred by coreblog.org, cyberciti.biz, etc., andstatic.ak.facebook.com, www.facebook.com, etc. areaggregated to facebook.com.
2) Sites Referring Most-referred URLs Pane: This paneshows which sites definitely leak user browsing data to track-ing sites. The leaking sites are listed using the notation of theweighted score of data leakage discussed in Section III-B. InFigure 1, for example, livedoor.jp’s leakage score is 4.34because it is denoted as “livedoor.jp(4.34).”
These displayed URLs are also clickable. Users can obtainmore detailed information on URLs—referring sites, DNSSOA RNAME, and aggregated URLs—and this is shown atthe lower-right area of the Web user inerface. For example,through Figure 1, one can learn that livedoor.jp’s DNSSOA RNAME is hostmaster.data-hotel.net, it refers2-d.jp, 2ch.net, etc., and parts.blog.livedoor.jp,image.profile.livedoor.jp, and blog.livedoor.jp areaggregated to livedoor.jp.
3) HTTP-referred Graph Pane: This pane provides referredgraph files in .dot and .sif formats. Users can download thesefiles from here and analyze or visualize the referred graph byusing Graphviz, Cytoscape, etc. Figures 5 and Figure 6 showvisualization examples using Cytoscape. Through this sort ofvisualization users can easily find to which sites many othersites refer.
IV. Experiment
To demonstrate the usability and effectiveness of the pro-posed system, we conducted an experiment at WIDE campheld during September 10–13 2013.
A. Setup
The WIDE project [19] is a research and developmentproject in Japan aimed at developing a widely integrateddistributed environment. It organizes camps every spring andautumn, with many researchers, developers, and students tak-ing part and discussing Internet technologies. Table I lists thebreakdown of the camp attendees. There were 129 attendees,most of whom are either IT specialists or students majoring inIT. We have conducted two types of experiments: user trafficanalysis and questionnaire-based use analysis.
TABLE II: Top-five Most-referred Sites
Site # of incoming linksgoogle-analytics.com 847
facebook.com 437twitter.com 393
doubleclick.net 380google.com 356
B. User Traffic Analysis
We captured all the attendee’s network traffic, with whichwe analyzed cookie and ad sites. Figure 5 shows the over-all HTTP referrer graph generated by MindYourPrivacy andCytoscape. The graph has a total of 3,966 nodes and 12,941edges. In this experiment, we obtained 734,194 HTTP requestsand 1,661 individual source IP addresses including IPv4 andIPv6. We observed only 40,650 (40, 650/734, 194 ≈ 6%) DoNot Track–flag enabled HTTP requests. Although modern Webbrowsers provide users with a Do Not Track option, almostno one uses it.
Table II lists the top-five most-referred sites in Figure 5of the HTTP referrer graph. From this table, we found thatGoogleAnalytics, Google’s Web site analyzer, has the largestnumber of incoming links, and SNSs, such as Facebook,Twitter, and Google+, and DoubleClick, Google’s ad site, havemany incoming links.
We then analyzed the cookies of Twitter and Face-book, the most popular SNSs. platform.twitter.com andwww.facebook.com are used for Web widgets (“Tweet” and“Like” buttons). Table III lists suspected tracking cookies,whose values are random text strings, the number of cookievalues we observed, and examples. In total we observed2,309 and 2,671 requests for platform.twitter.com andwww.facebook.com, respectively. However, we found onlyabout 100 unique values for each cookie, though fr ofwww.facebook.com is 397. fr thus does not seem to betracking cookies, and the 100 likely indicates the number ofattendees (which was also around 100) or devices. The resultsreveal that tracking cookies can also be used for per-useranalysis and visualization.
We then applied MCODE clustering [20] to the graph inFigure 5 to find further features. This allowed us to observemany ad sites clustered into the rank 1 cluster by MCODE.The following domains were ad sites found in the rank 1cluster of Figure 6:
doubleclick.net, amazon-adsystem.com,googleadservices.com, i-mobile.co.jp,advg.jp, adingo.jp, iogous.com, admeld.com,criteo.com.
Ad sites generally tend to collect user information for businesspurposes. We therefore should be concerned with the privacyissues they present. This discovery should help further analysisand visualization concerning such sites. Table IV lists thefeature vector of ads and other sites that appeared in Figure 6.
ad-sites in cluster
17

Experiment User Traffic Analysis (4)
❖ We analyzed the cluster from the aspect of graph theory’s feature.!
❖ As a result of that, we found that ad-sites’ #incoming links, #outgoing links and neighborhood connectivity are quite different from others.!
❖ ad-sites have many incoming links, but few outgoing links!
❖ ad-sites’ neighborhood connectivity is relatively low
18
TABLE III: SNS Cookies
Site Cookie # Value exampleplatform.twitter.com twll 96 l%3D1331765309
l%3D1333118000l%3D1335671305
guest id 141 v1%3A131651075276670565v1%3A131721129117754955v1%3A132349265936441847
www.facebook.com fr 397 00cR2iyYceFlIPB2P.AWUGBBr8MhcaIM4BALQwG5kdLao.BQ-hz2.kK.FIv.AWU0lIEH00cR2iyYceFlIPB2P.AWUSiuGBHhqaESzfy63moRc4g3M.BQ-hz2.kK.FId.AWUXHGm300cR2iyYceFlIPB2P.AWUjl0ipaMJZ9NE rdSUtbIPc88.BQ-hz2.kK.FIv.AWUTqwp6
datr 130 1-scUgBUZkbTHDd73b op-M614UlUmdprx8ANvJbAdiIkIQT19 CUe7FcK5cGowt6ArJOWjC
lu 118 RA0Irow8ICRZYIYPWOWwkHtARAEOvoS3QYv1w5LmXwBruB9gRAGC-6X5oD2AuhtcpU2SvQPw
Fig. 6: Rank 1 Cluster by MCODE (include loops = false,degree cutoff = 2, haircut = true, fluff = false, node scorecutoff = 0.2, k-core = 2, and max. depth = 100)
TABLE IV: Feature Vector of Rank 1 Cluster’s Edge (Averageand Unbiased Variance)
#incoming links # of outgoinglinks
Neighborhoodconnectivity
avg. var. avg. var. avg. var.ad sites 90.2 12405.4 15.2 3972.9 46.0 3972.9others 30.2 3972.9 29.7 569.3 130.2 5212.0
measures, and the most popular measure is to use multiplebrowsers. Although multiple browser usage does not strictlyprevent user privacy leaking to trackers, critical privacy leak-age will be avoided. A DNT (Do Not Track) flag [22] indicatesusers’ intention of tracking to Websites, but only seven peopleuse this. We consider that this is because of the fact that
TABLE V: Answers to Question 2 (Multiple Choices Allowed)
Question # %No 30 53.6Use multiple browsers 16 28.6Enable Do Not Track flag 7 12.5Do not use SNSs 1 1.8Disable HTTP referrers 1 1.8Disable HTTP cookies 2 3.6
the DNT flag is not a technological way of restricting Webtracking; it is just a guideline. Only three people disable HTTPreferrers or cookies. This is likely because doing so decreasesonline usability. We then observed that only one person doesnot use SNSs. This reveals that SNSs are now a major formof infrastructure. We therefore need to seriously address thepros and cons of SNSs.
The free-form text answers were summarized as follows:• Use private browsing mode• Delete HTTP cookies frequently• Use AdBlock plug-in• Absolutely do not mind tracking
Modern Web browsers provide users with a private browsingmode to isolate the browsing environment. Some attendeesresponded that they use this to avoid critical privacy leakages.Some of them frequently delete HTTP cookies. The reasonfor not disabling HTTP cookies is likely a usability problem.Some attendees also use AdBlock, a browser plug-in thatblocks online ads but this does not prevent users from privacyleakage through SNSs. Unlike in previous answers, someattendees answered that they absolutely do not mind Webtracking. Such an answer reconfirmed that feelings towardprivacy are quite different among individuals.
Question 3: Did you change your mind about Web trackingafter seeing the experiment?: The final question was aboutuser perception of Web tracking before and after the exper-iment. Table VI lists the answers to this question. Unfortu-nately, seven attendees did not see our experiment. We assumethat they had no interest in Web tracking. Eight attendees also

Experiment User Traffic Analysis (5)
❖ Do Not Track flag is used to announce a wish of users to third-party trackers.!
❖ However only 40,650 (40,605/734,194 = 6 %) DNT enabled requests are observed.
19

Conclusion and Future Work❖ Proposed a visualization system for third-party web tracking called
MindYourPrivacy.!
❖ browser and device independent architecture!
❖ visualize web trackers as tag cloud fashion!
❖ Experimented MindYourPrivacy at WIDE camp 2013 autumn and analyze users’ web browsing traffic.!
❖ generate web graph by HTTP referrer and analyze it!
❖ revealed that graph clustering and some graph theory’s features are useful to find web trackers!
❖ Adopting more sophisticated approaches we revealed at the experiment, and signature based approach is a future work.
20

EOF
21