mineral commodity summaries 2012
TRANSCRIPT
MINERAL COMMODITY SUMMARIES 2012

U.S. Department of the Interior U.S. Geological Survey
MINERAL COMMODITY SUMMARIES 2012 Abrasives Fluorspar Mercury SilverAluminum Gallium Mica Soda Ash Antimony Garnet Molybdenum Sodium Sulfate Arsenic Gemstones Nickel StoneAsbestos Germanium Niobium Strontium Barite Gold Nitrogen SulfurBauxite Graphite Peat TalcBeryllium Gypsum Perlite Tantalum Bismuth Hafnium Phosphate Rock Tellurium Boron Helium Platinum ThalliumBromine Indium Potash ThoriumCadmium Iodine Pumice TinCement Iron and Steel Quartz Crystal TitaniumCesium Iron Ore Rare Earths Tungsten Chromium Iron Oxide Pigments Rhenium Vanadium Clays Kyanite Rubidium Vermiculite Cobalt Lead Salt Wollastonite Copper Lime Sand and Gravel YttriumDiamond Lithium Scandium ZeolitesDiatomite Magnesium Selenium ZincFeldspar Manganese Silicon Zirconium

U.S. Department of the Interior KEN SALAZAR, Secretary U.S. Geological Survey Marcia K. McNutt, Director U.S. Geological Survey, Reston, Virginia: 2012
Manuscript approved for publication January 24, 2012.
For more information on the USGS—the Federal source for science about the Earth, its natural and living resources, natural hazards, and the environment— visit http://www.usgs.gov or call 1–888–ASK–USGS.
For an overview of USGS information products, including maps, imagery, and publications, visit http://www.usgs.gov/pubprod
For sale by the Superintendent of Documents, U.S. Government Printing Office Mail: Stop IDCC; Washington, DC 20402–0001 Phone: (866) 512–1800 (toll-free); (202) 512–1800 (DC area) Fax: (202) 512–2104 Internet: bookstore.gpo.gov
Any use of trade, product, or firm names is for descriptive purposes only and does not imply endorsement by the U.S. Government.
Although this report is in the public domain, permission must be secured from the individual copyright owners to reproduce any copyrighted material contained within this report.
Suggested citation: U.S. Geological Survey, 2012, Mineral commodity summaries 2012: U.S. Geological Survey, 198 p.
ISBN 978–1–4113–3349–9

1
CONTENTS Page General:
Page
Introduction .................................................................... 3 Growth Rates of Leading and Coincident Indexes for
Mineral Products ......................................................... 4 The Role of Nonfuel Minerals in the U.S. Economy ...... 5 2011 U.S. Net Import Reliance for Selected Nonfuel
Mineral Materials ........................................................ 6
Significant Events, Trends, and Issues .......................... 7 Appendix A—Abbreviations and Units of Measure .... 192 Appendix B—Definitions of Selected Terms Used in This Report .............................................................. 192 Appendix C—Reserves and Resources ..................... 193 Appendix D—Country Specialists Directory ............... 197
Mineral Commodities:
Abrasives (Manufactured) ............................................ 14 Aluminum ..................................................................... 16 Antimony ...................................................................... 18 Arsenic ......................................................................... 20 Asbestos ...................................................................... 22 Barite ............................................................................ 24 Bauxite and Alumina .................................................... 26 Beryllium ...................................................................... 28 Bismuth ........................................................................ 30 Boron ............................................................................ 32 Bromine ........................................................................ 34 Cadmium ...................................................................... 36 Cement......................................................................... 38 Cesium ......................................................................... 40 Chromium..................................................................... 42 Clays ............................................................................ 44 Cobalt ........................................................................... 46 Copper ......................................................................... 48 Diamond (Industrial) ..................................................... 50 Diatomite ...................................................................... 52 Feldspar ....................................................................... 54 Fluorspar ...................................................................... 56 Gallium ......................................................................... 58 Garnet (Industrial) ........................................................ 60 Gemstones ................................................................... 62 Germanium .................................................................. 64 Gold .............................................................................. 66 Graphite (Natural) ........................................................ 68 Gypsum ........................................................................ 70 Helium .......................................................................... 72 Indium .......................................................................... 74 Iodine ........................................................................... 76 Iron and Steel ............................................................... 78 Iron and Steel Scrap .................................................... 80 Iron and Steel Slag ...................................................... 82 Iron Ore ........................................................................ 84 Iron Oxide Pigments .................................................... 86 Kyanite and Related Materials ..................................... 88 Lead ............................................................................. 90 Lime ............................................................................. 92 Lithium.......................................................................... 94 Magnesium Compounds .............................................. 96 Magnesium Metal ......................................................... 98 Manganese ................................................................ 100 Mercury ...................................................................... 102
Mica (Natural) ............................................................. 104 Molybdenum ............................................................... 106 Nickel .......................................................................... 108 Niobium (Columbium) ................................................. 110 Nitrogen (Fixed), Ammonia ........................................ 112 Peat ............................................................................ 114 Perlite ......................................................................... 116 Phosphate Rock ......................................................... 118 Platinum-Group Metals ............................................... 120 Potash ........................................................................ 122 Pumice and Pumicite .................................................. 124 Quartz Crystal (Industrial) .......................................... 126 Rare Earths ................................................................ 128 Rhenium ..................................................................... 130 Rubidium .................................................................... 132 Salt ............................................................................. 134 Sand and Gravel (Construction) ................................. 136 Sand and Gravel (Industrial) ...................................... 138 Scandium .................................................................... 140 Selenium ..................................................................... 142 Silicon ......................................................................... 144 Silver ........................................................................... 146 Soda Ash .................................................................... 148 Sodium Sulfate ........................................................... 150 Stone (Crushed) ......................................................... 152 Stone (Dimension) ...................................................... 154 Strontium .................................................................... 156 Sulfur .......................................................................... 158 Talc and Pyrophyllite .................................................. 160 Tantalum ..................................................................... 162 Tellurium ..................................................................... 164 Thallium ...................................................................... 166 Thorium ...................................................................... 168 Tin ............................................................................... 170 Titanium and Titanium Dioxide ................................... 172 Titanium Mineral Concentrates .................................. 174 Tungsten ..................................................................... 176 Vanadium ................................................................... 178 Vermiculite .................................................................. 180 Wollastonite ................................................................ 182 Yttrium ........................................................................ 184 Zeolites (Natural) ........................................................ 186 Zinc ............................................................................. 188 Zirconium and Hafnium .............................................. 190

2
INSTANT INFORMATION Information about the U.S. Geological Survey, its programs, staff, and products is available from the Internet at <http://www.usgs.gov> or by contacting the Earth Science Information Center at (888) ASK-USGS [(888) 275-8747]. This publication has been prepared by the National Minerals Information Center. Information about the Center and its products is available from the Internet at <http://minerals.usgs.gov/minerals> or by writing to Director, National Minerals Information Center, 988 National Center, Reston, VA 20192.
KEY PUBLICATIONS Minerals Yearbook—These annual publications review the mineral industries of the United States and of more than 180 other countries. They contain statistical data on minerals and materials and include information on economic and technical trends and developments. The three volumes that make up the Minerals Yearbook are Volume I, Metals and Minerals; Volume II, Area Reports, Domestic; and Volume III, Area Reports, International. Mineral Commodity Summaries—Published on an annual basis, this report is the earliest Government publication to furnish estimates covering nonfuel mineral industry data. Data sheets contain information on the domestic industry structure, Government programs, tariffs, and 5-year salient statistics for more than 90 individual minerals and materials. Mineral Industry Surveys—These periodic statistical and economic reports are designed to provide timely statistical data on production, distribution, stocks, and consumption of significant mineral commodities. The surveys are issued monthly, quarterly, or at other regular intervals. Metal Industry Indicators—This monthly publication analyzes and forecasts the economic health of three metal industries (primary metals, steel, and copper) using leading and coincident indexes. Nonmetallic Mineral Products Industry Indexes—This monthly publication analyzes the leading and coincident indexes for the nonmetallic mineral products industry (NAICS 327). Materials Flow Studies—These publications describe the flow of materials from source to ultimate disposition to help better understand the economy, manage the use of natural resources, and protect the environment. Recycling Reports—These materials flow studies illustrate the recycling of metal commodities and identify recycling trends. Historical Statistics for Mineral and Material Commodities in the United States (Data Series 140)—This report provides a compilation of statistics on production, trade, and use of more than 80 mineral commodities during the past 100 years.
WHERE TO OBTAIN PUBLICATIONS • Mineral Commodity Summaries and the Minerals Yearbook are sold by the U.S. Government Printing Office.
Orders are accepted over the Internet at <http://bookstore.gpo.gov>, by telephone toll free (866) 512-1800; Washington, DC area (202) 512-1800, by fax (202) 512-2104, or through the mail (P.O. Box 979050, St. Louis, MO 63197–9000).
• All current and many past publications are available in PDF format (and some are available in XLS format)
through <http://minerals.usgs.gov/minerals>.

3
INTRODUCTION Each chapter of the 2012 edition of the U.S. Geological Survey (USGS) Mineral Commodity Summaries (MCS) includes information on events, trends, and issues for each mineral commodity as well as discussions and tabular presentations on domestic industry structure, Government programs, tariffs, 5-year salient statistics, and world production and resources. The MCS is the earliest comprehensive source of 2011 mineral production data for the world. More than 90 individual minerals and materials are covered by 2-page synopses. For mineral commodities for which there is a Government stockpile, detailed information concerning the stockpile status is included in the two-page synopsis. Abbreviations and units of measure, and definitions of selected terms used in the report, are in Appendix A and Appendix B, respectively. “Appendix C—Reserves and Resources” includes “Part A—Resource/Reserve Classification for Minerals” and “Part B—Sources of Reserves Data.” A directory of USGS minerals information country specialists and their responsibilities is Appendix D. The USGS continually strives to improve the value of its publications to users. Constructive comments and suggestions by readers of the MCS 2012 are welcomed.

Sources: U.S. Geological Survey, Metal Industry Indicators and Nonmetallic Mineral Products Industry Indexes.
LEADING
COINCIDENT
The leading indexes historically give signals several months in advance of major changes in the corresponding coincident index, which measures current industry activity. The growth rates,which can be viewed as trends, are expressed as compound annual rates based on the ratio of the current month's index to its average level during the preceding 12 months.
89 90 91 92 93 94 95 96 97 98 99
30
20
10
0
-10
-20
-3030
20
10
0
-10
-20
-30
NONMETALLIC MINERAL PRODUCTS:
Percent
Percent
November
November
LEADING AND COINCIDENT GROWTH RATES, 1989–2011
Percent
Percent
89 90 91 92 93 94 95 96 97 98 99
30
20
10
0
-10
-20
-3030
20
10
0
-10
-20
-30
LEADING
COINCIDENT
November
October
PRIMARY METALS: LEADING AND COINCIDENT GROWTH RATES, 1989–2011
GROWTH RATES OF LEADINGAND COINCIDENT INDEXESFOR MINERAL PRODUCTS
0807 09 10 11
07 08 09 10 11
06
0605
05
04
0403
03
02
0201
01
00
00
4

NET EXPORTS OF MINERAL RAW MATERIALS
GOLD, SODA ASH, ZINCCONCENTRATES, ETC.
Imports: $6.9 billionExports: $9.8 billionNet exports: $2.9 billion
DOMESTIC MINERAL RAW MATERIALS FROM MINING
COPPER ORE, IRON ORE, SAND AND GRAVEL, STONE, ETC.
Value: $74.0 billion
THE ROLE OF NONFUEL MINERALS IN THE U.S. ECONOMY
(ESTIMATED VALUES IN 2011)
1 Major consuming industries of processed mineral materials are construction, durable goods manufacturers, and some nondurable goods manufacturers. The value of shipments for processed mineral materials cannot be directly related to gross domestic product.
METALS AND MINERAL PRODUCTS RECYCLEDDOMESTICALLY
ALUMINUM, GLASS, STEEL, ETC.
Value of old scrap: $32.3 billion
NET EXPORTS OF OLD SCRAP
GOLD, STEEL, ETC.
Imports: $6.3 billionExports: $35.8 billionNet exports: $29.5 billion
Sources: U.S. Geological Survey and U.S. Department of Commerce.
MINERAL MATERIALS PROCESSED DOMESTICALLY
ALUMINUM, BRICK, CEMENT, COPPER, FERTILIZERS, STEEL, ETC.
Value of shipments:$633 billion
NET IMPORTS OF PROCESSED MINERAL MATERIALS
METALS, CHEMICALS, ETC.
Imports: $149 billion Exports: $113 billionNet imports: $36 billion
VALUE ADDED TO GROSS DOMESTIC PRODUCT BY MAJORINDUSTRIES THAT CONSUME PROCESSEDMINERAL MATERIALS1
Value: $2,230 billion
U.S. ECONOMY
Gross Domestic Product: $15,100 billion
5

2011 U.S. NET IMPORT RELIANCE FOR SELECTED NONFUEL MINERAL MATERIALS
Commodity Percent ARSENIC (trioxide) 100 ASBESTOS 100 BAUXITE and ALUMINA 100 CESIUM 100 FLUORSPAR 100 GRAPHITE (natural) 100 INDIUM 100 MANGANESE 100 MICA, sheet (natural) 100 NIOBIUM (columbium) 100 QUARTZ CRYSTAL (industrial) 100 RARE EARTHS 100 RUBIDIUM 100 SCANDIUM 100 STRONTIUM 100 TANTALUM 100 THALLIUM 100 THORIUM 100 YTTRIUM 100 GALLIUM 99 IODINE 99 GEMSTONES 98 GERMANIUM 90 BISMUTH 89 DIAMOND (dust, grit and powder) 89 PLATINUM 88 ANTIMONY 87 RHENIUM 87 STONE (dimension) 85 POTASH 83 VANADIUM 80 BARITE 78 SILICON CARBIDE 76 TIN 76 COBALT 75 SILVER 75 ZINC 73 TITANIUM (sponge) 69 TITANIUM MINERAL CONCENTRATES 68 PEAT 63 CHROMIUM 60 PALLADIUM 56 MAGNESIUM COMPOUNDS 53 NICKEL 47 SILICON (ferrosilicon) 42 NITROGEN (fixed), AMMONIA 41 GARNET (industrial) 39 GOLD 36 TUNGSTEN 36 COPPER 35 MAGNESIUM METAL 35 PERLITE 27 SULFUR 24 SALT 22 BERYLLIUM 21 MICA, scrap and flake (natural) 20 VERMICULITE 20 ALUMINUM 13 GYPSUM 13 PHOSPHATE ROCK 13 IRON and STEEL 9 IRON and STEEL SLAG 8 CEMENT 6 PUMICE 5 DIAMOND (natural industrial stone) 3 LIME 1 STONE (crushed) 1
Major Import Sources (2007–10)1
Morocco, China, Belgium Canada, Zimbabwe Jamaica, Brazil, Guinea, Australia Canada Mexico, China, South Africa, Mongolia China, Mexico, Canada, Brazil China, Canada, Japan, Belgium South Africa, Gabon, China, Australia China, Brazil, Belgium, India Brazil, Canada, Germany, Russia China, Japan, Russia China, France, Estonia, Japan Canada China Mexico, Germany China, Germany, Kazakhstan, Australia Russia, Germany, Kazakhstan France, India, Canada, United Kingdom China, Japan, France, United Kingdom Germany, Canada, United Kingdom, China Chile, Japan Israel, India, Belgium, South Africa China, Belgium, Russia, Germany China, Belgium, United Kingdom, China, Ireland, Republic of Korea, Russia Germany, South Africa, United Kingdom, Canada China, Mexico, Belgium Chile, Netherlands, Germany Brazil, China, Italy, Turkey Canada, Belarus, Russia Rep. of Korea, Canada, Austria, Czech Republic China, India China, Brazil, Vietnam, Norway Peru, Bolivia, Indonesia, China China, Norway, Russia, Canada Mexico, Canada, Peru, Chile Canada, Peru, Mexico, Ireland Kazakhstan, Japan, China, Russia South Africa, Australia, Canada, Mozambique Canada South Africa, Kazakhstan, Russia, China Russia, South Africa, United Kingdom, Norway China, Canada, Brazil, Austria Canada, Russia, Australia, Norway China, Russia, Venezuela, Canada Trinidad and Tobago, Russia, Canada, Ukraine India, Australia, China, Canada Mexico, Canada, Colombia, Peru China, Bolivia, Canada, Germany Chile, Canada, Peru, Mexico Israel, Canada, China Greece Canada, Mexico, Venezuela Canada, Chile, Mexico, The Bahamas Russia, Kazakhstan, Japan, Russia Canada, China, India China, South Africa, Australia, Brazil Canada, Russia, China, Mexico Canada, Mexico, Spain Morocco, Peru Canada, European Union, China, Mexico Japan, Canada, South Africa, Italy Canada, China, Republic of Korea, Mexico Greece, Mexico, Iceland, Montserrat Botswana, South Africa, Russia, Namibia Canada, Mexico Canada, Mexico, The Bahamas
1In descending order of import share.
6

7
SIGNIFICANT EVENTS, TRENDS, AND ISSUES In 2011, the value of mineral production increased in the United States for the second consecutive year. Production increased modestly for most mineral commodities mined in the United States, and price increases, especially for precious metals, resulted in increases in the value of production. Minerals remained fundamental to the U.S. economy, contributing to the real gross domestic product (GDP) at several levels, including mining, processing, and manufacturing finished products. Minerals’ contribution to the GDP increased for the second consecutive year. Trends in other sectors of the domestic economy were similar to those in mineral production and consumption rates. After continued decline following the 2008–09 recession, the construction industry began to show signs of improvement during 2011, with increased production and consumption of cement, construction sand and gravel, and gypsum—mineral commodities that are used almost exclusively in construction. Crushed stone production, however, continued to decline. The figure on page 4 shows that the primary metals industry and the nonmetallic minerals products industry are intrinsically cyclical. Growth rates are directly affected by the U.S. business cycle as well as by global economic conditions. The U.S. Geological Survey (USGS) generates composite indexes to measure economic activity in these industries. The coincident composite indexes describe the current situation using production, employment, and shipments data. The leading composite indexes forecast major changes in the industry’s direction by such variables as stock prices, commodity prices, new product orders, and other indicators, which are combined into one gauge. For each of the indexes, a growth rate is calculated to measure its change relative to the previous 12 months. Although the primary metals leading index growth rate generally decreased in 2011, it ended the year high enough to indicate that the recovery in U.S. primary metals industry activity likely will continue into 2012. Growth in the manufacturing sector boosted new orders for ferrous and nonferrous metal products. The construction sector, which has not begun a sustained recovery from the 2008–09 recession, was not a major factor increasing primary metals activity. Because more than one-half of its output goes to the construction sector, the nonmetallic mineral products industry has been slower to recover than the primary metals industry. The nonmetallic mineral products leading index growth rate suggests that the recovery in the nonmetallic mineral products industry could remain slow in 2012. As shown in the figure on page 5, the estimated value of mineral raw materials produced at mines in the United States in 2011 was $74 billion, a 12% increase from $66 billion in 2010. Net exports of mineral raw materials and old scrap contributed an additional $32 billion to the U.S. economy. The domestic raw materials, along with domestically recycled materials, were used to process mineral materials worth $633 billion. These mineral materials, including aluminum, brick, copper, fertilizers,
and steel, and net imports of processed materials (worth about $36 billion) were, in turn, consumed by downstream industries with a value added of an estimated $2.2 trillion in 2011, representing about 15% of the U.S. GDP, up from 14% in 2010. The estimated value of U.S. metal mine production in 2011 was $37.1 billion, about 23% more than that of 2010. Principal contributors to the total value of metal mine production in 2010 were gold (30%), copper (27%), iron ore (16%), molybdenum (10%), and zinc (5%). Prices for domestically mined metals averaged higher. Gold prices continued to climb, reaching an alltime high of $1,881.34 per troy ounce in late August 2011. The estimated value of U.S. industrial minerals mine production in 2011 was $36.9 billion, 3% more than that of 2010. The value of industrial minerals mine production in 2011 was dominated by crushed stone (28%), cement (17%), and construction sand and gravel (16%). In general, industrial minerals prices were relatively stable, with modest price variations. Mine production of 15 mineral commodities was worth more than $1 billion each in the United States in 2011. These were gold, crushed stone, copper, iron ore (shipped), construction sand and gravel, cement, molybdenum concentrates, phosphate rock, lime, zinc, salt, clays (all types), soda ash, silver, and industrial sand and gravel, listed in decreasing order of value. The figure on page 6 illustrates the reliance of the United States on foreign sources for raw and processed mineral materials. In 2011, the supply for more than one-half of U.S. apparent consumption of 43 mineral commodities came from imports, and the United States was 100% import reliant for 19 of those. U.S. import dependence has increased significantly since 1978, the year that this information was first reported. At that time, the United States was 100% import dependent for 7 mineral commodities, and more than 50% import dependent for 25 mineral commodities. In 2011, the United States was a net exporter of 18 mineral commodities, meaning more of those domestically produced mineral commodities were exported than imported. That figure has remained relatively stable, with net exports of 18 mineral commodities in 1978. In 2011, 10 States each produced more than $2 billion worth of nonfuel mineral commodities. These States were, in descending order of value—Nevada, Arizona, Minnesota, Utah, Alaska, Florida, California, Texas, Michigan, and Missouri. The mineral production of these States accounted for 62% of the U.S. total output value (table 3). In fiscal year 2011, the Defense Logistics Agency, DLA Strategic Materials (DLA) sold $94.4 million of excess mineral materials from the National Defense Stockpile (NDS). Additional detailed information can be found in the “Government Stockpile” sections in the mineral commodity reports that follow. Under the authority of the

8
TABLE 1.—U.S. MINERAL INDUSTRY TRENDS 2007 2008 2009 2010 Total mine production (million dollars):
2011e
Metals 25,400 27,300 21,900 30,200 37,100 Industrial minerals 44,700 44,000 36,900 35,700 36,900 Coal 30,000 36,600 35,700 38,600 39,200
Employment (thousands of production workers): Coal mining 68 71 71 70 76 Metal mining 28 32 28 29 195 Industrial minerals, except fuels 82 79 73 71 2NA Chemicals and allied products 504 513 479 472 478 Stone, clay, and glass products 384 363 303 284 281 Primary metal industries 358 348 273 274 298
Average weekly earnings of production workers (dollars): Coal mining 1,052 1,138 1,250 1,365 1,405 Metal mining 1,074 1,195 1,096 2NA 2NA Industrial minerals, except fuels 870 838 807 2NA 2NA Chemicals and allied products 820 809 841 889 916 Stone, clay, and glass products 716 711 706 728 771 Primary metal industries 843 851 819 879 887
eEstimated. NA Not available. 1Metal mining and industrial minerals (except fuel), combined. 2Because of changes to U.S. Department of Labor reports, these data are no longer available. Sources: U.S. Geological Survey, U.S. Department of Energy, U.S. Department of Labor.
TABLE 2.—U.S. MINERAL-RELATED ECONOMIC TRENDS
2007 2008 2009 2010 Gross domestic product (billion dollars)
2011e 14,029 14,292 13,939 14,527 15,100
Industrial production (2007=100):
Total index 100 96 86 90 94 Manufacturing: 100 95 82 87 90
Nonmetallic mineral products 100 88 67 68 69 Primary metals: 100 100 69 83 91
Iron and steel 100 106 63 88 95 Aluminum 100 93 75 78 83 Nonferrous metals (except aluminum) 100 101 86 92 97
Chemicals 100 92 84 87 89 Mining: 100 101 96 101 107
Coal 100 102 93 94 93 Oil and gas extraction 100 101 106 110 116 Metals 100 104 90 98 105 Nonmetallic minerals 100 87 71 73 75
Capacity utilization (percent): Total industry: 81 78 69 74 77
Mining: 89 90 81 86 90 Metals 76 79 70 76 78 Nonmetallic minerals 82 74 64 70 75
Housing starts (thousands) 1,340 900 554 585 606 Light vehicle sales (thousands)1 12,200 9,720 7,520 8,620 9,760 Highway construction, value, put in place (billion dollars) 77 81 82 82 79 eEstimated. 1Excludes imports. Sources: U.S. Department of Commerce, Federal Reserve Board, Autodata Corp., and U.S. Department of Transportation.

9 Defense Production Act of 1950, the U.S. Geological Survey advises the DLA on acquisition and disposals of NDS mineral materials. At the end of the fiscal year, mineral materials valued at $1.39 billion remained in the stockpile.
In August 2008, DLA had announced plans to suspend competitive commercial offerings of six mineral commodities and reduce the sale quantities of nine additional mineral commodities for the remainder of fiscal year 2008. During fiscal year 2011, sales of iridium, niobium metal ingot, platinum, tantalum carbide powder, tin, and zinc remained suspended.
TABLE 3.—VALUE OF NONFUEL MINERAL PRODUCTION IN THE UNITED STATES AND PRINCIPAL NONFUEL MINERALS PRODUCED IN 2011p, 1
State Value
(thousands) Rank
Percent of U.S. total Principal minerals, in order of value
Alabama $964,000 22 1.30 Stone (crushed), cement (portland), lime, sand and gravel (construction), clays (common).
Alaska 3,790,000 5 5.13 Zinc, gold, silver, lead, sand and gravel (construction). Arizona 8,250,000 2 11.15 Copper, molybdenum concentrates, sand and gravel
(construction), silver, cement (portland). Arkansas 771,000 28 1.04 Bromine, stone (crushed), cement (portland), sand and gravel
(construction), lime. California 2,870,000 7 3.88 Boron minerals, sand and gravel (construction), cement
(portland), gold, stone (crushed). Colorado 1,940,000 12 2.63 Molybdenum concentrates, gold, sand and gravel (construction),
cement (portland), stone (crushed). Connecticut2 125,000 43 0.17 Stone (crushed), sand and gravel (construction), clays (common),
stone (dimension), gemstones (natural). Delaware2
7,360 50 0.01 Magnesium compounds, stone (crushed), sand and gravel
(construction), gemstones (natural). Florida 3,270,000 6 4.42 Phosphate rock, stone (crushed), cement (portland), sand and
gravel (construction), zirconium concentrates. Georgia 1,440,000 14 1.95 Clays (kaolin), stone (crushed), clays (fuller's earth), cement
(portland), sand and gravel (construction). Hawaii 94,800 46 0.13 Stone (crushed), sand and gravel (construction), gemstones
(natural). Idaho 1,290,000 17 1.74 Molybdenum concentrates, phosphate rock, silver, sand and
gravel (construction), lead. Illinois 894,000 23 1.21 Stone (crushed), sand and gravel (industrial), sand and gravel
(construction), cement (portland), tripoli. Indiana 772,000 27 1.04 Stone (crushed), cement (portland), sand and gravel
(construction), lime, cement (masonry). Iowa 565,000 32 0.76 Stone (crushed), cement (portland), sand and gravel
(construction), sand and gravel (industrial), lime. Kansas 1,180,000 18 1.60 Helium (Grade–A), salt, cement (portland), stone (crushed),
helium (crude). Kentucky 836,000 26 1.13 Stone (crushed), lime, cement (portland), sand and gravel
(construction), clays (common). Louisiana 498,000 34 0.67 Salt, sand and gravel (construction), stone (crushed), sand and
gravel (industrial), lime. Maine2 94,200 47 0.13 Sand and gravel (construction), cement (portland), stone
(crushed), stone (dimension), cement (masonry). Maryland2 276,000 38 0.37 Stone (crushed), cement (portland), sand and gravel
(construction), cement (masonry), stone (dimension). Massachusetts2 196,000 41 0.27 Stone (crushed), sand and gravel (construction), stone
(dimension), lime, clays (common). Michigan 2,470,000 9 3.34 Iron ore (usable shipped), cement (portland), sand and gravel
(construction), salt, stone (crushed). Minnesota2 5,120,000 3 6.92 Iron ore (usable shipped), sand and gravel (construction), sand
and gravel (industrial), stone (crushed), lime. Mississippi2 195,000 42 0.26 Sand and gravel (construction), stone (crushed), clays (fuller's
earth), clays (ball), clays (bentonite). See footnotes at end of table.

10
TABLE 3.—VALUE OF NONFUEL MINERAL PRODUCTION IN THE UNITED STATES AND
PRINCIPAL NONFUEL MINERALS PRODUCED IN 2011p, 1—Continued
State Value
(thousands) Rank
Percent of U.S. total Principal minerals, in order of value
Missouri $2,220,000 10 3.00 Cement (portland), stone (crushed), lead, lime, sand and gravel (construction).
Montana 1,360,000 15 1.83 Copper, palladium metal, molybdenum concentrates, platinum metal, gold.
Nebraska 259,000 39 0.35 Sand and gravel (construction), cement (portland), stone (crushed), sand and gravel (industrial), lime.
Nevada 10,400,000 1 14.02 Gold, copper, silver, lime, sand and gravel (construction). New Hampshire2 78,700 48 0.11 Sand and gravel (construction), stone (crushed), stone
(dimension), gemstones (natural). New Jersey2 221,000 40 0.30 Stone (crushed), sand and gravel (construction), sand and gravel
(industrial), greensand marl, peat. New Mexico 1,290,000 16 1.75 Copper, potash, sand and gravel (construction), stone (crushed),
salt. New York 1,140,000 20 1.54 Stone (crushed), salt, sand and gravel (construction), cement
(portland), clays (common). North Carolina 883,000 24 1.19 Stone (crushed), phosphate rock, sand and gravel (construction),
sand and gravel (industrial), stone (dimension). North Dakota2 98,400 45 0.13 Sand and gravel (construction), lime, stone (crushed), clays
(common), sand and gravel (industrial). Ohio 1,160,000 19 1.56 Stone (crushed), salt, sand and gravel (construction), lime,
cement (portland). Oklahoma 749,000 29 1.01 Stone (crushed), cement (portland), sand and gravel
(construction), sand and gravel (industrial), iodine. Oregon 297,000 37 0.40 Stone (crushed), sand and gravel (construction), cement
(portland), diatomite, perlite (crude). Pennsylvania 1,590,000 13 2.15 Stone (crushed), cement (portland), lime, sand and gravel
(construction), cement (masonry). Rhode Island2 27,700 49 0.04 Stone (crushed), sand and gravel (construction), sand and gravel
(industrial), gemstones (natural). South Carolina2 502,000 33 0.68 Cement (portland), stone (crushed), sand and gravel
(construction), cement (masonry), sand and gravel (industrial). South Dakota 320,000 36 0.43 Sand and gravel (construction), gold, cement (portland), stone
(crushed), lime. Tennessee 848,000 25 1.15 Stone (crushed), zinc, cement (portland), sand and gravel
(construction), sand and gravel (industrial). Texas 2,810,000 8 3.80 Cement (portland), stone (crushed), sand and gravel
(construction), salt, sand and gravel (industrial). Utah 4,570,000 4 6.17 Copper, molybdenum concentrates, gold, potash, magnesium
metal. Vermont2 123,000 44 0.17 Stone (crushed), sand and gravel (construction), stone
(dimension), talc (crude), gemstones (natural). Virginia 1,030,000 21 1.40 Stone (crushed), zirconium concentrates, cement (portland), lime,
sand and gravel (construction). Washington 727,000 30 0.98 Gold, sand and gravel (construction), stone (crushed), cement
(portland), diatomite. West Virginia 350,000 35 0.47 Cement (portland), stone (crushed), lime, sand and gravel
(industrial), cement (masonry). Wisconsin2 599,000 31 0.81 Sand and gravel (construction), sand and gravel (industrial), stone
(crushed), lime, stone (dimension). Wyoming 1,950,000 11 2.63 Soda ash, clays (bentonite), helium (Grade–A), sand and gravel
(construction), cement (portland). Undistributed 490,000 XX 0.66
Total 74,000,000 XX 100.00 pPreliminary. XX Not applicable. 1Data are rounded to no more than three significant digits; may not add to totals shown. 2Partial total; excludes values that must be concealed to avoid disclosing company proprietary data. Concealed values included with “Undistributed.”

B1 Copper and molybdenum +/- gold, silverB2 Copper +/- gold, silverB3 Lead, zinc +/- copper +/- gold +/- silverB4 Zinc and silver + lead and goldBe BerylliumFe IronMg MagnesiumMo Molybdenum
Zn Zinc
Au Gold
P1 Silver +/- base metalsP2 Gold and silverP3 Gold and silver +/- base metalsP4 Platinum and palladium
SYMBOLS
MAJOR METAL-PRODUCING AREAS
1
Note: Titanium minerals production shown on this map in prior yearshas been removed as it is shown as ilmenite and rutile production onpart I of the industrial mineral-producing areas map.
1
B1
P1
P3
B1
B2B2
B1
B1
B1
B1 Be
Zn
P4
Mo
Mo
Mo
Mg
B3
FeFeFe
P2
P2P2
P2
P2
Au
Au
P3 AuAu
Au
AuAu
B2
B2
B2
P2
Au
P1
AuAu
B4
B3
B2
Au
Au
ZnP2
Mo
Au0 500 250 Kilometers
0 500250 Kilometers0 1,000500 Kilometers
11

MAJOR INDUSTRIAL MINERAL-PRODUCING AREAS—PART I
SYMBOLSBa
BBr
DiaGarGypHeIrz
IKy
MgCp
BariteBoratesBromineDiatomiteGarnetGypsumHeliumIlmenite, rutile, and zirconIodineKyaniteMagnesium compounds
MicaO
PeatPK
SaltNaCNaS
STalcVmWolZeo
MicaOlivinePeatPhosphatePotash
SaltSoda ashSodium sulfateSulfurTalcVermiculiteWollastoniteZeolites
Pyrp Pyrophyllite
GarWol
SS
Gar
Vm
IrzKy
Salt
Salt
Mica P
S
VmMica
MgCp P Irz
PeatP
SaltS
SS
K
Gyp
SaltPeat
MgCp
Gyp
S SS SSalt
SSalt
BrGyp
Gyp
SGyp
SaltSalt S
Salt
S
Peat
S
Gyp
HeGyp
Salt
I
Gyp
I Salt
Gyp
SSalt
ZeoGyp
Gyp
S
S
Mica
He
He
He
Salt NaSS
KZeo
Zeo
GypP
He
Mica
K
P
Talc
Gyp
HeS
NaC
Zeo
Salt
KSalt
MgCp
Gyp
Gyp
Salt
S
Dia
O
Gar
B
GypZeoB
DiaBa
MgCpGyp
BaSalt
Gyp
SaltS
Dia
ZeoDia
GypNaCNaSDia
SSaltGyp
S
SS
Pyrp
K
Zeo
MgCpMgCp
He
S
S
S
S
S
S
S
Talc
Talc
TalcTalc
He
He
Wol
Peat
Gar
Salt
Peat
S
Ba
Mica
Salt
PeatPeat
Peat
Peat
I
O
Salt
Salt
Peat
Salt
Salt
0 500250 Kilometers0 1,000500 Kilometers
0 500250 Kilometers
12

MAJOR INDUSTRIAL MINERAL-PRODUCING AREAS—PART II
BCBentClay
DSFCFelFulISKaLi
PerPum
Ball clayBentoniteCommon clayDimension stoneFire clayFeldsparFuller's earthIndustrial sandKaolinLithium carbonatePerlitePumice and pumicite
SYMBOLS
Per
Pum
Per
FulFul
Ful
Clay
Clay
Clay
ClayClay
Fel
IS IS
IS
Clay
Clay
IS
IS
Ka
Ful
Bent
FC
Clay
Clay
Clay
Pum
DSDS
DS
DS
IS
IS
IS
IS
DS
DS
DS
DSDS
ClayDS
ISIS
DS
Fel
Clay
Ful
DS
Clay
DS
IS
Clay
ISFel
KaDS
Ka ISFel
Ful
KaFul
IS
Bent
DS Fel
DS
Clay
IS
Clay
FC
ISIS
Clay
DS
IS
Clay
IS
Clay
Ka
Clay
BC
IS
Clay
DS
IS
Ful
BCBent
ClayClay
DSFul
Clay
ISIS
BC
Clay
Ful
IS
DS
IS DSIS
IS
FC
Fel
BC
IS
DS
ISDS
Clay
Clay
Clay
Clay
Pum
DS
Clay
ISDS
Clay
ClayIS
Clay
Bent
Bent
Bent
Bent
DS
Per
DS
Per
PumPum
Per
DS
DS
Fel
Bent
Per
DS
DSClay
PumKa
Per
ISDS
FelIS
IS
PumLi
ISPum
PumPer
IS
FelIS Pum
DS
DS
DS
DS
DS
DS
FC
Clay
0 500250 Kilometers
0 500250 Kilometers0 1,000500 Kilometers
13

14
ABRASIVES (MANUFACTURED)
(Fused aluminum oxide and silicon carbide) (Data in metric tons unless otherwise noted)
Domestic Production and Use
: Fused aluminum oxide was produced by two companies at three plants in the United States and Canada. Production of regular-grade fused aluminum oxide had an estimated value of $1.9 million. Silicon carbide was produced by two companies at two plants in the United States. Domestic production of crude silicon carbide had an estimated value of about $26 million. Bonded and coated abrasive products accounted for most abrasive uses of fused aluminum oxide and silicon carbide.
Salient Statistics—United States: 2007 2008 2009 2010 Production,1 United States and Canada (crude):
2011e
Fused aluminum oxide, regular 10,000 10,000 10,000 10,000 10,000 Silicon carbide 35,000 35,000 35,000 35,000 35,000 Imports for consumption (U.S.): Fused aluminum oxide 237,000 285,000 64,200 185,000 210,000 Silicon carbide 164,000 127,000 78,000 143,000 140,000 Exports (U.S.): Fused aluminum oxide 18,200 21,900 12,300 20,000 20,000 Silicon carbide 19,300 17,000 20,700 23,100 28,000 Consumption, apparent (U.S.): Fused aluminum oxide NA NA NA NA NA Silicon carbide 180,000 145,000 92,300 155,000 150,000 Price, value of imports, dollars per ton (U.S.): Fused aluminum oxide, regular 361 512 608 555 606 Fused aluminum oxide, high-purity 1,110 1,230 1,170 1,300 1,330 Silicon carbide 550 835 557 793 1,250 Net import reliance2 as a percentage of apparent consumption (U.S.): Fused aluminum oxide NA NA NA NA NA Silicon carbide 81 76 62 77 76 Recycling
: Up to 30% of fused aluminum oxide may be recycled, and about 5% of silicon carbide is recycled.
Import Sources (2007–10)
: Fused aluminum oxide, crude: China, 83%; Venezuela, 8%; Canada, 6%; and other, 3%. Fused aluminum oxide, grain: Brazil, 30%; Germany, 24%; Austria, 17%; China, 6%; and other, 23%. Silicon carbide, crude: China, 80%; Venezuela, 5%; South Africa, 5%; Netherlands, 4%; and other, 6%. Silicon carbide, grain: China, 42%; Brazil, 22%; Vietnam, 8%; Norway, 7%; and other, 21%.
Tariff
: Item Number Normal Trade Relations
Fused aluminum oxide, crude 2818.10.1000 Free. 12-31-11
White, pink, ruby artificial corundum, greater than 97.5% fused aluminum oxide, grain 2818.10.2010 1.3% ad val. Artificial corundum, not elsewhere specified or included, fused aluminum oxide, grain 2818.10.2090 1.3% ad val. Silicon carbide, crude 2849.20.1000 Free. Silicon carbide, grain 2849.20.2000 0.5% ad val. Depletion Allowance
: None.
Government Stockpile
: None.
Prepared by Donald W. Olson [(703) 648-7721, [email protected]]

15 ABRASIVES (MANUFACTURED)
Events, Trends, and Issues
: In 2011, China was the world’s leading producer of both abrasive fused aluminum oxide and abrasive silicon carbide, with annual production of nearly 695,000 tons and 450,000 tons, respectively, nearly at capacity. Imports and higher operating costs continued to challenge abrasives producers in the United States and Canada. Foreign competition, particularly from China, is expected to persist and further curtail production in North America. Abrasives markets are greatly influenced by activity in the manufacturing sector in the United States. During 2011, these manufacturing sectors included the aerospace, automotive, furniture, housing, and steel industries. The U.S. abrasive markets also are influenced by economic and technological trends. As the world and the United States continued slowly recovering from the global economic recession, U.S. imports, exports, consumption, and prices of manufactured abrasives, in general, have increased since the beginning of 2009 through the present.
World Production Capacity Fused aluminum oxide Silicon carbide
:
2010 2011 2010 United States and Canada 60,400 60,400 42,600 42,600
2011
Argentina — — 5,000 5,000 Australia 50,000 50,000 — — Austria 60,000 60,000 — — Brazil 50,000 50,000 43,000 43,000 China 700,000 700,000 455,000 455,000 France 40,000 40,000 16,000 16,000 Germany 80,000 80,000 36,000 36,000 India 40,000 40,000 5,000 5,000 Japan 25,000 25,000 60,000 60,000 Mexico — — 45,000 45,000 Norway — — 80,000 80,000 Venezuela — — 30,000 30,000 Other countries 80,000 80,000 190,000 World total (rounded) 1,190,000 1,190,000 1,010,000 1,010,000
190,000
World Resources
: Although domestic resources of raw materials for the production of fused aluminum oxide are rather limited, adequate resources are available in the Western Hemisphere. Domestic resources are more than adequate for the production of silicon carbide.
Substitutes
: Natural and manufactured abrasives, such as garnet, emery, or metallic abrasives, can be substituted for fused aluminum oxide and silicon carbide in various applications.
eEstimated. NA Not available. — Zero. 1Rounded to the nearest 5,000 tons to protect proprietary data. 2Defined as imports – exports + adjustments for Government and industry stock changes.
U.S. Geological Survey, Mineral Commodity Summaries, January 2012

16
ALUMINUM1
(Data in thousand metric tons of metal unless otherwise noted) Domestic Production and Use
: In 2011, 5 companies operated 10 primary aluminum smelters; 5 smelters were closed the entire year. One smelter that was closed in 2009 was reopened during the first quarter of 2011. Five potlines that were closed in late 2008 and early 2009 at four other smelters were also restarted in early 2011. Based on published market prices, the value of primary metal production was $5.27 billion. Aluminum consumption was centered in the East Central United States. Transportation accounted for an estimated 34% of domestic consumption; the remainder was used in packaging, 27%; building, 12%; electrical, 8%; machinery, 8%; consumer durables, 7%; and other, 4%.
Salient Statistics—United States: 2007 2008 2009 2010 Production:
2011e
Primary 2,554 2,658 1,727 1,726 1,990 Secondary (from old scrap) 1,660 1,500 1,260 1,250 1,400 Imports for consumption 4,020 3,710 3,680 3,610 3,670 Exports 2,840 3,280 2,710 3,040 3,350 Consumption, apparent2 5,170 3,940 3,320 3,460 3,900 Price, ingot, average U.S. market (spot), cents per pound 125.2 120.5 79.4 104.4 120.0 Stocks: Aluminum industry, yearend 1,400 1,220 937 1,010 900 LME, U.S. warehouses, yearend3 463 1,290 2,200 2,230 2,150 Employment, number4 39,600 38,000 33,800 29,200 30,000 Net import reliance5 as a percentage of apparent consumption 18 E 10 14 13 Recycling
: In 2011, aluminum recovered from purchased scrap in the United States was about 3.0 million tons, of which about 54% came from new (manufacturing) scrap and 46% from old scrap (discarded aluminum products). Aluminum recovered from old scrap was equivalent to about 36% of apparent consumption.
Import Sources (2007–10)
: Canada, 62%; Russia, 8%; China, 5%; Mexico, 3%; and other, 22%.
Tariff
: Item Number Normal Trade Relations
Unwrought (in coils) 7601.10.3000 2.6% ad val. 12-31-11
Unwrought (other than aluminum alloys) 7601.10.6000 Free. Unwrought (billet) 7601.20.9045 Free. Waste and scrap 7602.00.0000 Free. Depletion Allowance
: Not applicable.1
Government Stockpile
: None.
Events, Trends, and Issues
: During the first half of 2011, production from domestic primary aluminum smelters increased after cutbacks were made during 2008 and 2009 in response to price drops in the second half of 2008. Production resumed at a smelter in Massena, NY; potlines were also restarted at smelters in Ferndale, WA; Hannibal, OH; Hawesville, KY; and Wenatchee, WA. Work on an expansion project continued at a smelter in New Madrid, MO, that would increase capacity to 266,000 tons of aluminum per year from 250,000 tons per year by yearend 2013. By the beginning of the fourth quarter of 2011, domestic smelters operated at about 64% of rated or engineered capacity.
Prepared by E. Lee Bray [(703) 648-4979, [email protected]]

17 ALUMINUM
The United States continued to be slightly reliant upon imports in 2011, as domestic primary production increased from that in 2010 but still remained at significantly lower levels than in 2008, although exports of scrap continued to increase. Canada, Russia, and the United Arab Emirates accounted for about 71% of total U.S. imports. Total aluminum exports from the United States increased by 10% in 2011 compared with the amount exported in 2010, and total imports of aluminum in 2011 were slightly higher than the amount imported in 2010. China, Canada, and Mexico, in descending order, received approximately 79% of total United States exports. Scrap exports to China accounted for 40% of total aluminum exports. The monthly average U.S. market price for primary ingot quoted by Platts Metals Week started the year at $1.163 per pound and reached a peak of $1.283 per pound in April. The monthly average price began a downward trend, reaching $1.166 in August. Prices on the London Metal Exchange (LME) followed the trend of U.S. market prices. World primary aluminum production increased in 2011 compared with production in 2010, mainly as a result of starting new smelters and restarting domestic smelters that had been shut down in 2008 and early in 2009. New smelters were constructed and came onstream, mainly in China and India. New smelters previously completed reached full production during 2011 in Qatar and the United Arab Emirates. World inventories of metal held by producers, as reported by the International Aluminium Institute, increased through the end of July to about 2.6 million tons from 2.5 million tons at yearend 2010. Inventories of primary aluminum metal held by the LME worldwide increased during the year to 4.6 million tons in mid-September from 4.3 million tons at yearend 2010. World Smelter Production and Capacity Production Yearend capacity
:
2010 2011e 2010 United States 1,726 1,990 3,200 3,200
2011e
Australia 1,930 1,930 2,050 2,050 Bahrain 870 870 880 880 Brazil 1,540 1,410 1,700 1,700 Canada 2,960 2,970 3,020 3,020 China 16,200 18,000 23,000 25,000 Germany 394 450 620 620 Iceland 780 790 790 790 India 1,450 1,700 1,950 2,310 Mozambique 557 560 570 570 Norway 800 800 1,230 1,230 Qatar 190 390 585 585 Russia 3,950 4,000 4,440 4,440 South Africa 807 800 900 900 United Arab Emirates 1,400 1,800 1,800 1,800 Venezuela 335 380 590 590 Other countries 4,900 5,230 6,180 World total (rounded) 40,800 44,100 53,500 55,900
6,190
World Resources
: Domestic aluminum requirements cannot be met by domestic bauxite resources. Domestic nonbauxitic aluminum resources are abundant and could meet domestic aluminum demand. However, no processes for using these resources have been proven economically competitive with those now used for bauxite. The world reserves for bauxite are sufficient to meet world demand for metal well into the future.
Substitutes
: Composites can substitute for aluminum in aircraft fuselages and wings. Glass, paper, plastics, and steel can substitute for aluminum in packaging. Magnesium, titanium, and steel can substitute for aluminum in ground transportation and structural uses. Composites, steel, vinyl, and wood can substitute for aluminum in construction. Copper can replace aluminum in electrical applications.
eEstimated. E Net exporter. 1See also Bauxite and Alumina. 2Domestic primary metal production + recovery from old aluminum scrap + net import reliance; excludes imported scrap. 3Includes aluminum alloy. 4Alumina and aluminum production workers (North American Industry Classification System—3313). Source: U.S. Department of Labor, Bureau of Labor Statistics. 5Defined as imports – exports + adjustments for Government and industry stock changes.
U.S. Geological Survey, Mineral Commodity Summaries, January 2012

18
ANTIMONY
(Data in metric tons of antimony content unless otherwise noted) Domestic Production and Use
: There was no antimony mine production in the United States in 2011. Primary antimony metal and oxide was produced by one company in Montana, using foreign feedstock. The estimated distribution of antimony uses was as follows: flame retardants, 36%; transportation, including batteries, 23%; chemicals, 16%; ceramics and glass, 12%; and others, 13%.
Salient Statistics—United States: 2007 2008 2009 2010 Production:
2011e
Mine (recoverable antimony) W — — — — Smelter: Primary W W W W W Secondary 3,480 3,180 3,020 3,520 3,450 Imports for consumption 21,900 29,000 20,200 26,200 25,300 Exports of metal, alloys, oxide, and waste and scrap1 1,950 2,200 2,100 2,550 2,350 Consumption, apparent2 23,700 30,400 21,200 27,000 26,600 Price, metal, average, cents per pound3 257 280 236 401 685 Stocks, yearend 1,900 1,490 1,420 1,560 1,370 Employment, plant, numbere 10 10 15 15 15 Net import reliance4 as a percentage of apparent consumption 85 90 86 87 87 Recycling
: Traditionally, the bulk of secondary antimony has been recovered as antimonial lead, most of which was generated by and then consumed by the battery industry. Changing trends in that industry in recent years, however, have generally reduced the amount of secondary antimony produced; the trend to low-maintenance batteries has tilted the balance of consumption away from antimony and toward calcium as an additive.
Import Sources (2007–10)
: Metal: China, 68%; Mexico, 14%; Peru, 8%; and other, 10%. Ore and concentrate: Bolivia, 59%; China, 28%; and other, 13%. Oxide: China, 53%; Mexico, 32%; Belgium, 8%; and other, 7%. Total: China, 56%; Mexico, 28%; Belgium, 7%; and other, 9%.
Tariff
: Item Number Normal Trade Relations
Ore and concentrates 2617.10.0000 Free. 12-31-11
Antimony oxide 2825.80.0000 Free. Antimony and articles thereof, including waste and scrap 8110.00.0000 Free. Depletion Allowance
: 22% (Domestic), 14% (Foreign).
Government Stockpile
: None.
Prepared by James F. Carlin, Jr. [(703) 648-4985, [email protected]]

19 ANTIMONY
Events, Trends, and Issues
: In 2011, antimony production from domestic source materials was derived mostly from the recycling of lead-acid batteries. Recycling supplied only a minor portion of estimated domestic consumption, and the remainder came from imports. In the past decade, the number of primary antimony smelters has been reduced, as smelters in New Jersey and Texas were closed in 2004. Only one domestic smelter, in Montana, continued to make antimony products. This domestic smelter, through its wholly owned Mexican subsidiary, received approval to build an ore-processing plant near its antimony-silver deposit in Mexico in 2010. In 2011, this Mexican subsidiary proceeded with construction of mine infrastructure and a concentration mill. The antimony materials produced there would provide feedstock for the Montana facility.
In China, the world’s leading antimony producer, the Government continued to shut down antimony mines and smelters in an effort to control environmental issues and resolve safety problems. The local Government in Lengshuijiang, Hunan Province, which accounts for about 60% of the world antimony supply, shuttered almost all of its mines and smelters. Also, officials in Lengshuijiang announced that after more than 110 years of continuous mining, the area now had only 5 years of mining life left. The price of antimony rose substantially during 2011. The price started the year at about $5.60 per pound and finished September at about $6.60 per pound. Industry observers attributed the strong price increase to production interruptions in China. Several new antimony mine projects were being developed in Australia, Canada, and Laos. World Mine Production and Reserves Mine production Reserves5
:
2010 Bolivia 5,000 5,000 310,000
2011e
China 150,000 150,000 950,000 Russia (recoverable) 3,000 3,000 350,000 South Africa 3,000 3,000 21,000 Tajikistan 2,000 2,000 50,000 Other countries 4,000 6,000 World total (rounded) 167,000 169,000 1,800,000
150,000
World Resources
: U.S. resources of antimony are mainly in Alaska, Idaho, Montana, and Nevada. Principal identified world resources are in Bolivia, China, Mexico, Russia, and South Africa. Additional antimony resources may occur in Mississippi Valley-type lead deposits in the Eastern United States.
Substitutes
: Compounds of chromium, tin, titanium, zinc, and zirconium substitute for antimony chemicals in paint, pigments, and enamels. Combinations of cadmium, calcium, copper, selenium, strontium, sulfur, and tin can be used as substitutes for hardening lead. Selected organic compounds and hydrated aluminum oxide are widely accepted substitutes as flame retardants.
eEstimated. W Withheld to avoid disclosing company proprietary data. — Zero. 1Gross weight, for metal, alloys, waste, and scrap. 2Domestic mine production + secondary production from old scrap + net import reliance. 3New York dealer price for 99.5% to 99.6% metal, c.i.f. U.S. ports. 4Defined as imports - exports + adjustments for Government and industry stock changes. 5See Appendix C for resource/reserve definitions and information concerning data sources.
U.S. Geological Survey, Mineral Commodity Summaries, January 2012

20
ARSENIC
(Data in metric tons of arsenic unless otherwise noted) Domestic Production and Use
: Arsenic trioxide and arsenic metal have not been produced as primary mineral commodity forms in the United States since 1985. However, arsenic metal has been recycled from gallium-arsenide semiconductors. Owing to environmental concerns and a voluntary ban on the use of arsenic trioxide for the production of chromated copper arsenate (CCA) wood preservatives at yearend 2003, imports of arsenic trioxide averaged 6,100 tons annually during 2006–10 compared with imports of arsenic trioxide that averaged more than 20,000 tons annually during 2001–03. Ammunition used by the United States military was hardened by the addition of less than 1% arsenic metal, and the grids in lead-acid storage batteries were strengthened by the addition of arsenic metal. Arsenic metal was also used as an antifriction additive for bearings, to harden lead shot, and in clip-on wheel weights. Arsenic compounds were used in fertilizers, fireworks, herbicides, and insecticides. High-purity arsenic (99.9999%) was used by the electronics industry for gallium-arsenide semiconductors that are used for solar cells, space research, and telecommunication. Arsenic was also used for germanium-arsenide-selenide specialty optical materials. Indium-gallium-arsenide was used for short-wave infrared technology. The value of arsenic compounds and metal consumed domestically in 2011 was estimated to be about $3 million.
Salient Statistics—United States: 2007 2008 2009 2010 Imports for consumption:
2011e
Metal 759 376 438 769 410 Trioxide 7,010 4,810 4,660 4,530 3,550 Exports, metal 2,490 1,050 354 481 670 Estimated consumption1 5,280 4,130 4,740 4,820 3,290 Value, cents per pound, average:2 Metal (China) 122 125 121 72 70 Trioxide (China) 23 23 18 20 20 Net import reliance3 as a percentage of estimated consumption 100 100 100 100 100 Recycling
: Arsenic metal was recycled from gallium-arsenide semiconductor manufacturing, and arsenic trioxide contained in the process water at wood treatment plants where CCA was used was also recycled. Electronic circuit boards, relays, and switches may contain arsenic; these scrap materials should be disposed of at sites that recycle arsenic-containing, end-of-service electronics or at hazardous waste sites. There was no recovery or recycling of arsenic from arsenic-containing residues and dusts at nonferrous smelters in the United States.
Import Sources (2007–10)
: Metal: China, 83%; Japan, 15%; and other, 2%. Arsenic trioxide: Morocco, 66%; China, 25%; Belgium, 8%; and other, 1%.
Tariff
: Item Number Normal Trade Relations
Metal 2804.80.0000 Free. 12-31-11
Acid 2811.19.1000 2.3% ad val. Trioxide 2811.29.1000 Free. Sulfide 2813.90.1000 Free. Depletion Allowance
: 14% (Domestic and foreign).
Government Stockpile
: None.
Events, Trends, and Issues
: Arsenic metal has been recycled from gallium-arsenide semiconductors and scrap. However, overall apparent exports of arsenic metal have continued to increase, and arsenic-containing “e-waste,” such as computers and other electronics destined for reclamation and recycling, may also have been included in this export category. The exported arsenic metal may have been intended for use in electronics applications. In 2011, the leading export destinations for this category were Honduras (65%), France (27%), and Guatemala (4%).
Prepared by William E. Brooks [(703) 648-7791, [email protected]]

21 ARSENIC
In 1975, the Safe Drinking Water Act mandated that the U.S. Environmental Protection Agency identify and regulate drinking water contaminants, such as arsenic, that may have adverse effects on human health. Ongoing research showed that 60% of total arsenic in source water at test sites in California, Minnesota, Nevada, New Hampshire, and Wisconsin was removed. Arsenic removal technology included adsorptive media, coagulation/filtration, iron removal, and oxidation/filtration systems that have been tested in California, New Mexico, Texas, and Washington. At Lead, SD, adsorptive media was used for 25 months and resulted in the arsenic content of the effluent ultimately being reduced to 0.5 microgram per liter. In response to human health issues, the wood-preserving industry made a voluntary decision to stop using CCA to treat wood used for decks and outdoor residential use by yearend 2003. However, because of known performance and lower cost, CCA may still be used to treat wood used for nonresidential applications. Arsenic may also be released from coal-burning powerplant emissions. Human health concerns, environmental regulation, use of alternative wood preservation material, and the substitution of concrete or plasticized wood products will affect the long-term demand for arsenic. World Production and Reserves Production Reserves4
:
(arsenic trioxide) 2010 Belgium 1,000 1,000
2011e
Chile 11,000 11,500 World reserves are thought to be China 25,000 25,000 about 20 times annual world Kazakhstan 1,500 — production. Mexico — NA Morocco 8,000 8,000 Peru 4,500 4,500 Russia 1,500 1,500 Other countries 310 World total (rounded) 52,800 52,000
300
World Resources
: Arsenic may be obtained from copper, gold, and lead smelter dust as well as from roasting arsenopyrite, the most abundant ore mineral of arsenic. Arsenic was recovered from realgar and orpiment in China, Peru, and the Philippines; from copper-gold ores in Chile; and was associated with gold occurrences in Canada. Orpiment and realgar from gold mines in Sichuan Province, China, were stockpiled for later recovery of arsenic. Arsenic also may be recovered from enargite, a copper mineral. Global resources of copper and lead contain approximately 11 million tons of arsenic.
Substitutes
: Substitutes for CCA in wood treatment include alkaline copper quaternary, ammoniacal copper quaternary, ammoniacal copper zinc arsenate, copper azole, and copper citrate. CCA-treated wood substitutes include concrete, steel, plasticized wood scrap, or plastic composite material. The use of silver-containing biocides is being considered as an alternative wood preservative in some humid areas.
eEstimated. NA Not available. — Zero. 1Estimated to be the same as net imports. 2Calculated from U.S. Census Bureau import data. 3Defined as imports – exports + adjustments for Government and industry stock changes. 4See Appendix C for resource/reserve definitions and information concerning data sources.
U.S. Geological Survey, Mineral Commodity Summaries, January 2012

22
ASBESTOS
(Data in metric tons unless otherwise noted) Domestic Production and Use
: Asbestos has not been mined in the United States since 2002. The United States is dependent on imports to meet manufacturing needs. Asbestos consumption in the United States was estimated to be 1,100 tons, based on asbestos imports through July 2011. Roofing products were estimated to account for about 60% of U.S. consumption; the chloralkali industry about 35%; and unknown applications, 5%.
Salient Statistics—United States: 2007 2008 2009 2010 Production (sales), mine — — — — —
2011e
Imports for consumption 1,730 1,460 869 1,040 1,100 Exports1 815 368 59 171 60 Consumption, estimated 1,730 1,460 869 1,040 1,100 Price, average value, dollars per ton2 473 746 787 786 940 Net import reliance3 as a percentage of estimated consumption 100 100 100 100 100 Recycling
: None.
Import Sources (2007–10)
: Canada, 92%; Zimbabwe, 6%, and other, 2%.
Tariff
: Item Number Normal Trade Relations
Crocidolite 2524.10.0000 Free. 12-31-11
Amosite 2524.90.0010 Free. Chrysotile: Crudes 2524.90.0030 Free. Milled fibers, group 3 grades 2524.90.0040 Free. Milled fibers, group 4 and 5 grades 2524.90.0045 Free. Other, chrysotile 2524.90.0055 Free. Other 2524.90.0060 Free. Depletion Allowance
: 22% (Domestic), 10% (Foreign).
Government Stockpile
: None.
Prepared by Robert L. Virta [(703) 648-7726, [email protected]]

23 ASBESTOS
Events, Trends, and Issues
: The use of asbestos in 2011 and the preceding 5 years is the lowest it has been in the United States since 1909. Most companies that used asbestos to manufacture products have switched to asbestos substitutes, manufacturing alternative products, or simply ceased production of products requiring asbestos. In 2011, U.S. apparent consumption increased by 6%. While this increase seems considerable, the actual tonnage increase was 60 tons and was unlikely to represent any resurgence in the asbestos industry. Based on current trends, U.S. asbestos consumption is likely to remain near the 1,000-ton level in the near future. All the asbestos used in the United States was chrysotile. In 2011, most asbestos was imported from Canada, with a small amount from Brazil. A minor amount of chrysotile was imported from South Africa but was most likely sourced from Zimbabwe.
World Mine Production and Reserves Mine production Reserves4
:
2010 United States — — Small
2011e
Brazil 270,000 270,000 Moderate Canada 100,000 100,000 Large China 400,000 400,000 Large Kazakhstan 214,000 210,000 Large Russia 1,000,000 1,000,000 Large Other countries 21,000 20,000 World total (rounded) 2,010,000 2,000,000 Large
Moderate
World Resources
: The world has 200 million tons of identified resources of asbestos. U.S. resources are large but are composed mostly of short-fiber asbestos, for which use is more limited than long-fiber asbestos in asbestos-based products.
Substitutes
: Numerous materials substitute for asbestos in products. Substitutes include calcium silicate, carbon fiber, cellulose fiber, ceramic fiber, glass fiber, steel fiber, wollastonite, and several organic fibers, such as aramid, polyethylene, polypropylene, and polytetrafluoroethylene. Several nonfibrous minerals or rocks, such as perlite, serpentine, silica, and talc, are considered to be possible asbestos substitutes for products in which the reinforcement properties of fibers were not required.
eEstimated. — Zero. 1Probably includes nonasbestos materials and reexports. 2Average Customs value for U.S. chrysotile imports, all grades combined. Prices for individual commercial products are no longer published. 3Defined as imports – exports. 4See Appendix C for resource/reserve definitions and information concerning data sources.
U.S. Geological Survey, Mineral Commodity Summaries, January 2012

24
BARITE
(Data in thousand metric tons unless otherwise noted) Domestic Production and Use
: Domestic producers of crude barite sold or used for grinding an estimated 640,000 tons in 2011 valued at about $40 million, a decrease in production of about 3% compared with that of 2010. Most of the production came from four major mines in Nevada followed by a significantly smaller sales volume from a single mine in Georgia. In 2011, an estimated 2.7 million tons of barite (from domestic production and imports) was sold by crushers and grinders in 10 States. Nearly 95% of the barite sold in the United States was used as a weighting agent in gas- and oil-well drilling fluids. The majority of Nevada crude barite was ground in Nevada and Wyoming and then sold primarily to gas-drilling customers in Colorado, New Mexico, North Dakota, Utah, and Wyoming. Crude barite was shipped to a Canadian grinding mill in Lethbridge, Alberta, which supplies the Western Canada drilling mud market. The barite imports to Louisiana and Texas ports mostly went to offshore drilling operations in the Gulf of Mexico and to onshore operations in Louisiana, Oklahoma, and Texas.
Barite is also used as a filler, extender, or weighting agent in products such as paints, plastics, and rubber. Some specific applications include its use in automobile brake and clutch pads and automobile paint primer for metal protection and gloss, and to add weight to rubber mudflaps on trucks and to the cement jacket around underwater petroleum pipelines. In the metal casting industry, barite is part of the mold-release compounds. Because barite significantly blocks x-ray and gamma-ray emissions, it is used as aggregate in high-density concrete for radiation shielding around x-ray units in hospitals, nuclear powerplants, and university nuclear research facilities. Ultrapure barite consumed as liquid is used as a contrast medium in medical x-ray examinations. Salient Statistics—United States: 2007 2008 2009 2010 Sold or used, mine 455 648 383 662 640
2011e
Imports for consumption 2,600 2,620 1,430 2,110 2,200 Exports 15 62 49 109 94 Consumption, apparent1 (crude and ground) 3,040 3,210 1,770 2,660 2,700 Consumption2 (ground and crushed) 2,980 2,840 2,080 2,570 2,800 Price, average value, dollars per ton, f.o.b. mine 45.20 47.60 51.90 56.30 61.00 Employment, mine and mill, numbere 330 350 330 350 350 Net import reliance3 as a percentage of apparent consumption 85 80 78 75 78 Recycling
: None.
Import Sources (2007–10)
: China, 95%; India, 3%; and other, 2%.
Tariff
: Item Number Normal Trade Relations
Crude barite 2511.10.5000 $1.25 per metric ton. 12-31-11
Ground barite 2511.10.1000 Free. Oxide, hydroxide, and peroxide 2816.40.2000 2% ad val. Other chlorides 2827.39.4500 4.2% ad val. Other sulfates of barium 2833.27.0000 0.6% ad val. Carbonate 2836.60.0000 2.3% ad val. Depletion Allowance
: 14% (Domestic and foreign).
Government Stockpile
: None.
Events, Trends, and Issues
: In 2011, the number of drill rigs operating in the United States increased rather rapidly. In late February, there were 1,699 rigs operating, but by November the number had increased to near record levels of 2,026. Most of this increase was by rigs drilling for oil—the number of rigs drilling for oil increased to 1,133 in November 2011 from 765 in December 2010.
With the dramatic increase in U.S. natural gas reserves in recent years, domestic drilling for natural gas was expected to increase in the long term. This will be dependent on the strength of demand, which would be dictated by the health of the U.S. economy and the price of natural gas. Too little demand and there is no motivation to explore, and too low a price and exploration becomes uneconomic. With large reserves of shale gas, the United States is expected to shift more of its energy usage to natural gas and away from coal. This implies continued high levels of drilling and resulting strong demand for barite. Prepared by M. Michael Miller [(703) 648-7716, [email protected]]

25 BARITE
Supplies of barite from China were tight in 2011 owing to the lingering impacts of severe weather in barite mining regions, depletion of reserves in Guangxi Province, increased fuel costs, and increased domestic demand in China. These factors and strong demand for barite in world markets resulted in sharply higher prices for Chinese barite. According to Industrial Minerals magazine, crude barite, drilling grade, free on board China, was in the range of $72 to $75 per metric ton at yearend 2010 but had increased to $109 to $110 per metric ton in October 2011. In 2010, severe weather adversely affected barite production in India, but production had recovered by spring 2011. India’s State-owned producer, which produces most of India’s barite, effectively controls India’s barite production, export levels, and prices. India also increased crude barite export prices in 2011, almost doubling prices to $138 to $140 per metric ton in October 2011, from $72 to $74 per metric ton at yearend 2010. World Mine Production and Reserves
: The barite reserve estimate for India has been revised based on new information.
Mine production Reserves4 2010 United States 662 640 15,000
2011e
Algeria 60 60 29,000 China 4,000 4,000 100,000 Germany 50 50 1,000 India 1,100 1,100 32,000 Iran 200 200 NA Kazakhstan 5200 200 NA Mexico 134 154 7,000 Morocco 6650 650 10,000 Pakistan 49 50 1,000 Russia 60 60 12,000 Turkey 250 250 4,000 United Kingdom 50 50 100 Vietnam 85 85 NA Other countries 300 300 World total (rounded) 7,850 7,800 240,000
24,000
World Resources
: In the United States, identified resources of barite are estimated to be 150 million tons, and undiscovered resources include an additional 150 million tons. The world’s barite resources4 in all categories are about 2 billion tons, but only about 740 million tons is identified resources.
Substitutes
: In the drilling mud market, alternatives to barite include celestite, ilmenite, iron ore, and synthetic hematite that is manufactured in Germany. None of these substitutes, however, has had a major impact on the barite drilling mud industry.
eEstimated. NA Not available. 1Sold or used by domestic mines + imports – exports. 2Imported and domestic barite, crushed and ground, sold or used by domestic grinding establishments. 3Defined as imports – exports + adjustments for Government and industry stock changes. 4See Appendix C for resource/reserve definitions and information concerning data sources. 5Estimated marketable barite; however, reported production figures are significantly higher. 6Estimated marketable production based on export data.
U.S. Geological Survey, Mineral Commodity Summaries, January 2012

26
BAUXITE AND ALUMINA1
(Data in thousand metric dry tons unless otherwise noted) Domestic Production and Use
: Nearly all bauxite consumed in the United States was imported; of the total, more than 90% was converted to alumina. Of the total alumina used, about 90% went to primary aluminum smelters and the remainder went to nonmetallurgical uses. Annual alumina production capacity was 5.64 million tons, with three Bayer refineries operating throughout the year. One other refinery that was temporarily idled in 2006 was restarted during the fourth quarter of 2011 and was expected to be operating at full capacity early in 2012. Domestic bauxite was used in the production of nonmetallurgical products, such as abrasives, chemicals, and refractories.
Salient Statistics—United States: 2007 2008 2009 2010 Production, bauxite, mine NA NA NA NA NA
2011e
Imports of bauxite for consumption2 11,200 12,400 7,770 9,320 11,000 Imports of alumina3 2,440 2,530 1,860 1,720 2,230 Exports of bauxite2 30 31 45 53 56 Exports of alumina3 1,160 1,150 946 1,520 1,820 Shipments of bauxite from Government stockpile excesses2 — — — — — Consumption, apparent, bauxite and alumina (in aluminum equivalents)4 3,630 3,450 2,360 2,350 2,660 Price, bauxite, average value U.S. imports (f.a.s.) dollars per ton 31 26 30 29 31 Stocks, bauxite, industry, yearend2 W W 1,860 1,450 1,500 Net import reliance,5 bauxite and alumina, as a percentage of apparent consumption 100 100 100 100 100 Recycling
: None.
Import Sources (2007–10)
:6 Bauxite: Jamaica, 41%; Guinea, 21%; Brazil, 18%; Guyana, 8%; and other, 12%. Alumina: Australia, 38%; Brazil, 18%; Suriname, 17%; Jamaica, 16%; and other, 11%. Total: Jamaica, 30%; Brazil, 18%; Guinea, 16%; Australia, 14%; and other, 22%.
Tariff
: Import duties on bauxite and alumina were abolished in 1971 by Public Law 92–151. Duties can be levied only on such imports from nations with nonnormal trade relations. However, all countries that supplied commercial quantities of bauxite or alumina to the United States during the first 9 months of 2011 had normal-trade-relations status.
Depletion Allowance
: 22% (Domestic), 14% (Foreign).
Government Stockpile
: None
Prepared by E. Lee Bray [(703) 648-4979, [email protected]]

27 BAUXITE AND ALUMINA
Events, Trends, and Issues
: The average monthly price (f.a.s.) for U.S. imports of metallurgical-grade alumina began the year at $384 per ton. By April, the price had peaked at $460 per ton, then from May through August the price ranged between $431 per ton to $415 per ton.
World production of alumina increased compared with that of 2010. Based on production data from the International Aluminium Institute and industry sources in China, world alumina production during 2011 increased by 8% compared with that in 2010. Increases in production from expanded, new, and reopened mines in Brazil, China, Guinea, India, Jamaica, Suriname, and Venezuela accounted for most of the 6% increase in worldwide production of bauxite in 2011 compared with that of 2010. Bauxite production in Australia declined slightly because of flooding that forced production cuts at some mines. World Bauxite Mine Production and Reserves
: Reserve estimates for Australia, Brazil, China, and Kazakhstan have been revised or added based on new information available through company and Government reports.
Mine production Reserves7 2010 United States NA NA 20,000
2011e
Australia 68,400 67,000 6,200,000 Brazil 28,100 31,000 3,600,000 China 44,000 46,000 830,000 Greece 2,100 2,100 600,000 Guinea 17,400 18,000 7,400,000 Guyana 1,760 2,000 850,000 India 18,000 20,000 900,000 Jamaica 8,540 10,200 2,000,000 Kazakhstan 5,310 5,400 160,000 Russia 5,480 5,800 200,000 Sierra Leone 1,090 1,700 180,000 Suriname 4,000 5,000 580,000 Venezuela 2,500 4,500 320,000 Vietnam 80 80 2,100,000 Other countries 2,630 2,600 World total (rounded) 209,000 220,000 29,000,000
3,300,000
World Resources
: Bauxite resources are estimated to be 55 to 75 billion tons, in Africa (32%), Oceania (23%), South America and the Caribbean (21%), Asia (18%), and elsewhere (6%). Domestic resources of bauxite are inadequate to meet long-term U.S. demand, but the United States and most other major aluminum-producing countries have essentially inexhaustible subeconomic resources of aluminum in materials other than bauxite.
Substitutes
: Bauxite is the only raw material used in the production of alumina on a commercial scale in the United States. However, the vast U.S. resources of clay are technically feasible sources of alumina. Other domestic raw materials, such as alunite, anorthosite, coal wastes, and oil shales, offer additional potential alumina sources. Although it would require new plants using different technology, alumina from these nonbauxitic materials could satisfy the demand for primary metal, refractories, aluminum chemicals, and abrasives. Synthetic mullite, produced from kyanite and sillimanite, substitutes for bauxite-based refractories. Although more costly, silicon carbide and alumina-zirconia can substitute for bauxite-based abrasives.
eEstimated. NA Not available. W Withheld to avoid disclosing company proprietary data. — Zero. 1See also Aluminum. As a general rule, 4 tons of dried bauxite is required to produce 2 tons of alumina, which, in turn, provides 1 ton of primary aluminum metal. 2Includes all forms of bauxite, expressed as dry equivalent weights. 3Calcined equivalent weights. 4The sum of U.S. bauxite production and net import reliance. 5Defined as imports – exports + adjustments for Government and industry stock changes (all in aluminum equivalents). Treated as separate commodities, the U.S. net import reliance as a percentage of apparent consumption equaled 100% for bauxite in 2007–10. For 2007–10, the U.S. net import reliance as a percentage of apparent consumption ranged from 5 to 35% for alumina. 6Based on aluminum equivalents. 7See Appendix C for resource/reserve definitions and information concerning data sources.
U.S. Geological Survey, Mineral Commodity Summaries, January 2012

28
BERYLLIUM
(Data in metric tons of beryllium content unless otherwise noted) Domestic Production and Use
: One company in Utah mined bertrandite ore, which it converted, along with imported beryl and beryl from the National Defense Stockpile, into beryllium hydroxide. Some of the beryllium hydroxide was shipped to the company’s plant in Ohio, where it was converted into beryllium-copper master alloy, metal, and/or oxide—some of which was sold. Estimated beryllium consumption of 270 tons was valued at about $121 million, based on the estimated unit value for beryllium in imported beryllium-copper master alloy. Based on sales revenues, 45% of beryllium use was estimated to be in consumer electronics and telecommunications products, 12% was estimated to be in defense-related applications, 11% was estimated to be in industrial components and commercial aerospace applications, and the remainder was used in appliances, automotive electronics, energy, medical devices, and other applications.
Salient Statistics—United States: 2007 2008 2009 2010 Production, mine shipmentse 150 175 120 180 210
2011e
Imports for consumption1 72 70 24 271 91 Exports2 101 112 23 39 25 Government stockpile releases3 28 47 19 29 11 Consumption: Apparent4 100 218 170 456 270 Reported, ore 190 220 150 200 190 Unit value, annual average, beryllium-copper master alloy, dollars per pound contained beryllium5 144 159 154 228 205 Stocks, ore, consumer, yearend 100 60 30 15 35 Net import reliance6 as a percentage of apparent consumption E 20 29 61 21 Recycling
: Beryllium was recycled mostly from new scrap generated during the manufacture of beryllium products. Detailed data on the quantities of beryllium recycled are not available but may represent as much as 10% of apparent consumption.
Import Sources (2007–10)
:1 Russia, 45%; Kazakhstan, 22%; Japan, 7%; Kenya, 5%; and other, 21%.
Tariff
: Item Number Normal Trade Relations
Beryllium ores and concentrates 2617.90.0030 Free. 12-31-11
Beryllium oxide and hydroxide 2825.90.1000 3.7% ad val. Beryllium-copper master alloy 7405.00.6030 Free. Beryllium: Unwrought, including powders 8112.12.0000 8.5% ad val. Waste and scrap 8112.13.0000 Free. Other 8112.19.0000 5.5% ad val. Depletion Allowance
: 22% (Domestic), 14% (Foreign).
Government Stockpile
: The Defense Logistics Agency, U.S. Department of Defense, had a goal of retaining 45 tons of hot-pressed beryllium powder in the National Defense Stockpile. Disposal limits for beryllium materials in the fiscal year 2012 Annual Materials Plan are as follows: beryllium metal, 47 tons of contained beryllium.
Stockpile Status—9-30-117 Uncommitted Authorized Disposal plan Disposals Material inventory for disposal FY 2011 FY 2011 Beryl ore (11% BeO) — — — — Beryllium-copper master alloy — — — — Beryllium metal: Hot-pressed powder 86 41 — 11 Vacuum-cast 14 14 47 — Prepared by Brian W. Jaskula [(703) 648-4908, [email protected]]

29 BERYLLIUM
Events, Trends, and Issues
: Market conditions improved for beryllium-based products in 2011. During the first half of 2011, the leading U.S. beryllium producer reported volume shipments of strip and bulk beryllium-copper alloy products to be 3% and 32% higher, respectively, than those during the first half of 2010. Sales of beryllium products for key markets, including aerospace and industrial components, automotive electronics, industrial x-ray products, oil and gas, semiconductor processing equipment, and telecommunications infrastructure were higher than those during the first half of 2010. Sales of beryllium products for defense-related applications in the first half of 2011 remained about the same as those of the first half of 2010. The revenue growth in 2011 was also due in part to higher beryllium prices.
In an effort to ensure current and future availability of high-quality domestic beryllium to meet critical defense needs, the U.S. Department of Defense in 2005, under the Defense Production Act, Title III, invested in a public-private partnership with the leading U.S. beryllium producer to build a new $90.4 million primary beryllium facility in Ohio. Construction of the facility was completed in early 2011, and during the first half of the year the facility produced a small, nonproduction level quantity of pure beryllium metal. Approximately two-thirds of the facility’s output was to be allocated for defense and government-related end uses, the remaining output going to the private sector. Plant capacity was reported to be 160,000 pounds per year of high-purity beryllium metal. Primary beryllium facilities, the last of which closed in the United States in 2000, traditionally produced the feedstock used to make beryllium metal products. Because of the toxic nature of beryllium, various international, national, and State guidelines and regulations have been established regarding beryllium in air, water, and other media. Industry is required to carefully control the quantity of beryllium dust, fumes, and mists in the workplace, which adds to the final cost of beryllium products. World Mine Production and Reserves Mine productione Reserves8
:
2010 United States 180 210 The United States has very little beryl that can be
2011
China 22 22 economically handsorted from pegmatite deposits. Mozambique 2 2 The Spor Mountain area in Utah, an epithermal Other countries 1 1 World total (rounded) 205 240 which was being mined. Proven bertrandite reserves
deposit, contains a large bertrandite resource,
in Utah total about 15,900 tons of contained beryllium. World beryllium reserves are not sufficiently well delineated to report consistent figures for all countries.
World Resources
: World resources in known deposits of beryllium have been estimated to be more than 80,000 tons. About 65% of these resources is in nonpegmatite deposits in the United States—the Gold Hill and Spor Mountain areas in Utah and the Seward Peninsula area in Alaska account for most of the total.
Substitutes
: Because the cost of beryllium is high compared with that of other materials, it is used in applications in which its properties are crucial. In some applications, certain metal matrix or organic composites, high-strength grades of aluminum, pyrolytic graphite, silicon carbide, steel, or titanium may be substituted for beryllium metal or beryllium composites. Copper alloys containing nickel and silicon, tin, titanium, or other alloying elements or phosphor bronze alloys (copper-tin-phosphorus) may be substituted for beryllium-copper alloys, but these substitutions can result in substantially reduced performance. Aluminum nitride or boron nitride may be substituted for beryllium oxide in some applications.
eEstimated. E Net exporter. — Zero. 1Includes estimated beryllium content of imported ores and concentrates, oxide and hydroxide, unwrought metal (including powders), beryllium articles, waste and scrap, and beryllium-copper master alloy. 2Includes estimated beryllium content of exported unwrought metal (including powders), beryllium articles, and waste and scrap. 3Change in total inventory level from prior yearend inventory. 4The sum of U.S. mine shipments and net import reliance. 5Calculated from gross weight and customs value of imports; beryllium content estimated to be 4%. 6Defined as imports – exports + adjustments for Government and industry stock changes. 7See Appendix B for definitions. 8See Appendix C for resource/reserve definitions and information concerning data sources.
U.S. Geological Survey, Mineral Commodity Summaries, January 2012

30
BISMUTH
(Data in metric tons of bismuth content unless otherwise noted) Domestic Production and Use
: The United States ceased production of primary refined bismuth in 1997 and is thus highly import dependent for its supply. A small amount of bismuth is recycled by some domestic firms. Bismuth is contained in some lead ores mined domestically, but the bismuth-containing residues are not processed domestically and may be exported. The value of reported consumption of bismuth was approximately $26 million. About 67% of the bismuth was used in pharmaceuticals and chemicals, 26% in metallurgical additives, and 7% in fusible alloys, solders, and ammunition cartridges.
The Safe Drinking Water Act Amendment of 1996 required that all new and repaired fixtures and pipes for potable water supply be lead free after August 1998. As a result, a wider market was opened for bismuth as a metallurgical additive to lead-free pipes. Bismuth use in water meters and fixtures is one particular application that has increased in recent years. An application with major growth potential is the use of zinc-bismuth alloys to achieve thinner and more uniform galvanization. Bismuth was also used domestically in the manufacture of ceramic glazes, crystal ware, and pigments; as an additive to free-machining steels; and as an additive to malleable iron castings. Salient Statistics—United States: 2007 2008 2009 2010 Production:
2011e
Refinery — — — — –– Secondary (old scrap) 100 100 60 80 80 Imports for consumption, metal 3,070 1,930 1,250 1,620 1,200 Exports, metal, alloys, and scrap 421 375 397 704 500 Consumption: Reported 2,630 1,090 820 884 1,000 Apparent 2,740 1,560 1,010 996 744 Price, average, domestic dealer, dollars per pound 14.07 12.73 7.84 8.76 11.60 Stocks, yearend, consumer 139 228 134 134 170 Net import reliance1 as a percentage of apparent consumption 96 94 94 92 89 Recycling
: All types of bismuth-containing new and old alloy scrap were recycled and contributed about 10% of U.S. bismuth consumption, or 80 tons.
Import Sources (2007–10)
: China, 36%; Belgium, 34%; United Kingdom, 18%; and other, 12%.
Tariff
: Item Number Normal Trade Relations
Bismuth and articles thereof, including waste 12-31-11
and scrap 8106.00.0000 Free. Depletion Allowance
: 22% (Domestic), 14% (Foreign).
Government Stockpile
: None.
Prepared by James F. Carlin, Jr. [(703) 648-4985, [email protected]]

31 BISMUTH
Events, Trends, and Issues
: Owing to its unique properties, bismuth has a wide variety of applications, including use in free-machining steels, brass, pigments, and solders, as a nontoxic replacement for lead; in pharmaceuticals, including bismuth subsalicylate, the active ingredient in over-the-counter stomach remedies; in the foundry industry, as an additive to enhance metallurgical quality; in the construction field, as a triggering mechanism for fire sprinklers; and in holding devices for grinding optical lenses. Researchers in the European Union, Japan, and the United States are investigating the possibilities of using bismuth in lead-free solders. Researchers also are examining liquid lead-bismuth coolants for use in nuclear reactors. Work is proceeding toward developing a bismuth-containing metal-polymer bullet.
The price of bismuth started 2011 at $9.35 per pound and rose throughout the year, ending October at $12.87 per pound. The estimated average price of bismuth in 2011 was about 33% above that in 2010. Industry analysts attributed the higher price to increased world demand. World Mine Production and Reserves Mine production Reserves2
:
2010 United States — — —
2011e
Bolivia 90 100 10,000 Canada 90 100 5,000 China 6,500 6,000 240,000 Kazakhstan 150 — NA Mexico 850 1,000 10,000 Peru 1,100 1,100 11,000 Other countries 120 200 World total (rounded) 8,900 8,500 320,000
39,000
World Resources
: Bismuth, at an estimated 8 parts per billion by weight, ranks 69th in elemental abundance in the Earth’s crust and is about twice as abundant as gold. World reserves of bismuth are usually based on bismuth content of lead resources because bismuth production is most often a byproduct of processing lead ores; in China, bismuth production is a byproduct of tungsten and other metal ore processing. Bismuth minerals rarely occur in sufficient quantities to be mined as principal products; the Tasna Mine in Bolivia and a mine in China are the only mines that produced bismuth from a bismuth ore.
Substitutes
: Bismuth can be replaced in pharmaceutical applications by alumina, antibiotics, and magnesia. Titanium dioxide-coated mica flakes and fish scale extracts are substitutes in pigment uses. Indium can replace bismuth in low-temperature solders. Resins can replace bismuth alloys for holding metal shapes during machining, and glycerine-filled glass bulbs can replace bismuth alloys in triggering devices for fire sprinklers. Free-machining alloys can contain lead, selenium, or tellurium as a replacement for bismuth.
Bismuth, on the other hand, is an environmentally friendly substitute for lead in plumbing and many other applications, including fishing weights, hunting ammunition, lubricating greases, and soldering alloys. eEstimated. NA Not available. — Zero. 1Defined as imports – exports + adjustments for Government and industry stock changes. 2See Appendix C for resource/reserve definitions and information concerning data sources.
U.S. Geological Survey, Mineral Commodity Summaries, January 2012

32
BORON
(Data in thousand metric tons of boric oxide (B2O3) unless otherwise noted) Domestic Production and Use
: Two companies in southern California produced borates in 2011, and most of the boron products consumed in the United States were manufactured domestically. To avoid disclosing company proprietary data, U.S. boron production and consumption in 2011 were withheld. The leading boron producer mined borate ores containing kernite and tincal by open pit methods and operated associated compound plants. The kernite was used for boric acid production and the tincal was used as a feedstock for sodium borate production. A second company produced borates from brines extracted through solution mining techniques. Boron minerals and chemicals were principally consumed in the North Central and the Eastern United States. The estimated distribution pattern for boron compounds consumed in the United States in 2011 was glass and ceramics, 80%; soaps, detergents, and bleaches, 4%; agriculture, 4%; enamels and glazes, 3%; and other, 9%.
Salient Statistics—United States: 2007 2008 2009 2010 Production1 W W W W W
2011e
Imports for consumption, gross weight: Borax 1 1 (2) (2) (2) Boric acid 67 50 36 50 55 Colemanite 26 30 31 50 45 Ulexite 92 75 28 1 15 Exports, gross weight: Boric acid 248 303 171 264 250 Refined sodium borates 446 519 417 423 510 Consumption: Apparent W W W W W Reported W W W W W Price, average value of mineral imports at port of exportation, dollars per ton 302 302 339 361 300 Employment, number 1,320 1,310 1,220 1,180 1,200 Net import reliance3 as a percentage of apparent consumption E E E E E Recycling
: Insignificant.
Import Sources (2007–10)
: Boric acid: Turkey, 62%; Chile, 10%; Bolivia, 5%; and other, 23%.
Tariff
: Item Number Normal Trade Relations
Natural borates: 12-31-11
Sodium 2528.10.0000 Free. Calcium 2528.90.0010 Free. Other 2528.90.0050 Free. Boric acids 2810.00.0000 1.5% ad val. Borates: Refined borax: Anhydrous 2840.11.0000 0.3% ad val. Other 2840.19.0000 0.1% ad val. Other 2840.20.0000 3.7% ad val. Perborates: Sodium 2840.30.0010 3.7% ad val. Other 2840.30.0050 3.7% ad val. Depletion Allowance
: Borax, 14% (Domestic and foreign).
Government Stockpile
: None.
Prepared by Marc A. Angulo [Contact Robert D. Crangle, Jr., (703) 648-6410, [email protected]]

33 BORON
Events, Trends, and Issues
: Elemental boron is a metalloid that has limited commercial applications. Boron compounds, chiefly borates, are commercially important; therefore, boron products were priced and sold based on their boric oxide content (B2O3), varying by ore and compound and by the absence or presence of calcium and sodium. The four borates—colemanite, kernite, tincal, and ulexite—make up 90% of the borates used by industry worldwide. Although there are more than 300 end uses for borates, more than three-quarters of the world’s supply is sold into the following four end uses: ceramics, detergents, fertilizer, and glass.
The global economic crisis of late 2008 and recession of 2009 negatively affected sectors vital for boron consumption, such as the construction and automotive industries. The moderate economic recovery in 2010 created steady growth in boron production and consumption. Consumption of borates is expected to increase in 2011 and the coming years, spurred by strong demand in the Asian and South American agricultural, ceramic, and glass markets. In particular, boron consumption in the global fiberglass industry was projected to increase by 7% annually through 2013, spurred by a projected 19% increase in Chinese consumption. World consumption of borates was projected to reach 2.0 million metric tons of B2O3 by 2014, compared with 1.5 million metric tons of B2O3 in 2010. Demand for borates was expected to shift slightly away from detergents and soaps towards glass and ceramics. Because China has low-grade boron reserves and demand for boron is anticipated to rise in that country, Chinese imports from Chile, Russia, Turkey, and the United States were expected to increase during the next several years. European and emerging markets were requiring more stringent building standards with respect to heat conservation. Consequently, increased consumption of borates for fiberglass insulation was expected. Continued investment in new refineries and technologies and the continued rise in demand were expected to fuel growth in world production during the next several years. World Production and Reserves Production—All forms4 Reserves5
:
2010 United States W W 40,000
2011e
Argentina 600 630 2,000 Bolivia 97 120 NA Chile 504 480 35,000 China 150 150 32,000 Iran 2 2 1,000 Kazakhstan 30 30 NA Peru 293 370 4,000 Russia 400 400 40,000 Turkey 2,000 2,100 World total (rounded) 64,080 64,300 210,000
60,000
World Resources
: Deposits of borates are associated with volcanic activity and arid climates, with the largest economically viable deposits located in the Mojave Desert of the United States, the Alpide belt in southern Asia, and the Andean belt of South America. U.S. deposits consist primarily of tincal, kernite, and borates contained in brines, and to a lesser extent ulexite and colemanite. About 70% of all Turkish deposits are colemanite. Small deposits are being mined in South America. At current levels of consumption, world resources are adequate for the foreseeable future.
Substitutes
: The substitution of other materials for boron is possible in detergents, enamel, insulation, and soaps. Sodium percarbonate can replace borates in detergents and requires lower temperatures to undergo hydrolysis, which is an environmental consideration. Some enamels can use other glass-producing substances, such as phosphates. Insulation substitutes include cellulose, foams, and mineral wools. In soaps, sodium and potassium salts of fatty acids can act as cleaning and emulsifying agents.
eEstimated. E Net exporter. NA Not available. W Withheld to avoid disclosing company proprietary data. 1Minerals and compounds sold or used by producers; includes both actual mine production and marketable products. 2Less than ½ unit. 3Defined as imports – exports + adjustments for Government and industry stock changes. 4Gross weight of ore in thousand metric tons. 5See Appendix C for resource/reserve definitions and information concerning data sources. 6Excludes U.S. production.
U.S. Geological Survey, Mineral Commodity Summaries, January 2012

34
BROMINE
(Data in metric tons of bromine content unless otherwise noted) Domestic Production and Use
: Bromine was recovered from underground brines by two companies in Arkansas. Bromine was the leading mineral commodity, in terms of value, produced in Arkansas. The two bromine companies in the United States accounted for about one-third of world production capacity.
Primary uses of bromine compounds are in flame retardants, drilling fluids, brominated pesticides (mostly methyl bromide), and water treatment. Bromine is also used in the manufacture of dyes, insect repellents, perfumes, pharmaceuticals, and photographic chemicals. Other bromine compounds are used in a variety of applications, including chemical synthesis, mercury control, and paper manufacturing. Salient Statistics—United States: 2007 2008 2009 2010 Production W W W W W
2011e
Imports for consumption, elemental bromine and compounds1 32,200 41,200 35,000 45,000 43,000 Exports, elemental bromine and compounds 8,560 9,640 6,120 8,150 7,400 Consumption, apparent W W W W W Price, cents per kilogram, bulk, purified bromine NA NA NA NA NA Employment, numbere 1,000 1,000 1,000 950 950 Net import reliance2 as a percentage of apparent consumption <25 <25 <25 <25 <25 Recycling
: Some bromide solutions were recycled to obtain elemental bromine and to prevent the solutions from being disposed of as hazardous waste. Hydrogen bromide is emitted as a byproduct in many organic reactions. This byproduct waste is recycled with virgin bromine brines and is a major source of bromine production. Plastics containing bromine flame retardants can be incinerated as solid organic waste, and the bromine can be recovered. This recycled bromine is not included in the virgin bromine production reported to the U.S. Geological Survey by companies but is included in data collected by the U.S. Census Bureau.
Import Sources (2007–10)
: Israel, 84%; China, 8%; Germany, 4%; Jordan, 2%; and other, 2%.
Tariff
: Item Number Normal Trade Relations
Bromine 2801.30.2000 5.5% ad val. 12-31-11
Hydrobromic acid 2811.19.3000 Free. Potassium or sodium bromide 2827.51.0000 Free. Ammonium, calcium, or zinc bromide 2827.59.2500 Free. Other bromides and bromide oxides 2827.59.5100 3.6% ad val. Potassium bromate 2829.90.0500 Free. Sodium bromate 2829.90.2500 Free. Ethylene dibromide 2903.31.0000 5.4% ad val. Methyl bromide 2903.39.1520 Free. Bromochloromethane 2903.49.1000 Free. Tetrabromobisphenol A 2908.19.2500 5.5% ad val. Decabromodiphenyl and octabromodiphenyl oxide 2909.30.0700 5.5% ad val. Depletion Allowance
: Brine wells, 5% (Domestic and foreign).
Government Stockpile
: None.
Prepared by Joyce A. Ober [(703) 648-7717, [email protected]]

35 BROMINE
Events, Trends, and Issues
: Although still the leading bromine producer in the world, the United States’ dominance has decreased as other countries, such as Israel, Japan, and Jordan, strengthened their positions as world producers of elemental bromine. A United States bromine company announced plans to double production capacity at its joint-venture operation on the Dead Sea in Jordan. The project was expected to be completed in 2012. China also is a significant bromine producer, although environmental restrictions to protect farmland, limits to plant expansions, and shutdowns of unlicensed bromine operations have resulted in tight supplies. Bromine and bromine compound prices increased in 2011, reflecting the expanding markets of bromine, especially in China, and increases in the costs of energy, raw materials, regulatory compliance, and transportation.
The leading use of bromine is in flame retardants; however, this use is in decline because of the environmental considerations and potential health effects related to specific bromine flame-retardant compounds. In the United States in 2010, bromine chemical producers and importers reached an agreement with the U.S. Environmental Protection Agency to voluntarily phase out the production, importation, and use of decabromodiphenyl ether (Deca-BDE), a widely used flame retardant, in all consumer products by December 2012, and in all products by the end of 2013. Several companies were pursuing new markets for bromine to mitigate mercury emissions at powerplants. Bromine compounds bond with mercury in flue gases from coal-fired powerplants creating mercuric bromide, a substance that is more easily captured in flue-gas scrubbers than the mercuric chloride that is produced at many facilities. Wide acceptance of the new technology would likely increase demand for bromine, counteracting, at least in part, the decline expected from the ban on Deca-BDE. World Production and Reserves
: Reserve data for Ukraine have been revised to “not available” because no current information is available to confidently and accurately quantify reserves for that country.
Production Reserves3 2010 United States W W 11,000,000
2011e
Azerbaijan 3,500 3,500 300,000 China 150,000 155,000 NA Germany 985 1,500 NA India 1,500 1,500 NA Israel 185,000 200,000 NA Japan 20,000 20,000 NA Jordan 85,000 75,000 NA Spain 100 100 1,400,000 Turkmenistan 150 150 700,000 Ukraine 4,100 4,100 World total (rounded) 4450,000 4460,000 Large
NA
World Resources
: Bromine is found principally in seawater, evaporitic (salt) lakes, and underground brines associated with petroleum deposits. In the Middle East, the Dead Sea is estimated to contain 1 billion tons of bromine. Seawater contains about 65 parts per million of bromine, or an estimated 100 trillion tons. Bromine is also recovered from seawater as a coproduct during evaporation to produce salt.
Substitutes
: Chlorine and iodine may be substituted for bromine in a few chemical reactions and for sanitation purposes. There are no comparable substitutes for bromine in various oil and gas well completion and packer applications that do not harm the permeability of the production zone and that control well “blowouts.” Because plastics have a low ignition temperature, alumina, magnesium hydroxide, organic chlorine compounds, and phosphorus compounds can be substituted for bromine as fire retardants in some uses. Bromine compounds and bromine acting as a synergist are used as fire retardants in plastics, such as those found in electronics.
eEstimated. NA Not available. W Withheld to avoid disclosing company proprietary data. 1Imports calculated from items shown in Tariff section. 2Defined as imports – exports + adjustments for Government and industry stock changes. 3See Appendix C for resource/reserve definitions and information concerning data sources. 4Excludes U.S. production.
U.S. Geological Survey, Mineral Commodity Summaries, January 2012

36
CADMIUM
(Data in metric tons of cadmium content unless otherwise noted) Domestic Production and Use
: Three companies in the United States were thought to have produced refined cadmium in 2011. One company, operating in Tennessee, recovered primary cadmium as a byproduct of zinc leaching from roasted sulfide concentrates. The other two companies, with facilities in Ohio and Pennsylvania, thermally recovered secondary cadmium metal from spent nickel-cadmium (NiCd) batteries and other cadmium-bearing scrap. Cadmium metal and compounds are mainly consumed for alloys, coatings, nickel-cadmium batteries, pigments, and plastic stabilizers. Based on the average New York dealer price, U.S. cadmium metal consumption was valued at about $1.35 million in 2011.
Salient Statistics—United States: 2007 2008 2009 2010 Production, refinery1 735 777 633 637 600
2011e
Imports for consumption: Metal only 315 153 117 216 150 Metal, alloys, scrap 316 197 122 221 160 Exports: Metal only 270 295 276 40 70 Metal, alloys, scrap 424 421 661 306 290 Consumption of metal, apparent 594 528 199 477 490 Price, metal, annual average,2 dollars per kilogram 7.61 5.92 2.87 3.90 2.75 Stocks, yearend, producer and distributor 107 132 27 102 80 Net import reliance3 as a percentage of apparent consumption E E E E E Recycling
: Cadmium is mainly recovered from spent consumer and industrial NiCd batteries. Other waste and scrap from which cadmium can be recovered includes copper-cadmium alloy scrap, some complex nonferrous alloy scrap, and cadmium-containing dust from electric arc furnaces (EAF). The amount of cadmium recycled was not disclosed.
Import Sources (2007–10)
: Metal:4 Mexico, 38%; Australia, 17%; Canada, 14%; Germany, 11%; and other, 20%.
Tariff
: Item Number Normal Trade Relations5
Cadmium oxide 2825.90.7500 Free. 12-31-11
Cadmium sulfide 2830.90.2000 3.1% ad val. Pigments and preparations based on cadmium compounds 3206.49.6010 3.1% ad val. Unwrought cadmium and powders 8107.20.0000 Free. Cadmium waste and scrap 8107.30.0000 Free. Wrought cadmium and other articles 8107.90.0000 4.4% ad val. Depletion Allowance
: 22% (Domestic), 14% (Foreign).
Government Stockpile
: None.
Events, Trends, and Issues
: Most of the world’s primary cadmium metal was produced in Asia and the Pacific—specifically China, Japan, and the Republic of Korea—followed by North America, Central Europe and Eurasia, and Western Europe. Secondary cadmium production takes place mainly at NiCd battery recycling facilities.
Cadmium use in batteries accounted for the majority of global consumption. The remainder was distributed as follows, in order of descending consumption: pigments, coatings and plating, stabilizers for plastics, nonferrous alloys, and other specialized uses (including photovoltaic devices). The percentage of cadmium consumed globally for NiCd battery production has been increasing, while the percentages for the other traditional end uses of cadmium—specifically coatings, pigments, and stabilizers—have gradually decreased owing to environmental and health concerns. A large percentage of the global NiCd battery market was concentrated in Asia. NiCd battery use in consumer electronics was thought to be declining owing partly to the preference for other rechargeable battery chemistries—particularly lithium ion (Li-ion) batteries, which have already replaced NiCd batteries to a large degree in laptops and cell phones. Li-ion batteries are used in lightweight electronic devices because of their greater energy density (power-to-weight ratio). However, demand for cadmium may increase owing Prepared by Amy C. Tolcin [(703) 648-4940, [email protected]]

37 CADMIUM
to several new market opportunities for NiCd batteries, particularly in industrial applications. Industrial-sized NiCd batteries could also be used to store energy produced by certain on-grid systems. For load leveling, excess energy produced during periods of low demand, such as night time, would be stored in a NiCd battery and later released during periods of high electricity demand, such as midday. Concern about cadmium’s toxicity has spurred various recent legislative efforts, especially in the European Union, to restrict the use of cadmium in most of its end-use applications. In May, the European Commission announced that the use of cadmium in brazing sticks, plastics, and jewelry will be banned in the European Union beginning in December 2011. The new legislation was adopted as an amendment under the REACH (Registration, Evaluation, Authorization and Restriction of Chemicals) regulation. The final effect of this legislation and others on global cadmium consumption has yet to be seen. If recent legislation involving cadmium dramatically reduces long-term demand, a situation could arise, such as has been recently seen with mercury, where an accumulating oversupply of byproduct cadmium will need to be permanently stockpiled. World Refinery Production and Reserves
: Reserve data for Kazakhstan and Poland were revised based on new company information and country reports.
Refinery production Reserves6 2010 United States 637 600 39,000
2011e
Australia 350 380 61,000 Canada 1,300 1,300 18,000 China 7,200 7,500 92,000 Germany 400 400 — India 620 660 130,000 Japan 2,050 2,000 — Kazakhstan 1,800 1,800 35,000 Korea, Republic of 2,500 2,500 — Mexico 1,480 1,500 48,000 Netherlands 580 580 — Peru 400 400 45,000 Poland 530 550 16,000 Russia NA NA 21,000 Other countries 1,250 1,300 World total (rounded) 21,100 21,500 640,000
130,000
World Resources
: Cadmium is generally recovered as a byproduct from zinc concentrates. Zinc-to-cadmium ratios in typical zinc ores range from 200:1 to 400:1. Sphalerite (ZnS), the most economically significant zinc mineral, commonly contains minor amounts of other elements; cadmium, which shares certain similar chemical properties with zinc, will often substitute for zinc in the sphalerite crystal lattice. The cadmium mineral greenockite (CdS) is frequently associated with weathered sphalerite and wurtzite but usually at microscopic levels. Zinc-bearing coals of the Central United States and Carboniferous age coals of other countries also contain large subeconomic resources of cadmium.
Substitutes
: Li-ion and nickel-metal hydride batteries are replacing NiCd batteries in some applications. However, the higher cost of these substitutes restricts their use in less-expensive products. Except where the surface characteristics of a coating are critical (e.g., fasteners for aircraft), coatings of zinc or vapor-deposited aluminum can be substituted for cadmium in many plating applications. Cerium sulfide is used as a replacement for cadmium pigments, mostly in plastics. Barium/zinc or calcium/zinc stabilizers can replace barium/cadmium stabilizers in flexible polyvinylchloride applications.
eEstimated. E Net exporter. NA Not available. — Zero. 1Cadmium metal produced as a byproduct of lead-zinc refining plus metal from recycling. 2Average New York dealer price for 99.95% purity in 5-short-ton lots. Source: Platts Metals Week. 3Defined as imports – exports + adjustments for Government and industry stock changes. 4Imports for consumption of unwrought metal and metal powders (Tariff no. 8107.20.0000). 5No tariff for Australia, Canada, Mexico, and Peru for items shown. 6See Appendix C for resource/reserve definitions and information concerning data sources.
U.S. Geological Survey, Mineral Commodity Summaries, January 2012

38
CEMENT
(Data in thousand metric tons unless otherwise noted) Domestic Production and Use
: In 2011, about 66 million tons of portland cement and 1.8 million tons of masonry cement were produced at 103 plants in 35 States. Cement also was produced at two plants in Puerto Rico. Output improved slightly overall but was still at a very low level relative to the more than 90-million-ton-per-year levels of 2002–07 and reflected recent plant closures and idlings, and idlings of spare kilns at active plants. Although slightly higher than levels in 2009–10, sales volumes in 2011 were still more than 57 million tons below the record level of 2005. The overall value of sales was about $6.6 billion. Most of the cement was used to make concrete, worth at least $37 billion. About 71% of cement sales went to ready-mixed concrete producers, 12% to concrete product manufacturers, 10% to contractors (mainly road paving), 3% to building materials dealers, and 4% to other users. In descending order, Texas, California, Missouri, Florida, Pennsylvania, Michigan, and Alabama were the seven leading cement-producing States and accounted for about 53% of U.S. production.
Salient Statistics—United States:1 2007 2008 2009 2010 Production:
2011e
Portland and masonry cement2 95,464 86,310 63,929 66,452 67,700 Clinker 86,130 78,382 56,116 59,812 59,500 Shipments to final customers, includes exports 115,426 97,322 71,489 71,194 72,300 Imports of hydraulic cement for consumption 21,496 10,744 6,211 6,013 5,600 Imports of clinker for consumption 972 621 556 613 500 Exports of hydraulic cement and clinker 886 823 884 1,178 1,700 Consumption, apparent3 116,600 96,800 71,500 71,200 72,300 Price, average mill value, dollars per ton 104.00 103.50 99.00 92.00 91.00 Stocks, cement, yearend 8,890 8,360 6,080 6,166 5,500 Employment, mine and mill, numbere 16,000 15,000 13,000 12,000 12,000 Net import reliance4 as a percentage of apparent consumption 19 11 8 8 6 Recycling
: Cement kiln dust is routinely recycled to the kilns, which also can burn a variety of waste fuels and recycled raw materials such as slags and fly ash. Certain secondary materials can be incorporated as supplementary cementitious materials in blended cements and in the cement paste in concrete. Cement is not directly recycled, but there is significant recycling of concrete for use as aggregate.
Import Sources (2007–10)
:5 Canada, 34%; China, 18%; Republic of Korea, 12%; Mexico, 7%; and other, 29%.
Tariff
: Item Number Normal Trade Relations
Cement clinker 2523.10.0000 Free. 12-31-11
White portland cement 2523.21.0000 Free. Other portland cement 2523.29.0000 Free. Aluminous cement 2523.30.0000 Free. Other hydraulic cement 2523.90.0000 Free. Depletion Allowance
: Not applicable. Certain raw materials for cement production have depletion allowances.
Government Stockpile
: None.
Events, Trends, and Issues
: Construction spending levels remained low in 2011 because of the continuing depressed housing market, high numbers of housing foreclosures, lower tax revenues to the States, tight credit, and high levels of unemployment. In the construction sectors requiring significant quantities of concrete (hence cement), stimulus spending had only minor and localized impact in 2011. Imports continued to fall, but slightly higher overall sales allowed for a modest increase in cement production. Beginning in 2008, a large number of plants were put into indefinite idle status or were closed altogether. This trend continued into 2011, with one already idle plant being formally closed, and another plant being idled indefinitely, with few prospects for reopening. Most multikiln plants had only a single kiln operating in 2011. One new plant opened in 2011.
Prepared by Hendrik G. van Oss [(703) 648-7712, [email protected]]

39 CEMENT
The manufacture of clinker for cement releases a great deal of carbon dioxide, and plant-level reporting of these emissions to the U.S. Environmental Protection Agency (EPA) became mandatory in 2010. Carbon dioxide reduction strategies by the cement industry mainly aim at reducing emissions per ton of cement product rather than by a plant overall. These strategies include installation of more fuel-efficient kiln technologies, partial substitution of noncarbonate sources of calcium oxide in the kiln raw materials, and partial substitution of supplementary cementitious materials (SCM), such as pozzolans, for portland cement in the finished cement products and in concrete. Because SCM do not require the energy-intensive clinker manufacturing (kiln) phase of cement production, their use, or the use of inert additives or extenders, reduces the unit monetary and environmental costs of the cement component of concrete. Research continued toward developing cements that require less energy to manufacture than portland cement, and(or) that utilize more benign raw materials. A new National Emissions Standards for Hazardous Air Pollutants (NESHAP) protocol for cement plants finalized in 2010 by the EPA was being appealed in 2011 by the cement industry. The protocol would significantly lower the acceptable emissions levels of mercury and certain other pollutants. It was unclear how many plants would be able to comply with the new limits; the mercury limits were further expected to make it difficult for cement plants to continue to burn fly ash as a raw material for clinker manufacture. World Production and Capacity Cement production Clinker capacitye
:
2010 2011e 2010 United States (includes Puerto Rico) 67,200 68,400 6111,000 6108,000
2011
Brazil 59,100 62,600 50,000 53,000 China 1,880,000 2,000,000 1,500,000 1,600,000 Egypt 48,000 45,000 46,000 46,000 Germany 29,900 33,000 31,000 31,000 India 210,000 210,000 240,000 250,000 Indonesia 22,000 22,000 42,000 42,000 Iran 50,000 52,000 57,000 59,000 Italy 36,300 35,000 46,000 46,000 Japan 51,500 47,000 63,000 60,000 Korea, Republic of 47,200 46,000 50,000 50,000 Mexico 34,500 35,000 42,000 42,000 Pakistan 30,000 30,000 42,000 42,000 Russia 50,400 52,000 65,000 65,000 Saudi Arabia 42,300 44,000 50,000 50,000 Spain 23,500 20,700 42,000 42,000 Thailand 36,500 36,000 50,000 50,000 Turkey 62,700 64,000 64,000 66,000 Vietnam 50,000 50,000 55,000 55,000 Other countries (rounded) 480,000 480,000 460,000 World total (rounded) e3,310,000 3,400,000 3,100,000 3,200,000
460,000
World Resources
: Although individual plant reserves are subject to exhaustion, cement raw materials, especially limestone, are geologically widespread and abundant, and overall shortages are unlikely in the future.
Substitutes
: Virtually all portland cement is used either in making concrete or mortars and, as such, competes in the construction sector with concrete substitutes, such as aluminum, asphalt, clay brick, rammed earth, fiberglass, glass, steel, stone, and wood. A number of materials, especially fly ash and ground granulated blast furnace slag, develop good hydraulic cementitious properties by reacting with the lime released by the hydration of portland cement. Where not constrained in supply, these SCM are increasingly being used as partial substitutes for portland cement in many concrete applications.
eEstimated. 1Portland plus masonry cement unless otherwise noted; excludes Puerto Rico. 2Includes cement made from imported clinker. 3Production of cement (including from imported clinker) + imports (excluding clinker) – exports + adjustments for stock changes. 4Defined as imports (cement and clinker) – exports. 5Hydraulic cement and clinker. 6Capacity includes nearly 6 million tons classified as indefinite idle status rather than closed.
U.S. Geological Survey, Mineral Commodity Summaries, January 2012

40
CESIUM
(Data in kilograms of cesium content unless otherwise noted) Domestic Production and Use
: The United States is 100% import reliant on pollucite, the principal cesium mineral; however, occurrences of pollucite are known in pegmatites in Maine and South Dakota. Pollucite occurs in zoned pegmatites worldwide, associated with lepidolite, petalite, and spodumene, with the largest deposit located at Bernic Lake, Canada. Canada is the leading producer and supplier of pollucite concentrate, which is imported for processing by one company in the United States. The principal end use of cesium is in formate brines, a high-density, low-viscosity fluid used for high-pressure/high-temperature (HPHT) oil and gas drilling and exploration. Other significant end uses of cesium are in biomedical, chemical, and electronic applications, as well as in research. Cesium nitrate is used as a colorant and oxidizer in the pyrotechnic industry, in petroleum cracking, in scintillation counters, and in x-ray phosphors.
Cesium is used as an atomic resonance frequency standard in atomic clocks, playing a vital role in global positioning satellites, Internet, and cell phone transmissions and aircraft guidance systems. Cesium clocks monitor the cycles of microwave radiation emitted by cesium’s electrons and use these cycles as a time reference. Owing to the high accuracy of the cesium atomic clock, the international definition of a second is based on the cesium atom. The U.S. primary time and frequency standard is based on a cesium fountain clock at the National Institute of Standards and Technology in Boulder, CO. Reactor-produced cesium-131 and cesium-137 are used primarily to treat cancer. Both have been used in brachytherapy, where the radioactive source is placed within the cancerous area. With a shorter half-life and higher energy, cesium-131 is used as an alternative to iodine-125 and palladium-103 in the treatment of prostate cancer. Cesium-137 is also widely used in industrial gauges, in mining and geophysical instruments, and for sterilization of food, sewage, and surgical equipment. Cesium can be used in ferrous and nonferrous metallurgy to remove gases and other impurities. Salient Statistics—United States
: Consumption, import, and export data for cesium have not been available since the late 1980s. Because cesium is not traded, a market price is unavailable. Only a few thousand kilograms of cesium is consumed in the United States per year. In 2011, one company offered 1-gram ampoules of 99.8% (metals basis) cesium for $53.60 each and 99.98% (metals basis) cesium for $65.90, an increase of 3.1% and 3.0% from that of 2010, respectively. The price for 50 grams of 99.8% (metals basis) cesium was $661.00, and 100 grams of 99.98% (metals basis) cesium was priced at $1,813.00, an increase of 3.0% from that of 2010 for each product.
Recycling
: Cesium formate brines are typically rented by oil and gas exploration clients. After completion of the well, the used cesium formate is returned and reprocessed for subsequent drilling operations. Approximately 85% of the cesium formate can be retrieved and recycled for further use. There are no data available on the amounts used or recovered.
Import Sources (2007–10)
: Canada is the chief source of pollucite concentrate imported by the United States.
Tariff
: Item Number Normal Trade Relations
Alkali metals, other 2805.19.9000 5.5% ad val. 12-31-11
Chlorides, other 2827.39.9000 3.7% ad val. Depletion Allowance
: 14% (Domestic and foreign).
Government Stockpile
: None.
Prepared by Marc A. Angulo [Contact William E. Brooks, (703) 648-7791, [email protected]]

41 CESIUM
Events, Trends, and Issues
: Domestic cesium occurrences will remain uneconomic unless market conditions change, such as the discovery of new end uses or increased consumption for existing end uses. Commercially useful quantities of inexpensive cesium are available as a byproduct of the production of lithium. Increases in lithium exploration may yield discoveries of additional cesium resources, which may lead to expanded commercial applications. There are no known human health issues associated with cesium, and its use has minimal environmental impact.
Cesium’s cost and reactivity limit its viability in many applications; however, its use in cesium formate brines and nuclear medicine is showing steady growth. Advances have been made in the use of cesium in laser communication, with operational systems slated to come online. Digital radiography systems that use cesium iodide are appearing in the consumer market. Cesium formate drilling operations are being undertaken in the Thar Desert in Pakistan, in the North Sea off the coast of Norway, and in Argentina. In addition to its use in drilling fluid, cesium formate brine is used as a fast-acting liquid pill for releasing drill pipes differentially stuck in oil-based mud (OBM) filter cakes. The pill of formate brine rapidly destroys the OBM filter cake and allows the pipe to be jarred free. The International Atomic Energy Agency has indicated that cesium-137 is one of several radioactive materials that may be used in radiological dispersion devices or “dirty bombs.” Cesium-137 is now regulated in the United States by the U.S. Nuclear Regulatory Commission (NRC) and the Environmental Protection Agency (EPA). The NRC monitors devices containing cesium-137 and requires users to obtain specific licenses for these devices. The EPA places a maximum allowance of cesium-137 that can be released into the air by nuclear facilities and requires the cleanup of contaminated soil and groundwater. The NRC agreed to encourage research into finding and implementing alternatives but deemed that a near-term replacement was not practical and would be detrimental to current emergency medical capabilities. World Mine Production and Reserves
: Pollucite, mainly formed in association with lithium-rich, lepidolite-bearing or petalite-bearing zoned granite pegmatites, is the principal cesium ore mineral. Cesium reserves are therefore estimated based on the occurrence of pollucite, which is mined as a byproduct of the lithium mineral lepidolite. Most pollucite contains 5% to 32% Cs2O. Data on cesium resources and mine production are either limited or not available. The main pollucite zone at Bernic Lake in Canada contains approximately 400,000 metric tons of pollucite, with an average Cs2O content of 24%, and a secondary zone of approximately 100,000 metric tons of pollucite contains an average of 5% Cs2O. The next largest occurrence that may become economic is in Zimbabwe.
Reserves1 Canada 70,000,000 Other countries World total (rounded) 70,000,000
NA
World Resources
: World resources of cesium have not been estimated. Cesium is associated with lithium-bearing pegmatites worldwide, and cesium resources have been identified in Namibia and Zimbabwe. Smaller concentrations are also known in brines in Chile and China and in geothermal systems in Germany, India, and Tibet.
Substitutes
: Cesium and rubidium can be used interchangeably in many applications because they have similar physical properties and atomic radii. Cesium, however, is more electropositive than rubidium, making it a preferred material for some applications.
NA Not available. 1See Appendix C for resource/reserve definitions and information concerning data sources.
U.S. Geological Survey, Mineral Commodity Summaries, January 2012

42
CHROMIUM
(Data in thousand metric tons gross weight unless otherwise noted) Domestic Production and Use
: In 2011, the United States was expected to consume about 5% of world chromite ore production in various forms of imported materials, such as chromite ore, chromium chemicals, chromium ferroalloys, chromium metal, and stainless steel. One U.S. company mined chromite ore in Oregon. Imported chromite ore was consumed by one chemical firm to produce chromium chemicals. One company produced chromium metal. Stainless- and heat-resisting-steel producers were the leading consumers of ferrochromium. Superalloys require chromium. The value of chromium material consumption in 2010 was $883 million as measured by the value of net imports, excluding stainless steel, and was expected to be about $720 million in 2011.
Salient Statistics—United States:1 2007 2008 2009 2010 Production:
2011e
Mine — — — — NA Recycling2 162 146 141 144 160 Imports for consumption 485 559 273 499 430 Exports 291 287 280 274 200 Government stockpile releases 137 11 25 14 1 Consumption: Reported (includes recycling) 442 401 369 396 380 Apparent3 (includes recycling) 493 432 160 383 400 Unit value, average annual import (dollars per metric ton): Chromite ore (gross mass) 156 227 227 212 330 Ferrochromium (chromium content) 1,951 3,728 2,085 2,564 2,300 Chromium metal (gross mass) 8,331 11,078 9,896 11,322 14,500 Stocks, yearend, held by U.S consumers 10 7 7 7 5 Net import reliance4 as a percentage of apparent consumption 67 66 12 62 60 Recycling
: In 2011, recycled chromium (contained in reported stainless steel scrap receipts) accounted for 40% of apparent consumption.
Import Sources (2007–10)
: Chromium contained in chromite ore, chromium ferroalloys and metal, and stainless steel mill products and scrap: South Africa, 34%; Kazakhstan, 17%; Russia, 9%; China, 5%; and other, 35%.
Tariff
:5 Item Number Normal Trade Relations
Ore and concentrate 2610.00.0000 Free. 12-31-11
Ferrochromium: Carbon more than 4% 7202.41.0000 1.9% ad val. Carbon more than 3% 7202.49.1000 1.9% ad val. Other: Carbon more than 0.5% 7202.49.5010 3.1% ad val. Other 7202.49.5090 3.1% ad val. Ferrochromium silicon 7202.50.0000 10% ad val. Chromium metal: Unwrought, powder 8112.21.0000 3% ad val. Waste and scrap 8112.22.0000 Free. Other 8112.29.0000 3% ad val. Depletion Allowance
: 22% (Domestic), 14% (Foreign).
Government Stockpile
: In fiscal year (FY) 2011, which ended on September 30, 2011, the Defense Logistics Agency, DLA Strategic Materials reported disposals of 190 tons of high-carbon ferrochromium, 4,509 tons of low-carbon ferrochromium, and 193 tons of chromium metal. Disposals in the following table are estimated as the change in DLA Strategic Materials’ reported current year minus previous year physical inventory, with adjustments for accounting changes when appropriate. Metallurgical-grade chromite ore and ferrochromium silicon stocks were exhausted in FY 2002; chemical- and refractory-grade chromite ore stocks were exhausted in FY 2004. The DLA Strategic Materials announced that maximum disposal limits for FY 2012 were 90,718 tons of ferrochromium and 454 tons of chromium metal.
Prepared by John F. Papp [(703) 648-4963, [email protected]]

43 CHROMIUM
Stockpile Status—9-30-116
Average Uncommitted Authorized Disposal plan Disposals chromium Material inventory for disposal FY 2011 FY 2011 content Ferrochromium: High-carbon 95.2 — 790.7 0.190 71.4% Low-carbon 55.1 — (7) 4.51 71.4% Chromium metal 4.24 — 0.454 0.193 100% Events, Trends, and Issues
: Most chromite ore is converted into ferrochromium that is consumed by the metallurgical industry and most of that is consumed to make stainless and heat-resisting steel. The year 2011 was characterized by uncertainty resulting from the escalating Eurozone debt crisis. World ingot and slab equivalent stainless and heat-resisting steel production at the end of the first half of 2011 was on track to reach 32 million tons for the year. At 32 million tons, an historically high stainless and heat-resisting steel world production would be reached.
World Mine Production and Reserves
: Reserves for India were revised based on information reported by the government of India. Reserves for Kazakhstan and South Africa were revised based on Joint Ore Reserves Committee (JORC) complaint information reported by mining companies.
Mine production8 Reserves9 2010 2011e
United States — NA 620 (shipping grade)10
India 3,800 3,800 54,000 Kazakhstan 3,830 3,900 220,000 South Africa 10,900 11,000 200,000 Other countries 5,170 5,300 World total (rounded) 23,700 24,000 >480,000
NA
World Resources
: World resources are greater than 12 billion tons of shipping-grade chromite, sufficient to meet conceivable demand for centuries. About 95% of the world’s chromium resources is geographically concentrated in Kazakhstan and southern Africa; U.S. chromium resources are mostly in the Stillwater Complex in Montana.
Substitutes
: Chromium has no substitute in stainless steel, the leading end use, or in superalloys, the major strategic end use. Chromium-containing scrap can substitute for ferrochromium in some metallurgical uses.
eEstimated. NA Not available. — Zero. 1Data in thousand metric tons of contained chromium unless otherwise noted. 2Recycling production is based on reported stainless steel scrap receipts. 3Calculated consumption of chromium; equal to production (from mines and recycling) + imports – exports + stock adjustments. 4Defined as imports – exports + adjustments for Government and industry stock changes. 5In addition to the tariff items listed, certain imported chromium materials (see 26 U.S.C. sec. 4661, 4662, and 4672) are subject to excise tax. 6See Appendix B for definitions. 7Disposal plan for ferrochromium without distinction between high-carbon and low-carbon ferrochromium; total included in high-carbon. 8Mine production units are thousand metric tons, gross weight, of marketable chromite ore. 9See Appendix C for resource/reserve definitions and information concerning data sources. 10Reserves units are thousand metric tons of shipping-grade chromite ore, which is deposit quantity and grade normalized to 45% Cr2O3.
U.S. Geological Survey, Mineral Commodity Summaries, January 2012

44
CLAYS
(Data in thousand metric tons unless otherwise noted) Domestic Production and Use
: In 2011, clay and shale production was reported in 40 States. About 175 companies operated approximately 800 clay pits or quarries. The leading 20 firms supplied about 51% of the tonnage and 79% of the value for all types of clay sold or used in the United States. In 2011, sales or use was estimated to be 25.9 million tons valued at $1.56 billion. Major uses for specific clays were estimated to be as follows: ball clay—39% floor and wall tile, 21% sanitaryware, and 40% other uses; bentonite—30% absorbents, 26% drilling mud, 13% iron ore pelletizing, 12% foundry sand bond, and 19% other uses; common clay—47% brick, 25% lightweight aggregate, 21% cement, and 7% other uses; fire clay—50% heavy clay products, 50% refractory products and other uses; fuller’s earth—72% absorbent uses and 28% other uses; and kaolin—44% paper and 56% other uses.
Salient Statistics—United States:1 2007 2008 2009 2010 Production, mine:
2011e
Ball clay 1,070 967 831 912 940 Bentonite 4,820 4,910 3,650 4,630 4,950 Common clay 20,600 17,500 12,500 12,100 12,200 Fire clay 565 296 320 216 240 Fuller’s earth 2,600 22,340 22,010 22,050 22,100 Kaolin 7,110 6,740 5,290 5,370 Total3 36,700 232,700 224,500 225,300 225,900
5,480
Imports for consumption: Artificially activated clay and earth 23 25 27 28 18 Kaolin 194 330 281 239 300 Other 14 20 26 34 Total3 231 375 334 301 340
25
Exports: Ball clay 83 65 35 45 60 Bentonite 1,430 1,090 709 953 980 Fire clay4 425 393 328 404 390 Fuller’s earth 134 127 90 100 105 Kaolin 3,300 2,960 2,290 2,470 2,500 Clays, not elsewhere classified 279 153 374 382 Total3 5,650 4,790 3,830 4,350 4,390
350
Consumption, apparent 31,300 28,300 21,000 21,300 21,900 Price, average, dollars per ton: Ball clay 46 46 45 46 47 Bentonite 52 49 57 59 60 Common clay 11 12 13 12 13 Fire clay 42 40 30 31 32 Fuller’s earth 97 298 2102 2107 110 Kaolin 135 134 135 146 150 Employment, number:e Mine 1,150 1,060 875 828 810 Mill 5,080 5,020 4,540 4,400 4,200 Net import reliance5 as a percentage of apparent consumption E E E E E Recycling
: Insignificant.
Import Sources (2007–10)
: Brazil, 76%; Mexico, 6%; Canada, 5%; United Kingdom, 3%; and other, 10%.
Prepared by Robert L. Virta [(703) 648-7726, [email protected]]
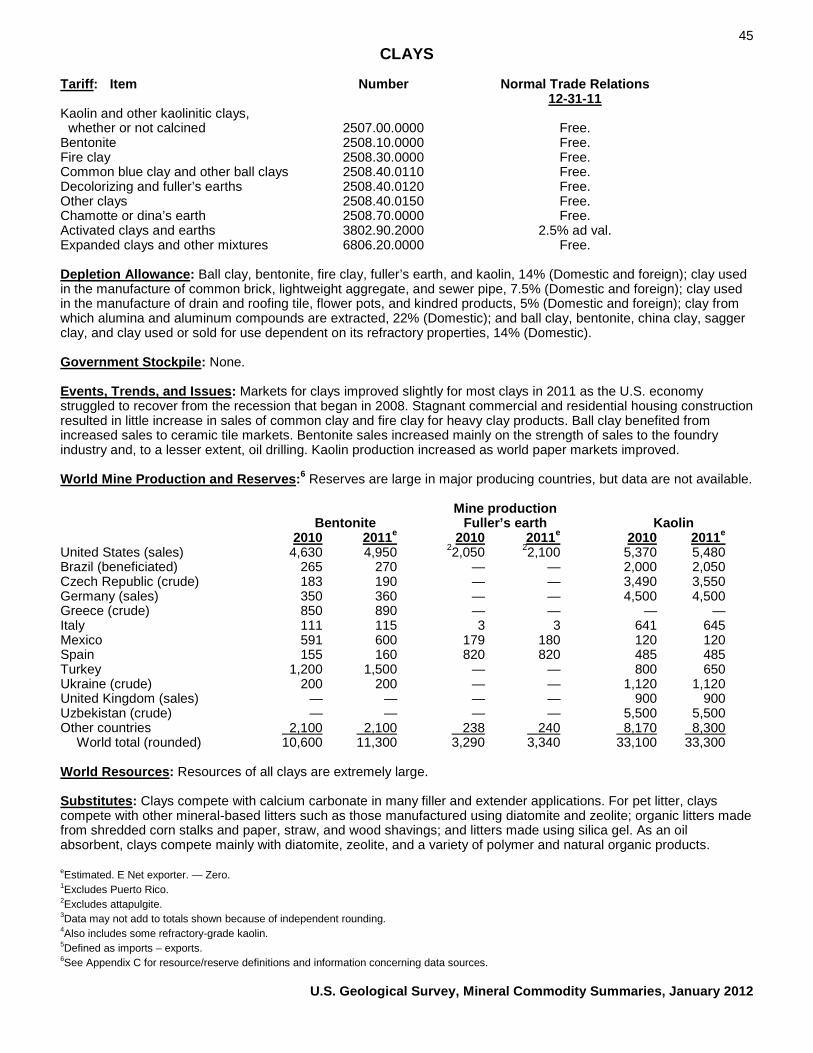
45 CLAYS
Tariff
: Item Number Normal Trade Relations
Kaolin and other kaolinitic clays, 12-31-11
whether or not calcined 2507.00.0000 Free. Bentonite 2508.10.0000 Free. Fire clay 2508.30.0000 Free. Common blue clay and other ball clays 2508.40.0110 Free. Decolorizing and fuller’s earths 2508.40.0120 Free. Other clays 2508.40.0150 Free. Chamotte or dina’s earth 2508.70.0000 Free. Activated clays and earths 3802.90.2000 2.5% ad val. Expanded clays and other mixtures 6806.20.0000 Free. Depletion Allowance
: Ball clay, bentonite, fire clay, fuller’s earth, and kaolin, 14% (Domestic and foreign); clay used in the manufacture of common brick, lightweight aggregate, and sewer pipe, 7.5% (Domestic and foreign); clay used in the manufacture of drain and roofing tile, flower pots, and kindred products, 5% (Domestic and foreign); clay from which alumina and aluminum compounds are extracted, 22% (Domestic); and ball clay, bentonite, china clay, sagger clay, and clay used or sold for use dependent on its refractory properties, 14% (Domestic).
Government Stockpile
: None.
Events, Trends, and Issues
: Markets for clays improved slightly for most clays in 2011 as the U.S. economy struggled to recover from the recession that began in 2008. Stagnant commercial and residential housing construction resulted in little increase in sales of common clay and fire clay for heavy clay products. Ball clay benefited from increased sales to ceramic tile markets. Bentonite sales increased mainly on the strength of sales to the foundry industry and, to a lesser extent, oil drilling. Kaolin production increased as world paper markets improved.
World Mine Production and Reserves
:6 Reserves are large in major producing countries, but data are not available.
Mine production Bentonite Fuller’s earth Kaolin 2010 2011e 2010 2011e 2010 United States (sales) 4,630 4,950 22,050 22,100 5,370 5,480
2011e
Brazil (beneficiated) 265 270 — — 2,000 2,050 Czech Republic (crude) 183 190 — — 3,490 3,550 Germany (sales) 350 360 — — 4,500 4,500 Greece (crude) 850 890 — — — — Italy 111 115 3 3 641 645 Mexico 591 600 179 180 120 120 Spain 155 160 820 820 485 485 Turkey 1,200 1,500 — — 800 650 Ukraine (crude) 200 200 — — 1,120 1,120 United Kingdom (sales) — — — — 900 900 Uzbekistan (crude) — — — — 5,500 5,500 Other countries 2,100 2,100 238 240 8,170 World total (rounded) 10,600 11,300 3,290 3,340 33,100 33,300
8,300
World Resources
: Resources of all clays are extremely large.
Substitutes
: Clays compete with calcium carbonate in many filler and extender applications. For pet litter, clays compete with other mineral-based litters such as those manufactured using diatomite and zeolite; organic litters made from shredded corn stalks and paper, straw, and wood shavings; and litters made using silica gel. As an oil absorbent, clays compete mainly with diatomite, zeolite, and a variety of polymer and natural organic products.
eEstimated. E Net exporter. — Zero. 1Excludes Puerto Rico. 2Excludes attapulgite. 3Data may not add to totals shown because of independent rounding. 4Also includes some refractory-grade kaolin. 5Defined as imports – exports. 6See Appendix C for resource/reserve definitions and information concerning data sources.
U.S. Geological Survey, Mineral Commodity Summaries, January 2012

46
COBALT
(Data in metric tons of cobalt content unless otherwise noted) Domestic Production and Use
: Significant U.S. cobalt mine production has not been reported since 1971, and production of refined cobalt from imported nickel-copper-cobalt matte ceased in 1985. U.S. supply comprised imports, stock releases, and secondary (scrap) materials. The sole U.S. producer of extra-fine cobalt powder, in Pennsylvania, used cemented carbide scrap as feed. Seven companies were known to produce cobalt compounds. More than 60 industrial consumers were surveyed on a monthly or annual basis. Data reported by these consumers indicate that 47% of the cobalt consumed in the United States was used in superalloys, mainly in aircraft gas turbine engines; 9% in cemented carbides for cutting and wear-resistant applications; 16% in various other metallic applications; and 28% in a variety of chemical applications. The total estimated value of cobalt consumed in 2011 was $380 million.
Salient Statistics—United States: 2007 2008 2009 2010 Production:
2011e
Mine — — — — — Secondary 1,930 1,930 1,790 2,000 2,200 Imports for consumption 10,300 10,700 7,680 11,100 10,000 Exports 3,100 2,850 2,440 2,640 3,400 Shipments from Government stockpile excesses1 617 203 180 -8 — Consumption: Reported (includes secondary) 9,320 8,820 7,470 8,030 9,000 Apparent2 (includes secondary) 9,630 10,100 7,580 10,300 8,700 Price, average, dollars per pound: Spot, cathode3 30.55 39.01 17.86 20.85 18.00 London Metal Exchange (LME), cash XX XX XX XX 16.00 Stocks, yearend: Industry 1,310 1,160 780 880 930 LME, U.S. warehouse XX XX XX 23 40 Net import reliance4 as a percentage of apparent consumption 80 81 76 81 75 Recycling
: In 2011, cobalt contained in purchased scrap represented an estimated 24% of cobalt reported consumption.
Import Sources (2007–10)
: Cobalt contained in metal, oxide, and salts: China, 18%; Norway, 16%; Russia, 13%; Canada, 10%; and other, 43%.
Tariff
: Item Number Normal Trade Relations5
Cobalt ores and concentrates 2605.00.0000 Free. 12-31-11
Chemical compounds: Cobalt oxides and hydroxides 2822.00.0000 0.1% ad val. Cobalt chlorides 2827.39.6000 4.2% ad val. Cobalt sulfates 2833.29.1000 1.4% ad val. Cobalt carbonates 2836.99.1000 4.2% ad val. Cobalt acetates 2915.29.3000 4.2% ad val. Unwrought cobalt, alloys 8105.20.3000 4.4% ad val. Unwrought cobalt, other 8105.20.6000 Free. Cobalt mattes and other intermediate products; cobalt powders 8105.20.9000 Free. Cobalt waste and scrap 8105.30.0000 Free. Wrought cobalt and cobalt articles 8105.90.0000 3.7% ad val. Depletion Allowance
: 22% (Domestic), 14% (Foreign).
Government Stockpile
:
Stockpile Status—9-30-116 Uncommitted Authorized Disposal plan Disposals Material inventory for disposal FY 2011 FY 2011 Cobalt 301 301 301 — Prepared by Kim B. Shedd [(703) 648-4974, [email protected]]

47 COBALT
Events, Trends, and Issues
: During the first half of 2011, the world availability of refined cobalt (as measured by production and U.S. Government shipments) was 12% higher than that of the first half of 2010. China showed the largest increase in production; production from Canada, Finland, and Zambia also increased significantly. In the next few years, global increases in supply from existing producers and new projects are forecast to outpace increases in consumption. If an oversupply of cobalt takes place, it could lead to a downward trend in prices.
Worldwide cobalt inventories in London Metal Exchange (LME) warehouses increased to 325 tons in late November from 278 tons at yearend 2010. China was the world’s leading producer of refined cobalt, and much of its production was from cobalt-rich ore and partially refined cobalt imported from Congo (Kinshasa). China was a leading supplier of cobalt imports to the United States. World Mine Production and Reserves
: Reserves for Brazil were revised based on information from a Government report. Reserves for Canada and “Other countries” were revised based on company reports.
Mine production Reserves7 2010 United States — — 33,000
2011e
Australia 3,850 4,000 81,400,000 Brazil 1,600 1,700 87,000 Canada 4,600 7,200 130,000 China 6,500 6,500 80,000 Congo (Kinshasa) 47,400 52,000 3,400,000 Cuba 3,600 3,600 500,000 Morocco 2,200 2,500 20,000 New Caledonia9 1,000 2,000 370,000 Russia 6,200 6,300 250,000 Zambia 5,700 5,700 270,000 Other countries 6,800 7,000 World total (rounded) 89,500 98,000 7,500,000
990,000
World Resources
: Identified cobalt resources of the United States are estimated to be about 1 million tons. Most of these resources are in Minnesota, but other important occurrences are in Alaska, California, Idaho, Missouri, Montana, and Oregon. With the exception of resources in Idaho and Missouri, any future cobalt production from these deposits would be as a byproduct of another metal. Identified world cobalt resources are about 15 million tons. The vast majority of these resources are in nickel-bearing laterite deposits, with most of the rest occurring in nickel-copper sulfide deposits hosted in mafic and ultramafic rocks in Australia, Canada, and Russia, and in the sedimentary copper deposits of Congo (Kinshasa) and Zambia. In addition, as much as 1 billion tons of hypothetical and speculative cobalt resources may exist in manganese nodules and crusts on the ocean floor.
Substitutes
: In some applications, substitution for cobalt would result in a loss in product performance. Potential substitutes include barium or strontium ferrites, neodymium-iron-boron, or nickel-iron alloys in magnets; cerium, iron, lead, manganese, or vanadium in paints; cobalt-iron-copper or iron-copper in diamond tools; copper-iron-manganese for curing unsaturated polyester resins; iron-cobalt-nickel, nickel, cermets, or ceramics in cutting and wear-resistant materials; iron-phosphorous, manganese, nickel-cobalt-aluminum, or nickel-cobalt-manganese in lithium-ion batteries; nickel-based alloys or ceramics in jet engines; nickel in petroleum catalysts; and rhodium in hydroformylation catalysts.
eEstimated. XX Not applicable. — Zero. 1Negative numbers are the result of inventory adjustments. 2The sum of U.S. net import reliance and secondary production, as estimated from consumption of purchased scrap. 3As reported by Platts Metals Week. 4Defined as imports – exports + adjustments for Government and industry stock changes. 5No tariff for Canada or Mexico. Tariffs for other countries for some items may be eliminated under special trade agreements. 6See Appendix B for definitions. 7See Appendix C for resource/reserve definitions and information concerning data sources. 8Joint Ore Reserves Committee (JORC) compliant reserves for Australia were about 360,000 tons. 9Overseas territory of France.
U.S. Geological Survey, Mineral Commodity Summaries, January 2012

48
COPPER
(Data in thousand metric tons of copper content unless otherwise noted) Domestic Production and Use
: U.S. mine production of copper in 2011 increased slightly to about 1.1 million tons and its value rose to about $10 billion. Arizona, Utah, New Mexico, Nevada, and Montana—in descending order of production—accounted for more than 99% of domestic mine production; copper also was recovered in Idaho and Missouri. Twenty-nine mines recovered copper, 18 of which accounted for about 99% of production. Three primary smelters, 3 electrolytic and 3 fire refineries, and 15 electrowinning facilities operated during the year. Refined copper and scrap were consumed by about 30 brass mills, 15 rod mills, and 500 foundries and miscellaneous consumers. Copper and copper alloy products were used in building construction, 45%; electric and electronic products, 23%; transportation equipment, 12%; consumer and general products, 12%; and industrial machinery and equipment, 8%.1
Salient Statistics—United States: 2007 2008 2009 2010 Production:
2011e
Mine 1,170 1,310 1,180 1,110 1,120 Refinery: Primary 1,270 1,220 1,110 1,060 1,000 Secondary 46 54 46 38 40 Copper from all old scrap 158 156 138 131 130 Imports for consumption: Ores and concentrates 1 1 (2) 1 1 Refined 829 724 664 605 660 General imports, refined 832 721 645 583 650 Exports: Ores and concentrates 134 301 151 137 220 Refined 51 37 81 78 35 Consumption: Reported, refined 2,140 2,020 1,650 1,760 1,780 Apparent, unmanufactured3 2,270 1,990 1,580 1,740 1,750 Price, average, cents per pound: Domestic producer, cathode 328.0 319.2 241.2 348.3 405 London Metal Exchange, high-grade 322.8 315.5 233.6 341.7 400 Stocks, yearend, refined, held by U.S. producers, consumers, and metal exchanges 130 199 434 384 380 Employment, mine and mill, thousands 9.7 11.9 8.3 89.1 10.5 Net import reliance4 as a percentage of apparent consumption 37 31 21 32 35 Recycling
: Old scrap, converted to refined metal and alloys, provided 130,000 tons of copper, equivalent to 7% of apparent consumption. Purchased new scrap, derived from fabricating operations, yielded 650,000 tons of contained copper. Of the total copper recovered from scrap (including aluminum- and nickel-based scrap), brass mills recovered 73%; miscellaneous manufacturers, foundries, and chemical plants, 13%; ingot makers, 9%; and copper smelters and refiners, 5%. Copper in all old and new, refined or remelted scrap contributed about 35% of the U.S. copper supply.
Import Sources (2007–10)
: Unmanufactured: Chile, 42%; Canada, 33%; Peru, 13%; Mexico, 6%; and other, 6%. Refined copper accounted for 83% of unwrought copper imports.
Tariff
: Item Number Normal Trade Relations5
Copper ores and concentrates 2603.00.0000 1.7¢/kg on lead content. 12-31-11
Unrefined copper anode 7402.00.0000 Free. Refined and alloys; unwrought 7403.00.0000 1.0% ad val. Copper wire (rod) 7408.11.6000 3.0% ad val. Depletion Allowance
: 15% (Domestic), 14% (Foreign).
Government Stockpile
: The stockpiles of refined copper and brass were liquidated in 1993 and 1994, respectively.
Events, Trends, and Issues
: Refined copper prices trended upward during the second half of 2010, with the London Metal Exchange Ltd. (LME) price ending the year at the then record-high level of $4.44 per pound of copper. Though fluctuating significantly, copper prices mostly remained above $4 per pound through August 2011, with the LME price reaching a record-high $4.60 per pound in February. In September, in response to concern about the effect on copper
Prepared by Daniel L. Edelstein [(703) 648-4978, [email protected]]

49 COPPER
demand from the mounting debt crises in the European Union and slower growth policies in China, the spot price fell sharply to $3.16 per pound during a 1-week period, the lowest level since July 2010. In September, however, the International Copper Study Group6 projected that global refined copper demand in 2011 would exceed refined copper production by about 200,000 tons, continuing the production deficit experienced in 2010, as operational problems and labor unrest, including strikes in Chile and Indonesia, continued to constrain world copper mine output. Global consumption and production of refined copper were projected to increase by 1.5% and 2.3%, respectively, in 2011. U.S. mine production rose slightly in 2011 as restorations of mine cutbacks instituted at yearend 2008 were mostly offset by lower ore grades at a major producer. Electrolytic refinery production declined owing to the 2010 closure of a refinery that treated imported anode and to lower domestic smelter output, the latter resulting in increased concentrate exports. U.S. copper mine production was expected to rise by more than 100,000 tons in 2012, primarily owing to continued restoration of cutbacks. Domestic consumption of refined copper was nearly unchanged in 2011. World Mine Production and Reserves
: Significant upward revision to Chile’s reserves is based on revised company reports and new developments. For Australia, Geoscience Australia’s “Accessible Economic Demonstrated Resources” are reported; Joint Ore Reserves Committee (JORC) compliant reserves for Australia were only about 25 million tons. The Kazakhstan reserve estimate was revised downward to reflect international reporting standards.
Mine production Reserves7 2010 United States 1,110 1,120 35,000
2011e
Australia 870 940 86,000 Canada 525 550 7,000 Chile 5,420 5,420 190,000 China 1,190 1,190 30,000 Congo (Kinshasa) 343 440 20,000 Indonesia 872 625 28,000 Kazakhstan 380 360 7,000 Mexico 260 365 38,000 Peru 1,250 1,220 90,000 Poland 425 425 26,000 Russia 703 710 30,000 Zambia 690 715 20,000 Other countries 1,900 2,000 World total (rounded) 15,900 16,100 690,000
80,000
World Resources
: A 1998 USGS assessment estimated 550 million tons of copper contained in identified and undiscovered resources in the United States.8 Subsequent USGS reports estimated 1.3 billion tons and 196 million tons of copper in the Andes Mountains of South America and in Mexico, respectively, contained in identified, mined, and undiscovered resources.9, 10 A preliminary assessment indicates that global land-based resources exceed 3 billion tons. Deep-sea nodules and submarine massive sulfides are unconventional copper resources.
Substitutes
: Aluminum substitutes for copper in power cables, electrical equipment, automobile radiators, and cooling and refrigeration tube; titanium and steel are used in heat exchangers; optical fiber substitutes for copper in telecommunications applications; and plastics substitute for copper in water pipe, drain pipe, and plumbing fixtures.
eEstimated. 1Some electrical components are included in each end use. Distribution for 2010 by the Copper Development Association, Inc., 2011. 2Less than ½ unit. 3Defined as primary refined production + copper from old scrap converted to refined metal and alloys + refined imports – refined exports ± changes in refined stocks. General imports were used to calculate apparent consumption. 4Defined as imports – exports + adjustments for Government and industry stock changes for refined copper. 5No tariff for Canada, Chile, Mexico, and Peru for items shown. Tariffs for other countries may be eliminated under special trade agreements. 6International Copper Study Group, 2011, Forecast 2011–2012: Lisbon, Portugal, International Copper Study Group press release, October 4, 1 p. 7See Appendix C for resource/reserve definitions and information concerning data sources. 8U.S. Geological Survey National Mineral Resource Assessment Team, 2000, 1998 assessment of undiscovered deposits of gold, silver, copper, lead, and zinc in the United States: U.S. Geological Survey Circular 1178, 21 p. 9Cunningham, C.G., and others, 2008, Quantitative mineral resource assessment of copper, molybdenum, gold, and silver in undiscovered porphyry copper deposits in the Andes Mountains of South America: U.S. Geological Survey Open-File Report 2008–1253, 282 p. 10Hammarstrom, J.M., and others, 2010, Global mineral resource assessment—Porphyry copper assessment of Mexico: U.S. Geological Survey Scientific Investigations Report 2010–5090–A, 176 p.
U.S. Geological Survey, Mineral Commodity Summaries, January 2012

50
DIAMOND (INDUSTRIAL)
(Data in million carats unless otherwise noted) Domestic Production and Use
: In 2011, total domestic production of industrial diamond was estimated to be 98.2 million carats, and the United States was one of the world’s leading markets. Domestic output was synthetic grit, powder, and stone. Two firms, one in Pennsylvania and another in Ohio, accounted for all of the production. Nine firms produced polycrystalline diamond from diamond powder. Three companies recovered used industrial diamond as one of their principal operations. Total domestic secondary production of industrial diamond was estimated to be 35 million carats. The following industry sectors were the major consumers of industrial diamond: computer chip production, construction, machinery manufacturing, mining services (drilling for mineral, oil, and gas exploration), stone cutting and polishing, and transportation systems (infrastructure and vehicles). Stone cutting and highway building, milling, and repair consumed most of the industrial diamond stone. About 99% of the U.S. industrial diamond market now uses synthetic industrial diamond because its quality can be controlled and its properties can be customized to fit specific requirements.
Salient Statistics—United States: 2007 2008 2009 2010 Bort, grit, and dust and powder; natural and synthetic:
2011e
Production: Manufactured diamonde 48 48.3 38.3 39.3 41 Secondary 34.4 33.9 33.5 33.4 35 Imports for consumption 411 492 246 596 810 Exports1 107 116 67 113 170 Consumption, apparent 386 458 251 556 720 Price, value of imports, dollars per carat 0.19 0.15 0.17 0.14 0.13 Net import reliance2 as a percentage of apparent consumption 79 82 71 87 89 Stones, natural and synthetic: Production: Manufactured diamonde 82 83.1 52.7 53.7 57 Secondary 0.38 0.36 0.46 0.46 0.31 Imports for consumption3 3.1 3.22 1.4 1.72 1.9 Exports1 — — — — — Sales from Government stockpile excesses (4) 0.47 — — — Consumption, apparent 85.5 87.1 54.6 55.9 59 Price, value of imports, dollars per carat 11.54 12.89 13.31 18.78 26.70 Net import reliance2 as a percentage of apparent consumption 4 4 3 3 3 Recycling
: In 2011, the amount of diamond bort, grit, and dust and powder recycled was estimated to be 34.7 million carats. Lower prices of newly produced industrial diamond appear to be reducing the number and scale of diamond stone recycling operations. In 2011, it was estimated that 309,000 carats of diamond stone was recycled.
Import Sources (2007–10)
: Bort, grit, and dust and powder; natural and synthetic: China, 70%; Ireland, 17%; Republic of Korea, 4%; Russia, 4%; and other, 5%. Stones, primarily natural: Botswana, 46%; South Africa, 27%; Russia, 8%; Namibia, 8%; and other, 11%.
Tariff
: Item Number Normal Trade Relations
Industrial Miners’ diamonds, carbonados 7102.21.1010 Free. 12-31-11
Industrial Miners’ diamonds, other 7102.21.1020 Free. Industrial diamonds, simply sawn, cleaved, or bruted 7102.21.3000 Free. Industrial diamonds, not worked 7102.21.4000 Free. Industrial diamonds, other 7102.29.0000 Free. Grit or dust and powder of natural or synthetic diamonds 7105.10.0000 Free. Depletion Allowance
: 14% (Domestic and foreign).
Government Stockpile
: None.
Prepared by Donald W. Olson [(703) 648-7721, [email protected]]

51 DIAMOND (INDUSTRIAL)
Events, Trends, and Issues
: In 2011, China was the world’s leading producer of synthetic industrial diamond, with annual production exceeding 4 billion carats. The United States is likely to continue to be one of the world’s leading markets for industrial diamond into the next decade and likely will remain a significant producer and exporter of synthetic industrial diamond as well. Owing to continued recovery from impacts of the economic recession on U.S. manufacturing sectors that utilize industrial diamond, U.S. imports in 2011 increased an estimated 37% compared with those of 2010. U.S. demand for industrial diamond is likely to continue in the construction sector as the United States continues building, milling, and repairing the Nation’s highway system. Industrial diamond coats the cutting edge of saws used to cut cement in highway construction and repair work.
Demand for synthetic diamond grit and powder is expected to remain greater than that for natural diamond material. Constant-dollar prices of synthetic diamond products probably will continue to decline as production technology becomes more cost effective; the decline is even more likely if competition from low-cost producers in China and Russia continues to increase. World Mine Production and Reserves Mine production Reserves6
:5
2010 United States — — NA
2011e
Australia 10 10 110 Botswana 7 7 130 China 1 1 10 Congo (Kinshasa) 22 22 150 Russia 15 15 40 South Africa 5 5 70 Other countries 4 4 World total (rounded) 64 64 600
85
World Resources
: Natural diamond resources have been discovered in more than 35 countries. Natural diamond accounts for about 1.4% of all industrial diamond used, while synthetic diamond accounts for the remainder. At least 15 countries have the technology to produce synthetic diamond.
Substitutes
: Materials that can compete with industrial diamond in some applications include manufactured abrasives, such as cubic boron nitride, fused aluminum oxide, and silicon carbide. Synthetic diamond rather than natural diamond is used for about 98.6% of industrial applications.
eEstimated. NA Not available. — Zero. 1Reexports no longer are combined with exports because increasing amounts of U.S. reexports obscure apparent consumption rates. 2Defined as imports – exports + adjustments for Government and industry stock changes. 3May include synthetic miners’ diamond. 4Less than ½ unit. 5Natural industrial diamond only. Note that synthetic diamond production far exceeds natural industrial diamond output. Worldwide production of manufactured industrial diamond totaled at least 4.38 billion carats in 2011; the leading producers included Belarus, China, Ireland, Japan, Russia, South Africa, Sweden, and the United States. 6See Appendix C for resource/reserve definitions and information concerning data sources.
U.S. Geological Survey, Mineral Commodity Summaries, January 2012

52
DIATOMITE
(Data in thousand metric tons unless otherwise noted) Domestic Production and Use
: In 2011, domestic production of diatomite was estimated at 600,000 tons with an estimated processed value of $180 million, f.o.b. plant. Seven companies produced diatomite at 10 mining areas and 9 processing facilities in California, Nevada, Oregon, and Washington. Diatomite is frequently used in filter aids, 67%; cement additives, 15%; absorbents, 11%; fillers, 7%; and less than 1% for other applications, including specialized pharmaceutical and biomedical uses. The unit value of diatomite varied widely in 2011, from less than $9.00 per ton for cement manufacture to more than $700 per ton for limited specialty markets, including art supplies, cosmetics, and DNA extraction. The average unit value for filter-grade diatomite was $395 per ton.
Salient Statistics—United States: 2007 2008 2009 2010
Production1 687 764 575 595 600 2011e
Imports for consumption 4 3 1 1 1 Exports 143 151 88 86 120 Consumption, apparent 548 616 488 510 490 Price, average value, dollars per ton, f.o.b. plant 237 224 255 299 300 Stocks, producer, yearende 40 40 40 40 40 Employment, mine and plant, numbere 700 700 670 660 660 Net import reliance2 as a percentage of apparent consumption E E E E E Recycling
: None.
Import Sources (2007–10)
: Spain, 36%; Italy, 22%; Mexico, 17%; Netherlands, 11%; and other, 14%.
Tariff
: Item Number Normal Trade Relations
Siliceous fossil meals, including diatomite 2512.00.0000 Free. 12-31-11
Depletion Allowance
: 14% (Domestic and foreign).
Government Stockpile
: None.
Prepared by Robert D. Crangle, Jr. [(703) 648-6410, [email protected]]

53 DIATOMITE
Events, Trends, and Issues
: The amount of domestically produced diatomite sold or used by producers in 2011 increased slightly compared with that of 2010, while apparent domestic consumption decreased slightly and exports increased. Filtration (including the purification of beer, liquors, and wine, and the cleansing of greases and oils) continued to be the largest end use for diatomite, also known as diatomaceous earth. Domestically, production of diatomite used as an ingredient in portland cement was the next largest use. An important application for diatomite is the removal of microbial contaminants, such as bacteria, protozoa, and viruses in public water systems. Other applications for diatomite include filtration of human blood plasma, pharmaceutical processing, and use as a nontoxic insecticide.
World Mine Production and Reserves Mine production Reserves3
:
2010
United States1 595 600 250,000 2011e
Argentina 50 50 NA China 400 400 110,000 Commonwealth of Independent States 80 80 NA Denmark4 (processed) 225 225 NA France 75 75 NA Japan 110 110 NA Mexico 80 80 NA Spain 50 50 NA Turkey 30 30 NA Other countries 125 105 World total (rounded) 1,820 1,800 Large
NA
World Resources
: World resources of crude diatomite are adequate for the foreseeable future. Transportation costs will continue to determine the maximum economic distance most forms of diatomite may be shipped and still remain competitive with alternative materials.
Substitutes
: Many materials can be substituted for diatomite. However, the unique properties of diatomite assure its continuing use in many applications. Expanded perlite and silica sand compete for filtration. Synthetic filters, notably ceramic, polymeric, or carbon membrane filters and filters made with cellulose fibers, are becoming competitive as filter media. Alternate filler materials include clay, ground limestone, ground mica, ground silica sand, perlite, talc, and vermiculite. For thermal insulation, materials such as various clays, exfoliated vermiculite, expanded perlite, mineral wool, and special brick can be used.
eEstimated. E Net exporter. NA Not available. 1Processed ore sold and used by producers. 2Defined as imports – exports + adjustments for Government and industry stock changes. 3See Appendix C for resource/reserve definitions and information concerning data sources. 4Includes sales of moler production.
U.S. Geological Survey, Mineral Commodity Summaries, January 2012

54
FELDSPAR
(Data in thousand metric tons unless otherwise noted) Domestic Production and Use
: U.S. feldspar production in 2011 was valued at about $43 million. The three leading producers accounted for about 71% of the production, with four other companies supplying the remainder. Producing states were North Carolina, Virginia, Oklahoma, California, Idaho, and South Dakota, in descending order of estimated tonnage. Feldspar processors reported coproduct recovery of mica and silica sand.
Feldspar is ground to about 20 mesh for glassmaking and to 200 mesh or finer for most ceramic and filler applications. It was estimated that feldspar shipments went to at least 30 States and to foreign destinations, including Canada and Mexico. In pottery and glass, feldspar functions as a flux. The estimated 2011 end-use distribution of domestic feldspar was glass, 70%, and pottery and other uses, 30%. Salient Statistics—United States: 2007 2008 2009 2010 Production, marketablee 730 650 550 670 690
2011e
Imports for consumption 4 2 2 2 2 Exports 10 15 8 17 10 Consumption, apparente 724 637 544 655 680 Price, average value, marketable production, dollars per ton 60 62 65 65 63 Employment, mine, preparation plant, and office, numbere 400 450 400 450 450 Net import reliance1 as a percentage of apparent consumption E E E E E Recycling
: There is no recycling of feldspar by producers; however, glass container producers use cullet (recycled glass), thereby reducing feldspar consumption.
Import Sources (2007–10)
: Mexico, 72%; Germany, 17%; Canada, 9%; and other, 2%.
Tariff
: Item Number Normal Trade Relations
Feldspar 2529.10.0000 Free. 12-31-11
Depletion Allowance
: 14% (Domestic and foreign).
Government Stockpile
: None.
Events, Trends, and Issues
: Glass, including beverage containers and insulation for housing and building construction, continued to be the leading end use of feldspar in the United States. Most feldspar consumed by the glass industry is for the manufacture of container glass. The glass container industry was moderately stable, although competing materials in some market segments, such as baby food, fruit juices, mineral water, and wine, and a recent trend to import less expensive containers from China, continued to present challenges. Additionally, increasing use of post-consumer glass collected through local government and neighborhood recycling programs continued to provide additional competition for traditional raw materials, such as feldspar in the manufacture of glass containers.
While recovery for world economic markets from the economic recession in 2008 and 2009 continued to be slow, gradual improvements that began in 2010 continued in 2011. Residential flat glass markets improved slightly in 2011, but remained somewhat sluggish. Housing starts were projected to increase a small amount in 2011, based upon the first 9 months, whereas housing completions were expected to decrease slightly, with significantly fewer completions during the first half of the year compared with those of the same period in 2010. Commercial construction increased slightly. Automotive glass markets increased also. Fiberglass consumption for thermal insulation was forecast to expand in line with housing and commercial building construction in the United States through 2013. Domestic feldspar consumption has been gradually shifting from ceramics toward glass markets. Another growing segment in the glass industry was solar glass, used in the production of solar cells. Prepared by Arnold O. Tanner [(703) 648-4791, [email protected]]
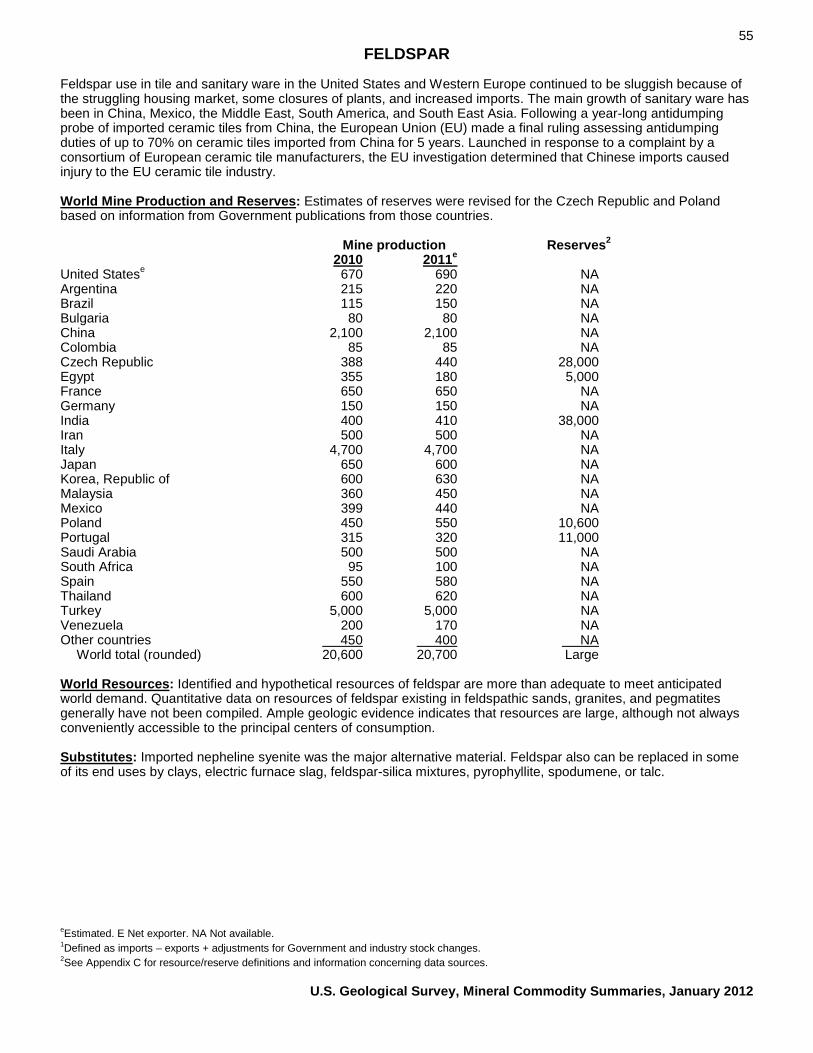
55 FELDSPAR
Feldspar use in tile and sanitary ware in the United States and Western Europe continued to be sluggish because of the struggling housing market, some closures of plants, and increased imports. The main growth of sanitary ware has been in China, Mexico, the Middle East, South America, and South East Asia. Following a year-long antidumping probe of imported ceramic tiles from China, the European Union (EU) made a final ruling assessing antidumping duties of up to 70% on ceramic tiles imported from China for 5 years. Launched in response to a complaint by a consortium of European ceramic tile manufacturers, the EU investigation determined that Chinese imports caused injury to the EU ceramic tile industry. World Mine Production and Reserves
: Estimates of reserves were revised for the Czech Republic and Poland based on information from Government publications from those countries.
Mine production Reserves2 2010 United Statese 670 690 NA
2011e
Argentina 215 220 NA Brazil 115 150 NA Bulgaria 80 80 NA China 2,100 2,100 NA Colombia 85 85 NA Czech Republic 388 440 28,000 Egypt 355 180 5,000 France 650 650 NA Germany 150 150 NA India 400 410 38,000 Iran 500 500 NA Italy 4,700 4,700 NA Japan 650 600 NA Korea, Republic of 600 630 NA Malaysia 360 450 NA Mexico 399 440 NA Poland 450 550 10,600 Portugal 315 320 11,000 Saudi Arabia 500 500 NA South Africa 95 100 NA Spain 550 580 NA Thailand 600 620 NA Turkey 5,000 5,000 NA Venezuela 200 170 NA Other countries 450 400 World total (rounded) 20,600 20,700 Large
NA
World Resources
: Identified and hypothetical resources of feldspar are more than adequate to meet anticipated world demand. Quantitative data on resources of feldspar existing in feldspathic sands, granites, and pegmatites generally have not been compiled. Ample geologic evidence indicates that resources are large, although not always conveniently accessible to the principal centers of consumption.
Substitutes
: Imported nepheline syenite was the major alternative material. Feldspar also can be replaced in some of its end uses by clays, electric furnace slag, feldspar-silica mixtures, pyrophyllite, spodumene, or talc.
eEstimated. E Net exporter. NA Not available. 1Defined as imports – exports + adjustments for Government and industry stock changes. 2See Appendix C for resource/reserve definitions and information concerning data sources.
U.S. Geological Survey, Mineral Commodity Summaries, January 2012

56
FLUORSPAR
(Data in thousand metric tons unless otherwise noted) Domestic Production and Use
: In Illinois, fluorspar (calcium fluoride) was processed and sold from stockpiles produced as a byproduct of limestone quarrying. Byproduct calcium fluoride was recovered from industrial waste streams, although data are not available on exact quantities. Domestically, production of hydrofluoric acid (HF) in Louisiana and Texas was by far the leading use for acid-grade fluorspar. HF is the primary feedstock for the manufacture of virtually all fluorine-bearing chemicals and is also a key ingredient in the processing of aluminum and uranium. Other uses included as a flux in steelmaking, in iron and steel casting, primary aluminum production, glass manufacture, enamels, welding rod coatings, cement production, and other uses or products. In 2011, an estimated 74,000 tons of fluorosilicic acid (equivalent to about 130,000 tons of 92% fluorspar) was recovered from phosphoric acid plants processing phosphate rock. Fluorosilicic acid was used primarily in water fluoridation.
Salient Statistics—United States: 2007 2008 2009 2010 Production:
2011e
Finished, all grades — NA NA NA NA Fluorspar equivalent from phosphate rock 94 111 114 128 130 Imports for consumption: Acid grade 577 496 417 442 430 Metallurgical grade 43 76 58 97 120 Total fluorspar imports 620 572 475 539 550 Fluorspar equivalent from hydrofluoric acid plus cryolite 233 209 175 209 220 Exports 14 19 14 18 23 Shipments from Government stockpile 17 — — — — Consumption: Apparent1 613 528 473 502 520 Reported 539 506 400 448 450 Stocks, yearend, consumer and dealer2 90 115 103 121 130 Net import reliance3 as a percentage of apparent consumption 100 100 100 100 100 Recycling
: A few thousand tons per year of synthetic fluorspar is recovered—primarily from uranium enrichment, but also from petroleum alkylation and stainless steel pickling. Primary aluminum producers recycle HF and fluorides from smelting operations. HF is recycled in the petroleum alkylation process.
Import Sources (2007–10)
: Mexico, 59%; China, 28%; South Africa, 9%; and Mongolia, 4%.
Tariff
: Item Number Normal Trade Relations
Acid grade (97% or more CaF2) 2529.22.0000 Free. 12-31-11
Metallurgical grade (less than 97% CaF2) 2529.21.0000 Free. Depletion Allowance
: 22% (Domestic), 14% (Foreign).
Government Stockpile
: The last of the Government stocks of fluorspar officially were sold in fiscal year 2007.
Events, Trends, and Issues
: Fluorspar prices began rising in the first quarter of 2011 and continued to rise through the summer. Prices for Chinese fluorspar (acidspar and metspar) exhibited the largest increases owing to increases in production costs, appreciation of the Chinese yuan relative to the U.S. dollar, and rising demand. Rising fluorspar prices have caused price increases for fluorspar-derived products such as aluminum fluoride and fluoropolymers.
Canada Fluorspar Inc. (Markham, Ontario, Canada) and French fluorochemicals company Arkema Inc. (Colombes, France) signed an agreement to fund reopening of the St. Lawrence fluorspar mine near the town of St. Lawrence on the Burin Peninsula of Newfoundland Island in the Province of Newfoundland and Labrador, Canada. The agreement called for Arkema to purchase Canada Fluorspar shares and for the two companies to form a limited partnership in which Canada Fluorspar and Arkema each hold 50% stakes. As part of the partnership, Canada Fluorspar and Arkema were to enter into an offtake agreement whereby the partners would each receive a prorated share of the output. In addition, for a period of 10 years, Arkema was to have the right to purchase approximately 20% of CFI’s share of the output.4 The mine last operated in the early 1990s. Prepared by M. Michael Miller [(703) 648-7716, [email protected]]

57 FLUORSPAR
South African fluorspar producer Witkop Fluorspar Mine (Pty.) Ltd. restarted operations in the second quarter. The mine had been on standby since June 2009 (Nicholas Davidoff, Firebird Management LLC, written commun., August 15, 2011). A World Trade Organization (WTO) dispute settlement panel ruled that aspects of China’s export policies on several important industrial raw materials (including fluorspar) are inconsistent with China’s WTO obligations. The panel recommended that China bring its policies into conformity with its WTO obligations, although China had until September 3, 2011, to appeal the findings. The WTO panel’s findings were the result of complaints filed in 2009 by the European Union, Mexico, and the United States about China’s policy of applying export duties, export licenses, export quotas, and minimum export prices on fluorspar and several other mineral commodities. The panel found that China’s export duties and export quotas were inconsistent with WTO rules, and that certain aspects of China’s export licensing system restrict exports and are therefore inconsistent with WTO rules. Concerning China’s argument that its export policies were justified on grounds of natural resource conservation, the panel found that China was unable to prove that it imposed such export restrictions while restricting domestic production or consumption of the raw materials in order to conserve the raw materials. World Mine Production and Reserves
: Production estimates for individual countries were made using country or company specific data where available; other estimates were made based on general knowledge of end-use markets. The reserve estimate for Mongolia has been revised based on new information.
Mine production Reserves5, 6 2010 United States NA NA NA
2011e
Brazil 64 65 NA China 3,300 3,300 24,000 Kazakhstan 67 70 NA Kenya 44 115 2,000 Mexico 1,070 1,080 32,000 Mongolia 420 430 22,000 Morocco 75 90 NA Namibia 95 100 3,000 Russia 250 250 NA South Africa 200 270 41,000 Spain 135 140 6,000 Other countries 290 300 World total (rounded) 6,010 6,200 240,000
110,000
World Resources
: Identified world fluorspar resources were approximately 500 million tons of contained fluorspar. The quantity of fluorine present in phosphate rock deposits is enormous. Current U.S. reserves of phosphate rock are estimated to be 1.4 billion tons, which at 3.5% fluorine would contain about 101 million tons of 100% calcium fluoride (fluorspar) equivalent. World reserves of phosphate rock are estimated to be 65 billion tons, equivalent to about 4.7 billion tons of 100% calcium fluoride equivalent.
Substitutes
: Aluminum smelting dross, borax, calcium chloride, iron oxides, manganese ore, silica sand, and titanium dioxide have been used as substitutes for fluorspar fluxes. Byproduct fluorosilicic acid has been used as a substitute in aluminum fluoride production and also has the potential to be used as a substitute in HF production.
eEstimated. NA Not available. — Zero. 1Excludes fluorspar equivalent of fluorosilicic acid, hydrofluoric acid, and cryolite. 2Industry stocks for two leading consumers and fluorspar distributors. 3Defined as imports – exports + adjustments for Government and industry stock changes. 4Canada Fluorspar Inc., 2011, Canada Fluorspar announces strategic agreement with Arkema resulting in a CDN$83.5 million investment to fund the St. Lawrence fluorspar project: Markham, Ontario, Canada, Canada Fluorspar Inc. news release, June 15, 4 p. 5See Appendix C for resource/reserve definitions and information concerning data sources. 6Measured as 100% calcium fluoride.
U.S. Geological Survey, Mineral Commodity Summaries, January 2012

58
GALLIUM
(Data in kilograms of gallium content unless otherwise noted) Domestic Production and Use
: No domestic primary gallium recovery was reported in 2011. One company in Utah recovered and refined gallium from scrap and impure gallium metal. Imports of gallium, which supplied most of U.S. gallium consumption, were valued at about $66 million. Gallium arsenide (GaAs) and gallium nitride (GaN) electronic components represented about 99% of domestic gallium consumption. About 61% of the gallium consumed was used in integrated circuits (ICs). Optoelectronic devices, which include laser diodes, light-emitting diodes (LEDs), photodetectors, and solar cells, represented 38% of gallium consumption. The remaining 1% was used in research and development, specialty alloys, and other applications. Optoelectronic devices were used in areas such as aerospace, consumer goods, industrial equipment, medical equipment, and telecommunications. Uses of ICs included defense applications, high-performance computers, and telecommunications.
Salient Statistics—United States: 2007 2008 2009 2010 Production, primary — — — — —
2011e
Imports for consumption 37,100 41,100 35,900 59,200 95,000 Exports NA NA NA NA NA Consumption, reported 25,100 28,700 24,900 33,500 57,000 Price, yearend, dollars per kilogram1 530 579 449 600 700 Stocks, consumer, yearend 6,010 3,820 4,100 4,970 6,000 Employment, refinery, number 20 20 20 20 20 Net import reliance2 as a percentage of reported consumption 99 99 99 99 99 Recycling
: Old scrap, none. Substantial quantities of new scrap generated in the manufacture of GaAs-base devices were reprocessed.
Import Sources (2007–10)
: Germany, 27%; Canada, 20%; United Kingdom, 19%; China, 17%; and other, 17%.
Tariff
: Item Number Normal Trade Relations
Gallium arsenide wafers, undoped 2853.00.0010 2.8% ad val. 12-31-11
Gallium arsenide wafers, doped 3818.00.0010 Free. Gallium metal 8112.92.1000 3.0% ad val. Depletion Allowance
: Not applicable.
Government Stockpile
: None.
Events, Trends, and Issues
: Imports of gallium and GaAs wafers continued to supply almost all U.S. demand for gallium. Gallium prices increased sharply in the first and second quarters of 2011 owing to the exceptional demand for GaN-LEDs in mobile display and backlighting applications. Prices decreased during the third quarter when rapidly rising gallium production exceeded the declining demand from LED producers. In January, the price for low-grade (99.99%-pure) gallium in Asia and Europe averaged $645 per kilogram. By June, the average low-grade price had increased to $970 per kilogram. By early October, the average low-grade price had decreased to $740 per kilogram.
Market conditions continued to improve for GaAs- and GaN-based products in 2011. GaAs demand, while still driven mainly by cellular handsets and other high-speed wireless applications, increased owing to rapid growth of feature-rich, application-intensive, third- and fourth-generation “smartphones,” which employ considerably more GaAs content than standard cellular handsets. Smartphones were estimated to account for 28% of all handset sales in 2011. Analysts estimated that the smartphone market’s sales volume will grow at an annual rate of 15% to 25% for the next several years. Owing to the large power handling capabilities of GaN technology, GaN-based products, which historically have been used in defense and military applications, have recently begun to gain acceptance in cable television transmission, commercial wireless infrastructure, power electronics, and satellite markets. The high-brightness LED industry was a significant driver for GaN-based technologies. In 2011, the worldwide GaN-LED market increased by 36% in unit volume from that of 2010. GaN-LED sales volume, however, increased by only 1%, to $8.7 billion, from that of 2010. Reduced revenue growth was attributed to slower-than-expected growth in LED backlighting and to LED supply outpacing demand. The backlighting of computer notebook screens, flat-screen computer monitors, and flat-screen televisions was the driving force for high-brightness LED consumption in 2011. The market share of LED-backlit computer notebooks was estimated to have increased to 100% in 2011 from 89% in 2010, while LED-backlit flat-screen televisions increased to 43% in 2011 from 23% in 2010. Prepared by Brian W. Jaskula [(703) 648-4908, [email protected]]

59 GALLIUM
In response to the unprecedented demand for high-brightness LEDs, several trimethylgallium (TMG) producers expanded their TMG production capacities worldwide in 2010 and 2011. TMGs are metalorganic precursors used in the production of LEDs. One producer announced plans to build an additional TMG production plant in the United States, which would bring its total TMG capacity to 100 metric tons per year. Construction of the plant was expected to begin in late 2011, with completion in 2012. In 2011, the parent company of a Utah-based gallium refiner purchased an Oklahoma-based producer of gallium trichloride, which is used in the production of LEDs. The company announced plans to expand its gallium trichloride production operations into the Republic of Korea. A new facility was expected to commence operations in late 2012. The value of the copper-indium-gallium diselenide (CIGS) market, a thin-film photovoltaic technology, was estimated to be $613 million in 2011, and had been forecast by one analyst to increase to $5.4 billion by 2018. CIGS technology, however, had been slow to enter the commercial market owing to a complicated manufacturing process that had impeded commercial mass production of CIGS panels. Decreased prices of silicon-based solar cells also slowed demand for the more expensive CIGS technology. These two factors resulted in a large oversupply of CIGS modules that caused prices to be reduced by 20%. Asian Governments invested heavily in LED technologies in 2010 and 2011. The Republic of Korea initiated a LED lighting program that aimed to achieve a 100% adoption rate for LED lighting in the Korean public sector and a 60% adoption rate for all lighting applications nationwide by 2020. In China, significant incentives were established by its Government to build a dominant LED industry. The Chinese Government also implemented a large street-lighting program that was expected to create strong domestic demand for LED-based lighting. To meet the large gallium demand for LEDs, Chinese gallium capacity and production was believed to have expanded tremendously in 2011. World Production and Reserves
:3 In 2011, world primary gallium production was estimated to be 216 metric tons, 19% greater than the revised 2010 world primary production of 182 tons. China, Germany, Kazakhstan, and Ukraine were the leading producers; countries with lesser output were Hungary, Japan, the Republic of Korea, and Russia. Refined gallium production was estimated to be about 310 tons; this figure includes primary gallium production and some possible scrap refining. China, Japan, the United Kingdom, and the United States were the principal producers of refined gallium. Gallium was recycled from new scrap in Canada, Germany, Japan, the United Kingdom, and the United States. World primary gallium production capacity in 2011 was estimated to be between 260 and 320 tons; refinery capacity, 270 tons; and recycling capacity, 198 tons.
Gallium occurs in very small concentrations in ores of other metals. Most gallium is produced as a byproduct of treating bauxite, and the remainder is produced from zinc-processing residues. Only part of the gallium present in bauxite and zinc ores is recoverable, and the factors controlling the recovery are proprietary. Therefore, an estimate of current reserves comparable to the definition of reserves of other minerals cannot be made. The world bauxite reserves are so large that much of them will not be mined for many decades; hence, most of the gallium in the bauxite reserves cannot be considered to be available in the short term. World Resources
: The average content of gallium in bauxite is 50 parts per million (ppm). U.S. bauxite deposits consist mainly of subeconomic resources that are not generally suitable for alumina production owing to their high silica content. Recovery of gallium from these deposits is therefore unlikely. Some domestic zinc ores contain as much as 50 ppm gallium and, as such, could be a significant resource. World resources of gallium in bauxite are estimated to exceed 1 billion kilograms, and a considerable quantity could be present in world zinc reserves. The foregoing estimate applies to total gallium content; only a small percentage of this metal in bauxite and zinc ores is economically recoverable.
Substitutes
: Liquid crystals made from organic compounds are used in visual displays as substitutes for LEDs. Researchers also are working to develop organic-based LEDs that may compete with GaAs in the future. Indium phosphide components can be substituted for GaAs-based infrared laser diodes in some specific-wavelength applications, and GaAs competes with helium-neon lasers in visible laser diode applications. Silicon is the principal competitor with GaAs in solar-cell applications. GaAs-based ICs are used in many defense-related applications because of their unique properties, and there are no effective substitutes for GaAs in these applications. GaAs in heterojunction bipolar transistors is being challenged in some applications by silicon-germanium.
eEstimated. NA Not available. — Zero. 1Estimated based on the average values of U.S. imports for 99.9999%- and 99.99999%-pure gallium. 2Defined as imports – exports + adjustments for Government and industry stock changes. 3See Appendix C for resource/reserve definitions and information concerning data sources.
U.S. Geological Survey, Mineral Commodity Summaries, January 2012

60
GARNET (INDUSTRIAL)1
(Data in metric tons of garnet unless otherwise noted)
Domestic Production and Use
: Garnet for industrial use was mined in 2011 by four firms—one in Idaho, one in Montana, and two in New York. The estimated value of crude garnet production was about $7.91 million, while refined material sold or used had an estimated value of $7.43 million. Major end uses for garnet were waterjet cutting, 35%; abrasive blasting media, 30%; water filtration, 20%; abrasive powders, 10%; and other end uses, 5%.
Salient Statistics—United States: 2007 2008 2009 2010 Production (crude) 61,400 62,900 45,600 52,600 53,000
2011e
Sold by producers 20,700 49,800 22,100 28,900 29,000 Imports for consumptione 52,300 49,200 37,900 42,500 48,200 Exportse 12,000 12,500 13,200 11,700 13,700 Consumption, apparente, 2 102,000 99,700 70,300 83,500 87,500 Price, range of value, dollars per ton3 50–2,000 50–2,000 50–2,000 50–2,000 50–2,000 Employment, mine and mill, numbere 160 160 160 160 160 Net import reliance4 as a percentage of apparent consumption 40 37 35 37 39 Recycling
: Small amounts of garnet reportedly are recycled.
Import Sources (2007–10)
:e India, 44%; Australia, 34%; China, 15%; Canada, 6%; and other, 1%.
Tariff
: Item Number Normal Trade Relations
Emery, natural corundum, natural garnet, 12-31-11
and other natural abrasives, crude 2513.20.1000 Free. Emery, natural corundum, natural garnet, and other natural abrasives, other than crude 2513.20.9000 Free. Natural abrasives on woven textile 6805.10.0000 Free. Natural abrasives on paper or paperboard 6805.20.0000 Free. Natural abrasives sheets, strips, disks, belts, sleeves, or similar form 6805.30.1000 Free. Depletion Allowance
: 14% (Domestic and foreign).
Government Stockpile
: None.
Prepared by Donald W. Olson [(703) 648-7721, [email protected]]

61 GARNET (INDUSTRIAL)
Events, Trends, and Issues
: During 2011, domestic U.S. production of crude garnet concentrates increased slightly compared with production in 2010. U.S. garnet consumption increased 5% compared with that of 2010. In 2011, imports were estimated to have increased 13% compared with those of 2010, and exports were estimated to have increased 18% from those of 2010. The 2011 estimated domestic sales of garnet increased slightly compared with sales of 2010. In 2010, the United States remained a net importer. Garnet imports have supplemented U.S. production in the domestic market; Australia, Canada, China, and India were major garnet suppliers.
The garnet market is very competitive. To increase profitability and remain competitive with foreign imported material, production may be restricted to only high-grade garnet ores or other salable mineral products that occur with garnet, such as kyanite, marble, mica minerals, sillimanite, staurolite, wollastonite, or metallic ores. World Mine Production and Reserves
: The reserve data for India were revised based on information reported by the Government of India.
Mine production Reserves5 2010 United States 52,600 53,000 5,000,000
2011e
Australia 150,000 150,000 Moderate to Large China 470,000 470,000 Moderate to Large India 700,000 700,000 6,700,000 Other countries 36,000 36,000 World total (rounded) 1,400,000 1,400,000 Moderate to Large
6,500,000
World Resources
: World resources of garnet are large and occur in a wide variety of rocks, particularly gneisses and schists. Garnet also occurs in contact-metamorphic deposits in crystalline limestones, pegmatites, serpentinites, and vein deposits. In addition, alluvial garnet is present in many heavy-mineral sand and gravel deposits throughout the world. Large domestic resources of garnet also are concentrated in coarsely crystalline gneiss near North Creek, NY; other significant domestic resources of garnet occur in Idaho, Maine, Montana, New Hampshire, North Carolina, and Oregon. In addition to those in the United States, major garnet deposits exist in Australia, Canada, China, and India, where they are mined for foreign and domestic markets; deposits in Russia and Turkey also have been mined in recent years, primarily for internal markets. Additional garnet resources are in Chile, Czech Republic, Pakistan, South Africa, Spain, Thailand, and Ukraine; small mining operations have been reported in most of these countries.
Substitutes
: Other natural and manufactured abrasives can substitute to some extent for all major end uses of garnet. In many cases, however, the substitutes would entail sacrifices in quality or cost. Fused aluminum oxide and staurolite compete with garnet as a sandblasting material. Ilmenite, magnetite, and plastics compete as filtration media. Diamond, corundum, and fused aluminum oxide compete for lens grinding and for many lapping operations. Emery is a substitute in nonskid surfaces. Finally, quartz sand, silicon carbide, and fused aluminum oxide compete for the finishing of plastics, wood furniture, and other products.
eEstimated. 1Excludes gem and synthetic garnet. 2Defined as crude production – exports + imports. 3Includes both crude and refined garnet; most crude concentrate is $80 to $130 per ton, and most refined material is $80 to $290 per ton. 4Defined as imports – exports. 5See Appendix C for resource/reserve definitions and information concerning data sources.
U.S. Geological Survey, Mineral Commodity Summaries, January 2012

62
GEMSTONES1
(Data in million dollars unless otherwise noted) Domestic Production and Use
: The combined value of U.S. natural and synthetic gemstone output increased by about 4% in 2011 from that of 2010. The natural gemstone production value increased by 6% from that of 2010, while synthetic gemstone production value increased nearly 4% during the same period. Domestic gemstone production included agate, beryl, coral, garnet, jade, jasper, opal, pearl, quartz, sapphire, shell, topaz, tourmaline, turquoise, and many other gem materials. In decreasing order, Arizona, North Carolina, Oregon, Utah, California, Tennessee, Montana, Colorado, Arkansas, and Idaho produced 86% of U.S. natural gemstones. Laboratory-created gemstones were manufactured by five firms in Florida, New York, Massachusetts, North Carolina, and Arizona, in decreasing order of production. Major gemstone uses were carvings, gem and mineral collections, and jewelry. The apparent consumption for 2011 in the table below is much lower than the actual consumption, owing to the exports, including reexports, which increased significantly during 2011 compared with those of previous years.
Salient Statistics—United States: 2007 2008 2009 2010 Production:2
2011e
Natural3 11.9 11.5 9.3 10.0 11 Laboratory-created (synthetic) 73.5 51.4 27.2 30.8 32 Imports for consumption 20,100 20,900 13,600 19,600 22,000 Exports, including reexports4 12,300 15,300 10,500 14,900 20,000 Consumption, apparent 7,880 5,670 3,080 4,720 1,900 Price Variable, depending on size, type, and quality Employment, mine, numbere 1,200 1,200 1,000 1,100 1,100 Net import reliance5 as a percentage of apparent consumption 99 99 99 99 98 Recycling
: Gemstones are often recycled by being resold as estate jewelry, reset, or recut, but this report does not account for those stones.
Import Sources (2007–10 by value)
: Israel, 46%; India, 23%; Belgium, 17%; South Africa, 6%; and other, 8%. Diamond imports accounted for 95% of the total value of gem imports.
Tariff
: Item Number Normal Trade Relations
Pearls, imitation, not strung 7018.10.1000 4.0% ad val. 12-31-11
Imitation precious stones 7018.10.2000 Free. Pearls, natural 7101.10.0000 Free. Pearls, cultured 7101.21.0000 Free. Diamond, unworked or sawn 7102.31.0000 Free. Diamond, ½ carat or less 7102.39.0010 Free. Diamond, cut, more than ½ carat 7102.39.0050 Free. Precious stones, unworked 7103.10.2000 Free. Precious stones, simply sawn 7103.10.4000 10.5% ad val. Rubies, cut 7103.91.0010 Free. Sapphires, cut 7103.91.0020 Free. Emeralds, cut 7103.91.0030 Free. Other precious stones, cut but not set 7103.99.1000 Free. Other precious stones 7103.99.5000 10.5% ad val. Synthetic, cut but not set 7104.90.1000 Free. Depletion Allowance
: 14% (Domestic and foreign).
Government Stockpile
: None.
Prepared by Donald W. Olson [(703) 648-7721, [email protected]]

63 GEMSTONES
Events, Trends, and Issues
: In 2011, the U.S. market for gem-quality diamonds was estimated to be about $20.8 billion, accounting for more than 35% of world demand. This was an increase of about 12% compared with that of 2010. The domestic market for natural, nondiamond gemstones was estimated to be about $995 million, which was a slight decrease from that of 2010. The United States is expected to continue dominating global gemstone consumption.
World Gem Diamond Mine Production6 and Reserves Mine production Reserves7
:
2010 Angola 12,500 12,500 World reserves of diamond-bearing
2011e
Australia 100 100 deposits are substantial. No reserve Botswana 25,000 25,000 data are available for other gemstones. Brazil 200 200 Canada 11,773 11,800 Central African Republic 250 250 China 100 100 Congo (Kinshasa) 5,500 5,500 Ghana 300 300 Guinea 550 550 Guyana 144 144 Lesotho 460 460 Namibia 1,200 1,200 Russia 17,800 17,800 Sierra Leone 240 240 South Africa 3,500 3,500 Tanzania 77 77 Other countries8 180 World total (rounded) 79,900 80,000
180
World Resources
: Most diamond-bearing ore bodies have a diamond content that ranges from less than 1 carat per ton to about 6 carats per ton. The major gem diamond reserves are in southern Africa, Australia, Canada, and Russia.
Substitutes
: Plastics, glass, and other materials are substituted for natural gemstones. Synthetic gemstones (manufactured materials that have the same chemical and physical properties as gemstones) are common substitutes. Simulants (materials that appear to be gems, but differ in chemical and physical characteristics) also are frequently substituted for natural gemstones.
eEstimated. 1Excludes industrial diamond and garnet. See Diamond (Industrial) and Garnet (Industrial). 2Estimated minimum production. 3Includes production of freshwater shell. 4Reexports account for about 78% of the totals. 5Defined as imports – exports and reexports + adjustments for Government and industry stock changes. 6Data in thousands of carats of gem diamond. 7See Appendix C for resource/reserve definitions and information concerning data sources. 8In addition to countries listed, Armenia, Cameroon, Congo (Brazzaville), Gabon, India, Indonesia, Liberia, Togo, Venezuela, and Zimbabwe are known to produce gem diamonds.
U.S. Geological Survey, Mineral Commodity Summaries, January 2012

64
GERMANIUM
(Data in kilograms of germanium content unless otherwise noted) Domestic Production and Use
: Germanium production in the United States comes from either the refining of imported germanium compounds or domestic industry-generated scrap. Germanium for domestic consumption also was obtained from materials imported in chemical form and either directly consumed or consumed in the production of other germanium compounds. Germanium was recovered from zinc concentrates produced at a domestic zinc mine in Alaska. These concentrates were exported to Canada for processing. A zinc mine complex in Tennessee, which had started producing germanium-rich zinc concentrates in early 2008 and was subsequently closed owing to declining market conditions, resumed operations under new ownership in 2010. There was no indication that any germanium had been recovered from these concentrates in 2011.
A germanium refinery in Utica, NY, produced germanium tetrachloride for optical fiber production. Another refinery in Quapaw, OK, produced refined germanium compounds for the production of fiber optics, infrared devices, and substrates for electronic devices. The major end uses for germanium, worldwide, were estimated to be fiber-optic systems, 30%; infrared optics, 25%; polymerization catalysts, 25%; electronics and solar electric applications, 15%; and other (phosphors, metallurgy, and chemotherapy), 5%. Domestically, the end use distribution was different and was estimated to be infrared optics, 50%; fiber-optic systems, 30%; electronics and solar electric applications, 15%; and other (phosphors, metallurgy, and chemotherapy), 5%. Germanium is not used in polymerization catalysts in the United States. The estimated value of germanium metal consumed in 2010, based upon the annual average U.S. producer price, was about $38 million. Salient Statistics—United States: 2007 2008 2009 2010 Production, refinerye 4,600 4,600 4,600 3,000 3,000
2011e
Total imports1 52,400 67,600 60,200 44,700 40,000 Total exports1 11,700 17,900 21,200 8,000 5,000 Shipments from Government stockpile excesses 6,900 102 68 — — Consumption, estimated 60,000 54,000 44,000 40,000 38,000 Price, producer, yearend, dollars per kilogram: Zone refined 1,240 1,490 940 1,200 1,650 Dioxide, electronic grade 800 960 580 720 1,400 Stocks, producer, yearend NA NA NA NA NA Employment, plant,2 numbere 65 70 70 100 100 Net import reliance3 as a percentage of estimated consumption 80 90 90 90 90 Recycling
: Worldwide, about 30% of the total germanium consumed is produced from recycled materials. During the manufacture of most optical devices, more than 60% of the germanium metal used is routinely recycled as new scrap. Germanium scrap was also recovered from the window blanks in decommissioned tanks and other military vehicles.
Import Sources (2007–10)
:4 China, 41%; Belgium, 29%; Russia, 17%; Germany, 9%; and other, 4%.
Tariff
: Item Number Normal Trade Relations
Germanium oxides 2825.60.0000 3.7% ad val. 12-31-11
Metal, unwrought 8112.92.6000 2.6% ad val. Metal, powder 8112.92.6500 4.4% ad val. Metal, wrought 8112.99.1000 4.4% ad val. Depletion Allowance
: 14% (Domestic and foreign).
Government Stockpile
: The Defense Logistics Agency, DLA Strategic Materials did not allocate any germanium for sale in the fiscal year 2011 Annual Materials Plan.
Stockpile Status—9-30-115
Uncommitted Authorized Disposal plan Disposals Material inventory for disposal FY 2011 FY 2011 Germanium 16,362 16,362 — — Prepared by David E. Guberman [(703) 648-4977, [email protected]]

65 GERMANIUM
Events, Trends, and Issues
: Germanium prices, particularly for germanium dioxide, increased significantly in 2011. During the first 6 months of 2011, free market prices of germanium dioxide increased by 94% to $1,400 per kilogram from $720 per kilogram at yearend 2010. During the same period, free market prices of germanium metal increased by a more modest 35% to $1,625 per kilogram from $1,200 per kilogram. Factors that contributed to the germanium dioxide price increase included a 2010 export tax on germanium dioxide produced in China that tightened global supply, coupled with the shutdown of a Chinese germanium dioxide plant owing to environmental concerns in early 2011. The Chinese Government was attempting to limit exports of raw materials and encourage the export of more finished products, such as germanium ingots and optical lenses, through export tax rebates on those products. In response to the increased germanium dioxide prices, some domestic germanium consumers found it more economical to purchase germanium in pure metal form instead of as oxide. An early 2011 announcement indicating that China intended to include germanium in a strategic stockpile of rare metals, potentially tightening supply, also contributed to price increases.
According to leading producers of germanium-related products, consumption of germanium substrates, used in light-emitting diodes and solar cells, increased during the first half of 2011 compared with that of the same period of 2010. In 2011, a leading domestic germanium substrate producer began certifying substrates produced at a new manufacturing facility in Oklahoma that was expected to have the capacity to produce about 400,000 substrates per year. The use of germanium substrates in high-efficiency, multijunction solar cells for satellites continued to be a staple of consumption, and more germanium substrates were being used in terrestrial-based solar concentrator systems. In late 2010, a domestic solar cell producer announced that it began mass producing germanium-based multijunction solar cells for terrestrial use that convert concentrated sunlight to electricity at efficiencies as great as 38.5%. Consumption of germanium-based optical blanks for infrared devices (frequently used by the military) declined during the first half of 2011 compared with that in the first half of 2010. Global consumption of germanium tetrachloride, used primarily in fiber optics, increased during the first half of the year compared with that in the same period of 2010, mainly owing to increased consumption in China. Consumption of germanium dioxide for use in manufacturing plastic bottles was thought to have increased in Japan in the aftermath of the spring 2011 earthquake and tsunami. During the first 6 months of 2011, Japanese germanium dioxide imports increased by about 43% compared with those in the same period of 2010. World Refinery Production and Reserves Refinery productione Reserves6
:
2010 United States 3,000 3,000 450,000
2011
China 80,000 80,000 NA Russia 5,000 5,000 NA Other countries 30,000 30,000 World total 118,000 118,000 NA
NA
World Resources
: The available resources of germanium are associated with certain zinc and lead-zinc-copper sulfide ores. Significant amounts of germanium are contained in ash and flue dust generated in the combustion of certain coals for power generation. Reserves exclude germanium contained in coal ash.
Substitutes
: Silicon can be a less-expensive substitute for germanium in certain electronic applications. Some metallic compounds can be substituted in high-frequency electronics applications and in some light-emitting-diode applications. Zinc selenide and germanium glass substitute for germanium metal in infrared applications systems but often at the expense of performance. Titanium has the potential to be a substitute as a polymerization catalyst.
eEstimated. NA Not available. — Zero. 1In addition to the gross weight of wrought and unwrought germanium and waste and scrap that comprise these figures, this series includes estimated germanium content of germanium dioxide. This series does not include germanium tetrachloride and other germanium compounds for which data are not available. 2Employment related to primary germanium refining is indirectly related to zinc refining. 3Defined as imports – exports + adjustments for Government stock changes; rounded to nearest 5%. 4Imports are based on the gross weight of wrought and unwrought germanium and waste and scrap, but not germanium tetrachloride and other germanium compounds for which data are not available. 5See Appendix B for definitions. 6See Appendix C for resource/reserve definitions and information concerning data sources.
U.S. Geological Survey, Mineral Commodity Summaries, January 2012

66
GOLD
(Data in metric tons1 of gold content unless otherwise noted) Domestic Production and Use
: Gold was produced at about 50 lode mines, a few large placer mines (all in Alaska), and numerous smaller placer mines (mostly in Alaska and in the Western States). In addition, a small amount of domestic gold was recovered as a byproduct of processing base metals, chiefly copper. Thirty operations yielded more than 99% of the gold produced in the United States. In 2011, the value of mine production was about $12.2 billion. Commercial-grade refined gold came from about 2 dozen producers. A few dozen companies, out of several thousand companies and artisans, dominated the fabrication of gold into commercial products. U.S. jewelry manufacturing was heavily concentrated in New York, NY, and Providence, RI; areas with lesser concentrations include California, Florida, and Texas. Estimated uses were jewelry and arts, 54%; dental, 10%; electrical and electronics, 7%; and other, 29%.
Salient Statistics—United States: 2007 2008 2009 2010 Production:
2011e
Mine 238 233 223 231 237 Refinery: Primary 176 168 170 175 190 Secondary (new and old scrap) 135 181 189 198 225 Imports for consumption2 170 231 320 604 670 Exports2 519 567 381 383 470 Consumption, reported 180 176 150 180 200 Stocks, yearend, Treasury3 8,140 8,140 8,140 8,140 8,140 Price, dollars per ounce4 699 874 975 1,227 1,600 Employment, mine and mill, number5 9,130 9,560 9,630 10,200 10,300 Net import reliance6 as a percentage of apparent consumption E E E 40 36 Recycling
: In 2011, 225 tons of new and old scrap was recycled, more than the reported consumption.
Import Sources (2007–10)
:2 Mexico, 49%; Canada, 25%; Colombia, 8%; Peru, 5%; and other, 13%.
Tariff
: Most imports of unwrought gold, including bullion and doré, enter the United States duty free.
Depletion Allowance
: 15% (Domestic), 14% (Foreign).
Government Stockpile
: The U.S. Department of the Treasury maintains stocks of gold (see salient statistics above), and the U.S. Department of Defense administers a Governmentwide secondary precious-metals recovery program.
Events, Trends, and Issues
: Domestic gold mine production in 2011 was estimated to be 3% more than the level of 2010. This marks the second consecutive increase in annual domestic production. Increased production from restarted mines in Montana and Nevada and from existing mines in Nevada accounted for much of the increase. These increases were partially offset by decreases in production from mines in Nevada and Utah. Because of the substantial amount of imports of gold products, the United States was not a net exporter of gold in 2010 and 2011. Much of the recent surge in imports is ores and concentrates from Mexico shipped into the United States for processing.
Worldwide gold production continued to increase because increases in production from Australia, Canada, Chile, China, Mexico, and Russia more than offset production losses in Indonesia and Peru. South Africa has stopped its almost decade-long trend of falling gold production. Gold production in China continued to increase, and the country remained the leading gold-producing nation, followed by Australia, the United States, Russia, and South Africa. Domestic jewelry consumption continued to drop as the price of gold continued to increase. The estimated gold price in 2011 was 30% higher than the price in 2010. In 2010, Engelhard’s daily price of gold ranged from a low of $1,321.89 per troy ounce on January 28 to an alltime high of $1,881.34 per troy ounce in late August. Prepared by Micheal W. George [(703) 648-4962, [email protected]]

67 GOLD
With the increase in the price of gold and the global economic instability, investment in gold has increased, as investors seek safe-haven investments. Gold Exchange-Traded Funds (ETFs) have gained popularity with investors. According to some industry analysts, investing in gold in the traditional manner is not as accessible and carries higher costs owing to insurance, storage, and higher markups. The claimed advantage of the ETF is that the investor can purchase gold ETF shares through a stockbroker without being concerned about these problems. Each share represents one-tenth of an ounce of allocated gold. Demand for physical gold was also high. There were local shortages of gold coins weighing 1 ounce or less. World Mine Production and Reserves
: Reserve data for Australia and Canada were revised based on information from the respective country Governments.
Mine production Reserves7 2010 United States 231 237 3,000
2011e
Australia 261 270 7,400 Brazil 58 55 2,400 Canada 91 110 920 Chile 38 45 3,400 China 345 355 1,900 Ghana 82 100 1,400 Indonesia 120 100 3,000 Mexico 73 85 1,400 Papua New Guinea 68 70 1,200 Peru 164 150 2,000 Russia 192 200 5,000 South Africa 189 190 6,000 Uzbekistan 90 90 1,700 Other countries 559 630 World total (rounded) 2,560 2,700 51,000
10,000
World Resources
: An assessment of U.S. gold resources indicated 33,000 tons of gold in identified (15,000 tons) and undiscovered (18,000 tons) resources.8 Nearly one-quarter of the gold in undiscovered resources was estimated to be contained in porphyry copper deposits. The gold resources in the United States, however, are only a small portion of global gold resources.
Substitutes
: Base metals clad with gold alloys are widely used in electrical and electronic products, and in jewelry to economize on gold; many of these products are continually redesigned to maintain high-utility standards with lower gold content. Generally, palladium, platinum, and silver may substitute for gold.
eEstimated. E Net exporter. 1One metric ton (1,000 kilograms) = 32,150.7 troy ounces. 2Refined bullion, doré, ores, concentrates, and precipitates. Excludes:
a. Waste and scrap. b. Official monetary gold. c. Gold in fabricated items. d. Gold in coins. e. Net bullion flow (in tons) to market from foreign stocks at the New York Federal Reserve Bank: 189 (2007), 220 (2008), 0 (2009), 0 (2010),
and 0 (2011 estimate). 3Includes gold in Exchange Stabilization Fund. Stocks were valued at the official price of $42.22 per troy ounce. 4Engelhard’s average gold price quotation for the year. In 2011, price was estimated by the USGS based on the first 9 months of data. 5Data from Mine Safety and Health Administration. 6Defined as imports – exports + adjustments for Government and industry stock changes. 7See Appendix C for resource/reserve definitions and information concerning data sources. 8U.S. Geological Survey National Mineral Resource Assessment Team, 2000, 1998 assessment of undiscovered deposits of gold, silver, copper, lead, and zinc in the United States: U.S. Geological Survey Circular 1178, 21 p.
U.S. Geological Survey, Mineral Commodity Summaries, January 2012

68
GRAPHITE (NATURAL)
(Data in thousand metric tons unless otherwise noted) Domestic Production and Use
: Although natural graphite was not produced in the United States in 2011, approximately 90 U.S. firms, primarily in the Northeastern and Great Lakes regions, used it for a wide variety of applications. The major uses of natural graphite in 2011 were estimated to be refractory applications and crucibles combined, 33%; foundry operations and steelmaking combined, 26%; brake linings, 7%; batteries and lubricants combined, 5%; and other applications, 29%.
Salient Statistics—United States: 2007 2008 2009 2010 Production, mine — — — — —
2011e
Imports for consumption 59 58 33 65 70 Exports 16 8 11 6 7 Consumption, apparent1 43 50 22 60 63 Price, imports (average dollars per ton at foreign ports): Flake 499 753 694 720 1,170 Lump and chip (Sri Lankan) 2,219 2,550 1,410 1,700 2,070 Amorphous 150 203 249 257 299 Net import reliance2 as a percentage of apparent consumption 100 100 100 100 100 Recycling
: Refractory brick and linings, alumina-graphite refractories for continuous metal castings, magnesia-graphite refractory brick for basic oxygen and electric arc furnaces, and insulation brick led the way in recycling of graphite products. The market for recycled refractory graphite material is growing, with material being recycled into products such as brake linings and thermal insulation.
Recovering high-quality flake graphite from steelmaking kish is technically feasible, but not practiced at the present time. The abundance of graphite in the world market inhibits increased recycling efforts. Information on the quantity and value of recycled graphite is not available. Import Sources (2007–10)
: China, 51%; Mexico, 20%; Canada, 19%; Brazil, 6%; and other, 4%.
Tariff
: Item Number Normal Trade Relations
Crystalline flake (not including flake dust) 2504.10.1000 Free. 12-31-11
Powder 2504.10.5000 Free. Other 2504.90.0000 Free. Depletion Allowance
: 22% (Domestic lump and amorphous), 14% (Domestic flake), and 14% (Foreign).
Government Stockpile
: None.
Prepared by Donald W. Olson [(703) 648-7721, [email protected]]

69 GRAPHITE (NATURAL)
Events, Trends, and Issues
: Worldwide demand for graphite slowly began to increase during the last half of 2009 and continued increasing steadily throughout 2010 and into 2011. This increase resulted from the improvement of global economic conditions and its impact on industries that use graphite. Principal import sources of natural graphite were, in descending order of tonnage, China, Mexico, Canada, Brazil, and Madagascar, which combined accounted for 99% of the tonnage and 92% of the value of total imports. Mexico provided all the amorphous graphite, and Sri Lanka provided all the lump and chippy dust variety. China, Canada, and Brazil were, in descending order of tonnage, the major suppliers of crystalline flake and flake dust graphite.
During 2011, China produced the majority of the world’s graphite, and China’s graphite production is expected to continue to increase. Advances in thermal technology and acid-leaching techniques that enable the production of higher purity graphite powders are likely to lead to development of new applications for graphite in high-technology fields. Such innovative refining techniques have enabled the use of improved graphite in carbon-graphite composites, electronics, foils, friction materials, and special lubricant applications. Flexible graphite product lines, such as graphoil (a thin graphite cloth), are likely to be the fastest growing market. Large-scale fuel-cell applications are being developed that could consume as much graphite as all other uses combined. World Mine Production and Reserves
: The reserve data for India were revised based on information reported by the Government of India.
Mine production Reserves3 2010 United States — — —
2011e
Brazil 76 76 360 Canada 25 25 (4) China 600 600 55,000 India 140 140 11,000 Korea, North 30 30 (4) Madagascar 5 5 940 Mexico 7 7 3,100 Norway 2 2 (4) Romania 20 20 (4) Sri Lanka 8 8 (4) Ukraine 6 6 (4) Other countries 6 6 World total (rounded) 925 925 77,000
6,400
World Resources
: Domestic resources of graphite are relatively small, but the rest of the world’s inferred resources exceed 800 million tons of recoverable graphite.
Substitutes
: Manufactured graphite powder, scrap from discarded machined shapes, and calcined petroleum coke compete for use in iron and steel production. Finely ground coke with olivine is a potential competitor in foundry facing applications. Molybdenum disulfide competes as a dry lubricant but is more sensitive to oxidizing conditions.
eEstimated.— Zero. 1Defined as imports – exports. 2Defined as imports – exports. 3See Appendix C for resource/reserve definitions and information concerning data sources. 4Included with “Other countries.”
U.S. Geological Survey, Mineral Commodity Summaries, January 2012

70
GYPSUM
(Data in thousand metric tons unless otherwise noted) Domestic Production and Use
: In 2011, domestic production of crude gypsum was estimated to be 9.4 million tons with a value of about $65.9 million. The leading crude gypsum-producing States were, in descending order, Oklahoma, Texas, Iowa, Nevada, and California, which together accounted for 58% of total output. Overall, 47 companies produced gypsum in the United States at 54 mines and plants in 34 States. Approximately 90% of domestic consumption, which totaled approximately 23 million tons, was accounted for by manufacturers of wallboard and plaster products. Approximately 1.3 million tons for cement production and agricultural applications, and small amounts of high-purity gypsum for a wide range of industrial processes accounted for the remaining tonnage. At the beginning of 2011, the production capacity of operating wallboard plants in the United States was about 27 billion square feet1 per year.
Salient Statistics—United States: 2007 2008 2009 2010 Production:
2011e
Crude 15,700 12,300 10,400 8,840 9,400 Synthetic2 8,370 9,660 8,120 10,700 11,000 Calcined3 21,700 17,900 13,800 12,100 12,100 Wallboard products sold (million square feet1) 27,800 20,700 18,300 17,200 16,900 Imports, crude, including anhydrite 9,390 7,330 4,220 3,330 3,300 Exports, crude, not ground or calcined 147 149 156 360 300 Consumption, apparent4 33,300 29,100 22,600 22,500 23,400 Price: Average crude, f.o.b. mine, dollars per metric ton 7.50 8.70 8.50 6.90 7.00 Average calcined, f.o.b. plant, dollars per metric ton 38.30 42.60 35.00 29.70 30.00 Employment, mine and calcining plant, numbere 6,000 5,400 4,500 4,500 4,500 Net import reliance5 as a percentage of apparent consumption 28 25 18 13 13 Recycling
: Some of the more than 4 million tons of gypsum scrap that was generated by wallboard manufacturing, wallboard installation, and building demolition was recycled. The recycled gypsum was used primarily for agricultural purposes and feedstock for the manufacture of new wallboard. Other potential markets for recycled gypsum include athletic field marking, cement production as a stucco additive, grease absorption, sludge drying, and water treatment.
Import Sources (2007–10)
: Canada, 65%; Mexico, 28%; Spain, 6%; and other, 1%.
Tariff
: Item Number Normal Trade Relations
Gypsum; anhydrite 2520.10.0000 Free. 12-31-11
Depletion Allowance
: 14% (Domestic and foreign).
Government Stockpile
: None.
Events, Trends, and Issues
: U.S. gypsum production increased by 4% compared with that of 2010 as the housing and construction markets appeared to stabilize. Apparent consumption also increased by about 4% compared with that of 2010. China, the world’s leading gypsum producer, produced more than five times the amount produced in the United States, the world’s fourth ranked producer. Iran is believed to be ranked second in world production and supplied much of the gypsum needed for construction in the Middle East. Spain, the leading European producer, ranked third in the world, and supplied both crude gypsum and gypsum products to much of Western Europe. An increased use of wallboard in Asia, coupled with new gypsum product plants, spurred increased production in that region. As more cultures recognize the economy and efficiency of wallboard use, worldwide production of gypsum is expected to increase.
Demand for gypsum depends principally on the strength of the construction industry, particularly in the United States, where about 95% of consumed gypsum is used for building plasters, the manufacture of portland cement, and wallboard products. The construction of wallboard manufacturing plants designed to use synthetic gypsum as feedstock will result in less use of natural gypsum as these new plants become operational. Gypsum imports decreased slightly compared with those of 2010. Exports, although very low compared with imports, decreased by 17%. Prepared by Robert D. Crangle, Jr. [(703) 648-6410, [email protected]]

71 GYPSUM
World Mine Production and Reserves
Mine production Reserves6
: Reserves for Brazil, India, and Poland were revised based on information from those countries.
2010 United States 8,840 9,400 700,000
2011e
Algeria 1,700 1,700 NA Argentina 1,360 1,400 NA Australia 3,500 3,500 NA Brazil 2,350 2,400 1,200,000 Canada 2,717 2,300 450,000 China 47,000 47,000 NA Egypt 2,400 2,400 NA France 2,300 2,300 NA Germany 1,822 2,000 NA India 2,650 2,700 69,000 Iran 13,000 13,000 NA Italy 4,130 4,100 NA Japan 5,700 5,700 NA Mexico 3,560 3,500 NA Poland 1,300 1,300 55,000 Russia 2,900 2,900 NA Saudi Arabia 2,100 2,100 NA Spain 11,500 11,500 NA Thailand 8,500 8,500 NA Turkey 3,200 3,200 NA United Kingdom 1,700 1,700 NA Other countries 12,500 13,000 World total (rounded) 147,000 148,000 Large
NA
World Resources
: Reserves are large in major producing countries, but data for most are not available. Domestic gypsum resources are adequate but unevenly distributed. Large imports from Canada augment domestic supplies for wallboard manufacturing in the United States, particularly in the eastern and southern coastal regions. Imports from Mexico supplement domestic supplies for wallboard manufacturing along portions of the U.S. western seaboard. Large gypsum deposits occur in the Great Lakes region, the midcontinent region, and several Western States. Foreign resources are large and widely distributed; 86 countries produce gypsum.
Substitutes
: In such applications as stucco and plaster, cement and lime may be substituted for gypsum; brick, glass, metallic or plastic panels, and wood may be substituted for wallboard. Gypsum has no practical substitute in the manufacturing of portland cement. Synthetic gypsum generated by various industrial processes, including flue gas desulfurization of smokestack emissions, is very important as a substitute for mined gypsum in wallboard manufacturing, cement production, and agricultural applications (in descending tonnage order). In 2011, synthetic gypsum accounted for approximately 54% of the total domestic gypsum supply.
eEstimated. NA Not available. 1The standard unit used in the U.S. wallboard industry is square feet. Multiply square feet by 9.29 x 10⁻² to convert to square meters. 2Data refer to the amount sold or used, not produced. 3From domestic crude and synthetic. 4Defined as crude production + total synthetic reported used + imports – exports. 5Defined as imports – exports. 6See Appendix C for resource/reserve definitions and information concerning data sources.
U.S. Geological Survey, Mineral Commodity Summaries, January 2012

72
HELIUM
(Data in million cubic meters of contained helium gas1 unless otherwise noted) Domestic Production and Use
: The estimated value of Grade-A helium (99.997% or better) extracted domestically during 2011 by private industry was about $808 million. Nine plants (five in Kansas and four in Texas) extracted helium from natural gas and produced only a crude helium product that varied from 50% to 99% helium. Ten plants (four in Kansas, and one each in Colorado, New Mexico, Oklahoma, Texas, Utah, and Wyoming) extracted helium from natural gas and produced an intermediate process stream of crude helium (about 70% helium and 30% nitrogen) and continued processing the stream to produce a Grade-A helium product. Of these 10 plants, 6 (4 in Kansas, 1 in Oklahoma, and 1 in Texas) accepted a crude helium product from other producers and the Bureau of Land Management (BLM) pipeline and purified it to a Grade-A helium product. Estimated 2011 domestic consumption of 56 million cubic meters (2.0 billion cubic feet) was used for cryogenic applications, 32%; for pressurizing and purging, 18%; for controlled atmospheres, 18%; for welding cover gas, 13%; leak detection, 4%; breathing mixtures, 2%; and other, 13%.
Salient Statistics—United States: 2007 2008 2009 2010 Helium extracted from natural gas2 77 80 78 75 83
2011e
Withdrawn from storage3 61 50 40 53 57 Grade-A helium sales 138 130 118 128 140 Imports for consumption — — — — — Exports4 64 70 71 77 84 Consumption, apparent4 74 60 47 51 56 Net import reliance5 as a percentage of apparent consumption E E E E E Price: The Government price for crude helium was $2.70 per cubic meter ($75.00 per thousand cubic feet) in fiscal year (FY) 2011. The price for the Government-owned helium is mandated by the Helium Privatization Act of 1996 (Public Law 104-273). The estimated price range for private industry’s Grade-A gaseous helium was about $5.77 per cubic meter ($160 per thousand cubic feet), with some producers posting surcharges to this price. Recycling
: In the United States, helium used in large-volume applications is seldom recycled. Some low-volume or liquid boiloff recovery systems are used. In Western Europe and Japan, helium recycling is practiced when economically feasible.
Import Sources (2007–10)
: None.
Tariff
: Item Number Normal Trade Relations
Helium 2804.29.0010 3.7% ad val. 12-31-11
Depletion Allowance
: Allowances are applicable to natural gas from which helium is extracted, but no allowance is granted directly to helium.
Government Stockpile
: Under Public Law 104-273, the BLM manages the Federal Helium Program, which includes all operations of the Cliffside Field helium storage reservoir, in Potter County, TX, and the Government’s crude helium pipeline system. The BLM no longer supplies Federal agencies with Grade-A helium. Private firms that sell Grade-A helium to Federal agencies are required to purchase a like amount of (in-kind) crude helium from the BLM. The Helium Privatization Act of 1996 mandated that all Federal Conservation helium stored in Bush Dome at the Cliffside Field be offered for sale, except 16.6 million cubic meters (600 million cubic feet).
In FY 2011, privately owned companies purchased about 4.3 million cubic meters (155 million cubic feet) of in-kind crude helium. In addition to this, privately owned companies also purchased 52.4 million cubic meters (1,889 million cubic feet) of open market sales helium. During FY 2011, the BLM’s Amarillo Field Office, Helium Operations (AMFO), accepted about 12.1 million cubic meters (436 million cubic feet) of private helium for storage and redelivered nearly 71 million cubic meters (2,560 million cubic feet). As of September 30, 2011, about 31.8 million cubic meters (1,146 million cubic feet) of privately owned helium remained in storage at Cliffside Field.
Stockpile Status—9-30-116 Uncommitted Authorized Disposal plan Disposals Material inventory for disposal FY 2011 FY 2011 Helium 403.2 403.2 63.8 63.2 Prepared by Peter J. Madrid7 [(806) 356-1034, [email protected]]

73 HELIUM
Events, Trends, and Issues
: In 2011, BLM began using the pricing mechanism defined in the Helium Privatization Act of 1996. During 2011, BLM helium prices increased slightly to $2.73 per cubic meter ($75.00 per thousand cubic feet) of gas delivered. In 2012, increased cost recovery measures are expected to be implemented at various natural gas fields throughout the United States, including the Hugoton and Riley Ridge Fields. The Amarillo Field Office conducted four open market helium offerings in FY 2011, selling a total of 59.2 million cubic meters (2,130 million cubic feet) of helium. A new helium extraction facility came online near Big Piney, WY, near the Riley Ridge gas field during 2011. Nevertheless, international helium extraction facilities are more likely future sources for world helium resources. Seven international helium plants are in operation and more are planned for the next 3 to 5 years. Most recently, a plant in Darwin, Australia, came online and expansions were planned in Algeria and Qatar. Future production from these facilities is expected to be sufficient to meet worldwide helium demand for the next 5 years; however, to ensure future helium supplies, more exploration will be needed.
World Production and Reserves Production Reserves8
:
2010 United States (extracted from natural gas) 75 83 4,000
2011e
United States (from Cliffside Field) 53 57 (9) Algeria 18 20 1,800 Canada NA NA NA China NA NA NA Poland 3 3 33 Qatar 13 15 NA Russia 6 6 1,700 Other countries NA NA World total (rounded) 168 180 NA
NA
World Resources
: As of December 31, 2006, the total helium reserves and resources of the United States were estimated to be 20.6 billion cubic meters (744 billion cubic feet). This includes 4.25 billion cubic meters (153.2 billion cubic feet) of measured reserves, 5.33 billion cubic meters (192.2 billion cubic feet) of probable resources, 5.93 billion cubic meters (213.8 billion cubic feet) of possible resources, and 5.11 billion cubic meters (184.4 billion cubic feet) of speculative resources. Included in the measured reserves are 0.67 billion cubic meters (24.2 billion cubic feet) of helium stored in the Cliffside Field Government Reserve, and 0.065 billion cubic meters (2.3 billion cubic feet) of helium contained in Cliffside Field native gas. The Hugoton (Kansas, Oklahoma, and Texas), Panhandle West, Panoma, Riley Ridge in Wyoming, and Cliffside Fields are the depleting fields from which most U.S.-produced helium is extracted. These fields contained an estimated 3.9 billion cubic meters (140 billion cubic feet) of helium.
Helium resources of the world, exclusive of the United States, were estimated to be about 31.3 billion cubic meters (1.13 trillion cubic feet). The locations and volumes of the major deposits, in billion cubic meters, are Qatar, 10.1; Algeria, 8.2; Russia, 6.8; Canada, 2.0; and China, 1.1. As of December 31, 2010, AMFO had analyzed about 22,000 gas samples from 26 countries and the United States, in a program to identify world helium resources. Substitutes
: There is no substitute for helium in cryogenic applications if temperatures below –429 °F are required. Argon can be substituted for helium in welding, and hydrogen can be substituted for helium in some lighter-than-air applications in which the flammable nature of hydrogen is not objectionable. Hydrogen is also being investigated as a substitute for helium in deep-sea diving applications below 1,000 feet.
eEstimated. E Net exporter. NA Not available. — Zero. 1Measured at 101.325 kilopascals absolute (14.696 psia) and 15 °C; 27.737 cubic meters of helium = 1 Mcf of helium at 70 °F and 14.7 psia. 2Both Grade-A and crude helium. 3Extracted from natural gas in prior years. 4Grade-A helium. 5Defined as imports – exports + adjustments for Government and industry stock changes. 6See Appendix B for definitions. 7Team Leader, Resources and Evaluation Group, Bureau of Land Management, Amarillo Field Office, Helium Operations, Amarillo, TX. 8See Appendix C for resource/reserve definitions and information concerning data sources. 9Included in United States (extracted from natural gas) reserves.
U.S. Geological Survey, Mineral Commodity Summaries, January 2012

74
INDIUM
(Data in metric tons unless otherwise noted) Domestic Production and Use
: Indium was not recovered from ores in the United States in 2011. Two companies, one in New York and the other in Rhode Island, produced indium metal and indium products by upgrading lower grade imported indium metal. High-purity indium shapes, alloys, and compounds were also produced from imported indium by several additional firms. Production of indium tin oxide (ITO) continued to be the leading end use of indium and accounted for most global indium consumption. ITO thin-film coatings were primarily used for electrically conductive purposes in a variety of flat-panel devices—most commonly liquid crystal displays (LCDs). Other end uses included solders and alloys, compounds, electrical components and semiconductors, and research. The estimated value of primary indium metal consumed in 2011, based upon the annual average New York dealer price, was about $82 million.
Salient Statistics—United States: 2007 2008 2009 2010 Production, refinery — — — — —
2011e
Imports for consumption1 147 144 105 117 150 Exports NA NA NA NA NA Consumption, estimated 125 130 110 120 120 Price, annual average, dollars per kilogram U.S. producer2 795 685 500 565 720 New York dealer3 637 519 382 552 685
99.99% c.i.f. Japan4 NA 479 348 546 680 Stocks, producer, yearend NA NA NA NA NA Net import reliance5 as a percentage of estimated consumption 100 100 100 100 100 Recycling
: Data on the quantity of secondary indium recovered from scrap were not available. Indium is most commonly recovered from ITO. Sputtering, the process in which ITO is deposited as a thin-film coating onto a substrate, is highly inefficient; approximately 30% of an ITO target material is deposited onto the substrate. The remaining 70% consists of the spent ITO target material, the grinding sludge, and the after-processing residue left on the walls of the sputtering chamber. ITO recycling is concentrated in China, Japan, and the Republic of Korea—the countries where ITO production and sputtering take place.
An LCD manufacturer has developed a process to reclaim indium directly from scrap LCD panels. Indium recovery from tailings was thought to have been insignificant, as these wastes contain low amounts of the metal and can be difficult to process. However, recent improvements to the process technology have made indium recovery from tailings viable when the price of indium is high. Import Sources (2007–10)
:1 China, 31%; Canada, 25%; Japan, 16%; Belgium, 9%; and other, 19%.
Tariff
: Item Number Normal Trade Relations
Unwrought indium, including powders 8112.92.3000 Free. 12-31-11
Depletion Allowance
: 14% (Domestic and foreign).
Government Stockpile
: None.
Events, Trends, and Issues
: The annual average price of indium increased by approximately 25% in 2011 from that of 2010. The U.S. producer price for indium began the year at $570 per kilogram, increased to $690 per kilogram in April, and rose further to $785 per kilogram in May; the price remained at that level through early November. The New York dealer price range for indium began the year at $520 to $570 per kilogram and increased through early June, reaching a high of $800 to $875 per kilogram. The price range then decreased to $630 to $670 per kilogram by early November.
Prepared by Amy C. Tolcin [(703) 648-4940, [email protected]]

75 INDIUM
In 2011, world production of primary indium increased by 5% from that of 2010 to 640 tons. Secondary production, which accounts for a greater share of global production than primary, was thought to have increased as well, as many ITO producers were reported to have increased their recycling rates during the year. Global consumption of primary and secondary indium was estimated to be more than 1,800 tons, of which approximately 60% was consumed in Japan. The Chinese indium export quota remained unchanged in 2011 from that of 2010 at 233 tons, of which the quota for the first half of the year was set at 140 tons, and the quota for the second half of the year totaled 93 tons. However, the number of companies that received export licenses dropped to 18 in 2011 from 21 in 2010. World Refinery Production and Reserves Refinery production Reserves6
:
2010 United States — — Quantitative estimates of reserves are not
2011e
Belgium 30 30 available. Brazil 5 5 Canada 67 65 China 340 340 Japan 70 70 Korea, Republic of 70 100 Russia NA NA Other countries 27 World total (rounded) 609 640
30
World Resources
: Indium’s abundance in the continental crust is estimated to be approximately 0.05 part per million. Trace amounts of indium occur in base metal sulfides—particularly chalcopyrite, sphalerite, and stannite—by ionic substitution. Indium is most commonly recovered from the zinc-sulfide ore mineral sphalerite. The average indium content of zinc deposits from which it is recovered ranges from less than 1 part per million to 100 parts per million. Although the geochemical properties of indium are such that it occurs with other base metals—copper, lead, and tin—and to a lesser extent with bismuth, cadmium, and silver, most deposits of these metals are subeconomic for indium.
Vein stockwork deposits of tin and tungsten host the highest known concentrations of indium. However, the indium from this type of deposit is usually difficult to recover economically. Other major geologic hosts for indium mineralization include volcanic-hosted massive sulfide deposits, sediment-hosted exhalative massive sulfide deposits, polymetallic vein-type deposits, epithermal deposits, active magmatic systems, porphyry copper deposits, and skarn deposits. Substitutes
: Indium’s recent price volatility and various supply concerns associated with the metal have accelerated the development of ITO substitutes. Antimony tin oxide coatings, which are deposited by an ink-jetting process, have been developed as an alternative to ITO coatings in LCDs and have been successfully annealed to LCD glass. Carbon nanotube coatings, applied by wet-processing techniques, have been developed as an alternative to ITO coatings in flexible displays, solar cells, and touch screens. Poly(3,4-ethylene dioxythiophene) (PEDOT) has also been developed as a substitute for ITO in flexible displays and organic light-emitting diodes. PEDOT can be applied in a variety of ways, including spin coating, dip coating, and printing techniques. Graphene quantum dots have been developed to replace ITO electrodes in solar cells and also have been explored as a replacement for ITO in LCDs. Researchers have recently developed a more adhesive zinc oxide nanopowder to replace ITO in LCDs. The technology was estimated to be commercially available within the next 3 years. Gallium arsenide can substitute for indium phosphide in solar cells and in many semiconductor applications. Hafnium can replace indium in nuclear reactor control rod alloys.
eEstimated. NA Not available. — Zero. 1Imports for consumption of unwrought indium and indium powders (Tariff no. 8112.92.3000). 2Indium Corp.’s price for 99.97% purity metal; 1-kilogram bar in lots of 10,000 troy ounces. Source: Platts Metals Week. 3Price is based on 99.99% minimum purity indium at warehouse (Rotterdam); cost, insurance, and freight (in minimum lots of 50 kilograms). Source: Platts Metals Week. 4Price is based on 99.99% purity indium, primary or secondary, shipped to Japan. Source: Platts Metals Week. 5Defined as imports – exports + adjustments for Government and industry stock changes; exports were assumed to be no greater than the difference between imports and consumption. 6See Appendix C for resource/reserve definitions and information concerning data sources.
U.S. Geological Survey, Mineral Commodity Summaries, January 2012

76
IODINE
(Data in metric tons elemental iodine unless otherwise noted) Domestic Production and Use
: Iodine was produced in 2011 by two companies operating in Oklahoma, with a fourth company initializing iodine production in Montana in March 2010. Production in 2011 was estimated to have increased from that of 2010. To avoid disclosing company proprietary data, U.S. iodine production in 2011 was withheld. The operation at Woodward, OK, continued production of iodine from subterranean brines. Another company continued production at Vici, OK. Prices for iodine have increased in recent years owing to high demand, which has led to high utilization of capacity. The Japanese earthquake and tsunami in March 2011 tightened iodine supplies through disruptions in Japanese iodine production and panic buying of potassium iodide anti-radiation tablets. As a result, prices in 2011 became erratic. The average c.i.f. value of iodine imports in 2011 was estimated to be $27.00 per kilogram.
Domestic and imported iodine were used by downstream manufacturers to produce many intermediate iodine compounds, making it difficult to establish an accurate end-use pattern. Of the consumers that participate in an annual U.S. Geological Survey canvass, 16 plants reported consumption of iodine in 2010. Iodine and iodine compounds reported were unspecified organic and inorganic compounds, including ethyl and methyl iodide, 66%; resublimed iodine, 15%; ethylenediamine dihydroiodide, 5%; crude iodine, 4%; hydriodic acid, 4%; potassium iodide, 3%; and other, 3%. Salient Statistics—United States: 2007 2008 2009 2010 Production W W W W W
2011e
Imports for consumption, crude content 6,060 6,300 5,190 5,710 4,600 Exports 1,060 950 1,160 1,070 660 Shipments from Government stockpile excesses 93 — — — — Consumption: Apparent W W W W W Reported 4,470 4,590 4,550 4,670 4,000 Price, average c.i.f. value, dollars per kilogram, crude 21.01 21.52 25.55 24.71 27.00 Employment, numbere 30 30 30 30 30 Net import reliance1 as a percentage of reported consumption 100 100 89 99 99 Recycling
: Small amounts of iodine were recycled, but no data were reported.
Import Sources (2007–10)
: Chile, 83%; Japan, 16%; and other, 1%.
Tariff
: Item Number Normal Trade Relations
Iodine, crude 2801.20.0000 Free. 12-31-11
Iodide, calcium or copper 2827.60.1000 Free. Iodide, potassium 2827.60.2000 2.8% ad val. Iodides and iodide oxides, other 2827.60.5100 4.2% ad val. Depletion Allowance
: 14% (Domestic and foreign).
Government Stockpile
: None.
Prepared by Marc A. Angulo [Contact Robert L. Virta, (703) 648-7726, [email protected]]

77 IODINE
Events, Trends, and Issues
: In response to strong demand for iodine in recent years driven by the liquid crystal display (LCD) and x-ray contrast media industries, coupled with a supply shortfall resulting from the Japanese disaster, iodine prices were expected to be volatile throughout 2011 and into early 2012. It was unclear if Japanese iodine production would return to predisaster levels; however, with an increase in Chilean production and further recovery in Japan, prices were expected to stabilize in mid-2012. With a projected global economic recovery, demand for iodine used in biocides, iodine salts, LCDs, synthetic fabric treatments, and x-ray contrast media was expected to increase at a rate of between 3.5% and 4% per year during the next decade.
As in recent years, Chile was the world’s leading producer of iodine, followed by Japan and the United States. Chile accounted for more than 58% of world production in 2010, having two of the leading iodine producers in the world. The Chilean producers were operating near capacity and were expected to expand production in response to changes in demand and to capitalize on price increases. The third largest Chilean producer initiated a new project at Algorta, Chile, which was expected to replace its current operation at Lagunas, Chile. Several government programs were expected to affect future iodine demand. The European Union prohibited its 27 member countries from using or selling iodine for the purpose of disinfecting drinking water. China’s Ministry of Health announced the reduction of iodine content in salt owing to fears that iodized salt is causing a rise in thyroid disease. The U.S. Environmental Protection Agency approved the restricted use of the soil fumigant iodomethane (methyl iodide) as an alternative to ozone-depleting methyl bromide. Australia and Belgium required bread manufacturers to use iodized salt with the intent of limiting iodine deficiency in their populations. World Mine Production and Reserves Mine production Reserves2
:
2010 United States W W 250,000
2011e
Azerbaijan 300 300 170,000 Chile 17,500 18,000 9,000,000 China 590 590 4,000 Indonesia 75 75 100,000 Japan 9,700 9,800 5,000,000 Russia 300 300 120,000 Turkmenistan 270 270 170,000 Uzbekistan 2 2 World total (rounded) 328,700 329,000 15,000,000
NA
World Resources
: In addition to the reserves shown above, seawater contains 0.05 parts per million iodine, or approximately 34 million tons. Seaweeds of the Laminaria family are able to extract and accumulate up to 0.45% iodine on a dry basis. Although not as economical as the production of iodine as a byproduct of gas, nitrate, and oil, the seaweed industry represented a major source of iodine prior to 1959 and remains a large resource.
Substitutes
: There are no comparable substitutes for iodine in many of its principal applications, such as in animal feed, catalytic, nutritional, pharmaceutical, and photographic uses. Bromine and chlorine could be substituted for iodine in biocide, colorant, and ink, although they are usually considered less desirable than iodine. Antibiotics can be used as a substitute for iodine biocides.
eEstimated. NA Not available. W Withheld to avoid disclosing company proprietary data. — Zero. 1Defined as imports – exports + adjustments for Government and industry stock changes. 2See Appendix C for resource/reserve definitions and information concerning data sources. 3Excludes U.S. production.
U.S. Geological Survey, Mineral Commodity Summaries, January 2012

78
IRON AND STEEL1
(Data in million metric tons of metal unless otherwise noted) Domestic Production and Use
: The iron and steel industry and ferrous foundries produced goods in 2011 that were estimated to be valued at $103 billion. Pig iron was produced by 5 companies operating integrated steel mills in 15 locations. About 48 companies produce raw steel at about 108 minimills. Combined production capability was about 115 million tons. Indiana accounted for 26% of total raw steel production, followed by Ohio, 12%, Pennsylvania, 7%, and Michigan, 6%. The distribution of steel shipments was estimated to be: warehouses and steel service centers, 25%; construction, 16%; transportation (predominantly automotive), 15%; cans and containers, 3%; and other, 41%.
Salient Statistics—United States: 2007 2008 2009 2010 Pig iron production2 36.3 33.7 19.0 26.8 29
2011e
Steel production: 98.1 91.9 59.4 80.5 86 Basic oxygen furnaces, percent 41.8 42.6 38.2 38.7 38 Electric arc furnaces, percent 58.2 57.4 61.8 61.3 62 Continuously cast steel, percent 96.7 96.4 97.5 97.4 98 Shipments: Steel mill products 96.5 89.3 56.4 75.7 89 Steel castingse, 3 0.7 0.7 0.4 0.4 0.4 Iron castingse, 3 7.4 7.4 4.0 4.0 4.0 Imports of steel mill products 30.2 29.0 14.7 21.7 30 Exports of steel mill products 10.1 12.2 8.4 11.0 13 Apparent steel consumption4 116 102 63 80 91 Producer price index for steel mill products (1982=100)5 182.9 220.6 165.2 191.7 220 Steel mill product stocks at service centers yearend6 9.3 7.8 5.6 7.0 7 Total employment, average, number Blast furnaces and steel mills 102,000 107,000 e109,000 110,000 140,000 Iron and steel foundriese 95,000 86,000 86,000 86,000 86,000 Net import reliance7 as a percentage of apparent consumption 16 13 11 6 9 Recycling
: See Iron and Steel Scrap and Iron and Steel Slag.
Import Sources (2007–10)
: Canada, 23%; European Union, 16%; China, 12%; Mexico, 10%; and other, 39%.
Tariff
: Item Number Normal Trade Relations
Pig iron 7201.10.0000 Free. 12-31-11
Carbon steel: Semifinished 7207.12.0050 Free. Hot-rolled, pickled 7208.27.0060 Free. Sheets, hot-rolled 7208.39.0030 Free. Cold-rolled 7209.18.2550 Free. Galvanized 7210.49.0090 Free. Bars, hot-rolled 7213.20.0000 Free. Structural shapes 7216.33.0090 Free. Stainless steel: Semifinished 7218.91.0015 Free. Do. 7218.99.0015 Free. Cold-rolled sheets 7219.33.0035 Free. Bars, cold-finished 7222.20.0075 Free. Pipe and tube 7304.41.3045 Free. Depletion Allowance
: Not applicable.
Government Stockpile
: None.
Prepared by Michael D. Fenton [(703) 648-4972, [email protected]]

79 IRON AND STEEL
Events, Trends, and Issues
: The expansion or contraction of gross domestic product (GDP) may be considered a predictor of the health of the steelmaking and steel manufacturing industries, worldwide and domestically. The World Bank’s (WB) global GDP growth forecast for 2012 and 2013 was 3.6% each, after 3.2% in 2011. The WB forecast that the U.S. economy would expand in 2012 and 2013 at rates of 2.9% and 2.7%, respectively, after a rate of 2.6% in 2011.
According to the Institute of Supply Management (ISM), economic activity in the manufacturing sector expanded in September 2011 for the 26th consecutive month and the overall economy grew for the 28th consecutive month. The ISM manufacturing index fluctuated during the 12 months ending September 2011 between 50.6 and 61.4, while averaging 56.6, which corresponds to a 4.8% increase in real GDP. An index in excess of 42.5 for a period of time generally indicates an expansion of the overall economy. MEPS (International) Inc. forecast total world steel production in 2011 to be up 7% from that in 2010. MEPS also forecast changes in steel production in 2011 in the European Union, South America, Asia (excluding China), the Commonwealth of Independent States (CIS), and Africa of 4%, 17%, 10%, 5%, and -13%, respectively. China accounted for about 45% of the world steel production. According to the World Steel Association, world apparent steel consumption (ASC) was expected to increase by 5.4% in 2012, after increasing by 6.5% during 2011 to 1,398 million tons. In the developed world, ASC was expected to be 15% below the 2007 level, whereas in the emerging and developing countries, it was expected to be 44% above. China’s ASC was expected to increase by 6% in 2012. ASC in India was expected to increase by 8% in 2012. ASC in the United States was expected to increase by 5% in 2012, while in the European Union, ASC was expected to increase by almost 3%. World Production Pig iron Raw steel
:
2010 2011e 2010 United States 27 29 81 86
2011e
Brazil 25 34 33 36 China 590 650 627 700 France 10 9 15 16 Germany 29 29 44 46 India 39 38 67 72 Japan 82 81 110 110 Korea, Republic of 31 42 49 68 Russia 49 48 67 69 Ukraine 28 29 34 35 United Kingdom 7 7 10 10 Other countries 109 67 273 World total (rounded) 1,030 1,100 1,410 1,500
260
World Resources
: Not applicable. See Iron Ore.
Substitutes
: Iron is the least expensive and most widely used metal. In most applications, iron and steel compete either with less expensive nonmetallic materials or with more expensive materials that have a performance advantage. Iron and steel compete with lighter materials, such as aluminum and plastics, in the motor vehicle industry; aluminum, concrete, and wood in construction; and aluminum, glass, paper, and plastics in containers.
eEstimated. Do. Ditto. 1Production and shipments data source is the American Iron and Steel Institute; see also Iron Ore and Iron and Steel Scrap. 2More than 95% of iron made is transported in molten form to steelmaking furnaces located at the same site. 3U.S. Census Bureau. 4Defined as steel shipments + imports - exports + adjustments for industry stock changes - semifinished steel product imports. 5U.S. Department of Labor, Bureau of Labor Statistics. 6Metals Service Center Institute. 7Defined as imports – exports + adjustments for Government and industry stock changes.
U.S. Geological Survey, Mineral Commodity Summaries, January 2012

80
IRON AND STEEL SCRAP1
(Data in million metric tons of metal unless otherwise noted) Domestic Production and Use
: Total value of domestic purchases (receipts of ferrous scrap by all domestic consumers from brokers, dealers, and other outside sources) and exports was estimated to be $35.2 billion in 2011, up by 42% from that of 2010. U.S. apparent steel consumption, an indicator of economic growth, increased to about 91 million tons in 2011. Manufacturers of pig iron, raw steel, and steel castings accounted for about 88% of scrap consumption by the domestic steel industry, using scrap together with pig iron and direct-reduced iron to produce steel products for the appliance, construction, container, machinery, oil and gas, transportation, and various other consumer industries. The ferrous castings industry consumed most of the remaining 12% to produce cast iron and steel products, such as motor blocks, pipe, and machinery parts. Relatively small quantities of scrap were used for producing ferroalloys, for the precipitation of copper, and by the chemical industry; these uses collectively totaled less than 1 million tons.
During 2011, raw steel production was an estimated 95 million tons, up about 18% from that of 2010; annual steel mill capability utilization was about 75% compared with 70% for 2010. Net shipments of steel mill products were estimated to have been about 89 million tons compared with 76 million tons for 2010. Salient Statistics—United States: 2007 2008 2009 2010 Production:
2011e
Home scrap 12 12 10 10 11 Purchased scrap2 64 73 70 66 73 Imports for consumption3 4 4 3 4 4 Exports3 16 22 22 21 24 Consumption, reported 64 67 53 60 55 Price, average, dollars per metric ton delivered, No. 1 Heavy Melting composite price, Iron Age Average, Pittsburgh, Philadelphia, Chicago 249 349 208 319 500 Stocks, consumer, yearend 4.4 4.6 3.4 4.0 4.0 Employment, dealers, brokers, processors, number4 30,000 30,000 30,000 30,000 30,000 Net import reliance5 as a percentage of reported consumption E E E E E Recycling
: Recycled iron and steel scrap is a vital raw material for the production of new steel and cast iron products. The steel and foundry industries in the United States have been structured to recycle scrap, and, as a result, are highly dependent upon scrap.
In the United States, the primary source of old steel scrap was the automobile. The recycling rate for automobiles in 2010, the latest year for which statistics were available, was about 113%. This high recycling rate includes the impact of more than a three-quarter-million unit increase of vehicles in operation, as compared with those of 2009. A recycling rate greater than 100% is a result of the steel industry recycling more steel from automobiles than was used in the domestic production of new vehicles. In 2010, the automotive recycling industry recycled more than 13.5 million tons of steel from end-of-life vehicles through more than 300 car shredders, the equivalent of nearly 10.8 million automobiles. More than 8,200 vehicle dismantlers throughout North America resell parts. The recycling rates for appliances and steel cans in 2010 were 90% and greater than 67%, respectively; this is the latest year for which statistics were available. Recycling rates for construction materials in 2010 were, as in 2009, about 98% for plates and beams and 70% for rebar and other materials. The recycling rates for appliance, can, and construction steel are expected to increase not only in the United States, but also in emerging industrial countries at an even greater rate. Public interest in recycling continues, and recycling is becoming more profitable and convenient as environmental regulations for primary production increase. Recycling of scrap plays an important role in the conservation of energy because the remelting of scrap requires much less energy than the production of iron or steel products from iron ore. Also, consumption of iron and steel scrap by remelting reduces the burden on landfill disposal facilities and prevents the accumulation of abandoned steel products in the environment. Recycled scrap consists of approximately 58% post-consumer (old, obsolete) scrap, 20% prompt scrap (produced in steel-product manufacturing plants), and 22% home scrap (recirculating scrap from current operations). Import Sources (2007–10)
: Canada, 77%; Mexico, 9%; United Kingdom, 6%; Sweden, 3%; and other, 5%.
Prepared by Michael D. Fenton (703) 648-4972, [email protected]]

81 IRON AND STEEL SCRAP
Tariff
: Item Number Normal Trade Relations
Iron and steel waste and scrap: 12-31-11
No. 1 Bundles 7204.41.0020 Free. No. 1 Heavy Melting 7204.49.0020 Free. No. 2 Heavy Melting 7204.49.0040 Free. Shredded 7204.49.0070 Free. Depletion Allowance
: Not applicable.
Government Stockpile
: None.
Events, Trends, and Issues
: Hot-rolled steel prices increased steadily during 2011 to a high in March of about $886 per metric ton, after which they decreased to $630 in November 2011. During the first 5 months of 2011, prices of hot-rolled steel were higher than those in 2010. The producer price index for steel mill products increased to 222 in May 2011 from 153 in May 2009. Steel mill production capability utilization peaked at 76.2% in June 2011 from a low of 40.8% in April 2009.
Scrap prices fluctuated during the first half of 2011, between about $336 and $412 per ton. Composite prices published by Iron Age Scrap Price Bulletin for No. 1 Heavy Melting steel scrap delivered to purchasers in Chicago, IL, and Philadelphia and Pittsburgh, PA, averaged about $399 per ton during the first 8 months of 2011. As reported by Iron Age Scrap Price Bulletin, the average price for nickel-bearing stainless steel scrap delivered to purchasers in Pittsburgh was about $2,257 per ton during the first 10 months of 2011, which was 3.2% higher than the 2010 average price of $2,187 per ton. The prices fluctuated widely between a low of $1,737 per ton in October 2011 and a high of $2,888 in late February and early March 2011. Exports of ferrous scrap increased in 2011 to an estimated 24 million tons from 21 million tons during 2010, mainly to Turkey, China, Taiwan, the Republic of Korea, and Canada, in descending order of export tonnage. Export scrap value increased from $8.4 billion in 2010 to an estimated $12 billion in 2011. Continuing and growing concern about the European Union sovereign-debt and banking crisis have adversely affected steel consumer confidence; depressed steel demand, production, and prices; and, thus, caused ferrous scrap prices to fluctuate and possibly decrease considerably. Annual world steel consumption increase was expected to slow to 6.5% in 2011 and 5.4% in 2012, following 15% annual growth in 2010, according to the World Steel Association. Growing economies of developing countries, such as China and India, have increased demand and prices of scrap iron and steel. The United States is the world’s leading exporter of scrap metal, including steel, gold, platinum, and other precious metals. As prices of iron and steel scrap increased, eventually some people began to recognize the resale value of iron and steel bridges, construction materials, manhole covers, statues, storm drain grates, wire, and even a steam locomotive. For this reason, many States have developed guidelines for scrap buyers to identify sellers in an effort to prevent stolen goods from being processed. World Mine Production and Reserves
: Not applicable.
World Resources
: Not applicable.
Substitutes
: About 1.7 million tons of direct-reduced iron was used in the United States in 2011 as a substitute for iron and steel scrap, up from 1.6 million tons in 2010.
eEstimated. E Net exporter. 1See also Iron Ore and Iron and Steel. 2Receipts – shipments by consumers + exports – imports. 3Includes used rails for rerolling and other uses, and ships, boats, and other vessels for scrapping. 4Estimated, based on 2002 Census of Wholesale Trade for 2007 through 2011. 5Defined as imports – exports + adjustments for Government and industry stock changes.
U.S. Geological Survey, Mineral Commodity Summaries, January 2012

82
IRON AND STEEL SLAG
(Data in million metric tons unless otherwise noted) Domestic Production and Use
: Ferrous slags are coproducts of iron- and steelmaking and are marketed primarily to the construction center. Data on U.S. slag production are unavailable, but it is estimated to have been in the range of 16 to 21 million tons in 2011. Sales improved owing largely to greater slag availability but remained constrained by continued low levels of construction spending. An estimated 17 million tons of iron and steel slag, valued at about $290 million1 (f.o.b. plant), was sold in 2011. Iron (blast furnace) slag accounted for about 50% of the tonnage sold and had a value of about $250 million; nearly 85% of this value was granulated slag. Steel slag produced from basic oxygen and electric arc furnaces accounted for the remainder.2 Slag was processed by nearly 30 companies servicing active iron and/or steel facilities or reprocessing old slag piles at about 120 sites in 32 States; included in this tally are a number of facilities that grind and sell ground granulated blast furnace slag (GGBFS) based on imported unground feed.
The prices listed in the table below are weighted, rounded averages for iron and steel slags sold for a variety of applications. Actual prices per ton ranged widely in 2011 from a few cents for some steel slags at a few locations to about $100 for some GGBFS. The major uses of air-cooled iron slag and for steel slag are as aggregates for asphaltic paving, fill, and road bases and as a feed for cement kilns; air-cooled slag also is used as an aggregate for concrete. Almost all GGBFS is used as a partial substitute for portland cement in concrete mixes or in blended cements. Pelletized slag is generally used for lightweight aggregate but can be ground into material similar to GGBFS. Owing to their low unit values, most slag types can be shipped by truck only over short distances, but rail and waterborne transportation can be longer. The much higher unit value of GGBFS allows this slag to be shipped economically over longer distances. Salient Statistics—United States: 2007 2008 2009 2010 Production, marketed1, 3 19.6 18.8 12.5 15.7 17.0
2011e
Imports for consumption4 1.9 1.3 1.3 1.4 1.5 Exports 0.1 (5) (5) 0.1 0.1 Consumption, apparent4, 6 19.6 18.8 12.5 15.7 16.9 Price average value, dollars per ton, f.o.b. plant 22.00 18.00 19.00 17.00 17.00 Stocks, yearend NA NA NA NA NA Employment, numbere 2,200 2,100 2,000 2,100 2,100 Net import reliance7 as a percentage of apparent consumption 9 7 10 8 8 Recycling
: Slag is commonly returned to the blast and steel furnaces as ferrous and flux feed, but data on these returns are incomplete. Entrained metal, particularly in steel slag, is routinely recovered during slag processing for return to the furnaces, but data on metal returns are unavailable.
Import Sources (2007–10)
: Granulated blast furnace slag (mostly unground) is the dominant type of ferrous slag imported, but official import data show significant year-to-year variations in tonnage and unit value and commonly include some shipments of industrial residues other than ferrous slags (such as fly ash, silica fume, and cenospheres) or of slags of other metallurgical industries. Furthermore, the official data in recent years appear to underrepresent true import levels of granulated slag. Based on official data, the principal country sources for 2007–10 were Japan, 47%; Canada, 35%; South Africa, 7%; Italy, 7%; and other, 4%.
Tariff
: Item Number Normal Trade Relations
Granulated slag 2618.00.0000 Free. 12-31-11
Slag, dross, scale, from manufacture of iron and steel 2619.00.3000 Free. Depletion Allowance
: Not applicable.
Government Stockpile
: None.
Prepared by Hendrik G. van Oss [(703) 648-7712, [email protected]]

83 IRON AND STEEL SLAG
Events, Trends, and Issues
: Blast furnace slag availability overall is constrained by the general decline in recent years in the number of active U.S. blast furnaces, the lack of construction of new furnaces, and the depletion of old slag piles. Granulation cooling is currently installed at only four active blast furnaces but is being evaluated for installation at other sites, contingent on the sites remaining active. Pelletized blast furnace slag is in very limited supply, but it is uncertain if any additional pelletizing capacity is being planned. Production of basic oxygen furnace steel slag from integrated iron and steel works has increased recently as some previously idled furnaces have been restarted, but slag availability for the market remains constrained by significant volumes of slag being returned to the furnaces. Slag from electric arc steel furnaces (largely fed with steel scrap) remains relatively abundant. Where slag availability has not been a problem, slag (as aggregate) sales to the construction sector have tended to be less volatile than those of natural aggregates or of cement. In contrast, sales of GGBFS have trended more in line with those of cement, but, for both environmental and performance reasons, there has been a general growth in this slag’s share of the cementitious material market in recent years, albeit still at a very small percentage of the total. Although sales prices for GGBFS remain lower than those for portland cement, the differences have become small owing to significant declines in cement prices in recent years. Draft regulations released in 2009–10 to restrict emissions (especially of mercury) by U.S. cement plants and to reclassify fly ash as a hazardous waste for disposal purposes have the potential to reduce the supply of these cementitious materials to the U.S. market and thus could lead to an increase in demand for GGBFS. Long-term growth in the supply of GGBFS is likely to hinge on imports, either of ground or unground material.
World Mine Production and Reserves
: Slag is not a mined material and thus the concept of reserves does not apply to this mineral commodity. Slag production data for the world are unavailable, but it is estimated that annual world iron slag output in 2011 was on the order of 260 to 310 million tons, and steel slag about 130 to 210 million tons, based on typical ratios of slag to crude iron and steel output.
World Resources
: Not applicable.
Substitutes
: Slag competes with crushed stone and sand and gravel as aggregates in the construction sector. Fly ash, natural pozzolans, and silica fume are common alternatives to GGBFS as cementitious additives in blended cements and concrete. Slags (especially steel slag) can be used as a partial substitute for limestone and some other natural (rock) materials as raw material for clinker (cement) manufacture. Some other metallurgical slags, such as copper slag, can compete with ferrous slags in some specialty markets but are generally in much more restricted supply than ferrous slags.
eEstimated. NA Not available. 1The data (obtained from an annual survey of slag processors) pertain to the quantities of processed slag sold rather than that processed or produced during the year. The data exclude any entrained metal that may be recovered during slag processing and returned to iron and, especially, steel furnaces, and are incomplete regarding slag returns to the furnaces. 2There were very minor sales of open hearth furnace steel slag from stockpiles but no domestic production of this slag type in 2006–10. 3Data include sales of imported granulated blast furnace slag, either after domestic grinding or still unground, and exclude sales of pelletized slag (proprietary but very small). Overall, actual production of blast furnace slag may be estimated as equivalent to 25% to 30% of crude (pig) iron production and steel furnace slag as about 10% to 15% of crude steel output. 4Comparison of official (U.S. Census Bureau) with unofficial import data suggest that the official data significantly understate the true imports of granulated slag. The USGS canvass appears to capture only part of the imported slag. Thus the apparent consumption statistics are likely too low by about 0.1 to 1.3 million tons per year for the range of years listed. 5Less than ½ unit. 6Defined as total sales of slag (includes that from imported feed) minus exports. Calculation is based on unrounded original data. 7Defined as total sales of imported slag minus exports of slag. Data are not available to allow adjustments for changes in stocks.
U.S. Geological Survey, Mineral Commodity Summaries, January 2012

84
IRON ORE1
(Data in million metric tons of usable ore2 unless otherwise noted) Domestic Production and Use
: In 2011, mines in Michigan and Minnesota shipped 99% of the usable ore produced in the United States, with an estimated value of $6.0 billion. Thirteen iron ore mines (11 open pits, 1 reclamation operation, and 1 dredging operation), 9 concentration plants, and 9 pelletizing plants operated during the year. Almost all ore was concentrated before shipment. Eight of the mines operated by three companies accounted for virtually all of the production. The United States was estimated to have produced and consumed 2% of the world’s iron ore output.
Salient Statistics—United States: 2007 2008 2009 2010 Production, usable 52.5 53.6 26.7 49.9 54
2011e
Shipments 50.9 53.6 27.6 50.6 52 Imports for consumption 9.4 9.2 3.9 6.4 5 Exports 9.3 11.1 3.9 10.0 10 Consumption: Reported (ore and total agglomerate)3 54.7 51.9 31.0 42.3 49 Apparente 52.1 49.7 25.7 48.0 48 Price,4 U.S. dollars per metric ton 59.64 70.43 92.80 98.80 120.00 Stocks, mine, dock, and consuming plant, yearend, excluding byproduct oree, 5 15.8 17.7 18.7 17.2 18 Employment, mine, concentrating and pelletizing plant, quarterly average, number 4,450 4,770 3,530 4,780 5,260 Net import reliance6 as a percentage of apparent consumption (iron in ore) E E E E E Recycling
: None (see Iron and Steel Scrap section).
Import Sources (2007–10)
: Canada, 66%; Brazil, 22%; Russia, 3%; Chile, 3%; and other, 6%.
Tariff
: Item Number Normal Trade Relations
Concentrates 2601.11.0030 Free. 12-31-11
Coarse ores 2601.11.0060 Free. Fine ores 2601.11.0090 Free. Pellets 2601.12.0030 Free. Briquettes 2601.12.0060 Free. Sinter 2601.12.0090 Free. Depletion Allowance
: 15% (Domestic), 14% (Foreign).
Government Stockpile
: None.
Events, Trends, and Issues
: Following an almost 30% decrease in the worldwide price for iron ore fines sold in the European market and an almost one-third decrease for fines from Australia sold in the Asian market in 2009, both owing to the global economic downturn, the global benchmarking system for the sale of iron ore ceased in 2010. April 2010 marked the end of the 40-year global benchmarking system for the sale of iron ore under annual contract. Iron ore producers felt that they had been losing out when some customers reneged on contract tonnages when spot price fell below the contract price. The major producers reached agreements with several customers to move to shorter term or quarterly contracts (based on 3 months—starting the previous quarter minus 1 month). U.S. prices in 2010 did not follow the adjustment in world prices and actually increased. U.S. domestic prices continued to increase in 2011, following a general upward trend in world prices.
Major iron-ore-mining companies continue to reinvest profits in mine development, but increases in production capacity may outstrip expected consumption within the next few years, as economic growth, dominated by China, is expected to slow. In 2010, it was estimated that China increased production (of mostly lower grade ores) by 22% from that of the previous year—significantly higher than the 7% increase seen between 2008 and 2009 and somewhat higher than the 17% increase seen between 2007 and 2008. Estimates of Chinese imports of higher grade ores in 2010 (more than 80% from Australia, Brazil, and India) showed a slight decrease compared with those of 2009—the first decrease in more than a decade. Prepared by John D. Jorgenson [(703) 648-4912, [email protected]]

85 IRON ORE
In 2010, China imported almost 60% of the world’s total iron ore exports and produced about 60% of the world’s pig iron. Since international iron ore trade and production of iron ore and pig iron are key indicators of iron ore consumption, this demonstrates that iron ore consumption in China is the primary factor upon which the expansion of the international iron ore industry depends. The world iron ore market should continue to be tight with demand exceeding supply until at least 2015 owing to the long lead time required to bring mines into production, a world shortage of skilled labor, and growing natural resource nationalism. The Mesabi Nugget project—a direct-reduced iron nugget plant—was completed in Minnesota in the fourth quarter of 2009 and continued to ramp up production in 2011. The $270 million plant produces 96%-to-98% iron-content nuggets. Plans are being made to reopen an iron ore pit adjacent to the nugget plant. A $1.6-billion project to produce steel slab was also underway on the Mesabi Range in Minnesota. A taconite pellet plant, direct-reduced iron plant, and steelmaking facilities are planned for operation and all are planned to be completed by 2015. World Mine Production and Reserves
: The mine production estimate for China is based on crude ore, rather than usable ore, which is reported for the other countries. The iron ore reserve estimates for Australia, Kazakhstan, and Ukraine have been revised based on new information from those countries.
Mine production Reserves7 2010 2011e
United States 50 54 6,900 2,100 Crude ore Iron content
Australia 433 480 35,000 17,000 Brazil 370 390 29,000 16,000 Canada 37 37 6,300 2,300 China 1,070 1,200 23,000 7,200 India 230 240 7,000 4,500 Iran 28 30 2,500 1,400 Kazakhstan 24 24 3,000 1,000 Mauritania 11 11 1,100 700 Mexico 14 14 700 400 Russia 101 100 25,000 14,000 South Africa 59 55 1,000 650 Sweden 25 25 3,500 2,200 Ukraine 78 80 6,000 2,100 Venezuela 14 16 4,000 2,400 Other countries 48 50 12,000 World total (rounded) 2,590 2,800 170,000 80,000
6,000
World Resources
: U.S. resources are estimated to be about 27 billion tons of iron contained within 110 billion tons of ore. U.S. resources are mainly low-grade taconite-type ores from the Lake Superior district that require beneficiation and agglomeration prior to commercial use. World resources are estimated to exceed 230 billion tons of iron contained within greater than 800 billion tons of crude ore.
Substitutes
: The only source of primary iron is iron ore, used directly, as lump ore, or converted to briquettes, concentrates, pellets, or sinter. At some blast furnace operations, ferrous scrap may constitute as much as 7% of the blast furnace feedstock. Scrap is extensively used in steelmaking in electric arc furnaces and in iron and steel foundries, but scrap availability can be an issue in any given year. In general, large price increases for lump and fine iron ores and iron ore pellets through mid-2009 were commensurate with price increases in the alternative—scrap. The ratio of the U.S. import price of scrap to the U.S. import price of iron ore decreased in 2011, causing the relative attractiveness of scrap compared to iron ore to increase to levels similar to those of 2009. The ratio of imported scrap to imported iron ore price in 2011 is the lowest it has been in the past decade.
eEstimated. E Net exporter. 1See also Iron and Steel and Iron and Steel Scrap. 2Agglomerates, concentrates, direct-shipping ore, and byproduct ore for consumption. 3Includes weight of lime, flue dust, and other additives in sinter and pellets for blast furnaces. 4Estimated from reported value of ore at mines. 5Information regarding consumer stocks at receiving docks and plants has not been available since 2003 (stock changes for 2006–10 were estimated). 6Defined as imports – exports + adjustments for Government and industry stock changes. 7See Appendix C for resource/reserve definitions and information concerning data sources.
U.S. Geological Survey, Mineral Commodity Summaries, January 2012

86
IRON OXIDE PIGMENTS
(Data in metric tons unless otherwise noted) Domestic Production and Use
: Iron oxide pigments (IOPs) are mined by three companies in three States in the United States. Production data, which were withheld by the U.S. Geological Survey to protect company proprietary data, were virtually unchanged in 2011 from those of 2010. There were seven companies, including the three producers of natural IOPs, that processed and sold finished natural and synthetic IOPs. Sales by those companies increased slightly in 2011, still remaining well below the sales peak of 88,100 tons in 2007. About 57% of natural and synthetic finished IOP’s were used in concrete and other construction materials, 29% in coatings and paints, 6% in foundry uses, and about 2% each in industrial chemicals, animal food, magnetic tape and ink, and other uses.
Salient Statistics—United States: 2007 2008 2009 2010 Production, mine W W W W W
2011e
Production, finished natural and synthetic IOP 88,100 83,300 50,800 54,700 55,000 Imports for consumption 178,000 155,000 106,000 151,000 160,000 Exports, pigment grade 5,410 4,740 5,640 9,490 11,000 Consumption, apparent1 261,000 234,000 151,000 196,000 200,000 Price, average value, dollars per kilogram2 1.38 1.39 1.46 1.47 1.47 Employment, mine and mill 70 65 58 60 60 Net import reliance3 as a percentage of apparent consumption >50% >50% >50% >50% >50% Recycling
: None.
Import Sources (2007–10)
: Natural: Cyprus, 62%; Spain, 18%; France, 10%; Austria, 4%; and other, 6%. Synthetic: China, 57%; Germany, 23%; Brazil, 6%; Italy, 5%; and other, 9%.
Tariff
: Item Number Normal Trade Relations
Natural: 12-31-11
Micaceous iron oxides 2530.90.2000 2.9% ad val. Earth colors 2530.90.8015 Free. Iron oxides and hydroxides containing more than 70% Fe2O3: Synthetic: Black 2821.10.0010 3.7% ad val. Red 2821.10.0020 3.7% ad val. Yellow 2821.10.0030 3.7% ad val. Other 2821.10.0040 3.7% ad val. Earth colors 2821.20.0000 5.5% ad val. Depletion Allowance
: 14% (Domestic and foreign).
Government Stockpile
: None.
Prepared by Arnold O. Tanner [(703) 648-4791, [email protected]]

87 IRON OXIDE PIGMENTS
Events, Trends, and Issues
: In 2011, natural IOP production and sales increased only slightly compared with those of 2010, reflecting a slowing of the recovery of the U.S. and European economies from the economic recession in 2008 and 2009; moderate to strong growth continued in Asia. Shipments of architectural and specialty paints and coatings, and brick and tile, decreased slightly in the United States in the first half of 2011 compared with those of the same period in 2010. Residential construction, in which IOPs are used to color concrete block and brick, ready-mixed concrete, and roofing tiles, remained sluggish. Housing starts were estimated to have had a small increase in 2011, based upon the first 9 months, but housing completions were estimated to have decreased slightly. Commercial construction, a major market for IOP colorants in concrete, remained weak in 2011. Exports of pigment-grade IOPs increased to some Asian markets, where economic recovery was occurring at a faster pace than in other regions, and to Mexico. Exports also increased moderately to some European and South American markets. Exports of other grades of IOPs and hydroxides also increased to Asian markets, Canada, Mexico, Spain, and the United Kingdom. Imports of natural IOPs increased from Cyprus, France, and Germany. Imports of synthetic IOPs increased, especially from Brazil, Canada, China, and Germany.
An increasing awareness of environmental issues, particularly in Europe and the United States, accompanied by an increasing demand for environmentally friendly products and industrial processes worldwide, presented challenges and opportunities for the pigments market. A study by a research firm revealed that a number of factors continued to influence the domestic market for pigments in the coatings industry. These included the elimination of heavy metals and heavy-metal salts and an increase in competitively priced high-performance pigments from Asia. Inorganic pigments, although losing some appeal owing to cadmium, chromium, or barium content, were expected to continue to be the preferred types where heat, light, and chemical resistance properties were required. The oldest known mine in the Western Hemisphere, determined by archeologists to be about 12,000 years old, was discovered in Chile. The mine, in the form of a single trench nearly 40 meters long, was used by Native Americans to produce red and yellow iron oxide pigments. World Mine Production and Reserves Mine production Reserves4
:
2010 United States W W Moderate
2011e
Cyprus 12,000 12,500 Moderate Germany5 234,000 250,000 Moderate India 390,000 400,000 Large Pakistan 6,000 6,000 Moderate Spain 140,000 140,000 Large Turkey 100,000 100,000 NA United Kingdom 8,000 8,000 NA Other countries 20,000 21,000 World total (rounded) 6NA 6NA Large
Moderate
World Resources
: Domestic and world resources for production of IOPs are adequate. Adequate resources are available worldwide for the manufacture of synthetic IOPs.
Substitutes
: IOPs are probably the most important of the natural minerals suitable for use as pigments after milling. Because IOPs are low cost, color stable, and nontoxic, they can be economically used for imparting black, brown, yellow, and red coloring in large and relatively low-value applications. Other minerals may be used as colorants, but they generally cannot compete with IOPs because of the limited tonnages available. Synthetic IOPs are widely used as colorants and compete with natural IOPs in many color applications. Organic colorants are used for some colorant applications, but several of the organic compounds fade over time from exposure to sunlight.
eEstimated. NA Not available. W Withheld to avoid disclosing company proprietary data. 1Defined as production of finished natural and synthetic IOPs + imports – exports. 2Unit value for finished iron oxide pigments sold or used by U.S. producers. 3Defined as imports – exports + adjustments for Government and industry stock changes. 4See Appendix C for resource/reserve definitions and information concerning data sources. 5Includes natural and synthetic iron oxide pigment. 6A significant number of other countries undoubtedly produce iron oxide pigments, but output is not reported and no basis is available to formulate estimates of output levels. Such countries include Azerbaijan, China, Honduras, Kazakhstan, Russia, and Ukraine. Unreported output likely is substantial.
U.S. Geological Survey, Mineral Commodity Summaries, January 2012

88
KYANITE AND RELATED MATERIALS
(Data in thousand metric tons unless otherwise noted) Domestic Production and Use
: One firm in Virginia with integrated mining and processing operations produced kyanite from hard-rock open pit mines. Another company produced synthetic mullite in Georgia. Commercially produced mullite is synthetic, produced from sintering or fusing such feedstock materials as kyanite or bauxitic kaolin; natural mullite occurrences typically are rare and uneconomic to mine. Of the kyanite-mullite output, 90% was estimated to have been used in refractories and 10% in other uses. Of the refractory usage, an estimated 60% to 65% was used in ironmaking and steelmaking and the remainder in the manufacture of chemicals, glass, nonferrous metals, and other materials. The only source of commercially mined andalusite was produced in North Carolina as part of a mineral mixture of high-purity silica and alumina for use in a variety of refractory mineral products for the foundry and ceramics industries.
Salient Statistics—United States: 2007 2008 2009 2010 Production:
2011e
Mine1 120 97 71 93 95 Synthetic mullitee 40 40 40 40 40 Imports for consumption (andalusite) 2 6 5 2 7 Exports 36 36 26 38 40 Consumption, apparente 124 107 90 97 102 Price, average, dollars per metric ton:2 U.S. kyanite, raw NA 229 283 283 300 U.S. kyanite, calcined 333 357 383 422 425 Andalusite, Transvaal, South Africa 235 263 352 336 347 Employment, kyanite mine, office, and plant, numbere 130 120 110 115 120 Employment, mullite plant, office, and plant, numbere 200 190 170 180 190 Net import reliance3 as a percentage of apparent consumption E E E E E Recycling
: Insignificant.
Import Sources (2007–10)
: South Africa, 85%; France, 7%; Peru, 3%; and other, 5%.
Tariff
: Item Number Normal Trade Relations
Andalusite, kyanite, and sillimanite 2508.50.0000 Free. 12-31-11
Mullite 2508.60.0000 Free. Depletion Allowance
: 22% (Domestic), 14% (Foreign).
Government Stockpile
: None.
Prepared by Arnold O. Tanner [(703) 648-4791, [email protected]]

89 KYANITE AND RELATED MATERIALS
Events, Trends, and Issues
: Steel production in the United States, which ranked third in the world, increased by 6% in the first 8 months of 2011 compared with that of the same period in 2010, indicating a similar increase in consumption for kyanite-mullite refractories. Crude steel production in three other top steel-producing countries increased in the first 8 months of 2011 compared with that of the same period in 2010. China, the leading producer, increased production by about 10%; India and Russia (fourth and fifth) increased production by nearly 5% each. Steel production in Japan (second) decreased slightly. Total world steel production rose by nearly 8% during the same period. Of the total world refractories market, estimated to be approximately 24 million tons, crude steel manufacturing consumed around 70% of refractories production.
Global demand for refractory products grew during 2010 and 2011 as a result of the continued recovery of steel production and reductions of refractory inventory implemented since 2009. With the steel recovery continuing, mullite received increasing interest, as many refractory customers sought alternative aluminosilicate refractory minerals to refractory bauxite. China is expected to continue to be the largest national market for refractories, comprising the majority of global demand, and the Asia Pacific region likely will continue to be the largest regional market. Above-average growth is expected in India. Eastern Europe, North America, and Western Europe had significant refractory demand because of their large industrial bases, but Eastern Europe is expected to have the highest growth of these regions, reflecting the area’s continued industrialization. North America is expected to have solid growth prospects in the near term, showing continued recovery in manufacturing and steel production, but longer term expectations are for growth to lag behind the worldwide average, with steel production shifting to less-developed areas. Demand for refractories in iron and steel production is expected to have the strongest gain in the next several years owing to increasing steel production. Growth also is anticipated for refractories needed to produce other metals and in the industrial mineral market because of increasing production of cement, ceramics, glass, and other mineral products. World Mine Production and Reserves Mine production Reserves4
:
2010 United Statese 93 95 Large
2011e
France 65 65 NA India 25 25 1,400 South Africa 240 270 NA Other countries 6 8 World total (rounded) 429 460 NA
NA
World Resources
: Large resources of kyanite and related minerals are known to exist in the United States. The chief resources are in deposits of micaceous schist and gneiss, mostly in the Appalachian Mountains area and in Idaho. Other resources are in aluminous gneiss in southern California. These resources are not economical to mine at present. The characteristics of kyanite resources in the rest of the world are thought to be similar to those in the United States.
Substitutes
: Two types of synthetic mullite (fused and sintered), superduty fire clays, and high-alumina materials are substitutes for kyanite in refractories. Principal raw materials for synthetic mullite are bauxite, kaolin and other clays, and silica sand.
eEstimated. E Net exporter. NA Not available. 1Production data are as reported in the trade literature. 2Source: Industrial Minerals Magazine. 3Defined as imports – exports + adjustments for Government and industry stock changes. 4See Appendix C for resource/reserve definitions and information concerning data sources.
U.S. Geological Survey, Mineral Commodity Summaries, January 2012
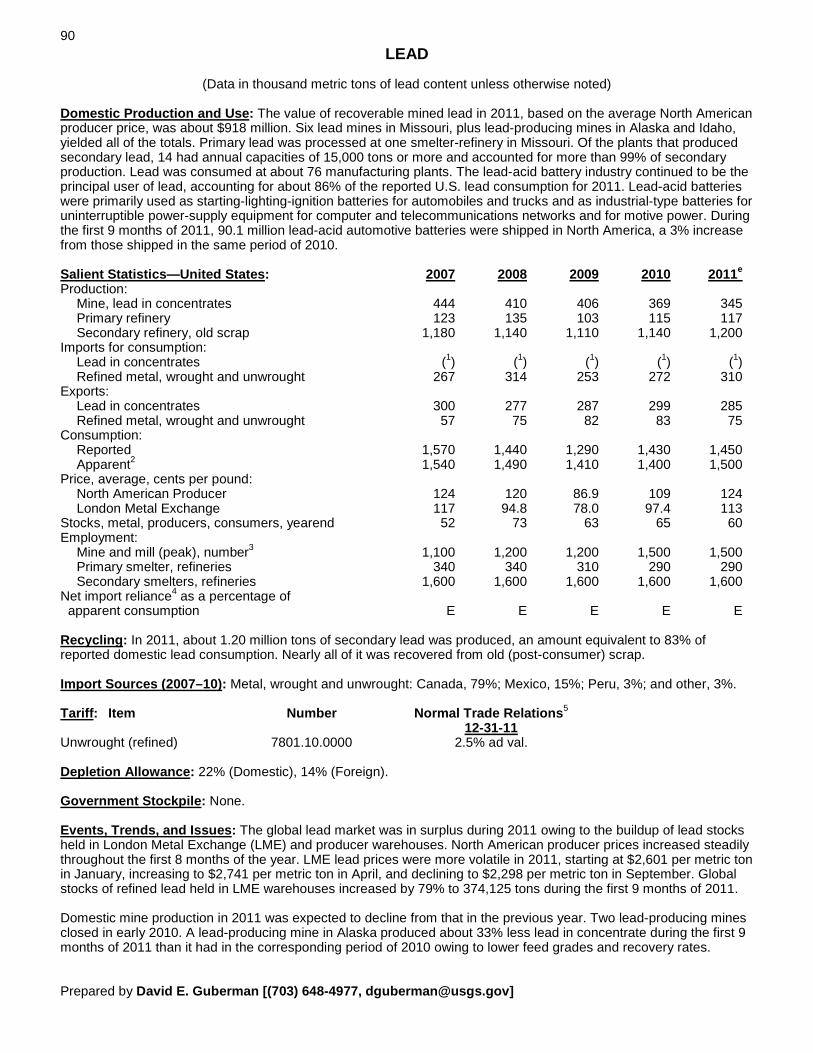
90
LEAD
(Data in thousand metric tons of lead content unless otherwise noted) Domestic Production and Use
: The value of recoverable mined lead in 2011, based on the average North American producer price, was about $918 million. Six lead mines in Missouri, plus lead-producing mines in Alaska and Idaho, yielded all of the totals. Primary lead was processed at one smelter-refinery in Missouri. Of the plants that produced secondary lead, 14 had annual capacities of 15,000 tons or more and accounted for more than 99% of secondary production. Lead was consumed at about 76 manufacturing plants. The lead-acid battery industry continued to be the principal user of lead, accounting for about 86% of the reported U.S. lead consumption for 2011. Lead-acid batteries were primarily used as starting-lighting-ignition batteries for automobiles and trucks and as industrial-type batteries for uninterruptible power-supply equipment for computer and telecommunications networks and for motive power. During the first 9 months of 2011, 90.1 million lead-acid automotive batteries were shipped in North America, a 3% increase from those shipped in the same period of 2010.
Salient Statistics—United States: 2007 2008 2009 2010 Production:
2011e
Mine, lead in concentrates 444 410 406 369 345 Primary refinery 123 135 103 115 117 Secondary refinery, old scrap 1,180 1,140 1,110 1,140 1,200 Imports for consumption: Lead in concentrates (1) (1) (1) (1) (1) Refined metal, wrought and unwrought 267 314 253 272 310 Exports: Lead in concentrates 300 277 287 299 285 Refined metal, wrought and unwrought 57 75 82 83 75 Consumption: Reported 1,570 1,440 1,290 1,430 1,450 Apparent2 1,540 1,490 1,410 1,400 1,500 Price, average, cents per pound: North American Producer 124 120 86.9 109 124 London Metal Exchange 117 94.8 78.0 97.4 113 Stocks, metal, producers, consumers, yearend 52 73 63 65 60 Employment: Mine and mill (peak), number3 1,100 1,200 1,200 1,500 1,500 Primary smelter, refineries 340 340 310 290 290 Secondary smelters, refineries 1,600 1,600 1,600 1,600 1,600 Net import reliance4 as a percentage of apparent consumption E E E E E Recycling
: In 2011, about 1.20 million tons of secondary lead was produced, an amount equivalent to 83% of reported domestic lead consumption. Nearly all of it was recovered from old (post-consumer) scrap.
Import Sources (2007–10)
: Metal, wrought and unwrought: Canada, 79%; Mexico, 15%; Peru, 3%; and other, 3%.
Tariff
: Item Number Normal Trade Relations5
Unwrought (refined) 7801.10.0000 2.5% ad val. 12-31-11
Depletion Allowance
: 22% (Domestic), 14% (Foreign).
Government Stockpile
: None.
Events, Trends, and Issues
: The global lead market was in surplus during 2011 owing to the buildup of lead stocks held in London Metal Exchange (LME) and producer warehouses. North American producer prices increased steadily throughout the first 8 months of the year. LME lead prices were more volatile in 2011, starting at $2,601 per metric ton in January, increasing to $2,741 per metric ton in April, and declining to $2,298 per metric ton in September. Global stocks of refined lead held in LME warehouses increased by 79% to 374,125 tons during the first 9 months of 2011.
Domestic mine production in 2011 was expected to decline from that in the previous year. Two lead-producing mines closed in early 2010. A lead-producing mine in Alaska produced about 33% less lead in concentrate during the first 9 months of 2011 than it had in the corresponding period of 2010 owing to lower feed grades and recovery rates. Prepared by David E. Guberman [(703) 648-4977, [email protected]]

91 LEAD
The operator of the only domestic primary lead smelter announced plans to construct a new primary lead smelter at the same location as its existing smelter, which would be closed by yearend 2013, according to an agreement with the U.S. Environmental Protection Agency (EPA). The company was expected to vote on final approval for the project by yearend 2011. The new smelter would incorporate processing technology that could reduce lead emissions substantially compared with traditional lead smelting. A leading domestic lead-acid battery manufacturer broke ground on a new $100 million secondary lead smelter in Florence, SC. When completed in 2012, the facility would have the capacity to produce about 120,000 tons per year of secondary lead. Another producer was expanding secondary lead production capacity at an existing facility in Tampa, FL, by 400%, to 118,000 tons per year. The company was on schedule to start a new secondary lead furnace in late September and reach its expanded capacity in early 2012. In mid-2011, the EPA proposed stronger air toxic standards for secondary lead smelters that would potentially reduce lead and arsenic emissions. Global mine production of lead was expected to increase by 9% in 2011 from that in 2010, to 4.52 million tons, mainly owing to production increases in China, India, and Mexico, offsetting declines in other regions. China was expected to account for nearly one-half of global lead mine production. Global refined lead production was expected to increase by about 7% from that in 2010, to 10.3 million tons. Increased refined lead output was expected to be primarily driven by new production capacity in China (despite shutdowns of many smaller smelters) and increases in Australia, Germany, India, and the Republic of Korea. Global lead consumption was expected to increase by about 6% in 2011 from that in 2010, to 10.1 million tons, partially owing to a 7% increase in Chinese lead consumption. The International Lead and Zinc Study Group forecast global refined lead production would exceed consumption by 188,000 tons by yearend 2011. World Mine Production and Reserves
: Reserve estimates for Australia, Canada, China, Peru, Poland, and the United States were revised based on information derived from Government and industry sources.
Mine production Reserves6 2010 United States 369 345 6,100
2011e
Australia 625 560 29,000 Bolivia 73 85 1,600 Canada 65 75 450 China 1,850 2,200 14,000 India 95 120 2,600 Ireland 45 50 600 Mexico 158 225 5,600 Peru 262 240 7,900 Poland 70 40 1,700 Russia 97 115 9,200 South Africa 50 55 300 Sweden 60 70 1,100 Other countries 320 340 World total (rounded) 4,140 4,500 85,000
5,000
World Resources
: In recent years, significant lead resources have been demonstrated in association with zinc and/or silver or copper deposits in Australia, China, Ireland, Mexico, Peru, Portugal, Russia, and the United States (Alaska). Identified lead resources of the world total more than 1.5 billion tons.
Substitutes
: Substitution of plastics has reduced the use of lead in cable covering, cans, and containers. Aluminum, iron, plastics, and tin compete with lead in other packaging and coatings. Tin has replaced lead in solder for new or replacement potable water systems. In the electronics industry, there has been a move towards lead-free solders with compositions of bismuth, copper, silver, and tin. Steel and zinc were common substitutes for lead in wheel weights.
eEstimated. E Net exporter. 1Less than ½ unit. 2Apparent consumption defined as mine production + secondary refined + imports (concentrates and refined) – exports (concentrates and refined) + adjustments for Government and industry stock changes. 3Includes lead and zinc-lead mines for which lead was either a principal product or significant byproduct. 4Defined as imports – exports + adjustments for Government and industry stock changes; includes trade in both concentrates and refined lead. 5No tariff for Canada, Mexico, and Peru for item shown. 6See Appendix C for resource/reserve definitions and information concerning data sources.
U.S. Geological Survey, Mineral Commodity Summaries, January 2012

92
LIME1
(Data in thousand metric tons unless otherwise noted) Domestic Production and Use
: In 2011, an estimated 19.3 million tons (21.3 million short tons) of quicklime and hydrate was produced (excluding commercial hydrators), valued at about $2.2 billion. At yearend, there were 31 companies producing lime, which included 21 companies with commercial sales and 10 companies that produced lime strictly for internal use (for example, sugar companies). These companies had 72 primary lime plants (plants operating lime kilns) in 28 States and Puerto Rico. The 4 leading U.S. lime companies produced quicklime or hydrate in 24 States and accounted for about 72% of U.S. lime production. Principal producing States were Alabama, Kentucky, and Missouri (each with production of more than 2 million tons), and Nevada, Ohio, Pennsylvania, and Texas (each with production of more than 1 million tons). Major markets for lime were, in descending order of consumption, steelmaking, flue gas desulfurization, construction, water treatment, mining, precipitated calcium carbonate, and pulp and paper.
Salient Statistics—United States: 2007 2008 2009 2010 Production2 20,200 19,900 15,800 18,300 19,300
2011e
Imports for consumption 375 307 422 445 510 Exports 144 174 108 215 230 Consumption, apparent 20,400 20,000 16,100 18,500 19,600 Quicklime average value, dollars per ton at plant 84.60 89.90 102.00 102.70 112.00 Hydrate average value, dollars per ton at plant 102.40 107.20 126.40 125.00 131.00 Stocks, yearend NA NA NA NA NA Employment, mine and plant, number 5,300 5,400 4,800 5,000 5,000 Net import reliance3 as a percentage of apparent consumption 1 1 2 1 1 Recycling
: Large quantities of lime are regenerated by paper mills. Some municipal water-treatment plants regenerate lime from softening sludge. Quicklime is regenerated from waste hydrated lime in the carbide industry. Data for these sources were not included as production in order to avoid duplication.
Import Sources (2007–10)
: Canada, 88%; Mexico, 11%; and other, 1%.
Tariff
: Item Number Normal Trade Relations
Calcined dolomite 2518.20.0000 3% ad. val. 12-31-11
Quicklime 2522.10.0000 Free. Slaked lime 2522.20.0000 Free. Hydraulic lime 2522.30.0000 Free. Depletion Allowance
: Limestone produced and used for lime production, 14% (Domestic and foreign).
Government Stockpile
: None.
Events, Trends, and Issues
: In 2011, domestic lime production was bolstered by increased steel production, which is the leading market for lime. Through the end of October 2011, U.S. steel production was up by 7% compared with that in the same period in 2010.
Lime prices increased in 2011, with quicklime prices up about 9% and hydrate prices rising nearly 5% compared with those of 2010. Price increases were the result of increased production costs and increasing environmental costs. Increased production of higher priced dolomitic quicklime used for steelmaking also may have contributed to the higher quicklime price. The U.S. Environmental Protection Agency (EPA) published a final rule titled “Standards of performance for new stationary sources and emission guidelines for existing sources—Commercial and industrial solid waste incineration units.” The rule places new restrictions on materials that may legally be combusted in lime kilns and other combustion units. The rule created a new definition of nonhazardous materials that are solid waste when they are burned. This definition is important because solid wastes could not be burned in ordinary combustion units, such as boilers and lime kilns, but instead would need to be burned in a commercial or industrial solid waste incinerator. Several types of nonhazardous materials are burned in lime kilns or have been tested for their suitability as fuel. These materials include carpet, chipped tires, cocoa husks, creosote-treated wood, glycerin, landfill gas, municipal waste, paper, plastics, resins, sawdust, wood chips, and various types of engineered fuel. The EPA’s new rule could result in lime companies discontinuing the burning of some of these materials in lime kilns. Prepared by M. Michael Miller [(703) 648-7716, [email protected]]

93 LIME
September 30 was the deadline for the lime industry to begin electronically submitting greenhouse gas (GHG) reports to the EPA. Pursuant to the greenhouse gas reporting rule (40 CFR part 98), facilities that emit 25,000 tons or more per year of GHGs are required to report annually to the EPA. World Lime Production and Limestone Reserves Production Reserves4
:
2010 United States 18,300 19,300 Adequate for all
2011e
Australia 2,000 1,900 countries listed. Belgium 2,000 2,200 Brazil 7,700 8,300 Canada 1,910 1,900 China 190,000 200,000 France 3,500 3,600 Germany 6,850 7,100 India 14,000 15,000 Iran 2,700 2,900 Italy5 6,000 6,600 Japan (quicklime only) 7,200 7,200 Korea, Republic of 3,900 4,500 Mexico 5,800 6,200 Poland 1,800 2,000 Romania 2,000 2,000 Russia 8,000 8,200 South Africa (sales) 1,286 1,000 Spain 2,200 2,200 Turkey (sales) 4,300 4,900 Ukraine 4,220 4,400 United Kingdom 1,500 1,500 Vietnam 1,600 1,700 Other countries 11,900 World total (rounded) 311,000 330,000
12,000
World Resources
: Domestic and world resources of limestone and dolomite suitable for lime manufacture are adequate.
Substitutes
: Limestone is a substitute for lime in many applications, such as agriculture, fluxing, and sulfur removal. Limestone, which contains less reactive material, is slower to react and may have other disadvantages compared with lime, depending on the application; however, limestone is considerably less expensive than lime. Calcined gypsum is an alternative material in industrial plasters and mortars. Cement, cement kiln dust, fly ash, and lime kiln dust are potential substitutes for some construction uses of lime. Magnesium hydroxide is a substitute for lime in pH control, and magnesium oxide is a substitute for dolomitic lime as a flux in steelmaking.
eEstimated. NA Not available. 1Data are for quicklime, hydrated lime, and refractory dead-burned dolomite. Includes Puerto Rico. 2Sold or used by producers. 3Defined as imports – exports + adjustments for Government and industry stock changes; stock changes are assumed to be zero for apparent consumption and net import reliance calculations. 4See Appendix C for resource/reserve definitions and information concerning data sources. 5Includes hydraulic lime.
U.S. Geological Survey, Mineral Commodity Summaries, January 2012

94
LITHIUM
(Data in metric tons of lithium content unless otherwise noted) Domestic Production and Use
: The only active lithium carbonate plant in the United States was a brine operation in Nevada. Two companies produced a large array of downstream lithium compounds in the United States from domestic or South American lithium carbonate. A U.S. recycling company produced a small quantity of lithium carbonate from solutions recovered during the recycling of lithium-ion batteries.
Although lithium markets vary by location, global end-use markets are estimated as follows: ceramics and glass, 29%; batteries, 27%; lubricating greases, 12%; continuous casting, 5%; air treatment, 4%; polymers, 3%; primary aluminum production, 2%; pharmaceuticals, 2%; and other uses, 16%. Lithium use in batteries expanded significantly in recent years because rechargeable lithium batteries were being used increasingly in portable electronic devices and electrical tools. Salient Statistics—United States: 2007 2008 2009 2010 Production W W W W W
2011e
Imports for consumption 3,140 3,160 1,890 1,960 2,800 Exports 1,440 1,450 920 1,410 1,200 Consumption: Apparent W W W W W Estimated 2,400 2,300 1,300 11,000 12,000 Employment, mine and mill, number 68 68 68 68 68 Net import reliance2 as a percentage of apparent consumption >50% >50% >50% >50% >80% Recycling
: Recycled lithium content has been historically insignificant, but has increased steadily owing to the growth in consumption of lithium batteries. One U.S. company has recycled lithium metal and lithium-ion batteries since 1992 at its Canadian facility in British Columbia. In 2009, the U.S. Department of Energy awarded the company $9.5 million to construct the first U.S. recycling facility for lithium-ion batteries.
Import Sources (2007–10)
: Argentina, 50%; Chile, 47%; China, 2%; and other, 1%.
Tariff
: Item Number Normal Trade Relations
Other alkali metals 2805.19.9000 5.5% ad val. 12-31-11
Lithium oxide and hydroxide 2825.20.0000 3.7% ad val. Lithium carbonate: U.S.P. grade 2836.91.0010 3.7% ad val. Other 2836.91.0050 3.7% ad val. Depletion Allowance
: 22% (Domestic), 14% (Foreign).
Government Stockpile
: None.
Events, Trends, and Issues
: Worldwide lithium production increased in 2011. Sales volumes of two major lithium producers in Australia and Chile were reported to be up approximately 20% through the third quarter of 2011 compared with those of the same period of 2010, and lithium production in China was estimated to have increased by more than 30% from that of 2010. Argentina’s lithium industry experienced weather-related complications in the second quarter of 2011. Industry analysts expected worldwide consumption of lithium in 2011 to be between 22,500 and 24,500 tons, similar to that of 2010. Several brine and mineral-based lithium producers increased their lithium prices in 2011. Many new companies continued exploring for lithium on claims worldwide. Numerous claims in Nevada, as well as in Argentina, Australia, Bolivia, and Canada, have been leased or staked.
The most recent public information available on lithium production in Nevada was a 1998 U. S. Securities and Exchange Commission Report, which indicated lithium carbonate production of 5,400 tons and lithium hydroxide production of 2,270 tons. The Nevada Department of Taxation reported the 2009 gross proceeds from lithium at $7,475,578, which was 65% lower than that of 2008.3 Subsurface brines have become the dominant raw material for lithium carbonate production worldwide because of lower production costs compared with the mining and processing costs for hard-rock ores. Two brine operations in Chile dominate the world market, and a facility at a brine deposit in Argentina produced lithium carbonate and lithium Prepared by Brian W. Jaskula [(703) 648-4908, [email protected]]

95 LITHIUM
chloride. Several additional brine operations were under development in Argentina, with one facility expected to begin commercial production in 2012. Brine operations in China produced lithium carbonate, lithium chloride, and lithium hydroxide. Lithium minerals were used directly as ore concentrates in ceramics and glass applications worldwide and, increasingly, as feedstock for lithium carbonate and other lithium compounds in China. Owing to China’s growing demand for high-quality spodumene by its chemical companies, Australia’s leading lithium ore miner planned to double its production capacity by 2012, raising its total lithium carbonate equivalent production capacity to 110,000 tons per year. An emerging Australian lithium ore producer continued lithium concentrate production in Western Australia. The lithium concentrate was to be converted to battery-grade lithium carbonate in China to supply the Asian market. Utilizing a unique reverse osmosis process, a California company began producing high-purity lithium carbonate from geothermal brines. The reverse osmosis process eliminates the need for solar evaporation, a crucial and lengthy procedure in more common brine operations. Initial lithium carbonate production capacity was 500 tons per year. Batteries, especially rechargeable batteries, are the uses for lithium compounds with the largest growth potential. Demand for rechargeable lithium batteries continued to gain market share from rechargeable nonlithium batteries for use in cellular telephones, cordless tools, MP3 players, and portable computers and tablets. Major automobile companies were pursuing the development of lithium batteries for electric vehicles and hybrid electric vehicles—vehicles with an internal combustion engine and a battery-powered electric motor. Most commercially available hybrid vehicles use other types of batteries, although future generations of these vehicles may use lithium. Nonrechargeable lithium batteries were used in calculators, cameras, computers, electronic games, watches, and other devices. Lithium supply security has become a top priority for Asian technology companies. Strategic alliances and joint ventures have been, and are continuing to be, established with lithium exploration companies worldwide to ensure a reliable, diversified supply of lithium for Asia’s battery suppliers and vehicle manufacturers. With lithium carbonate being one of the lowest cost components of a lithium-ion battery, the issue to be addressed was not cost difference or production efficiency but supply security attained by acquiring lithium from diversified sources. World Mine Production and Reserves
: The reserve estimate for Australia has been revised based on new information from Government and industry sources.
Mine production Reserves4 2010 United States W W 38,000
2011e
Argentina 2,950 3,200 850,000 Australia 9,260 11,300 970,000 Brazil 160 160 64,000 Chile 10,510 12,600 7,500,000 China 3,950 5,200 3,500,000 Portugal 800 820 10,000 Zimbabwe 470 470 World total (rounded) 528,100 534,000 13,000,000
23,000
World Resources
: The identified lithium resources total 4 million tons in the United States and approximately 30 million tons in other countries. Among the other countries, identified lithium resources for Bolivia and Chile total 9 million tons and in excess of 7.5 million tons, respectively. Identified lithium resources for China, Argentina, and Australia are 5.4 million tons, 2.6 million tons, and 1.8 million tons, respectively; while Brazil, Congo (Kinshasa), and Serbia contain approximately 1 million tons each. Identified lithium resources for Canada total 360,000 tons.
Substitutes
: Substitution for lithium compounds is possible in batteries, ceramics, greases, and manufactured glass. Examples are calcium and aluminum soaps as substitutes for stearates in greases; calcium, magnesium, mercury, and zinc as anode material in primary batteries; and sodic and potassic fluxes in ceramics and glass manufacture. Lithium carbonate is not considered to be an essential ingredient in aluminum potlines. Substitutes for aluminum-lithium alloys in structural materials are composite materials consisting of boron, glass, or polymer fibers in resins.
eEstimated. W Withheld to avoid disclosing company proprietary data. 1Rounded to 1 significant figure to avoid disclosing company proprietary data. 2Defined as imports – exports + adjustments for Government and industry stock changes. 3Davis, David, 2010, Industrial minerals in The Nevada mineral industry 2009: Reno, NV, Nevada Bureau of Mines and Geology, p. 121–122. 4See Appendix C for resource/reserve definitions and information concerning data sources. 5Excludes U.S. production.
U.S. Geological Survey, Mineral Commodity Summaries, January 2012

96
MAGNESIUM COMPOUNDS1
(Data in thousand metric tons of magnesium content unless otherwise noted) Domestic Production and Use
: Seawater and natural brines accounted for about 57% of U.S. magnesium compounds production in 2011. Magnesium oxide and other compounds were recovered from seawater by three companies in California, Delaware, and Florida; from well brines by one company in Michigan; and from lake brines by two companies in Utah. Magnesite was mined by one company in Nevada, and olivine was mined by two companies in North Carolina and Washington. About 52% of the magnesium compounds consumed in the United States was used for refractories. The remaining 48% was used in agricultural, chemical, construction, environmental, and industrial applications.
Salient Statistics—United States: 2007 2008 2009 2010 Production 342 274 239 261 272
2011e
Imports for consumption 357 342 173 279 330 Exports 26 25 13 16 20 Consumption, apparent 673 591 399 524 582 Stocks, producer, yearend NA NA NA NA NA Employment, plant, numbere 370 370 300 300 300 Net import reliance2 as a percentage of apparent consumption 49 54 40 50 53 Recycling
: Some magnesia-based refractories are recycled, either for reuse as refractory material or for use as construction aggregate.
Import Sources (2007–10)
: China, 72%; Canada, 5%; Brazil, 5%; Austria, 5%; and other, 13%.
Tariff
:3 Item Number Normal Trade Relations
Crude magnesite 2519.10.0000 Free. 12-31-11
Dead-burned and fused magnesia 2519.90.1000 Free. Caustic-calcined magnesia 2519.90.2000 Free. Kieserite 2530.20.1000 Free. Epsom salts 2530.20.2000 Free. Magnesium hydroxide 2816.10.0000 3.1% ad val. Magnesium chloride 2827.31.0000 1.5% ad val. Magnesium sulfate (synthetic) 2833.21.0000 3.7% ad val. Depletion Allowance
: Brucite, 10% (Domestic and foreign); dolomite, magnesite, and magnesium carbonate, 14% (Domestic and foreign); magnesium chloride (from brine wells), 5% (Domestic and foreign); and olivine, 22% (Domestic) and 14% (Foreign).
Government Stockpile
: None.
Events, Trends, and Issues
: A lawsuit against several Chinese magnesite sellers, which was originally filed in 2005 by several U.S. magnesite purchasers alleging price fixing of magnesite since April 2000, was revived. The U.S. Circuit Court of Appeals in Philadelphia reversed a 2009 lower court decision that dismissed the case, and remanded the decision to the lower court for review. In addition, a group of U.S. farmers filed a class action lawsuit against a U.S. magnesia producer and two other firms alleging that the three companies agreed to control the price of magnesia used in animal feed and fertilizers. A similar lawsuit had been filed in 2010.
Prepared by Deborah A. Kramer [(703) 648-7719, [email protected]]

97 MAGNESIUM COMPOUNDS
As the world economy began to rebound, several magnesia manufacturers were increasing capacity. In Australia, the country’s leading magnesite mining company planned to refurbish a mothballed cement plant to produce 100,000 tons per year of caustic-calcined magnesia. The plant, which would increase the company’s total magnesia production capacity to 400,000 tons per year, was expected to come onstream by 2013. The leading magnesia producer in Turkey acquired the mine, plant, and reserves of a smaller magnesia producer in western Turkey and planned to expand caustic-calcined and dead-burned magnesia capacity at the facility. The company also planned to double the fused magnesia production capacity to 26,000 tons per year at its Kutahya facility. Another magnesia producer in Turkey doubled its caustic-calcined magnesia production capacity to 30,000 tons per year. In Brazil, the country’s sole dead-burned magnesia producer received approval to increase its production capacity by 120,000 tons per year to 440,000 tons per year. In April, a new magnesia plant came onstream in Saudi Arabia with capacities of 39,000 tons per year of caustic-calcined magnesia and 32,000 tons per year of dead-burned magnesia. An Austria-based refractories manufacturer acquired seawater magnesia producers in Drogheda, County Louth, Ireland, and Porsgrunn, Norway. The plant in Ireland was expected to provide a high-purity source of dead-burned magnesia to the Austrian company, and caustic-calcined magnesia production from the Norwegian plant would supply feedstock for a new 80,000-ton-per-year fused magnesia plant that was to be constructed at Porsgrunn. The world’s leading olivine producer planned to restart production at its 400,000-ton-per-year Raubergvik and 1.9-million-ton-per-year Grubse olivine mines in Norway. Production from the Raubergvik mine was scheduled to be shipped to the United States, mainly for foundry use, for which supplies have become tight. World Magnesite Mine Production and Reserves
: Reserve data for Brazil were revised based on new information from the country’s Government.
Mine production Reserves4 2010 United States W W 10,000
2011e
Australia 86 90 95,000 Austria 202 200 15,000 Brazil 115 115 160,000 China 4,040 4,100 550,000 Greece 86 90 30,000 India 95 100 6,000 Korea, North 43 45 450,000 Russia 346 350 650,000 Slovakia 187 190 35,000 Spain 133 130 10,000 Turkey 288 300 49,000 Other countries 141 150 World total (rounded) 55,760 55,900 2,500,000
390,000
In addition to magnesite, there are vast reserves of well and lake brines and seawater from which magnesium compounds can be recovered. World Resources
: Resources from which magnesium compounds can be recovered range from large to virtually unlimited and are globally widespread. Identified world resources of magnesite total 12 billion tons, and of brucite, several million tons. Resources of dolomite, forsterite, magnesium-bearing evaporite minerals, and magnesia-bearing brines are estimated to constitute a resource in billions of tons. Magnesium hydroxide can be recovered from seawater.
Substitutes
: Alumina, chromite, and silica substitute for magnesia in some refractory applications.
eEstimated. NA Not available. W Withheld to avoid disclosing company proprietary data. 1See also Magnesium Metal. 2Defined as imports – exports + adjustments for Government and industry stock changes. 3Tariffs are based on gross weight. 4See Appendix C for resource/reserve definitions and information concerning data sources. 5Excludes U.S. production.
U.S. Geological Survey, Mineral Commodity Summaries, January 2012

98
MAGNESIUM METAL1
(Data in thousand metric tons unless otherwise noted) Domestic Production and Use
: In 2011, magnesium was produced by one company at a plant in Utah by an electrolytic process that recovered magnesium from brines from the Great Salt Lake. Magnesium used as a constituent of aluminum-based alloys that were used for packaging, transportation, and other applications was the leading use for primary magnesium, accounting for 43% of primary metal use. Structural uses of magnesium (castings and wrought products) accounted for 40% of primary metal consumption. Desulfurization of iron and steel accounted for 11% of U.S. consumption of primary metal, and other uses were 6%.
Salient Statistics—United States: 2007 2008 2009 2010 Production:
2011e
Primary W W W W W Secondary (new and old scrap) 89 88 67 72 75 Imports for consumption 72 83 47 53 50 Exports 15 14 20 15 12 Consumption: Reported, primary 72 65 51 56 60 Apparent 2130 2140 390 2110 2110 Price, yearend: U.S. spot Western, dollars per pound, average 2.25 3.15 2.30 2.43 2.35 China free market, dollars per metric ton, average 4,550 2,665 2,950 2,925 3,300 Stocks, producer and consumer, yearend W W W W W Employment, numbere 400 400 400 400 400 Net import reliance4 as a percentage of apparent consumption 47 50 33 36 35 Recycling
: In 2011, about 21,000 tons of secondary production was recovered from old scrap.
Import Sources (2007–10)
: Israel, 30%; Canada, 28%; China, 12%; and other, 30%.
Tariff
: Item Number Normal Trade Relations
Unwrought metal 8104.11.0000 8.0% ad val. 12-31-11
Unwrought alloys 8104.19.0000 6.5% ad val. Wrought metal 8104.90.0000 14.8¢/kg on Mg content + 3.5% ad val. Depletion Allowance
: Dolomite, 14% (Domestic and foreign); magnesium chloride (from brine wells), 5% (Domestic and foreign).
Government Stockpile
: None.
Events, Trends, and Issues
: After hearing arguments from U.S. magnesium diecasters, which claimed that their magnesium diecasting volumes were being reduced as a direct result of the antidumping duties on magnesium from China and Russia, and from the U.S. primary magnesium producer, the U.S. International Trade Commission (ITC) voted to retain antidumping duties on magnesium alloy from China and revoke antidumping duties on magnesium alloy imported from Russia. These votes resulted from a full sunset review of duties on magnesium alloy imports from China and Russia that were established in 2005. The U.S. primary magnesium producer appealed the decision to revoke the antidumping duties on Russian magnesium alloy because the company claimed that the ITC should have investigated the cumulative effects of the imports of magnesium from China and Russia, instead of assessing each country’s imports separately. In October, the ITC scheduled an expedited 5-year sunset review on magnesium metal imports from China.
Prepared by Deborah A. Kramer [(703) 648-7719, [email protected]]

99 MAGNESIUM METAL
The U.S. primary magnesium producer accelerated its expansion plans and expected to have most of an 11,500-ton-per-year expansion at its Rowley, UT, primary magnesium plant onstream by the end of 2011. The expansion was originally scheduled to be completed by yearend 2012, but the company cited an increase in orders as the reason for the accelerated startup. When the expansion is completed, the company’s total production capacity would be 63,500 tons per year. Much of the magnesium production from the additional capacity would be sent to a nearby titanium sponge plant for use in its sponge production process. In China, many companies continued to expand their primary magnesium metal production capacities. A South Korean steel producer announced that it would begin construction of a 10,000-ton-per-year primary magnesium plant in Gangneung City, Gangwon Province, Republic of Korea, in May 2011. Construction of the modified Pidgeon process plant was expected to be completed by June 2012. The Israeli primary magnesium producer announced that it would increase production at its magnesium plant in Sdom by as much as 10% through debottlenecking. The plant had the capacity to produce 34,000 tons per year of magnesium, and the company said that the increased production level should be reached in the first quarter of 2011. Most of the additional output was expected to be shipped to the United States. In July, the World Trade Organization (WTO) issued its report concerning allegations by the European Union, Mexico, and the United States regarding export restraints maintained by China on various metals and minerals, including magnesium. A panel had been convened by the WTO in 2009 in response to the allegations. The panel found that the export duties and export quotas that China maintained on various forms of magnesium constituted a breach of WTO rules and that China failed to justify those measures as legitimate conservation measures, environmental protection measures, or short supply measures. The panel also found that China’s imposition of minimum export price, export licensing, and export quota administration requirements on these materials, as well as China’s failure to publish certain measures related to these requirements, was inconsistent with WTO rules. In January, the U.S. Circuit Court of Appeals for the District of Columbia denied the U.S. magnesium producer’s appeal of the U.S. Environmental Protection Agency’s (EPA) decision to include the company’s Rowley magnesium production facility as a Superfund site. The designation of the facility as a Superfund site gives the EPA the authority to investigate the site further to determine if a cleanup is necessary. The designated site encompasses 1,830 hectares on the southwest edge of the Great Salt Lake. Contaminants at the site include acidic wastewater, dioxins, furans, heavy metals, hexachlorobenzene, polychlorinated biphenyls, and polycyclic aromatic hydrocarbons. By yearend, the EPA began its initial investigation to determine the extent of the cleanup. World Primary Production and Reserves Primary production Reserves5
:
2010 United States W W Magnesium metal is derived from seawater, natural
2011e
Brazil 16 16 brines, dolomite, and other minerals. The reserves China 654 670 for this metal are sufficient to supply current and Israel 25 28 future requirements. To a limited degree, the existing Kazakhstan 21 20 natural brines may be considered to be a renewable Russia 37 37 resource wherein any magnesium removed by Serbia 2 2 humans may be renewed by nature in a short span Ukraine 2 2 World total6 (rounded) 757 780
of time.
World Resources
: Resources from which magnesium may be recovered range from large to virtually unlimited and are globally widespread. Resources of dolomite and magnesium-bearing evaporite minerals are enormous. Magnesium-bearing brines are estimated to constitute a resource in the billions of tons, and magnesium can be recovered from seawater at places along world coastlines.
Substitutes
: Aluminum and zinc may substitute for magnesium in castings and wrought products. For iron and steel desulfurization, calcium carbide may be used instead of magnesium.
eEstimated. W Withheld to avoid disclosing company proprietary data. 1See also Magnesium Compounds. 2Rounded to two significant digits to protect proprietary data. 3Rounded to one significant digit to protect proprietary data. 4Defined as imports – exports + adjustments for Government and industry stock changes. 5See Appendix C for resource/reserve definitions and information concerning data sources. 6Excludes U.S. production.
U.S. Geological Survey, Mineral Commodity Summaries, January 2012

100
MANGANESE
(Data in thousand metric tons gross weight unless otherwise specified) Domestic Production and Use
: Manganese ore containing 35% or more manganese has not been produced domestically since 1970. Manganese ore was consumed mainly by eight firms with plants principally in the East and Midwest. Most ore consumption was related to steel production, directly in pig iron manufacture and indirectly through upgrading ore to ferroalloys. Additional quantities of ore were used for such nonmetallurgical purposes as production of dry cell batteries, in plant fertilizers and animal feed, and as a brick colorant. Manganese ferroalloys were produced at two smelters. Construction, machinery, and transportation end uses accounted for about 29%, 10%, and 10%, respectively, of manganese demand. Most of the rest went to a variety of other iron and steel applications. The value of domestic consumption, estimated from foreign trade data, was about $1.3 billion.
Salient Statistics—United States:1 2007 2008 2009 2010 Production, mine2 — — — — —
2011e
Imports for consumption: Manganese ore 602 571 269 489 570 Ferromanganese 315 448 153 326 390 Silicomanganese3 414 365 130 297 400 Exports: Manganese ore 29 48 15 14 1 Ferromanganese 29 23 24 19 8 Silicomanganese 3 7 19 9 10 Shipments from Government stockpile excesses:4 Manganese ore 101 9 3 — -300 Ferromanganese 68 18 25 26 11 Consumption, reported:5 Manganese ore6 351 464 422 468 470 Ferromanganese 272 304 242 292 300 Silicomanganese 92 113 94 97 100 Consumption, apparent, manganese7 979 844 451 758 810 Price, average, 46% to 48% Mn metallurgical ore, dollars per metric ton unit, contained Mn: Cost, insurance, and freight (c.i.f.), U.S. portse 3.10 12.15 7.95 9.18 9.10 CNF8 China, Ryan’s Notes 6.05 14.70 5.61 7.23 96.13 Stocks, producer and consumer, yearend: Manganese ore6 190 255 115 89 90 Ferromanganese 31 27 31 30 30 Silicomanganese 22 24 26 28 28 Net import reliance10 as a percentage of apparent consumption 100 100 100 100 100 Recycling
: Manganese was recycled incidentally as a constituent of ferrous and nonferrous scrap; however, scrap recovery specifically for manganese was negligible. Manganese is recovered along with iron from steel slag.
Import Sources (2007–10)
: Manganese ore: Gabon, 57%; Australia, 15%; South Africa, 12%; Brazil, 4%; and other, 12%. Ferromanganese: South Africa, 50%; China, 19%; Ukraine, 6%; Mexico, 6%; and other, 19%. Manganese contained in all manganese imports: South Africa, 33%; Gabon, 19%; China, 10%; Australia, 9%; and other, 29%.
Tariff
: Item Number Normal Trade Relations
Ore and concentrate 2602.00.0040/60 Free. 12-31-11
Manganese dioxide 2820.10.0000 4.7% ad val. High-carbon ferromanganese 7202.11.5000 1.5% ad val. Silicomanganese 7202.30.0000 3.9% ad val. Metal, unwrought 8111.00.4700/4900 14% ad val. Depletion Allowance
: 22% (Domestic), 14% (Foreign).
Prepared by Lisa A. Corathers [(703) 648-4973, [email protected]]

101 MANGANESE
Government Stockpile
Stockpile Status—9-30-1111 :
Uncommitted Authorized Disposal plan Disposals Material inventory for disposal FY 2011 FY 2011 Manganese ore12 292 292 91 — Ferromanganese, high-carbon 356 356 91 34 Events, Trends, and Issues
: U.S. steel production in 2011 was projected to be 18% more than that in 2010. Imports of manganese materials were expected to be significantly more in 2011 than in 201017%, 20%, and 35% more for manganese ore, ferromanganese, and silicomanganese, respectively. As a result, U.S. manganese apparent consumption increased by an estimated 7% to 810,000 tons in 2011, which is less than might be expected based on increased imports because of a significant amount of manganese added to the Government stockpile. The annual average domestic manganese ore contract price followed the decrease in the average international price for metallurgical-grade ore set between Japanese consumers and major suppliers in 2011. Improved economic conditions led to planned expansions at three manganese mines and the startup of two new manganese mines, which added about 4.2 million tons per year of additional manganese ore production capacity worldwide.
World Mine Production and Reserves (metal content)
: Reserve estimates have been revised from those previously published for Brazil (upward), Gabon (downward), and South Africa (upward), as reported by the Government of Brazil and the major manganese producers in Gabon and South Africa.
Mine production Reserves13 2010 United States — — —
2011e
Australia 3,100 2,400 93,000 Brazil e780 1,000 110,000 China e2,600 2,800 44,000 Gabon 1,420 1,500 21,000 India e1,000 1,100 56,000 Mexico 175 170 4,000 South Africa 2,900 3,400 150,000 Ukraine e540 340 140,000 Other countries 1,340 1,400 World total (rounded) 13,900 14,000 630,000
Small
World Resources
: Land-based manganese resources are large but irregularly distributed; those of the United States are very low grade and have potentially high extraction costs. South Africa accounts for about 75% of the world’s identified manganese resources, and Ukraine accounts for 10%.
Substitutes
: Manganese has no satisfactory substitute in its major applications.
eEstimated. — Zero. 1Manganese content typically ranges from 35% to 54% for manganese ore and from 74% to 95% for ferromanganese. 2Excludes insignificant quantities of low-grade manganiferous ore. 3Imports more nearly represent amount consumed than does reported consumption. 4Net quantity, in manganese content, defined as stockpile shipments – receipts. 5Manganese consumption cannot be estimated as the sum of manganese ore and ferromanganese consumption because so doing would count manganese in ore used to produce ferromanganese twice. 6Consumers only, exclusive of ore consumed at iron and steel plants. 7Thousand metric tons, manganese content; based on estimated average content for all components except imports, for which content is reported. 8Cost and freight (CNF) represents the costs paid by a seller to ship manganese ore by sea to a Chinese port; excludes insurance. 9Average weekly price through October 2011. 10Defined as imports – exports + adjustments for Government and industry stock changes. 11See Appendix B for definitions. 12Metallurgical grade; positive inventory reflects material that was unobligated from a prior sale. 13See Appendix C for resource/reserve definitions and information concerning data sources.
U.S. Geological Survey, Mineral Commodity Summaries, January 2012

102
MERCURY
(Data in metric tons of mercury content unless otherwise noted)1 Domestic Production and Use
: Mercury has not been produced as a principal mineral commodity in the United States since 1992, when the McDermitt Mine, in Humboldt County, NV, closed. In 2011, mercury was recovered as a byproduct from processing gold-silver ore at several mines in Nevada; however, these production data were not reported. Secondary, or recycled, mercury was recovered by retorting end-of-use mercury-containing products that mainly included batteries, compact and traditional fluorescent lamps, dental amalgam, medical devices, and thermostats, as well as mercury-contaminated soils. The mercury was processed and refined for resale or exported. Secondary mercury production data were not reported. Mercury use is not carefully tracked in the United States; however, no more than 100 metric tons per year of mercury was consumed domestically. The leading domestic end user of mercury was the chlorine-caustic soda industry. Owing to mercury toxicity and concerns for the environment and human health, overall mercury use has declined in the United States. Mercury has been released to the environment from mercury-containing car switches when the automobile is scrapped for recycling, from coal-fired powerplant emissions, and from incinerated mercury-containing medical devices. Mercury is no longer used in batteries and paints manufactured in the United States. Mercury was imported, refined, and then exported for global use in chlorine-caustic soda production, compact and traditional fluorescent lights, dental amalgam, and neon lights; however, its primary use is for small-scale gold mining in many parts of the world. Some button-type batteries, cleansers, fireworks, folk medicines, grandfather clocks, pesticides, and some skin-lightening creams and soaps may contain mercury.
Salient Statistics—United States: 2007 2008 2009 2010 Production:
2011e
Mine (byproduct) NA NA NA NA NA Secondary NA NA NA NA NA Imports for consumption (gross weight), metal 67 155 206 294 160 Exports (gross weight), metal 84 732 753 459 200 Price, average value, dollars per flask, free market2 530 600 600 1,076 1,950 Net import reliance3 as a percentage of apparent consumption E E E E E Recycling
: In 2011, six companies in the United States accounted for the majority of secondary mercury recycling and production. Mercury-containing automobile convenience switches, barometers, computers, dental amalgam, fluorescent lamps, medical devices, thermostats, and some mercury-containing toys were collected by as many as 50 smaller companies and then the mercury-containing materials were shipped to larger companies for retorting and reclamation of the mercury. The increased use of nonmercury substitutes has resulted in a shrinking reservoir of mercury-containing products for recycling.
Import Sources (2007–10)
: Peru, 50%; Chile, 37%; Germany, 7%; Canada, 4%; and other, 2%.
Tariff
: Item Number Normal Trade Relations
Mercury 2805.40.0000 1.7% ad val. 12-31-11
Depletion Allowance
: 22% (Domestic), 14% (Foreign).
Government Stockpile
: An inventory of 4,436 tons of mercury was held at several sites in the United States; however, the Defense Logistics Agency, DLA Strategic Materials has indicated that consolidated storage is preferred. An additional 1,329 tons of mercury was held by the U.S. Department of Energy, Oak Ridge, TN. Sales of mercury from the National Defense Stockpile remained suspended.
Stockpile Status—9-30-114 Uncommitted Authorized Disposal plan Disposals Material inventory for disposal FY 2011 FY 2011 Mercury 4,436 4,436 — — Events, Trends, and Issues
: The United States was a leading exporter of mercury in 2011, and the principal export destinations included Canada, Guyana, and Vietnam. The average price of a flask of domestic mercury was $1,950; however, by July, prices were reported in the $2,400-to-$2,600 range. Mercury is used for small-scale gold mining in
Prepared by William E. Brooks [(703) 648-7791, [email protected]]

103 MERCURY
many parts of the world and the price of gold, rising to slightly more than $1,800 per troy ounce in September, has influenced the global demand for mercury. In Colombia, the price of mercury in the small-scale gold mining areas may be as much as $100 per kilogram; therefore, a flask may be worth as much $3,450. Mercury prices were also affected by the European Union mercury export ban that took place in March, as well as the impending United States export ban that will take place in 2013. Diminishing supplies of mercury reclaimed from end-of-use, mercury-containing products, and the availability of mercury from China and Kyrgyzstan also affected mercury prices. Global consumption of mercury was estimated to be 2,000 tons per year, and approximately 50% of this consumption came from the use of mercury compounds to make vinyl monomer in China and Eastern Europe. Use of nonmercury technology for chloralkali production and the ultimate closure of the world’s mercury-cell chloralkali plants may put a large quantity of mercury on the global market for recycling, sale, or, owing to export bans in Europe and the United States, storage. Only 4 mercury cell chlorine-caustic soda plants were in use in the United States in 2011, compared with 5 in 2008, and 14 in 1996. The Federal Government was trying to find storage sites for the Nation’s excess mercury, and seven States—Colorado, Idaho, Missouri, Nevada, South Carolina, Texas, and Washington—were being considered. Byproduct mercury production is expected to continue from large-scale domestic and foreign gold-silver mining and processing, as is secondary production of mercury from an ever-diminishing supply of mercury-containing products, such as automobile convenience switches and thermostats. However, the volume of byproduct mercury that enters the global supply from foreign gold-silver processing may change dramatically from year to year; for example, mercury in Chile and Peru is typically stockpiled until there is sufficient material for export. Mercury may also be recycled from compact and traditional fluorescent lamps. Domestic mercury consumption will continue to decline as nonmercury-containing products, such as digital thermometers, are substituted for those containing mercury. World Mine Production and Reserves Mine production Reserves5
:
2010 United States NA NA —
2011e
Chile (byproduct) 176 100 NA China 1,600 1,400 21,000 Kyrgyzstan 250 250 7,500 Mexico (reclaimed) 21 15 27,000 Peru (byproduct) 102 35 NA Spain NA NA NA Other countries 100 130 World total (rounded) 2,250 1,930 93,000
38,000
World Resources
: China, Kyrgyzstan, Mexico, Peru, Russia, Slovenia, Spain, and Ukraine have most of the world’s estimated 600,000 tons of mercury resources. Mexico reclaims mercury from Spanish Colonial silver mining waste. In Peru, mercury production from the Santa Barbara Mine (Huancavelica) stopped in the 1990s; however, Peru continues to be an important source of byproduct mercury imported into the United States. Spain, once a leading producer of mercury from its centuries-old Almaden Mine, stopped mining in 2003. In the United States, there are mercury occurrences in Alaska, Arkansas, California, Nevada, and Texas; however, mercury has not been mined as a principal mineral commodity since 1992. The declining consumption of mercury, except for small-scale gold mining, indicates that these resources are sufficient for another century or more of use.
Substitutes
: For aesthetic or human health concerns, natural-appearing ceramic composites substitute for the dark-gray mercury-containing dental amalgam. “Galistan,” an alloy of gallium, indium, and tin, or alternatively, digital thermometers, now replaces the mercury used in traditional mercury thermometers. At chloralkali plants around the world, mercury-cell technology is being replaced by newer diaphragm and membrane cell technology. Light-emitting diodes that contain indium substitute for mercury-containing fluorescent lamps. Lithium, nickel-cadmium, and zinc-air batteries replace mercury-zinc batteries in the United States; indium compounds substitute for mercury in alkaline batteries; and organic compounds have been substituted for mercury fungicides in latex paint.
eEstimated. E Net exporter. NA Not available. — Zero. 1Some international data and dealer prices are reported in flasks. One metric ton (1,000 kilograms) = 29.0082 flasks, and 1 flask = 76 pounds, or 34.5 kilograms, or 0.035 ton. 2Platts Metals Week average mercury price quotation for the year. Actual prices may vary significantly from quoted prices. 3Defined as imports – exports + adjustments for Government and industry stock changes. 4See Appendix B for definitions. 5See Appendix C for resource/reserve definitions and information concerning data sources.
U.S. Geological Survey, Mineral Commodity Summaries, January 2012

104
MICA (NATURAL)
(Data in thousand metric tons unless otherwise noted) Domestic Production and Use
: Scrap and flake mica production, excluding low-quality sericite, was estimated to be 64,000 tons in 2011. Mica was mined in Alabama, Georgia, North Carolina, and South Dakota. Scrap mica was recovered principally from mica and sericite schist and as a byproduct from feldspar, kaolin, and industrial sand beneficiation. The majority of domestic production was processed into small particle-size mica by either wet or dry grinding. Primary uses were joint compound, oil-well-drilling additives, paint, roofing, and rubber products. The value of 2011 scrap mica production was estimated to be $9.9 million.
A minor amount of sheet mica was produced in 2011 as a byproduct at a gemstone mine in Amelia, VA, and as incidental production from feldspar mining in the Spruce Pine area of North Carolina. The domestic consuming industry was dependent upon imports to meet demand for sheet mica. Most sheet mica was fabricated into parts for electronic and electrical equipment. Salient Statistics—United States: 2007 2008 2009 2010 Scrap and flake:
2011e
Production:1, 2 Mine 97 85 51 53 64 Ground 99 98 77 76 96 Imports, mica powder and mica waste 41 27 20 26 25 Exports, mica powder and mica waste 8 9 8 6 9 Consumption, apparent3 130 103 63 73 80 Price, average, dollars per metric ton, reported: Scrap and flake 149 120 128 137 154 Ground: Dry 243 251 284 285 285 Wet 683 651 651 700 700 Employment, mine, number NA NA NA NA NA Net import reliance4 as a percentage of apparent consumption 25 18 19 27 20 Sheet: Production, minee (5) (5) (5) (5) (5) Imports, plates, sheets, strips; worked mica; split block; splittings; other >$1.00/kg 1.95 1.90 1.50 1.98 1.95 Exports, plates, sheets, strips; worked mica; crude and rifted into sheet or splittings >$1.00/kg 1.30 2.06 1.11 0.93 1.00 Shipments from Government stockpile excesses (5) (5) — — — Consumption, apparent 60.65 (6, 7) 60.39 1.05 0.95 Price, average value, dollars per kilogram, muscovite and phlogopite mica, reported: Block 132 122 121 130 130 Splittings 1.57 1.53 1.66 1.53 1.53 Stocks, fabricator and trader, yearend NA NA NA NA NA Net import reliance4 as a percentage of apparent consumption 100 100 100 100 100 Recycling
: None.
Import Sources (2007–10)
: Scrap and flake: Canada, 34%; China, 34%; India, 22%; Finland, 7%; and other, 3%. Sheet: China, 25%; Brazil, 21%; Belgium, 18%; India, 17%; and other, 19%.
Tariff
: Item Number Normal Trade Relations
Split block mica 2525.10.0010 Free. 12-31-11
Mica splittings 2525.10.0020 Free. Unworked—other 2525.10.0050 Free. Mica powder 2525.20.0000 Free. Mica waste 2525.30.0000 Free. Plates, sheets, and strips of agglomerated or reconstructed mica 6814.10.0000 2.7% ad val. Worked mica and articles of mica—other 6814.90.0000 2.6% ad val. Prepared by Jason Christopher Willett [(703) 648-6473, [email protected]]

105 MICA (NATURAL)
Depletion Allowance
: 22% (Domestic), 14% (Foreign).
Government Stockpile
: None.
Events, Trends, and Issues
: Domestic production and consumption of scrap and flake mica were estimated to increase in 2011. The increase primarily resulted from increased production of minerals from which mica is a byproduct that was caused by a slight recovery in construction materials consumption. Apparent consumption of sheet mica decreased in 2011. No environmental concerns are associated with the manufacture and use of mica products.
Significant stocks of sheet mica previously sold from the National Defense Stockpile (NDS) to domestic and foreign mica traders, brokers, and processors were exported, possibly resulting in understating apparent consumption in 2006 through 2009. The NDS has not held mica since 2008, when the last stocks of muscovite block were sold. Future supplies for U.S. consumption were expected to come increasingly from imports, primarily from Brazil, China, India, and Russia. World Mine Production and Reserves Scrap and flake Sheet
:
Mine productione Reserves8 Mine productione Reserves8 2010 2011 2010 All types:
2011
United States1 53 64 Large (5) (5) Very small Argentina 9 9 Large — — NA Canada 15 15 Large — — NA China 750 750 Large — — NA Finland 70 70 Large — — NA France 20 20 Large — — NA India 7 8 Large 3.5 3.5 Very large Korea, Republic of 27 28 Large — — NA Russia 100 100 Large 1.5 1.5 Moderate Other countries 25 28 Large 0.2 0.2 World total (rounded) 1,070 1,090 Large 5.2 5.2 Very large
Moderate
World Resources
: Resources of scrap and flake mica are available in clay deposits, granite, pegmatite, and schist, and are considered more than adequate to meet anticipated world demand in the foreseeable future. World resources of sheet mica have not been formally evaluated because of the sporadic occurrence of this material. Large deposits of mica-bearing rock are known to exist in countries such as Brazil, India, and Madagascar. Limited resources of sheet mica are available in the United States. Domestic resources are uneconomic because of the high cost of hand labor required to mine and process sheet mica from pegmatites.
Substitutes
: Some lightweight aggregates, such as diatomite, perlite, and vermiculite, may be substituted for ground mica when used as filler. Ground synthetic fluorophlogopite, a fluorine-rich mica, may replace natural ground mica for uses that require thermal and electrical properties of mica. Many materials can be substituted for mica in numerous electrical, electronic, and insulation uses. Substitutes include acrylic, cellulose acetate, fiberglass, fishpaper, nylon, nylatron, phenolics, polycarbonate, polyester, styrene, vinyl-PVC, and vulcanized fiber. Mica paper made from scrap mica can be substituted for sheet mica in electrical and insulation applications.
eEstimated. NA Not available. — Zero. 1Sold or used by producing companies. 2Excludes low-quality sericite used primarily for brick manufacturing. 3Based on scrap and flake mica mine production. 4Defined as imports – exports + adjustments for Government and industry stock changes. 5Less than ½ unit. 6See explanation in the Events, Trends, and Issues section. 7Apparent consumption calculation in 2008 results in a negative number. 8See Appendix C for resource/reserve definitions and information concerning data sources.
U.S. Geological Survey, Mineral Commodity Summaries, January 2012

106
MOLYBDENUM
(Data in metric tons of molybdenum content unless otherwise noted) Domestic Production and Use
: In 2011, molybdenum, valued at about $2.2 billion (based on an average oxide price), was produced by 10 mines. Molybdenum ore was produced as a primary product at four mines—one each in Colorado, Idaho, Nevada, and New Mexico—whereas six copper mines (three in Arizona, one each in Montana, Nevada, and Utah) recovered molybdenum as a byproduct. Three roasting plants converted molybdenite concentrate to molybdic oxide, from which intermediate products, such as ferromolybdenum, metal powder, and various chemicals, were produced. Iron and steel and superalloy producers accounted for about 81% of the molybdenum consumed.
Salient Statistics—United States: 2007 2008 2009 2010 Production, mine 57,000 55,900 47,800 59,400 64,000
2011e
Imports for consumption 18,300 14,500 11,400 19,700 18,000 Exports 33,700 34,700 27,900 31,600 33,000 Consumption: Reported 21,000 21,100 17,700 19,200 19,000 Apparent 40,900 36,400 30,500 46,400 50,000 Price, average value, dollars per kilogram1 66.79 62.99 25.84 34.83 34.90 Stocks, mine and plant concentrates, product, and consumer materials 7,600 7,000 7,700 8,800 7,500 Employment, mine and plant, number 940 940 920 940 940 Net import reliance2 as a percentage of apparent consumption E E E E E Recycling
: Molybdenum in the form of molybdenum metal or superalloys was recovered, but the amount was small. Although molybdenum is not recovered from scrap steel, recycling of steel alloys is significant, and some molybdenum content is reutilized. The amount of molybdenum recycled as part of new and old steel and other scrap may be as much as 30% of the apparent supply of molybdenum.
Import Sources (2007–10)
: Ferromolybdenum: Chile, 61%; China, 19%; Canada, 10%; and other, 10%. Molybdenum ores and concentrates: Mexico, 32%; Chile, 30%; Peru, 20%; Canada, 17%; and other, 1%.
Tariff
: Item Number Normal Trade Relations
Molybdenum ore and concentrates, roasted 2613.10.0000 12.8¢/kg + 1.8% ad val. 12-31-11
Molybdenum ore and concentrates, other 2613.90.0000 17.8¢/kg. Molybdenum chemicals: Molybdenum oxides and hydroxides 2825.70.0000 3.2% ad val. Molybdates of ammonium 2841.70.1000 4.3% ad val. Molybdates, all others 2841.70.5000 3.7% ad val. Molybdenum pigments, molybdenum orange 3206.20.0020 3.7% ad val. Ferroalloys, ferromolybdenum 7202.70.0000 4.5% ad val. Molybdenum metals: Powders 8102.10.0000 9.1¢/kg + 1.2% ad val. Unwrought 8102.94.0000 13.9¢/kg + 1.9% ad val. Wrought bars and rods 8102.95.3000 6.6% ad val. Wrought plates, sheets, strips, etc. 8102.95.6000 6.6% ad val. Wire 8102.96.0000 4.4% ad val. Waste and scrap 8102.97.0000 Free. Other 8102.99.0000 3.7% ad val. Depletion Allowance
: 22% (Domestic); 14% (Foreign).
Government Stockpile
: None.
Prepared by Désirée E. Polyak [(703) 648-4909, [email protected]]

107 MOLYBDENUM
Events, Trends, and Issues
: U.S. mine output of molybdenum in concentrate in 2011 increased by 8% from that of 2010. U.S. imports for consumption decreased by 9% from those of 2010, while U.S. exports increased by 5% from those of 2010. Domestic roasters operated at between 80% and 90% of full production capacity in 2009, but in 2010 and 2011 operated close to full production levels. U.S. reported consumption decreased slightly from that of 2010 while apparent consumption increased by 8%. Mine capacity utilization in 2010 was about 72%.
Molybdenum prices slowly increased in the first 2 months of 2011 but decreased for the remainder of the year; average price for the year was slightly higher than that of 2010. However, molybdenum demand remained strong. Both byproduct and primary molybdenum production levels in the United States remained strong in 2011 compared with their relatively low levels in 2009. Byproduct molybdenum production continued to be suspended at the Chino Mine in Grant County, NM, the Morenci Mine in Greenlee County, AZ, and the Mission Mine in Pima County, AZ. The Questa Mine, in Taos County, NM, commenced primary molybdenum mine production in the second quarter of 2011. World Mine Production and Reserves
: Reserves for Chile and Canada were revised based on new information.
Mine production Reserves3 2010 2011e
United States 59,400 64,000 2,700 (thousand metric tons)
Armenia 4,150 4,200 200 Canada 8,260 8,300 220 Chile 37,200 38,000 1,200 China 93,600 94,000 4,300 Iran 3,700 3,700 50 Kazakhstan 360 360 130 Kyrgyzstan 250 250 100 Mexico 10,900 12,000 130 Mongolia 2,500 2,000 160 Peru 17,000 18,000 450 Russiae 3,800 3,800 250 Uzbekistane 550 550 World total (rounded) 242,000 250,000 10,000
60
World Resources
: Identified resources of molybdenum in the United States amount to about 5.4 million tons, and in the rest of the world, about 14 million tons. Molybdenum occurs as the principal metal sulfide in large low-grade porphyry molybdenum deposits and as an associated metal sulfide in low-grade porphyry copper deposits. Resources of molybdenum are adequate to supply world needs for the foreseeable future.
Substitutes
: There is little substitution for molybdenum in its major application as an alloying element in steels and cast irons. In fact, because of the availability and versatility of molybdenum, industry has sought to develop new materials that benefit from the alloying properties of the metal. Potential substitutes for molybdenum include chromium, vanadium, niobium (columbium), and boron in alloy steels; tungsten in tool steels; graphite, tungsten, and tantalum for refractory materials in high-temperature electric furnaces; and chrome-orange, cadmium-red, and organic-orange pigments for molybdenum orange.
eEstimated. E Net exporter. 1Time-weighted average price per kilogram of molybdenum contained in technical-grade molybdic oxide, as reported by Platts Metals Week. 2Defined as imports – exports + adjustments for Government and industry stock changes. 3See Appendix C for resource/reserve definitions and information concerning data sources.
U.S. Geological Survey, Mineral Commodity Summaries, January 2012

108
NICKEL
(Data in metric tons of nickel content unless otherwise noted) Domestic Production and Use
: The United States did not have any active nickel mines in 2010. Limited amounts of byproduct nickel were recovered from copper and palladium-platinum ores mined in the Western United States. An inclined tunnel was being driven to access a sulfide orebody in Michigan, and four other projects were in varying stages of development in Minnesota. On a monthly or annual basis, 110 facilities reported nickel consumption. The principal consuming State was Pennsylvania, followed by Kentucky, North Carolina, and Indiana. Approximately 46% of the primary nickel consumed went into stainless and alloy steel production, 34% into nonferrous alloys and superalloys, 14% into electroplating, and 6% into other uses. End uses were as follows: transportation, 30%; fabricated metal products, 14%; electrical equipment, 12%; petroleum industry, 10%; chemical industry, construction, household appliances, and industrial machinery, 8% each; and other, 2%. The estimated value of apparent primary consumption was $2.93 billion.
Salient Statistics—United States: 2007 2008 2009 2010 Production, refinery byproduct W W W W W
2011e
Shipments of purchased scrap1 186,000 160,000 152,000 161,000 141,000 Imports: Primary 125,000 129,000 99,900 129,000 139,000 Secondary 16,200 20,100 17,700 23,800 22,500 Exports: Primary 13,100 11,600 7,030 12,600 13,000 Secondary 103,000 94,600 90,000 80,300 65,000 Consumption: Reported, primary 101,000 102,000 83,600 108,000 116,000 Reported, secondary 99,100 85,400 79,800 105,000 98,900 Apparent, primary 112,000 115,000 93,200 112,000 129,000 Total2 212,000 201,000 173,000 217,000 228,000 Price, average annual, London Metal Exchange: Cash, dollars per metric ton 37,216 21,104 14,649 21,804 22,800 Cash, dollars per pound 16.881 9.572 6.645 9.890 10.300 Stocks: Consumer, yearend 19,200 19,200 17,700 22,600 19,900 Producer, yearend3 5,690 5,860 6,150 7,950 7,050 Net import reliance4 as a percentage of apparent consumption 17 33 21 34 47 Recycling
: About 99,000 tons of nickel was recovered from purchased scrap in 2011. This represented about 43% of reported secondary plus apparent primary consumption for the year.
Import Sources (2007–10)
: Canada, 38%; Russia, 17%; Australia, 10%; Norway, 10%; and other, 25%.
Tariff
: Item Number Normal Trade Relations
Nickel oxide, chemical grade 2825.40.0000 Free. 12-31-11
Ferronickel 7202.60.0000 Free. Unwrought nickel, not alloyed 7502.10.0000 Free. Depletion Allowance
: 22% (Domestic), 14% (Foreign).
Government Stockpile
: The U.S. Government sold the last of the nickel in the National Defense Stockpile in 1999. The U.S. Department of Energy is holding 8,800 tons of nickel ingot contaminated by low-level radioactivity plus 5,080 tons of contaminated shredded nickel scrap. Ongoing decommissioning activities at former nuclear defense sites are expected to generate an additional 20,000 tons of nickel in shredded scrap.
Events, Trends, and Issues
: The U.S. economy continued to recover from the global recession of 2008–09, but the recovery remained weak. In 2011, U.S. production of austenitic (nickel-bearing) stainless steel increased to 1.57 million tons—slightly more than production in 2010 but 35% greater than the reduced output of 1.16 million tons in 2009. Stainless steel has traditionally accounted for two-thirds of primary nickel use worldwide, with more than one-half of the steel going into the construction, food processing, and transportation sectors. China, the world’s leading producer, cast a record-high 9.69 million tons of austenitic stainless steel in 2011.
Prepared by Peter H. Kuck [(703) 648-4965, [email protected]]

109 NICKEL
Nickel prices have been volatile in the aftermath of the global economic recession. In February 2011, the London Metal Exchange (LME) cash mean for 99.8%-pure nickel peaked at $28,249 per metric ton after an 8-month recovery. The cash price, however, began to deteriorate at that point as the European debt situation worsened and the adverse economic effect of the March earthquake in Japan became apparent. By September, the cash price had fallen to $20,388 per metric ton despite a gradual drawdown of stocks in LME warehouses. The average monthly LME cash price for November 2011 was $17,879 per ton. Canadian mine production rebounded after a 12-month labor dispute was settled in July 2010. Companies mining lateritic ore in the Philippines have been ramping up production to meet increased demand from Chinese producers of nickel pig iron. The $5.5 billion Ambatovy mining and processing project in east-central Madagascar was scheduled to begin producing nickel metal in early 2012. The lateritic ore was being slurried and piped to the venture’s pressure leach plant and refinery near Toamasina. The Toamasina refinery was designed to produce 60,000 tons per year of nickel metal. New mines also were being developed at several locations in Brazil, Southeast Asia, and the Pacific. The Barro Alto and Onca Puma laterite projects in Brazil have been producing ferronickel since early 2011. The $4.5 billion Goro hydrometallurgical complex in New Caledonia began producing a nickel-cobalt intermediate for export and was scheduled to reach full production in 2013. World Mine Production and Reserves
: Estimates of reserves for Canada, Colombia, Dominican Republic, Madagascar, and New Caledonia were revised based on new mining industry information from published sources.
Mine production Reserves5 2010 United States — — —
2011e
Australia 170,000 180,000 624,000,000 Botswana 28,000 32,000 490,000 Brazil 59,100 83,000 8,700,000 Canada 158,000 200,000 3,300,000 China 79,000 80,000 3,000,000 Colombia 72,000 72,000 720,000 Cuba 70,000 74,000 5,500,000 Dominican Republic — 14,000 1,000,000 Indonesia 232,000 230,000 3,900,000 Madagascar 15,000 25,000 1,600,000 New Caledonia7 130,000 140,000 12,000,000 Philippines 173,000 230,000 1,100,000 Russia 269,000 280,000 6,000,000 South Africa 40,000 42,000 3,700,000 Other countries 99,000 100,000 World total (rounded) 1,590,000 1,800,000 80,000,000
4,600,000
World Resources
: Identified land-based resources averaging 1% nickel or greater contain at least 130 million tons of nickel. About 60% is in laterites and 40% is in sulfide deposits. In addition, extensive deep-sea resources of nickel are in manganese crusts and nodules covering large areas of the ocean floor, particularly in the Pacific Ocean. The long-term decline in discovery of new sulfide deposits in traditional mining districts has forced companies to shift exploration efforts to more challenging locations like east-central Africa and the Subarctic. In 2007, a promising high-grade sulfide resource was discovered in the James Bay Lowlands of northwestern Ontario. The development of awaruite deposits in other parts of Canada may help alleviate any prolonged shortage of nickel concentrate. Awaruite, a natural iron-nickel alloy, is much easier to concentrate than pentlandite, the principal sulfide of nickel.
Substitutes
: To offset high and fluctuating nickel prices, engineers have been substituting low-nickel, duplex, or ultrahigh-chromium stainless steels for austenitic grades in construction applications. Nickel-free specialty steels are sometimes used in place of stainless steel within the power-generating and petrochemical industries. Titanium alloys can substitute for nickel metal or nickel-based alloys in corrosive chemical environments. Cost savings in manufacturing lithium-ion batteries allow them to compete against nickel-metal hydride in certain applications.
eEstimated. W Withheld to avoid disclosing company proprietary data. — Zero. 1Scrap receipts – shipments by consumers + exports – imports + adjustments for consumer stock changes. 2Apparent primary consumption + reported secondary consumption. 3Stocks of producers, agents, and dealers held only in the United States. 4Defined as imports – exports + adjustments for Government and industry stock changes. 5See Appendix C for resource/reserve definitions and information concerning data sources. 6For Australia, Joint Ore Reserves Committee (JORC) compliant reserves were only 5.5 million tons. 7Overseas territory of France.
U.S. Geological Survey, Mineral Commodity Summaries, January 2012

110
NIOBIUM (COLUMBIUM)
(Data in metric tons of niobium content unless otherwise noted) Domestic Production and Use
: Significant U.S. niobium mine production has not been reported since 1959. Domestic niobium resources are of low grade, some are mineralogically complex, and most are not commercially recoverable. Companies in the United States produced ferroniobium and niobium compounds, metal, and other alloys from imported niobium minerals, oxides, and ferroniobium. Niobium was consumed mostly in the form of ferroniobium by the steel industry and as niobium alloys and metal by the aerospace industry. Major end-use distribution of reported niobium consumption was as follows: steels, 75%; and superalloys, 25%. In 2010, the estimated value of niobium consumption was $330 million and was expected to be about $400 million in 2011, as measured by the value of imports.
Salient Statistics—United States: 2007 2008 2009 2010 Production:
2011e
Mine — — — — — Secondary NA NA NA NA NA Imports for consumptione, 1 10,120 9,230 4,400 8,500 9,200 Exportse, 1 1,100 781 195 281 430 Government stockpile releasese, 2 — — — — — Consumption:e Apparent 9,020 8,450 4,210 8,070 8,800 Reported3 6,510 5,380 4,350 5,590 4,400 Unit value, ferroniobium, dollars per metric ton4 21,918 34,398 37,298 37,781 41,000 Net import reliance5 as a percentage of apparent consumption 100 100 100 100 100 Recycling
: Niobium was recycled when niobium-bearing steels and superalloys were recycled; scrap recovery specifically for niobium content was negligible. The amount of niobium recycled is not available, but it may be as much as 20% of apparent consumption.
Import Sources (2007–10)
: Niobium contained in niobium and tantalum ore and concentrate; ferroniobium; and niobium metal and oxide: Brazil, 85%; Canada, 10%; Germany, 2%; Russia, 1%; and other, 2%.
Tariff
: Item Number Normal Trade Relations
Synthetic tantalum-niobium concentrates 2615.90.3000 Free. 12-31-11
Niobium ores and concentrates 2615.90.6030 Free. Niobium oxide 2825.90.1500 3.7% ad val. Ferroniobium: Less than 0.02% of P or S, or less than 0.4% of Si 7202.93.4000 5.0% ad val. Other 7202.93.8000 5.0% ad val. Niobium, unwrought: Waste and scrap6 8112.92.0600 Free. Alloys, metal, powders 8112.92.4000 4.9% ad val. Niobium, other6 8112.99.9000 4.0% ad val. Depletion Allowance
: 22% (Domestic), 14% (Foreign).
Government Stockpile
: For fiscal year (FY) 2011, which ended on September 30, 2011, the Defense Logistics Agency, DLA Strategic Materials disposed of no niobium materials. The DLA Strategic Materials did not announce a maximum disposal limit for niobium metal in FY 2012. The DLA Strategic Materials’ niobium mineral concentrate inventory was exhausted in FY 2007; niobium carbide powder, in FY 2002; and ferroniobium, in FY 2001.
Stockpile Status—9-30-117 Uncommitted Authorized Disposal plan Disposals Material inventory for disposal FY 2011 FY 2011 Niobium metal 10.1 10.1 — — Prepared by John F. Papp [(703) 648-4963, [email protected]]

111 NIOBIUM (COLUMBIUM)
Events, Trends, and Issues
: Niobium principally was imported in the form of ferroniobium and niobium unwrought metal, alloy, and powder. United States niobium import dependence was expected to be the same in 2011 as in 2010, when Brazil was the leading niobium supplier. By weight in 2010, Brazil supplied 87% of total U.S. niobium imports, 86% of ferroniobium, 93% of niobium metal, and 85% of niobium oxide. The leading suppliers of niobium in ore and concentrate were China (43%) and Brazil (26%). Financial market problems in 2008 and the subsequent economic slowdown resulted in reduced niobium material consumption in 2009. Niobium apparent consumption is believed to have continued an upward trend in 2011; however, the debt crisis in Europe threatened that recovery. In 2011, the British Geological Survey published a niobium-tantalum minerals profile (http://www.bgs.ac.uk/downloads/start.cfm?id=2033).
World Mine Production and Reserves
: Canada’s reserves were changed to proven plus probable reserves from proven reserves; data were updated (for the Niobec Mine) and another property added (Thor Lake), based on company reports.
Mine production Reserves8 2010 United States — — —
2011e
Brazil 58,000 58,000 2,900,000 Canada 4,420 4,400 200,000 Other countries 520 600 World total (rounded) 62,900 63,000 3,000,000
NA
World Resources
: World resources of niobium are more than adequate to supply projected needs. Most of the world’s identified resources of niobium occur mainly as pyrochlore in carbonatite [igneous rocks that contain more than 50% by volume carbonate (CO3) minerals] deposits and are outside the United States. The United States has approximately 150,000 tons of niobium resources in identified deposits, all of which were considered uneconomic at 2011 prices for niobium.
Substitutes
: The following materials can be substituted for niobium, but a performance or cost penalty may ensue: molybdenum and vanadium, as alloying elements in high-strength low-alloy steels; tantalum and titanium, as alloying elements in stainless and high-strength steels; and ceramics, molybdenum, tantalum, and tungsten in high-temperature applications.
eEstimated. NA Not available. — Zero. 1Imports and exports include the estimated niobium content of niobium and tantalum ores and concentrates, niobium oxide, ferroniobium, niobium unwrought alloys, metal, and powder. 2Government stockpile inventory reported by DLA Strategic Materials is the basis for estimating Government stockpile releases. 3Includes ferroniobium and nickel niobium. 4Unit value is mass-weighted average U.S. import value of ferroniobium assuming 65% niobium content. To convert dollars per metric ton to dollars per pound, divide by 2,205. 5Defined as imports – exports + adjustments for Government and industry stock changes. 6This category includes other than niobium-containing material. 7See Appendix B for definitions. 8See Appendix C for resource/reserve definitions and information concerning data sources.
U.S. Geological Survey, Mineral Commodity Summaries, January 2012

112
NITROGEN (FIXED)—AMMONIA
(Data in thousand metric tons of nitrogen unless otherwise noted) Domestic Production and Use
: Ammonia was produced by 12 companies at 24 plants in 16 States in the United States during 2011; 4 additional plants were idle for the entire year. Sixty percent of total U.S. ammonia production capacity was centered in Louisiana, Oklahoma, and Texas because of their large reserves of natural gas, the dominant domestic feedstock. In 2011, U.S. producers operated at about 85% of their rated capacity. The United States was one of the world’s leading producers and consumers of ammonia. Urea, ammonium nitrate, ammonium phosphates, nitric acid, and ammonium sulfate were the major derivatives of ammonia in the United States, in descending order of importance.
Approximately 86% of apparent domestic ammonia consumption was for fertilizer use, including anhydrous ammonia for direct application, urea, ammonium nitrates, ammonium phosphates, and other nitrogen compounds. Ammonia also was used to produce plastics, synthetic fibers and resins, explosives, and numerous other chemical compounds. Salient Statistics—United States:1 2007 2008 2009 2010 Production2 8,540 7,870 7,700 8,290 8,100
2011e
Imports for consumption 6,530 6,020 4,530 5,540 5,810 Exports 145 192 16 35 22 Consumption, apparent 15,000 13,600 12,300 13,800 13,800 Stocks, producer, yearend 157 302 167 165 207 Price, dollars per ton, average, f.o.b. Gulf Coast3 307 590 251 396 520 Employment, plant, numbere 1,050 1,100 1,050 1,050 1,050 Net import reliance4 as a percentage of apparent consumption 43 42 38 40 41 Recycling
: None.
Import Sources (2007–10)
: Trinidad and Tobago, 59%; Russia, 14%; Canada, 13%; Ukraine, 5%; and other, 9%.
Tariff
: Item Number Normal Trade Relations
Ammonia, anhydrous 2814.10.0000 Free. 12-31-11
Urea 3102.10.0000 Free. Ammonium sulfate 3102.21.0000 Free. Ammonium nitrate 3102.30.0000 Free. Depletion Allowance
: Not applicable.
Government Stockpile
: None.
Events, Trends, and Issues
: The Henry Hub spot natural gas price ranged between $3.4 and $4.9 per million British thermal units for most of the year, with an average of around $4.2 per million British thermal units. Natural gas prices in 2011 were relatively stable; slightly higher prices were a result of increased demand for natural gas owing to colder temperatures. The average Gulf Coast ammonia price gradually increased from $420 per short ton at the beginning of 2011 to a high of around $550 per short ton in October. The average ammonia price for the year was estimated to be about $520 per short ton. The U.S. Department of Energy, Energy Information Administration, projected that Henry Hub natural gas spot prices would average $4.30 per million British thermal units in 2012.
A long period of stable and low natural gas prices in the United States has made it economical for companies to restart idled ammonia plants in Louisiana and Texas. Several companies have announced plans to build new ammonia plants in Africa, Brazil, Brunei, China, India, Indonesia, Malaysia, and Turkmenistan, which would add about 6.7 million tons of annual production capacity within the next 2 to 4 years. The largest growth in ammonia production is in Africa and Brazil. Prepared by Lori E. Apodaca [(703) 648-7724, [email protected]]

113 NITROGEN (FIXED)—AMMONIA
According to the U.S. Department of Agriculture, U.S. corn growers planted 37.3 million hectares of corn in the 2011 crop year (July 1, 2010, through June 30, 2011), which was 5% higher than the area planted in 2010. Expectations of corn acreage utilization increased in many States because of higher selling prices and expectations of better net returns from corn compared to other commodities. Corn plantings for the 2012 crop year were expected to decrease slightly to 37.2 million hectares. Overall corn acreage was expected to remain high owing in part to continued U.S. ethanol production and U.S. corn exports in response to a strong global demand for feed grains. Nitrogen compounds also were an environmental concern. Overfertilization and the subsequent runoff of excess fertilizer may contribute to nitrogen accumulation in watersheds. Nitrogen in excess fertilizer runoff was suspected to be a cause of the hypoxic zone that arises in the Gulf of Mexico during the summer. Scientists continued to study the effects of fertilization on the Nation’s environmental health. World Ammonia Production and Reserves Plant production Reserves5
:
2010 United States 8,290 8,100 Available atmospheric nitrogen and sources
2011e
Australia 1,200 1,200 of natural gas for production of ammonia Bangladesh 1,300 1,300 are considered adequate for all listed Canada 4,000 4,100 countries. China 40,900 41,000 Egypt 3,000 3,500 Germany 2,680 2,700 India 11,500 12,000 Indonesia 4,800 4,800 Iran 2,500 3,000 Japan 1,000 1,000 Netherlands 1,800 1,800 Pakistan 2,400 2,400 Poland 1,800 1,800 Qatar 1,700 3,900 Romania 1,100 1,100 Russia 10,400 11,000 Saudi Arabia 2,600 3,000 Trinidad and Tobago 5,000 5,600 Ukraine 3,400 3,400 Uzbekistan 1,000 1,000 Venezuela 1,160 1,200 Other countries 17,000 World total (rounded) 131,000 136,000
17,000
World Resources
: The availability of nitrogen from the atmosphere for fixed nitrogen production is unlimited. Mineralized occurrences of sodium and potassium nitrates, found in the Atacama Desert of Chile, contribute minimally to global nitrogen supply.
Substitutes
: Nitrogen is an essential plant nutrient that has no substitute. Also, there are no known practical substitutes for nitrogen explosives and blasting agents.
eEstimated. 1U.S. Department of Commerce (DOC) data unless otherwise noted. 2Annual and preliminary data as reported in Current Industrial Reports MQ325B (DOC). 3Source: Green Markets. 4Defined as imports – exports + adjustments for Government and industry stock changes. 5See Appendix C for resource/reserve definitions and information concerning data sources.
U.S. Geological Survey, Mineral Commodity Summaries, January 2012

114
PEAT
(Data in thousand metric tons unless otherwise noted)1 Domestic Production and Use
: The estimated f.o.b. plant value of marketable peat production in the conterminous United States was $15.0 million in 2011. Peat was harvested and processed by about 38 companies in 12 of the conterminous States. The Alaska Department of Natural Resources, which conducted its own canvass of producers, reported 59,800 cubic meters of peat was produced in 2010; output was reported only by volume.2 A production estimate was unavailable for Alaska for 2011. Florida, Minnesota, and Illinois were the leading producing States, in order of quantity harvested. Reed-sedge peat accounted for approximately 86% of the total volume produced, followed by sphagnum moss, 8%, hypnum moss, 4%, and humus, 2%. About 97% of domestic peat was sold for horticultural use, including general soil improvement, golf course construction, nurseries, and potting soils. Other applications included earthworm culture medium, mixed fertilizers, mushroom culture, packing for flowers and plants, seed inoculants, and vegetable cultivation. In the industrial sector, peat was used as an oil absorbent and as an efficient filtration medium for the removal of waterborne contaminants in mine waste streams, municipal storm drainage, and septic systems.
Salient Statistics—United States: 2007 2008 2009 2010 Production 635 615 609 628 605
2011e
Commercial sales 694 648 644 605 525 Imports for consumption 977 936 906 947 1,060 Exports 56 e57 77 69 39 Consumption, apparent3 1,590 1,440 1,440 1,560 1,640 Price, average value, f.o.b. mine, dollars per ton 25.59 26.42 23.24 24.80 24.40 Stocks, producer, yearend 98 152 149 100 90 Employment, mine and plant, numbere 625 620 610 610 610 Net import reliance4 as a percentage of apparent consumption 60 57 58 60 63 Recycling
: None.
Import Sources (2007–10)
: Canada, 97%; and other, 3%.
Tariff
: Item Number Normal Trade Relations
Peat 2703.00.0000 Free. 12-31-11
Depletion Allowance
: 5% (Domestic).
Government Stockpile
: None.
Prepared by Lori E. Apodaca [(703) 648-7724, [email protected]]

115 PEAT
Events, Trends, and Issues
: Peat is an important component of growing media, and the demand for peat generally follows that of horticultural applications. In the United States, the short-term outlook is for production to average about 600,000 tons per year and imported peat from Canada to account for more than 60% of domestic consumption.
Owing to poor weather conditions, the Canadian peat harvest was expected to fall well short of the 2011 season targets. Eastern Canada, where 60% to 70% of the peat is harvested in New Brunswick and Quebec, was the most affected. World Mine Production and Reserves
: Countries that reported by volume only and had insufficient data for conversion to tons were combined and included with “Other countries.”
Mine production Reserves5 2010 United States 628 605 150,000
2011e
Belarus 2,593 3,200 400,000 Canada 1,262 950 720,000 Estonia 965 970 60,000 Finland 6,460 4,800 6,000,000 Ireland 3,300 3,300 (6) Latvia 1,119 1,000 76,000 Lithuania 327 330 190,000 Moldova 475 475 (6) Norway 440 300 (6) Poland 672 650 (6) Russia 1,300 1,650 1,000,000 Sweden 2,550 2,500 (6) Ukraine 597 450 (6) Other countries 670 670 World total (rounded) 23,400 22,000 10,000,000
1,400,000
World Resources
: Peat is a renewable resource, continuing to accumulate on 60% of global peatlands. However, the volume of global peatlands has been decreasing at a rate of 0.05% annually owing to harvesting and land development. Many countries evaluate peat resources based on volume or area because the variations in densities and thickness of peat deposits make it difficult to estimate tonnage. Volume data have been converted using the average bulk density of peat produced in that country. Reserve data were estimated based on data from International Peat Society publications and the percentage of peat resources available for peat extraction. More than 50% of the U.S. peatlands are located in undisturbed areas of Alaska. Total world resources of peat were estimated to be between 5 trillion and 6 trillion tons, covering about 400 million hectares.7
Substitutes
: Natural organic materials such as composted yard waste and coir (coconut fiber) compete with peat in horticultural applications. Shredded paper and straw are used to hold moisture for some grass-seeding applications. The superior water-holding capacity and physiochemical properties of peat limit substitution alternatives.
eEstimated. 1See Appendix A for conversion to short tons. 2Szumigala, D.J., Harbo, L.A., and Aldeman, J.N., 2011, Alaska’s mineral industry 2010: Alaska Division of Geological & Geophysical Surveys Special Report 65, 83 p. 3Defined as production + imports – exports + adjustments for industry stock changes. 4Defined as imports – exports + adjustments for Government and industry stock changes. 5See Appendix C for resource/reserve definitions and information concerning data sources. 6Included with “Other countries.” 7Lappalainen, Eino, 1996, Global peat resources: Jyvaskyla, Finland, International Peat Society, p. 55.
U.S. Geological Survey, Mineral Commodity Summaries, January 2012

116
PERLITE
(Data in thousand metric tons unless otherwise noted) Domestic Production and Use
: The estimated value (f.o.b. mine) of processed crude perlite produced in 2011 was $20.4 million. Crude ore production came from eight mines operated by six companies in five Western States. New Mexico continued to be the major producing State. Processed crude perlite was expanded at 50 plants in 26 States. The principal end uses were building construction products, 55%; fillers, 14%; horticultural aggregate, 14%; and filter aid, 9%. The remaining 8% includes miscellaneous uses and estimated expanded perlite consumption whose use is unknown.
Salient Statistics—United States: 2007 2008 2009 2010 Production1 409 434 348 414 400
2011e
Imports for consumptione 229 187 153 174 185 Exportse 28 37 33 42 40 Consumption, apparent 610 584 468 546 540 Price, average value, dollars per ton, f.o.b. mine 45 48 49 52 51 Employment, mine and mill 110 103 97 102 92 Net import reliance2 as a percentage of apparent consumption 33 26 26 24 27 Recycling
: Not available.
Import Sources (2007–10)
: Greece, 100%.
Tariff
: Item Number Normal Trade Relations
Vermiculite, perlite and 12-31-11
chlorites, unexpanded 2530.10.0000 Free. Depletion Allowance
: 10% (Domestic and foreign).
Government Stockpile
: None.
Prepared by Wallace P. Bolen [(703) 648-7727, [email protected]]

117 PERLITE
Events, Trends, and Issues
: The amount of processed crude perlite sold or used from U.S. mines decreased by about 3% compared with that reported for 2010. Imports increased as demand for perlite-based construction products staged a weak recovery in 2010 after the low experienced in 2009.
The quantities of processed crude perlite sold or used each year from 2009 through 2011 were lower than they had been since the mid-1960s. Imports continued to recover in 2011 but seemingly at the expense of domestic sales. A perlite mine in California, which had been in operation for many decades, apparently had ceased production. Perlite mining generally takes place in remote areas, and its environmental impact is not severe. The mineral fines, overburden, and reject ore produced during ore mining and processing are used to reclaim the mined-out areas, and, therefore, little waste remains. Airborne dust is captured by baghouses, and there is practically no runoff that contributes to water pollution. World Processed Perlite Production and Reserves
: Greece surpassed the United States in processed perlite production starting in 2003. Information for China and several other countries is unavailable, making it unclear whether or not Greece and the United States are the world’s leading producers.
Production Reserves3 2010 United States 414 400 50,000
2011e
Greece 500 500 50,000 Hungary 65 80 NA Italy 60 60 (4) Japan 210 200 (4) Mexico 50 50 (4) Turkey 230 500 (4) Other countries 140 150 World total (rounded) 1,670 1,900 700,000
600,000
World Resources
: Insufficient information is available to make reliable estimates of resources in perlite-producing countries.
Substitutes
: Alternative materials can be substituted for all uses of perlite, if necessary. Long-established competitive commodities include diatomite, expanded clay and shale, pumice, slag, and vermiculite.
eEstimated. NA Not available. 1Processed perlite sold and used by producers. 2Defined as imports - exports + adjustments for Government and industry stock changes; changes in stocks were not available and assumed to be zero for apparent consumption and net import reliance calculations. 3See Appendix C for resource/reserve definitions and information concerning data sources. 4Included with “Other countries.”
U.S. Geological Survey, Mineral Commodity Summaries, January 2012

118
PHOSPHATE ROCK
(Data in thousand metric tons unless otherwise noted) Domestic Production and Use
: Phosphate rock ore was mined by 6 firms at 12 mines in 4 States and upgraded to an estimated 28.4 million tons of marketable product valued at $ 2.7 billion, f.o.b. mine. Florida and North Carolina accounted for more than 85% of total domestic output; the remainder was produced in Idaho and Utah. Marketable product refers to beneficiated phosphate rock with phosphorus pentoxide (P2O5) content suitable for phosphoric acid or elemental phosphorus production. More than 95% of the U.S. phosphate rock mined was used to manufacture wet-process phosphoric acid and superphosphoric acid, which were used as intermediate feedstocks in the manufacture of granular and liquid ammonium phosphate fertilizers and animal feed supplements. Approximately 45% of the wet-process phosphoric acid produced was exported in the form of upgraded granular diammonium and monoammonium phosphate (DAP and MAP, respectively) fertilizer, and merchant-grade phosphoric acid. The balance of the phosphate rock mined was for the manufacture of elemental phosphorus, which was used to produce phosphorus compounds for a variety of food-additive and industrial applications.
Salient Statistics—United States: 2007 2008 2009 2010 Production, marketable 29,700 30,200 26,400 25,800 28,400
2011e
Sold or used by producers 31,100 28,900 25,500 28,100 28,500 Imports for consumption 2,670 2,750 2,000 2,400 3,300 Consumption1 33,800 31,600 27,500 30,500 31,800 Price, average value, dollars per ton, f.o.b. mine2 51.10 76.76 127.19 78.50 94.00 Stocks, producer, yearend 4,970 6,340 8,120 5,620 4,800 Employment, mine and beneficiation plant, numbere 2,500 2,550 2,500 2,300 2,200 Net import reliance3 as a percentage of apparent consumption 14 4 1 16 13 Recycling
: None.
Import Sources (2007–10)
: Morocco, 92% and Peru, 8%.
Tariff: Item Number Normal Trade Relations Natural calcium phosphates:
12-31-11
Unground 2510.10.0000 Free. Ground 2510.20.0000 Free. Depletion Allowance
: 14% (Domestic and foreign).
Government Stockpile
: None.
Events, Trends, and Issues
: In 2011, domestic production and consumption of phosphate rock increased from that of 2010 owing to increased phosphoric acid and fertilizer production. Export sales of phosphate fertilizers, primarily MAP, increased from that of 2010. U.S. imports of phosphate rock were estimated to have increased by nearly 1 million tons from those of 2010 because of imports of phosphate rock from Peru, where the leading U.S. phosphate fertilizer producer has a 35% stake in the only phosphate rock mine in that country.
Prepared by Stephen M. Jasinski [(703) 648-7711, [email protected]]

119 PHOSPHATE ROCK
World phosphate rock production capacity was projected to increase by nearly 20%, from 215 million tons in 2011 to 256 million tons in 2015, with most of the increases occurring in Africa. The largest increase was expected from the Moroccan producer, which planned to increase annual production incrementally from about 27 million tons to 50 million tons by 2017. Other significant new mines were planned in Australia, Brazil, Namibia, and Saudi Arabia. World consumption of P2O5 contained in fertilizers was projected to grow at a rate of 2.5% per year during the next 5 years, with the largest increases in Asia and South America. World Mine Production and Reserves
: Reserves for Australia and Brazil were updated with information from Government agencies in each country. Reserves in Canada were lowered to reflect the projected closure of the only phosphate rock mine in 2013. Based on a report issued jointly by the U.S. Geological Survey (USGS) and the Iraqi Ministry of Industry and Minerals in 2011, reserve data for Iraq were added. Reserves for Saudi Arabia are included in “Other countries”; however, production data were not available for a new mine that opened in that country in late 2010. Production and reserve data for India, Mexico, and Peru were added to the table because they were among the 20 leading producing countries.
Mine production Reserves4
2010 United States 25,800 28,400 1,400,000
2011e
Algeria 1,800 1,800 2,200,000 Australia 2,600 2,700 250,000 Brazil 5,700 6,200 310,000 Canada 700 1,000 2,000 China5 68,000 72,000 3,700,000 Egypt 6,000 6,000 100,000 India 1,240 1,250 6,100 Iraq — — 5,800,000 Israel 3,140 3,200 180,000 Jordan 6,000 6,200 1,500,000 Mexico 1,510 1,620 30,000 Morocco and Western Sahara 25,800 27,000 50,000,000 Peru 791 2,400 240,000 Russia 11,000 11,000 1,300,000 Senegal 950 950 180,000 South Africa 2,500 2,500 1,500,000 Syria 3,000 3,100 1,800,000 Togo 850 800 60,000 Tunisia 7,600 5,000 100,000 Other countries 6,400 7,400 World total (rounded) 181,000 191,000 71,000,000
500,000
World Resources
: Domestic reserve data were based on USGS and individual company information. Phosphate rock resources occur principally as sedimentary marine phosphorites. The largest sedimentary deposits are found in northern Africa, China, the Middle East, and the United States. Significant igneous occurrences are found in Brazil, Canada, Finland, Russia, and South Africa. Large phosphate resources have been identified on the continental shelves and on seamounts in the Atlantic Ocean and the Pacific Ocean. World resources of phosphate rock are more than 300 billion tons.
Substitutes
: There are no substitutes for phosphorus in agriculture.
eEstimated. — Zero. 1Defined as phosphate rock sold or used + imports. 2Marketable phosphate rock, weighted value, all grades. 3Defined as imports – exports + adjustments for Government and industry stock changes. 4See Appendix C for resource/reserve definitions and information concerning data sources. 5Production data for China do not include small artisanal mines.
U.S. Geological Survey, Mineral Commodity Summaries, January 2012

120
PLATINUM-GROUP METALS
(Platinum, palladium, rhodium, ruthenium, iridium, osmium) (Data in kilograms unless otherwise noted)
Domestic Production and Use
: The Stillwater and East Boulder Mines in south-central Montana were the only primary platinum-group metals (PGMs) mines in the United States and were owned by one company. Small quantities of PGMs were also recovered as byproducts of copper refining. The leading demand sector for PGMs continued to be catalysts to decrease harmful emissions in both light- and heavy-duty vehicles. PGMs are also used in the chemical sector as catalysts for manufacturing bulk chemicals such as nitric acid and in the production of specialty silicones; in the petroleum refining sector; and in laboratory equipment, including crucibles for growing high-purity single crystals for use in the electronics sector. Also in the electronics sector, PGMs are used in computer hard disks to increase storage capacity, in multilayer ceramic capacitors, and in hybridized integrated circuits. PGMs are used by the glass manufacturing sector in the production of fiberglass, liquid crystal displays, and flat-panel displays. Platinum alloys, in cast or wrought form, are commonly used for jewelry. Platinum, palladium, and a variety of complex gold-silver-copper alloys are used as dental restorative materials. Platinum, palladium, and rhodium are used as investment tools in the form of exchange-traded notes and exchange-traded funds.
Salient Statistics—United States: 2007 2008 2009 2010 Mine production:1
2011e
Platinum 3,860 3,580 3,830 3,450 3,700 Palladium 12,800 11,900 12,700 11,600 12,500 Imports for consumption: Platinum 181,000 150,000 183,000 152,000 130,000 Palladium 113,000 120,000 69,700 70,700 80,000 Rhodium 16,600 12,600 11,200 12,800 12,000 Ruthenium 48,700 49,800 21,200 14,100 15,000 Iridium 3,410 2,550 1,520 3,530 2,800 Osmium 23 11 68 76 80 Exports: Platinum 28,900 15,600 15,600 16,900 10,000 Palladium 41,800 26,400 30,300 38,100 33,000 Rhodium 2,210 1,980 1,220 2,320 1,900 Other PGMs 8,190 6,450 4,020 3,720 1,000 Price,2 dollars per troy ounce: Platinum 1,308.44 1,578.26 1,207.55 1,615.56 1,720.00 Palladium 357.34 355.12 265.65 530.61 730.00 Rhodium 6,203.09 6,533.57 1,591.32 2,459.07 2,030.00 Ruthenium 573.74 324.60 97.28 198.45 170.00 Iridium 444.43 448.34 420.40 642.15 1,030.00 Employment, mine, number1 1,630 1,360 1,270 1,350 1,360 Net import reliance as a percentage of apparent consumptione Platinum 91 89 95 91 88 Palladium 73 79 62 49 56 Recycling
: An estimated 36,000 kilograms of PGMs was recovered from new and old scrap in 2011.
Import Sources (2007–10)
: Platinum: Germany, 17%; South Africa, 17%; United Kingdom, 9%; Canada, 5%; and other, 52%. Palladium: Russia, 42%; South Africa, 24%; United Kingdom, 15%; Norway, 5%; and other, 14%.
Tariff
: All unwrought and semimanufactured forms of PGMs can be imported duty free.
Depletion Allowance
: 22% (Domestic), 14% (Foreign).
Government Stockpile
Stockpile Status—9-30-113
: Sales of iridium and platinum from the National Defense Stockpile remained suspended through FY 2011.
Uncommitted Authorized Disposal plan Disposals Material inventory for disposal FY 2011 FY 2011 Platinum 261 261 4778 — Iridium 18 18 4186 — Prepared by Patricia J. Loferski [(703) 648-7708, [email protected]]

121 PLATINUM-GROUP METALS
Events, Trends, and Issues
: The global economy continued to be unstable; fears of a recession affected prices of the PGMs. Platinum and palladium prices held relatively steady for the first 8 months of 2011; platinum reached a multiyear high briefly in August, boosted in part by record gold prices. Prices plunged in September because concerns about the world economy led to a sell-off of investments. Toward midyear, platinum prices were less than those for gold for the first time since late 2008, and platinum prices were higher than those for rhodium for several days for the first time since 2004. Rhodium prices trended downward throughout the year; ruthenium prices were steady in the first 8 months and then decreased because of lower demand. In contrast, iridium prices trended upward during the year owing to steady demand from the electronics sector. A new exchange-traded fund was launched for rhodium. The fund was backed by physical rhodium sponge and was designed to track the U.S. dollar spot price less fees. The rhodium price increased briefly after the exchange-traded fund was introduced, but interest proved to be short-lived, and the price dropped.
Mine production of PGMs decreased in South Africa in 2011 compared with that of 2010 owing to safety-related stoppages, workers strikes, and rising production costs, which caused one mine to be placed on care-and-maintenance status and other companies to postpone mine expansions. Mine production in Canada was substantially higher in 2011 because a workers strike ended. A massive earthquake and tsunami in Japan in March disrupted automobile production and thereby temporarily lowered demand for PGMs. Globally, however, production of and demand for automobiles was higher in 2011 than in 2010, particularly in developing nations such as China and India. This led to increased PGM demand in some regions because catalytic converters are the major end use of PGMs. Global automobile production and demand are expected to continue to increase. Compared with that in 2010, consumption of PGMs for industrial uses in the chemical, glassmaking, and petroleum-refining sectors increased. In contrast, consumption in the jewelry sector was lower in 2011 as a result of higher prices than those in 2010. Consumption in the jewelry sector can be expected to follow price trends for platinum. The Zimbabwe Government moved forward with plans to require foreign-owned companies worth more than $1 to sell 51% stakes in the company to indigenous personnel. Mining companies were required to draw up plans regarding how they will transfer ownership, and the process was to be completed by September 2011, although negotiations continued beyond that date for some PGM mining companies. World Mine Production and Reserves Mine production PGMs
:
Platinum Palladium Reserves5 2010 2011e 2010 United States 3,450 3,700 11,600 12,500 900,000
2011e
Canada 3,900 10,000 6,700 18,000 310,000 Colombia 998 1,000 NA NA (6) Russia 25,100 26,000 84,700 85,000 1,100,000 South Africa 148,000 139,000 82,200 78,000 63,000,000 Zimbabwe 8,800 9,400 7,000 7,400 (6) Other countries 2,300 2,500 9,540 6,100 World total (rounded) 192,000 192,000 202,000 207,000 66,000,000
800,000
World Resources
: World resources of PGMs in mineral concentrations that can be mined economically are estimated to total more than 100 million kilograms. The largest reserves are in the Bushveld Complex in South Africa.
Substitutes
: Many motor vehicle manufacturers have substituted palladium for the more expensive platinum in gasoline-engine catalytic converters. As much as 25% palladium can routinely be substituted for platinum in diesel catalytic converters; new technologies and laboratory experiments have increased that proportion to around 50% in some applications. For other end uses, some PGMs can be substituted for other PGMs, with some losses in efficiency.
eEstimated. NA Not available. — Zero. 1Estimates from published sources. 2Engelhard Corporation unfabricated metal. 3See Appendix B for definitions. 4Actual quantity limited to remaining inventory. 5See Appendix C for resource/reserve definitions and information concerning data sources. 6Included with “Other countries.”
U.S. Geological Survey, Mineral Commodity Summaries, January 2012

122
POTASH
(Data in thousand metric tons of K2O equivalent unless otherwise noted) Domestic Production and Use
: In 2011, the production value of marketable potash, f.o.b. mine, was about $780 million. Potash was produced in Michigan, New Mexico, and Utah. Most of the production was from southeastern New Mexico, where two companies operated three mines. New Mexico sylvinite and langbeinite ores were beneficiated by flotation, dissolution-recrystallization, heavy-media separation, or combinations of these processes, and provided more than 75% of total U.S. producer sales. In Utah, which has three operations, one company extracted underground sylvinite ore by deep-well solution mining. Solar evaporation crystallized the sylvinite ore from the brine solution, and a flotation process separated the potassium chloride (muriate of potash or MOP) from byproduct sodium chloride. Two companies processed surface and subsurface brines by solar evaporation and flotation to produce MOP, potassium sulfate (sulfate of potash or SOP), and byproducts. In Michigan, one company used deep-well solution mining and mechanical evaporation for crystallization of MOP and byproduct sodium chloride.
The fertilizer industry used about 85% of U.S. potash sales, and the chemical industry used the remainder. More than 60% of the potash produced was MOP. Potassium magnesium sulfate (sulfate of potash-magnesia or SOPM) and SOP, which are required by certain crops and soils, also were produced. Salient Statistics—United States: 2007 2008 2009 2010 Production, marketable1 1,100 1,100 720 930 1,100
2011e
Sales by producers, marketable1 1,200 1,100 630 1,000 1,000 Imports for consumption 4,970 5,800 2,220 4,760 5,600 Exports 199 222 303 297 215 Consumption:1 Apparent2 5,900 6,700 2,600 5,400 6,500 Reported3 5,900 6,700 2,500 5,600 6,400 Price, dollars per metric ton of K2O, average, muriate, f.o.b. mine4 400 675 800 605 700 Employment, number: Mine 480 525 510 540 540 Mill 580 615 640 650 650 Net import reliance5 as a percentage of apparent consumption 81 84 73 83 83 Recycling
: None.
Import Sources (2007–10)
: Canada, 88%; Belarus, 8%; Russia, 3%; and other, 1%.
Tariff
: Item Number Normal Trade Relations
Potassium nitrate 2834.21.0000 Free. 12-31-11
Potassium chloride 3104.20.0000 Free. Potassium sulfate 3104.30.0000 Free. Potassic fertilizers, other 3104.90.0100 Free. Potassium-sodium nitrate mixtures 3105.90.0010 Free. Depletion Allowance
: 14% (Domestic and foreign).
Government Stockpile
: None.
Prepared by Stephen M. Jasinski [(703) 648-7711, [email protected]]

123 POTASH
Events, Trends, and Issues
: World potash production and consumption were estimated to have increased compared with those of 2010, returning to nearly those of 2008, which was before the global downturn in the fertilizer industry. The leading U.S. producer continued its development of a new solution mine in New Mexico. The company expected to begin production about 1 year after receiving approval from Government agencies. Exploration and development activities for potash continued by other companies in Arizona, New Mexico, North Dakota, and Utah; however, none of these projects were expected to begin production for at least 7 to 10 years.
The only U.S. producer of SOP acquired the sole Canadian SOP producer in early 2011. No changes were planned for the Canadian operations. The two Russian potash producers merged in 2011 to create the second leading potash producer in the world. The company later announced plans to increase its annual production capacity from 10.5 million tons of MOP to 19 million tons of MOP by 2021. Many other global development and expansion projects are expected to increase world production capacity substantially over the next decade, with significant additions to capacity planned in Argentina, Belarus, Brazil, Canada, China, Congo (Brazzaville), and the United Kingdom. World potash consumption was projected to increase by about 4% annually during the next 5 years, owing to world population growth and the concurrent need for increased production of food and biofuels. World Mine Production and Reserves
: Reserve data for China and Russia were obtained from official Government sources and may not be comparable to the reserve definition in Appendix C. Reserves for Chile were revised based on information reported by the leading producer in that country.
Mine production Reserves6 2010 United States 1930 11,100 130,000
2011e
Belarus 5,250 5,500 750,000 Brazil 453 400 300,000 Canada 9,788 11,200 4,400,000 Chile 800 800 130,000 China 3,200 3,200 210,000 Germany 3,000 3,300 150,000 Israel 1,960 2,000 740,000 Jordan 1,200 1,400 740,000 Russia 6,280 7,400 3,300,000 Spain 415 420 20,000 United Kingdom 427 430 22,000 Other countries — — World total (rounded) 33,700 37,000 9,500,000
50,000
World Resources
: Estimated domestic potash resources total about 7 billion tons. Most of these lie at depths between 1,800 and 3,100 meters in a 3,110-square-kilometer area of Montana and North Dakota as an extension of the Williston Basin deposits in Saskatchewan, Canada. The Paradox Basin in Utah contains resources of about 2 billion tons, mostly at depths of more than 1,200 meters. The Holbrook Basin of Arizona contains resources of about 1 billion tons. A large potash resource lies about 2,100 meters under central Michigan and contains approximately 40 million tons. Estimated world resources total about 250 billion tons.
Substitutes
: There are no substitutes for potassium as an essential plant nutrient and an essential nutritional requirement for animals and humans. Manure and glauconite (greensand) are low-potassium-content sources that can be profitably transported only short distances to the crop fields.
eEstimated. –– Zero. 1Data are rounded to no more than two significant digits to avoid disclosing company proprietary data. 2Defined as production + imports – exports. 3Defined as sales + imports – exports. 4Average prices based on actual sales; excludes soluble and chemical muriates. 5Defined as imports – exports + adjustments for Government and industry stock changes. 6See Appendix C for resource/reserve definitions and information concerning data sources. 7Total reserves in the Dead Sea are arbitrarily divided equally between Israel and Jordan for inclusion in this tabulation.
U.S. Geological Survey, Mineral Commodity Summaries, January 2012

124
PUMICE AND PUMICITE
(Data in thousand metric tons unless otherwise noted) Domestic Production and Use
: In 2011, domestic production of pumice and pumicite was estimated to be 380,000 metric tons with an estimated processed value of about $7.7 million, f.o.b. plant. Production occurred at 14 producers in 7 States. Pumice and pumicite were mined in Nevada, Oregon, Idaho, Arizona, California, New Mexico, and Kansas, in descending order of production. Approximately 46% of all production came from Nevada and Oregon. About 70% of mined pumice was used in the production of construction building block; horticulture consumed 16%; abrasives, 6%; concrete admixture and aggregate, 4%; and the remaining 4% was used for absorbent, filtration, laundry stone washing, and other applications.
Salient Statistics—United States: 2007 2008 2009 2010 Production, mine1 1,270 791 410 390 380
2011e
Imports for consumption 37 65 26 35 35 Exportse 9 15 11 13 15 Consumption, apparent 1,290 841 425 412 400 Price, average value, dollars per ton, f.o.b. mine or mill 22.85 20.13 29.97 20.00 20.30 Employment, mine and mill, number 300 220 150 145 145 Net import reliance2 as a percentage of apparent consumption 2 6 4 5 5 Recycling
: Not available.
Import Sources (2007–10)
: Greece, 88%; Mexico, 4%; Iceland, 4%; Montserrat, 2%; and other, 2%.
Tariff
: Item Number Normal Trade Relations
Pumice, crude or in irregular 12-31-11
pieces, including crushed 2513.10.0010 Free. Pumice, except crude or crushed 2513.10.0080 Free. Depletion Allowance
: 5% (Domestic and foreign).
Government Stockpile
: None.
Prepared by Robert D. Crangle, Jr. [(703) 648-6410, [email protected]]

125 PUMICE AND PUMICITE
Events, Trends, and Issues
: The amount of domestically produced pumice and pumicite sold or used in 2011 decreased slightly to 380,000 tons, compared with 390,000 tons in 2010. Exports increased and imports were unchanged compared with those of 2010. Approximately 96% of pumice imports originated from Greece, Iceland, and Mexico in 2011, and primarily supplied markets in the eastern and gulf coast regions of the United States.
Although pumice and pumicite are plentiful in the Western United States, legal challenges and public land designations could limit access to known deposits. Pumice and pumicite production is sensitive to mining and transportation costs. An increase in fuel prices would likely lead to increases in production expenditures; imports and competing materials could become more attractive than domestic products. All known domestic pumice and pumicite mining in 2011 was accomplished through open pit methods, generally in remote areas where land-use conflicts were not severe. Although the generation and disposal of reject fines in mining and milling resulted in local dust issues at some operations, the environmental impact was restricted to a relatively small geographic area. World Mine Production and Reserves Mine production Reserves3
:
2010 United States1 390 380 Large in the United States. Quantitative
2011e
Algeria 450 450 estimates of reserves for most countries Cameroon 600 600 are not available. Chile 915 950 Ecuador 680 680 Greece 1,280 1,300 Guatemala 400 400 Iran 1,500 1,500 Italy 3,020 3,000 New Zealand 160 160 Saudi Arabia 800 800 Spain 600 600 Syria 950 900 Turkey 4,000 4,100 Other countries 1,570 World total (rounded) 17,300 17,000
1,320
World Resources
: The identified U.S. resources of pumice and pumicite are concentrated in the Western States and estimated to be more than 25 million tons. The estimated total resources (identified and undiscovered) in the Western and Great Plains States are at least 250 million tons and may total more than 1 billion tons. Turkey and Italy are the leading producers of pumice and pumicite, followed by Iran, Greece, Syria, and Chile. There are large resources of pumice and pumicite on all continents.
Substitutes
: The costs of transportation determine the maximum economic distance pumice and pumicite can be shipped and still remain competitive with alternative materials. Competitive resources that may be substituted for pumice and pumicite include crushed aggregates, diatomite, expanded shale and clay, and vermiculite.
eEstimated. 1Quantity sold and used by producers. 2Defined as imports – exports + adjustments for Government and industry stock changes. 3See Appendix C for resource/reserve definitions and information concerning data sources.
U.S. Geological Survey, Mineral Commodity Summaries, January 2012

126
QUARTZ CRYSTAL (INDUSTRIAL)
(Data in metric tons unless otherwise noted) Domestic Production and Use
: Cultured quartz crystal production capacity still exists in the United States but would require considerable refurbishment to be brought online. In the past several years, cultured quartz crystal was increasingly produced overseas, primarily in Asia. Electronic applications accounted for most industrial uses of quartz crystal; other uses included special optical applications. Lascas1 mining and processing in Arkansas ended in 1997 and, in 2011, no U.S. firms reported the production of cultured quartz crystals.
Virtually all quartz crystal used for electronics was cultured rather than natural crystal. Electronic-grade quartz crystal was essential for making filters, frequency controls, and timers in electronic circuits employed for a wide range of products, such as communications equipment, computers, and many consumer goods, such as electronic games and television receivers. Salient Statistics—United States
: The U.S. Census Bureau, which is the primary Government source of U.S. trade data, does not provide specific import or export statistics on lascas. The U.S. Census Bureau collects import and export statistics on electronic and optical-grade quartz crystal; however, the quartz crystal import and export quantities and values reported in previous years included zirconia that was inadvertently reported to be quartz crystal. Lumbered quartz, which is as-grown quartz that has been processed by sawing and grinding, had an estimated average price of $210 per kilogram in 2011. Prices for lumbered quartz can range from $20 per kilogram to more than $900 per kilogram, depending on the application. Other salient statistics were not available.
Recycling
: None.
Import Sources (2007–10)
: The United States is 100% import reliant on cultured quartz crystal. Although no definitive data exist listing import sources for cultured quartz crystal, imported material is thought to be mostly from China, Japan, and Russia.
Tariff
: Item Number Normal Trade Relations
Sands: 12-31-11
95% or greater silica 2505.10.10.00 Free. Less than 95% silica 2505.10.50.00 Free. Quartz (including lascas) 2506.10.00.50 Free. Piezoelectric quartz 7104.10.00.00 3% ad val. Depletion Allowance
: 22% (Domestic), 14% (Foreign).
Government Stockpile
: As of September 30, 2011, the Defense Logistics Agency, DLA Strategic Materials contained 7,134 kilograms of natural quartz crystal. The stockpile has 11 weight classes for natural quartz crystal that range from 0.2 kilogram to more than 10 kilograms. The stockpiled crystals, however, are primarily in the larger weight classes. The larger pieces are suitable as seed crystals, which are very thin crystals cut to exact dimensions, to produce cultured quartz crystal. In addition, many of the stockpiled crystals could be of interest to the specimen and gemstone industry. Little, if any, of the stockpiled material is likely to be used in the same applications as cultured quartz crystal. No natural quartz crystal was sold from the DLA Strategic Materials stockpile in 2011, and the Federal Government does not intend to dispose of or sell any of the remaining material. Previously, only individual crystals in the DLA Strategic Materials stockpile inventory that weighed 10 kilograms or more and could be used as seed material were sold.
Stockpile Status—9-30-112 Uncommitted Authorized Disposal plan Disposals Material inventory for disposal FY 2011 FY 2011 Quartz crystal 7 (3) — — Prepared by Thomas P. Dolley [(703) 648-7710, [email protected]]

127 QUARTZ CRYSTAL (INDUSTRIAL)
Events, Trends, and Issues
: Trends indicate that demand for quartz crystal devices will continue to increase, and consequently, quartz crystal production is expected to remain strong well into the future. Growth of the consumer electronics market (for products such as personal computers, electronic games, and cellular telephones) will continue to drive global production. The growing global electronics market may require additional production capacity worldwide.
World Mine Production and Reserves
:4 This information is unavailable, but the global reserves for lascas are thought to be large.
World Resources
: Limited resources of natural quartz crystal suitable for direct electronic or optical use are available throughout the world. World dependence on these resources will continue to decline because of the increased acceptance of cultured quartz crystal as an alternative material; however, use of cultured quartz crystal will mean an increased dependence on lascas for growing cultured quartz.
Substitutes
: Quartz crystal is the best material for frequency-control oscillators and frequency filters in electronic circuits. Other materials, such as aluminum orthophosphate (the very rare mineral berlinite), langasite, lithium niobate, and lithium tantalate, which have larger piezoelectric coupling constants, have been studied and used. The cost competitiveness of these materials, as opposed to cultured quartz crystal, is dependent on the type of application the material is used for and the processing required.
— Zero. 1Lascas is a nonelectronic-grade quartz used as a feedstock for growing cultured quartz crystal and for production of fused quartz. 2See Appendix B for definitions. 3Less than ½ unit. 4See Appendix C for resource/reserve definitions and information concerning data sources.
U.S. Geological Survey, Mineral Commodity Summaries, January 2012

128
RARE EARTHS1
[Data in metric tons of rare-earth oxide (REO) content unless otherwise noted] Domestic Production and Use
: In 2011, rare earths were not mined in the United States; however, rare-earth concentrates previously produced at Mountain Pass, CA, were processed into lanthanum concentrate and didymium (75% neodymium, 25% praseodymium) products. Rare-earth concentrates, intermediate compounds, and individual oxides were available from stocks. The United States continued to be a major consumer, exporter, and importer of rare-earth products in 2011. The estimated value of refined rare earths imported by the United States in 2011 was $696 million, an increase from $161 million imported in 2010. Based on reported data through August 2011, the estimated 2011 distribution of rare earths by end use, in decreasing order, was as follows: catalysts, 47%; metallurgical applications and alloys, 13%; alloys, 11%; glass polishing and ceramics, 10%; permanent magnets, 9%; ceramics, 5%; rare-earth phosphors for computer monitors, lighting, radar, televisions, and x-ray-intensifying film, 5%.
Salient Statistics—United States: 2007 2008 2009 2010 Production, bastnäsite concentrates — — — — —
2011e
Exports:2
Cerium compounds 1,470 1,380 840 1,350 1,400 Rare-earth metals, alloys 1,470 1,390 4,920 1,380 3,400 Other rare-earth compounds 1,300 663 455 1,690 3,300 Ferrocerium, alloys 3,210 4,490 2,970 3,460 2,500 Thorium ore (monazite or various thorium materials) — — 18 1 30 Imports:2
Cerium compounds 2,680 2,080 1,500 1,770 1,300 Ferrocerium, alloys 123 125 102 131 130 Mixed rare-earth chlorides 1,610 1,310 411 956 330 Mixed REOs 2,570 2,400 4,750 5,480 2,300 Rare-earth oxides, compounds 9,900 8,820 5,130 3,980 3,700 Rare-earth metals, alloy 784 679 226 525 420 Thorium ore (monazite or various thorium materials) — — — 26 — Consumption, apparent (excludes thorium ore) 3 10,200 7,410 W W W Price, dollars per kilogram, yearend: Bastnäsite concentrate, REO basise 6.61 8.82 5.73 6.87 NA Monazite concentrate, REO basise 0.87 0.87 0.87 0.87 2.70 Mischmetal, metal basis, metric ton quantity4 7–8 8–9 8–9 45–55 86–110 Stocks, producer and processor, yearend W W W W W Employment, mine and mill, number at yearend 70 100 110 220 350 Net import reliance5 as a percentage of apparent consumption 100 100 100 100 100 Recycling
: Small quantities, mostly permanent magnet scrap.
Import Sources (2007–10)
: Rare-earth metals, compounds, etc.: China, 79%; France, 6%; Estonia, 4%: Japan, 3%; and other, 8%.
Tariff
: Item Number Normal Trade Relations
Thorium ores and concentrates (monazite) 2612.20.0000 Free. 12-31-11
Rare-earth metals, scandium and yttrium whether or not intermixed or interalloyed 2805.30.0000 5.0% ad val. Cerium compounds 2846.10.0000 5.5% ad val. Mixtures of REOs (except cerium oxide) 2846.90.2010 Free. Mixtures of rare-earth chlorides (except cerium chloride) 2846.90.2050 Free. Rare-earth compounds, individual REOs (excludes cerium compounds) 2846.90.8000 3.7% ad val. Ferrocerium and other pyrophoric alloys 3606.90.3000 5.9% ad val. Depletion Allowance
: Monazite, 22% on thorium content and 14% on rare-earth content (Domestic), 14% (Foreign); bastnäsite and xenotime, 14% (Domestic and foreign).
Government Stockpile
: None.
Prepared by Daniel J. Cordier [(703) 648-7723, [email protected]]

129 RARE EARTHS
Events, Trends, and Issues
: Based on apparent consumption derived from 8 months of trade data, domestic consumption of rare earths and imports in 2011 declined significantly compared with that of 2010. All seven rare-earth import categories decreased when compared with those of 2010. Owing to declining supply, prices for most rare-earth products increased significantly in the third and fourth quarters of 2011. Consumption generally decreased for cerium compounds used in automotive catalytic converters and in glass additives and glass-polishing compounds; rare-earth chlorides used in the production of fluid-cracking catalysts for oil refining; rare-earth compounds used in automotive catalytic converters and many other applications; and rare-earth metals and their alloys used in armaments and base-metal alloys. Consumption was more stable in lighter flints, permanent magnets, pyrophoric alloys, and superalloys, but decreased for yttrium compounds used in color televisions and flat-panel displays, electronic thermometers, fiber optics, lasers, and oxygen sensors and for phosphors used for color televisions, electronic thermometers, fluorescent lighting, pigments, superconductors, x-ray-intensifying screens, and other applications. Demand remained stable for rare earths in many applications, especially automotive catalytic converters, permanent magnets, and rechargeable batteries for electric and hybrid vehicles.
The rare-earth separation plant at Mountain Pass, CA, resumed operation in 2007 and continued to operate throughout 2011. Bastnäsite concentrates and other rare-earth intermediates and refined products continued to be sold from mine stocks at Mountain Pass. The company commenced with Project Phoenix in 2011 to reopen mining operations and to build new processing facilities at Mountain Pass. Exploration efforts to develop rare earths projects continued to surge in 2011, and investment and interest increased dramatically. Economic assessments continued in North America at Bear Lodge in Wyoming; Diamond Creek in Idaho; Elk Creek in Nebraska; Hoidas Lake in Saskatchewan, Canada; Kipawa in Quebec, Canada; Lemhi Pass in Idaho-Montana; and Nechalacho (Thor Lake) in Northwest Territories, Canada. Economic assessments in other locations around the world include Dubbo Zirconia in New South Wales, Australia; Kangankunde in Malawi; Mount Weld in Western Australia, Australia; Nolans Project in Northern Territory, Australia, and Steenkampskraal in Western Cape, South Africa. World Mine Production and Reserves Mine productione Reserves6
:
2010 United States — — 13,000,000
2011
Australia — — 1,600,000 Brazil 550 550 48,000 China 130,000 130,000 55,000,000 Commonwealth of Independent States NA NA 19,000,000 India 2,800 3,000 3,100,000 Malaysia 30 30 30,000 Other countries NA NA World total (rounded) 133,000 130,000 110,000,000
22,000,000
World Resources
: Rare earths are relatively abundant in the Earth’s crust, but discovered minable concentrations are less common than for most other ores. U.S. and world resources are contained primarily in bastnäsite and monazite. Bastnäsite deposits in China and the United States constitute the largest percentage of the world’s rare-earth economic resources, while monazite deposits in Australia, Brazil, China, India, Malaysia, South Africa, Sri Lanka, Thailand, and the United States constitute the second largest segment. Apatite, cheralite, eudialyte, loparite, phosphorites, rare-earth-bearing (ion adsorption) clays, secondary monazite, spent uranium solutions, and xenotime make up most of the remaining resources. Undiscovered resources are thought to be very large relative to expected demand. A very large resource enriched in heavy rare-earth elements is inferred for phosphorites of the Florida Phosphate District.
Substitutes
: Substitutes are available for many applications but generally are less effective.
eEstimated. NA Not available. W Withheld to avoid disclosing company proprietary data. — Zero. 1Data include lanthanides and yttrium but exclude most scandium. See also Scandium and Yttrium. 2REO equivalent or contents of various materials were estimated. Data from U.S. Census Bureau. 3Defined as production + imports – exports + adjustments for industry stock changes; for 2010 and 2011, excludes producer stock changes (proprietary), and there were no producer stock changes in 2007. 4Price range from Elements—Rare Earths, Specialty Metals and Applied Technology and Web-based High Tech Materials, Longmont, CO, and Hefa Rare Earth Canada Co. Ltd., Richmond, British Columbia, Canada. 5Defined as imports – exports + adjustments for Government and industry stock changes. For 2010 and 2011, excludes producer stock changes (proprietary). 6See Appendix C for resource/reserve definitions and information concerning data sources.
U.S. Geological Survey, Mineral Commodity Summaries, January 2012

130
RHENIUM
(Data in kilograms of rhenium content unless otherwise noted) Domestic Production and Use
: During 2011, ores containing rhenium were mined at five operations (three in Arizona, and one each in Montana and Utah). Rhenium compounds are included in molybdenum concentrates derived from porphyry copper deposits, and rhenium is recovered as a byproduct from roasting such molybdenum concentrates. Rhenium-containing products included ammonium perrhenate (APR), metal powder, and perrhenic acid. The major uses of rhenium were in petroleum-reforming catalysts and in superalloys used in high-temperature, turbine engine components, representing an estimated 20% and 70%, respectively, of end use. Bimetallic platinum-rhenium catalysts were used in petroleum-reforming for the production of high-octane hydrocarbons, which are used in the production of lead-free gasoline. Rhenium improves the high-temperature (1,000° C) strength properties of some nickel-based superalloys. Rhenium alloys were used in crucibles, electrical contacts, electromagnets, electron tubes and targets, heating elements, ionization gauges, mass spectrographs, metallic coatings, semiconductors, temperature controls, thermocouples, vacuum tubes, and other applications. The estimated value of rhenium consumed in 2011 was about $67 million.
Salient Statistics—United States: 2007 2008 2009 2010 Production1 7,090 7,910 5,580 6,100 6,300
2011e
Imports for consumption 41,000 43,700 31,500 40,800 43,000 Exports NA NA NA NA NA Consumption, apparent 48,100 51,600 37,100 46,900 49,000 Price,2 average value, dollars per kilogram, gross weight: Metal powder, 99.99% pure 1,620 2,030 2,460 2,280 2,000 Ammonium perrhenate 2,730 2,160 955 704 650 Stocks, yearend, consumer, producer, dealer NA NA NA NA NA Employment, number Small Small Small Small Small Net import reliance3 as a percentage of apparent consumption 85 85 85 87 87 Recycling
: Small amounts of molybdenum-rhenium and tungsten-rhenium scrap have been processed by several companies during the past few years. All spent platinum-rhenium catalysts were recycled.
Import Sources (2007–10)
: Rhenium metal powder: Chile, 84%; Netherlands, 8%; Germany, 5%; and other, 3%. Ammonium perrhenate: Kazakhstan, 36%; United Kingdom, 17%; Chile, 11%; Poland, 9%; and other, 27%.
Tariff
: Item Number Normal Trade Relations
Salts of peroxometallic acids, other— 12-31-11
ammonium perrhenate 2841.90.2000 3.1% ad val. Rhenium, etc., (metals) waste and scrap 8112.92.0600 Free. Rhenium, (metals) unwrought; powders 8112.92.5000 3% ad val. Rhenium, etc., (metals) wrought; etc. 8112.99.9000 4% ad val. Depletion Allowance
: 14% (Domestic and foreign).
Government Stockpile
: None.
Prepared by Désirée E. Polyak [(703) 648-4909, [email protected]]

131 RHENIUM
Events, Trends, and Issues
: During 2011, average rhenium metal price, based on U.S. Census Bureau customs value, was about $2,000 per kilogram, 12% less than that of 2010. Rhenium imports for consumption increased by about 5%. Rhenium production in the United States increased slightly owing to increased production of byproduct molybdenum concentrates in the United States. The four leading copper-molybdenum mines increased byproduct molybdenum production levels in 2011, while the one smaller operation commenced byproduct molybdenum production in 2011. Owing to the scarcity and minor output of rhenium, its production and processing pose no known threat to the environment. In areas where it is recovered, pollution-control equipment for sulfur dioxide removal also prevents most of the rhenium from escaping into the atmosphere.
The United States continued to rely on imports for much of its supply of rhenium, and Chile and Kazakhstan supplied most of the imported rhenium. In 2011, the catalytic-grade APR price decreased in the first quarter and remained at $4,500 per kilogram until late June, when the price increased to $4,600 per kilogram. In October, the price decreased to $4,250 per kilogram. Rhenium metal powder price started out the year at $960 per kilogram until the end of February, when it decreased to $900 per kilogram. The price increased in June to $1,000 per kilogram and remained at that level until October, when the price decreased to $950 per kilogram. Consumption of catalyst-grade APR by the petroleum industry was expected to remain strong. Demand for rhenium in the aerospace industry, although more unpredictable, was also expected to remain strong. However, the major aerospace companies were expected to continue testing superalloys that contain half the rhenium used in currently designed engine blades, as well as testing rhenium-free alloys for other engine components. In October, Pratt & Whitney and Rolls-Royce plc announced a joint venture to develop new engines for future generation mid-size aircrafts. The new collaboration was expected to combine each company’s technological resources, including Pratt & Whitney’s high bypass geared turbofan technology, which allows engines to run at a lower operating temperature. This research could reduce the need for rhenium.4 World Mine Production and Reserves Mine production5 Reserves6
:
2010 United States 6,100 6,300 390,000
2011e
Armenia 400 600 95,000 Canada 1,000 1,200 32,000 Chile7 25,000 26,000 1,300,000 Kazakhstan 2,000 3,000 190,000 Peru 5,000 5,000 45,000 Poland 4,700 4,700 NA Russia 1,500 500 310,000 Other countries 1,500 1,500 World total (rounded) 47,200 49,000 2,500,000
91,000
World Resources
: Most rhenium occurs with molybdenum in porphyry copper deposits. Identified U.S. resources are estimated to be about 5 million kilograms, and the identified resources of the rest of the world are approximately 6 million kilograms. In Kazakhstan, rhenium also exists in sedimentary copper deposits.
Substitutes
: Substitutes for rhenium in platinum-rhenium catalysts are being evaluated continually. Iridium and tin have achieved commercial success in one such application. Other metals being evaluated for catalytic use include gallium, germanium, indium, selenium, silicon, tungsten, and vanadium. The use of these and other metals in bimetallic catalysts might decrease rhenium’s share of the existing catalyst market; however, this would likely be offset by rhenium-bearing catalysts being considered for use in several proposed gas-to-liquid projects. Materials that can substitute for rhenium in various end uses are as follows: cobalt and tungsten for coatings on copper x-ray targets, rhodium and rhodium-iridium for high-temperature thermocouples, tungsten and platinum-ruthenium for coatings on electrical contacts, and tungsten and tantalum for electron emitters.
eEstimated. NA Not available. 1Based on 80% recovery of estimated rhenium contained in MoS2 concentrates. 2Average price per kilogram of rhenium in pellets or ammonium perrhenate, based on U.S. Census Bureau customs value. 3Defined as imports – exports + adjustments for Government and industry stock changes. 4Pratt & Whitney, 2011, Pratt & Whitney and Rolls-Royce announce restructuring of IAE collaboration and new partnership to develop next generation engines for mid-size aircraft: East Hartford, CT, Pratt & Whitney, October 12, 2 p. 5Estimated amount of rhenium recovered in association with copper and molybdenum production. 6See Appendix C for resource/reserve definitions and information concerning data sources. 7Estimated rhenium recovered from roaster residues from Belgium, Chile, and Mexico.
U.S. Geological Survey, Mineral Commodity Summaries, January 2012

132
RUBIDIUM
(Data in kilograms of rubidium content unless otherwise noted) Domestic Production and Use
: Rubidium is not mined in the United States; however, occurrences are known in Maine and South Dakota, and rubidium is associated with some evaporite mineral occurrences in other States. Rubidium concentrate is imported from Canada for processing in the United States. Applications for rubidium and its compounds include biomedical research, electronics, specialty glass, and pyrotechnics. Biomedical applications include rubidium salts used in the treatment of epilepsy and rubidium-82 used as a blood-flow tracer. Rubidium is used as an atomic resonance frequency standard in atomic clocks, playing a vital role in global positioning systems (GPS). Rubidium-rich feldspars are used in ceramic applications for spark plugs and electrical insulators because of their high-dielectric capacity.
Salient Statistics—United States
: U.S. salient statistics, such as consumption, exports, and imports, are not available. U.S rubidium consumption was small and may amount to only a few thousand kilograms per year. One mine in Canada produced rubidium ore, which was converted to byproduct concentrate; however, production data for that mine are not available. Part of that concentrate was exported to the United States for further processing. There is no market price for rubidium because the metal is not traded. In 2011, one company offered 1-gram ampoules of 99.75%-grade rubidium (metal basis) for $72.10 each, a 3% increase from that of 2010. The price for 100 grams of the same material was $1,321.00, a 2.0% increase from that of 2010.
Recycling
: None.
Import Sources (2007–10)
: The United States is 100% import reliant on byproduct rubidium concentrate imported from Canada.
Tariff
: Item Number Normal Trade Relations
Alkali metals, other 2805.19.9000 5.5% ad val. 12-31-11
Depletion Allowance
: 14% (Domestic and foreign).
Government Stockpile
: None.
Prepared by Marc A. Angulo [Contact William E. Brooks, (703) 648-7791, [email protected]]

133 RUBIDIUM
Events, Trends, and Issues
: Rubidium has been commercially available as a byproduct of lithium chemicals production for 40 years. The use of rubidium was primarily in chemical and electronics research. The use of rubidium in atomic clocks continues to increase. Advances have been made in the use of rubidium in atomic circuit technology for quantum computing. Rubidium atoms are used to create quantum gates that transfer information in atomic circuits. The use of rubidium-82 positron emission tomography (PET) combined with computed tomography angiography (CTA) in the evaluation and care of patients with suspected coronary artery disease continues to increase. Research in the use of rubidium in superconductors is increasing.
World Mine Production and Reserves
:1 There are no minerals in which rubidium is the predominant metallic element; however, rubidium may be taken up in trace amounts in the lattices of potassium feldspars and micas during the crystallization of pegmatites. The rubidium-bearing minerals lepidolite and pollucite may be found in zoned pegmatites, which are exceptionally coarse-grained plutonic rocks that form late in the crystallization of a silicic magma. Lepidolite, the principal source of rubidium, can contain up to 3.5% rubidium oxide, and pollucite contains up to 1.5% rubidium oxide.
World Resources
: World resources of rubidium are unknown. In addition to several significant rubidium-bearing zoned pegmatites in Canada, there are pegmatite occurrences in Afghanistan, Namibia, Peru, Russia, and Zambia. Minor amounts of rubidium are reported in brines in northern Chile and China and in evaporites in France, Germany, and the United States (New Mexico and Utah).
Substitutes
: Rubidium and cesium have similar physical properties and may be used interchangeably in many applications; however, cesium is a preferred material in many applications because it is more electropositive than rubidium.
1See Appendix C for resource/reserve definitions and information concerning data sources.
U.S. Geological Survey, Mineral Commodity Summaries, January 2012

134
SALT
(Data in thousand metric tons unless otherwise noted) Domestic Production and Use
: Domestic production of salt increased slightly in 2011. The total value was estimated to be more than $1.7 billion. Twenty-eight companies operated 60 plants in 16 States. The estimated percentage of salt sold or used, by type, was rock salt, 44%; salt in brine, 38%; vacuum pan, 10%; and solar salt, 8%.
The chemical industry consumed about 40% of total salt sales, with salt in brine representing about 90% of the type of salt used for feedstock. The chlorine and caustic soda manufacturing sector was the main consumer within the chemical industry. Salt for highway deicing accounted for 38% of U.S. demand. The remaining markets for salt, in declining order, were distributors, 8%; agricultural, 4%; food, 4%; general industrial, 2%; water treatment, 2%; and other combined with exports, 2%. Salient Statistics—United States:1 2007 2008 2009 2010 Production 44,500 48,000 46,000 43,300 44,000
2011e
Sold or used by producers2 45,500 47,400 43,100 43,500 44,000 Imports for consumption 8,640 13,800 14,700 12,900 13,000 Exports 833 1,030 1,450 595 400 Consumption: Reported 53,200 53,100 45,000 48,600 57,000 Apparent2 53,300 60,200 56,400 55,800 57,000 Price, average value of bulk, pellets and packaged salt, dollars per ton, f.o.b. mine and plant: Vacuum and open pan salt 154.95 158.59 178.67 180.08 180.00 Solar salt 61.50 64.33 72.09 50.90 60.00 Rock salt 27.84 31.39 36.08 35.40 32.00 Salt in brine 7.11 7.99 7.85 7.49 8.00 Employment, mine and plant, numbere 4,100 4,100 4,100 4,100 4,100 Net import reliance3 as a percentage of apparent consumption 15 21 24 22 22 Recycling
: None.
Import Sources (2007–10)
: Canada, 38%; Chile, 34%; Mexico, 9%; The Bahamas, 6%; and other, 13%.
Tariff
: Item Number Normal Trade Relations
Salt (sodium chloride) 2501.00.0000 Free. 12-31-11
Depletion Allowance
: 10% (Domestic and foreign).
Government Stockpile
: None.
Events, Trends, and Issues
: A major soup manufacturer that reformulated more than 60% of its condensed soups in 2010 announced that it would reintroduce salt into some of its product lines. The decision was based on consumers complaints that the reduced sodium levels adversely affected the taste of the soups. The company will still offer soups lower in sodium for those individuals on salt-restricted diets.
Computer hard drive storage capacity has risen in the past several years from megabytes to terabytes. Inside the hard drive is a spinning magnetic platter that is covered with randomly dispersed nanoscopic grains that store the information. Researchers discovered that adding a salt solution to the developer solution in the electron-beam lithography process significantly decreases the nanostructures, thereby increasing the storage capacity of the hard drive. The researchers were optimistic that 18-terabyte hard drives could be achieved in the next few years. The Centers for Disease Control and Prevention and the National Institutes of Health published a joint survey that showed about 90% of U.S. citizens consume more than the recommended amount of salt despite efforts in the past few years to publicize the health dangers of consuming too much salt. Prepared by Dennis S. Kostick [(703) 648-7715, [email protected]]

135 SALT
Many scientists have been studying global weather changes. The National Aeronautics and Space Administration (NASA) launched its Aquarius instrument on a satellite in June 2011. Later in the year, NASA produced the first global map of the salinity of the Earth’s ocean surface to measure salinity variations and their connections between global rainfall, ocean currents, and climate variations. The data showed higher salinity in the subtropics and lower salinity in the equatorial rain belts. The salinity changes are linked to the influence of freshwater around the planet on ocean circulation. China has been the top-ranked salt-producing nation for the past few years. Salt consumption is forecast to grow in China because of the sustained demand growth for chloralkali and synthetic soda ash. One study indicated that world salt production may reach about 300 million tons in the next 3 years. China now accounts for one-third of world salt consumption, placing it ahead of Europe and North America. Budget constraints in the United States for local and State governments may affect the availability and consumption of rock salt for highway deicing in 2012. It is anticipated that the domestic salt industry will be able to provide adequate salt supplies from domestic and foreign sources for emergency use in the event of adverse winter weather. World Production and Reserves Production Reserves4
:
2010 United States1 43,300 44,000 Large. Economic and subeconomic
2011e
Australia 11,968 13,000 deposits of salt are substantial in Bahamas, The 10,000 10,000 principal salt-producing countries. Brazil 7,020 7,000 The oceans contain a virtually Canada 10,537 11,000 inexhaustible supply of salt. Chile 8,400 9,000 China 62,750 65,000 France 6,100 6,000 Germany 19,100 20,000 India 17,000 18,000 Mexico 8,431 8,800 Netherlands 5,000 5,000 Pakistan 11,000 11,000 Poland 3,520 4,000 Spain 4,350 4,400 Turkey 4,000 4,000 Ukraine 5,400 5,500 United Kingdom 5,800 5,800 Other countries 36,200 World total (rounded) 280,000 290,000
39,000
World Resources
: World continental resources of salt are practically unlimited, and the salt content in the oceans is virtually inexhaustible. Domestic resources of rock salt and salt from brine are in the Northeast, Central Western, and Gulf Coast States. Saline lakes and solar evaporation salt facilities are near populated regions in the Western United States. Almost every country in the world has salt deposits or solar evaporation operations of various sizes.
Substitutes
: There are no economic substitutes or alternates for salt. Calcium chloride and calcium magnesium acetate, hydrochloric acid, and potassium chloride can be substituted for salt in deicing, certain chemical processes, and food flavoring, but at a higher cost.
eEstimated. 1Excludes Puerto Rico production. 2Reported stock data are incomplete. For apparent consumption and net import reliance calculations, changes in annual stock totals are assumed to be the difference between salt produced and salt sold or used. 3Defined as imports – exports + adjustments for Government and industry stock changes. 4See Appendix C for resource/reserve definitions and information concerning data sources.
U.S. Geological Survey, Mineral Commodity Summaries, January 2012

136
SAND AND GRAVEL (CONSTRUCTION)1
(Data in million metric tons unless otherwise noted)2 Domestic Production and Use
: Construction sand and gravel valued at $5.9 billion was produced by an estimated 4,000 companies from about 6,400 operations in 50 States. Leading producing States, in order of decreasing tonnage, were California, Texas, Arizona, Michigan, New York, Utah, Minnesota, Arizona, Wisconsin, Ohio, and Colorado, which together accounted for about 48% of the total output. It is estimated that about 41% of construction sand and gravel was used as concrete aggregates; 25% for road base and coverings and road stabilization; 13% as construction fill; 12% as asphaltic concrete aggregates and other bituminous mixtures; 4% for plaster and gunite sands; 1% for concrete products, such as blocks, bricks, and pipes; and the remaining 4% for filtration, golf courses, railroad ballast, roofing granules, snow and ice control, and other miscellaneous uses.
The estimated output of construction sand and gravel in the 48 conterminous States, shipped for consumption in the first 9 months of 2011, was slightly higher than the 590 million tons estimated for the same period in 2010. Additional production information by quarter for each State, geographic region, and the United States is published by the U.S. Geological Survey (USGS) in its quarterly Mineral Industry Surveys for Crushed Stone and Sand and Gravel. Salient Statistics—United States: 2007 2008 2009 2010 Production 1,250 1,060 836 e760 790
2011e
Imports for consumption 4 5 3 e2 2 Exports (3) (3) (3) e1 1 Consumption, apparent 1,250 1,060 839 e760 790 Price, average value, dollars per ton 7.06 7.47 7.57 e7.70 7.50 Employment, mines, mills, and shops, number 38,000 35,200 30,800 29,500 28,800 Net import reliance4 as a percentage of apparent consumption (3) (3) (3) (3) (3) Recycling
: Recycling of asphalt road surface layers, cement concrete surface layers, and concrete structures was increasing.
Import Sources (2007–10)
: Canada, 83%; The Bahamas, 8%; Mexico, 6%; and other, 3%.
Tariff
: Item Number Normal Trade Relations
Sand, silica and quartz, less than 95% silica 2505.10.5000 Free. 12-31-11
Sand, other 2505.90.0000 Free. Pebbles and gravel 2517.10.0015 Free. Depletion Allowance
: Common varieties, 5% (Domestic and foreign).
Government Stockpile
: None.
Prepared by Wallace P. Bolen [(703) 648-7727, [email protected]]

137 SAND AND GRAVEL (CONSTRUCTION)
Events, Trends, and Issues
: With U.S. economic activity remaining sluggish, construction sand and gravel output for 2011 stayed near the low levels experienced in 2010. The flat demand for construction sand and gravel reflected challenges in the U.S. construction industry, with unemployment in many areas at more than 20% for construction workers. It is predicted that 2012 domestic production will begin to increase as the economy slowly grows. A rapid recovery to highs of the mid-2000s is unlikely, however, as tax revenues that fund government construction projects continue to be depressed by lower home values. Additionally, demand for new housing is suppressed by limited credit availability and economic uncertainty.
The construction sand and gravel industry was concerned with environmental, health, permitting, safety, and zoning regulations. Movement of sand and gravel operations away from densely populated centers was expected to continue where environmental, land development, and local zoning regulations discouraged them. Consequently, shortages of construction sand and gravel would support higher-than-average price increases in industrialized and urban areas. World Mine Production and Reserves Mine production Reserves5
:
2010 United States e760 790 Reserves are controlled largely by land
2011e
Other countries6 NA NA World total NA NA
use and/or environmental concerns.
World Resources
: Sand and gravel resources of the world are large. However, because of environmental restrictions, geographic distribution, and quality requirements for some uses, sand and gravel extraction is uneconomic in some cases. The most important commercial sources of sand and gravel have been glacial deposits, river channels, and river flood plains. Use of offshore deposits in the United States is mostly restricted to beach erosion control and replenishment. Other countries routinely mine offshore deposits of aggregates for onshore construction projects.
Substitutes
: Crushed stone, the other major construction aggregate, is often substituted for natural sand and gravel, especially in more densely populated areas of the Eastern United States. Crushed stone remains the dominant choice for construction aggregate use. Increasingly, recycled asphalt and portland cement concretes are being substituted for virgin aggregate, although the percentage of total aggregate supplied by recycled materials remained very small in 2011.
eEstimated. NA Not available. 1See also Sand and Gravel (Industrial) and Stone (Crushed). 2See Appendix A for conversion to short tons. 3Less than ½ unit. 4Defined as imports – exports. 5See Appendix C for resource/reserve definitions and information concerning data sources. 6No reliable production information for most countries is available owing to the wide variety of ways in which countries report their sand and gravel production. Some countries do not report production for this mineral commodity. Production information for some countries is available in the country chapters of the USGS Minerals Yearbook.
U.S. Geological Survey, Mineral Commodity Summaries, January 2012

138
SAND AND GRAVEL (INDUSTRIAL)1
(Data in thousand metric tons unless otherwise noted) Domestic Production and Use
: Industrial sand and gravel valued at about $1.03 billion was produced by 68 companies from 116 operations in 33 States. Leading States, in order of tonnage produced, were Illinois, Texas, Wisconsin, Minnesota, Oklahoma, North Carolina, California, and Michigan. Combined production from these States represented 64% of the domestic total. About 41% of the U.S. tonnage was used as hydraulic fracturing sand and well-packing and cementing sand, 26% as glassmaking sand, 11% as foundry sand, 6% as other whole-grain silica, 6% as whole-grain fillers and building products, 3% as ground and unground sand for chemicals, 2% as golf course sand, 2% for abrasive sand for sandblasting, and 3% for other uses.
Salient Statistics—United States: 2007 2008 2009 2010 Production 30,100 30,400 24,600 29,900 30,000
2011e
Imports for consumption 511 355 95 131 280 Exports 3,020 3,100 2,150 3,950 4,000 Consumption, apparent 27,600 27,700 22,500 26,100 26,300 Price, average value, dollars per ton 27.64 30.82 31.90 34.45 34.51 Employment, quarry and mill, numbere 1,400 1,400 1,400 1,400 1,400 Net import reliance2 as a percentage of apparent consumption E E E E E Recycling
: There is some recycling of foundry sand, and recycled cullet (pieces of glass) represents a significant proportion of reused silica.
Import Sources (2007–10)
: Canada, 76%; Mexico, 16%; and other, 8%.
Tariff
: Item Number Normal Trade Relations
95% or more silica and not 12-31-11
more than 0.6% iron oxide 2505.10.1000 Free. Depletion Allowance
: Industrial sand or pebbles, 14% (Domestic and foreign).
Government Stockpile
: None.
Events, Trends, and Issues
: Domestic sales of industrial sand and gravel in 2011 increased slightly compared with those of 2010. Mined output was sufficient to accommodate many uses, which included ceramics, chemicals, fillers (ground and whole-grain), container, filtration, flat and specialty glass, and recreational uses. Increased demand for hydraulic fracturing sand in support of production of natural gas from shale gas deposits has led to production capacity upgrades and ongoing permitting and opening of new mines. U.S. apparent consumption was about 26.3 million tons in 2011, up slightly from that of the previous year. Imports of industrial sand and gravel in 2011 increased to about 280,000 tons from 131,000 tons in 2010. Imports of silica are generally of two types—small shipments of very high-purity silica or a few large shipments of lower grade silica shipped only under special circumstances (for example, very low freight rates). Exports of industrial sand and gravel in 2011 increased to 4 million tons from 3.95 million tons in 2010.
Prepared by Thomas P. Dolley [(703) 648-7710, [email protected]]

139 SAND AND GRAVEL (INDUSTRIAL)
The United States was the world’s leading producer and consumer of industrial sand and gravel based on estimated world production figures. It was difficult to collect definitive data on silica sand and gravel production in most nations because of the wide range of terminology and specifications from country to country. The United States remained a major exporter of silica sand and gravel, shipping it to almost every region of the world. The high level of exports was attributed to the high-quality and advanced processing techniques used in the United States for a large variety of grades of silica sand and gravel, meeting virtually every specification. The industrial sand and gravel industry continued to be concerned with safety and health regulations and environmental restrictions in 2011. Local shortages of industrial sand and gravel were expected to continue to increase owing to local zoning regulations and land development alternatives, including ongoing development and permitting of operations specializing in hydraulic fracturing sand. These situations are expected to cause future sand and gravel operations to be located farther from high-population centers. World Mine Production and Reserves Mine productione Reserves3
:
2010 United States 29,900 30,000
2011
Australia 5,300 5,300 Large. Industrial sand and gravel Belgium 1,800 1,800 deposits are widespread. Canada 1,171 1,170 Chile 1,400 1,300 Czech Republic 1,400 1,400 Egypt 1,757 1,760 Finland 2,250 2,250 France 5,000 5,000 French Guyana 1,500 1,500 Germany 7,000 7,500 India 1,800 1,800 Iran 1,500 1,500 Italy 19,800 19,800 Japan 3,078 3,100 Latvia 1,359 1,400 Mexico 2,480 2,500 Norway 1,500 1,500 Poland 2,730 2,700 South Africa 2,910 2,900 Spain 5,000 5,000 Turkey 4,000 4,000 United Kingdom 3,760 3,800 Other countries 13,000 World total (rounded) 121,000 122,000
3,000
World Resources
: Sand and gravel resources of the world are large. However, because of their geographic distribution, environmental restrictions, and quality requirements for some uses, extraction of these resources is sometimes uneconomic. Quartz-rich sand and sandstones, the main sources of industrial silica sand, occur throughout the world.
Substitutes
: Alternative materials that can be used for glassmaking and for foundry and molding sands are chromite, olivine, staurolite, and zircon sands.
eEstimated. E Net exporter. 1See also Sand and Gravel (Construction). 2Defined as imports – exports + adjustments for Government and industry stock changes. 3See Appendix C for resource/reserve definitions and information concerning data sources.
U.S. Geological Survey, Mineral Commodity Summaries, January 2012

140
SCANDIUM1
(Data in kilograms of scandium oxide content unless otherwise noted) Domestic Production and Use
: Demand for scandium decreased slightly in 2011. Domestically, scandium-bearing minerals have not been mined nor recovered from tailings since 1990. However, quantities sufficient to meet demand were available in domestic tailings. Principal sources were imports from China, Russia, and Ukraine. Domestic companies with scandium-processing capabilities were in Mead, CO, and Urbana, IL. Capacity to produce ingot and distilled scandium metal was in Ames, IA; Phoenix, AZ; and Urbana, IL. Scandium used in the United States was essentially derived from foreign sources. Principal uses for scandium in 2011 were aluminum alloys for sporting equipment (baseball and softball bats, bicycle frames, crosse handles (lacrosse stick handles), golf clubs, gun frames, and tent poles), metallurgical research, high-intensity metal halide lamps, analytical standards, electronics, oil well tracers, and lasers.
Salient Statistics—United States: 2007 2008 2009 2010
Price, yearend, dollars: 2011e
Per kilogram, oxide, 99.0% purity 700 900 900 900 900 Per kilogram, oxide, 99.9% purity 1,400 1,400 1,400 1,400 1,400 Per kilogram, oxide, 99.99% purity2 1,620 1,620 1,620 1,620 4,700 Per kilogram, oxide, 99.999% purity2 2,540 2,540 2,540 2,540 5,200 Per kilogram, oxide, 99.9995% purity2 3,260 3,260 3,260 3,260 5,900 Per gram, dendritic, metal3 208.00 188.00 189.00 193.00 199.00 Per gram, metal, ingot4 131.00 152.00 155.00 158.00 163.00 Per gram, scandium acetate, 99.99% purity5, 6 74.00 NA NA 47.00 48.40 Per gram, scandium chloride, 99.9% purity5 48.70 57.40 60.40 62.40 138.00 Per gram, scandium fluoride, 99.9% purity5 193.80 224.20 224.60 229.00 235.80 Per gram, scandium iodide, 99.999% purity5 174.00 201.00 203.00 207.00 213.00 Per kilogram, scandium-aluminum alloy2 74.00 74.00 74.00 74.00 220.00 Net import reliance7 as a percentage of apparent consumption 100 100 100 100 100 Recycling
: None.
Import Sources (2007–10)
: Although no definitive data exist listing import sources, imported material is thought to be mostly from China.
Tariff
: Item Number Normal Trade Relations
Mineral substances not elsewhere specified or 12-31-11
included, including scandium ores 2530.90.8050 Free. Rare-earth metals, scandium and yttrium, whether or not intermixed or interalloyed, including scandium 2805.30.0000 5.0% ad val. Mixtures of rare-earth oxides except cerium oxide, including scandium oxide mixtures 2846.90.2010 Free. Rare-earth compounds, including individual rare-earth oxides, hydroxides, nitrates, and other individual compounds, including scandium oxide 2846.90.8000 3.7% ad val. Aluminum alloys, other, including scandium-aluminum 7601.20.9090 Free. Depletion Allowance
: 14% (Domestic and foreign).
Government Stockpile
: None.
Events, Trends, and Issues
: Nominal prices for domestically produced scandium oxide remained unchanged for low purities while other scandium compounds increased from those of the previous year. The supply of domestic and foreign scandium remained stable. Prices increased slightly in 2011, and the total market remained very small. Domestic decreases in scandium demand were primarily related to recently developed applications in carbon fiber and carbon nanotube technology for baseball and softball bats; however, scandium-aluminum baseball and softball bats remained popular high-end sports equipment, and sports equipment remained the leading use of scandium. New demand is expected to come from future fuel-cell markets and aerospace applications.
Prepared by Daniel J. Cordier [(703) 648-7723, [email protected]]
141 SCANDIUM
Scandium’s use in metal halide lighting continued. Scandium, as the metal or the iodide, mixed with other elements, was added to halide light bulbs to adjust the color to simulate natural sunlight. Future development of alloys for aerospace and specialty markets is expected. Scandium's availability from Kazakhstan, Russia, and Ukraine increased substantially in 1992, after export controls were relaxed, and sales continue to provide the Western World with most of its scandium alloys, compounds, and metal. China continued to supply scandium compounds and metal to the U.S. market. World Mine Production and Reserves
:8 Scandium was produced as byproduct material in China, Kazakhstan, Russia, and Ukraine. Foreign mine production data were not available. No scandium was mined in the United States in 2011. Scandium occurs in many ores in trace amounts, but has not been found in sufficient concentration to be mined for scandium alone. As a result of its low concentration, scandium has been produced exclusively as a byproduct during processing of various ores or recovered from previously processed tailings or residues.
World Resources
: Resources of scandium are abundant, especially when considered in relation to actual and potential demand. Scandium is rarely concentrated in nature because of its lack of affinity for the common ore-forming anions. It is widely dispersed in the lithosphere and forms solid solutions in more than 100 minerals. In the Earth's crust, scandium is primarily a trace constituent of ferromagnesium minerals. Concentrations in these minerals (amphibole-hornblende, biotite, and pyroxene) typically range from 5 to 100 parts per million scandium oxide equivalent. Ferromagnesium minerals commonly occur in the igneous rocks basalt and gabbro. Enrichment of scandium also occurs in aluminum phosphate minerals, beryl, cassiterite, columbite, garnet, muscovite, rare-earth minerals, and wolframite. Scandium that was produced domestically was primarily from the scandium-yttrium silicate mineral thortveitite, and from byproduct leach solutions from uranium operations. One of the principal domestic scandium resources is the fluorite tailings from the mined-out Crystal Mountain deposit near Darby, MT. Tailings from the mined-out fluorite operations, which were generated from 1952 to 1971, contain thortveitite and associated scandium-enriched minerals. Resources also are contained in the tantalum residues previously processed at Muskogee, OK. Smaller resources are associated with molybdenum, titanium-tungsten, and tungsten minerals from the Climax molybdenum deposit in Colorado and in crandallite, kolbeckite, and variscite at Fairfield, UT. Other lower grade domestic resources are present in ores of aluminum, cobalt, iron, molybdenum, nickel, phosphate, tantalum, tin, titanium, tungsten, zinc, and zirconium. Process residues from tungsten operations in the United States also contain significant amounts of scandium.
Foreign scandium resources are known in Australia, China, Kazakhstan, Madagascar, Norway, Russia, and Ukraine. Resources in Australia are contained in nickel and cobalt deposits in Syerston and Lake Innes, New South Wales. China’s resources are in iron, tin, and tungsten deposits in Fujian, Guangdong, Guangxi, Jiangxi, and Zhejian Provinces. Resources in Russia are in apatites and eudialytes in the Kola Peninsula and in uranium-bearing deposits in Kazakhstan. Scandium in Madagascar is contained in pegmatites in the Befanomo area. Resources in Norway are dispersed in the thortveitite-rich pegmatites of the Iveland-Evje Region and a deposit in the northern area of Finnmark. In Ukraine, scandium is recovered as a byproduct of iron ore processing at Zheltye Voda. An occurrence of the mineral thortveitite is reported from Kobe, Japan. Undiscovered scandium resources are thought to be very large. Substitutes
: In applications such as lighting and lasers, scandium is generally not subject to substitution. Titanium and aluminum high-strength alloys, as well as carbon fiber and carbon nanotube material, may substitute in sporting goods, especially baseball and softball bats and bicycle frames. Light-emitting diodes, also known as LEDs, are beginning to displace halides in industrial lighting, residential safety and street lighting, and buoys and maritime lamp applications.
eEstimated. NA Not available. 1See also Rare Earths. 2Scandium oxide (as a white powder) and scandium-aluminum master alloy (with a 2% scandium metal content and sold in metric ton quantities) from Stanford Materials Corp. The significant increase in price reference for 2011 was by written quotation on November 23, 2011. 3Scandium pieces, 99.9% purity, distilled dendritic; 2007 prices converted from 0.5-gram prices, and 2008–11 prices from 2-gram price, from Alfa Aesar, a Johnson Matthey company. 4Metal ingot pieces, 99.9% purity, 2007–11, from Alfa Aesar, a Johnson Matthey company. 5Acetate, chloride, and fluoride, in crystalline or crystalline aggregate form and scandium iodide as ultradry powder from Alfa Aesar, a Johnson Matthey company; Fluoride price converted from 5-gram quantity. 6Scandium acetate, 99.9% purity listing beginning in 2010. 7Defined as imports – exports + adjustments for Government and industry stock changes. 8See Appendix C for resource/reserve definitions and information concerning data sources.
U.S. Geological Survey, Mineral Commodity Summaries, January 2012

142
SELENIUM
(Data in metric tons of selenium content unless otherwise noted) Domestic Production and Use
: Primary selenium was recovered from anode slimes generated in the electrolytic refining of copper. One copper refinery in Texas reported production of primary selenium. One copper refiner exported semirefined selenium for toll-refining in Asia, and one other refiner generated selenium-containing slimes, which were exported for processing.
In glass manufacturing, selenium is used to decolorize the green tint caused by iron impurities in container glass and other soda-lime silica glass and is used in architectural plate glass to reduce solar heat transmission. Cadmium sulfoselenide pigments are used in plastics, ceramics, and glass to produce a ruby-red color. Selenium is used in catalysts to enhance selective oxidation; in plating solutions, where it improves appearance and durability; in blasting caps and gun bluing; in rubber compounding chemicals; in the electrolytic production of manganese to increase yields; and in brass alloys to improve machinability. Selenium is used as a human dietary supplement and in antidandruff shampoos. The leading agricultural uses are as a dietary supplement for livestock and as a fertilizer additive to enrich selenium-poor soils. It is used as a metallurgical additive to improve machinability of copper, lead, and steel alloys. Historically, the primary electronic use was as a photoreceptor on the replacement drums for older plain paper photocopiers; these have been replaced by newer models that do not use selenium in the reproduction process. Selenium is also used in thin-film photovoltaic copper indium gallium diselenide (CIGS) solar cells. Salient Statistics—United States: 2007 2008 2009 2010 Production, refinery W W W W W
2011e
Imports for consumption, metal and dioxide 544 519 263 480 630 Exports, metal, waste and scrap 592 562 618 919 1,200 Consumption, apparent1 544 519 263 480 630 Price, dealers, average, dollars per pound, 100-pound lots, refined 33.08 32.29 23.07 37.83 65.00 Stocks, producer, refined, yearend W W W W W Net import reliance2 as a percentage of apparent consumption E E E E E Recycling
: Domestic production of secondary selenium was estimated to be very small because most scrap xerographic and electronic materials were exported for recovery of the contained selenium.
Import Sources (2007–10)
: Belgium, 34%; Germany, 15%; Canada, 11%; China, 9%; and other, 31%.
Tariff
: Item Number Normal Trade Relations
Selenium metal 2804.90.0000 Free. 12-31-11
Selenium dioxide 2811.29.2000 Free. Depletion Allowance
: 14% (Domestic and foreign).
Government Stockpile
: None.
Prepared by Micheal W. George [(703) 648-4962, [email protected]]

143 SELENIUM
Events, Trends, and Issues
: The supply of selenium is directly affected by the supply of the materials from which it is a byproduct—copper, and to a lesser extent, nickel. Estimated domestic selenium production was slightly lower in 2011 compared with that of 2010.
Domestic use of selenium in glass in 2011 reversed its downward trend and increased because of increased glass production. The use of selenium as a substitute for lead in free-machining brasses also was slightly higher owing to improvement in global economic conditions. The use of selenium in fertilizers and supplements in the plant-animal-human food chain and as human vitamin supplements increased as its health benefits were documented. Although small amounts of selenium are considered beneficial, it can be hazardous in larger quantities. Continued increased interest in solar cell technologies has increased the consumption of selenium in CIGS solar cells. World Refinery Production and Reserves
: Selenium reserves in Peru were revised substantially upward because of an increase in copper reserves based on Government reports.
Refinery production Reserves3 2010 United States W W 10,000
2011e
Belgium 200 200 — Canada 79 95 6,000 Chile 90 90 20,000 Finland 60 60 — Germany 650 650 — Japan 753 630 — Peru 45 45 13,000 Philippines 65 70 500 Russia 140 140 20,000 Other countries4 38 40 World total (rounded) 52,120 52,000 93,000
23,000
World Resources
: Reserves for selenium are based on identified copper deposits. Coal generally contains between 0.5 and 12 parts per million of selenium, or about 80 to 90 times the average for copper deposits. The recovery of selenium from coal, although technically feasible, does not appear likely in the foreseeable future because it is currently not economical.
Substitutes
: High-purity silicon has replaced selenium in high-voltage rectifiers. Silicon is also the major substitute for selenium in low- and medium-voltage rectifiers and solar photovoltaic cells. Organic pigments have been developed as substitutes for cadmium sulfoselenide pigments. Other substitutes include cerium oxide as either a colorant or decolorant in glass; tellurium in pigments and rubber; bismuth, lead, and tellurium in free-machining alloys; and bismuth and tellurium in lead-free brasses. Sulfur dioxide can be used as a replacement for selenium dioxide in the production of electrolytic manganese metal.
The selenium-tellurium photoreceptors used in some xerographic copiers and laser printers have been replaced by organic photoreceptors in newer machines. Amorphous silicon and cadmium telluride are the two principal competitors to copper indium gallium diselenide in thin-film photovoltaic power cells. eEstimated. E Net exporter. W Withheld to avoid disclosing company proprietary data. — Zero. 1Imports for consumption were used as a proxy for apparent consumption. 2Defined as imports – exports + adjustments for Government and industry stock changes. 3See Appendix C for resource/reserve definitions and information concerning data sources. 4In addition to the countries listed, Australia, China, Iran, Kazakhstan, Mexico, Poland, the United Kingdom, and Uzbekistan are known to produce refined selenium, but output is not reported, and information is inadequate for formulation of reliable production estimates. 5Excludes U.S. production.
U.S. Geological Survey, Mineral Commodity Summaries, January 2012

144
SILICON
(Data in thousand metric tons of silicon content unless otherwise noted) Domestic Production and Use
: Estimated value of silicon alloys and metal produced in the United States in 2011 was $1,400 million. Two companies produced silicon materials in seven plants east of the Mississippi River. Ferrosilicon and metallurgical-grade silicon metal were each produced in four plants. One company produced both products at two plants. Most ferrosilicon was consumed in the ferrous foundry and steel industries, predominantly in the eastern United States. The main consumers of silicon metal were producers of aluminum and aluminum alloys and the chemical industry. The semiconductor and solar industries, which manufacture chips for computers and photovoltaic cells from high-purity silicon, respectively, accounted for only a small percentage of silicon demand.
Salient Statistics—United States: 2007 2008 2009 2010 Production:
2011e
Ferrosilicon, all grades1 155 180 139 176 W Silicon metal2 W W W W W Total W W W W 350 Imports for consumption: Ferrosilicon, all grades1 208 190 70 157 150 Silicon metal 147 168 113 171 200 Exports: Ferrosilicon, all grades1 7 10 9 15 20 Silicon metal 28 35 38 65 82 Consumption, apparent: Ferrosilicon, all grades1 359 352 207 312 W Silicon metal2 W W W W W Total W W W W 600 Price,3 average, cents per pound Si: Ferrosilicon, 50% Si 74.0 116 76.9 109 110 Ferrosilicon, 75% Si 65.6 109 68.9 97.2 100 Silicon metal2 113 162 116 140 150 Stocks, producer, yearend: Ferrosilicon, all grades1 14 21 14 20 W Silicon metal2 W W W W W Total W W W W 23 Net import reliance4 as a percentage of apparent consumption: Ferrosilicon, all grades1 58 49 33 44 <50 Silicon metal2 <50 <50 <50 <50 <50 Total W W W W 42 Recycling
: Insignificant.
Import Sources (2007–10)
: Ferrosilicon: China, 41%; Russia, 33%; Venezuela, 13%; Canada, 9%; and other, 4%. Silicon metal: Brazil, 39%; South Africa, 22%; Canada, 13%; Australia, 10%; and other, 16%. Total: China, 22%; Brazil, 20%; Russia, 17%; Canada, 11%; and other, 30%.
Tariff
: Item Number Normal Trade Relations
Silicon, more than 99.99% Si 2804.61.0000 Free. 12-31-11
Silicon, 99.00%−99.99% Si 2804.69.1000 5.3% ad val. Silicon, other 2804.69.5000 5.5% ad val. Ferrosilicon, 55%−80% Si: More than 3% Ca 7202.21.1000 1.1% ad val. Other 7202.21.5000 1.5% ad val. Ferrosilicon, 80%−90% Si 7202.21.7500 1.9% ad val. Ferrosilicon, more than 90% Si 7202.21.9000 5.8% ad val. Ferrosilicon, other: More than 2% Mg 7202.29.0010 Free. Other 7202.29.0050 Free. Prepared by Lisa A. Corathers [(703) 648-4973, [email protected]]

145 SILICON
Depletion Allowance
: Quartzite, 14% (Domestic and foreign); gravel, 5% (Domestic and foreign).
Government Stockpile
: None.
Events, Trends, and Issues
: The number of ferrosilicon producers in the United States fell from three to two during 2011, as one of the existing companies acquired another. As a result, U.S. ferrosilicon statistics have been withheld to avoid disclosing company proprietary data, and domestic ferrosilicon and silicon metal statistics have been aggregated. Annual average U.S. ferrosilicon spot market prices increased only slightly in 2011 from those of 2010 despite increased domestic steel production, as competition for ferrosilicon business increased and costs for replacing Chinese ferrosilicon decreased.
Demand for silicon metal comes primarily from the aluminum and chemical industries. Domestic secondary aluminum production—the primary materials source for aluminum-silicon alloys—was projected to increase by 12% in 2011 compared with that in 2010. Domestic chemical production was projected to increase by 3% in 2011. World production of silicon materials increased in 2011 compared with that in 2011, mainly as a result of ferrosilicon and silicon smelter expansions, particularly in China. One ferrosilicon plant in the Inner Mongolia Autonomous Region of China added about 350,000 tons of production capacity in 2011, making it the largest plant of its kind at 1,000,000 tons of capacity (gross weight). About 180,000 tons of production capacity (gross weight) was added to the global silicon industry via plant expansions in Australia, China, Kazakhstan, Russia, and Thailand. World Production and Reserves Productione, 5 Reserves6
:
2010 United States 7176 350 The reserves in most major producing
2011
Brazil 224 230 countries are ample in relation to Canada 52 52 demand. Quantitative estimates are China 4,920 5,400 not available. France 127 140 Iceland 74 75 India7 66 68 Norway 303 320 Russia 643 670 South Africa 137 130 Ukraine7 127 100 Venezuela7 50 62 Other countries 394 World total (rounded) 7,290 8,000
400
Ferrosilicon accounts for about four-fifths of world silicon production (gross-weight basis). The leading countries for ferrosilicon production, in descending order, were China, Russia, the United States, Norway, and Ukraine, and for silicon metal production were China, the United States, Norway, Brazil, and France. China was by far the leading producer of both ferrosilicon (5,800,000 tons) and silicon metal (1,650,000 tons) in 2011. World Resources
: World and domestic resources for making silicon metal and alloys are abundant and, in most producing countries, adequate to supply world requirements for many decades. The source of the silicon is silica in various natural forms, such as quartzite.
Substitutes
: Aluminum, silicon carbide, and silicomanganese can be substituted for ferrosilicon in some applications. Gallium arsenide and germanium are the principal substitutes for silicon in semiconductor and infrared applications.
eEstimated. W Withheld to avoid disclosing company proprietary data. 1Ferrosilicon grades include the two standard grades of ferrosilicon50% and 75% siliconplus miscellaneous silicon alloys. 2Metallurgical-grade silicon metal. 3Based on U.S. dealer import price. 4Defined as imports – exports + adjustments for Government and industry stock changes. 5Production quantities are combined totals of estimated silicon content for ferrosilicon and silicon metal, as applicable, except as noted. 6See Appendix C for resource/reserve definitions and information concerning data sources. 7Ferrosilicon only.
U.S. Geological Survey, Mineral Commodity Summaries, January 2012

146
SILVER
(Data in metric tons1 of silver content unless otherwise noted) Domestic Production and Use
: In 2011, the United States produced approximately 1,160 tons of silver with an estimated value of $1.27 billion. Silver was produced as a byproduct from 35 domestic base- and precious-metal mines. Alaska continued as the country’s leading silver-producing State, followed by Nevada. There were 21 U.S. refiners of commercial-grade silver, with an estimated total output of 6,500 tons from domestic and foreign ores and concentrates, and from old and new scrap. Silver’s traditional use categories include coins and medals, industrial applications, jewelry and silverware, and photography. The physical properties of silver include ductility, electrical conductivity, malleability, and reflectivity. The demand for silver in industrial applications continues to increase and includes use of silver in bandages for wound care, batteries, brazing and soldering, in catalytic converters in automobiles, in cell phone covers to reduce the spread of bacteria, in clothing to minimize odor, electronics and circuit boards, electroplating, hardening bearings, inks, mirrors, solar cells, water purification, and wood treatment to resist mold. Silver was used for miniature antennas in Radio Frequency Identification Devices (RFIDs) that were used in casino chips, freeway toll transponders, gasoline speed purchase devices, passports, and on packages to keep track of inventory shipments. Mercury and silver, the main components of dental amalgam, are biocides, and their use in amalgam inhibits recurrent decay.
Salient Statistics—United States: 2007 2008 2009 2010 Production:
2011e
Mine 1,280 1,250 1,250 1,270 1,160 Refinery: Primary 791 779 796 819 820 Secondary (new and old scrap) 1,220 1,530 1,340 1,590 1,700 Imports for consumption2 4,830 4,680 3,590 5,680 6,600 Exports2 797 685 478 796 1,000 Consumption, apparent 5,250 6,300 4,600 7,220 7,850 Price, dollars per troy ounce3 13.41 15.00 14.69 20.20 34.50 Stocks, yearend: Treasury Department4 220 220 220 220 220 COMEX, NYSE Liffe5 4,200 3,900 3,480 3,260 3,000 Exchange Traded Fund6 5,350 8,240 12,400 18,100 19,600 Employment, mine and mill,7 number 900 900 900 900 850 Net import reliance8 as a percentage of apparent consumption 64 68 59 72 75 Recycling
: In 2011, approximately 1,700 tons of silver was recovered from new and old scrap. This includes 60 to 90 tons of silver that is reclaimed and recycled annually from photographic wastewater.
Import Sources (2007–10)
:2 Mexico, 56%; Canada, 25%; Peru, 10%; Chile, 3%; and other, 6%.
Tariff
: No duties are imposed on imports of unrefined silver or refined bullion.
Depletion Allowance
: 15% (Domestic), 14% (Foreign).
Government Stockpile
: None.
Events, Trends, and Issues
: Through September 2011, silver prices averaged $36.39 per troy ounce. The overall rise in silver prices corresponded to continued investment interest and the surge in fabrication demand for industrial applications. Holdings in silver exchange traded funds (ETF), including an ETF that began in 2010 and was focused on the performance of companies involved in silver exploration, mining, and refining, have continued to increase since the first silver ETF was established in April 2006. Silver ETF inventories totaled 17,730 metric tons at the end of October.
Industrial demand for silver in photography continued to decline, and in the United States, demand for silver in photography fell to slightly more than 600 tons, compared with a high of slightly more than 2,000 tons in 2000. Although silver is still used in x-ray films, many hospitals have begun to use digital imaging systems. Approximately 99% of the silver in photographic wastewater may be recycled. Silver demand for use in photographic applications declined; however, the use of silver for jewelry and silverware increased slightly. Owing to silver’s biocidal and conductive properties, the use of silver for electronics, industrial, and medical applications increased. Silver was used Prepared by William E. Brooks [(703) 648-7791, [email protected]]

147 SILVER
as a replacement metal for platinum in catalytic converters in automobiles. Silver also was used in clothing to help regulate body heat and to control odor in shoes and in sports and everyday clothing. The use of trace amounts of silver in bandages for wound care and minor skin infections is also increasing. World silver mine production increased to a new record of 23,800 tons as a result of increased production at primary silver and lead-zinc mines. Production at the Palmarejo (primary silver) and Peñasquito (lead-zinc) Mines in Mexico contributed to maintaining Mexico as the world’s leading silver producer. Production increases also took place in China and Australia—for example, at the Cannington Mine, the world’s leading silver-producing mine. Overall domestic silver production declined, with production decreases at the Bingham Canyon Mine, UT, and at the Red Dog Mine in Alaska. Despite higher mill throughput, production also decreased at the Greens Creek Mine, AK, and at the Lucky Friday Mine, ID, owing to lower ore grades. At the Lucky Friday Mine, mine exploration and mining from new ore zones continued. Production of gold and silver from its leaching operations was expected to extend mine life by 8 years. World Mine Production and Reserves
: Reserve data for Poland were revised based on new information from Government and industry sources.
Mine production Reserves9 2010 United States 1,270 1,160 25,000
2011e
Australia 1,860 1,900 69,000 Bolivia 1,260 1,350 22,000 Canada 600 700 7,000 Chile 1,280 1,400 70,000 China 3,500 4,000 43,000 Mexico 4,410 4,500 37,000 Peru 3,640 4,000 120,000 Poland 1,180 1,200 85,000 Russia 1,150 1,400 NA Other countries 2,950 2,200 World total (rounded) 23,100 23,800 530,000
50,000
World Resources
: Silver was obtained as a byproduct from lead-zinc mines, copper mines, and gold mines, in descending order of production. The polymetallic ore deposits from which silver is recovered account for more than two-thirds of U.S. and world resources of silver. Most recent silver discoveries have been associated with gold occurrences; however, copper and lead-zinc occurrences that contain byproduct silver will continue to account for a significant share of future reserves and resources.
Substitutes
: Digital imaging, film with reduced silver content, silverless black-and-white film, and xerography substitute for silver that has traditionally been used in black-and-white as well as color printing applications. Surgical pins and plates may be made with tantalum and titanium in place of silver. Stainless steel may be substituted for silver flatware, and germanium added to silver flatware will make it tarnish resistant. Nonsilver batteries may replace silver batteries in some applications. Aluminum and rhodium may be used to replace silver that was traditionally used in mirrors and other reflecting surfaces. Silver may be used to replace more costly metals in catalytic converters for off-road vehicles.
eEstimated. NA Not available. 1One metric ton (1,000 kilograms) = 32,150.7 troy ounces. 2Ores and concentrates, refined bullion, doré, and other unwrought silver; excludes coinage, and waste and scrap material. 3Handy & Harman quotations. 4Balance in U.S. Mint only. 5NYSE Liffe: formerly Chicago Board of Trade. 6Held in the United Kingdom by ETF Securities and iShares Silver Trust and in Switzerland by Zürcher Kantonalbank. 7Source: U.S. Department of Labor, Mine Safety and Health Administration. 8Defined as imports – exports + adjustments for Government and industry stock changes. 9See Appendix C for resource/reserve definitions and information concerning data sources.
U.S. Geological Survey, Mineral Commodity Summaries, January 2012

148
SODA ASH
(Data in thousand metric tons unless otherwise noted) Domestic Production and Use
: The total value of domestic soda ash (sodium carbonate) produced in 2011 was estimated to be about $1.3 billion.1 The U.S. soda ash industry comprised four companies in Wyoming operating five plants, one company in California with one plant, and one company with one mothballed plant in Colorado that owns one of the Wyoming plants. The five producers have a combined annual nameplate capacity of 14.5 million tons. Salt, sodium sulfate, and borax were produced as coproducts of sodium carbonate production in California. Sodium bicarbonate, sodium sulfite, and chemical caustic soda were manufactured as coproducts at several of the Wyoming soda ash plants. Sodium bicarbonate was produced at the Colorado operation using soda ash feedstock shipped from the company’s Wyoming facility.
Based on final 2010 reported data, the estimated 2011 distribution of soda ash by end use was glass, 48%; chemicals, 29%; soap and detergents, 10%; distributors, 5%; flue gas desulfurization, 4%; miscellaneous uses and pulp and paper, 2% each; and water treatment, less than 1%. Salient Statistics—United States: 2007 2008 2009 2010 Production2 11,100 11,300 9,310 10,600 10,700
2011e
Imports for consumption 9 13 6 20 25 Exports 5,130 5,370 4,410 5,400 5,500 Consumption: Reported 5,940 5,700 5,020 5,270 5,200 Apparent 6,030 5,860 4,950 5,200 5,200 Price: Quoted, yearend, soda ash, dense, bulk: F.o.b. Green River, WY, dollars per short ton 155.00 260.00 260.00 260.00 260.00 F.o.b. Searles Valley, CA, same basis 180.00 285.00 285.00 285.00 285.00 Average sales value (natural source), f.o.b. mine or plant, dollars per short ton 103.53 122.11 129.88 116.47 120.00 Stocks, producer, yearend 206 259 217 220 250 Employment, mine and plant, number 2,600 2,500 2,400 2,400 2,400 Net import reliance3 as a percentage of apparent consumption E E E E E Recycling
: There is no recycling of soda ash by producers; however, glass container producers are using cullet glass, thereby reducing soda ash consumption.
Import Sources (2007–10)
: China, 26%; Turkey, 20%; United Kingdom, 19%; Mexico, 16%; and other, 19%.
Tariff
: Item Number Normal Trade Relations
Disodium carbonate 2836.20.0000 1.2% ad val. 12-31-11
Depletion Allowance
: Natural, 14% (Domestic and foreign).
Government Stockpile
: None.
Events, Trends, and Issues
: The global soda ash industry continued to recover from the world economic problems that began in 2009. Domestic residential and commercial construction and automotive industries increased glass usage, which affected soda ash consumption worldwide. Increased demand for soda ash prompted U.S. soda ash producers to raise the sales price of soda ash by $10 per ton in May and by $15 per ton effective November 1. The U.S. soda ash export association raised the export price by $50 per ton effective July 1, citing that global soda ash demand was increasing.
The largest domestic soda ash producer restarted its mothballed plant in Granger, WY, at midyear. Annual production capacity was expected to be 500,000 tons in 2010, ramping up to 1.2 million tons by 2014. Other soda ash ventures were announced throughout the world in anticipation of growing demand for soda ash. A chemicals complex was planned near Walvis Bay in Namibia to produce soda ash, sulfuric acid, and phosphoric acid. Prepared by Dennis S. Kostick [(703) 648-7715, [email protected]]

149 SODA ASH
Construction of a soda ash facility was announced at Jubail, Saudi Arabia, to support the growing glass industry in that country. The operation was scheduled to produce 500,000 tons of soda ash per year when completed. The synthetic soda ash manufacturer in Pakistan announced it would increase production capacity to 385,000 tons per year at its plant in Jhelum. In Beypazari, Turkey, the natural soda ash producer announced it would raise production capacity from 1.0 million tons per year to 1.5 million tons per year by 2013. The U.S. Congress announced its support of an investigation to address the trade practices by the Chinese soda ash industry that were thought to have adversely affected the U.S. soda ash producers’ efforts to increase exports to Asia. The Chinese Government granted a 9% rebate on the 17% value-added tax on Chinese soda ash exports. The practice, along with the concerns about the undervaluation of Chinese currency, the U.S.soda ash industry has struggled to increase exports to the region. Economic conditions were improving in many parts of the world. Overall global demand for soda ash was expected to grow from 1.5% to 2% annually for the next several years, with most of the growth expected to be in China, India, Russia, and South America. If the domestic economy and export sales improve, U.S. production may be higher in 2012. World Production and Reserves Production Reserves4, 5
:
Natural: 2010 United States 10,600 10,700 623,000,000
2011e
Botswana 250 250 400,000 Kenya 460 460 7,000 Mexico — — 200,000 Turkey 1,500 1,500 200,000 Uganda NA NA 20,000 Other countries — — World total, natural (rounded) 12,800 13,000 24,000,000
260,000
World total, synthetic (rounded) 34,700 36,000 XX World total (rounded) 47,500 49,000 XX World Resources
: Soda ash is obtained from trona and sodium carbonate-rich brines. The world’s largest deposit of trona is in the Green River Basin of Wyoming. About 47 billion tons of identified soda ash resources could be recovered from the 56 billion tons of bedded trona and the 47 billion tons of interbedded or intermixed trona and halite that are in beds more than 1.2 meters thick. Underground room-and-pillar mining, using conventional and continuous mining, is the primary method of mining Wyoming trona ore. This method has an average 45% mining recovery, whereas average recovery from solution mining is 30%. Improved solution-mining techniques, such as horizontal drilling to establish communication between well pairs, could increase this extraction rate and entice companies to develop some of the deeper trona beds. Wyoming trona resources are being depleted at the rate of about 15 million tons per year (8.3 million tons of soda ash). Searles Lake and Owens Lake in California contain an estimated 815 million tons of soda ash reserves. There are at least 62 identified natural sodium carbonate deposits in the world, only some of which have been quantified. Although soda ash can be manufactured from salt and limestone, both of which are practically inexhaustible, synthetic soda ash is more costly to produce and generates environmentally deleterious wastes.
Substitutes
: Caustic soda can be substituted for soda ash in certain uses, particularly in the pulp and paper, water treatment, and certain chemical sectors. Soda ash, soda liquors, or trona can be used as feedstock to manufacture chemical caustic soda, which is an alternative to electrolytic caustic soda.
eEstimated. E Net exporter. NA Not available. XX Not applicable. — Zero. 1Does not include values for soda liquors and mine waters. 2Natural only. 3Defined as imports – exports + adjustments for Government and industry stock changes. 4The reported quantities are sodium carbonate only. About 1.8 tons of trona yields 1 ton of sodium carbonate. 5See Appendix C for resource/reserve definitions and information concerning data sources. 6From trona, nahcolite, and dawsonite sources.
U.S. Geological Survey, Mineral Commodity Summaries, January 2012
150
SODIUM SULFATE
(Data in thousand metric tons unless otherwise noted) Domestic Production and Use
: The domestic natural sodium sulfate industry consisted of two producers operating two plants, one each in California and Texas. Nine companies operating 11 plants in 9 States recovered byproduct sodium sulfate from various manufacturing processes or products, including battery reclamation, cellulose, resorcinol, silica pigments, and sodium dichromate. About one-half of the total output was a byproduct of these plants in 2011. The total value of natural and synthetic sodium sulfate sold was an estimated $42 million. Estimates of U.S. sodium sulfate consumption by end use were soap and detergents, 35%; glass, 18%; pulp and paper, 15%; carpet fresheners and textiles, 4% each; and miscellaneous, 24%.
Salient Statistics—United States: 2007 2008 2009 2010 Production, total (natural and synthetic)1 312 319 260 297 300
2011e
Imports for consumption 43 69 77 77 80 Exports 101 107 140 196 200 Consumption, apparent (natural and synthetic) 254 281 197 178 180 Price, quoted, sodium sulfate (100% Na2SO4), bulk, f.o.b. works, East, dollars per short ton 134 134 134 134 140 Employment, well and plant, numbere 225 225 225 225 225 Net import reliance2 as a percentage of apparent consumption E E E E E Recycling
: There was some recycling of sodium sulfate by consumers, particularly in the pulp and paper industry, but no recycling by sodium sulfate producers.
Import Sources (2007–10)
: Canada, 87%; China, 4%; Japan, 3%; Finland, 2%; and other, 4%.
Tariff
: Item Number Normal Trade Relations
Disodium sulfate: 12-31-11
Saltcake (crude) 2833.11.1000 Free. Other: 2833.11.5000 0.4% ad val. Anhydrous 2833.11.5010 0.4% ad val. Other 2833.11.5050 0.4% ad val. Depletion Allowance
: Natural, 14% (Domestic and foreign); synthetic, none.
Government Stockpile
: None.
Prepared by Dennis S. Kostick [(703) 648-7715, [email protected]]

151 SODIUM SULFATE
Events, Trends, and Issues
: China remained the leading exporter and producer of natural and synthetic sodium sulfate in the world. Jiangsu Province is the major area for sodium sulfate production. It was anticipated that this area will produce 4.8 million tons of sodium sulfate annually by 2013. As of 2008, China represented about three-fourths of world production capacity and more than 70% of world production.
The primary use of sodium sulfate worldwide is in powdered detergents. Sodium sulfate is a low-cost, inert, white filler in home laundry detergents. Although powdered home laundry detergents may contain as much as 50% sodium sulfate in their formulation, the market for liquid detergents, which do not contain any sodium sulfate, continued to increase. However, with the major downturn in the world economies beginning in 2008, many consumers have reverted to using more powdered laundry detergents because they are less expensive than their liquid counterparts. Sodium sulfate consumption in the domestic textile industry also has been declining because of imports of less-expensive textile products. In nations with strengthening economies, sodium sulfate consumption increased by yearend 2011. Sodium sulfate consumption in 2012 is expected to be comparable with that of 2011, with detergents remaining the leading sodium-sulfate-consuming sector. If the winter of 2011–12 is relatively mild, byproduct recovery of sodium sulfate from automobile batteries may decline because fewer battery failures during mild winter weather reduce recycling. World production and consumption of sodium sulfate have been stagnant but are expected to increase between 2% to 3% per year in the next few years, especially in Asia and South America. World Production and Reserves
: Although data on mine production for natural sodium sulfate are not available, total world production of natural sodium sulfate is estimated to be about 6 million tons. Total world production of byproduct sodium sulfate is estimated to be between 1.5 and 2.0 million tons.
Reserves3 United States 860,000 Canada 84,000 China NA Mexico 170,000 Spain 180,000 Turkey 100,000 Other countries World total (rounded) 3,300,000
1,900,000
World Resources
: Sodium sulfate resources are sufficient to last hundreds of years at the present rate of world consumption. In addition to the countries with reserves listed above, the following countries also possess identified resources of sodium sulfate: Botswana, Egypt, Italy, Mongolia, Romania, and South Africa. Commercial production from domestic resources is from deposits in California and Texas. The brine in Searles Lake, CA, contains about 450 million tons of sodium sulfate resource, representing about 35% of the lake’s brine. In Utah, about 12% of the dissolved salts in the Great Salt Lake is sodium sulfate, representing about 400 million tons of resource. An irregular, 21-meter-thick mirabilite deposit is associated with clay beds 4.5 to 9.1 meters below the lake bottom near Promontory Point, UT. Several playa lakes in west Texas contain underground sodium-sulfate-bearing brines and crystalline material. Other economic and subeconomic deposits of sodium sulfate are near Rhodes Marsh, NV; Grenora, ND; Okanogan County, WA; and Bull Lake, WY. Sodium sulfate also can be obtained as a byproduct from the production of ascorbic acid, boric acid, cellulose, chromium chemicals, lithium carbonate, rayon, resorcinol, silica pigments, and from battery recycling. The quantity and availability of byproduct sodium sulfate are dependent on the production capabilities of the primary industries and the sulfate recovery rates.
Substitutes
: In pulp and paper, emulsified sulfur and caustic soda (sodium hydroxide) can replace sodium sulfate. In detergents, a variety of products can substitute for sodium sulfate. In glassmaking, soda ash and calcium sulfate have been substituted for sodium sulfate with less-effective results.
eEstimated. E Net exporter. NA Not available. 1Source: U.S. Census Bureau. Synthetic production data are revised in accordance with recent updated Census Bureau statistics. 2Defined as imports – exports + adjustments for Government and industry stock changes (if available). 3See Appendix C for resource/reserve definitions and information concerning data sources.
U.S. Geological Survey, Mineral Commodity Summaries, January 2012

152
STONE (CRUSHED)1
(Data in million metric tons unless otherwise noted)2 Domestic Production and Use
: Crushed stone valued at $11 billion was produced by 1,600 companies operating 3,900 quarries, 93 underground mines, and 207 sales/distribution yards in 50 States. Leading States, in descending order of production, were Texas, Pennsylvania, Missouri, Illinois, Kentucky, Ohio, Indiana, Virginia, Georgia, and Florida, together accounting for one-half of the total crushed stone output. Of the total crushed stone produced in 2011, about 70% was limestone and dolomite; 14%, granite; 6%, traprock; 5%, miscellaneous stone; 4%, sandstone and quartzite; and the remaining 1% was divided, in descending order of tonnage, among marble, slate, calcareous marl, volcanic cinder and scoria, and shell. It is estimated that of the 1.15 billion tons of crushed stone consumed in the United States in 2011, 46% was reported by use, 27% was reported for unspecified uses, and 27% of the total consumed was estimated for nonrespondents to the U.S. Geological Survey (USGS) canvasses. Of the 512 million tons reported by use, 82% was used as construction material, mostly for road construction and maintenance; 10%, for cement manufacturing; 2% each, for lime manufacturing and for agricultural uses; and 4%, for special and miscellaneous uses and products. To provide a more accurate estimate of the consumption patterns for crushed stone, the “unspecified uses—reported and estimated,” as defined in the USGS Minerals Yearbook, are not included in the above percentages.
The estimated output of crushed stone in the 48 conterminous States shipped for consumption in the first 6 months of 2011 was 507 million tons, a decrease of 3.7% compared with that of the same period of 2010. Second quarter shipments for consumption decreased by 6.5% compared with those of the same period of 2010. Additional production information, by quarter for each State, geographic division, and the United States, is reported in the USGS quarterly Mineral Industry Surveys for Crushed Stone and Construction Sand and Gravel. Salient Statistics—United States: 2007 2008 2009 2010 Production 1,650 1,460 1,160 1,160 1,110
2011e
Recycled material 20 29 29 25 25 Imports for consumption 20 21 12 15 15 Exports 1 1 1 1 1 Consumption, apparent 1,690 1,510 1,200 1,200 1,150 Price, average value, dollars per metric ton 8.58 9.36 9.74 9.67 9.48 Employment, quarry and mill, numbere, 3 81,900 81,000 81,000 79,000 79,000 Net import reliance4 as a percentage of apparent consumption 1 1 1 1 1 Recycling
: Road surfaces made of asphalt and crushed stone and, to a lesser extent, cement concrete surface layers and structures were recycled on a limited but increasing basis in most States. Asphalt road surfaces and concrete were recycled in 49 States and Puerto Rico. The amount of material reported to be recycled decreased by 10% in 2011 compared with that of the previous year.
Import Sources (2007–10)
: Canada, 43%; Mexico, 38%; The Bahamas, 17%; and other, 2%.
Tariff
: Item Number Normal Trade Relations
Crushed stone 2517.10.00 Free. 12-31-11
Depletion Allowance
: (Domestic) 14% for some special uses; 5%, if used as ballast, concrete aggregate, riprap, road material, and similar purposes.
Government Stockpile
: None.
Prepared by Jason Christopher Willett [(703) 648-6473, [email protected]]

153 STONE (CRUSHED)
Events, Trends, and Issues
: Crushed stone production was about 1.11 billion tons in 2011, a 4% decrease compared with that of 2010. Apparent consumption also decreased to about 1.15 billion tons. Demand for crushed stone is anticipated to be slightly less for 2011 because of the continuing slowdown in activity that some of the principal construction markets have experienced during the last 5 years. Long-term increases in construction aggregates demand will be influenced by activity in the public and private construction sectors, as well as by construction work related to security measures being implemented around the Nation. The underlying factors that would support a rise in prices of crushed stone are expected to be present in 2012, especially in and near metropolitan areas.
The crushed stone industry continued to be concerned with environmental, health, and safety regulations. Shortages of crushed stone in some urban and industrialized areas are expected to continue to increase owing to local zoning regulations and land-development alternatives. These issues are expected to continue and to cause new crushed stone quarries to locate away from large population centers. World Mine Production and Reserves Mine production Reserves5
:
2010 United States 1,160 1,110 Adequate except where special
2011e
Other countries6 NA NA World total NA NA local shortages exist.
types are needed or where
World Resources
: Stone resources of the world are very large. Supply of high-purity limestone and dolomite suitable for specialty uses is limited in many geographic areas. The largest resources of high-purity limestone and dolomite in the United States are in the central and eastern parts of the country.
Substitutes
: Crushed stone substitutes for roadbuilding include sand and gravel, and iron and steel slag. Substitutes for crushed stone used as construction aggregates include sand and gravel, iron and steel slag, sintered or expanded clay or shale, and perlite or vermiculite.
eEstimated. NA Not available. 1See also Stone (Dimension). 2See Appendix A for conversion to short tons. 3Including office staff. 4Defined as imports – exports + adjustments for Government and industry stock changes. Changes in stocks were assumed to be zero in the net import reliance and apparent consumption calculations because data on stocks were not available. 5See Appendix C for resource/reserve definitions and information concerning data sources. 6Consistent production information is not available for other countries owing to a wide variety of ways in which countries report their crushed stone production. Some countries do not report production for this mineral commodity. Production information for some countries is available in the country chapters of the USGS Minerals Yearbook.
U.S. Geological Survey, Mineral Commodity Summaries, January 2012

154
STONE (DIMENSION)1
(Data in thousand metric tons unless otherwise noted) Domestic Production and Use
: Approximately 1.64 million tons of dimension stone, valued at $321 million, was sold or used by U.S. producers in 2011. Dimension stone was produced by 173 companies, operating 255 quarries, in 37 States. Leading producer States, in descending order by tonnage, were Georgia, Texas, Indiana, South Dakota, and Wisconsin. These five States accounted for about 54% of the production and contributed about 47% of the value of domestic production. Approximately 42%, by tonnage, of dimension stone sold or used was granite, followed by limestone (27%), miscellaneous stone (14%), sandstone (14%), marble (2%), and slate (1%). By value, the leading sales or uses were for granite (36%), followed by limestone (32%), miscellaneous stone (14%), sandstone (10%), marble (4%), and slate (4%). Rough stone represented 62% of the tonnage and 42% of the value of all the dimension stone sold or used by domestic producers, including exports. The leading uses and distribution of rough stone, by tonnage, were in irregular-shaped stone (45%), and in building and construction (36%). Dressed stone mainly was sold for curbing (26%), ashlars and partially squared pieces (24%), and flagging (18%), by tonnage.
Salient Statistics—United States:2 2007 2008 2009 2010 Sold or used by producers:
2011e
Tonnage 1,920 1,800 1,620 1,670 1,640 Value, million dollars 346 324 328 323 321 Imports for consumption, value, million dollars 2,540 2,150 1,350 2,430 1,920 Exports, value, million dollars 74 66 48 55 145 Consumption, apparent, value, million dollars 2,810 2,400 1,630 2,700 2,100 Price Variable, depending on type of product Employment, quarry and mill, number3 3,000 3,000 3,000 3,000 3,000 Net import reliance4 as a percentage of apparent consumption (based on value) 88 87 80 88 85 Granite only: Production 536 464 469 699 540 Exports (rough and finished) 112 103 75 96 97 Price Variable, depending on type of product Employment, quarry and mill, number3 1,500 1,500 1,500 1,500 1,500 Recycling
: Small amounts of dimension stone were recycled, principally by restorers of old stone work.
Import Sources (2007–10 by value)
: All dimension stone: Brazil, 22%; China, 22%; Italy, 20%; Turkey, 8%; and other, 28%. Granite only: Brazil, 40%; China, 24%; India, 14%; Italy, 14%; and other, 8%.
Tariff
: Dimension stone tariffs ranged from free to 6.5% ad valorem, according to type, degree of preparation, shape, and size, for countries with normal trade relations in 2011. Most crude or rough trimmed stone was imported at 3.0% ad valorem or less.
Depletion Allowance
: 14% (Domestic and foreign); slate used or sold as sintered or burned lightweight aggregate, 7.5% (Domestic and foreign); dimension stone used for rubble and other nonbuilding purposes, 5% (Domestic and foreign).
Government Stockpile
: None.
Prepared by Thomas P. Dolley [(703) 648-7710, [email protected]]

155 STONE (DIMENSION)
Events, Trends, and Issues
: The United States is the world’s largest market for dimension stone. Imports of dimension stone decreased in value to about $1.9 billion compared with $2.4 billion in 2010. The sluggish U.S. economy tended to decrease demand for and imports of dimension stone in the near term. Dimension stone exports increased to about $145 million. The weakening of the U.S. dollar has aided the U.S. export market for dimension stone. Apparent consumption, by value, was $2.1 billion in 2011—a $600 million, or 22%, decrease from that of 2010. Dimension stone for construction and refurbishment was used in both commercial and residential markets; 2011 refurbishment activity was unchanged compared with that of 2010.
World Mine Production and Reserves Mine production Reserves5
:
2010 United States 1,670 1,640 Adequate except for certain
2011e
Other countries NA NA World total NA NA shortages.
special types and local
World Resources
: Dimension stone resources of the world are sufficient. Resources can be limited on a local level or occasionally on a regional level by the lack of a particular kind of stone that is suitable for dimension purposes.
Substitutes
: Substitutes for dimension stone include aluminum, brick, ceramic tile, concrete, glass, plastics, resin-agglomerated stone, and steel.
eEstimated. NA Not available. 1See also Stone (Crushed). 2Includes Puerto Rico. 3Excluding office staff. 4Defined as imports – exports. 5See Appendix C for resource/reserve definitions and information concerning data sources.
U.S. Geological Survey, Mineral Commodity Summaries, January 2012

156
STRONTIUM
(Data in metric tons of strontium content1 unless otherwise noted) Domestic Production and Use
: Although deposits of strontium minerals occur widely throughout the United States, strontium minerals have not been mined in the United States since 1959. Domestic production of strontium carbonate, the principal strontium compound, ceased in 2006. A few domestic companies produce small amounts of downstream strontium chemicals. Estimates of primary strontium compound end uses in the United States were pyrotechnics and signals, 30%; ferrite ceramic magnets, 30%; master alloys, 10%; pigments and fillers, 10%; electrolytic production of zinc, 10%; and other applications, 10%.
Salient Statistics—United States: 2007 2008 2009 2010 Production — — — — —
2011e
Imports for consumption: Strontium minerals 541 2,030 6,420 2,370 6,200 Strontium compounds 8,550 9,420 5,860 8,640 13,000 Exports, compounds 688 594 532 566 800 Consumption, apparent, celestite and compounds 8,400 10,900 11,800 10,400 18,400 Price, average value of mineral imports at port of exportation, dollars per ton 67 64 47 45 46 Net import reliance2 as a percentage of apparent consumption 100 100 100 100 100 Recycling
: None.
Import Sources (2007–10)
: Strontium minerals: Mexico, 100%. Strontium compounds: Mexico, 70%; Germany, 15%; and other, 15%. Total imports: Mexico, 79%; Germany, 10%; and other, 11%.
Tariff
: Item Number Normal Trade Relations
Celestite 2530.90.8010 Free. 12-31-11
Strontium metal 2805.19.1000 3.7% ad val. Compounds: Strontium oxide, hydroxide, peroxide 2816.40.1000 4.2% ad val. Strontium nitrate 2834.29.2000 4.2% ad val. Strontium carbonate 2836.92.0000 4.2% ad val. Depletion Allowance
: 22% (Domestic), 14% (Foreign).
Government Stockpile
: None.
Prepared by Marc A. Angulo [Contact Joyce A. Ober, (703) 648-7717, [email protected]]

157 STRONTIUM
Events, Trends, and Issues
: Strontium compounds are mostly consumed by the ceramic, glass, and pyrotechnics industries, with smaller amounts consumed by a multitude of other industries. Ceramics and glass manufacture remained the top end-use industries through strontium’s estimated use in ceramic ferrite magnets and other ceramic and glass applications. The use of strontium nitrate in pyrotechnics was estimated to equal the use of strontium carbonate in ferrite magnets.
With expected improvements to global economic conditions, demand for strontium carbonate in more traditional applications is expected to increase. Use of strontium by the ceramics, glass, and pyrotechnic industries is expected to continue, with solid demand for strontium used in ferrite magnets. With improvements in advanced applications, consumption of strontium in new end uses may increase. In descending order of production, China, Spain, and Mexico are the world’s leading producers of celestite. China is becoming more reliant on imported celestite because Chinese celestite reserves are smaller and of lower quality than those in other major producing countries. The Iranian celestite industry was expecting strong growth owing to increased exports to China, coupled with the low cost of container freights and government subsidies. A key Spanish celestite mine and refinery ceased operations because its sales to China declined significantly and demand for CRTs decreased. World Mine Production and Reserves Mine production Reserves4
:3
2010 United States — — —
2011e
Argentina 7,000 7,100 All other: Chinae 220,000 210,000 6,800,000 Iran 2,000 2,000 Mexico 31,400 35,000 Morocco 2,500 2,500 Pakistan 1,600 1,600 Spain 140,000 120,000 World total (rounded) 405,000 380,000 6,800,000
1
World Resources
: World resources of strontium are thought to exceed 1 billion tons.
Substitutes
: Barium can be substituted for strontium in ferrite ceramic magnets; however, the resulting barium composite will have reduced maximum operating temperature when compared with that of strontium composites. Substituting for strontium in pyrotechnics is hindered by difficulty in obtaining the desired brilliance and visibility imparted by strontium and its compounds.
eEstimated. — Zero. 1The strontium content of celestite is 43.88%; this factor was used to convert units of celestite to strontium content. 2Defined as imports – exports + adjustments for Government and industry stock changes. 3Metric tons of strontium minerals. 4See Appendix C for resource/reserve definitions and information concerning data sources.
U.S. Geological Survey, Mineral Commodity Summaries, January 2012

158
SULFUR
(Data in thousand metric tons of sulfur unless otherwise noted) Domestic Production and Use
: In 2011, elemental sulfur and byproduct sulfuric acid were produced at 109 operations in 29 States and the U.S. Virgin Islands. Total shipments were valued at about $1.6 billion. Elemental sulfur production was 8.1 million tons; Louisiana and Texas accounted for about 53% of domestic production. Elemental sulfur was recovered, in descending order of tonnage, at petroleum refineries, natural-gas-processing plants, and coking plants by 34 companies at 103 plants in 26 States and the U.S. Virgin Islands. Byproduct sulfuric acid, representing about 8% of production of sulfur in all forms, was recovered at six nonferrous smelters in four States by five companies. Domestic elemental sulfur provided 59% of domestic consumption, and byproduct acid accounted for about 5%. The remaining 36% of sulfur consumed was provided by imported sulfur and sulfuric acid. About 90% of sulfur consumed was in the form of sulfuric acid. Agricultural chemicals (primarily fertilizers) composed about 68% of identified sulfur demand; petroleum refining, 24%; and metal mining, 5%. Other uses, accounting for 3% of demand, were widespread because a multitude of industrial products required sulfur in one form or another during some stage of their manufacture.
Salient Statistics—United States: 2007 2008 2009 2010 Production:
2011e
Recovered elemental 8,280 8,550 8,190 8,280 8,100 Other forms 817 753 749 791 Total (rounded) 9,100 9,300 8,940 9,070 8,800
710
Shipments, all forms 9,130 9,280 8,860 9,140 8,800 Imports for consumption: Recovered, elementale 2,930 3,000 1,700 2,950 3,300 Sulfuric acid, sulfur content 857 1,690 413 689 890 Exports: Recovered, elemental 922 953 1,430 1,450 1,300 Sulfuric acid, sulfur content 110 86 83 70 130 Consumption, apparent, all forms 11,900 12,900 9,520 11,300 11,600 Price, reported average value, dollars per ton of elemental sulfur, f.o.b., mine and/or plant 36.49 264.04 1.73 70.48 200.00 Stocks, producer, yearend 187 211 232 164 165 Employment, mine and/or plant, number 2,600 2,600 2,600 2,600 2,600 Net import reliance1 as a percentage of apparent consumption 23 28 6 19 24 Recycling
: Typically, between 2.5 million and 5 million tons of spent sulfuric acid is reclaimed from petroleum refining and chemical processes during any given year.
Import Sources (2007–10)
: Elemental: Canada, 76%; Mexico, 12%; Venezuela, 9%; and other, 3%. Sulfuric acid: Canada, 59%; India, 19%; Mexico, 8%; and other, 14%. Total sulfur imports: Canada, 72%; Mexico, 11%; Venezuela, 7%; and other, 10%.
Tariff
: Item Number Normal Trade Relations
Sulfur, crude or unrefined 2503.00.0010 Free. 12-31-11
Sulfur, all kinds, other 2503.00.0090 Free. Sulfur, sublimed or precipitated 2802.00.0000 Free. Sulfuric acid 2807.00.0000 Free. Depletion Allowance
: 22% (Domestic and foreign).
Government Stockpile
: None.
Events, Trends, and Issues
: Total U.S. sulfur production and shipments decreased slightly compared with those of 2010. Domestic production of elemental sulfur from petroleum refineries and recovery from natural gas operations decreased slightly. Domestically, refinery sulfur production is expected to continue to increase, sulfur from natural gas processing is expected to decline over time, and byproduct sulfuric acid is expected to remain relatively stable, unless one or more of the remaining nonferrous smelters close.
Prepared by Lori E. Apodaca [(703) 648-7724, [email protected]]
159 SULFUR
World sulfur production increased slightly and is likely to steadily increase for the foreseeable future. Significantly increased production is expected from sulfur recovery at liquefied natural gas operations in the Middle East and expanded oil sands operations in Canada, unless the downturn in the world economy limits investments in those areas. The contract sulfur prices in Tampa, FL, began 2011 at around $160 per ton. The price increased to $220 per ton in May and remained at that level throughout November. Export prices were similar to the domestic prices. Domestic phosphate rock consumption was higher in 2011 than in 2010, which resulted in increased demand for sulfur to process the phosphate rock into phosphate fertilizers. World Production and Reserves Production—All forms Reserves2
:
2010 United States 9,070 8,800 Reserves of sulfur in crude oil, natural gas,
2011e
Australia 940 930 and sulfide ores are large. Because most Brazil 480 480 sulfur production is a result of the processing Canada 7,255 7,100 of fossil fuels, supplies should be adequate Chile 1,676 1,700 for the foreseeable future. Because China 9,600 9,600 petroleum and sulfide ores can be processed Finland 590 590 long distances from where they are France 1,305 1,300 produced, sulfur production may not be in the Germany 3,905 3,700 country to which the reserves were India 1,171 1,200 attributed. For instance, sulfur from Saudi Iran 1,780 1,800 Arabian oil may be recovered at refineries in Italy 740 740 the United States. Japan 3,292 3,100 Kazakhstan 2,000 2,700 Korea, Republic of 660 1,500 Kuwait 830 830 Mexico 1,810 1,800 Netherlands 530 530 Poland 732 1,000 Qatar 1,124 1,100 Russia 7,070 7,100 Saudi Arabia 3,300 3,300 South Africa 465 470 Spain 637 640 United Arab Emirates 1,763 1,800 Uzbekistan 520 520 Venezuela 800 800 Other countries 4,020 World total (rounded) 68,100 69,000
4,000
World Resources
: Resources of elemental sulfur in evaporite and volcanic deposits and sulfur associated with natural gas, petroleum, tar sands, and metal sulfides amount to about 5 billion tons. The sulfur in gypsum and anhydrite is almost limitless, and some 600 billion tons of sulfur is contained in coal, oil shale, and shale rich in organic matter, but low-cost methods have not been developed to recover sulfur from these sources. The domestic sulfur resource is about one-fifth of the world total.
Substitutes
: Substitutes for sulfur at present or anticipated price levels are not satisfactory; some acids, in certain applications, may be substituted for sulfuric acid.
eEstimated. 1Defined as imports – exports + adjustments for Government and industry stock changes. 2See Appendix C for resource/reserve definitions and information concerning data sources.
U.S. Geological Survey, Mineral Commodity Summaries, January 2012

160
TALC AND PYROPHYLLITE
(Data in thousand metric tons unless otherwise noted) Domestic Production and Use
: Domestic talc production in 2011 was estimated to be 615,000 tons valued at $20 million. Three companies operated six talc-producing mines in three States in 2011. These three companies accounted for more than 99% of the U.S. talc production. Three other companies, two in California and one in Virginia, worked from stocks. Montana was the leading producer State, followed by Texas and Vermont. Sales of talc were estimated to be 572,000 tons valued at $90 million. Talc produced and sold in the United States was used for ceramics, 24%; paper, 22%; paint, 19%; roofing, 10%; plastics, 9%; cosmetics, 4%; rubber, 2%; and other, 10%. About 290,000 tons of talc was imported with a likely 30,000 to 40,000 tons retained as stocks. Of the remainder, more than 75% was used for plastics, cosmetics, and paint applications, in decreasing order by tonnage. The total estimated use of talc in the United States, with imported talc included, was plastics, 26%; ceramics, 17%; paint, 16%; paper, 16%; cosmetics, 7%; roofing, 6%; rubber, 3%; and other, 9%. One company in California and one company in North Carolina mined pyrophyllite. Production of pyrophyllite increased slightly from that of 2010. Consumption was, in decreasing order by tonnage, in refractory products, ceramics, and paint.
Salient Statistics—United States:1 2007 2008 2009 2010
Production, mine 769 706 511 604 615 2011e
Sold by producers 720 667 512 567 572 Imports for consumption 221 193 134 242 275 Exports 271 244 188 224 220 Shipments from Government stockpile excesses — (2) — — — Consumption, apparent 719 655 457 622 670 Price, average, processed, dollars per metric ton 114 125 111 150 157 Employment, mine and mill 430 350 285 280 300 Net import reliance3 as a percentage of apparent consumption E E E 3 8 Recycling
: Insignificant.
Import Sources (2007–10)
: China, 47%; Canada, 37%; Japan, 6%; and other, 10%.
Tariff
: Item Number Normal Trade Relations
Not crushed, not powdered 2526.10.0000 Free. 12-31-11
Crushed or powdered 2526.20.0000 Free. Cut or sawed 6815.99.2000 Free. Depletion Allowance
: Block steatite talc: 22% (Domestic), 14% (Foreign). Other: 14% (Domestic and foreign).
Government StockpileStockpile Status—9-30-114
:
(Metric tons) Uncommitted Authorized Disposal plan Disposals Material inventory for disposal FY 2011 FY 2011 Talc, block and lump 865 865 9075 — Talc, ground 621 621 — — Prepared by Robert L. Virta [(703) 648-7726, [email protected]]

161 TALC AND PYROPHYLLITE
Events, Trends, and Issues
: The talc and pyrophyllite industries continued to be hampered by the slow economic recovery in the United States. While some industry sectors, such as automotive and general manufacturing, improved slightly in 2011, housing remained stagnant. This affected sales of talc for such product applications as adhesives, caulks, ceramics, joint compounds, paint, and roofing. As a result, U.S. production and sales of talc increased only slightly from those of 2010 and remained far below levels attained just prior to the 2008 recession.
Exports declined 11% in 2011 as Europe continued to struggle with its economic issues, the economy in China slowed, and shipments to Mexico, whose ceramic industries were major exporters to the United States, declined. Belgium, China, and Mexico accounted for the largest share of the decrease in exports. Mexico remained the leading destination for U.S. talc exports, accounting for 30% of the tonnage. Canada, the second leading export destination, accounted for 25% of the export tonnage. U.S. imports increased 20% from those of 2010. Increased imports from China and Pakistan accounted for a major share of the increase. In 2011, Australia, Canada, China, and Pakistan supplied approximately 90% of the talc imported into the United States. Imports from Australia and Pakistan increased significantly in 2011 because of increased imports by two companies, one affiliated with an Australian talc producer and another, a mineral trading company. Not all of the talc imported into the United States was believed to have entered commerce; it is likely that 30,000 to 40,000 tons was used to replenish inventories. Sales of pyrophyllite were likely to have increased slightly for refractory products. The slow recovery of industries that use pyrophyllite to manufacture ceramics and paints limited further growth in pyrophyllite sales in 2011. The leading global producer of talc, with operations in Australia, Asia, Europe, and North America, was sold to an investment firm in France. The French firm was involved in industrial minerals through its mining of calcium carbonate, diatomite, feldspar, kaolin, mica, perlite, refractory products, and silica, and reported that talc would complement its product offerings. The second leading producer of talc, with talc mines in Finland, was sold to a London-based investment firm. The sale included calcium carbonate as well as the talc operations. World Mine Production and Reserves Mine production Reserves6
:
2010 United States1 604 615 140,000
2011e
Brazil 410 420 230,000 China 2,000 2,000 Large Finland 500 500 Large France 420 420 Large India 637 650 75,000 Japan 364 360 100,000 Korea, Republic of 706 700 14,000 Other countries 1,570 1,570 World total (rounded) 7,210 7,200 Large
Large
World Resources
: The United States is self-sufficient in most grades of talc and related minerals. Domestic and world resources are estimated to be approximately five times the quantity of reserves.
Substitutes
: Substitutes for talc include bentonite, chlorite, kaolin, and pyrophyllite in ceramics; chlorite, kaolin, and mica in paint; calcium carbonate and kaolin in paper; bentonite, kaolin, mica, and wollastonite in plastics; and kaolin and mica in rubber.
eEstimated. E Net exporter. — Zero. 1Excludes pyrophyllite. 2Less than ½ unit. 3Defined as imports – exports + adjustments for Government and industry stock changes. 4See Appendix B for definitions. 5Included talc, block and lump, and talc, ground. 6See Appendix C for resource/reserve definitions and information concerning data sources.
U.S. Geological Survey, Mineral Commodity Summaries, January 2012

162
TANTALUM
(Data in metric tons of tantalum content unless otherwise noted) Domestic Production and Use
: No significant U.S. tantalum mine production has been reported since 1959. Domestic tantalum resources are of low grade, some mineralogically complex, and most are not commercially recoverable. Companies in the United States produced tantalum alloys, compounds, and metal from imported concentrates, and metal and alloys were recovered from foreign and domestic scrap. Tantalum was consumed mostly in the form of alloys, compounds, fabricated forms, ingot, and metal powder. Tantalum capacitors were estimated to account for more than 60% of tantalum use. Major end uses for tantalum capacitors include automotive electronics, pagers, personal computers, and portable telephones. The value of tantalum consumed in 2010 was estimated at about $174 million and was expected to be about $200 million in 2011 as measured by the value of imports.
Salient Statistics—United States: 2007 2008 2009 2010 Production:
2011e
Mine — — — — — Secondary NA NA NA NA NA Imports for consumptione, 1 1,160 1,290 798 1,600 1,700 Exportse, 1 511 662 326 438 540 Government stockpile releasese, 2 — — — — — Consumption, apparent 644 629 473 1,160 1,200 Price, tantalite, dollars per pound of Ta2O5 content3 37 44 40 54 130 Net import reliance4 as a percentage of apparent consumption 100 100 100 100 100 Recycling
: Tantalum was recycled mostly from new scrap that was generated during the manufacture of tantalum-containing electronic components and from tantalum-containing cemented carbide and superalloy scrap.
Import Sources (2007–10)
: Tantalum contained in niobium (columbium) and tantalum ore and concentrate; tantalum metal; and tantalum waste and scrap—China, 18%; Germany, 13%; Kazakhstan, 10%; Australia, 10%; and other, 49%.
Tariff
: Item Number Normal Trade Relations
Synthetic tantalum-niobium concentrates 2615.90.3000 Free. 12-31-11
Tantalum ores and concentrates 2615.90.6060 Free. Tantalum oxide5 2825.90.9000 3.7% ad val. Potassium fluotantalate5 2826.90.9000 3.1% ad val. Tantalum, unwrought: Powders 8103.20.0030 2.5% ad val. Alloys and metal 8103.20.0090 2.5% ad val. Tantalum, waste and scrap 8103.30.0000 Free. Tantalum, other 8103.90.0000 4.4% ad val. Depletion Allowance
: 22% (Domestic), 14% (Foreign).
Government Stockpile
: In fiscal year (FY) 2011, which ended on September 30, 2011, the Defense Logistics Agency, DLA Strategic Materials sold no tantalum materials. The DLA Strategic Materials announced that maximum disposal limits for tantalum carbide powder in FY 2012 was zero. The DLA Strategic Materials exhausted stocks of tantalum minerals in FY 2007, metal powder in FY 2006, metal oxide in FY 2006, and metal ingots in FY 2005.
Stockpile Status—9-30-116 Uncommitted Authorized Disposal plan Disposals Material inventory for disposal FY 2011 FY 2011 Tantalum carbide powder 1.73 1.73 7— — Prepared by John F. Papp [(703) 648-4963, [email protected]]

163 TANTALUM
Events, Trends, and Issues
: U.S. tantalum apparent consumption in 2011 was estimated to increase about 3% from that of 2010. Tantalum waste and scrap was the leading imported tantalum material, accounting for more than 67% of tantalum imports. By weight, averaged from 2007 through 2010, the leading suppliers of tantalum imports for consumption were: mineral concentrate, Australia, 61%; Canada, 20%; and Mozambique,16%: metal, China, 33%; Kazakhstan, 26%; and Germany, 13%: and waste and scrap, Germany, 17%; Russia, 14%; and Mexico, 12%. The United States rebounded from financial market problems and the subsequent economic slowdown in 2008 and 2009, as the world economy continued a slow recovery; however, a developing debt crisis in Europe reduced recovery expectations. Several tantalum mines that were put on care and maintenance have reopened [Wodgina Mine (Australia) in December 2008, and Tanco (Canada) and Marropino (Mozambique) in April 2009].
World Mine Production and Reserves
: Reserves for Australia were raised to agree with the Government of Australia’s “Accessible Economic Demonstrated Resources.”
Mine production8 Reserves9 2010 United States — — —
2011e
Australia — 80 51,000 Brazil 180 180 65,000 Canada — 25 NA Mozambique 120 120 3,200 Rwanda 110 110 NA Other countries10 271 270 World total (rounded) 681 790 120,000
NA
World Resources
: Identified resources of tantalum, most of which are in Australia and Brazil, are considered adequate to meet projected needs. The United States has about 1,500 tons of tantalum resources in identified deposits, all of which are considered uneconomic at 2011 prices.
Substitutes
: The following materials can be substituted for tantalum, but usually with less effectiveness: niobium in carbides; aluminum and ceramics in electronic capacitors; glass, niobium, platinum, titanium, and zirconium in corrosion-resistant equipment; and hafnium, iridium, molybdenum, niobium, rhenium, and tungsten in high-temperature applications.
eEstimated. NA Not available. — Zero. 1Imports and exports include the estimated tantalum content of niobium and tantalum ores and concentrates, unwrought tantalum alloys and powder, tantalum waste and scrap, and other tantalum articles. 2Government stockpile inventory reported by DLA Strategic Materials is the basis for estimating Government stockpile releases. 3Price is annual average price reported in Ryan’s Notes. 4Defined as imports – exports + adjustments for Government and industry stock changes. 5This category includes other than tantalum-containing material. 6See Appendix B for definitions. 7Actual quantity limited to remaining sales authority or inventory. 8Excludes production of tantalum contained in tin slags. 9See Appendix C for resource/reserve definitions and information concerning data sources. 10Includes Burundi, Congo (Kinshasa), Ethiopia, Somalia, Uganda, and Zimbabwe.
U.S. Geological Survey, Mineral Commodity Summaries, January 2012

164
TELLURIUM
(Data in metric tons of tellurium content unless otherwise noted) Domestic Production and Use
: In the United States, one firm produced commercial-grade tellurium at its refinery complex in Texas, mainly from copper anode slimes but also from lead refinery skimmings, both of domestic origin. Primary and intermediate producers further refined domestic and imported commercial-grade metal and tellurium dioxide, producing tellurium and tellurium compounds in high-purity form for specialty applications.
Tellurium’s major use is as an alloying additive in steel to improve machining characteristics. It is also used as a minor additive in copper alloys to improve machinability without reducing conductivity; in lead alloys to improve resistance to vibration and fatigue; in cast iron to help control the depth of chill; and in malleable iron as a carbide stabilizer. It is used in the chemical industry as a vulcanizing agent and accelerator in the processing of rubber, and as a component of catalysts for synthetic fiber production. Tellurium was increasingly used in the production of cadmium-tellurium-based solar cells. Production of bismuth-telluride thermoelectric cooling devices decreased owing to the reduced manufacturing of automobiles containing seat-cooling systems. Other uses include those in photoreceptor and thermoelectric electronic devices, other thermal cooling devices, as an ingredient in blasting caps, and as a pigment to produce various colors in glass and ceramics. Salient Statistics—United States: 2007 2008 2009 2010 Production, refinery W W W W W
2011e
Imports for consumption, unwrought, waste and scrap 44 102 84 42 50 Exports 15 50 8 59 55 Consumption, apparent W W W W W Price, dollars per kilogram, 99.95% minimum1 82 211 150 220 360 Stocks, producer, refined, yearend W W W W W Net import reliance2 as a percentage of apparent consumption W W W W W Recycling
: For traditional uses, there is little or no old scrap from which to extract secondary tellurium because these uses of tellurium are nearly all dissipative. A very small amount of tellurium is recovered from scrapped selenium-tellurium photoreceptors employed in older plain paper copiers in Europe. Currently, there is a plant in the United States recycling tellurium from cadmium-tellurium-based solar cells; however, most of this is new scrap because cadmium-tellurium-based solar cells are relatively new and have not reached the end of their useful life.
Import Sources (2007–10)
: China, 47%; Canada, 23%; Philippines, 11%; Belgium, 6%; and other, 13%.
Tariff
: Item Number Normal Trade Relations
Tellurium 2804.50.0020 Free. 12-31-11
Depletion Allowance
: 14% (Domestic and foreign).
Government Stockpile
: None.
Prepared by Micheal W. George [(703) 648-4962, [email protected]]

165 TELLURIUM
Events, Trends, and Issues
: In 2011, estimated domestic tellurium production was slightly less than production in 2010. Although detailed information on the world tellurium market was not available, world tellurium consumption was estimated to have increased in 2011. The price of tellurium significantly increased in 2011 because of increased use of tellurium in solar cells.
World Refinery Production and Reserves
: Significant upward revisions were made to global reserves because of an increase in recovery factors. Tellurium reserves in Peru were substantially revised upward because of an increase in copper reserves based on Government reports.
Refinery production Reserves3 2010 United States W W 3,500
2011e
Canada 8 10 800 Japan 51 40 — Peru 30 30 3,600 Russia 34 35 NA Other countries4 NA NA World total (rounded) NA NA 24,000
16,000
World Resources
: The figures shown for reserves include only tellurium contained in copper reserves. These estimates assume that more than one-half of the tellurium contained in unrefined copper anodes is actually recovered. With increased concern for supply of tellurium, companies are investigating other potential sources, such as gold telluride and lead-zinc ores with higher concentrations of tellurium, which are not included in estimated world resources.
More than 90% of tellurium is produced from anode slimes collected from electrolytic copper refining, and the remainder is derived from skimmings at lead refineries and from flue dusts and gases generated during the smelting of bismuth, copper, and lead ores. In copper production, tellurium is recovered only from the electrolytic refining of smelted copper. Increased use of the leaching solvent extraction-electrowinning processes for copper extraction, which does not capture tellurium, has limited the future supply of tellurium supply from certain copper deposit types. Substitutes
: Several materials can replace tellurium in most of its uses, but usually with losses in production efficiency or product characteristics. Bismuth, calcium, lead, phosphorus, selenium, and sulfur can be used in place of tellurium in many free-machining steels. Several of the chemical process reactions catalyzed by tellurium can be carried out with other catalysts or by means of noncatalyzed processes. In rubber compounding, sulfur and/or selenium can act as vulcanization agents in place of tellurium. The selenides of the refractory metals can function as high-temperature, high-vacuum lubricants in place of tellurides. The selenides and sulfides of niobium and tantalum can serve as electrically conducting solid lubricants in place of tellurides of those metals.
The selenium-tellurium photoreceptors used in some xerographic copiers and laser printers have been replaced by organic photoreceptors in newer machines. Amorphous silicon and copper indium diselenide are the two principal competitors to cadmium telluride in photovoltaic power cells. eEstimated. NA Not available. W Withheld to avoid disclosing company proprietary data. — Zero. 1For 2007 through 2009, the price listed was the average price published by Mining Journal for United Kingdom lump and powder, 99.95% tellurium. In 2010 through 2011, the price listed was the average price published by Metal-Pages for 99.95% tellurium. 2Defined as imports – exports + adjustments for Government and industry stock changes. 3Estimates include tellurium contained in copper resources only. See Appendix C for resource/reserve definitions and information concerning data sources. 4In addition to the countries listed, Australia, Belgium, Chile, China, Colombia, Germany, Kazakhstan, Mexico, the Philippines, and Poland produce refined tellurium, but output is not reported, and available information is inadequate for formulation of reliable production estimates.
U.S. Geological Survey, Mineral Commodity Summaries, January 2012

166
THALLIUM
(Data in kilograms of thallium content unless otherwise noted) Domestic Production and Use
: Thallium is a byproduct metal recovered in some countries from flue dusts and residues collected in the smelting of copper, zinc, and lead ores. Although thallium was contained in ores mined or processed in the United States, it has not been recovered domestically since 1981. Consumption of thallium metal and thallium compounds continued for most of its established end uses. These included the use of radioactive thallium isotope 201 for medical purposes in cardiovascular imaging; thallium as an activator (sodium iodide crystal doped with thallium) in gamma radiation detection equipment (scintillometer); thallium-barium-calcium-copper oxide high-temperature superconductor (HTS) used in filters for wireless communications; thallium in lenses, prisms and windows for infrared detection and transmission equipment; thallium-arsenic-selenium crystal filters for light diffraction in acousto-optical measuring devices; and thallium as an alloying component with mercury for low-temperature measurements. Other uses included an additive in glass to increase its refractive index and density, a catalyst for organic compound synthesis, and a component in high-density liquids for sink-float separation of minerals.
Salient Statistics—United States: 2007 2008 2009 2010 Production, mine (1) (1) (1) (1) (1)
2011e
Imports for consumption (gross weight): Unwrought and powders ― 916 1,600 2,000 1,500 Other 901 ― 160 200 250 Total 901 916 1,760 2,200 1,750 Exports (gross weight): Unwrought and powders 155 43 260 45 50 Waste and scrap 190 51 75 55 50 Other 258 153 595 835 600 Total 603 247 930 935 700 Consumptione 300 670 830 1,270 1,050 Price, metal, dollars per kilogram2 4,560 4,900 5,700 5,930 6,000 Net import reliance3 as a percentage of estimated consumption 100 100 100 100 100 Recycling
: None.
Import Sources (2007–10)
: Russia, 63%; Germany, 35%; and Kazakhstan, 2%.
Tariff
: Item Number Normal Trade Relations
Unwrought and powders 8112.51.0000 4.0% ad val. 12-31-11
Waste and scrap 8112.52.0000 Free. Other 8112.59.0000 4.0% ad val. Depletion Allowance
: 14% (Domestic and foreign).
Government Stockpile
: None.
Events, Trends, and Issues
: The price for thallium metal remained high in 2011 as global supply continued to be relatively tight. The average price for high-purity granules and rods increased slightly in 2011 from that in 2010 and has more than tripled since 2005. China continued its policy of eliminating toll trading tax benefits on exports of thallium that began in 2006, thus contributing to tight supply conditions on the world market. In July 2010, China canceled a 5% value-added-tax rebate on exports of many minor metals, including fabricated thallium products. Higher internal demand for many metals has prompted China to begin importing greater quantities of thallium.
In late 2010, an Arizona-based miner acquired 100% ownership of a company that had a licensed exploration and development concession for a mineral-rich property in Sierra Leone, near the Pampana River. The primary mineral commodities of interest were gold and rare metals. Assays conducted by the company in 2010 and 2011 identified commercially exploitable grades of several mineral commodities, including thallium, contained in black sand concentrates. Exploration of the property continued during 2011. Prepared by David E. Guberman [(703) 648-4977, [email protected]]

167 THALLIUM
Beginning in 2009, there was a global shortage of the medical isotope technetium-99, which was widely used by physicians for medical imaging tests owing to its availability, cost, and the superior diagnostic quality of images produced. Two of five isotope-producing nuclear reactors in Canada and the Netherlands were closed for repair work. These reactors accounted for nearly 65% of the world’s supply of technetium-99 in 2008. Technetium-99 has a very short half-life so it needs to be produced on a continual basis and cannot be stockpiled. Following the closure of these two plants, medical care facilities had a difficult time acquiring adequate supplies of technetium-99 and were forced to cancel scans or use alternative types of tests. The thallium isotope 201 was the most common alternative to technetium-99 for use in scans, such as the cardiac-stress test that monitors blood perfusion into heart tissue during vigorous exercise. It was estimated that before the shortage, thallium was used in about 25% of all cardiac-perfusion tests performed in the United States. In response to the shortage of technetium-99, some medical imaging equipment producers increased production of thallium isotope 201 in order to meet anticipated demand. In late 2010, the Chalk River National Research Universal reactor in Eastern Ontario, Canada, was restarted and produced medical isotopes, including technetium-99. During the first three quarters of 2011, leading producers of thallium isotopes reported declines in sales compared with those of the same period in 2010 owing to the renewed availability of technetium-99. Thallium metal and its compounds are highly toxic materials and are strictly controlled to prevent a threat to humans and the environment. Thallium and its compounds can be absorbed into the human body by skin contact, ingestion, or inhalation of dust or fumes. Further information on thallium toxicity can be found in the U.S. Environmental Protection Agency (EPA) Integrated Risk Information System database. Under its national primary drinking water regulations, the EPA has set an enforceable Maximum Contaminant Level for thallium at 2 parts per billion. All public water supplies must abide by these regulations. The EPA continued to conduct studies at its National Risk Management Research Laboratory (NRMRL) to develop and promote technologies that protect and improve human health and the environment. Studies were conducted recently at NRMRL on methods to remove thallium from mine wastewaters. World Mine Production and Reserves Mine production Reserves5
:4
2010 United States (1) (1) 32,000
2011e
Other countries 10,000 10,000 World total (rounded) 10,000 10,000 380,000
350,000
World Resources
: World resources of thallium contained in zinc resources total about 17 million kilograms; most are in Canada, Europe, and the United States. Kazakhstan is believed to be one of the leading global producers of refined thallium. An additional 630 million kilograms is in world coal resources. The average thallium content of the Earth’s crust has been estimated to be 0.7 part per million.
Substitutes
: The apparent leading potential demand for thallium could be in the area of HTS materials, but demand will be based on which HTS formulation has a combination of favorable electrical and physical qualities and is best suited for fabrication. A firm presently using a thallium HTS material in filters for wireless communications is considering using a nonthallium HTS. While research in HTS continues, and thallium is part of that research effort, it is not guaranteed that HTS products will be a large user of thallium in the future.
Although other materials and formulations can substitute for thallium in gamma radiation detection equipment and optics used for infrared detection and transmission, thallium materials are presently superior and more cost effective for these very specialized uses. Nonpoisonous substitutes like tungsten compounds are being marketed as substitutes for thallium in high-density liquids for sink-float separation of minerals. eEstimated. — Zero. 1No reported mine production; flue dust and residues from base-metal smelters, from which thallium metal and compounds may be recovered, are exported to Canada, France, the United Kingdom, and other countries. 2Estimated price of 99.99%-pure granules or rods in 100- to 250-gram or larger lots. 3Defined as imports – exports + adjustments for Government and industry stock changes. Consumption and exports of unwrought thallium were from imported material or from a drawdown in unreported inventories. 4Estimates are based on thallium content of zinc ores. 5See Appendix C for resource/reserve definitions and information concerning data sources.
U.S. Geological Survey, Mineral Commodity Summaries, January 2012

168
THORIUM
(Data in metric tons of thorium oxide (ThO2) equivalent unless otherwise noted) Domestic Production and Use
: The world’s primary source of thorium is the rare-earth and thorium phosphate mineral monazite. In the United States, thorium has been a byproduct of refining monazite for its rare-earth content. Monazite itself is recovered as a byproduct of processing heavy-mineral sands for titanium and zirconium minerals. In 2011, monazite was not recovered domestically as a salable product. Essentially all thorium compounds and alloys consumed by the domestic industry were derived from imports, stocks of previously imported materials, or materials previously shipped from U.S. Government stockpiles. About eight companies processed or fabricated various forms of thorium for nonenergy uses, such as catalysts, high-temperature ceramics, and welding electrodes. Thorium’s use in most products has generally decreased because of its naturally occurring radioactivity. The value of thorium compounds used by the domestic industry was estimated to have increased to $521,000 from $208,000 in 2010.
Salient Statistics—United States: 2007 2008 2009 2010 Production, refinery1 — — — — —
2011e
Imports for consumption: Thorium ore and concentrates (monazite), gross weight — — 26 — 30 Thorium ore and concentrates (monazite), ThO2 content — — 1.82 — 2.1 Thorium compounds (oxide, nitrate, etc.), gross weight2 6.37 0.63 2.24 3.03 8.1 Thorium compounds (oxide, nitrate, etc.), ThO2 content2 4.71 0.47 1.66 2.24 6.0 Exports: Thorium ore and concentrates (monazite), gross weight 1 61 18 1 — Thorium ore and concentrates (monazite), ThO2 content 0.07 4.27 1.26 0.07 — Thorium compounds (oxide, nitrate, etc.), gross weight2 1.63 2.70 4.73 1.50 3.7 Thorium compounds (oxide, nitrate, etc.), ThO2 content2 1.21 2.00 3.51 1.11 2.7 Consumption, apparent2 3.51 (3) (3) 1.13 3.3 Price, yearend, dollars per kilogram: Nitrate, welding-grade4 5.46 5.46 5.46 5.46 5.46 Nitrate, mantle-grade5 27.00 27.00 27.00 27.00 27.00 Oxide, yearend, 99.99% purity6 200.00 252.00 252.00 252.00 252.00 Net import reliance7 as a percentage of apparent consumption 100 100 100 100 100 Recycling
: None.
Import Sources (2007–10)
: Monazite: United Kingdom, 100%. Thorium compounds: France, 61%; India, 30%; Canada, 8%; and United Kingdom, 1%.
Tariff
: Item Number Normal Trade Relations
Thorium ores and concentrates (monazite) 2612.20.0000 Free. 12-31-11
Thorium compounds 2844.30.1000 5.5% ad val. Depletion Allowance
: Monazite, 22% on thorium content, and 14% on rare-earth and yttrium content (Domestic); 14% (Foreign).
Government Stockpile
: None.
Events, Trends, and Issues
developed or new technology, such as a nonproliferative nuclear fuel, creates renewed demand.
: Domestic mine production of thorium-bearing monazite ceased at the end of 1994 as world demand for ores containing naturally occurring radioactive thorium declined. Imports and existing stocks supplied essentially all thorium consumed in the United States in 2011. Domestic demand for thorium alloys, compounds, metals, and ores has exhibited a long-term declining trend. There were exports and domestic shipments of thorium material in the United States in 2011, according to the U.S. Census Bureau and the U.S. Geological Survey, respectively. In 2011, unreported thorium consumption was believed to be primarily in catalysts, microwave tubes, and optical equipment and was estimated to have increased. Increased costs to monitor and dispose of thorium have caused domestic processors to switch to thorium-free materials. Real and potential costs related to compliance with State and Federal regulations, proper disposal, and monitoring of thorium’s radioactivity have limited its commercial value. It is likely that thorium’s use will continue to decline unless a low-cost disposal process is
Prepared by Daniel J. Cordier [(703) 648-7723, [email protected]]

169 THORIUM
On the basis of data through August 2011, the average value of imported thorium compounds decreased to $64.29 per kilogram from the 2010 average of $68.68 per kilogram (gross weight). The average value of exported thorium compounds decreased to $186.78 per kilogram based on data through August 2011, compared with $403.68 for 2010. World Refinery Production and Reserves
: The thorium reserve estimate for Australia has been revised based on new information from that country.
Refinery production8 Reserves9 2010 United States — — 440,000
2011
Australia — — 10410,000 Brazil NA NA 16,000 Canada NA NA 100,000 India NA NA 290,000 Malaysia — — 4,500 South Africa — — 35,000 Other countries NA NA World total NA NA 1,400,000
90,000
Reserves are contained primarily in the rare-earth ore mineral monazite and the thorium mineral thorite. Without demand for the rare earths, monazite would probably not be recovered for its thorium content. Other ore minerals with higher thorium contents, such as thorite, would be more likely sources if demand significantly increased. New demand is possible with the development and testing of thorium nuclear fuel in Russia and India. Reserves exist primarily in recent and ancient placer deposits and in thorium vein deposits such as those in the Lemhi Pass area of Idaho. Lesser quantities of thorium-bearing monazite and thorite reserves occur in certain iron ore deposits and carbonatites. Thorium enrichment is known in iron (Fe)-REE-thorium-apatite (FRETA) deposits, as found in the deposits at Mineville, NY; Pea Ridge, MO; and Scrub Oaks, NJ. World Resources
: Thorium resources occur in geologic provinces similar to those that contain reserves. The leading share is contained in placer deposits. Resources of more than 500,000 tons are contained in placer, vein, and carbonatite deposits. Disseminated deposits in various other alkaline igneous rocks contain additional resources of more than 2 million tons. Large thorium resources are found in Australia, Brazil, Canada, Greenland (Denmark), India, South Africa, and the United States.
Substitutes
: Nonradioactive substitutes have been developed for many applications of thorium. Yttrium compounds have replaced thorium compounds in incandescent lamp mantles. A magnesium alloy containing lanthanides, yttrium, and zirconium can substitute for magnesium-thorium alloys in aerospace applications.
eEstimated. NA Not available. — Zero. 1All domestically consumed thorium was derived from imported materials. 2Thorium compound imports from the United Kingdom were believed to be material for nuclear fuel reprocessing or waste and were not used in calculating domestic apparent consumption. Thorium compound exports to Mexico were believed to be waste material shipped for disposal and were not used in calculating domestic apparent consumption. Apparent consumption calculation excludes ore and concentrates. 3Apparent consumption calculations in 2008 and 2009 result in negative numbers. 4Source: Defense Logistics Agency, DLA Strategic Materials; based on sales from the National Defense Stockpile in 1997. 5Source: Rhodia Canada, Inc., and Rhodia Electronics and Catalysis, Inc., f.o.b. port of entry, duty paid, ThO2 basis. 6Source: Rhodia Electronics and Catalysis, Inc., 1- to 950-kilogram quantities, f.o.b. port of entry, duty paid. In 2007, Rhodia ceased sales of its 99.9% purity thorium oxide. 7Defined as imports – exports + adjustments for Government and industry stock changes. 8Estimates, based on thorium contents of rare-earth ores. 9See Appendix C for resource/reserve definitions and information concerning data sources. 10Includes thorium contained in mineralized sands.
U.S. Geological Survey, Mineral Commodity Summaries, January 2012

170
TIN
(Data in metric tons of tin content unless otherwise noted) Domestic Production and Use
: Tin has not been mined or smelted in the United States since 1993 and 1989, respectively. Twenty-five firms used about 91% of the primary tin consumed domestically in 2011. The major uses were as follows: electrical, 29%; cans and containers, 18%; construction, 13%; transportation, 12%; and other, 28%. On the basis of the average New York composite price, the estimated values of some critical items in 2011 were as follows: primary metal consumed, $980 million; imports for consumption, refined tin, $1.36 billion; and secondary production (old scrap), $369 million.
Salient Statistics—United States: 2007 2008 2009 2010 Production, secondary:
2011e
Old scrap 12,200 11,700 11,100 10,900 10,200 New scrap 2,800 2,100 2,310 2,700 2,300 Imports for consumption, refined tin 34,600 36,300 33,000 35,300 37,500 Exports, refined tin 6,410 9,800 3,170 5,630 6,200 Shipments from Government stockpile excesses 4,540 60 — — — Consumption, reported: Primary 23,700 23,100 24,700 25,200 27,100 Secondary 7,490 6,250 7,750 4,820 5,900 Consumption, apparent 43,700 38,800 42,400 41,200 42,100 Price, average, cents per pound: New York market 680 865 642 954 1,260 New York composite 899 1,130 837 1,240 1,640 London 659 837 615 925 1,150 Kuala Lumpur 658 838 609 922 1,160 Stocks, consumer and dealer, yearend 9,100 8,560 7,070 6,410 5,800 Net import reliance1 as a percentage of apparent consumption 72 70 74 74 76 Recycling
: About 12,500 tons of tin from old and new scrap was recycled in 2011. Of this, about 10,000 tons was recovered from old scrap at 2 detinning plants and 78 secondary nonferrous metal processing plants.
Import Sources (2007–10)
: Peru, 55%; Bolivia, 16%; Indonesia, 9%; China, 6%; and other, 14%.
Tariff
: Most major imports of tin, including unwrought metal, waste and scrap, and unwrought tin alloys, enter the United States duty free.
Depletion Allowance
: 22% (Domestic), 14% (Foreign).
Government Stockpile
: On June 4, 2008, the Office of the Undersecretary of Defense suspended tin sales pending further research as a result of the Defense Logistics Agency, DLA Strategic Materials’ reconfiguration. As a result of this suspension, the DLA Strategic Materials made no tin sales in calendar year 2011. The fiscal year 2011 Annual Materials Plan was reduced to zero. The DLA Strategic Materials inventory was stored in the Hammond, IN, depot and was all “long horn” brand tin. When tin was last offered for sale, it was available via the basic ordering agreement and negotiated sales procedures.
Stockpile Status—9-30-112 Uncommitted Authorized Disposal plan Disposals Material inventory for disposal FY 2011 FY 2011 Pig tin 4,020 — — — Prepared by James F. Carlin, Jr. [(703) 648-4985, [email protected]]

171 TIN
Events, Trends, and Issues
: Apparent consumption of tin in the United States increased slightly in 2011 compared with that of 2010. The monthly average composite price of tin rose substantially during the year. Higher prices in 2011 were attributed to lower production in key producing countries, moderately higher world tin consumption, and to investment fund buying and selling.
Developments continued in major tin-consuming countries to move to new lead-free solders that usually contain greater amounts of tin than do leaded solders. In response to higher tin prices in 2011, tin producers opened new tin mines and tin smelters and expanded existing operations, including ones in Australia, Bolivia, Canada, and Thailand. Tin exploration activity increased, especially in Australia and Canada. In Bolivia, old tin tailings were being evaluated for reclamation of tin. China continued as the world’s leading tin producer from both mines and smelters but experienced sporadic difficulty in obtaining feedstock for its smelters. Indonesia, the world’s second leading tin producer from both mines and smelters, continued to experience production difficulties, some related to a Government shutdown of possibly illegal production sites. World Mine Production and Reserves
: Reserve figures were revised for Peru based on new information from official Government sources in that country.
Mine production Reserves3 2010 United States — — —
2011e
Australia 18,600 19,500 180,000 Bolivia 20,200 20,700 400,000 Brazil 11,000 12,000 590,000 China 120,000 110,000 1,500,000 Congo (Kinshasa) 6,700 5,700 NA Indonesia 56,000 51,000 800,000 Malaysia 1,770 2,000 250,000 Peru 33,800 34,600 310,000 Portugal 30 100 70,000 Russia 1,100 1,000 350,000 Thailand 150 100 170,000 Vietnam 5,500 6,000 NA Other countries 2,000 2,000 World total (rounded) 277,000 270,000 4,800,000
180,000
World Resources
: U.S. resources of tin, primarily in Alaska, were insignificant compared with those of the rest of the world. World resources, principally in western Africa, southeastern Asia, Australia, Bolivia, Brazil, China, and Russia, are sufficient to sustain recent annual production rates well into the future.
Substitutes
: Aluminum, glass, paper, plastic, or tin-free steel substitute for tin in cans and containers. Other materials that substitute for tin are epoxy resins for solder; aluminum alloys, copper-base alloys, and plastics for bronze; plastics for bearing metals that contain tin; and compounds of lead and sodium for some tin chemicals.
eEstimated. NA Not available. — Zero. 1Defined as imports - exports + adjustments for Government and industry stock changes. 2See Appendix B for definitions. 3See Appendix C for resource/reserve definitions and information concerning data sources.
U.S. Geological Survey, Mineral Commodity Summaries, January 2012

172
TITANIUM AND TITANIUM DIOXIDE1
(Data in metric tons unless otherwise noted) Domestic Production and Use
: Titanium sponge metal was produced by three operations in Nevada and Utah. Ingot was produced by 10 operations in 8 States. Numerous firms consumed ingot to produce wrought products and castings. In 2011, an estimated 66% of the titanium metal was used in aerospace applications. The remaining 34% was used in armor, chemical processing, marine, medical, power generation, sporting goods, and other nonaerospace applications. The value of sponge metal consumed was about $515 million, assuming an average selling price of $10.50 per kilogram.
In 2011, titanium dioxide (TiO2) pigment, which was valued at about $3.8 billion, was produced by four companies at six facilities in five States. The estimated use of TiO2 pigment by end use was paint (includes lacquers and varnishes), 57%; plastic, 27%; paper, 10%; and other, 6%. Other uses of TiO2 included catalysts, ceramics, coated fabrics and textiles, floor coverings, printing ink, and roofing granules. Salient Statistics—United States: 2007 2008 2009 2010 Titanium sponge metal:
2011e
Production W W W W W Imports for consumption 25,900 23,900 16,600 20,500 32,000 Exports 2,000 2,370 820 293 200 Consumption, reported 33,700 W W 34,900 49,000 Price, dollars per kilogram, yearend 14.76 15.64 15.58 10.74 10.30 Stocks, industry yearende 7,820 14,200 15,300 10,500 8,500 Employment, numbere 400 350 300 300 300 Net import reliance2 as a percentage of reported consumption 72 W W 72 69 Titanium dioxide: Production 1,440,000 1,350,000 1,230,000 1,320,000 1,420,000 Imports for consumption 221,000 183,000 175,000 204,000 180,000 Exports 682,000 733,000 649,000 758,000 815,000 Consumption, apparent 979,000 800,000 757,000 767,000 785,000 Producer price index, yearend 162 170 164 194 252 Stocks, producer, yearend NA NA NA NA NA Employment, numbere 4,300 4,200 3,800 3,400 3,400 Net import reliance2 as a percentage of apparent consumption E E E E E Recycling
: New scrap metal recycled by the titanium industry totaled about 27,000 tons in 2011. Estimated use of titanium as scrap and ferrotitanium by the steel industry was about 10,000 tons; by the superalloy industry, 1,000 tons; and in other industries, 1,000 tons. Old scrap reclaimed totaled about 1,000 tons.
Import Sources (2007–10)
: Sponge metal: Kazakhstan, 51%; Japan, 37%; China; 5%; Russia, 4%; and other, 3%. Titanium dioxide pigment: Canada, 41%; China, 13%; Germany, 6%; Finland, 6%; and other, 34%.
Tariff
: Item Number Normal Trade Relations
Titanium oxides (unfinished TiO2 pigments) 2823.00.0000 5.5% ad val. 12-31-11
TiO2 pigments, 80% or more TiO2 3206.11.0000 6.0% ad val. TiO2 pigments, other 3206.19.0000 6.0% ad val. Ferrotitanium and ferrosilicon titanium 7202.91.0000 3.7% ad val. Unwrought titanium metal 8108.20.0000 15.0% ad val. Titanium waste and scrap metal 8108.30.0000 Free. Other titanium metal articles 8108.90.3000 5.5% ad val. Wrought titanium metal 8108.90.6000 15.0% ad val. Depletion Allowance
: Not applicable.
Government Stockpile
: None.
Prepared by Joseph Gambogi [(703) 648-7718, [email protected]]

173 TITANIUM AND TITANIUM DIOXIDE
Events, Trends, and Issues
: Because TiO2 pigment is used in paint, paper, and plastics, consumption is tied to the Gross Domestic Product (GDP). In June, the World Bank forecast domestic (2.5%) and global (4.3%) GDP growth in 2011. Increased consumption and production of TiO2 pigment was led by China. To meet rising domestic and global TiO2 consumption, domestic production of TiO2 pigment increased to 1.4 million tons, an 8% increase compared with that in 2010.
In 2011, global consumption of titanium metal in commercial aerospace and industrial markets rose significantly. Increasing demand and reduced inventories brought about by production curtailments made in 2009 and 2010 caused several metal producers to increase titanium sponge production capacity. China’s titanium metal and TiO2 pigment production capacity grew most significantly. In the United States, new titanium production capacity neared completion in Ottawa, IL. Instead of sponge produced by magnesium reduction via the Kroll process, the plant produced titanium metal powder by sodium reduction by the Armstrong process. Production capacity was expected to be 2,000 tons per year by yearend 2011. At least three other Kroll-alternative titanium technologies were in the pilot-plant stage of development. Japan and Kazakhstan were the leading U.S. import sources of titanium sponge in 2011, and China emerged as a major import source for the first time. Increased imports of titanium sponge were led by China and Japan. World Sponge Metal Production and Sponge and Pigment Capacity
: Capacity estimates were revised based on new information from industry reports.
Sponge production Capacity 20113 2010 2011e
United States W W 24,000 1,470,000 Sponge Pigment
Australia — — — 281,000 Belgium — — — 74,000 Canada — — — 90,000 Chinae 57,800 60,000 114,000 2,000,000 Finland — — — 130,000 France — — — 125,000 Germany — — — 440,000 Italy — — — 80,000 Japane 31,600 56,000 62,200 309,000 Kazakhstane 14,500 20,700 26,000 1,000 Mexico — — — 130,000 Russiae 25,800 40,000 46,500 20,000 Spain — — — 80,000 Ukrainee 7,400 9,000 10,000 120,000 United Kingdom — — — 300,000 Other countries — — — World total (rounded) 4137,000 4186,000 283,000 6,550,000
900,000
World Resources
:5 Resources and reserves of titanium minerals are discussed in Titanium Mineral Concentrates. The commercial feedstock sources for titanium are ilmenite, leucoxene, rutile, slag, and synthetic rutile.
Substitutes
: There are few materials that possess titanium metal’s strength-to-weight ratio and corrosion resistance. In high-strength applications, titanium competes with aluminum, composites, intermetallics, steel, and superalloys. Aluminum, nickel, specialty steels, and zirconium alloys may be substituted for titanium for applications that require corrosion resistance. Ground calcium carbonate, precipitated calcium carbonate, kaolin, and talc compete with titanium dioxide as a white pigment.
eEstimated. E Net exporter. NA Not available. W Withheld to avoid disclosing company proprietary data. — Zero. 1See also Titanium Mineral Concentrates. 2Defined as imports – exports + adjustments for Government and industry stock changes. 3Yearend operating capacity. 4Excludes U.S. production. 5See Appendix C for resource/reserve definitions and information concerning data sources.
U.S. Geological Survey, Mineral Commodity Summaries, January 2012

174
TITANIUM MINERAL CONCENTRATES1
(Data in thousand metric tons of contained TiO2 unless otherwise noted) Domestic Production and Use
: Two firms produced ilmenite and rutile concentrates from surface-mining operations in Florida and Virginia. The value of titanium mineral concentrates consumed in the United States in 2011 was about $650 million. Zircon was a coproduct of mining from ilmenite and rutile deposits. About 95% of titanium mineral concentrates was consumed by domestic titanium dioxide (TiO2) pigment producers. The remaining 5% was used in welding rod coatings and for manufacturing carbides, chemicals, and metal.
Salient Statistics—United States: 2007 2008 2009 2010 Production2 (rounded) 300 200 200 200 300
2011e
Imports for consumption 1,220 1,110 927 958 1,100 Exports,e all forms 6 7 9 12 20 Consumption, estimated 1,600 1,440 1,360 1,460 1,580 Price, dollars per metric ton, yearend: Ilmenite, bulk, minimum 54% TiO2, f.o.b. Australia 80 111 73 75 200 Rutile, bulk, minimum 95% TiO2, f.o.b. Australia 488 525 533 540 1,400 Slag, 80%–95% TiO2
3 418–457 393–407 401–439 367–433 550–650 Stocks, mine, consumer, yearend NA NA NA NA NA Employment, mine and mill, numbere 225 144 194 178 195 Net import reliance4 as a percentage of estimated consumption 76 78 68 65 68 Recycling
: None.
Import Sources (2007–10)
: South Africa, 44%; Australia, 30%; Canada, 14%; Mozambique, 6%; and other, 6%.
Tariff
: Item Number Normal Trade Relations
Synthetic rutile 2614.00.3000 Free. 12-31-11
Ilmenite and ilmenite sand 2614.00.6020 Free. Rutile concentrate 2614.00.6040 Free. Titanium slag 2620.99.5000 Free. Depletion Allowance
: Ilmenite and rutile; 22% (Domestic), 14% (Foreign).
Government Stockpile
: None.
Events, Trends, and Issues
: Consumption of titanium mineral concentrates is tied to consumption of TiO2 pigments primarily used in paint, paper, and plastics. Owing to increased production of TiO2 pigment, domestic consumption of titanium mineral concentrates was estimated to have increased by 8% in 2011 compared with that in 2010. Increased global consumption of titanium minerals was led by China.
Although world mine production increased in 2011, a shortage of titanium mineral concentrates caused prices for titanium mineral concentrates to rise significantly. Rising costs for titanium minerals has encouraged vertical integration within the mineral and pigment industries. In Mozambique, plans were underway to expand mine production capacity at the Moma mining operation to 1.2 million tons per year of ilmenite and 14,000 tons per year of rutile, a 50% increase compared with the existing design capacity. In Saudi Arabia, plans were underway to construct a titanium slag plant with a production capacity of 500,000 tons per year. South African production of slag in 2011 was mitigated by a burn through at a slag operation. In Richards Bay, KwaZulu-Natal, South Africa, a tailings treatment plant was commissioned. Heavy-mineral concentrates, including ilmenite and rutile, were to be recovered from about 30 years of accumulated mine tailings. In Mtunzini, the Fairbreeze deposit was once again under development, with 500,000 tons per year of ilmenite and 25,000 tons per year of rutile production capacity scheduled for startup in 2013. In the Ukraine, the Birzulivske Mine was being commissioned with a production capacity of 185,000 tons per year; mine production capacity may rise to 300,000 tons per year in 2012. In Vietnam, Government policies were being developed to stop ilmenite exports, control illegal mining, and promote the development of upgraded products. Although a ban on exports was approved in 2008, it has been repeatedly delayed to help mining companies that have been hurt by global economic conditions. The export ban was once again delayed until yearend 2011. Prepared by Joseph Gambogi [(703) 648-7718, [email protected]]
175 TITANIUM MINERAL CONCENTRATES
World Mine Production and Reserves Mine production Reserves5
:
2010 Ilmenite:
2011e
United States2 6200 6300 2,000 Australia 991 900 100,000 Brazil 45 45 43,000 Canada7 754 700 31,000 China 550 500 200,000 India 540 550 85,000 Madagascar 172 280 40,000 Mozambique 407 510 16,000 Norway7 300 300 37,000 South Africa7 952 1,030 63,000 Sri Lanka 32 60 NA Ukraine 300 300 5,900 Vietnam 485 490 1,600 Other countries 37 37 World total (ilmenite, rounded) 5,800 6,000 650,000
26,000
Rutile: United States (8) (8) (8) Australia 361 400 18,000 Brazil 3 3 1,200 India 24 24 7,400 Madagascar 5 8 NA Malaysia 7 8 NA Mozambique 4 6 480 Sierra Leone 65 60 3,800 South Africa 145 131 8,300 Sri Lanka 2 2 NA Ukraine 57 57 2,500 Other countries — — World total (rutile, rounded) 8670 8700 42,000
400
World total (ilmenite and rutile, rounded) 6,400 6,700 690,000 World Resources
: Ilmenite accounts for about 90% of the world’s consumption of titanium minerals. World resources of anatase, ilmenite, and rutile total more than 2 billion tons.
Substitutes
: Ilmenite, leucoxene, rutile, slag, and synthetic rutile compete as feedstock sources for producing TiO2 pigment, titanium metal, and welding-rod coatings.
eEstimated. NA Not available. — Zero. 1See also Titanium and Titanium Dioxide. 2Rounded to one significant digit to avoid disclosing company proprietary data. 3Landed duty-paid value based on U.S. imports for consumption. 4Defined as imports – exports + adjustments for Government and industry stock changes. 5See Appendix C for resource/reserve definitions and information concerning data sources. 6Includes rutile. 7Mine production is primarily used to produce titaniferous slag. 8U.S. rutile production and reserve data are included with ilmenite.
U.S. Geological Survey, Mineral Commodity Summaries, January 2012

176
TUNGSTEN
(Data in metric tons of tungsten content unless otherwise noted) Domestic Production and Use
: One mine in California produced tungsten concentrates in 2011. Approximately eight companies in the United States processed tungsten concentrates, ammonium paratungstate, tungsten oxide, and/or scrap to make tungsten powder, tungsten carbide powder, and/or tungsten chemicals. More than 50 industrial consumers were surveyed on a monthly or annual basis. Data reported by these consumers indicated that more than one-half of the tungsten consumed in the United States was used in cemented carbide parts for cutting and wear-resistant materials, primarily in the construction, metalworking, mining, and oil- and gas-drilling industries. The remaining tungsten was consumed to make tungsten heavy alloys for applications requiring high density; electrodes, filaments, wires, and other components for electrical, electronic, heating, lighting, and welding applications; steels, superalloys, and wear-resistant alloys; and chemicals for various applications. The estimated value of apparent consumption in 2011 was $980 million.
Salient Statistics—United States: 2007 2008 2009 2010 Production:
2011e
Mine W W W W W Secondary 4,330 4,790 3,550 5,880 10,000 Imports for consumption: Concentrate 3,880 3,990 3,590 2,740 3,800 Other forms 9,050 9,060 6,410 9,690 9,300 Exports: Concentrate 109 496 38 276 50 Other forms 5,950 5,480 2,730 4,350 6,900 Government stockpile shipments: Concentrate 1,740 1,470 688 2,060 1,200 Other forms 31 51 12 (1) 50 Consumption: Reported, concentrate W W W 4,840 W Apparent,2,3 all forms 13,300 13,800 11,600 15,600 18,200 Price, concentrate, dollars per mtu WO3,4 average: U.S. spot market, Platts Metals Week 189 184 151 183 250 European market, Metal Bulletin 165 164 150 150 150 Stocks, industry, yearend: Concentrate W W W W W Other forms 1,970 2,240 2,210 2,500 2,800 Net import reliance5 as a percentage of apparent consumption 67 60 68 63 36 Recycling
: In 2011, the tungsten contained in scrap consumed by processors and end users represented approximately 55% of apparent consumption of tungsten in all forms.
Import Sources (2007–10)
: Tungsten contained in ores and concentrates, intermediate and primary products, wrought and unwrought tungsten, and waste and scrap: China, 44%; Bolivia, 8%; Canada, 8%; Germany, 7%; and other, 33%.
Tariff
: Item Number Normal Trade Relations6
Ore 2611.00.3000 Free. 12-31-11
Concentrate 2611.00.6000 37.5¢/kg tungsten content. Tungsten oxide 2825.90.3000 5.5% ad val. Ammonium tungstate 2841.80.0010 5.5% ad val. Tungsten carbide 2849.90.3000 5.5% ad val. Ferrotungsten 7202.80.0000 5.6% ad val. Tungsten powders 8101.10.0000 7.0% ad val. Depletion Allowance
: 22% (Domestic), 14% (Foreign).
Prepared by Kim B. Shedd [(703) 648-4974, [email protected]]

177 TUNGSTEN
Government Stockpile
Stockpile Status—9-30-117 :
Uncommitted Authorized Disposal plan Disposals Material inventory for disposal FY 2011 FY 2011 Metal powder 160 160 136 11 Ores and concentrates 15,800 15,800 3,630 1,180 Events, Trends, and Issues
: World tungsten supply is dominated by Chinese production and exports. China’s Government regulates its tungsten industry by limiting the number of exploration, mining, and export licenses; limiting or forbidding foreign investment; imposing constraints on mining and processing; establishing quotas on production and exports; adjusting export quotas to favor value-added downstream materials and products; and imposing export taxes on tungsten materials. China is the world’s largest tungsten consumer, and since 2008 the amount of tungsten consumed domestically has exceeded the amount exported. To conserve its resources and meet increasing domestic demand, the Chinese Government was expected to continue to limit tungsten production and exports and increase tungsten imports. Scrap was also an important source of tungsten raw material in China.
In 2011, Chinese domestic consumption continued to rise, U.S. apparent consumption increased, and Japanese imports were expected to be similar to those of 2010. Tight supplies of tungsten concentrates in China, combined with strong demand, resulted in higher prices for tungsten concentrates in China and the United States. Prices of such downstream products as ferrotungsten and ammonium paratungstate were significantly higher in 2011 compared with those of 2010. Estimated U.S. net import reliance for tungsten decreased in 2011 compared with net import reliance for recent years owing to a significant increase in estimated scrap consumption (secondary production). World Mine Production and Reserves
Mine production Reserves8
: Reserves for “Other countries” was revised upward based on company and Government data.
2010 United States W W 140,000
2011e
Austria 1,000 1,100 10,000 Bolivia 1,200 1,200 53,000 Canada 420 2,000 120,000 China 59,000 60,000 1,900,000 Portugal 1,200 1,300 4,200 Russia 2,800 3,100 250,000 Other countries 3,200 3,400 World total (rounded) 368,800 372,000 3,100,000
600,000
World Resources
: World tungsten resources are geographically widespread. China ranks first in the world in terms of tungsten resources and reserves and has some of the largest deposits. Canada, Kazakhstan, Russia, and the United States also have significant tungsten resources.
Substitutes
: Potential substitutes for cemented tungsten carbides include cemented carbides based on molybdenum carbide and titanium carbide, ceramics, ceramic-metallic composites (cermets), and tool steels. Potential substitutes for other applications are as follows: molybdenum for certain tungsten mill products; molybdenum steels for tungsten steels; lighting based on carbon nanotube filaments, induction technology, and light-emitting diodes for lighting based on tungsten electrodes or filaments; depleted uranium or lead for tungsten or tungsten alloys in applications requiring high-density or the ability to shield radiation; and depleted uranium alloys or hardened steel for cemented tungsten carbides or tungsten alloys in armor-piercing projectiles. In some applications, substitution would result in increased cost or a loss in product performance.
eEstimated. W Withheld to avoid disclosing company proprietary data. 1Less than one-half unit. 2The sum of U.S. net import reliance and secondary production, as estimated from scrap consumption. 3Excludes U.S. mine production. 4A metric ton unit (mtu) of tungsten trioxide (WO3) contains 7.93 kilograms of tungsten. 5Defined as imports – exports + adjustments for Government and industry stock changes. 6No tariff for Canada and Mexico. Tariffs for other countries for some items may be eliminated under special trade agreements. 7See Appendix B for definitions. 8See Appendix C for resource/reserve definitions and information concerning data sources.
U.S. Geological Survey, Mineral Commodity Summaries, January 2012

178
VANADIUM
(Data in metric tons of vanadium content unless otherwise noted) Domestic Production and Use
: Seven U.S. firms that comprise most of the domestic vanadium industry produced ferrovanadium, vanadium pentoxide, vanadium metal, and vanadium-bearing chemicals or specialty alloys by processing materials such as petroleum residues, spent catalysts, utility ash, and vanadium-bearing pig iron slag. Metallurgical use, primarily as an alloying agent for iron and steel, accounted for about 95% of the domestic vanadium consumption in 2010. Of the other uses for vanadium, the major nonmetallurgical use was in catalysts for the production of maleic anhydride and sulfuric acid.
Salient Statistics—United States: 2007 2008 2009 2010 Production, mine, mill1 — W W W W
2011e
Imports for consumption: Ferrovanadium 2,220 2,800 353 1,340 1,000 Vanadium pentoxide, anhydride 2,390 3,700 1,120 4,000 2,400 Oxides and hydroxides, other 42 144 25 167 650 Aluminum-vanadium master alloys (gross weight) 1,110 618 282 21,200 800 Ash and residues 1,000 1,040 791 521 900 Sulfates 80 2 16 46 40 Vanadates 211 187 214 158 140 Vanadium metal, including waste and scrap 4 5 22 10 30 Exports: Ferrovanadium 206 452 672 611 300 Vanadium pentoxide, anhydride 327 249 401 140 100 Oxides and hydroxides, other 626 1,040 506 1,100 700 Aluminum-vanadium master alloys (gross weight)2 1,700 1,390 447 1,190 900 Vanadium metal, including waste and scrap 49 57 23 21 52 Consumption: Apparent 4,160 5,820 1,040 35,000 35,000 Reported 4,970 5,170 4,690 5,030 5,000 Price, average, dollars per pound V2O5 7.40 12.92 5.43 6.50 6.80 Stocks, consumer, yearend 324 335 295 248 190 Net import reliance4 as a percentage of apparent consumption 100 91 78 80 80 Recycling
: Some tool steel scrap was recycled primarily for its vanadium content. The vanadium content of other recycled steels was lost to slag during processing and was not recovered. Vanadium recycled from spent chemical process catalysts was significant and may comprise as much as 40% of total supply.
Import Sources (2007–10)
: Ferrovanadium: Republic of Korea, 45%; Canada, 26%; Austria, 15%; Czech Republic, 12%; and other, 2%. Vanadium pentoxide: Russia, 46%; South Africa, 33%; China, 20%; and other, 1%.
Tariff
: Ash, residues, slag, and waste and scrap enter duty-free.
Item Number Normal Trade Relations Vanadium pentoxide anhydride 2825.30.0010 5.5% ad val.
12-31-11
Vanadium oxides and hydroxides, other 2825.30.0050 5.5% ad val. Vanadates 2841.90.1000 5.5% ad val. Ferrovanadium 7202.92.0000 4.2% ad val. Aluminum-vanadium master alloys 7601.20.9030 Free. Depletion Allowance
: 22% (Domestic), 14% (Foreign).
Government Stockpile
: None.
Prepared by Désirée E. Polyak [(703) 648-4909, [email protected]]

179 VANADIUM
Events, Trends, and Issues
: U.S. apparent consumption of vanadium in 2011 decreased by 14% from its 2010 level; however, it was still almost four times higher than its level in 2009. Apparent consumption of vanadium declined dramatically in 2009 from that of 2008 owing to the global economic recession in 2009. Among the major uses for vanadium, production of carbon, full-alloy, and high-strength, low-alloy steels accounted for 15%, 45%, and 34% of domestic consumption, respectively. U.S. imports for consumption of vanadium in 2011 decreased 16% from those of the previous year. U.S. exports decreased 33% from those of the previous year. In 2011, U.S. steel production was expected to increase from that of 2010. Given the increase in steel demand, especially in China, it appears likely that, in the near term, vanadium demand will be strong.
Vanadium pentoxide (V2O5) prices continued to slowly increase to a year-to-date high of $7.41 per pound of V2O5 in March 2011 before decreasing again in April. In August 2011, V2O5 prices averaged $6.65 per pound of V2O5, slightly more than average V2O5 prices in August 2010. Ferrovanadium (FeV) prices continued to slowly increase to a year-to-date high of $16.00 per pound of FeV in August 2011 before decreasing again in September. In September 2011, FeV prices averaged $14.95 per pound of FeV, slightly less than average FeV prices in September 2010. World Mine Production and Reserves Mine production Reserves5
:
2010 2011e
United States W W 45 (thousand metric tons)
China 22,000 23,000 5,100 Russia 15,000 15,000 5,000 South Africa 19,000 20,000 3,500 Other countries 1,600 1,500 World total (rounded) 57,600 60,000 14,000
NA
World Resources
: World resources of vanadium exceed 63 million tons. Vanadium occurs in deposits of phosphate rock, titaniferous magnetite, and uraniferous sandstone and siltstone, in which it constitutes less than 2% of the host rock. Significant amounts are also present in bauxite and carboniferous materials, such as coal, crude oil, oil shale, and tar sands. Because vanadium is usually recovered as a byproduct or coproduct, demonstrated world resources of the element are not fully indicative of available supplies. While domestic resources and secondary recovery are adequate to supply a large portion of domestic needs, a substantial part of U.S. demand is currently met by foreign material.
Substitutes
: Steels containing various combinations of other alloying elements can be substituted for steels containing vanadium. Certain metals, such as manganese, molybdenum, niobium (columbium), titanium, and tungsten, are to some degree interchangeable with vanadium as alloying elements in steel. Platinum and nickel can replace vanadium compounds as catalysts in some chemical processes. There is currently no acceptable substitute for vanadium in aerospace titanium alloys.
eEstimated. NA Not available. W Withheld to avoid disclosing company proprietary data; not included in total. — Zero. 1Domestic vanadium mine and mill production did not occur from 1999–2007. In 2008, production commenced. 2Adjustments made by U.S. Geological Survey. 3Rounded to one significant figure to avoid disclosing company proprietary information. 4Defined as imports – exports + adjustments for Government and industry stock changes. 5See Appendix C for resource/reserve definitions and information concerning data sources.
U.S. Geological Survey, Mineral Commodity Summaries, January 2012

180
VERMICULITE
(Data in thousand metric tons unless otherwise noted) Domestic Production and Use
: Two companies with mining and processing facilities in South Carolina and Virginia produced vermiculite concentrate. Most of the vermiculite concentrate was shipped to 16 exfoliating plants in 10 States. The end uses for exfoliated vermiculite were estimated to be lightweight agriculture/horticulture, 40%; concrete aggregates (including cement premixes, concrete, and plaster), 20%; insulation, 8%; and other, 32%.
Salient Statistics—United States: 2007 2008 2009 2010 Productione, 1 100 100 100 100 100
2011e
Imports for consumptione, 2 51 73 39 29 50 Exportse 5 5 3 2 3 Consumption, apparent, concentratee 150 170 140 130 150 Consumption, exfoliatede 85 82 69 73 85 Price, average, concentrate, dollars per ton, ex-plant 140 140 130 150 160 Employment, numbere 100 100 75 80 90 Net import reliance3 as a percentage of apparent consumptione, 4 30 40 30 20 20 Recycling
: Insignificant.
Import Sources (2007–10)
: China, 48%; South Africa, 47%; Australia, 2%; Brazil, 2%; and other, 1%.
Tariff
: Item Number Normal Trade Relations
Vermiculite, perlite and chlorites, unexpanded 2530.10.0000 Free. 12-31-11
Exfoliated vermiculite, expanded clays, foamed slag, and similar expanded materials 6806.20.0000 Free. Depletion Allowance
: 14% (Domestic and foreign).
Government Stockpile
: None.
Prepared by Arnold O. Tanner [(703) 648-4791, [email protected]]

181 VERMICULITE
Events, Trends, and Issues
: U.S. imports of vermiculite are not collected as a separate category by the U.S. Census Bureau. However, according to a nongovernmental source, U.S. imports, excluding any material from Canada and Mexico, were about 34,000 tons for the first 8 months of 2011. South Africa provided 52%, China, 28%, and Brazil, 17%. With increased demand globally and a tightening of supply, especially in coarse grades, prices began rising significantly in 2011.
An Australian company continued development of and production at the East African Namekara vermiculite deposit in Uganda, a portion of the larger East African vermiculite project (EAVP). The EAVP has about 55 million tons of inferred resources and is considered to be one of the world’s largest deposits. With the installation of two 50,000-ton-per-year plant modules, the company planned to increase annual production from an estimated 20,000 tons of vermiculite concentrate in 2011 to 80,000 tons in 2012 and 130,000 tons by 2014. The Namekara deposit has sufficient resources for more than 50 years of production at the expanded rate. The company secured a 25-year sales contract for all production with another industrial minerals company, which will market and distribute the product. A Brazilian company increased vermiculite production at its mine in central Brazil from 35,000 tons in 2010 to an estimated 55,000 tons in 2011, with plans to increase to 80,000 tons by 2013. The company also planned to bring online its vermiculite project near the country’s capital city of Brasilia in 2013, with an estimated 40,000 tons of production in the first year, increasing to as much as 120,000 tons by 2016. World Mine Production and Reserves
Mine production Reserves5
: The estimate of reserves was revised for Brazil based on new information from an official Government source in that country.
2010 United Statese, 1 100 100 25,000
2011e
Australia 13 15 NA Brazil 35 55 6,600 China 120 130 NA Egypt 12 6 NA India 13 14 NA Russia 25 25 NA South Africa 198 200 14,000 Uganda 4 20 NA Other countries 16 15 World total 536 580 NA
15,000
World Resources
: Marginal reserves of vermiculite in Colorado, Nevada, North Carolina, Texas, and Wyoming are estimated to be 2 million to 3 million tons. Reserves have been reported in Australia, Brazil, China, Russia, South Africa, Uganda, the United States, Zimbabwe, and some other countries. However, reserve information comes from many sources, and in most cases, it is not clear whether the numbers refer to vermiculite alone or vermiculite plus host rock and overburden.
Substitutes
: Expanded perlite is a substitute for vermiculite in lightweight concrete and plaster. Other more dense but less costly material substitutes in these applications are expanded clay, shale, slag, and slate. Alternate materials for loosefill fireproofing insulation include fiberglass, perlite, and slag wool. In agriculture, substitutes include peat, perlite, sawdust, bark and other plant materials, and synthetic soil conditioners.
eEstimated. NA Not available. 1Concentrate sold and used by producers. Data are rounded to one significant digit to avoid disclosing company proprietary data. 2Excludes Canada and Mexico. 3Defined as imports – exports + adjustments for Government and industry stock changes. 4Data are rounded to one significant digit to avoid disclosing company proprietary data. 5See Appendix C for resource/reserve definitions and information concerning data sources.
U.S. Geological Survey, Mineral Commodity Summaries, January 2012
182
WOLLASTONITE
(Data in metric tons unless otherwise noted) Domestic Production and Use
: Wollastonite was mined by two companies in New York. U.S. production statistics are withheld by the U.S. Geological Survey (USGS) to protect company proprietary data. Wollastonite mined in the United States formed when impure limestone was metamorphosed or silica-bearing fluids were introduced into calcareous sediments during metamorphism. In both cases, calcite reacted with silica to produce wollastonite and carbon dioxide. Wollastonite also can crystallize directly from a magma that has high carbon content, but this is a less common occurrence. Domestic deposits of wollastonite have been identified in Arizona, California, Idaho, Nevada, New Mexico, New York, and Utah, but New York is the only State where long-term continuous mining has taken place.
The USGS does not collect consumption statistics for wollastonite. Plastics and rubber products, however, were estimated to account for 30% to 35% of U.S. consumption, followed by ceramics with 20% to 25%; metallurgical applications, 10% to 20%; paint, 10% to 15%; friction products, 10% to 15%; and miscellaneous, 10% to 15%. Salient Statistics—United States
: U.S. production, as reported in the trade literature, was between 60,000 and 70,000 tons in 2009. In 2011, U.S. production and apparent consumption probably was 4% to 7% greater than in 2009 and about 3% to 5% greater than in 2010. Some wollastonite end-use markets have improved since the 2008–09 economic recession. Comprehensive trade data are not available, but the United States was a net exporter of wollastonite. Documented exports were in the range of 1,500 to 2,000 tons in 2011; additional tonnages probably were exported under a generic export harmonized tariff schedule code. Imports probably remained less than 4,000 tons in 2011. Prices for wollastonite were reported in the trade literature to range from $80 to $1,800 per metric ton. Products with finer grain sizes and being more acicular in morphology sold for higher prices. Surface treatment, when necessary, also increased the selling price. The United States was thought to be a net exporter of wollastonite.
Recycling
: None.
Import Sources (2007–10)
: Trade data are not available, but wollastonite has been imported from Canada, China, Finland, India, and Mexico.
Tariff
: Item Number Normal Trade Relations
Mineral substances not elsewhere 12-31-11
specified or included 2530.90.8050 Free. Depletion Allowance
: 10% (Domestic and foreign).
Government Stockpile
: None.
Prepared by Robert L. Virta [(703) 648-7726, [email protected]]
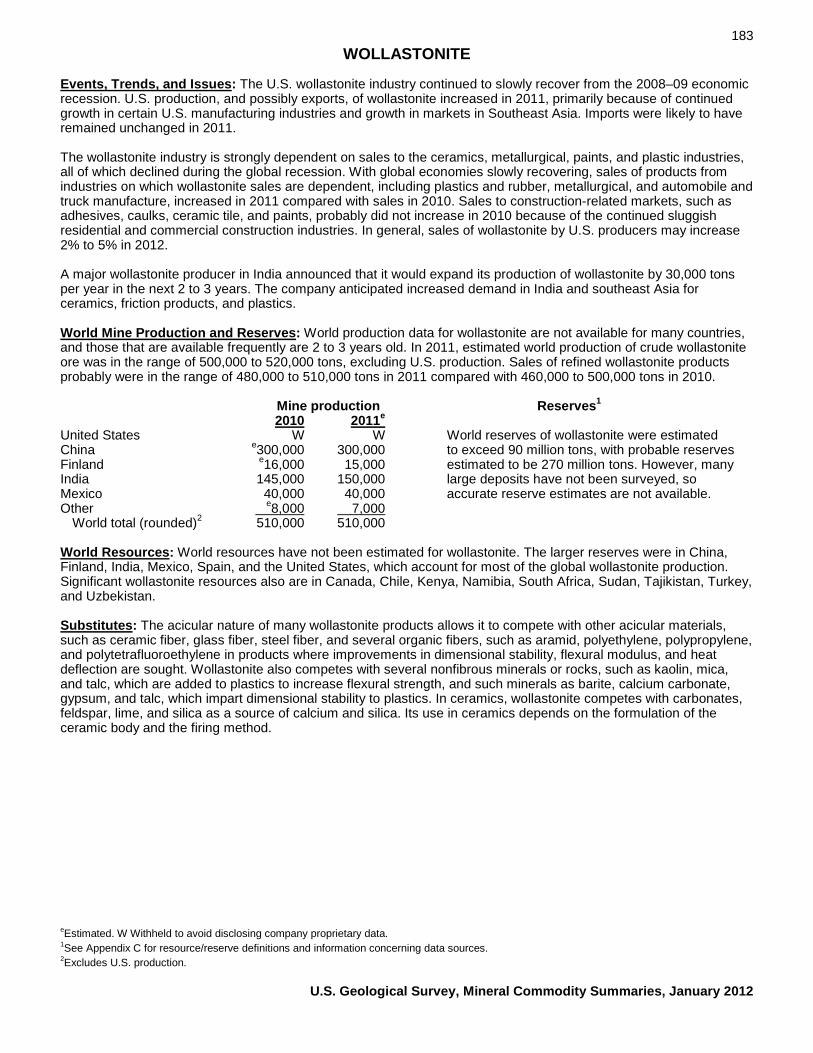
183 WOLLASTONITE
Events, Trends, and Issues
: The U.S. wollastonite industry continued to slowly recover from the 2008–09 economic recession. U.S. production, and possibly exports, of wollastonite increased in 2011, primarily because of continued growth in certain U.S. manufacturing industries and growth in markets in Southeast Asia. Imports were likely to have remained unchanged in 2011.
The wollastonite industry is strongly dependent on sales to the ceramics, metallurgical, paints, and plastic industries, all of which declined during the global recession. With global economies slowly recovering, sales of products from industries on which wollastonite sales are dependent, including plastics and rubber, metallurgical, and automobile and truck manufacture, increased in 2011 compared with sales in 2010. Sales to construction-related markets, such as adhesives, caulks, ceramic tile, and paints, probably did not increase in 2010 because of the continued sluggish residential and commercial construction industries. In general, sales of wollastonite by U.S. producers may increase 2% to 5% in 2012. A major wollastonite producer in India announced that it would expand its production of wollastonite by 30,000 tons per year in the next 2 to 3 years. The company anticipated increased demand in India and southeast Asia for ceramics, friction products, and plastics. World Mine Production and Reserves
: World production data for wollastonite are not available for many countries, and those that are available frequently are 2 to 3 years old. In 2011, estimated world production of crude wollastonite ore was in the range of 500,000 to 520,000 tons, excluding U.S. production. Sales of refined wollastonite products probably were in the range of 480,000 to 510,000 tons in 2011 compared with 460,000 to 500,000 tons in 2010.
Mine production Reserves1 2010 United States W W World reserves of wollastonite were estimated
2011e
China e300,000 300,000 to exceed 90 million tons, with probable reserves Finland e16,000 15,000 estimated to be 270 million tons. However, many India 145,000 150,000 large deposits have not been surveyed, so Mexico 40,000 40,000 accurate reserve estimates are not available. Other e8,000 World total (rounded)2 510,000 510,000
7,000
World Resources
: World resources have not been estimated for wollastonite. The larger reserves were in China, Finland, India, Mexico, Spain, and the United States, which account for most of the global wollastonite production. Significant wollastonite resources also are in Canada, Chile, Kenya, Namibia, South Africa, Sudan, Tajikistan, Turkey, and Uzbekistan.
Substitutes
: The acicular nature of many wollastonite products allows it to compete with other acicular materials, such as ceramic fiber, glass fiber, steel fiber, and several organic fibers, such as aramid, polyethylene, polypropylene, and polytetrafluoroethylene in products where improvements in dimensional stability, flexural modulus, and heat deflection are sought. Wollastonite also competes with several nonfibrous minerals or rocks, such as kaolin, mica, and talc, which are added to plastics to increase flexural strength, and such minerals as barite, calcium carbonate, gypsum, and talc, which impart dimensional stability to plastics. In ceramics, wollastonite competes with carbonates, feldspar, lime, and silica as a source of calcium and silica. Its use in ceramics depends on the formulation of the ceramic body and the firing method.
eEstimated. W Withheld to avoid disclosing company proprietary data. 1See Appendix C for resource/reserve definitions and information concerning data sources. 2Excludes U.S. production.
U.S. Geological Survey, Mineral Commodity Summaries, January 2012

184
YTTRIUM1
[Data in metric tons of yttrium oxide (Y2O3) content unless otherwise noted] Domestic Production and Use
: The rare-earth element yttrium was not mined in the United States in 2010. All yttrium metal and compounds used in the United States were imported. Principal uses were in phosphors for color televisions and computer monitors, temperature sensors, trichromatic fluorescent lights, and x-ray-intensifying screens. Yttria-stabilized zirconia was used in alumina-zirconia abrasives, bearings and seals, high-temperature refractories for continuous-casting nozzles, jet-engine coatings, oxygen sensors in automobile engines, simulant gemstones, and wear-resistant and corrosion-resistant cutting tools. In electronics, yttrium-iron garnets were components in microwave radar to control high-frequency signals. Yttrium was an important component in yttrium-aluminum-garnet laser crystals used in dental and medical surgical procedures, digital communications, distance and temperature sensing, industrial cutting and welding, nonlinear optics, photochemistry, and photoluminescence. Yttrium also was used in heating-element alloys, high-temperature superconductors, and superalloys. The approximate distribution in 2011 by end use was as follows: ceramics, 59%; metallurgy and phosphors (all types), 39%; magnets, metallurgical, electronics, and lasers, 2%.
Salient Statistics—United States: 2007 2008 2009 2010 Production, mine — — — — —
2011e
Imports for consumption: In monazite — — — — — Yttrium, alloys, compounds, and metale, 2 676 616 450 670 620 Exports, in ore and concentrate NA NA NA NA NA Consumption, estimated3 676 616 450 670 620 Price, dollars: Monazite concentrate, per metric ton4 730 480 480 NA 1,600 Yttrium oxide, per kilogram, 99.9% to 99.99% purity5 10–85 10–85 10–85 38–41 75–180 Yttrium metal, per kilogram, 99.99 to 99.999% purity6 68–155 68–155 68–155 73–99 160–190 Stocks, processor, yearend NA NA NA NA NA Net import reliancee, 7 as a percentage of apparent consumption 100 100 100 100 100 Recycling
: Small quantities, primarily from laser crystals and synthetic garnets.
Import Sources (2007–10)
: Yttrium compounds, greater than 19% to less than 85% weight percent yttrium oxide equivalent: China, 63%; Japan, 9%; France, 6%; United Kingdom, 4%; and other, 18%.
Tariff
: Item Number Normal Trade Relations
Thorium ores and concentrates (monazite) 2612.20.0000 Free. 12-31-11
Rare-earth metals, scandium and yttrium, whether or not intermixed or interalloyed 2805.30.0000 5.0% ad val. Yttrium-bearing materials and compounds containing by weight >19% to <85% Y2O3 2846.90.4000 Free. Other rare-earth compounds, including yttrium oxide >85% Y2O3, yttrium nitrate, and other individual compounds 2846.90.8000 3.7% ad val. Depletion Allowance
: Monazite, thorium content, 22% (Domestic), 14% (Foreign); yttrium, rare-earth content, 14% (Domestic and foreign); and xenotime, 14% (Domestic and foreign).
Government Stockpile
: None.
Events, Trends, and Issues
: Yttrium consumption in the United States increased in 2010 but was expected to decrease in 2011 based on import data. The United States required yttrium for use in phosphors and in electronics, especially those used in defense applications. Prices for yttrium peaked in a period between July and August. Since that time, the prices have returned to a range of about $90 to $130 for oxide and about $120 to $160 for metal.
Prepared by Daniel J. Cordier [(703) 648-7723, [email protected]]

185 YTTRIUM
Yttrium production and marketing within China continued to be competitive. China was the source of most of the world’s supply of yttrium, from its weathered clay ion-adsorption ore deposits in the southern Provinces, primarily Fujian, Guangdong, and Jiangxi, with a lesser number of deposits in Guangxi and Hunan. Processing was primarily at facilities in Guangdong, Jiangsu, and Jiangxi Provinces. Yttrium was consumed mainly in the form of high-purity oxide compounds for phosphors. Smaller amounts were used in ceramics, electronic devices, lasers, and metallurgical applications. China was the primary source of most of the yttrium consumed in the United States. About 90% of the imported yttrium compounds, metal, and alloys were sourced from China, with lesser amounts from Japan, France, and Austria. World Mine Production and Reserves Mine productione, 8 Reserves9
:
2010 United States — — 120,000
2011
Australia — — 100,000 Brazil 15 15 2,200 China 8,800 8,800 220,000 India 55 55 72,000 Malaysia 4 4 13,000 Sri Lanka — — 240 Other countries — — World total (rounded) 8,900 8,900 540,000
17,000
World Resources
: Although reserves may be sufficient to satisfy near-term demand at current rates of production, economics, environmental issues, and permitting and trade restrictions could affect the mining or availability of many of the rare-earth elements, including yttrium. Large resources of yttrium in monazite and xenotime are available worldwide in ancient and recent placer deposits, carbonatites, uranium ores, and weathered clay deposits (ion-adsorption ore). Additional large subeconomic resources of yttrium occur in apatite-magnetite-bearing rocks, deposits of niobium-tantalum minerals, non-placer monazite-bearing deposits, sedimentary phosphate deposits, and uranium ores, especially those of the Blind River District near Elliot Lake, Ontario, Canada, which contain yttrium in brannerite, monazite, and uraninite. Significant yttrium resources are inferred to be in the Bokan Mountain deposit, Prince of Wales Island, Alaska. Additional resources in Canada are contained in allanite, apatite, and britholite at Eden Lake, Manitoba; allanite and apatite at Hoidas Lake, Saskatchewan; and fergusonite and xenotime at Thor Lake, Northwest Territories. Measured yttrium resources have been documented in the Dubbo Zirconia deposit New South Wales, Australia. The world’s resources of yttrium are probably very large. Yttrium is associated with most rare-earth deposits. It occurs in various minerals in differing concentrations and occurs in a wide variety of geologic environments, including alkaline granites and intrusives, carbonatites, hydrothermal deposits, laterites, placers, and vein-type deposits.
Substitutes
: Substitutes for yttrium are available for some applications but generally are much less effective. In most uses, especially in electronics, lasers, and phosphors, yttrium is not subject to substitution by other elements. As a stabilizer in zirconia ceramics, yttria (yttrium oxide) may be substituted with calcia (calcium oxide) or magnesia (magnesium oxide), but they generally impart lower toughness.
eEstimated. NA Not available. — Zero. 1See also Rare Earths; trade data for yttrium are included in those data shown for rare earths. 2Imports based on data from the Port Import/Export Reporting Service (PIERS), Journal of Commerce. 3Essentially, all yttrium consumed domestically was imported or refined from imported ores and concentrates. 4Monazite price estimated for 2007 through 2010; estimate for 2011 based on sale of concentrate to China from Vietnam in 2009; anonymous marketing source. 5Yttrium oxide and metal prices for 5-kilogram to 1-metric-ton quantities from Rhodia Rare Earths, Inc., Shelton, CT; the China Rare Earth Information Center, Baotou, China; Hefa Rare Earth Canada Co., Ltd., Vancouver, Canada; and Stanford Materials Corp., Aliso Viejo, CA. 6Purity ranges for metal price quotes changed to 99.99% to 99.999% in 2011 from 99.9% between 2007 and 2010. Vendor list is the same as footnote 5. 7Defined as imports – exports + adjustments for Government and industry stock changes. 8Includes yttrium contained in rare-earth ores. 9See Appendix C for resource/reserve definitions and information concerning data sources.
U.S. Geological Survey, Mineral Commodity Summaries, January 2012

186
ZEOLITES (NATURAL)
(Data in metric tons unless otherwise noted) Domestic Production and Use
: Natural zeolites were mined by 10 companies in the United States, with 1 other company working from stockpiled materials or zeolites purchased from other producers for resale. Chabazite was mined in Arizona; clinoptilolite was mined in California, Idaho, Nevada, New Mexico, and Texas. New Mexico was the leading producing State in 2011, followed by Idaho, Texas, Arizona, California, and Nevada.
Natural zeolites mined in the United States are associated with the alteration of volcanic tuffs in alkaline lake deposits and open hydrologic systems. Commercial deposits are in Arizona, California, Idaho, Nevada, New Mexico, Oregon, and Texas. Smaller, noncommercial deposits are found in several other Midwestern and Western States. Zeolite minerals such as chabazite, clinoptilolite, erionite, mordenite, and phillipsite occur in these deposits, but the most commonly mined zeolites are chabazite, clinoptilolite, and mordenite. In 2011, U.S. production and consumption of natural zeolites were estimated to be 62,000 tons and 61,000 tons, respectively, slight increases from those of 2010. Domestic uses for natural zeolites were, in decreasing order by tonnage, animal feed, pet litter, odor control, water purification, gas absorbent, wastewater cleanup, fertilizer, desiccant, oil absorbent, aquaculture, fungicide or pesticide carrier, and catalyst. Animal feed, odor control, pet litter, and water purification applications accounted for more than 70% of the domestic sales tonnage. Salient Statistics—United States: 2007 2008 2009 2010 Production, mine 57,400 60,100 59,500 61,300 62,000
2011e
Sales, mill 57,100 58,500 59,400 60,000 61,000 Price, range of value, dollars per metric ton1 30–900 30–900 30–900 30–900 40–900 Recycling
: Natural zeolites used for most applications are not recycled. Natural zeolites used for such applications as desiccants, gas absorbents, wastewater cleanup, or water purification may be reused after reprocessing of the spent zeolites.
Import Sources (2007–10)
: Comprehensive trade data are not available for natural zeolites. Nearly all exports and imports are synthetic zeolites. Small amounts of natural zeolites have been imported from Bulgaria and India.
Tariff
: Item Number Normal Trade Relations
Mineral substances not elsewhere 12-31-11
specified or included 2530.90.8050 Free. Depletion Allowance
: 14% (Domestic and foreign).
Government Stockpile
: None.
Prepared by Robert L. Virta [(703) 648-7726, [email protected]]

187 ZEOLITES (NATURAL)
Events, Trends, and Issues
: Markets for natural zeolites were not seriously affected by the U.S. economic recession. Notably, natural zeolite markets were smaller and less associated with construction and manufacturing than other industrial minerals. However, construction markets outside of the United States, where natural zeolites were widely used as dimension stone, lightweight aggregate, and pozzolan, were likely to have been affected by the global recession because of the reduced level of building activity. World production probably remained unchanged in 2011 from that of 2010 because of the overall lack of economic growth in many regions of the globe. The earthquake and tsunami in Japan, which caused structural damage to several nuclear reactors, brought about increased U.S. exports of natural zeolite used to remove radioactive isotopes from coolant waters. The United States was a net exporter of natural zeolites in 2011. Interest increased in possible health effects caused by inhalation of erionite. The National Institute of Environmental Health Sciences conducted a workshop to discuss analysis, exposure assessment, health research, and public health concerns. A summary of the workshop was not available at the time of publication.
World Mine Production and Reserves
:2 Natural zeolite production data are not available for most countries. Countries mining large tonnages of zeolites typically use them in low-value applications. The ready availability of zeolite-rich rock at low cost and the shortage of competing minerals and rocks are probably the most important factors enabling its large-scale use. It is also likely that a significant percentage of the material sold as zeolites in some countries is ground or sawn volcanic tuff that contains only a small amount of zeolites. Some examples of such usage are dimension stone (as an altered volcanic tuff), lightweight aggregate, pozzolanic cement, and soil conditioners.
World reserves of natural zeolites have not been estimated. Deposits occur in many countries, but companies rarely, if ever, publish reserve data. Further complicating estimates of reserves is the fact that much of the reported world production includes altered volcanic tuffs that contain low to moderate concentrations of zeolites. These typically are used in high-volume construction applications, and therefore some deposits should be excluded from reserve estimates because it is the rock itself and not its zeolite content that makes the deposit valuable. Mine production2 Reserves3 2010 United States 61,300 62,000
2011e
Chinae, 4 2,000,000 2,000,000 Japane, 4 140,000 155,000 Jordane 140,000 140,000 World reserves are Korea, Republic of 235,000 240,000 not determined but are Slovakia 80,000 80,000 estimated to be large. Turkey 150,000 150,000 Other 5,500 World total (rounded) 2,800,000 2,800,000
5,000
World Resources
: World resources have not been estimated for natural zeolites. An estimated 120 million tons of clinoptilolite, chabazite, erionite, mordenite, and phillipsite is present in near-surface deposits in the Basin and Range province in the United States. Possible resources in the United States may approach 10 trillion tons for zeolite-rich deposits.
Substitutes
: For pet litter, natural zeolites compete with other mineral-based litters, such as those manufactured using attapulgite, bentonite, diatomite, fuller’s earth, and sepiolite; organic litters made from shredded corn stalks and paper, straw, and wood shavings; and litters made using silica gel. Diatomite, perlite, pumice, vermiculite, and volcanic tuff compete with natural zeolite as lightweight aggregate. Zeolite desiccants compete against such products as magnesium perchlorate and silica gel. Zeolites compete with bentonite, gypsum, montmorillonite, peat, perlite, silica sand, and vermiculite in various soil amendment applications. Carbon, diatomite, or silica sand may substitute for zeolites in water purification applications. As an oil absorbent, zeolites compete mainly with bentonite, diatomite, fuller’s earth, sepiolite, and a variety of polymer and natural organic products.
eEstimated. 1Estimate based on values reported by U.S. producers and prices published in the trade literature. Bulk shipments typically range from $100 to $200 per ton. 2Estimates for countries that do not report production represent a range with possibly 15% to 20% variability, rather than an absolute value. 3See Appendix C for resource/reserve definitions and information concerning data sources. 4Includes pozzolan applications.
U.S. Geological Survey, Mineral Commodity Summaries, January 2012
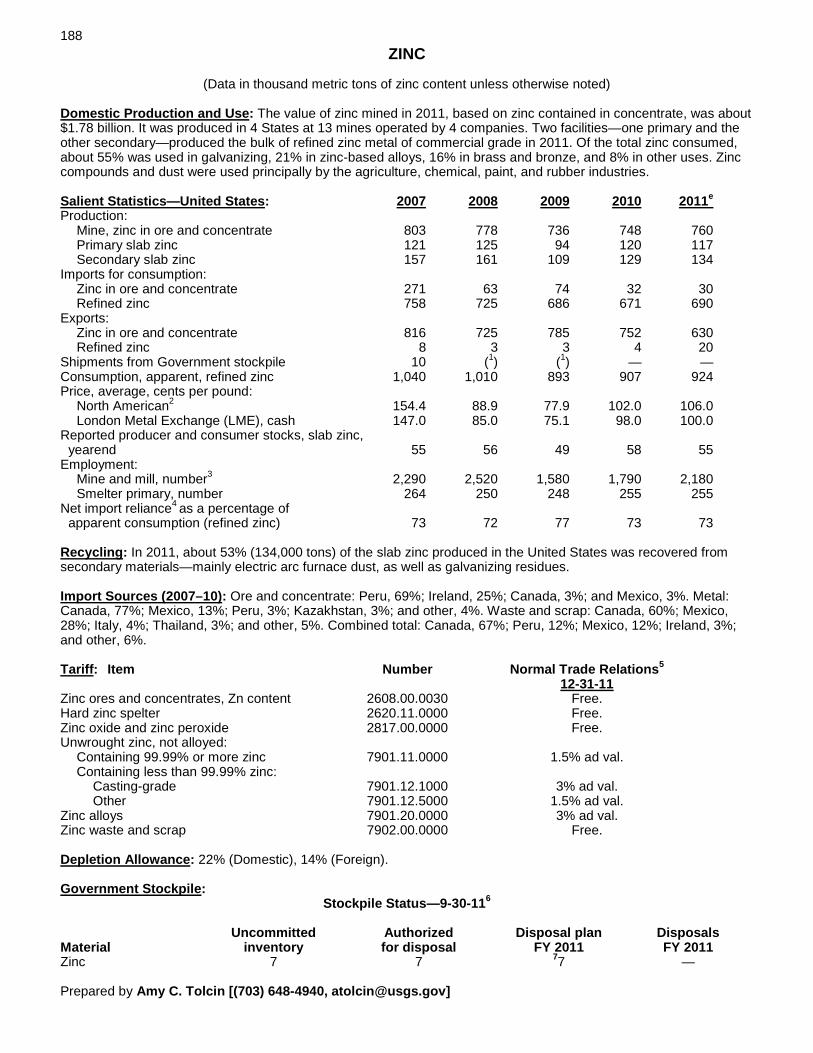
188
ZINC
(Data in thousand metric tons of zinc content unless otherwise noted) Domestic Production and Use
: The value of zinc mined in 2011, based on zinc contained in concentrate, was about $1.78 billion. It was produced in 4 States at 13 mines operated by 4 companies. Two facilities—one primary and the other secondary—produced the bulk of refined zinc metal of commercial grade in 2011. Of the total zinc consumed, about 55% was used in galvanizing, 21% in zinc-based alloys, 16% in brass and bronze, and 8% in other uses. Zinc compounds and dust were used principally by the agriculture, chemical, paint, and rubber industries.
Salient Statistics—United States: 2007 2008 2009 2010
Production: 2011e
Mine, zinc in ore and concentrate 803 778 736 748 760 Primary slab zinc 121 125 94 120 117 Secondary slab zinc 157 161 109 129 134 Imports for consumption: Zinc in ore and concentrate 271 63 74 32 30 Refined zinc 758 725 686 671 690 Exports: Zinc in ore and concentrate 816 725 785 752 630 Refined zinc 8 3 3 4 20 Shipments from Government stockpile 10 (1) (1) — — Consumption, apparent, refined zinc 1,040 1,010 893 907 924 Price, average, cents per pound: North American2 154.4 88.9 77.9 102.0 106.0 London Metal Exchange (LME), cash 147.0 85.0 75.1 98.0 100.0 Reported producer and consumer stocks, slab zinc, yearend 55 56 49 58 55 Employment: Mine and mill, number3 2,290 2,520 1,580 1,790 2,180 Smelter primary, number 264 250 248 255 255 Net import reliance4 as a percentage of apparent consumption (refined zinc) 73 72 77 73 73 Recycling
: In 2011, about 53% (134,000 tons) of the slab zinc produced in the United States was recovered from secondary materials—mainly electric arc furnace dust, as well as galvanizing residues.
Import Sources (2007–10)
: Ore and concentrate: Peru, 69%; Ireland, 25%; Canada, 3%; and Mexico, 3%. Metal: Canada, 77%; Mexico, 13%; Peru, 3%; Kazakhstan, 3%; and other, 4%. Waste and scrap: Canada, 60%; Mexico, 28%; Italy, 4%; Thailand, 3%; and other, 5%. Combined total: Canada, 67%; Peru, 12%; Mexico, 12%; Ireland, 3%; and other, 6%.
Tariff
: Item Number Normal Trade Relations5
Zinc ores and concentrates, Zn content 2608.00.0030 Free. 12-31-11
Hard zinc spelter 2620.11.0000 Free. Zinc oxide and zinc peroxide 2817.00.0000 Free. Unwrought zinc, not alloyed: Containing 99.99% or more zinc 7901.11.0000 1.5% ad val. Containing less than 99.99% zinc: Casting-grade 7901.12.1000 3% ad val. Other 7901.12.5000 1.5% ad val. Zinc alloys 7901.20.0000 3% ad val. Zinc waste and scrap 7902.00.0000 Free. Depletion Allowance
: 22% (Domestic), 14% (Foreign).
Government StockpileStockpile Status—9-30-116
:
Uncommitted Authorized Disposal plan Disposals Material inventory for disposal FY 2011 FY 2011 Zinc 7 7 77 — Prepared by Amy C. Tolcin [(703) 648-4940, [email protected]]

189 ZINC
Events, Trends, and Issues
: Global zinc mine production in 2011 increased by 4% to 12.4 million tons, mostly owing to increases in zinc mine production in China, India, Mexico, and Russia. According to the International Lead and Zinc Study Group, refined metal production increased by 3% to 13.2 million tons, while world metal consumption increased by 2% to 12.9 million tons, resulting in a market surplus of 317,000 tons of metal. A smaller surplus is anticipated in 2012. Demand for zinc generally follows industrial production or, more generally, global economic growth. Global economic activity slowed in 2011 from that of 2010, with growth in advanced economies considerably lagging behind those of emerging economies. Significant increases in zinc consumption in 2011 took place in Brazil, China, India, the Republic of Korea, and Turkey. However, in China, the rate of increase in apparent zinc consumption fell in 2011 owing to a destocking of unreported inventories that were built up in 2010. In Europe, zinc consumption increased slightly by 2.5%.
Domestically, zinc mine production increased in 2011 from that of 2010 owing to increased production at the zinc mining complexes in Tennessee. Primary production slightly decreased in 2011, as production at a zinc refinery in Tennessee underwent planned maintenance in the third quarter. Secondary zinc production increased from that of 2010 owing to increased production at a smelter in Pennsylvania during the first half of the year compared with production in the same period of 2010. Monthly average zinc prices generally declined during the course of 2011, reaching annual peaks of about 113 cents per pound in February and July. The LME cash price for Special High Grade zinc averaged 108 cents per pound in January and decreased to 86 cents per pound by mid-October. World Mine Production and Reserves
: Reserve estimates for Australia, Canada, China, and Kazakhstan were revised based on new company information and country reports. All other reserve estimates were revised based on a commercially available database of reserves and resources of mines and potential mines.
Mine production8 Reserves9 2010
United States 748 760 12,000 2011e
Australia 1,480 1,400 56,000 Bolivia 411 430 5,000 Canada 649 660 4,200 China 3,700 3,900 43,000 India 700 790 12,000 Ireland 342 350 1,800 Kazakhstan 500 500 12,000 Mexico 518 630 17,000 Peru 1,470 1,400 19,000 Other countries 1,490 1,600 World total (rounded) 12,000 12,400 250,000
68,000
World Resources
: Identified zinc resources of the world are about 1.9 billion metric tons.
Substitutes
: Aluminum, plastics, and steel substitute for galvanized sheet. Aluminum, magnesium, and plastics are major competitors as diecasting materials. Aluminum alloy, cadmium, paint, and plastic coatings replace zinc for corrosion protection; aluminum alloys substitute for brass. Many elements are substitutes for zinc in chemical, electronic, and pigment uses.
eEstimated. — Zero. 1Less than ½ unit. 2Platts Metals Week price for North American Special High Grade zinc; based on the London Metal Exchange cash price plus premiums or discounts, depending on market conditions. 3Includes mine and mill employment at all zinc-producing mines. Source: Mine Safety and Health Administration. 4Defined as imports – exports + adjustments for Government and industry stock changes. 5No tariff for Canada, Mexico, and Peru for items shown. 6See Appendix B for definitions. 7Actual quantity limited to remaining inventory. 8Zinc content of concentrate and direct shipping ore. 9See Appendix C for resource/reserve definitions and information concerning data sources.
U.S. Geological Survey, Mineral Commodity Summaries, January 2012

190
ZIRCONIUM AND HAFNIUM
(Data in metric tons unless otherwise noted) Domestic Production and Use
: The zirconium-silicate mineral zircon is produced as a coproduct from the mining and processing of heavy minerals. Typically, zirconium and hafnium are contained in zircon at a ratio of about 50 to 1. Two firms produced zircon from surface-mining operations in Florida and Virginia. Zirconium metal and hafnium metal were produced from zirconium chemical intermediates by two domestic producers, one in Oregon and the other in Utah. Zirconium chemicals were produced by the metal producer in Oregon and by at least 10 other companies. Ceramics, foundry applications, opacifiers, and refractories are the leading end uses for zircon. Other end uses of zircon include abrasives, chemicals, metal alloys, and welding rod coatings. The leading consumers of zirconium metal and hafnium metal are the nuclear energy and chemical process industries.
Salient Statistics—United States: 2007 2008 2009 2010 Production, zircon (ZrO2 content) W W W W W
2011e
Imports: Zirconium, ores and concentrates (ZrO2 content) 13,000 22,300 9,370 14,900 13,600 Zirconium, unwrought, powder, and waste and scrap 299 318 451 726 648 Zirconium, wrought 485 715 526 435 359 Zirconium oxide1 3,740 5,060 2,810 2,920 2,850 Hafnium, unwrought, powder, and waste and scrap 4 12 5 8 12 Exports: Zirconium ores and concentrates (ZrO2 content) 43,000 27,400 25,700 30,800 15,500 Zirconium, unwrought, powder, and waste and scrap 328 591 223 519 488 Zirconium, wrought 1,830 2,080 2,080 1,540 1,180 Zirconium oxide1 2,400 2,970 3,050 5,630 6,250 Consumption, zirconium ores and concentrates, apparent (ZrO2 content) W W W W W Prices: Zircon, dollars per metric ton (gross weight): Domestic2 763 788 830 860 2,500 Imported, f.o.b.3 872 773 850 1,155 2,100 Zirconium, unwrought, import, France, dollars per kilogram4 29 41 51 74 64 Hafnium, unwrought, import, France, dollars per kilogram4 246 225 472 453 562 Net import reliance5 as a percentage of apparent consumption: Zirconium E E E E E Hafnium NA NA NA NA NA Recycling
: In-plant recycled zirconium came from scrap generated during metal production and fabrication and was recycled by companies in Oregon and Utah. Scrap zirconium metal and alloys were recycled by companies in California and Oregon. Zircon foundry mold cores and spent or rejected zirconia refractories are often recycled. Recycling of hafnium metal was insignificant.
Import Sources (2007–10)
: Zirconium mineral concentrates: Australia, 49%; South Africa, 44%; and other, 7%. Zirconium, unwrought, including powder: Germany, 47%; France, 34%; Japan, 11%; Kazakhstan, 4%; and other, 4%. Hafnium, unwrought: France, 69%; Germany, 17%; United Kingdom, 5%; and other, 9%.
Tariff
: Item Number Normal Trade Relations
Zirconium ores and concentrates 2615.10.0000 Free. 12-31-11
Germanium oxides and zirconium dioxide 2825.60.0000 3.7% ad val. Ferrozirconium 7202.99.1000 4.2% ad val. Zirconium, unwrought and zirconium powder 8109.20.0000 4.2% ad val. Zirconium waste and scrap 8109.30.0000 Free. Other zirconium articles 8109.90.0000 3.7% ad val. Hafnium, unwrought, powder, and waste and scrap 8112.92.2000 Free. Depletion Allowance
: 22% (Domestic), 14% (Foreign).
Government Stockpile
: None.
Prepared by Joseph Gambogi [(703) 648-7718, [email protected]]

191 ZIRCONIUM AND HAFNIUM
Events, Trends, and Issues
: Domestic production of zirconium mineral concentrates increased compared with that of 2010 and consumption was stable. Domestic mining of heavy minerals continued near Stony Creek, VA, and Starke, FL.
In 2011, increased zircon consumption, primarily in China, resulted in dramatic price increases for zircon. Zircon prices, which began to rise in 2010, reached record-high levels in 2011. Global production of zirconium concentrates (excluding the United States) increased significantly compared with that of 2010. In the Eucla Basin, Australia, production at the Jacinth-Ambrosia operation was being ramped up to 300,000 tons per year of zircon concentrate. Higher titanium and zirconium mineral prices supported the resumption of mining operations at yearend at Eneabba in Western Australia. In Mozambique, mine production was increasing at the Moma operation to 80,000 tons per year of zircon. In South Africa, a mine tailings treatment plant was commissioned at Richards Bay to recover heavy-mineral concentrates, including zircon, from about 30 years of accumulated mine tailings. Heavy-mineral exploration and mining projects were underway in Australia, Canada, India, Kazakhstan, Kenya, Madagascar, Mozambique, Paraguay, Senegal, South Africa, and the United States. World Mine Production and Reserves
: World primary hafnium production statistics are not available. Hafnium occurs with zirconium in the minerals zircon and baddeleyite. The reserve estimates for Australia and the United States have been revised downward based on new information from Government and company reports. Quantitative estimates of hafnium reserves are not available.
Zirconium mine production Zirconium reserves6 (thousand metric tons) (thousand metric tons, ZrO2) 2010 United States W W 500
2011e
Australia 518 720 21,000 Brazil 18 18 2,200 China 140 100 500 India 38 38 3,400 Indonesia 50 50 NA Mozambique 37 40 1,200 South Africa 400 380 14,000 Ukraine 30 35 4,000 Other countries 14 32 World total (rounded) 71,250 71,410 52,000
5,000
World Resources
: Resources of zircon in the United States included about 14 million tons associated with titanium resources in heavy-mineral sand deposits. Phosphate and sand and gravel deposits have the potential to yield substantial amounts of zircon as a byproduct. Eudialyte and gittinsite are zirconium silicate minerals that have a potential for zirconia production. Identified world resources of zircon exceed 60 million tons.
World resources of hafnium are associated with those of zircon and baddeleyite. Quantitative estimates of hafnium resources are not available. Substitutes
: Chromite and olivine can be used instead of zircon for some foundry applications. Dolomite and spinel refractories can also substitute for zircon in certain high-temperature applications. Niobium (columbium), stainless steel, and tantalum provide limited substitution in nuclear applications, while titanium and synthetic materials may substitute in some chemical processing plant applications.
Silver-cadmium-indium control rods are used in lieu of hafnium at numerous nuclear powerplants. Zirconium can be used interchangeably with hafnium in certain superalloys; in others, only hafnium produces the desired or required grain boundary refinement. eEstimated. E Net exporter. NA Not available. W Withheld to avoid disclosing company proprietary data. 1Includes germanium oxides. 2Yearend average of high-low price range. 3Unit value based on U.S. imports for consumption. 4Unit value based on U.S. imports for consumption from France. 5Defined as imports – exports. 6See Appendix C for resource/reserve definitions and information concerning data sources. 7Excludes U.S. production.
U.S. Geological Survey, Mineral Commodity Summaries, January 2012

192
APPENDIX A
Abbreviations and Units of Measure 1 carat (metric) (diamond) = 200 milligrams 1 flask (fl) = 76 pounds, avoirdupois 1 karat (gold) = one twenty-fourth part 1 kilogram (kg) = 2.2046 pounds, avoirdupois 1 long ton (lt) = 2,240 pounds, avoirdupois 1 long ton unit (ltu) = 1% of 1 long ton or 22.4 pounds avoirdupois long calcined ton (lct) = excludes water of hydration long dry ton (ldt) = excludes excess free moisture Mcf = 1,000 cubic feet 1 metric ton (t) = 2,204.6 pounds, avoirdupois or 1,000 kilograms 1 metric ton (t) = 1.1023 short ton 1 metric ton unit (mtu) = 1% of 1 metric ton or 10 kilograms
metric dry ton (mdt) = excludes excess free moisture 1 pound (lb) = 453.6 grams 1 short ton (st) = 2,000 pounds, avoirdupois 1 short ton unit (stu) = 1% of 1 short ton or 20 pounds, avoirdupois short dry ton (sdt) = excludes excess free moisture 1 troy ounce (tr oz) = 1.09714 avoirdupois ounces or 31.103 grams 1 troy pound = 12 troy ounces
APPENDIX B
Definitions of Selected Terms Used in This Report Terms Used for Materials in the National Defense Stockpile and Helium Stockpile Uncommitted inventory refers to the quantity of mineral materials held in the National Defense Stockpile. Nonstockpile-grade materials may be included in the table; where significant, the quantities of these stockpiled materials will be specified in the text accompanying the table. Authorized for disposal refers to quantities that are in excess of the stockpile goal for a material, and for which Congress has authorized disposal over the long term at rates designed to maximize revenue but avoid undue disruption of the usual markets and financial loss to the United States. Disposal plan FY 2011 indicates the total amount of a material in the National Defense Stockpile that the U.S. Department of Defense is permitted to sell under the Annual Materials Plan approved by Congress for the fiscal year. FY 2011 (fiscal year 2011) is the period October 1, 2010, through September 30, 2011. For mineral commodities that have a disposal plan greater than the inventory, actual quantity will be limited to remaining disposal authority or inventory. Note that, unlike the National Defense Stockpile, helium stockpile sales by the Bureau of Land Management under the Helium Privatization Act of 1996 are permitted to exceed disposal plans. Disposals FY 2011 refers to material sold or traded from the stockpile in FY 2011. Depletion Allowance The depletion allowance is a business tax deduction analogous to depreciation, but which applies to an ore reserve rather than equipment or production facilities. Federal tax law allows this deduction from taxable corporate income, recognizing that an ore deposit is a depletable asset that must eventually be replaced.

193
APPENDIX C—Reserves and Resources Reserves data are dynamic. They may be reduced as ore is mined and/or the extraction feasibility diminishes, or more commonly, they may continue to increase as additional deposits (known or recently discovered) are developed, or currently exploited deposits are more thoroughly explored and/or new technology or economic variables improve their economic feasibility. Reserves may be considered a working inventory of mining companies’ supply of an economically extractable mineral commodity. As such, magnitude of that inventory is necessarily limited by many considerations, including cost of drilling, taxes, price of the mineral commodity being mined, and the demand for it. Reserves will be developed to the point of business needs and geologic limitations of economic ore grade and tonnage. For example, in 1970, identified and undiscovered world copper resources were estimated to contain 1.6 billion metric tons of copper, with reserves of about 280 million metric tons of copper. Since then, about 400 million metric tons of copper have been produced worldwide, but world copper reserves in 2011 were estimated to be 690 million metric tons of copper,
more than double those in 1970, despite the depletion by mining of more than the original estimated reserves. Future supplies of minerals will come from reserves and other identified resources, currently undiscovered resources in deposits that will be discovered in the future, and material that will be recycled from current in-use-stocks of mineral or from minerals in waste disposal sites. Undiscovered deposits of minerals constitute an important consideration in assessing future supplies. USGS reports provide estimates of undiscovered mineral resources using a three-part assessment methodology (Singer and Menzie, 2010). Mineral-resource assessments have been carried out for small parcels of land being evaluated for land reclassification, for the Nation, and for the world. Reference Cited Singer, D.A., and Menzie, W.D., 2010, Quantitative mineral resource
assessments—An integrated approach: Oxford, United Kingdom, Oxford University Press, 219 p.
Part A—Resource/Reserve Classification for Minerals1
INTRODUCTION Through the years, geologists, mining engineers, and others operating in the minerals field have used various terms to describe and classify mineral resources, which as defined herein include energy materials. Some of these terms have gained wide use and acceptance, although they are not always used with precisely the same meaning. The USGS collects information about the quantity and quality of all mineral resources. In 1976, the USGS and the U.S. Bureau of Mines developed a common classification and nomenclature, which was published as USGS Bulletin 1450–A—“Principles of the Mineral Resource Classification System of the U.S. Bureau of Mines and U.S. Geological Survey.” Experience with this resource classification system showed that some changes were necessary in order to make it more workable in practice and more useful in long-term planning. Therefore, representatives of the USGS and the U.S. Bureau of Mines collaborated to revise Bulletin 1450–A. Their work was published in 1980 as USGS Circular 831—“Principles of a Resource/Reserve Classification for Minerals.” Long-term public and commercial planning must be based on the probability of discovering new deposits, on developing economic extraction processes for currently unworkable deposits, and on knowing which resources are immediately available. Thus, resources must be continuously reassessed in the light of new geologic knowledge, of progress in science and technology, and of shifts in economic and political conditions. To best serve these planning needs, known resources should be classified from two standpoints: (1) purely geologic or physical/chemical characteristics—such as grade, quality, tonnage, thickness, and depth—of the material in place; and (2) profitability analyses based on costs of extracting and marketing the material in a given
economy at a given time. The former constitutes important objective scientific information of the resource and a relatively unchanging foundation upon which the latter more valuable economic delineation can be based. The revised classification system, designed generally for all mineral materials, is shown graphically in figures 1 and 2; its components and their usage are described in the text. The classification of mineral and energy resources is necessarily arbitrary, because definitional criteria do not always coincide with natural boundaries. The system can be used to report the status of mineral and energy-fuel resources for the Nation or for specific areas.1
RESOURCE/RESERVE DEFINITIONS A dictionary definition of resource, “something in reserve or ready if needed,” has been adapted for mineral and energy resources to comprise all materials, including those only surmised to exist, that have present or anticipated future value. Resource.—A concentration of naturally occurring solid,
liquid, or gaseous material in or on the Earth’s crust in such form and amount that economic extraction of a commodity from the concentration is currently or potentially feasible.
Original Resource.—The amount of a resource before production.
Identified Resources.—Resources whose location, grade, quality, and quantity are known or estimated from specific geologic evidence. Identified resources include economic, marginally economic, and sub-economic components. To reflect varying degrees of geologic certainty, these economic divisions can be subdivided into measured, indicated, and inferred.
1Based on U.S. Geological Survey Circular 831, 1980.

194
Demonstrated.—A term for the sum of measured plus indicated.
Measured.—Quantity is computed from dimensions revealed in outcrops, trenches, workings, or drill holes; grade and(or) quality are computed from the results of detailed sampling. The sites for inspection, sampling, and measurements are spaced so closely and the geologic character is so well defined that size, shape, depth, and mineral content of the resource are well established.
Indicated.—Quantity and grade and(or) quality are computed from information similar to that used for measured resources, but the sites for inspection, sampling, and measurement are farther apart or are otherwise less adequately spaced. The degree of assurance, although lower than that for measured resources, is high enough to assume continuity between points of observation.
Inferred.—Estimates are based on an assumed continuity beyond measured and(or) indicated resources, for which there is geologic evidence. Inferred resources may or may not be supported by samples or measurements.
Reserve Base.—That part of an identified resource that meets specified minimum physical and chemical criteria related to current mining and production practices, including those for grade, quality, thickness, and depth. The reserve base is the in-place demonstrated (measured plus indicated) resource from which reserves are estimated. It may encompass those parts of the resources that have a reasonable potential for becoming economically available within planning horizons beyond those that assume proven technology and current economics. The reserve base includes those resources that are currently economic (reserves), marginally economic (marginal reserves), and some of those that are currently subeconomic (subeconomic resources). The term “geologic reserve” has been applied by others generally to the reserve-base category, but it also may include the inferred-reserve-base category; it is not a part of this classification system.
Inferred Reserve Base.—The in-place part of an identified resource from which inferred reserves are estimated. Quantitative estimates are based largely on knowledge of the geologic character of a deposit and for which there may be no samples or measurements. The estimates are based on an assumed continuity beyond the reserve base, for which there is geologic evidence.
Reserves.—That part of the reserve base which could be economically extracted or produced at the time of determination. The term reserves need not signify that extraction facilities are in place and operative. Reserves include only recoverable materials; thus, terms such as “extractable reserves” and “recoverable reserves” are redundant and are not a part of this classification system.
Marginal Reserves.—That part of the reserve base which, at the time of determination, borders on being economically producible. Its essential characteristic is economic uncertainty. Included are resources that would be producible, given postulated changes in economic or technological factors.
Economic.—This term implies that profitable extraction or production under defined investment assumptions has been established, analytically demonstrated, or assumed with reasonable certainty.
Subeconomic Resources.—The part of identified resources that does not meet the economic criteria of reserves and marginal reserves.
Undiscovered Resources.—Resources, the existence of which are only postulated, comprising deposits that are separate from identified resources. Undiscovered resources may be postulated in deposits of such grade and physical location as to render them economic, marginally economic, or subeconomic. To reflect varying degrees of geologic certainty, undiscovered resources may be divided into two parts:
Hypothetical Resources.—Undiscovered resources that are similar to known mineral bodies and that may be reasonably expected to exist in the same producing district or region under analogous geologic conditions. If exploration confirms their existence and reveals enough information about their quality, grade, and quantity, they will be reclassified as identified resources.
Speculative Resources.—Undiscovered resources that may occur either in known types of deposits in favorable geologic settings where mineral discoveries have not been made, or in types of deposits as yet unrecognized for their economic potential. If exploration confirms their existence and reveals enough information about their quantity, grade, and quality, they will be reclassified as identified resources.
Restricted Resources/Reserves.—That part of any resource/reserve category that is restricted from extraction by laws or regulations. For example, restricted reserves meet all the requirements of reserves except that they are restricted from extraction by laws or regulations.
Other Occurrences.—Materials that are too low grade or for other reasons are not considered potentially economic, in the same sense as the defined resource, may be recognized and their magnitude estimated, but they are not classified as resources. A separate category, labeled other occurrences, is included in figures 1 and 2. In figure 1, the boundary between subeconomic and other occurrences is limited by the concept of current or potential feasibility of economic production, which is required by the definition of a resource. The boundary is obviously uncertain, but limits may be specified in terms of grade, quality, thickness, depth, percent extractable, or other economic-feasibility variables.
Cumulative Production.—The amount of past cumulative production is not, by definition, a part of the resource. Nevertheless, a knowledge of what has been produced is important in order to understand current resources, in terms of both the amount of past production and the amount of residual or remaining in-place resource. A separate space for cumulative production is shown in figures 1 and 2. Residual material left in the ground during current or future extraction should be recorded in the resource category appropriate to its economic-recovery potential.

195
FIGURE 1.—Major Elements of Mineral-Resource Classification, Excluding Reserve Base and Inferred Reserve Base
FIGURE 2.—Reserve Base and Inferred Reserve Base Classification Categories
Cumulative ProductionDemonstrated
IDENTIFIED RESOURCES UNDISCOVERED RESOURCES
(or)Measured Indicated Inferred
ECONOMIC
MARGINALLY ECONOMIC
SUBECONOMIC
Other Occurrences
Includes nonconventional and low-grade materials
Probability RangeHypothetical Speculative
Reserve
Base
Reserve
Base
Inferred
Cumulative Production
ECONOMIC
MARGINALLY ECONOMIC
SUBECONOMIC
Other Occurrences
IDENTIFIED RESOURCES
DemonstratedMeasured Indicated Inferred
Reserves Inferred Reserves
Marginal ReservesInferred Marginal Reserves
Demonstrated Subeconomic Resources
Inferred Subeconomic
Resources
UNDISCOVERED RESOURCES
Probability Range(or)Hypothetical Speculative
Includes nonconventional and low-grade materials

196
Part B—Sources of Reserves Data National information on reserves for most mineral commodities found in this report, including those for the United States, is derived from a variety of sources. The ideal source of such information would be comprehensive evaluations that apply the same criteria to deposits in different geographic areas and report the results by country. In the absence of such evaluations, national reserve estimates compiled by countries for selected mineral commodities are a primary source of national reserves information. Lacking national assessment information by governments, sources such as academic articles, company reports, presentations by company representatives, and trade journal articles, or a combination of these, serve as the basis for national information on reserves reported in the mineral commodity sections of this publication. A national estimate may be assembled from the following: historically reported reserve information carried for years without alteration because no new information is available, historically reported reserves reduced by the amount of historical production, and company reported reserves. International minerals availability studies conducted by the U.S. Bureau of Mines before 1996 and estimates of identified resources by an international collaborative effort (the International Strategic Minerals Inventory) are the bases for some reserve estimates. The USGS collects information about the quantity and quality of mineral resources but does not directly measure reserves, and companies or governments do not directly report reserves to the USGS. Reassessment of reserves is a continuing process, and the intensity of this process differs for mineral commodities, countries, and time period. Some countries have specific definitions for reserve data, and reserves for each country are assessed separately, based on reported data and definitions. An attempt is made to make reserves consistent among countries for a mineral commodity and its byproducts. For example, the Australasian Joint Ore Reserves Committee (JORC) established the Australasian Code for Reporting of Exploration Results, Mineral Resources and Ore Reserves (the JORC Code) that sets out minimum standards, recommendations, and guidelines for public reporting in Australasia of exploration results, mineral resources, and ore reserves. Companies listed on the Australian Securities Exchange and the New Zealand Stock Exchange are required to report publicly on ore reserves and mineral resources under their control, using the JORC Code (http://www.jorc.org/). Data reported for individual deposits by mining companies are compiled in Geoscience Australia’s national mineral resources database and used in the preparation of the annual national assessments of Australia’s mineral resources. Because of its specific use in the JORC Code, the term “reserves” is not used in the national inventory, where the highest category is “Economic Demonstrated Resources” (EDR). In essence, EDR combines the JORC Code categories
proved reserves and probable reserves, plus measured resources and indicated resources. This is considered to provide a reasonable and objective estimate of what is likely to be available for mining in the long term. Accessible Economic Demonstrated Resources represent the resources within the EDR category that are accessible for mining. Reserves for Australia in Mineral Commodity Summaries 2012 are Accessible EDR. For more information, see Australia’s Identified Mineral Resources 2010 (http://www.ga.gov.au/ image_cache/GA19253.pdf). In Canada, the Canadian Institute of Mining, Metallurgy, and Petroleum (CIM) provides standards for the classification of mineral resources and mineral reserves estimates into various categories. The category to which a resource or reserve estimate is assigned depends on the level of confidence in the geologic information available on the mineral deposit, the quality and quantity of data available on the deposit, the level of detail of the technical and economic information that has been generated about the deposit, and the interpretation of the data and information. For more information on the CIM definition standards, see http://www.cim.org/ UserFiles/File/CIM_DEFINITON_STANDARDS_Nov_2010.pdf. Russian reserves for most minerals, which had been withheld, have been released with increasing frequency within the past 4 or 5 years and can appear in a number of sources, although no systematic list of Russian reserves is published. Russian reserve data for various minerals appear at times in journal articles, such as those in the journal Mineral’nye Resursy Rossii [Mineral Resources of Russia (MRR)], which is published by the Russian Ministry of Natural Resources. Russian reserve data are often published according to the Soviet reserves classification system, which is still used in many countries of the former Soviet Union but also at times published according to the JORC system based on analyses made by Western firms. It is sometimes not clear if the reserves are being reported in ore or mineral content. It is also in many cases not clear which definition of reserves is being used, as the system inherited from the former Soviet Union has a number of ways in which the term reserves is defined, and these definitions qualify the percentage of reserves that are included. For example, the Soviet reserves classification system, besides the categories A, B, C1, and C2, which represent progressively detailed knowledge of a mineral deposit based on exploration data, has other subcategories cross-imposed upon the system. Under the broad category reserves (zapasy), there are subcategories that include balance reserves (economic reserves or balansovye zapasy) and outside the balance reserves (uneconomic reserves or zabalansovye zapasy), as well as categories that include explored, industrial, and proven reserves, and the reserve totals can vary significantly depending on the specific definition of reserves being reported.

197
APPENDIX D
Country Specialists Directory Minerals information country specialists at the U.S. Geological Survey collect and analyze information on the mineral industries of more than 170 nations throughout the world. The specialists are available to answer minerals-related questions concerning individual countries. Africa and the Middle East Algeria Mowafa Taib Angola Omayra Bermúdez-Lugo Bahrain Mowafa Taib Benin Omayra Bermúdez-Lugo Botswana Harold R. Newman Burkina Faso Omayra Bermúdez-Lugo Burundi Thomas R. Yager Cameroon Harold R. Newman Cape Verde Harold R. Newman Central African Republic Omayra Bermúdez-Lugo Chad Philip M. Mobbs Comoros Harold R. Newman Congo (Brazzaville) Philip M. Mobbs Congo (Kinshasa) Thomas R. Yager Côte d’Ivoire Omayra Bermúdez-Lugo Djibouti Thomas R. Yager Egypt Mowafa Taib Equatorial Guinea Philip M. Mobbs Eritrea Harold R. Newman Ethiopia Thomas R. Yager Gabon Omayra Bermúdez-Lugo The Gambia Omayra Bermúdez-Lugo Ghana Omayra Bermúdez-Lugo Guinea Omayra Bermúdez-Lugo Guinea-Bissau Omayra Bermúdez-Lugo Iran Philip M. Mobbs Iraq Mowafa Taib Israel Thomas R. Yager Jordan Mowafa Taib Kenya Thomas R. Yager Kuwait Philip M. Mobbs Lebanon Mowafa Taib Lesotho Harold R. Newman Liberia Omayra Bermúdez-Lugo Libya Mowafa Taib Madagascar Thomas R. Yager Malawi Thomas R. Yager Mali Omayra Bermúdez-Lugo Mauritania Mowafa Taib Mauritius Harold R. Newman Morocco & Western Sahara Harold R. Newman Mozambique Thomas R. Yager Namibia Omayra Bermúdez-Lugo Niger Omayra Bermúdez-Lugo Nigeria Philip M. Mobbs Oman Mowafa Taib Qatar Mowafa Taib Reunion Harold R. Newman Rwanda Thomas R. Yager São Tomé & Principe Omayra Bermúdez-Lugo Saudi Arabia Philip M. Mobbs Senegal Omayra Bermúdez-Lugo Seychelles Harold R. Newman Sierra Leone Omayra Bermúdez-Lugo Somalia Thomas R. Yager
South Africa Thomas R. Yager Sudan Thomas R. Yager Swaziland Harold R. Newman Syria Mowafa Taib Tanzania Thomas R. Yager Togo Omayra Bermúdez-Lugo Tunisia Mowafa Taib Turkey Philip M. Mobbs Uganda Harold R. Newman United Arab Emirates Mowafa Taib Yemen Mowafa Taib Zambia Philip M. Mobbs Zimbabwe Philip M. Mobbs Asia and the Pacific Afghanistan Chin S. Kuo Australia Pui-Kwan Tse Bangladesh Yolanda Fong-Sam Bhutan Lin Shi Brunei Pui-Kwan Tse Burma (Myanmar) Yolanda Fong-Sam Cambodia Yolanda Fong-Sam China Pui-Kwan Tse East Timor Pui-Kwan Tse Fiji Lin Shi India Chin S. Kuo Indonesia Chin S. Kuo Japan Chin S. Kuo Korea, North Lin Shi Korea, Republic of Lin Shi Laos Yolanda Fong-Sam Malaysia Pui-Kwan Tse Mongolia Susan G. Wacaster Nauru Pui-Kwan Tse Nepal Lin Shi New Caledonia Susan G. Wacaster New Zealand Pui-Kwan Tse Pakistan Chin S. Kuo Papua New Guinea Susan G. Wacaster Philippines Yolanda Fong-Sam Singapore Pui-Kwan Tse Solomon Islands Chin S. Kuo Sri Lanka Chin S. Kuo Taiwan Pui-Kwan Tse Thailand Lin Shi Tonga Chin S. Kuo Vanuatu Chin S. Kuo Vietnam Yolanda Fong-Sam Europe and Central Eurasia Albania Mark Brininstool Armenia1 Elena Safirova Austria2 Steven T. Anderson Azerbaijan1 Elena Safirova Belarus1 Elena Safirova

198
Europe and Central Eurasia—continued Belgium2 Alberto A. Perez Bosnia and Herzegovina Mark Brininstool Bulgaria2 Mark Brininstool Croatia Harold R. Newman Cyprus2 Harold R. Newman Czech Republic2 Steven T. Anderson Denmark, Faroe Islands, and Greenland2 Harold R. Newman Estonia2 Alberto A. Perez Finland2 Alberto A. Perez France2 Alberto A. Perez Georgia Elena Safirova Germany2 Steven T. Anderson Greece2 Harold R. Newman Hungary2 Steven T. Anderson Iceland Harold R. Newman Ireland2 Alberto A. Perez Italy2 Alberto A. Perez Kazakhstan1 Mark Brininstool Kyrgyzstan1 Elena Safirova Latvia2 Alberto A. Perez Lithuania2 Alberto A. Perez Luxembourg2 Alberto A. Perez Macedonia Mark Brininstool Malta2 Harold R. Newman Moldova1 Elena Safirova Montenegro Harold R. Newman Netherlands2 Alberto A. Perez Norway Harold R. Newman Poland2 Mark Brininstool Portugal2 Alfredo C. Gurmendi Romania2 Alberto A. Perez Russia1 Elena Safirova Serbia Mark Brininstool Slovakia2 Harold R. Newman Slovenia2 Harold R. Newman Spain2 Alfredo C. Gurmendi Sweden2 Alberto A. Perez Switzerland Harold R. Newman Tajikistan1 Elena Safirova
Turkmenistan1 Elena Safirova Ukraine1 Mark Brininstool United Kingdom2 Alberto A. Perez Uzbekistan1 Elena Safirova North America, Central America, and the Caribbean Belize Susan G. Wacaster Canada Philip M. Mobbs Costa Rica Susan G. Wacaster Cuba Susan G. Wacaster Dominican Republic Susan G. Wacaster El Salvador Susan G. Wacaster Guatemala Susan G. Wacaster Haiti Susan G. Wacaster Honduras Susan G. Wacaster Jamaica Susan G. Wacaster Mexico Alberto A. Perez Nicaragua Susan G. Wacaster Panama Susan G. Wacaster Trinidad and Tobago Susan G. Wacaster South America Argentina Susan G. Wacaster Bolivia Steven T. Anderson Brazil Alfredo C. Gurmendi Chile Steven T. Anderson Colombia Susan G. Wacaster Ecuador Susan G. Wacaster French Guiana Alfredo C. Gurmendi Guyana Alfredo C. Gurmendi Paraguay Alfredo C. Gurmendi Peru Alfredo C. Gurmendi Suriname Alfredo C. Gurmendi Uruguay Alfredo C. Gurmendi Venezuela Alfredo C. Gurmendi 1Member of Commonwealth of Independent States. 2Member of European Union.
Country specialist Telephone E-mail Steven T. Anderson (703) 648-7744 [email protected] Omayra Bermúdez-Lugo (703) 648-4946 [email protected] Mark Brininstool (703) 648-7798 [email protected] Yolanda Fong-Sam (703) 648-7756 [email protected] Alfredo C. Gurmendi (703) 648-7745 [email protected] Chin S. Kuo (703) 648-7748 [email protected] Philip M. Mobbs (703) 648-7740 [email protected] Harold R. Newman (703) 648-7742 [email protected] Alberto A. Perez (703) 648-7749 [email protected] Elena Safirova (703) 648-7731 [email protected] Lin Shi (703) 648-7994 [email protected] Mowafa Taib (703) 648-4986 [email protected] Pui-Kwan Tse (703) 648-7750 [email protected] Susan G. Wacaster (703) 648-7785 [email protected] Thomas R. Yager (703) 648-7739 [email protected]