mineralogical aspects of three drill cores along the
TRANSCRIPT

Saskatchewan Geological Survey 1 Summary of Investigations 2002, Volume 2
Mineralogical Aspects of Three Drill Cores Along the McArthurRiver Transect Using a Portable Infrared Spectrometer
J.B. Percival 1, K. Wasyliuk 2, T. Reif 3, S. Bernier 4, G. Drever 2, and C.T. Perkins 2
Percival, J.B., Wasyliuk, K., Reif, T., Bernier, S., Drever, G., and Perkins, C.T. (2002): Mineralogical aspects of three drill coresalong the McArthur River transect using a portable infrared spectrometer; in Summary of Investigations 2002, Volume 2,Saskatchewan Geological Survey, Sask. Industry Resources, Misc. Rep., 2002-4.2, CD-ROM, Paper D-14, 15p.
AbstractDetailed logging and infrared analyses of samples from three drill cores were completed during field activities in2002 at the McArthur River mine site in northern Saskatchewan. Both FieldSpec Pro and PIMA-II portablespectrometers were used to determine mineralogy of the matrix in representative samples selected every 1.5 m.Spectral data from the FieldSpec Pro were converted to PIMA format and processed using the MINSPEC algorithmfor semi-quantitative mineral analysis. Results for the three cores are highly comparable, although a separatealgorithm is needed for processing FieldSpec Pro spectra.
Mineralogy distribution in each core is similar. The upper MFa and MFb members of the Manitou Falls Formationcontain abundant kaolinite with subordinate dravite and chlorite. Illite is present in variable amounts. There is asharp increase in illite content at the base of MFb. From there, illite gradually decreases to the unconformity asdickite concomitantly increases. The preservation of dickite, the regional diagenetic clay mineral, is due to intensesilicification in MFc and MFd. Alteration minerals in basement rocks include chlorite and illite with minor kaoliniteand dravite. Illite and chlorite reflect circulating hydrothermal fluids and dravite has been ascribed to mineralizingfluids. The clay mineral distributions are controlled by parameters such as porosity, permeability, and fluidpressures as well as fluid chemistry and follow lithological variations in the Manitou Falls Formation.
Keywords: infrared spectroscopy, FieldSpec Pro, PIMA-II, clay mineralogy, dickite, kaolinite, illite, chlorite,dravite, McArthur River, uranium deposits.
1. Introduction
Clay minerals are a major component of the sandstones and alteration haloes surrounding the world-classunconformity-type uranium deposits in the Athabasca Basin. Their genesis can be related to several processesincluding paleo-weathering, sedimentation, diagenesis and hydrothermal alteration. As sensitive indicators of a lowtemperature environment (Keller, 1970; Hoeve and Quirt, 1984), the composition, structure, and crystallinity of theclay minerals are controlled by temperature, fluid chemistry, and fluid flux. The nature and extent of alteration canprovide valuable information about diagenetic/hydrothermal conditions and depth of burial in a sedimentaryenvironment (Kisch, 1983; Percival et al., 1993).
This study forms part of a larger project, the EXTECH IV–Athabasca Uranium Multidisciplinary Study, which is anintegrated partnership between the geological surveys of Saskatchewan, Alberta, and Canada, Cameco Corp.,COGEMA Resources Inc., and the universities of Alberta, Laurentian, Regina, and Saskatchewan (Jefferson andDelaney, 2001). The main objective of this sub-project (Clay Mineralogy) is to use clay mineralogy to enhance theinterpretation of stratigraphy, diagenesis, basement geology, geophysical surveys (i.e., gamma ray) and surficialgeology, thereby assisting in the development of exploration tools and an improved geological framework for thesedeposits.
This report summarizes the results from fieldwork undertaken in June 2002 in the McArthur River area of northernSaskatchewan. During this time several drill cores were logged using Palm PDA’s as described in Yeo et al. (2001).In addition, a portable infrared spectrometer (FieldSpec Pro FR, Analytical Spectral Devices, Inc.), newly acquiredat the Geological Survey of Canada, was field tested in concert with Cameco’s PIMA-II infrared spectrometer(Integrated Spectronics Ltd.).
1 Geological Survey of Canada, 601 Booth Street, Ottawa, ON K1A 0E8; E-mail: [email protected] Cameco Corporation, 2121 11th Street West, Saskatoon, SK S7M 1J3.3 Office of Minerals and Energy Resources South Australia, 101 Grenfell Street, Adelaide, SA 5001.4 Department of Earth Sciences, Laurentian University, Ramsey Lake Road, Sudbury, ON P3E 2C6.

Saskatchewan Geological Survey 2 Summary of Investigations 2002, Volume 2
2. Materials and Methods
Three drill holes, MAC-198,MAC-218, and RL-064, locatedalong the high-resolution seismictransect of the P2 fault zone andthe McArthur River mine area(Gyorfi et al., this volume), werelogged and systematicallysampled (Figure 1). Forstratigraphic purposes,observations were made for every1 m interval and recorded on ahand-held Palm III PDA. Keyparameters of interest includemaximum transported grain sizein millimetres (MTG), percentgrains greater than sand(%>2 mm), aggregate thicknessand type of intraclasts, percentmatrix clay, silicification, andfriability. More detaileddiscussion on the choice ofparameters is given in Jeffersonet al. (2001) and Bernier et al.(2001). In addition, the coreswere also logged on a row-by-row basis and a representativesample was selected from eachrow for further analyses. Thesamples were split in the field,sun-dried and then analyzed insitu using both PIMA-II andFieldSpec Pro infraredspectrometers.
Both the PIMA-II and FieldSpecPro instruments are field-portableinfrared spectrometers that canprovide rapid in situ qualitative tosemi-quantitative clay mineralanalyses. Infrared analysis is particularly useful in differentiating between the kaolin-group polymorphs, kaoliniteand dickite, both of which occur in the Athabasca sandstones. The PIMA-II instrument measures reflectancewavelengths from 1300 to 2500 nm (short-wavelength infrared region or SWIR) and mineral identification is basedon the wavelength position and shape of absorption peaks. Spectral data collected from Athabasca Group sampleswith known mineral proportions were used to develop an algorithm for semi-quantitative analyses (Earle, 1994,1995, 1996). The mineral proportions were originally determined using XRD (Hoeve et al., 1981). Estimatescalculated from PIMA-II spectra are thus rapidly obtained for the common minerals present in the AthabascaGroup, including illite, chlorite, dickite, kaolinite, and dravite (field term for microcrystalline blue tourmaline).
The FieldSpec Pro measures reflectance wavelengths from 350 to 2500 nm and includes the visible (350 to780 nm), near infrared (780 to 1300 nm), and SWIR region (1300 to 2500 nm). Instrument specifications are listedin Table 1 for both spectrometers. Although the instruments operate with different detectors, other parameters arecomparable. Spectral resolution for the PIMA-II is 7 nm for the SWIR region and for the FieldSpec Pro resolutionranges from 3 nm in the visible and near infrared range, and up to 10 in the SWIR region. PIMA-II uses morespectral channels for the SWIR than the FieldSpec Pro.
As the FieldSpec Pro is a relatively new acquisition, the software to process the spectra in a similar manner to thePIMA-II spectra is not yet available. In order to provide some preliminary estimates of mineral content, the spectrawere processed in a somewhat convoluted manner. The spectra files were converted from the FieldSpec Pro format(350 to 2500 nm) to the PIMA format (1300 to 2500 nm) and then processed using Cameco’s program MINSPEC(Earle, 1996). Preliminary results were compiled in a Microsoft Excel spreadsheet and then brought into Logview(Elliott et al., 1996; Markarian et al., 1996) for plotting purposes.
Figure 1 - Location of drill holes at the McArthur River uranium deposit. The regionalseismic reflection lines, A-A' and B-B', are shown for context. The P2 North uraniumdeposit is located on the P2 Structure at about its intersection with line A-A'.

Saskatchewan Geological Survey 3 Summary of Investigations 2002, Volume 2
Table 1 - Instrument specifications for PIMA-II and FieldSpec Pro FR portable infrared spectrometers.
PIMA-II FieldSpec Pro FR
Detector PbS Si photo-diode 350 to 1000 nmInGaAs @1000 to 2500 nm
Wavelength Interval 1300 to 2500 nm 350 to 2500 nmSpectral Resolution ~7 nm 3 nm @ 700 nm
10 nm @ 1400 and 2100 nmSampling Interval 2 or 4 nm (selectable) 1.4 nm @ 350 to 1050 nm
2 nm @ 1000 to 2500 nmSpectral Channels 601 2148
512 @ 350 to 1000 nm528 @ 1000 to 1800 nm528 @ 1800 to 2500 nm
Sampling Time 20 to 60 s (mode dependent) 100 msCalibration Automatic Uses Spectralon disc
3. Results
Some of the key logging parameters are plotted for each drill core in Figures 2 to 4. Overall, grain size decreasesupwards (see MTG and %>2 mm columns), beginning with interbedded conglomerate and sandstone with redmudstones, typical of the lowermost MFa member. The contact between MFa and MFb is interpreted as adisconformity (Bernier, this volume). At this boundary, the fluvial facies change upward from flat-laminated andcross-bedded sandstone to a coarser sandstone (even conglomerate) rich in cross-beds (trough?) but lacking flat-laminations (Bernier, this volume). Other differences between MFa and MFb are in the mudstones which arecommonly red, desiccation-cracked, scoured and reworked as intraformational conglomerates in MFa, but grey orgreen, uncracked, non-scoured and rarely ripped-up in MFb. In all three cores, the MFd (upper member) ischaracterised by abundant intraclasts. Intraclasts are minor in MFb, although conglomerate beds are also abundantin MFb3.
Two of the three cores were observed to be intensely silicified (based on tombstone appearance). MAC-198 ishighly silicified between 347 and 400 m and MAC-218 below 330 m. RL-064 is moderately silicified, but has nozone that is considered highly silicified.
Mineralogy of the matrix as determined using FieldSpec Pro and PIMA-II infrared spectrometers is plotted for eachdrill core in Figures 5 to 7. Overall, results for both instruments are comparable, although illite content appears to beslightly greater in the FieldSpec Pro data set, and dravite content more in the PIMA-II data set. In some samples, akaolinite-dickite mixed layer clay mineral was determined, but to simplify the plots it was included as dickite.
In MAC-198, the upper part (<200 m) is dominated by kaolinite with variable amounts of chlorite (variety sudoite)and dravite. Minor to trace amounts of illite occur in some zones. Between 200 and 400 m, illite dominates and thendecreases with depth as dickite content increases from 300 to 480 m. Below the unconformity, basement rockscontain abundant chlorite. MAC-218 shows a similar mineral distribution with depth. The upper section to thebottom of the MFd (<200 m), is dominated by kaolinite, chlorite, minor dravite and variable amounts of illite.Below this (in MFc), illite dominates but decreases with depth as dickite content increases. The basement rocks arechlorite-rich. Note that in both sections, there is a sharp change in mineralogy at or near the base of MFd.
Core RL-064 contains abundant kaolinite in the MFd unit (<200 m) but contains more variable amounts of chlorite.Dravite content increases in the lower part of MFd and in MFc; and the greatest proportions occur in an intraclast-rich zone. The change from kaolinite-dominant to illite occurs at the base of the MFc. From this point until theunconformity dickite is abundant in distinct zones. Basement rocks contain abundant illite and only traces ofchlorite.
For each of these cores, large intraclasts were analysed separately. An example of their composition, in relation tothe matrix composition is given in Table 2. There appears to be only a few samples that show any significantdifferences.
4. Discussion
In this study, the validity of the FieldSpec Pro data relative to the PIMA-II was tested, because the algorithm used toprocess the spectra was developed for the PIMA-II instrument. A series of standards were initially processed for this

Saskatchewan Geological Survey 4 Summary of Investigations 2002, Volume 2
Figure 2 - Plot of selected key logging parameters for drill hole MAC-198. Stratigraphic subdivisions after Ramaekers (1990)and Ramaekers et al. (2001).

Saskatchewan Geological Survey 5 Summary of Investigations 2002, Volume 2
Figure 3 - Plot of selected key logging parameters for drill hole MAC-218. Stratigraphic subdivisions after Ramaekers (1990)and Ramaekers et al. (2001).

Saskatchewan Geological Survey 6 Summary of Investigations 2002, Volume 2
Figure 4 - Plot of selected key logging parameters for drill hole RL-064. Stratigraphic subdivisions after Ramaekers (1990)and Ramaekers et al. (2001).

Saskatchewan Geological Survey 7 Summary of Investigations 2002, Volume 2
Figure 5 - Mineralogy of the matrix of selected samples (every 1.5 m) plotted against depth for FieldSpec Pro and PIMAspectral data for MAC-198. Each column shows mineralogical data plotted as cumulative percent in order of illite, chlorite,dickite, kaolinite, and dravite. Each inflection point represents a sample.

Saskatchewan Geological Survey 8 Summary of Investigations 2002, Volume 2
Figure 6 - Mineralogy of the matrix of selected samples (every 1.5 m) plotted against depth for FieldSpec Pro and PIMAspectral data for MAC-218. Each column shows mineralogical data plotted as cumulative percent in order of illite, chlorite,dickite, kaolinite, and dravite. Each inflection point represents a sample.

Saskatchewan Geological Survey 9 Summary of Investigations 2002, Volume 2
Figure 7 - Mineralogy of the matrix of selected samples (every 1.5 m) plotted against depth for FieldSpec Pro and PIMAspectral data for RL-064. Each column shows mineralogical data plotted as cumulative percent in order of illite, chlorite,dickite, kaolinite, and dravite. Each inflection point represents a sample.

Saskatchewan Geological Survey 10 Summary of Investigations 2002, Volume 2
Table 2 - Comparison of mineralogy from selected samples showing variations between the matrix and large intraclasts forRL-064.
test. The FieldSpec Pro results showed that illite was overestimated by MINSPEC at the expense of other minerals,particularly chlorite and dravite. In turn, it has been previously noted that chlorite and dravite are in some casesoverestimated with respect to illite by MINSPEC for PIMA spectra. True confirmation would come from X-raydiffraction analysis, however, a minimum amount (e.g., 2 to 3 wt %) is needed for detection and in some of thesesamples, there is less than 5% matrix.
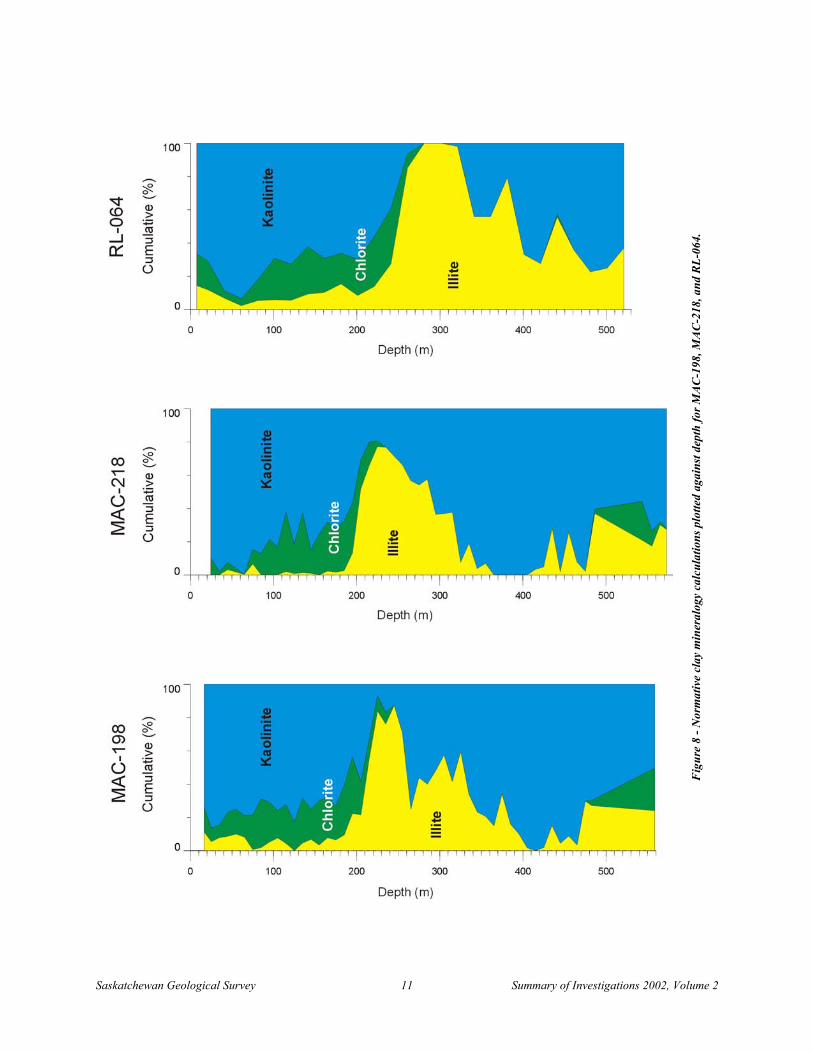
As further validation, the normative clay mineralogy was plotted for each core in Figure 8. Normative mineralogy isbased on major element chemistry (Al2O3, K2O, MgO) of composite samples every 10 to 20 m (combined chipsover the sampled interval). For MAC-198, there is a low but consistent amounts of illite in the upper 200 m, similarto the FieldSpec Pro results. Illite content peaks at about 250 m and steadily decreases with depth to the basement.Chlorite is in the upper unit as well as in the basement wedge. Kaolinite (here as undifferentiated kaolinite anddickite) dominates throughout the section. Dravite was not calculated, but its presence can be correlated to the Bcontent (see Figure 9).
In contrast to MAC-198, the normative mineralogy calculations revealed MAC-218 does not have as much illite inthe upper 200 m (Figure 8); this is more consistent with the PIMA results. Increase in illite in MFb and occurrenceof chlorite are reflected in both of the infrared data sets. Kaolinite group minerals also dominate throughout thesection.
Depth (m) Sample Type Illite Chlorite Dickite Kaolinite Dravite20.73 Intraclast 9 27 0 53 11
Matrix 14 0 0 35 5145.45 Intraclast 12 21 0 60 7
Matrix 0 40 0 33 2757.28 Intraclast 28 0 0 72 0
Matrix 22 9 0 69 058.73 Intraclast 3 21 0 61 15
Matrix 42 0 0 58 0109.38 Intraclast 0 50 0 22 28
Matrix 0 60 0 26 14116.67 Intraclast 0 39 0 50 11
Matrix 2 20 0 67 11128.23 Intraclast 0 41 0 48 11
Matrix 7 18 0 63 12163.91 Intraclast 0 0 0 3 97
Matrix 0 0 0 6 94165.32 Intraclast 0 0 0 0 100
Matrix 0 0 0 4 96190.03 Intraclast 36 0 0 37 27
Matrix 21 0 0 64 15205.04 Intraclast 42 0 0 18 40
Matrix 48 0 0 22 30362.83 Intraclast 44 0 56 0 0
Matrix 48 0 52 0 0
Saskatchewan Geological Survey 11 Summary of Investigations 2002, Volume 2
Fig
ure
8 -
Nor
mat
ive
clay
min
eral
ogy
calc
ula
tion
s pl
otte
d ag
ain
st d
epth
for
MA
C-1
98, M
AC
-218
, an
d R
L-0
64.
Saskatchewan Geological Survey 12 Summary of Investigations 2002, Volume 2
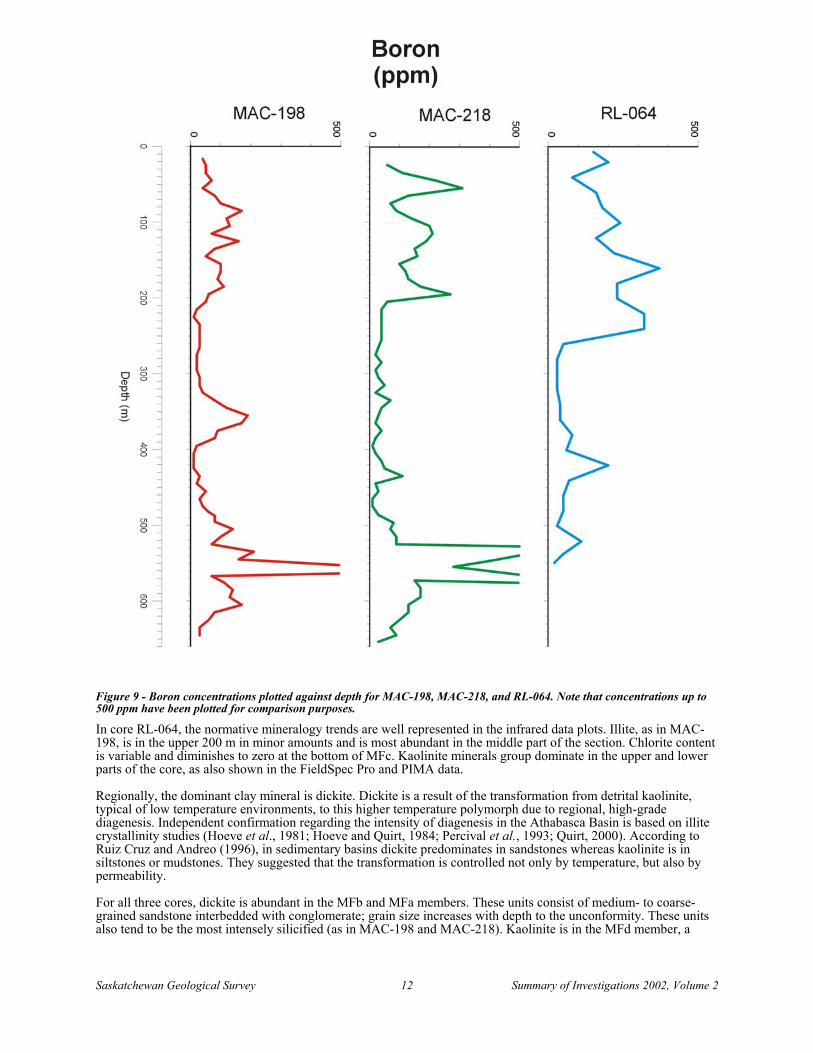
Figure 9 - Boron concentrations plotted against depth for MAC-198, MAC-218, and RL-064. Note that concentrations up to500 ppm have been plotted for comparison purposes.
In core RL-064, the normative mineralogy trends are well represented in the infrared data plots. Illite, as in MAC-198, is in the upper 200 m in minor amounts and is most abundant in the middle part of the section. Chlorite contentis variable and diminishes to zero at the bottom of MFc. Kaolinite minerals group dominate in the upper and lowerparts of the core, as also shown in the FieldSpec Pro and PIMA data.
Regionally, the dominant clay mineral is dickite. Dickite is a result of the transformation from detrital kaolinite,typical of low temperature environments, to this higher temperature polymorph due to regional, high-gradediagenesis. Independent confirmation regarding the intensity of diagenesis in the Athabasca Basin is based on illitecrystallinity studies (Hoeve et al., 1981; Hoeve and Quirt, 1984; Percival et al., 1993; Quirt, 2000). According toRuiz Cruz and Andreo (1996), in sedimentary basins dickite predominates in sandstones whereas kaolinite is insiltstones or mudstones. They suggested that the transformation is controlled not only by temperature, but also bypermeability.
For all three cores, dickite is abundant in the MFb and MFa members. These units consist of medium- to coarse-grained sandstone interbedded with conglomerate; grain size increases with depth to the unconformity. These unitsalso tend to be the most intensely silicified (as in MAC-198 and MAC-218). Kaolinite is in the MFd member, a

Saskatchewan Geological Survey 13 Summary of Investigations 2002, Volume 2
fine-grained sandstone, as well as in the basement below the unconformity (possibly related to the basementregolith, zone of intense paleo-weathering).
Dravite tends to be localized along fractures and faults. Dravite in other units has been ascribed to mineralizingfluids. Figure 9 plots Boron content with depth for the three cores. For comparison purposes, concentrations up to500 ppm are plotted but in MAC-198 and MAC-218 concentrations range up to 1950 and 1300 ppm, respectively.Slightly elevated Boron concentrations (background <20 ppm) correspond to dravite as shown in Figures 5 to 7 (seealso Zhang et al., 2001). In the basement, there is an intense Boron anomaly associated with mineralization, but thisis not reflected in the infrared data. For MAC-198 and MAC-218, the high concentration of chlorite may interfere inthe calculation of dravite due to their peak positions. Chlorite in the basement is clinochlore, not sudoite. Inaddition, the signal/noise ratio for the basement samples is noticeably low (<10) due to their darker colour.
Illite and chlorite in the core reflect circulating hydrothermal fluids. Earle and Sopuck (1989) attributed a regionalillite anomaly to hydrothermal alteration along major structural features extending from McArthur River to KeyLake. Clay mineral distributions are controlled by parameters such as porosity, permeability, and fluid pressures aswell as fluid chemistry. Subtle variations are related to stratigraphically or structurally controlled small-scaleporosity/permeability contrasts (Wasyliuk, 2002).
5. Summary
The trends in clay mineralogy with depth, in all three cores are similar, reflecting their geographic proximity. Ingeneral, the clay mineral distributions surrounding the McArthur River deposit are controlled structurally andlithologically by the porosity and permeability characteristics of the Manitou Falls Formation and its individualmembers. Regional dickite with lesser illite has been altered to illite and kaolinite/dravite/chlorite and zoned similarto Key Lake (Earle et al., 1996). However, zonation has been inverted due to the affects of an early silicificationevent in the lower sandstone immediately above the mineralization.
Subtle differences in the spectra between the PIMA-II and FieldSpec Pro instruments resulted in some discrepanciesin the semi-quantitative clay estimates using the MINSPEC algorithm. This suggests that separate algorithms needto be derived for both instruments. This does not imply that infrared (SWIR) spectroscopy cannot be used toquantify clay or alteration minerals. The use of SWIR to quantitatively estimate clay or mineral proportions isrelatively new. However, recent studies (Zhang et al., 2001) have shown that high-quality, quantitative results canbe obtained provided that peak resolution is established using the appropriate mineral standards, and that artificialmixtures can be created and used to develop the best-fit algorithms.
6. Acknowledgments
The authors are grateful to P. Hauff and E. Prosh (Spectral International, Inc.) for their guidance in the use of theFieldSpec Pro and to W. Peppin (Advanced Software Applications, Inc.) for producing a batch program to convertfiles into PIMA-II format. Thanks also to Sean Bosman (University Western Ontario) and Maria Karagiorgakis(Laurentian University) for their assistance in the field logging and collecting infrared analyses. Reviews by J.Harris and C.W. Jefferson (Geological Survey of Canada) are gratefully acknowledged. This paper is GeologicalSurvey of Canada Contribution No. 2002165.
7. References
Bernier S., Jefferson, C.W., and Drever, G.L. (2001): Aspects of the stratigraphy of the Manitou Falls AthabascaBasin, in the vicinity of the McArthur River Uranium Deposit, Saskatchewan: Preliminary observations; inSummary of Investigations 2001, Volume 2, Saskatchewan Geological Survey, Sask. Energy Mines, Misc. Rep.2001-4.2, CD B, p291-296.
Earle, S. (1994): Application of reflectance spectrometry to analysis of Manitou Falls Formation samples; unpubl.rep. Cameco Corp., 22p.
__________ (1995): Quantitative reflectance spectrometry for analysis of the clay mineralogy of the AthabascaBasin rock samples; unpubl. rep., Cameco Corp., 7p.
__________ (1996): Evaluation of the reliability of mineral proportion estimates from PIMA-II reflectancespectrometer and MINSPEC1 program; unpubl. rep., Cameco Corp., 21p.

Saskatchewan Geological Survey 14 Summary of Investigations 2002, Volume 2
Earle, S. and Sopuck, V. (1989): Regional lithogeochemistry of the eastern part of the Athabasca Basin uraniumprovince, Saskatchewan; in Muller-Kahle, E. (ed.), Uranium Resources and Geology, North America, Internat.Atomic Energy Agency, TECDC-500, p263-294.
Earle, S., Wheatley, K., and Wasyliuk, K. (1996): Application of reflectance spectroscopy to the assessment ofalteration mineralogy in the Key Lake area; in Ashton, K.E. and Harper, C.T. (eds.), Proceedings ofMinExpo'96 Symposium, Advances in Saskatchewan Geology and Mineral Exploration, Sask. Geol. Soc.,Spec. Publ. No. 14, p109-123.
Elliott, B.E., Killeen, P.G., Pflug, K.A., and Mwenifumbo, C.J. (1996): LogView: Borehole geophysical softwarefor presentation quality output; in Proceedings of the 6th International Symposium on Borehole Geophysics forMinerals, Geotechnical and Groundwater Applications, Santa Fe, Oct 22-25, Paper P, p1-18.
Hoeve, J. and Quirt, D. (1984): Mineralization and host rock alteration in relation to clay mineral diagenesis andevolution of the Middle-Proterozoic, Athabasca Basin, northern Saskatchewan, Canada; Sask. Resear. Counc.,Tech. Rep. 187, 187p.
Hoeve, J., Rawsthorn, K., and Quirt, D. (1981): Uranium metallogenic studies: Clay mineral stratigraphy anddiagenesis in the Athabasca Group; in Summary of Investigations 1981, Saskatchewan Geological Survey,Sask. Energy Mines, Misc. Rep. 81-4, p76-89.
Jefferson, C.W. and Delaney, G. (2001): Multidisciplinary EXTECH IV Athabasca uranium study: Project update;in Summary of Investigations, Volume 2, Saskatchewan Geological Survey, Sask. Energy Mines, Misc. Rep.2001-4.2, CD B, p187-198.
Jefferson, C.W., Percival, J.B., Bernier, S., Cutts, C., Drever, G., Jiricka, D., Long, D., McHardy, S., Quirt, D.,Ramaekers, P., Wasyliuk, K., and Yeo, G.M. (2001): Lithostratigraphy and mineralogy in the easternAthabasca Basin, northern Saskatchewan – Progress in year 2 of EXTECH IV; in Summary of Investigations2001, Volume 2, Saskatchewan Geological Survey, Sask. Energy Mines, Misc. Rep. 2001-4.2, CD B, p272-290.
Keller, W.D. (1970): Environmental aspects of clay minerals; J. Sed. Petrol. v40, p788-813.
Kisch, H.J. (1983): Mineralogy and petrology of burial diagenesis (burial metamorphism) and incipientmetamorphism in clastic rocks; in Larsen, G. and Chilingar, G.V. (eds.), Diagenesis in Sediments andSedimentary Rocks, Volume 2, Elsevier, Amsterdam, p289-493.
Markarian, D., Grant, J.A., and Elliott, B.E. (1996): LogView - A Microsoft Windows 3.1 application to viewborehole log (geophysical and geological) data; Geol. Surv. Can., Open File 3055, 1 diskette.
Percival, J.B., Bell, K., and Torrance, J.K. (1993): Clay mineralogy and isotope geochemistry of alterationassociated with the Cigar Lake deposit; Can. J. Earth Sci., v30, p689-704.
Quirt, D. (2000): Kaolin-group clay minerals in the Athabasca sandstone, northern Saskatchewan, Canada; Sask.Resear. Counc. Publ. 10400-9D00, 24p.
Ramaekers, P. (1990): Geology of the Athabasca Group (Helikian) in Northern Saskatchewan; Sask. Energy Mines,Rep. 195, 49p.
Ramaekers, P., Yeo, G., and Jefferson, C.W. (2001): Preliminary overview of regional stratigraphy in the latePaleoproterozoic Athabasca Basin, Saskatchewan and Alberta; in Summary of Investigations 2001, Volume 2,Saskatchewan Geological Survey, Sask. Energy and Mines, Misc. Rep. 2001-4.2, CD B, p240-251.
Ruiz Cruz, M.D. and Andreo, B. (1996): Genesis and transformation of dickite in Permo-Triassic sediments (BeticCordilleras, Spain); Clay Minerals, v31, p133-152.
Wasyliuk, K. (2002): Petrogenesis of the kaolinite-group minerals in the eastern Athabasca basin of northernSaskatchewan: Applications to uranium mineralization; unpubl. M.Sc. thesis, Univ. Saskatchewan, 140p.
Yeo, G., Jefferson, C., Ramaekers, P., and Tong, K. (2001): From palm to plot: Core logging in the EXTECH IVAthabasca Basin stratigraphy sub-project; in Summary of Investigations 2001, Volume 2, SaskatchewanGeological Survey, Sask. Energy Mines, Misc. Rep. 2001-4-2, CD B, p314-320.

Saskatchewan Geological Survey 15 Summary of Investigations 2002, Volume 2
Zhang, G., Wasyliuk, K., and Pan, Y. (2001): The characterization and quantitative analysis of clay minerals in theAthabasca Basin, Saskatchewan: Application of short-wave infrared reflectance spectroscopy; Can. Miner.,v39, p1347-1363.