mineralogy, chemical composition and leachability of ash
TRANSCRIPT
67
MINERALOGIA, 49, No 1-4: 67-97 (2018)
DOI: 10.2478/mipo-2018-0008
www.Mineralogia.pl
MINERALOGICAL SOCIETY OF POLAND
POLSKIE TOWARZYSTWO MINERALOGICZNE
Original paper Mineralogy, chemical composition and leachability of ash from biomass combustion and biomass–coal co-combustion Wanda Wilczyńska-Michalik1*, Renata Gasek1, Marek Michalik2, Janusz Dańko3, Tadeusz Plaskota4 1Institute of Geography, Pedagogical University, 30-084 Kraków, ul. Podchorążych 2 2Institute of Geological Sciences, Jagiellonian University, 30-387 Kraków, ul. Gronostajowa 3a 3PGE Energia Ciepła Oddział nr 1, Ciepłownicza 1, 31-574 Kraków 4Przedsiębiorstwo Gospodarki Komunalnej i Mieszkaniowej Spółka z o.o. w Nowej Dębie
* Corresponding author
e-mail: [email protected]
Received: October 21, 2018 Received in revised form: December 16, 2018
Accepted: December 18, 2018 Available online: January 31, 2019
Abstract. Ash samples from biomass combustion or co-combustion with coal were analysed. The aim of this study of ash was to determine its mineral and chemical composition, and the chemical composition of solutions obtained during one-step water extraction. Besides the chemical analysis, X-ray diffraction (XRD) and scanning electron microscopy coupled with energy dispersive spectrometry (SEM-EDS) were applied.
The mineral and chemical composition of ash samples differ strongly. The content of heavy metals in the ash is generally low, but in some samples the limits of the content of some elements determined for fertilizers or soil amendments are exceeded. The relatively poor correlation between the concentration in leachate and bulk content in ash indicates that numerous elements are present in different forms in the studied samples. The results indicate that the potential use of biomass ash, or ash from biomass–coal co-combustion, requires complex studies that explore ash and leachates.
Key-words: biomass ash, mineral and chemical composition, leachability, biomass combustion and biomass–coal co-combustion, hazardous elements 1. Introduction
The leaching of major compounds or potentially hazardous minor or trace elements
from ash obtained during the combustion of solid fuels is important in determining the
68
fields of application for ash, or its possible environmental impact. Biomass combustion or biomass-coal co-combustion in professional power plants for heat and power generation is increasing in Europe (Bogush et al. 2018). Biomass is also commonly used as a fuel in small or medium-size boilers for heat production. It is expected that biomass would contribute up to 33-50% world’s primary energy consumption by 2050 (López et al. 2018). Importance of proper management of biomass combustion residues is growing systematically.
In this paper, we present the effects of the water leaching of ash obtained during biomass combustion or biomass–coal co-combustion. Discussion of leaching results is related to mineral and chemical composition of ash samples. Six samples representing bottom ash were obtained during the combustion of biomass (different types of wood and their mixtures) in a medium-size grate boiler devoid of any flue gas cleaning system. Combustion of biomass in medium or small boilers is often considered as a reasonable option in renewable energy production in Poland (Wiśniewski et al. 2012). Other samples were collected in professional power plants. Two samples represent fly ash from biomass combustion in fluidised bed boilers, and four samples fly ash from biomass–coal co-combustion in pulverised fuel boilers.
We used a one-stage batch leaching test in deionised water over 24 h to obtain data on the short-term effect of the ash–water interaction. Comparison of the leaching properties of different types of ash is eligible because both types of ashes (fly ash from professional power plants and bottom ash from medium size boilers) are commonly utilised, and the migration of the elements to the environment could be potentially hazardous.
The leachability of various elements from biomass ash could be significant because of high or very high content of soluble fraction. According to Vassiliev et al. (2014), the content of soluble fraction can be up to 61 wt%. Vassiliev et al. (2014) distinguish highly water-soluble components as chlorides (sylvite, halite), sulphates (arcanite, syngenite, ettringite, gypsum), oxides (lime), hydroxides (portlandite), nitrates, carbonates, and bicarbonates; less soluble components as carbonates (calcite), phosphates (phosphorites), and oxides (periclase); and slightly soluble components as phosphates (apatite), and silicates (Ca silicates, feldspars). Their content in biomass ash is not only related to the biomass type, but also to the content of the detrital minerals deposited on growing plants from the atmosphere (dry and wet deposition) or derived from the soil during harvesting. Low content of Al, usually observed in biomass, results in the scarcity of aluminosilicates in biomass ash. Aluminosilicates bind numerous relatively durable chemical elements. The retention of nutrient elements in biomass ash is often high what suggest that ash can be important in nutrients recycling (Demeyer et al. 2001; Ingerslev et al. 2011). Biomass ash can be also considered as a source of phosphorous for fertilizer production (Tan, Lagerkvist 2011). In both cases leachability of hazardous elements from ash is of the utmost importance.
The opinion that biomass is relatively poor in hazardous elements is not supported by detailed analyses (Vassilev et al. 2014). Hazardous elements in biomass are more mobile during combustion compared with coal, and are also more susceptible to leaching from ash (Vassilev et al. 2014). In the case of biomass cultivated on polluted sites, the concentration of various elements in ash (temperature of experimental ashing: 475oC) could be very high, e.g. Zn above 1 wt%, Pb up to 2800 ppm (Michalik et al. 2013). According to Kovacs et al.

69
(2013), ash from plants grown on contaminated mining areas must be treated as toxic waste.
Ash from coal combustion contains high amounts of amorphous or crystalline aluminosilicates and quartz. Although the content of soluble fraction in coal fly ash is relatively low, the leaching of potentially hazardous elements could be high. This is caused by the large specific surface of fly ash particles and adsorption of numerous volatile, often potentially toxic elements on or within the outermost part of fly ash particles during the cooling of the flue gas in the power plant installation (Querol et al. 1996). The concentration of volatile elements increases in fly ash with decreases in the temperature of fly ash collection from the flue gas and increased fly ash surface area (Mardon et al. 2008). Co-combustion of biomass with coal can result in the production of fly ash differing from the fly ash obtained from coal combustion by a higher content of soluble fraction, higher content of unburned coaly matter, and higher content of fine particles different in composition when compared with coal-fired power plant (Johansson et al. 2003; Jiménez et al. 2005; Zheng et al. 2007; Kalembkiewicz, Chmielarz 2012; Nzihou, Stanmore 2013). On the other hand, it is often considered that during the combustion of coal–biomass blends with less than 20% biomass, aluminosilicates dominate in the ash (Degereji et al. 2013). The addition of biomass can modify the ash composition from mullite-rich aluminosilicates typical for coal combustion into calcium aluminosilicates (anorthite/gehlenite-rich) (Priyanto et al. 2016).
2. Material
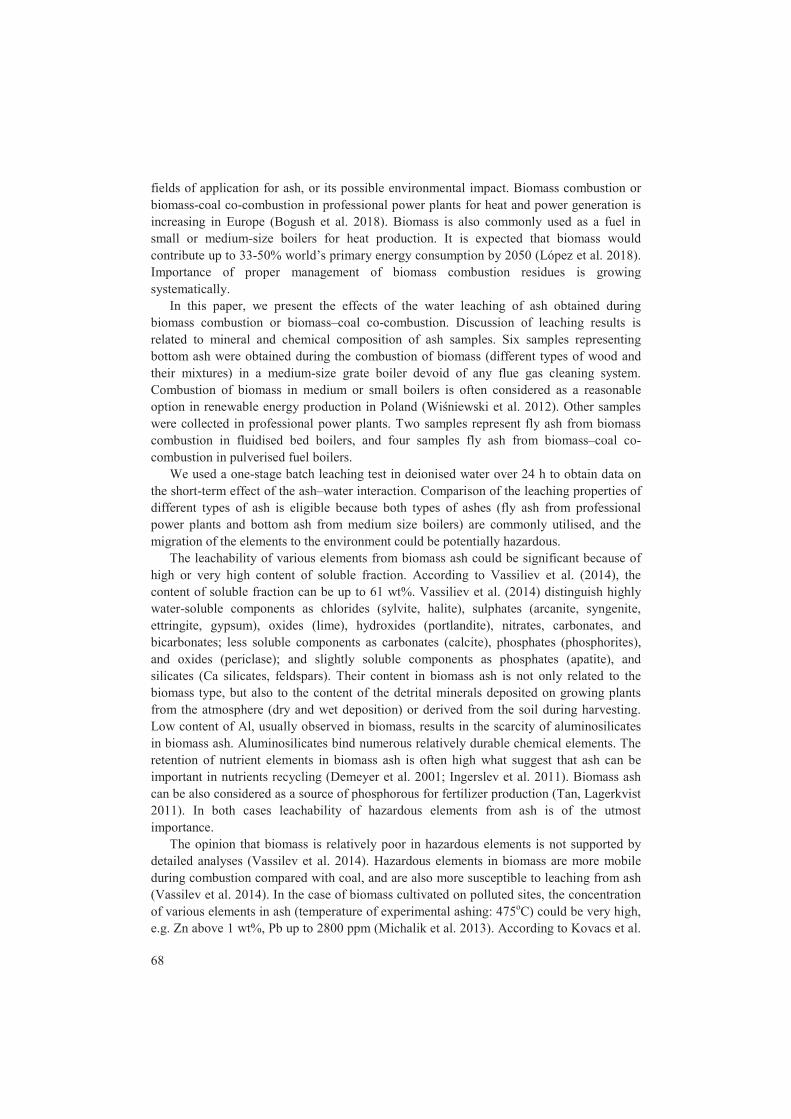
Ash samples were collected in different installations fired with different fuels (Table 1).
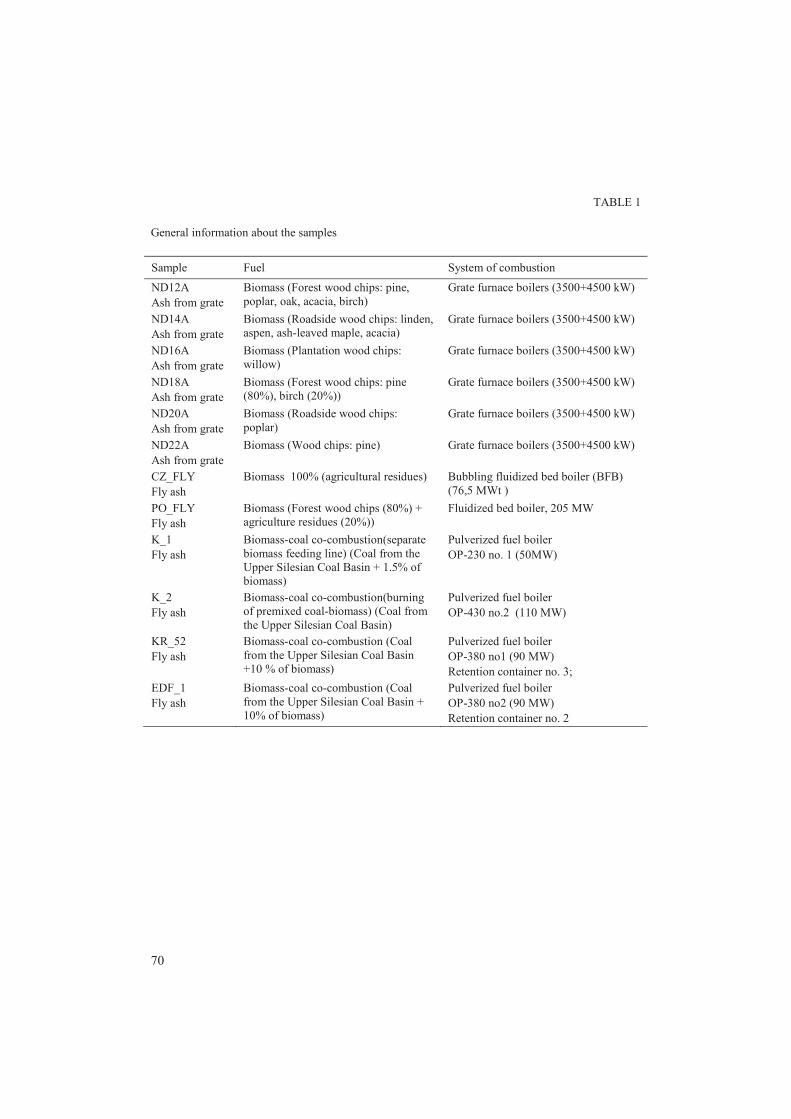
The ash samples differ strongly. The samples from the medium-size boilers are composed of porous irregular fragments, sandy material and charcoal fragments in various proportions (Table 2). Meanwhile, the samples from the boilers in the professional power plants are very fine-grained, homogenous, and differing slightly in colour, except for one sample (PO_FLY) containing visible small charcoal fragments (Table 2).
3. Analytical methods
The mineral composition of ash before and after leaching, as well as the dry residue
after evaporation of the leachates, was determined using X-ray diffraction (XRD). XRD analyses of powdered samples were performed using a Philips X’Pert APD diffractometer (PW1830 generator and PW3020 vertical goniometer). A voltage of 40 kV and 30 mA current were applied. The samples were irradiated by CuKα radiation and the data were collected in the range of 2–64 °2Θ, with a step of 0.02 °2Θ and dwell time of 1 s.
Scanning electron microscopy with energy dispersive spectrometry (SEM-EDS) was applied as a supplementary method for determining the mineral composition and to recognise the size, form and chemical composition of individual particles. A HITACHI S-4700 field emission microscope and NORAN spectrometer were used. The polished sections of ash or the natural surfaces of ash particles were prepared for SEM-EDS measurement by carbon coating. Quantitative determination of the chemical elements’ content was based on the standardless method.
70
TABLE 1
General information about the samples
Sample Fuel System of combustion
ND12A Ash from grate
Biomass (Forest wood chips: pine, poplar, oak, acacia, birch)
Grate furnace boilers (3500+4500 kW)
ND14A Ash from grate
Biomass (Roadside wood chips: linden, aspen, ash-leaved maple, acacia)
Grate furnace boilers (3500+4500 kW)
ND16A Ash from grate
Biomass (Plantation wood chips: willow)
Grate furnace boilers (3500+4500 kW)
ND18A Ash from grate
Biomass (Forest wood chips: pine (80%), birch (20%))
Grate furnace boilers (3500+4500 kW)
ND20A Ash from grate
Biomass (Roadside wood chips: poplar)
Grate furnace boilers (3500+4500 kW)
ND22A Ash from grate
Biomass (Wood chips: pine) Grate furnace boilers (3500+4500 kW)
CZ_FLY Fly ash
Biomass 100% (agricultural residues) Bubbling fluidized bed boiler (BFB) (76,5 MWt )
PO_FLY Fly ash
Biomass (Forest wood chips (80%) + agriculture residues (20%))
Fluidized bed boiler, 205 MW
K_1 Fly ash
Biomass-coal co-combustion(separate biomass feeding line) (Coal from the Upper Silesian Coal Basin + 1.5% of biomass)
Pulverized fuel boiler OP-230 no. 1 (50MW)
K_2 Fly ash
Biomass-coal co-combustion(burning of premixed coal-biomass) (Coal from the Upper Silesian Coal Basin)
Pulverized fuel boiler OP-430 no.2 (110 MW)
KR_52 Fly ash
Biomass-coal co-combustion (Coal from the Upper Silesian Coal Basin +10 % of biomass)
Pulverized fuel boiler OP-380 no1 (90 MW) Retention container no. 3;
EDF_1 Fly ash
Biomass-coal co-combustion (Coal from the Upper Silesian Coal Basin + 10% of biomass)
Pulverized fuel boiler OP-380 no2 (90 MW) Retention container no. 2
71
TABLE 2
General description of the samples
Sample Description (for inhomogenous samples typical components are listed)
ND12A 1. Hard very porous fragments of the size from 2 mm to several cm; Fragments are grey with white, pinkish or black spots;
2. Sandy grey material; 3. Numerous elongated char-coal fragments (up to 3 cm long)
ND14A 1. Hard very porous fragments of the size from 2 mm to several cm; Brownish grey fragments contain numerous fragments of char coal;
2. Few fragments of char coal ND16A 1. Sandy grey substance
2. Irregular porous fragments up to 5 cm; grey with white spots; 3. Char coal fragments
ND18A 1. Hard porous grey fragments of the size from 2 mm to several cm; 2. Sandy grey material; 3. Char coal fragments
ND20A 1. Dark grey sandy material; 2. Fine-grained char coal fragments; 3. Hard, porous dark grey fragments up to 2 cm in size
ND22A 1. Elongated char coal fragments dominate; 2. Delicate aggregates of grey sandy material
CZ_FLY Fine-grained brownish grey material with finely dispersed char fragments PO_FLY Very fine-grained brownish material K_1 Brownish grey very fine grained material K_2 Grey very fine grained material KR_52 Grey very fine grained material EDF_1 Grey very fine grained material
The chemical composition of ash (major and trace elements) was determined using the
ICP AES and ICP MS methods in the Bureau Veritas Laboratory (Vancouver, Canada) (former Acme Laboratory). Loss of ignition (LOI) was determined by the mass difference after heating to 1000oC. The Leco method was used for determination of the total C and S content. LOI value and content of C and S were determined in the Bureau Veritas Laboratory.
The content of the cations in the leachates was analysed using the ICP MS method in the Activation Laboratories Ltd. (Actlabs, Canada).
The leaching test was based on PN-EN 12457-2 (2006). 300 ml of deionised water was add to 30 g of averaged sample (ground to <4 mm). Samples with water were shaken for 7.5 and 4.5 h, with 12 h of interruption (total time of leaching equals 24 hours). The filtered solution was subjected to pH and conductivity measurements (three measurements per solution in controlled temperature) and chemical analysis. The remaining solution was evaporated.
72
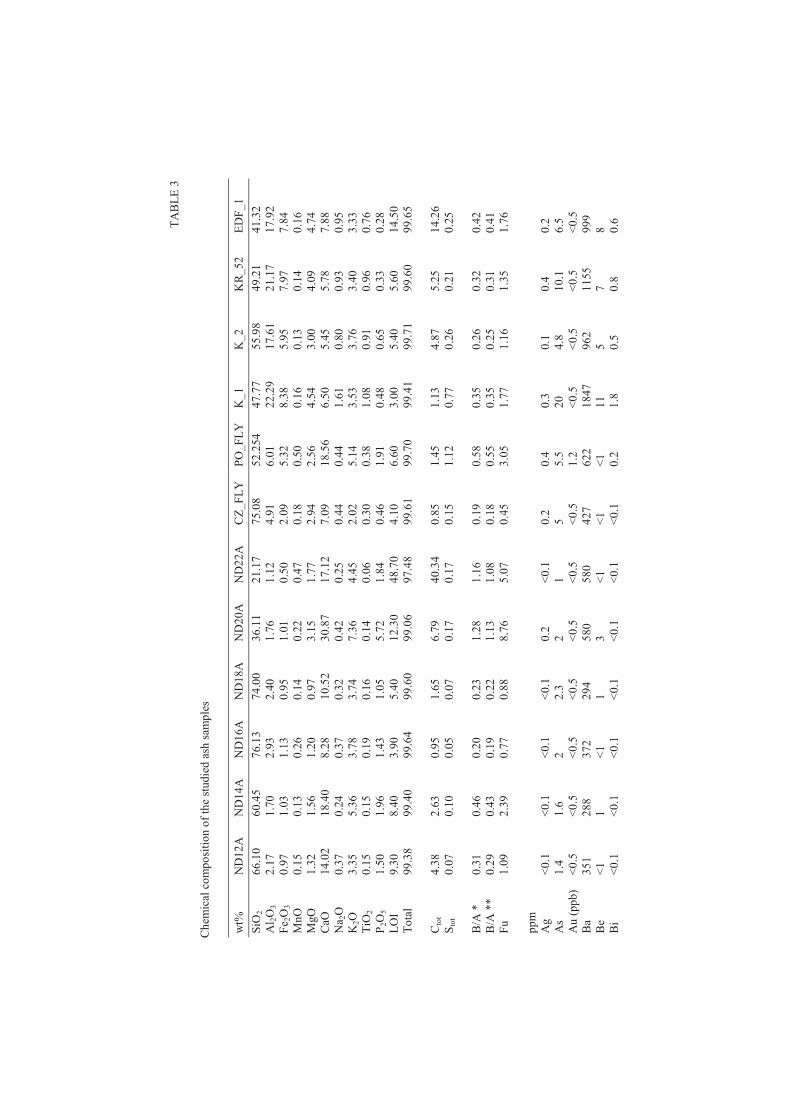
4. Results and discussion 4.1. Chemical composition of ash
The chemical composition of the studied ash samples varies significantly (Table 3). In
comparison to geological materials chemical composition of ash samples corresponds to peralkaline, metaluminous and peraluminous rocks or to foidites, trachybasalts, andesites, dacites and rhyolites in TAS classification. The biomass ash from the medium-size boiler contains from ~20 to >76 wt% of SiO2. The very high content of SiO2 in the biomass ash is partly related to contamination of the biomass via soil or ground material, which is confirmed by the presence of detrital material observed in the optical and electron microscopes. The presence of this type of impurities in biomass indicates improper practices during the biomass preparation (Modolo et al. 2014), or can be related to the harvesting technique (Bonner et al. 2014). In the case of the biomass ash coming from the fluidised bed boiler in one of the power plants (sample CZ_FLY), the content of SiO2 is very high because of the admixture of quartz sand from the bed, whereas in the ash sample from the other fluidised bed boiler (PO_FLY) the SiO2 content is significantly lower. An increase of SiO2 content in ash from fluidised bed boilers due to the admixture of material from the bed is often noted (Steenari et al. 1999; Freire et al. 2015). The variation of SiO2 content in ash from the co-combustion of biomass and coal is lower (from ca 41 to 56 wt%) compared with the biomass ash, which can be related to differences in coal composition, differences in the biomass burned and different biomass share in the fuel blend. CaO, K2O and P2O5 are other strongly variant compounds in the ash samples (Table 3). The very high LOI value in sample ND22A (and correspondingly high Ctot value: 48.7 wt%) is related to the high content of unburned coaly fragments (charcoal) (Table 3). Production of the ash with a high content of unburned carbon is often noted in grate boilers (Demirbas 2005). According to Vassilev et al. (2013b), the unburned char content in biomass ash can be up to 79%, but normally is within the 1–20% range.
In the ternary diagram of ash composition (Vassilev, Vassileva 2007), samples of biomass ash are scattered along the SiO2+Al2O3+K2O+TiO2+P2O5-CaO+MgO+SO3+ Na2O+MnO edge, mostly within the calsialic (CS) type field (Fig. 1). Ash samples from the biomass–coal co-combustion plot are closer to the ferricalsiallic (FCS) and ferrisialic (FS) fields because of significantly higher Fe content in these samples (Fig. 1). Diagram SiO2-Al2O3-CaO+MgO+MnO+Na2O+K2O (Fig. 2) presents the difference in Al2O3 and SiO2 content (ash samples from the biomass–coal co-combustion are enriched in Al2O3; two biomass ash samples are relatively poor in SiO2).
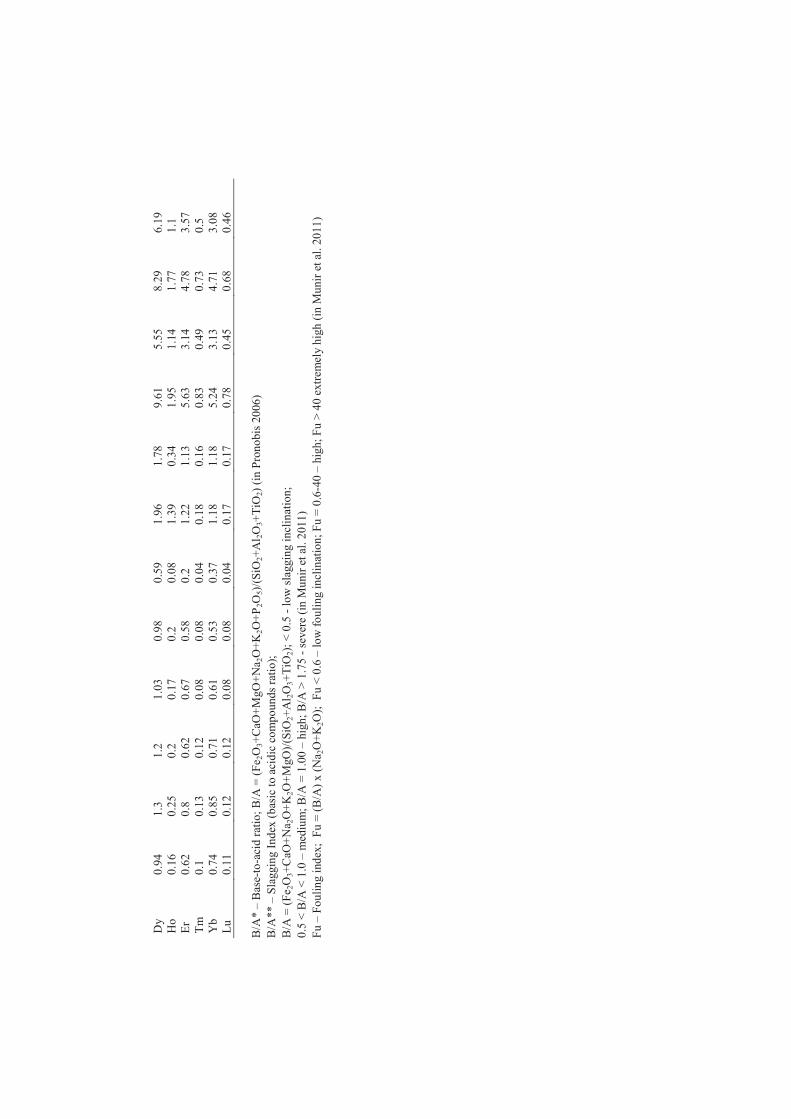
The broad range of variation of the chemical composition of ash samples (Table 3) is reflected in the strong variation of fouling or slagging indices (Fu and B/A**, respectively) calculated for the ash samples (Table 3). The base-to-acid ratio is presented in two forms— the content of phosphorus (Pronobis 2006) and in a form introduced for low phosphorus fuels (slagging index). The variation of indices (e.g. B/A** from 0.19 to 1.28; Fu from 0.77 to 8.76) are related to the significant differentiation of the chemical composition of the biomass ash samples. The indices calculated for the ash samples from the coal–biomass co-combustion are relatively uniform for four samples because of the dominant role of coal ash in the determination of the samples’ chemical composition.
T
AB
LE
3
Che
mic
al c
ompo
siti
on o
f th
e st
udie
d as
h sa
mpl
es
wt%
N
D12
A
ND
14A
N
D16
A
ND
18A
N
D20
A
ND
22A
C
Z_F
LY
P
O_F
LY
K
_1
K_2
K
R_5
2 E
DF
_1
SiO
2 66
.10
60.4
5 76
.13
74.0
0 36
.11
21.1
7 75
.08
52.2
54
47.7
7 55
.98
49.2
1 41
.32
Al 2
O3
2.17
1.
70
2.93
2.
40
1.76
1.
12
4.91
6.
01
22.2
9 17
.61
21.1
7 17
.92
Fe 2
O3
0.97
1.
03
1.13
0.
95
1.01
0.
50
2.09
5.
32
8.38
5.
95
7.97
7.
84
MnO
0.
15
0.13
0.
26
0.14
0.
22
0.47
0.
18
0.50
0.
16
0.13
0.
14
0.16
M
gO
1.32
1.
56
1.20
0.
97
3.15
1.
77
2.94
2.
56
4.54
3.
00
4.09
4.
74
CaO
14
.02
18.4
0 8.
28
10.5
2 30
.87
17.1
2 7.
09
18.5
6 6.
50
5.45
5.
78
7.88
N
a 2O
0.
37
0.24
0.
37
0.32
0.
42
0.25
0.
44
0.44
1.
61
0.80
0.
93
0.95
K
2O
3.35
5.
36
3.78
3.
74
7.36
4.
45
2.02
5.
14
3.53
3.
76
3.40
3.
33
TiO
2 0.
15
0.15
0.
19
0.16
0.
14
0.06
0.
30
0.38
1.
08
0.91
0.
96
0.76
P
2O5
1.50
1.
96
1.43
1.
05
5.72
1.
84
0.46
1.
91
0.48
0.
65
0.33
0.
28
LO
I 9.
30
8.40
3.
90
5.40
12
.30
48.7
0 4.
10
6.60
3.
00
5.40
5.
60
14.5
0 T
otal
99
.38
99.4
0 99
.64
99.6
0 99
.06
97.4
8 99
.61
99.7
0 99
.41
99.7
1 99
.60
99.6
5
C
tot
4.38
2.
63
0.95
1.
65
6.79
40
.34
0.85
1.
45
1.13
4.
87
5.25
14
.26
Sto
t 0.
07
0.10
0.
05
0.07
0.
17
0.17
0.
15
1.12
0.
77
0.26
0.
21
0.25
B
/A *
0.
31
0.46
0.
20
0.23
1.
28
1.16
0.
19
0.58
0.
35
0.26
0.
32
0.42
B
/A *
*
0.29
0.
43
0.19
0.
22
1.13
1.
08
0.18
0.
55
0.35
0.
25
0.31
0.
41
Fu
1.
09
2.39
0.
77
0.88
8.
76
5.07
0.
45
3.05
1.
77
1.16
1.
35
1.76
pp
m
Ag
<0.
1 <
0.1
<0.
1 <
0.1
0.2
<0.
1 0.
2 0.
4 0.
3 0.
1 0.
4 0.
2 A
s 1.
4 1.
6 2
2.3
2 1
5 5.
5 20
4.
8 10
.1
6.5
Au
(ppb
) <
0.5
<0.
5 <
0.5
<0.
5 <
0.5
<0.
5 <
0.5
1.2
<0.
5 <
0.5
<0.
5 <
0.5
Ba
351
288
372
294
580
580
427
622
1847
96
2 11
55
999
Be
<1
1 <
1 1
3 <
1 <
1 <
1 11
5
7 8
Bi
<0.
1 <
0.1
<0.
1 <
0.1
<0.
1 <
0.1
<0.
1 0.
2 1.
8 0.
5 0.
8 0.
6
Cd
1.9
3.5
5.8
2.3
4.2
0.5
2.3
10.4
1.
5 0.
6 0.
6 0.
4 C
o 2.
3 2.
7 3.
5 3.
2 3.
4 2
5.6
8.2
65
22
31.4
24
.6
Cr
43
.3
31.0
24
.8
31.0
55
.7
12.4
37
.1
123.
8 19
1.9
130.
0 15
4.8
111.
4 C
s 0.
9 0.
6 1.
3 1
0.8
1 2.
8 8.
5 15
.7
11.5
14
10
.8
Cu
27.3
22
.9
16.9
12
4 14
5.1
31.6
39
.7
89.5
14
5.4
54.2
80
.6
67.7
G
a 2.
5 2.
2 2.
8 3
1.7
1.3
6.1
8 57
.9
19.6
26
.5
21.2
H
f 3.
2 4.
1 5.
1 3.
8 3.
1 1
4.7
3.9
5.2
5 6.
2 4.
1 H
g
0.02
0.
04
0.03
0.
03
0.02
0.
03
0.44
0.
04
0.33
0.
18
0.32
0.
38
Mo
0.8
0.7
0.7
0.7
1.3
1.3
1 3.
2 15
.1
3.8
5.2
4.2
Nb
3.5
4.2
4.2
3.7
3.2
2 5.
5 5.
2 20
.9
14
18.6
13
.5
Ni
7.4
10.1
7.
2 7.
1 15
.3
7.8
12.9
20
.3
78.8
28
.2
44.2
45
.6
Pb
9.3
4.4
3.9
6.4
12.8
4.
7 31
.4
44.4
13
6.7
39.3
64
.1
73.5
R
b 44
.7
57.8
65
.6
60.8
54
66
.3
58.9
18
0.4
146.
5 11
8.8
120
101.
3 S
b 0.
3 0.
2 0.
4 0.
2 0.
2 0.
1 0.
8 5.
3 8.
6 1.
8 3.
9 2.
2 S
c 2
1 2
2 1
<1
4 1
28
18
23
17
Se
<0.
5 <
0.5
<0.
5 <
0.5
0.6
0.5
<0.
5 0.
9 6.
9 4.
1 5.
1 6.
3 S
r 45
1 55
8.8
346.
1 32
2.3
1052
49
6.7
124.
1 37
6.3
627.
5 28
3 48
4.8
345.
4 T
a 0.
2 0.
3 0.
4 0.
3 0.
2 <
0.1
0.5
0.4
1.4
1 1.
5 0.
9 T
h 2.
2 2.
2 2.
6 2.
3 1.
8 1
4.4
4.7
22
15.8
21
.3
15.1
T
l <
0.1
<0.
1 <
0.1
<0.
1 <
0.1
<0.
1 0.
2 1.
1 1.
3 0.
2 0.
4 0.
2 U
0.
7 0.
8 1
0.8
0.7
0.2
1.7
1.4
13.2
5.
7 9.
1 5.
6 V
21
14
21
14
13
<
8 39
42
31
3 13
0 18
7 12
6 W
7.
3 0.
5 2
1.5
0.7
1 2.
6 4.
4 10
.3
4.1
5.1
7.7
Y
5.7
8 7.
8 6.
4 6.
3 3.
4 10
.9
9.9
58.8
32
.4
46.5
34
.9
Zn
161
137
231
124
226
96
213
335
207
81
110
115
Zr
144.
2 15
4 19
6.6
154.
5 12
1.2
51.5
18
1.2
134.
2 19
8.1
186.
6 20
7.5
152.
9 L
a 7.
4 9.
8 9.
1 9.
4 7.
5 5
13.4
12
.9
61.7
37
.7
54.7
41
.9
Ce
12.5
15
.4
15.6
16
13
.7
8 26
.8
27.1
12
0.8
78.7
11
0.2
80.7
P
r 1.
48
2.13
1.
93
1.72
1.
57
0.96
3.
09
2.81
13
.58
8.58
12
.65
9.34
N
d 6.
2 7.
3 6.
7 6.
5 5.
3 3
12.5
10
.4
52
32.5
45
.2
35.2
S
m
1.01
1.
53
1.33
1.
22
1.21
0.
71
2.28
1.
81
10.6
6 6.
38
9.9
7.14
E
u 0.
2 0.
31
0.27
0.
22
0.23
0.
14
0.44
0.
42
2.4
1.38
2.
12
1.49
G
d 0.
99
1.43
1.
28
1.14
0.
93
0.65
1.
93
1.83
10
.52
6.07
8.
74
6.67
T
b 0.
13
0.22
0.
17
0.15
0.
14
0.28
0.
28
0.29
1.
69
0.99
1.
45
1
Dy
0.94
1.
3 1.
2 1.
03
0.98
0.
59
1.96
1.
78
9.61
5.
55
8.29
6.
19
Ho
0.16
0.
25
0.2
0.17
0.
2 0.
08
1.39
0.
34
1.95
1.
14
1.77
1.
1 E
r 0.
62
0.8
0.62
0.
67
0.58
0.
2 1.
22
1.13
5.
63
3.14
4.
78
3.57
T
m
0.1
0.13
0.
12
0.08
0.
08
0.04
0.
18
0.16
0.
83
0.49
0.
73
0.5
Yb
0.74
0.
85
0.71
0.
61
0.53
0.
37
1.18
1.
18
5.24
3.
13
4.71
3.
08
Lu
0.11
0.
12
0.12
0.
08
0.08
0.
04
0.17
0.
17
0.78
0.
45
0.68
0.
46
B/A
* –
Bas
e-to
-aci
d ra
tio;
B/A
= (
Fe 2
O3+
CaO
+M
gO+
Na 2
O+
K2O
+P
2O5)
/(S
iO2+
Al 2
O3+
TiO
2) (
in P
rono
bis
2006
) B
/A**
– S
lagg
ing
Inde
x (b
asic
to a
cidi
c co
mpo
unds
rat
io);
B
/A =
(F
e 2O
3+C
aO+
Na 2
O+
K2O
+M
gO)/
(SiO
2+A
l 2O
3+T
iO2)
; < 0
.5 -
low
sla
ggin
g in
clin
atio
n;
0.5
< B
/A <
1.0
– m
ediu
m; B
/A =
1.0
0 –
high
; B/A
> 1
.75
- se
vere
(in
Mun
ir e
t al.
2011
) F
u –
Foul
ing
inde
x; F
u =
(B
/A)
x (N
a 2O
+K
2O);
Fu
< 0
.6 –
low
fou
ling
incl
inat
ion;
Fu
= 0
.6-4
0 –
high
; Fu
> 4
0 ex
trem
ely
high
(in
Mun
ir e
t al.
2011
)
76
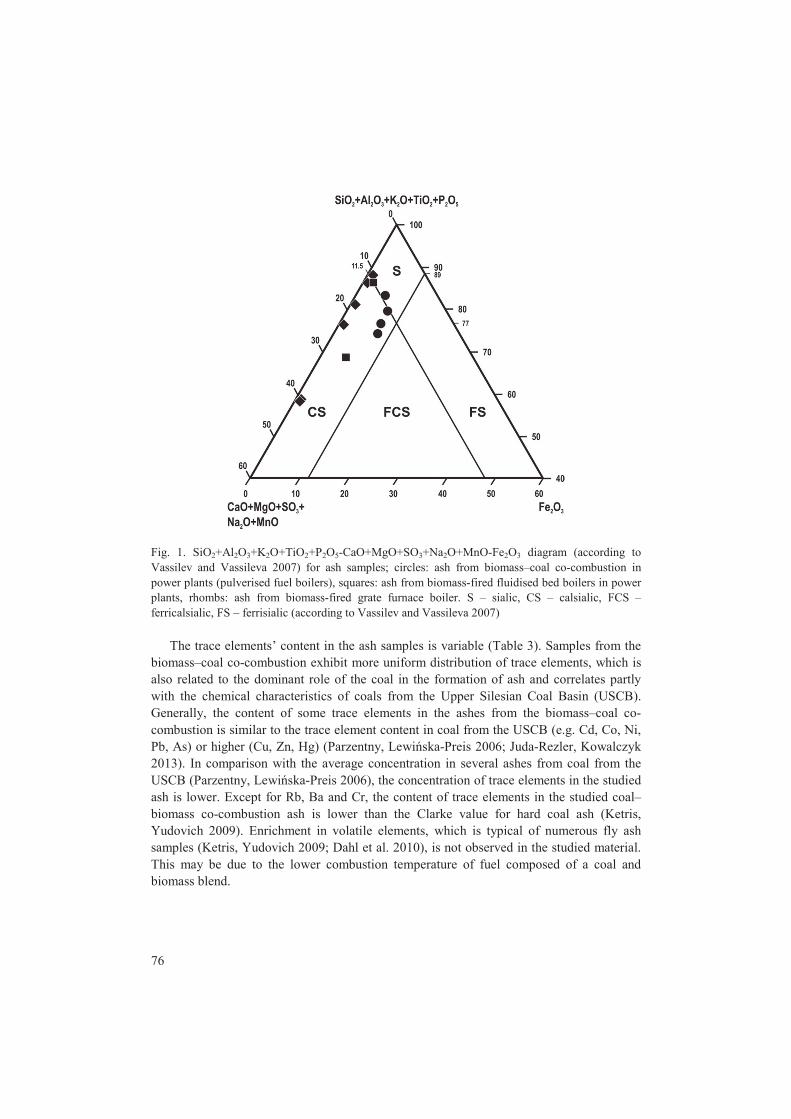
Fig. 1. SiO2+Al2O3+K2O+TiO2+P2O5-CaO+MgO+SO3+Na2O+MnO-Fe2O3 diagram (according to Vassilev and Vassileva 2007) for ash samples; circles: ash from biomass–coal co-combustion in power plants (pulverised fuel boilers), squares: ash from biomass-fired fluidised bed boilers in power plants, rhombs: ash from biomass-fired grate furnace boiler. S – sialic, CS – calsialic, FCS – ferricalsialic, FS – ferrisialic (according to Vassilev and Vassileva 2007)
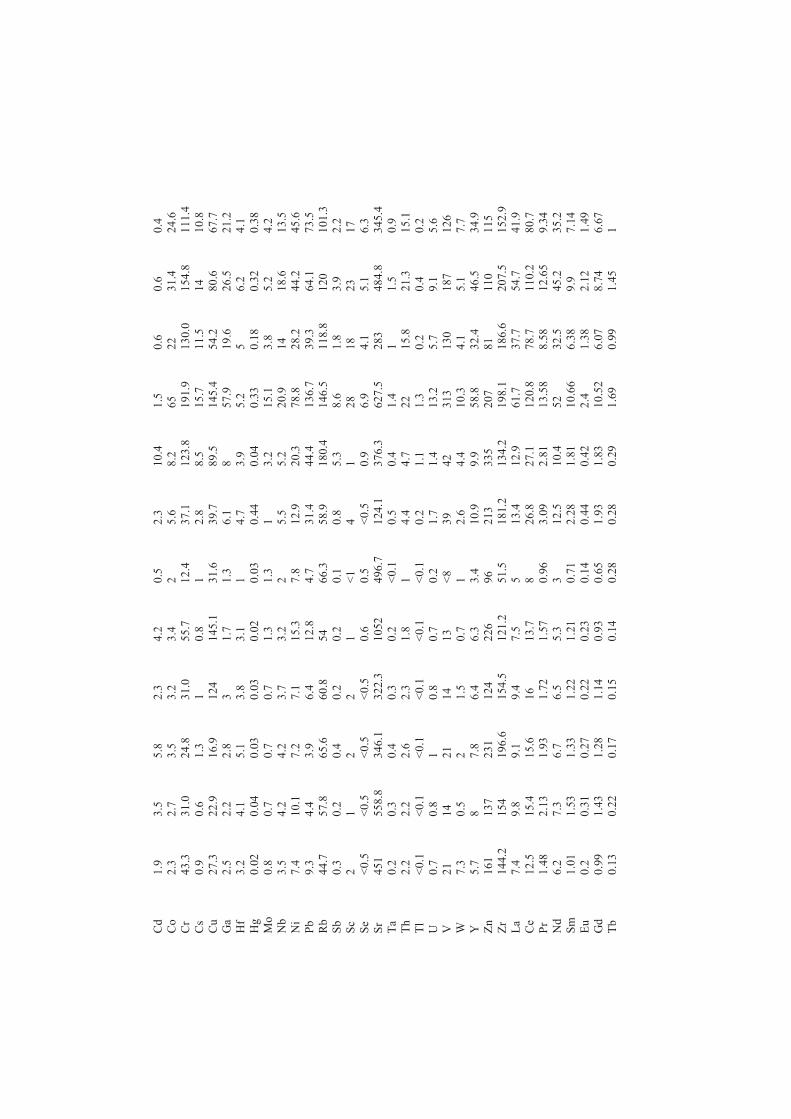
The trace elements’ content in the ash samples is variable (Table 3). Samples from the
biomass–coal co-combustion exhibit more uniform distribution of trace elements, which is also related to the dominant role of the coal in the formation of ash and correlates partly with the chemical characteristics of coals from the Upper Silesian Coal Basin (USCB). Generally, the content of some trace elements in the ashes from the biomass–coal co-combustion is similar to the trace element content in coal from the USCB (e.g. Cd, Co, Ni, Pb, As) or higher (Cu, Zn, Hg) (Parzentny, Lewińska-Preis 2006; Juda-Rezler, Kowalczyk 2013). In comparison with the average concentration in several ashes from coal from the USCB (Parzentny, Lewińska-Preis 2006), the concentration of trace elements in the studied ash is lower. Except for Rb, Ba and Cr, the content of trace elements in the studied coal–biomass co-combustion ash is lower than the Clarke value for hard coal ash (Ketris, Yudovich 2009). Enrichment in volatile elements, which is typical of numerous fly ash samples (Ketris, Yudovich 2009; Dahl et al. 2010), is not observed in the studied material. This may be due to the lower combustion temperature of fuel composed of a coal and biomass blend.
77
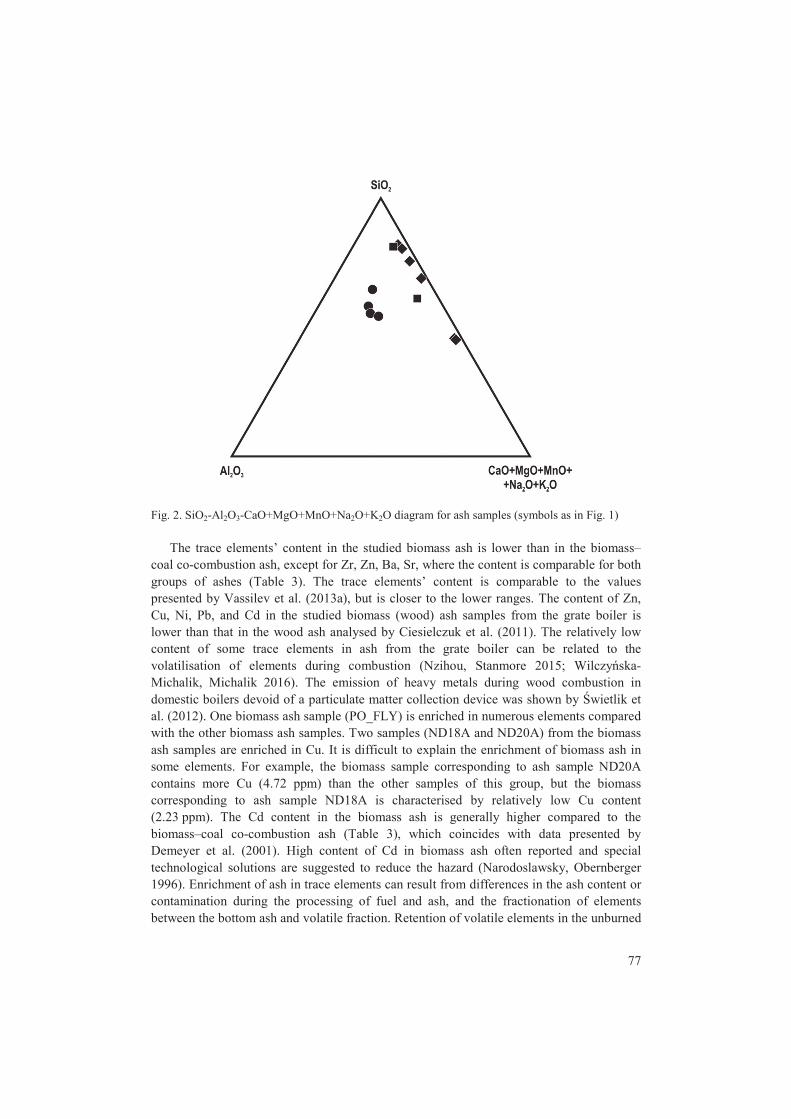
Fig. 2. SiO2-Al2O3-CaO+MgO+MnO+Na2O+K2O diagram for ash samples (symbols as in Fig. 1)
The trace elements’ content in the studied biomass ash is lower than in the biomass–
coal co-combustion ash, except for Zr, Zn, Ba, Sr, where the content is comparable for both groups of ashes (Table 3). The trace elements’ content is comparable to the values presented by Vassilev et al. (2013a), but is closer to the lower ranges. The content of Zn, Cu, Ni, Pb, and Cd in the studied biomass (wood) ash samples from the grate boiler is lower than that in the wood ash analysed by Ciesielczuk et al. (2011). The relatively low content of some trace elements in ash from the grate boiler can be related to the volatilisation of elements during combustion (Nzihou, Stanmore 2015; Wilczyńska-Michalik, Michalik 2016). The emission of heavy metals during wood combustion in domestic boilers devoid of a particulate matter collection device was shown by Świetlik et al. (2012). One biomass ash sample (PO_FLY) is enriched in numerous elements compared with the other biomass ash samples. Two samples (ND18A and ND20A) from the biomass ash samples are enriched in Cu. It is difficult to explain the enrichment of biomass ash in some elements. For example, the biomass sample corresponding to ash sample ND20A contains more Cu (4.72 ppm) than the other samples of this group, but the biomass corresponding to ash sample ND18A is characterised by relatively low Cu content (2.23 ppm). The Cd content in the biomass ash is generally higher compared to the biomass–coal co-combustion ash (Table 3), which coincides with data presented by Demeyer et al. (2001). High content of Cd in biomass ash often reported and special technological solutions are suggested to reduce the hazard (Narodoslawsky, Obernberger 1996). Enrichment of ash in trace elements can result from differences in the ash content or contamination during the processing of fuel and ash, and the fractionation of elements between the bottom ash and volatile fraction. Retention of volatile elements in the unburned

78
coal (char) is not observed in the studied samples. Sample ND22A containing the highest amount of char (LOI >48 wt%) is characterised by a medium content of Cl, Ni, Cu, Zn, Ga, As, and Se, i.e. elements positively correlated with unburned coal in fly ash (Bartoňová et al. 2012).
The content of Cr is higher in the studied biomass samples from the grate boiler in comparison with the wood ash samples studied by Ciesielczuk et al. (2011), except for sample ND22A. The content of heavy metals in the studied ash samples from the biomass combustion in the medium-size grate boiler (samples ND12A–ND22A) is below the concentration limits for the utilisation of biomass ash as a soil conditioner in forests and agriculture accepted in Finland, Sweden and Lithuania (Lanzerstorfer 2015), and below the limits accepted in Poland for soil fertilizers and amendments (Rozporządzenie Ministra Rolnictwa i Rozwoju Wsi 2008), except for the Cd in sample ND16A (5.8 ppm; value of limit: 5 ppm for organo-mineral fertilisers and organo-mineral soil amendments according to Rozporządzenie Ministra Rolnictwa i Rozwoju Wsi z dnia 18 czerwca 2008 r.). The biomass ash from a fluidised bed boiler’s Cr content exceeds the limit (100 ppm for organo-mineral fertilisers and organo-mineral soil amendments according to Rozporządzenie Ministra Rolnictwa i Rozwoju Wsi z dnia 18 czerwca 2008 r.). Contents of Cr and Ni in the ash from the biomass-coal co-combustion in pulverised fuel boilers are higher than limits determined in the Rozporządzenie Ministra Rolnictwa i Rozwoju Wsi z dnia 18 czerwca 2008 r. (100 and 60 ppm respectively). Content of V in the ash from the biomass-coal co-combustion in pulverised fuel boilers is higher than limit for soil conditioners in Lithuania (70 ppm; Lanzerstorfer 2015).
4.2. Mineral composition of ash
The ash from the biomass combustion in the medium-size grate boiler is composed of
slag lumps rich in glassy material, fine-grained sandy material and charcoal fragments mixed in various proportions in different samples. The mineral composition of the ash from the biomass combustion is varied (Table 4 and Fig. 3A). The minerals determined in the studied samples correspond to the list of minerals occurring in biomass ash (Vassilev et al. 2013a), except for some of the phosphates noticed in the studied samples, although only present in small amounts. Quartz dominates in all the samples and is accompanied by cristobalite, except for sample ND22A, which is characterised by the lowest SiO2 content. Generally, it is possible to distinguish detrital components (e.g. soil components, aeolian dust, components of contamination during harvesting, transportation, and storage) and components newly formed during and after combustion. The slag fragments (porous or massive) (Fig. 4A, B) contain detrital quartz grains (Fig. 4B) and newly formed wollastonite crystals embedded in glassy material relatively rich in Ca, K, and Si, with variable content of Fe (Fig. 4B, C). The glassy material is often enriched in P. The fine-grained ash also contains detrital grains (mostly quartz) and newly formed wollastonite, calcite, portlandite, and glassy spheres (Fig. 4D, E). The calcite exhibits significant variability in morphology (Fig. 4F, G). It is often composed of nanoparticles aggregated in rhombohedral forms (Fig. 4G), but needle-like crystals are also observed. The occurrence of newly formed calcite indicates that biomass combustion products are active in the CO2
79
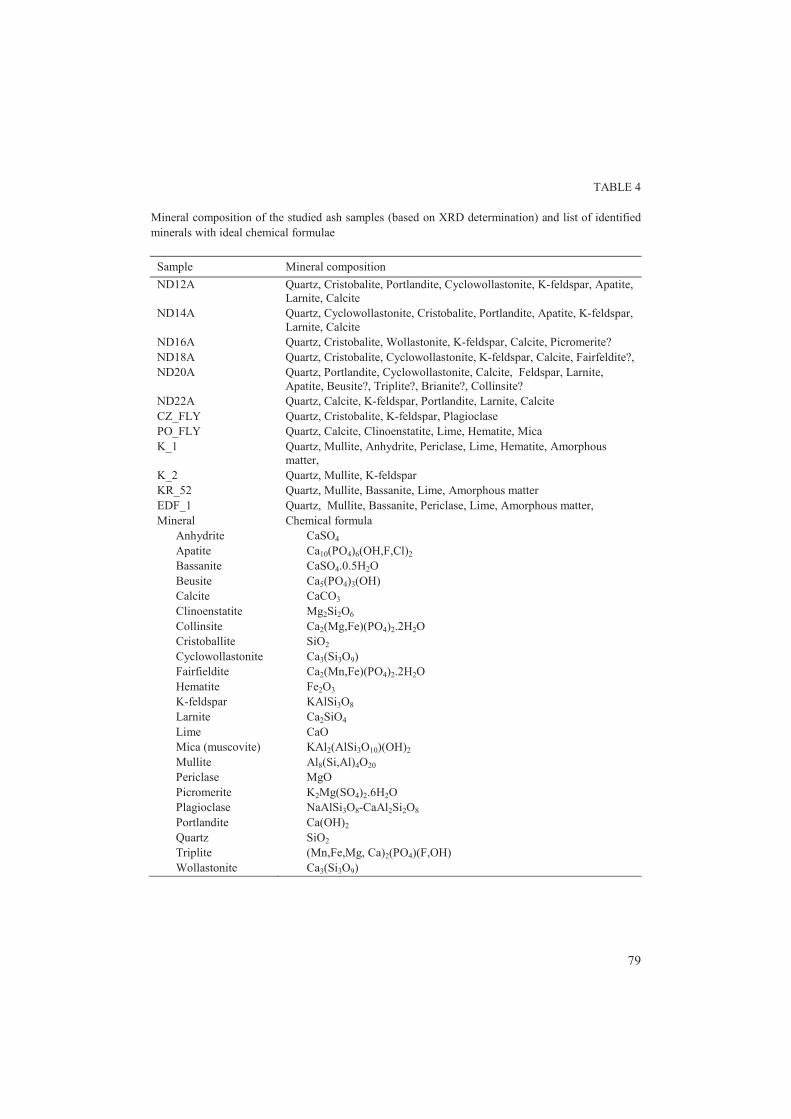
TABLE 4 Mineral composition of the studied ash samples (based on XRD determination) and list of identified minerals with ideal chemical formulae
Sample Mineral composition
ND12A Quartz, Cristobalite, Portlandite, Cyclowollastonite, K-feldspar, Apatite, Larnite, Calcite
ND14A Quartz, Cyclowollastonite, Cristobalite, Portlandite, Apatite, K-feldspar, Larnite, Calcite
ND16A Quartz, Cristobalite, Wollastonite, K-feldspar, Calcite, Picromerite? ND18A Quartz, Cristobalite, Cyclowollastonite, K-feldspar, Calcite, Fairfeldite?, ND20A Quartz, Portlandite, Cyclowollastonite, Calcite, Feldspar, Larnite,
Apatite, Beusite?, Triplite?, Brianite?, Collinsite? ND22A Quartz, Calcite, K-feldspar, Portlandite, Larnite, Calcite CZ_FLY Quartz, Cristobalite, K-feldspar, Plagioclase PO_FLY Quartz, Calcite, Clinoenstatite, Lime, Hematite, Mica K_1 Quartz, Mullite, Anhydrite, Periclase, Lime, Hematite, Amorphous
matter, K_2 Quartz, Mullite, K-feldspar KR_52 Quartz, Mullite, Bassanite, Lime, Amorphous matter EDF_1 Quartz, Mullite, Bassanite, Periclase, Lime, Amorphous matter, Mineral
Anhydrite Apatite Bassanite Beusite Calcite Clinoenstatite Collinsite Cristoballite Cyclowollastonite Fairfieldite Hematite K-feldspar Larnite Lime Mica (muscovite) Mullite Periclase Picromerite Plagioclase Portlandite Quartz Triplite Wollastonite
Chemical formula CaSO4 Ca10(PO4)6(OH,F,Cl)2
CaSO4.0.5H2O Ca5(PO4)3(OH) CaCO3 Mg2Si2O6 Ca2(Mg,Fe)(PO4)2.2H2O SiO2 Ca3(Si3O9) Ca2(Mn,Fe)(PO4)2.2H2O Fe2O3 KAlSi3O8 Ca2SiO4 CaO KAl2(AlSi3O10)(OH)2 Al8(Si,Al)4O20 MgO K2Mg(SO4)2.6H2O NaAlSi3O8-CaAl2Si2O8 Ca(OH)2 SiO2 (Mn,Fe,Mg, Ca)2(PO4)(F,OH) Ca3(Si3O9)
80
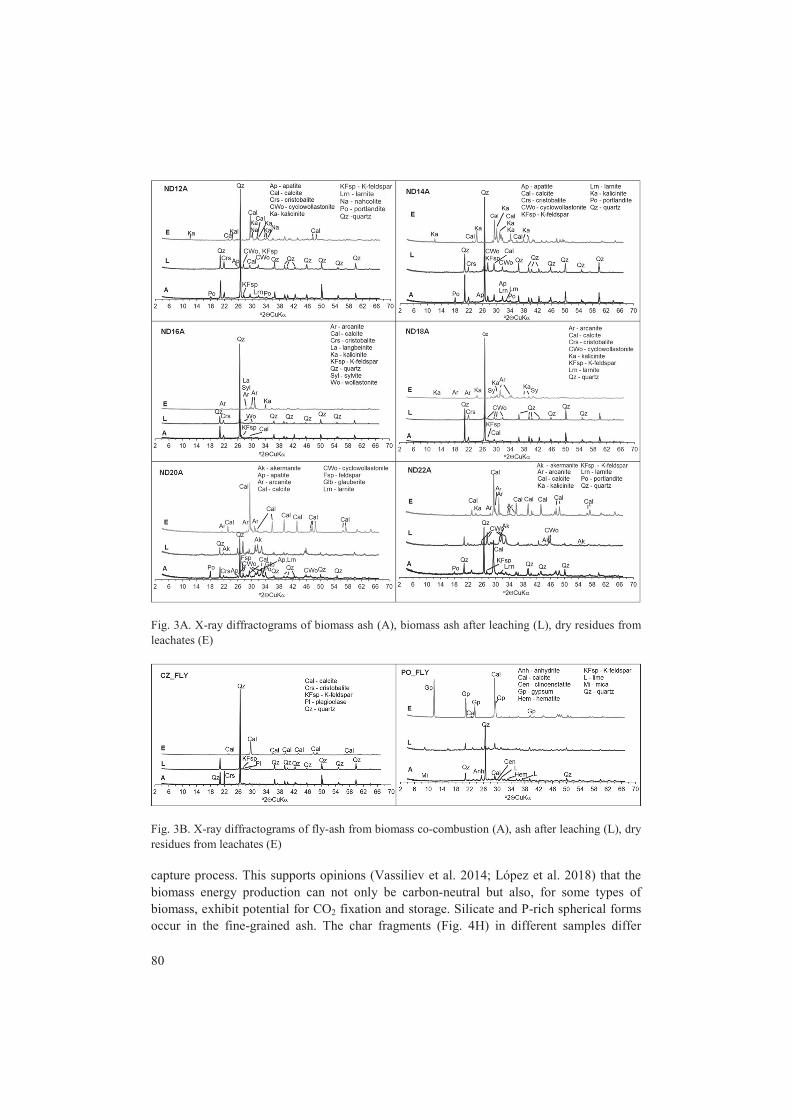
Fig. 3A. X-ray diffractograms of biomass ash (A), biomass ash after leaching (L), dry residues from leachates (E)
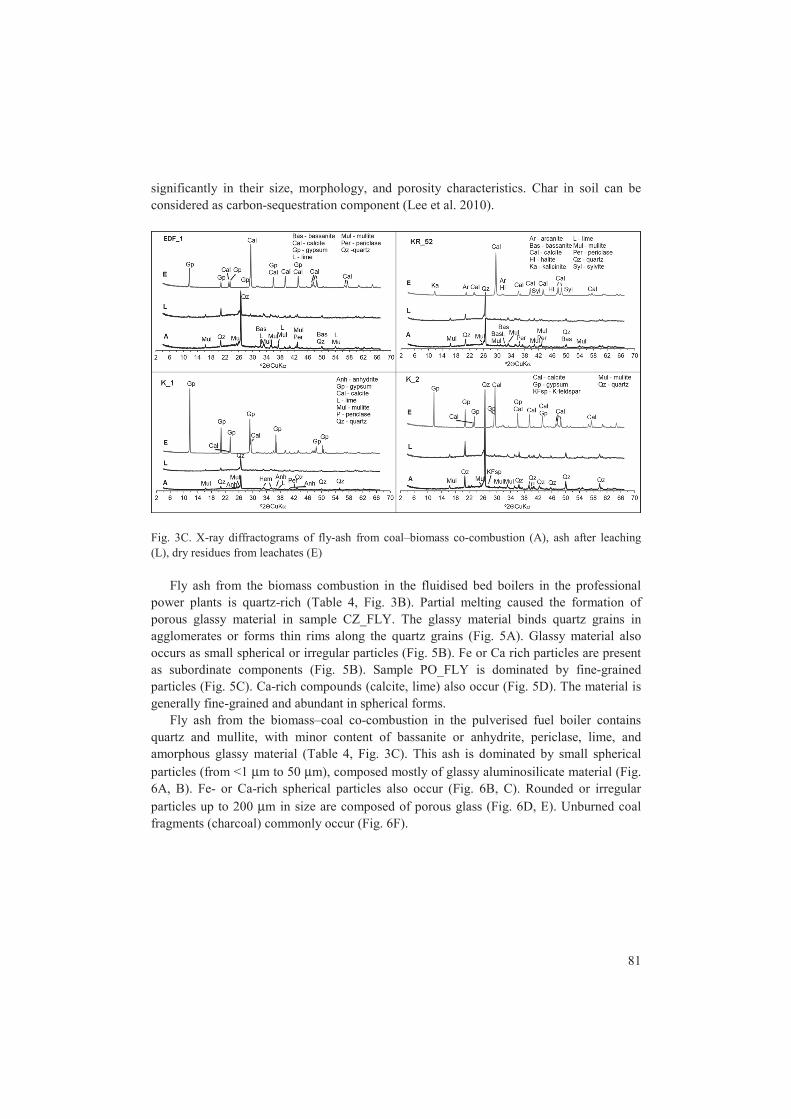
Fig. 3B. X-ray diffractograms of fly-ash from biomass co-combustion (A), ash after leaching (L), dry residues from leachates (E) capture process. This supports opinions (Vassiliev et al. 2014; López et al. 2018) that the biomass energy production can not only be carbon-neutral but also, for some types of biomass, exhibit potential for CO2 fixation and storage. Silicate and P-rich spherical forms occur in the fine-grained ash. The char fragments (Fig. 4H) in different samples differ
81
significantly in their size, morphology, and porosity characteristics. Char in soil can be considered as carbon-sequestration component (Lee et al. 2010).
Fig. 3C. X-ray diffractograms of fly-ash from coal–biomass co-combustion (A), ash after leaching (L), dry residues from leachates (E)
Fly ash from the biomass combustion in the fluidised bed boilers in the professional
power plants is quartz-rich (Table 4, Fig. 3B). Partial melting caused the formation of porous glassy material in sample CZ_FLY. The glassy material binds quartz grains in agglomerates or forms thin rims along the quartz grains (Fig. 5A). Glassy material also occurs as small spherical or irregular particles (Fig. 5B). Fe or Ca rich particles are present as subordinate components (Fig. 5B). Sample PO_FLY is dominated by fine-grained particles (Fig. 5C). Ca-rich compounds (calcite, lime) also occur (Fig. 5D). The material is generally fine-grained and abundant in spherical forms.
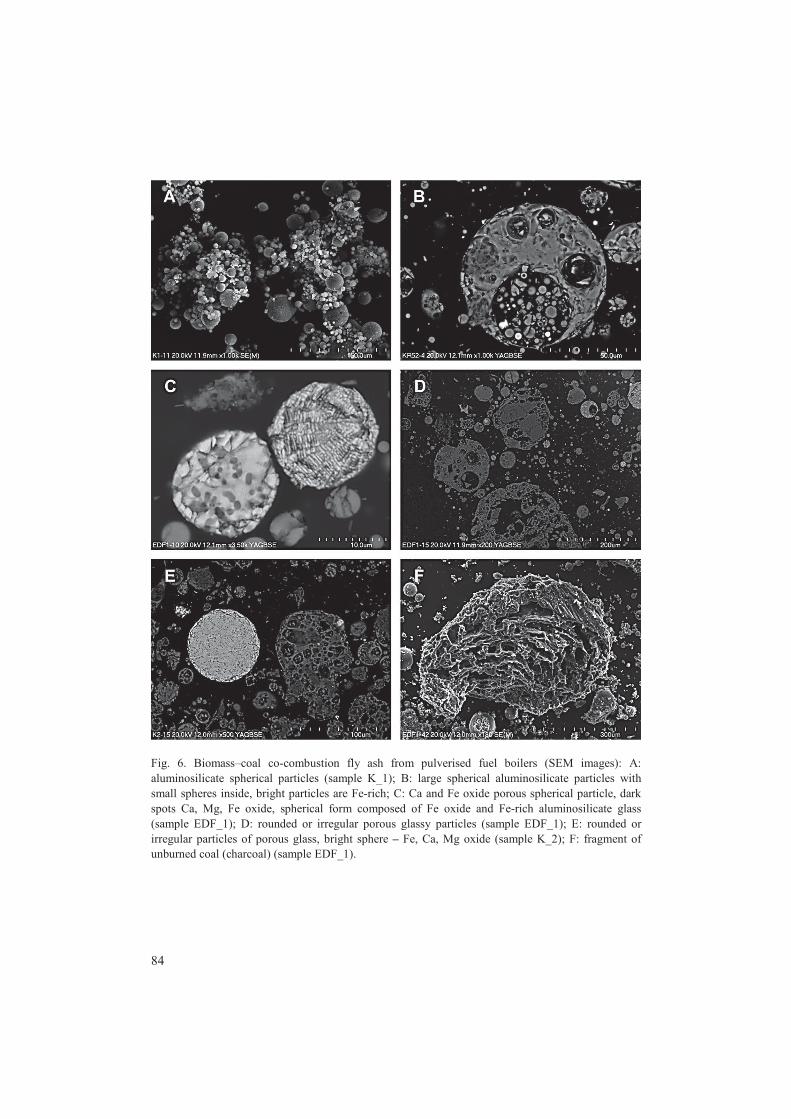
Fly ash from the biomass–coal co-combustion in the pulverised fuel boiler contains quartz and mullite, with minor content of bassanite or anhydrite, periclase, lime, and amorphous glassy material (Table 4, Fig. 3C). This ash is dominated by small spherical particles (from <1 μm to 50 μm), composed mostly of glassy aluminosilicate material (Fig. 6A, B). Fe- or Ca-rich spherical particles also occur (Fig. 6B, C). Rounded or irregular particles up to 200 μm in size are composed of porous glass (Fig. 6D, E). Unburned coal fragments (charcoal) commonly occur (Fig. 6F).

82
Fig. 4. Biomass ash from grate boiler (SEM images): A: porous slag fragment (sample ND12A); B: slag fragment with wollastonite (bright forms) and detrital quartz (Qtz) with numerous cracks (sample ND12A); C: branched crystal of wollasonite in slag (sample ND18A); D: glassy sphere (short arrow), quartz grain coated with glassy material (long arrow) (sample ND12A); E: platy crystals of portlandite (sample ND20A); F: porous crystals of calcite (sample ND14A); G: rhombohedral crystal of calcite (sample ND22A); H: charcoal fragment (sample ND16A)

83
Fig. 5. Biomass fly ash from fluidised bed boilers (SEM images): A: porous glassy material binding quartz grains and glassy coating of quartz grain (sample CZ_FLY); B: glassy irregular or spherical particles (massive, porous and hollow), bright iron-rich sphere and porous Fe and Ca oxide (sample CZ_FLY); C: fine-grained material of fly ash (sample PO_FLY); D: calcite crystal (sample PO_FLY)
The mineral composition of ash after leaching (Fig. 3A, B, C) differs from the
composition of the raw ash. The content of portlandite is reduced in samples ND12A and ND14A, while the content of anhydrite is reduced in sample K-1. Increase of the intensity of wollastonite or cyclowollastonite XRD peaks could be interpreted as an effect of their relative content increase due to the dissolution of portlandite. The dissolution of quartz, however possible in alkaline solutions, seems to be improbable because of the relatively short period of reaction. This is also evidenced by the low content of Si in the leachates (see section 4.5).
Ca-containing newly formed minerals are common in the studied ash samples. Wollastonite and/or calcite, sometimes accompanied by portlandite are present in the biomass ash from the medium-size boiler, i.e. in ash formed at a lower temperature compared with ash from the fluidised bed or pulverised fuel boilers (higher temperature of combustion) in which lime and bassanite are present (except for sample PO_FLY with lime and calcite). Mullite is present only in the samples from biomass–coal co-combustion, because of the relatively high content of Al in these samples.
84
Fig. 6. Biomass–coal co-combustion fly ash from pulverised fuel boilers (SEM images): A: aluminosilicate spherical particles (sample K_1); B: large spherical aluminosilicate particles with small spheres inside, bright particles are Fe-rich; C: Ca and Fe oxide porous spherical particle, dark spots Ca, Mg, Fe oxide, spherical form composed of Fe oxide and Fe-rich aluminosilicate glass (sample EDF_1); D: rounded or irregular porous glassy particles (sample EDF_1); E: rounded or irregular particles of porous glass, bright sphere – Fe, Ca, Mg oxide (sample K_2); F: fragment of unburned coal (charcoal) (sample EDF_1).
85
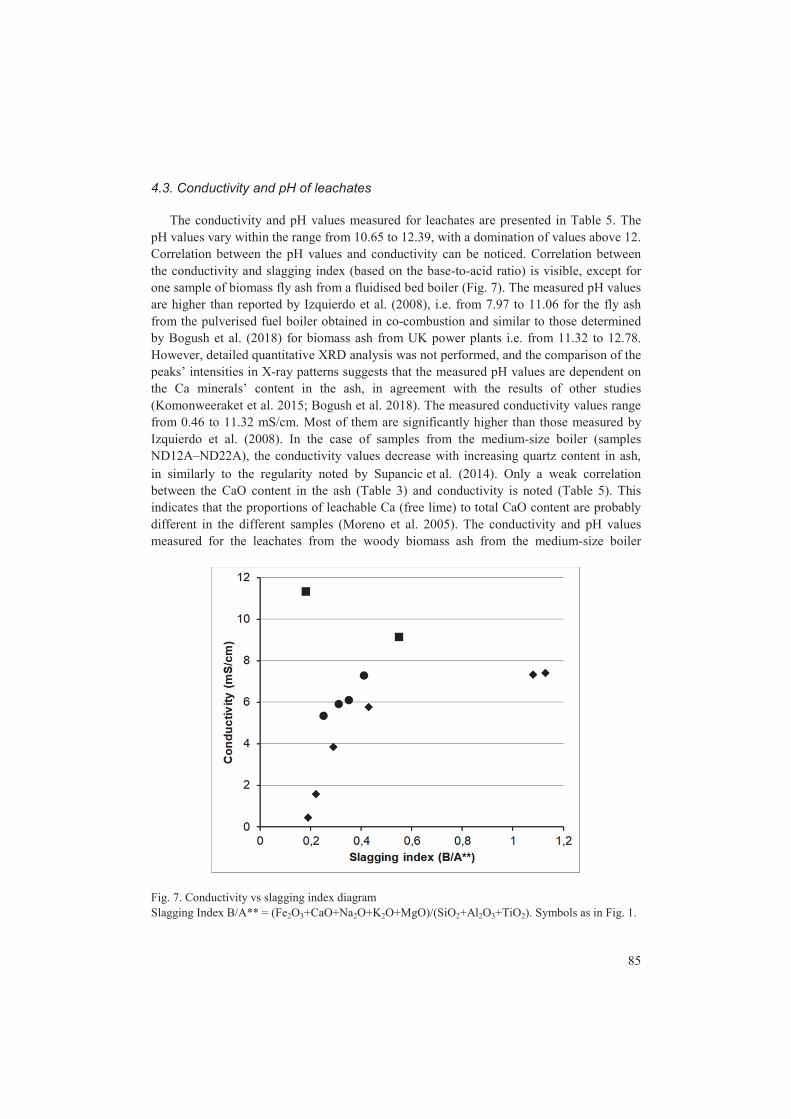
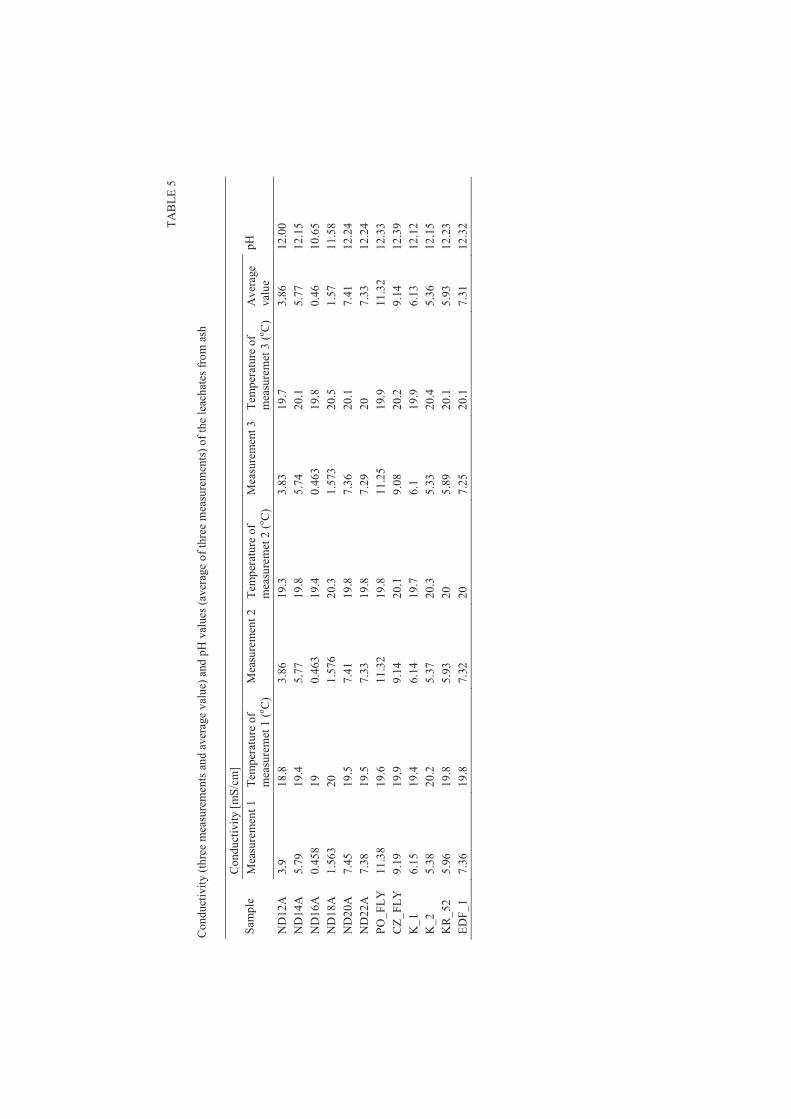
4.3. Conductivity and pH of leachates The conductivity and pH values measured for leachates are presented in Table 5. The
pH values vary within the range from 10.65 to 12.39, with a domination of values above 12. Correlation between the pH values and conductivity can be noticed. Correlation between the conductivity and slagging index (based on the base-to-acid ratio) is visible, except for one sample of biomass fly ash from a fluidised bed boiler (Fig. 7). The measured pH values are higher than reported by Izquierdo et al. (2008), i.e. from 7.97 to 11.06 for the fly ash from the pulverised fuel boiler obtained in co-combustion and similar to those determined by Bogush et al. (2018) for biomass ash from UK power plants i.e. from 11.32 to 12.78. However, detailed quantitative XRD analysis was not performed, and the comparison of the peaks’ intensities in X-ray patterns suggests that the measured pH values are dependent on the Ca minerals’ content in the ash, in agreement with the results of other studies (Komonweeraket et al. 2015; Bogush et al. 2018). The measured conductivity values range from 0.46 to 11.32 mS/cm. Most of them are significantly higher than those measured by Izquierdo et al. (2008). In the case of samples from the medium-size boiler (samples ND12A–ND22A), the conductivity values decrease with increasing quartz content in ash, in similarly to the regularity noted by Supancic et al. (2014). Only a weak correlation between the CaO content in the ash (Table 3) and conductivity is noted (Table 5). This indicates that the proportions of leachable Ca (free lime) to total CaO content are probably different in the different samples (Moreno et al. 2005). The conductivity and pH values measured for the leachates from the woody biomass ash from the medium-size boiler
Fig. 7. Conductivity vs slagging index diagram Slagging Index B/A** = (Fe2O3+CaO+Na2O+K2O+MgO)/(SiO2+Al2O3+TiO2). Symbols as in Fig. 1.
T
AB
LE
5
Con
duct
ivit
y (t
hree
mea
sure
men
ts a
nd a
vera
ge v
alue
) an
d pH
val
ues
(ave
rage
of
thre
e m
easu
rem
ents
) of
the
leac
hate
s fr
om a
sh
Sam
ple
C
ondu
ctiv
ity
[mS
/cm
] pH
M
easu
rem
ent 1
T
empe
ratu
re o
f m
easu
rem
et 1
(o C
) M
easu
rem
ent 2
T
empe
ratu
re o
f m
easu
rem
et 2
(o C
) M
easu
rem
ent 3
T
empe
ratu
re o
f m
easu
rem
et 3
(o C
) A
vera
ge
valu
e
ND
12A
3.
9 18
.8
3.86
19
.3
3.83
19
.7
3.86
12
.00
ND
14A
5.
79
19.4
5.
77
19.8
5.
74
20.1
5.
77
12.1
5 N
D16
A
0.45
8 19
0.
463
19.4
0.
463
19.8
0.
46
10.6
5 N
D18
A
1.56
3 20
1.
576
20.3
1.
573
20.5
1.
57
11.5
8 N
D20
A
7.45
19
.5
7.41
19
.8
7.36
20
.1
7.41
12
.24
ND
22A
7.
38
19.5
7.
33
19.8
7.
29
20
7.33
12
.24
PO
_FL
Y
11.3
8 19
.6
11.3
2 19
.8
11.2
5 19
.9
11.3
2 12
.33
CZ
_FL
Y
9.19
19
.9
9.14
20
.1
9.08
20
.2
9.14
12
.39
K_1
6.
15
19.4
6.
14
19.7
6.
1 19
.9
6.13
12
.12
K_2
5.
38
20.2
5.
37
20.3
5.
33
20.4
5.
36
12.1
5 K
R_5
2 5.
96
19.8
5.
93
20
5.89
20
.1
5.93
12
.23
ED
F_1
7.
36
19.8
7.
32
20
7.25
20
.1
7.31
12
.32
87
(samples ND12A–ND22A) vary within a broad span. The lowest value of conductivity and pH (0.46 mS/cm and 10.65, respectively) was obtained for the leachate from willow ash. The highest value of conductivity (7.41 mS/cm) was obtained for the leachate from poplar ash; this solution was also characterised by a high pH value (12.24).
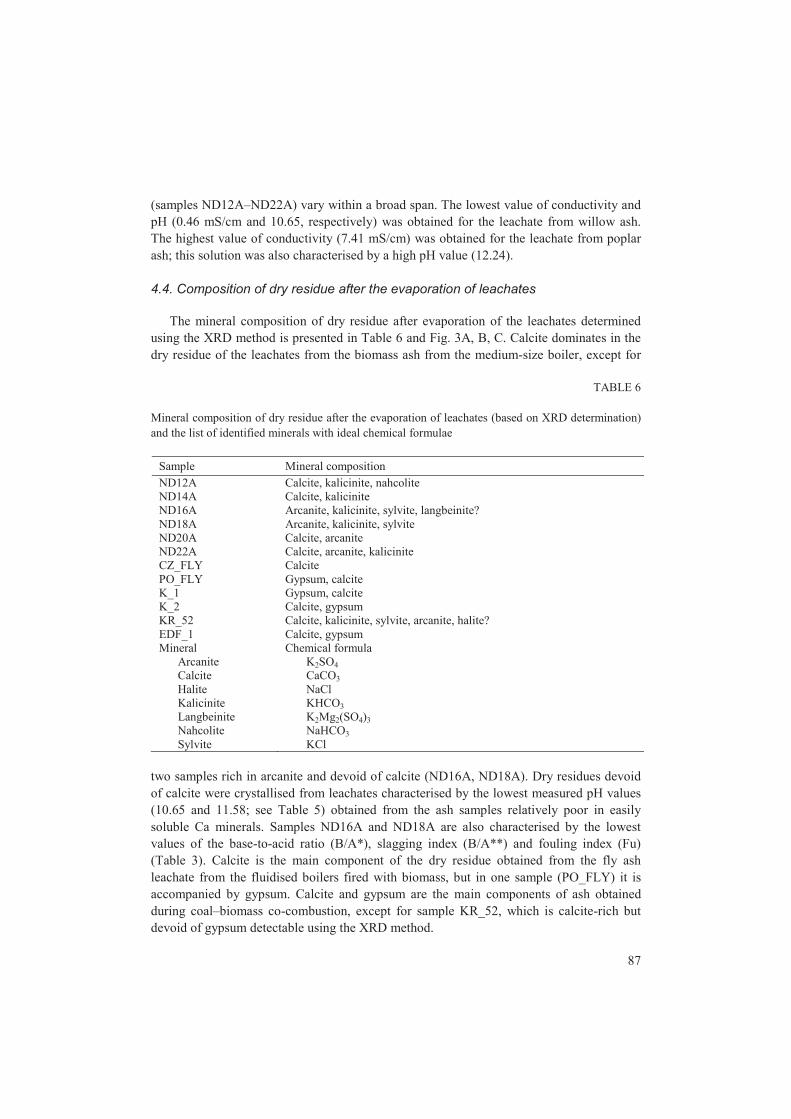
4.4. Composition of dry residue after the evaporation of leachates
The mineral composition of dry residue after evaporation of the leachates determined
using the XRD method is presented in Table 6 and Fig. 3A, B, C. Calcite dominates in the dry residue of the leachates from the biomass ash from the medium-size boiler, except for
TABLE 6 Mineral composition of dry residue after the evaporation of leachates (based on XRD determination) and the list of identified minerals with ideal chemical formulae
Sample Mineral composition
ND12A Calcite, kalicinite, nahcolite ND14A Calcite, kalicinite ND16A Arcanite, kalicinite, sylvite, langbeinite? ND18A Arcanite, kalicinite, sylvite ND20A Calcite, arcanite ND22A Calcite, arcanite, kalicinite CZ_FLY Calcite PO_FLY Gypsum, calcite K_1 Gypsum, calcite K_2 Calcite, gypsum KR_52 Calcite, kalicinite, sylvite, arcanite, halite? EDF_1 Calcite, gypsum Mineral
Arcanite Calcite Halite Kalicinite Langbeinite Nahcolite Sylvite
Chemical formula K2SO4 CaCO3
NaCl KHCO3 K2Mg2(SO4)3
NaHCO3 KCl
two samples rich in arcanite and devoid of calcite (ND16A, ND18A). Dry residues devoid of calcite were crystallised from leachates characterised by the lowest measured pH values (10.65 and 11.58; see Table 5) obtained from the ash samples relatively poor in easily soluble Ca minerals. Samples ND16A and ND18A are also characterised by the lowest values of the base-to-acid ratio (B/A*), slagging index (B/A**) and fouling index (Fu) (Table 3). Calcite is the main component of the dry residue obtained from the fly ash leachate from the fluidised boilers fired with biomass, but in one sample (PO_FLY) it is accompanied by gypsum. Calcite and gypsum are the main components of ash obtained during coal–biomass co-combustion, except for sample KR_52, which is calcite-rich but devoid of gypsum detectable using the XRD method.
88
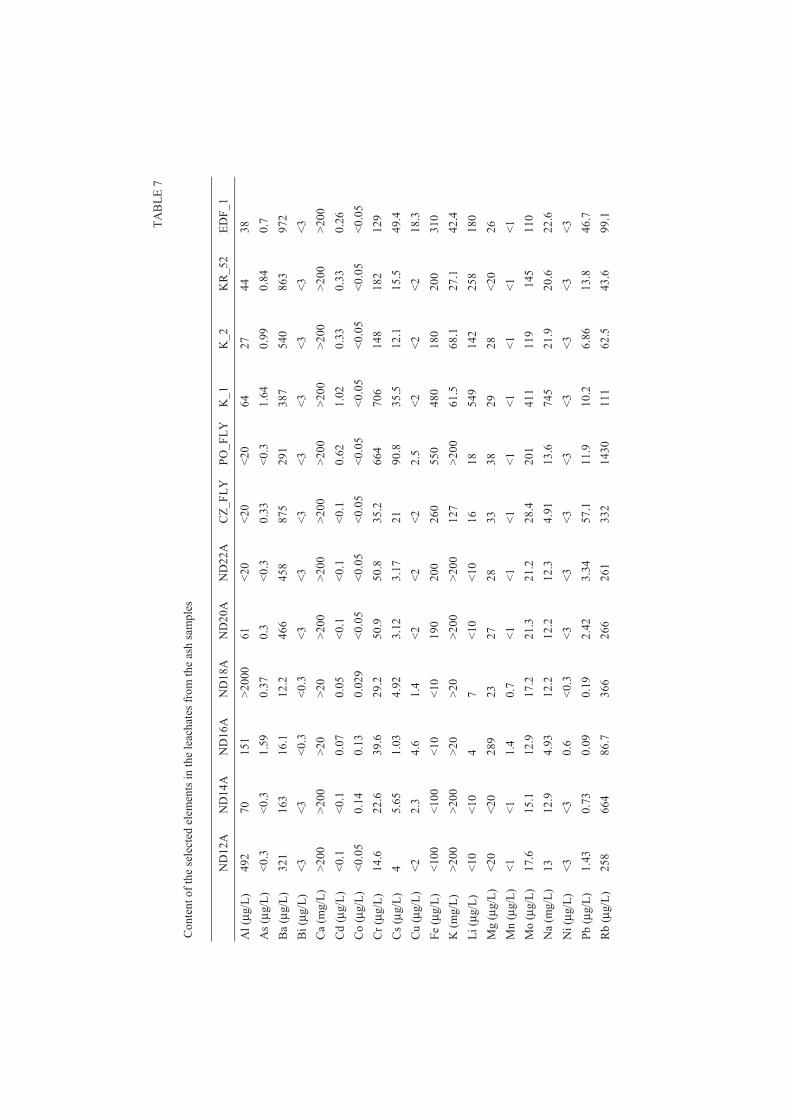
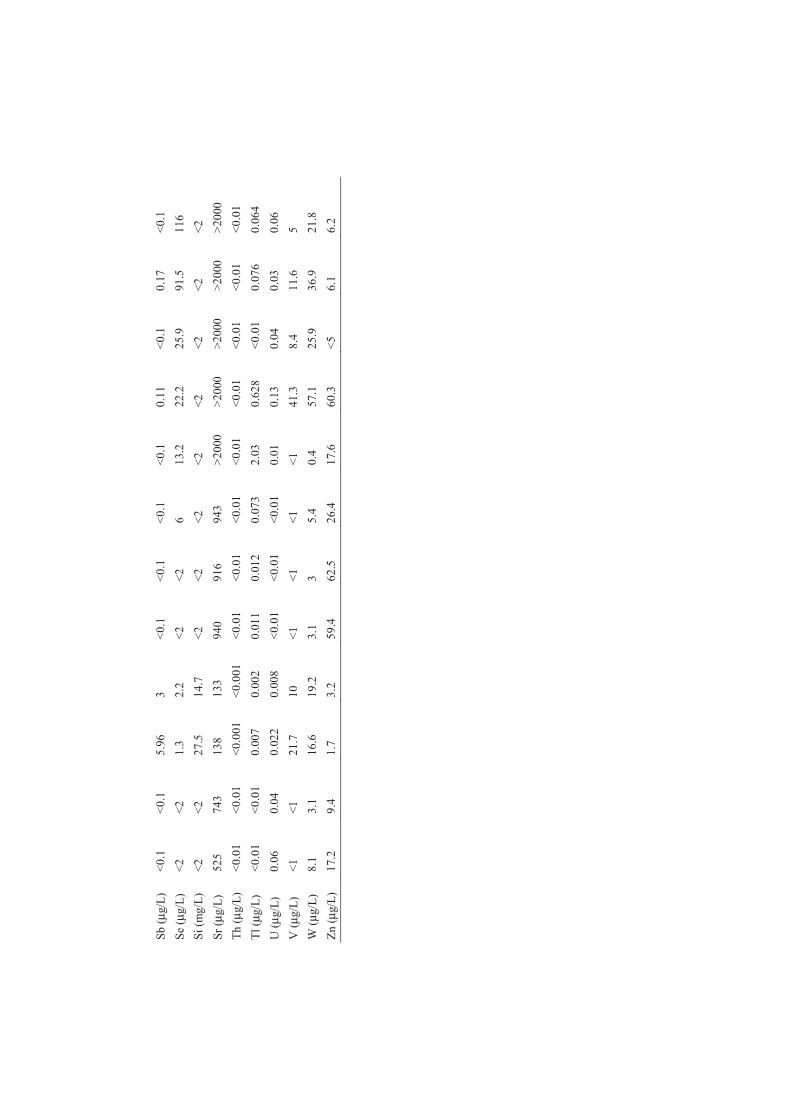
4.5. Chemical characteristics of the leachates and fraction of elements leached The content of the selected chemical components in the leachates is presented in Table
7. Some data are ambiguous, e.g. a large difference in Al content (from <20 μg/L to >2000 μg/L). Variation of the Al content in the leachate is not correlated with the Al2O3 content in ash (Table 3), while it is also difficult to find an explanation for these differences in Al content in the mineral composition of the ash (Table 4). The content of Si in the leachates is usually very low (<2 μg/L), except for two samples (ND16A and ND18A, at 27.5 and 14.7 μg/L, respectively) with the lowest slagging and fouling indices (Table 3). Leachates obtained from these samples are characterised by the lowest conductivity and lowest pH values (Table 5). The content of Ca, Na, and K is high in all the leachate samples. The occurrence of Ca, Na and K in relatively soluble compounds is commonly observed in the biomass ash, while ash from the combustion of solid biomass can be considered as a valuable source of plant nutrients such as K, P, Mg and Ca (N-free fertilizer) (Demeyer et al. 2001; Freire et al. 2015). The Li content is relatively high in the leachate from ash obtained in the co-combustion of coal with biomass, and probably reflects higher Li content in coal compared with biomass.
The content of trace elements in the leachates is generally low, usually below limits required of surface water intended for the abstraction of drinking water (Rozporządzenie Ministra z dnia 27 listopada 2002 r., Dz. U. 204) (except for Cr and Se in ash from biomass combustion in fluidised bed boiler and from biomass-coal co-combustion).
Low concentration can be interpreted as an effect of leaching in alkaline conditions. Leaching of elements from ash is pH dependent (Baba, Kaya 2004; Hansen et al. 2001; Komonweeraket et al. 2015). According to Khanra et al. (1998), the leachability of trace elements (except As) decreases with an increase in the pH of solution from 1.8 to 3.1. According to Komonweeraket et al. (2015), the concentration of some elements decreases with increasing pH (e.g. Mn), while for other elements the lowest concentrations are observed for neutral pH values (e.g. Al, Cr, Cu, Zn, Fe). In alkaline conditions it is possible to expect reprecipitation of the dissolved components (as was suggested for Cd by Hansen et al. (2001)).
Laboratory leaching only partly simulates real situations in the environment and low content of potentially hazardous elements in leachates cannot be considered as proof of safety (Li et al. 2012).
For most samples, the content of trace elements in leachate is partly related to their content in ash (Fig. 8). The content of trace elements is usually higher in the leachates obtained from ash from biomass–coal co-combustion compared to other samples. The Mo concentration in the leachate is well correlated with its content in ash (Fig. 8). Ba content in the leachate slightly correlates with its content in the ash (Fig. 8). The Ba content in four samples of ash from the coal–biomass co-combustion is higher than in other samples, but
TA
BL
E 7
C
onte
nt o
f th
e se
lect
ed e
lem
ents
in th
e le
acha
tes
from
the
ash
sam
ples
ND
12A
N
D14
A
ND
16A
N
D18
A
ND
20A
N
D22
A
CZ
_FL
Y
PO
_FL
Y
K_1
K
_2
KR
_52
ED
F_1
Al (
μg/L
) 49
2 70
15
1 >
2000
61
<
20
<20
<
20
64
27
44
38
As
(μg/
L)
<0.
3 <
0.3
1.59
0.
37
0.3
<0.
3 0.
33
<0.
3 1.
64
0.99
0.
84
0.7
Ba
(μg/
L)
321
163
16.1
12
.2
466
458
875
291
387
540
863
972
Bi (
μg/L
) <
3 <
3 <
0.3
<0.
3 <
3 <
3 <
3 <
3 <
3 <
3 <
3 <
3
Ca
(mg/
L)
>20
0 >
200
>20
>
20
>20
0 >
200
>20
0 >
200
>20
0 >
200
>20
0 >
200
Cd
(μg/
L)
<0.
1 <
0.1
0.07
0.
05
<0.
1 <
0.1
<0.
1 0.
62
1.02
0.
33
0.33
0.
26
Co
(μg/
L)
<0.
05
0.14
0.
13
0.02
9 <
0.05
<
0.05
<
0.05
<
0.05
<
0.05
<
0.05
<
0.05
<
0.05
Cr
(μg/
L)
14.6
22
.6
39.6
29
.2
50.9
50
.8
35.2
66
4 70
6 14
8 18
2 12
9
Cs
(μg/
L)
4 5.
65
1.03
4.
92
3.12
3.
17
21
90.8
35
.5
12.1
15
.5
49.4
Cu
(μg/
L)
<2
2.3
4.6
1.4
<2
<2
<2
2.5
<2
<2
<2
18.3
Fe
(μg/
L)
<10
0 <
100
<10
<
10
190
200
260
550
480
180
200
310
K (
mg/
L)
>20
0 >
200
>20
>
20
>20
0 >
200
127
>20
0 61
.5
68.1
27
.1
42.4
Li (
μg/L
) <
10
<10
4
7 <
10
<10
16
18
54
9 14
2 25
8 18
0
Mg
(μg/
L)
<20
<
20
289
23
27
28
33
38
29
28
<20
26
Mn
(μg/
L)
<1
<1
1.4
0.7
<1
<1
<1
<1
<1
<1
<1
<1
Mo
(μg/
L)
17.6
15
.1
12.9
17
.2
21.3
21
.2
28.4
20
1 41
1 11
9 1
45
110
Na
(mg/
L)
13
12.9
4.
93
12.2
12
.2
12.3
4.
91
13.6
74
5 21
.9
20.6
22
.6
Ni (
μg/L
) <
3 <
3 0.
6 <
0.3
<3
<3
<3
<3
<3
<3
<3
<3
Pb
(μg/
L)
1.43
0.
73
0.09
0.
19
2.42
3.
34
57.1
11
.9
10.2
6.
86
13.8
46
.7
Rb
(μg/
L)
258
664
86.7
36
6 26
6 26
1 33
2 14
30
111
62.5
43
.6
99.1
Sb
(μg/
L)
<0.
1 <
0.1
5.96
3
<0.
1 <
0.1
<0.
1 <
0.1
0.11
<
0.1
0.17
<
0.1
Se
(μg/
L)
<2
<2
1.3
2.2
<2
<2
6 13
.2
22.2
25
.9
91.5
11
6
Si (
mg/
L)
<2
<2
27.5
14
.7
<2
<2
<2
<2
<2
<2
<2
<2
Sr
(μg/
L)
525
743
138
133
940
916
943
>20
00
>20
00
>20
00
>20
00
>20
00
Th
(μg/
L)
<0.
01
<0.
01
<0.
001
<0.
001
<0.
01
<0.
01
<0.
01
<0.
01
<0.
01
<0.
01
<0.
01
<0.
01
Tl (
μg/L
) <
0.01
<
0.01
0.
007
0.00
2 0.
011
0.01
2 0.
073
2.03
0.
628
<0.
01
0.07
6 0.
064
U (
μg/L
) 0.
06
0.04
0.
022
0.00
8 <
0.01
<
0.01
<
0.01
0.
01
0.13
0.
04
0.03
0.
06
V (
μg/L
) <
1 <
1 21
.7
10
<1
<1
<1
<1
41.3
8.
4 11
.6
5
W (
μg/L
) 8.
1 3.
1 16
.6
19.2
3.
1 3
5.4
0.4
57.1
25
.9
36.9
21
.8
Zn
(μg/
L)
17.2
9.
4 1.
7 3.
2 59
.4
62.5
26
.4
17.6
60
.3
<5
6.1
6.2
91
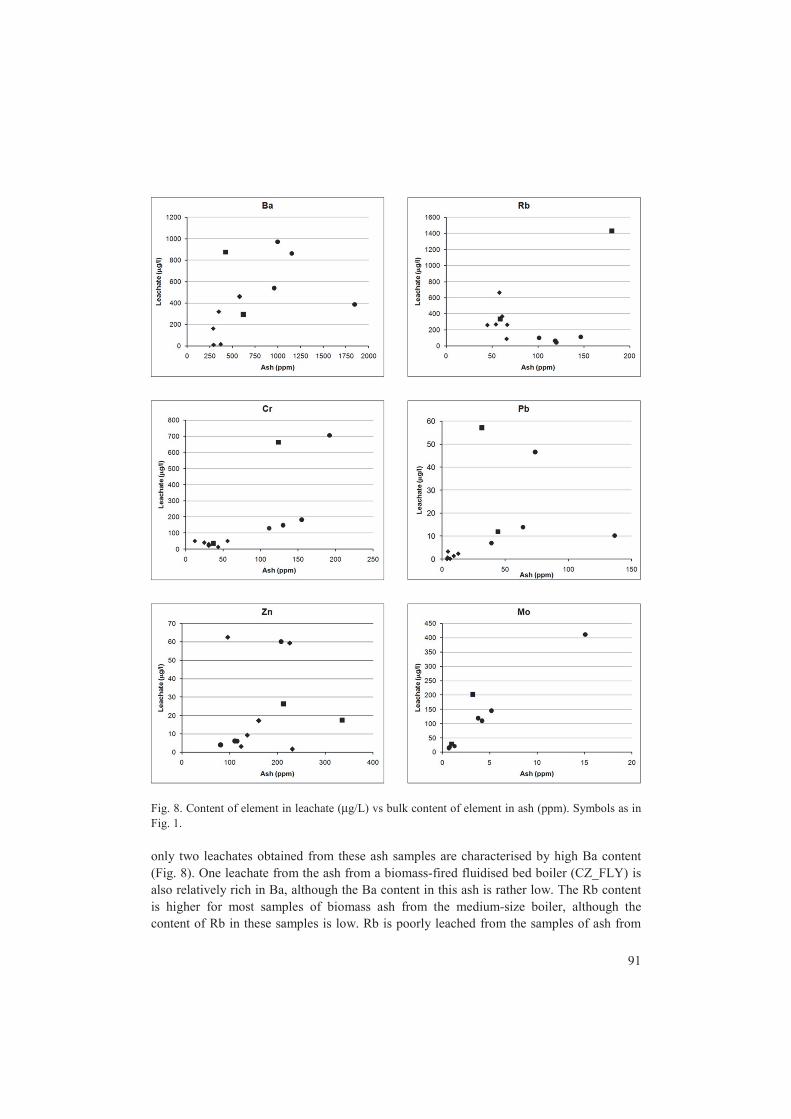
Fig. 8. Content of element in leachate (μg/L) vs bulk content of element in ash (ppm). Symbols as in Fig. 1.
only two leachates obtained from these ash samples are characterised by high Ba content (Fig. 8). One leachate from the ash from a biomass-fired fluidised bed boiler (CZ_FLY) is also relatively rich in Ba, although the Ba content in this ash is rather low. The Rb content is higher for most samples of biomass ash from the medium-size boiler, although the content of Rb in these samples is low. Rb is poorly leached from the samples of ash from

92
the coal–biomass co-combustion. The highest content of Rb in the leachate was noted for one sample of biomass ash from the fluidised bed boiler characterised by the highest Rb content in ash. The Mo content in the leachates correlates relatively well with its content in the ashes. For Cr, Pb and Zn the relationships between the content in the leachate and bulk content in ash are rather irregular. High Cr content in the leachate (above 600 μg/L) was noticed for two samples with high Cr content in ash, but one of these samples represents ash from the biomass-fired fluidised bed boiler and the other the ash from coal–biomass co-combustion in the pulverised fuel boiler. The highest Pb content in the leachate (above 40 μg/L) was noted for two samples (other than those samples with the highest Cr content) with a medium or high Pb content in ash. One of these samples represents ash from a biomass-fired fluidised bed boiler and the second ash from a pulverised fuel boiler fired with coal and biomass blend. The highest Zn content in the leachate (around 60 μg/L) was noted for three samples with medium content of this element in ash. Two samples represent biomass ash from the medium-size boiler and one is ash from the coal–biomass co-combustion in the pulverised fuel boiler.
The results indicate that the content of elements in the leachate is related to various factors and is not in a simple relationship with the bulk content of these elements in the ash. This could suggest that elements potentially excluding Mo are contained in samples in different phases characterised by different solubility. The speciation of elements is very important as a factor determining their mobility. For example, Hansen et al. (2001) showed that speciation of Cd (CdCl2 vs CdSiO3) strongly influences its leachability. Fly ash is enriched in volatile trace elements captured from flue gases (Díaz-Somoano et al. 2006). Determination of speciation can be based on sequential extraction, but detailed mineralogical study seems to be necessary as a confirmation of sequential extraction-based interpretation.
The fraction of leached elements is rather low compared with their content in ash (Table 8). Only some elements are leached off from the sample in amounts higher than 10%. For Mo, the effectiveness of extraction is surprisingly high (Table 8). The degree of water extraction of Mo increases with increasing pH value, because it forms molybdate oxide in a basic solution (Ogata 2011). One sample of biomass fly ash from the fluidised bed boiler (PO_FLY) is characterised by a high degree of extraction for some elements (Mo: 62.81%; Se: 14.67%; Cs: 10.68%; Cr: 5.36%). Leachates from two samples of biomass ash from a medium-size boiler (ND16A and ND18A) are richer in Sb, As, and W compared with the other samples. The composition of dry residue after evaporation of the leachate from these two samples also differs from the other samples (Table 6) and is rich in arcanite, but devoid of calcite. Significant variation of the mineral and chemical composition of the ash and chemical composition of leachates indicates that the usage of this material can be troublesome. Relatively high concentration of some elements (heavy metals or potentially toxic elements) in some ash samples or in leachates obtained during water extraction indicates that the bioavailability of these elements can also be high. Limited correlation between the bulk content of elements in the ash and their concentration in leachate indicates that complex study (including leaching in different conditions) is needed for determination of a possible field of application for the ash (e.g. as fertilizer or soil amendment).
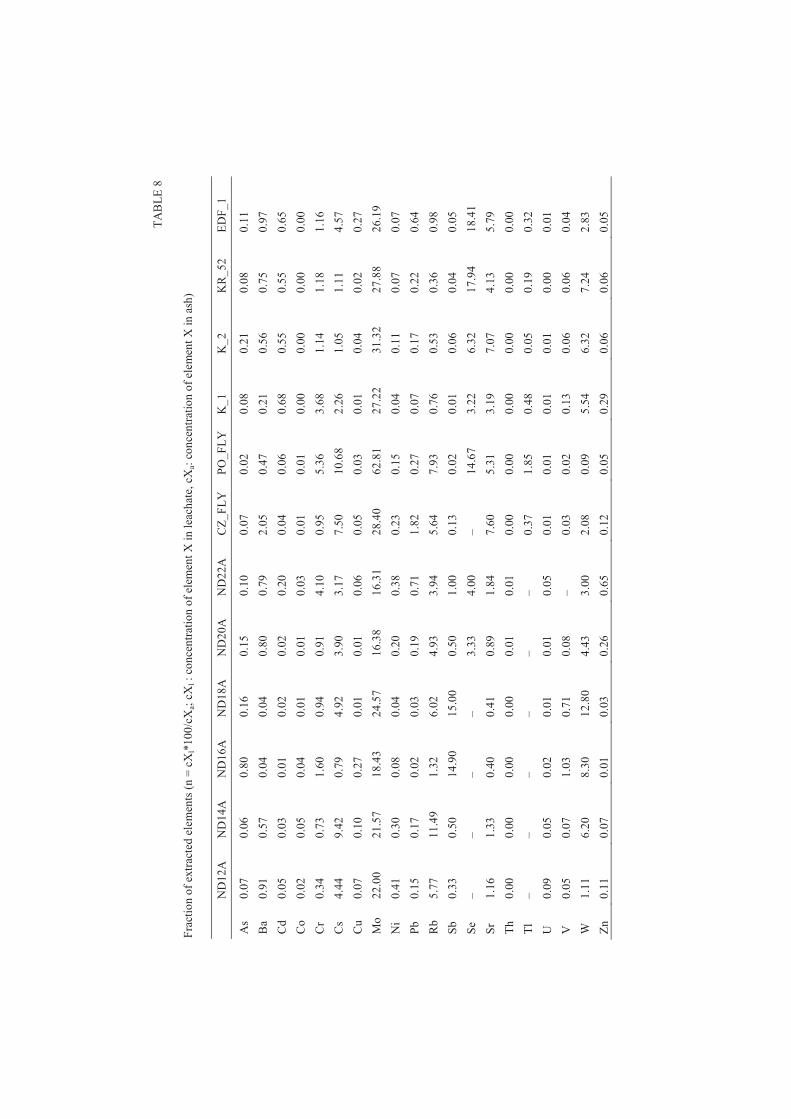
TA
BL
E 8
F
ract
ion
of e
xtra
cted
ele
men
ts (
n =
cX
l*10
0/cX
a; c
Xl :
con
cent
rati
on o
f el
emen
t X in
leac
hate
, cX
a: c
once
ntra
tion
of e
lem
ent X
in a
sh)
ND
12A
N
D14
A
ND
16A
N
D18
A
ND
20A
N
D22
A
CZ
_FL
Y
PO
_FL
Y
K_1
K
_2
KR
_52
ED
F_1
As
0.07
0.
06
0.80
0.
16
0.15
0.
10
0.07
0.
02
0.08
0.
21
0.08
0.
11
Ba
0.91
0.
57
0.04
0.
04
0.80
0.
79
2.05
0.
47
0.21
0.
56
0.75
0.
97
Cd
0.05
0.
03
0.01
0.
02
0.02
0.
20
0.04
0.
06
0.68
0.
55
0.55
0.
65
Co
0.02
0.
05
0.04
0.
01
0.01
0.
03
0.01
0.
01
0.00
0.
00
0.00
0.
00
Cr
0.34
0.
73
1.60
0.
94
0.91
4.
10
0.95
5.
36
3.68
1.
14
1.18
1.
16
Cs
4.44
9.
42
0.79
4.
92
3.90
3.
17
7.50
10
.68
2.26
1.
05
1.11
4.
57
Cu
0.07
0.
10
0.27
0.
01
0.01
0.
06
0.05
0.
03
0.01
0.
04
0.02
0.
27
Mo
22.0
0 21
.57
18.4
3 24
.57
16.3
8 16
.31
28.4
0 62
.81
27.2
2 31
.32
27.8
8 26
.19
Ni
0.41
0.
30
0.08
0.
04
0.20
0.
38
0.23
0.
15
0.04
0.
11
0.07
0.
07
Pb
0.15
0.
17
0.02
0.
03
0.19
0.
71
1.82
0.
27
0.07
0.
17
0.22
0.
64
Rb
5.77
11
.49
1.32
6.
02
4.93
3.
94
5.64
7.
93
0.76
0.
53
0.36
0.
98
Sb
0.33
0.
50
14.9
0 15
.00
0.50
1.
00
0.13
0.
02
0.01
0.
06
0.04
0.
05
Se
– –
– –
3.33
4.
00
– 14
.67
3.22
6.
32
17.9
4 18
.41
Sr
1.16
1.
33
0.40
0.
41
0.89
1.
84
7.60
5.
31
3.19
7.
07
4.13
5.
79
Th
0.00
0.
00
0.00
0.
00
0.01
0.
01
0.00
0.
00
0.00
0.
00
0.00
0.
00
Tl
– –
– –
– –
0.37
1.
85
0.48
0.
05
0.19
0.
32
U
0.09
0.
05
0.02
0.
01
0.01
0.
05
0.01
0.
01
0.01
0.
01
0.00
0.
01
V
0.05
0.
07
1.03
0.
71
0.08
–
0.03
0.
02
0.13
0.
06
0.06
0.
04
W
1.11
6.
20
8.30
12
.80
4.43
3.
00
2.08
0.
09
5.54
6.
32
7.24
2.
83
Zn
0.11
0.
07
0.01
0.
03
0.26
0.
65
0.12
0.
05
0.29
0.
06
0.06
0.
05

94
5. Conclusions Ash from the biomass combustion in the medium-size grate boiler and fly ash from the
fluidised bed boilers from the power plants, as well as fly ash from the coal–biomass co-combustion in the pulverised boilers in power plants, differs strongly in chemical and mineral composition. The diversity of ash obtained from the woody biomass combusted in the medium-size boiler can be related to the different compositions of fuel, and to the contamination of fuel during harvesting or storage. The composition of fly ash from the biomass–coal co-combustion is governed by the coal composition, which dominates in fuel blend.
The content of heavy metals in the biomass ash from the medium-size boiler is generally below the limits for fertilizers or soil amendments (except for Cd in one sample). The content of Cr, Ni and V in some samples of the biomass ash from the fluidised bed boilers and the ash biomass–coal co-combustion in the pulverised fuel boilers exceeds these limits.
The content and type of newly formed minerals in the ash are related to the chemical composition of the ash. Ca-containing minerals are common (calcite, wollastonite, periclase, portlandite, bassanite). Mullite is present only in ash from the biomass–coal co-combustion.
The correlation between the conductivity of leachate and slagging index (based on the base-to-acid ratio) of the ash is visible, along with a correlation between the pH values and conductivity of leachates. The conductivity and pH values of the leachates from the woody biomass ash from the medium-size boiler vary significantly.
Calcite is a dominant component of the dry residues obtained after the evaporation of leachates, except for two samples characterised by the presence of K-bearing components (arcanite, kalicinite, sylvite) and devoid of calcite (samples with the lowest base-to-acid ratio values).
Concentration of the trace elements in the leachates is generally low. Fraction of the leached elements compared to their bulk content in the ash is relatively low, except for Mo (from 16.31 to 62.81%). The content of most of the elements in the leachate is related to various factors and is not in a simple relationship with the bulk content of these elements in the ash potentially excluding Mo.
Significant variation of the mineral and chemical composition of the ash and chemical composition of the leachates indicates that the complex study of ash samples is necessary for the determination of a possible field of application.
Acknowledgements. This study was supported by NCN Grant No. 0579/B/P01/2011/40. Thanks is addressed to Waldemar Obcowski for final preparation of figures.
6. References
Baba, A., & Kaya, A. (2004). Leaching characteristics of fly ash from thermal power plants of Soma
and Tunçbilek, Turkey. Environmental Monitoring and Assessment, 91, 171-181. DOI: 10.1023/B:EMAS.0000009234.42446.d3.

95
Bartoňová, L., Čech, B., Ruppenthalová, L., Majvelderová, V., Juchelková, D., & Klika, Z. (2012). Effect of unburned carbon content in fly ash on the retention of 12 elements out of coal-combustion flue gas. Journal of Environmental Sciences, 24, 1624-1629. DOI: 10.1016/S1001-0742(11)60981-9.
Bogush, A. A., Stegemann, J. A., Williams, R., & Wood I. G. (2018). Element speciation in UK biomass power plant residues based on composition, mineralogy, microstructure and leaching. Fuel, 211, 712-725. DOI: 10.1016/j.fuel.2017.09.103.
Bonner, I. J., Smith, W. A., Einerson, J. J., & Kenney, K. L. (2014). Impact of harvest equipment on ash variability of baled corn stover biomass for bioenergy. Bioenergy Research, 7, 845-855. DOI 10.1007/s12155-014-9432-x.
Ciesielczuk, T., Kusza, G., & Nemś, A. (2011). Nawożenie popiołami z termicznego przekształcania biomasy źródłem pierwiastków śladowych dla gleb. Ochrona Środowiska i Zasobów Mineralnych, 49, 219-227.
Dahl, O., Nurmesniemi, H., Pöykiö, R., & Watkins, G. (2010). Heavy metal concentrations in bottom ash and fly ash fractions from a large-sized (246 MW) fluidized bed boiler with respect to their Finnish forest fertilizer limit values. Fuel Processing Technology, 91, 1634-1639. DOI: 10.1016/j.fuproc.2010.06.012.
Degereji, M. U., Gubba, S. R., Ingham, D. B., Ma, L., Pourkashanian, M., Williams, A., & Williamson, J. (2013). Predicting the slagging potential of co-fired coal with sewage sludge and wood biomass. Fuel, 108, 550-556. DOI: 10.1016/j.fuel.2012.12.030.
Demeyer, A., Voundi Nkana, J. C., & Verloo, M. G. (2001). Characteristics of wood ash and influence on soil properties and nutrient uptake: an overview. Bioresource Technology, 77, 287-295. DOI: 10.1016/S0960-8524(00)00043-2.
Demirbas, A. (2005). Potential applications of renewable energy sources, biomass combustion problems in boiler power systems and combustion related environmental issues. Progress in Energy and Combustion Science, 31, 171-192. DOI: 10.1016/j.pecs.2005.02.002.
Díaz-Somoano, M., Unterberger, S., & Hein, K. R. G.(2006). Prediction of trace element volatility during co-combustion processes. Fuel, 85, 1087-1093. DOI:10.1016/j.fuel.2005.10.013.
Freire, M., Lopes, H., & Tarelho, L.A.C. (2015). Critical aspects of biomass ashes utilization in soils: Composition, leachability, PAH and PCDD/F. Waste Management, 46, 304-315. DOI: 10.1016/j.wasman.2015.08.036.
Hansen, H. K., Pedersen, A. J., Ottosen, L. M., & Villumsen, A. (2001). Speciation and mobility of cadmium in straw and wood combustion fly ash. Chemosphere, 45, 123-128. DOI: 10.1016/S0045-6535(01)00026-1.
Ingerslev, M., Skov, S., Sevel, L., & Pedersen, L.B. (2011). Element budgets of forest biomass combustion and ash fertilisation - a Danish case-study. Biomass and Bioenergy, 35, 2697-2704. DOI: 10.1016/j.biombioe.2011.03.018.
Izquierdo, M., Moreno, N., Font, O., Querol, X., Alvarez, E., Antenucci, D., Nugteren, H., Luna, Y., & Fernández-Pereira, C. (2008). Influence of the co-firing on the leaching of trace pollutants from coal ash. Fuel, 87, 1958-1966. DOI:10.1016/j.fuel.2007.11.002.
Jiménez, S., & Ballester, J. (2005). Effect of co-firing on the properties of submicron aerosols from biomass combustion. Proceedings of the Combustion Institute, 30, 2965-2972. DOI: 10.1016/j.proci.2004.08.099.
Johansson, L. S., Tullin, C., Leckner, B., & Sjövall, P. (2003). Particle emissions from biomass combustion in small combustors. Biomass and Bioenergy, 25, 435-446. DOI: 10.1016/S0961-9534(03)00036-9.
Juda-Rezler, K., & Kowalczyk, D. (2013). Size distribution and trace elements contents of Coal fly ash from pulverized boilers. Polish Journal of Environmental Studies, 22, 25-40.
Kalembkiewicz, J., & Chmielarz, U. (2012). Ashes from co-combustion of coal and biomass: New industrial wastes. Resources, Conservation and Recycling, 69, 109-121. DOI: 10.1016/j.resconrec.2012.09.010.
Ketris, M. P., & Yudovich, Ya. E. (2009). Estimation of Clarkes for Carbonaceous biolithes: World for trace element content in black shales and coals. International Journal of Coal Geology, 78, 135-148. DOI: 10.1016/j.coal.2009.01.002.
Khanra, S., Mallick, D, Dutta, S. N., Chaudhuri, S. K. (1998). Studies on the phase mineralogy and leaching characteristics of coal fly ash. Water, Air, and Soil Pollution, 107, 251-275. DOI: 10.1023/A:1004947519170.
Komonweeraket, K., Cetin, B., Aydilek, A. H., Benson, C. H., & Edil, T.B. (2015). Effects of pH on the leaching mechanisms of elements from fly ash mixed soils. Fuel, 140, 788-802. DOI: 10.1016/j.fuel.2014.09.068.
Kovacs, H., Szemmelveisz, K., & Palotas, A.B. (2013). Solubility analysis and disposal options of combustion residues from plants grown on contaminated mining area. Environmental Science and Pollution Research, 20, 7917-7925. DOI 10.1007/s11356-013-1673-2.
Lanzerstorfer, C. (2015). Chemical composition and physical properties of filter fly ashes from eight grate-fired biomass combustion plants. Journal of Environmental Sciences, 30, 191-197. DOI:10.1016/j.jes.2014.08.021.
96
Lee, J. W., Hawkins, B., Day, D. M., & Reicosky, D.C. (2010). Sustainability: the capacity of smokeless biomass pyrolysis for energy production, global carbon capture and sequestration. Energy and Environmental Sciences, 11, 1695-1705. DOI: 10.1039/c004561f.
Li, L., Yu, C., Bai, J., Wang, Q., & Luo, Z. (2012). Heavy metal characterization of circulating fluidized bed derived biomass ash. Journal of Hazardous Materials, 233-234, 41-47. DOI: 10.1016/j.jhazmat.2012.06.053.
López, R., Díaz, M. J., & González-Pérez, J. A. (2018). Extra CO2 sequestration following reutilization of biomass ash. Science of the Total Environment, 625, 1013-1020. DOI: 10.1016/j.scitotenv.2017.12.263.
Mardon, S. M., Hower, J. C., O'Keefe, J. M. K., Marks, M. N., & Hedges, D. H. (2008). Coal combustion by-product quality at two stoker boilers: Coal source vs. fly ash collection system design. International Journal of Coal Petrology, 75, 284-254. DOI: 10.1016/j.coal.2008.07.004.
Michalik, M., Pogrzeba, M., & Wilczyńska-Michalik, W. (2013). Biomass combustion – a possible source of environmental pollution? Goldschmidt 2013 Conference Abstracts, Mineralogical Magazine, 77(5), 1753.
Modolo, R. C. E., Tarelho, L. A. C., Teixeira, E. R., Ferreira, V. M., & Labrincha, J. A. (2014). Treatment and use of bottom bed waste in biomass fluidized bed combustors. Fuel Processing Technology, 125, 170-181. DOI: 10.1016/j.fuproc.2014.03.040.
Moreno, N., Querol, X., Andrés, J. M., Stanton, K., Towler, M., Nugteren, H., Janssen Jurkovicová, M., & Jones, R. (2005). Physico-chemical characteristics of European pulverized coal combustion fly ashes. Fuel, 84, 1351-1363. DOI:10.1016/j.fuel.2004.06.038.
Narodoslawsky, M., & Obernberger, I. (1996). From waste to raw material – the route from biomass to wood ash for cadmium and other heavy metals. Journal of Hazardous Materials, 50, 157-168. DOI: 10.1016/0304-3894(96)01785-2.
Nzihou, A., & Stanmore, B. R. (2013). The fate of heavy metals during combustion and gasification of contaminated biomass – A brief review. Journal of Hazardous Materials, 256-257, 56-66. DOI: 10.1016/j.jhazmat.2013.02.050.
Nzihou, A., & Stanmore, B. R., 2015. The formation of aerosols during the co-combustion of coal and biomass. Waste Biomass Valorization, 6, 947-957. DOI 10.1007/s12649-015-9390-3.
Ogata, F., Tominaga, H., Yabutani, H., Taga, A., & Kawasaki, N. (2011). Recovery of molybdenum from fly ash by gibbsite. Toxicological and Environmental Chemistry, 93, 635–642. DOI: 10.1080/ 02772248.2011.558508.
Parzentny, H. R., & Lewińska-Preis, L. (2006). The role of sulphide and carbonate minerals in the concentration of chalcophile elements in the bituminous coal seams of a paralic series (Upper Carboniferous) in the Upper Silesian Coal Basin (USCB), Poland. Chemie der Erde, 66, 227-247. DOI:10.1016/j.chemer.2005.04.001.
Priyanto, D. E., Ueno, S., Sato, N., Kasai, H., Tanoue, T., & Fukushima, H. (2016). Ash transformation by co-firing of coal with high ratios of woody biomass and effect on slagging propensity. Fuel, 174, 172-179. DOI: 10.1016/j.fuel.2016.01.072.
Pronobis, M. (2006). The influence of biomass co-combustion on boiler fouling and efficiency. Fuel, 85, 474-480. DOI: 10.1016/j.fuel.2005.08.015.
Querol, X., Juan, R., Lopez-Soler, A., Fernandez-Turiel, J. L., & Ruiz, C. R. (1996). Mobility of trace elements from coal and combustion wastes. Fuel, 7, 821-838. DOI: 10.1016/0016-
2361(96)00027-0. Rozporządzenie Ministra Rolnictwa i Rozwoju Wsi z dnia 18 czerwca 2008 r. w sprawie wykonania niektórych
przepisów ustawy o nawozach i nawożeniu. Dziennik Ustaw, 119, Poz. 765, 6515-6520. Rozporządzenie Ministra z dnia 27 listopada 2002 r. w sprawie wymagań jakim powinny odpowiadać wody
powierzchniowe wykorzystywane do zaopatrzenia ludności w wodę przeznaczoną do spożycia. Dziennik Ustaw, 204, Poz. 1728, 12738-12751.
Steenari, B.-M., Karlsson, L. G. & Lindqvist, O. (1999). Evaluation of the leaching characteristics of wood ash and the influence of ash agglomeration. Biomass and Bioenergy, 16, 119-136. DOI: 10.1016/S0961-9534(98)00070-1.
Supancic, K., Obernberger, I., Kienzl, N., & Arich, A. (2014). Conversion and leaching characteristics of biomass ashes during outdoor storage - Results of laboratory tests. Biomass and Bioenergy, 61, 211-226. DOI: 10.1016/j.biombioe.2013.12.014.
Świetlik, R., Trojanowska, M., & Rabek, P. (2012). Distribution patterns of Cd, Cu, Mn, Pb and Zn in wood fly ash emitted from domestic boilers. Chemical Speciation and Bioavailability, 25, 63-70. DOI: 10.3184/095422912X13497968675047.
Tan, Z., & Lagerkvist. A. (2011). Phosphorus recovery from the biomass ash: A review. Renewable and Sustainable Energy Reviews, 15, 3588-3602. DOI: 10.1016/j.rser.2011.05.016.
97
Vassilev, S. V., & Vassileva, C. G. (2007). A new approach for the classification of coal fly ashes based on their origin, composition, properties, and behavior. Fuel, 86, 1490-1512. DOI:10.1016/j.fuel.2006.11.020.
Vassilev, S. V., Baxter, D., Andersen, L. K., & Vassileva, C.G. (2013a). An overview of the composition and application of biomass ash. Part 1. Phase–mineral and chemical composition and classification. Fuel, 105, 40-76. DOI: 10.1016/j.fuel.2012.09.041.
Vassilev, S. V., Baxter, D., Andersen, L. K., & Vassileva, C. G. (2013b). An overview of the composition and application of biomass ash. Part 2. Potential utilisation, technological and ecological advantages and challenges. Fuel, 105, 19-39. DOI: 10.1016/j.fuel.2012.10.001.
Vassilev, S. V., Baxter, D., & Vassileva, C. G. (2014). An overview of the behaviour of biomass during combustion: Part II. Ash fusion and ash formation mechanisms of biomass types. Fuel, 117, 152-183. DOI: 10.1016/j.fuel.2013.09.024.
Wilczyńska-Michalik, W., & Michalik, M. (2016). Trace elements in biomass fuel and biomass ash – a comparison with coal and coal ash. Goldschmidt Conference Abstracts, 3412.
Wiśniewski, G., Michałowska-Knap, K., & Arcipowska, A. (2012). O niezrównoważonym wykorzystaniu odnawialnych zasobów energii w Polsce i patologii w systemie wsparcia OZE, Propozycje zmian podejścia do promocji OZE i kierunków wykorzystania zasobów biomasy. Instytut Energetyki Odnawialnej (EC BREC IEO), Warszawa, 1-29.
Zheng, Y., Peter Jensen, A., Jensen, A. D., Sander, B., & Junker, H. (2007). Ash transformation during co-firing coal and straw. Fuel, 86(7-8), 1008-1020. DOI: 10.1016/j.fuel.2006.10.008.