mineralogy review - university of wyoming
TRANSCRIPT


5
Common non-silicate planetary minerals
• Many of the non-silicate minerals are simple oxides.– Corundum Al2O3 Al2
+3 O3-2
– Rutile Ti2O3 Ti2+3 O3
-2
– Ilmenite FeTiO3 Fe+3Ti+3O3-2
– Hematite Fe2O3 Fe2+3 O3
-2
• Families of similar form also exist, such as the spinel group, named after one of its members. The general formula is X+2O •Y2
+3O3 where X and Y can be as follows
• Common sulfides are– Troilite FeS
– Pyrite FeS2
– Pyrrhotite FeS to Fe7S8
– Galena PbS– Sphalerite ZnS
Name X+2 Y+3 Formula
spinel Mg Al MgAl2O4
magnetite Fe Fe Fe3O4
chromite Fe Cr FeCr2O4

6
Melting and Crystallization: Solid Solutions●Minerals where solid solutions exist like: Olivine: (Mg, Fe)
2 SiO
4 : any Mg can replace any Fe
●Pure Mg2SiO
4 (Forsterite) melts at 1890o C
●Pure Fe2SiO
4 (Fayalite) melts at 1205o C
●Mg crystals survive at higher temperature because Mg bonds are stronger than Fe ones.
●For given intermediate composition: Liquidus gives temperature above which system is all liquid Solidus gives temperature below which system is all solid
●If you have melt with composition “a” and cool it, first crystals form at temperature of the b-c line (~1700o C). The melt (which makes up almost all the system) will have composition “a” but the crystals will be more Mg rich, with composition “c”.
●As you continue to cool it the composition of the melt shifts to the left (towards Fe) since your are preferentiallyextracting Mg. As long as crystals stay in equilibrium with melt the melt composition will follow the liquidus curve while the crystal composition follows the solidus curve.
●At a temperature just below 1500o the crystals have composition “a”, the same as the original melt, and the liquid composition reaches “d”. Virtually all of the system must now be solid and “d” represents the last dregs of liquid. If you cool it any further than this the system is all solid with original composition “a”.
●You can find the relative amounts of liquid and solid using the “lever” rule: If F is fraction and C is composition F
melt × C
melt + F
crystals × C
crystals = C
system and F
melt + F
crystals = 1
From Winter 2001

7
●If you cool a “melt” with the composition of “A” then when it reaches “D” it begins to form pure ice crystals. Since you are preferentially extracting ice, the “melt” composition shifts towards Salt. As the melt cools the melt composition follows the “D” to “E” curve. At any point the amount of ice crystals and the amount of melt can be found from the lever rule.
●Point “E” is called the “Eutectic”●The Eutectic Composition is 23.3% NaCl by weight. The Eutectic Temperature is -21.1o C.●If you cool the system any further then both pure ice and pure salt crystals will form. When the entire system is crystallized it will be a “mechanical” mixture of pure ice and pure salt crystals whose bulk composition will match the original composition of the “melt”.
●If you heat an initially solid mechanical mixture of salt and ice the first melt will appear that the Eutectic Temperature with the Eutectic Composition. As the temperature is raised the melt will evolve along either the D-E or E-B curve until the melt composition matches the bulk composition.
Melting and Crystallization: Immiscible Solids●Minerals where only pure crystals of end-member composition exist. (This is simplified salt – in reality hydrated salts exist)
●Pure H2O melts as 0o C
●Pure NaCl melts at 801o C●Mixtures of the right intermediate composition can melt at temperatures less than either end-member.
●Diagram shows:
●Clear portion: pure liquid brines
●Dark gray to left is: ice crystals plus saltwater
●Dark gray to left is: salt crystals plus saltwater.
●Light gray at bottom: mixture of pure salt crystals and pure ice crystalsFrom the web

8
●Real salt can form not only pure H2O ice and pure NaCl crystals but also a
hydrated salt NaCl·2H2O crystal so the actual phase diagram is more
complicated.
Melting and Crystallization: Real Salt
From the web

9
Melting: Immiscible Solids (Diopside + Anorthite)
●Crystals of the pyroxene Diopside (MgCaSi2O
6 and the feldspar Anorthite
(CaAl2Si
2O
8) are immiscible and so have a phase diagram similar to that of the
simplified salt.
From Winter 2001

10
Melting: Immiscible Solids and Immiscible Liquids●Since both mathematically and physically:●
●Mg2SiO
4 + SiO
2 ↔ 2 MgSiO
3
●Forsterite + Quartz ↔ Enstatite
●Enstatite can be plotted on an axis stretching between Fo and Qtz
●We can have crystals of Fo, En, or Qtz●The quartz crystals can have two forms:
●Cristobalite at higher temperature●Tridymite at lower temperature
●The quartz rich liquid actually separates into two immiscible liquids●Point “i” is “peritectic” point. At this point in a cooling liquid + Forsterite system, all the Forsterite reacts with the melt to form Enstatite plus some residual melt
From Winter 2001
11
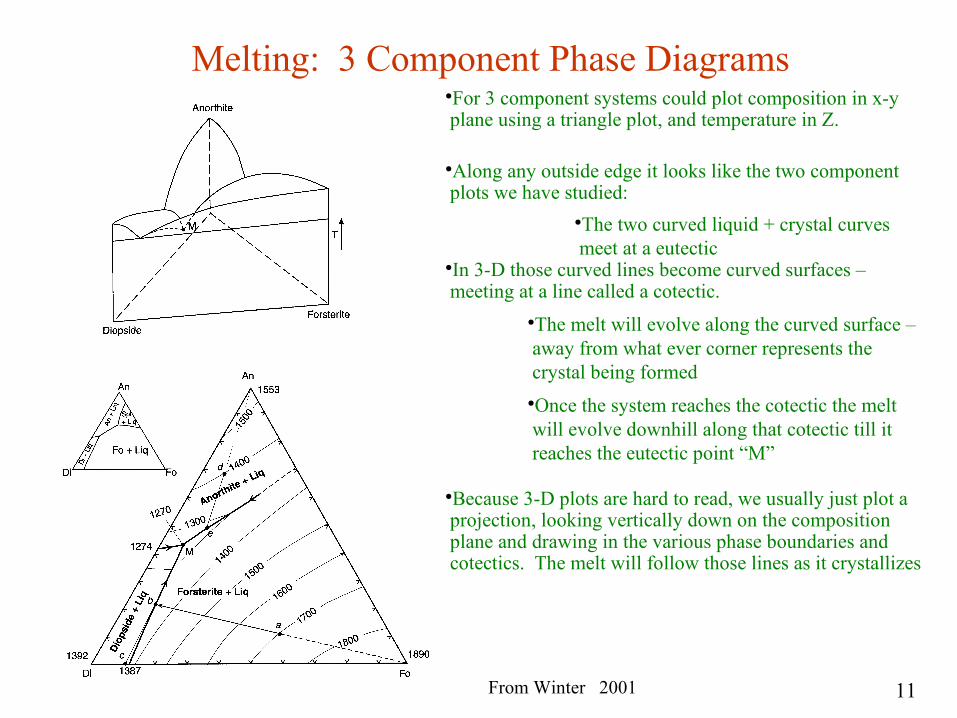
Melting: 3 Component Phase Diagrams●For 3 component systems could plot composition in x-y plane using a triangle plot, and temperature in Z.
●Along any outside edge it looks like the two component plots we have studied:
●The two curved liquid + crystal curves meet at a eutectic
●In 3-D those curved lines become curved surfaces – meeting at a line called a cotectic.
●The melt will evolve along the curved surface – away from what ever corner represents the crystal being formed
●Once the system reaches the cotectic the melt will evolve downhill along that cotectic till it reaches the eutectic point “M”
●Because 3-D plots are hard to read, we usually just plot a projection, looking vertically down on the composition plane and drawing in the various phase boundaries and cotectics. The melt will follow those lines as it crystallizes
From Winter 2001

12
Melting: The An, Fo, SiO2 diagram
●We can plot a wider range of compositions if we remember that Diopside can be thought of as lying partway between Quartz and Forsterite
●Like the Fo SiO2 diagram this one will have not only
eutectic (or cotectic) lines, but also peritectic lines where the forsterite crystals react with the melt to form enstatite.
●Diagram below is often used for plotting lunar rock evolution. Rotated and flipped version of one from Winter. Also, axes scaled differently (by weight vs. #)
From Winter 2001

13
Classification used for Highland Rocks: “Gabbroids”
• Gabbro: Dominated by Feldspar and Mafic minerals, • with little Quartz• Note: Gabbro can be used as a specific name for rock containing plagioclase plus
clinopyroxene, with perhaps olivine and orthopyroxene, or it can be used in a general sense (gabbroid) for rock containing plagioclase plus mafic materials. In much of the lunar literature it is used in the general sense.
– Quartz: < 5% of total – Mafics: 35 – 65% of total (augite hyperthese olivine)
– Plag: 90 – 100% of feldspar
• Anorthosite: Dominated by Ca Feldspar (anorthite)– Quartz: < 5% of total– Mafics: 0 – 10% (augite) typically augite– Plagioclase 90 – 100 % of feldspars
• Pyroxenite: Dominated by Pyroxene– Plagioclase: < 10% of total– Mafics: > 40% pyroxene
• Peridotite: Dominated by Olivine– Plagioclase: < 10% of total– Mafics: > 60% of total– (Dunite is name for rock with >90% olivine)
–
Deitrich & Skinner Figure 4.8b

14
Classification used for Highland Rocks: More refined names for Gabbroids
• You can plot Anorthite, Olivine, and Pyroxene in a ternary diagram for Anorthite, Olivine, Quartzsince Pyroxene is “intermediate” between olivine and quartz. This has the advantage that you can plot rocks that are even closer to quartz.
• So this diagram is like previous one, but rotated so An is at the lower right, and expanded to cover a region more toward SiO2
• Troctolites– Plagioclase (anorthosite) with olivine– Name (German) from resemblance to “speckled trout”
– from olivine phenocrysts on light background
• Norite– Plagioclase (anorthosite) with orthopyroxene
Taylor 1982