minimal evidence found of service duplication for students ... · 12/10/2018 · (e.g., speech,...
TRANSCRIPT

Minimal Evidence Found of Service Duplication for Students with Disabilities in Schools and
Communities
Final Report to the Joint Legislative Program Evaluation Oversight Committee
Report Number 2018-12
December 10, 2018
Program Evaluation Division
North Carolina General Assembly Legislative Office Building, Suite 100
300 North Salisbury Street Raleigh, NC 27603-5925
919-301-1404 www.ncleg.net/PED
75 copies of this public document were printed at a cost of $52.35 or $0.70 per copy.
A limited number of copies are available for distribution through the Legislative Library: Rooms 2126, 2226 Room 500
State Legislative Building Legislative Office Building Raleigh, NC 27601 Raleigh, NC 27603
919-733-7778 919-733-9390
The report is also available online at www.ncleg.net/PED.

NORTH CAROLINA GENERAL ASSEMBLY Legislative Services Office
Paul Coble, Legislative Services Officer
Program Evaluation Division 300 N. Salisbury Street, Suite 100 Raleigh, NC 27603-5925 Tel. 919-301-1404 Fax 919-301-1406
John W. Turcotte Director
AN EQUAL OPPORTUNITY/AFFIRMATIVE ACTION EMPLOYER
December 10, 2018
Senator Brent Jackson, Co-Chair, Joint Legislative Program Evaluation Oversight Committee Representative Craig Horn, Co-Chair, Joint Legislative Program Evaluation Oversight Committee North Carolina General Assembly Legislative Building 16 West Jones Street Raleigh, NC 27601 Honorable Co-Chairs:
The 2018 Work Plan of the Joint Legislative Program Evaluation Oversight Committee directed the Program Evaluation Division to examine how services for students with disabilities are determined and funded and whether duplication of Medicaid services occurs across school and community settings. I am pleased to report that the Department of Health and Human Services and the Department of Public Instruction cooperated with us fully and were at all times courteous to our evaluators during the evaluation. Sincerely,
John W. Turcotte Director

Mandatory Evaluation Components Report 2018-12: Minimal Evidence Found of Service Duplication for Students with Disabilities in Schools and Communities
N.C. Gen. § 120-36.14 requires the Program Evaluation Division to include certain components in each of its evaluation reports, unless exempted by the Joint Legislative Program Evaluation Oversight Committee. The table below fulfills this requirement and, when applicable, provides a reference to the page numbers(s) where the component is discussed in the report.
N.C. Gen. § 120-36.14 Specific
Provision
Component Program Evaluation Division Determination Report Page
(b)(1) Findings concerning the merits of the program or activity based on whether the program or activity
(b)(1)(a) Is efficient The delivery of services to students is not efficient, but improvements are underway. The State requires evaluations to be conducted, eligibility determined, and placement completed within 90 days of receipt of a written referral. In Federal Fiscal Year 2015–16, local education agencies met the State’s established timeframe 92% of the time. North Carolina’s performance on this indicator is worse than the national average of 98%. Of the 3,371 referrals exceeding the 90-day period in North Carolina, local education agencies reported 56% of the delays were due to referral paperwork not being processed in a timely manner. The Department of Public Instruction plans to implement the Every Child Accountability and Tracking System (ECATS) in 2019. This new data system should bolster the efficiency of service delivery by improving workflow processes.
22, 41
(b)(1)(b) Is effective Federal performance indicators suggest that services are effective and enable students with disabilities to achieve positive outcomes.
Between 2007 and 2016, the four-year high school graduation rate increased by 22%.
Between 2007 and 2016, the high school dropout rate decreased by 49%.
From 2012 to 2016, the percentage of students enrolled in higher education, enrolled in some other post-secondary education/training program, or employed within one year of departing high school increased by 24%.
North Carolina’s performance exceeded national performance in all of these areas.
20-21, 40-41
(b)(1)(c) Aligns with entity mission DPI’s Exceptional Children Division has a mission to ensure students with disabilities develop intellectually, physically, emotionally, and vocationally through the provision of an appropriate individualized education program in the least restrictive environment possible. This mission aligns with the State Board of Education’s mission to lead and uphold a system of public education in North Carolina that guarantees every student in the state an opportunity to receive a sound basic education.
3

(b)(1)(d) Operates in accordance with law The U.S. Department of Education provides oversight to ensure states meet federal Individuals with Disabilities Education Act requirements. In 2018, the U.S. Department of Education determined that North Carolina was among the 21 states that met requirements of the federal IDEA.
19
(b)(1)(e) Does not duplicate another program or activity
The State Board of Education has a duty to monitor local education agencies to determine compliance with the federal IDEA and state law. The State Board, through DPI’s Exceptional Children Division, monitors the implementation of all LEAs’ Exceptional Children Programs. The Exceptional Children Division is the sole state entity responsible for monitoring LEAs in the provision of services for students with disabilities.
3
(b)(1a) Quantitative indicators used to determine whether the program or activity
(b)(1a)(a) Is efficient The U.S. Department of Education requires each state to report annually on the timeliness of eligibility determinations. The Program Evaluation Division’s efficiency determination is based on Federal Indicator 11, which measures the percentage of children who were evaluated within the State's established timeframe. North Carolina requires evaluations to be conducted, eligibility determined, and placement completed within 90 days of receipt of a written referral.
41
(b)(1a)(b) Is effective The U.S. Department of Education requires each state to report annually on student outcomes. The Program Evaluation Division’s effectiveness determination is based on several Federal Indicators:
the percentage of youth with individualized education programs (IEPs) graduating from high school with a regular high school diploma within four years (Indicator 1),
the percentage of youth with IEPs dropping out of high school (Indicator 2), and
the percentage of youth who are no longer in secondary school, had IEPs in effect at the time they left school, and were enrolled in higher education or in some other postsecondary education or training program or were competitively employed in some other employment within one year of leaving high school (Indicator 14C).
40-41
(b)(1b) Cost of the program or activity broken out by activities performed
In Fiscal Year 2016–17, LEAs spent an average of $1,181 on direct medical services per Medicaid-enrolled student with an individualized education program. During the same time period, LEAs spent an average of $38 per Medicaid-enrolled student on Medicaid administrative activities.
11,
35-39
(b)(2) Recommendations for making the program or activity more efficient or effective
Recommendation 1 states the General Assembly should direct the Department of Public Instruction to establish methods for soliciting feedback from Exceptional Children Directors of local education agencies. This recommendation should improve the effectiveness of services for students with disabilities by improving the quality of technical assistance for local Exceptional Children Directors.
26-27
(b)(2a) Recommendations for eliminating any duplication
The Program Evaluation Division did not find evidence of duplication in the provision of services for students with disabilities.
N/A
(b)(4) Estimated costs or savings from implementing recommendations
Neither of the Program Evaluation Division’s recommendations will require additional costs nor yield savings.
N/A

PROGRAM EVALUATION DIVISION NORTH CAROLINA GENERAL ASSEMBLY
December 2018 Report No. 2018-12
Minimal Evidence Found of Service Duplication for Students with Disabilities in Schools and Communities
Summary
The Joint Legislative Program Evaluation Oversight Committee’s 2018 Work Plan directed the Program Evaluation Division to examine how services for students with disabilities are determined and funded and whether duplication of Medicaid services occurs across school and community settings.
The Program Evaluation Division found minimal evidence that Medicaid-covered services are duplicated in school and community settings. A Program Evaluation Division analysis of 3.2 million Medicaid claims from Fiscal Year 2016–17 found only 0.4% of paid claims were potentially duplicated across settings. According to the Division of Health Benefits, all potentially duplicated claims are permissible under a federal law that ensures Medicaid-enrolled children receive medically necessary services.
Based on measures collected by the U.S. Department of Education, North Carolina complies with the Individuals with Disabilities Education Act and effectively provides services to students with disabilities; efficiency may be improved with the implementation of the Department of Public Instruction’s (DPI) new special education services data system. In 2018, North Carolina was among 21 states to earn a federal determination of meeting IDEA requirements. The State is effective in getting students with disabilities into general classrooms and assisting them with achieving better outcomes. DPI’s new Every Child Accountability and Tracking System should improve the efficiency of service delivery for services provided in schools. The Program Evaluation Division also found that DPI’s Exceptional Children Division provides technical assistance to local education agencies (LEAs) but does not systematically measure the effectiveness of those efforts.
North Carolina’s new health information exchange, NC HealthConnex, could improve service delivery coordination, but failure to meet the statutory connectivity deadline could negatively impact LEA funding. LEAs are at risk of losing state funding if they do not connect to NC HealthConnex by June 1, 2019.
Based on these findings, the General Assembly should direct DPI to establish methods for soliciting feedback from LEAs'
Exceptional Children Directors and direct the Department of Information Technology, in conjunction with
the Department of Health and Human Services and DPI, to determine the feasibility of and fiscal impact on LEAs in meeting mandatory NC HealthConnex connectivity requirements.

Services for Students with Disabilities Report No. 2018-12
Page 2 of 41
Purpose & Scope The Joint Legislative Program Evaluation Oversight Committee’s 2018 Work Plan directed the Program Evaluation Division to examine the provision of services for students with disabilities. Specifically, the evaluation examines how services are determined, sources of funding for services, and the extent to which duplication of Medicaid services occurs across school and community settings.
Three central research questions guided this evaluation: 1. How do students with disabilities receive services across school and
community settings? 2. What are the funding mechanisms for providing services to students
with disabilities in school settings? 3. To what extent are Medicaid services provided to students with
disabilities being duplicated across settings?
The Program Evaluation Division collected data from several sources, including
review of laws and policies guiding the provision of services for students with disabilities;
review of policies and provider manuals guiding the provision of Medicaid-covered services;
interviews and queries of Department of Health and Human Services, Division of Health Benefits (formerly the Division of Medical Assistance);
an analysis of Medicaid claims data; interviews and queries of Department of Public Instruction,
Exceptional Children Division; interviews of Exceptional Children Program Directors at 12 local
school administrative units (commonly and hereafter in this report referred to as local education agencies);
interviews with national and state association representatives; and an interview with the Exceptional Children’s Assistance Center.
This evaluation focused on the provision of services for K-12 students with disabilities in traditional public schools, excluding pre-K and post-secondary students. Furthermore, the evaluation does not include students with disabilities in non-public educational settings.1
Appendix A shows summary statistics of students with disabilities in Fiscal Year 2016–17, including a statewide student profile, LEA expenditures and Medicaid participation, LEA funding for such services, and Medicaid claims and reimbursement.
1 The Department of Administration’s Non-Public Education Division governs non-public schools within the State.

Services for Students with Disabilities Report No. 2018-12
Page 3 of 41
Background Federal and state law require that individuals with disabilities are provided with a free appropriate public education. Two federal laws have provisions specific to protecting the rights of students with disabilities.
Section 504. Section 504 of the federal Rehabilitation Act of 1973 protects the civil rights of people with disabilities in programs that receive federal financial assistance. In general, Section 504 defines a disability as a physical or mental impairment that substantially limits one or more major life activities of an individual. Because public schools receive federal financial assistance, Section 504 prohibits discrimination against students with disabilities.
Individuals with Disabilities Education Act (IDEA). The IDEA protects the rights of students with disabilities in public school settings. The purpose of the IDEA is to prepare students with disabilities for further education, employment, and independent living. The IDEA defines a child with a disability as one who has been evaluated as having a specific condition, such as autism, specific learning disabilities, or speech or language impairment.2 Part B of the IDEA requires that all children between the ages of 3 and 21 are to be provided with a free appropriate public education.3 The IDEA defines free appropriate public education as services being provided at public expense, under public supervision and direction, and without charge.
Similar to federal law, state law also requires full educational opportunities be provided to all students with disabilities residing in North Carolina.4 State law permits the State Board of Education to set more stringent standards than those required by the IDEA, but at this time the State’s requirements are the same as federal requirements.
The State Board of Education sets rules to ensure IDEA requirements are met and tasks the Department of Public Instruction’s Exceptional Children Division with overseeing local education agencies' provision of services for students with disabilities. The State Board has a duty to monitor local education agencies (LEAs) to determine their compliance with the IDEA and state law. The State Board, through the Department of Public Instruction's Exceptional Children Division, monitors the implementation of Exceptional Children programs that are administered by each individual LEA (see Exhibit 1). The Exceptional Children Division’s mission is to ensure students with disabilities develop intellectually, physically, emotionally, and vocationally through the provision of an appropriate individualized education program in the least restrictive environment.
2 Additional specific conditions include deaf-blindness, hearing impairment (including deafness), intellectual disability, multiple disabilities, orthopedic impairment, serious emotional disturbance, traumatic brain injury, visual impairment (including blindness), or another health impairment. 3 According to IDEA's Child Find requirement, states must have policies and procedures in place to identify and evaluate children who need special education. Should a local school district fail to identify and evaluate a child with a disability, the district may be required to provide the student with compensatory education if the child is later determined to have needed services. A compensatory education is one-on-one special education designed to bring the student up to where he/she would have been if the district had identified the disability when it should have. 4 N.C. Gen. Stat. § 115C-106.2.

Services for Students with Disabilities Report No. 2018-12
Page 4 of 41
Exhibit 1: DPI Monitors LEA Implementation of Exceptional Children Programs
Department of Public Instruction, Exceptional Children Division
Monitors LEAs’ implementation of their exceptional children
programs
Local Education Agency, Exceptional Children Programs
Traditional Public K-12 Schools
Provide services to eligible students with disabilities
Monitor their schools’ provision of services for students with
disabilities
State Board of Education
Tasks the Department of Public Instruction with ensuring LEAs comply
with the IDEA and state law Source: Program Evaluation Division based on information from the Department of Public Instruction.
Before receiving services, students go through an identification and evaluation process. The IDEA defines the services for which students with disabilities may be eligible.
Special education. This instruction is specifically designed to meet the unique needs of a child with a disability. Special education is meant to ensure access to the general curriculum so that a child can meet the educational standards that apply to all students.
Related services. These services are necessary to allow students with disabilities to benefit from special education. The most common related services provided in schools include occupational therapy, physical therapy, and speech-language pathology and audiology services.5 For example, a child with a disability who cannot be understood when speaking would need the related service of speech therapy, and a child who has poor motor skills and cannot write legibly would need the related service of occupational therapy. Considerations must be given to whether a related service will assist a child in meeting his/her educational goals.
The IDEA requires states to have policies and procedures to identify, refer, and evaluate students with disabilities. Exhibit 2 shows the process for making eligibility determinations in North Carolina. Upon suspicion that a disability may be interfering with a child’s learning, the child first receives instructional or classroom-based adjustments. For example, a student who is easily distracted due to attention-related disabilities may be allowed to sit near the teacher, or a student with handwriting difficulty may be allowed to provide test answers orally rather than in writing. If these adjustments do not support improved learning outcomes, a parent, public agency staff member, or teacher can refer the child for an initial evaluation in writing. Once referred, the LEA has 90 days to evaluate the student and begin providing needed services.6
5 Additional related services include counseling services (including rehabilitation counseling), early identification and assessment of disabilities in children, interpreting services, medical services for diagnostic and evaluation purposes, orientation and mobility services, psychological services, recreation (including therapeutic recreation), and transportation. 6 Prior to the evaluation, the parent consents to the evaluation by signing a consent form.
Services for Students with Disabilities Report No. 2018-12
Page 5 of 41
Exhibit 2: Process for Determining Eligibility for Special Education
Child is identified by parent or teacher as having significant academic struggles and a disability is suspected
Classroom and/or instructional modifications are attempted but do not help the student with the academic struggle
Identification Referral Evaluation Eligibility
Parent, public agency staff member, or teacher provides referral in writing
Individualized Education Program (IEP) team forms and includes special education teacher, LEA representative, regular education teacher, and parent
90-day deadline to evaluate student, develop IEP (if applicable), and provide services begins
After parent provides consent, LEA conducts relevant evaluations according to the Department of Public Instruction’s evaluation procedures and list of screenings and assessments to determine if child needs special education
If LEA determines child needs special education, LEA creates IEP
If LEA determines child does not need special education, LEA considers whether a 504 plan or other modifications are appropriate for the child
Implementation
LEA periodically reviews IEP
Revision of IEP may also be necessary based on the results of any reevaluation, additional information provided to parents, and/or changes to the child’s anticipated needs
Source: Program Evaluation Division based on information from the Department of Public Instruction.
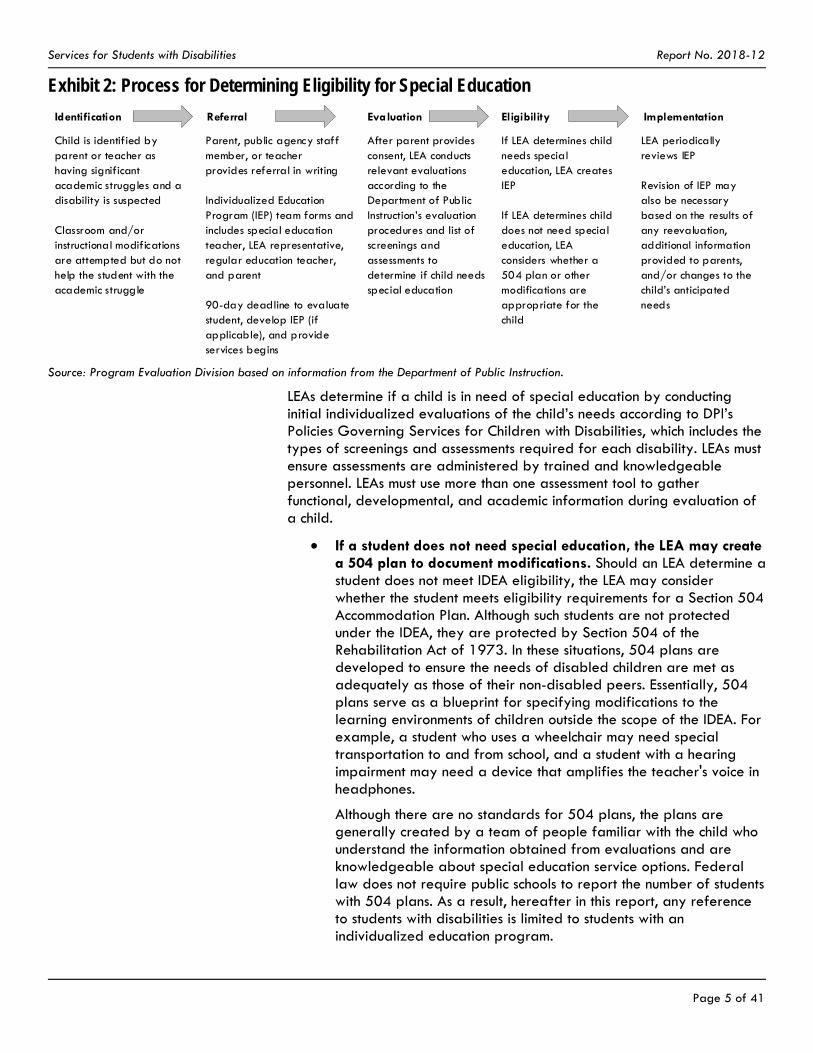
LEAs determine if a child is in need of special education by conducting initial individualized evaluations of the child’s needs according to DPI’s Policies Governing Services for Children with Disabilities, which includes the types of screenings and assessments required for each disability. LEAs must ensure assessments are administered by trained and knowledgeable personnel. LEAs must use more than one assessment tool to gather functional, developmental, and academic information during evaluation of a child.
If a student does not need special education, the LEA may create a 504 plan to document modifications. Should an LEA determine a student does not meet IDEA eligibility, the LEA may consider whether the student meets eligibility requirements for a Section 504 Accommodation Plan. Although such students are not protected under the IDEA, they are protected by Section 504 of the Rehabilitation Act of 1973. In these situations, 504 plans are developed to ensure the needs of disabled children are met as adequately as those of their non-disabled peers. Essentially, 504 plans serve as a blueprint for specifying modifications to the learning environments of children outside the scope of the IDEA. For example, a student who uses a wheelchair may need special transportation to and from school, and a student with a hearing impairment may need a device that amplifies the teacher's voice in headphones.
Although there are no standards for 504 plans, the plans are generally created by a team of people familiar with the child who understand the information obtained from evaluations and are knowledgeable about special education service options. Federal law does not require public schools to report the number of students with 504 plans. As a result, hereafter in this report, any reference to students with disabilities is limited to students with an individualized education program.

Services for Students with Disabilities Report No. 2018-12
Page 6 of 41
If a student needs special education, the LEA creates an individualized education program (IEP). The IDEA requires each LEA to have an IEP for each disabled student within its district. IEPs are specific, written statements that stipulate the supports and educational goals for students with disabilities. IEPs provide measurable annual academic and functional goals and specify how progress will be measured towards meeting those goals. Specifically, the IEP provides a description of the special education and related services that are to be provided including the frequency, location, and duration of services.
The IEP team must consider the strengths of the child, concerns of the parents for enhancing the child’s education, results of performed evaluations, and the child’s academic, developmental, and functional needs.7 After an IEP has been implemented, LEAs must ensure its periodic review.8 Revision of an IEP may also be necessary based on the results of any reevaluations, additional information provided to parents, and/or changes to the child’s anticipated needs.
In April 2018, 12.4% of students attending North Carolina’s public schools had an IEP, specifying their need for special education. Nationally, 13% of all public school students are designated as special education students under the IDEA. In North Carolina, the proportion of students with disabilities is similar. Students with disabilities have consistently represented approximately 12% of all students in traditional and charter public schools during the past decade (see Exhibit 3). The April 2018 headcount of students with disabilities in North Carolina was approximately 188,000 students.9
7 The IEP team must include the parent(s) of the child, at least one regular education teacher of the child, at least one special education teacher of the child, a representative of the LEA, and an individual who can interpret the instructional implications of evaluation results. The team also may include the child with the disability (when appropriate) and other individuals at the discretion of the parent(s) or LEA, such as related services personnel. 8 The IEP team must review an IEP no less frequently than annually to ascertain whether its stated annual goals are being achieved. If a lack of expected progress is noted, the IEP team revises the IEP. 9 State law does not require non-public schools to provide headcounts of students with disabilities.

Services for Students with Disabilities Report No. 2018-12
Page 7 of 41
Exhibit 3: Proportion of Students with Individualized Education Programs in Traditional and Charter Schools Has Remained Stable during the Past Decade
Source: Program Evaluation Division based on the Department of Public Instruction's April 2009–2018 headcounts.
A combination of state education dollars and federal education and Medicaid dollars fund services for students with disabilities, mitigating how much local governments have to spend on special education and related services. The IDEA requires LEAs to meet the needs of students with disabilities regardless of an LEA’s available resources. Exhibit 4 shows the funding sources for services for students with disabilities in Fiscal Year 2016–17.
174,707 188,312
0%
2%
4%
6%
8%
10%
12%
0
20,000
40,000
60,000
80,000
100,000
120,000
140,000
160,000
180,000
200,000
2009 2010 2011 2012 2013 2014 2015 2016 2017 2018
Count Percentage of Average Daily Membership

Exhibit 4: Local Education Agencies Receive a Total of $1.1 Billion for Services for Students with Disabilities, Fiscal Year 2016–17
Federal Individuals with Disabilities Education Act $352.9 million
Federal Share of Medicaid$61.3 million
State Appropriations $778.5 million
IDEA Part B 611(PRC 60)
$288.4 millionProvides funding to
assist LEAs in providing special
education and related services to students with IEPs
IDEA Risk Pool (PRC 114) $8 million
Provides funding for high cost special
education services for children with “high
needs”
IDEA VI-B Special Needs Targeted
Assistance(PRC 118)
$2.9 millionProvides funding for targeted areas of need and special
initiatives
Federal Share ofDirect Medical
Services$44.9 million
Children with Special Needs
(PRC 32)$750.4 million
Provides funding for special education
and related services for students with
IEPs
State Special Reserve (PRC 63)
$28.1 millionProvides funding for
emergency situations when all available state,
federal, and local resources have been
exhausted
In total, local education agencies (LEAs) received over $1.1 billion in funding from a variety of sources to assist with providing
services to students with individualized education programs (IEPs) in Fiscal Year 2016-17.
Federal Share ofAdministrative
Activities$16.4 million
Department of Public Instruction retains $53.6 million for administration and allocates the remainder to LEAs
Department of Public Instruction allocates the funds to LEAs
Goes to LEAs
Notes: In addition to receiving the funding described above, some LEAs receive local funding to assist with the provision of services to students with IEPs. Medicaid services provided in schools are reimbursed using local funds with a federal match; the Division of Health Benefits does not use state funds to pay for any portion of these services. “High need” is defined as any special education and/or related service that is at least three times the per-pupil expenditure. Source: Program Evaluation Division based on information from the Department of Public Instruction and Division of Health Benefits.

Services for Students with Disabilities Report No. 2018-12
Page 9 of 41
State Education Funds
The State provides the majority of funding for the provision of services to students with disabilities. In Fiscal Year 2016–17, the bulk of state appropriations for this purpose ($750.4 million) were allocated by DPI to LEAs on a formula basis. In Fiscal Year 2016–17, LEAs received an average base allocation of $4,093 per disabled child based on the previous April’s headcount of students with disabilities, up to a maximum of 12.75% of the LEA’s average daily membership. This cap means LEAs with disabled student populations greater than 12.75% receive less funding on a per-student basis.10,11
In Fiscal Year 2016–17, DPI received $28.1 million in state appropriations to fund the Special State Reserve program. In addition to their formula-based allocation, LEAs may apply to receive special state reserve funds
to cover excess costs when a student with extraordinary needs enrolls in an LEA after available funds have been expended and budgets have been committed or
to assist in serving students in approved developmental day centers and community residential centers.
Federal Education Funds
States receive federal funding to assist in the provision of services for students with disabilities. IDEA funding was originally intended to cover 40% of the costs of providing special education and related services, but funding has historically covered less than 20% of costs. Permitted expenditures include the salaries of special education teachers and costs associated with related services personnel such as speech therapists and psychologists. In Fiscal Year 2016–17, North Carolina received approximately $352.9 million in IDEA, Title VI, Part B funding, of which DPI retained $53.6 million for administration and distributed $299.3 million to LEAs.12
Federal Medicaid Funds
Unlike private insurance, Medicaid covers services that are provided in schools. For services provided under the IDEA, Medicaid is the primary payer and pays for eligible services before other federal and state funding sources. Since 1988, LEAs have been allowed to seek reimbursement from Medicaid for services provided to students under the IDEA. LEAs are not required to participate in Medicaid, but the available
10 A 2016 report by the Program Evaluation Division entitled Allotment-Specific and System-Level Issues Adversely Affect North Carolina’s Distribution of K-12 Resources found 62 LEAs had disabled student populations greater than the cap in Fiscal Year 2014–15 (which was 12.5% at that time) and, as a result, received less funding on a per-student basis. In addition, the allotment does not take into consideration that students with disabilities are not equally distributed across the State and that disabilities vary in severity and, as a result, some students cost more to serve. 11 A 2017 report by North Carolina State University’s Friday Institute for Educational Innovation entitled Short- and Longer-Term Options for Modernizing State Exceptional Children Funding in North Carolina recommended the State transition to a hybrid block/tiered reimbursement model to address the immediate fiscal needs of providing services to students with disabilities. The report recommended the hybrid model because of its responsiveness to changes in student population from year to year, its ability to reduce incentives for under-identifying students, and its ability to stabilize available funding at the LEA level. 12 States receive a base amount equal to the amount they received for Federal Fiscal Year 1998–99 and additional funds based on the number of children with disabilities and the number of children living in poverty.

Services for Students with Disabilities Report No. 2018-12
Page 10 of 41
funding represents a significant means for LEAs to recoup spending for providing services to Medicaid-enrolled disabled children.13
At present, LEAs may bill Medicaid when the following conditions are met: a child is enrolled in Medicaid, the service is listed in an enrolled child’s IEP, the State Medicaid Plan covers the service, and the LEA is an enrolled Medicaid provider.
Medicaid clinical policy dictates which services provided in schools are covered.14 Recently, policy pertaining to covered school services was updated to include services outlined within a child’s 504 plan. Although the policy has been updated and posted for public comment by the Division of Health Benefits, the amended policy will not go into effect until the U.S. Centers for Medicare and Medicaid Services has approved North Carolina’s state plan amendment that references these changes. The Division of Health Benefits anticipates approval of the state plan amendment in early 2019. If the plan amendment receives federal approval, LEAs will then be allowed to bill Medicaid for covered services provided under a Medicaid-enrolled student's 504 plan.
As Medicaid providers, LEAs can seek reimbursement for both direct medical services and administrative activities.
Direct medical services. The majority of LEAs claim Medicaid reimbursement for direct medical services on a fee-for-service basis. Generally, LEAs contract with a third-party vendor that submits direct medical service claims for reimbursement on their behalf to the Division of Health Benefits. In Fiscal Year 2016–17, 66.72% of direct medical services were federally funded. The Division of Health Benefits does not use state funds to pay for any portion of direct medical services. The non-federal match portion is met with local funds. North Carolina’s Medicaid-participating LEAs were cumulatively reimbursed $44.9 million in Fiscal Year 2016–17 for the provision of direct medical services to students with disabilities.
Administrative activities. LEAs also seek Medicaid funds for qualifying school-based administrative activities that are considered necessary for the proper and efficient administration of Medicaid. School-based administrative activities include outreach and enrollment activities related to assisting students who may not be Medicaid-enrolled; efforts that support the provision of Medicaid-eligible services; and activities such as care coordination, referrals, and transportation to and from school on a day a child receives a Medicaid-covered service. In Fiscal Year 2016–17, 50% of Medicaid school-based administrative activities were federally funded. North Carolina’s Medicaid-participating LEAs were
13 Ashe, Clay, Clinton City, Columbus, Dare, Elkin City, Hickory City, Hyde, Jones, Tyrrell, and Washington LEAs did not submit claims in Fiscal Year 2016–17. LEAs may choose not to participate in the Medicaid program if the challenges of providing documentation outweigh the benefits of securing reimbursement. 14 Clinical Coverage Policy No. 10C Outpatient Specialized Therapies, Local Education Agencies (LEAs).

Services for Students with Disabilities Report No. 2018-12
Page 11 of 41
cumulatively reimbursed $16.4 million in Fiscal Year 2016–17 for Medicaid school-based administrative activities.
The Division of Health Benefits requires LEAs to submit annual cost reports that reconcile the actual cost of Medicaid-covered services with the amount reimbursed.15 To substantiate the cost reports, LEAs must participate in random moment time studies that gauge the amount of time personnel spend on direct medical services.16 In Fiscal Year 2016–17, LEAs spent $1,181 on direct medical services per Medicaid-enrolled student with an IEP and $38 on administrative activities per Medicaid-enrolled student (see Exhibit 5). See Appendix B and C for detailed cost report information for each reporting LEA.
Exhibit 5: On Average, LEAs Spend $1,181 on Direct Medical Services for Students with Disabilities, Fiscal Year 2016–17
Number of Students Total Cost Cost Per Student LEA Range of
Cost Per Student
Direct medical services 56,736 $67,004,748 $1,181 $357 - $9,311
Administrative activities 860,274 $32,766,393 $38 $2 - $89
Notes: Direct medical services only include Medicaid-enrolled students with an Individualized Education Program (IEP), whereas administrative activities include all Medicaid-enrolled students because costs are not tracked separately for students who have IEPs and those who do not.
Source: Program Evaluation Division based on data from the Division of Health Benefits.
Local Funding
The non-federal Medicaid match (33.28%) for direct medical services is covered entirely by local funding. In Fiscal Year 2016–17, North Carolina’s Medicaid-participating LEAs cumulatively spent $22 million on the provision of direct medical services for students with disabilities and $16.4 million on school-based administrative activities.
The amount of local funds available to supplement federal IDEA funding and state appropriations varies across LEAs and is a function of local tax bases. Because there are no dedicated federal or state funding streams for 504 plan services, LEAs pay for those services using local funds, unrestricted state education funds, or a combination of the two.
Because students with disabilities may be receiving services in multiple settings that are covered by multiple funding streams, the potential exists for duplication of services. Children with disabilities who receive services in school may have additional needs that must be addressed in a community setting. Medicaid is the only public funding source that covers services across school and community settings. For Medicaid-enrolled children, Medicaid covers a range of services provided by both schools
15 The dollar amounts reported by LEAs in cost reports are certified public expenditures. Statutorily recognized as a Medicaid financing approach, certified public expenditures are certifications by LEAs that they have spent funds on items and services that are eligible for federal matching Medicaid funds. If the actual costs exceed the amount reimbursed, LEAs receive a settlement. However, if the amount LEAs initially receive exceeds costs, LEAs pay back the difference. 16 A random moment time study is a federally approved, statistically valid sampling technique that produces accurate labor distribution results by determining what portion of the selected group of participants’ workload is spent performing all work activities. The method polls participants on an individual basis at random time intervals over a given time period and totals the results to determine work effort for the entire population of participating staff during that same period.

Services for Students with Disabilities Report No. 2018-12
Page 12 of 41
and community-based providers. As shown in Exhibit 6, 56,736 students were enrolled in Medicaid, had IEPs, and received health services in school in Fiscal Year 2016–17. To ensure the proper use of Medicaid funding, it is important to examine whether the presence of service duplication exists across school and community settings.
Exhibit 6
Students Enrolled in Medicaid with IEPs May Receive Services in School and Community Settings
Total Students Enrolled in Medicaid
860,274
Total Students with IEPs187,642
Total Students Enrolled in Medicaid with IEPs Who Received Health
Services in School56,736
Source: Program Evaluation Division based on data from the Department of Public Instruction and Division of Health Benefits.
Findings Finding 1. There is minimal evidence of duplication of Medicaid-covered services across school and community settings.
Students with disabilities receiving services in schools may also receive services from a variety of service providers in community settings, such as primary care providers, support and therapy providers, and mental health providers. If a lack of communication and coordination exists between service providers, gaps in services and duplication of services are more likely to occur, which can adversely affect the quality of services and increase overall costs.
Care coordination entails the organization of care among providers involved in the delivery of services and helps to ensure a patient’s needs and preferences are met over time. With improved care coordination, recipients experience better outcomes as the efficacy of treatment is enhanced. In the provision of services for students with disabilities, care coordination between school and community providers can result in better alignment of services and help to prevent services from counteracting one another or being duplicated.

Services for Students with Disabilities Report No. 2018-12
Page 13 of 41
School and community providers both serve students with disabilities, yet their primary focuses may differ. For some children, the frequency or intensity of therapy received at school does not meet all of their needs. These children require services in both the school and community setting.
School setting. When offered in school settings, services focus on helping students with disabilities benefit from their special education curriculum. In determining the need for services, an individualized education program (IEP) team only considers whether services will assist students with disabilities in meeting their educational goals.
Community setting. When offered in clinical settings, services focus on addressing a medical condition or impairment. In determining the need for services, medical professionals use the diagnosis to determine which services are medically necessary. The focus of treatment in the community setting is broader than the school setting because it is aimed at realizing the full potential of the disabled child beyond simply meeting his or her educational goals.
Exhibit 7 illustrates the differences between the focus of therapy in school versus community settings. These differences may hinder coordination between school and community providers.

Services for Students with Disabilities Report No. 2018-12
Page 14 of 41
Exhibit 7: Focus of Therapy is Dependent on the Setting Where Services Are Provided School Setting Community Setting
How is the need for services identified?
• Referral initiated by parent, public agency staff member, or teacher based on observed academic struggles
• Referral initiated by a doctor based on observed delay or diagnosis
Who decides the need for service?
• Individualized education program (IEP) team—including parents, student (if appropriate), educators, administrators, and school-based therapists—based on evaluation and classroom observation
• Assessment considers only needs associated with special education
• Testing and clinical observation by licensed professional
• Assessment considers all settings
Who decides the scope of services?
• IEP team determines the focus, frequency, and duration of therapy
• Medical team determines location, focus, frequency, and duration of therapy
• Insurance coverage, doctor’s orders, and transportation may be determining factors
How can services be changed? • Changes to related services require a meeting of the IEP team to discuss and come to consensus
• Doctors can alter orders or therapist can change therapy plan, generally after discussing with parents
What is the focus of therapy? • Therapy addresses access to special education and school environment
• Therapy works towards independence and participation in the school setting
• Therapy addresses medical conditions and impairments
• Therapy works towards realizing full potential in all settings
Where does therapy occur? • On school grounds, bus, halls, playground, classroom, or lunchroom
• In the clinic, hospital, or home
Who pays for services? • No cost to student or family because of federal requirement of free appropriate public education
• Fee-for-service payment by family, insurance company, or via governmental assistance
How are services documented? • Documented in IEP using accessible, readable language guided by state and local policy reflecting best practice
• Dictated by insurance requirements and guidelines of the setting; emphasis on medical terminology and billing codes
Source: Program Evaluation Division based on information from the Department of Public Instruction.
Because of the potential for duplication, the Program Evaluation Division analyzed 3.2 million Medicaid claims for students with disabilities who received services in both school and community settings during Fiscal Year 2016–17. As shown in Exhibit 8, a total of 2.5 million claims for students with disabilities were paid in Fiscal Year 2016–17, totaling $227.4 million.
Exhibit 8: Description of Medicaid Reimbursed Services, Fiscal Year 2016–17
School Setting Community Setting Total
Number of Medicaid claims paid for students with disabilities 649,199 1,841,250 2,490,449
Dollar value of Medicaid claims paid for students with disabilities $25,072,156 $202,356,907 $227,429,063
Source: Program Evaluation Division based on information from the Division of Health Benefits.
The majority of Medicaid reimbursed claims in the school setting are for speech therapy followed by physical and occupational therapy (see Exhibit 9). In comparison, speech therapy, physical therapy, occupational

Services for Students with Disabilities Report No. 2018-12
Page 15 of 41
therapy, and psychological services only account for 24% of services provided in the community. The remainder of Medicaid reimbursed claims in the community setting are for pharmacy claims or different types of procedural, test-based services, such as ultrasounds, X-rays, and blood draws.
Exhibit 9
Speech Therapy is the Most Frequent Service Provided in the School Setting, Fiscal Year 2016–17
School Setting Community Setting
Speech therapy 71% 9%
Physical therapy 14% 6%
Occupational therapy 14% 6%
Psychological services 1% 3%
Source: Program Evaluation Division based on data from the Division of Health Benefits.
The Program Evaluation Division’s analysis of Fiscal Year 2016–17 Medicaid claims data shows little evidence of duplication of services. Duplication was identified in the data when the same student (Medicaid ID number), received the same service (identified by Current Procedural Terminology code), on the same day, in a school setting and in a community setting (identified by National Provider Identification number).
Based on this methodology, the Program Evaluation Division found a potential 4,433 instances in which Medicaid paid for the same service on the same day in and outside of school (or 8,866 potentially duplicated claims), which represents 0.4% of the 2.5 million paid claims analyzed (see Exhibit 10). In terms of dollars, potential duplication accounts for $572,318 of the total $227.4 million in paid claims. The amounts paid out per student receiving duplicated services ranged from $1 to more than $500. The majority of identified duplicated services were for speech therapy (54.6%), followed by physical therapy (22.6%) and occupational therapy (22.6%).

Services for Students with Disabilities Report No. 2018-12
Page 16 of 41
Exhibit 10: Program Evaluation Division Identified 8,866 Potentially Duplicated Medicaid Claims, All of Which Are Permissible by Law, Fiscal Year 2016–17
All Medicaid claims submitted for students with disabilities This number includes claims for services provided in and outside of school
Paid Medicaid claims submitted for students with disabilities
Potentially duplicated Medicaid claims identified by the Program Evaluation Division This number represents the number of times the same student received the same service on the same day in and outside of school.
The Division of Health Benefits conducted a review of potentially duplicated Medicaid claims.
3.2 million Medicaid claims filed
2.5 million claims (equals $227.4 million paid in Medicaid claims)
8,866 potentially duplicated claims (0.4% of total paid claims)
0 claims were determined to be
impermissible duplications
Note: The Division of Health Benefits determined that all potentially duplicated claims were permissible because services (1) were coverable by Medicaid, (2) were provided to Medicaid-enrolled children, (3) met policy standards of medical necessity, and (4) were allowable in multiple locations on the same day under federal law.
Source: Program Evaluation Division based on data from the Division of Health Benefits.
Duplication of services may be appropriate if it is educationally and medically necessary to receive the same service in and outside of school. The Program Evaluation Division asked the Division of Health Benefits to review the 8,866 potentially duplicated claims.
The Division of Health Benefits initially determined all but 70 instances identified by the Program Evaluation Division were permissible under federal law.17 Although North Carolina state policy specifies that a provider cannot bill Medicaid twice for the same service provided on the same day, federal law supersedes state regulations. Section 1905(r) of the Social Security Act, entitled Early and Periodic Screening, Diagnostic and Treatment Services, requires that Medicaid-enrolled children receive any service
17 Using the Division of Health Benefits’s methodology, the Program Evaluation Division reassessed the 2.5 million paid Medicaid claims; looking only at students who did not have a billed service from a community provider, there were 775 instances that involved multiple same-day billings from an LEA. Of the 1,552 claims billed in these instances, the Division of Health Benefits determined all but 210 speech therapy claims were permissible under federal law. The Division of Heath Benefits is currently conducting an in-depth review of the 210 claims to determine whether impermissible duplication occurred.

Services for Students with Disabilities Report No. 2018-12
Page 17 of 41
coverable under the Act so long as the service is "medically necessary to correct or ameliorate" a diagnosed health condition.18 Only a medical professional can truly determine if duplication of services is not appropriate, meaning the services a student received in school unnecessarily duplicated the services a student received outside of school or vice versa.
The Division of Health Benefits conducted an in-depth review of the 70 instances when a student received either (1) a service in a community setting and at least two of that same service in a school setting that same day or (2) a service in a school setting and at least two of that same service in a community setting that same day.19 The Division of Health Benefits consulted with its prior approval agent for speech, occupational, and physical therapy and determined those 70 instances met policy standards of medical necessity and were allowable in multiple locations on the same day under federal law.
Opportunities for duplication are minimized because of the multiple mechanisms North Carolina uses to comply with the U.S. Centers for Medicare and Medicaid Services’s requirements for Medicaid services in general. Local education agencies (LEAs) are Medicaid providers and, like all Medicaid providers, are required to comply with rules and regulations as part of agreeing to participate in the Medicaid program. North Carolina employs several controls throughout the Medicaid reimbursement process to prevent fraud, waste, and abuse; the provision of unnecessary services; or the inappropriate use of Medicaid services available in the state plan.
LEAs are subject to provider enrollment requirements. The North Carolina Division of Health Benefits approves LEAs as Medicaid providers. LEAs sign participation agreements including the False Claims Act attestation, which obligates them to adhere to state and federal laws prohibiting the submission of false claims. The provider enrollment requirements hold LEAs accountable on the front end of the Medicaid reimbursement process by informing them of the requirements they must follow including the requirement that they only provide medically necessary services.
Claims submitted by LEAs proceed through the claims adjudication process within NCTracks. The North Carolina Department of Health and Human Services (DHHS) contracts with CSRA State and Local Solutions LLC to serve as the fiscal agent for Medicaid claims adjudication in the State. Like all Medicaid providers, LEAs submit claims for reimbursement in NCTracks, the State’s multi-payer Medicaid Management Information System. NCTracks utilizes internal business processes for applying state Medicaid policies to identify duplication of services and calculate correct payment amounts to providers.
18 42 U.S. Code § 1396d. 19 The 70 instances constituted a total of 210 claims of which 102 were for occupational therapy, 102 were for physical therapy, and 6 for speech therapy.

Services for Students with Disabilities Report No. 2018-12
Page 18 of 41
LEAs are subject to a cost settlement process. At the end of each fiscal year, LEAs submit a cost report of certified public expenditures to the Division of Health Benefits. The cost settlement process ensures LEAs receive accurate reimbursement for services rendered and mitigates overpayment caused by duplicative payment.
LEAs are subject to audit by the Division of Health Benefits's Office of Compliance and Program Integrity. Like all Medicaid providers, LEAs are subject to pre- and post-review audits by the Office of Compliance and Program Integrity. The office upholds both federal and state regulations related to Medicaid by investigating suspected fraud, waste, and abuse reported to it through external complaints or referrals and discovered through internal data analysis. Providers may receive a pre-payment review from the Office of Compliance and Program Integrity to ensure their claims meet federal and state law requirements and regulations and meet medically necessary criteria. A post-payment review includes an on-site visit from the Office of Compliance and Program Integrity, of which the provider may or may not receive prior notice. State audits serve as an enforcement mechanism, deterring providers from providing and claiming services unnecessarily. Within the past five years, no post-payment reviews have been triggered. Furthermore, no LEA has been terminated from the Medicaid program and referred for investigation.
LEAs are subject to audit by the U.S. Department of Health and Human Services’s Office of Inspector General. The U.S. DHHS Office of Inspector General conducts audits, investigations, and inspections in an effort to protect the integrity of DHHS programs in all states. Federal audits help ensure Medicaid payments are not duplicated or improperly claimed.20
Finding 2. Based on measures collected by the U.S. Department of Education, North Carolina complies with the Individuals with Disabilities Education Act and effectively provides services to students with disabilities; efficiency may be improved with the implementation of the Department of Public Instruction’s new special education services data system.
The U.S. Department of Education’s Office of Special Education Programs carries out administrative activities related to the Individuals with Disabilities Education Act (IDEA). The U.S. Department of Education monitors the North Carolina Department of Public Instruction’s (DPI) Exceptional Children Division to ensure processes and procedures are in place to meet the State’s obligation to monitor local education agency (LEA) compliance
20 In 2016, the U.S. DHHS Office of Inspector General (OIG) found the Division of Health Benefits claimed almost $107.5 million in unallowable school-based administrative costs for federal fiscal years 2010 through 2012. NC DHHS and the Division of Health Benefits do not agree with OIG’s finding. The U.S. Centers for Medicare and Medicaid Services continues to review North Carolina’s response along with OIG’s comments. As of October 16, 2018, the Division of Health Benefits has not received a request for repayment of any federal funds related to OIG’s report.

Services for Students with Disabilities Report No. 2018-12
Page 19 of 41
with the IDEA. Exhibit 11 shows the eight primary ways the Exceptional Children Division monitors LEA compliance with the IDEA.
Exhibit 11: DPI Monitors LEAs in Eight Primary Ways
State Performance Plan and Annual Performance Reports
The State Performance Plan is updated at least every six years. Annual Performance Reports contain state performance data on student outcomes and compliance with IDEA requirements.
Policies, Practices, and Procedures
Historically, policies have been revised regularly with the latest revision occurring in March 2018.
Dispute Resolution System DPI provides a formal means for dispute resolution that includes mediation, formal written complaints, and due process hearings regarding the identification, evaluation, and placement of students.
Data Collection Data collection involves collection and verification, examination and analysis, and reporting. Data are used for decision making about program management or improvement.
Monitoring Activities The North Carolina Continuous Improvement Focused Monitoring System includes LEA self-assessment, targeted on-site visits where systematic problems occur, focused monitoring of state priority areas, and program compliance review.
Improvement, Correction, Incentives, and Sanctions
LEAs must demonstrate they have addressed noncompliance and have made progress towards meeting performance targets. DPI recognizes high-performing LEAs and sanctions low-performing LEAs.
Targeted Technical Assistance The Exceptional Children Division provides LEAs with targeted technical assistance to help improve student outcomes and compliance with IDEA requirements. Annual performance report indicators provide a better understanding of which LEAs are most in need of improvement.
Fiscal Monitoring The Exceptional Children Division uses a three-tiered fiscal monitoring process. Monitoring includes a comparison review of LEA budgets versus expenditure reports, IDEA fiscal desk reviews, and IDEA fiscal monitoring on-site visits.
Source: Program Evaluation Division based on information from the Department of Public Instruction.
North Carolina was among 21 states to earn a federal determination of meeting IDEA requirements in 2018. The U.S. Department of Education has established 17 indicators that states are required to measure and report regarding their performance in educating students with disabilities. Appendix D shows how North Carolina’s performance compares to overall national performance based on Federal Fiscal Year 2015–16 indicators. The U.S. Department of Education determined in June 2018 that North Carolina meets IDEA requirements based on its ability to
report valid and reliable data, demonstrate corrective action for findings of noncompliance, ensure the timeliness of state complaint and due process hearing
decisions, and achieve student-level results.
In addition, North Carolina has been effective in placing students with disabilities into regular classrooms and assisting them with achieving better outcomes. The IDEA requires schools to educate students with disabilities in the least restrictive environment possible.21 Least restrictive
21 A 2016 Program Evaluation Division report entitled Meeting Current Standards for School Nurses Statewide May Cost Up to $79 Million Annually discussed the impact that mainstreaming exceptional children has on the need for services in schools.

Services for Students with Disabilities Report No. 2018-12
Page 20 of 41
environment considerations help ensure students with disabilities are educated with their non-disabled peers in a regular educational environment.22 During the past two decades, there has been an uptick nationally in the amount of time spent by students with disabilities in regular classrooms. As shown in Exhibit 12, in Federal Fiscal Year 2015–16, 98% of North Carolina students with disabilities spent at least some portion of their day inside a regular classroom, with most (66.8%) spending at least 80% of their day there.
Exhibit 12: Ninety-Eight Percent of Students with Disabilities Spend At Least Some Portion of the Day Inside a Regular Classroom, Federal Fiscal Year 2015–16
Inside regular classroom 1%-40%
of the day(14%)
Inside regular classroom 40%-79% of the day
(17%)
Inside regular classroom > 80% of the day
(66.8%)
Other environment
(2.2%)
98% spend at least some portion of day inside regular classroom
Source: Program Evaluation Division based on data from the U.S. Department of Education.
During the past decade, the State also has seen improvements in educational outcomes of students with disabilities. As shown in Exhibit 13, the percentage of students with IEPs graduating high school within four years increased by 22.4% between 2007 and 2016. During the same period, the high school dropout rate of students with IEPs declined by nearly half (49.1%). For students no longer in secondary school who had IEPs in effect at the time they left school, 24% more were either enrolled in higher education, enrolled in some other postsecondary education/training program, or were employed within one year of leaving high school in 2016 as compared to 2012.
22 A regular educational environment includes classrooms and other settings in schools such as lunchrooms and playgrounds in which children without disabilities participate.

Services for Students with Disabilities Report No. 2018-12
Page 21 of 41
Exhibit 13: Outcomes for North Carolina Students with Disabilities Have Improved in Recent Years
High School Graduation Rates for Students with Disabilities Increased
22.4% increase
High School Dropout Rates for Students with Disabilities Decreased
24% increase
Percentage of Students with Disabilities with Positive Post-School Outcomes Increased
49.1% decrease
56.3%
68.9%
0%
20%
40%
60%
80%
2007 2008 2009 2010 2011 2012 2013 2014 2015 2016
8.0%
4.1%
0%
2%
4%
6%
8%
10%
2007 2008 2009 2010 2011 2012 2013 2014 2015 2016
63%
78.1%
0%
20%
40%
60%
80%
100%
2012 2013 2014 2015 2016 Notes: Positive post-school outcomes are defined as either being enrolled in higher education, enrolled in some other post-secondary education/training program, or employed within one year of leaving high school.
Source: Program Evaluation Division based on data from the U.S. Department of Education.

Services for Students with Disabilities Report No. 2018-12
Page 22 of 41
LEAs’ inability to process referral paperwork in a timely manner sometimes hinders the efficient delivery of services to students with disabilities, but DPI’s new special education services data system should improve efficiency by improving workflow processes. The State requires evaluations to be conducted, eligibility determined, and placement completed within 90 days of receipt of a written referral. In Federal Fiscal Year 2015–16, LEAs met the State’s established timeframe in 92% of instances in which parental consent to evaluate was received. North Carolina’s performance on this indicator is worse than the national average of 98%. Of the 3,371 referrals exceeding the 90-day period, LEAs reported 56% of delays were due to referral paperwork not being processed in a timely manner.
The State’s current special education data system, the Comprehensive Exceptional Children Accountability System (CECAS), was created in 2004 and is now obsolete because it does not meet the needs of LEAs. DPI does not require LEAs to use CECAS for maintaining student-level data. Currently, CECAS only contains detailed student-level service data for about half of the students with disabilities population in North Carolina’s public schools because the State’s largest LEAs have opted out of participation. The State’s five largest LEAs, in addition to many others, have chosen instead to use independent data systems developed by third-party vendors.
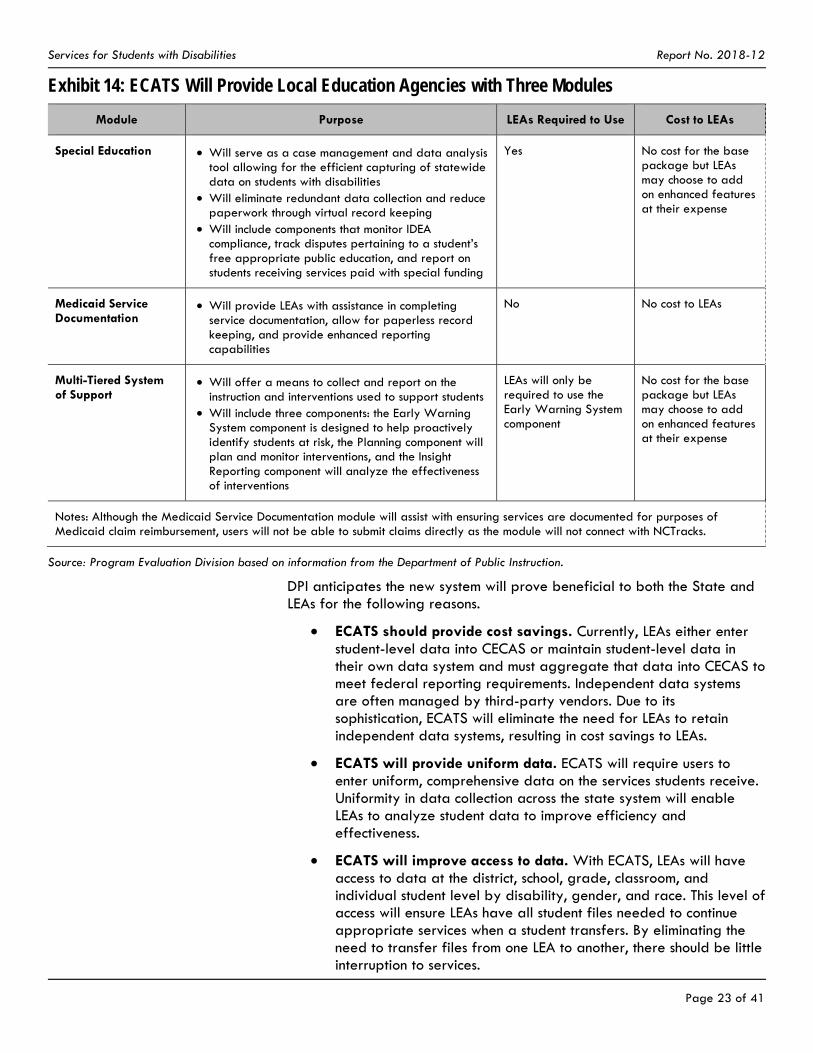
In an effort to meet the needs of LEAs, DPI contracted with the Public Consulting Group, Inc. (PCG) in February 2017 to develop a new platform, the Every Child Accountability Tracking System (ECATS), which will assist all LEAs with collecting and maintaining data on students with disabilities.23 The new system will cost the State $3.2 million annually for the first three years. DPI expects to roll out ECATS in 2019. As seen in Exhibit 14, ECATS will provide LEAs with three integrated modules that can be accessed from a single user interface.
23 In North Carolina, LEAs may choose to submit Medicaid claims on their own or contract with a third party vendor for filing. PCG serves as a third-party Medicaid biller for many schools in North Carolina. PCG’s Medicaid fee-for-service clients represent 68% of the State’s Medicaid student population. Currently, PCG’s contingency fee for Medicaid billing services is 15%, but the fee will go down to 13% when ECATS rolls out.
Services for Students with Disabilities Report No. 2018-12
Page 23 of 41
Exhibit 14: ECATS Will Provide Local Education Agencies with Three Modules
Module Purpose LEAs Required to Use Cost to LEAs
Special Education Will serve as a case management and data analysis tool allowing for the efficient capturing of statewide data on students with disabilities
Will eliminate redundant data collection and reduce paperwork through virtual record keeping
Will include components that monitor IDEA compliance, track disputes pertaining to a student’s free appropriate public education, and report on students receiving services paid with special funding
Yes No cost for the base package but LEAs may choose to add on enhanced features at their expense
Medicaid Service Documentation
Will provide LEAs with assistance in completing service documentation, allow for paperless record keeping, and provide enhanced reporting capabilities
No No cost to LEAs
Multi-Tiered System of Support
Will offer a means to collect and report on the instruction and interventions used to support students
Will include three components: the Early Warning System component is designed to help proactively identify students at risk, the Planning component will plan and monitor interventions, and the Insight Reporting component will analyze the effectiveness of interventions
LEAs will only be required to use the Early Warning System component
No cost for the base package but LEAs may choose to add on enhanced features at their expense
Notes: Although the Medicaid Service Documentation module will assist with ensuring services are documented for purposes of Medicaid claim reimbursement, users will not be able to submit claims directly as the module will not connect with NCTracks.
Source: Program Evaluation Division based on information from the Department of Public Instruction.
DPI anticipates the new system will prove beneficial to both the State and LEAs for the following reasons.
ECATS should provide cost savings. Currently, LEAs either enter student-level data into CECAS or maintain student-level data in their own data system and must aggregate that data into CECAS to meet federal reporting requirements. Independent data systems are often managed by third-party vendors. Due to its sophistication, ECATS will eliminate the need for LEAs to retain independent data systems, resulting in cost savings to LEAs.
ECATS will provide uniform data. ECATS will require users to enter uniform, comprehensive data on the services students receive. Uniformity in data collection across the state system will enable LEAs to analyze student data to improve efficiency and effectiveness.
ECATS will improve access to data. With ECATS, LEAs will have access to data at the district, school, grade, classroom, and individual student level by disability, gender, and race. This level of access will ensure LEAs have all student files needed to continue appropriate services when a student transfers. By eliminating the need to transfer files from one LEA to another, there should be little interruption to services.

Services for Students with Disabilities Report No. 2018-12
Page 24 of 41
Finding 3. The Department of Public Instruction’s Exceptional Children Division provides technical assistance to local education agencies but does not measure the effectiveness of those efforts.
Each LEA has an Exceptional Children Director, who is responsible for monitoring the provision of services for students with disabilities by the district's schools. The Program Evaluation Division interviewed 12 Exceptional Children Directors to better understand their role in the provision of services.24 Directors reported several challenges of the position, such as the need to constantly shift funding around to meet students' needs, the complicated nature of IDEA and Medicaid regulations, and the shortage of qualified personnel available to provide specialty services.
Recognizing the challenges that LEAs face in administering their exceptional children programs, DPI provides several types of technical assistance to local districts. The Exceptional Children Division in the Department of Public Instruction (DPI) monitors each LEA’s implementation of its exceptional children program. Five years ago, DPI made a concerted effort to assist LEA Exceptional Children Directors in meeting the demands of their positions by providing targeted and individualized technical assistance. At present, DPI offers the following types of technical assistance.
New Directors' Leadership Institute. DPI designed the Institute for directors with less than two years of experience and for those in district-level leadership positions who might become directors in the future. The training includes eight two-day sessions spread over two years (up to 135 hours). The purpose of the training is to develop knowledge and skills in competency areas identified as essential to the role of director.
Annual conferences. DPI hosts the Annual Conference on Exceptional Children for administrators, special education teachers, related service personnel, psychologists, regular education teachers, and parents/families. The one-and-a-half-day conference offers an opportunity to share and learn about innovations and practices intended to help students with disabilities achieve. DPI also hosts the March Institute, which is an annual three-day conference for Exceptional Children Directors and their direct staff. This Institute represents an opportunity to provide additional professional development on priority topics based on director input.
Regional consultants. DPI has 23 regional consultant positions that provide professional services to LEAs regarding special education matters.25 For example, consultants provide assistance with compliance and parent complaint follow-up; program planning, development, management, and evaluation; corrective action plan activities; and applications for Title VI-B Rural Education Achievement Program funding. In addition, regional
24 The Program Evaluation Division interviewed directors from each of DPI’s eight Exceptional Children regions. 25 Of the 23 positions, 18 were filled at the time of this report, and DPI reported it is attempting to fill the remaining 5 positions.

Services for Students with Disabilities Report No. 2018-12
Page 25 of 41
consultants keep abreast of current trends in special education and make LEAs aware of any such developments.
Regional director meetings. DPI's regional consultants plan and coordinate four quarterly one-day regional meetings for Exceptional Children Directors. The purpose of these meetings is to share information on upcoming requirements and events and to provide professional development. In addition, directors have the opportunity to network, collaborate, problem solve, and brainstorm with directors of like-sized districts within their region.
Webinars. DPI offers hour-long webinars every other month for Exceptional Children Directors. Webinars cover informational updates, clarification around recent memorandums, and hot topics. LEAs have the opportunity to submit questions in advance, which are covered during the question and answer portion. Webinars are posted to DPI's website for on-demand access by LEAs.
DPI collects feedback and input regularly but does not distribute a formalized survey to collect customer satisfaction data to determine the effectiveness of its technical assistance efforts. Anecdotally, LEA Exceptional Children Directors reported satisfaction with the support they receive from DPI. For example, directors felt the New Directors' Leadership Institute was a valuable and helpful resource. One stated, "The Institute was great. It definitely opened my eyes to how we are supposed to be doing things." However, directors' reactions to regional consultants varied, with some reporting positive experiences and others reporting negative experiences. In addition, more than half of the directors interviewed mentioned the need for a formal mentorship program.
DPI does not systematically seek nor gauge feedback from LEA Exceptional Children Directors on its technical assistance efforts. Customer satisfaction surveys are an important diagnostic tool for assessing satisfaction with services provided to internal or external customers. For example, the U.S. Office of Personnel Management has designed a customer satisfaction survey that measures nine service quality dimensions: access, courtesy, knowledge, timeliness, reliability, choice, tangibles, recovery, and quality. Customer satisfaction data from LEA Exceptional Children Directors could inform DPI about which technical assistance efforts are most beneficial and could reveal shortcomings of or inconsistencies across other efforts. Having this type of performance data could help DPI improve the quality and effectiveness of its services.
Finding 4. North Carolina’s new health information exchange, NC HealthConnex, could improve service delivery coordination, but failure by local education agencies to meet the statutory connectivity deadline could negatively impact their funding.
A health information exchange is a secure electronic network that gives healthcare providers the ability to access and share patient information. Health information exchanges are designed to improve healthcare quality, enhance patient safety, improve health outcomes, and reduce overall healthcare costs.

Services for Students with Disabilities Report No. 2018-12
Page 26 of 41
In 2015, the General Assembly passed the Statewide Health Information Exchange Act, and appropriated up to $1.4 million for establishing a successor health information exchange network.26 The North Carolina Health Information Exchange Authority oversees and administers NC HealthConnex, the State’s designated health information exchange.27 NC HealthConnex is a secure electronic network that facilitates communication between healthcare providers by enabling them to share information electronically.
Local education agencies are at risk of losing state funding if they do not connect to NC HealthConnex by June 1, 2019. All healthcare providers, excluding local management entities/managed care organizations, who receive state funds for the provision of healthcare services must connect to NC HealthConnex by June 1, 2019 in order to continue receiving state funds for healthcare services. LEAs receive state funds for providing healthcare services. In Fiscal Year 2018–19, the State initially allocated $14 million to LEAs for healthcare services. According to law, LEAs that are not connected by June 1, 2019 would stop receiving state funds for healthcare services.
To connect to NC HealthConnex, providers must meet minimal technology requirements. In July 2018, the Department of Information Technology published a study on the feasibility of various provider types connecting to NC HealthConnex. The study recognized that certain healthcare providers (e.g., speech, language, and hearing service providers, occupational therapists, physical therapists) may not have electronic health records and noted the costs of health information technology are significant. The study did not examine the impact on LEAs of procuring necessary technology and therefore did not include implementation cost estimates for LEAs.
The Program Evaluation Division asked Health Information Exchange Authority officials how NC HealthConnex requirements would affect LEAs in their role as Medicaid providers. These officials were unaware that LEAs are subject to the connectivity requirements. The Program Evaluation Division then asked officials from DPI’s Exceptional Children Division about the impact of connectivity requirements on LEAs. These officials also were unaware of NC HealthConnex and its requirements. To date, there has been no indication that Health Information Exchange Authority officials have engaged the Exceptional Children Division or LEAs.
26 N.C. Gen. Stat. § 90-414. 27 The Authority is housed within the Department of Information Technology’s Government Data Analytics Center.

Services for Students with Disabilities Report No. 2018-12
Page 27 of 41
Recommendations Recommendation 1. The General Assembly should direct the Department of Public Instruction to establish methods for soliciting feedback from Exceptional Children Directors of local education agencies.
As discussed in Finding 3, the Department of Public Instruction (DPI) provides several types of technical assistance to local education agency (LEA) Exceptional Children Directors in order to assist directors in meeting the demands of their positions. Anecdotally, directors reported satisfaction with the support they receive from DPI. However, interviews with directors revealed varying degrees of satisfaction with regional consultants and a perceived need for a formal mentorship program. Customer satisfaction data could inform DPI about which technical assistance efforts are most effective and which efforts need improvement.
The General Assembly should direct DPI to establish methods for soliciting feedback on each of its technical assistance efforts: the New Directors' Leadership Institute, annual conferences, regional consultants, regional director meetings, and webinars. DPI should consider seeking feedback in the form of customer satisfaction surveys. The methods for soliciting feedback should be incorporated into DPI’s Exceptional Children Division policies and procedures. DPI should report to the Joint Legislative Education Oversight Committee by December 15, 2019 on its efforts to seek systematic feedback from LEA Exceptional Children Directors.
Recommendation 2. The General Assembly should direct the Department of Information Technology, in conjunction with the Departments of Health and Human Services and Public Instruction, to determine the feasibility of and fiscal impact on local education agencies in meeting mandatory NC HealthConnex connectivity requirements.
As discussed in Finding 4, LEAs must connect to NC HealthConnex by June 1, 2019. LEAs not connected to NC HealthConnex by that date will stop receiving state funds for healthcare services. As of October 2018, Health Information Exchange Authority officials had failed to consider the impact of the statutory connectivity requirement on LEAs. Furthermore, officials of the Department of Public Instruction’s Exceptional Children Division were unaware of NC HealthConnex.
The General Assembly should direct the Department of Information Technology, in conjunction with the Departments of Health and Human Services and Public Instruction, to determine the feasibility of and fiscal impact on LEAs in meeting NC HealthConnex’s connectivity requirements. The Department of Information Technology should report to the Joint Legislative Oversight Committee on Health and Human Services, Joint Legislative Oversight Committee on Information Technology, Joint Legislative Program Evaluation Oversight Committee, and Fiscal Research Division by April 15, 2019. Based on the report, LEAs may need additional time and resources to meet connectivity requirements.

Services for Students with Disabilities Report No. 2018-12
Page 28 of 41
Appendices Appendix A: Summary Statistics of Students with Disabilities, Fiscal Year
2016–17
Appendix B: LEA Medicaid Cost Report Details, Fiscal Year 2016–17
Appendix C: Per Student Costs for Medicaid Direct Medical Services and Administrative Activities by LEA, Fiscal Year 2016–17
Appendix D: North Carolina Annual Performance Report Indicators, Federal Fiscal Year 2015–16
Agency Responses A draft of this report was submitted to the Department of Health and Human Services and the Department of Public Instruction for review. Their responses are provided following the appendices.
A draft of Finding 4 and Recommendation 2 regarding NC HealthConnex was submitted to the Department of Information Technology for review. Its response to these sections of the report is provided following the appendices.
Program Evaluation Division Contact and Acknowledgments
For more information on this report, please contact the lead evaluator, Justin Davis, at [email protected].
Staff members who made key contributions to this report include Emily B. McCartha and Kiernan McGorty. John W. Turcotte is the director of the Program Evaluation Division.

Services for Students with Disabilities Report No. 2018-12
Page 29 of 41
Appendix A: Summary Statistics of Students with Disabilities, Fiscal Year 2016–17
Statewide Student Profile
Number of students with disabilities with an individualized education program (IEP) attending North Carolina traditional and charter schools 187,642
Percentage of students with disabilities with an IEP attending North Carolina traditional and charter schools based on average daily membership 12.4%
Number of students with an IEP receiving health/treatment services in schools 99,383
Number of Medicaid-enrolled students with an IEP receiving health/treatment services in school 56,736
Percentage of students with an IEP receiving health/treatment services in school who are Medicaid-enrolled 57.1%
LEA Expenditures and Medicaid Participation
Number of local education agencies (LEAs) in North Carolina 115
Number of LEAs participating in Medicaid fee-for-service claiming 102
Total LEA expenditures for providing direct medical services covered by the Individuals with Disabilities Education Act (IDEA) to Medicaid-enrolled students with disabilities
$67 million
Direct medical service costs per Medicaid-enrolled student with an IEP $1,181
Federal share for direct medical services 66.72%
Number of LEAs participating in Medicaid school-based administrative activities 112
Total LEA expenditures for Medicaid school-based administrative activities $32.8 million
Federal share for school-based administrative activities 50%
Funding to LEAs
Total state appropriations to LEAs for the provision of services for students with disabilities
$778.5 million
Average base state appropriation per disabled student (PRC 32) $4,093
Federal IDEA funding for LEAs (traditional K-12 students) $299.3 million
Total federal Medicaid reimbursement to LEAs for expenditures $61.3 million
Total local funds used to meet Medicaid match requirements $38.4 million
Medicaid Claims Reimbursement
Total number of Medicaid claims paid for students with disabilities 2,490,449
Number of Medicaid claims paid for students with disabilities receiving services in a community setting
1,841,250
Number of Medicaid claims paid for students with disabilities receiving services in a school setting 649,199
Percentage of school-based claims paid that were for speech therapy services 71%
Source: Program Evaluation Division based on information from the Department of Public Instruction and Division of Health Benefits.

Appendix B: LEA Medicaid Cost Report Details, Fiscal Year 2016–17
School District
Medicaid Students IEP Students Direct Medical Services Administrative Activities
Medicaid-Enrolled Students
Total Students
Proportion of Medicaid-Enrolled to
Total
Medicaid-Enrolled IEP
Students Receiving
Health Services
Total IEP Students
Receiving Health
Services
Proportion of
Medicaid-Enrolled
IEP to Total IEP
Federal Share (66.72%)
Local Share (33.28%)
Federal Share (50%)
Local Share (50%)
Alamance-Burlington 13,980 24,246 57.70% 1,100 1,949 56.40% $950,473 $474,097 $365,721 $365,721
Alexander County 2,816 4,888 57.60% 250 412 60.70% $263,173 $118,944 $82,924 $82,924
Alleghany County 966 1,317 73.30% 107 148 72.30% $114,381 $57,054 $40,368 $40,368
Anson County 2,849 3,333 85.50% 304 356 85.40% $283,375 $141,347 $89,852 $89,852
Asheboro City 2,737 4,603 59.50% 242 340 71.20% $214,149 $106,817 $74,668 $74,667
Asheville City 16,637 30,481 54.60% 193 298 64.80% $167,992 $83,794 $64,716 $64,716
Avery County 1,165 2,143 54.40% 155 252 61.50% $61,552 $30,702 $22,972 $22,973
Beaufort County 4,751 7,084 67.10% 325 462 70.30% $122,644 $61,175 $35,382 $35,382
Bertie County 2,053 2,503 82.00% 171 215 79.50% $126,077 $62,888 $27,446 $27,446
Bladen County 3,529 4,668 75.60% 177 235 75.30% $244,777 $122,095 $69,781 $69,781
Brunswick County 8,983 12,409 72.40% 562 874 64.30% $488,652 $243,740 $129,376 $129,376
Buncombe County 16,637 30,481 54.60% 1,248 2,019 61.80% $826,343 $412,180 $345,320 $345,320
Burke County 7,974 12,325 64.70% 928 1,394 66.60% $607,183 $302,479 $261,555 $261,554
Cabarrus County 15,930 40,080 39.70% 944 2,317 40.70% $720,949 $359,610 $280,854 $280,854
Caldwell County 7,655 11,716 65.30% 626 882 71.00% $653,699 $254,567 $213,873 $213,873
Camden County 438 1,826 24.00% 61 148 41.20% $68,843 $34,339 $9,787 $9,787
Carteret County 4,191 8,377 50.00% 270 448 60.30% $373,333 $168,032 $125,038 $125,038
Caswell County 2,068 2,631 78.60% 146 193 75.60% $157,589 $78,605 $40,152 $40,152
Catawba County 8,851 16,307 54.30% 565 989 57.10% $535,118 $266,917 $198,934 $198,934 Charlotte-Mecklenburg
84,479 159,472 53.00% 3,782 7,979 47.40% $3,255,923 $1,624,057 $1,333,165 $1,333,165
Chatham County 4,056 9,811 41.30% 292 578 50.50% $293,427 $134,715 $97,528 $97,528
Cherokee County 2,344 3,467 67.60% 170 236 72.00% $169,963 $84,778 $46,387 $46,387
Cleveland County 10,741 14,662 73.30% 979 1,328 73.70% $616,655 $307,588 $288,680 $288,680

School District
Medicaid Students IEP Students Direct Medical Services Administrative Activities
Medicaid-Enrolled Students
Total Students
Proportion of Medicaid-Enrolled to
Total
Medicaid-Enrolled IEP
Students Receiving
Health Services
Total IEP Students
Receiving Health
Services
Proportion of
Medicaid-Enrolled
IEP to Total IEP
Federal Share (66.72%)
Local Share (33.28%)
Federal Share (50%)
Local Share (50%)
Craven County 7,583 13,876 54.60% 456 852 53.50% $481,653 $240,249 $158,313 $158,312
Cumberland County 32,248 51,003 63.20% 1,825 2,887 63.20% $1,370,365 $616,260 $462,566 $462,566
Currituck County 1,142 3,995 28.60% 76 144 52.80% $169,345 $84,469 $23,033 $23,033
Davidson County 13,581 24,061 56.40% 814 1,409 57.80% $679,603 $338,987 $203,153 $203,153
Davie County 2,830 6,195 45.70% 242 437 55.40% $283,513 $134,599 $97,648 $97,648
Duplin County 6,502 9,572 67.90% 275 420 65.50% $230,320 $114,883 $72,707 $72,707
Durham County 22,964 32,907 69.80% 1,358 2,885 47.10% $1,172,102 $584,646 $478,951 $478,951 Edenton-Chowan County
1,299 2,028 64.10% 88 116 75.90% $132,020 $58,560 $46,974 $46,974
Edgecombe County 6,923 7,613 91.00% 359 438 82.00% $186,734 $93,143 $116,360 $116,360 Elizabeth City/Pasquotank
3,562 5,860 60.80% 280 436 64.20% $237,367 $118,399 $66,178 $66,178
Franklin County 5,568 8,613 64.60% 303 472 64.20% $277,873 $138,603 $111,797 $111,797
Gaston County 19,336 33,765 57.30% 1,329 2,158 61.60% $1,136,193 $566,734 $461,445 $461,445
Gates County 788 1,594 49.40% 81 128 63.30% $68,503 $34,169 $14,987 $14,987
Graham County 854 1,162 73.50% 59 89 66.30% $124,608 $62,155 $29,407 $29,407
Granville County 4,302 7,667 56.10% 263 494 53.20% $148,585 $74,115 $58,317 $58,317
Greene County 2,302 3,100 74.30% 127 169 75.10% $129,966 $64,826 $19,847 $19,847
Guilford County 47,744 77,498 61.60% 3,583 6,315 56.70% $2,426,795 $1,210,488 $990,521 $990,521
Halifax County 2,490 2,825 88.10% 161 194 83.00% $87,976 $43,882 $38,565 $38,565
Harnett County 11,040 20,357 54.20% 822 1,494 55.00% $574,823 $286,723 $190,549 $190,549
Haywood County 4,685 7,083 66.10% 439 668 65.70% $320,767 $159,999 $128,708 $128,708
Henderson County 7,202 13,609 52.90% 417 777 53.70% $367,265 $183,192 $165,156 $165,156
Hertford County 2,529 2,862 88.40% 115 137 83.90% $161,691 $75,958 $28,318 $28,318
Hoke County 5,887 8,355 70.50% 361 637 56.70% $132,114 $65,899 $85,614 $85,614
Iredell-Statesville 11,199 20,300 55.20% 689 1,404 49.10% $494,204 $246,509 $171,474 $171,474

School District
Medicaid Students IEP Students Direct Medical Services Administrative Activities
Medicaid-Enrolled Students
Total Students
Proportion of Medicaid-Enrolled to
Total
Medicaid-Enrolled IEP
Students Receiving
Health Services
Total IEP Students
Receiving Health
Services
Proportion of
Medicaid-Enrolled
IEP to Total IEP
Federal Share (66.72%)
Local Share (33.28%)
Federal Share (50%)
Local Share (50%)
Jackson County 2,872 3,949 72.70% 188 282 66.70% $190,512 $95,027 $86,328 $86,328
Johnston County 17,326 34,964 49.60% 1,365 2,695 50.60% $742,887 $370,553 $267,416 $267,416
Kannapolis City 15,930 40,080 39.70% 148 249 59.40% $170,215 $84,904 $48,850 $48,850
Lee County 6,284 9,948 63.20% 439 766 57.30% $441,800 $220,370 $123,142 $123,142
Lenoir County 6,772 8,873 76.30% 308 422 73.00% $212,578 $106,034 $127,355 $127,355
Lexington City 1,645 2,995 54.90% 236 293 80.50% $177,648 $88,612 $39,069 $39,069
Lincoln County 5,932 11,340 52.30% 393 736 53.40% $290,997 $145,139 $100,409 $100,409
Macon County 2,681 4,303 62.30% 344 517 66.50% $172,791 $86,188 $53,691 $53,691
Madison County 1,545 2,295 67.30% 100 163 61.30% $35,337 $17,626 $1,816 $1,816
Martin County 2,381 3,558 66.90% 216 300 72.00% $262,169 $130,769 $80,279 $80,279
McDowell County 4,107 6,107 67.30% 251 385 65.20% $276,571 $137,954 $104,274 $104,273
Mitchell County 1,152 1,823 63.20% 134 206 65.00% $42,879 $21,388 $16,891 $16,891
Montgomery County 2,880 3,848 74.80% 169 250 67.60% $160,484 $80,050 $85,644 $85,644
Moore County 5,895 13,321 44.30% 426 821 51.90% $525,651 $262,195 $230,496 $230,496
Mooresville 2,161 6,017 35.90% 173 356 48.60% $150,792 $75,215 $19,619 $19,619
Mount Airy City 1,315 2,311 56.90% 72 104 69.20% $81,656 $40,730 $19,049 $19,049
Nash-Rocky Mount 9,369 16,418 57.10% 657 963 68.20% $539,507 $269,107 $131,447 $131,447
New Hanover Co. 13,697 26,953 50.80% 2,547 4,424 57.60% $979,028 $488,340 $416,135 $416,135
Newton-Conover City
1,636 3,015 54.30% 134 206 65.00% $101,831 $50,793 $50,364 $50,364
Northampton County 2,175 2,984 72.90% 174 208 83.70% $138,716 $64,648 $39,066 $39,066
Onslow County 12,612 25,936 48.60% 897 1,708 52.50% $1,043,992 $510,512 $379,281 $379,281
Orange County 6,199 20,124 30.80% 258 619 41.70% $309,931 $154,594 $88,126 $88,127
Pender County 4,786 9,154 52.30% 360 627 57.40% $318,475 $158,855 $102,072 $102,072
Perquimans County 1,047 1,637 64.00% 126 171 73.70% $104,087 $50,907 $30,724 $30,724

School District
Medicaid Students IEP Students Direct Medical Services Administrative Activities
Medicaid-Enrolled Students
Total Students
Proportion of Medicaid-Enrolled to
Total
Medicaid-Enrolled IEP
Students Receiving
Health Services
Total IEP Students
Receiving Health
Services
Proportion of
Medicaid-Enrolled
IEP to Total IEP
Federal Share (66.72%)
Local Share (33.28%)
Federal Share (50%)
Local Share (50%)
Person County 3,189 5,586 57.10% 237 341 69.50% $227,781 $113,618 $61,995 $61,995
Pitt County 15,295 23,888 64.00% 1,059 1,610 65.80% $595,567 $280,245 $219,091 $219,091
Polk County 1,272 2,158 58.90% 86 140 61.40% $112,348 $56,039 $44,369 $44,369
Randolph County 10,676 17,956 59.50% 721 1,085 66.50% $419,834 $205,066 $130,165 $130,165
Richmond County 6,103 7,233 84.40% 430 587 73.30% $271,060 $124,463 $107,971 $107,970
Roanoke Rapids 2,539 2,879 88.20% 125 180 69.40% $132,032 $64,335 $74,089 $74,089
Robeson County 20,159 23,200 86.90% 2,049 2,613 78.40% $488,394 $243,611 $25,997 $25,997
Rockingham Co. 8,224 12,445 66.10% 832 1,234 67.40% $675,673 $337,026 $258,926 $258,926
Rowan-Salisbury 13,475 19,053 70.70% 817 1,257 65.00% $543,725 $271,211 $200,249 $200,249
Rutherford County 5,841 9,646 60.60% 494 672 73.50% $458,671 $228,785 $150,788 $150,788
Sampson County 5,615 8,292 67.70% 20 29 69.00% $124,250 $61,976 $21,640 $21,640
Scotland County 4,974 5,688 87.40% 485 640 75.80% $422,775 $210,880 $209,974 $209,974
Stanly County 4,673 8,762 53.30% 369 640 57.70% $287,523 $143,417 $84,753 $84,753
Stokes County 3,241 5,896 55.00% 512 821 62.40% $354,905 $177,027 $103,555 $103,555
Surry County 4,540 7,984 56.90% 373 553 67.50% $329,084 $164,148 $126,651 $126,651
Swain County 1,597 2,094 76.30% 86 134 64.20% $117,340 $58,529 $60,841 $60,840
Thomasville City 13,581 24,061 56.40% 174 213 81.70% $91,794 $45,787 $28,583 $28,583
Transylvania County 2,315 3,690 62.70% 180 254 70.90% $192,373 $95,956 $41,913 $41,913
Union County 14,087 43,529 32.40% 1,028 2,394 42.90% $1,261,431 $629,203 $265,341 $265,341
Vance County 6,371 7,439 85.60% 178 224 79.50% $254,710 $127,049 $114,574 $114,574
Wake County 56,595 169,630 33.40% 3,235 8,141 39.70% $3,370,519 $1,681,218 $1,200,467 $1,200,467
Warren County 1,917 2,319 82.70% 175 228 76.80% $92,069 $45,924 $54,403 $54,403
Watauga County 1,565 4,564 34.30% 288 546 52.70% $272,204 $135,775 $69,704 $69,705
Wayne County 13,688 18,321 74.70% 638 1,192 53.50% $264,496 $131,931 $214,152 $214,152
Weldon City 770 873 88.20% 66 85 77.60% $59,345 $29,601 $19,639 $19,639

School District
Medicaid Students IEP Students Direct Medical Services Administrative Activities
Medicaid-Enrolled Students
Total Students
Proportion of Medicaid-Enrolled to
Total
Medicaid-Enrolled IEP
Students Receiving
Health Services
Total IEP Students
Receiving Health
Services
Proportion of
Medicaid-Enrolled
IEP to Total IEP
Federal Share (66.72%)
Local Share (33.28%)
Federal Share (50%)
Local Share (50%)
Whiteville City 2,357 3,043 77.50% 78 108 72.20% $121,679 $45,099 $2,219 $2,219
Wilkes County 5,824 9,538 61.10% 595 862 69.00% $504,558 $249,731 $179,187 $179,187
Wilson County 9,071 13,249 68.50% 401 584 68.70% $387,922 $193,496 $159,188 $159,188 Winston-Salem/Forsyth County
33,411 56,784 58.80% 2,397 4,712 50.90% $1,893,008 $944,234 $954,669 $954,669
Yadkin County 3,086 5,262 58.60% 257 424 60.60% $302,356 $109,259 $58,669 $58,669
Yancey County 1,434 2,145 66.90% 117 197 59.40% $100,759 $50,258 $32,826 $32,826
Statewide 860,274 1,563,890 55.00% 56,736 99,383 57.10% $44,911,374 $22,093,374 $16,383,198 $16,383,195
Notes: IEP stands for individualized education program. Direct medical services only include Medicaid-enrolled students with an IEP, whereas administrative activities include all Medicaid-enrolled students because costs are not tracked separately for students who have IEPs and those students who do not. The federal and local share amounts for administrative services reflect all LEA Medicaid Administrative Claiming that has been reviewed by the Provider Audit section of the Division of Health Benefits’s NC Medicaid office and submitted to the Program Evaluation Division as of October 19, 2018.
Source: Program Evaluation Division based on data from the Division of Health Benefits.

Appendix C: Per Student Costs for Medicaid Direct Medical Services and Administrative Activities by LEA, Fiscal Year 2016–17
School District
Direct Medical Services Administrative Activities
Medicaid-Enrolled IEP Students
Federal and Local Share of Direct
Medical Services Per Student Cost Medicaid-
Enrolled Students
Federal and Local Share of
Administrative Activities
Per Medicaid Student Cost
Alamance-Burlington 1,100 $1,424,570 $1,295 13,980 $731,442 $52
Alexander County 250 $382,117 $1,528 2,816 $165,849 $59
Alleghany County 107 $171,435 $1,602 966 $80,736 $84
Anson County 304 $424,722 $1,397 2,849 $179,703 $63
Asheboro City 242 $320,966 $1,326 2,737 $149,335 $55
Asheville City 193 $251,786 $1,305 16,637 $129,433 $8
Avery County 155 $92,254 $595 1,165 $45,945 $39
Beaufort County 325 $183,819 $566 4,751 $70,764 $15
Bertie County 171 $188,965 $1,105 2,053 $54,893 $27
Bladen County 177 $366,872 $2,073 3,529 $139,563 $40
Brunswick County 562 $732,392 $1,303 8,983 $258,752 $29
Buncombe County 1,248 $1,238,523 $992 16,637 $690,640 $42
Burke County 928 $909,662 $980 7,974 $523,109 $66
Cabarrus County 944 $1,080,559 $1,145 15,930 $561,708 $35
Caldwell County 626 $908,266 $1,451 7,655 $427,746 $56
Camden County 61 $103,182 $1,692 438 $19,575 $45
Carteret County 270 $541,365 $2,005 4,191 $250,076 $60
Caswell County 146 $236,194 $1,618 2,068 $80,304 $39
Catawba County 565 $802,035 $1,420 8,851 $397,868 $45
Charlotte-Mecklenburg 3,782 $4,879,980 $1,290 84,479 $2,666,329 $32
Chatham County 292 $428,142 $1,466 4,056 $195,055 $48
Cherokee County 170 $254,741 $1,498 2,344 $92,775 $40
Cleveland County 979 $924,243 $944 10,741 $577,360 $54
Craven County 456 $721,902 $1,583 7,583 $316,626 $42

School District
Direct Medical Services Administrative Activities
Medicaid-Enrolled IEP Students
Federal and Local Share of Direct
Medical Services Per Student Cost
Medicaid-Enrolled Students
Federal and Local Share of
Administrative Activities
Per Medicaid Student Cost
Cumberland County 1,825 $1,986,625 $1,089 32,248 $925,131 $29
Currituck County 76 $253,814 $3,340 1,142 $46,066 $40
Davidson County 814 $1,018,590 $1,251 13,581 $406,306 $30
Davie County 242 $418,112 $1,728 2,830 $195,295 $69
Duplin County 275 $345,203 $1,255 6,502 $145,413 $22
Durham County 1,358 $1,756,748 $1,294 22,964 $957,903 $42
Edenton-Chowan County 88 $190,580 $2,166 1,299 $93,948 $72
Edgecombe County 359 $279,877 $780 6,923 $232,720 $34
Elizabeth City/Pasquotank 280 $355,766 $1,271 3,562 $132,357 $37
Franklin County 303 $416,476 $1,375 5,568 $223,593 $40
Gaston County 1,329 $1,702,927 $1,281 19,336 $922,890 $48
Gates County 81 $102,672 $1,268 788 $29,974 $38
Graham County 59 $186,763 $3,165 854 $58,813 $69
Granville County 263 $222,700 $847 4,302 $116,635 $27
Greene County 127 $194,792 $1,534 2,302 $39,693 $17
Guilford County 3,583 $3,637,283 $1,015 47,744 $1,981,042 $41
Halifax County 161 $131,858 $819 2,490 $77,131 $31
Harnett County 822 $861,546 $1,048 11,040 $381,098 $35
Haywood County 439 $480,766 $1,095 4,685 $257,417 $55
Henderson County 417 $550,457 $1,320 7,202 $330,312 $46
Hertford County 115 $237,649 $2,067 2,529 $56,635 $22
Hoke County 361 $198,013 $549 5,887 $171,229 $29
Iredell-Statesville 689 $740,713 $1,075 11,199 $342,949 $31
Jackson County 188 $285,539 $1,519 2,872 $172,655 $60
Johnston County 1,365 $1,113,440 $816 17,326 $534,832 $31

School District
Direct Medical Services Administrative Activities
Medicaid-Enrolled IEP Students
Federal and Local Share of Direct
Medical Services Per Student Cost
Medicaid-Enrolled Students
Federal and Local Share of
Administrative Activities
Per Medicaid Student Cost
Kannapolis City 148 $255,119 $1,724 15,930 $97,699 $6
Lee County 439 $662,170 $1,508 6,284 $246,283 $39
Lenoir County 308 $318,612 $1,034 6,772 $254,710 $38
Lexington City 236 $266,260 $1,128 1,645 $78,137 $47
Lincoln County 393 $436,136 $1,110 5,932 $200,817 $34
Macon County 344 $258,979 $753 2,681 $107,383 $40
Madison County 100 $52,963 $530 1,545 $3,631 $2
Martin County 216 $392,938 $1,819 2,381 $160,557 $67
McDowell County 251 $414,525 $1,651 4,107 $208,547 $51
Mitchell County 134 $64,267 $480 1,152 $33,782 $29
Montgomery County 169 $240,534 $1,423 2,880 $171,288 $59
Moore County 426 $787,846 $1,849 5,895 $460,993 $78
Mooresville 173 $226,007 $1,306 2,161 $39,237 $18
Mount Airy City 72 $122,386 $1,700 1,315 $38,097 $29
Nash-Rocky Mount 657 $808,614 $1,231 9,369 $262,894 $28
New Hanover County 2,547 $1,467,368 $576 13,697 $832,270 $61
Newton-Conover City 134 $152,624 $1,139 1,636 $100,728 $62
Northampton County 174 $203,364 $1,169 2,175 $78,132 $36
Onslow County 897 $1,554,504 $1,733 12,612 $758,562 $60
Orange County 258 $464,525 $1,800 6,199 $176,253 $28
Pender County 360 $477,330 $1,326 4,786 $204,144 $43
Perquimans County 126 $154,994 $1,230 1,047 $61,448 $59
Person County 237 $341,399 $1,441 3,189 $123,989 $39
Pitt County 1,059 $875,812 $827 15,295 $438,181 $29
Polk County 86 $168,387 $1,958 1,272 $88,739 $70

School District
Direct Medical Services Administrative Activities
Medicaid-Enrolled IEP Students
Federal and Local Share of Direct
Medical Services Per Student Cost
Medicaid-Enrolled Students
Federal and Local Share of
Administrative Activities
Per Medicaid Student Cost
Randolph County 721 $624,900 $867 10,676 $260,330 $24
Richmond County 430 $395,523 $920 6,103 $215,941 $35
Roanoke Rapids 125 $196,367 $1,571 2,539 $148,178 $58
Robeson County 2,049 $732,005 $357 20,159 $51,995 $3
Rockingham County 832 $1,012,699 $1,217 8,224 $517,852 $63
Rowan-Salisbury 817 $814,936 $997 13,475 $400,499 $30
Rutherford County 494 $687,456 $1,392 5,841 $301,576 $52
Sampson County 20 $186,226 $9,311 5,615 $43,281 $8
Scotland County 485 $633,655 $1,307 4,974 $419,948 $84
Stanly County 369 $430,940 $1,168 4,673 $169,506 $36
Stokes County 512 $531,932 $1,039 3,241 $207,110 $64
Surry County 373 $493,232 $1,322 4,540 $253,301 $56
Swain County 86 $175,869 $2,045 1,597 $121,681 $76
Thomasville City 174 $137,581 $791 13,581 $57,166 $4
Transylvania County 180 $288,329 $1,602 2,315 $83,827 $36
Union County 1,028 $1,890,634 $1,839 14,087 $530,682 $38
Vance County 178 $381,759 $2,145 6,371 $229,148 $36
Wake County 3,235 $5,051,737 $1,562 56,595 $2,400,933 $42
Warren County 175 $137,993 $789 1,917 $108,806 $57
Watauga County 288 $407,979 $1,417 1,565 $139,409 $89
Wayne County 638 $396,427 $621 13,688 $428,303 $31
Weldon City 66 $88,946 $1,348 770 $39,278 $51
Whiteville City 78 $166,778 $2,138 2,357 $4,438 $2
Wilkes County 595 $754,289 $1,268 5,824 $358,375 $62
Wilson County 401 $581,418 $1,450 9,071 $318,377 $35
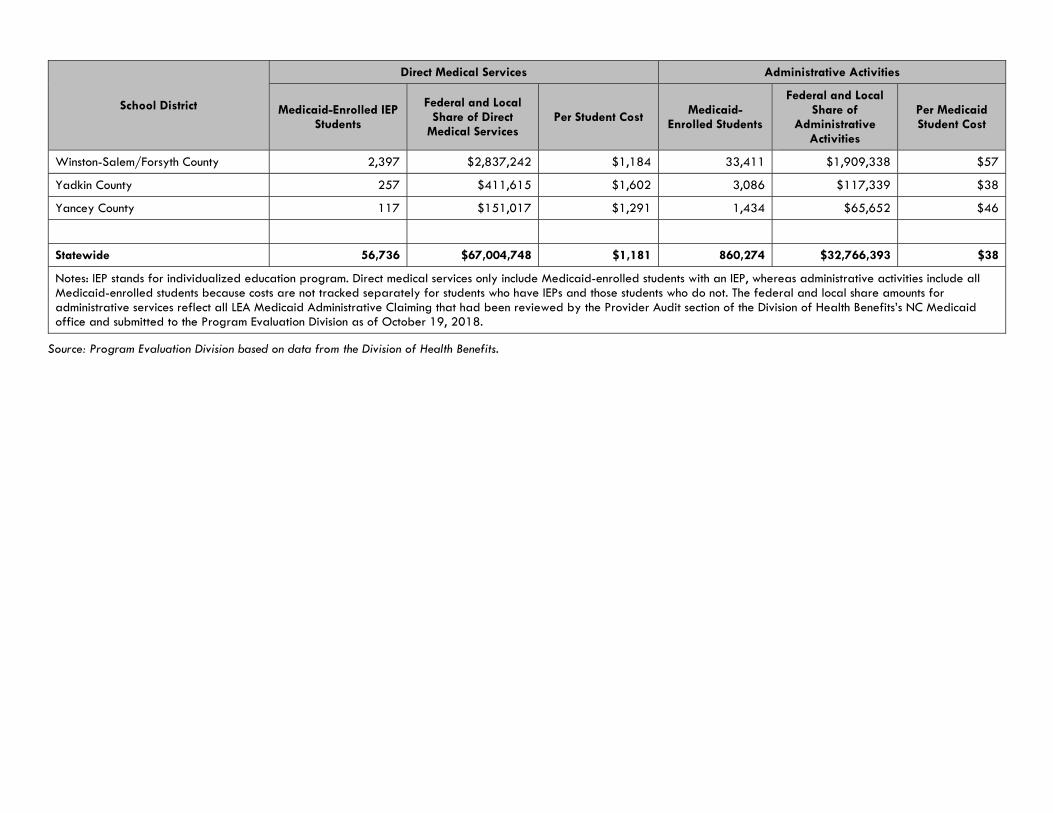
School District
Direct Medical Services Administrative Activities
Medicaid-Enrolled IEP Students
Federal and Local Share of Direct
Medical Services Per Student Cost
Medicaid-Enrolled Students
Federal and Local Share of
Administrative Activities
Per Medicaid Student Cost
Winston-Salem/Forsyth County 2,397 $2,837,242 $1,184 33,411 $1,909,338 $57
Yadkin County 257 $411,615 $1,602 3,086 $117,339 $38
Yancey County 117 $151,017 $1,291 1,434 $65,652 $46
Statewide 56,736 $67,004,748 $1,181 860,274 $32,766,393 $38
Notes: IEP stands for individualized education program. Direct medical services only include Medicaid-enrolled students with an IEP, whereas administrative activities include all Medicaid-enrolled students because costs are not tracked separately for students who have IEPs and those students who do not. The federal and local share amounts for administrative services reflect all LEA Medicaid Administrative Claiming that had been reviewed by the Provider Audit section of the Division of Health Benefits’s NC Medicaid office and submitted to the Program Evaluation Division as of October 19, 2018.
Source: Program Evaluation Division based on data from the Division of Health Benefits.

Services for Students with Disabilities Report No. 2018-12
Page 40 of 41
Appendix D: North Carolina Annual Performance Report Indicators, Federal Fiscal Year 2015–16
Indicator No. Indicator Measurement NC National
1 Graduation rate Percentage of youth with individualized education programs (IEPs) graduating from high school with a regular high school diploma within four years
68.9% 65.4%
2 Dropout Rate Percentage of youth with IEPs dropping out of high school
4.1% 3.7%
3B Reading Assessment Participation
Participation rate of children with IEPs on statewide reading assessments
99.1% 94.6%
3B Math Assessment Participation
Participation rate of children with IEPs on statewide math assessments
99.0% 94.8%
3C Reading Proficiency Proficiency rate for children with IEPs scoring at or above proficient against grade level and alternate academic achievement standards for reading (as measured by statewide reading assessments)
14.1% 20.6%
3C Math Proficiency Proficiency rate for children with IEPs scoring at or above proficient against grade level and alternate academic achievement standards for math (as measured by statewide reading assessments)
14.6% 19.2%
4A Suspension and Expulsion
Percentage of districts that have a significant discrepancy in the rate of suspensions and expulsions of greater than 10 days in a school year for children with IEPs
0.0% A direct comparison is not appropriate as
states use a variety of methods to calculate.
5A Least Restrictive Education Environment
Percentage of children with IEPs aged 6 through 21 who remain inside the regular classroom 80% or more of the day
66.8% 65.5%
5B Least Restrictive Education Environment
Percentage of children with IEPs aged 6 through 21 who remain inside the regular classroom less than 40% of the day
14.0% 10.8%
5C Least Restrictive Education Environment
Percentage of children with IEPs aged 6 through 21 placed in separate schools, residential facilities, or with homebound/hospital placements
1.8% 2.9%
8 Parent Involvement Percentage of parents with a child receiving special education services who report that schools facilitated parent involvement as a means of improving services and results for children with disabilities
43.4% 76.0%
9 Disproportionate Representation Due to Inappropriate Identification
Percentage of districts with disproportionate representation of racial and ethnic groups in special education and related services that is the result of inappropriate identification
0.0% A direct comparison is not appropriate as
states use a variety of methods to calculate.

Services for Students with Disabilities Report No. 2018-12
Page 41 of 41
Indicator No.
Indicator Measurement NC National
10 Disproportionate Representation Due to Inappropriate Identification
Percentage of districts with disproportionate representation of racial and ethnic groups in specific disability categories that is the result of inappropriate identification
0.0% A direct comparison is not appropriate as
states use a variety of methods to calculate.
11 Timely Initial Evaluations (Child Find)
Percentage of children who were evaluated within the state's established timeframe
92.0% 97.6%
13 Secondary Transition Percentage of youth aged 16 and above with an IEP that includes appropriate measurable postsecondary goals that are annually updated and based upon an age appropriate transition assessment.
85.4% 91.0%
14A Post-School Outcomes Percentage of youth who are no longer in secondary school, had IEPs in effect at the time they left school, and were enrolled in higher education within one year of leaving high school
27.3% 26.3%*
14B Post-School Outcomes Percentage of youth who are no longer in secondary school, had IEPs in effect at the time they left school, and were enrolled in higher education or competitively employed within one year of leaving high school
62.5% 62.3%*
14C Post-School Outcomes Percentage of youth who are no longer in secondary school, had IEPs in effect at the time they left school, and were either enrolled in higher education, enrolled in some other postsecondary education/training program, or were employed within one year of leaving high school
78.1% 77.6%*
15 Dispute Resolution Percentage of hearing requests that went to resolution sessions that were resolved through resolution session settlement agreements
38.5% 52.0%
16 Dispute Resolution Percentage of mediations held that resulted in mediation agreements
79.0% 73.0%
17 State Systematic Improvement Plan
The State Performance Plan/Annual Performance Report includes a State Systemic Improvement Plan (SSIP) that is a comprehensive, ambitious, yet achievable multi-year plan for improving results for children with disabilities.
Yes -
Notes: Values represent national averages except those marked with an asterisk (*), which represent national median values. Indicators 6, 7, and 12 have been excluded from this table as they pertain to preschool-aged children.
Source: Program Evaluation Division based on data from the U.S. Department of Education.


ROY COOPER J. ERIC BOYETTE GOVERNOR SECRETARY & STATE CHIEF INFORMATION OFFICER
P O Box 17209, Raleigh, NC 27619-7209 4101 Mail Service Center, Raleigh, NC 27699-4101
Telephone: 919-754-6100 An Equal Opportunity/Affirmative Action Employer
November 5, 2018 Mr. John W. Turcotte, Director N.C. General Assembly Legislative Services Office Program Evaluation Division 300 N. Salisbury Street, Suite 100 LOB Raleigh, NC 27603-5925 Dear Director Turcotte: Thank you very much for the opportunity to review the Division’s preliminary draft report as it pertains to the statutory requirement that health care providers that receive state funds connect to N.C. HealthConnex, the state’s health information exchange. As your study notes, staff for the N.C. Health Information Exchange Authority (NC HIEA), which is housed within the Department of Information Technology, were unaware of the potential implications of the statutorily required June 1, 2019, connectivity deadline upon local education agencies. To date, our focus has been on the health care community – specifically hospitals, physicians, and nurse practitioners that receive Medicaid and have electronic health record technology. The Department and the NC HIEA are committed to executing the law as it is written and working with all state agencies and health care providers affected by the HIE Act. We will work with all local education entities that ask for extensions under the law. We agree with the Division’s recommendations. Specifically, we look forward to working with the Departments of Health & Human Services and Public Instruction to examine the consequences of this law applying to local education agencies and the logistics of full compliance. I appreciate your team’s collaboration throughout the Division’s study process. If you have any questions, please do not hesitate to contact me or DIT’s legislative liaison Nate Denny at (919) 397-2124 or [email protected]. Sincerely,
J. Eric Boyette