,minimization of blending losses of nuclear fuel
TRANSCRIPT

,MINIMIZATION OF BLENDING LOSSES
TO DETERMINE OPTIMAL STANOARD ENRICHMENTS
OF NUCLEAR FUEL/
by
John Scott Lorber,\Juni or, / Thesis submitted to the Graduate Faculty at the
Virginia Polytechnic Instituate and State University
in partial fulfill~ent of the requirements for the deqree of
MASTER OF SCIENCE
in
Nuclear Science and Engineering
APPROVED:
I I =-y - v - ' ~ v 1" ' < - r. " ' ....... "> ' 7· H. A. Kurstedt Jr., Co-Chairman A. Nachlas, Co-Chairman
G. H. B'eyer
June 1978
Blacksburg, Virginia

ACKNOWLEDGEMENT
I wish to express my appreciation to and
Without their patience, guidance, and prodding,
this work would never have been completed.
I would like to thank
menber of my advisory committee.
I would also like to thank
for serving as a
and for their invaluable assistance in the area of linear
programming.
I am deeply indebted to both my mother and father for their help
and encourangement throughout my educational career.
ii

Chapter
I.
II.
III.
IV.
v. BIBLIOGRAPHY
APPENDIX I.
APPENDIX II.
APPENDIX III.
VITA
TABLE OF CONTENTS
INTRODUCTION •
A. Background • .
B. Problem Focus
C. Approach
D. Result .
ENRICHMENT AND BLENDING
MODEL FORMULATION
A. Mathematical Model
B. Reference Case • • •
RESULTS AND CONCLUSIONS
RECOMMENDATIONS FOR FUTURE WORK
Nuclear Fuel Cycle .
Enrichment Technology
Mixed Integer Procedures • •
iii
.J
Page
1
1
4
6
6
8
14
14
18
25
43
45
47
50
63
66

Figure
1
2
3
4
5
6
7
8
9
LIST OF FIGURES
The Effects Various Tails Assays Have on the Amount of Feed and Separative Work Required to Produce Three Percent Uranium Product •
SWU Cost, Feed Cost, and Total Cost for Pro-ducing One Kilogram of a Desired Enrichment •
The Amount of Separative Work Required to Pro-duce One Kilogram of a Desired Enrichment •
The Amount of Natural Uranium Feed Material Required to Produce One Kilogram of a Desired Enrichment . . . . . . . . . . . . . . . . .
Total Enrichment Costs for the Optimal N En-richment Sets • . . . . . • • .
Total Amount of Separative Work for the Optimal N Enrichment Set .•.•
Feed Material Necessary to Produce Optimal N Enrichment Sets • • • • . • • • . . •
Percent Increase in Total Enrichment Costs for the Optimal N Enrichment Sets .
Nuclear Fuel Cycle
10 Modes of Molecular Flow Through Capillary Media •
11 Gaseous Diffusion Stage and Stage Arrange-ment
12 General Types of Countercurrent Centrifuge
13 Atomic and Molecular Approach to Laser En-richment . . . . . . . . . . . . . .
14 Becker Trennduse and Fenn Shock Process
15 MISTIC Loop • • • . • • .
iv
Page
11
21
22
23
36
37
38
39
48
51
53
55
58
62
64
Table
1
2
3
4
Enrichment Year 1980
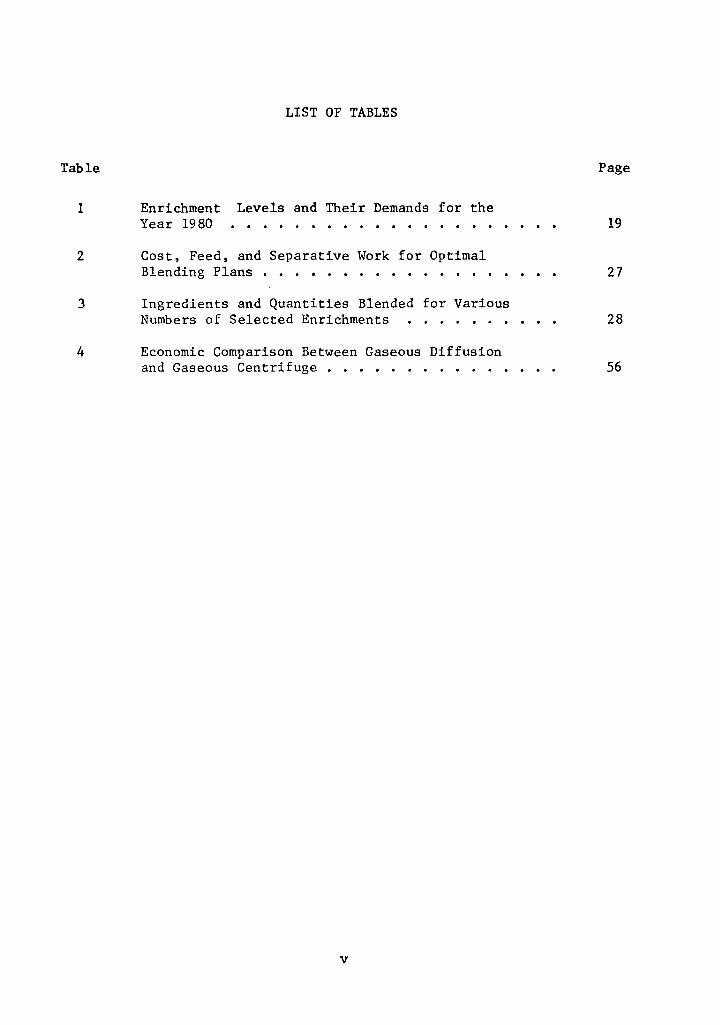
LIST OF TABLES
Levels and Their Demands for the
Cost, Feed, and Separative Work for Optimal Blending Plans . • . • • • • . • •
Ingredients and Quantities Blended for Various Numbers of Selected Enrichments • • . •
Economic Comparison Between Gaseous Diffusion and Gaseous Centrifuge • . • • . . . . • • • •
v
Page
19
27
28
56

CHAPTER I
INTRODUCTION
Within the scenarios for future expansion of the present United
States enrichment capacity, alternative enrichment technologies leading
to a limited number of enrichment values are proposed. The gas
centrifuge is the most prominent example. Cost-effective gas centrifuge
facility design implies the µroduction of a limited number of enrichment
values. The early employment of these facilities leads to a need to
blend these enrichment values to meet existing demands for a wide range
of different enriched fuels.
The requirement is to produce a wide range of products from a
limited number of ingredients. The optimal design of such a blending
system includes consideration of both the mechanical blending processes
and the economic penalties resulting from the nonlinearities associated
with enrichment costs. The design parameters of the mechanical pro-
cesses for blending ingredient enrichments to produce fuels for existing
reactors are not defined and are assumed here to be independent of
both ingredient and product enrichments. The economic penalties of
blending ingredient enrichments are analyzed using a linear program
with the objective of determining the identities of the ingredients
that minimize these penalties as a function of the number of ingredi-
ents produced.
A. Background
Presently there are 60 connnercial light water nuclear reactors in
1

2
operation; each of which is to some extent custom designed and built.
While based on a fundamental design, the reactors have design and
construction modifications to satisfy continually changing regulations.
The nuclear power industry may be unique in having evolved entirely (1) under federal regulations. As a result, a dynamic and highly
nonstationary regulatory environment leads to substantial modification
in the implementation of the fundamental reactor design. The
simultaneous evolution of regulation and design is generally viewed as
industry growth and as therefore acceptable. Nevertheless, the diversity
in implemented reactor design format carries associated customization
costs.
Considerable interest has recently been generated in the concept of
standardization of nuclear reactor systems. This interest is in part
motivated by a desire to contain rising energy costs, but is to a greater
extent a reflection of prevailing views of the appropriate pattern of
further nuclear energy industry growth. (l)
The concept of standardization can be applied to the entire reactor
installation or to specific connnon components of nuclear power plants.
When considering component standardization, attention can be restricted
to new installations or can include both equipment for new plants and
replacement items for existing reactors. The impact that standardization
will have upon existing reactor installations, however implemented, must
be investigated.
Through standardization of nuclear power plants, a utility appli-
cant can reference and thereby gain advanced approval of all equipment,
structures, and interfaces necessary for plant construction. (l, 2) An-
3
other advantage to using a standardized system is an estimated shortening
of plant regulatory reviews by as much as 6 to 7 months and a savings of
between 40 and 50 man-years of utility and construction work during
PSAR (Preliminary ~afety _!nalysis E_eport) preparation. (3)
The reactor fuel is an attractive component for the implementation
of standardization. In particular, standardized fuel enrichments have
the advantage of being very cost effective and new enrichment technologies
have the appeal of potentially lower capital costs relative to those
of the presently used gaseous diffusion process. In the case of new
reactors, standardized fuel enrichments can have numerous advantages,
including manufacturing cost, licensing, startup testing, interchange-
ability in the event of fuel assembly damage, and uniformity of shielding
requirements. The use of standardized fuel for existing reactors may
not be practical. However, the concept of using standardized fuel
enrichments and blending them to produce the required enrichments for
existing reactors would assure continued service to existing reactors
while permitting standard fuel for new reactors. For example, if 2
percent and 4 percent by weight of uranium-235 are standardized enrich-
ments and if uranium at an enrichment of 3 percent is needed, the blend-
ing of one kilogram of 2 percent enriched material with one kilogram of
4 percent enriched material will yield two kilograms of 3 percent
enriched fuel. Thus fuel requirements for existing reactors need not
necessarily block the use of standardized fuel enrichments.
The existing nuclear industry is not going to be immediately
standardized. Meanwhile, needed and beneficial technology should be
agressively pursued, and interim procedures for fuel supply must be

4
considered. The use of a fixed set of selected enrichment values is
viewed as a possible first step in fuel standardization and, in turn,
in reactor design standardization. An analysis of blending selected
enrichments is a necessary input to the evaluation of standardization
of enrichments.
B. Problem Focus
It should be noted, that the requirement to blend standard enrich-
ments can produce technological and quality assurance problems. The
standard enrichments must be homogeneously blended with a high degree of
assurance, precision, and repeatability in either the gaseous, liquid,
or solid state. The physical process and related costs are not avail-
able in existing literature, which suggests that these parameters be
eliminated from any present-day optimization analysis of enrichment
blending. Otherwise the uncertainity reflected in these parameters can
render results and trends of such analysis indistinguishable.
Due to the nonlinearity in the cost of separative work required in
producing enriched products, the optimal choice of a standard set of
enrichments and their associated quantities necessary to meet existing
commercial light water reactor demands are not readily clear. It
is this determination toward which this affect is directed. The nec-
essary requirement is that the actual cost of physically blending
the standard enrichments, and assuring the proper homogeneous blend,
must not affect the optimization procedure. If these operational
blending costs are not a function of the values of the ingredient
being blended, then the optimization achieved ignoring these oper-

5
ational costs will be identical to that achieved when considering
operational costs. For example, if the operational cost of blending
A percent enriched material with B percent enriched material is the
same as that of blending C percent enriched material with D percent
enriched material, where A, B, C, and/or D are not necessarily equal,
then the operational blending costs are not a function of the values
of the blending ingredients. The operational costs can then be
ignored.
Without actual knowledge of the blending process and/or procedure,
it is reasonable to assume that the physical blending and quality
assurance costs are constant for blending different valued ingredients.
It may be questionable, however, whether the cost associated with the
effect to obtain confidence in the variance from the desired blended
product for blended ingredients of narrowly differing enrichments (such
as 0.1 percent difference) is the same as to obtain confidence in the
variance for blending ingredients of widely differing enrichments (up
to 3 percent difference or so). It will be assumed that the cost to
obtain this confidence is constant and it is upon this assumption that
the resulting optimization analysis rests. At this time, it is reason-
able to state that not only the relationship between this confidence
cost and the difference in blending ingredient values are unknown, but
also the blending process and other associated costs are unknown. The
analysis is hence performed under the assumption stated above and the
trends of the analysis considered appropriate until more detailed
blending information is available.
6
c. Approach
A mixed integer linear programming model is developed which will
determine the identities of the enrichment values, the quantity of each
enrichment value required to optimally blend the fuel for existing
reactors and the blending penalty associated with using the selected
enrichments, given the following data:
1) N, the number of ingredient enrichments to be blended;
2) a variety of ingredient enrichment levels, the amount of
separative work needed to produce one unit of the as-
sociated level, and their associated production costs;
3) the number, enrichment levels, and associated amounts
of the enrichments demanded by the nuclear industry in
a given time frame; and
4) the maximum amount of separative work available in that
time frame.
The model is applied to a reference case corresponding to the fuel
requirements for the expected reactor poputation (800 MWe and greater)
in 1980 and is analyzed for several values of N, the number of selected
enrichments.
D. Results
From the analysis of the results obtained for various values of N,
it is found that the cost penalty associated with blending is small,
even for a small number of selected enrichments. In fact, as few as
4 enrichment values can be used with a cost penalty of only 0.18 percent.
Another result is that the costs of blending decrease rapidly as the

7
number of selected enrichments increases. It is also found that the
amount of separative work is the major contributor to the total enrich-
ment cost. Finally, it is found that certain enrichment values occur
in the optimal set of selected enrichments for many values of N.
Implications include the economic attractiveness of enrichments from
new technologies, the extension possibilities to mixed oxide fuels,
and the optimal use of residual material during maintenance.

Chapter II
ENRICHMENT AND BLENDING LOSSES
There are several isotopes of uranium found in nature. The two
principal ones are uranium-235 and uranium-238. Because of the favor-
able ratio of fission to absorption probabilities of uranium-235 with
thermal neutrons, it is necessary to enhance the concentration of ura-
nium-235 from its natural 0.711 weight percent to the 2 to 4 percent
desired for fuel in light water reactors. The gaseous diffusion process
is presently used to accomplish this enrichment. However, there is a
definite potential for use of the laser and/or gas centrifuge enrich-
ment processes.
Uranium enrichment is defined as the process of separating a quan-
tity of feed uranium into an enriched product component containing a
higher concentration of uranium-235 and a depleted tails component
containing a lower concentration of uranium-235. The total quantities
of uranium in feed, product, and waste streams are symbolically referred
to as "F", "P", and "W", respectively. Similarly, the weight fraction
of uranium-235 in each stream will be symbolized by "Z" with the appro-
priate subscript (i.e. ZF, Zp, or ZW). The overall separation operation
is defined by the following mathematical relationships:
a) total uranium material flow balance,
F = P + W;
b) uranium-235 material flow balance,
F • ZF = (P • Zp) + (W • Zw); and
8

9
c) "separative work balance",
SW = P • V(Z ) + W • V(Z ) - F • V(Z ) P W F which can be written
where SWU = SW/P and V(Z) is adefined "value function"
given by V(Z) = (2Z - 1) • ln(Z/(l - Z)). (4, 7)
As can be seen from the equation, the separative work balance possesses
the same units as the quantities of total uranium.
An important concept in uranium enrichment is separative work.
Separative work is a measure of the quantity of physical work required to
accomplish a given enrichment. The effect of a unit of separative work
may be understood by noting that it takes approximately 1.78 units of
separative work applied to 3.99 kilograms of natural uranium feed to
produce one kilogram of uranium product containing 2.00 percent by
weight uranium-235 while stripping the uranium tails to 0.28 percent
uranium-235, using the gaseous diffusion process. It should be noted,
however, that in deriving the separative work unit for the gaseous
diffusion process the stage enrichment factor, which is equal to the
separation factor minus one, is assumed to be a very small positive
number, but in the laser and centrifuge processes that assumption is not
valid. Consequently, for laser and centrifuge enrichment the equation
for separative work does not really measure the work "done" by these
systems. It can still be used to describe the capacity of laser or
centrifuge enrichment plants and to compare their capacities to the
projected needs.
The waste or depleted stream from the enrichment plant is commonly

10
called "tails" and the uranium-235 content of the tails is referred to as
the "tails assay". In specifing the quantity of separative work neces-
sary to accomplish the production of a specific quantity of enriched
material, a variety of feed streams and tails enrichments are available.
Alternatively, for a fixed waste stream, a variety of alternative combi-
nations of feed streams and separative work will yield the required
product. Thus, there is a trade off between the use of feed and the use
of separative work in the production of the enriched material. This
trade off is subject to economic optimization.
For example, Figure 1 shows the effects of changing the tails assay
on the amount of separative work required to produce 3.0 percent by
weight enriched uranium using natural uranium feed and on the associated
amount of feed material required. Figure 1 uses as a base point the (5) projected 1980 tails assay of 0.28 percent , and expresses the effects
of different tails assays on separative work and feed in percent units.
The effect of separative work and feed on the enriched material can be
seen to be that increasing tails assays increases the requirement for
feed material and decreases the requirement for separative work. These
relationships are independent of separative work costs and feed costs.
Consider the total cost relationship for the enrichment trade-off shown
in Figure 1 including both separative work and feed cost in the produc-
tion of 3.00 percent by weight enriched uranium, using natural uranium
feed costing $31.64 per kilogram and $76.00 per unit charge of separative
work. It can be seen that the total cost is relatively insensitive to
the tails assay over a considerable range. To both the uranium enrichers
and uranium producers, the tails assay adopted is of greater economic

160 t- I Feed Cost = $31.64/KgU
SWU Cost = $76.00/Kg SWU I
150
140
tn .µ 130 ·~ ~
::::> ,-.,
~ t) 120 (IJ CJ ~ (IJ
110 I ~: _J I-' p..,
I-'
TOTAL COST OF PRODUCT --100
90
80
0.2 0.28 0.3 0.4 Tails Assay (Weight Percent U~235)
Figure 1. The Effects Various Tails Assays Have on the Amount of Feed and Separative Work Required to Produce Three Percent Uranium Product.(5,6) •
12
significance than it is to the enriched uranium customers. (6)
On inspection of the total cost curve in Figure 1, it may be noted
that the minimum cost point occurs at a tails assay greater than 0.28
percent uranium-235. This observation leads to the conclusion that the
tails assay used is slightly suboptimal for the user of enriched uranium.
This would be the case if the $76.00 charge for separative work was, in
fact, independent of the standard tails assay. However, this is not the
case. The level of plant operation affects the cost of separative work
which in turn is affected by the magnitude of the demand for separative
work; and the demand is affected by the tails assay selected. (6)
For any enrichment level required, the relation between feed,
product, and waste streams, the enrichment of these streams, and the
separative work required to process them is specifically defined and can
be applied to any level of product enrichment. The costs of using the
enrichment process are the costs of providing the feed material and the
costs of the separative work. Thus, for any enrichment, z, the total
unit cost, TC , is equal to the unit cost of feed, CF, times the amount z of feed material used, F , plus the unit cost of separative work, CSW, z
times the quantity of separative work utilized, SWU • Because the re-z
lation between product enrichment level and separative work is essen-
tially exponential, cost per unit of product is an exponential function
of product enrichment for a fixed feed quantity and fixed tails assay.
Consequently, the cost of producing two specific enrichment levels and
blending them to produce a third enrichment level is greater than the
cost of producing the third level directly. The difference between
these two costs plus the costs associated with a particular fuel blending

13
operation is called the "blending loss". Consider the following
illustration using $76.00 per kilogram separative work unit, $31.64
per kilogram of natural uranium feed, and a 0.28 percent tails assay.
It costs $261.46 to produce one kilogram of 2.00 percent enriched fuel
and $689.88 to produce one kilogram of 4.00 percent enriched fuel.
Blending these two yields a cost of $951.34 per two kilograms of the
3.00 percent enriched fuel plus the cost associated with the blending
operation. The difference of $4.74 plus the blending operation cost
per kilogram is the "blending loss". If a set of selected enrichments
are produced, the elements of this set should be chosen in order to
minimize the total blending losses.

CHAPTER III
MODEL FOR.MULATION
Mathematical Model
Existing commercial light water reactors use fuel at a variety of
enrichment values. The objective of the study is to develop a metho-
dology that identifies a set of selected enrichments from which the
needed quantities of any number of fuel enrichments can be blended at
minimum cost. If the elememts of the set of selected enrichments are
defined to be ingredients and the required enrichments are labelled
products, the problem of identifying the elements of the set of selected
enrichments can be formulated as an optimization problem. In order to
construct a model of this problem, the following variables are defined:
Xi. =the quantity of ingredient i used to blend product j, (Xij~ 0), J
Ci the total unit cost of producing fuel material at the ith
enrichment level directly (the total unit cost includes both
unit feed costs and unit separative work costs),
Ui = the amount of separative work required to produce one unit th of material of the i~ enrichment,
Si =weight percent of uranium-235 in the ith ingredient enrich-
M
ment,
weight percent of uranium-235 in the jth product enrichment,
th the demand for product material of the j~ enrichment,
total separative capacity available,
=the number of product enrichments demanded (M ~N),
14

15
Ii = use coefficient; equal to zero if ingredient i is not used at
all and equal to one if it is used to blend product material,
N = the number of ingredient enrichments used to blend the product
material,
Fi = amount of feed required to produce one unit of material of the
i th . h - enric ment,
TF = total amount of feed material available, and
EC = the total enrichment cost.
The objective is to minimize the total enrichment cost subject to
the constraints imposed by the product-fuel demand, availability of feed,
availability of separative work, and blending. The total enrichment
cost is
EC (3 .1)
Five basic sets of constraints must be satisfied. The first set
assures that the blending of enrichments yields the correct enrichment
levels. Thus, the enrichment of the jth product, Pj, is equal to the
summation over all ingredients of the products of the quantities blended
and their enrichment levels, divided by the summation of the quantities th of the i- ingredient enrichment used. This can be expressed as
= p j
(3.2)
or
(3.3)

16
The next set of constraints requires that the quantities of the desired
products satisfy the demand for the given year:
N Ex .. ~D .• l lJ J
(3.4)
The third type of constraint restricts the total amount of separative
work to be within production limits (i.e., enrichment plant capacity is
not exceeded):
(3 .5)
The fourth type of constraint limits the total amount of feed material
to within mining and milling output capacity and enrichment plant input
capacity for a given year:
(3. 6)
The final set of constraints restricts the number of ingredients that
can be utilized to produce the desired products. Thus the suunnation of
the use coefficients, I., must be equal to the total number of ingredient l
enrichments allowed in the blending process:
N ~\ = N. (3. 7)
l
th The suunnation of the amounts of the f~ ingredient utilized in the th production of the M products is equal to the total amount of the f~
ingredient consumed by the enriching process. This can be expressed
as
(3. 8)
17
where th Ai = the total amount of the i~ ingredient utilized in the enrich-
ing process.
The amount of the ith ingredient consumed in the enriching process must
th be less than or equal to the availability of the i~ ingredient, AVi'
times its use coefficient, Ii;
where
I. l.
Ii = 0 when ingredient not used and
Ii = 1 when ingredient used in the blending process.
(3. 9)
Substituting Eq. (3.9) into Eq. (3.8) yields the following equation:
M L:x .. LAV. · I .• . l.J l. l. J
(3. 10)
The availability of an ith ingredient, AVi, is limited by the enrichment
plant capacity. In this study, it should be noted that the value of AVi
is assigned a constant value, AV, such that AV is equal to a value great-
er than the total demand for any ith ingredient used in the blending
process. This simplification of AVi to AV is an attempt to reduce the
complexity of the model and help in the determination of the optimal
enrichment sets when ingredient availability is unlimited.
The formulation of this mixed integer problem is identical to the
formulation of a linear programming problem except for the zero/one
integer variables of the use coefficient. MISTIC (!'1_ixed Integer ~earch . (25) I_echnique .!_nternally _g_ontrolled), a MPS III proprietary procedure
for solving optimization problems having a mixture of integer variables

18
(restricted to values of zero and one) and continuous variables, is
employed to solve the mixed integer problem. See Appendix III for
additional information about MISTIC.
B. Reference Case
Sample calculations to demonstrate application of the model are
performed using the following reference case. The reference case select-
ed consists of the quantities and enrichment levels of reactor fuels
required for planned existing connnercial light water reactor refueling
schedules and for new connnercial light water reactor installation (8 9) schedules in the United States in 1980. ' It is assumed that all
the reactors on line in 1980 are rated at an electric capacity of 800
MW or greater and that recycled uranium or plutonium is not available.
It is further assumed that the gaseous diffusion process will still be
the main process of uranium enrichment (the centrifuge and laser enrich-
ing processes are still a few years from connnercial feasibility). Final-
ly, the blending process is assumed to occur using the enriched uranium
hexafluoride gas components at the enrichment plant and the costs associ-
ated with this particular blending technique are assumed to be negligible.
The enrichment values for each reactor type are chosen according to
the readily-available literature. C3, 9) Refueling quantities of fuel are
estimated at one-third core. It is conservatively estimated that two
full core quantities of fuel [one initial startup core and replacement
fuel (refuel enrichments) equalling one additional core] are required at
the time of a new reactor fueling. The estimated distribution of re-
quired assays are shown in Table 1. The identified 39 different fuel
19
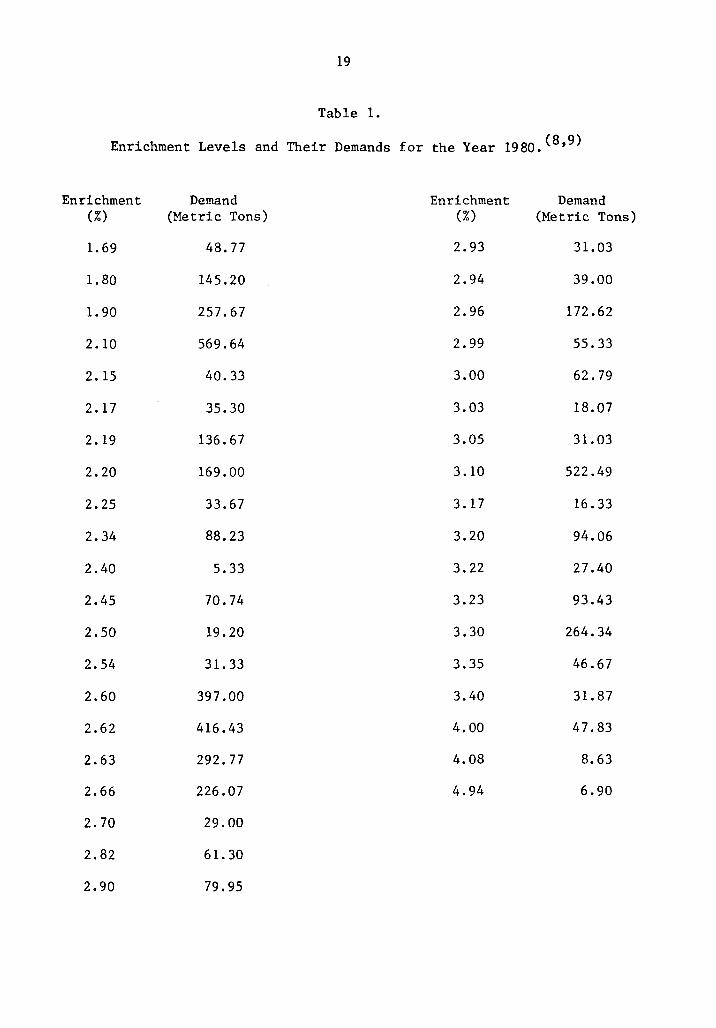
Table 1.
Enrichment Levels and Their Demands for the Year 1980. (S, 9)
Enrichment Demand Enrichment Demand (%) (Metric Tons) (%) (Metric Tons)
1.69 48.77 2.93 31.03
1.80 145.20 2.94 39.00
1. 90 257.67 2.96 172. 62
2.10 569.64 2.99 55.33
2. 15 40.33 3.00 62.79
2.17 35.30 3.03 18.07
2.19 136.67 3.05 31.03
2.20 169.00 3.10 522.49
2.25 33.67 3.17 16.33
2.34 88.23 3.20 94.06
2.40 5.33 3.22 27.40
2.45 70.74 3.23 93.43
2.50 19.20 3.30 264.34
2.54 31. 33 3.35 46.67
2.60 397 .00 3.40 31. 87
2.62 416.43 4.00 47.83
2.63 292. 77 4.08 8.63
2.66 226.07 4.94 6.90
2.70 29.00
2.82 61.30
2.90 79.95
20
enrichments are a conservative simplification of the over 50 separate
fuel enrichments utilized in commercial light water reactors. (9)
For each of the model parameters, representative values are
obtained. They are as follows:
1) The projected unit price for separative work, CSW, is
$76.00 per kilogram separative work unit. (l4)
2) The projected unit price for natural uranium feed
material, CF, is $31.64 per kilogram (0.711 percent
by weight uranium-235). (l9)
3) The tails assay, ZW, is 0.28 percent. (5) This proposed
increase of the tails assay by NRC from the present
0.20 to 0.28 percent by 1980 results in a 14 percent
increase in the amount of feed required and a 16 percent
decrease in the amount of separative work needed. The (15 16) overall cost would be "only slightly affected". '
4) The available amount of separative work, SC, projected
for the year 1980 is between 13.8 and 14.5 million . (5 15) separative work units. '
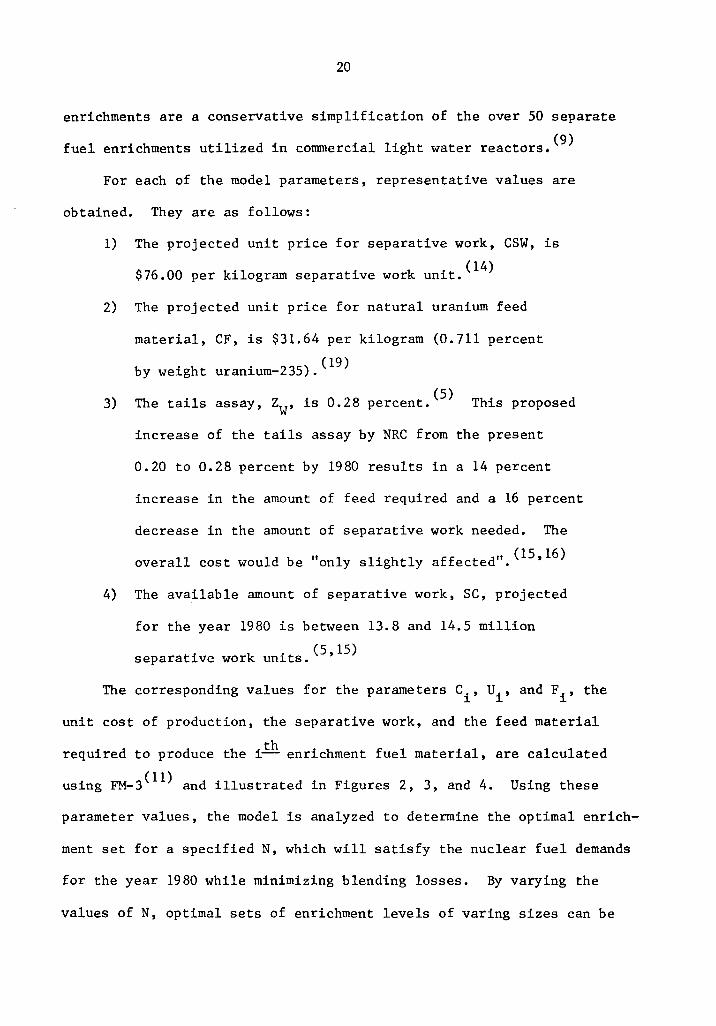
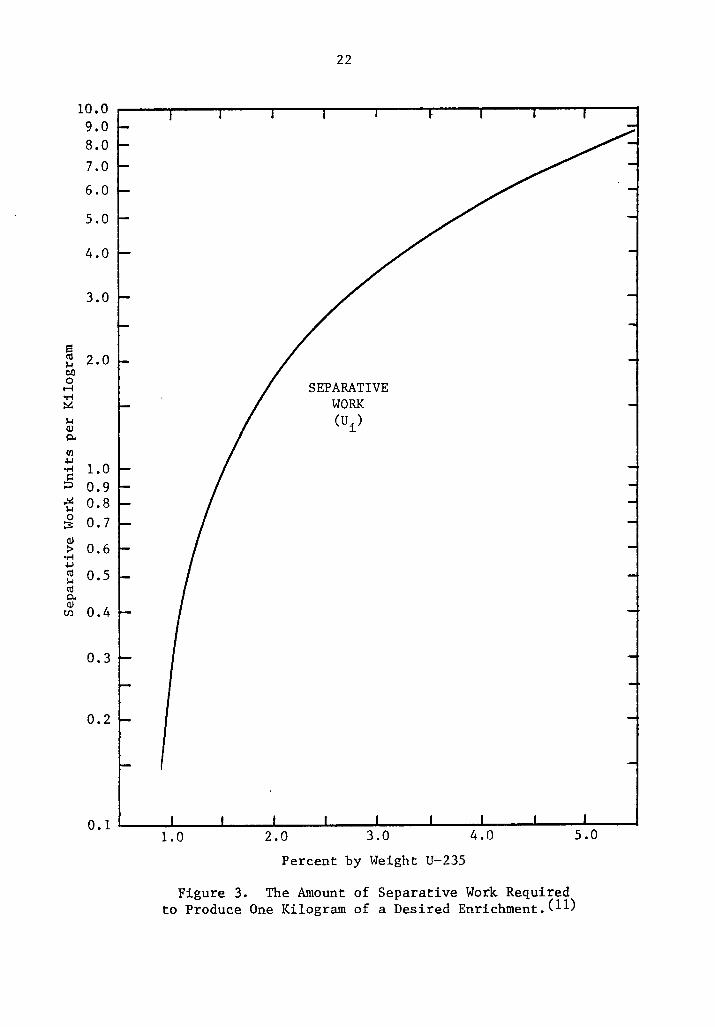
The corresponding values for the parameters Ci, Ui' and Fi, the
unit cost of production, the separative work, and the feed material
required to produce the ith enrichment fuel material, are calculated
using FM-3(ll) and illustrated in Figures 2, 3, and 4. Using these
parameter values, the model is analyzed to determine the optimal enrich-
ment set for a specified N, which will satisfy the nuclear fuel demands
for the year 1980 while minimizing blending losses. By varying the
values of N, optimal sets of enrichment levels of varing sizes can be

-bO ~ -<Jr ...... s t1l 1-1 00 0
r-4 -rt ~
1-1 Q) p,. .µ Cl) 0 u
21
102
1.0 2.0 3.0 4.0 Percent by Weight
Figure 2. SWU Cost, Feed Cost, and Total Cost for Producing One Kilogram of a Desired Enrichment.(11)
5.0
m 1-1 ClO 0
r-l ·n ~
1-1 Q) p.
f/l -I.I •n ~
::::::>
~ 1-1 0 ::;:: Q) :> -n -I.I C1l 1-1 C1l p. Q)
ti)
10.0 9.0 8.0 7.0 6.0
5.0
4.0
3.0
2.0
1.0 0.9 0.8 0.7
0.6
0.5
0.4
0.3
0.2
22
SEPARATIVE WORK (Ui)
1.0 2.0 Percent by Weight U-235
Figure 3. The Amount of Separative Work Required to Produce One Kilogram of a Desired Enrichment.(11)

15
10
9
8
7
13 6 ;::l ..-4 i:: <ll ,....
:::> 5 .--I <ll ,.... ;::l
.&-J <ll 4 z
1.1-l 0 (/) s co
3 ,.... 00 0
.--I -M ::.:::
2
1
23
FEED (Fi)
1.0 2.0 3.0 4.0 5.0 Percent by Weight U-235
Figure 4. The Amount of Natural Uranium Feed Material Required to Produce One Kilogram of a Desired Enrichment.Cl!)

24
identified and compared.

CHAPTER IV
RESULTS AND CONCLUSIONS
In evaluating the results of the model, it is important to define
the number of significant figures that are to be responsibly carried in
order to properly display the trends of the optimization analysis. The
development of the optimization model for blending selected enrichments
is much like the definition, design, construction, and testing of
experimental apparatus. With high precision digital computers, the
error associated with operation of the model can be rendered negligible
compared to typical experimental error. Also, input data for a computer
model can be actual or hypothetical. For the problem studied here, input
parameters have values, such as cost, which are rapidly changing with
time. To evaluate trends, it is important to use input values that are
in the correct range. Any input value for the model can be considered
as precise as desired by considering the value as a snapshot precisely
correct at some point in time.
For the case where the trend rapidly approaches an asymptote over a
defined range, it is desirable to maintain a sufficient number of signif-
icant figures to observe the functional form and the relationship to the
asymptote. For that reason, the number of significant figures carried
will be that number that demonstrates the effects under observation.
Justification for the number of significant figures will relate to the
concept of the validity of the input to any degree of precision at some
instant in time. Since the exact instant in time is not known, the pre-
cision of the result of the model is only valid for that unknown point.
25

26
Thus, the significant figures considered for the numerical result must
be many fewer than the significant figures used to establish the trend.
However, the appropriate view of both trend and result are important.
It should be remembered that the major objectives of the effect
are to establish a model and to check its validity through application
to a reference case. The resulting model can then be used to obtain
results to any degree of accuracy, dependent upon the ability of the
user to obtain precise time-related input. The second objective is
to observe trends for the reference case application, realizing that
the trends observed are valid but the absolute value of the results
are strongly related to the accuracy of the input. It is not claimed
here that the input is precise due to the inability to obtain exact
and timely cost data.
Sample calculations to demonstrate the application of the model are
performed to investigate the previously defined reference case. The re-
sults obtained in determining various optimal sets of N blended enrich-
ments are summarized in Tables 2 and 3.
Examination of the model solutions displayed in Tables 2 and 3 re-
veals several significant results. Although available as ingredients,
enrichments less than the lowest product enrichment demanded are not uti-
lized in the blending procedure. It appears that this is because the cost
of the blending complement for an enrichment less than the lowest demand-
ed product enrichment must have a correspondingly high enrichment value.
Such a blend is not cost effective under exponential enrichment costs.
An anticipated res~lt is that in each case the highest and lowest
enrichment demanded is always the upper and lower bound of each of the

27
Table 2.
Cost, Feed, and Separative Work for Optimal Blending Plans.
Separative Total Total Number of Total Feed Work Units Enrichment Marginal
Ingredients (MTU) (xl07) Cost Cost* ($ x109) (xl07)
2 25742.4 1.42883 1.90040 4.37260 3 25742.2 1.38956 1.86447 0.77935 4 25742.2 1. 37573 1.86004 0.33683 5 25742.0 1. 37287 1. 85786 0.11844 6 25742.0 1.37222 1.85736 0.06900 7 25742.2 1. 37204 1.85723 0.05601 8 25742.0 1. 37181 1.85705 0.03779 9 25742.0 1.37164 1. 85692 0.02512
10 25742.0 1. 37158 1.85688 0.02039 11 25742.0 1. 37148 1.85680 0.01258 12 25742.0 1.37145 1.85678 0.01049 13 25742.1 1. 37140 1. 85675 0.00730 14 25742.0 1. 37138 1.85673 0.00535 15 25742.2 1. 37136 1.8567] 0.00403 16 25742.2 1.37135 1.85671 0.00358 17 25742.2 1. 37134 1.85670 0.00295 18 25742.2 1. 37133 1. 85669 0.00204 19 25742.2 1.37132 1.85669 0.00128 21 25742.2 1. 37132 1.85668 0.00114 22 25742.1 1.37132 1.85668 0.00094 23 25742.1 1. 37131 1.85668 0 .00071 24 25742.1 1. 37131 1.85668 0.00058 25 25742.1 1. 37131 1.85668 0.00049 30 25742.1 1. 37131 1.85668 0.00026 35 25742.1 1. 37131 1. 85667 0.00005 39 25742.1 1. 37130 1.85667 0.00000
* Marginal costs are the difference between the blending plan cost and the cost of producing the 39 products directly.

Table 3a.
Ingredients and Quantities Blended for Various Numbers of Selected Enrichments
(2-10 Enrichments)
Number of Ingredients
Ingredients
Quantity 2 3 4 5 6 7 8 9 10 (tonnes)
1. 69 3358.87 1011. 57 927. 58 280.71 280.71 280.71 117.91 117.91 117.91 1. 90 538.41 333.73 333.73
N 2.10 1178.46 1178.46 1154. 90 823.20 614.06 00
2.20 896. 52 403.70 2.34 342.31 2.45 206. 15 2.60 491. 17 2.61 2207.39 2.62 1698.45 1698.45 1425.98 1361.57 303.27 2.66 3345.94 2.90 491.14 429.09 429.09 429.09 3.10 1499.17 1476.52 1168.85 918.54 918.54 918.54 918.54 3.40 367.61 367.61 367.61 367.61 367.61 4.94 1364.55 365.92 89.28 89.28 29.35 29.35 29.35 29.35 29.35

Table 3b.
Ingredients and Quantities Blended for Various Numbers of Selected Enrichments
(11-19 Enrichments)
Number of Ingredients
Ingredients
Quantity (tonnes) 11 12 13 14 15 16 17 18 19
1. 69 117.91 117.91 117.91 48. 77 48. 77 48. 77 48. 77 48. 77 48. 77 1. 80 145.20 145.20 145.20 145.20 145.20 145.20
N
1.90 333.73 333.73 333.73 257.67 257.67 257.67 257.67 257.67 257.67 ~
2.10 614.06 614.06 614.06 614.06 614.06 614.06 614.06 614.06 614.06 2.20 403.70 403.70 403.70 403.70 388.60 388.60 358.52 358.52 358.52 2.34 100.26 102.68 102.68 2.40 147.56 147.56 77. 38 2.45 206.15 206.15 206.15 206.15 98.98 98.98 2.60 585.03 585.03 585.03 561. 01 561. 01 2.62 1303.27 1265.35 1265.35 1265.35 2.63 779. 08 570.39 570.39 570.39 570.39 2.66 270.67 270.67 247.82 247.82 2.82 179.24 179.24 179.24 154.16 68.55 68.55 2.90 429.09 154.17 154. 17 108.47 108. 47

Table 3b. (continued)
Ingredients and quantities Blended for Various Numbers of Selected Enrichments
(11-19 Enrichments)
Number of Ingredients
Ingredients
Quantity (tonnes) 11 12 13 14 15 16 17 18
2.96 384.56 384.56 384.56 384.56 322.58 322.58 322.58 3.10 918.54 821. 77 682.57 682.57 682.57 682.57 682.57 682.57 3.20 3.30 417.59 417.59 417.59 417.59 417.59 417.59 3.40 333.60 333.60 55.21 55.21 55.21 55.21 55.21 55.21 4.00 55.73 55.73 55.73 55.73 55.73 55.73 55.73 55.73 4.94 7.63 7.63 7.63 7.63 7.63 7.63 7.63 7.63
19
322.58 586.17 192.81 321.18
55.21 55.73
7.63
w 0

Table 3c.
Ingredients and Quantities Blended for Various Numbers of Selected Enrichments
(21-25, 30, 35, 39 Enrichments)
Number of Ingredients
Ingredients
Quantity (tonnes) 21 22 23 24 25 30 35 39
1. 69 48. 77 48. 77 48. 77 48. 77 48. 77 48. 77 48. 77 48. 77 1. 80 145.20 145.20 145.20 145.20 145.20 145.20 145.20 145.20 w 1. 90 257.67 257.67 257.67 257.67 257.67 257.67 257.67 257.67 .....
2.10 614.06 595.41 595.41 595.41 595.41 569.64 569.64 569.64 2.15 57.98 40.33 40.33 2.17 35.30 35.30 2.19 186.53 186.53 186.53 186.53 154.32 136.67 136.67 2.20 358.52 190.65 190.65 190.65 190.65 190.65 169.00 169.00 2.25 33.67 33.67 2.34 102.68 102.68 102.68 102.68 102.68 102.68 90.65 88.23 2.40 5.33 2.45 73.65 82.18 82.18 82.18 82.18 82.18 82.18 70.74 2.50 38.00 19.20 2.54 42.00 42.00 42.00 42.00 42.00 42.00 31. 33

Table 3c. (continued)
Ingredients and Quantities Blended for Various Numbers of Selected Enrichments
(21-25, 30, 35, 39 Enrichments)
Number of Ingredients
Ingredients
Quantity (tonnes) 21 22 23 24 25 30 35 39
2.60 548.32 397.00 397.00 397.00 397.00 397.00 397.00 397 .oo 2.62 416.43 416.43 416.43 416.43 416.43 416.43 416.43
VJ
2.63 699.57 292. 77 292. 77 292. 77 292. 77 292. 77 292. 77 292. 77 N
2.66 247.82 247.82 247.82 247.82 247.82 247.82 226.07 2.70 125.89 29.00 29.00 2.82 61.30 68.55 68.55 68.55 68.55 68.55 61. 30 61. 30 2.90 199.65 108.47 108.47 108.47 108.47 87.71 79.95 79.95 2.93 31.03 31. 03 2.94 62.27 39.00 39.00 2.96 322.58 227.97 22 7. 97 227.97 172. 62 172.62 172.62 2.99 55.33 55.33 55.33 3.00 269.23 132.45 132.45 132.45 70 .02 70.02 62.79 3.03 18.07 3.05 41. 87 41.87 31.03

Table 3c. (continued)
Ingredients and Quantities Blended for Various Numbers of Selected Enrichments
(21-25, 30, 35, 39 Enrichments)
Number of Ingredients
Ingredients
Quantity (tonnes) 21 22 23 24 25 30 35 39
3.10 548.33 586.17 548.33 548.33 548.33 527.39 527.39 522.49 3.17 16.33 w 3.20 192.81 192.81 192.81 192.81 114. 62 114. 62 105.49 94.06 w
3.22 27.40 27.40 3.23 111. 70 111. 70 93.43 93.43 3.30 321. 18 321. 18 321.18 321.18 287.68 264.34 264.34 264.34 3.35 46.67 46.67 46.67 3.40 55.21 55.21 55.21 55.21 55.21 31. 87 31. 87 31. 87 4.00 47.83 55.73 55.73 47.83 47.83 47.83 47.83 47.83 4.08 8.63 8.63 8.63 8.63 8.63 8.63 4.94 6.90 6.90 6.90 6.90 6.90 6.90 6.90 6.90

34
optimal enrichment sets. This simple result, however, leads to further
observations about the solutions. Note the change in the model solution
generated by permitting a single additional ingredient enrichment (N+l).
The model responds to this relaxation in the constraint upon the number
of ingredients in either of two ways.
One response is exemplified by increasing the number of ingredients
from N = 13 to N+l = 14. The selection of ingredients for the optimal
N+l set remains the same as that to the optimal N set except for a
choice to avoid blending two ingredient enrichments to obtain a third.
Instead, the third enrichment is produced directly, thereby reducing the
production of the two original ingredients. In the case of 14 ingredi-
ents, 1.80 percent enriched fuel is produced directly causing a reduction
in the production of 1.69 percent and 1.90 percent enriched fuels from
117.913 and 333.727 metric tons, utilized in the 13 ingredients case, to
48.770 and 257.670 metric tons, respectively. The model makes this
adjustment because it offers greater marginal savings in total production
costs than does any other potential alteration to the N = 13 solution.
The other response is exemplified by increasing the number of ingre-
dients from N = 11 to N+l = 12. For this change, the set of ingredients
selected for N+l remains unchanged from that of N, above and below a
range of enrichments; however, within the range the choice of ingredi-
ents as well as their quantities are adjusted. In going fron 11 to 12
ingredients, the 1303.274 metric tons of 2.62 percent, 429.091 metric
tons of 2.90 percent, and 918,544 metric tons of 3.10 percent enrichments
are replaced by 1265.345 metric tons of 2.62 percent, 179.238 metric tons
of 2.82 percent, 384.556 metric tons of 2.96 percent and 821.771 metric

35
tons of 3.10 percent enrichments. The model makes this adjustment
because it yields a greater marginal savings in the total production
cost than does any other potential alteration of the N ingredient
solution.
Thus, relaxing the constraint upon the number of ingredient
enrichments causes the model to search for the adjustment of the
still feasible but now suboptimal solution that will yield the
greatest marginal reduction in the total cost of the products.
This search locates one of two types of adjuctments both of which
eliminate some blending while leaving the majority of the solution
intact. As N is increased from 2 to 39, the adjustments occur
within the highest and lowest enrichment values first and then
among the intermediate values. This reflects the fact that the
exponential separative work costs yield greater marginal cost re-
duction when requirements for higher enrichments are reduced and
that the use of either a high or low enrichment value as an in-
gredient requires the production of a higher enrichment valued in-
gredient.
Another result is that certain of the potential ingredients occur-
red in most or all of the optimal solutions. In particular, aside from
1.69 percent and 4.94 percent, each of the enrichment values of 1.90,
2.10, 3.10, and 3.40 percent occurred in most of the solutions. This
phenomenon is attributable to two factors. Primary among these is the
set of quantities of the product enrichments required. The distribution
of necessary product quantities acts to stabilize the intermediate en-
richment values in the solutions and to weigh'blending costs. The second

36
1860
1859
'° I C> ~
~
<f>-
~ 00 0 u
M w & 1858 M m ~
0 H
1857 •
1856.667 {.Total Cost of Direct Production of Required Enrichments
4 6 8 10 12 14 16 18 20 22 24 26 28 30
N, Number of Ingredients Blended
Figure 5. Total Enrichment Costs for the Optimal N Enrichment Sets.

I/'\ 0 .-I
:< Cl) µ -M i::
:::i ~ ,_. 0
:::s: QJ :> ·~ µ !1l ,_. !1l p.. Q)
t/)
142.0
141.0
140.0
139.0
138.0
2 4 6
37
8 10 12 14 16 18 20 22 24 26 28
N, Number of Ingredients Blended
Figure 6. Total Amount of Separative Work for the Optimal N Enrichment Set.

13 25745.0 ::;I •r-1 i:: ~ ~ :::i li-1 a
rJJ 25742.1 i:: a E-1 CJ ~ •r-1 ~ w
00 ~ .µ
~ 25740.0
5 10 15 20 25 30 35 40 N, Number of Ingredients Blended
Figure 7. Feed Material Necessary to Produce Optimal N Enrichment Sets.

~ 00 0 u
10-1 ~ ~ ~
0 H ~ ~
~ 00 ~ ~ ~ u ~
H 10-2
~
~ ~ u ~ ~ ~
39
•
•
5 10 15 20 25 N, Number of Ingredients Blended
Figure 8. Percent Increase in Total Enrichment Costs for the Optimal N Enrichment Sets.
30
40
reason for the consistent choice of certain ingredients is the need to
use enrichment values lower and higher than the bounding values for
blending. That is, the lowest and highest values are not cost effective
blending ingredients because of their distance from most of the product
enrichment values. The gaps between 1.69 percent and 2.10 percent and
between 3.40 percent and 4.94 percent make 1.69 percent and 4.94 percent
marginally unattractive but necessary blending ingredients. The use of
1.90, 2.10, 3.10, and 3.40 percent enriched ingredients is therefore a
cost effective alternative to the use of the extreme enrichment values
as ingredients.
The amount of natural uranium feed required to satisfy the demands
for the enrichment procedure for any N, the amount of optimal selected
enrichments, is presented in Figure 7 and Table 2. As can be seen, the
demand for natural uranium feed is relatively constant over the whole
range of N. This constancy means that environmentally and economically
there would be no significant increase in the demands for exploration,
mining, milling or conversion of the uranium ore, due to the blending
procedure. This constant demand for natural uranium feed reflects a
constant feed cost and a greater importance of SWU costs with regard to
the total enrichment cost of each of the optimal enrichment sets.
Figure 6 displays the amount of separative work necessary to satisfy
the enrichment demands for each of the optimal enrichment sets. Note
that the demand for separative work decreases sharply with the initial
increase in N and approaches asymptotically the 39 product solution.
This reflects a decrease in dependence of intermediate product enrich-
ments on the higher and lower ingredient enrichments. Note also that
41
SWU requirements level off at N = 18. This indicates that for N greater
than or equal to 18, the demands for separative work are approximately
equal to the separative work demanded when producing the product enrich-
ments directly.
The total enrichment cost for each of the optimal enrichment sets
is presented in Figure 5 and Table 2. Note the rapidity with which the
total enrichment costs decrease as the value of N increases. This rapid
decline in the total enrichment cost is due to the rapid decay of blend-
ing losses as N increases, see Figure 8. These costs reach zero when
the number of ingredients equals the number of products, e.g., when the
products are produced directly and no blending is used. For as few as
four ingredients, the marginal blending cost is only 0.18 percent of the
total direct production cost. Thus, the increased fuel cost under blend-
ing of four ingredients exceeds the direct production cost by less than
two tenths of one percent. In terms of dollars, this is over 3 million.
Nevertheless, it is a small fraction of the total fuel costs. The
margin is less than $21,000 for 21 ingredients. Thus, the extent to
which blending costs are incurred can be controlled and balanced against
the benifits of using selected enrichments. . (17 18) Shadow prices, ' an integral part of the linear programming
technique, are evaluated. From this evaluation it is evident that the
trends resulting from the evaluation of the arbitary reference case
input data are not significantly sensitive to the number of product en-
richments, the magnitude of the blending costs, and the relative
quantities of demanded material. The conclusions associsted with the
results obtained here can be considered valid for a range of cases

42
similar to the reference case. The trends are not affected by a change
in demand as long as the new demand is reflected in the evaluation of
all values of N. Variations in SWU costs affect the magnitude of the
marginal costs but do not affect the reported trends.
The results indicate that blending is a reasonable approach for
providing fuel for existing commercial light water reactors while
pursuing reactor component standardization. In fact, the marginal
blending losses (or blending costs) may be offset by the economic
benefits of using standardized fuel in new reactors or by the advantages
of reduced capital requirements for alternate enrichment technologies.
The results also demonstrate that the model is an effective tool for
analyzing fuel blending problems. The model can therefore be used to
investigate blending when standardized reactor design fixes the set of
fuel enrichment levels or to evaluate strategies for blending mixed
oxide fuels under spent fuel reprocessing.

CHAPTER V
RECOMMENDATION FOR FUTURE WORK
The model provides substantial insight into the consequences of
using blending as a means towards achieving standardization of nuclear
fuels in existing reactors. However, there are several areas of
investigation that should be explored.
One area for investigation deals with the determination of an
optimal blending method and the cost associated with it. At present,
the model does not examine the physical mechanisms by which the enrich-
ment ingredients are blended; nor does it adjust the total enrichment
cost to incorporate the associated cost of using a particular blending
method or facility.
As previously discussed, there are M different fuel enrichments
utilized in existing coI!Dllercial light water reactors. The exact
number of these M fuel enrichments and their amounts depends on the
reference material used. A more up-to-date selection of enrichment
levels and the associated amounts of these enrichments demanded by
commercial light water reactors should be incorporated into the model. th In this study, AVi, the availability of the i~ ingredient enrich-
ment level, is equal to a constant value, AV, greater than the largest
d d f .th . di eman or any 1~ ingre ent. Thus AV has no influence on the
selection of ingredient enrichment levels in the optimal set of
blended ingredients. By determining the availability of any or all ith
ingredient enrichment levels, AVi' and incorporating them into the model,
43

44
the constraint on the availability of ingredients can be explored and
studied.
The effects uranium recycle will have on the enrichment process
and the selection of blending ingredient enrichment levels should be
investigated. Recycled uranium has an assay of approximately 0.80 per-
cent (except with extended burnup) and natural uranium 0.711 percent.
Utilizing the limited amount of recycled uranium as a feed input into
the enrichment process, the total enrichment cost associated with a given
product or products will be less than if the same product was produced
using natural uranium as a feed input. Exploration into possible modes
of utilizing the recycled uranium in the enrichment process will give
rise to possible cost advantages that should be determined.
At present, there is research being done dealing with the produc-
tion and utilization of mixed oxide fuels in an attempt to use pluto-
nium reserves in light-water moderated reactors. Mixed oxide fuels
contain a large fraction of uranium oxide and a smaller fraction of
plutonium oxide (up to 3.0 percent of the mixed oxide). Mixed oxide
fuel performs as well as uranium fuel with some minor core physics
changes. The present model can be modified to handle the blending
operation of the mixed oxide fuels, selection of optimal blending
ratios, the selection of possible standardized enrichment sets, and
plutonium recycle.

BIBLOGRAPHY
1. Naymark, Sherman, "The Road to Nuclear Plant Standardization - An Historical Perspective", Working Paper of Nuclear Services Corpora-tion, November 1975.
2. Nuclear News, Vol. 19, No. 10, August, 1976, p. 40.
3. Nuclear News, Vol. 18, No. 7, May, 1975, pp. 44-50.
4. "AEC Gaseous Diffusion Plant Operations", USAEC Report OR0-658, Division of Technical Information Extension, Oak Ridge, Tenn., February, 1968.
5. "New Enrichment Plant Scheduling", USAEC Report OR0-735, USAEC Oak Ridge Operations Office, Oak Ridge, Tenn., November, 1973.
6. "Selected Background Information on Uranium Enriching", USAEC Report OR0-668, April, 1969.
7. Symposium on Isotopic Separation of Uranium by Gaseous Diffusion (5 papers), in AIChE Symposium Series, Nuclear Engineering -Part XXIII, No. 123, Vol. 68, 1968.
8. "World List of Nuclear Power Plants", Nuclear News, Vol 19, No. 3, February, 1976, pp. 52-64.
9. "Power Reactors '76", Nuclear Engineering International, Vol. 21, No. 244, Supplement April, 1976.
10. Avery, D. G.; and Davis, E., "Uranium Enrichment by Gas Centrifuge", Mills and Boom Limited, London, 1973.
11. Nuclear Engineering Computer Module FM-3, College of Engineering, NSE Grant GZ-2888, Virginia Polytechnic Institute and State University.
12. Cohen, K., "The Theory of Isotope Separation as Applied to the Large Scale Production of U-235", McGraw-Hill Co., Inc., New York, 1951.
13. "Gas Centrifuge Plant Called Economic Choice", Nuclear News, Vol. 18, No. 13, October, 1975, p. 52.
14. "Conunents on Proposed Legislation to Change Basis for Government Charge for Uranium Enrichment Services", RED-76-30, September 22, 1975.
15. Golan, S.; and Salmon, R., "Nuclear Fuel Logistics", Nuclear News, Vol. 16, No. 2, 1973, p. 50.
45

46
16. Hogeston, John F., "U.S. Uranium Supply and Demand, Near Term and Long Term", Nuclear News, Vol. 18, No. 9, May, 1975, pp. 44-50.
17. Hillier, F. S.; and Lieberman, G. J., "Introduction to Operations Research", Holden-Day, Inc., San Francisco, California, February, 1968.
18. Hadley, G., "Nonlinear and Dynamic Programming", Addison-Wesley Publishing Company, Inc., Massachusetts, 1964.
19. Benedict, M.; and Pigford, T. H., "Nuclear Chemical Engineering", McGraw-Hill Co., Inc., New York, 1957.
20. Nuclear News, Vol 19, No. 9, July 1976, pp. 52-54.
21. Reddy, J. M., "A Model to Schedule Sales Optimally Blended From Scarce Resources", Interfaces, Vol. 6, No. 1, Part 2, November, 1975.
22. Hogerton, J. F., "Uranium Supply in the U. S.: A Current Assess:-ment", Nuclear News, Vol. 19, No. 8, June, 1976, pp. 73-76.
23. Glackin, James J., "The Dangerous Drift in Uranium Enrichment", The Bulletin of the Atomic Scientists, Vol. 32, No. 2, February 1976, pp. 22-29.
24. Mathematical Programming System - Extended (MPSX), and Generalized Upper Bounding (GUB), IBM Program Product Report, September, 1972.
25. Mixed Integer Search Technique Internally Controlled, MISTIC, Standard Oil of New Jersey Proprietary program licensed through Management Science Systems, Inc., 1969.
26. Casper, Barry M., "Laser Enrichment: A New Path to Proliferation", The Bulletin of the Atomic Scientists, Vol. 33, No. 1, January, 1977, pp. 28-41.

APPENDIX I
NUCLEAR FUEL CYCLE
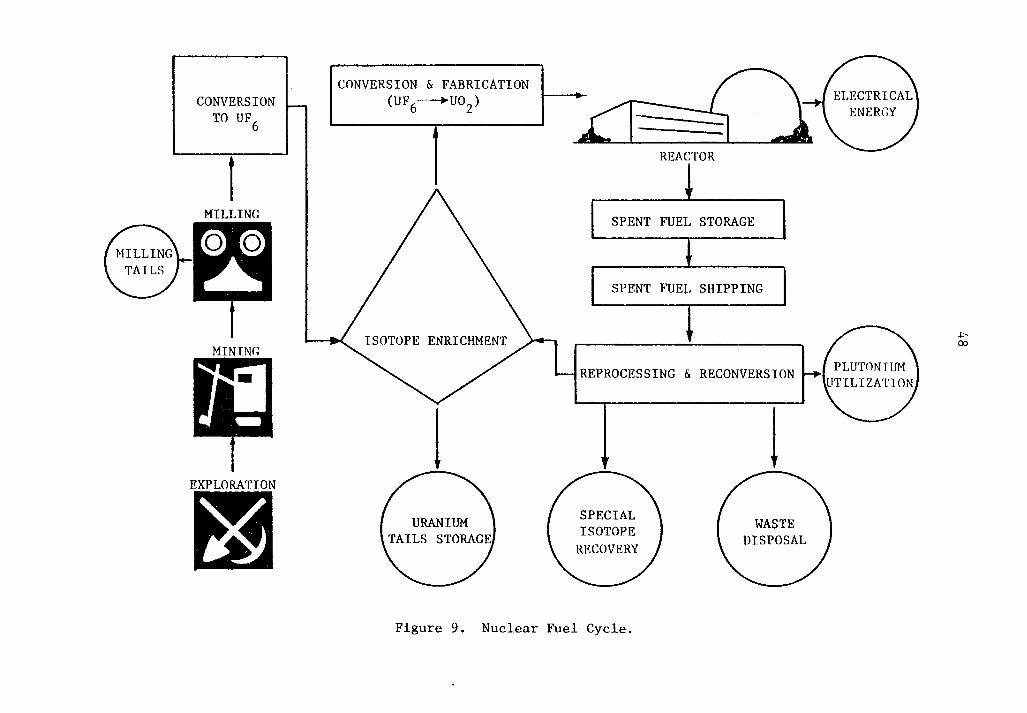
The transformation of uranium from uranium bearing ore into reactor
fuel and its return back to the earth in the form of solid waste is shown
in Figure 9. As indicated in the figure, the nuclear fuel cycle begins
with the exploration and mining of the uranium bearing ore. The low
grade ore is then mechanically and chemically processed to obtain approx-
imately 85 percent pure uranium oxide, u3o8 ("yellow cake"). It takes
up to 500 kilograms of low grade ore to yield one kilogram of "yellow
cake". The "yellow cake" is further purified and chemically converted
into gaseous uranium hexafluoride, UF6 • The uranium hexafluoride is
processed in the enrichment plant where it is mechanically enriched in
the lighter uranium-235 isotope. In the fuel fabrication plant the ura-
nium hexafluoride is chemically converted into uranium dioxide, uo2 and
formed into pellets. The uranium pellets are loaded into zircalloy or
stainless steel tubes which are assembled into matrices known as fuel
assemblies. From the fabrication plant, the fuel assemblies are shipped
to nuclear fuel consumers (reactors). At the nuclear power reactor, the
fuel assemblies are located into the reactor core where the uranium-235
is fissioned and the heat energy produced is transformed, through steam
generation and turbines, to electrical energy. Since only a fraction of
the uranium-235 is fissioned or transmuted, the spent fuel contains
residual uranium-235, radioactive fission products, and plutonium. After
sufficient cooling, the spent fuel is shipped to a reprocessing plant
where the fuel is separated into plutonium and uranium for recycle and
47
CONVERSION TO UF6
t MILLING
MINTNr,
E~
CONVERSION & FABRICATION (uF6--.uo2)
~ /
l ....--
( URANIUM J TAILS STORAGE
I
(
REACTOR
SPENT FUEL STORAGE
SPENT FUEL SHIPPING
I --
REPROCESSING & RECONVERSION
1 ! SPECIAL
J l WASTE ISOTOPE DISPOSAL RECOVERY
Figure 9. Nuclear Fuel Cycle.
+-00

49
solid wastes which are disposed of in a manner which precludes release
to the environment.

APPENDIX II
ENRICHMENT TECHNOLOGIES
Isotopes of an element are identical chemically; therefore, separa-
tion and concentration of a particular isotope must be done by physical
means, utilizing slight differences in the atoms or molecules in which
they are contained. Any physical phenomenon in which a difference in
mass, light absorption, or velocity affects the distribution of the
molecules or atoms can potentially be employed to separate isotopes.
Further discussion of separation techniques in the enrichment of natural
uranium into a larger fraction of uranium-235 is presented below.
Gaseous Diffusion
The gaseous diffusion separation process is based upon the small
differences between the average molecular velocities of the gas molecules
containing uranium-235 and uranium-238. Due to this difference, the
molecules containing the lighter uranium-235 strike the porous membrane
walls of the containment vessel more frequently than the heavier
molecules of uranium-238. Because of the frequency of collisions of
the lighter uranium-235 compounds, on the porous membrane (or "barrier"),
there is a higher rate of diffusion of the uranium-235 compound across
the "barrier" (see Figure 10). The result is a slightly enriched
diffused stream of the lighter uranium-235 compound compared with the
undiffused stream. Graham in 1846 first discovered this separation
technique which was later explained theoretically by Maxwell's kinetic
theory of gases. (6)
50

0
•
0
• 0
• 0
0
•
0
51
CAP IL LARY FLOW In very fine pores, the gas condenses and flows as a liquid to evaporate at the low pressure face. Nonseparative .
SURFACE FLOW Molecules absorb at the high pressure face, migrate as a surface film, and desorb at the low pressure face. This mode of flow can occur in all sizes of pores, but it is especially serious in small pores which
0 have a high ratio of surface/volume. Par-~ially nonseparative.
0
0
•
0
0
0
PURE KNUDSEN FLOW Molecules move completely independently through the pores, colliding only with the pore walls. Separative .
MIXED KNUDSEN FLOW Some collisions occur between molecules within the pores. The effect tends to make both types of molecules move through the pore at the same rate and reduces the separation.
VISCOUS FLOW Viscous flow occurs in relatively large pores and leaks. Collision between mole-cules within the pores is very frequent and the molecules move as a group rather than independently. Nonseparative.
•
Figure 10. Modes of Molecular Flow Through Capillary Media.

52
Uranium hexafluoride (UF6) is the only uranium compound which is
gaseous at convenient temperatures and pressures. Because fluorine has
only one naturally occurring isotope, separation of the UF6 is due
only to the mass difference between uranium-235 and uranium-238. Uti-
lizing this gas, the maximum theoretical separation factor obtainable
by gaseous diffusion is 1.00429. With the theoretical separation factor
so close to unity, the enrichment gain achieved per single stage is
very small. This necessitates the utilization of a cascade consisting
of a number of stages to obtain a significant degree of enrichment
(Figure 11). By utilizing larger equipment to permit a very large
throughput of uranium hexafluoride, the amount of separative work
performed per stage can be quite large.
A term frequently mentioned in discussing isotope separation tech-
niques is separative work. Separative work, as applied to the separa-
tion of uranium isotopes, is a measure of the work required to separate
a given uranium-235 concentration in a feed stream into a product stream
which is more enriched, and a waste stream depleted in uranium-235.
Separative work can thus be used as a "unit" of enriching services
performed by isotope separation facilities. Separative work has the
units of mass and is usually expressed in kilogram units.
Gaseous Centrifuge
Today, the gas centrifuge process is one of the most attractive
alternatives to gaseous diffusion for providing new separation capacity.
The appeal of the gas centrifuge process is based upon the single stage
comparison of the ideal separation factor for uranium-235 and uranium-

53
Gaseous Di ffus:.on Stage.
LOW PRESSURE
U238F 0 • • • 6 • 0 0 • 0
HIGH 0 • 0 • 0 0 PRESSURE 0 • 0 BARRIER • 0 0 0
• 0 0 • 0 0 • 0
o~ • 0 0 0 0 0 0 • 0 • 0 0 • • • • • 0 0 0 FEED • 0 0 DEPLETED 0 • 0 • STREAM 0 • • STREAM • 0 • • 0
U235F 0 0 • • • 0 6
LOW PRESSURE
Stage Arrangement.
DIFFUSER
COMPRESSOR
Figure 11. Gaseous Diffusion Stage and Stage Arrangement. C4)

54
238. In the gaseous diffusion case, the ideal separation factor is
1.0043 compared to 1.055 for a centrifuge having a peripheral speed
of 300 meters per second. (lO)
The countercurrent centrifuge method suggusted by H. C. Urey and
the theory principally developed by K. Cohen is of the most interest. (l2)
This method employs an axial convective circulation (axial counter-
current flow) of uranium hexafluoride gas in a hollow vertical cylinder
rotating about its axis at a high angular velocity. Due to the axial
rotation, the lighter isotope becomes enriched in the vicinity of the
wall, forming an axial concentration gradient.
Countercurrent centrifuges are of two basic types; individual
streamed and internal recirculation (see Figure 12). The advantages of
the countercurrent centrifuge are:
1) Both isotope fractions can be extracted from the periphery
without difficulity, due to the high pressure in this
area·(lO) '
2) A high separation factor can be obtained from each single
unit, thus reducing the amount of gas to be transported be-
tween units;(lO) and
3) The reduction in the number of stages to achieve a given
enrichment. <7,lO)
In theory, the gas centrifuge process is thermodynamically revers-
ible, making it possible to operate a centrifuge plant with far less
power than required for a diffusion cascade. Another advantage is that
the equivalent capacities can be constructed at lower capital costs with
comparable unit costs, as shown in Table 4. The gase centrifuge process,

Individual Streamed Internal Recirculation
Top Bearing I F@iio;RI
Motor •
Figure 12. General Types of Countercurrent Centrifuge.(lO)
Bottom Bearing
Top Scoop
Bottom Scoop
V1 V1

56
Table 4.
Economic Comparison Between 13) Gaseous Diffusion and Gaseous Centrifuge. (
Gas Gaseous Centrifuge Diffusion
3 Plant Size (xlO SWU yr.) 3,100 9,000
Capital Cost ($109)* .13* 3.16
Specific Investment Cost ($/SWU yr.) 365 351
Unit Cost ($/SWU)
Financing 43 35
Operating 27 44
70 79
* Including working capital and interest during construction (cal-culated in 1974 dollars).
57
however, loses its economic appeal as the number of different enrich-
ment levels it can produce increases.
Comparing a 3.1-million-SWU/yr. gas centrifuge plant with a 9-mil-
lion-SWU/yr. gaseous diffusion plant the smaller gas centrifuge plant
can produce enrichments at a cost of $70 per SWU compared to $79 per
SWU for the larger diffusion plant (both calculated in 1974 dollars).
Furthermore, it is predicted that even a 1-million-SWU/yr. gas
centrifuge plant would produce enrichments at only $78 per SWU, still a
dollar less than the product of the larger gaseous diffusion plant. (l3)
Besides the economic advantages of the gas centrifuge process, low
capital requirements and small size, the centrifuge plant uses only one . (13) tenth of the electricity consumed by a gaseous diffusion plant.
Thus the centrifuge process has a lower environmental impact than the
gaseous diffusion process.
Laser Enrichment
Laser enrichment has the advantage of nearly complete separation
of uranium-235 and uranium-238 in a single stage. Currently laser
enrichment research is following two modes of developement. One deals
with utilizing atomic uranium (metallic uranium) as feed, the other
molecular uranium (uranium hexafluoride). The basic ideas for both
modes of development are very much the same; but the engineering
problems they present are very different.
In the atomic approach to laser enrichment ( see Figure 13)
uranium metal is vaporized at a very high temperature (on the order
0 of 2300 C). The uranium vapor containing atoms of uranium-235 and

58
MOLECULAR APPROACH
Icnizeci L'-235 Laser light _I U-235
0
• 0
0 0 0
0 0 0
0
• ~ 0 ~· 0
0
0 0
• • 0
Beam
0 ~' • .,,,o/..;,:_,0 o
U-238
Excited U-235
ATOMIC APPROACH
Excited
0 0
Expanding UF 6 gas 0
° ~ ~ .. /o:.-•• 0. '~ 0
., ~;.~: ·:~ 0 :
0 0
•
Laser
0
EXCITATION REGION
0
0 ~ \ .. ./ 0
0
0
0 .
0
·r 'i IONIZATION
REGION
IONIZATION REGION
0 0
0 • -~
-~
0 0 0
0
0
eO
/ U-238
Collector
Electric Field
•
U235F 6 Collectors
0
0 0
0
Figure 13. Atomic and Molecular Approach to Laser Enrichment.
59
uranium-238 is then exposed to the light from a tunable dye laser of
just the right wave length to excite the atoms of uranium-235 but not
those of uranium-238. The vapor is then illuminated by the light from
a second tunable dye laser which ionizes the excited uranium-235 but not
the unexcited uranium-238. An electric field is then applied to sweep
the charged uranium-235 ions onto collecting plates.
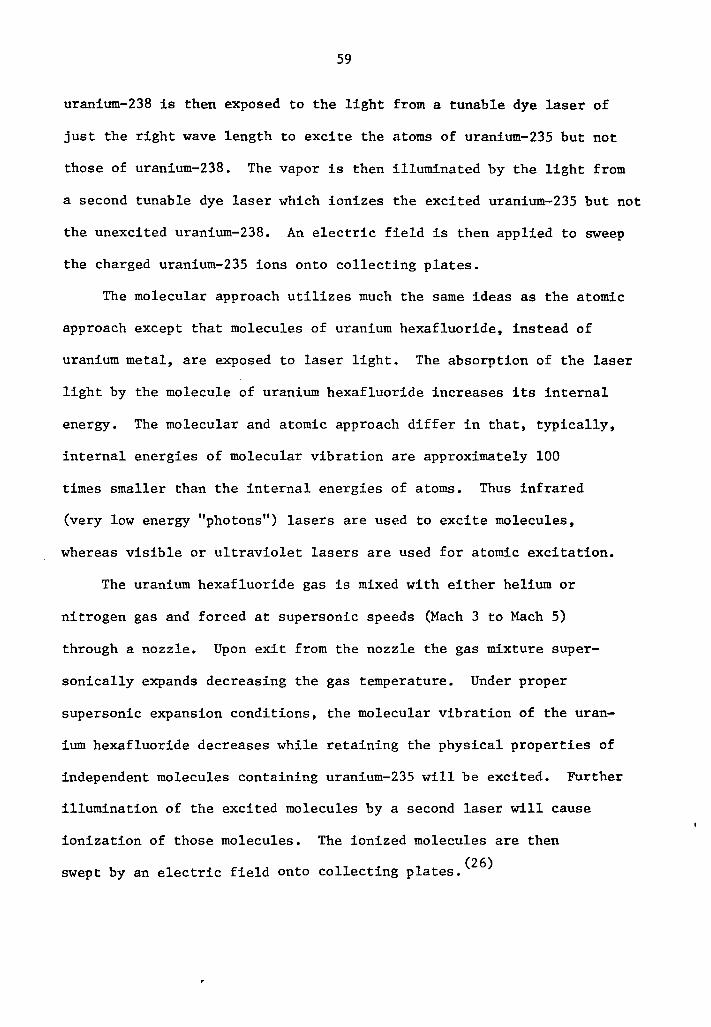
The molecular approach utilizes much the same ideas as the atomic
approach except that molecules of uranium hexafluoride, instead of
uranium metal, are exposed to laser light. The absorption of the laser
light by the molecule of uranium hexafluoride increases its internal
energy. The molecular and atomic approach differ in that, typically,
internal energies of molecular vibration are approximately 100
times smaller than the internal energies of atoms. Thus infrared
(very low energy "photons") lasers are used to excite molecules,
whereas visible or ultraviolet lasers are used for atomic excitation.
The uranium hexafluoride gas is mixed with either helium or
nitrogen gas and forced at supersonic speeds (Mach 3 to Mach 5)
through a nozzle. Upon exit from the nozzle the gas mixture super-
sonically expands decreasing the gas temperature. Under proper
supersonic expansion conditions, the molecular vibration of the uran-
ium hexafluoride decreases while retaining the physical properties of
independent molecules containing uranium-235 will be excited. Further
illumination of the excited molecules by a second laser will cause
ionization of those molecules. The ionized molecules are then . (26) swept by an electric field onto collecting plates.

60
Becker Trennduse or "Nozzle Process
The Becker process utilizes the pressure gradient developed in a
curved, expanding, supersonic jet to achieve separation of a gas mixture
of uranium hexafluoride and hydrogen carrier gas. A schematic of the
separation nozzle stage is shown in Figure 14. The gas mixture is
forced at high velocity between a pair of paring blads, and a semi-
circular groove having a radius of approximately one-tenth millimeter
(0.039 inch). Through a combination of pressure and centrifuge
effects, the heavier isotope of uranium hexafluoride is concentrated
in the vicinity of the groove's wall. The expanding jet of gas is
divided into two fractions by the second blade, one enriched in the
lighter uranium hexafluoride component and the other enriched in the
heavier uranium hexafluoride component. Connecting large numbers of
separation nozzle stages together to form a cascade is necessary to
obtain desired separation.
The Becker process is a high-pressure process. The machined
tolerance of the groove and blade must be one micron (39 millionths
of an inch) in, order to function correctly.
The major disadvantage of the Becker process is the relatively
high power requirements due to the large volume of light gas that
must be recompressed between stages. This is due to the fact that
the efficiency of the Becker process per stage varies with the
percentage of uranium hexafluoride, the greater the degree of enrich-(7 23) ment but the less material that can be enriched. '
61
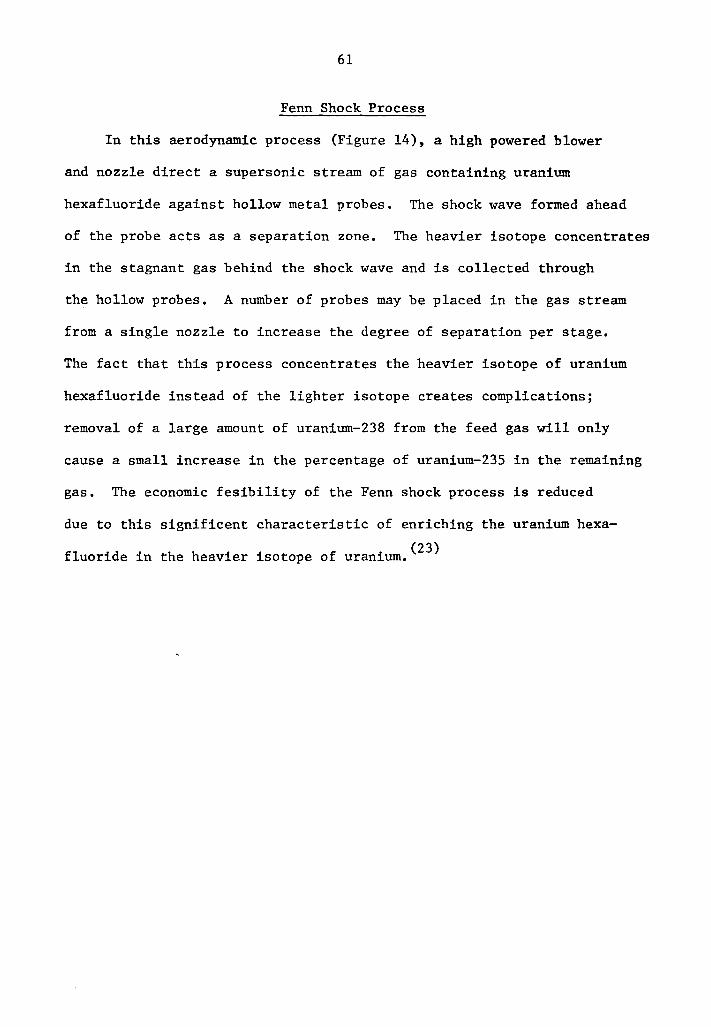
Fenn Shock Process
In this aerodynamic process (Figure 14), a high powered blower
and nozzle direct a supersonic stream of gas containing uranium
hexafluoride against hollow metal probes. The shock wave formed ahead
of the probe acts as a separation zone. The heavier isotope concentrates
in the stagnant gas behind the shock wave and is collected through
the hollow probes. A number of probes may be placed in the gas stream
from a single nozzle to increase the degree of separation per stage.
The fact that this process concentrates the heavier isotope of uranium
hexafluoride instead of the lighter isotope creates complications;
removal of a large amount of uranium-238 from the feed gas will only
cause a small increase in the percentage of uranium-235 in the remaining
gas. The economic fesibility of the Fenn shock process is reduced
due to this significent characteristic of enriching the uranium hexa-
fluoride in the heavier isotope of uranium. <23 )

62
BECK.ER TRENNDUSE OR "NOZZLE" PROCESS
Feed r,as 5 percent UF6 95 percent H2
FENN SHOCK PROCESS
Supersonic Gas Stream
.....___> Detached Thick
Shock
light fraction Heavy fraction
Depleted in U-235 and H2
Enriched in u235 F 6
Figure 14. Becker Trennduse and Fenn Shock Process.
APPENDIX III
MIXED INTEGER PROCEDURE
MISTIC(2S)
MISTIC, !!ixed _!_nteger ~earch I.echnique _!_nternally fontrolled, is
an MPS III proprietary procedure for solving optimization problems
having a mixture of continuous and integer variables. The integer
variables are restricted to values of zero and one. The basic method
used is the branch-and-bound algorithm. <23 )
Formulation of the mixed integer problem is identical to a linear
programming problem except that a unique identifiying character must
be contained in the zero/one integer variable names. The integer vari-
ables must also be defined in the bounds section of the input data as
having an upperbound of 1.0. Continuous variables may be bounded
according to,the normal MPS conventions.
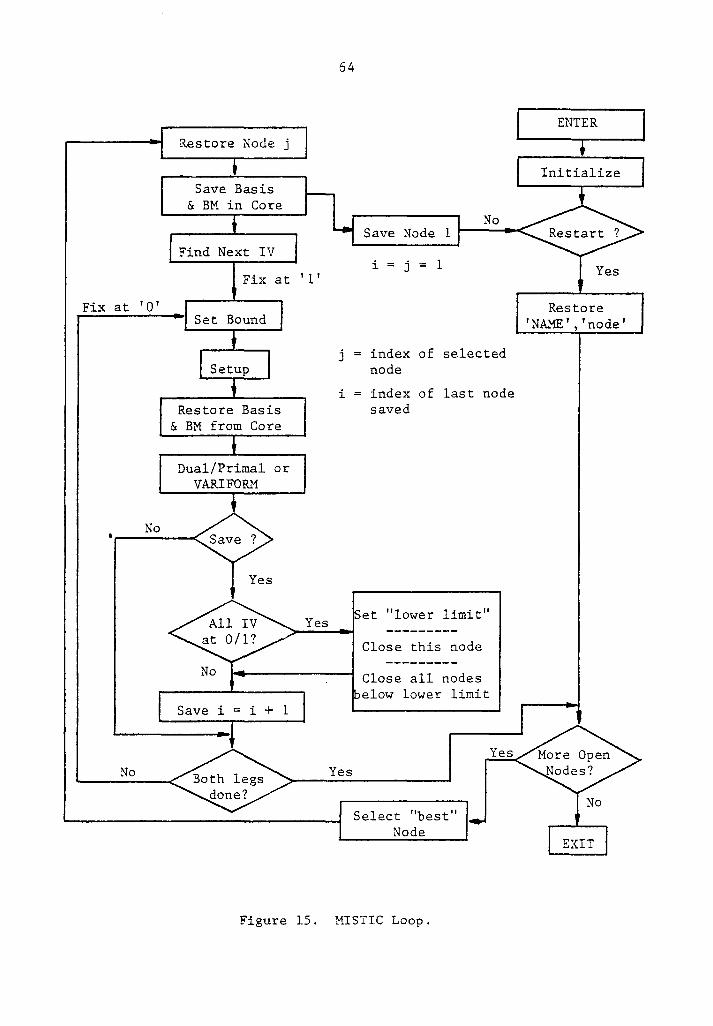
MISTIC incorporates a branch-and-bound enumeration procedure for
finding an optimal solution from a finite number of feasible solutions.
The basic idea of the branch-and-bound technique is the following. As-
sume that the value of the objective function for the best feasible
solution identified thus far, sometimes called the continuous optimal
solution, is available; and that the objective function is to be min-
imized. Once the continuous problem is solved, a branch-and-bound
algorithm is employed to generate partial solutions (nodes) of the
mixed integer problem. The nodes are partitioned into several subsets,
and, for each subset, a lower bound is obtained for the value of the
63
Fix at 'O'
No
Restore Node j
Save Basis & BM in Core
Find Next IV
Fix at 'l'
Set Bound
Restore Basis & BM from Core
Dual/Primal or VARI FORM
Save i = i + 1
Yes
64
ENTER
Initialize
No Save Node 1 1----::::..
j
i
i = j = 1
index of selected node
index of last node saved
et "lower limit"
Close this node
Close all nodes elow lower limit
Select "best" Node
Yes
Restore 'NAME', 'node'
EXIT
Figure 15. MISTIC Loop.

65
objective function of the nodes within that subset. To eliminate a
large number of possible nodes from consideration, those subsets whose
lower bounds exceed the current upper bound on the objective function
are excluded. The remaining subsets are then partitioned further into
several subsets. In turn, these lower bounds are obtained and used to
exclude some of these subsets from consideration. From all of the re-
maining subsets, another one is selected for further partitioning, etc.
This process is repeated until the reduced solution space is exhausted
or a feasible solution is found for which the corresponding value of
the objective function is no greater than the lower bound for any sub-(17,24,25) set. A flow chart of the MISTIC loop is shown in Figure 15.
The following control program demonstrates the use of MISTIC.
PROGRAM INITIALZ MOVE(XDATA,'ENRICH') MOVE(XPBNAME,'BLEND') CONVERT('SUMMARY') SETUP('MIN' ,'BOUND','MIX') MOVE(XOBJ,'MINZ','AV ••• I') MOVE(XRHS,'LIMIT') VARI FORM XPARMAX O. MIS TIC MISTIC('SOLUTION' ,XR1C2) EXIT PEND

The vita has been removed from the scanned document

MINIMIZATION OF BLENDING LOSSES TO DETERMINE OPTIMAL STANDARD
ENRICHMENTS OF NUCLEAR FUEL
by
John Scott Lorber Junior
(ABSTRACT)
Identities, quantities, and costs associated with producing a set
of selected enrichments and blending them to provide fuel for existing
reactors are investicated using on optimization model constructed with
appropriate constraints. Selected enrichments are required for either
nuclear reactor fuel standardization of potintial uranium enrichment
alternatives such as the gas centrifuge. Using a mixed-integer linear
program, th~ model minimizes present worth costs for a 39-product-
enrichment reference case. For four ingredients, the marginal blending
cost is only 0.18 percent of the total direct production cost. Natural
uranium is not an optimal blending ingredient. Optimal values reappear
in most sets of ingredient enrichments.