minimization of environmental emissions through improved process integration
TRANSCRIPT

Heat Recovery Systems & CHP Vol. 10, No. 4, pp. 329-339, 1990 0890-4332/90 S3.00 + .00 Printed in Great Britain Pergamon Press pk
MINIMIZATION OF ENVIRONMENTAL EMISSIONS THROUGH IMPROVED PROCESS INTEGRATION
R. SmPa Department of Chemical Engineering, UMIST, P.O. Box 88, Manchester M60 IQD, U.K.
E. A. PETF.LA Linnhoff March Ltd, Tabley Court, Knutsford, Cheshire WAI6 0PL, U.K.
and
H. D. SPRIGGS Linnhoff March Inc., 2 Cardinal Park, Leesburg, VA 22075, U.S.A.
(Received 2 May 1990)
Aktraet--The problem of process waste whether gas, fiquid or solid is best dealt with by making the procees more efficient in its use of raw materials and energy. Improved process integration can lead to reduced environmental emimons. Once emissions have been r¢cl,_~,¢~__ to an economic minimum, the assessment of alternative waste treatment options must be considered in the content of the overall process. This paper proposes an approach to the minimi~tion of environmental emissions through improved process integration and their treatment in the context of the overall process.
INTRODUCTION
Pinch Technology has established itself as a highly versatile tool for process design. Originally pioneered as a technique for reducing the capital and energy cost of a new plant, Pinch Technology was shown to be readily adapted to the task of identifying the potential for energy saving in existing process plants during the period of rapidly escalating oil prices. More recently it has also become estabfished as a tool for debottlenecking, yield improvement, capital cost reduction and for enhanced flexibility. Given the growing concern for the environment we should now consider whether the power of Pinch Technology can be turned to solve environmental problems.
This paper will address three areas in which Pinch Technology has already been identified as having an important role to play:
(i) flue gas emissions; (ii) waste minimization;
(iii) evaluation of waste treatment options.
In each of these areas Pinch Technology has a unique role to play in that it can be used to evaluate the relevant economic trade-offs.
However, before this can be considered a brief review of Pinch Technology is necessary.
PINCH TECHNOLOGYmA REVIEW
Pinch Technology first identifies sources of heat (termed hot streams) and sinks (termed cold streams) from the material and energy balance of a process. By combining hot streams in given temperature ranges we can produce the 'composite curve' of all hot streams. Similarly, by combining cold streams in given temperature ranges we produce the 'composite curve' of all cold streams. If we plot composite ~ e s on a common temperature-enthalpy axis we can define the energy target for the process as shown in Fig. I. The relative position of the two curves and hence the energy target is fixed by the chosen minimum temperature driving force, AT. . .
The composite curves are used to determine the energy target for a given value of ATm. This minimum driving force will normally be observed at one point only between the hot and the cold composite, called the "pinch", Fig. I. The pinch point has a special significance.
329

330 R. S u r ~ et aL
E
Hot utility target Process
p,nch. //.~1 I \
,,nc, .J /
Cold utility target
Enthalw
Fig. 1. The composite curves allow minimum hot and cold utility to be determined before ~ . The curves also provide the location of the pinch which is of fundamental
importance in design.
Hot target
Cold ~T=-~)t ,.
Enthalpy
Fig. 2. Heat flow across the pinch equals excess heat flow in and out.
To understand this significance we divide the process at the pinch, as in Fig. 2. Above the pinch (in temperature terms) the process is in heat balance with the minimum hot utility, Q ~ , . Heat is received from hot utility and no heat is rejected. The process acts as a heat sink. Below the pinch (in temperature terms) the process is in heat balance with the minimum cold utility, Qc~,. No heat is received but heat is rejected to cold utility. The process acts as a heat source.
If we choose to transfer heat, say 'XP' , from the system above the pinch to the system below, the pinch equation presents the result quantitatively:
A = T + XP. Actual Energy Target Cross Pinch Consumption Heat Flow
In other words, to achieve the energy target set by the composite curves the designer must not transfer heat across the pinch in any of the following forms.
(i) process to process; (ii) use of cold utility above the pinch;
(iii) use of hot utility below the pinch.
These rules, if observed in design, are enough to ensure that the energy target is achieved in practice [1, 2].
All of this is based on a fixed relative position of the composite curves, a fixed A TB. The correct relative location of the composite curves (and hence the correct A T n ) is given by an economic trade-off between capital and energy.
Let us now consider how the composite curves are used to bring captial costs into consideration. The capital cost of a heat recovery system depends mainly on three factors:
(i) the number of separate heat exchange matches (or units); (ii) the total heat exchange area;
(iii) the cost of the utility system necessary to provide the outstanding hot and cold utilities (boiler plant, cooling water system, refrigeration plant, etc.).
The minimum number o f heat exchange matches (or units) depends fundamentally on the number of streams involved and on the pinch location. It can be calculated, prior to design, from equations based on Euler's graph theorem [1, 2].

Pinch Technology 331
The minimum total heat exchange area can also be calculated prior to any network design [3, 4]. The approach is an extension of the standard model for counter-current heat exchange. When we apply the model to the composite curves for the whole process, the equivalent countercurrent condition requires heat to be transferred vertically from the hot composite curves into the cold composite.
Given the relevant algorithms we can now evaluate the trade-off between capital cost and energy recovery, explicitly [5]. The procedure is indicated in Fig. 3. For various values of AT~n (obtained by changing the relative location of the composite curves) we determine the energy target (and hence the hot and cold utility requirements), the overall area required and the number of units. The larger ATm, the larger will be the energy target and the lower the overall heat transfer area. This information is combined and is used to predict ahead of design the overall cost for each AT,~. The lowest possible overall cost is clearly established, Fig. 3.
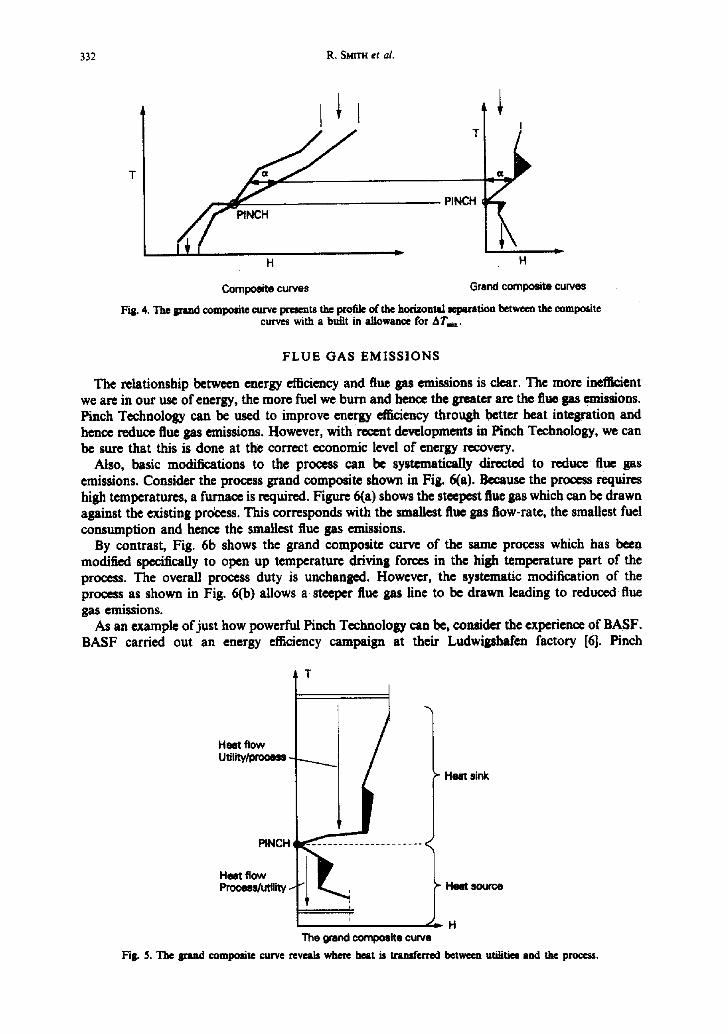
The composite curves show us the scope for energy recovery and the hot and cold utility targets. Generally, a number of different utilities at different temperature levels and of different cost are available to the designer. Another Pinch Technology tool, the grand composite curve, helps the designer select the best individual utility or utility mix. The grand composite curve presents the profile of the horizontal (enthalpy) separation between the composite curves with a built-in allowance of AT~o. As illustrated in Fig. 4 its construction involves bringing the composite curves together vertically (to allow for A T e ) and then plotting the horizontal separation (a in Fig. 4).
Figure 5 shows how the grand composite curves reveals where heat is to be transferred between utilities and process and where the process can satisfy its own heat demand.
But how can all this be used to solve environmental problems?
J . . . . f
I I
I ' "l
H
~ Total
AT~
~ Ener~
aM a ~
(Optimum) Fig. 3. Capital and energy cost targets allow the capital-energy trade-off to be established ahead of design.
332 R. S~TH et al.
T / J
Y : P I N C H
H
PINCH
Composite curves
H
Grand comlx~te curves
Fig. 4. The Brand compomte curve presents the profile of the horizontal separation between the composite curves with a built in allowance for ATm.
F L U E GAS E M I S S I O N S
The relationship between energy efficiency and flue gas emissions is clear. The more inefficient we are in our use of energy, the more fuel we burn and hence the grater are the flue gas emissions. Pinch Techno logy can be used to improve energy efficiency through better heat integration and hence reduce flue gas emissions. However, with recent developments in Pinch Technology, we can be sure that this is done at the correct economic level of energy recovery.
Also, basic modifications to the process can be systematically directed to reduce flue gas emissions. Consider the process grand composite shown in Fig. 6(a). Because the process requires high temperatures, a furnace is required. Figure 6(a) shows the steepest flue gas which can be drawn against the existing probess. This corresponds with the smallest flue gas flow-rate, the smallest fuel consumption and hence the smallest flue gas emissions.
By contrast, Fig. 6b shows the grand composite curve of the same process which has been modified specifically to open up temperature driving forces in the high temperature part of the process. The overall process duty is unchanged. However, the systematic modification of the process as shown in Fig. 6(b) allows a. steeper flue gas line to be drawn leading to reduced flue gas emissions.
As an example of just how powerful Pinch Technology can be, consider the experience of BASF. BASF carried out an energy efficiency campaign at their Ludwigshafen factory [6]. Pinch
Heat flow Utilitv/Iorooe~ -
PINCH,
Heat flow Process/utility.
T
> H e ~ sink
~ ' - ' - - - - . . . . . . H ~ ~
- H The grand composlte curve
Fig. 5. The Band composite curve reveals where heat is transferr~ between utilities and the process.

Pinch Technology 333
1
/ Process grand composite
" H
(a) Rue gas matched against the process is limited by the process above the pinch
I
Process grand composite
D H
(b) The modified process allows s steeper flue gas line which gives a reduction in fuel and emissions
. even though the process duty has not changed Fig. 6. The grand composite curve allows the minimum flue gas to be established.
Technology was used to increase energy efficiency of the individual chemical processes on the site. Individual projects were justified on the basis of their energy saving potential only, with a required simple payback of one year or less. The total energy saved was 790 MW [6]. Figure 7 shows this change graphically and how it was achieved against a background of increased production levels. However, the following environmental relief resulted from reduced power station emissions on the site [6]:
carbon dioxide sulphur dioxide nitrogen oxides ash carbon monoxide waste water from water treatment
218 re/hour 1.4 te/hour 0.7 re/hour 21 kg/hour
7 kg/hour 70 re/hour.
Remarkable though these reduced emissions are, they are even more remarkable when we consider that they are associated with improved profitability.
Production and energy consumption [basis 1970 = 100)
170 -
100112010 - - ~ / . , , ~.Electdcal.,,. ~.E~.e~];/co?su consumption._.
8 o - \ "~ ../~ \ ~.."'--.. . . . . . . . ',, ._ \ v \ 70
l- Coal and oil for " . : l ~ steam and electricity " - ," 40 "'-o'°" 3O 2O 10
o I i I 1970 1975 1980 1985
Fig. 7. Pinch technology achieved considerable energy savings on the BASF site at Ludwigdtafen against the background of increased levels of production.

334 R. SMITH et al.
Pinch Technology can be used to establish the appropriate economic level of energy recovery given the trade-off between energy and capital. How then do we include environmental relief into the trade-offs?
At the moment there is no cost associated with the emission of greenhouse gases such as carbon dioxide and those which cause more direct environmental damage such as sulphur dioxide. If the regulatory bodies responsible for environmental emissions are to impose restrictions on sulphur dioxide then this requires switching to an alternative (more expensive) fuel or the installation of flue gas desulphurization plant. Here Pinch Technology can be used to evaluate the trade-offs between reduced energy consumption, investment in heat recovery systems for improved energy efficiency and investment in flue gas clean-up.
Similar trade-offs for carbon dioxide emissions cannot be carried out unless a "carbon tax" is introduced to avert the greenhouse effect. However, the regulatory bodies responsible for environmental emissions could use Pinch Technology to target emissions rather than target energy consumption.
For a given set of process heating and cooling demands, there is an energy target for a given setting of the capital/energy trade-off. This energy target together with a given fuel and type of combustion equipment results in a minimum flue gas emission. Thus, once the type of fuel and combustion equipment has been set the minimum flue gas emission is set by the process heating and cooling demands and by the capital/energy trade-off for heat recovery. Pinch Technology could thus be used to set practical and economically based targets for flue gas emissions.
Such targets could then be used, for example, to screen alternative process options, to compare centralized power generation with local cogeneration, etc., or to impose a "carbon tax" on these companies which did not meet their targets.
WASTE MINIMIZATION
The problem of process waste whether gas, liquid or solid is best dealt with by making the process more efficient in its use of raw materials; that is by waste minimization.
Here, both the reaction and separation technology have a key role to play. Sometimes it is possible to reduce the formation of unwanted byproducts in the reactor (which must ultimately be disposed of) by modifying the reactor technology. More often it is possible to minimize waste by changes to the separation system. If the separation systems can be made more effu2ient such that useful materials can be separated and recycled more effectively, this will have the dual benefit of both reducing waste disposal costs and reducing raw materials costs.
Many separation processes are driven by the input of heat such as distillation and evaporation. Others may be driven by the removal of heat such as condensation and some crystallization operations. If the separation system as a whole requires the addition or removal of heat, then Pinch Technology has an important role to play. Now we are not just dealing with a trade-off between capital and energy, but a trade-off between capital, energy, raw materials costs and waste disposal costs. Without the benefit of Pinch Technology, such trade-offs are difficult or impossible to perform.
Figure 8 shows part of a fine chemical process. Two feeds (FI and F2) are reacted together in a stirred tank. The reactor contents are cooled to cooling water temperature causing the product to crystallize out of solution. The crystalline product is then separated by filtration. The liquor remaining after filtration is disposed of to effluent. The treatment costs associated with the effluent in Fig. 8 were considerable. Two alternative means were sugsested to increase the efficiency of the separation systems in order to decrease the amount of product lost to effluent and thereby reduce the effluent treatment costs.
(i) Firstly, cooling below cooling water temperature using a refriFrated cooler after the cooling water to cause a greater proportion of the product to crystallize. This involved the installation of a new refrigeration plant together with the high electricity costs of running the refrigeration plant.
(ii) Secondly, taking the liquor from the filter in Fig. 8 and feeding it to an evaporator. Evaporating part of the liquor again causes a greater proportion of the product to crystallize.

Pinch Technology 335
F1 = F2
10 b a r ~ - -
2 bar L
Reactor I - CW
F i l t e r ( ~ , CW _
Product Fig. 8. A fine chemicals process.
Further filtration is then required . In this case, the existing filter could be used because the process was batch in operation. In addition to the capital cost of the evaporator, the scheme requires considerable extra steam to run the evaporator. Unfortunately, both of these schemes would cause an increase in energy costs in exchange for a decrease in effluent and raw materials costs. There seems to be no way out of this effluent treatment problem without an increase in production costs. Pinch Technology was then used to analyze this problem.
Steam at 10 bar pressure was originally used to heat the reactor in Fig. 8 even though a lower pressure (e.g. 2 bar) would have been adequate. This is clearly shown by the grand composite curve (Fig. 9) which plots actual required processing temperatures rather than "existing practice". Instead, in Fig. 10 the 10 bar steam has been used in the evaporator, which operates at 2 bar. The steam from the evaporator at 2 bar pressure is used to heat the reactor. Thus, the evaporator has been used to increase the product recovery and decrease effluent treatment costs without any increase in energy costs.
There is no increase in energy costs. Raw materials and effluent treatment costs have both been reduced.
10 berg steam (184 C)
Evaporator J
2 be~ 8team (134 C)
H
Fig. 9. The grand composite of the fine chemic~ process indicates that an evaporator can be used to reduce effluent treatment costs without an increase in energy consumption.

336 R. SMITH et al.
F 1 F....~.2
10 =bar = CW
Fi l te~ Cw
V Product
Effluent
T
2 bar
Fig. 10. Final flowsheet for the fine chemicals process.
WASTE TREATMENT
Waste minimization at source is dearly the best way to deal with effluent problems, However, there comes a point when further waste minimization becomes uneconomic, or simply not possible, and we must resort to waste treatment.
At this stage there will often be more than a single option to treat the effluent. The decision as to which option to pursue would be based on several factors such as:
(i) whether the scheme recovers material for recycle (or re-use), or whether the original pollutant is simply destroyed or converted to less harmful material;
(ii) the capital cost of the effluent treatment plant; (iii) the running cost of the effluent plant.
The conventional way of assessing the best method for d u e n t treatment is to consider the effluent plant in isolation from the existing process plant and to carry out a cost/benefit analysis for each alternative scheme.
If during the 10 years or so that process integration techniques have been practiced, any one lesson has been learned from this field, it is that individual unit operations should not be considered in isolation. By drawing boundaries around unit operations many potential benefits of integration can be lost. The lesson of process integration is to draw the boundaries as wide as possible and look for integration potential. Should we not, therefore, apply this lesson to effluent treatment plants in order to discover latent benefits hidden from us by considering effluent treatment in isolation?
Take the simple situation where we have an effluent in the form of an air stream laden with, say, a solvent. An initial market survey reveals that there are two particularly strong candidates for effluent treatment (others are available but much less likely to be worthwhile). The two strong candidates are firstly water scrubbing followed by distillation to recover the solvent, and secondly incineration. Incineration, in addition to destroying the solvent, can also supply steam from a waste heat recovery unit. Which option is best? On the face of it we might consider that we have sufficient information given the cost of each plant, the value of recovered solvent and the cost of steam. But are we missing potentially valuable information?
Consider the same problem through Pinch Technology. Since Pinch Technology has taught us not to consider systems in isolation we stand back and, as a minimum, consider the process plant to which the effluent treatment facility is to be added. Cn'and composite curves are used to give a graphic display of the energy cascade through the process. Fig. 1 l(a) shows the grand composite curves for the scrubbing/distillation option. The incineration option is shown in Fig. 1 l(b). Figure 12 shows the grand composite curve for the process.

Pinch Technology 337
T*
H {a) Grand composite curve for scrubbing
and distillation
T"
H (b) Grand composite curve for incineration
Fig. I 1. The grand composite curves for the two alternative waste treatment processes.
Superimposing the grand composite curves of the treatment options on the grand composite curve of the process allows the scope for integration to be quantified. Figure 13(a) shows the potential for integration between the process and the incineration plant should that option be pursued. The shaded area in Fig. 13(a) shows where waste beat from the process is useful heat for the process plant. Note that the profile of the waste treatment process is shown in mirror image. Assuming that direct heat transfer is not desirable (or even possible) then line XX defines the optimum steam level for maximum useful heat recovery. This l~vel is not likely to be where existing steam mains are. Figure 13(b) shows what often happens in practice. Line YY now represents the site steam header pressure. Clearly much useful heat is being lost due to the constraint of the existing steam distribution system and the operating economics are different in these two eases shown in Figs 13(a) and 13(b).
Consider now the option of integrating the process plant with the scrubbing/distillation plant. Superimposing these grand composites in Fig. 14(a) again shows the potential for integration. However, another lession of process integration is that process modification can be used to provide increased potential benefits [7]. Inspection of the grand composite curve for the scrubbing/ distillation process in Fig. 1 l(a) shows a typical system dominated by a single distillation operation. The operating conditions of the distillation process had, in this case, been set so as to use cooling water in the overhead condenser. An increase in the operating pressure of the distillation process would essentially allow the entire grand composite curve in Fig. 1 l(a) to rise in the temperature scale. Figure 14(b) now shows the grand composite of the process plant with a high pressure distillation process. The shaded area now shows much greater potential for integration.
In both of the above eases, substantial reductions in operating costs were shown to be possible by correctly integrating the effluent treatment plant into the process plant which it serves.
In many instances this type of analysis will clearly demonstrate that one of the effluent treatment options can be made far more cost effective than the other options. In some cases the option so selected may not have been the one chosen if this analysis had not been carried out.
Whilst this example is simple, significant benefits could be realized from a study of the process and the effluent treatment options using the analytical power of Pinch Technology.
D
H
Fig. 12. Grand composite curve for the process. An air-stream laden with solvent requires treatment.

338
T-t xL 28 r0--m f/J'~
H (a) Integration between the incinerator
end the process via. steam mains at 2.8 berg,
, T*4 Heat recovery into existing
system limited by existing prenure
- - 110.3 berg steam
H
(b) Integration between the incinerator end the process vie existing steam mains at 10.3 berg.
Fig. 13. Integration between the incinerator and the process.
R. SMITH etal.
Effluent treatment/ process recover/
IlL H
(a) Integration between the scrubbing and diistilation effluent treatment end the process
T*
Effimmt treatment/ process recovery
H
(b) I n ~ F o t ~ between the effluent t m m m m end the p m ~ m w ~ the tmotmmt plato o l x ~ st higher pressure
Fig. 14. Intcl~tion betweca the scrubbing and distillation effluent treatment plant and the process.
In reality, however, the problem is rarely so simple. There may be many plants on a site and many treatment options. The real power of Pinch Technology is in its ability to reduce even the most complex series of operations into a simple set of easily interpreted curves.
Many examples are available where this analytical procedure was not carried out and as a result the correct option was not chosen. For example, an operator of a large petrochemical plant chose to incinerate the gaseous effluents because the plant steam balance showed an import of 20 t/h of steam. Incineration would provide the necessary s~am. An alternative would have been a refrigeration plant which would have recovered much of the affluent for recycle. A process integration study carried out a few years later showed that the majority of this original shortfall in steam could have been removed by simple heat recovery projects having very short paybacks.
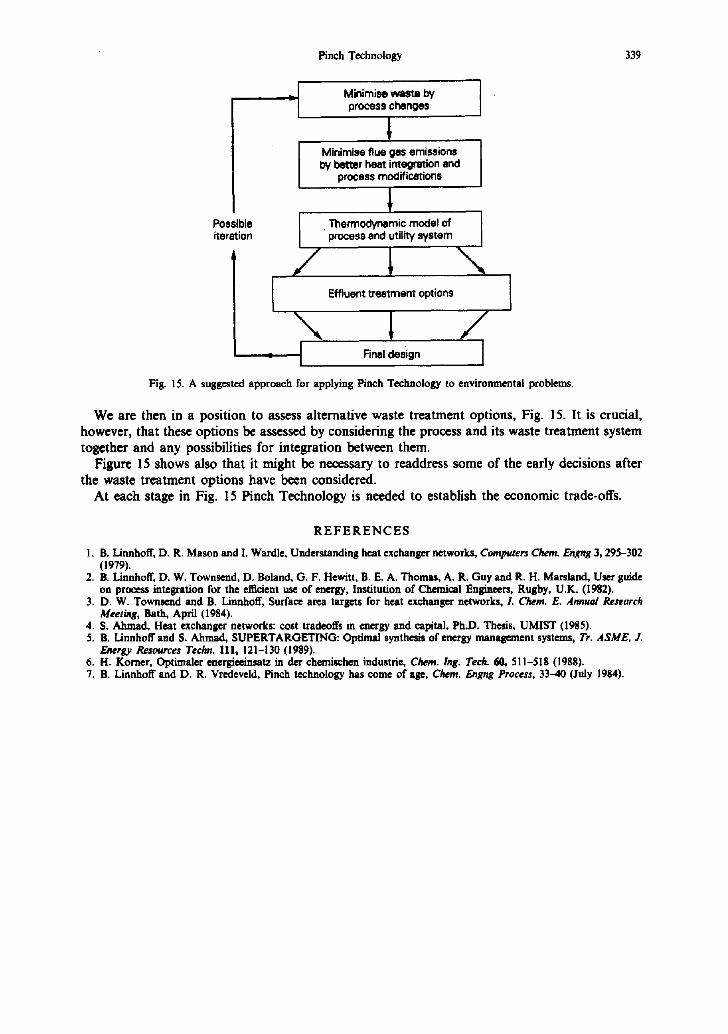
A S U G G E S T E D A P P R O A C H
Figure 15 summarizes a suggested approach for applying Pinch Technology to environmental problems. Clearly the place to start is waste minimization. It might not always be simplest to solve environmental problems at source by waste minimization but it is usually the most satisfactory solution in the long term. Reducing the problem at source by modifications to the process reaction and separation technology has the dual benefit of reducing raw material and effluent treatment costs. Once the possibilities for waste minimization have been exhaused by process modifications the minimum flue gas emission can be established, Fig. 15. Further process modifications might be required to achieve this as indicated in Fig. 6. This establishes the thermodynamic model for the process and utility system.
Pinch Technology 339
Possible iteration
_I Minimise warm by [ - I process changes J
Minimise flue gas emissions by better heat integration and
process modifications
process and utility system
/ ",,, !
treatment options J Effluent !
" , 1 ..//. J Final design J I
Fig. 15. A suggested approach for applying Pinch Technology to environmental problems.
We are then in a position to assess alternative waste treatment options, Fig. 15. It is crucial, however, that these options be assessed by considering the process and its waste treatment system together and any possibilities for integration between them.
Figure 15 shows also that it might be necessary to readdress some of the early decisions after the waste treatment options have been considered.
At each stage in Fig. 15 Pinch Technology is needed to establish the economic trade-offs.
R E F E R E N C E S
1. B. Linnhoff, D. R. Mason and I. Wardle, Understanding heat exchanger networks, Computers Chem. Engng 3, 295-302 (1979).
2. B. Linnhoff, D. W. Townsend, D. Boland, G. F. Hewitt, B. E. A. Thomas, A. R. Guy end R. H. Marsland, User guide on process integration for the efficient use of energy, Institution of Chemical Engineers, Rugby, U.K. (1982).
3. D. W. Townsend and B. Linnhoff, Surface area targets for heat exchanger networks, I. Chem. E. Annual Research Meeting, Bath, April (1984).
4. S. Abroad, Heat exchanger networks: cost tradeoffs in energy and capital, Ph.D. Thesis, UMIST (1985). 5. B. Linnhoff and S. Ahmad, SUPERTARGETING: Optimal synthesis of energy management systems, Tr. ASME, J.
Energy Resources Techn. 111, 121-130 (1989). 6. H. Korner, Optimaler energieeinsatz in der chemischen industrie, Chem. Inz. Tech. 60, 511-518 0988). 7. B. Linnhoff and D. R. Vredeveld, Pinch technology has come of age, Chem. Engng Process, 33-40 (July 1984).