minimize volatility to maximize the benefits of real assets
TRANSCRIPT
RAAX® VanEck Inflation Allocation ETF
June 2021
Minimize Volatility to Maximize the Benefits of Real Assets

This material does not constitute an offer to sell or solicitation to buy any security, including shares of any Fund. An offer or solicitation will be made only through a Fund’s prospectus or summary prospectus and willbe subject to the terms and conditions contained therein. This material and the information provided herein are not directed at or intended for distribution to any person (or entity) who is a citizen or resident of (orlocated or established in) any jurisdiction where the distribution of these materials and/or the purchase or sale of interests of a Fund would be contrary to applicable law or regulation or would subject a Fund to anyregistration or licensing requirement in such jurisdiction. Persons who wish to review this material are required to inform themselves about and to observe any legal or regulatory restrictions which may affect theireligibility to make an investment in a Fund. Professional advice should be sought in cases of doubt.
THIS MATERIAL MAY ONLY BE PROVIDED TO YOU BY VANECK AND IS FOR YOUR PERSONAL USE ONLY AND MUST NOT BE PASSED ON TO THIRD PARTIES WITHOUT THE PRIOR EXPRESSWRITTEN CONSENT OF VANECK. IF YOU HAVE NOT RECEIVED THIS MATERIAL FROM VANECK, YOU ARE HEREBY NOTIFIED THAT YOU HAVE RECEIVED IT FROM A NON-AUTHORIZED SOURCETHAT DID NOT ACT ON BEHALF OF VANECK AND THAT ANY REVIEW, USE, DISSEMINATION, DISCLOSURE OR COPYING OF THIS MATERIAL IS STRICTLY PROHIBITED. BEFORE MAKING ANINVESTMENT DECISION, PLEASE CONSULT A QUALIFIED INVESTMENT AND TAX ADVISOR.
Any projections, market outlooks or estimates in this material are forward-looking statements and are based upon certain assumptions that are solely the opinion of VanEck. Any projections, outlooks or assumptionsshould not be construed to be indicative of the actual events which will occur. Further, any information regarding portfolio composition, portfolio composition methodology, investment process or limits, or valuationmethods of evaluating companies and markets are intended as guidelines which may be modified or changed by VanEck at any time in its sole discretion without notice.
The performance data quoted represents past performance. Past performance is not a guarantee of future results.
Forecasts, estimates, and certain information contained herein are based upon proprietary research and the information contained in this material is not intended to be, nor should it be construed or used asinvestment, tax or legal advice, any recommendation, or an offer to sell, or a solicitation of any offer to buy, an interest in any security. References to specific securities and their issuers or sectors are for illustrativepurposes only and are not intended and should not be interpreted as recommendations to purchase or sell such securities or gain exposure to such sectors. The Fund(s) may or may not own the securities or beexposed to the sectors referenced and, if such securities are owned or exposure maintained, no representation is being made that such securities will continue to be held or exposure maintained.
Diversification and asset allocation do not assure a profit nor protect against loss.
An investment in the Funds may be subject to risks which include, among others, in fund of funds risk which may subject the Funds to investing in commodities, gold, natural resources companies, MLPs, realestate sector, infrastructure, equities securities, small- and medium-capitalization companies, foreign securities, emerging market issuers, foreign currency, credit, interest rate, call and concentration risks,derivatives, cryptocurrency, cryptocurrency tax, all of which may adversely affect the Fund. The Funds may also be subject to affiliated fund, U.S. Treasury Bills, subsidiary investment, commodity regulatory (withrespect to investments in the Subsidiary), tax (with respect to investments in the Subsidiary), risks of ETPs, liquidity, gap, cash transactions, high portfolio turnover, model and data, management, operational,authorized participant concentration, no guarantee of active trading market, trading issues, market, fund shares trading, premium/discount and liquidity of fund shares, and non-diversified risks. . Foreigninvestments are subject to risks, which include changes in economic and political conditions, foreign currency fluctuations, changes in foreign regulations, and changes in currency exchange rates which maynegatively impact the Funds’ returns. Small- and medium-capitalization companies may be subject to elevated risks. Funds shares are not individually redeemable and will be issued and redeemed at their NAV onlythrough certain authorized broker-dealers in large, specified blocks of shares called “creation units” and otherwise can be bought and sold only through exchange trading. Shares may trade at a premium or discountto their NAV in the secondary market. You will incur brokerage expenses when trading Funds shares in the secondary market. Past performance is no guarantee of future results. Returns for actual Fundsinvestments may differ from what is shown because of differences in timing, the amount invested and fees and expenses. Please see the prospectus of each Fund for more complete informationregarding each Fund's specific risks.
Investing involves substantial risk and high volatility, including possible loss of principal. Bonds and bond funds will decrease in value as interest rates rise. An investor should consider the investment objective, risks, charges and expenses of the Fund carefully before investing. To obtain a prospectus and summary prospectus, which contains this and other information, call 800.826.2333 or visit vaneck.com. Please read the prospectus and summary prospectus carefully before investing.
See index descriptions at the end of this presentation.
Non-VanEck proprietary information contained herein has been obtained from sources believed to be reliable, but not guaranteed. No part of this material may be reproduced in any form, or referred to in any other publication, without express written permission of VanEck.
VanEck Securities Corporation, Distributor 666 Third Avenue, New York, NY 10017 800.826.2333
©VanEck.
ETF disclosure
2
3
Table Of Contents
VanEck’s Real Asset Capabilities 4
Quantitative Investment Solutions 7
Why Real Assets? 11
RAAX Process 16
Allocations and Performance 22

Real AssetCapabilities
4
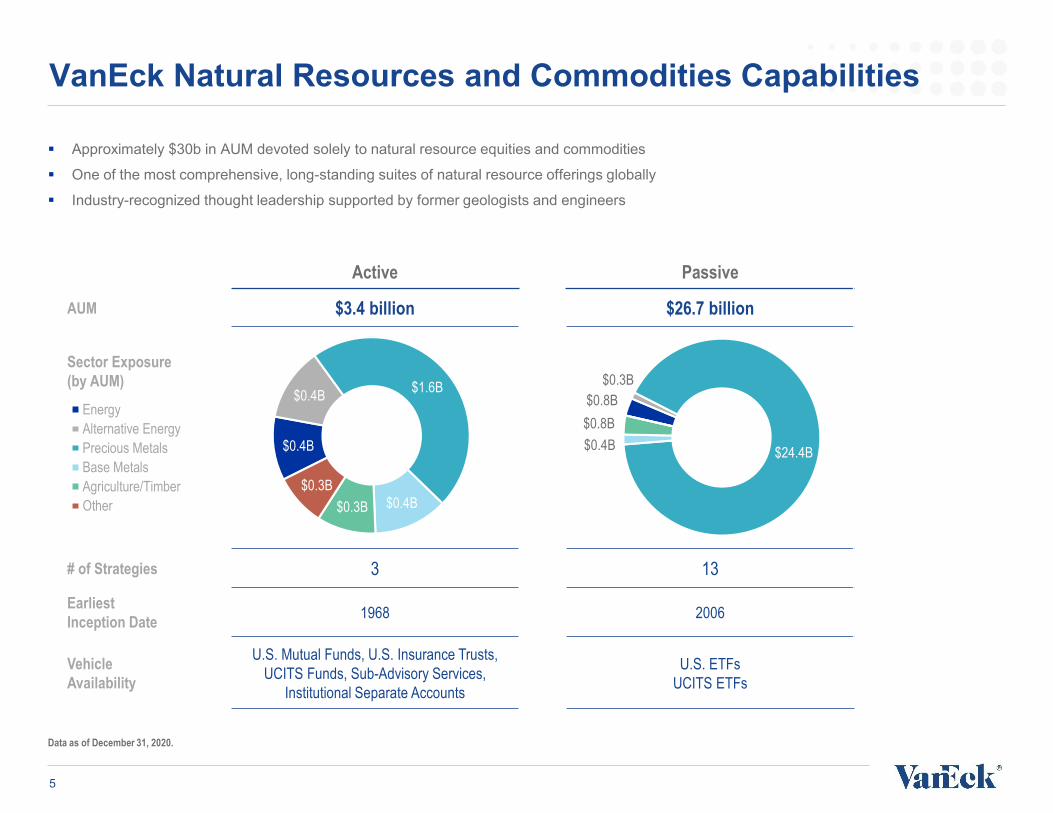
VanEck Natural Resources and Commodities Capabilities
Active Passive
AUM $3.4 billion $26.7 billion
Sector Exposure (by AUM)
# of Strategies 3 13
EarliestInception Date 1968 2006
Vehicle Availability
U.S. Mutual Funds, U.S. Insurance Trusts, UCITS Funds, Sub-Advisory Services,
Institutional Separate Accounts
U.S. ETFsUCITS ETFs
Approximately $30b in AUM devoted solely to natural resource equities and commodities
One of the most comprehensive, long-standing suites of natural resource offerings globally
Industry-recognized thought leadership supported by former geologists and engineers
Data as of December 31, 2020.
$0.4B
$0.4B $1.6B
$0.4B$0.3B$0.3B
EnergyAlternative EnergyPrecious MetalsBase MetalsAgriculture/TimberOther
$0.8B$0.3B
$24.4B$0.4B$0.8B
5

VanEck Solutions
Symbol Name
Gold/Precious Metals
Traditional Energy
Alternative Energy
Base Metals Agriculture
Strategic/Rare Earth
Metals MLPsInfra-
structure REITs
CRAK Oil Refiners ETF ■
EINC Energy Income ETF ■ ■
FRAK Unconventional Oil & Gas ETF ■
GDX Gold Miners ETF ■
GDXJ Junior Gold Miners ETF ■
HAP Natural Resources ETF ■ ■ ■ ■ ■ ■
MOO Agribusiness ETF ■
NLR Uranium+Nuclear Energy ETF ■ ■
OIH Oil Services ETF ■
OUNZ VanEck Merk Gold Trust ■
RAAX Inflation Allocation ETF ■ ■ ■ ■ ■ ■ ■ ■
REMX Rare Earth/Strategic Metals ETF ■
SLX Steel ETF ■
SMOG Low Carbon Energy ETF ■
VanEck offers a complement of passive approaches spanning broad applications to more isolated exposures
RAAX provides access to real assets using many of VanEck’s existing solutions
6

Quantitative Investment Solutions (QIS)
7
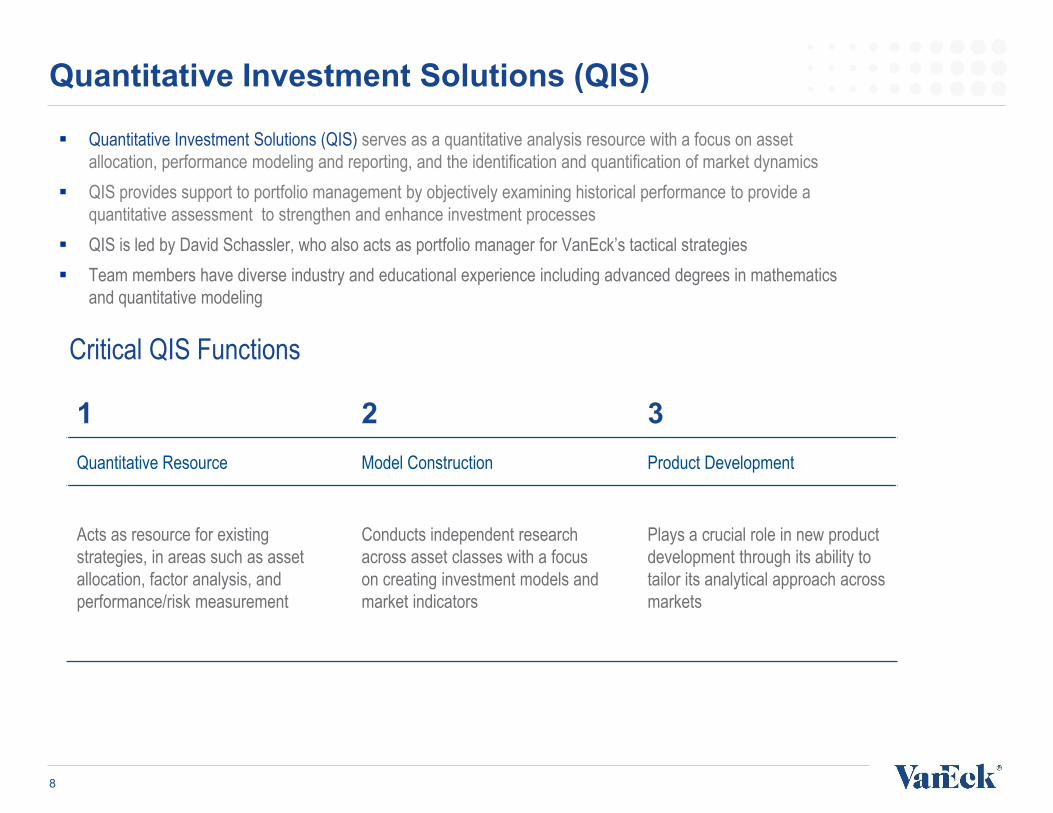
Quantitative Investment Solutions (QIS)
Quantitative Investment Solutions (QIS) serves as a quantitative analysis resource with a focus on asset allocation, performance modeling and reporting, and the identification and quantification of market dynamics
QIS provides support to portfolio management by objectively examining historical performance to provide a quantitative assessment to strengthen and enhance investment processes
QIS is led by David Schassler, who also acts as portfolio manager for VanEck’s tactical strategies Team members have diverse industry and educational experience including advanced degrees in mathematics
and quantitative modeling
Critical QIS Functions
1 2 3Quantitative Resource Model Construction Product Development
Acts as resource for existing strategies, in areas such as asset allocation, factor analysis, and performance/risk measurement
Conducts independent research across asset classes with a focus on creating investment models and market indicators
Plays a crucial role in new product development through its ability to tailor its analytical approach across markets
8
Quantitative Investment Solutions (QIS)
David Schassler, Head of Quantitative Solutions, Portfolio Manager Investment Management Team member since 2012
Previously served as Director of Manager Research and Investment Committee Member for VanEck’s multi-manager alternative strategies.
Prior to joining VanEck, served as Director and Portfolio Manager within the UBS Portfolio Strategy Group; responsible for multi-manager global asset allocation portfolios.
MBA, Finance, Leonard N. Stern School of Business, New York University; BS, Business Economics, State University of New York at Cortland
John Lau, Deputy Portfolio Manager Investment Management Team member since 2012
Prior to his current role, served as Analyst for VanEck’s multi-manager alternative strategies.
BS, Business Administration (concentration in Financial Analysis), State University of New York at Buffalo
9
Quantitative Investment Solutions (QIS)
Barak Laks, Quantitative Analyst Quantitative Analyst for VanEck active and passive investment strategies
Joined VanEck in 2017
Prior to joining VanEck, Chief Investment Officer and Chief Marketing Officer with several hedge funds
MS, Mathematics, New York University
MS, Financial Mathematics, New York University
BA, Mathematics and Economics, Yale University
Joseph Schafer, Quantitative Analyst Quantitative Analyst for VanEck active and passive investment strategies
Joined VanEck in 2011
Prior to his current position, served as quantitative analyst and project manager at VanEck
MA, Statistics, Columbia University
MBA, Loyola University
BBA, Finance, Loyola University
10
Why Real Assets?
11

Our view on real assets and why?
Please see important disclosures at the beginning of this presentation.
Real assets includes commodities, natural resource equities, gold, bitcoin, MLPs, REITs, and Infrastructure
An allocation to real assets can play three key roles in a portfolio:
As a hedge to inflationary pressure
As a leverage to global growth
As a portfolio diversifier
Income Assets
Portfolio diversification which also provides alternative source of income
• MLPS• Infrastructure• REITS
Financial Assets
Protection from currency debasement and store of value
• Gold Bullion• Gold Mining Equities• Bitcoin
Resource Assets
Critical inputs in economic engine with equity growth potential
• Diversified Commodities• Low Carbon Energy Equities• Global Metals & Mining Equities• Steel Equities• Unconventional Oil & Gas Equities• Oil Services Equities• Energy Equities• Agribusiness Equities
12
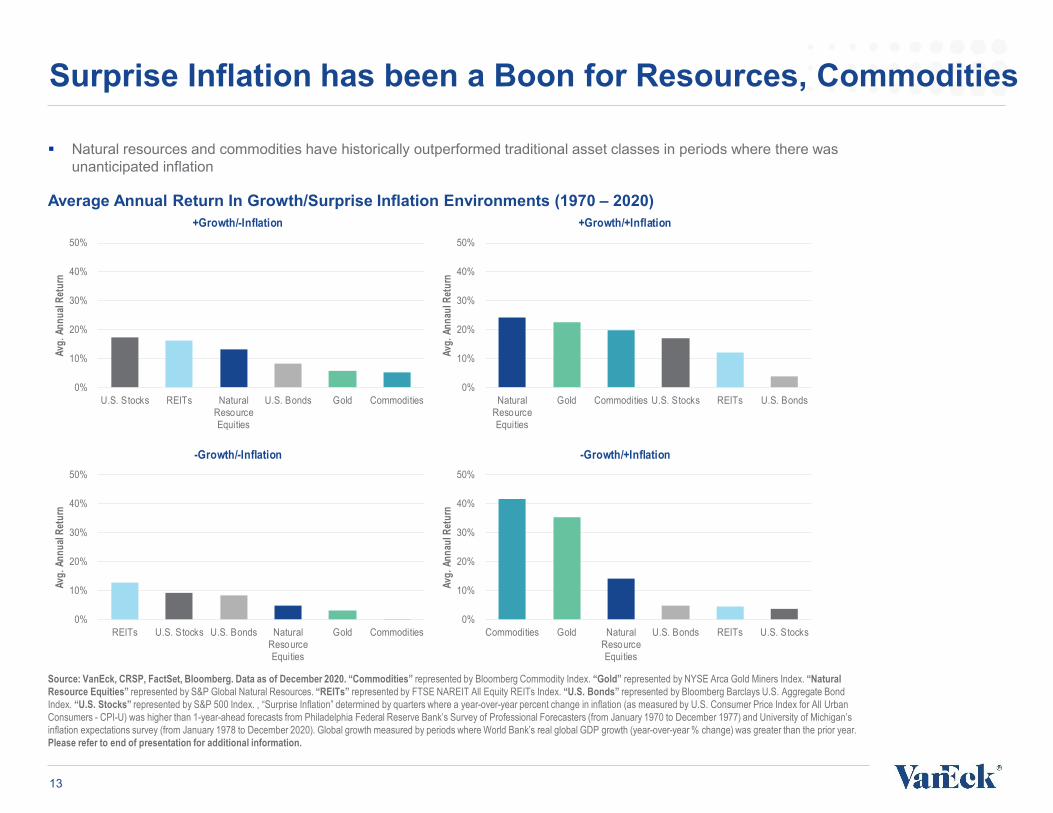
Surprise Inflation has been a Boon for Resources, Commodities
Source: VanEck, CRSP, FactSet, Bloomberg. Data as of December 2020. “Commodities” represented by Bloomberg Commodity Index. “Gold” represented by NYSE Arca Gold Miners Index. “Natural Resource Equities” represented by S&P Global Natural Resources. “REITs” represented by FTSE NAREIT All Equity REITs Index. “U.S. Bonds” represented by Bloomberg Barclays U.S. Aggregate Bond Index. “U.S. Stocks” represented by S&P 500 Index. , “Surprise Inflation” determined by quarters where a year-over-year percent change in inflation (as measured by U.S. Consumer Price Index for All Urban Consumers - CPI-U) was higher than 1-year-ahead forecasts from Philadelphia Federal Reserve Bank’s Survey of Professional Forecasters (from January 1970 to December 1977) and University of Michigan’s inflation expectations survey (from January 1978 to December 2020). Global growth measured by periods where World Bank’s real global GDP growth (year-over-year % change) was greater than the prior year. Please refer to end of presentation for additional information.
Average Annual Return In Growth/Surprise Inflation Environments (1970 – 2020)
Natural resources and commodities have historically outperformed traditional asset classes in periods where there was unanticipated inflation
0%
10%
20%
30%
40%
50%
NaturalResourceEquities
Gold Commodities U.S. Stocks REITs U.S. Bonds
Avg.
Ann
aul R
etur
n
0%
10%
20%
30%
40%
50%
U.S. Stocks REITs NaturalResourceEquities
U.S. Bonds Gold Commodities
Avg.
Ann
ual R
etur
n
0%
10%
20%
30%
40%
50%
Commodities Gold NaturalResourceEquities
U.S. Bonds REITs U.S. Stocks
Avg.
Ann
aul R
etur
n
0%
10%
20%
30%
40%
50%
REITs U.S. Stocks U.S. Bonds NaturalResourceEquities
Gold Commodities
Avg.
Ann
ual R
etur
n
+Growth/-Inflation +Growth/+Inflation
-Growth/-Inflation -Growth/+Inflation
13

Even Modest Inflation Bodes Well For The Space
Source: VanEck, CRSP, FactSet, Bloomberg. Data as of December 2020. CPI is represented by the Consumer Price Index for All Urban Consumers. Past performance is not a guarantee of future results. Please refer to end of presentation for additional information.
Average Annual Return of Natural Resource Equities & Commodities in Varying Inflation Regimes (1970-2020)
24% 59% 17%
-10%
-5%
0%
5%
10%
15%
20%
25%
30%
<2% 2-6% >6%
Frequency of Inflation Regime
Aver
age T
railin
g 12
-Mon
th R
etur
n
Inflation Regime(U.S. CPI, YoY)
Energy EquitiesDiversified MinersGold MinersREITsU.S. StocksU.S. Bonds
24% 59% 17%
-30%
-20%
-10%
0%
10%
20%
30%
40%
50%
60%
<2% 2-6% >6%
Frequency of Inflation Regime
Aver
age T
railin
g 12
-Mon
th R
etur
n
Inflation Regime(U.S. CPI, YoY)
Oil, Gas & Consumable FuelsBase & Industrial MetalsGold Bullion
Natural resources and commodities have still outperformed traditional asset classes in even modest inflationary periods (of 2-6% y-o-y inflation)
14
VanEck Vectors®
Inflation Allocation ETF (RAAX)
15

Minimize volatility to maximize real asset benefits
Source: VanEck. 1Net expense ratio shown. The gross expense ratio for the fund is 1.35%. Expenses for RAAX are capped contractually at 0.55% until February 1, 2022. Cap excludes acquired fund fees and expenses, interest expense, trading expenses, taxes and extraordinary expenses. Expense ratio as of the most recent prospectus. Please see the Fund’s prospectus for more detailed information on expenses.
The VanEck Vectors Inflation Allocation ETF is designed to provide exposure to the valuable potential of real assets while seeking to reduce volatility through its unique, objective investment approach.
Fund Details
Fund Ticker RAAXIntraday NAV Ticker RAAX.IVCommencement Date 4/9/2018Expense Ratio (%)1 0.78Exchange NYSE ArcaAnticipated Dividend Frequency Annually
Comprehensive allocation strategy that invests across commodities, natural resources equities, gold, bitcoin, REITs, MLPs, and infrastructure
Seeks to reduce volatility by responding to changing market environments
Optimized allocation process provides balanced exposure across a diverse set of real asset investments
Key Characteristics
16

Process focused on diversification and volatility
PortfolioCore real asset exposure with the
flexibility to adapt positioning among asset class to reflect current conditions
Step two:
Measure & Respondto market volatility
Comprehensive indicators generate risk score to guide positioning in periods of extreme market stress
Step one:
Optimize portfolio exposures
Asset classes characteristics are analyzed to produce portfolio with optimal diversification and volatility profile
17
Please note the information in this presentation represents the investment team’s current implementation of its investment strategy and this implementation may change without notice.

Eligible real assets classes Typical exposure range (%)1
Natural Resource Equities 25 – 50Gold 15 – 30Diversified Commodities 10 – 20Global Infrastructure 5 – 20REITs 5 – 20Master Limited Partnerships 5 – 10Bitcoin 0 – 10
Analyze volatility and correlations of the investable asset classes and optimize for portfolio weights
Weights are assigned to create the minimum variance portfolio (or to maximize diversification and minimize volatility)
Step one: determine asset class weightings
1The Real Asset sectors listed above represent the current investable universe as determined by portfolio management and ranges reflect sizing at time of purchase. Please note the information in this presentation represents the investment team’s current implementation of its investment strategy and this implementation may change without notice.These sectors and their respective typical exposure ranges, as well as the portfolio’s defensive positioning are subject to change in the future, dependent on a number of factors, including asset size and relevant developments in real assets and the broad market environment. Target exposure applies to weightings initiated at Strategy’s monthly repositioning. Weightings may vary intra-month.
Van Eck Absolute Return Advisers Corporation anticipates that the indicators and process used in RAAX’s allocation decisions will evolve over time and may incorporate additional changes. See important disclosures on page 2.
18

For illustrative purposes only. Please note the information in this presentation represents the investment team’s current implementation of its investment strategy and this implementation may change without notice. See disclosures at the beginning of this presentation. See index descriptions and definitions at the end of this presentation. Beginning in October 2020, the Real Asset Allocation Model was modified to reduce the cap on cash/cash equivalents from 100% to a maximum of 20%.
Step two: identify market environment positioning Indicators signals are aggregated to compile Overall Risk Score to identify five market environments
As the Risk Score increases, defensive positioning rises; if above 67 then portfolio most defensive at 20% T-Bills Risk Increasing in RealAssets
Over
all R
isk S
core
RISK SCORE: Between 76 and 100
MARKET ENVIRONMENT: WEAK
DEFENSIVE ALLOCATION: 20% T-Bills
WEAK
RISK SCORE: Between 51 and 75
MARKET ENVIRONMENT: CAUTIOUS
DEFENSIVE ALLOCATION: 10% T-Bills
CAUTIOUS
RISK SCORE: Between 0 and 50
MARKET ENVIRONMENT: STABLE
DEFENSIVE ALLOCATION: 0% T-Bills
STABLE
Real Assets T-Bills
19
Please note the information in this presentation represents the investment team’s current implementation of its investment strategy and this implementation may change without notice.
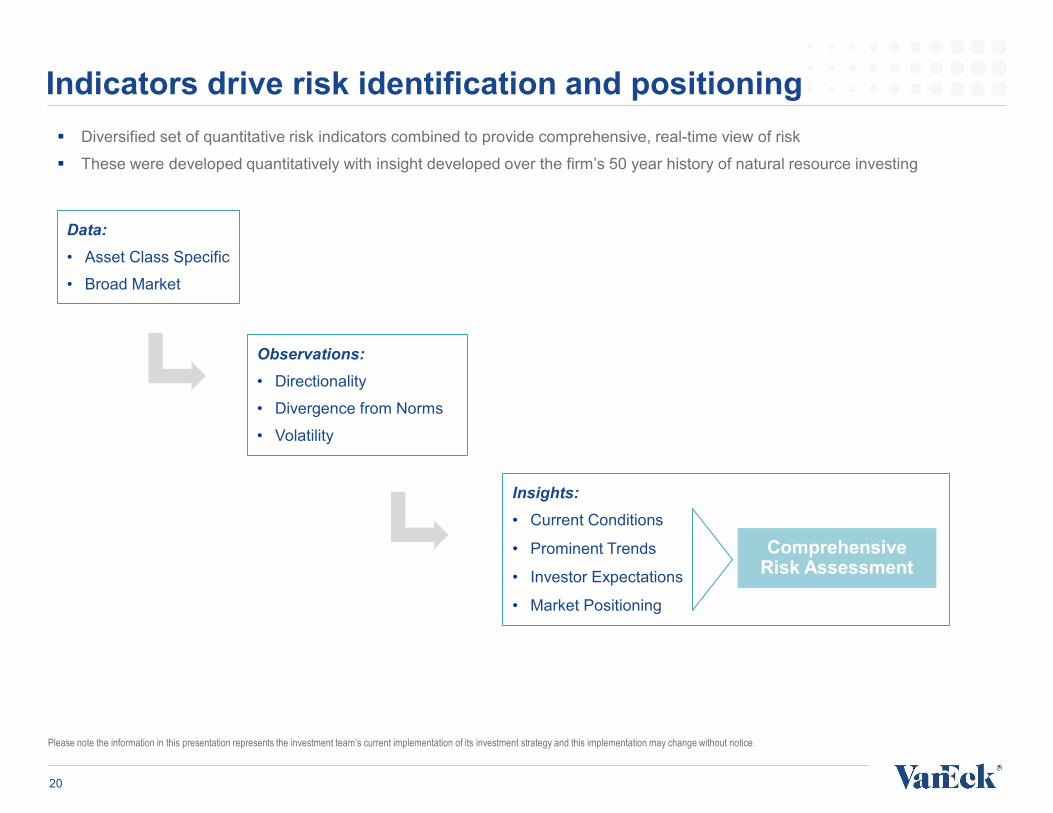
Data:• Asset Class Specific• Broad Market
Indicators drive risk identification and positioning
Observations:• Directionality• Divergence from Norms• Volatility
Comprehensive Risk Assessment
Insights:• Current Conditions
• Prominent Trends
• Investor Expectations
• Market Positioning
Diversified set of quantitative risk indicators combined to provide comprehensive, real-time view of risk These were developed quantitatively with insight developed over the firm’s 50 year history of natural resource investing
20
Allocations and Performance
21
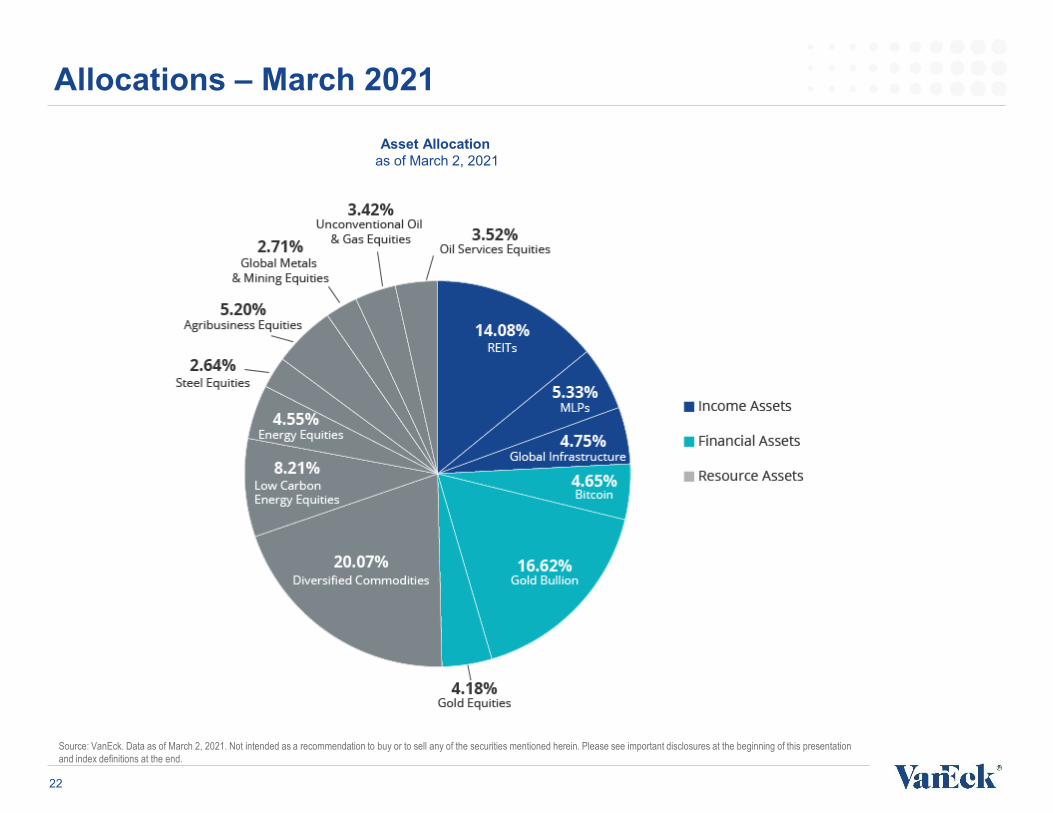
Allocations – March 2021
Source: VanEck. Data as of March 2, 2021. Not intended as a recommendation to buy or to sell any of the securities mentioned herein. Please see important disclosures at the beginning of this presentation and index definitions at the end.
Asset Allocation as of March 2, 2021
22

Allocations – March 2021
Source: VanEck. Data as of March 2, 2021. Not intended as a recommendation to buy or to sell any of the securities mentioned herein. Please see important disclosures at the beginning of this presentation and index definitions at the end.
23
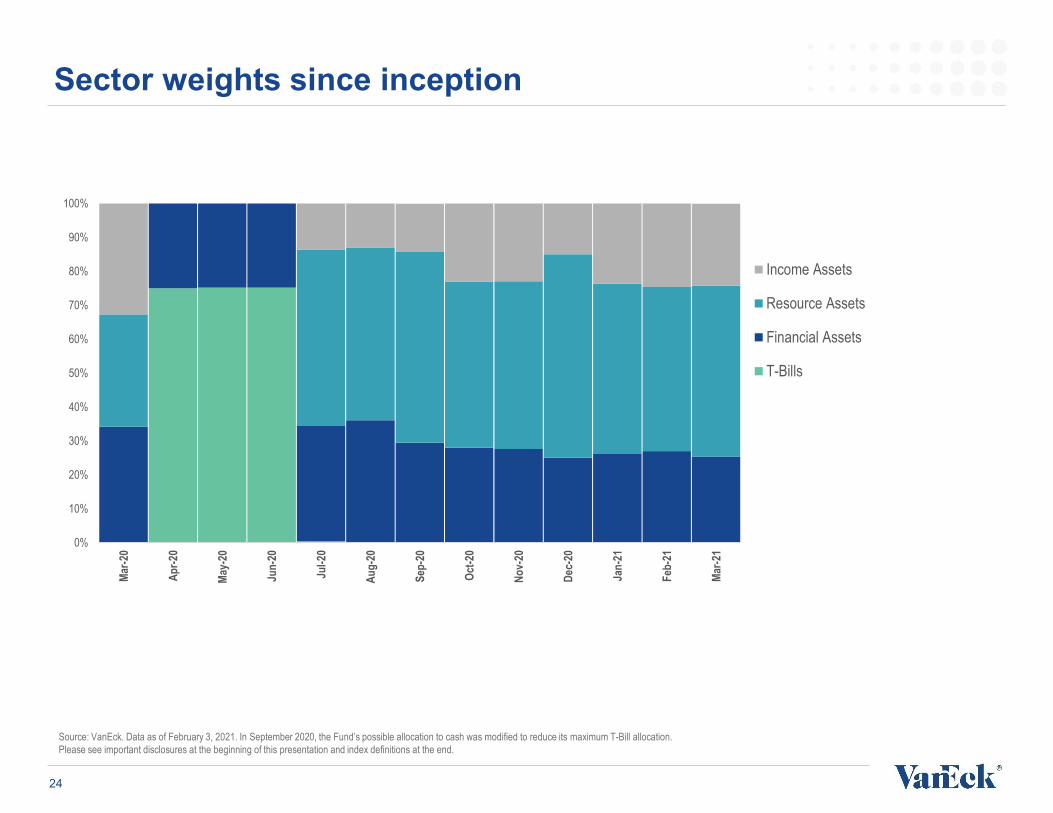
Source: VanEck. Data as of February 3, 2021. In September 2020, the Fund’s possible allocation to cash was modified to reduce its maximum T-Bill allocation. Please see important disclosures at the beginning of this presentation and index definitions at the end.
Sector weights since inception
0%
10%
20%
30%
40%
50%
60%
70%
80%
90%
100%
Mar-2
0
Apr-2
0
May-
20
Jun-
20
Jul-2
0
Aug-
20
Sep-
20
Oct-2
0
Nov-
20
Dec-
20
Jan-
21
Feb-
21
Mar-2
1
Income Assets
Resource Assets
Financial Assets
T-Bills
24

Overall Risk Score
Source: VanEck. Data as of February 28, 2021. Van Eck Absolute Return Advisers Corporation anticipates that the indicators and process used in RAAX’s allocation decisions will evolve over time and may incorporate additional changes. See important disclosures on page 2.
25
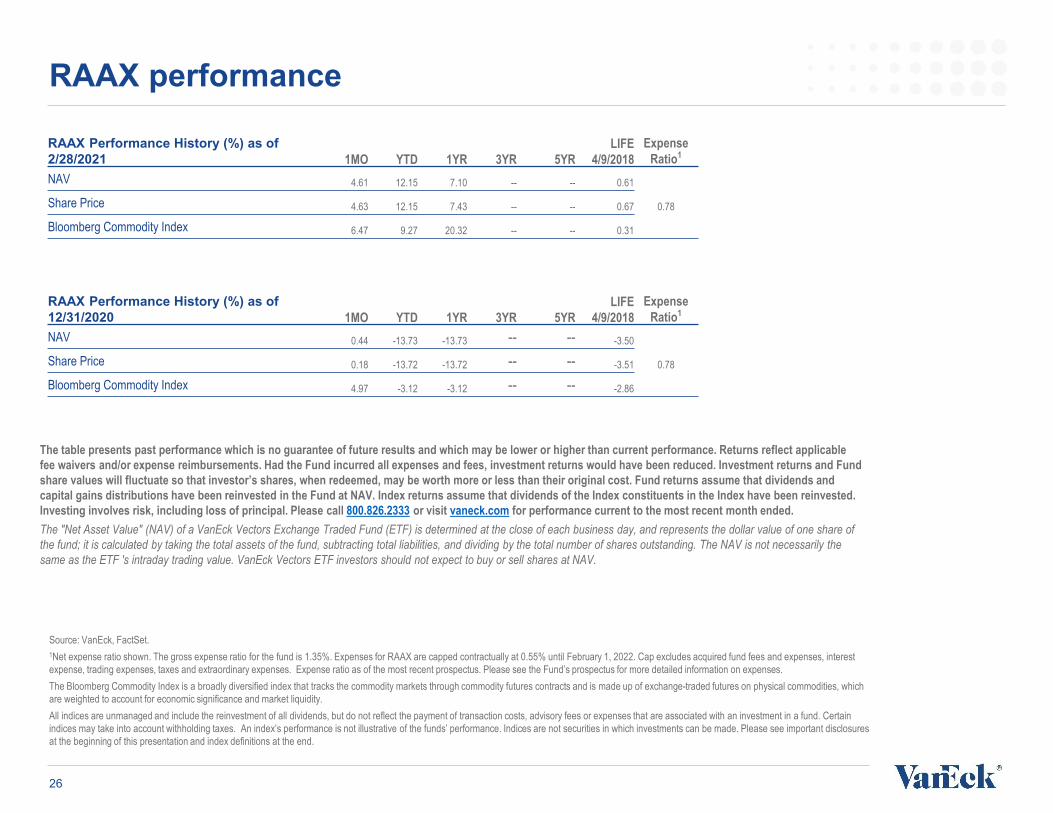
RAAX performance
The table presents past performance which is no guarantee of future results and which may be lower or higher than current performance. Returns reflect applicable fee waivers and/or expense reimbursements. Had the Fund incurred all expenses and fees, investment returns would have been reduced. Investment returns and Fund share values will fluctuate so that investor’s shares, when redeemed, may be worth more or less than their original cost. Fund returns assume that dividends and capital gains distributions have been reinvested in the Fund at NAV. Index returns assume that dividends of the Index constituents in the Index have been reinvested. Investing involves risk, including loss of principal. Please call 800.826.2333 or visit vaneck.com for performance current to the most recent month ended.The "Net Asset Value" (NAV) of a VanEck Vectors Exchange Traded Fund (ETF) is determined at the close of each business day, and represents the dollar value of one share of the fund; it is calculated by taking the total assets of the fund, subtracting total liabilities, and dividing by the total number of shares outstanding. The NAV is not necessarily the same as the ETF 's intraday trading value. VanEck Vectors ETF investors should not expect to buy or sell shares at NAV.
RAAX Performance History (%) as of 2/28/2021 1MO YTD 1YR 3YR 5YR
LIFE 4/9/2018
ExpenseRatio1
NAV 4.61 12.15 7.10 -- -- 0.61
0.78Share Price 4.63 12.15 7.43 -- -- 0.67
Bloomberg Commodity Index 6.47 9.27 20.32 -- -- 0.31
Source: VanEck, FactSet. 1Net expense ratio shown. The gross expense ratio for the fund is 1.35%. Expenses for RAAX are capped contractually at 0.55% until February 1, 2022. Cap excludes acquired fund fees and expenses, interest expense, trading expenses, taxes and extraordinary expenses. Expense ratio as of the most recent prospectus. Please see the Fund’s prospectus for more detailed information on expenses.The Bloomberg Commodity Index is a broadly diversified index that tracks the commodity markets through commodity futures contracts and is made up of exchange-traded futures on physical commodities, which are weighted to account for economic significance and market liquidity.All indices are unmanaged and include the reinvestment of all dividends, but do not reflect the payment of transaction costs, advisory fees or expenses that are associated with an investment in a fund. Certain indices may take into account withholding taxes. An index’s performance is not illustrative of the funds’ performance. Indices are not securities in which investments can be made. Please see important disclosures at the beginning of this presentation and index definitions at the end.
RAAX Performance History (%) as of 12/31/2020 1MO YTD 1YR 3YR 5YR
LIFE 4/9/2018
ExpenseRatio1
NAV 0.44 -13.73 -13.73 -- -- -3.50
0.78Share Price 0.18 -13.72 -13.72 -- -- -3.51
Bloomberg Commodity Index 4.97 -3.12 -3.12 -- -- -2.86
26
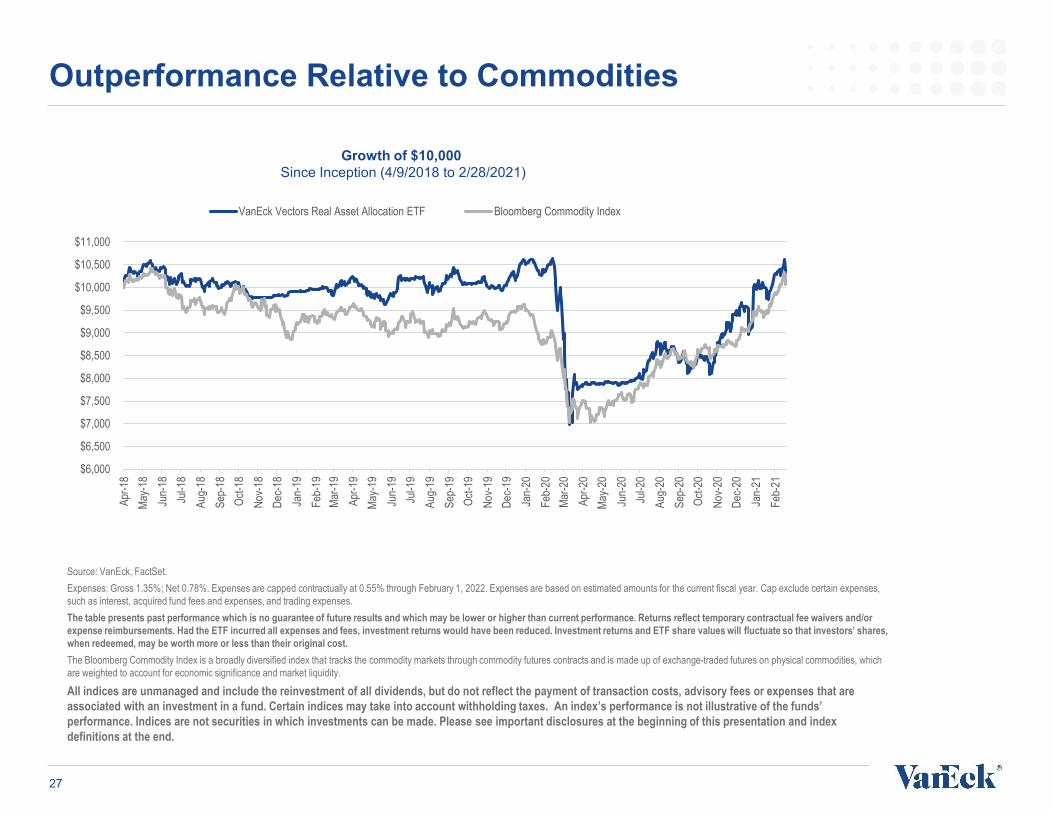
Outperformance Relative to Commodities
27
$6,000
$6,500
$7,000
$7,500
$8,000
$8,500
$9,000
$9,500
$10,000
$10,500
$11,000
Apr-1
8Ma
y-18
Jun-
18Ju
l-18
Aug-
18Se
p-18
Oct-1
8No
v-18
Dec-1
8Ja
n-19
Feb-
19Ma
r-19
Apr-1
9Ma
y-19
Jun-
19Ju
l-19
Aug-
19Se
p-19
Oct-1
9No
v-19
Dec-1
9Ja
n-20
Feb-
20Ma
r-20
Apr-2
0Ma
y-20
Jun-
20Ju
l-20
Aug-
20Se
p-20
Oct-2
0No
v-20
Dec-2
0Ja
n-21
Feb-
21
VanEck Vectors Real Asset Allocation ETF Bloomberg Commodity Index
Growth of $10,000 Since Inception (4/9/2018 to 2/28/2021)
Source: VanEck, FactSet. Expenses: Gross 1.35%; Net 0.78%. Expenses are capped contractually at 0.55% through February 1, 2022. Expenses are based on estimated amounts for the current fiscal year. Cap exclude certain expenses, such as interest, acquired fund fees and expenses, and trading expenses. The table presents past performance which is no guarantee of future results and which may be lower or higher than current performance. Returns reflect temporary contractual fee waivers and/or expense reimbursements. Had the ETF incurred all expenses and fees, investment returns would have been reduced. Investment returns and ETF share values will fluctuate so that investors’ shares, when redeemed, may be worth more or less than their original cost. The Bloomberg Commodity Index is a broadly diversified index that tracks the commodity markets through commodity futures contracts and is made up of exchange-traded futures on physical commodities, which are weighted to account for economic significance and market liquidity.
All indices are unmanaged and include the reinvestment of all dividends, but do not reflect the payment of transaction costs, advisory fees or expenses that are associated with an investment in a fund. Certain indices may take into account withholding taxes. An index’s performance is not illustrative of the funds’ performance. Indices are not securities in which investments can be made. Please see important disclosures at the beginning of this presentation and index definitions at the end.
All indices are unmanaged and include the reinvestment of all dividends but do not reflect the payment of transactions costs, advisory fees or expenses that are typically associated with managedaccounts or investment funds. Indices were selected for illustrative purposes only and are not securities in which investments can be made. The returns of actual accounts investing in natural resourceequities, energy equities, diversified mining equities, gold equities, commodities, oil, industrial metals, gold, U.S. equities and U.S. bonds strategies are likely to differ from the performance of eachcorresponding index. In addition, the returns of accounts will vary from the performance of the indices for a variety of reasons, including timing and individual account objectives andrestrictions. Accordingly, there can be no assurance that the benefits and risk/return profile of the indices shown would be similar to those of actual accounts managed. Performance is shown for thestated time period only.
The Bloomberg Commodity Index is a broadly diversified index that tracks the commodity markets through commodity futures contracts and is made up of exchange-traded futures on physical commodities, which are weighted to account for economic significance and market liquidity.
The exchange-traded funds held in RAAX’s portfolio track the following indices: The MVIS Global Agribusiness Index is a modified market cap-weighted index tracks the performance of the largest and most liquid companies in the global agribusiness segment. Its unique pure-play approach requires that companies have to generate at least 50% of their revenues from agri-chemicals and fertilizers, seeds and traits, from farm/irrigation equipment and farm machinery, from agricultural products (incl. Grain, tobacco, meat, poultry and sugar), aquaculture and fishing, livestock, plantations and trading of agricultural products. The MVIS Global Coal Index is a modified market cap-weighted index tracks the performance of the largest and most liquid companies in the global coal segment. Its unique pure-play approach requires that companies have to generate at least 50% of their revenues from coal operation (production, mining and cokeries), transportation of coal, from production of coal mining equipment as well as from storage and trade. The NYSE Arca Gold Miners Index is a modified market capitalization-weighted index composed of publicly traded companies involved primarily in the mining for gold. The Index is calculated and maintained by the New York Stock Exchange. The MVIS U.S. Listed Oil Services 25 Index is intended to track the overall performance of U.S.-listed companies involved in oil services to the upstream oil sector, which include oil equipment, oil services, or oil drilling. The MVIS Global Unconventional Oil & Gas Index is intended to track the performance of the largest and most liquid companies in the unconventional oil and gas segment. The pure-play index contains only companies that generate at least 50% of their revenues from unconventional oil and gas which is defined as coal bed methane (CBM), coal seam gas (CSG), shale oil, shale gas, tight natural gas, tight oil and tight sands. The DBIQ Optimum Yield Diversified Commodity Index Excess Return is an index composed of futures contracts on 14 heavily traded commodities across the energy, precious metals, industrial metals and agriculture sectors. The NYSE Arca Steel Index is a modified market capitalization weighted index comprised of publicly traded companies involved primarily in the production of steel products. The S&P Global Infrastructure Index is designed to track companies from around the world chosen to represent the listed infrastructure industry while maintaining liquidity and tradability. To create diversified exposure, the index includes three distinct infrastructure clusters: energy, transportation, and utilities. The Ardour Global IndexSM Extra Liquid Index tracks a market-cap-weighted index of low carbon energy companies defined as deriving at least 50% of their revenues from alternative energy. The LBMA Gold Price Index: is a regulated benchmark administered by ICE Benchmark Administration (IBA) who provide the auction platform, the methodology and the overall independent administration and governance for the LBMA Gold Price. The LBMA Gold Price continues to be set twice daily (at 10:30 and 15:00 London BST) in US dollars and other currencies. The MSCI US IMI Real Estate 25/50 Index is designed to capture the large, mid and small cap segments of the U.S. equity universe. All securities in the index are classified in the Real Estate sector as per the Global Industry Classification Standard (GICS®). The index also applies certain investment limits to help ensure diversification. The Energy Sector Index seeks to provide an effective representation of the energy sector of the S&P 500 Index. The Index includes companies from the following industries: oil, gas and consumable fuels; and energy equipment and services. The MSCI ACWI Select Metals & Mining Producers Ex Gold and Silver Investable Market Index (IMI) aims to focus on companies in the industrial and rare earth metals (excluding gold and silver) that are highly sensitive to underlying prices of industrial and rare earth metals. The index includes companies that are primarily engaged in the production or extraction of metals and minerals, in the mining of precious metals excluding gold and silver (e.g. platinum), or in the production of aluminum or steel. All S&P indices listed are products of S&P Dow Jones Indices LLC and/or its affiliates and has been licensed for use by Van Eck Associates Corporation. Copyright © 2018 S&P Dow Jones Indices LLC, a division of S&P Global, Inc., and/or its affiliates. All rights reserved. Redistribution or reproduction in whole or in part are prohibited without written permission of S&P Dow Jones Indices LLC. For more information on any of S&P Dow Jones Indices LLC’s indices please visit www.spdji.com. S&P® is a registered trademark of S&P Global and Dow Jones® is a registered trademark of Dow Jones Trademark Holdings LLC. Neither S&P Dow Jones Indices LLC, Dow Jones Trademark Holdings LLC, their affiliates nor their third party licensors make any representation or warranty, express or implied, as to the ability of any index to accurately represent the asset class or market sector that it purports to represent and neither S&P Dow Jones Indices LLC, Dow Jones Trademark Holdings LLC, their affiliates nor their third party licensors shall have any liability for any errors, omissions, or interruptions of any index or the data included therein.
Index definitions
28
Inflation (Slides 13 & 14)
“Base & Industrial Metals” represented by S&P GSCI Industrial Metals Index from January 1977 to December 2020 and CRB Commodity Metals Index from January 1970 to December 1976. “Commodities” represented by Bloomberg CommodityIndex. “Diversified Miners” represented by MSCI ACWI Select Metals & Mining ex. Gold & Silver Index from September 2001 to December 2020, EMIX Global Mining ex. Gold & Energy Index from January 1986 to August 2001, and CRSP’sIndustry Portfolio (Mines) from January 1970 to December 1985. “Energy Equities” represented by S&P Global BMI Energy (Sector) Index from August 1989 to December 2020, EMIX Global Energy Index from January 1986 to July 1989 andCRSP’s Industry Portfolio (Energy) from January 1970 to December 1985. “Gold (Bullion)” represented by NYMEX spot gold price in $US/oz. “Gold Miners” represented by NYSE Arca Gold Miners Index from October 1993 to December 2020,Dow Jones Global Indexes All World Gold Mining (Sub-Industry) Index from February 1992 to September 1993, S&P 500 Gold (Sub-Industry) index from October 1989 to January 1992 and CRSP’s Industry Portfolio (Gold) from January 1970 toSeptember 1989. “Natural Resource Equities” represented by S&P Global Natural Resources Index from December 2012 to December 2020, an equal-weighted blend of returns for S&P Global BMI Energy and Materials (Sector) indices fromAugust 1989 to November 2012, an equal-weighted blend of returns for EMIX Global Energy and Global Mining indices from January 1986 to July 1989 and a blend of returns for CRSP’s Industry Portfolios (50% Energy, 10% Mines, 10% Chemicals,10% Wood, 10% Boxes and 10% Agriculture) from January 1970 to December 1985. “Oil, Gas & Consumable Fuels” represented by World Bank Energy Price Index. “REITs” represented by FTSE NAREIT All Equity REITs Index from January1972 to December 2020. “U.S. Bonds” represented by Bloomberg Barclays U.S. Aggregate Bond Index from March 1976 to December 2020, Bloomberg Barclays U.S. Aggregate Government/Credit Index from March 1973 to February 1976 and ablend of returns of Ibbotson SBBI bond indices (70% U.S. Intermediate-Term Government Bond Index and 30% U.S. Long-Term Corporate Bond Index) from January 1970 to February 1973. “U.S. Stocks” represented by S&P 500 Index.
For Slide 13, “Surprise Inflation” determined by quarters where a year-over-year percent change in inflation (as measured by U.S. Consumer Price Index for All Urban Consumers - CPI-U) was higher than 1-year-ahead forecasts from PhiladelphiaFederal Reserve Bank’s Survey of Professional Forecasters (from January 1970 to December 1977) and University of Michigan’s inflation expectations survey (from January 1978 to December 2020). For Slides 13 and 14, global growth measured byperiods where World Bank’s real global GDP growth (year-over-year % change) was greater than the prior year.
All indices listed are unmanaged indices and include the reinvestment of all dividends, but do not reflect the payment of transaction costs, advisory fees or expenses that are associated with an investment in any fund. Certainindices may take into account withholding taxes. An index’s performance is not illustrative of a fund’s performance. Indices are not securities in which investments can be made.
Ag Economy Barometer Index, developed by Purdue University and CME Group, is a nationwide measure of the health of the U.S. agricultural economy. On the first Tuesday of each month, the Ag Economy Barometer provides a sense of theagricultural economy’s health with an index value. The index is based on a survey of 400 agricultural producers on economic sentiment each month. Quarterly, the index is accompanied by an in-depth survey of 100 agriculture and agribusinessthought leaders. Bloomberg Barclays U.S. Aggregate Bond Index is a broad-based benchmark that measures the investment grade, U.S. dollar-denominated, fixed-rate taxable bond market. The index includes Treasuries, government-related andcorporate securities, MBS (agency fixed-rate and hybrid ARM pass-throughs), ABS and CMBS (agency and non-agency). Bloomberg Barclays U.S. Aggregate Government/Credit Index is a broad-based benchmark that measures the performanceof U.S. Dollar denominated U.S. Treasuries, government-related and investment grade U.S. corporate securities that have a remaining maturity of greater than one year. Bloomberg Commodity Index is designed to be a highly liquid, diversifiedbenchmark for commodities as an asset class. The Bloomberg Commodity Index is composed of futures contracts on 20 physical commodities. Commodity Research Bureau (CRB) Index acts as a representative indicator of today's globalcommodity markets. The CRB measures the aggregated price direction of various commodity sectors, and is designed to isolate and reveal the directional movement of prices in overall commodity trades. Consumer Price Index for All UrbanConsumers (All Items) is a measure of the average change in the price for goods and services paid by urban consumers between any two time periods. It can also represent the buying habits of urban consumers. This particular index includesroughly 88 percent of the total population, accounting for wage earners, clerical workers, technical workers, self-employed, short-term workers, unemployed, retirees, and those not in the labor force. The CPIs are based on prices for food, clothing,shelter, and fuels; transportation fares; service fees (e.g., water and sewer service). EMIX Global Energy Index EMIX Global Mining ex. Gold & Energy Index measure the returns of companies in the metal and mineral extraction industriesexcluding gold and energy companies. FTSE NAREIT All Equity REITs Index is a free-float adjusted, market capitalization-weighted index of U.S. Equity REITs. Constituents of the Index include all tax-qualified REITs with more than 50 percent oftotal assets in qualifying real estate assets other than mortgages secured by real property. Ibbotson SBBI U.S. Intermediate Government Bond Index is an unweighted index that measures the performance of U.S. Treasury and U.S. GovernmentAgency bonds with maturities between four and seven years. Ibbotson SBBI U.S. Long-Term Corporate Bond Index is an unweighted index that measures the performance of U.S. corporate bonds with maturities of seven years or longer. J.P.Morgan Global Manufacturing PMI is a diffusion index is calculated for each survey variable (output, new orders, new export orders, future output, backlogs of work, employment, quantity of purchases, suppliers' delivery times, stocks of purchases,stocks of finished goods, input prices and output prices), at the country level. The index is the sum of the percentage of ‘higher’ responses and half the percentage of ‘unchanged’ responses. The indices vary between 0 and 100, with a reading above50 indicating an overall increase compared to the previous month, and below 50 an overall decrease. The indices are then seasonally adjusted. NYSE Arca Gold Miners Index is a modified market capitalization-weighted index composed of publiclytraded companies involved primarily in the mining for gold. The Index is calculated and maintained by the New York Stock Exchange. MSCI ACWI Select Metals & Mining Producers Ex Gold and Silver Investable Market Index (IMI) aims to focuson companies in the industrial and rare earth metals (excluding gold and silver) that are highly sensitive to underlying prices of industrial and rare earth metals. The index includes companies that are primarily engaged in the production or extraction ofmetals and minerals, in the mining of precious metals excluding gold and silver (e.g. platinum), or in the production of aluminum or steel. S&P 500 Index is widely regarded as the best single gauge of large-cap U.S. equities. The index is a float-adjusted, market-cap-weighted index of 500 leading U.S. companies from across all market sectors including information technology, telecommunications services, utilities, energy, materials, industrials, real estate, financials, health care, consumerdiscretionary, and consumer staples. S&P Global Natural Resources Index includes 90 of the largest publicly traded companies in natural resources and commodities businesses that meet specific investability requirements, offering investorsdiversified and investable equity exposure across three primary commodity-related sectors: agribusiness, energy, and metals & mining which tracks the global natural resources and commodities businesses. S&P GSCI Index is a world production-weighted commodity index comprised of liquid, exchange-traded futures contracts and is often used as a benchmark for world commodity prices. S&P North American Natural Resources Index provides investors with a benchmark that representsU.S. traded securities that are classified under the GICS® energy and materials sector excluding the chemicals industry; and steel sub-industry. UBS Bloomberg Constant Maturity Commodity Index is a rules-based composite benchmark indexdiversified across 29 commodity components from within five sectors, specifically energy, precious metals, industrial metals, agricultural and livestock.
The S&P 500 Index is a product of S&P Dow Jones Indices LLC and/or its affiliates and has been licensed for use by Van Eck Associates Corporation. Copyright © 2021 S&P Dow Jones Indices LLC, a division of S&P Global, Inc., and/or its affiliates.All rights reserved. Redistribution or reproduction in whole or in part are prohibited without written permission of S&P Dow Jones Indices LLC. For more information on any of S&P Dow Jones Indices LLC’s indices please visit www.spdji.com. S&P® isa registered trademark of S&P Global and Dow Jones® is a registered trademark of Dow Jones Trademark Holdings LLC. Neither S&P Dow Jones Indices LLC, Dow Jones Trademark Holdings LLC, their affiliates nor their third party licensors makeany representation or warranty, express or implied, as to the ability of any index to accurately represent the asset class or market sector that it purports to represent and neither S&P Dow Jones Indices LLC, Dow Jones Trademark Holdings LLC, theiraffiliates nor their third party licensors shall have any liability for any errors, omissions, or interruptions of any index or the data included therein.
Bloomberg Barclays Indices does not sponsor, endorse, or promote any fund mentioned herein and bears no liability with respects to any fund or security mentioned herein.
Index Definitions
29