minimum correspondence sets for improving large-scale...
TRANSCRIPT

Minimum Correspondence Sets for Improving Large-Scale Augmented Paper
Xin Yang1, Chunyuan Liao
2, Qiong Liu
2, Kwang-Ting Cheng
1
1Dept. of Electrical and Computer Engineering, University of California, Santa Barbara, CA 93106, USA
2FX Palo Alto Laboratory, 3400 Hillview Avenue, Bldg.4, Palo Alto, CA 94304, USA
[email protected], {liao, liu}@fxpal.com, [email protected]
Abstract Augmented Paper (AP) is an important area of Augmented Real-
ity (AR). Many AP systems rely on visual features for paper
document identification. Although promising, these systems can
hardly support large sets of documents (i.e. one million docu-
ments) because of the high memory and time cost in handling
high-dimensional features. On the other hand, general large-scale
image identification techniques are not well customized to AP,
costing unnecessarily more resources to achieve the identification
accuracy required by AP.
To address this mismatching between AP and image identification
techniques, we propose a novel large-scale image identification
technique well geared to AP. At its core is a geometric verifica-
tion scheme based on Minimum visual-word Correspondence Set
(MICSs). MICS is a set of visual word (i.e. quantized visual fea-
ture) correspondences, each of which contains a minimum number
of correspondences that are sufficient for deriving a transforma-
tion hypothesis between a captured document image and an in-
dexed image. Our method selects appropriate MICSs to vote in a
Hough space of transformation parameters, and uses a robust
dense region detection algorithm to locate the possible transfor-
mation models in the space. The models are then utilized to ver-
ify all the visual word correspondence to precisely identify the
matching indexed image.
By taking advantage of unique geometric constraints in AP, our
method can significantly reduce the time and memory cost while
achieving high accuracy. As showed in evaluation with two AP
systems called FACT and EMM, over a dataset with 1M+ images,
our method achieves 100% identification accuracy and 0.67%
registration error for FACT; For EMM, our method outperforms
the state-of-the-art image identification approach by achieving 4%
improvements in detection rate and almost perfect precision,
while saving 40% and 70% memory and time cost.
Categories and Subject Descriptors I.3.8 [Computer Graphics]: Applications; I.5.1 [Pattern Recog-
nition]: Models – Geometric; I.5.3 [Pattern Recognition]: Ap-
plications – Computer Vision; H.3.3 [Information Storage and
Retrieval]: Information Search and Retrieval – Information Fil-
tering, Search Process.
Keywords: Minimum Correspondence Set, augment paper, im-
age identification, large-scale, full geometric verification, Hough
transform.
1. Introduction Although paper documents is still one of the most widely used
devices for viewing information, it lacks computational capability
(e.g. Web search and keyword finding) and cannot render dy-
namic information. On the other hand, computers and mobile
devices (e.g. cell phones) are increasingly used to provide rich
GUI interactions and conveniently access dynamic information.
But they hardly match paper’s display quality, tangibility, flexibil-
ity in spatial organization and robustness. To combine the com-
plementary advantages of the two media, Augmented Paper (AP)
has become an active research area [8-17].
Similar to other Augmented Reality (AR) applications, a typical
approach for Augmented Paper consists of three major steps: 1)
identifying a paper document using its camera-captured images,
2) building precise coordinates transforms between the camera,
display and document coordinates, and 3) overlaying the associ-
ated digital information on the paper document via a see-through
Magic Lens [12, 13, 23] or projector [11, 14]. The first step,
document identification, is a key step for AP. For this step, many
existing systems such as FACT [11], MapSnapper [15] and Ma-
pLens [23] rely on the matching of pixel-level visual features of
the document content, as this approach works for generic docu-
ment types (e.g. text, photos and graphics) and does not have the
visual obtrusiveness and layout interference issues of barcodes.
However, matching raw high dimensional features (e.g. 128 di-
mensions for SIFT features [1]) incur a large amount of memory
and time. As a result, these systems can only handle small datasets
with hundreds to thousands of documents, which are not sufficient
for large-scale public use, e.g. linking dynamic media or provid-
ing digital interactions for all books in a library, all papers of
ACM conferences or city-scale advertising leaflets.
Figure 2. An illustration of MICS based Model Estimation
Figure 1. Interface of an Augmented Paper system called FACT.
(1) Hardware configuration, (2) Projector-highlighted words on
paper for fine-grained interaction with the document content.
Webcam Mobile projector
1 2
Augmented Paper

On the other hand, the available large-scale image identification
methods usually aim at applications in general object search [3, 4]
and near-/partial-duplicate detection [2], and focus on addressing
possible image variations in these applications. For instance, iden-
tification methods for general object search needs to tackle 3D
object deformations or 3D perspective changes, while methods for
near-/partial-duplicate detection has to tackle changes from exten-
sive digital editing on an original image. However, without care-
fully analyzing particular geometric changes and constraints in
AP applications, these methods cost unnecessarily more memory
and time to achieve a satisfactory accuracy. Therefore, simply
applying these general methods to Augmented Paper does not
work well.
In this paper, we present a novel document identification method
well adapted to Augmented Paper. In particular, we propose a
verification scheme based on the concept of Minimum visual-
word (i.e. quantized visual feature) Correspondence Set (MICSs).
MICS is a set of visual-word correspondences (Figure 2(a)), each
of which contains a minimum number of correspondences that are
sufficient for deriving a transformation hypothesis between a
query image and an indexed image. For instance, a MICS with 2
correspondences can be used for a Rotation/Scaling/Translation
(RST) coordinate transformation and one with 3 correspondences
is needed for an affine transformation.
We first use a filtering algorithm to choose an appropriate set of
MICSs, each of which is used to compute a transformation hy-
pothesis (Figure 2(b)). The hypotheses are then projected into a
Hough transform space, where we adopt a dense region detection
algorithm to estimate a precise transform model (Figure 2(c)).
Based on the estimated model, we verify all the visual-word cor-
respondences and give a score for the indexed image. Among all
the indexed images, the one with highest scores is taken as the
matched image for the query image.
Our method takes advantage of two geometric constraints which
are unique in AP. First, we notice that paper documents are usu-
ally flat, and orthogonal to the camera (see Figure 1 (1) and Fig-
ure 7 (1)). Thus geometric changes between a captured image and
its matched indexed image can be well approximated by linear
transformation, i.e. RST and affine transformation. With this ap-
proximation we can improve the robustness and efficiency of
Hough-based model estimation, which performs poorly for more
complex perspective or nonlinear transformation.
Second, unlike near-/partial-duplicate image detection [2], AP
systems usually index all document content that a user may cap-
ture for query, and thus features of a query image have almost
equal probability to be matched to features of its indexed image.
Accordingly, we can safely select a small subset of correspon-
dences for MICS generation and model estimation, which greatly
reduces the time and memory cost without sacrificing much accu-
racy.
We integrated our technique in three AP systems and ran experi-
ments on 1M+ indexed images. Experimental results show that
our proposed method can achieve more than 95% detection rate,
over 99.2% precision and less than 0.67% registration offset.
Comparing to state-of-the-art method hamming embedding [3]
plus RASNAC [7] re-ranking, our method exceeds it by achieving
4% better detection rate and almost perfect precision. Meanwhile,
our method costs 40% less memory and 70% less time.
The rest of the paper is organized as follows: we first review re-
lated work in Section 2, followed by the architecture of a typical
augmented paper system and requirements on document identifi-
cation techniques in Section 3. Then in Section 4 we present tech-
nique details of the proposed scheme. We introduce three AP
systems in Section 5 and report evaluation experiments in Section
6. Finally, Section 7 concludes the paper with future work.
2. Related Work
Our work falls in the general category of augmented paper, which attempts to bridge the gap between paper and the digital world. The research can be traced back to pioneering systems like Digital Desk [14], which augments paper with digital video projected from overhead. EMM [8, 9], HotPaper [15] and Mobile Retriever [16] facilitate retrieving multimedia information/annotations asso-ciated to a paper document and display them on a cell phone. FACT [11], based on a mobile camera-projector unit, allows users to issue various pen gestures to select fine-grained paper docu-ment content and apply user-specified digital operations. PACER[12, 13] adopted the idea of gesture commands and ap-plied them to a camera-touch phone based paper interface.
2.1 Image Identification in Existing AP Systems
The aforementioned AP systems link paper document with its
digital information through visual feature-based document identi-
fication techniques, thus no obstructive barcodes or electronic tags
are demanded. However, due to the limitation of identification
techniques used in these systems, the prior systems suffer from
the following two problems. First, some systems, like Mobile
Retriever [16], heavily rely on the text characteristics, and hence
cannot work for document patches with graphic or figure content.
Second, most existing systems, such as FACT [11] and EMM [8,
9], utilize general local features, e.g. SIFT. Due to the high mem-
ory and time cost of local-feature-based image matching, these
systems can only support small datasets with hundreds to thou-
sands of documents, which limits their impact in real life.
2.2 Existing Large-Scale Image Matching Techniques To support large scale image sets, state-of-the-art image retrieval systems [2, 3, 4, 5, 6] quantize raw visual features into visual words and represent images with bag-of-words [5, 6] due to its compactness and fast matching. However, because of the quanti-zation errors and lack of spatial information, the bag-of-words representation results in a large number of false visual-word cor-respondences and hence a lower search accuracy. To address this problem, the systems usually apply two-stage verification: Weak correspondence verification followed by strong geometric verifi-cation to boost accuracy while retaining a reasonable efficiency.
Weak verification, exemplified by hamming embedding [3] and spatial coding [2], enforces matching constraints based on pre-computed and compact information. It is fast to compute but not sufficiently effective in removing all false matches, thus it is usu-ally employed for pre-filtering on the first stage. To further im-prove accuracy, a costly but highly effective strong geometric verification scheme is further utilized on the second stage. This scheme estimates explicit transformation models between the query and index images using model fitting algorithms and then verifies visual-word correspondences by checking their consis-tency to the estimated models. Strong geometric verification is very powerful in excluding false correspondences; however, model fitting approaches like RANSAC are too computationally expensive thus it is usually only applied for the top-ranked images.
However these methods are not optimized for AP, thus they spend unnecessarily more memory and time cost to achieve a satisfac-tory accuracy. In contrast, our method is well geared to AP by considering the special constraints in the application scenarios.

3. System Overview and Design Requirements
As illustrated in Figure 3, a typical AP system consists of four major components, namely Camera Processor, Document Identi-fier, Paper-Digital Coordinator and Display Processor. The Camera Processor captures an image of a paper document, along with finger or pen tip. The captured document image is then iden-tified by the Document Identifier as one of indexed documents in the database. After that, the Paper-Digital Coordinator computes a coordinates transform between the captured image and its digital version. Based on the coordinate transform, actions, e.g. pen tip operations, on paper document can be interpreted as equivalent manipulations on the digital version. Concurrently, associated digital information can also be precisely aligned with the paper document content and forwarded to the Display Processor for visual feedback.
Our ultimate goal is a practical AP system that can be deployed in real life. Towards this goal, we set up the following requirements when selecting and designing supporting techniques. 1) High identification accuracy in large datasets. Frequent
failure of identifying a paper document either due to low
identification accuracy or due to the limited size of datasets
may frustrate users. For positive user experience, it is crucial
to ensure high identification accuracy in large-scale datasets.
2) Low registration offset: Many AP systems [11] leverage a
projector to overlay, or “register”, visual feedbacks on paper
documents. To facilitate precise overlaying, e.g. word level
augmentation in FACT [11], it is critical to establish accurate
coordinate transformation between a camera image, its
matched digital document and the resulting projection image.
3) Semi-real-time identification and registration: Unlike some
AR systems which require real-time identification and regis-
tration for high-speed changing environmental conditions,
AP systems only demand semi-real-time performance. This
is because in AP systems a paper document usually remains
still in hands or on the table. The paper movement normally
occurs during page navigation and spatial arrangement, sel-
dom during a content-operation within a page. Therefore, for
most AP systems, a semi-real-time performance is sufficient.
4. MICSs-based Geometric Verification
4.1 Overview
We propose an efficient and robust large scale document image
identification scheme which is built on top of a standard bag-of-
words framework: 1) locating feature points from all the images;
2) extracting local features for each of the feature points; 3) quan-
tizing all the local features into visual words according to a pre-
trained vocabulary [6], which significantly save space by using
only the visual word labels afterwards; 4) matching a query image
to indexed images sharing the same visual words and ranking all
the matched images according to the number of visual-word cor-
respondences in decreasing order; and 5) verifying correspon-
dences of the top-ranked matched images, removing false ones
and re-ranking the top-ranked images. The last step is necessary
as the quantization greatly degenerate the local features’ dis-
criminability thus two features with the same visual word may be
not really matched.
The main contribution of this paper lies in a verification method
which considers not only the label of the individual visual words
but also the spatial relationship among visual words. In particular,
our method estimates geometric transformation model based on a
set of MICSs between a captured image and an indexed document
image, and then removes most false visual-word correspondences
using the estimated model.
MICSs selection and model estimation are two key steps which
affect the performance of efficiency and robustness. On one ex-
treme, selecting only one correct MICS (i.e. all its included corre-
spondences are correctly matched visual words) can lead to a
correct model with minimum time cost in hypotheses computing.
However, due to large number of noisy MICSs arising from false
correspondences, selecting a correct MICS is quite time-
consuming. Though it can lead to a robust model but the overall
time cost is high. On the other extreme, using all the MICSs leads
to no selection time but the resulting model is unreliable. There-
fore, we focus on finding an optimal solution for achieving both
efficiency and robustness. Our key idea is to first identify a subset
of correct MICSs using Hough transform [19, 20, 21] and then
estimate an accurate model using the identified MICSs. To further
improve the efficiency, we pre-filter as many as possible MICSs
that may contain false correspondences before deciding on the
MICSs for model estimation.
Figure 4 illustrates the workflow of the proposed scheme. It con-sists of four major steps, as indicated in the red box: (1) creating MICSs by selecting sets of visual-word correspondences; (2) computing transformation hypotheses based on MICSs; (3) MICSs based model estimation in Hough space: locating a set of densely clustered hypotheses by our dense region detection algo-rithm and estimating the final model by summing up the weighted hypotheses within the region; (4) Finally, verifying all the corre-spondences based on the estimated model, removing outliers and ranking matched images according to the number of inliers to the estimated model. We pre-determine a threshold for identifying a query document: if the number of inlier between the query docu-ment and the top 1 ranked indexed document is larger than the threshold, we considered this query as an identified document;
Figure 3. The architecture of an Augmented Document System
Figure 4. An overview of our method
otherwise, the query is rejected as an unrecognized one.
4.2 MICS Generation
MICS generation contains two major steps: 1) selecting a subset
correspondences, and 2) generating combinations of selected cor-
respondences and pre-filtering unreliable combinations (i.e. those
are likely to contain false correspondences) by checking the scale
and angle parameter consistency. The remaining combinations are
used as our MICSs.
4.2.1 Subset Correspondences Selection
As mentioned in introduction, AP systems usually index all
document content that a user may capture for query, thus it is safe
to select a small subset of correspondences for model estimation
which greatly reduces the time and memory cost without sacrific-
ing much accuracy. But arbitrarily selected correspondences may
locate closely and densely to each other on a captured document
image (i.e. query image), leading to large estimation errors. We
therefore address this problem by uniformly choose points on a
query image, and select correspondences containing these points.
In our implementation, we also assign slightly larger probability
to be selected to points locate close to the center of a captured
image than those reside on the margin. This is because the content
in the center of a captured image is more likely to appear again on
its matched indexed image.
4.2.2 Correspondence Combinations Filtering
After selecting subset correspondences, we generate correspon-
dences combinations, each of which contains minimum number of
correspondences that are sufficient for computing a transforma-
tion. But many combinations may contain false correspondences,
i.e. unreliable combinations, which affect the robustness of model
estimation. Therefore, it is necessary to pre-filter as many these
unreliable ones as possible beforehand.
We observe that correct visual word correspondences are more
likely to have consistent scale and angle parameters than incorrect
ones. Based on this observation, we filter the unreliable combina-
tions which have inconsistent scale and angle parameters. The
remaining combinations which pass the consistency checking are
used as MICS for the following model estimation.
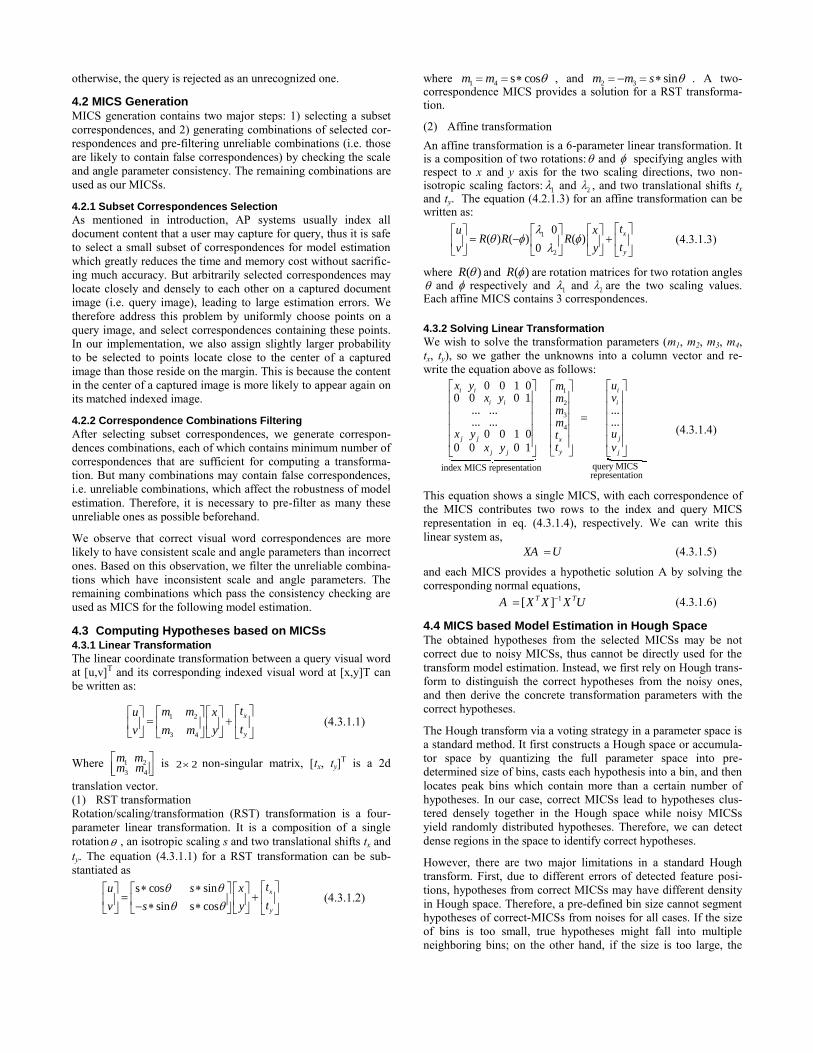
4.3 Computing Hypotheses based on MICSs
4.3.1 Linear Transformation
The linear coordinate transformation between a query visual word
at [u,v]T and its corresponding indexed visual word at [x,y]T can
be written as:
1 2
3 4
x
y
tm mu x
tm mv y
(4.3.1.1)
Where 1 2
3 4
m mm m
is 2 2 non-singular matrix, [tx, ty]T is a 2d
translation vector.
(1) RST transformation
Rotation/scaling/transformation (RST) transformation is a four-
parameter linear transformation. It is a composition of a single
rotation , an isotropic scaling s and two translational shifts tx and
ty. The equation (4.3.1.1) for a RST transformation can be sub-
stantiated as
s cos sin
sin s cos
x
y
tu s x
tv s y
(4.3.1.2)
where 1 4 s cosm m , and
2 3 sinm m s . A two-correspondence MICS provides a solution for a RST transforma-tion.
(2) Affine transformation
An affine transformation is a 6-parameter linear transformation. It is a composition of two rotations: and specifying angles with respect to x and y axis for the two scaling directions, two non-isotropic scaling factors: 1 and 2 , and two translational shifts tx and ty. The equation (4.2.1.3) for an affine transformation can be written as:
1
2
0( ) ( ) ( )
0
x
y
tu xR R R
tv y
(4.3.1.3)
where ( )R and ( )R are rotation matrices for two rotation angles and respectively and 1 and 2 are the two scaling values. Each affine MICS contains 3 correspondences.
4.3.2 Solving Linear Transformation
We wish to solve the transformation parameters (m1, m2, m3, m4,
tx, ty), so we gather the unknowns into a column vector and re-
write the equation above as follows:
1
2
3
4
index MICS representation
0 0 1 00 0 0 1 ... ... ...
... ... ... 0 0 1 0
0 0 0 1
i i i
i i i
j j jx
yj j j
x y umx y vm
mm
x y uttx y v
query MICS representation
(4.3.1.4)
This equation shows a single MICS, with each correspondence of
the MICS contributes two rows to the index and query MICS
representation in eq. (4.3.1.4), respectively. We can write this
linear system as,
XA U (4.3.1.5)
and each MICS provides a hypothetic solution A by solving the
corresponding normal equations, 1 [ ]T TA X X X U
(4.3.1.6)
4.4 MICS based Model Estimation in Hough Space
The obtained hypotheses from the selected MICSs may be not
correct due to noisy MICSs, thus cannot be directly used for the
transform model estimation. Instead, we first rely on Hough trans-
form to distinguish the correct hypotheses from the noisy ones,
and then derive the concrete transformation parameters with the
correct hypotheses.
The Hough transform via a voting strategy in a parameter space is
a standard method. It first constructs a Hough space or accumula-
tor space by quantizing the full parameter space into pre-
determined size of bins, casts each hypothesis into a bin, and then
locates peak bins which contain more than a certain number of
hypotheses. In our case, correct MICSs lead to hypotheses clus-
tered densely together in the Hough space while noisy MICSs
yield randomly distributed hypotheses. Therefore, we can detect
dense regions in the space to identify correct hypotheses.
However, there are two major limitations in a standard Hough
transform. First, due to different errors of detected feature posi-
tions, hypotheses from correct MICSs may have different density
in Hough space. Therefore, a pre-defined bin size cannot segment
hypotheses of correct-MICSs from noises for all cases. If the size
of bins is too small, true hypotheses might fall into multiple
neighboring bins; on the other hand, if the size is too large, the

peak bin will be polluted by many false hypotheses. Second, the
time and space complexity of searching in a full-Hough space is
high, which is in order of O(K1*…*Km), where m is the total
number of parameters and Ki (1 )i m is the number of bins for
parameter i. In response to these limitations, we propose two algo-
rithms to handle flexible hypothesis density and low efficiency.
4.4.1 Dense Region Detection
To address the first limitation, we propose a more reliable proce-
dure, which first detects peak bins in a finely grained Hough
space and then grows the dense region around each peak by merg-
ing neighboring bins which contain more than a certain number of
hypotheses. Two examples are illustrated in Figure 5(a) and (b).
One peak bin is detected (indicated by a purple box) and inserted
into the dense region set. And then the neighbors of the dense
region boundary are examined; those containing more than k
votes are further inserted the dense region set (k=3 in our current
implementation). Such region growing process iterates until no
neighboring bin of the dense region contains enough votes. The
final boundary of the detected dense region is denoted by the
green lines in Figure 5(a) and (b). Algorithm 1 presents the proc-
ess of our dense region detection.
We illustrate the advantages of our method by two cases that fail
with conventional Hough transform. First, when consistent hy-
potheses distribute relatively sparsely, fine quantization may sepa-
rate them into several adjacent bins. Our scheme can re-merge
these bins together, as shown in Figure 5(a), and hence overcome
the over segmentation problem caused by a pre-defined fine quan-
tization strategy. Second, when consistent hypotheses cluster
densely in one dimension while a bit sparsely in other dimensions,
as shown in Figure 5 (b), our scheme can automatically grow the
dense region along sparsely distributed dimensions. Therefore,
our scheme outperforms a pre-defined coarse quantization strat-
egy, which may introduce lots of noises for densely clustered
dimension in these scenarios.
4.4.2 Reducing Time/Memory cost
Storing and searching in a full Hough space with fine quantization
involves high space and time complexity. To address this issue,
we propose two strategies which break the problem into a set of
sub-problems of low complexity:
Subspace dense region detection and final parameter calcula-
tion. We reduce the problem of detecting high-dimensional dense
regions in a full-parameter space to finding dense regions for each
dimension independently. Figure 6 (a) and (b) provides two ex-
amples of locating dense regions for dimension mi and mj, inde-
pendently and respectively. In this example, we quantize both mi
and mj into 8 bins and along each dimension we count the number
of votes for each bin individually. We detect the peak bins Qi and
Qj for mi and mj and grow the dense regions around the peak bins.
The green boxes denote the final detected dense region. Such
simplification can reduce the space and time complexity from
O(K1*…*Km) to O(K1+…+Km).
After obtaining the dense regions for each dimension, we can
calculate the concrete parameter of each dimension in two differ-
ent ways: a) averaging the weighted quantized values within the
region. The weight of each quantized value is defined using the
number of hypotheses in this bin over the total number of hy-
potheses in the detected region. An example of this calculation is
shown in Figure 6 (a) and (b). Such scheme is fast and memory
(a) (b)
Figure 5. Detect dense region based on our procedure for dif-
ferent hypotheses distributions
Algorithm1: Dense region detection
Step1: Initial DenseRegioni = {}, Boundleft = Boundright= null
Step2: Detect the peak, and DenseRegioni = {binpeak}, Boundleft = binpeak -1, Boundright = binpeak +1
Step3: REPEAT if: N(Boundleft)>threshold (N(*): number of votes) Boundleft DenseRegioni, Boundleft -- else if: N(Boundright)>threshold Boundright DenseRegioni, Boundright ++ else go to END
Step4: go to REPEAT
Step5: END
Algorithm2: MICS based model estimation in Hough space
Step1: Calculate (m1, m2, m3, m4) hypotheses, quantize mi (1 4)i space and cast hypotheses into bins.
Step2: for {parameter = mi, (1 4)i } Dense region detection Calculate a concrete mi
Step3: Calculate ti ( , )i x y hypotheses based on concrete mi
(1 4)i , quantize ti ( , )i x y space and cast hypothe-ses into bins.
Step4: for {parameter = ti ( , )i x y } Dense region detection Calculate a concrete ti
(a) (b)
Figure 6. Illustration of the dense region detection and concrete
parameter calculation for mi and mj, respectively.
cheap since we do not need to store the real parameter values
obtained from MICSs. In our following experiments, we calculate
the final parameters in this way. b) In order to obtain more accu-
rate parameters, we can also average the real values estimated
based on MICSs within the detected region. But this scheme de-
mands more memory for storing the real parameter values and
more time for accessing them.
Sequential computation. To further reduce the computational
complexity, we divide the whole model estimation flow into two
sequential steps: (m1, m2, m3, m4) estimation and (tx, ty) translation
estimation. In the first step, we compute the (m1, m2, m3, m4) hy-
potheses based on MICSs. This step involves C1=O(4*NMICS)
computations, where NMICS is the total number of MICSs. Then
we calculate the final parameters (m1, m2, m3, m4) based on which
we further compute translation hypotheses (tx, ty) using every
individual correspondences. A complete translation hypotheses
estimation involves C2=O(2*N) computations, where N is the
number of correspondences used for model estimation. The total
computation complexity in a sequential strategy is
Cseq= C1+C2 = O(4*NMICS)+ O(2*N)
However, without the sequential strategy, the total computation
complexity is
C = O(6*NMICS)
Since NMICSs >> N, Cseq is always smaller than C. Algorithm2
summarizes the whole flow of MICS based model estimation in a
Hough space.
5. Using MICS in Augmented Paper Systems
In this section, we briefly present three AP systems based on our
prior work, demonstrating how the MICS-based large scale image
identification can help bring new applications and business pros-
pects of augmented paper.
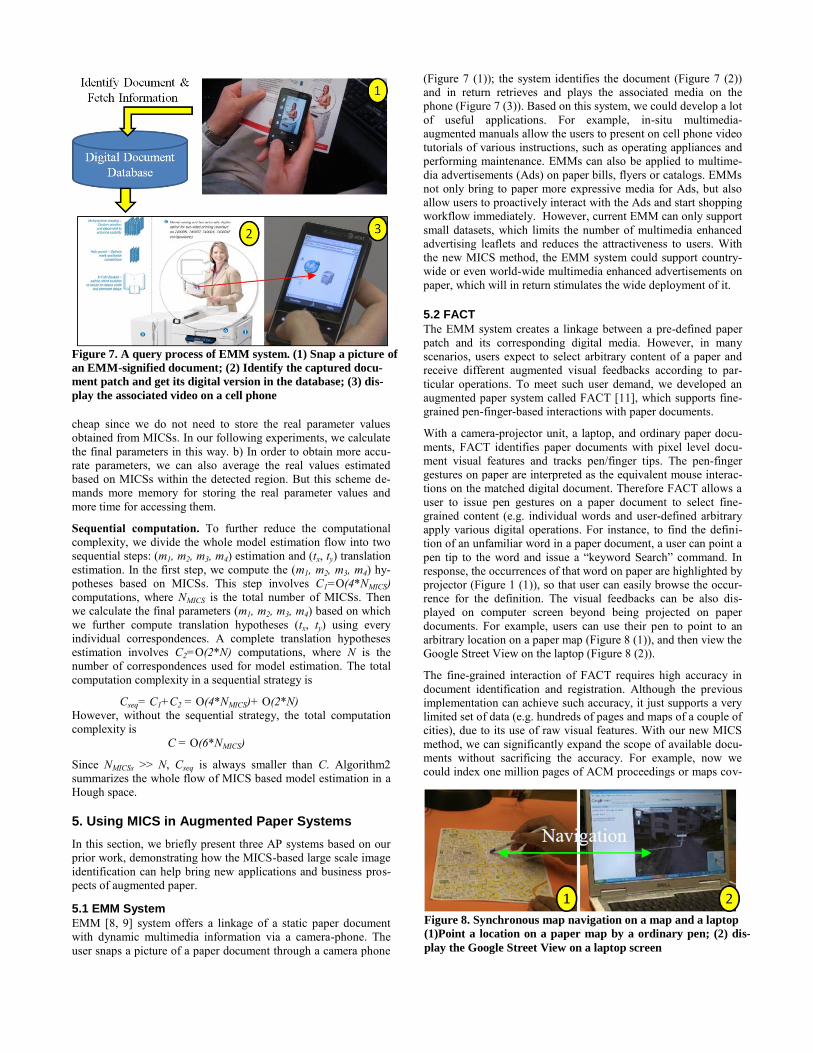
5.1 EMM System
EMM [8, 9] system offers a linkage of a static paper document
with dynamic multimedia information via a camera-phone. The
user snaps a picture of a paper document through a camera phone
(Figure 7 (1)); the system identifies the document (Figure 7 (2))
and in return retrieves and plays the associated media on the
phone (Figure 7 (3)). Based on this system, we could develop a lot
of useful applications. For example, in-situ multimedia-
augmented manuals allow the users to present on cell phone video
tutorials of various instructions, such as operating appliances and
performing maintenance. EMMs can also be applied to multime-
dia advertisements (Ads) on paper bills, flyers or catalogs. EMMs
not only bring to paper more expressive media for Ads, but also
allow users to proactively interact with the Ads and start shopping
workflow immediately. However, current EMM can only support
small datasets, which limits the number of multimedia enhanced
advertising leaflets and reduces the attractiveness to users. With
the new MICS method, the EMM system could support country-
wide or even world-wide multimedia enhanced advertisements on
paper, which will in return stimulates the wide deployment of it.
5.2 FACT
The EMM system creates a linkage between a pre-defined paper
patch and its corresponding digital media. However, in many
scenarios, users expect to select arbitrary content of a paper and
receive different augmented visual feedbacks according to par-
ticular operations. To meet such user demand, we developed an
augmented paper system called FACT [11], which supports fine-
grained pen-finger-based interactions with paper documents.
With a camera-projector unit, a laptop, and ordinary paper docu-
ments, FACT identifies paper documents with pixel level docu-
ment visual features and tracks pen/finger tips. The pen-finger
gestures on paper are interpreted as the equivalent mouse interac-
tions on the matched digital document. Therefore FACT allows a
user to issue pen gestures on a paper document to select fine-
grained content (e.g. individual words and user-defined arbitrary
apply various digital operations. For instance, to find the defini-
tion of an unfamiliar word in a paper document, a user can point a
pen tip to the word and issue a “keyword Search” command. In
response, the occurrences of that word on paper are highlighted by
projector (Figure 1 (1)), so that user can easily browse the occur-
rence for the definition. The visual feedbacks can be also dis-
played on computer screen beyond being projected on paper
documents. For example, users can use their pen to point to an
arbitrary location on a paper map (Figure 8 (1)), and then view the
Google Street View on the laptop (Figure 8 (2)).
The fine-grained interaction of FACT requires high accuracy in
document identification and registration. Although the previous
implementation can achieve such accuracy, it just supports a very
limited set of data (e.g. hundreds of pages and maps of a couple of
cities), due to its use of raw visual features. With our new MICS
method, we can significantly expand the scope of available docu-
ments without sacrificing the accuracy. For example, now we
could index one million pages of ACM proceedings or maps cov-
Figure 7. A query process of EMM system. (1) Snap a picture of
an EMM-signified document; (2) Identify the captured docu-
ment patch and get its digital version in the database; (3) dis-
play the associated video on a cell phone
Figure 8. Synchronous map navigation on a map and a laptop
(1)Point a location on a paper map by a ordinary pen; (2) dis-
play the Google Street View on a laptop screen

ering a country even the whole globe. As the result, the usefulness
of FACT is greatly improved.
5.3 PACER
FACT system enables fine-grained interaction between paper and
computers. However, to visualize feedbacks, FACT system relies
on a projector or a laptop screen, which is portable but not easy to
be deployed for mobile users. To provide a similar system that
could be used conveniently in mobile scenarios, we developed a
system named PACER with camera-touch screen phones.
PACER [12, 13] is a gesture based augmented paper system that
supports fine-grained paper document content manipulation
through the touch screen of a camera phone. Like FACT, PACER
relies on visual features to identify paper documents. It also
adopts camera-based phone-motion detection for embodied ges-
tures, e.g. marquees as shown in Figure 9 (1), with which users
can flexibly select and interact with document details (e.g. indi-
vidual words, symbols, and pixels). The touch input is incorpo-
rated to facilitate target selection at fine-granularity (see examples
in Figure 9 (2-3)), and to address some limitations of the embod-
ied interaction, such as hand jitter.
With the document identification and tracking in conjunction with
camera-touch hybrid interactions, PACER eases the development
of camera-touch phone based interactive paper applications. For
example, in scenarios of reading paper document outside without
a computer nearby, PACER enables the user to pick arbitrary
content on paper, such as math symbols (e.g. Ɵ and ɸ) and foreign
words, which are difficult for a user to type in. After selecting
paper content via PACER (Figure 10 (1-2)), the user can issue
various commands, including Google, Wikipedia, Citation
Downloading, Copy&Email, Dictionary and Keyword Finding
(Figure 10 (2)). Similar to EMM and FACT, the PACER system
can be effectively enhanced by using our MICS approach as the
underlying identification technique and thus accommodating a
large scale document data.
6. Performance Evaluation
6. 1. EMM Identification
We apply our method to EMM-signified document identification
and evaluate its performance. The performance is greatly affected
by two key parameters: 1)TopK, the number of top-ranked images
that will be verified by our method ; 2) score threshold, the mini-
mum number of correspondences between a query image and an
indexed image, below which the query image is rejected as an
unrecognized document. To ensure a best performance, we first
conduct a set of experiments for selecting the optimal parameters
for our method. After that we have a series of comparison ex-
periments to head-to-head compare our method with the state-of-
the-art approaches, hamming embedding [3] and RANSAC [4, 7].
6.1.1 Database and Query set
The dataset is composed of three image sets: 1) EMM-ICME2K,
which is generated from the ICME06 proceedings and has 2188
document images with text, images, and figures, 2) EMM-
Oxford5k, which is constructed from Oxford5k [4] dataset con-
sisting of 5k+ natural images, and 3) one million distracter im-
ages randomly crawled from Flickr. We purposely mix the dataset
with different types of images in order to mimic the cases in real
world and have a clear understanding whether or not our method
can work well for practical applications.
For ground truth, we randomly select 109 document images and
119 natural images from EMM-ICME2K and EMM-Oxford5k,
respectively.
For query images, we manually take five pictures of a hardcopy of
each ground truth image, yielding in total 1140 positive images
(one image is accidently missing thus in practical we only have
1139 query images). In order to know the effectiveness of our
method in rejecting an un-registered image, we also randomly
select another 1139 images that are not included in our database,
i.e. negative images. By combining the positive and negative im-
ages, we get a query set with total 2278 images.
6.1.2 Measurement
Detection Rate: number of positive documents that are successful identified over the total number of positive documents. In our case, the detection rate is 1 if all the 1139 positive documents are successfully identified.
Precision: number of correctly identified positive documents over the total number of identified documents.
Time Cost: average time cost in matching and verification for identifying a document. The total time consumption should take into account of SIFT feature extraction and bag-of-words quanti-zation. But since both our method and HE adopt the same proce-dure for these two steps, we only consider the difference in matching and verification.
Figure 9. A hybrid marquee gesture for copying a rectangular
region form a paper document. (1) Initial coarse selection (in
orange) with a camera-detected embodied gesture (in red)
through a Magic-Lens-Like interface. (2) Fine-tuning with a
touch gesture (in green) on the screen. (3) The whole hybrid
gesture and the resulting region. Excerpted from [12]
Figure 10. (1) Selecting paper content via a camera-phone; (2)
one selected word using PACER; (3) various commands in
PACER, such as Google, email and dictionary

Memory Cost: average memory cost involved in a practical testing,
i.e. reading from Windows task manager.
6.1.3 Settings
For all the images, we resize them to no larger than 256 x 256 and extract SIFT features of the resized images, as small image size leads to less local features, costing less memory and time. For each SIFT feature, we quantize them into visual words based on a pre-trained 100k-sized vocabulary. The vocabulary is trained using a combination of 2k ICME document images and 5k oxford natural images. All the following experiments are running on a PC equipped with an Intel Pentium (R) quad-core 2.83GHz CPU and 8GB RAM. All the time cost is reported based on the utilization of a single CPU. 6.1.4 Experimental Results
1) Selecting number of verified images (TopK)
In principle, the more images can be verified, the better detection rate and precision we can achieve, but the more time will be taken. In this experiment, we revolve around the effects of this parameter. Over 1M+ images, we test the performance of five different con-figurations: 100, 1000, 5000, 10k and entire candidate images. For this test, we set the score threshold for rejecting a document as 25. In the next experiment, we will further examine the impacts of the threshold. Table 1 displays the performance when varying the parameter TopK. When TopK is 100, the detection rate, precision and time cost are 81%, 94.5% and 280ms, respectively (first row of Table 1). These three numbers increase to 95%, 99.2% and 330ms when TopK is 5000 (third row of Table 1). Further increasing TopK no longer improves the detection rate and precison, and slightly pro-longs the processing time (last two rows of Table 1). This result reflects that all the correctly matched images are ranked in the first 5000 positions. Therefore, verifying the top 5000 candidate images is sufficient for achieving the best performance on this dataset. .
Table 1. Performance when varying TopK on 1M+ images, score threshold=25
TopK Detection rate Precision Time (ms)
100 1000 5000
10k all
0.81 0.94 0.95
0.95 0.95
0.945 0.990 0.992
0.992 0.992
280 289 330
343 345
2) Selecting threshold
The score threshold is another important parameter. A high threshold can reject many false documents and lead to a high pre-cision, but may also accidently exclude some positive documents, yielding a low detection rate. In this experiment, we test the per-formance of three different thresholds for selecting the best one. Ideally, we expect 100% detection rate and 100% precision. How-ever, in practice, it is difficult to achieve perfect performance for the both, thus between the two we opt more to have good preci-sion than good detection rate. This is because according to our observation, the users may feel more frustrated if the system re-turns a wrong document than returns nothing.
Table 2 displays the performance of three different thresholds: 10, 25 and 50. When increasing the threshold from 10 to 25, the de-tection rate declines from 0.99 to 0.95, i.e. 4% decrease, while the precision improves from 0.888 to 0.992, i.e. 12% improvement. When further increasing the threshold from 25 to 50, the detection rate drops from 0.95 to 0.77, i.e. 19% decrease, and the precision
slightly increases from 0.992 to 0.993, i.e. 0.1%. Taking into ac-count of the detection rate and precision, we choose 25 as the best parameter among the three configurations.
Table 2. Performance of different thresholds on 1M+ images, TopK=5000
Threshold Detection rate Precision
10 25
50
0.99 0.95
0.77
0.888 0.992
0.993
3) Method evaluation
Baseline. We used the bag-of-words matching plus state-of-the-art 2-stage verification as the “baseline” approach. On the first stage, we adopt HE [3], one of the best weak verification ap-proach, for pre-filtering and on the second stage, we apply RANSAC on the top10 candidate images for strong verification To examine the performance gain at each stage of the baseline approach, we also report the performance of only using HE and RANSAC, respectively. In this experiment, we set the length of hamming code as 64, which has been shown to provide an overall best performance in [3] and utilize the opencv [22] implementa-tion for RANSAC. Comparison. Table 3 displays the comparison results on the da-
tabase with 1007,251 images. We first examine the detection rate
and precision. By comparing the results in the first two columns
we obtain four key observations: 1) weak verification HE
achieves reasonable detection rate (89%) while low precision
(74%). This result confirms our former claim that weak verifica-
tion is not sufficiently effective in removing false correspon-
dences thus leads to a low precision. 2) On the contrary, strong
geometric verification method, RANSAC, achieves good enough
precision but a low detection rate. This is because, due to high
computational cost, it is only able to be applied for topk candidate
images (top 10 in these experiments), therefore it cannot detect
images that are not included in the verification list. 3) The combi-
nation of weak and strong verification in a two-stage flow
achieves both satisfactory detection rate and precision, which are
91% and 99.3% respectively. 4) Our method, as shown in the last
row obtains 4% higher detection rate than the HE+RANSAC. At
the same time, the precision achieved by our method is very close
to that is obtained in HE + RANSAC.
In terms of memory cost, our method consumes about 4GB mem-
ory space, against 6GB used by HE and 6.8GB used by
HE+RANSAC. These results are consistent with the theoretical
computation of memory cost. In our method, each local feature
cost 4bytes in storing the geometric information (2bytes for x-y
coordinates and 2 bytes for quantized scale and angle). While in
HE each feature utilizes 8bytes for encoding the 64-bit hamming
code. There are 1M images in the database, assume each image
contains around 500 local features, thus there are in total 0.5G
local features. Since HE spends 4btyes more memory space for
each local feature than our approach, accordingly, HE consumes
totally 2GB more than our method. Beyond the memory cost for
64-bit hamming code, HE+RANSAC demands another 2Bytes for
x-y coordinates of each local features. As a result, HE+RANSAC
costs 0.8GB more space than HE alone.
We finally examine the time cost and observe that, our method is
as fast as weak verification approach HE and 2.7X faster than
HE+RANSAC.
To conclude, the results in Table 3 demonstrate that our method
can achieve similar or even better detection rate and identification

precision as/than a state-of-the-art image matching approach de-
signed for object retrieval while costing much less memory and
time than it.
Table 3. Performance comparison over 1M+ images
Method Detect Rate
Precision Memory cost(GB)
Time Cost (ms)
HE RANSAC
HE+RANSAC MICS
0.89 0.79 0.91 0.95
0.744 0.957 0.993 0.992
6 3
6.8 4
333 1417 1230 330
6.2 Precise Physical-Digital Interaction Mapping
MICS is also suitable for AP systems that require high registration
accuracy for fine-grained interaction besides high identification
accuracy, such as FACT [11]. In this section, we evaluate our
method in the FACT system to confirm its high registration accu-
racy, high identification accuracy and low time complexity. In the
meantime, we compare it with original FACT implementation
[11], with the same testing images and measurements.
6.2.1 Database and Query set
The database is a combination of two sets of images: 1) 400
document images which are generated by 100 randomly selected
articles (400 pages in total) from ICME 2006 proceedings. Each
image is resized to 306x396; it has been shown in [11] that this
dimension can achieve best performance. 2) 1M images randomly
crawled from Flickr as distracters, which cover a wide range of
images including natural images, graphics, figures and text.
The ground truth images are generated by randomly choosing 116
images from the 400 document images and rendering them into
5100 x 6600 JPEG images (in 600 dpi). Within each ground truth
image, four check points are randomly selected (Figure 10 (1)),
and their coordinates at 5100 x 6600 resolutions are recorded.
Each ground truth image is printed on normal letter-size paper and
then is captured in video frames (960 x 720) by the FACT inter-
face. For each ground truth image, we select 10 continuous video
frames as query images, accordingly generating a query set of
1160 images.
To evaluate the registration accuracy, we ask users to mark the
printed check points in the query images (Figure 11 (2)). These
user-marked locations are then mapped to the digital document
reference frame and compared against the ground truth.
6.2.2 Measurement
Identification Accuracy is the percentage of the pages correctly identified.
Transform Error is the average ratio of the point mapping errors to the diagonal length of the ground truth document (8341 pixels). The point mapping error is the distance between a ground truth check point and its corresponding recognized check point.
Identification Time is the time during for identifying a document image and deriving the coordinate transform matrices.
6.2.3 Settings
We utilize a Logitech QuickCam Pro Webcam and 3M MPro 110 portable digital projector. They connected to the PC via a USB and a VGA port respectively, with the projector as the secondary display of the PC. The camera-projector unit was attached to a lamp stand, and was about 25cm high above the table. At this distance, the camera roughly covered two letter-size paper sheets, and the projection area was about 13cm x 9.5cm. For all the im-ages, we extract SIFT features and quantize them into visual
words based on a pre-trained 100k-sized vocabulary. The vocabu-lary is trained using a combination of 3k document images and 3k natural images. According to the results of previous parameter selection experiments and we set TopK and score threshold to 5000 and 25, respectively.
6.2.4 Experimental Results
We first examine Identification Accuracy. As shown in the first two rows of Table 4, for the small dataset with 400 document images, our approach achieves the same perfect accuracy, i.e. 100% as [11] does. As the dataset scales up to 1M images, our method can still maintain the 100% identification accuracy (see the third row of Table 4), which confirms the feasibility of our method for a large-scale FACT system.
We further check Transform Error of those correctly identified frames. The result is very encouraging: the average error is <= 0.67% for both small dataset with 400 registered documents and 1M-scale large dataset. The same transform errors for both small and large datasets are reasonable: Our method achieves 100% identification accuracy in both small and large dataset. As long as a document is correctly identified, the same matching pair of a paper document and its digital version is used for deriving the transformation matrix, yielding the same transform errors.
When comparing the first two rows of Table 4 we observe that our method achieves smaller transforms errors than the prior iden-tification technique used in the original FACT system. The prior identification technique leverages ANN (Approximate Nearest Neighbor) for fast matching SIFT features, and removes SIFT feature pairs with distance over a pre-defined threshold as false matching pairs. Such false-match-filtering strategy does not util-ize spatial layout constraints, thus removes less false matches than our new method, which leads to larger transform errors. In all, the small transform errors reflect that our method is feasible and ef-fective for fine-grained interaction of the FACT system.
In terms of Identification Time, our method is more efficient than the prior technique when running on computers of similar con-figurations. As shown in the first two rows, when identifying documents in small datasets with 400 documents, our method utilizes 960ms, against 2311ms for [11]. In particular, in our method on average 732ms is used for SIFT feature extraction and the remaining 228ms is consumed for matching and computing the transform matrix. As the dataset scales up to 1M+ images, our method costs in total 2166ms. Although the processing is not real time, our early deployment shows that it does not prevent user interaction much, because the paper usually remains static during within page fine-grained interaction and the pen-tip detection is actually performed in real-time.
Table 4. Performance comparison for FACT
Method Database Size
Accuracy Transform Error
Time (ms)
Figure 11. 1) A testing page with ground truth check points (red
cross); 2) A camera image with manually marked check points
(white cross)
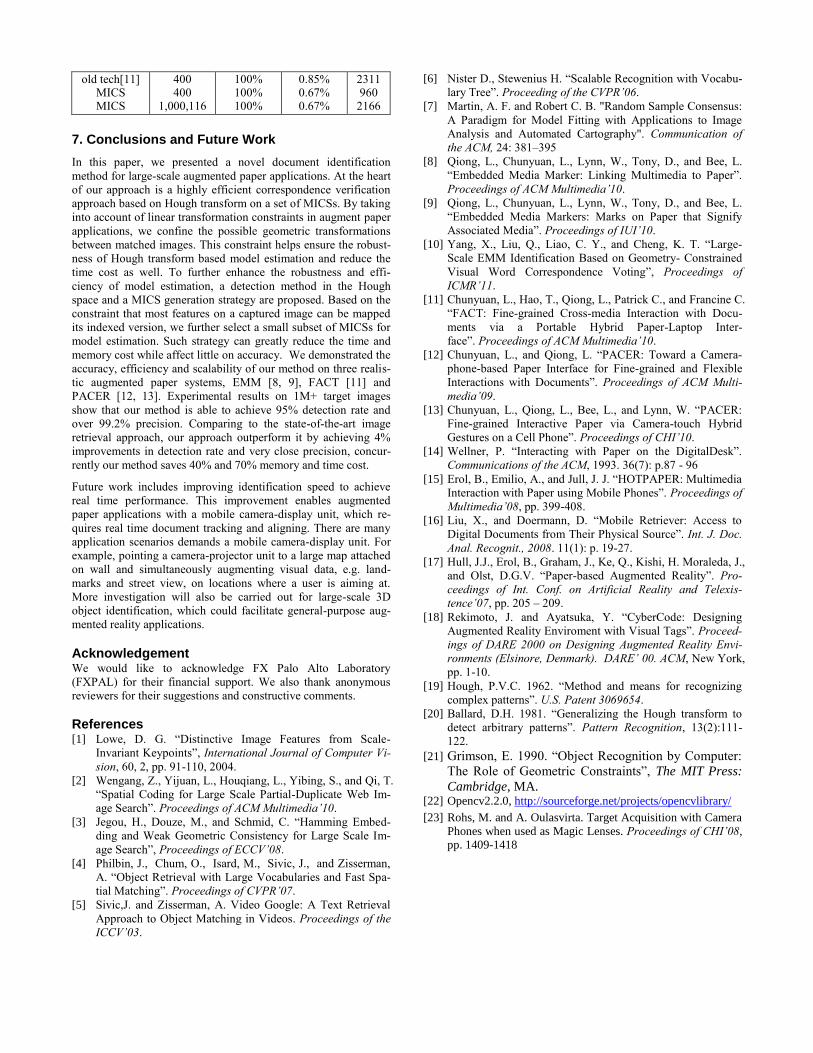
old tech[11] MICS MICS
400 400
1,000,116
100% 100% 100%
0.85% 0.67% 0.67%
2311 960
2166
7. Conclusions and Future Work
In this paper, we presented a novel document identification
method for large-scale augmented paper applications. At the heart
of our approach is a highly efficient correspondence verification
approach based on Hough transform on a set of MICSs. By taking
into account of linear transformation constraints in augment paper
applications, we confine the possible geometric transformations
between matched images. This constraint helps ensure the robust-
ness of Hough transform based model estimation and reduce the
time cost as well. To further enhance the robustness and effi-
ciency of model estimation, a detection method in the Hough
space and a MICS generation strategy are proposed. Based on the
constraint that most features on a captured image can be mapped
its indexed version, we further select a small subset of MICSs for
model estimation. Such strategy can greatly reduce the time and
memory cost while affect little on accuracy. We demonstrated the
accuracy, efficiency and scalability of our method on three realis-
tic augmented paper systems, EMM [8, 9], FACT [11] and
PACER [12, 13]. Experimental results on 1M+ target images
show that our method is able to achieve 95% detection rate and
over 99.2% precision. Comparing to the state-of-the-art image
retrieval approach, our approach outperform it by achieving 4%
improvements in detection rate and very close precision, concur-
rently our method saves 40% and 70% memory and time cost.
Future work includes improving identification speed to achieve
real time performance. This improvement enables augmented
paper applications with a mobile camera-display unit, which re-
quires real time document tracking and aligning. There are many
application scenarios demands a mobile camera-display unit. For
example, pointing a camera-projector unit to a large map attached
on wall and simultaneously augmenting visual data, e.g. land-
marks and street view, on locations where a user is aiming at.
More investigation will also be carried out for large-scale 3D
object identification, which could facilitate general-purpose aug-
mented reality applications.
Acknowledgement We would like to acknowledge FX Palo Alto Laboratory
(FXPAL) for their financial support. We also thank anonymous
reviewers for their suggestions and constructive comments.
References [1] Lowe, D. G. “Distinctive Image Features from Scale-
Invariant Keypoints”, International Journal of Computer Vi-
sion, 60, 2, pp. 91-110, 2004.
[2] Wengang, Z., Yijuan, L., Houqiang, L., Yibing, S., and Qi, T.
“Spatial Coding for Large Scale Partial-Duplicate Web Im-
age Search”. Proceedings of ACM Multimedia’10.
[3] Jegou, H., Douze, M., and Schmid, C. “Hamming Embed-
ding and Weak Geometric Consistency for Large Scale Im-
age Search”, Proceedings of ECCV’08.
[4] Philbin, J., Chum, O., Isard, M., Sivic, J., and Zisserman,
A. “Object Retrieval with Large Vocabularies and Fast Spa-
tial Matching”. Proceedings of CVPR’07.
[5] Sivic,J. and Zisserman, A. Video Google: A Text Retrieval
Approach to Object Matching in Videos. Proceedings of the
ICCV’03.
[6] Nister D., Stewenius H. “Scalable Recognition with Vocabu-
lary Tree”. Proceeding of the CVPR’06.
[7] Martin, A. F. and Robert C. B. "Random Sample Consensus:
A Paradigm for Model Fitting with Applications to Image
Analysis and Automated Cartography". Communication of
the ACM, 24: 381–395
[8] Qiong, L., Chunyuan, L., Lynn, W., Tony, D., and Bee, L.
“Embedded Media Marker: Linking Multimedia to Paper”.
Proceedings of ACM Multimedia’10.
[9] Qiong, L., Chunyuan, L., Lynn, W., Tony, D., and Bee, L.
“Embedded Media Markers: Marks on Paper that Signify
Associated Media”. Proceedings of IUI’10.
[10] Yang, X., Liu, Q., Liao, C. Y., and Cheng, K. T. “Large-
Scale EMM Identification Based on Geometry- Constrained
Visual Word Correspondence Voting”, Proceedings of
ICMR’11.
[11] Chunyuan, L., Hao, T., Qiong, L., Patrick C., and Francine C.
“FACT: Fine-grained Cross-media Interaction with Docu-
ments via a Portable Hybrid Paper-Laptop Inter-
face”. Proceedings of ACM Multimedia’10.
[12] Chunyuan, L., and Qiong, L. “PACER: Toward a Camera-
phone-based Paper Interface for Fine-grained and Flexible
Interactions with Documents”. Proceedings of ACM Multi-
media’09.
[13] Chunyuan, L., Qiong, L., Bee, L., and Lynn, W. “PACER:
Fine-grained Interactive Paper via Camera-touch Hybrid
Gestures on a Cell Phone”. Proceedings of CHI’10.
[14] Wellner, P. “Interacting with Paper on the DigitalDesk”.
Communications of the ACM, 1993. 36(7): p.87 - 96
[15] Erol, B., Emilio, A., and Jull, J. J. “HOTPAPER: Multimedia
Interaction with Paper using Mobile Phones”. Proceedings of
Multimedia’08, pp. 399-408.
[16] Liu, X., and Doermann, D. “Mobile Retriever: Access to
Digital Documents from Their Physical Source”. Int. J. Doc.
Anal. Recognit., 2008. 11(1): p. 19-27.
[17] Hull, J.J., Erol, B., Graham, J., Ke, Q., Kishi, H. Moraleda, J.,
and Olst, D.G.V. “Paper-based Augmented Reality”. Pro-
ceedings of Int. Conf. on Artificial Reality and Telexis-
tence’07, pp. 205 – 209.
[18] Rekimoto, J. and Ayatsuka, Y. “CyberCode: Designing
Augmented Reality Enviroment with Visual Tags”. Proceed-
ings of DARE 2000 on Designing Augmented Reality Envi-
ronments (Elsinore, Denmark). DARE’ 00. ACM, New York,
pp. 1-10.
[19] Hough, P.V.C. 1962. “Method and means for recognizing
complex patterns”. U.S. Patent 3069654.
[20] Ballard, D.H. 1981. “Generalizing the Hough transform to
detect arbitrary patterns”. Pattern Recognition, 13(2):111-
122.
[21] Grimson, E. 1990. “Object Recognition by Computer:
The Role of Geometric Constraints”, The MIT Press:
Cambridge, MA. [22] Opencv2.2.0, http://sourceforge.net/projects/opencvlibrary/
[23] Rohs, M. and A. Oulasvirta. Target Acquisition with Camera
Phones when used as Magic Lenses. Proceedings of CHI’08, pp. 1409-1418