minimum wages and job search: what do employment effects really
TRANSCRIPT

Minimum Wages and Job Search: WhatDo Employment Effects Really Measure?Dr. Peter Arcidiacono, Duke University
Dr. Tom Ahn, Duke University
August 2004

Employment Policies Institute Advisory Board
Dr. Charles Brown – Professor of Economics, University of Michigan
Dr. Richard Burkhauser – Chairman of Economics Department, Cornell University
Dr. Daniel Hamermesh – Professor of Economics, University of Texas
Dr. James Heckman – Nobel Laureate and Professor of Economics, University of Chicago
Dr. Kevin Murphy – Professor of Economics, University of Chicago
Dr. June O’Neil – Former Congressional Budget Office Director and Professor of Economics,
City University of New York
Dr. Peter S. Arcidiacono is an Assistant Professor of Economics at Duke University. His interests include
discrimination and higher education. Dr. Arcidiacono has authored several articles appearing in leading
economics journals including Econometrica, the Journal of Econometrics, the Journal of Public
Economics, and the Journal of Urban Economics. He received his Ph.D. in Economics from the
University of Wisconsin in 1999.
Dr. Thomas Ahn completed his Ph.D. in Economics at Duke University in 2003. Dr. Ahn has published
in the Journal of Urban Economics. He specializes in the study of search models as applied to mini-
mum wages and unions. He is currently performing his military service in Korea.
T he Employment Policies Institute (EPI) is a nonprofit research
organization dedicated to studying public policy issues
surrounding employment growth. In particular, EPI research
focuses on issues that affect entry-level employment. Among other
issues, EPI research has quantified the impact of new labor costs on job
creation, explored the connection between entry-level employment and
welfare reform, and analyzed the demographic distribution of mandated
benefits. EPI sponsors nonpartisan research that is conducted by
independent economists at major universities around the country.

Employment Policies Institute | www.EPIonline.orgi
Executive SummaryIn this study, Drs. Peter Arcidiacono and
Thomas Ahn investigate claims of positive
employment effects resulting from a minimum
wage. The study first highlights the multitude of
reasons why, under the classical economic
model—the widely accepted model of economic
behavior—an increase in the minimum wage can-
not lead to an increase in employment. Then, by
relaxing certain assumptions critical to the clas-
sical model, a search model is constructed. This
model—which runs contrary
to commonly accepted eco-
nomic theory—is created to
study a hypothetical situation
of positive employment
effects from a minimum
wage increase? Even in this
case, the authors show that
those individuals who most
value minimum wage jobs—
current employees—end up
with a higher probability of
being unemployed after a
minimum wage increase. In
fact, all increases in the minimum wage under
this model result in decreased employment
prospects for individuals.
The authors conclude that the overall employ-
ment level does not fully describe the negative
effects resulting from a minimum wage increase?
Instead, this antipoverty policy should be
judged by its effect on the group it is attempt-
ing to help—current minimum wage employees.
Examining the distributional employment results
reveals that minimum wage increases decrease
employment opportunities for current employ-
ees—the very individuals these policies are
attempting to help. This decreased probability of
employment is a result of increased labor force
participation by teenagers from wealthy families.
Competitive Labor MarketRecent studies suggesting a lack of employ-
ment loss—or even more unbelievably, an
increase in employment—
after a minimum wage
increase generated signifi-
cant criticism from the
academic community. A vast
amount of this criticism
stems from the failure
of studies’ authors—most
prominently Drs. David
Card and Alan Krueger—to
advance any rigorous theory
explaining their results.
Arcidiacono and Ahn estab-
lish that in the competitive
economic model, raising the mandated wage
level cannot result in an increase in employment.
Decades of economic research and theory show
that these increases result in fewer employment
opportunities for affected individuals. Increasing
the minimum wage will only result in those
employees with the lowest reservation wages—
the least skilled—facing increased difficulties
securing and retaining employment.
Minimum Wages and Job Search: What DoEmployment Effects Really Measure?
“Those individuals who
most value minimum
wage jobs—current
employees—end up with a
higher probability of being
unemployed after a
minimum wage increase.”

iiEmployment Policies Institute | www.EPIonline.org
Search ModelEconomists claiming positive employment
results from a minimum wage hike suggest
the labor market may be best described as a
monopsony—a market with one buyer and
many sellers. Most economists, however, dis-
miss these claims because the requirement of
a captive labor market is difficult to achieve
in an era with a high degree of firm and
labor mobility.
Arcidiacono and Ahn avoid monopsony argu-
ments and construct a search model in which
employment is determined by the number of
successful matches between employers and
applicants. While this does not require a captive
labor market, it does require violating many crit-
ical assumptions of the classical model. The
authors do not state that they believe the labor
market is best represented by this search model
but, rather, construct the model as a means to
examine the distributional results of a hypo-
thetical situation of no employment loss after a
minimum wage increase.
The key difference between the search
model and the classical model is that in the
search model, employment level is not deter-
mined solely by labor demand (the number
of searching firms) but also by labor supply
(the number of applicants). Under the com-
petitive model, the number of employees
seeking employment does not affect the
number hired if the wage floor is above the
equilibrium price. Instead, labor demand is
expected to be less than labor supply, and
the resulting surplus represents unemploy-
ment from the wage floor. If labor demand is
not the sole determinant of the employment
level (i.e., labor supply influences total
employment), it is possible to imagine a situ-
ation in which a minimum wage hike does
not result in decreased employment. As the
number of employees searching for jobs
increases in response to a minimum wage
increase, it could overcome the number of
firms no longer interested in employment at
the higher wage, resulting in an increased
number of successful matches. It is impor-
tant to note, however, that in all the
situations described by this model—even
those in which overall employment increas-
es—an increase in the minimum wage must
result in a decreased probability of an indi-
vidual finding a job.
Employment Level or Distribution—Which Is The Best Measure?What happens to current minimum wage
employees under this hypothetical scenario?
These often low-skilled employees are left
with decreased employment opportunities.
The authors found that “the effect of an
increase in the minimum wage may appear to
have little effect on the employment
prospects of low-income workers if one only
looks at employment levels. However, as our
search model shows, the employment levels
may be masking much larger changes in the
probability of finding a job.” If this is the
case, the overall employment level is an
incomplete gauge of the damage caused by a
minimum wage hike.
Why might these underlying unemployment
rates change while overall employment does
not? Previous economic research suggests that
as the mandated wage level rises, current low-
skilled minimum wage recipients face
increased competition from more experienced
and skilled applicants attracted to the new
wage. As a result, the very individuals mini-
mum wage hikes are intended to help—those
with the lowest wages and skill levels—are the
individuals most hurt by these policies.

The employment level becomes an ineffective
indicator because even “if the number of search-
ing workers increases as a result of an increase
in the minimum wage, the expected loss in
employment understates the loss of any one
individual obtaining a job.” A higher minimum
wage will mean little to current employees
unable to secure continued employment. To
fully understand the impact of an increase min-
imum wage, it is clear that one must examine
both the overall employment level and the dis-
tributional impact.
What Are the Distributional Effects?The study found that a 10 percent increase in
the minimum wage causes a 2.9 percent
decrease in the probability of employment for
job searchers. Put into perspective, the recently
proposed federal minimum wage increase to
$7.00 would result in a 10 percent decrease in
the probability of finding a job. As a result,
those individuals who most want minimum
wage jobs—current minimum wage employees—
are less likely to retain employment after the
wage increase.
If the point of raising the minimum wage is
to improve the living conditions of current
low-wage employees, changes in the employ-
ment level are an inappropriate measure. The
authors show that increased unemployment is
focused on low-skilled and low-income
employees who must compete with wealthier
and more skilled entrants to the labor force.
When searching for jobs, individuals from
“high-income, highly educated, two parent
families are more likely to actually find a job”
than the average searcher, who is more likely
to come from a low-income family with low
parental education. Policymakers must exam-
ine these differing unemployment rates before
casting judgment on a wage increase.
Who Benefits from a Minimum Wage HikeCurrent low-wage workers—the intended ben-
eficiaries of a minimum wage increase—are
those who are most hurt by raising the
mandated wage. This alone should caution
policymakers. Even more troubling, the
authors found that these low-skilled workers
are displaced by wealthy teens who did not
even participate in the labor force at the lower
minimum wage. While there is nothing wrong
with wealthy teens entering the labor market,
one must question the efficacy and equity of
a policy that takes jobs from current low-
skilled employees and gives them to wealthy
teens with marginal labor force attachment.
The authors utilize 12 years of Current
Population Survey (CPS) data to examine who
actually benefits from an increased minimum
wage. The authors find that raising the mini-
mum wage causes teenagers, particularly
teenagers from wealthy families, to increase
labor force participation. These individuals
have higher reservation wages—due to both
supplemental income and greater returns
from education—causing them to enter the
labor force at the new wage while they were
content not to work at the previous wage. As
a result, current employees “are hurt by a min-
imum wage increase as they are now
competing with teenagers from wealthier fam-
ilies.” These wealthy teenagers are more likely
to secure a job, decreasing employment
opportunities for current minimum wage
employees.
ConclusionWhile much has been said recently about a
small number of largely discredited studies
showing no decrease in employment from a
minimum wage increase, this paper clearly
iiiEmployment Policies Institute | www.EPIonline.org

shows that these increases are not without
cost. Even if the improbable circumstance
described in these studies were to occur,
significant and harmful changes in the
employment rates of different subgroups
make an increased minimum wage destruc-
tive to incumbent workers. Examining the
distributional employment effects reveals
that increases in the minimum wage harm
the employment prospects of entry-level
employees. In many cases, low-skilled
employees pay for the increase with their
jobs. Who really benefits from these
increases? CPS data reveal that the benefici-
aries are wealthy teens who were not even
working at the previous minimum wage.
These distributional effects show that the
minimum wage is an inefficient anti poverty
effort, that harms the very individuals it is
designed to assist.
ivEmployment Policies Institute | www.EPIonline.org
— Craig GarthwaiteDirector of Research

vEmployment Policies Institute | www.EPIonline.org

1Employment Policies Institute | www.EPIonline.org
Minimum Wages and Job Search: What DoEmployment Effects Really Measure?
Peter Arcidiacono and Tom Ahn, Duke University
How does increasing the minimum wage
affect the labor market outcomes of its intend-
ed beneficiaries? Economists have generally
believed that increasing the minimum wage
hurt low-income workers by raising the cost of
labor. A higher cost of labor means firms sub-
stitute away from workers to capital and there-
fore leads to job losses among the most dis-
advantaged. Until recently,
there was consensus on the
direction of the employment
effect of an increase in the
minimum wage, with the
only debate being on the
magnitude of the effect.
Although the negative
employment effect of an
increase in the minimum
wage was never particularly
strong, the sign of the effect
matched the classical theory.
From the perspective of
economists, the one case in
which increasing the minimum wage could
lead to a positive effect on both employment
and earnings of low-income workers would
be if firms operated as monopsonies. In the
simplest case, a firm operates as a single
buyer of labor—the reverse of the standard
monopoly model where there is one seller.
Since the firm is the only buyer and must pay
one wage rate to its workforce, increasing the
wage to hire one more worker leads to
increases in wages for all workers. This leads
to an inefficiently low wage and number of
workers. Monoposony stories have held little
weight in the eyes of economists, however,
because these stories require a captive labor
market—-firm and worker mobility should
render a monopsony powerless (Boal and
Ransom 1997).
However, recent work by Card and Krueger
(1994, 1995) calls into ques-
tion the classical analysis.
In their 1994 article in
the American Economic
Review, they show that
increases in the New Jersey
minimum wage actually
increased employment at
fast food restaurants relative
to Pennsylvania, which did
not have a similar minimum
wage increase. In their
1995 book, Myth and
Measurement: The New
Economics of the Minimum
Wage, they argue that the evidence of the clas-
sical model is not particularly convincing. The
effect of increases in either federal or state
minimum wages typically leads to insignificant
effects on employment.
There has been considerable debate regard-
ing these findings, with Welch et. al. (1995) and
Neumark and Wascher (1994) calling into ques-
tion the robustness of the results from Card and
Krueger’s 1994 paper. Indeed, the reaction by
economists has been quite hostile to Card and
“The empirical estimates sug-
gest that the distributional effects
of a minimum wage increase
favor those who come from
wealthier families, … [Current
employees] are hurt by a mini-
mum wage increase as they are
now competing with teenagers
from wealthier families.”
Krueger’s evidence—-in part because of the lack
of a credible model that which can generate the
positive employment effects they find. This
view is best summarized by a quote in the Wall
Street Journal from James M. Buchanan, a 1986
Nobel laureate, who said:
Just as no physicist would claim that
“water runs uphill,” no self-respecting
economist would claim that increases
in the minimum wage increase employ-
ment. Such a claim, if seriously
advanced, becomes equivalent to a
denial that there is even minimal sci-
entific content in economics, and that,
in consequence, economists can do
nothing but write as advocates for ide-
ological interests. Fortunately, only a
handful of economists are willing to
throw over the teaching of two cen-
turies; we have not yet become a bevy
of camp-following whores.” Wall Street
Journal April 25, 1996)
We believe that many of Buchanan’s objec-
tions arise because there are no credible eco-
nomic models that includefree entry by firms
and firms competing for workers, and in which
an increase in the minimum wage increases
employment. In this paper we present a gener-
al equilibrium search model. This model
exhibits all three of these features and is a spe-
cialized version of Ahn and Arcidiacono (2004).
In a search model, the number of matches
(the employment level) depends on both the
number of searching workers and the num-
ber of searching firms. Firms and workers
each pay a fixed cost to search, with the
endogenous entry of the former leading to
zero expected profits in equilibrium. The
key difference between search models and
the classical model is that the employment
level depends on both the number of search-
ing workers and the number of searching
firms. In the classical model, this is not the
case. Rather, in the presence of a minimum
wage, the employment level is determined
solely by labor demand (the number of
searching firms) because the minimum wage
operates as a price floor. However, in a
model with search frictions, the employment
level can increase even if the number of
searching firms falls. This can occur because
increasing the minimum wage leads to more
workers searching for jobs. More workers
also search for jobs in the classical analysis,
but in that model the entry of workers has
no effect on the employment level.
An increase in the minimum wage may
appear to have little effect on the employment
prospects of low-income workers if one looks
only at employment levels. However, as our
search model shows, the employment levels
may be masking much larger changes in the
probability of actually finding a job.
Individuals who decide to search because of
the increase in the minimum wage may cause
higher employment levels. However, the high-
er minimum wage reduces the probability of
any one individual finding a job, including
those who wanted the low-wage job prior to
the minimum wage increase. Hence, there
may be large negative welfare effects from a
minimum wage increase, even if the employ-
ment level increases. As in Luttmer (1998) and
Glaeser (1996), in expectation, those with the
lowest reservation wages are hurt most by an
increase in the minimum wage, when workers
are randomly allocated to jobs.
Another paper also has firms earning zero
expected profits and yet can still generate
employment increases from a minimum
2Employment Policies Institute | www.EPIonline.org

wage hike. Lang and Kahn (1998) use a
model with segmented labor markets and
firms with preferences for workers of a par-
ticular type to obtain their result. Without a
minimum wage, an equilibrium exists in
which second-class workers have high
employment rates and low wages, while pre-
ferred workers have just the opposite and
are better off in expectation. For a minimum
wage slightly above the equilibrium wage in
the low-wage market, Lang and Kahn show
that an equilibrium exists in which some pre-
ferred workers now search for minimum
wage jobs, trading off higher wages for high-
er employment probabilities, and that this
effect can more than compensate for the
loss of jobs for the second-class workers.1
Flinn (2003) also estimates a search model
with minimum wages. His paper arises out of
the traditional search literature, in which an
individual’s reservation wage is determined by
the expected wages from continued search. In
our model, reservation wages are determined
by the value of leisure. The advantage to
Flinn’s work is that his paper estimates a con-
tinuous-time infinite-horizon model, while
ours is static. However, a significant benefit
from using our model is that we have endoge-
nous labor supply and demand, whereas in
Flinn’s model the number of searching work-
ers and firms is fixed. Our model is then able
to have firms earn zero expected profits in
equilibrium and is also able to generate posi-
tive employment effects from an increase in
the minimum wage.
For the search model to explain why esti-
mated employment responses to minimum
wages are so small and still have large
movements in labor demand, the labor sup-
ply response of teenagers to an increase in
expected wages must be large. We test this
using 12 years of data from the Current
Population Survey. We find that, indeed,
teen labor supply is responsive to increases
in the expected wage. Further, we show that
teenagers from high-income families have
higher reservation values than those from
low-income families. Hence, as the mini-
mum wage increases, the composition of
searching workers changes as the searching
workers are now more likely to come from
wealthier families.
This still begs the question as to why the
low-wage market should behave differently
from the rest of the labor market. The
answer lies in the types of workers who are
looking for work in the low-wage labor
market. For example, teenagers are much
more prevalent in this labor market. While
the labor force participation rates for adult
males are very high, teenagers are less apt to
participate. Recall that the key point in our
analysis is that the number of employees is
determined both by the number of search-
ing firms and the number of searching
workers. As wages increase, participation
rates for the adult male labor force will
remain virtually unchanged. However, for
teenagers, a group that is relatively unat-
tached to the labor force, the increase in
the wage may lead to a large increase in
labor force participation rates.
The next section shows the classical analy-
sis and how microeconomics textbooks typ-
ically misrepresent the welfare effects of a
minimum wage increase. Section 2 presents
a specialized version of the model in Ahn
and Arcidiacono (2004). Section 3 shows
how positive employment effects from an
increase in the minimum wage can arise
even if firms earn zero expected profits.
Section 4 examines the welfare effects for
3Employment Policies Institute | www.EPIonline.org

4Employment Policies Institute | www.EPIonline.org
workers, showing that those who most want
the minimum wage jobs are hurt most by the
increase. Section 5 presents data used in the
econometric analysis. Section 6 presents
some empirical evidence in support of the
model. Section 7 concludes.
1. The Classical ModelThe classical analysis of the effects of a min-
imum wage can be found in most introduc-
tory economics textbooks. Generally, how-
ever, the welfare analysis in these textbooks
is either not done or relies on assumptions
about the labor market that lead to the low-
est possible deadweight loss from an
increase in the minimum wage.2 To see this,
first consider the employment levels in the
classical analysis once a minimum wage is
implemented. Figure 1 shows this situation.
Note that, at the minimum wage, the elas-
ticity of the labor supply curve does not
affect the employment level as long as at the
minimum wage the number of interested
workers is above Q. This is because of the
implicit assumption that firms and workers
can effortlessly and instantaneously find
each other. Therefore, the employment level
is determined solely by the minimum of the
number of vacancies and the number of
interested workers. Since the number of
vacancies is smaller than the number of
interested workers in the case of a price
floor, the employment level is unaffected by
the elasticity of labor supply. Note also that
Classical Employment Losses From Minimum Wage IncreaseFigure 1
Labor Supply
Jobs/Workers
Labor Demand
Wag
e
W
Q Q Q
W
*
*
In the classical model, a binding minimum wage means that the employment level is determined only by
labor demand. Here, the imposition of a minimum wage causes employment to fall from Q* to Q. The
number of workers interested in working at the minimum wage, Q, only affects the unemployment rate,
not the employment level.

Employment Policies Institute | www.EPIonline.org5
Smallest Deadweight Loss in the Classical Model Figure 2
Labor Supply
FirmLosses
Worker Losses
Worker Gains
Profit
Jobs/Workers
Labor Demand
Wag
e
W
W
*
If the workers who obtain the mini-
mum wage jobs are those who
wanted the minimum wage jobs the
most, deadweight loss is minimized.
Some of the firm’s surplus is now
given to the workers, the worker
gains region, while the deadweight
loss is given by the sum of firm
losses and worker.
Deadweight Loss When All Have the Same Probability of EmploymentFigure 3
Labor Supply
Labor Demand
Jobs/Workers
Wag
e
Q Q Qc
W
*
BA
When all searching workers have
the same probability of finding a
match, the workers who wanted
the minimum wage most lose. In
particular, the kinked line repr
sents the expected worker surplus
given the minimum wage—the
worker surplus at the minimum
wage times the probability of
being employed. Those who now
have expected surpluses that are
lower than the surplus under the
market clearing wage, workers to
the left of Qc, lose because of the
minimum wage increase. Since the
workers who want the job the
most now have the same probabil-
ity as all other searching workers
of fin ing a job, deadweight loss
increases. The new deadweight
loss is Area A minus Area B.

6Employment Policies Institute | www.EPIonline.org
the number of those interested in working
has increased from Q* to Q with the
increase in the minimum wage.
The question, then, is who gets these min-
imum wage jobs? The standard textbook
analysis assumes that the people who most
want the minimum wage jobs, those to the
left of Q, will be the ones to obtain the jobs.
One way of calculating the extra gains a
worker receives from having a minimum
wage job over being unemployed is taking
the difference between the minimum wage
and the wage that would make the individ-
ual indifferent between working and not
working (their “point” on the labor supply
curve). This welfare analysis is displayed in
Figure 2, showing profit, worker gains and
losses, and the deadweight loss from the
minimum wage. Note that, in addition to
firms losing profits, some workers interested
in the minimum wage job also lose. Namely,
those individuals who fall between Q and
Q* would have been employed when there
was no minimum wage but are not employed
at the minimum wage w.
However, the “winners’’ may not be the
ones who want the minimum wage jobs the
most. In fact, those who most want the mini-
mum wage jobs are unlikely to have the job
networks necessary to obtain a job when jobs
are rationed. Let us instead operate under the
assumption that everyone interested in a min-
imum wage job has an equal probability of
finding one. That is, we confer an additional
advantage to those workers who want the
minimum wage job the most.
If it can be shown that even under this
case, these workers are not “winners’’ after
a minimum wage increase, it becomes clear
that we need to consider the welfare impli-
cations of a minimum wage increase with
much more care. This probability of finding
a minimum wage job would be given by
Q/Q. To calculate the expected gains from
the minimum wage for a particular individ-
ual, we take the probability of finding a job
times the difference between the minimum
wage and the wage that would make the
worker indifferent between working and
not working.
Figure 3 shows the welfare analysis for this
case. The workers who prefer the minimum
wage increase are not the ones who most
want the minimum wage jobs. In fact, those
who most want minimum wage jobs would
be most vehemently against an increase. This
is because it is no longer the case that work-
ers who desire the minimum wage jobs the
most get them. In particular, the winners are
those individuals who are interested in work-
ing at the minimum wage but who were
either uninterested in working before the
minimum wage (those between Q* and Q)
or who were marginally interested before
the minimum wage change (those between
Qc and Q*).3 However, those who wanted
the minimum wage jobs the most (i.e had
the lowest reservation wages) lose. These
individuals are willing to trade off a higher
probability of finding a job for a lower wage.
On the other hand, the winners are those
whose employment is of sufficiently low pri-
ority that they are willing to accept a lower
probability of finding a job for a higher
wage. Note that the deadweight loss is high-
er here than when the minimum wage jobs
are given to those who want them the most—
-the allocation of jobs to workers is ineffi-
cient in this latter case.
The allocation of jobs to workers, however,

Employment Policies Institute | www.EPIonline.org7
does not affect the basic result from the clas-
sical analysis: increasing the minimum wage
cannot lead to an increase in the level of
employment. This occurs because, at the min-
imum wage, the level of employment is solely
determined by labor demand. In the next sec-
tion, we relax this restriction and instead use a
matching model with two-sided search. The
employment level will then depend on both
the number of searching firms and the num-
ber of searching workers. With an increase
in the number of searching workers, even if
the number of searching firms falls, it is pos-
sible to increase the employment level with
an increase in the minimum wage. However,
the welfare analysis turns out to be very
much the same as the classical case when
workers are randomly matched to jobs. In
particular, those searching workers who are
most interested in employment are hurt by
the minimum wage increase, with marginally
interested workers benefiting.
2. The Search ModelIn this section we present a two-sided search
model designed to highlight the effects of a
minimum wage increase in the low-wage mar-
ket. In the two-sided search model, firms
search for workers and workers search for
firms. The model is a special case of Ahn and
Arcidiacono (2004). We focus in particular on
the market for teenage workers. Teenage
workers are differentiated in their reservation
values for being unemployed, which can be
interpreted as the value of schooling. Students
who expect to acquire much human capital in
school will consider a minimum wage job to
be relatively unattractive.
Let there be N teenagers, N of which work
where N is endogenous. All teenagers inter-
ested in searching pay a search cost K. Let pindicate the probability of finding a match
and is common across individuals. All match-
es pay W, the minimum wage. Individuals are
assumed to be risk neutral. The expected
value of searching, Vi , is then given by
(1)
where Ri is the reservation value for individual
i. Individuals search if Vi > 0.4
Each worker can match with at most one
firm. Similarly, each firm can match with at
most one worker.5 The number of searching
firms, J, is determined by the expectation of
earning zero profits in equilibrium. All firms
face an identical probability of finding a
match, q, and pay a cost, C, to search. In equi-
librium, expected profits are then given by
(2)
where S is the value of the match.6
To close the model, we need to specify the
matching process. The matching process most
common in the search literature (see
Petrongolo and Pissarides, 2001, for details)
takes the Cobb-Douglas form
(3)
where Q is the employment level, A is a con-
stant, and 0 < α < 1. The “min” on the out-
side of the matching function restricts the
level of unemployment to be no greater than
either the number of searching firms or the
number of searching workers. Searching work-
ers and searching firms then have match prob-
abilities ,respectively. Ahn
and Arcidiacono (2004) show that an equilib-
rium exists for this model.

3. Positive Employment EffectsWith the basic model in hand, we now show
that the model is able to generate positive
employment effects from an increase in the
minimum wage using reasonable parameter
values. To begin, note that an increase in the
employment does not imply an increase in the
probability of finding employment. In fact,
the probability of finding a match must fall in
this model given an increase in the minimum
wage. In particular, Proposition 3 in Ahn and
Arcidiacono (2004) shows that in equilibrium
an increase in the minimum wage always low-
ers the probability of matching:
Proposition 3 of Ahn and Arcidiacono (2004):
With the probability of finding a match guar-
anteed to fall, we are back to the classical pre-
diction on the effect of a minimum wage:
there exists a trade-off between employment
and earnings at the individual level. Therefore,
even if the employment level does rise, this
does not necessarily translate into low-income
searchers benefiting from an increase in the
minimum wage.
Much of the intuition for the result can be
found from examining the expected profit
condition given in equation (2). Substituting
in the firm’s share of the surplus under a
(binding) minimum wage into equation (2)
and noting that the minimum wage is only
effective if it binds:
(4)
As W increases, q must also increase for the
expected zero profit condition to bind.
However, for q to increase, p must decrease.
This is because the probability of a firm
finding a match depends positively on the
ratio of workers to firms, while the proba-
bility of a worker finding a match depends
negatively on the same ratio. In particular,
we can write q and p as
(5)
(6)
Hence, if q is increasing, p must be decreas-
ing. Since q must increase for the expected
zero profit condition to hold, the probability
of a worker finding a match, p, must fall. Note
that the total number of searching firms, J,
may increase, but it must be accompanied by
an even larger increase in the number of
searching workers.
While the probability of finding employ-
ment must fall, the effect on the employment
level is ambiguous. The reason for the ambi-
guity is that an increase in the minimum wage
may lead to an increase in the number of
searching workers. If the increase in searching
workers is large enough, an increase in the
employment level is possible. Differentiating
the employment level in equation (3) with
respect to the minimum wage yields
(7)
Multiplying through by and rearranging
terms yields
(8)
Note, however, that the expression inside the
parentheses contains both the elasticity of
labor supply and the elasticity of labor
demand. Also, placing the fraction on the
8Employment Policies Institute | www.EPIonline.org
left-hand side yields the elasticity of the equi-
librium employment level with respect to the
minimum wage, . We can then write the
elasticity of the equilibrium employment level
with respect to the minimum wage as
(9)
This last equation shows that the more elas-
tic the response by either labor supply or
labor demand is to an increase in the mini-
mum wage, the larger the impact on the
employment level in equilibrium. Note that
we expect these effects to move in opposite
directions, with labor demand falling as the
minimum wage increases and labor supply
increasing with the minimum wage. Note also
that in the classical model it is only the first
effect that is relevant; labor supply does not
affect the employment level in the presence of
a binding minimum wage.
The α parameter shows how much weight
the number of searching firms receives in
determining the employment level. The more
sensitive the employment level is to the num-
ber of searching firms (higher α’s), the more
difficult it will be to obtain positive employ-
ment effect given an increase in the minimum
wage. That is, in the search model, positive
employment effects must be driven by increas-
es in the number of searching workers.
Given the formula for , we would like to
know whether reasonable values for α and the
elasticities of labor demand and labor supply
generate positive employment effects from an
increase in the minimum wage. Most labor
economists estimate the labor demand elastic-
ity to be between -1.00 and -0.30 (see Fuchs,
Krueger, and Poterba 1998). Most estimates
of the α parameter in the matching function
are between 0.40 and 0.60 (see Petrongolo
and Pissarides 2001). The only question, then
is, what values to use for the elasticity of labor
supply for teenagers. Unfortunately, there are
virtually no estimates of this parameter in the
economics literature. Instead, we use estimates
of the Marshallian labor supply elasticity for
women as a proxy for the corresponding
teenage labor supply elasticity. We believe this
to be much more reasonable than using the
male labor supply estimates because we
expect teenagers to be less attached to the
workforce than their adult male counterparts.
Most labor economists place the Marshallian
labor supply elasticity for women in the 0.10
to 0.70 range (see Fuchs, Krueger, and
Poterba 1998).
Substituting these parameter ranges into
equation (9) yields estimates of employment
elasticity between -0.56 and 0.30, with a posi-
tive employment elasticity implying that an
increase in the minimum wage would increase
the equilibrium employment level. Hence,
positive employment effects are a very real
possibility in a simple search model.
4. WelfareEven with positive employment effects, the
decreased probability of finding a match means
that the welfare effects of an increase in the
minimum wage are ambiguous. What we can
say is that if anyone is hurt by the minimum
wage increase, it will be those who most want
the minimum wage jobs. The intuition for this
result is the same as in the classical analysis:
those who most want the minimum wage jobs
are willing to trade off a lower wage for a high-
er probability of employment.
In order to calculate the winners and losers
from a minimum wage increase, we differenti-
ate the expected value of searching with respect
9Employment Policies Institute | www.EPIonline.org

to the minimum wage. If this derivative is posi-
tive for a particular individual, that individual
benefits from the change in the minimum wage.
Substituting in W for the expected wage and
differentiating VVi with respect to W yields
(10)
Note that we know the derivative of the
probability of matching with respect to the
minimum wage must be negative from
Proposition 3. Note also that the equation is
not relevant for teenagers who have reserva-
tion values above the minimum wage: these
teenagers will never find it optimal to
search. Hence, the term in brackets must be
positive and is multiplied by a negative num-
ber
This equation then distinguishes winners
and losers from an increase in the minimum
wage, with a worker being indifferent regarding
a minimum wage increase if the expression in
equation (10) exactly equals zero at reserva-
tion value. As Ri approaches W the term in
parentheses goes to zero and the effect of an
increase in the minimum wage for workers
with reservation values close to Ri must be
(weakly) positive. These are the workers who
would not find it worthwhile to work for a
low wage; a minimum wage that moves a
worker from not searching to searching must
be welfare enhancing for that worker. If we
move in the other direction, however, the
lower the value of Ri, the more impact the
negative second term has on the expression.
Hence, lower values of Ri make it more likely
that the person is hurt by the minimum wage
change. A trade-off then exists: an increase in
the minimum wage may help the marginal
entrant in the labor market at the expense of
the welfare of someone who very much want-
ed a minimum wage job.
What this analysis implies is that if the num-
ber of searching workers increases as a result of
an increase in the minimum wage, the expected
loss in employment understates the loss of any
one individual obtaining a job. As more work-
ers enter the labor market, more firms will enter
as well, all else being equal. Labor then creates
its own demand (Pissarides, 1990).
5. DataIn this section we present the data used in
the econometric analysis. We use a 12 year
band of the basic monthly outgoing rotation
survey files of the Current Population Survey
(CPS) from 1989 to 2000. These 12 years are
suitable for analysis because there were four
federal minimum wage changes during this
period. More important, 15 states7 changed
their state minimum wage to outpace the fed-
eral wage, at various points in time. The
range of observed minimum wages in the 12
years runs from $3.35 to $6.50.8 We select
white teenage workers (16 years to 19 years)
during non-summer month six to look at the
employment and wage effects from an
increase in the minimum wage. The CPS is
especially useful for this analysis because the
survey explicitly asks for hourly wage. From
the CPS, we collect hourly wage, whether the
individual is searching for work or not,
whether the searching worker is employed or
not, parent weekly income, years of parental
education, and other demographic character-
istics, such as whether the teenager is from a
single-parent household.
Parent weekly income is a proxy for the level
of monetary support teenagers have from their
parents. A higher level of monetary support
10Employment Policies Institute | www.EPIonline.org

Age 17.36 1.102
Female 0.4757 0.4994
Pr (Search) 0.4808 0.0970
Single Parent 0.1824 0.3862
Parent Education (Years) 13.74 2.869
Weekly Parent Income 692.64 433.71
Missing Income 0.2668 0.4423
Age 17.62 1.077
Female 0.4745 0.4994
Pr (Employed/Search) 0.8387 0.0895
Single Parent 0.1951 0.3963
Parent Education (Years) 13.58 2.649
Weekly Parent Income 674.97 402.97
Missing Income 0.2346 0.4238
Hourly Wage 4.30 1.02
Age 17.66 1.068
Female 0.4835 0.4997
Single Parent 0.1829 0.3866
Family Size 3.790 1.153
Parent Education (Years) 13.66 2.601
Weekly Parent Income 693.53 400.43
Missing Income 0.2377 0.4257
from parents should lower the teenager’s will-
ingness to search for a minimum wage job. We
restrict the analysis to teenagers who are identi-
fied as having parental income. If a parent was
surveyed to be employed, but did not enter an
income amount, the household was treated as
having a missing income.
The level of parental education is indicative
of the extent to which a family regards educa-
tion for the teenager as important. That is, a
teenager with parents with a high level of edu-
cation is probably receiving encouragement to
focus on studying. Therefore, the reservation
value of a teenager with well-educated parents
should be higher a that of a teenager with
parents with a lower level of education, all
else being equal. Using these two measures of
reservation, we hope to capture many of the
concrete sources of reservation (outside sup-
port) as well as preference for education over
minimum wage work.
Table 1 contains general descriptive statis-
tics from the CPS portion of the data.
Individuals between 16 and 19 years old inclu-
sive were included in the sample and were
identified as employed, unemployed but look-
ing for work, or not searching for work.
Observations with employed individuals earn-
ing less than the minimum state or federal
minimum wage were dropped, as well were
individuals who reported earning more than
$10 per hour, about 0.79% of the sample.10
11Employment Policies Institute | www.EPIonline.org
Description of DataTable 1
Variable Mean Standard Deviation
Entire Sample (N: 120,686)
Searching Workers (N: 58,025)
Employed Workers (N: 48,668)
Entire Sample (N: 120686)
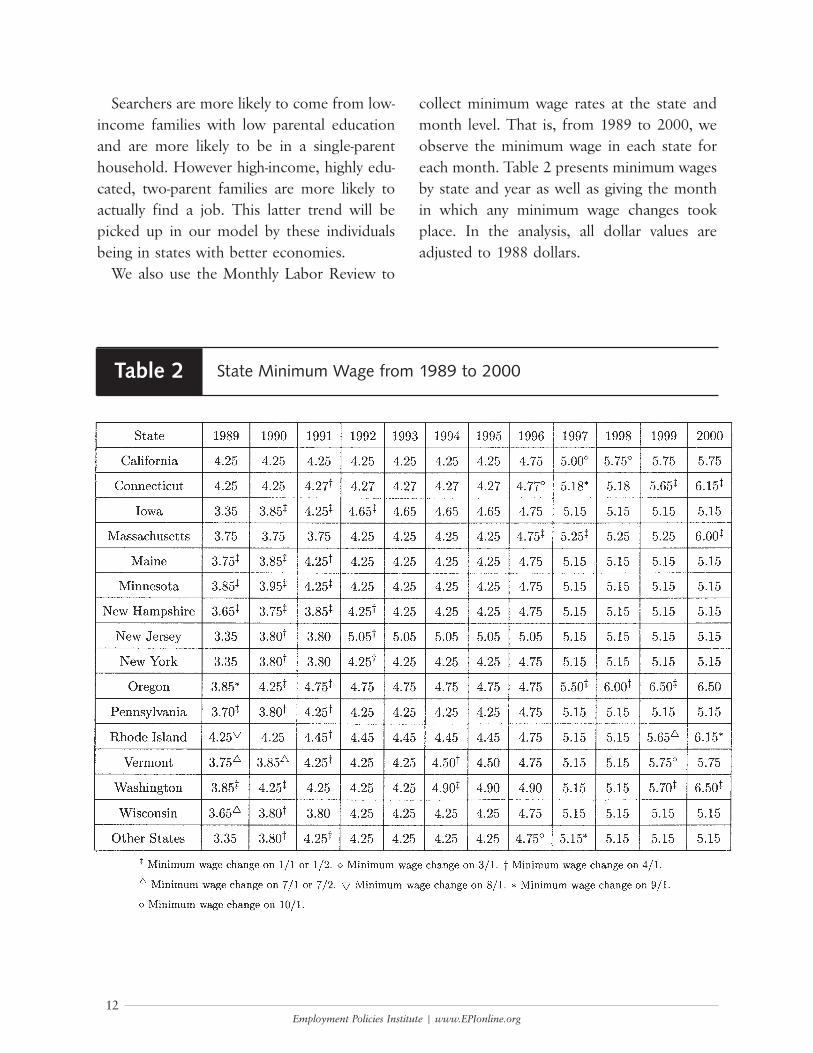
Searchers are more likely to come from low-
income families with low parental education
and are more likely to be in a single-parent
household. However high-income, highly edu-
cated, two-parent families are more likely to
actually find a job. This latter trend will be
picked up in our model by these individuals
being in states with better economies.
We also use the Monthly Labor Review to
collect minimum wage rates at the state and
month level. That is, from 1989 to 2000, we
observe the minimum wage in each state for
each month. Table 2 presents minimum wages
by state and year as well as giving the month
in which any minimum wage changes took
place. In the analysis, all dollar values are
adjusted to 1988 dollars.
12Employment Policies Institute | www.EPIonline.org
State Minimum Wage from 1989 to 2000Table 2

6. Empirical ImplementationWe focus the empirical analysis on the
teenager’s decision as to whether to search for
a job with the estimation strategy for the full
model given in Ahn and Arcidiacono (2004).
Recall that an individual searches if
(11)
Note that some teenagers (in fact, many) will
actually make much more than the minimum
wage. In order to accommodate the range of
wages actually seen in the labor market, we
replace W with the expected wage condition-
al on matching. That is, a matched worker
receives a draw from the wage distribution
subject to the wage being higher than the
minimum wage.11 Unlike the classical analy-
sis, a draw from the wage distribution that is
below the minimum wage does not result in
unemployment for the worker: the firm sim-
ply receives a smaller share of the surplus
than it otherwise would.
To obtain expected wages, we assume that
the wage distribution is log normal with cen-
soring points at the minimum wage. Note that
these censoring points differ across states and
years. We then regress log wages on age, state,
month, and year indicator variables to take
into account the ebbs and flows of the busi-
ness cycles and allow productivity and bar-
gaining power to be different across age and
state. The estimated parameters are then used
to calculate expected wages at the age, state,
month, and year levels.
We also need to obtain values for the
probability of finding a match conditional
on searching. Ahn and Arcidiacono (2004)
show how the firm’s zero profit condition
can be rewritten in terms of the probability
of a searching worker finding a match.
Rewriting the zero profit condition in this
way also provides a link between minimum
wages, expected wages, and the probability
of finding a match. Hence, they are able to
calculate the relevant demand elasticities.
We use their estimates of the probability of
finding a match at the age, state, month, and
year level in our model of the individual’s
decision to search.
Finally, we need to specify the reservation val-
ues. We assume that the reservation values are a
function of family income (FI), parental educa-
tion (PE), whether an individual is living with
both parents (TP), and sex (S). Further, the
reservation value has an unobserved compo-
nent, ε. We assume that no individual would be
willing to work for free. Hence, all reservation
values are bounded below by zero. A natural
specification for the reservation values is then
(12)
Substituting for Ri in equation (11) and solv-
ing the search condition for the εεi yields:
(13)
where an individual searches if the condition
above holds.
To estimate the model, we need to specify the
distribution for the ε’s. We assume that the ε’sare distributed standard normal, which yields
probit probabilities. The estimated coefficient
on the probability of finding a match condition-
al on searching then gives the search cost K.
13Employment Policies Institute | www.EPIonline.org

Expected Wage 0.3463 0.0054
Search Cost
Pr (Match) -0.0839 0.0071
Constant 0.3067 0.0062
Parental Education -0.0188 0.0011
Parental Income -0.0747 0.0065
Missing Income -0.2428 0.0068
Two Parents -0.0360 0.0062
Female -0.0051 0.0056
Age = 16 -0.6098 0.0086
Age = 17 -0.2610 0.0087
Age = 18 -0.1161 0.0095
Reservation Values (exp ()):
7. ResultsEstimates of the model are reported in Table 3.
Consistent with the theory, the expected wage
is positive and significant, while searching is
costly. The parameters characterizing the reser-
vation values consistently have the expected sign
and, with the exception of female, all are statis-
tically significant. In particular, higher parental
education and parental income are both associ-
ated with lower probabilities of search while
coming from a single-parent family makes it
more likely that an individual will enter the
labor market. With higher reservation values for
wealthier and more highly educated families,
individuals from these families will be more will-
ing to trade off lower probabilities of finding a
job for a higher expected wage conditional on
employment. Reservation values are also higher
for younger individuals.
14Employment Policies Institute | www.EPIonline.org
Estimates of the Search ParametersTable 3
Variable Coefficient Standard Error

Because the probit is nonlinear, it is diffi-
cult to interpret the magnitude of the coef-
ficients. To characterize what the parameters
mean, we simulate how a 10 percent change
in the minimum wage affects the decision to
search, the probability of matching condi-
tional on searching, and the employment
level. The simulation utilizes both the search
parameters estimated above and the param-
eters of the zero profit condition estimated
by Ahn and Arcidiacono (2004). The average
effects are presented in Table 4.
The table shows that with a minimum wage
increase, the probability of searching increases
as well. However, this is counteracted by a
decrease in the probability of finding a job
conditional on searching. The overall effect
on the probability of employment is a modest
-0.88% decrease. Note that this is the relevant
number when speaking of the employment
level, as it is not conditional on whether the
individual searched. Hence, the employment
level would be the probability of employment
times the number of 16- to 19-year-olds.
However, this small decrease in employment
is masking large changes in labor supply and
demand that are effectively canceling out.
Namely, a 10 percent increase in the mini-
mum wage causes a 2.1 percent increase in the
probability of searching and 2.9 percent
decrease in the probability of employment
conditional on searching.
15Employment Policies Institute | www.EPIonline.org
Changes in Labor Market Outcomes from a10 percent Minimum Wage IncreaseTable 4
Pr (Search) Before 0.4811 0.1239
Pr (Search) After 0.4910 0.1206
Pr (Match) Before 0.8269 0.0502
Pr (Match) After 0.8031 0.0601
Pct. Change in Employment -0.88% —
Pct. Change in Pr (Search) 2.1% —
Pct. Change in Pr (Match) -2.9% —
Variable Mean Standard Deviation

8. ConclusionEmpirical estimates of the employment
effects of an increase in the minimum wage
are consistently small. Recent work by Card
and Krueger (1994, 1995) suggest that the
employment effects may even be positive.
Does this then imply that workers in the
low-wage labor market would benefit from a
minimum wage increase? In order to answer
this question, we need to have a credible
model that is able to generate the employ-
ment effects found in the data.
This paper has proposed a search model as
an alternative to the classical model. The key
feature of the model is that the employment
level in the presence of a minimum wage is
not solely determined by labor demand, but is
also a function of labor supply, the number of
searching workers. While higher wages make
hiring workers less attractive from the firm’s
perspective, increased wages lead to more
workers interested in participating in the labor
force. Hence, the effect on the employment
level may be masking large changes in labor
demand and labor supply.
We estimated the model on teenagers in
the Current Population Survey. Consistent
with previous work, a 10 percent increase in
the minimum wage leads to only a -0.88 percent
decrease in employment. However, this is
masking a 2.1 percent increase in the proba-
bility of searching and a 2.9 percent decrease
in the probability of employment conditional
on searching. Hence, while employment levels
remain unaffected, much larger effects can be
found for unemployment rates.
Finally, the empirical estimates suggest that
the distributional effects of a minimum wage
increase favor those who come from wealthi-
er families. Individuals from wealthier families
are more likely to have higher reservation
wages and hence are willing to trade off a
lower probability of being employed for a
higher expected wage conditional on employ-
ment. Individuals from low-income families,
however, are more likely to take low-paying
jobs, preferring a high probability of finding a
job and a low wage to a low probability of
finding a job and a high wage. These are the
individuals who are hurt by a minimum wage
increase because they are now competing with
teenagers from wealthier families.
16Employment Policies Institute | www.EPIonline.org

17Employment Policies Institute | www.EPIonline.org
1. Burdett and Mortensen (1998) develop a search
model that incorporates monopsonistic competi-
tion and can generate positive employment effects
from a minimum wage hike. Firms earn positive
profits in their model.
2. This holds true for the intermediate microeco-
nomics and labor economics textbooks as well.
3. Marginally interested workers in this context are
those who would work at the old minimum wage
if and only if they were assured success in the job
search. Qc is the worker who is exactly indifferent
about working at the old wage when match proba-
bility is not one.
4. Note that K is not indexed by workers. The
model can be generalized to allow this value to
change, as long as there is no correlation
between the individual reservation value and the
worker search cost.
5. While in reality firms generally have more than one
employee, we can instead think about each vacan-
cy as a firm. The assumption of one firm per
vacancy has no effect on the results.
6. Allowing C to be indexed by firms will not change
the qualitative results of the model.
7. There are actually 17 states that paced ahead of the
federal minimum wage, but we exclude Alaska and
Hawaii from analysis.
8. We look at state minimum wages because some
of the larger and more populous states, such as
California, New York, and Pennsylvania, have
state minimum wages above the federally man-
dated minimum wage and are raised on differ-
ent schedules.
9. We exclude June, July, and August.
10. All dollar figures are adjusted to 1988 dollars. The
empirical estimates of the wage distributions were
not significantly altered when the ceiling for hourly
earnings was dropped or raised.
11. All of the analyses in the previous sections hold
when workers receive draws from a wage distribu-
tion rather than all receiving the minimum wage.
See Ahn and Arcidiacono (2004) for details.
Endnotes

18Employment Policies Institute | www.EPIonline.org
1. Ahn T. and Arcidiacono P. “Minimum Wages and
Positive Employment Effects in General
Equilibrium.” Working Paper, Duke University, 2004.
2. Arcidiacono P. “The Dynamic Implications of
Search Discrimination.” Journal of Public
Economics, 87(7-8):1681–1707.
3. Barzel Y. “A Theory of Rationing by Waiting.”
Journal of Law and Economics, 17(1):73–95, 1974.
4. Boal W. and Ransom M. “Monopsony in the
Labor Market.” Journal of Economic Literature,
35(1):86–112, 1997.
5. Brown C. “Minimum Wages, Employment, and the
Distribution of Income.” Handbook of Labor
Economics, 2101–2134, 1999.
6. Buchanan J. “Commentary on the Minimum
Wage.” Wall Street Journal. April 25, A20, 1996.
7. Burdett K. and Mortensen D. T. “Wage
Differentials, Employer Size, and Unemployment.”
International Economic Review, 39(2):257–273,
May 1998.
8. Card D. and Krueger A. B. “Minimum Wage and
Employment: A Case Study of the Fast-Food
Industry in New Jersey and Pennsylvania.” Amer-
ican Economic Review, 84:772–793, 1994.
9. Card D. and Krueger A. B. Myth and
Measurement: The New Economics of the
Minimum Wage. Princeton University Press,
Princeton NJ, 1995.
10. Card D. and Krueger A. B. “Minimum Wages and
Employment: A Case Study of the Fast-Food Industry
in New Jersey and Pennsylvania: Reply.” American
Economic Review, 90(5):1397–1420, 2000.
11. Flinn C. “Minimum Wage Effects on Labor Market
Outcomes under Search with Bargaining.” Working
Paper, New York University, 2003.
12. Fuchs V. R., Krueger A. B., and Poterba J.M.
“Economists’ Views about Parameters, Values, and
Policies: Survey Results in Labor and Public
Economics.” Journal of Economic Literature,
36(3):1387–1425, 1998.
13. Glaeser E. “The Social Costs of Rent Control
Revisited.” NBER Working Paper # 5441, 1996.
14. Glaeser E. and Luttmer E. “The Misallocation of
Housing under Rent Control.” NBER Working
Paper # 6220, 1997.
15. Hamermesh D. Labor Demand. Princeton
University Press, Princeton NJ, 1993.
16. Lang K. and Kahn S. “The Effect of Minimum-
Wage Laws on the Distribution of Employment:
Theory and Evidence.” Journal of Public
Economics, 69(1):67–82, 1998.
17. Luttmer E. “Does the Minimum Wage Cause
Inefficient Rationing?” Working Paper, University
of Chicago, October 1998.
18. Neumark D. and Wascher W. “Employment Effect
of Minimum and Sub-minimum Wages: Reply to
Card, Katz and Krueger.” Industrial and Labor
Relations Review, 47:497–512, 1994.
19. Neumark D. and Wascher W. “Minimum Wages
and Employment: A Case Study of the Fast-Food
Industry in New Jersey and Pennsylvania:
Comment.” American Economic Review,
90(5):1362–1396, 2000.
20. Petrongolo B. and Pissarides C. “Looking into the
Black Box: A Survey of the Matching Function.”
Journal of Economic Literature, 39(2):390–431,
June 2001.
21. Pissarides C. Equilibrium Unemployment Theory,
Basil Blackwell, Inc., 1990.
22. Welch F. “Comment by Finis Welch, in “Review
Symposium on Card and Krueger’s ‘Myth and
Measurement: The New Economics of the
Minimum Wage.’ ” Industrial and Labor Relations
Review, 48:842–848, 1995.
References

Wage Growth Among Minimum Wage Workers,
by Dr. William E. Even, Miami University of Ohio, and
David A. Macpherson, Florida State University, June 2004.
Helping Working-Poor Families: Advantages of Wage-
Based Tax Credits Over the EITC and Minimum
Wages, by Dr. Thomas MaCurdy, Stanford University,
and Dr. Frank McIntyre, Brigham Young University,
April 2004.
The Cost of California’s Health Insurance Act of
2003, by Dr. Aaron Yelowitz, University of Kentucky,
October 2003.
Welfare Reform and Its Effects on the Dynamics of
Welfare Receipt, Employment, and Earnings, by Dr.
Peter Mueser and Dr. Kenneth R. Troske, University of
Missouri, September 2003.
Where the Jobs Aren’t: Local Unemployment Spreads,
by Employment Policies Institute, July 2003.
Who Would Benefit from a $6.65 Minimum Wage? A
State-by-State Profile: 2003 Edition, by Employment
Policies Institute, July 2003.
Indexing the Minimum Wage: A Vise on Entry-Level
Wages, by Employment Policies Institute, March 2003.
The Effects of the Proposed Santa Fe Minimum
Wage Increase, by Dr. David A. Macpherson, Florida
State University, February 2003.
Living Wage and Earned Income Tax Credit:
A Comparative Analysis, by Mark D. Turner,
Georgetown University/Optimal Solutions Group, and
Burt S. Barnow, Johns Hopkins University, January 2003.
The Economic and Distributional Consequences of
the Santa Monica Minimum Wage Ordinance, by
Richard H. Sander, University of California at Los
Angeles; E. Douglass Williams, University of the South
;and Joseph Doherty, Empirical Research Group at
University of California Los Angeles, October 2002.
Measuring Poverty in America, by Employment
Policies Institute, April 2002.
The Economic Well-Being of Low-Income Working
Families, by John P. Formby and Hoseong Kim,
University of Alabama, and Dr. John A. Bishop, East
Carolina University, March 2002.
The Long-Term Effects of Youth Unemployment, by
Thomas A. Mroz, University of North Carolina at
Chapel Hill, and Timothy H. Savage, Welch
Consulting Economists, October 2001.
The Case for a Targeted Living Wage Subsidy, by
Employment Policies Institute, June 2001.
The Effect of Minimum Wages on the Labor Force
Participation Rates of Teenagers, by Walter J. Wessels,
North Carolina State University, June 2001.
Winners and Losers of Federal and State Minimum
Wages, by Thomas MaCurdy and Frank McIntyre,
Stanford University, June 2001.
Does the Minimum Wage Reduce Poverty? by Richard K.
Vedder and Lowell E. Gallaway, Ohio University, June 2001.
State Flexibility: The Minimum Wage and Welfare
Reform, by Employment Policies Institute, March 2001.
Evaluating the Effects of Medicaid on Welfare and Work:
Evidence from the Past Decade, by Aaron S. Yelowitz,
University of California at Los Angeles, December 2000.
Higher Minimum Wages Harm Minority and Inner-
City Teens, by Mark Turner and Berna Demiralp,
Johns Hopkins University, September 2000.
Living Wage Policy: The Basics, by Employment
Policies Institute, March 2000.
Rising Above the Minimum Wage, by William Even,
Miami University of Ohio, and David Macpherson,
Florida State University, January 2000.
Economic Analysis of a Living Wage Ordinance, by
George Tolley, University of Chicago; Peter Bernstein,
DePaul University; and Michael Lesage, RCF Economic
& Financial Consulting, July 1999.
Effective Marginal Tax Rates on Low-Income
Households, by Daniel N. Shaviro, New York
University School of Law, February 1999.
Targeted Jobs Tax Credits and Labor Market
Experience, by Frederick J. Tannery, University of
Pittsburgh, June 1998.
Work Ethic and Family Background, by Casey B.
Mulligan, University of Chicago, May 1997.
From Welfare to Work: The Transition of an
Illiterate Population, by Employment Policies
Institute, February 1997.
Who Are The “Low-Wage” Workers? by Derek Neal,
University of Chicago, July 1996.
Jobs Taken by Mothers Moving from Welfare to Work:
And the Effects of Minimum Wages on This Transition,
by Peter D. Brandon, Institute for Research on Poverty,
University of Wisconsin—Madison, February 1995.
Minimum Wage Laws and the Distribution of
Employment, by Kevin Lang, Boston University,
January 1995.
Selected Publications

Suite 1200 | 1775 Pennsylvania Avenue NW | Washington, DC 20006-4605 | telephone 202.463.7650 | www.EPIonline.org