mining massive document collections by the websom method
TRANSCRIPT
Information Sciences 163 (2004) 135–156
www.elsevier.com/locate/ins
Mining massive document collections bythe WEBSOM method
Krista Lagus, Samuel Kaski *, Teuvo Kohonen
Helsinki University of Technology, Neural Networks Research Centre, P.O. Box 5400,
FIN-02015 HUT, Finland
Received 8 May 2002; accepted 17 March 2003
Abstract
A viable alternative to the traditional text-mining methods is the WEBSOM, a
software system based on the Self-Organizing Map (SOM) principle. Prior to the
searching or browsing operations, this method orders a collection of textual items, say,
documents according to their contents, and maps them onto a regular two-dimensional
array of map units. Documents that are similar on the basis of their whole contents will
be mapped to the same or neighboring map units, and at each unit there exist links to
the document database. Thus, while the searching can be started by locating those
documents that match best with the search expression, further relevant search results
can be found on the basis of the pointers stored at the same or neighboring map units,
even if they did not match the search criterion exactly. This work contains an overview
to the WEBSOM method and its performance, and as a special application, the
WEBSOM map of the texts of Encyclopaedia Britannica is described.
� 2003 Elsevier Inc. All rights reserved.
Keywords: Information retrieval; Self-organizing map (SOM); Text mining; WEBSOM
* Corresponding author. Fax: +358-9-4513277.
E-mail address: [email protected] (S. Kaski).
0020-0255/$ - see front matter � 2003 Elsevier Inc. All rights reserved.
doi:10.1016/j.ins.2003.03.017
136 K. Lagus et al. / Information Sciences 163 (2004) 135–156
1. Introduction
1.1. General
Consider a very large collection of textual items, such as an encyclopaedia or
a digital library. It would be of great help for browsing it, if the items could be
preordered according to their contents. For the ordering one needs a similarity
measure for the pairs of items. One might wish to have a measure that com-
pares the meanings of the contents linguistically. When the text corpus is really
large, such linguistic analyses become soon computationally overwhelming. It
has transpired, however, that rather descriptive and useful similarity relations
between text items are already reflected in the use of the words in them.The word histograms, weighted by some information measure, have tradi-
tionally been used in text retrieval. For masses of natural texts, however, even
the word histograms, regarded as real vectors, have too high a dimensionality
to be feasible as such for the comparison of texts. A conventional method for
the reduction of the dimensionality, with minimum loss of information, has
been to compute a small number of eigenvectors for each histogram vector, and
to use the principal components of the histogram vectors as reduced repre-
sentations. Even then, the ordering problem must be solved somehow.In the multidimensional scaling (MDS) methods one represents each item as
a point on a two-dimensional plane. If dði; jÞ is any computable distance (in-
versely proportional to similarity) between the items indexed by i and j,respectively, and eði; jÞ is the Euclidean distance on the two-dimensional plane
between the corresponding points that represent these items, then the problem
is to determine a mapping by which, for each pair (i; j), one would have
eði; jÞ ¼ dði; jÞ. This usually cannot hold exactly; nonetheless it is possible to
minimize some error function. In the Sammon projection (cf. e.g. [1]), whichcreates rather well-ordered ‘‘maps’’ of items, this function is defined as
E ¼X
i6¼j
½eði; jÞ � dði; jÞ�2
dði; jÞ : ð1Þ
The main problem with the MDS methods is that one has to know all the
items before computation of the mapping. The computation is also a heavy and
even impossible task for any sizable collection of items. Therefore there might
be considerable interest in methods where an arbitrarily large set of items can
be represented by a much smaller set of models. The models themselves shall be
ordered and describe the distribution of the original items, and if a new item is
represented by its closest model, the quantization error, and eventually also
some topological error thereby made shall be minimized on the average. Thiskind of mapping is defined by the self-organizing map (SOM) algorithm [1].

K. Lagus et al. / Information Sciences 163 (2004) 135–156 137
This article describes a version of the SOM algorithms called the WEBSOM.
The latter can be regarded as another non-linear projection method. First of all
we shall show that the dimensionality of the weighted histogram vectors can be
reduced by a very simple and straightforward random projection method,which normally produces as good results as the eigenvalue methods; then these
reduced item vectors are mapped in an orderly fashion onto a two-dimensional
grid by the SOM algorithm. Thus, prior to any searching or browsing opera-
tions, the representations of the textual items on this grid will be ordered
according to all possible partial similarity relations between their text seg-
ments. After that, when one has been able to locate any interesting items on the
‘‘map’’ to start with, further relevant items, the search arguments of which were
not defined, will be found from the same or neighboring map units of theWEBSOM.
1.2. The Batch Map version of the SOM
The essence of the Self-Organizing Map algorithm, and a simple explanationof the ‘‘order’’ can be illustrated by the following setting that describes the
batch-type SOM [2]. This version has been used in the present work.
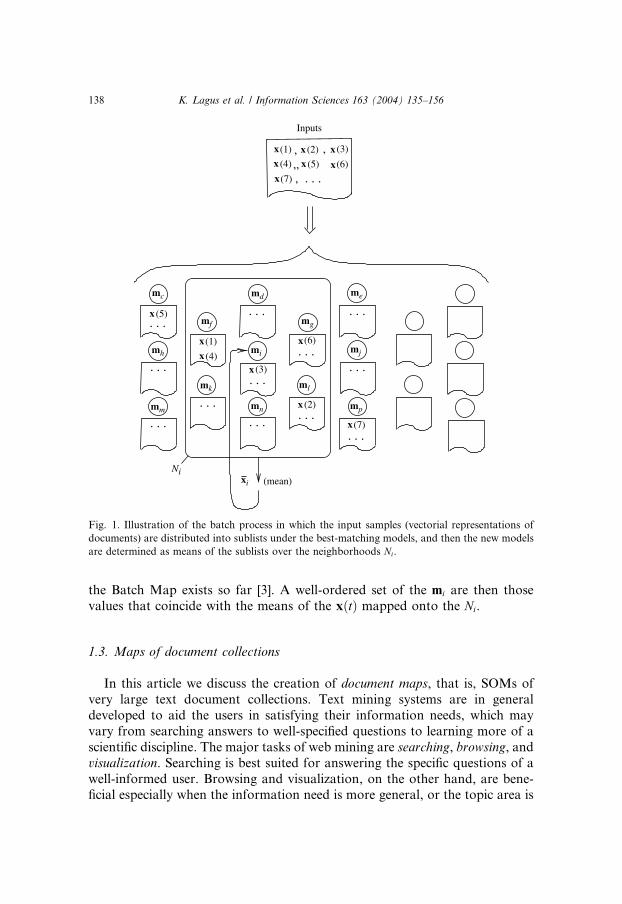
Consider Fig. 1 where a two-dimensionally ordered array of units, each one
having a model mi associated with it, is shown. Then consider a list of input
samples xðtÞ, where t is an integer-valued index. The initial values of the mi may
be selected as random, but a more effective method is to start with, e.g., values
selected irregularly along the principal plane of the xðtÞ [1]. Compare each xðtÞwith all the mi and copy each xðtÞ into a sublist associated with that map unit,the model vector of which is closest to xðtÞ relating to some distance measure
(e.g., Euclidean).
When all the xðtÞ have been distributed into the respective sublists in this
way, consider the neighborhood set Ni around the map unit corresponding to
model mi. Here Ni consists of all map units up to a certain radius in the grid
from unit i. In the union of all sublists in Ni, the mean of the xðtÞ is computed,
and this is done for every Ni. Let these means be denoted by �x0i.
The next step in the process is to replace each old value of mi by therespective �xi, and this replacement is done concurrently for all the mi.
In the same way as in the traditional SOM algorithms for vectorial variables,
one can also use weights in forming the means. Consider that i is the index of
the map unit around which Ni is centred, and let k be another map unit in Ni.
Then the weighting can be made by the factor hik that is similar to the
neighborhood function in the traditional SOM.
The above procedure shall be iterated always redistributing the xðtÞ into the
sublists and computing the new �x0i. The convergence, however, has not been
proved for a general case; as a matter of fact, only one theoretical treatment of
,,,
,
,
Ni
x (5). . .
. . .
x (1)
x (4)
. . .
x (3)
. . .
. . .
x (2). . .
. . .
x (7). . .
x(6)
xi
x (4)
x(1) x (2)
x (5)
x (3)
x(6)
x(7) . . .
Inputs
. . .. . .
. . .
md me
mh
mf
mi
mg
mj
mp
ml
mn
mk
mm
. . .
mc
(mean)
Fig. 1. Illustration of the batch process in which the input samples (vectorial representations of
documents) are distributed into sublists under the best-matching models, and then the new models
are determined as means of the sublists over the neighborhoods Ni.
138 K. Lagus et al. / Information Sciences 163 (2004) 135–156
the Batch Map exists so far [3]. A well-ordered set of the mi are then those
values that coincide with the means of the xðtÞ mapped onto the Ni.
1.3. Maps of document collections
In this article we discuss the creation of document maps, that is, SOMs of
very large text document collections. Text mining systems are in general
developed to aid the users in satisfying their information needs, which may
vary from searching answers to well-specified questions to learning more of a
scientific discipline. The major tasks of web mining are searching, browsing, and
visualization. Searching is best suited for answering the specific questions of a
well-informed user. Browsing and visualization, on the other hand, are bene-ficial especially when the information need is more general, or the topic area is
K. Lagus et al. / Information Sciences 163 (2004) 135–156 139
new to the user [4]. Document maps provide a means to explore large collec-
tions of texts by enabling an alternation between visualization, zooming in on
interesting information, browsing, and searching for a specific item.
1.4. Structure of this article
In Section 2 we discuss how text documents can be efficiently encoded as
real-valued vectors. The efficient construction of very large document maps is
described in Section 3. Section 4 presents examples of very large document
maps created in the WEBSOM project, and describes how the maps can aid inthe different text mining tasks. In addition, the semantic and pragmatic analysis
of words using the maps is discussed.
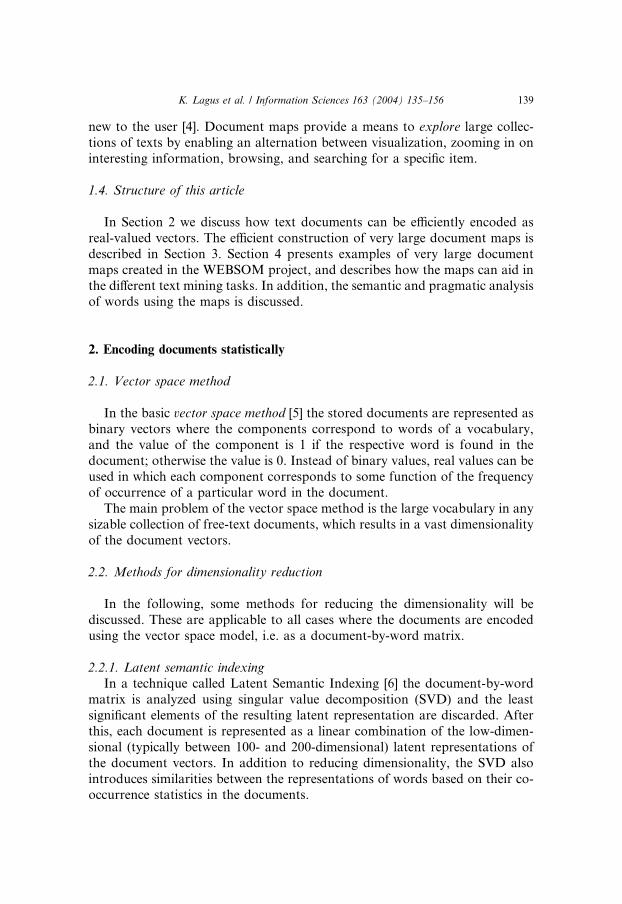
2. Encoding documents statistically
2.1. Vector space method
In the basic vector space method [5] the stored documents are represented as
binary vectors where the components correspond to words of a vocabulary,and the value of the component is 1 if the respective word is found in the
document; otherwise the value is 0. Instead of binary values, real values can be
used in which each component corresponds to some function of the frequency
of occurrence of a particular word in the document.
The main problem of the vector space method is the large vocabulary in any
sizable collection of free-text documents, which results in a vast dimensionality
of the document vectors.
2.2. Methods for dimensionality reduction
In the following, some methods for reducing the dimensionality will be
discussed. These are applicable to all cases where the documents are encoded
using the vector space model, i.e. as a document-by-word matrix.
2.2.1. Latent semantic indexing
In a technique called Latent Semantic Indexing [6] the document-by-word
matrix is analyzed using singular value decomposition (SVD) and the least
significant elements of the resulting latent representation are discarded. After
this, each document is represented as a linear combination of the low-dimen-
sional (typically between 100- and 200-dimensional) latent representations of
the document vectors. In addition to reducing dimensionality, the SVD also
introduces similarities between the representations of words based on their co-occurrence statistics in the documents.
140 K. Lagus et al. / Information Sciences 163 (2004) 135–156
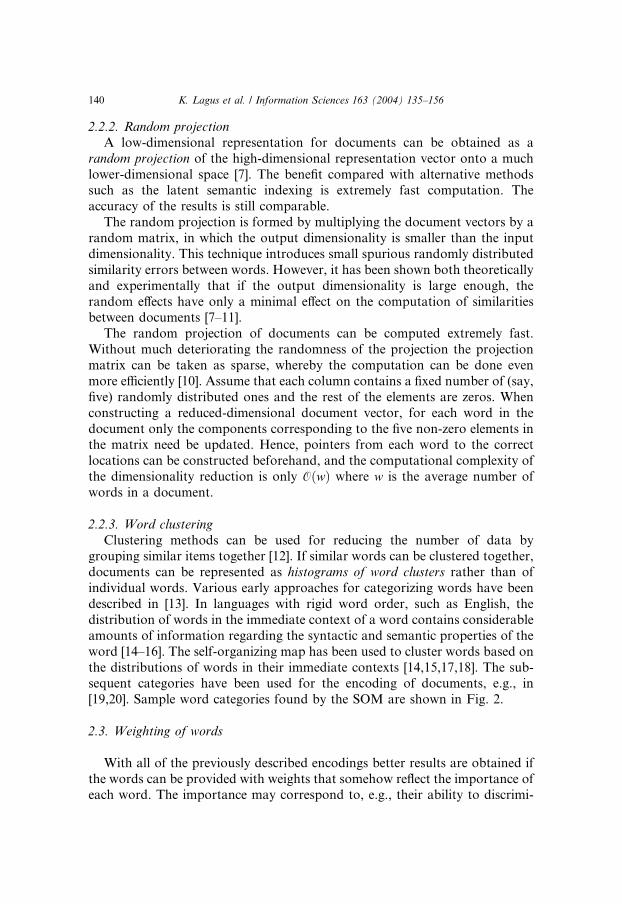
2.2.2. Random projection
A low-dimensional representation for documents can be obtained as a
random projection of the high-dimensional representation vector onto a much
lower-dimensional space [7]. The benefit compared with alternative methodssuch as the latent semantic indexing is extremely fast computation. The
accuracy of the results is still comparable.
The random projection is formed by multiplying the document vectors by a
random matrix, in which the output dimensionality is smaller than the input
dimensionality. This technique introduces small spurious randomly distributed
similarity errors between words. However, it has been shown both theoretically
and experimentally that if the output dimensionality is large enough, the
random effects have only a minimal effect on the computation of similaritiesbetween documents [7–11].
The random projection of documents can be computed extremely fast.
Without much deteriorating the randomness of the projection the projection
matrix can be taken as sparse, whereby the computation can be done even
more efficiently [10]. Assume that each column contains a fixed number of (say,
five) randomly distributed ones and the rest of the elements are zeros. When
constructing a reduced-dimensional document vector, for each word in the
document only the components corresponding to the five non-zero elements inthe matrix need be updated. Hence, pointers from each word to the correct
locations can be constructed beforehand, and the computational complexity of
the dimensionality reduction is only OðwÞ where w is the average number of
words in a document.
2.2.3. Word clustering
Clustering methods can be used for reducing the number of data bygrouping similar items together [12]. If similar words can be clustered together,
documents can be represented as histograms of word clusters rather than of
individual words. Various early approaches for categorizing words have been
described in [13]. In languages with rigid word order, such as English, the
distribution of words in the immediate context of a word contains considerable
amounts of information regarding the syntactic and semantic properties of the
word [14–16]. The self-organizing map has been used to cluster words based on
the distributions of words in their immediate contexts [14,15,17,18]. The sub-sequent categories have been used for the encoding of documents, e.g., in
[19,20]. Sample word categories found by the SOM are shown in Fig. 2.
2.3. Weighting of words
With all of the previously described encodings better results are obtained if
the words can be provided with weights that somehow reflect the importance ofeach word. The importance may correspond to, e.g., their ability to discrimi-

Fig. 2. A word category map calculated based on texts from a Usenet discussion group called
comp.ai.neural-nets. Four sample categories are shown in the insets.
K. Lagus et al. / Information Sciences 163 (2004) 135–156 141
nate between topics. Various weighting methods for words are discussed, e.g.,
in [21].
2.3.1. IDF-based weights
For the weighting of a word one can use one of the well-known ‘‘inverse
document frequency’’ (IDF)-based weighting schemes. An example of such a
scheme applied to calculating the weight for word i in document j is given by
IDFðiÞ ¼ logNdfi
; ð2Þ
where N is the number of documents in the collection, and dfi is the number of
documents that contain the term i. This weight is then multiplied by tfi;j, i.e.,the frequency of the term i in document j. Alternatively one may use 1þ log tfor
ffiffiffiffiffitf
p.
2.3.2. Entropy over topical document classes
If, however, the documents have some relevant topical classification, the
words can also be weighted according to their Shannon entropy over the set of
document classes (for details, see [10]).
3. Fast computation of very large document maps
The computational complexity of the baseline version of the SOM is onlylinear in the number of data samples. However, the complexity depends qua-
dratically on the number of map units.
142 K. Lagus et al. / Information Sciences 163 (2004) 135–156
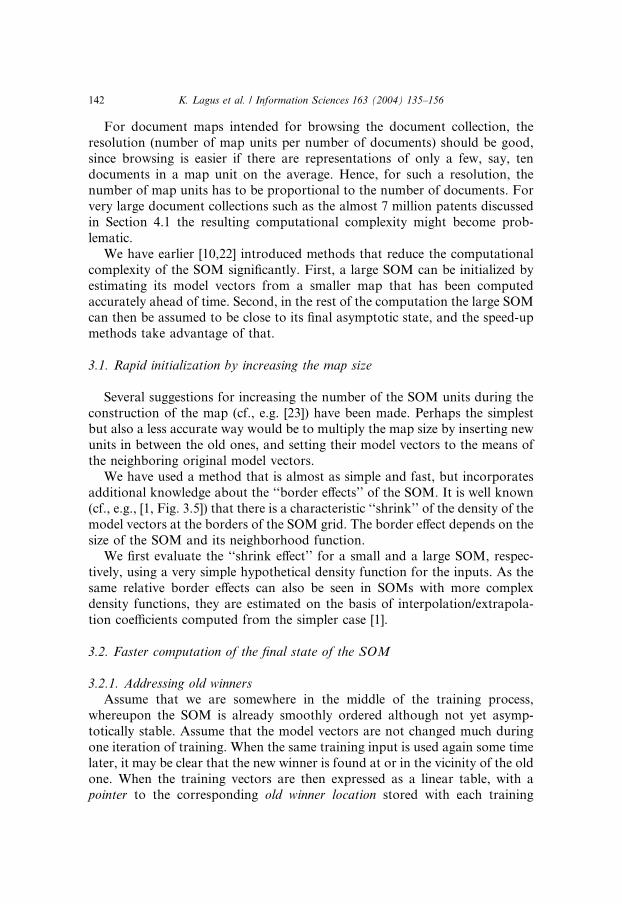
For document maps intended for browsing the document collection, the
resolution (number of map units per number of documents) should be good,
since browsing is easier if there are representations of only a few, say, ten
documents in a map unit on the average. Hence, for such a resolution, thenumber of map units has to be proportional to the number of documents. For
very large document collections such as the almost 7 million patents discussed
in Section 4.1 the resulting computational complexity might become prob-
lematic.
We have earlier [10,22] introduced methods that reduce the computational
complexity of the SOM significantly. First, a large SOM can be initialized by
estimating its model vectors from a smaller map that has been computed
accurately ahead of time. Second, in the rest of the computation the large SOMcan then be assumed to be close to its final asymptotic state, and the speed-up
methods take advantage of that.
3.1. Rapid initialization by increasing the map size
Several suggestions for increasing the number of the SOM units during the
construction of the map (cf., e.g. [23]) have been made. Perhaps the simplestbut also a less accurate way would be to multiply the map size by inserting new
units in between the old ones, and setting their model vectors to the means of
the neighboring original model vectors.
We have used a method that is almost as simple and fast, but incorporates
additional knowledge about the ‘‘border effects’’ of the SOM. It is well known
(cf., e.g., [1, Fig. 3.5]) that there is a characteristic ‘‘shrink’’ of the density of the
model vectors at the borders of the SOM grid. The border effect depends on the
size of the SOM and its neighborhood function.We first evaluate the ‘‘shrink effect’’ for a small and a large SOM, respec-
tively, using a very simple hypothetical density function for the inputs. As the
same relative border effects can also be seen in SOMs with more complex
density functions, they are estimated on the basis of interpolation/extrapola-
tion coefficients computed from the simpler case [1].
3.2. Faster computation of the final state of the SOM
3.2.1. Addressing old winners
Assume that we are somewhere in the middle of the training process,
whereupon the SOM is already smoothly ordered although not yet asymp-
totically stable. Assume that the model vectors are not changed much during
one iteration of training. When the same training input is used again some time
later, it may be clear that the new winner is found at or in the vicinity of the old
one. When the training vectors are then expressed as a linear table, with apointer to the corresponding old winner location stored with each training

new winner
old
Trainingvectors
Pointers
SOM
winner
Fig. 3. Finding the new winner in the vicinity of the old one, whereby the old winner is directly
located by a pointer. The pointer is then updated.
K. Lagus et al. / Information Sciences 163 (2004) 135–156 143
vector, the map unit corresponding to the associated pointer is searched for
first, and then a local search for the new winner in the neighborhood around
the located unit will suffice (Fig. 3). After the new winner location has been
identified, the associated pointer in the input table is replaced by the pointer to
the new winner location. This will be a significantly faster operation than an
exhaustive winner search over the whole SOM. The search can first be made inthe immediate surrounding of the said location, and only if the best match is
found at its edge, searching is continued in the surrounding of the preliminary
best match, until the winner is one of the middle units in the search domain.
In order to ensure that the matches are globally best, a full search for the
winner over the whole SOM can be performed intermittently.
Koikkalainen [24,25] has suggested a similar speedup method for a search-
tree structure.
3.2.2. Initial best matching units
Even searching for the winners once, which has to be done in order to ini-
tialize the pointers from the data to the respective winners, is very time-con-
suming for very large maps. Fortunately there exists a computational shortcut
for this stage as well.
When we were increasing the map size as described in Section 3.1, we as-
sumed that each model vector mðlÞi of the large map is a linear combination of
the three closest model vectors mðsÞ1 , m
ðsÞ2 , and m
ðsÞ3 of the small map:
mðlÞi ¼ aim
ðsÞ1 þ bim
ðsÞ2 þ ð1� ai � biÞm
ðsÞ3 : ð3Þ

144 K. Lagus et al. / Information Sciences 163 (2004) 135–156
The interpolation/extrapolation coefficients ai, and bi are computed for each
map unit i.As the winner in the larger map is defined by the maximal inner product
between the document vector x and the model vectors, then, according to Eq.(3) it is expressible as xTm
ðlÞi ¼ aixTm
ðsÞ1 þ bix
TmðsÞ2 þ ð1� ai � biÞxTm
ðsÞ3 . Note
that the inner products xTmðsÞi are already known for the smaller map; they can
be stored during its computation. Hence only a cumulative sum of three
products is needed for each distance computation, irrespective of the dimen-
sionality of the input.
If necessary, the winner search can still be speeded up by restricting the
search to the area of the dense map that corresponds to the neighborhood of
the winner on the sparse map.
3.3. Additional computational shortcuts
3.3.1. Parallelized Batch Map algorithm
The Batch Map algorithm facilitates a very efficient parallel implementa-
tion. The sublists of samples under the best matching models (see Fig. 1) can
be implemented as pointers, and even pointers from the data vectors to the
best matching units will do. The data set can be divided in a shared memory
computer to a set of parallel processors. Each processor computes the
pointers for its data vectors, using the speedup method discussed in Section3.2.1.
After the pointers have been computed, the previous values of the model
vectors are not needed any longer, and the new values can be computed in-
place. The mean over the sublists within the neighborhoods Ni of Fig. 1 can be
computed in two phases. First, the mean of data in the sublist of each map unit
i is computed with a recursive expression. Each processor computes the mean
for a subset of map units.
Second, the mean over the neighborhood is computed as the average overthe unit-wise means within the neighborhood. This computation can be
implemented in parallel as well.
3.3.2. Saving memory by reducing representation accuracy
If the dimensionality of the data vectors is large, which is certainly true for
text documents, then a reduced representation accuracy is sufficient for dis-
tance computations [1,26]. We have used a common adaptive scale for all of
the components of a model vector, representing each component with eight
bits only. This reduces the memory requirements significantly. Suffi-
cient accuracy can be maintained during the computation if a suitable
amount of noise is added to each new value of a model vector beforequantizing it [1].

K. Lagus et al. / Information Sciences 163 (2004) 135–156 145
3.3.3. Utilizing the sparsity of the vectors
It is generally known that even long documents have plenty of zeros in their
word histograms as approximated by Zipf’s law, and for short documents, such
as scientific abstracts, only a small proportion of the dimensions are non-zero.When the dimensionality is reduced by the pointer method of random pro-
jection (Section 2.2.2), the zeros are still predominant in the projected docu-
ment vectors.
When searching for the best matching model by inner products, the zero-
valued components do not contribute to distances. It is then possible to tab-
ulate the indices of the non-zero components of each input vector, and
thereafter consider only those components when computing the distances.
3.4. Performance evaluation of the new methods
3.4.1. Numerical comparison with the traditional SOM algorithm
In order to verify that the shortcut methods do not compromise the quality,
we compared traditional sequential SOMs with SOMs computed using all theabove speedup methods.
The SOMs were computed for a medium-sized document collection (see
[10]), and the quality of the results was measured with two performance indices:
the average quantization error (distance of the inputs from their closest
models), and classification accuracy (separability of the 21 subsections of the
patent classification system on the SOM). The parameters of SOM computa-
tion were chosen based on preliminary experiments.
As can be seen from Table 1, the quality of the resulting maps is compa-rable, but the time needed for the shortcut methods (in this rather small-size
example) is only about one tenth of that of the traditional algorithm. The time
has been measured with a SGI O2000 computer without parallelization of any
programs.
3.4.2. Comparison of the computational complexity
For very large maps the difference in the computation times is even more
marked than in Table 1, but can only be deduced from the computational
Table 1
Comparison of the new shortcut methods with the traditional SOM algorithm on a smaller col-
lection of 13,742 documents
Classification accuracy (%) Quantization error Time (s)
Traditional SOM 58.2±0.2 0.799±0.001 2550± 40
Shortcut methods 58.0± 0.2 0.798±0.002 241± 3.5
The figures are averages from five test runs with different random matrices used in the encoding of
the documents, and the error margins are standard deviations.
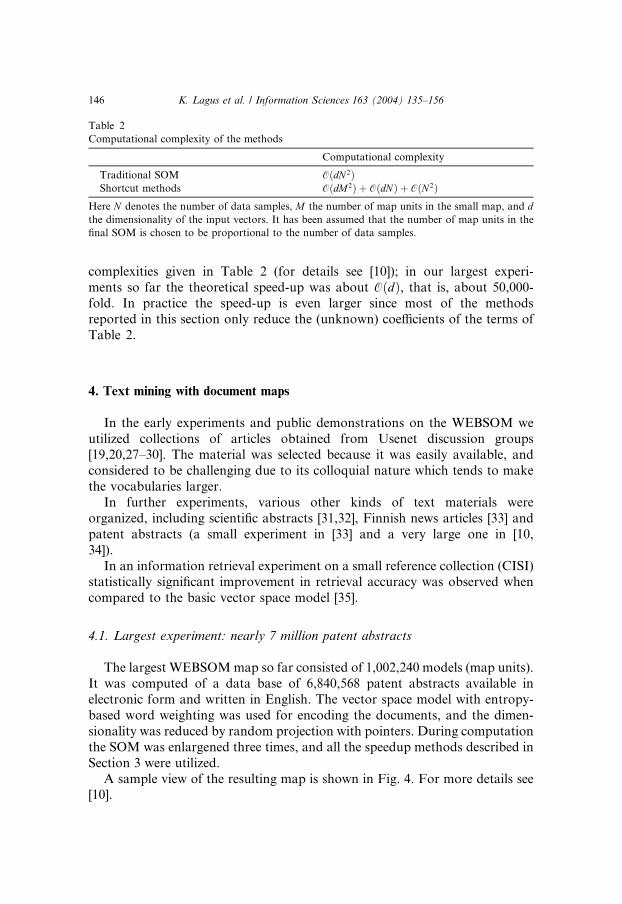
Table 2
Computational complexity of the methods
Computational complexity
Traditional SOM OðdN 2ÞShortcut methods OðdM2Þ þ OðdNÞ þ OðN 2Þ
Here N denotes the number of data samples, M the number of map units in the small map, and dthe dimensionality of the input vectors. It has been assumed that the number of map units in the
final SOM is chosen to be proportional to the number of data samples.
146 K. Lagus et al. / Information Sciences 163 (2004) 135–156
complexities given in Table 2 (for details see [10]); in our largest experi-
ments so far the theoretical speed-up was about OðdÞ, that is, about 50,000-fold. In practice the speed-up is even larger since most of the methods
reported in this section only reduce the (unknown) coefficients of the terms of
Table 2.
4. Text mining with document maps
In the early experiments and public demonstrations on the WEBSOM we
utilized collections of articles obtained from Usenet discussion groups[19,20,27–30]. The material was selected because it was easily available, and
considered to be challenging due to its colloquial nature which tends to make
the vocabularies larger.
In further experiments, various other kinds of text materials were
organized, including scientific abstracts [31,32], Finnish news articles [33] and
patent abstracts (a small experiment in [33] and a very large one in [10,
34]).
In an information retrieval experiment on a small reference collection (CISI)statistically significant improvement in retrieval accuracy was observed when
compared to the basic vector space model [35].
4.1. Largest experiment: nearly 7 million patent abstracts
The largest WEBSOMmap so far consisted of 1,002,240 models (map units).
It was computed of a data base of 6,840,568 patent abstracts available in
electronic form and written in English. The vector space model with entropy-
based word weighting was used for encoding the documents, and the dimen-
sionality was reduced by random projection with pointers. During computation
the SOM was enlargened three times, and all the speedup methods described in
Section 3 were utilized.
A sample view of the resulting map is shown in Fig. 4. For more details see[10].
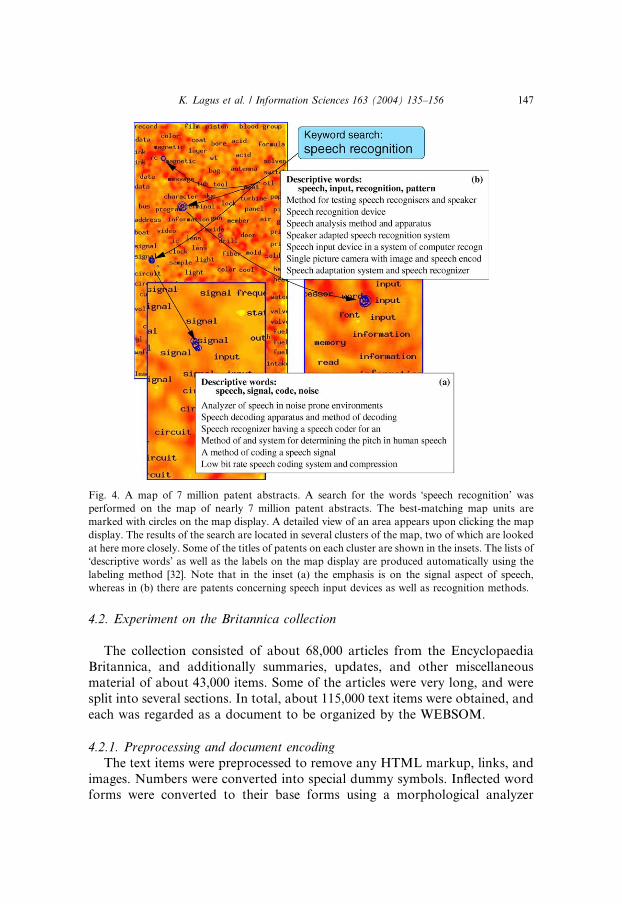
Fig. 4. A map of 7 million patent abstracts. A search for the words �speech recognition’ was
performed on the map of nearly 7 million patent abstracts. The best-matching map units are
marked with circles on the map display. A detailed view of an area appears upon clicking the map
display. The results of the search are located in several clusters of the map, two of which are looked
at here more closely. Some of the titles of patents on each cluster are shown in the insets. The lists of
�descriptive words’ as well as the labels on the map display are produced automatically using the
labeling method [32]. Note that in the inset (a) the emphasis is on the signal aspect of speech,
whereas in (b) there are patents concerning speech input devices as well as recognition methods.
K. Lagus et al. / Information Sciences 163 (2004) 135–156 147
4.2. Experiment on the Britannica collection
The collection consisted of about 68,000 articles from the Encyclopaedia
Britannica, and additionally summaries, updates, and other miscellaneous
material of about 43,000 items. Some of the articles were very long, and were
split into several sections. In total, about 115,000 text items were obtained, and
each was regarded as a document to be organized by the WEBSOM.
4.2.1. Preprocessing and document encoding
The text items were preprocessed to remove any HTML markup, links, and
images. Numbers were converted into special dummy symbols. Inflected wordforms were converted to their base forms using a morphological analyzer

148 K. Lagus et al. / Information Sciences 163 (2004) 135–156
[36]. After the preprocessing the average length of the text items was 490
words.
The total vocabulary consisted of 325,275 different words (i.e., base forms
and word forms that were not recognized by the morphological analyzer).After removing a list of 107 stopwords and the words occurring less than 30
times in the corpus, the remaining vocabulary consisted of 39,058 words.
The documents were encoded as random projections of the word histograms
(cf. Section 2.2.2). The end dimension of the projection was 1000 and the
number of ones in each column of the sparse random projection matrix was
three. The IDF method was used for weighting the words (cf. Section 2.3.1).
4.2.2. Construction of the map
The map of the size of 72 · 168 units was created by two-stage magnifica-tion, first from 6 · 14 to 24 · 56 and then to the final size. The batch map
algorithm and speeded winner search were utilized for fast convergence of the
map, and the model vectors were represented using reduced accuracy to de-
crease the memory requirements.
4.2.3. Obtaining descriptive labels for text clusters and map regions
Since the document maps can be very large it is extremely helpful for the
user if the contents of a map region or an individual map unit can be char-
acterized concisely. The characterizations can, for example, be used to labelregions of a document map display. The method introduced in [32] produces
such characterizations; here we will describe it briefly.
For a text cluster, characteristic words that describe it can be obtained using
the following measure of goodness G:
Gðw; jÞ ¼ FjðwÞFjðwÞPi FiðwÞ
; ð4Þ
where FjðwÞ is the proportion of the occurrences of the word w of all words in
cluster j. The measure compares the relative number of occurrences to the
other clusters. However, often the cluster borders are not clearly defined, but
instead rather fuzzy, and then it would be desirable to compare to distantclusters only. When the clusters are ordered, as is the case with the regions of
an ordered document map, this fuzziness can be taken into account in the
keyword selection. This is done by leaving out a so-called neutral zone between
the cluster to be labeled and the rest of the collection. A further advantage of
the ordering is that when labeling a large document collection, the granularity
of labeling (the size of the cluster being labeled) can be varied according to the
viewing depth (or degree of zooming) of the map display.
Table 3 lists some examples of sets of descriptive words obtained for indi-vidual map units on the Britannica map picked up from different clusters.
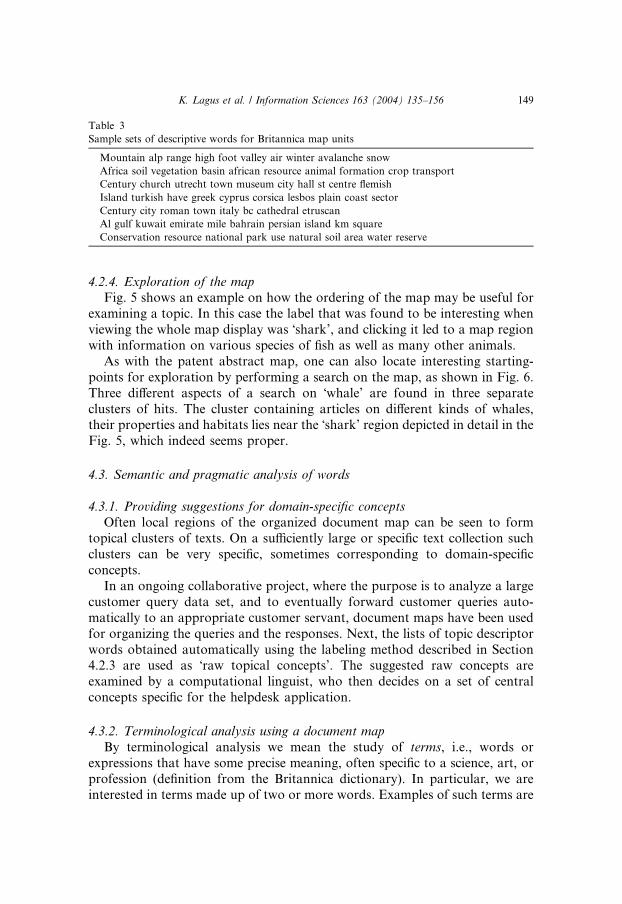
Table 3
Sample sets of descriptive words for Britannica map units
Mountain alp range high foot valley air winter avalanche snow
Africa soil vegetation basin african resource animal formation crop transport
Century church utrecht town museum city hall st centre flemish
Island turkish have greek cyprus corsica lesbos plain coast sector
Century city roman town italy bc cathedral etruscan
Al gulf kuwait emirate mile bahrain persian island km square
Conservation resource national park use natural soil area water reserve
K. Lagus et al. / Information Sciences 163 (2004) 135–156 149
4.2.4. Exploration of the map
Fig. 5 shows an example on how the ordering of the map may be useful for
examining a topic. In this case the label that was found to be interesting when
viewing the whole map display was �shark’, and clicking it led to a map region
with information on various species of fish as well as many other animals.
As with the patent abstract map, one can also locate interesting starting-
points for exploration by performing a search on the map, as shown in Fig. 6.
Three different aspects of a search on �whale’ are found in three separate
clusters of hits. The cluster containing articles on different kinds of whales,their properties and habitats lies near the �shark’ region depicted in detail in the
Fig. 5, which indeed seems proper.
4.3. Semantic and pragmatic analysis of words
4.3.1. Providing suggestions for domain-specific concepts
Often local regions of the organized document map can be seen to formtopical clusters of texts. On a sufficiently large or specific text collection such
clusters can be very specific, sometimes corresponding to domain-specific
concepts.
In an ongoing collaborative project, where the purpose is to analyze a large
customer query data set, and to eventually forward customer queries auto-
matically to an appropriate customer servant, document maps have been used
for organizing the queries and the responses. Next, the lists of topic descriptor
words obtained automatically using the labeling method described in Section4.2.3 are used as �raw topical concepts’. The suggested raw concepts are
examined by a computational linguist, who then decides on a set of central
concepts specific for the helpdesk application.
4.3.2. Terminological analysis using a document map
By terminological analysis we mean the study of terms, i.e., words or
expressions that have some precise meaning, often specific to a science, art, or
profession (definition from the Britannica dictionary). In particular, we areinterested in terms made up of two or more words. Examples of such terms are

Fig. 5. A close-up of the map of Encyclopaedia Britannica articles. The user has clicked a map
region with the label �shark’, obtaining a view of a section of the map with articles on sharks,
various species of fish and eel (in the middle and left); insects and larvae (lower right corner);
various species of birds (upper right corner); etc. Searches performed on the map confirm that also
whales and dolphins can be found nearby (not shown). A topic of interest is thus displayed in a
context of related topics. The three insets depict the contents of three map units, i.e., titles of articles
found in the unit. By clicking the title, one may read the article. The �descriptive words’ list was
obtained with the labeling method (Section 4.2.3) and contains a concise description of the contents
of the map unit.
150 K. Lagus et al. / Information Sciences 163 (2004) 135–156
�color display’ and �speech recognition’. In both cases the individual words that
make up the term are rather common and can be considered rather polyse-
mous.
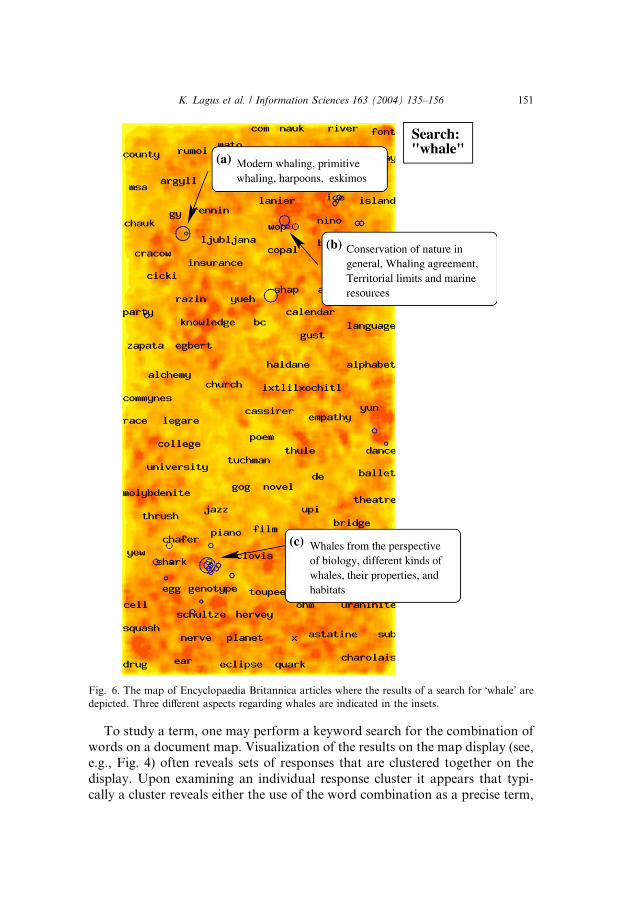
Fig. 6. The map of Encyclopaedia Britannica articles where the results of a search for �whale’ aredepicted. Three different aspects regarding whales are indicated in the insets.
K. Lagus et al. / Information Sciences 163 (2004) 135–156 151
To study a term, one may perform a keyword search for the combination of
words on a document map. Visualization of the results on the map display (see,e.g., Fig. 4) often reveals sets of responses that are clustered together on the
display. Upon examining an individual response cluster it appears that typi-
cally a cluster reveals either the use of the word combination as a precise term,
152 K. Lagus et al. / Information Sciences 163 (2004) 135–156
or the use of the two words in some of their other, individual meanings,
whereas more rarely a mixing of both cases.
To understand why this is so, consider that a polysemous word is typically
used in only one meaning per discourse and therefore per document. If, asclaimed, on a large collection the document map regions form coherent topical
or discourse-specific clusters, it should then follow that a specific region con-
tains examples of a specific meaning corresponding to a term or a word. Dif-
ferent clusters of the term on the map, on the other hand, may correspond to
different meanings of the term.
4.4. Related work on ordered document maps
In an early study Lin formed a small map of scientific documents based on
the words that occurred in the titles [37,38] and later extended the method to
full-text documents [39]. Scholtes has utilized the SOM in constructing a neural
document filter and a neural interest map [40]. Merkl has organized softwarelibrary components [41–43] and studied hierarchical document map formation
[44–46]. Document maps have also been created by Zavrel [47]. A system rather
similar in appearance to the WEBSOM has been used to organize collections of
scientific articles in the field of astronomy [48,49]. The Arizona AI group has
utilized the SOM for categorizing Internet documents to aid in searching and
exploration in a system called the ET-Map [50,51], for adaptive visualization of
search results [52,53], and as part of a specialized application for medical data
mining on the Internet [54]. Recently in [55] a commercial system was describedthat applies the SOM for creating document maps.
In the Themescape method an ordered document landscape is produced by a
fast clustering and projection method [56]. In a promising new approach an
ordered document map is constructed by utilizing a probabilistic model instead
of the vector similarity-based representations and clustering methods [57].
Self-organized document maps have also been applied for obtaining topi-
cally focused statistical language models intended for large vocabulary speech
recognition [58]. The experiments were carried out on English patent abstractsand Finnish news articles, and a considerable improvement was observed in a
word prediction task compared to an unfocused model, or a model focused
using a prior categorization.
5. Conclusions
In a number of studies on different text collections the WEBSOM method
has been shown to be robust for organizing large and varied collections onto
meaningfully ordered document maps. The developed computational speedupsenable the creation of very large maps. The topically ordered document maps
K. Lagus et al. / Information Sciences 163 (2004) 135–156 153
with a suitable user interface provide a tool usable for a combination of
visualization, search, and exploration tasks. The combination offers a new way
of interacting with large and varied text repositories. In this article we have
described our most recent application of the method, namely the creation of adocument map of the Encyclopaedia Britannica articles.
In addition to practical text mining with the purpose of retrieving knowl-
edge about the world the document maps may provide a valuable tool for the
theoretical analysis of language, in particular for the semantic and pragmatic
analysis of words and multiword terms.
The visualized similarity graphs appear to be especially suitable for inter-
active data mining or exploration tasks in which the user either does not know
the domain or the full-text database very well, or has only a vague or pre-liminary idea of what ‘‘interesting information’’ would be like.
References
[1] T. Kohonen, Self-Organizing Maps, Springer, Berlin, 1995, third extended ed., 2001.
[2] T. Kohonen, New developments of learning vector quantization and the self-organizing map,
in: Symposium on Neural Networks; Alliances and Perspectives in Senri (SYNAPSE’92),
Osaka, Japan, 1992.
[3] Y. Cheng, Convergence and ordering of Kohonen’s batch map, Neural Computation 9 (1997)
1667–1676.
[4] K. Lagus, Text mining with the WEBSOM, D.Sc.(Tech) Thesis, Helsinki University of
Technology, Finland, 2000.
[5] G. Salton, M.J. McGill, Introduction to modern information retrieval, McGraw-Hill, New
York, 1983.
[6] S. Deerwester, S.T. Dumais, G.W. Furnas, T.K. Landauer, Indexing by latent semantic
analysis, Journal of the American Society for Information Science 41 (1990) 391–407.
[7] S. Kaski, Dimensionality reduction by random mapping: fast similarity computation for
clustering, in: Proceedings of IJCNN’98, International Joint Conference on Neural Networks,
vol. 1, IEEE Service Center, Piscataway, NJ, 1998, pp. 413–418.
[8] W.B. Johnson, J. Lindenstrauss, Extensions of Lipschitz mappings into a Hilbert space,
Contemporary Mathematics 26 (1984) 189–206.
[9] S. Kaski, Data exploration using self-organizing maps, D.Sc.(Tech) Thesis, Helsinki
University of Technology, Finland, 1997.
[10] T. Kohonen, S. Kaski, K. Lagus, J. Saloj€arvi, V. Paatero, A. Saarela, Organization of a
massive document collection, IEEE Transactions on Neural Networks, Special Issue on Neural
Networks for Data Mining and Knowledge Discovery 11 (3) (2000) 574–585.
[11] C.H. Papadimitriou, P. Raghavan, H. Tamaki, S. Vempala, Latent semantic indexing: a
probabilistic analysis, in: Proceedings of the 17th ACM Symposium on the Principles of
Database Systems, Seattle, ACM Press, 1998.
[12] A.K. Jain, R.C. Dubes, Algorithms for clustering data, Prentice Hall, Englewood Cliffs, NJ,
1988.
[13] E. Charniak, Statistical Language Learning, MIT Press, 1993.
[14] S. Finch, N. Chater, Unsupervised methods for finding linguistic categories, in: I. Aleksander,
J. Taylor (Eds.), Artificial Neural Networks, vol. 2, North-Holland, 1992, pp. II-1365–II-1368.

154 K. Lagus et al. / Information Sciences 163 (2004) 135–156
[15] T. Honkela, V. Pulkki, T. Kohonen, Contextual relations of words in Grimm tales analyzed by
self-organizing map, in: F. Fogelman-Souli�e, P. Gallinari (Eds.), Proceedings of ICANN-95,
International Conference on Artificial Neural Networks, vol. 2, EC2 et Cie, Paris, 1995,
pp. 3–7.
[16] J. Zavrel, J. Veenstra, The language environment and syntactic word-class aquisition, in:
Proceedings of the Groningen Assembly on Language Aquisition (GALA95), 1995, pp. 365–
374.
[17] H. Ritter, T. Kohonen, Self-organizing semantic maps, Biological Cybernetics 61 (1989) 241–
254.
[18] T. Honkela, Self-organizing maps in natural language processing, Ph.D. Thesis, Helsinki
University of Technology, Espoo, Finland, 1997.
[19] T. Honkela, S. Kaski, K. Lagus, T. Kohonen, Newsgroup exploration with WEBSOMmethod
and browsing interface, Tech. Rep. A32, Helsinki University of Technology, Laboratory of
Computer and Information Science, Espoo, Finland, 1996.
[20] S. Kaski, T. Honkela, K. Lagus, T. Kohonen, WEBSOM––self-organizing maps of document
collections, Neurocomputing 21 (1998) 101–117.
[21] C.D. Manning, H. Sch€utze, Foundations of Statistical Natural Language Processing, The MIT
Press, Cambridge, Massachusetts, 1999.
[22] T. Kohonen, The speedy SOM, Tech. Rep. A33, Helsinki University of Technology,
Laboratory of Computer and Information Science, Espoo, Finland, 1996.
[23] J.S. Rodrigues, L.B. Almeida, Improving the learning speed in topological maps of patterns,
in: Proceedings of the INNC’90, International Neural Networks Conference, Kluwer,
Dordrecht, Netherlands, 1990, pp. 813–816.
[24] P. Koikkalainen, Progress with the tree-structured self-organizing map, in: A.G. Cohn (Ed.),
Proceedings of the ECAI’94, 11th European Conference on Artificial Intelligence, John Wiley
& Sons, New York, 1994, pp. 211–215.
[25] P. Koikkalainen, Fast deterministic self-organizing maps, in: F. Fogelman-Souli�e, P. Gallinari
(Eds.), Proceedings of the ICANN’95, International Conference on Artificial Neural
Networks, vol. II, EC2, Nanterre, France, 1995, pp. 63–68.
[26] T. Kohonen, Things you haven’t heard about the Self-Organizing Map, in: Proceedings of the
ICNN’93, International Conference on Neural Networks, IEEE Service Center, Piscataway,
NJ, 1993, pp. 1147–1156.
[27] T. Honkela, S. Kaski, K. Lagus, T. Kohonen, Exploration of full-text databases with self-
organizing maps, in: Proceedings of the ICNN96, International Conference on Neural
Networks, vol. 1, IEEE Service Center, Piscataway, NJ, 1996, pp. 56–61.
[28] S. Kaski, T. Honkela, K. Lagus, T. Kohonen, Creating an order in digital libraries with self-
organizing maps, in: Proceedings of WCNN’96, World Congress on Neural Networks,
September 15–18, San Diego, California, Lawrence Erlbaum and INNS Press, Mahwah, NJ,
1996, pp. 814–817.
[29] T. Kohonen, S. Kaski, K. Lagus, T. Honkela, Very large two-level SOM for the browsing of
newsgroups, in: C. von der Malsburg, W. von Seelen, J.C. Vorbr€uggen, B. Sendhoff (Eds.),
Proceedings of ICANN96, International Conference on Artificial Neural Networks, Bochum,
Germany, July 16–19, 1996, Lecture Notes in Computer Science, vol. 1112, Springer, Berlin,
1996, pp. 269–274.
[30] K. Lagus, T. Honkela, S. Kaski, T. Kohonen, Self-organizing maps of document collections: a
new approach to interactive exploration, in: E. Simoudis, J. Han, U. Fayyad (Eds.),
Proceedings of the Second International Conference on Knowledge Discovery and Data
Mining, AAAI Press, Menlo Park, California, 1996, pp. 238–243.
[31] K. Lagus, Map of WSOM’97 abstracts––alternative index, in: Proceedings of WSOM’97,
Workshop on Self-Organizing Maps, Espoo, Finland, June 4–6, Helsinki University of
Technology, Neural Networks Research Centre, Espoo, Finland, 1997, pp. 368–372.
K. Lagus et al. / Information Sciences 163 (2004) 135–156 155
[32] K. Lagus, S. Kaski, Keyword selection method for characterizing text document maps, in:
Proceedings of ICANN99, Ninth International Conference on Artificial Neural Networks, vol.
1, IEE, London, 1999, pp. 371–376.
[33] K. Lagus, Generalizability of the WEBSOM method to document collections of various types,
in: Proceedings of the 6th European Congress on Intelligent Techniques and Soft Computing
(EUFIT’98), vol. 1, Aachen, Germany, 1998, pp. 210–214.
[34] T. Kohonen, S. Kaski, K. Lagus, J. Saloj€arvi, J. Honkela, V. Paatero, A. Saarela, Self
organization of a massive text document collection, in: E. Oja, S. Kaski (Eds.), Kohonen
Maps, Elsevier, Amsterdam, 1999, pp. 171–182.
[35] K. Lagus, Text retrieval using self-organized document maps, Neural Processing Letters 15 (1)
(2002) 21–29.
[36] K. Koskenniemi, Two-level morphology: a general computational model for word-form
recognition and production, Ph.D. Thesis, University of Helsinki, Department of General
Linguistics, 1983.
[37] X. Lin, D. Soergel, G. Marchionini, A self-organizing semantic map for information retrieval,
in: Proceedings of 14th Annual International ACM/SIGIR Conference on Research and
Development in Information Retrieval, 1991, pp. 262–269.
[38] X. Lin, Visualization for the document space, in: Proceedings of Visualization’92, Center for
Comput. Legal Res., Pace Univ., White Plains, NY, USA, IEEE Comput. Soc. Press, Los
Alamitos, CA, USA, 1992, pp. 274–281.
[39] X. Lin, Map displays for information retrieval, Journal of the American Society for
Information Science 48 (1997) 40–54.
[40] J.C. Scholtes, Neural networks in natural language processing and information retrieval, Ph.D.
Thesis, Universiteit van Amsterdam, Amsterdam, Netherlands, 1993.
[41] D. Merkl, Structuring software for reuse––the case of self-organizing maps, in: Proceedings of
IJCNN-93-Nagoya, International Joint Conference on Neural Networks, vol. III, JNNS,
IEEE Service Center, Piscataway, NJ, 1993, pp. 2468–2471.
[42] D. Merkl, Content-based software classification by self-organization, in: Proceedings of
ICNN’95, IEEE International Conference on Neural Networks, vol. II, IEEE Service Center,
Piscataway, NJ, 1995, pp. 1086–1091.
[43] D. Merkl, Exploration of text collections with hierarchical feature maps, in: Proceedings of
SIGIR’97, 20th Annual International ACM SIGIR Conference on Research and Development
in Information Retrieval, ACM, New York, 1997.
[44] D. Merkl, Lessons learned in text document classification, in: Proceedings of the Workshop on
Self-Organizing Maps 1997 (WSOM’97), Helsinki University of Technology, Neural Networks
Research Centre, Espoo, Finland, 1997, pp. 316–321.
[45] D. Merkl, Document classification with self-organizing maps, in: E. Oja, S. Kaski (Eds.),
Kohonen Maps, Elsevier, 1999, pp. 183–195.
[46] D. Merkl, A. Rauber, Uncovering the hierarchical structure of text archives by using an
unsupervised neural network with adaptive architecture, in: Pacific Asia Conference on
Knowledge Discovery and Data Mining (PAKDD’2000), 2000.
[47] J. Zavrel, Neural navigation interfaces for information retrieval: are they more than an
appealing idea?, Artificial Intelligence Review 10 (5-6) (1996) 477–504.
[48] S. Lesteven, P. Ponc�ot, F. Murtagh, Neural networks and information extraction in
astronomical information retrieval, Vistas in Astronomy 40 (1996) 395.
[49] P. Poinc�ot, S. Lesteven, F. Murtagh, A spatial user interface to the astronomical literature,
Astronomy and Astrophysics 130 (1998) 183–191.
[50] H. Chen, C. Schuffels, R. Orwig, Internet categorization and search: a self-organizing
approach, Journal of the Visual Communication and Image Representation 7 (1996) 88–102.
[51] R. Orwig, H. Chen, J.F. Nunamaker, A graphical, self-organizing approach to classifying
electronic meeting output, Journal of the American Society for Information Science 48 (2)
(1997) 157–170.

156 K. Lagus et al. / Information Sciences 163 (2004) 135–156
[52] D. Roussinov, M. Ramsey, Information forage through adaptive visualization, in: The Third
ACM Conference on Digital Libraries, June 23–26, Pittsburgh, 1998, pp. 303–304.
[53] D. Roussinov, Internet search using adaptive visualization, in: Conference on Human Factors
in Computing Systems, Doctoral Consortium (SIGCHI’99), ACM, 1999.
[54] A.L. Houston, H. Chen, S.M. Hubbard, B.R. Schatz, T.D. Ng, R.R. Sewell, K.M. Tolle,
Medical data mining on the internet: Research on a cancer information system, Artificial
Intelligence Review 13 (5-6) (1999) 437–466.
[55] S. Shumsky, Navigation in databases using self-organizing maps, in: E. Oja, S. Kaski (Eds.),
Kohonen Maps, Elsevier, 1999, pp. 197–206.
[56] J.A. Wise, The ecological approach to text visualization, Journal of the American Society for
Information Science 50 (13) (1999) 1224–1233.
[57] T. Hofmann, Probmap––a probabilistic approach for mapping large document collections,
Journal for Intelligent Data Analysis 4 (2000) 149–164.
[58] M. Kurimo, K. Lagus, An efficiently focusing large vocabulary language model, in:
Proceedings of the ICANN’02, International Conference on Artificial Neural Networks,
Madrid, August 28–30, 2002, pp. 1068–1073.