ministry of agriculture and animal resources
TRANSCRIPT

iv
Republic of Rwanda
Ministry of Agriculture and Animal Resources
Annual Report FY 2013-2014

v
List of Tables
TABLE 1: SELECTED VISION 2020 TARGETS ............................................................................................................ 3 TABLE 2: PROGRESS OF AGRICULTURAL SECTOR .................................................................................................... 3 TABLE 3: ROADMAP TOWARD VISION 2020 ............................................................................................................. 3 TABLE 4: CROP ASSESSMENT 2014 A (MINAGRI) ................................................................................................. 6 TABLE 5: CROP ASSESSMENT 2014 B (MINAGRI) ................................................................................................. 7 TABLE 6: ANIMAL PRODUCTS IN TONS 2005-2013 (MINAGRI) ............................................................................ 10 TABLE 7: MARSHLAND DEVELOPMENT AND HILLSIDE IRRIGATION IN HA (MINAGRI) ......................................... 12 TABLE 8: LAND MECHANICALLY PLOUGHED IN HA DURING THE FY 2013-2014 (MINAGRI) ............................... 12 TABLE 9:REALIZED FIELD VISITS & TRAINING ..................................................................................................... 13 TABLE 10: PERFORMANCE ON EDPRS II TARGETS IN FY 2013/14 ........................................................................ 27 TABLE 11: PSTA III OUTCOME MATRIX FOR FY 2013/14 .................................................................................... 28 TABLE 12: PROGRESS ON POLICY ACTIONS IN FY 2013/14 ................................................................................... 30 TABLE 13: MINAGRI INTERNAL BUDGET EXECUTION FY 2013/14 ..................................................................... 84 TABLE 14: BUDGET EXECUTION BY PSTA III PROGRAMMES & SUB-PROGRAMMES ............................................. 84 TABLE 16: NATIONAL BUDGETARY ALLOCATION TO MINAGRI (US $ ‘000S)..................................................... 86 TABLE 17: DECENTRALIZED BUDGET TRANSFERS (FUNDS ALREADY DISBURSED BY THE EU) ............................. 86 TABLE 18: KEY PRIORITIES FOR FY 2014/15 ........................................................................................................ 89

1
SECTION 1: INTRODUCTION AND SUMMARY
OF SECTOR PERFORMANCE

2
1.1 Overview of the Agricultural Sector
The Rwandan economy exhibited impressive macroeconomic performance from 2001-2012. In this period the
economy grew in real terms (GDP) at an annual average rate of 8 percent. This strong growth performance was
accompanied by substantial improvements in living standards, significant progress toward the Millennium
Development Goals (MDGs), rapid growth in household consumption levels and a fall in the poverty headcount
ratio from 59 percent in 2001 to 45 percent in 2011. Agriculture was one of the main drivers of the socio-economic
achievements in this period, significantly lifting rural households out of poverty. Although the share of agriculture
in GDP decreased over this period from 37.3 percent to 31.2 percent, the sector remained the backbone of the
Rwandan economy through the generation of employment and sources of income for the majority of households
in the country (NISR, 2013). To illustrate, the sector contributed toward 28% of total economic growth and
approximately 45% of the poverty reduction outcomes from 2001-2011.
The Rwandan agricultural sector is experiencing a period of transformation- this is evident in the significant
sectorial progress achieved under its first and second strategic plans, PSTA I and PSTA II. Under PSTA
II/CAADP I (2008-2012) the productivity and marketing of food production experienced a notable increase driven
by a scaling up of productive investments in the Crop Intensification Programme (CIP) and the Land Use
Consolidation Programme, along with subsidization of fertilizer, improved seeds, and land development costs.
The period also observed impressive increases in milk production, largely attributed to the One Cow per Poor
Family (Girinka) programme.
Over the next five years, as we approach the end point for Rwanda’s overarching development framework Vision
2020, sectorial growth must be driven by both further yield increases and a more market driven approach. FY
2013/14 was the first year of implementation of phase III of the Programme for Strategic Transformation of
Agriculture. PSTA III is an investment framework for private sector development, soft and hard infrastructure for
agri-business and increased production of high value crops and processing. However, the strategy also recognises
the opportunity for further yield increases in staple crops, to facilitate domestic food security. The approach is
integrated - gender inclusivity and environmental sustainability are mainstreamed across programmes. In the short
term, continued rapid food production increases will ensure further reductions in rural poverty and malnutrition.
In the medium term, Rwandan agriculture will develop from a largely subsistence sector to a more knowledge-
intensive, market-oriented sector, sustaining growth and adding value.
During the last financial year, the sector has made important steps in realising the vision of market oriented
production. The Ministry of Agriculture and Animal Resources (MINAGRI), its two task forces of irrigation and
mechanization (TF I&M) and post-harvest handling and storage (TF PHHS), the Single Project Implementation
Unit (SPIU) and the two implementing bodies, the Rwanda Agriculture Board (RAB) and National Agricultural
Export Development Board (NAEB), have worked in partnership to deliver strategic programmes and projects.
This report outlines the achievements and challenges of the sector of the 2013-2014 FY. Further details can be
found in the RAB and NAEB Annual Reports. The final chapter of the MINAGRI Annual Report also identifies
priorities for the next financial year. It will be a major task to effect the systemic change required to double
productivity and achieve ambitious national goals. It is only through a partnership based approach focused on
implementation that MINAGRI, in collaboration with the private sector, donors and farmers, can effectively
transform the sector, and drive forward Rwanda’s overall development trajectory.
With the agricultural context explained, the rest of this chapter outlines progress in key agricultural intervention
areas of crop production, animal production, irrigation, land husbandry and mechanization, post-harvest handling
and storage, export promotion and key cross-cutting issues.
1.2 Progress towards Vision 2020
Vision 2020 defines the main goals which must be met for the country to achieve middle income status and
reduced poverty by 2020. Progress towards meeting these targets continues, with key indicators pertaining to the
agricultural sector illustrated in table 1 for FY 2013/14. The percentage of mechanized agricultural operations
increased to 15%, up from 12% last year. Efforts directed toward soil conservation through terracing and erosion
control ensured that 81% of the total land in Rwanda is now protected against soil erosion. Food security remains
a national priority- the indicator for assessing progress toward the objective may however require some
clarification. The ‘Food Consumption Score’ (FCS) is an internationally accepted World Food Programme (WFP)
indicator that captures the frequency of consumption of different food groups within a household’s diet. The
indicator differentiates between three levels of food consumption- poor, borderline and acceptable. As compared

3
with the 2009 CFSVA and Nutrition Survey, the percentage of households with poor FCS declined by a percentage
point, whereas those with borderline FCS showed a slight increase. On aggregate the number of food secure
households in 2012 was not statistically differentiable from the number in 2009. However, this result may well be
a function of the timing and nature of the two household surveys (the importance of seasonality in determining
food stocks available to households and concerns about inter-temporal comparability). Given these concerns it is
plausible that the percentage of food secure households between 2009 and 2012 in Rwanda actually showed an
increase. Please refer to the CFSVA and Nutrition Survey Report 2012 for further details.
Table 1: Selected Vision 2020 Targets
Revised Selected Vision 2020
Indicators
2000
(calendar) FY 2013-2014 2020 revised
(calendar)
Source
Agricultural GDP growth (%) 9 3 8.5% NISR
Agriculture as % of GDP 45 33 25% NISR
Fertilizer application (kg/ha/annum) 0.5 32 50 MINAGRI
% of Agriculture Operations
Mechanized
n.a. 15% 50% MINAGRI
Food Security Indicator: Food
Consumption Score
n.a Poor FCS: 4%
Borderline: 17%
(2012)
Poor FCS: 0%
Borderline:5%
CFSVA & Nutrition
Survey, 2012
Soil erosion protection (% of
cultivated land)
20 78.1% 91% MINAGRI
The time series for the annual growth rate of the sector is depicted in Table 2. In FY 2013-14 the calculation of
sectorial growth was based on the new agricultural seasonal survey conducted by the NISR (National Institute for
Statistics Rwanda). Previously the sector’s growth performance was computed from data sourced by the
MINAGRI Crop Assessment Report. The data point for FY 2013/14 agricultural sector growth is therefore not
comparable with the historical data owing to a change in computation methodology. Sectorial growth in FY
2013/14 was nonetheless adversely affected by insufficient rainfall in both Seasons A and B. This is elucidated
upon in Section 1.4 under the Crop Production Report. Efforts to mitigate the sector’s dependence on weather
conditions through irrigation projects, crop intensification, and the mainstreaming of climate change awareness
(and mitigation strategies) within the planning process were emphasized through the course of the year.
Table 2: Progress of Agricultural Sector
Growth Rate/Fiscal Year
2007-
08
2008-
09
2009-
10
2010-
11
2011-
12
2012-
13
2013-
14
GDP Growth Rate 8.0% 8.3% 4.3% 5.8% 9.5% 6.9% 5.1%
Agricultural Sector Growth Rate 4% 5% 5% 3% 8% 6% 3%
Agriculture as a % of GDP 34% 33% 34% 31% 33% 34% 33%
Source: National Accounts FY 2013/14 (NISR)
1.3 Sectorial Roadmap toward Vision 2020 Objectives: EDPRS II & PSTA III
Vision 2020 is supported by the Economic Development and Poverty Reduction Strategy at the national level.
EDPRS II, which was launched in 2013, identifies the agricultural sector as a key driver of inclusive economic
growth. The agricultural sector contributes to the EDPRS II goals of rural development & foundational and cross-
cutting issues. MINAGRI aids rural development by augmenting agricultural productivity and promoting the use
of sustainable practices therein. The sector’s efforts to promote food security and nutrition are classified as
contributing toward the goal of ‘foundational and cross cutting issues’ under EDPRS II. The progress against
EDPRS II objectives for the agricultural sector in FY 2013/14 is reported under Section II of the annual report.
The following table elucidates how the sector intends to actualize its targets for FY 2020 by setting high
performance targets for the 2017/18 FY under EDPRS II.
Table 3: Roadmap toward Vision 2020
Objectives EDPRS 2 targets by 2017/18 Vision 2020 targets
4
Rapid economic growth to
Middle Income status
GDP per capita of $1001
Avg. GDP growth of 10.2%
GDP per capita of $1240
Avg. GDP growth of 11.5%
Increased Poverty reduction Poverty reduced under 30%
Extreme poverty under 10%
Poverty reduced under 20%
Extreme poverty moving
towards eradication
More off-farm jobs 200,000 new off farm jobs p.a. 200,000 new off farm jobs
p.a.
Increased self-reliance Exports Growth of 28% p.a.
Exports cover. of Imports 75%
by 2017
Exports Growth of 28% p.a.
Exports cover. of Imports 80%
by 2020
Private Sector as engine of
growth
Private sector investment to
reach 15.4% of GDP
Private sector investment to
reach 20% of GDP
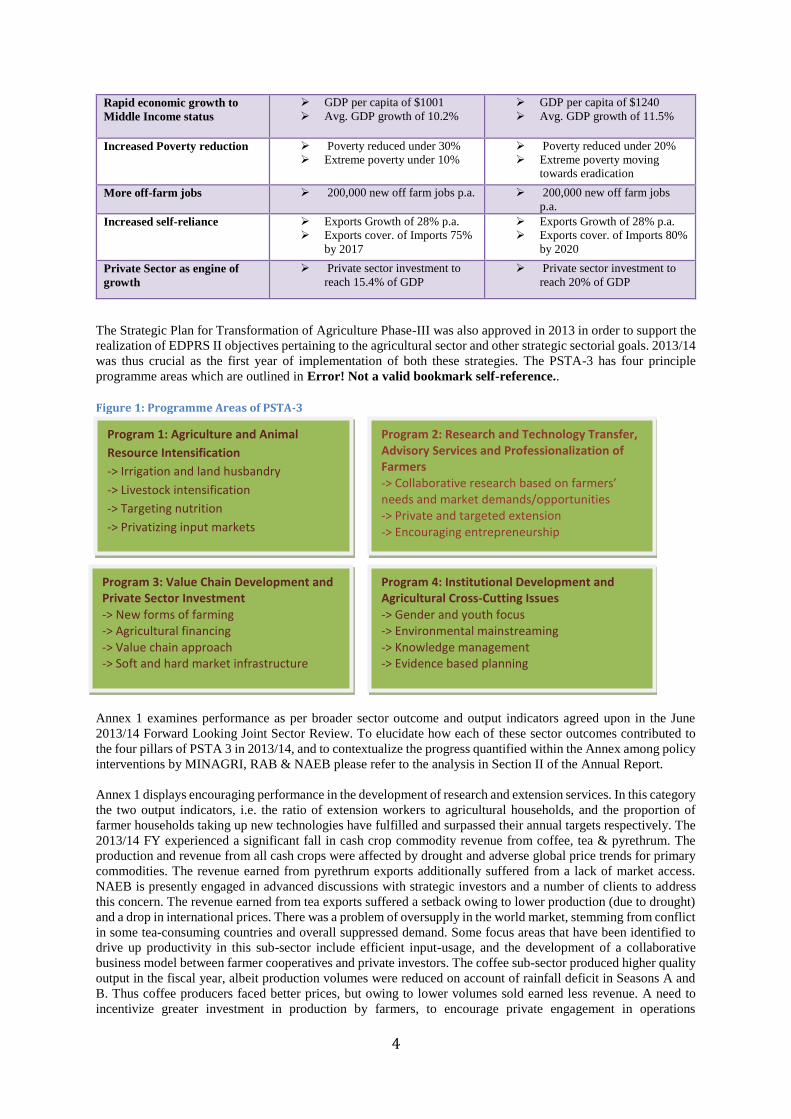
The Strategic Plan for Transformation of Agriculture Phase-III was also approved in 2013 in order to support the
realization of EDPRS II objectives pertaining to the agricultural sector and other strategic sectorial goals. 2013/14
was thus crucial as the first year of implementation of both these strategies. The PSTA-3 has four principle
programme areas which are outlined in Error! Not a valid bookmark self-reference..
Annex 1 examines performance as per broader sector outcome and output indicators agreed upon in the June
2013/14 Forward Looking Joint Sector Review. To elucidate how each of these sector outcomes contributed to
the four pillars of PSTA 3 in 2013/14, and to contextualize the progress quantified within the Annex among policy
interventions by MINAGRI, RAB & NAEB please refer to the analysis in Section II of the Annual Report.
Annex 1 displays encouraging performance in the development of research and extension services. In this category
the two output indicators, i.e. the ratio of extension workers to agricultural households, and the proportion of
farmer households taking up new technologies have fulfilled and surpassed their annual targets respectively. The
2013/14 FY experienced a significant fall in cash crop commodity revenue from coffee, tea & pyrethrum. The
production and revenue from all cash crops were affected by drought and adverse global price trends for primary
commodities. The revenue earned from pyrethrum exports additionally suffered from a lack of market access.
NAEB is presently engaged in advanced discussions with strategic investors and a number of clients to address
this concern. The revenue earned from tea exports suffered a setback owing to lower production (due to drought)
and a drop in international prices. There was a problem of oversupply in the world market, stemming from conflict
in some tea-consuming countries and overall suppressed demand. Some focus areas that have been identified to
drive up productivity in this sub-sector include efficient input-usage, and the development of a collaborative
business model between farmer cooperatives and private investors. The coffee sub-sector produced higher quality
output in the fiscal year, albeit production volumes were reduced on account of rainfall deficit in Seasons A and
B. Thus coffee producers faced better prices, but owing to lower volumes sold earned less revenue. A need to
incentivize greater investment in production by farmers, to encourage private engagement in operations
Program 2: Research and Technology Transfer, Advisory Services and Professionalization of Farmers
-> Collaborative research based on farmers’ needs and market demands/opportunities
-> Private and targeted extension
-> Encouraging entrepreneurship
Program 3: Value Chain Development and Private Sector Investment -> New forms of farming
-> Agricultural financing
-> Value chain approach
-> Soft and hard market infrastructure
Program 4: Institutional Development and Agricultural Cross-Cutting Issues
-> Gender and youth focus
-> Environmental mainstreaming
-> Knowledge management -> Evidence based planning
Figure 1: Programme Areas of PSTA-3
Program 1: Agriculture and Animal
Resource Intensification
-> Irrigation and land husbandry
-> Livestock intensification
-> Targeting nutrition
-> Privatizing input markets

5
downstream, and to develop a Zoning Policy have been underlined as essential to develop the coffee sub-sector.
Going forward the sector plans to boost horticulture for commodity exports, and a greater role of non-traditional
exports in the total basket of agricultural exports.
Improvements in the environment for agri-business in 2013/14 were primarily driven by an increase in the
provision of credit for agricultural production and agro-processing. Loans for this purpose increased to 6.1% of
overall loans (or a total amount of 35,273,866,000 Rwf). Efforts to improve post-harvest management and agro
processing are included the dissemination of training material & know-how for post-harvest best practices, the
construction of drying bays and rehabilitation of rural feeder roads. For instance, 23,281 farmers from over 500
cooperatives received training on maize, rice, beans, soya beans, wheat & Irish potatoes postharvest (PH) best
practices; and 72,095 were farmers coached on maize, rice, beans, soya beans, wheat & Irish potatoes post-harvest
handling practices. With stakeholder support, 101.15 km of rural feeder roads (RFR) were rehabilitated in 7
districts under the EU funded Sector Policy Support Programme; 30 km under the RFR Programme funded by the
AfDB in Nyamagabe District; and 54 km were rehabilitated in the Kirehe District under the IFAD funded
KWAMP programme. For more details please refer to Annex 1.
Approval of RFR rehabilitation standards: The feeder road standards were developed by RTDA (Rwanda
Transport Development Agency) and approved at ministerial level in June 2013. The process of approval by RSB
(Rwanda Standards Board) was started in 2014. The RSB received the final report on feeder road standards and
has produced two standards: “Feeder roads Part 1: Guidelines for design”, and “Feeder roads Part 2: Guidelines
for maintenance”. These standards have been approved by the board of RSB on 5 January 2015 and have been
published.
Development of a specific RFR policy and strategy at national level: A budget for this study is included in the
WB funded “Rural Feeder Road Development Programme” (RFRDP). The ToR for the study have been finalised
and the procurement of the study will start soon. The study is expected to start in April 2015 and be completed
in July-August 2015. The Policy and Strategy should be approved before the end of 2015.
Preparation of Feeder road master plans by district to be included in the District Development Plans: Based upon
the National RFR Policy and Strategy, the PSC of the National Feeder Roads Programme has decided to prepare
a National Feeder Roads Master Plan (NFRMP) from which District Feeder Roads Action Plans will be extracted.
The Netherlands have volunteered to mobilise additional funds from their HQ to fund this study. The study would
start in August 2015 as soon as the strategy study is completed. The implementation of the NFRMP and the action
plans will take six months and should be ready by January 2016.
1.4 Crop Production Report
Crop production represents one of the most important indicators of the sector’s success. MINAGRI and its
implementing agencies invest heavily in diverse areas to drive up yields, including infrastructure based
programmes such as irrigation and terracing, inputs provision, training to improve production management and
research to identify the best varieties for different agro-climactic zones. The data for harvested area (by crop),
crop yields and crop production for Seasons 2014A and 2014B are presented in Table 4 and Table 5 respectively.
Season 2014A
In Season 2014A the rains started too early (in September) when compared with that of Season 2013A, and were
irregular during the whole season. The western and northern provinces received enough rain in general while the
southern and eastern provinces received low and irregular rains. Especially, in 2nd dekad of October, the rains in
the southern and eastern provinces were below 50% of rains typically received in the month. As result, many
farmers lost pulses that do not persist on continued shortage of rains. In the western and northern provinces, the
situation was normal.
Countrywide in terms of area under crops, the main crops continued to be pulses (30%), roots & tubers (25%),
cereals (22%) and banana (18%). The main crops in terms of share of land under cultivation were: beans (24%),
maize (19%), banana (19%), cassava (11%), Irish potato (10%) and sweet potato (5%). In general, when we
compare the volume of production in terms Kcal between seasons 2013A and 2014A an increase of only 2% is
found due to irregular weather conditions, which negatively affected the area under crop cultivation.
In season A, due to adverse weather some crops showed a decrease in terms of yield and production. In particular
maize, beans, groundnuts, Irish potato and yam decreased production of over 3% in comparison to the 2013A
Season. Albeit the numbers indicate that there was increased crop production for cassava, taro, banana and
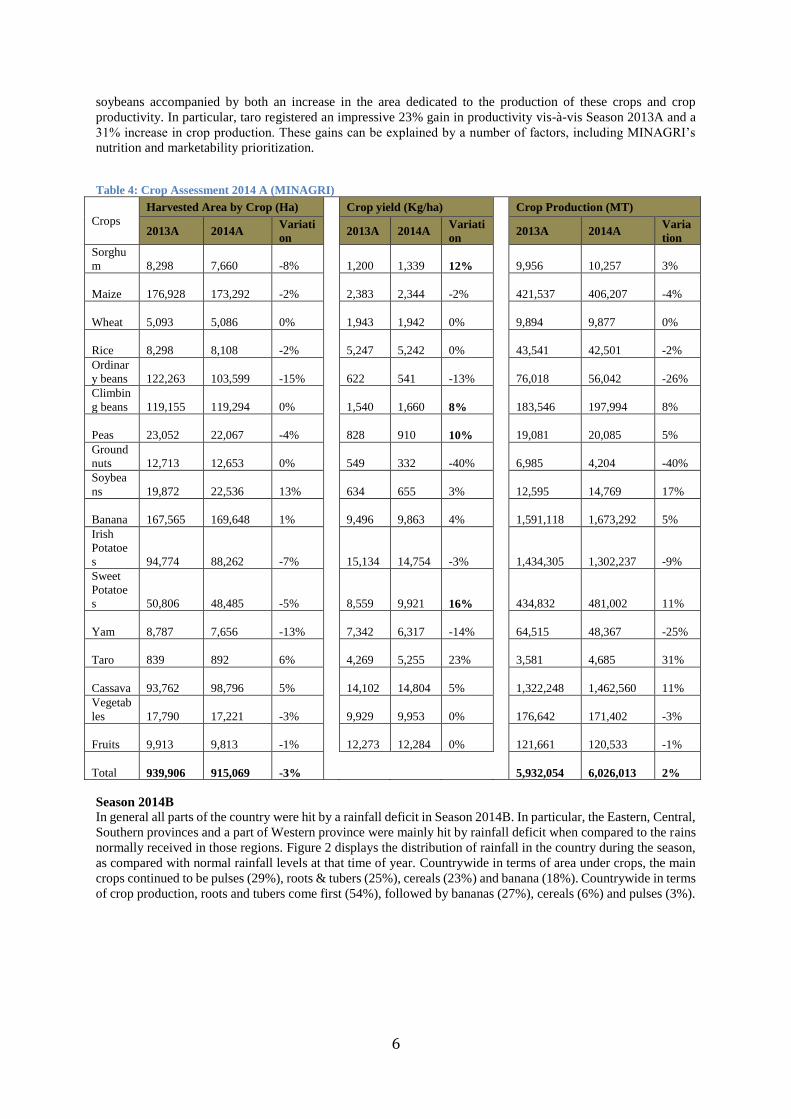
6
soybeans accompanied by both an increase in the area dedicated to the production of these crops and crop
productivity. In particular, taro registered an impressive 23% gain in productivity vis-à-vis Season 2013A and a
31% increase in crop production. These gains can be explained by a number of factors, including MINAGRI’s
nutrition and marketability prioritization.
Table 4: Crop Assessment 2014 A (MINAGRI)
Crops
Harvested Area by Crop (Ha) Crop yield (Kg/ha) Crop Production (MT)
2013A 2014A Variati
on 2013A 2014A
Variati
on 2013A 2014A
Varia
tion
Sorghu
m 8,298
7,660 -8%
1,200
1,339 12%
9,956
10,257 3%
Maize 176,928
173,292 -2%
2,383
2,344 -2%
421,537
406,207 -4%
Wheat 5,093
5,086 0%
1,943
1,942 0%
9,894
9,877 0%
Rice 8,298
8,108 -2%
5,247
5,242 0%
43,541
42,501 -2%
Ordinar
y beans 122,263
103,599 -15%
622
541 -13%
76,018
56,042 -26%
Climbin
g beans 119,155
119,294 0%
1,540
1,660 8%
183,546
197,994 8%
Peas 23,052
22,067 -4%
828
910 10%
19,081
20,085 5%
Ground
nuts 12,713
12,653 0%
549
332 -40%
6,985
4,204 -40%
Soybea
ns 19,872
22,536 13%
634
655 3%
12,595
14,769 17%
Banana 167,565
169,648 1%
9,496
9,863 4%
1,591,118
1,673,292 5%
Irish
Potatoe
s 94,774
88,262 -7%
15,134
14,754 -3%
1,434,305
1,302,237 -9%
Sweet
Potatoe
s 50,806
48,485 -5%
8,559
9,921 16%
434,832
481,002 11%
Yam 8,787
7,656 -13%
7,342
6,317 -14%
64,515
48,367 -25%
Taro 839
892 6%
4,269
5,255 23%
3,581
4,685 31%
Cassava 93,762
98,796 5%
14,102
14,804 5%
1,322,248
1,462,560 11%
Vegetab
les 17,790
17,221 -3%
9,929
9,953 0%
176,642
171,402 -3%
Fruits 9,913
9,813 -1%
12,273
12,284 0%
121,661
120,533 -1%
Total
939,906
915,069 -3%
5,932,054
6,026,013 2%
Season 2014B
In general all parts of the country were hit by a rainfall deficit in Season 2014B. In particular, the Eastern, Central,
Southern provinces and a part of Western province were mainly hit by rainfall deficit when compared to the rains
normally received in those regions. Figure 2 displays the distribution of rainfall in the country during the season,
as compared with normal rainfall levels at that time of year. Countrywide in terms of area under crops, the main
crops continued to be pulses (29%), roots & tubers (25%), cereals (23%) and banana (18%). Countrywide in terms
of crop production, roots and tubers come first (54%), followed by bananas (27%), cereals (6%) and pulses (3%).
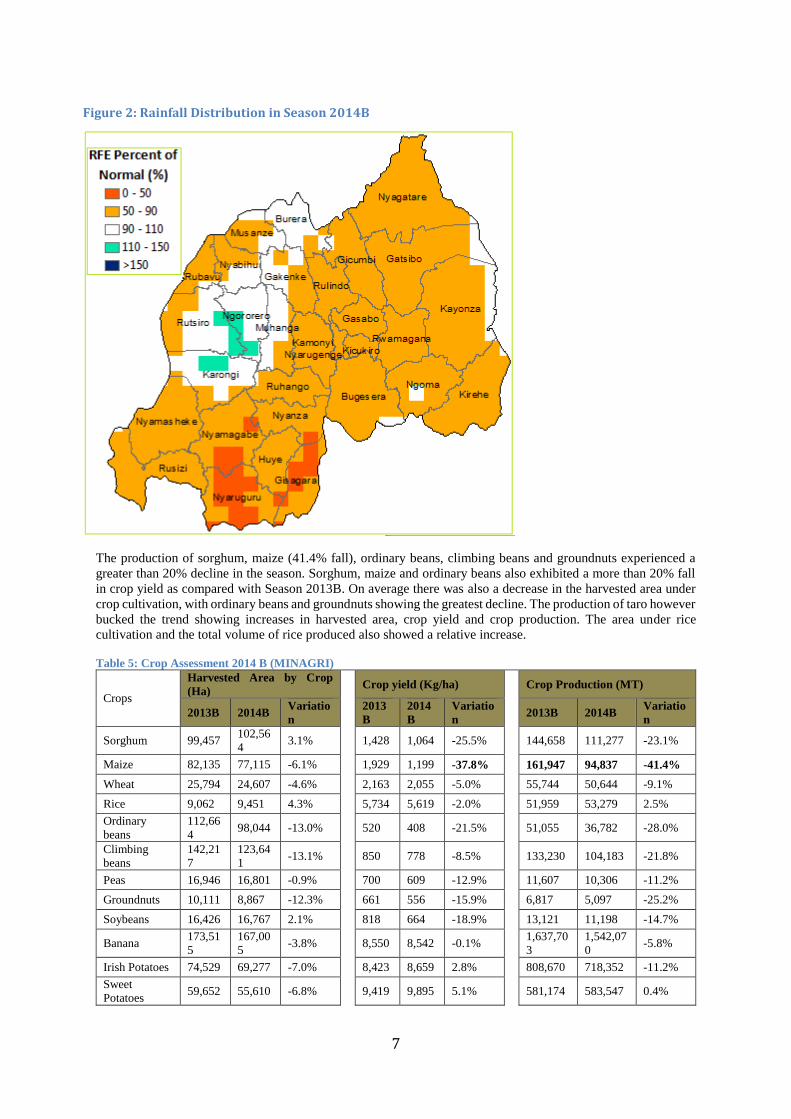
7
The production of sorghum, maize (41.4% fall), ordinary beans, climbing beans and groundnuts experienced a
greater than 20% decline in the season. Sorghum, maize and ordinary beans also exhibited a more than 20% fall
in crop yield as compared with Season 2013B. On average there was also a decrease in the harvested area under
crop cultivation, with ordinary beans and groundnuts showing the greatest decline. The production of taro however
bucked the trend showing increases in harvested area, crop yield and crop production. The area under rice
cultivation and the total volume of rice produced also showed a relative increase.
Table 5: Crop Assessment 2014 B (MINAGRI)
Crops
Harvested Area by Crop
(Ha) Crop yield (Kg/ha) Crop Production (MT)
2013B 2014B Variatio
n 2013
B
2014
B
Variatio
n 2013B 2014B
Variatio
n
Sorghum 99,457 102,56
4 3.1% 1,428 1,064 -25.5% 144,658 111,277 -23.1%
Maize 82,135 77,115 -6.1% 1,929 1,199 -37.8% 161,947 94,837 -41.4%
Wheat 25,794 24,607 -4.6% 2,163 2,055 -5.0% 55,744 50,644 -9.1%
Rice 9,062 9,451 4.3% 5,734 5,619 -2.0% 51,959 53,279 2.5%
Ordinary
beans
112,66
4 98,044 -13.0% 520 408 -21.5% 51,055 36,782 -28.0%
Climbing
beans
142,21
7
123,64
1 -13.1% 850 778 -8.5% 133,230 104,183 -21.8%
Peas 16,946 16,801 -0.9% 700 609 -12.9% 11,607 10,306 -11.2%
Groundnuts 10,111 8,867 -12.3% 661 556 -15.9% 6,817 5,097 -25.2%
Soybeans 16,426 16,767 2.1% 818 664 -18.9% 13,121 11,198 -14.7%
Banana 173,51
5
167,00
5 -3.8% 8,550 8,542 -0.1% 1,637,70
3
1,542,07
0 -5.8%
Irish Potatoes 74,529 69,277 -7.0% 8,423 8,659 2.8% 808,670 718,352 -11.2%
Sweet
Potatoes 59,652 55,610 -6.8% 9,419 9,895 5.1% 581,174 583,547 0.4%
Figure 2: Rainfall Distribution in Season 2014B

8
Yam 12,174 12,202 0.2% 6,384 6,487 1.6% 77,310 79,070 2.3%
Taro 4,633 5,047 8.9% 7,763 7,801 0.5% 37,365 39,356 5.3%
Cassava 91,225 88,037 -3.5% 17,26
4
17,89
4 3.6% 1,642,10
6
1,649,40
2 0.4%
Vegetables 23,188 22,321 -3.7% 12,08
0
10,99
9 -8.9% 287,681 246,863 -14.2%
Fruits 26,193 25,282 -3.5% 12,57
8
12,53
4 -0.4% 335,085 321,534 -4.0%
Total 979,92
3
922,63
8 -5.8% 6,037,23
0
5,657,79
7 -6.3%
Figure 3 displays the time series for crop production of some priority crops, namely maize, cassava, rice, Irish
potato and beans. As the Ministry in charge of production it is imperative that MINAGRI seeks to understand
food price movements. Given the context of decreasing crop production at national and regional level, we examine
the domestic price developments of key crops over the past financial year. The crops detailed in Figure 4 & Figure
5 highlight largely cyclical trends where lean periods of production result in higher prices. Note the general
increase in prices from October to December (pre-harvest period Season A) and February to May (pre-harvest
period Season B).
Figure 3: Food Production Time Series (MINAGRI)
Figure 4: Cereal & Pulses Average Market Price (MINAGRI)
0
500000
1000000
1500000
2000000
2500000
3000000
3500000
2005 2006 2007 2008 2009 2010 2011 2012 2013 2014
Cro
p P
rod
uct
ion
(M
T)
Year
Food Crop Production (2005-2014)
Maize
Rice
Cassava
Irish potato
Beans
0
100
200
300
400
500
600
700
800
Jul-13 Aug-13 Sep-13 Oct-13 Nov-13 Dec-13 Jan-14 Feb-14 Mar-14 Apr-14 May-14 Jun-14
Pri
ces
(Rw
F/K
g)
Year
Cereals & pulses market food price evolution
Maize
Wheat
Rice
Beans

9
Improvements in quality of crops and increasing regional demand, to an extent, explain the increase in prices. In
particular, wheat has seen high prices in Rwanda. Irish potato, given increasing demand both internally and
externally, has seen very positive price development.
Figure 5: Roots & Tubers & Banana Average Market Price (MINAGRI)
The market prices of rice and wheat, both of which have negative terms-of-trade, have been unstable over the last
year. However, in the last three months of the financial year, prices have begun to rise given the decrease in
domestic and regional seasonal harvest. As a medium to long-term strategy, MINAGRI is seeking to mitigate the
vulnerability to external price shocks by aggressively scaling up its rice and wheat production. There have been
significant differences in rural and urban prices that could indicate impediments to farmers increasing revenues.
Post-harvest constraints such as increasing fuel prices, post-harvest losses and large disparities between farmer
and trader profits could explain this price difference. MINAGRI will continue to support post-harvest
infrastructure to support a fairer price to the farmer.
1.5 Livestock Production Report
Animal resources are recognized as an opportunity to increase domestic food security, improve nutrition through
the provision of animal proteins, and generate income. Livestock also serves as a valuable asset for poor families.
There is increasing demand for meat and fish, dairy, eggs, honey and hides and skins both in domestic and regional
markets, which represents an important opportunity for investment in and growth of the livestock sector. In the
financial year 2013-2014 MINAGRI and RAB focused on animal resource sector modernization, expansion and
intensification. The PSTA III highlights the role of livestock, including the growth of the fishing industry, the
potential for further exports of premium products such as honey, and the potential to further strengthen and
integrate entire value chains e.g. for meat and dairy, fish and honey. The figures below demonstrate the continued
growth of animal resource headcounts, production and consumption in Rwanda. The recently developed Dairy
Strategy and Dairy Seal of Quality were finalized and started being implemented during this financial year. The
seal of quality is an important step toward the marketing of good quality milk and gives confidence to the
consumer. In addition, farmers who aim to produce good quality milk now have a tool to differentiate their product
on the market.
1.5.1 Animal Population
Figure 6 Illustrates how the animal head count has grown over the last five years. The greatest gains have been in
small animals, particularly pigs, rabbits and poultry. This is useful for lower income households that may not have
the resources to keep and maintain cattle, but are able to benefit from the meat and egg proteins produced by
smaller animals as Rwanda continues its fight against malnutrition. The poultry headcount has more than doubled
since 2009, driven by a concerted programme of intensification. In contrast, cattle, sheep and goat headcounts
have remained relatively stable. The marginal decline in the cattle population, despite the Girinka programme
which distributes cows to poor families, can be explained by the shift to zero grazing and improved cattle breeds
that give more milk. However, the livestock figures also illustrate how livestock distribution alone is insufficient
to develop Rwanda’s animal resources, and that efforts must be made to train households in providing appropriate
care, establish an effective service delivery network to improve animal health, improve the productivity of each
animal and focus on value chain development to attract investors and produce premium animal products. This is
particularly valid considering Rwanda’s limited land availability for livestock grazing.
0
50
100
150
200
250
300
Tubers & roots food price evolution
Irish potatoes
Sweet potatoes
Cassava
Cooking banana

10
Figure 6: Animal head count for 2009-2013 (MINAGRI)
1.5.2 Animal Products
The increase in animal head count has contributed to the greater production of animal products, shown in table
below. Between 2005 and 2013 milk production increased almost five times, and this will continue under the
National Dairy Strategy developed in 2013. Meat production has almost doubled, and should continue its
increasing trend alongside fish. This will be supported by the Aquaculture plan and prioritization of fisheries
under PSTA III, and the meat strategy. Honey production is still relatively low, but market opportunities exist for
premium exports and during the 2013/14 financial year, Rwanda obtained an Export Certificate Permit for Honey
to access the EU Market. This should help increase production and the marketing of good quality honey. Egg
production has increased five times- This has positive implications for nutrition as egg consumption provides both
protein and micro-vitamins as part of dietary diversification. Overall, since 2005 animal production has continued
to increase. This represents a market opportunity both for household consumption and commercialization of the
sector, particularly to capitalize on regional demand for milk, hides and skins and investigate further marketability
of animal products.
Table 6: Animal products in tons 2005-2013 (MINAGRI)
Product 2005 2006 2007 2008 2009 2010 2011 2012 2,013
Milk
142 5
11 152,511 189,827 257,480 334,727 372,619 442,337 503,130 628,266
Meat 49861
52,226 54,780 56,900 65,863 70,928 73,633 74,519 81,087
Fish 8 180
9.267 9.655 12,594 14,104 15,007 15,526 17,566 24,550
Eggs 2.452
1.536 1.620 2.327 3,268 5,203 5,736 6,324 6,757
Honey 1671
1,676 1,084 1,654 2,684 2,921 3,221 3,785 4,286
Hides & skin 2637 3.183 4.137 4,496 4,098 4,072 4,017 3,814 5,207
Meat production can be broken down into types of meat to better understand consumption patterns (See Table 6). Beef
accounts for the highest volume of production, representing the productivity of cattle despite the relatively low headcount.
Goat meat has the second highest production, driven by traditional dietary preferences and high availability. Poultry has
jumped sharply, even though chicken remains a relatively expensive meat which is still perceived as a luxury item.

11
5.3 Animal protein consumption
Increasing animal productivity and production over time is matched by the increasing trend for consumption of
animal products. As incomes increase with GDP growth, consumers prefer to purchase animal products.
Increasing consumption is a function of Rwanda’s growth and poverty reduction, and also the increased
availability of animal products and more competitive pricing (among other factors). Although fish and egg
consumption remain relatively low, nutrition education campaigns combined with increased
Figure 8: Animal product consumption per person per year (MINAGRI)
production will increase consumption. Milk will continue its upward trend with the new Seal of Quality to reassure
consumers about the high standards of domestically produced dairy quality. Overall, increased animal protein
consumption supports better nutrition, and these figures are therefore a positive indicator of improved food
security
MINAGRI and RAB will continue to work to develop the livestock sector. Under PSTA III livestock is included
as a separate programme area to ensure it is prioritized alongside crop production. The value chain section also
identifies specific interventions for strengthening the supply chain and market development for all animal resource
and fish products. The dual role that livestock development has to both increase rural incomes and improve
nutrition is also an important focus area. More details about the achievements of specific livestock projects are in
section 3. It should also be noted that the sub sector working group on livestock in 2013-2014 developed a
roadmap to increase access to livestock products in order to support nutritional and food security.
1.6 Irrigation, Land Husbandry and Mechanization
Irrigation and land husbandry are key priority areas for MINAGRI as they both improve productivity and mitigate
the effects of adverse weather shocks for farmers. Mechanization improves productivity and can contribute to
0
10
20
30
40
50
60
70
2010 2011 2012 2013
Co
nsu
mp
tio
n p
er
pe
rso
n p
er
year
Year
Milk lt/pers/year
Meat Kg/pers/year
Eggs kg /pers/year
Fish Kg/pers/year
Honey Kg/pers/year
Figure 7: Meat production from 2009-2013 according to meat type in Metric Tonnes (MINAGRI)
12
value addition and quality promotion. Although interventions in these areas are costly, they have also contributed
greatly to the increased yields generated by PSTA I and PSTA II. In the financial year 2013-2014, the Task Force
for Irrigation and Mechanization (TF I&M), working together with RAB, project units and development partners,
implemented various activities to improve land and water management and to disseminate farm equipment among
rural beneficiaries.
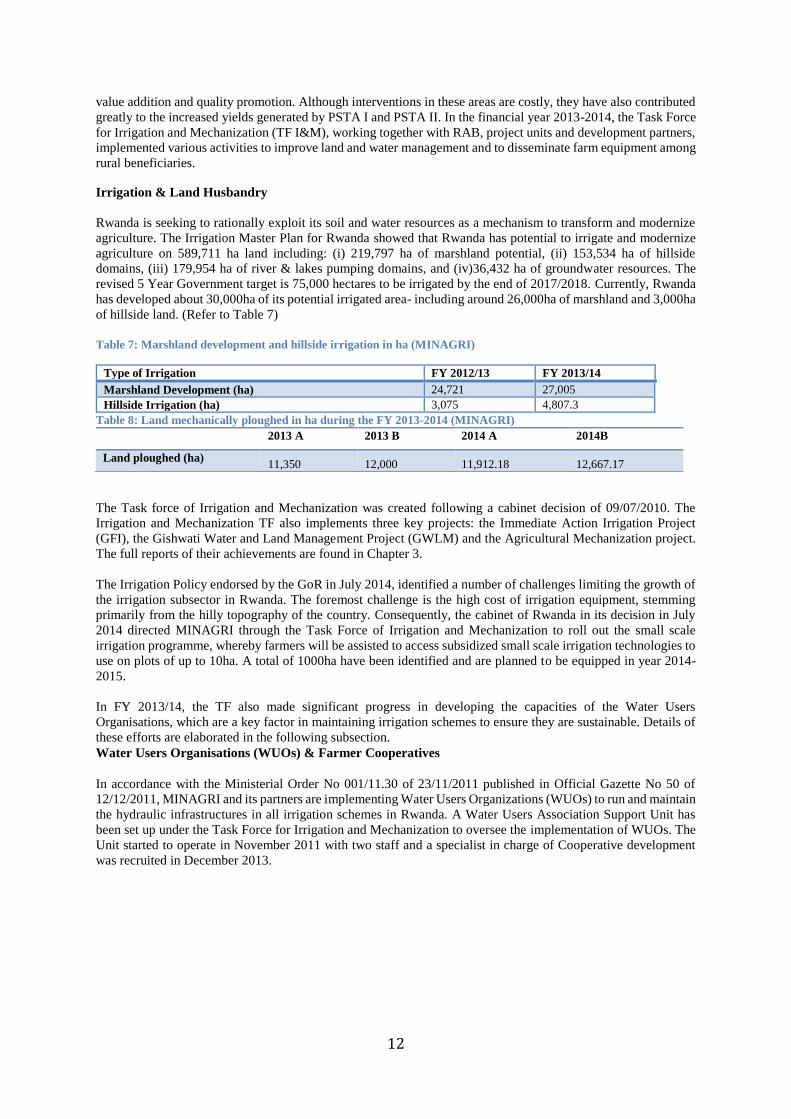
Irrigation & Land Husbandry
Rwanda is seeking to rationally exploit its soil and water resources as a mechanism to transform and modernize
agriculture. The Irrigation Master Plan for Rwanda showed that Rwanda has potential to irrigate and modernize
agriculture on 589,711 ha land including: (i) 219,797 ha of marshland potential, (ii) 153,534 ha of hillside
domains, (iii) 179,954 ha of river & lakes pumping domains, and (iv)36,432 ha of groundwater resources. The
revised 5 Year Government target is 75,000 hectares to be irrigated by the end of 2017/2018. Currently, Rwanda
has developed about 30,000ha of its potential irrigated area- including around 26,000ha of marshland and 3,000ha
of hillside land. (Refer to Table 7)
Table 7: Marshland development and hillside irrigation in ha (MINAGRI)
Table 8: Land mechanically ploughed in ha during the FY 2013-2014 (MINAGRI)
The Task force of Irrigation and Mechanization was created following a cabinet decision of 09/07/2010. The
Irrigation and Mechanization TF also implements three key projects: the Immediate Action Irrigation Project
(GFI), the Gishwati Water and Land Management Project (GWLM) and the Agricultural Mechanization project.
The full reports of their achievements are found in Chapter 3.
The Irrigation Policy endorsed by the GoR in July 2014, identified a number of challenges limiting the growth of
the irrigation subsector in Rwanda. The foremost challenge is the high cost of irrigation equipment, stemming
primarily from the hilly topography of the country. Consequently, the cabinet of Rwanda in its decision in July
2014 directed MINAGRI through the Task Force of Irrigation and Mechanization to roll out the small scale
irrigation programme, whereby farmers will be assisted to access subsidized small scale irrigation technologies to
use on plots of up to 10ha. A total of 1000ha have been identified and are planned to be equipped in year 2014-
2015.
In FY 2013/14, the TF also made significant progress in developing the capacities of the Water Users
Organisations, which are a key factor in maintaining irrigation schemes to ensure they are sustainable. Details of
these efforts are elaborated in the following subsection.
Water Users Organisations (WUOs) & Farmer Cooperatives
In accordance with the Ministerial Order No 001/11.30 of 23/11/2011 published in Official Gazette No 50 of
12/12/2011, MINAGRI and its partners are implementing Water Users Organizations (WUOs) to run and maintain
the hydraulic infrastructures in all irrigation schemes in Rwanda. A Water Users Association Support Unit has
been set up under the Task Force for Irrigation and Mechanization to oversee the implementation of WUOs. The
Unit started to operate in November 2011 with two staff and a specialist in charge of Cooperative development
was recruited in December 2013.
Type of Irrigation FY 2012/13 FY 2013/14
Marshland Development (ha) 24,721 27,005
Hillside Irrigation (ha) 3,075 4,807.3
2013 A 2013 B 2014 A 2014B
Land ploughed (ha) 11,350 12,000 11,912.18 12,667.17

13
In FY 2013/14 eight Water Users organizations (WUOs) were created in QWMDP II schemes and supported
to elect their own governing bodies. One cooperative
in hillside irrigation scheme (KABOKU COOP) was
reorganized to create two separate cooperatives
(KABOKU and KOHIWOKIMA) in respect of the
administrative boundaries within which the two
irrigation sectors are found. Trainings at Kirehe and
Nyagatare as well as study visits to Nyiramageni,
Makera, Nyagahembe and Musaza were conducted
for three hundreds and four (304) cooperative
member representatives from QWMDP and GFI
Schemes. Training and study visits were conducted
for forty six (46) WUO and Cooperatives Committee
members and farmers representatives in newly
developed QWMDP II Schemes.
Fifteen (15) WUOs coaching staff were trained on
Administration, finance, Human resource management and Operation and maintenance of irrigation
infrastructures. One hundred twenty three (123) WUOs and Cooperatives Committee members and farmers
representatives in QWMDP I , II and GFI Schemes were trained on Administration, finance, Human resource
management, Operation and maintenance of irrigation infrastructure. The same members also benefited from
a study tour in Makera, Rwasave and Musaza. Twelve (12) WUOs were supported for registration by RGB.
Four national workshops were organized in order to harmonize practices in line with Water Users
Organizations and Cooperatives in irrigation schemes. The following table summarizes training activities
carried out in various Districts:
Table 9:Realized Field Visits & Training
Visited areas /
Area of training
Number of participants Types and District Origin of the
participants
Training subject
Nyiramageni 33 Farmers growing rice from
Gisagara, Huye, Nyanza,
Ruhango
Good agricultural practices and
planning for sustainable
agricultural production
Makera 41 Farmers growing Maize from
Gisagara, Huye, rulindo,
kamonyi, gasabo, nyaruguru,
nyamagabe,
Good agricultural practices and
planning for sustainable
agricultural production
Nyagahembe 9 Farmers growing rice from
nyamasheke
Good agricultural practices and
planning for sustainable
agricultural production
Nasho 71 Farmers growing maize kirehe/
nasho irrigation scheme
Cooperative management and
and leadership, and business
plan, Composting
Nasho 45 Farmers growing maize kirehe/
nasho irrigation scheme
Crop residues management and
animal feeds making
Nyagatare 71 Farmers growing maize nyagatare
/ Matimba irrigation scheme
Cooperative management and
and leadership, and business
plan
Musaza / Kirehe 34 Farmers growing maize at
Nyagatare / Matimba and Kirehe
/ Nasho irrigation schemes
Good agricultural practices and
planning for sustainable
agricultural production
Total 304
Mechanisation
Figure 8: WUO field training

14
The use of machinery in farming is becoming a culture among Rwandans. The Taskforce is responding to the
demands of farmers by establishing Village Mechanization Service Centers (VMSCs), and encouraging the
private ownership of farm machinery, private hiring service to different beneficiaries. Private investment in
mechanization started early 2010 with BRAMIN’s farm in Kayonza district. BRAMIN has various types of
farm machinery such as seven center pivot equipment and 5 tractors of 65Hp to 120 Hp range, several
attachments and one combine harvester. They have mechanized maize production on land of more than 500
ha in seasons A & B 2014.
Nyagatare Agro Venture Ltd also have several
types of agricultural machinery and have more
than 700 ha of land for paddy rice cultivation.
Two more private companies are keenly
involved in Agri-mechanization hiring
services, namely Voluntous Agricon Ltd and
SBTC PVT Ltd. They have imported 12
tractors and different types of attachments and
have achieved more than 2000 ha during this
fiscal year. More than 14000 ha of land have
been put under mechanization by public and
private farm equipment during seasons A and B
2014, resulting in 15 % of agriculture
operations being mechanized.
Over 950 individual farmers and farmers’
cooperatives were trained on the operation and maintenance of agricultural machinery. A total of nine power
tillers were sold to different institutions which include World Vision, Swiss Resource Centre and Nyamagabe
District. A total of 24.6 million Frw was realized from the sales. For a time series of land mechanically
ploughed (in hectares) refer to Table 8.
1.7 Post-Harvest Handling and Storage
The Post-Harvest Handling and Storage Task
Force (PHHS TF) was established in 2010 to help
reduce losses after harvest, improve market access
through feeder roads and add value through
processing. This results in higher outputs and
increased revenue, and therefore enhances food
security and generates better returns for farmers.
The overall aim of the PHHS project is to reduce
food insecurity through an efficient post-harvest
private sector system delivering staple foods to
the people of Rwanda. Specific objectives aim to
strengthen food security for rural staple crop
producers while also improving consumer access
to safe and affordable food. Private sector
leverage is key to strengthen the competitiveness
of staple crop value and supply chains, and this will help to improve efficiency and reduce costs. The combination
of both a producer and consumer focus will also enhance farmer access to and linkages with markets. The
achievements of the PHHS TF for FY 2013/14 can be summarized as follows:
Reduction of Post-Harvest Losses
In order to reduce pre- and post-harvest losses that occur between the field and the first point of aggregation, the
Post-Harvest Handling and Storage Task Force has been engaged in different activities that include: training and
coaching of farmers, dissemination of post-harvest tools and equipment, construction of model drying and storage
facilities as well as promoting efficient and equitable transport system across staple crop producing areas.
According to surveys that have been conducted to quantify and evaluate staple crop post- harvest losses, the post-
harvest loss of maize, rice and wheat have been reduced to 10.4%, 8.3% and 14.8 % respectively for the year 2013
(season A & B). A post-harvest loss survey for season 2014 A indicated that post-harvest losses have been reduced
to 9.42% for maize, 12.7% for beans, 14.7% for soya, 8.64% for paddy and 7.8% for wheat. Training has been
conducted to build the capacity of farmers from different cooperatives in order to improve their knowledge on
Figure 9: Corn/Maize combine harvester in Ndego/Kayonza District
Figure 10: Storage facilities in Kigali SEZ
15
post-harvest best practices which lead to obtaining quality produce thus ensuring sustainable rural income. A total
of 23,281 farmers (11,657 F & 11,524 M) from over 500 cooperatives have been trained on maize and rice post-
harvest best practices. Training materials: 12,110 leaflets and 1,312 training modules of maize, rice, Irish potatoes
and wheat have been distributed to farmers.
Post-harvest extension staff members were regularly deployed to Districts and Sectors to coach farmers on post-
harvest best practices: 74,959 farmers (38,024 F & 36,935 M) from over 500 cooperatives were directly coached
on maize, rice, Irish potatoes & wheat post-harvest best practices. In order to minimize post-harvest losses, 21,469
sheetings (tarpaulin) have been distributed to maize, rice and wheat farmers; 733 shellers have also been
distributed to maize farmers. 10 Hermetic grain storage bags have been distributed to farmers for demonstration.
10 cooperatives were supported with electrical maize shellers while 17 cooperatives were supported with wheat
threshers. Public and private media were used to increase awareness of the benefits of post-harvest improvements
for farmers and the private sector.
Modest drying grounds and storage facilities have been constructed to preserve the quality of products and to
increase and stabilize farmers’ incomes: 29 drying grounds, 1 storage facility and 4 selling points have been
constructed in different districts. A total of 43 farmer’s cooperatives have been linked to financial institutions as
a result, they have been able to access inputs and compete on the market with their produce.
Efficient and equitable transport systems across staple crop producing areas
Follow up on the implementation of rehabilitation and maintenance of feeder roads has been conducted: Feeder
roads action plans have been streamlined at district level through meeting with districts executive secretaries,
agronomist and engineers. Tender document and Feeder roads standards were provided. With stakeholder support,
101.15 km of rural feeder roads (RFR) were rehabilitated in 7 districts under the EU funded Sector Policy Support
Programme; 30 km under the RFR Programme funded by the AfDB in Nyamagabe District; and 54 km were
rehabilitated in the Kirehe District under the IFAD funded KWAMP programme. Studies have been conducted
for feeder roads that will be supported by the World Bank (4 Districts) and USAID (7 Districts). Procurement
process for recruiting a service provider to conduct capacity building and technical support related to feeder road
rehabilitation and maintenance in 5 Districts that will be supported under the Netherlands program have been
conducted.
National Strategic Grain Reserves development
Management of National Strategic Grain Reserves with the principal objective of coping with food emergencies
and contributing to a reduction in food insecurity has been done to address potential shocks to food supply. 9,745.7
MT of maize and beans have been stocked for the National Strategic Grain Reserves (Maize: 7,857.422 MT;
beans: 1,888.28 MT).
Through the Purchase for Progress Program (P4P), the Post Harvest Handling and Storage Task Force worked
with 43 cooperatives that delivered 3,500.674 MT of maize for the National Strategic Grain Reserves. As a result,
there is increased farmers’ investment in agriculture and increased capacity to engage in the market. The National
Strategic Grain Reserves were used to support farmers through Food for Work Programme: a total of 954.126 MT
of grains (551.426 MT of maize and 402.7 MT of beans) were distributed in Kayonza and Bugesera Districts.
Agro-processing promoted
In order to promote value addition, the construction of different processing plants has been initiated: Zamura Feed
Plant has been installed in Musanze District; Rwamagana feed plant has been constructed in Rwamagana District
with a progress of 95%; installation of oil plant in Kayonza District has been completed; the project for
constructing an Irish potato processing plant in Musanze District has been handed over to the private sector. Seed
plant construction in Kigali Special Economic Zone: civil works and machine installation have been completed
and is operational; cob dryer and sorting house installation have been completed. Civil works of Nyagatare
metallic silos with 10,000 MT capacity is at 100%, while machine installation is at 80%; civil works for Bugesera
metallic silos with 6,000 MT capacity is at 100% while installation works are at 80%.
Challenges
-Education and change of farmers – need more time and investment in order to build strong and sustainable farmer
cooperatives,
-Some post-harvest materials and equipment are still expensive for farmers,

16
-Lack of adequate and timely disbursement of public funds (From MINECOFIN to District level) to construct
post- harvest facilities.
Way Forward
The Post-Harvest Handling and Storage Task Force is in the process of phasing out but its activities will be
continued with a main focus of:
-Supporting farmers on post-harvest best practices for different crops through training, coaching and
dissemination of post-harvest tools and equipment.
-Identifying and prioritizing economically relevant post-harvest technologies.
-Quantifying and evaluating staple crop post-harvest losses through post-harvest loss surveys.
-Constructing suitable and appropriate drying, storage and processing facilities.
-Reducing road transport cost between production and secondary aggregation points in high potential areas.
-Management of National Strategic Grain Reserves.
1.8 Export Promotion
Agricultural exports are coordinated by the National Agriculture Export Development Board (NAEB), focused
on coffee, tea and horticulture. NAEB is also exploring other
promising value chains such as sericulture, and these emerging
sub-sectors are progressively improving and contributing to the
diversification of export earnings. Exports are key to agricultural
revenue generation and national growth. EDPRS II has a 28%
annual export growth target, which agriculture must contribute
to. Furthermore, high value exports such as premium teas,
essential oils and floriculture will help achieve the 8% average
sector growth and 11.5% national GDP growth targets for Vision
2020. In line with the strategic plan for agricultural
transformation (PSTA), EDPRS, Vision 2020 and different
sector strategies, throughout the fiscal year 2013-2014, NAEB
focused its interventions in production, processing, quality improvement and marketing products from the three
priority subsectors; Although, the production and revenue from all cash crops were affected by drought in FY
2013/14 and adverse global price trends for primary commodities respectively.
During the FY, production activities were oriented mainly on expansion of the area under priority crops. In order
to increase acreage under tea and coffee production, seedlings were prepared and planted. For the coffee sub-
sector, NAEB managed to plant area totaling 9,166ha. Coffee productivity was also enhanced by increasing the
use of mineral and organic fertilizers. A total of 7,876tonnes of organic fertilizers and 3,300 tonnes of mineral
fertilizers were applied during the course of the fiscal year. The past year activities resulted in production of
17,827 metric tonnes of exportable coffee and generated a revenue of about 47.5 Millions USD. The fall in export
revenue earned can be accounted for by the decline in production volumes on account of the deficit in rainfall
albeit the coffee sub-sector produced higher quality output in the fiscal year. Thus coffee producers faced better
prices, but owing to lower volumes sold earned less revenue. There is a need to incentivize greater investment in
production by farmers, and more private engagement in terms of operations downstream. The development of a
Zoning Policy may also be required. NISR will conduct a coffee census in the following fiscal year.
The efforts in developing the tea sector yielded appreciable results especially in terms of increasing acreage under
tea plantation. A total of 1,891 ha were planted including replacement of dead seedlings in existing fields. 32
million tea seedlings were prepared to be planted during season A 2014. The productivity of tea plantations was
improved by stakeholders through the application of 5,753 tonnes of fertilizers. This past year we realized an
increase in tea production. The achievements were more than 22,483 metric tonnes with total revenue of 53.5
million USD. Developments in the tea subsector also included reviewing of the green leaf pricing model. A market
price based model was agreed upon by tea stakeholders. The revenue earned from tea exports suffered a setback
owing to lower production (due to drought) and a significant fall in international prices. There was a problem of
oversupply in the world market, stemming from conflict in some tea-consuming countries and overall suppressed
demand.
In the horticulture sector, NAEB focused attention on a few selected crops of both fruits and vegetables. Total
area planted with vegetables during the fiscal year 2013-2014 reached 4,816 ha while the area planted with fruits
totalled 3,480 ha. The new acreage includes 3,413 ha planted with pyrethrum. Various interventions and
inspections were undertaken to reduce pests and diseases incidences in the horticultural crops. The export of fruits
and vegetables increased to more than 8.6 million USD in the fiscal year 2013-2014. The export of refined
Figure 11: Harvested coffee cherries

17
pyrethrum extracts was hampered by bad prices and the lack of market access. The volume exported in the FY
was 14,413kg, earning 3.5 million USD in export revenues. There was only one company exporting pyrethrum in
FY 2013/14 to markets in the United States of America. There is a need for aggressive private investment,
increased market access and planned interventions in this sub-sector. NAEB is currently working with a strategic
investor and a number of clients to discuss possibilities of expanding markets.
Going forward there is room for greater contribution of horticulture, floriculture and non-traditional exports to the
total basket of exports. For the development of these new value chains investments in these areas will be needed.
Non-traditional export commodities is a complex industry involving hides and skins, meat, milk, honey and oils
plants. The hides and skins sub sector is one of the key agricultural sub-sectors with a high potential towards
commodity development that addresses pertinent socio economic issues and positively impacts rural
development, wealth creation and employment. Meat and milk are also sectors which are now growing faster in
Rwanda and are playing a paramount role in the Rwandan community. The sub sectors depend largely on locally
available livestock resources which need value addition for export. In addition to that in new chain development,
production in the honey sub-sector started a long time ago mainly for local consumption, but now there is a need
to expand the sub sector for regional and international consumption. The production, processing and export of the
sub sector need to be improved in order to meet the standards required at the international level. Beside animal
products, the sector includes essential oils which are important in international trade. Due to its worldwide
importance in perfumery and medicinal sectors, the sub sector promises a large contribution to the growth of
Rwandan exports. The contribution of those sub sectors toward economic growth through an expansion of the
export market for both semi-processed and finished goods is immense and the only way to such success is by
embracing value addition initiatives. Mount Meru Soyco Ltd. recently constructed an edible oil processing plant
in Mukarange Sector, Kayonza District in the Eastern Province. In order to further encourage the production of
soybeans, a technical team led by the Governor of the Eastern Province has started mapping lands suitable for
soybean production (e.g. public land for industrial blocks, irrigation schemes, and unused farmland like terraces).
Stakeholders are also mobilising farmers to adopt soybean production under the CIP. Further details of Rwanda’s
export promotion, key production figures, trends and revenues can be found in NAEB’s annual report.
1.9 Institutional Development
MINAGRI works in partnership with its implementing bodies, RAB and NAEB, development partners, projects
and all major stakeholders. In order to improve institutional capacities and information flows across the sector, to
foster a knowledge-based and efficient framework, MINAGRI also continues to invest in institutional
development activities. These focus on two areas: agricultural communications and capacity building. In addition
to these, MINAGRI has mainstreamed certain key issues across the sector, including environmental sustainability,
gender inclusivity, nutrition and food security and private sector development. Considerations of these factors are
integrated into policy planning and programming to ensure sector growth is sustainable and inclusive of marginal
groups. In the long run, this will create commercially viable but pro-poor centered growth.
1.9.1. Agricultural Communications
The Agricultural Information and Communication Center (CICA), launched in June 2010, is a focal point for all
agricultural related information, and works with all sector actors and across every district. CICA’s objective is to
regularly collect, produce, process, adapt, store, share and disseminate agricultural information. CICA’s main
achievement over the last financial year was the ongoing production and management of agricultural information
through ICT, the MINAGRI website and Agricultural Management Information System (AMIS), extension
material development, audio visual extension material development and maintenance of the documentation center
and library.
The main achievement across different areas of communication and the media include:
1. Information Communication and Technology:
Conception, design and development of a simple, intuitive and very interesting website for the
Farmers/extension website “Noz’ubuhinzi n’ ubworozi”: http://nozubu.minagri.gov.rw. this website aimed to
teach the farmers extension works, the best techniques, technology in agricultural sector by providing
information categorized in 4 categories (production, pest and disease, agricultural economics and marketing
and value addition) crop by crop in 3 formats : PDF/readable, Audio and video format in each category.

18
Figure 14: Noza Ubuhinzi n’ Ubworozi website, Ubuhinzi mu Rwanda (Page of Agriculture)
Agricultural Management Information System have been upgraded/updated from Drupal 6.0 to Drupal 7.0
version
801 news issues communicated through MINAGRI website, extension website and AMIS
Using the MINAGRI hotline, collection of feedback, comments, and inquiries from agricultural beneficiaries
and linking them with concerned staff to improve quality of service delivery (between 47 and 92 callers per
day, feedback shared)
Communication by using new Technologies have been adopted , deployed and MINAGRI staff trained on
their use ( social media, Dropobox , Whatsapp Groups, and DTWF and MINAGRI ePortal)
2. Extension Material Development:
7 monthly before then later quarterly magazines ( HINGA WORORA) developed, produced and
disseminated to share agricultural information and success stories, innovations and best practice
52 weekly flash news bulletins produced and published via email
Agricultural Media Review on daily basis
34.000 copies of booklets (climbing beans for both farmers and extensionists, pigs, poultry farming, cassava,
and pyrethrum) and 200 flyers for agribusiness developed and disseminated to farmer groups and agricultural
extension officers
3. Audio visual Extension Material Development:
50 radio and TV programs broadcasted
CICA is producing the community radio sketches (Ifumba-y’Ubukire : flame of wealth) on weekly basis, to
teach farmers about best practice, new techniques and how to better manage production and marketing. These
sketches are also very important for catalyzing socio-economic changes among Rwandan citizens. They are
broadcasted on Radio Rwanda on weekly basis.
Figure 12: Ifumba-y’Ubukire : Flame of wealth Radio Sketch (In Studio & CDs released)
GIS
19
Establishment of 15 Maps on sites infected by BXW countrywide, proposed Tea expansion area, a new sugar
plantation area among others.
Library:
3729 clients trained on how to KOHA system, with additional applications such as circulation, acquisition,
serial, cataloguing which are more user friendly for clients.
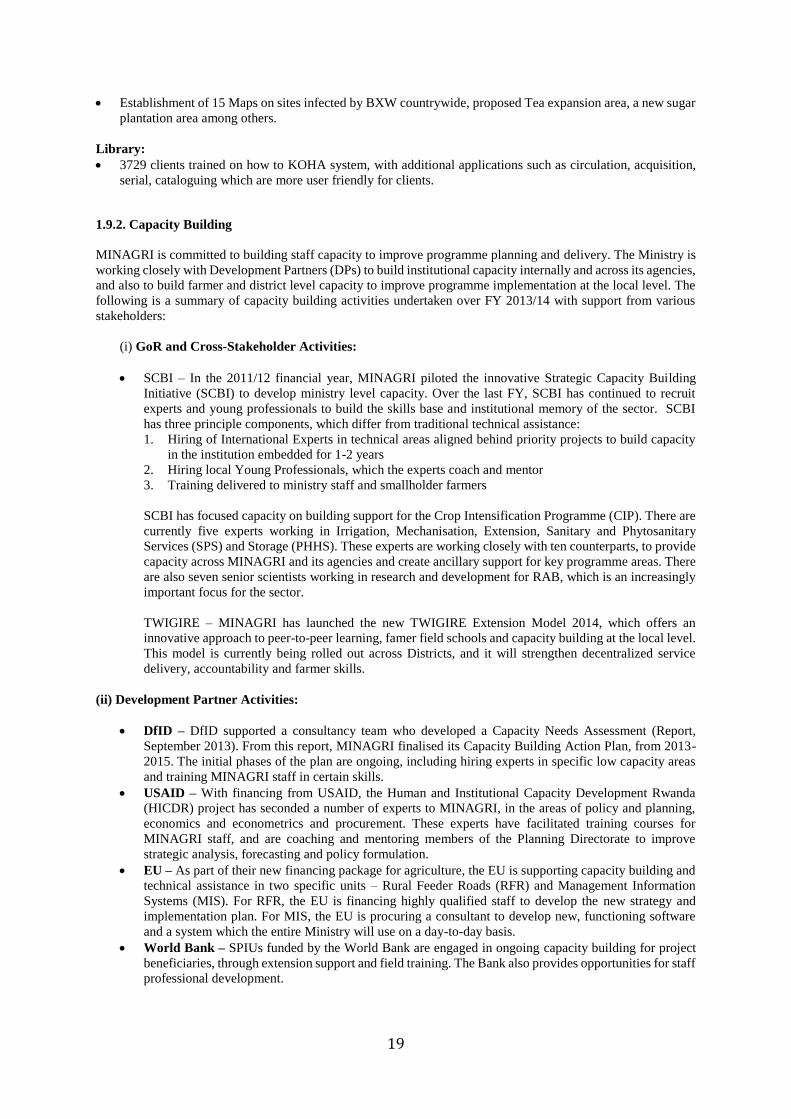
1.9.2. Capacity Building
MINAGRI is committed to building staff capacity to improve programme planning and delivery. The Ministry is
working closely with Development Partners (DPs) to build institutional capacity internally and across its agencies,
and also to build farmer and district level capacity to improve programme implementation at the local level. The
following is a summary of capacity building activities undertaken over FY 2013/14 with support from various
stakeholders:
(i) GoR and Cross-Stakeholder Activities:
SCBI – In the 2011/12 financial year, MINAGRI piloted the innovative Strategic Capacity Building
Initiative (SCBI) to develop ministry level capacity. Over the last FY, SCBI has continued to recruit
experts and young professionals to build the skills base and institutional memory of the sector. SCBI
has three principle components, which differ from traditional technical assistance:
1. Hiring of International Experts in technical areas aligned behind priority projects to build capacity
in the institution embedded for 1-2 years
2. Hiring local Young Professionals, which the experts coach and mentor
3. Training delivered to ministry staff and smallholder farmers
SCBI has focused capacity on building support for the Crop Intensification Programme (CIP). There are
currently five experts working in Irrigation, Mechanisation, Extension, Sanitary and Phytosanitary
Services (SPS) and Storage (PHHS). These experts are working closely with ten counterparts, to provide
capacity across MINAGRI and its agencies and create ancillary support for key programme areas. There
are also seven senior scientists working in research and development for RAB, which is an increasingly
important focus for the sector.
TWIGIRE – MINAGRI has launched the new TWIGIRE Extension Model 2014, which offers an
innovative approach to peer-to-peer learning, famer field schools and capacity building at the local level.
This model is currently being rolled out across Districts, and it will strengthen decentralized service
delivery, accountability and farmer skills.
(ii) Development Partner Activities:
DfID – DfID supported a consultancy team who developed a Capacity Needs Assessment (Report,
September 2013). From this report, MINAGRI finalised its Capacity Building Action Plan, from 2013-
2015. The initial phases of the plan are ongoing, including hiring experts in specific low capacity areas
and training MINAGRI staff in certain skills.
USAID – With financing from USAID, the Human and Institutional Capacity Development Rwanda
(HICDR) project has seconded a number of experts to MINAGRI, in the areas of policy and planning,
economics and econometrics and procurement. These experts have facilitated training courses for
MINAGRI staff, and are coaching and mentoring members of the Planning Directorate to improve
strategic analysis, forecasting and policy formulation.
EU – As part of their new financing package for agriculture, the EU is supporting capacity building and
technical assistance in two specific units – Rural Feeder Roads (RFR) and Management Information
Systems (MIS). For RFR, the EU is financing highly qualified staff to develop the new strategy and
implementation plan. For MIS, the EU is procuring a consultant to develop new, functioning software
and a system which the entire Ministry will use on a day-to-day basis.
World Bank – SPIUs funded by the World Bank are engaged in ongoing capacity building for project
beneficiaries, through extension support and field training. The Bank also provides opportunities for staff
professional development.

20
1.9.3 Agricultural Cross-cutting Issues – Environmental Sustainability
Agriculture and the environment affect each other and must be considered together. To foster a sustainable sector
in the long term, sound environmental management must be mainstreamed in agricultural practices. MINAGRI
has worked with partners to ensure agricultural interventions are environmentally sustainable and climate change
smart. In the 2013-2014 financial year, management of environment and some interventions focusing in climate
resilience have been mainstreamed into various planned activities in agriculture:
1. Soil erosion control intervention through radical and progressive terraces, including 18,344 ha of radical
terraces and 44,184 ha of progressive terraces.
2. Irrigation development projects on hillside, marshland and small scale with an environmental
consideration, to ensure water use efficiency in case of droughts due to climate variability.
3. Environmental consideration in rural roads design (EIA conducted), including 106 km Feeder roads
rehabilitated in different districts.
In addition, the Sub Sector Working Group convened to work on issues of Climate Change accomplished the
following tasks:
• Identified a tool to allow MINAGRI planners to evaluate the impact of programme spending decisions
on the ability to adjust to climate change and the impact of those programme decisions on climate change.
• Tested this tool on the Agricultural Sector Investment Programme (ASIP).
• Prepared terms of reference for an expert to develop and refine this tool.
• Found DFID funding for the consultant.
• Identified a path for eventual mainstreaming of climate issues in MINAGRI planning.
1.9.4. Gender Mainstreaming
Access to Finance and women’s Representation
Rwanda is ranked highly in gender equality terms, with legislation to protect women’s rights and an internationally
recognized representation of women in parliament. Nevertheless, gender disparities are still prevalent in
agriculture. Generally in rural areas, women spend more time engaged in farming activities and caring for the
household than men. As a result, on average women have longer working hours, which are worsened by the fact
that they are involved in doing activities that are labour intensive and time consuming. MINAGRI has developed
a gender strategy that describes the issues in detail and sets out an agenda to address them. Gender mainstreaming
activities are also included in PSTA III, the Nutrition Action Plan and other key strategic documents. Over the
2013/14 financial year, certain key activities were held to eliminate the gender gaps in agriculture.
Different measures were put in place to
increase agricultural productivity. One of these
measures was to increase access to finance for
farmers through agricultural value chains. For
the aim of making credit available, the Rural
Investment Facility (RIF) and other financial
schemes whose management is under Business
Development Facility (BDF) were set up and
are currently operational. Although some of
the challenges faced by women were addressed
in these interventions, such as the provision of
guaranty fund to facilitate access to available
financial schemes for some women who were
failing to provide adequate collateral, they still
benefit at a very low rate (slightly more than
22% currently). There is a need to assess
possible hindrances for access to finance
especially for women, in line with increasing
access to finance and agricultural investment at large.
It is against this background that MINAGRI organised an awareness campaign to discuss existing financial
schemes, with the specific objective of assessing the existing barriers and gathering ideas from the target group
on how to increase access to available schemes.
Figure 13: Raising awareness on Financing Options

21
The general picture of the level of participants’
knowledge on the above mentioned facilities is that
very few women participants knew about these
schemes. In all the sessions, hardly three
participants were found to be aware. Women
leaders of agricultural cooperatives were interested
by this awareness raising and appreciated how
MINAGRI thought about bringing together women
farmers, for they have got particular challenges as
they described. Participants from all provinces
showed high commitment to use gained
information and increase their own productivity
and that of their cooperatives, through working
closely with banks and using loans. Despite their commitment to work harder, the women explained that they face
different challenges.. The main challenges presented by women leaders of agricultural cooperatives include the
following: lack of information, unfavorable Agriculture credit schemes, lack/delay of feedback from banks, lack
of collateral, and delay of credit process, lack of skills in project management
Women explained that they highly need some basic skills on project elaboration, so that they don’t spend much
money on experts to help them elaborating their projects from zero. Moreover, they mentioned that when they
don’t have these skills, they also have difficulties in implementation. Participants took some measures to change
to the above mentioned stereotypes such as increasing their self-confidence and stand for their rights to be voted
in different agricultural committees. They pointed out that women should not wait for others to propose them for
vote but should be the ones to propose themselves and show that they are able.
In the context of Gender Issues the leaders of agricultural cooperatives provided recommendations on two fronts:
(i) Pertaining to the encouragement of women entrepreneurs:
To encourage women to strengthen their self-confidence to be able to influence growth of their
cooperatives and that of their families in regard to using credits.
To encourage women to promote the culture of working with banks (promoting deposit, saving and
credit)
Enhance cohesion among cooperative members
Increasing follow up on their projects in banks
(ii) The role of MINAGRI:
To partner with more financial institutions which are near farmers
Negotiate banks to propose schemes which cope with agriculture, including provision of grace period
and longer reimbursement period
Organise Study tours for cooperatives
Trainings on project elaboration and cooperative management are highly needed to uplift women level.
Organise study tours in best performing agricultural cooperatives to help women learn about the
cooperative management.
Providing technical experts to help farmers and agricultural cooperatives with assistance in design and
follow up of projects up to the bank level.
Partnering with other institutions in charge of gender mainstreaming, and fight against Gender based
violence which was a major hindrance to growth both in cooperatives and at the family level.
Gender Mainstreaming in Monitoring and Evaluation
A workshop was organized with Monitoring and Evaluation staff from MINAGRI, Boards and Projects. This
workshop had the aim of enhancing participants’ understanding of issues, conceptual approaches, and frameworks
for Gender sensitive monitoring and evaluation of boards, projects, programs and interventions in the agricultural
sector. Furthermore, the workshop helped to select appropriate gender sensitive monitoring methods and adapt
required monitoring tools for sector specific programs and different areas of intervention.
Participants have learnt how to understand, analyze, present, and interpret gender disaggregated data; Understand
how gender disaggregated data can be used for advocacy and decision-making towards agricultural productivity
and poverty reduction in general.
Figure 17: Working with Women in Farmer Cooperatives

22
At the end of the workshop, different tools were suggested to mainstream gender into policy making and
implementation. Furthermore, consensus was reached on key gender indicators to be monitored and on the way
forward.
1.9.5. Nutrition and Food Security
MINAGRI is one of the lead Ministries to improve food security and fight malnutrition. In the 2013-2014 financial
year, in the implementation of the National Strategy to eliminate malnutrition the following activities were
achieved:
1. Contribution to 1000 DAYS campaign to eliminate malnutrition in Gisagara, Karongi and Ngoma
District.
2. By January to March 2014; 1,355 of kitchen gardens were constructed in Rutsiro and Ngororero Districts.
3. In December 2013; 1950 avocadoes trees were distributed to families and were planted in Gisagara and
Ngoma Districts.
4. Promotion on consumption of bio-fortified beans and orange potatoes by: 6,250 kg of bio fortified beans
(seeds) were distributed to 1,342 farmers for multiplication.
5. 163,084 vines of orange sweet potatoes were produced and distributed to Farmers in Muhanga, Kamonyi,
Rulindo and Gakenke districts.
6. From January to March 2014, in creating awareness for eating mushroom: The mushroom center in
Rubona (RAB) provided 4, 658 bags of mushroom spawn to mushroom tubes producers and cooperatives
in Rwanda, which can produce 465, 800 tubes for 232,900 kg fresh mushrooms; and 28,083 mushroom
tubes (for planting) yielding at least 14,041 kg of fresh mushrooms.
7. During fiscal year 2013/14, some 28,765 heifers against the target of 40,000 which accounts to 71.9%
were distributed to beneficiaries mainly under district decentralization, non-governmental organizations.
8. Girinka program had to offer basic trainings in animal husbandry practices for some 25,000 families.
9. In one cup of milk per child the FY 2013/2014; 83,012 pupils are on the Program and 329,981 liters of
milk were consumed by children: 82,819 liters of milk in the 2nd term 2013; 83,012 liters of milk in the
3rd term 2013; 82,15liters of milk in the 1st term2014 and 81,997 liters of milk in the 2nd term 2014.
Nutrition will continue to be an important area for the
sector over the next four years under PSTA III. Nutrition
is included in Programme 1, to better integrate activities
with crop and livestock production and to ensure the
issue is prioritized in budget and delivery. PSTA III lines
of action follow the NAP and include growing nutritious
kitchen gardens, improving nutrition related knowledge,
bio-fortified food distribution, expanding nutrition based
programmes (Girinka and One Cup of Milk per Child)
and strengthening Rwanda’s food information systems
to better mitigate and manage food distribution.
1.9.6. Private Sector Development
Heavy investment undertaken by the Government of
Rwanda in agricultural value chain resulted in the
country’s economic growth in past years. In order to
ensure sustainable growth of the sector, involvement of
private sector investment is inevitable. It is in this regard
that the PSTA III emphasizes the need of MINAGRI to
prioritise strategies to attract new private sector players in
agriculture, and to retain existing ones. In the fiscal year
2013/14, MINAGRI participated in a number of national,
regional and global forums where potential investors were
represented and used such opportunities to present
profiles of private sector investment opportunities in the
Figure 21: Milk distribution for children through One Cup programme
Figure 25: CAADP II Meeting June 2014

23
agricultural sector. These forums include the National Private Sector Investors Forum March 2014; International
Agribusiness Conference in October 2013; Grow Africa Forum May 2014.
In June 2014, MINAGRI launched the second Comprehensive Africa Agriculture Development Program. During
this event one full day was dedicated for the private sector. A number of private investors across the agriculture
value chain were represented and issues of business environment, and challenges which are currently faced by the
existing investors were discussed. Most importantly private sector players committed to increase their investment
in the sector as a contribution to the country’s economic growth.
Apart from the investors who participated in these forums, the Minister and the Permanent Secretary met
individuals and groups of investors in the country and abroad and informed them about available opportunities.
As a result a number of investors have followed up showing a positive sign towards realization of investment in
future. Some of these companies include Clinton Development Initiative, Yara, Unilever, etc.
To enhance efforts of attracting private sector investments in agriculture, over 300 copies of investment profiles
were designed, printed and shared with potential investors. In addition to that, a sub working group on Private
Sector Development and Export Promotion was established aiming to facilitate achievement of PSTAIII through
enhanced engagement of private sector.
1.10 Report on International Conferences organized by MINAGRI
FY 2013/14 was an eventful year with the Ministry organizing over 6 international conferences in Kigali. The
events along with their objectives, participants and dates/venue of organization are summarized in the table below:
# Meeting title Objectives Participants Key
Organizers
Venue Date
1 (re)New Agri-
business in Rwanda
To provide a
forum for a private
sector-led
discussion about
agribusiness in
Rwanda and a
vision for the
future.
All interested
actors operating
in agribusiness,
and all who
were curious to
learn more
about it.
RDB, the
Ministry of
Agriculture and
Animal
Resources and
Kigali Farms
Kigali
Rwanda
October 16 2013
2 ICT for agriculture
(ICT4Ag)
(1) Find out how
increased
investment and
adoption of ICTs
in the agricultural
sector will
contribute to
improved value
chains as well as
more effective
advocacy and
policy processes in
agricultural and
rural development.
(2) In addition,
conference
objective was to
share ideas and
knowledge,
discuss new
approaches, best
practices and
experiences.
(3) Analyze ICT
trends and their
impact on
agriculture,
capacity building,
enabling
400 participants
(policy makers,
farmers,
development
practitioners,
etc.)
Technical
Centre for
Agricultural and
Rural
Cooperation
ACP-EU (CTA)
and the
Rwandan
Ministries of
Agriculture and
Animal
Resources and
ICTs
Kigali
Rwanda
November 4-8, 2013

24
environments,
scaling up and
sustainability
3 Cracking the Nuts
(private sector
engagement)
To tackle the
challenges of food
security, nutrition,
and sustainable
livelihoods for
Africa’s rural poor
Experts from
the private
sector, NGOs,
government,
and academia
Global
Communities’
USAID Ejo
Heza project,
the Ministry of
Agriculture and
Animal
Resources, the
Rwanda
Development
Board and
AZMJ, a global
international
development
consulting firm.
Kigali
Rwanda
January 14, 2013
4 2nd Global
Conference on
Biofortification
Deliberate on how
best to expand the
delivery of
nutritious foods to
reach more of the
two billion people
who suffer from
micronutrient
deficiency and
improve the lives
of billions of
people around the
world.
300 high-level
participants
from
government,
business and
civil society
around the
globe
Government of
Rwanda in
collaboration
with Harvest
Plus
Kigali
Rwanda
April 1, 2014
5 CAADP II
CONSULTATIVE
BUSINESS
SESSION
(1) Ensure the
integration of a
private sector
“perspective” on
the Results
Framework for
PSTA III; and (2)
Identify priority
policy issues and
public investments
which could
enhance the
incentives to
promote expanded
private sector
investments and
public-private
sector
partnerships, in
support of PSTA
III.
Public and
private actors,
Development
Partners, NGOs
(International
and local), and
Civil Society
representatives
Government of
Rwanda,
USAID, Africa
Lead, , and PSF
Kigali
Rwanda
March 27, 2014
6 Launch of CAADP II
and signing of new
MoU with partners
To operationalize
the second
Economic
Development and
Poverty Reduction
Strategy (EDPRS
II) and to achieve
the revised Vision
2020 targets,
through an
approach based on
resource
management,
human capacity
and value chains,
300 national
agricultural
experts,
policymakers,
donors and
representatives
of Ministries of
Agriculture
from other
African
countries, the
African Union
Commission
(AUC), the
New
Government of
Rwanda
Kigali June 9-10th, 2014

25
and involvement
of the private
sector.
Partnership for
Africa’s
Development
(NEPAD) and
other regional
and
international
organizations

26
SECTION 2: EDPRS II & PSTA III
OBJECTIVES AND DEVELOPMENT
PARTNER COORDINATION

27
This chapter discusses the performance of the agricultural sector in FY 2013/14 through an assessment of
indicators pertaining to both the core EDPRS II targets as well as broader sector objectives (PSTA III). FY 2013/14
was the first year of implementation of both EDPRS II and PSTA III- a review of performance in this fiscal year
is therefore critical for assessing progress toward sectorial and national objectives. The chapter also discusses the
progress on sectorial objectives secured through cooperation with development partners (DPs).
2.1 Performance in 2013-2014 toward EDPRS II objectives
This year, the Ministry made good progress in achievement of EDPRS II targets. The agricultural sector
contributes to the EDPRS II goals of rural development & foundational and cross-cutting issues. MINAGRI aids
rural development by augmenting agricultural productivity and promoting the use of sustainable practices therein.
The verifiable indicator identified in this regard is the area under irrigation (marshland & hillside). In FY 2013/14,
the sector achieved 95.8% of its annual target. The high cost of development of large-scale irrigation projects,
given Rwanda’s hilly topography, continues to pose a challenge for the Government, especially given the sector’s
target to bring a total of 75,000ha of land under irrigation by 2017/18. Consequently, the Cabinet of Rwanda in
its decision in July 2014 directed MINAGRI to roll out the small scale irrigation programme, whereby farmers
will be assisted to access subsidized small scale irrigation technologies to use on plots of up to 10ha. This will
help to better engage private sector participation in the development of irrigation projects. Strategies to facilitate
private sector engagement in the management of large-scale irrigation projects through innovative public-private-
producer-partnerships are also being developed.
The sector’s efforts to promote food security and nutrition are classified as contributing toward the goal of
‘foundational and cross cutting issues’ under EDPRS II. Seasons A & B in FY 2013/14 experienced adverse
weather conditions, creating a deficit in the year’s target for stockpiling a strategic reserve of maize and beans.
However, policy actions sought to mitigate the variability of food reserves in the short term (by mobilizing farmers
to establish household strategic food stocks) and to aid in the building of long-term capacity for farmers (support
on post-harvest handling technologies). See Table 10 for RAG ratings on both identified indicators to attain the
EDPRS II targets (pertaining to the agricultural sector) as well as performance on policy interventions carried out
to meet these targets. 1 Table 10: Performance on EDPRS II targets in FY 2013/14
EDPRS II Outcome Indicators Baseline Value
2012/2013
2013/14 Achievement 2013/14 Targets
RURAL DEVELOPMENT
Increased
productivity and
sustainability of
agriculture
Area under
irrigation
(Marshland &
Hillside)
27,796.31 ha in
June 2013
31,812.3 ha by June 2014 33,204 ha
FOUNDATIONAL AND CROSSCUTTING ISSUES
Enhanced food
security and
nutrition
Maize and beans
stored as a
strategic food
reserve
15,909 MT Current stock at 9,429.3 MT,
including 7,518.085 MT of
maize and 1,911.28 MT of
beans
15,000 MT
2.2 Progress in 2013/14 toward PSTA III Objectives
1 A clarification may be necessary with regard to the target of 15,000 MT for the national strategic food reserve of grain-the number should not be interpreted as a stock figure but instead as a revolving figure for grain flowing in and out of the reserve, i.e. on average the strategic grain reserve should have 15,000MT of stored grain.

28
The Strategic Plan for the Transformation of Agriculture- Phase III (2013/14 to 2017/18) lays out the sector’s
strategic plans for this five year period with a focus on increased production of staple crops and livestock products,
and greater involvement of the private sector to increase agricultural exports, processing and value addition. A
successful implementation of PSTA III would yield the following broad sectorial transformations:
From guaranteeing food availability to generating food security through economic growth
From farmers as passive recipients to farmers as active market players with new skills
From government as a direct provider to government as facilitator of the private sector
From supplying mostly the domestic market to exporter to the region.
In order to accomplish these transformative changes the PSTA III framework is organised along four key
programme areas- (i) Agriculture and animal resource intensification; (ii) Research and technology transfer,
advisory services and professionalization of farmers; (iii) Value chain development and private sector investment;
and (iv) Institutional development and agricultural cross-cutting issues. The following table lays out some of the
key interventions undertaken by MINAGRI and its implementing bodies RAB & NAEB, and classifies them
according to the four pillars of the PSTA III structure:
Table 11: PSTA III Outcome Matrix for FY 2013/14
PSTA III PROGRAMME
Sector Outcome Lead Agency
Responsible
Some Key Interventions in 2013/14
I. Agriculture and Animal Resource Intensification
Increase sustainably
agricultural
productivity
RAB
1. Monitoring & supervision of newly established radical (18,344
ha) and progressive terraces (above 92% of target or 44,184 ha)
2. Coverage of cultivable land protected against soil erosion: 78.1%
3. Average effectiveness of soil erosion protection measures: 57.2%
4. 2,284 ha Ha of Marshland and 1,732 Ha of hillside land
incorporated under irrigation schemes.
5. Development of a policy paper on irrigation, dissemination of
training material to Water Use Organisations & Cooperatives.
6. Land use consolidation:
-Season A: 753,650 ha (108.1% of target)
-Season B: 609,633.7 ha (91.5% of target)
Increase sustainably
animal resources
productivity
RAB 1. 37,875 cows were distributed under Girinka programme (95% of
target).
2. Insemination of 68,882 cows (90,000 targeted)
3. 22,696 MT out of 24,000 MT of fish produced from capture
fisheries.
4. About 399,728 One Day-Old Chicks produced.
5. Animal disease prevention (various)
II. Research and technology transfer, advisory services and professionalization of farmers
Transform agriculture
through research and
extension services.
RAB
1. 34 soybean varieties were evaluated for adaptability at Rubona,
Muhanga, Nyagatare, Ngoma and Karama stations. Several
hybrid maize varieties under evaluation.
2. Ratio of extension workers to farmer households reached annual
target of 1/500.
3. Capacity building for Farmer Promoters (now part of Twigire
Muhinzi). Over 14,000 present nationwide.
4. Dissemination of training material to Farmer Promoters including
28,000 maize guides, 14,000 climbing bean guides and 8,000
Irish Potato guides. 400,000 printed ads circulated to promote the
use of inorganic fertlisers.
5. Use of SMS services and a hotline to provide extension services
remotely.
6. 2,531 FFS facilitators are active on the field.
III. Value chain development and private sector investment
Enhanced agribusiness
environment for
agricultural
enterprises.
NAEB
Cash Crop Commodity Development/Revenue:
1. Coffee:
a. Acreage: Additional area planted totalled 9,166 ha.
b. Productivity: Total of 7,876tonnes of organic fertilizers
and 3,300 tonnes of mineral fertilizers applied during
FY 2013/14.
c. Revenue: Generated about 47.5 million USD (low
average world coffee prices)
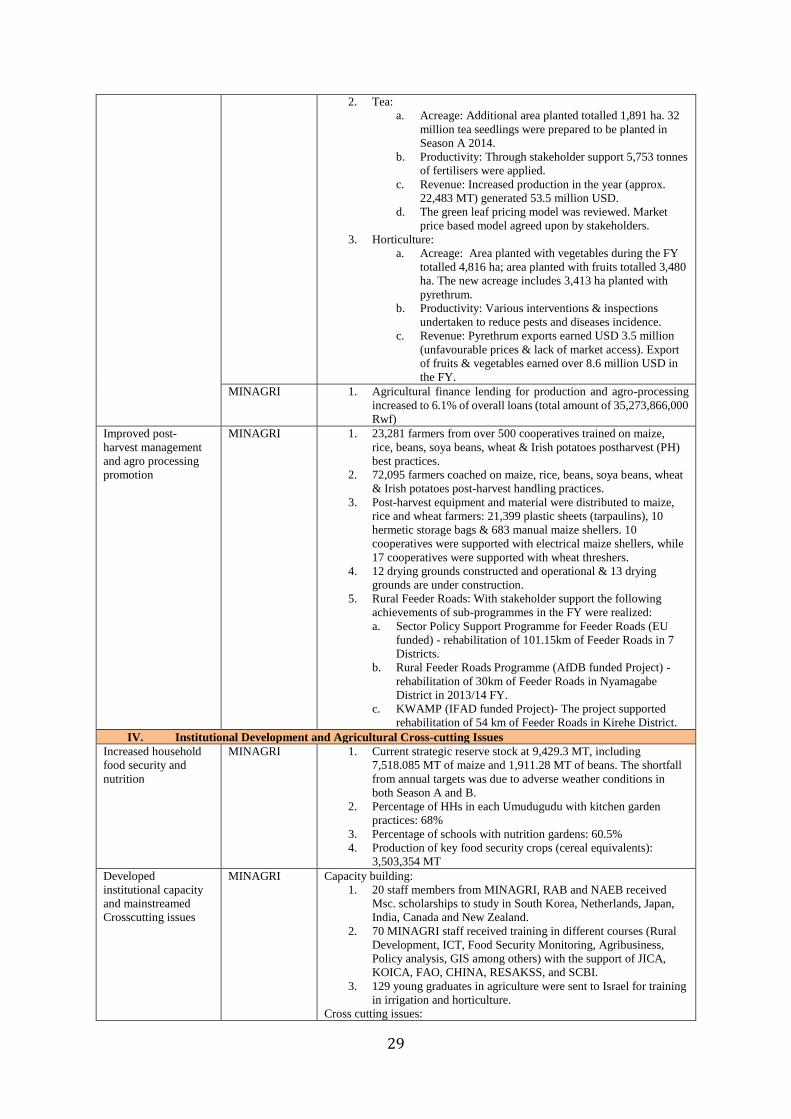
29
2. Tea:
a. Acreage: Additional area planted totalled 1,891 ha. 32
million tea seedlings were prepared to be planted in
Season A 2014.
b. Productivity: Through stakeholder support 5,753 tonnes
of fertilisers were applied.
c. Revenue: Increased production in the year (approx.
22,483 MT) generated 53.5 million USD.
d. The green leaf pricing model was reviewed. Market
price based model agreed upon by stakeholders.
3. Horticulture:
a. Acreage: Area planted with vegetables during the FY
totalled 4,816 ha; area planted with fruits totalled 3,480
ha. The new acreage includes 3,413 ha planted with
pyrethrum.
b. Productivity: Various interventions & inspections
undertaken to reduce pests and diseases incidence.
c. Revenue: Pyrethrum exports earned USD 3.5 million
(unfavourable prices & lack of market access). Export
of fruits & vegetables earned over 8.6 million USD in
the FY.
MINAGRI
1. Agricultural finance lending for production and agro-processing
increased to 6.1% of overall loans (total amount of 35,273,866,000
Rwf)
Improved post-
harvest management
and agro processing
promotion
MINAGRI 1. 23,281 farmers from over 500 cooperatives trained on maize,
rice, beans, soya beans, wheat & Irish potatoes postharvest (PH)
best practices.
2. 72,095 farmers coached on maize, rice, beans, soya beans, wheat
& Irish potatoes post-harvest handling practices.
3. Post-harvest equipment and material were distributed to maize,
rice and wheat farmers: 21,399 plastic sheets (tarpaulins), 10
hermetic storage bags & 683 manual maize shellers. 10
cooperatives were supported with electrical maize shellers, while
17 cooperatives were supported with wheat threshers.
4. 12 drying grounds constructed and operational & 13 drying
grounds are under construction.
5. Rural Feeder Roads: With stakeholder support the following
achievements of sub-programmes in the FY were realized:
a. Sector Policy Support Programme for Feeder Roads (EU
funded) - rehabilitation of 101.15km of Feeder Roads in 7
Districts.
b. Rural Feeder Roads Programme (AfDB funded Project) -
rehabilitation of 30km of Feeder Roads in Nyamagabe
District in 2013/14 FY.
c. KWAMP (IFAD funded Project)- The project supported
rehabilitation of 54 km of Feeder Roads in Kirehe District.
IV. Institutional Development and Agricultural Cross-cutting Issues
Increased household
food security and
nutrition
MINAGRI
1. Current strategic reserve stock at 9,429.3 MT, including
7,518.085 MT of maize and 1,911.28 MT of beans. The shortfall
from annual targets was due to adverse weather conditions in
both Season A and B.
2. Percentage of HHs in each Umudugudu with kitchen garden
practices: 68%
3. Percentage of schools with nutrition gardens: 60.5%
4. Production of key food security crops (cereal equivalents):
3,503,354 MT
Developed
institutional capacity
and mainstreamed
Crosscutting issues
MINAGRI
Capacity building:
1. 20 staff members from MINAGRI, RAB and NAEB received
Msc. scholarships to study in South Korea, Netherlands, Japan,
India, Canada and New Zealand.
2. 70 MINAGRI staff received training in different courses (Rural
Development, ICT, Food Security Monitoring, Agribusiness,
Policy analysis, GIS among others) with the support of JICA,
KOICA, FAO, CHINA, RESAKSS, and SCBI.
3. 129 young graduates in agriculture were sent to Israel for training
in irrigation and horticulture.
Cross cutting issues:
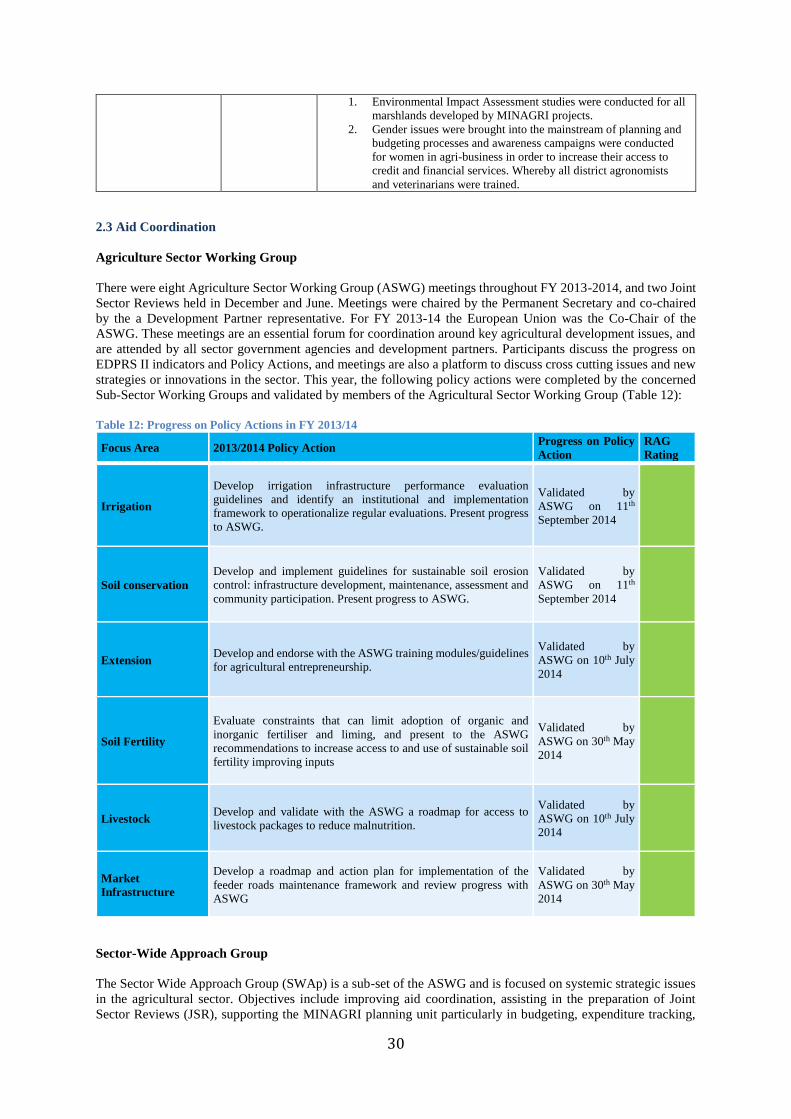
30
1. Environmental Impact Assessment studies were conducted for all
marshlands developed by MINAGRI projects.
2. Gender issues were brought into the mainstream of planning and
budgeting processes and awareness campaigns were conducted
for women in agri-business in order to increase their access to
credit and financial services. Whereby all district agronomists
and veterinarians were trained.
2.3 Aid Coordination
Agriculture Sector Working Group
There were eight Agriculture Sector Working Group (ASWG) meetings throughout FY 2013-2014, and two Joint
Sector Reviews held in December and June. Meetings were chaired by the Permanent Secretary and co-chaired
by the a Development Partner representative. For FY 2013-14 the European Union was the Co-Chair of the
ASWG. These meetings are an essential forum for coordination around key agricultural development issues, and
are attended by all sector government agencies and development partners. Participants discuss the progress on
EDPRS II indicators and Policy Actions, and meetings are also a platform to discuss cross cutting issues and new
strategies or innovations in the sector. This year, the following policy actions were completed by the concerned
Sub-Sector Working Groups and validated by members of the Agricultural Sector Working Group (Table 12):
Table 12: Progress on Policy Actions in FY 2013/14
Focus Area 2013/2014 Policy Action Progress on Policy
Action
RAG
Rating
Irrigation
Develop irrigation infrastructure performance evaluation
guidelines and identify an institutional and implementation
framework to operationalize regular evaluations. Present progress
to ASWG.
Validated by
ASWG on 11th
September 2014
Soil conservation
Develop and implement guidelines for sustainable soil erosion
control: infrastructure development, maintenance, assessment and
community participation. Present progress to ASWG.
Validated by
ASWG on 11th
September 2014
Extension Develop and endorse with the ASWG training modules/guidelines
for agricultural entrepreneurship.
Validated by
ASWG on 10th July
2014
Soil Fertility
Evaluate constraints that can limit adoption of organic and
inorganic fertiliser and liming, and present to the ASWG
recommendations to increase access to and use of sustainable soil
fertility improving inputs
Validated by
ASWG on 30th May
2014
Livestock Develop and validate with the ASWG a roadmap for access to
livestock packages to reduce malnutrition.
Validated by
ASWG on 10th July
2014
Market
Infrastructure
Develop a roadmap and action plan for implementation of the
feeder roads maintenance framework and review progress with
ASWG
Validated by
ASWG on 30th May
2014
Sector-Wide Approach Group
The Sector Wide Approach Group (SWAp) is a sub-set of the ASWG and is focused on systemic strategic issues
in the agricultural sector. Objectives include improving aid coordination, assisting in the preparation of Joint
Sector Reviews (JSR), supporting the MINAGRI planning unit particularly in budgeting, expenditure tracking,
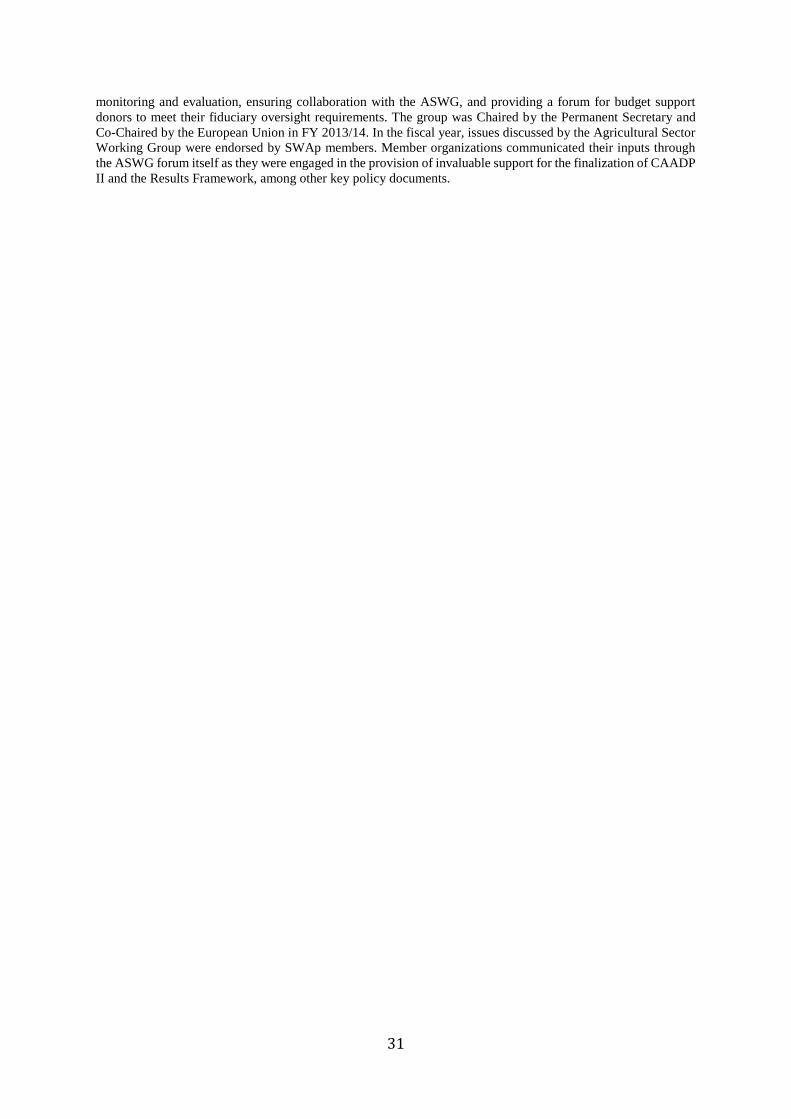
31
monitoring and evaluation, ensuring collaboration with the ASWG, and providing a forum for budget support
donors to meet their fiduciary oversight requirements. The group was Chaired by the Permanent Secretary and
Co-Chaired by the European Union in FY 2013/14. In the fiscal year, issues discussed by the Agricultural Sector
Working Group were endorsed by SWAp members. Member organizations communicated their inputs through
the ASWG forum itself as they were engaged in the provision of invaluable support for the finalization of CAADP
II and the Results Framework, among other key policy documents.

32
SECTION 3: PROJECT & PROGRAMME
IMPLEMENTATION
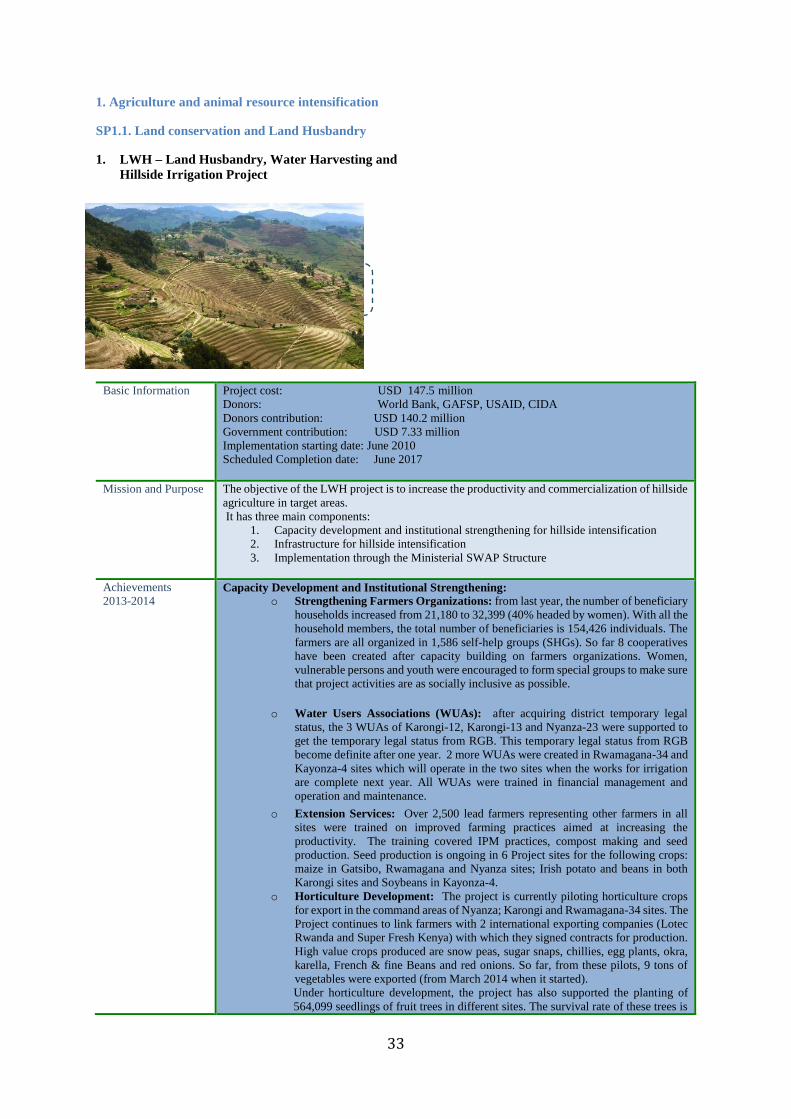
33
1. Agriculture and animal resource intensification
SP1.1. Land conservation and Land Husbandry
1. LWH – Land Husbandry, Water Harvesting and
Hillside Irrigation Project
Basic Information
Project cost: USD 147.5 million
Donors: World Bank, GAFSP, USAID, CIDA
Donors contribution: USD 140.2 million
Government contribution: USD 7.33 million
Implementation starting date: June 2010
Scheduled Completion date: June 2017
Mission and Purpose
The objective of the LWH project is to increase the productivity and commercialization of hillside
agriculture in target areas.
It has three main components:
1. Capacity development and institutional strengthening for hillside intensification
2. Infrastructure for hillside intensification
3. Implementation through the Ministerial SWAP Structure
Achievements
2013-2014
Capacity Development and Institutional Strengthening:
o Strengthening Farmers Organizations: from last year, the number of beneficiary
households increased from 21,180 to 32,399 (40% headed by women). With all the
household members, the total number of beneficiaries is 154,426 individuals. The
farmers are all organized in 1,586 self-help groups (SHGs). So far 8 cooperatives
have been created after capacity building on farmers organizations. Women,
vulnerable persons and youth were encouraged to form special groups to make sure
that project activities are as socially inclusive as possible.
o Water Users Associations (WUAs): after acquiring district temporary legal
status, the 3 WUAs of Karongi-12, Karongi-13 and Nyanza-23 were supported to
get the temporary legal status from RGB. This temporary legal status from RGB
become definite after one year. 2 more WUAs were created in Rwamagana-34 and
Kayonza-4 sites which will operate in the two sites when the works for irrigation
are complete next year. All WUAs were trained in financial management and
operation and maintenance.
o Extension Services: Over 2,500 lead farmers representing other farmers in all
sites were trained on improved farming practices aimed at increasing the
productivity. The training covered IPM practices, compost making and seed
production. Seed production is ongoing in 6 Project sites for the following crops:
maize in Gatsibo, Rwamagana and Nyanza sites; Irish potato and beans in both
Karongi sites and Soybeans in Kayonza-4.
o Horticulture Development: The project is currently piloting horticulture crops
for export in the command areas of Nyanza; Karongi and Rwamagana-34 sites. The
Project continues to link farmers with 2 international exporting companies (Lotec
Rwanda and Super Fresh Kenya) with which they signed contracts for production.
High value crops produced are snow peas, sugar snaps, chillies, egg plants, okra,
karella, French & fine Beans and red onions. So far, from these pilots, 9 tons of
vegetables were exported (from March 2014 when it started).
Under horticulture development, the project has also supported the planting of
564,099 seedlings of fruit trees in different sites. The survival rate of these trees is
Terraces constructed in the new site of Gishwati in Nyabihu District Terraces constructed in the new site of Gishwati in Nyabihu District Terraces constructed in the new site of Gishwati in Nyabihu District Terraces constructed in the new site of Gishwati in Nyabihu District
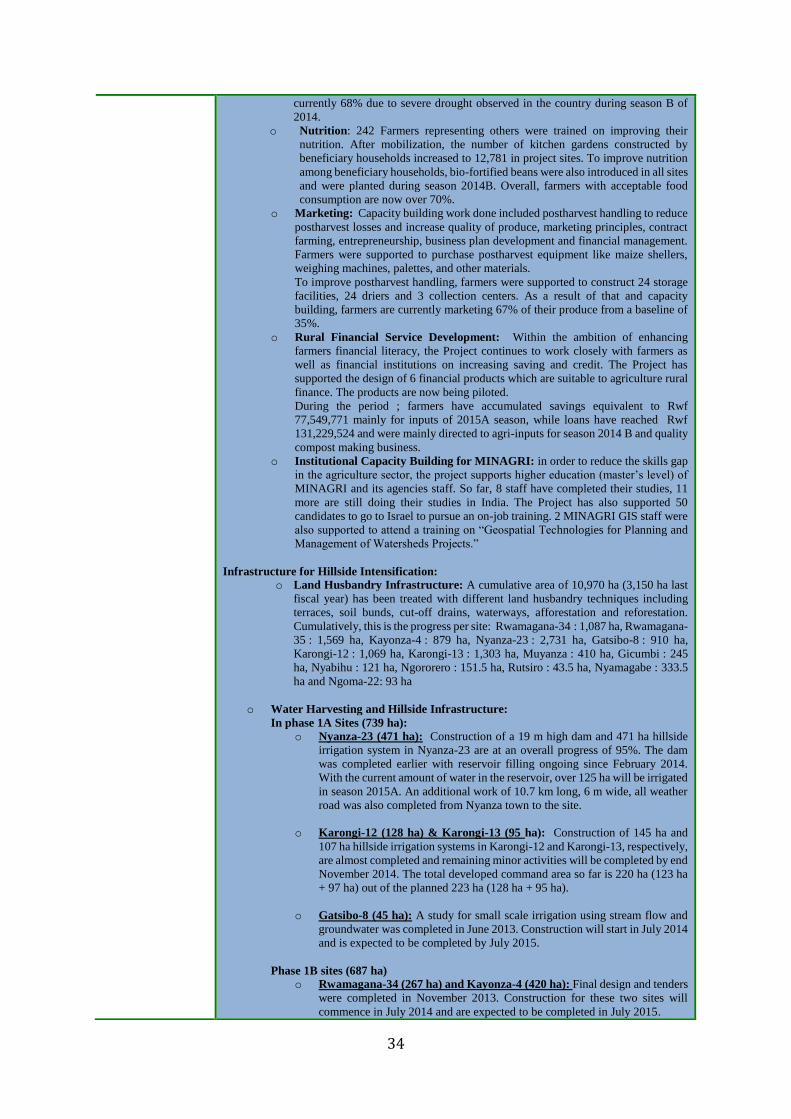
34
currently 68% due to severe drought observed in the country during season B of
2014.
o Nutrition: 242 Farmers representing others were trained on improving their
nutrition. After mobilization, the number of kitchen gardens constructed by
beneficiary households increased to 12,781 in project sites. To improve nutrition
among beneficiary households, bio-fortified beans were also introduced in all sites
and were planted during season 2014B. Overall, farmers with acceptable food
consumption are now over 70%.
o Marketing: Capacity building work done included postharvest handling to reduce
postharvest losses and increase quality of produce, marketing principles, contract
farming, entrepreneurship, business plan development and financial management.
Farmers were supported to purchase postharvest equipment like maize shellers,
weighing machines, palettes, and other materials.
To improve postharvest handling, farmers were supported to construct 24 storage
facilities, 24 driers and 3 collection centers. As a result of that and capacity
building, farmers are currently marketing 67% of their produce from a baseline of
35%.
o Rural Financial Service Development: Within the ambition of enhancing
farmers financial literacy, the Project continues to work closely with farmers as
well as financial institutions on increasing saving and credit. The Project has
supported the design of 6 financial products which are suitable to agriculture rural
finance. The products are now being piloted.
During the period ; farmers have accumulated savings equivalent to Rwf
77,549,771 mainly for inputs of 2015A season, while loans have reached Rwf
131,229,524 and were mainly directed to agri-inputs for season 2014 B and quality
compost making business.
o Institutional Capacity Building for MINAGRI: in order to reduce the skills gap
in the agriculture sector, the project supports higher education (master’s level) of
MINAGRI and its agencies staff. So far, 8 staff have completed their studies, 11
more are still doing their studies in India. The Project has also supported 50
candidates to go to Israel to pursue an on-job training. 2 MINAGRI GIS staff were
also supported to attend a training on “Geospatial Technologies for Planning and
Management of Watersheds Projects.”
Infrastructure for Hillside Intensification:
o Land Husbandry Infrastructure: A cumulative area of 10,970 ha (3,150 ha last
fiscal year) has been treated with different land husbandry techniques including
terraces, soil bunds, cut-off drains, waterways, afforestation and reforestation.
Cumulatively, this is the progress per site: Rwamagana-34 : 1,087 ha, Rwamagana-
35 : 1,569 ha, Kayonza-4 : 879 ha, Nyanza-23 : 2,731 ha, Gatsibo-8 : 910 ha,
Karongi-12 : 1,069 ha, Karongi-13 : 1,303 ha, Muyanza : 410 ha, Gicumbi : 245
ha, Nyabihu : 121 ha, Ngororero : 151.5 ha, Rutsiro : 43.5 ha, Nyamagabe : 333.5
ha and Ngoma-22: 93 ha
o Water Harvesting and Hillside Infrastructure:
In phase 1A Sites (739 ha):
o Nyanza-23 (471 ha): Construction of a 19 m high dam and 471 ha hillside
irrigation system in Nyanza-23 are at an overall progress of 95%. The dam
was completed earlier with reservoir filling ongoing since February 2014.
With the current amount of water in the reservoir, over 125 ha will be irrigated
in season 2015A. An additional work of 10.7 km long, 6 m wide, all weather
road was also completed from Nyanza town to the site.
o Karongi-12 (128 ha) & Karongi-13 (95 ha): Construction of 145 ha and
107 ha hillside irrigation systems in Karongi-12 and Karongi-13, respectively,
are almost completed and remaining minor activities will be completed by end
November 2014. The total developed command area so far is 220 ha (123 ha
+ 97 ha) out of the planned 223 ha (128 ha + 95 ha).
o Gatsibo-8 (45 ha): A study for small scale irrigation using stream flow and
groundwater was completed in June 2013. Construction will start in July 2014
and is expected to be completed by July 2015.
Phase 1B sites (687 ha)
o Rwamagana-34 (267 ha) and Kayonza-4 (420 ha): Final design and tenders
were completed in November 2013. Construction for these two sites will
commence in July 2014 and are expected to be completed in July 2015.

35
2. GWLM – Gishwati Water and Land Management Project
Phase 1C sites (1,100 ha)
o Muyanza (1,100 ha): Feasibility design for Muyanza (1,100 ha) will
complete in August 2014. Detail design is ongoing and tender documents are
expected by Dec 2014. Construction is expected to commence in Feb 2015
and end in Oct 2016. Procurement process for hiring a Consultant has started.
EIA studies have been completed.
Phase 2 sites (5,400 ha)
o Between September 2011 and March 2012, LWH team of engineers identified
37 new potential sites for 6,500 ha irrigation in different parts of Rwanda
including Muyanza (1,100 ha). Muyanza site is selected as a fast-track Phase
1C site as described above. The remaining sites will be of great potential for
future scale up of LWH2 project. Two consulting firms are currently carrying
out Pre-feasibility, Feasibility and Detailed Design studies of these sites which
have been separated into two lots.
o Feasibility designs for Muyanza (1,100 ha) and Nyamukana (840 ha) as well
as Pre-feasibility Studies for the remaining sites will complete in August
2014.
Financial Management implementation o The project has executed 89% of its 2013-2014 fiscal year budget and has disbursed
50.8 % of its total budget from its different donors (IDA: 68.3%, GAFSP: 64.9%,
CIDA: 77.1% and USAID: 39.06%).
Basic Information
Project cost: 25,774,908 USD (15,284,520,444 RwF)
Donor: Government of Rwanda internally funded project
Government contribution so far: 4,645,588 USD (3,159,000,000RwF)
Implementation starting date: July 2010
Scheduled Completion date: June 2013
Eventual Extension: June 2017
Implementing Agency: TF Irrigation and Mechanization
Mission and Purpose
GWLM aims to implement comprehensive and sustainable land use and water management
technologies, which contribute to environmental conservation and improve the livelihoods of
Gishwati communities. The project’s overall objective is to facilitate a healthy co-existence
between agrarian communities and Gishwati’s fragile ecosystem, while promoting sustainable
economic development to improve the community’s quality of life.
The main components of the program are:
• Sensitization, mobilization and empowerment of beneficiaries,
• Road network construction,
• Comprehensive water and land management works,
• Quarterly monitoring and evaluation, Building the capacity of staff and institutions.
Radical terrace construction in Arusha under GWLM for potato
and maize plantation
Radical terrace construction in Arusha under GWLM for potato
and maize plantation
Radical terrace construction in Arusha under GWLM for potato
and maize plantation
Radical terrace construction in Arusha under GWLM for potato
and maize plantation

36
Achievements 2013-
2014
1. Progress of activities in crop land use blocs:
Land husbandry works have been implemented on four sites: Muhe-Murambi and Muhe-
Bihangara in Bigogwe sector, Mutaho in Rambura sector (Nyabihu District) and Yungwe in
Kanama sector of Rubavu District. The table below shows the total treated area by the end of
2013.
Total area treated with graded terraces (Ha)
Site Area treated with graded terraces (Ha)
MUTAHO 94.08
YUNGWE 120.51
MUHE-MURAMBI 168.15
MUHE – BIHANGARA 127.5
Total 510.24
Collaborative work with REMA and MINADEF (Reserve Forces) have completed an extra 360Ha
of Land husbandry works in the project zone sectors as shown the table below:
Land husbandry works implemented in collaboration with REMA and MINADEF/Reserve Force
Site/Sector Area treated with appropriate LH Technologies( Ha)
Graded terraces Progressive terraces
JENDA 100 -
KARAGO 100 -
RAMBURA - 80
KARAGO - 80
Total 360 Ha
2. Agriculture development and self-help groups’ implementation
Activities related to agriculture development concerned mainly follow up of farming season on
different sites: The following table illustrates the situation of activities carried out on different
sites /2014 A and 2014 B. A total of 1064ha (season A) and 1590ha (season B) was successfully
exploited for the production of maize and Irish potatoes. A total production of 3192tons maize
and 31800 tons of potato was achieved.
Agriculture development and self-help groups’ implementation
Site Season 2014 A Season 2014B
Cultivated
area (ha)
Crops Cultivated
area (ha)
Crops
Arusha I 95 Irish potatoes 24.86 Maize
72 Irish potatoes
Kijote 128 Irish potatoes 175.54 Maize
Kora 35 Irish potatoes 54.096 Maize
Gatagara 56
Irish potatoes 82.13
Maize
Arusha II 75 Irish potatoes 108.07 Maize
Busoro 140
Irish potatoes 233.86
Maize
Kinamba / (Rega) 105 Irish potatoes 105 Beans and carrots
Muhe-Murambi 123 Maize 168.15 Irish potatoes

37
Yungwe 53 Maize 120.51 Irish potatoes
Bihangara 74 Maize 127.5 Irish potatoes
Mutaho 35 Maize 94.08 Irish potatoes
Jenda 73 Maize 96 Irish potatoes
Total 1064 1589.796
3. Progress of activities in forest and ecosystem rehabilitation
Major activities in the Forest domain have been dominated by constant monitoring of already
planted sites, continued sensitization of community members about the need for protecting already
planted sites, avoiding grazing in the restricted high risk zones and respecting the different
boundaries put into place by the project. However, in addition to monitoring, some others activities
took place in the forest and rehabilitation component pertaining to the growth of tea and apples in
the GWLM Project area. The GLWM project in collaboration with stakeholders mapped the area
allocated for Tree planting, Tea planting and Apple growing. In the map (produced by RNRA),
169HA have been allocated for Tea growing, 160HA were allocated for Apple growing while the
remaining area was for forestry.
The first tree planting contract between Rwanda Natural Resource Authority and Ministry of
Defense/Reserve Force planted a total of 700ha comprising of Alnus trees and other Indigenous
tree species. A new contract (second tree planting contract) was signed between the same
institutions. Under this contract, the Reserve forces will plant 500ha within GWLM Project area
designated to forest regeneration. Only indigenous tree species will be planted. Implementation of
this contract has already started with tree nursery establishment.
4. Progress of activities in range land development
After the process of land redistribution, 1280 households received land in the rangeland. The major
activities which have been going on in the rangeland development component are fencing of the
paddocks and establishment of groups among cattle keepers. In line with fencing and
establishment of groups, at least 70% of the redistributed rangeland is already fenced, and 25
groups are already established.
5. Other important activities:
5.1. Construction of the drainage canal in through Kinamba lowland
The subproject of reinforcing Mizingo river main drain with masonry was undertaken in order to
resolve flooding problems at Kinamba area, and help farmers to grow crops on an area of 105Ha
lowland as well as to convey water gathered by waterways and cut off drains in the upstream
terraces. The 1500km long drainage canal was provisional received in 2014.
5.2. Land redistribution in Gishwati
In order to address the crucial issues and to cope with the land use rehabilitation process, a special
commission has been tasked to redistribute available agricultural and range land to all affected
families. The categories of the affected people in Gishwati have been identified and given land for
agricultural activities (0.2ha/family owning land in Gishwati but living outside of Gishwati area
and 0.4ha/family living in Gishwati) and animal husbandry activities (1ha/family). 4353 families
have received agricultural land and 1280 families have been given range land. This exercise was
a great success as it solved many problems related to land management. However, after land
development and redistribution of land, in order to keep the primary objective of rehabilitation of
Gishwati, we recommend:
A strong emphasis on mobilization and sensitization of all the stakeholders including
beneficiaries of the developed land, local administration and other concerned entities to
work together for sustainable use of the developed land and infrastructures in this
sensitive ecosystem.
To hand over all the developed land for agriculture and livestock to the farmer
beneficiaries with a user contract signed between them and local administration.
5.3. Mobilization for Pyrethrum growing in GWLM project area
Following the Government’s recommendation to increase the area coverage for Pyrethrum
growing, the GWLM project area was appointed to support the government’s objective of
increasing the production of Pyrethrum while at the same time protecting and increasing the
sustainable productivity of the sensitive soils in Gishwati. Mobilization for Pyrethrum in GWLM
area started towards the end of last year, though it had not effectively taken off at the
grassroots/community level by January 2014. An intensive program of mobilization for pyrethrum
growing at the grassroots level started in January 2014.

38
SP1.2. Irrigation and Water Management
1. PAIRB – Bugesera Natural Region Rural Infrastructure support Project
Basic
Information
Project cost: 2.25 million USD
Donor: African Development Fund
Government contribution: None
Implementation starting date: October 2009
Scheduled Completion date: December 2015
Eventual Extension: Not yet decided
Mission and
Purpose
PAIRB aims to enhance food security in the Bugesera region through a sustainable increase in agricultural
production.
Achievement
s
2013-2014
Irrigation Development:
Gashora marshland (Block A) development works that started on December, 3rd 2012 executed
by a Joint Venture between AN KAPLAN (Israel) and Thomas et Piron Grands Lacs (Rwanda)
resulted into contract cancellation on December, 10th 2013 at 6.7% of progress.
A new process of acquisition of another contractor and supervisor (tendering process) has been
immediately initiated: contract signed on 21/05/2014 with the Joint Venture SINOHYDRO
TIANJIN (China) & HORIZON CONSTRUCTION COMPANY Ltd (Rwanda) for
7,267,074,990 Rwf. Works commenced on 21/06/2014 for 16 months. SCET Tunisie on
30/06/2014
Protection of hillsides of lakes and marshlands against erosion is done using local community
committees known as COGIBAV, standing for watersheds integrated management committees:
- Trenches were rehabilitated (18,424 ml) protecting 2,303 ha cumulatively
- Agro forestry trees prepared and planted by COGIBAV on ditches over 118 ha throughout
individual farmers’ plots. Transplantation was shifted to season B 2014 due to unexpected
drought period. Immediately after transplantation in March 2014, a period of severe drought
occurred again and destroyed much of the planted trees (results are to be evaluated and new
strategy elaborated with different stakeholders and partners early next year).
- Penissetum grasses were planted to strengthen progressive terraces protecting an area of 448ha.
Drought period badly affected the achievement of the intended results.
Development of production:
- Popularizing modern agricultural techniques through farmers’ field schools: efforts are still
being put in setting up more FFS to reach a big number of farmers organized around banana,
cassava and maize crops.
Crop Number of FFS Number of beneficiaries Comments
2013-
2014
(New)
Cumulative 2013-2014 Cumulative
Four seed storage facilities of 300MT each at Ngeruka, Gashora, Kamabuye and
Rweru in Bugesera District Four seed storage facilities of
300MT each at Ngeruka, Gashora, Kamabuye and
Rweru in Bugesera District Four seed storage facilities of
300MT each at Ngeruka, Gashora, Kamabuye and
Rweru in Bugesera District Four seed storage facilities of
300MT each at Ngeruka, Gashora, Kamabuye and
Rweru in Bugesera District

39
Banana 11 35 434 1,226 Need to be improved
(Yield 77MT/ha against 100MT
desired).
Cassava 29 200 870 2,758 Yield (23.1MT/ha, 30MT/ha
desired).
Maize 18 22 450 556 FFS experienced unfavorable
weather conditions (lack of
enough rains) that compromised
the learning exercise.
Rice 6 15 141 411 Started to engage early enough
future beneficiaries of Gashora
marshland after development
works. Yield attained in a non
developed marshland: 6MT/ha
TOTAL 64 272 2,353 4,951
- Three new technologies are being introduced:
Banana and pineapple macropropagation: cumulatively, 15 banana macropropagation units
initiated produced 11,661that benefited to 222 farmers; while for pineapple 9 sites established
produced 41,474 suckers for 204 farmers.
Fruits grafting (avocadoes, mangoes). Ten (10) fruit nurseries were established (one in each
Sector of the project intervention zone): 135,000 plantlets to be grafted in July-August 2014.
Transplantation is expected to take place in November 2014. Farmers (800) beneficiaries are
mobilized nearby water sources/wetlands to avoid losses due to the negative impact of droughts
that the District experiences frequently.
- Distribution of cattle and goats: It was planned to distribute 600 cows to poor beneficiary
families this year. The tendering process ended up with signature of contracts on 22/05/2014.
Heifers to be distributed are crossbreed (50%) jersey – frisonne. Identification process
completed in collaboration with RAB and Bugesera District. Taking into account the then
prevalent drought conditions, an evaluation of beneficiary preparedness advised to wait for the
rains in September 2014 to distribute heifers. Only 60 heifers distributed on 19/06/2014.
On the other side, pass on heifer gifts ceremonies were organized whereby the first beneficiaries (since
September 2011) passed gifts to new beneficiaries (70 heifers) in May 2014. The current situation of
distributed cattle is summarized in the table below:
Sector Cows
distribute
d
Beneficiaries Losses/Ma
y 2014
% of
losse
s
Aliv
e
new
born
Tota
l
cows
alive
Increas
e rate M W % 0f
wome
n
Nyamata 78 28 50 64 6 7.7 59 131 75.6
Mayang
e
95 32 63 66 12 12.6 49 132 51.6
Mwogo 67 27 40 60 18 26.9 30 79 44.8
Juru 94 31 63 67 15 16 72 151 76.6
Rilima 94 37 57 61 18 19.1 32 108 34
Gashora 311 21
7
94 30 57 18.3 97 351 31.2
Rweru 261 17
3
88 34 20 7.7 81 322 31
Total 1000 54
5
45
5
46 146 14.6 420 1274 42
Other Rural Infrastructure Development:
- Two milk collection centres in Ruhuha and Gashora Sector finished and operational (50,000
liters capacity each). Experiences brought by LISP other MCCs is being duplicated with regards
to farmer to farmer training, milk collection and handling (collection networking, testing,
marketing and records keeping, etc). Farmer cooperatives manage the infrastructure
(Zirakamwa at Ruhuha with 131 members, 46% are women and KOINDAMU at Gashora with
110 members, 42% are women).
- Ongoing construction and equipment of 3 grain silos (at Mayange with total 6000MT capacity).
General progress on the main contract is at 85% (delayed by electricity connection to the site
and the contractor unjustified works stopping). For now, electricity is connected, and the

40
contractor provided a new planning of activities for recovery. Completion expected to be
November 2014. Contracts regarding additional works (silo site internal roads, administrative
block and parking construction) signed on 30/06/2014 for 6 months (168,384,985 Rwf).
- Construction works of 4 seed storage sheds of 300MT capacity each completed in Ngeruka,
Kamabuye, Rweru and Gashora Sector and provisional reception done on 28th March 2014.
They have been constructed nearby crop intensification sites for easy use. The organizations
around are very new cooperatives being trained by ADEAR_UGAMA and the management
model in starting associates community and commercial interests.
- Construction of two road markets at Mayange and Gashora: Constructed and in use since May
2014 on sites used for selling fresh vegetables on the main road Kicukiro - Nyamata- Kirundo.
The beneficiaries are former users of selling points initially set by farmers’ initiative.
2. KWAMP – Kirehe Community Based Watershed Management Project
Basic Information
Project cost: 73.06 million USD
Donor: The International Fund for Agricultural Development
Government contribution: 9.54 million USD million USD
Implementation starting date: June 2009
Scheduled Completion date: December 2016
Eventual Extension: Not yet decided
Mission and Purpose
KWAMP is an agricultural investment project which aims to develop sustainable and profitable
small-scale agriculture in Kirehe District. There are three project areas:
Local institutional development
Agricultural intensification
Rural feeder roads.
Achievements
2013-2014
1. Local institutional development
18 Strong public and private local institutions with effective planning and management
capacity in the natural resource sector – Comité Local pour Gestion et Supervision
(CLGS) in place.
18 coherent Watershed Management Plans developed, amended as needed and
implemented.
Land registry give to farmers adequate title to their land rights for legal and planning
purposes.
17 Water Users’ Associations (WUA) able to operate without external assistance and
to mobilize funding for system maintenance and repairs
Construction and equipping of three permanent “Community Centres for Innovation”
responding to requests for advice and extension services.
At least 590 Village-based resource persons to act as links to CCI.
At least 9 community competitions organized at CCI and village levels to provide
incentives for greater efficiency in farming.
At least 25 primary cooperatives trained in businesses.
UCORIRWA (rice production cooperative) is trained in accounting and management.
At least 3 Co-operative Unions in Kirehe formed and strengthened.
Kinoni I Dam constructed under KWAMP as the first stage of a major irrigation scheme Kinoni I Dam constructed under KWAMP as the first stage of a major irrigation scheme Kinoni I Dam constructed under KWAMP as the first stage of a major irrigation scheme Kinoni I Dam constructed under KWAMP as the first stage of a major irrigation scheme

41
At least18 watersheds surrounding potential irrigation development sites selected and
developed at 100%.
Mapping exercise to identify the extent and present land use in target watersheds.
Local committee (CLGS) to manage each watershed is established at 100%.
At least 3,674 persons (PR, RV and CLGS members) trained on soil and water land use
management.
An inventory of physical, economic and social attributes of each watershed as the
foundation of a holistic Watershed Management Plan (WMP) is available.
18WMPs elaborated and updated by technicians according to CLGS and community’s
needs.
100% District Land Bureau and National Land Centre staff trained.
365 members of District Land commission, sectors and cell land committee trained on
land lows and land conflict resolution
At least 200,000 Land titles available and distributed to land owners.
20 WUA created for involvement in the planning, overseeing of construction and
subsequent operation and management of the installed system.
20 WUA trained in the technical, legal and operation and maintenance aspects of
irrigation management.
2. Agricultural Intensification
2.1: Value chain development
Four commodity chains are selected, mapped and analyzed.
An action plan is developed by stakeholders’ “actor-cluster platforms” for value-chain
development for each targeted commodity.
16 basic facilities developed for post-harvest
At least 10,000 persons trained in commodity chain management
A Value Chain Development Fund is established and operational
At least 10 Business plans prepared and implemented
Number of input shops and collection points constructed.
Number of market information and intelligence facilities available.
2.2: Crop and livestock intensification
25,000 ha of maize and bean intensification developed;
3,000 ha of banana rehabilitated;
2,000 ha of cassava intensification developed;
120 FFS groups for banana and 120 FFS groups for cassava established;
Additional 150 cows distributed using the new Umudugudu-based model
4 000 households have received passed-on animals from other beneficiaries (3000
cows, 600 pigs and 400 goats distributed through POG);
At least 15,000 persons trained in integrated crop/animal husbandry systems
300 roof rain water harvesting systems installed;
450 households regularly operating a biogas fermenter
At least 1500 cows inseminated per year.
2.3: Irrigation development
1100 ha of hillside scheme works completed;
600 ha of new marshland developed;
Operation & maintenance manuals for all irrigation schemes prepared and
disseminated.
2.4: Soil and water conservation
17,832 Ha of watershed protected.
5.335 Ha protected against erosion through the planting of 14,750,000 trees.
669 ha developed under comprehensive land husbandry technologies
34 community-based tree nurseries established.
54,375,000 planted of Napier cuttings
At least 22 Ha of hedge plant cuttings bank established.
At least 3 SWC resource manual for farmer compiled and distributed.
Additional 150 ha of hilltop reforestation established and 441 ha of watersheds
reforested
Contract signed with the cooperative Uburumbuke for forest management;
40 modern beehives provided to the cooperative Uburumbuke;

42
At least 25 kg of honey per beehive harvested one year after installation; and
A solidarity chain for beehives established and operational.
3. Feeder roads
64 Km of feeder roads rehabilitated;
Operation & maintenance manuals for feeder roads prepared and disseminated.
3. GFI – Government Funded Irrigation Immediate Action Irrigation Project
Basic
Information
Project cost: 50 billion RWF
Donor: Government of Rwanda
Government contribution: 100% Government funded
Implementation starting date: July 2010
Scheduled Completion date: June 2013
Eventual Extension: To Be Decided
Implementing Agency: TF Irrigation and Mechanization
Mission and
Purpose
The Immediate Action Irrigation (IAI) initiative for food self-sufficiency and livelihood improvement
under MINAGRI’s Task Force of Irrigation and Mechanization aims for the intensification and
modernization of agriculture, to successfully reduce dependence on rain fed agriculture in the Eastern
Province, the driest part of Rwanda. The targeted Districts are Kirehe and Nyagatare. The project aims
to cover 5,000 ha in three years.
Achievements
2013-2014
Operation and management of Muvumba (400ha) and Nasho (600ha) irrigation schemes
In Muvumba (400ha) the following achievements in crop production were accomplished:
- The cooperative (KABOKU), and two water organizations (WUOS), farmers produced
soybean, bean and vegetables. High value crops which included onion, eggplant
watermelon and beetroot were produced successfully in Season C. A total of 302 tons of
high value crops was achieved.
- The total production from 2013b to 2014B are given in the following table:
Crop production for different crops from 2013A to 2014B
Cropping
season
Total
scheme
Area
(Ha)
Crops
Cultivated
land
Provisional
production (t/ha)
Estimated
Production
ha % Production
(tones)
Yield
(t/ha)
availed
data
Production
(tones)
Yield
(t/ha)
2013A 400 Maize 400 100 2000 5 1800 4.5
2013B 400 Soybean 100 25 120 1.2 50 0.5
2013C 400 Onion 2 0.5 20 10 21 10.5
2013C 400 Eggplant 1 0.25 10 10 9 9
2013C 400 tomato 5 1.25 100 20 60 12
2014A 400 Bean 380 95 570 1.5 570 1.5
Irrigated maize under a sprinkler irrigation system supported by GFI at a mature stage
Irrigated maize under a sprinkler irrigation system supported by GFI at a mature stage
Irrigated maize under a sprinkler irrigation system supported by GFI at a mature stage
Irrigated maize under a sprinkler irrigation system supported by GFI at a mature stage

43
2014A 400 onion 2 0.5 20 10 21 10.5
2014A 400 tomato 15 3.75 300 20 150 10
2014B 400 Bean 375 93.75 562.5 1.5 420 1.12
2014b 400 tomato 10 2.5 200 20 300 30
2014b 400 onion 5 1.25 75 15 60 12
2014b 400 cabbages 2 0.5 20 10 14 7
2014b 400 Carrots 2 0.5 20 10 15 7.5
2014b 400 Eggplant 1 0.25 10 10 9 9
Development of Ngoma irrigation scheme: Feasibility study, EIA, awareness campaign and land
husbandry have been completed for the Ngoma (300ha) irrigation project in Ngoma District. The
project will cover 300ha combining marshland and hillside and will be financed by a grant from
the Japanese Government through JICA.
Development of 500ha of Center Pivot in Kagitumba Valley: Hillside irrigation with a command
area covering 500hectares (in three sections A,B,C) using center pivot has been completed at
Kagitumba. The scheme is under test and production will commence in Season 2015A.
Organization of farmers groups i.e. Water User Associations and farmer cooperatives.
Developing of quick win marshlands: A total of 1250 hectares have been completed under quick
win marshland development program - QWMDPIII - in various Districts throughout the Country.
Farmer mobilization: Farmers’ mobilization was made through farmers’ field visit, community
meetings and Demonstration plots installation. Cooperatives have been organized in meeting
where different ideas were shared with the agriculture extensionists. A total of 6 Farmer field
schools (FFS) were established, (3 at Nasho and 3 at Muvumba irrigation schemes), in
collaboration with farmers so that farmers may learn from their farmer mates.
Compost production from crop residue: Farmers were mobilization to understand the value of
compost made from crop residues. A total of 388 tons of compost was prepared and this will
produce 251.7m3 of fertilizer for the farmers.
Soil Erosion control: A total of 2.7km of gullies which were severely damaged by erosion have
been reclaimed using gabions and stone check dams in the Nasho Irrigation Scheme.
SP1.3. Mechanisation
1. Agricultural Mechanisation Program
Basic Information
Project cost: 1.5 billion RwF
Donor: Government of Rwanda
Government contribution: 100% Government Funded
Implementation starting date: June 2012
Completion date: July 2013
Eventual Extension: Yes
Implementing Agency: RAB/TF Irrigation and Mechanization
Mission and Purpose
The Agricultural Mechanization Program, implemented by the Task Force for Irrigation and
Mechanization, has two key aims:
To disseminate appropriately scaled mechanization options to farmers throughout the
country
To enable access to farm mechanization services through Village Mechanization
Service Centers and any other supply channels
Corn/Maize combine harvester in Ndego/Kayonza District Corn/Maize combine harvester in Ndego/Kayonza District Corn/Maize combine harvester in Ndego/Kayonza District Corn/Maize combine harvester in Ndego/Kayonza District
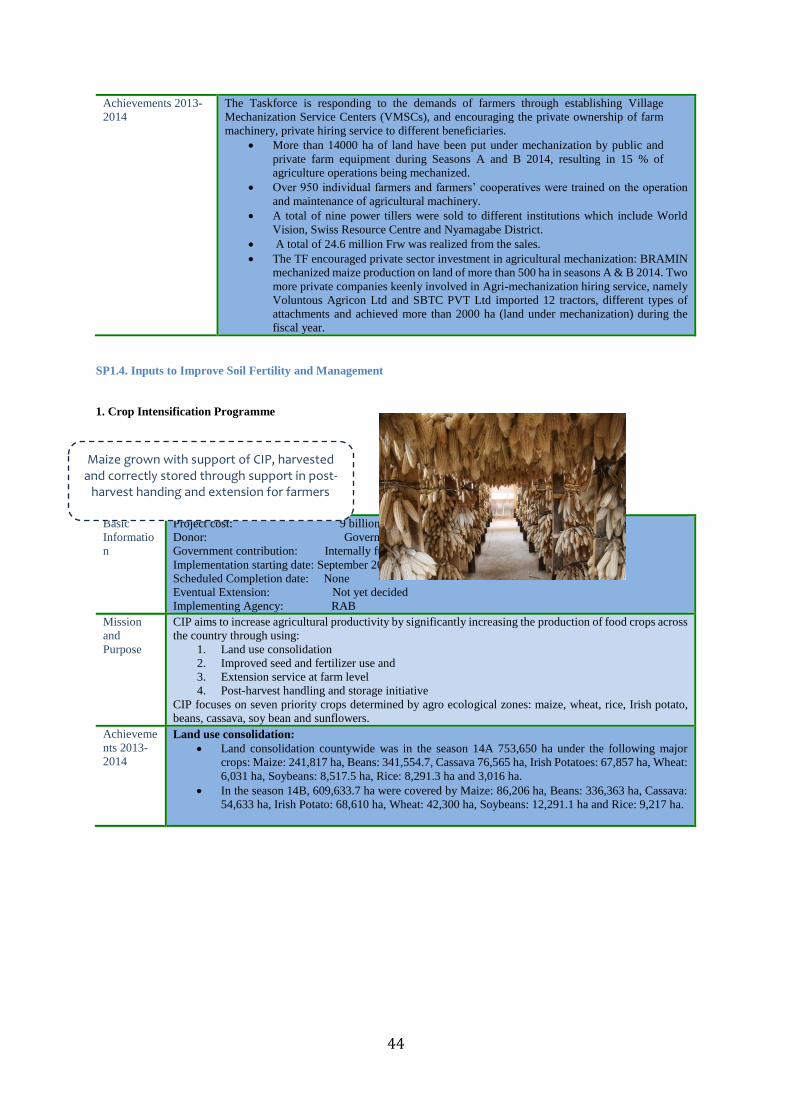
44
Achievements 2013-
2014
The Taskforce is responding to the demands of farmers through establishing Village
Mechanization Service Centers (VMSCs), and encouraging the private ownership of farm
machinery, private hiring service to different beneficiaries.
More than 14000 ha of land have been put under mechanization by public and
private farm equipment during Seasons A and B 2014, resulting in 15 % of
agriculture operations being mechanized.
Over 950 individual farmers and farmers’ cooperatives were trained on the operation
and maintenance of agricultural machinery.
A total of nine power tillers were sold to different institutions which include World
Vision, Swiss Resource Centre and Nyamagabe District.
A total of 24.6 million Frw was realized from the sales.
The TF encouraged private sector investment in agricultural mechanization: BRAMIN
mechanized maize production on land of more than 500 ha in seasons A & B 2014. Two
more private companies keenly involved in Agri-mechanization hiring service, namely
Voluntous Agricon Ltd and SBTC PVT Ltd imported 12 tractors, different types of
attachments and achieved more than 2000 ha (land under mechanization) during the
fiscal year.
SP1.4. Inputs to Improve Soil Fertility and Management
1. Crop Intensification Programme
Basic
Informatio
n
Project cost: 9 billion RWF
Donor: Government of Rwanda
Government contribution: Internally funded project
Implementation starting date: September 2007
Scheduled Completion date: None
Eventual Extension: Not yet decided
Implementing Agency: RAB
Mission
and
Purpose
CIP aims to increase agricultural productivity by significantly increasing the production of food crops across
the country through using:
1. Land use consolidation
2. Improved seed and fertilizer use and
3. Extension service at farm level
4. Post-harvest handling and storage initiative
CIP focuses on seven priority crops determined by agro ecological zones: maize, wheat, rice, Irish potato,
beans, cassava, soy bean and sunflowers.
Achieveme
nts 2013-
2014
Land use consolidation:
Land consolidation countywide was in the season 14A 753,650 ha under the following major
crops: Maize: 241,817 ha, Beans: 341,554.7, Cassava 76,565 ha, Irish Potatoes: 67,857 ha, Wheat:
6,031 ha, Soybeans: 8,517.5 ha, Rice: 8,291.3 ha and 3,016 ha.
In the season 14B, 609,633.7 ha were covered by Maize: 86,206 ha, Beans: 336,363 ha, Cassava:
54,633 ha, Irish Potato: 68,610 ha, Wheat: 42,300 ha, Soybeans: 12,291.1 ha and Rice: 9,217 ha.
Maize grown with support of CIP, harvested and correctly stored through support in post-
harvest handing and extension for farmers Maize grown with support of CIP, harvested
and correctly stored through support in post-harvest handing and extension for farmers
Maize grown with support of CIP, harvested
and correctly stored through support in post-harvest handing and extension for farmers
Maize grown with support of CIP, harvested
and correctly stored through support in post-harvest handing and extension for farmers
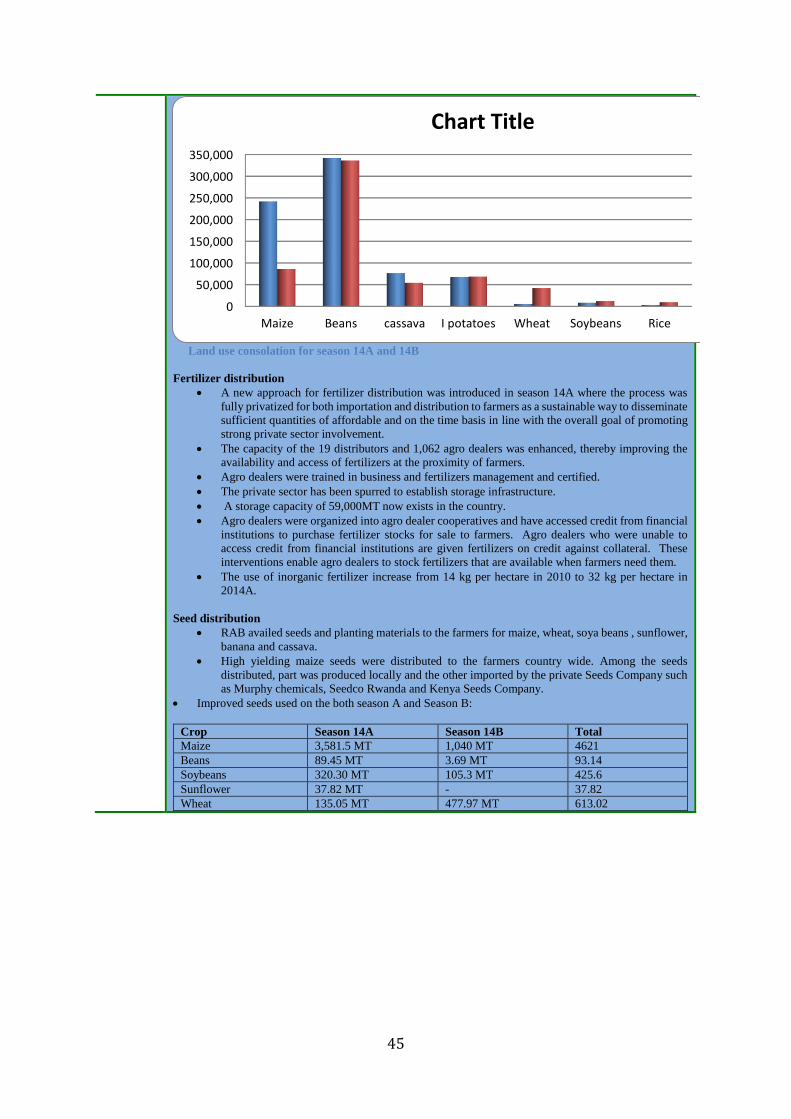
45
Land use consolation for season 14A and 14B
Fertilizer distribution
A new approach for fertilizer distribution was introduced in season 14A where the process was
fully privatized for both importation and distribution to farmers as a sustainable way to disseminate
sufficient quantities of affordable and on the time basis in line with the overall goal of promoting
strong private sector involvement.
The capacity of the 19 distributors and 1,062 agro dealers was enhanced, thereby improving the
availability and access of fertilizers at the proximity of farmers.
Agro dealers were trained in business and fertilizers management and certified.
The private sector has been spurred to establish storage infrastructure.
A storage capacity of 59,000MT now exists in the country.
Agro dealers were organized into agro dealer cooperatives and have accessed credit from financial
institutions to purchase fertilizer stocks for sale to farmers. Agro dealers who were unable to
access credit from financial institutions are given fertilizers on credit against collateral. These
interventions enable agro dealers to stock fertilizers that are available when farmers need them.
The use of inorganic fertilizer increase from 14 kg per hectare in 2010 to 32 kg per hectare in
2014A.
Seed distribution
RAB availed seeds and planting materials to the farmers for maize, wheat, soya beans , sunflower,
banana and cassava.
High yielding maize seeds were distributed to the farmers country wide. Among the seeds
distributed, part was produced locally and the other imported by the private Seeds Company such
as Murphy chemicals, Seedco Rwanda and Kenya Seeds Company.
Improved seeds used on the both season A and Season B:
Crop Season 14A Season 14B Total
Maize 3,581.5 MT 1,040 MT 4621
Beans 89.45 MT 3.69 MT 93.14
Soybeans 320.30 MT 105.3 MT 425.6
Sunflower 37.82 MT - 37.82
Wheat 135.05 MT 477.97 MT 613.02
0
50,000
100,000
150,000
200,000
250,000
300,000
350,000
Maize Beans cassava I potatoes Wheat Soybeans Rice
Chart Title
Season A
Season B

46
2. RSSP III – Rural Sector Support Project
Basic Information
Project cost: 100.9 million USD
Donor: World Bank
Donor contribution: USD 95.9 million
Government contribution: USD 5 million
Implementation starting date: June 20012
Scheduled Completion date: October 2018
Mission and Purpose
RSSP has two main objectives:
Increase agricultural production and marketing in an environmentally sustainable
manner in marshland and hillside areas targeted for development by the project
Strengthen participation of beneficiaries in market based value chains
Achievements
2013-2014
Increased Production through Marshlands and Terracing
Marshland Development: after the completion of Rwagitima extension works (325
ha) towards the end of FY2012-2013, works for Cyili (460ha) and Gacaca (400ha) were
completed during FY13-14. During the same period, the project was able to launch
marshland development works in Rwinkwavu (1,100 ha) and Kilimbi (170), while
procurement for Karangazi dam works which will irrigate 928 ha was completed and
the works are scheduled to start in October 2014.
Marshland Design Studies: Marshlands design studies completed for Mushaduka (200
ha), Mirayi (500 ha) and Kamiranzovu (140 ha). Detailed designs for Rugende (450 ha)
and Nyabirandi (345 ha) and Ndongozi (115 ha) are ongoing.
Soil Conservation: A total of 6,857 ha of hillsides have been sustainably protected
since July 2013. This increased the area sustainably protected to 9,929 ha from the
beginning of the Project. This was done on the hillsides of the following sites: Kirimbi
(Nyamasheke) : 906 ha, Kamiranzovu (Nyamasheke) : 190 ha, Rwagitima (Gatsibo) :
389 ha, Cyili (Huye) : 602.5 ha, Gacaca (Kayonza) : 1,066 ha, Rwinkwavu (Kayonza) :
1,984 ha, Karangazi-Rwangingo : 980.6 ha, Mirayi (Gisagara) : 553 ha, Mushaduka
(Gisagara) : 186 ha
Postharvest infrastructure: to ensure better postharvest handling 8 storages and 35
dryers were completed in Muvumba-8, Rwagitima, Gacaca, and Cyili and Rwinkwavu.
Strengthen Participation of Beneficiaries in Value Chains
Cooperative and WUAs Capacity Building: The Project has supported group
formation, and strengthened Water User Associations (WUAs) and cooperatives to
improve their governance and management capacity to deliver quality services to their
members. Currently, the projects work with 27 cooperatives and 22 WUAs.
Cooperatives were also supported to gain a transparent financial and procurement
management.
Beneficiary Identification: from last year, the number of household beneficiaries
increased from 57,532, to 65,402 (43% are headed by women). This number increases
to 271,534 when we include all household members.
Water User Associations: the project has continued to build capacity of the 22 WUAs
operating in the supported marshlands by strengthening their financial management and
organization skills, and operation and maintenance. Currently 96% of all water uses in
targeted developed marshlands pay water fees. The project has also supported the
The extension of Rwagitima marshland (325ha) in Gatsibo after development in December 2013. The marshland area under rice production is now 900 ha. The extension of Rwagitima marshland (325ha) in Gatsibo after development in December 2013. The marshland area under rice production is now 900 ha. The extension of Rwagitima marshland (325ha) in Gatsibo after development in December 2013. The marshland area under rice production is now 900 ha. The extension of Rwagitima marshland (325ha) in Gatsibo after development in December 2013. The marshland area under rice production is now 900 ha.

47
creation and capacity building of 14 irrigation district steering committee. Their
capacity building focused on roles and responsibilities.
Improving production technologies: 10 cooperatives of rice were supported in seed
production activity. They have all become certified seed producers. Lead farmers from
all supported cooperative members were also trained in IPM, compost making and
improved farming methods.
Training in Value Chain Participation: Beneficiaries were trained in topics including
postharvest management, entrepreneurship and business planning, financial
management, marketing principles, Small Enterprise Management, Strategic
management and procurement procedures. Currently, the share of marketed paddy rice
produce is 77% and 66% for other rain-fed crops. All cooperatives operate under
contract farming.
Financial implementation: the project has executed 99% of its 2013-2014 fiscal year
budget and has disbursed 40.6% of its total budget from the World Bank.
SP1.5. Seed Development
SP1.6. Livestock development
The Rwanda Agriculture Board (RAB) is the primary institution to develop and implement research and extension initiatives
which integrate sustainable crop production, animal
resources and natural resource management. The projects
under this sub-program and others are implemented by
RAB. Further information can be found in the RAB 2013-
2014 Annual Report.
1. GIRINKA – One Cow per Poor Family Program
Basic Information
Project cost: 1,168,063,178 RWF (Annual)
Donor: Government of Rwanda
Government contribution: Internally funded project
Implementation starting date: November 2006
Scheduled Completion date: 2017/18
Eventual Extension: Not yet decided
Implementing Agency: RAB
Mission and Purpose
One Cow Per Poor Family distributes cows to selected poor households and has three primary
objectives:
1. Fight malnutrition through provision of dairy products
2. Increase household income through a productive asset
3. Increase crop productivity through use of manure
Productive milk cows such as the one in the image are given to poor households as assets
Productive milk cows such as the one in the
image are given to poor households as assets
Productive milk cows such as the one in the image are given to poor households as assets
Productive milk cows such as the one in the
image are given to poor households as assets
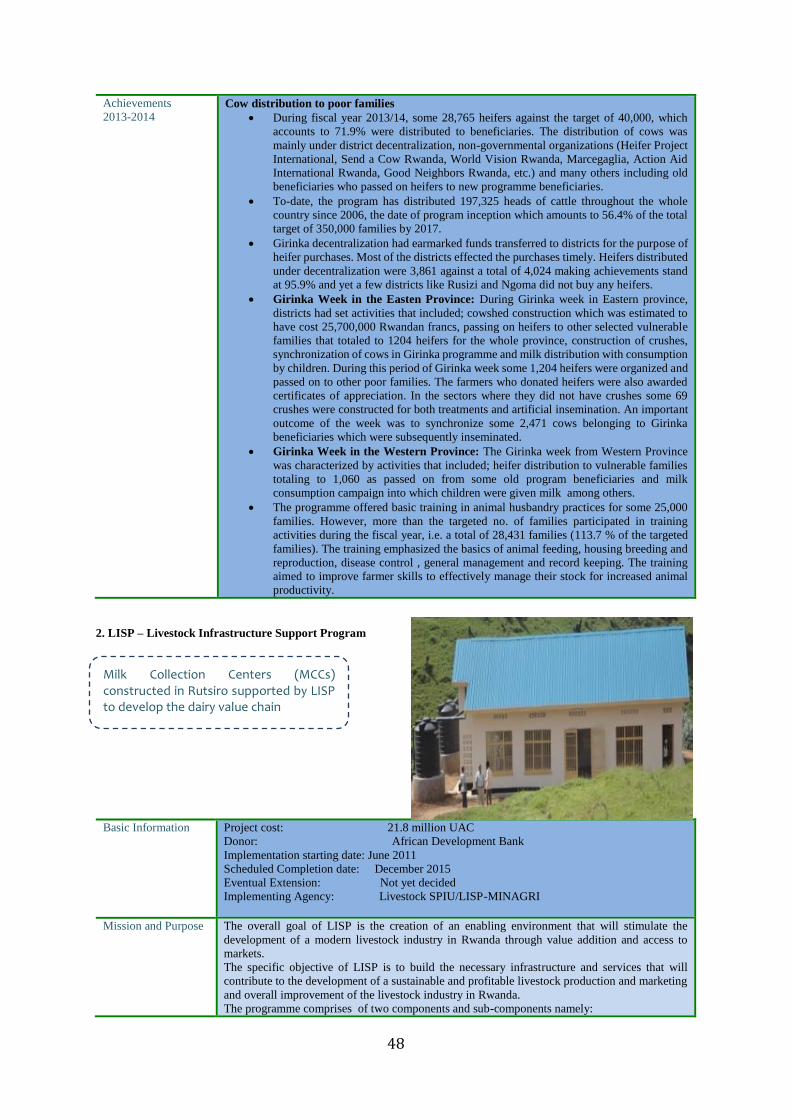
48
Achievements
2013-2014
Cow distribution to poor families
During fiscal year 2013/14, some 28,765 heifers against the target of 40,000, which
accounts to 71.9% were distributed to beneficiaries. The distribution of cows was
mainly under district decentralization, non-governmental organizations (Heifer Project
International, Send a Cow Rwanda, World Vision Rwanda, Marcegaglia, Action Aid
International Rwanda, Good Neighbors Rwanda, etc.) and many others including old
beneficiaries who passed on heifers to new programme beneficiaries.
To-date, the program has distributed 197,325 heads of cattle throughout the whole
country since 2006, the date of program inception which amounts to 56.4% of the total
target of 350,000 families by 2017.
Girinka decentralization had earmarked funds transferred to districts for the purpose of
heifer purchases. Most of the districts effected the purchases timely. Heifers distributed
under decentralization were 3,861 against a total of 4,024 making achievements stand
at 95.9% and yet a few districts like Rusizi and Ngoma did not buy any heifers.
Girinka Week in the Easten Province: During Girinka week in Eastern province,
districts had set activities that included; cowshed construction which was estimated to
have cost 25,700,000 Rwandan francs, passing on heifers to other selected vulnerable
families that totaled to 1204 heifers for the whole province, construction of crushes,
synchronization of cows in Girinka programme and milk distribution with consumption
by children. During this period of Girinka week some 1,204 heifers were organized and
passed on to other poor families. The farmers who donated heifers were also awarded
certificates of appreciation. In the sectors where they did not have crushes some 69
crushes were constructed for both treatments and artificial insemination. An important
outcome of the week was to synchronize some 2,471 cows belonging to Girinka
beneficiaries which were subsequently inseminated.
Girinka Week in the Western Province: The Girinka week from Western Province
was characterized by activities that included; heifer distribution to vulnerable families
totaling to 1,060 as passed on from some old program beneficiaries and milk
consumption campaign into which children were given milk among others.
The programme offered basic training in animal husbandry practices for some 25,000
families. However, more than the targeted no. of families participated in training
activities during the fiscal year, i.e. a total of 28,431 families (113.7 % of the targeted
families). The training emphasized the basics of animal feeding, housing breeding and
reproduction, disease control , general management and record keeping. The training
aimed to improve farmer skills to effectively manage their stock for increased animal
productivity.
2. LISP – Livestock Infrastructure Support Program
Basic Information
Project cost: 21.8 million UAC
Donor: African Development Bank
Implementation starting date: June 2011
Scheduled Completion date: December 2015
Eventual Extension: Not yet decided
Implementing Agency: Livestock SPIU/LISP-MINAGRI
Mission and Purpose
The overall goal of LISP is the creation of an enabling environment that will stimulate the
development of a modern livestock industry in Rwanda through value addition and access to
markets.
The specific objective of LISP is to build the necessary infrastructure and services that will
contribute to the development of a sustainable and profitable livestock production and marketing
and overall improvement of the livestock industry in Rwanda.
The programme comprises of two components and sub-components namely:
Milk Collection Centers (MCCs) constructed in Rutsiro supported by LISP to develop the dairy value chain Milk Collection Centers (MCCs) constructed in Rutsiro supported by LISP to develop the dairy value chain Milk Collection Centers (MCCs) constructed in Rutsiro supported by LISP to develop the dairy value chain Milk Collection Centers (MCCs) constructed in Rutsiro supported by LISP to develop the dairy value chain
49
1. Livestock infrastructure:
1.1. Community livestock infrastructure
1.2. Public livestock infrastructure
2. Food security enhancement and capacity building:
2.1. Support to One Cow per Poor Family
2.2. Support to productivity enhancement technologies
2.3. Capacity building
Achievements
2013-2014
Livestock infrastructure:
Milk collection centers (MCC): 35 milk collection centres were constructed all over
the country and all the equipment was delivered at 100%. The equipment
installation/commissioning activities are on-going (27/35 MCCs, meaning 77%).
During the commissioning the equipment was installed, tested and the training of the
beneficiaries on their operation done.
Livestock watering system (LWS): Overall works progressed at 64%, topographic
surveying done at 100%; excavation works done at 100% (287 km); sensitization
meetings of beneficiaries done at 75%; water tanks completed at 95.65 % (44/46
reservoirs); water intake preparation still at 80%; pipe laying works started 50 km so far
completed. Identification of farm owners is finished on 18/18 networks. List of
beneficiaries and location (Sector, Cell and Village available).
All required WUO committees have been elected (Committees of all 18 identified
networks)
Expropriation work is ongoing as some changes are being made (e.g.. access road,
construction of pressure break structures that were not in study).
Mukamira Dairy: o Construction and supervision of works: Construction works of all blocks are still at
95%. (Administration, factory, canteen and latrine at the finishing level; internal road
construction at the level of laterite compacting). The Contractor (TPGL) stopped
working and left the site since 25/10/2013 following delays in payment.
o About supervision of works: the contract for the supervising firm (ECET) was extended
due to delays in works progress, has now ended. In accordance with the procurement
law and considering the advanced stage of works (95%), a decision was taken to
advertize recruitment of a new supervisor, an individual consultant instead of a firm.
The process is now at the level contract negotiation. Contract not yet signed as the
contractor has suspended.
o For Water Waste Treatment Plant construction, the supplier (Helmet Construction &
IMPALA Trading Ltd) provided equipments’ guaranty and manufacturer’s
authorization on 02/01/2014; contract signed on April,1st 2014.
o Equipment ordered from France and inspection of equipment and materials at the
factory was done. Equipment and materials were shipped from the factory to Mukamira
and are yet to arrive. Civil works are undergoing together with the supervision.
o Construction and supply of Water Tanks: Works carried out up to 98% and the contract
already ended up by 16/09/2013; The contractor (DOUBLE M) was delayed by some
main contractor ‘s incomplete tasks.
o Supply of one Generator: Contract cancelled and contractor notified of the decision on
25/02/2014. Tender document was reviewed, re-advertised, evaluation done and so far
the supplier signed the contract awaiting the client to sign.
2. Research and Technology Transfer, Advisory Services and Professionalization of Farmers
SP2.1. Research and technology transfer
Activities to support sub-programme 2.1 of PSTA III are undertaken by RAB through research and technology generation
under the following fields-
1. Crop and Horticulture Research
2. Natural Resource Management Research
3. Animal Resources Research, and
4. Cross-Cutting Research
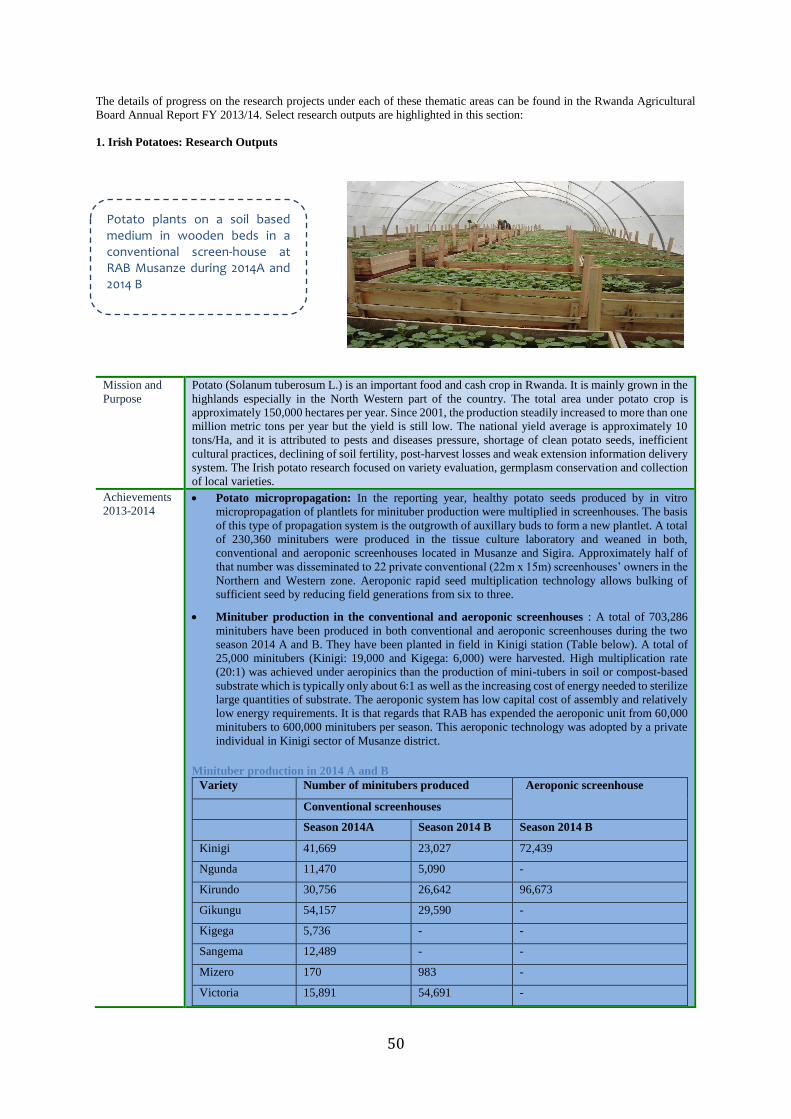
50
The details of progress on the research projects under each of these thematic areas can be found in the Rwanda Agricultural
Board Annual Report FY 2013/14. Select research outputs are highlighted in this section:
1. Irish Potatoes: Research Outputs
Mission and
Purpose
Potato (Solanum tuberosum L.) is an important food and cash crop in Rwanda. It is mainly grown in the
highlands especially in the North Western part of the country. The total area under potato crop is
approximately 150,000 hectares per year. Since 2001, the production steadily increased to more than one
million metric tons per year but the yield is still low. The national yield average is approximately 10
tons/Ha, and it is attributed to pests and diseases pressure, shortage of clean potato seeds, inefficient
cultural practices, declining of soil fertility, post-harvest losses and weak extension information delivery
system. The Irish potato research focused on variety evaluation, germplasm conservation and collection
of local varieties.
Achievements
2013-2014
Potato micropropagation: In the reporting year, healthy potato seeds produced by in vitro
micropropagation of plantlets for minituber production were multiplied in screenhouses. The basis
of this type of propagation system is the outgrowth of auxillary buds to form a new plantlet. A total
of 230,360 minitubers were produced in the tissue culture laboratory and weaned in both,
conventional and aeroponic screenhouses located in Musanze and Sigira. Approximately half of
that number was disseminated to 22 private conventional (22m x 15m) screenhouses’ owners in the
Northern and Western zone. Aeroponic rapid seed multiplication technology allows bulking of
sufficient seed by reducing field generations from six to three.
Minituber production in the conventional and aeroponic screenhouses : A total of 703,286
minitubers have been produced in both conventional and aeroponic screenhouses during the two
season 2014 A and B. They have been planted in field in Kinigi station (Table below). A total of
25,000 minitubers (Kinigi: 19,000 and Kigega: 6,000) were harvested. High multiplication rate
(20:1) was achieved under aeropinics than the production of mini-tubers in soil or compost-based
substrate which is typically only about 6:1 as well as the increasing cost of energy needed to sterilize
large quantities of substrate. The aeroponic system has low capital cost of assembly and relatively
low energy requirements. It is that regards that RAB has expended the aeroponic unit from 60,000
minitubers to 600,000 minitubers per season. This aeroponic technology was adopted by a private
individual in Kinigi sector of Musanze district.
Minituber production in 2014 A and B
Variety Number of minitubers produced Aeroponic screenhouse
Conventional screenhouses
Season 2014A Season 2014 B Season 2014 B
Kinigi 41,669 23,027 72,439
Ngunda 11,470 5,090 -
Kirundo 30,756 26,642 96,673
Gikungu 54,157 29,590 -
Kigega 5,736 - -
Sangema 12,489 - -
Mizero 170 983 -
Victoria 15,891 54,691 -
Potato plants on a soil based medium in wooden beds in a conventional screen-house at RAB Musanze during 2014A and 2014 B Potato plants on a soil based medium in wooden beds in a conventional screen-house at RAB Musanze during 2014A and 2014 B Potato plants on a soil based medium in wooden beds in a conventional screen-house at RAB Musanze during 2014A and 2014 B Potato plants on a soil based medium in wooden beds in a conventional screen-house at RAB Musanze during 2014A and 2014 B

51
Mabondo 8,754 17,153 -
Cruza 2,181 66,653 33,212
Nderera 3,029 - -
393077-54 566 - -
393371-58 20,592 55,225 12,791
391047-34 1,657 - -
Total 209,117 279,054 215,115
In vitro maintenance of potato germplasm: Thirty accessions of potato were conserved in vitro
in test tubes in the growth chamber of the tissue culture laboratory. Within these accessions there
are released varieties and those which are conserved for genebank/bioversity interest.
Agronomic evaluation of newly introduced and popular varieties: The trial was conducted in
Sigira, Kinigi and Tamira RAB stations during 2014B and it aimed to evaluate new Irish potato
cultivars introduced from CIP for field resistance to potato diseases especially late blight. Trials
were established in three different sites at Sigira, Kinigi and Tamira RAB stations. Fourty two new
potato cultivars plus two local checks (Cruza and Victoria) wereevaluated. Fungicide treatment
(Spray vs No spray) was applied. The varieties were CIP 394611.112 and CIP 399074. Twenty
three were the highest yielding at Sigira with 24.1 tons/Ha and 24.5 tons/Ha, respectively. In Kinigi,
CIP 399085.23 and CIP 398208.620 were the best with 22.1 tons/Ha and 28.4 tons/Ha. In Tamira,
the best yielders were CIP 395085.5 (31.7 tons/Ha) and CIP398208.505 (31.3 tons/Ha) under
fungicide protection; and CIP 388615.22 (29.6 tons/Ha) and CIP 391002.6 (28.3 tons/Ha) with no
fungicide protection.
Training on analysis of Fe and Zinc in Potato: A training course on methods of sampling and
preparation of potato and sweet potato for evaluation of Iron and Zinc content by X-ray fluorescence
(XRF) was conducted from 1st-4th April 2014 at Musanze. Twenty-five researchers and technicians
working on potato and sweet potato programs from Ethiopia, Kenya, Malawi, Mozambique, Ghana
and Uganda attended the training conducted by the facilitators from the International Potato Center,
Lima, Peru. After the training, samples from 42 genotypes of newly introduced and popular potato
varieties were processed from RAB Musanze laboratory and they will be sent to Lima, Peru for Iron
and Zinc mineral analysis using XRF machine. The aim was to generate genotype x location data
for micronutrients.
Collection of local potato varieties: A number of 35 local potato varieties were collected in
Western, Northern and Southern provinces (20, 11 and 4 varieties, respectively (Table below).
These varieties were maintained at Kinigi RAB station.
Locally collected potato varieties and their characteristics
Variety Province District Sector Farmers’ description
1.Nyabizi West Nyabihu Jenda High and early yield, good taste, short domancy 1.5 month; susteptible to late blight
2.Mabuno West Nyabihu Jenda Big tubers, good taste, late dormancy (4 months)
3.Magega West Rubavu Kanzenz
e
Medium yield, tolerant to mildew, sensitive to drought, very sensitive to leaf minner
4.Peko West Rubavu Bugeshi High yield, 2.5 months dormancy, resistant to late blight
5.Winyugug
a
West Rubavu Bugeshi High yield, 2 months dormancy, good taste
6.Gisore West Rubavu Bugeshi High yield, resistance to leaf minner, susteptible to drought
7.Sad
(PNAP)
West Rubavu Bugeshi High yield, 3 months dormancy, adaptive to wide range of soils, good taste, adaptive to wide range of soils 3 months dormancy, resistant to late blight
8.Nyirakiga
sire
/Insigarubay
e
West Rubavu Busasa
mana
High yield, good taste, tolerant to bacterial wilt
9.Kuruseke West Rubavu Busasa
mana
High yield, good taste, resistant to drought
10.Nyirakar
ama
West Rubavu Busasa
mana
Low yield, good taste, tolerant to late blight, sensitive to drought

52
11.Pepe West Rubavu Busasa
mana
Goog yield, good taste, susteptible to bacterial wilt
12.Makoron
i
West Rubavu Cyanzar
we
Good yield, good taste, short dormancy
13.Rugero West Karongi Rubeng
era
High yield, big and many tubers, short dormancy
14.Magayan
e
West Karongi Rwanku
ba
Early yielding, good taste, short dormancy (1 month)
15.Gashara/
Nyiraburayi
West Karongi Gitesi Early yield, good taste, short dormancy (1 month)
16.Urusitaz
a
West Karongi Rwanku
ba
Early yield, short domancy 1month
17.Makolon
i
West Karongi Gitesi Early yield, good taste, short dormancy (1 month)
18.Mabuno
ya Bigega
West Ngororero Muhand
a
Big and many tubers, good taste
19.Pepeni West Ngororero Kavumu High yield, long dormancy (3 months)
20.Tindura West Nyabihu Jenda High yield, good taste, resistant to late blight
21.Rwangu
me
North Gicumbi Miyove High and early yield, good taste, good cooking quality, susceptible to bacterial wilt, long dormancy
22.Makerer
e
North Gicumbi Miyove High yield, 3months in field, short dormancy (1 month)
23.Rwansaa
ke
North Gicumbi Kaniga High yield, good taste, 3months in field, dormancy 2 months, tolerant to bacterial wilt, susceptible to late blight
24.Karande North Gicumbi Kaniga Low yield, good taste & cooking quality, 2.5 months in field, many small tubers, short dormancy (1 month), very deep eyes, tolerant to bacterial wilt
25.Rwamati
ya
North Gicumbi Kaniga 2.5 months in field, short dormancy (1 month), tolerant to late blight
26.Makoron
e
North Gicumbi Miyove High yield, good taste, short dormancy (1 months), tolerant to bacterial wilt
27.Nicole North Rulindo Kisaro High yield, nice chips, 3 months in field, long dormancy (3 months), susceptible to late blight
28.Sarpomil
a
North Rulindo Kisaro High yield (40t/Ha), nice chips, highly resistant to late blight, long dormancy (3 months)
29.Mabond
o
North Rulindo Cyungo 2.5 months in field, many small tubers, Short domancy 1 month, tolerant to late blight and bacterial wilt
30.Bineza North Musanze Gatarag
a
High yield, good taste, resistant to late blight,
31.Bucendo
re
North Musanze Cyanika High yield, good taste, long dormancy (4 months), resistant to late blight
32.Mugogo South Nyamaga
be
Gatare Highly resistant to Bacterial wilt, long dormancy 3 months
33.Lokari South Nyamaga
be
Gatare High yield, good taste, highly resistant to late blight, long dormancy (3 months)
34.Montsam
a
South Nyamaga
be
Buruhuk
iro
High yield, many small tubers, 2.5 months in field, very deep eyes
35.Tsimba South Nyamaga
be
Buruhuk
iro
High yield, good taste, short dormancy (1 month), 3 months in field, highly resistant to late blight
2. Sweet Potatoes: Research Outputs

53
Mission and
Purpose
Sweet potato (Ipomoea batatas) is a key staple grown in Rwanda. Therefore, its improvement is
important in addressing food security, better nutrition and improved livelihoods.
Achievements
2013-2014
During the reporting year, sweet potato programme activities were focused on variety development and
promotion. Demonstration plots and fertilization trials were established in various districts to
demonstrate the appropriate agronomic practices. Postharvest storage experiment aimed at extending
root shelf life using zero cooling storage was initiated. New orange flesh sweet potato (OFSP) varieties
from advanced breeding stages were evaluated for postharvest aptitude.
Demonstration plots for new OFSP (Orange Flesh Sweet Potato) Demonstration plots for new OFSP (Orange Flesh Sweet Potato) Demonstration plots for new OFSP (Orange Flesh Sweet Potato) Demonstration plots for new OFSP (Orange Flesh Sweet Potato)

54
Sweet potato germplasm conservation: Conservation of 151 varieties of selected sweet potato
genotypes were maintained at Rubona RAB station. This location has a low virus occurrence and
good weather conditions, hence appropriate for germplasm maintenance. Most of the varieties are
landraces and were collected in various areas of Rwanda while others are exotic and were
introduced for adaptability evaluation.
Variety development for sweet potato: Around 4800 true sweet potato seeds were nursed to raise
clones for sweet potato selection with focus to dual purpose use using accelerating breeding
approach. A total of 452 clones were selected from 31 families for observation yield trial. Particular
attention for selection was put to Sweet Potato Virus Disease (SPVD) tolerance and Beta carotene
content. During this year, advanced and multiplication trials were conducted in Karama, Rubona
and Kibungo. 2000, 2002 and 2005 series were compared to high yielding varieties. OTADA and
2002-134 were the best performing varieties.
Best clones established to enter observational trial: From the 452 clones selected in nursery at
Rubona RAB station, three observation trials were set up in three locations (Karama, Rubona and
Kibungo) for clone selection. Karama and Kibungo low altitude location was chosen for SPVD
screening due to high virus pressure vs the Rubona location where the virus pressure is low with
some sporadic Alternaria incidence when the weather is too humid. A total of 67 clones were
advanced for preliminary yield trial whereby 24 clones were selected from Rubona, 23 from
Karama. Out of 67 clones tested, 24 were characterized by yellow to deep orange fleshed color.
In vitro culturing and multiplication of orange flesh sweet potato varieties: High yielding and
new orange flesh sweet potato (OFSP) varieties with early maturing and rich in vitamin A were
maintained in tissue culture laboratory and screen-house for subsequent multiplication. Between
3,000 to 5,000 healthy plantlets were produced monthly in Rubona lab. After hardening process,
rapid multiplication of planting material was done on station to produce enough cuttings. This
material was used for positive selection in order to get enough clean planting material to avail
enough clean cuttings to the partners. Additional new OFSP (Ndamirabana and Terimbere) with
high dry matter content which were released in 2013 were cleaned at Kenya Plant Health
Inspectorate (KEPHIS), Kenya, and multiplied at Rubona for further promotion to replace
Cacearpedo and Gihangamukungu varieties that succumbed due to SPVD. The new OFSP varieties
had high yield ranging from 20 to 25 tons/Ha with relative tolerance to drought due to heavy
vegetative cover with earlier maturity period of 4-5 months. Supplementary OFSP which included
Naspot 9, Naspot 10, Kakamega-7, Tacna-2, Mafutha-1 and UW 11906, were introduced from
Kenya, Uganda and Mozambique, to enrich the germplasm which were multiplied and evaluated at
Rubona, Kigembe, Karama research stations and on-farm. Additional new OFSP were produced in
vitro and hardened at Rubona RAB station.
Production and dissemination of clean OFSP planting material: During the reported year, high
yielding varieties were disseminated through various partners. A total of 47,250 plantlets were
hardened at Rubona Lab. A total of 2,206,500 cuttings was produced in primary and secondary
multiplication at Rubona, Kigembe and Karama RAB stations using Rapid Multiplication
Techniques and Tunnels. Yield assessment through demonstration plots for new OFSP was
conducted in various districts. Farmers use the tunnels and positive selection technology to produce
vines for sale. For instance, in Kamonyi district, UDI, the local NGO, has sold 300,000 cuttings for
900,000 frw for season 2014A.
Development of OFSP processed product: Four new OFSP varieties out of the six identified for
processing were tested for sensory evaluation of baked products. This included the following
varieties: 2560 (Terimbere), 2910 (Ndamirabana), Naspot 9, and Naspot 10. They were tested in
biscuit preparation for the following parameters: biscuits aroma, texture, color, flavor and overall
acceptability. For bread, aroma, texture (crumb), crust colour, crumb color, flavor, crumb cellular
structure and overall acceptability were tested. Preliminary results showed that all the 4 varieties
tested were good for use as bakery products. Test preparation of OFSP juice took place at Sina
Gerald enterprise (Nyirangarama, Northern Rwanda). The protocol was as following: OFSP
branding with pineapple and pure OFSP juice. These two categories of OFSP juice plus Agashya
Pineapple and Inyange Pineapple were used during the sensory test. Gihingamukungu variety was
used for making juice based on its characteristic of having low dry matter content. In total, 952
consumers were interviewed across Rulindo, Gakenke, Musanze, Muhanga and Kigali city. The
results showed that the juice from Gihingamukungu was well accepted by the consumers. In
collaboration with Imbaraga Federation syndicates, farmers’ groups in Gakenke district produce
OFSP doughnut for the local markets. The groups process about 500 to 600 Kg of sweet potatoes
per week for production of sweet potato doughnuts and crisps. The zero cooling storage for fresh
root conservation was conducted in Muhanga and equipments were brought to start assessment for

55
storage of fresh roots. The control of temperature inside the zero cooling storage was stabilized
from 14 to 15oC which is already a good indication for fresh root shelflife extension. The four OFSP
varieties under promotion were evaluated and preliminary results are promising.
Multiplication of nutrient-rich yam Bean (Pachyrhizus spp.: Yam bean (Pachirhizus spp)
research aimed at variety evaluation for adaptability and acceptability. Most the activities have been
supported by the International Potato Center (CIP) through Sweetpotato Action for Security and
Health in Africa (SASHA) and Enhancing the nutrient-rich Yam Bean. Released accessions were
cleaned in collaboration with KEPHIS, Kenya, and multiplied through in vitro facilities for
promotion in various districts. Yam bean accessions have been multiplied and maintained at
Karama and Rubona RAB stations. New hybrid lines were evaluated in F3 segregating populations
for early maturity.
3. Soybeans: Research Outputs
Mission and
Purpose
Soybean is one of the six priority crops under the Crop Intensification Program (CIP) for Rwanda. There
is need to focus on selection and breeding of high yielding soy bean varieties to achieve 3.5 tons per Ha
potential.
Achievements
2013-2014
This year, consolidated land for soy bean grain production has increased from 5,720 to 19,011.9 Ha
while the production has significantly increased in last two years from 0.8 to 1.5 tons per Ha.
Soy bean genotype adaptability evaluation: Research trials were conducted at Rubona,
Nyagatare, Muhanga, Ngoma and Karama RAB stations to evaluate 19 soy bean genotypes sourced
from Zimbabwe. Ten genotypes had a maturity period greater than 120 days (123-135) while the
rest was between 105 and 119 days. The first category with more than 120 days was considered as
late maturing and the second category ranging between 100 and 120 days was classified as medium
maturing genotypes. Late maturing genotypes include S 1023/5/23, S 1025/5/40, S 1025/5/52, S
1021/5/14, S 1023/5/52, S 1023/5/21, and S953/6/8. Medium maturing genotypes include the check
Peka 6, SC Sepa, SC Status, SC Sequel, SC Safari, S 822/6/13, S 823/6/16, SC Sequel, SC Saga
and SC Serenade. For growth characteristics, 12 genotypes were indeterminate while 7 varieties
were determinate. Most of indeterminate genotypes were also late maturing. Pod clearance of
indeterminate varieties was also very high. Data collected from the trial showed significant and
highly significant differences among genotypes for pod load and pod clearance. Significant
differences were recorded between the varieties for grain yield. SC Saga has the highest yield of
3708 kg/Ha followed by S 822/6/13, SC Squire, SC Sepa, S823/6/16, SC Sequel and SC 1023/5/23.
The third category included 11 genotypes with an average grain yield of 2378-2689 kg/Ha. The last
category (less than 100 days) consisting of one genotype S1023/5/52 with a grain yield of 1617
kg/Ha. The varieties SC Squire and SC Saga showed excellent tolerance to rust. SC Sepa, SC Safari,
SC Status, S 822/6/13, S 823/6/16 and S 1023/5/23 had good tolerance to the disease while SC
Serenade was very susceptible to rust. No important symptoms of bacteria pustules were observed
in the trial. In general, mosaic virus disease symptoms were observed in the whole trial but with
fewer incidences. No any genotype among them was shattering or lodging in all sites.
Farmers training on soybean production Farmers training on soybean production Farmers training on soybean production Farmers training on soybean production
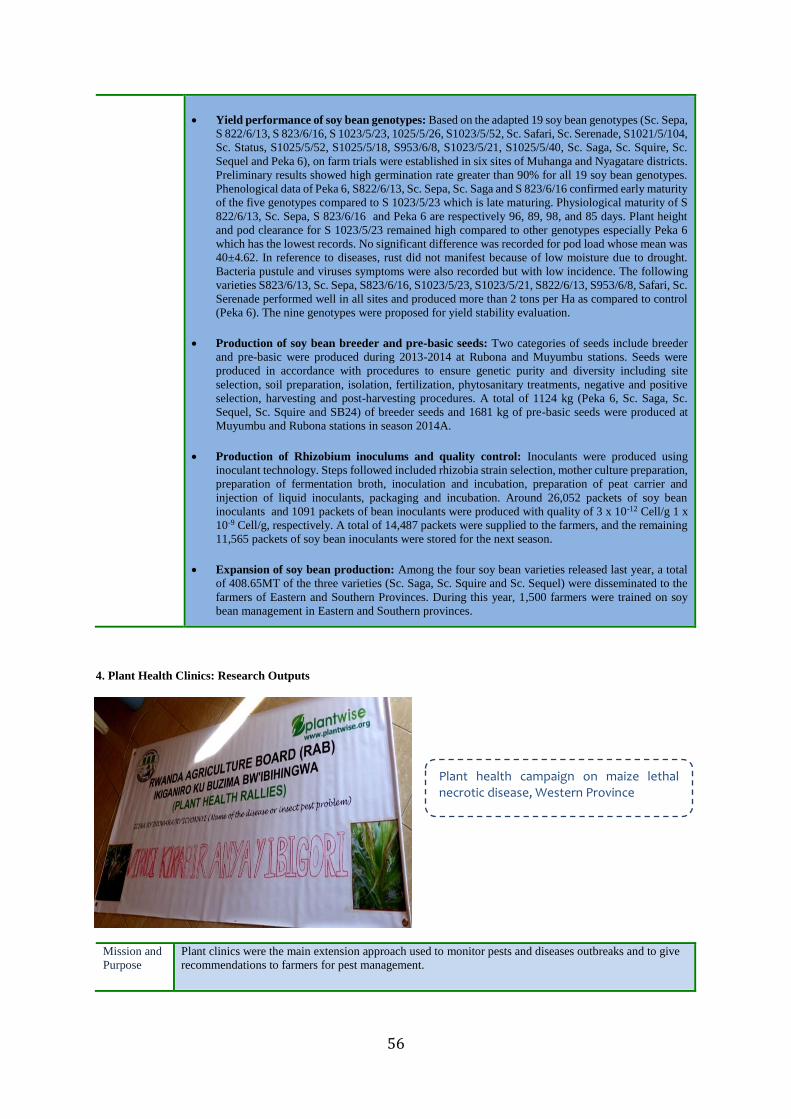
56
Yield performance of soy bean genotypes: Based on the adapted 19 soy bean genotypes (Sc. Sepa,
S 822/6/13, S 823/6/16, S 1023/5/23, 1025/5/26, S1023/5/52, Sc. Safari, Sc. Serenade, S1021/5/104,
Sc. Status, S1025/5/52, S1025/5/18, S953/6/8, S1023/5/21, S1025/5/40, Sc. Saga, Sc. Squire, Sc.
Sequel and Peka 6), on farm trials were established in six sites of Muhanga and Nyagatare districts.
Preliminary results showed high germination rate greater than 90% for all 19 soy bean genotypes.
Phenological data of Peka 6, S822/6/13, Sc. Sepa, Sc. Saga and S 823/6/16 confirmed early maturity
of the five genotypes compared to S 1023/5/23 which is late maturing. Physiological maturity of S
822/6/13, Sc. Sepa, S 823/6/16 and Peka 6 are respectively 96, 89, 98, and 85 days. Plant height
and pod clearance for S 1023/5/23 remained high compared to other genotypes especially Peka 6
which has the lowest records. No significant difference was recorded for pod load whose mean was
40±4.62. In reference to diseases, rust did not manifest because of low moisture due to drought.
Bacteria pustule and viruses symptoms were also recorded but with low incidence. The following
varieties S823/6/13, Sc. Sepa, S823/6/16, S1023/5/23, S1023/5/21, S822/6/13, S953/6/8, Safari, Sc.
Serenade performed well in all sites and produced more than 2 tons per Ha as compared to control
(Peka 6). The nine genotypes were proposed for yield stability evaluation.
Production of soy bean breeder and pre-basic seeds: Two categories of seeds include breeder
and pre-basic were produced during 2013-2014 at Rubona and Muyumbu stations. Seeds were
produced in accordance with procedures to ensure genetic purity and diversity including site
selection, soil preparation, isolation, fertilization, phytosanitary treatments, negative and positive
selection, harvesting and post-harvesting procedures. A total of 1124 kg (Peka 6, Sc. Saga, Sc.
Sequel, Sc. Squire and SB24) of breeder seeds and 1681 kg of pre-basic seeds were produced at
Muyumbu and Rubona stations in season 2014A.
Production of Rhizobium inoculums and quality control: Inoculants were produced using
inoculant technology. Steps followed included rhizobia strain selection, mother culture preparation,
preparation of fermentation broth, inoculation and incubation, preparation of peat carrier and
injection of liquid inoculants, packaging and incubation. Around 26,052 packets of soy bean
inoculants and 1091 packets of bean inoculants were produced with quality of 3 x 10-12 Cell/g 1 x
10-9 Cell/g, respectively. A total of 14,487 packets were supplied to the farmers, and the remaining
11,565 packets of soy bean inoculants were stored for the next season.
Expansion of soy bean production: Among the four soy bean varieties released last year, a total
of 408.65MT of the three varieties (Sc. Saga, Sc. Squire and Sc. Sequel) were disseminated to the
farmers of Eastern and Southern Provinces. During this year, 1,500 farmers were trained on soy
bean management in Eastern and Southern provinces.
4. Plant Health Clinics: Research Outputs
Mission and
Purpose
Plant clinics were the main extension approach used to monitor pests and diseases outbreaks and to give
recommendations to farmers for pest management.
Plant health campaign on maize lethal necrotic disease, Western Province Plant health campaign on maize lethal necrotic disease, Western Province Plant health campaign on maize lethal necrotic disease, Western Province Plant health campaign on maize lethal necrotic disease, Western Province

57
Achievement
s
2013-2014
About 60 new plant doctors from RAB and local leaders were trained to support the running of plant
clinics
The major pests and diseases identified in plant clinics are shown in the Table below.
Main pest and diseases detected in plant clinics
Type of plant Pest or disease
Bean Aphids, anthracnose
Cabbage Bacterial disease, aphids
Cassava Cassava mosaic disease, mites
Citrus Leaf spot, virus
Cucumber Virus
or Coffee Rust
Egg plant Alternaria, insect
Sweet pepper Fungus
Guava Unidentified
Irish potato Late bright, bacterial wilt
Maize Stalk borer, maize streak virus, maize lethal necrotic
disease
Mango Anthracnose, insect
Sweet potato Insect
Tamarillo Virus
Tomato Virus
In order to complete plant clinic activities, plant health campaigns were organized in Western
Province and focused specifically on maize lethal necrotic disease, which is becoming big challenge
to maize production. A total of 30 rallies were conducted in four different Districts such as Ngororero,
Rutsiro, Karongi and Rubavu. Factsheets on the disease symptoms and control were developed and
distributed during plant health campaigns to 3,835 farmers.
The Table below summarizes the distribution and location of Plant Health Clinics in Rwanda:
Distribution and location of plant clinics
N Zone District Sector Site Running days
1 East Kayonza Mukarange Mukarange 4th Friday of month
2 East Kayonza Kabare Cyarubare 3rd Wednesday of month
3 East Ngoma Kibungo Giturusu 2nd Tuesdys of month
4 East Ngoma Rukira Rukira 2nd Thursday of month
5 East Ngoma Mutenderi Mutenderi Every Monday
6 East Gastibo Kiramuruzi Kiramuruzi 2nd Tuesday of month
7 East Gastibo Rugarama Rwagitima 4th Wednesday of month
8 East Bugesera Juru Kabukuba 1st Monday of month
9 East Bugesera Rweru Batima 1st Tuesday of month
1
0
East Bugesera Ruhuha Ruhuha 4th Tuesday of month
1
1
East Kirehe Nasho Nasho 2nd Friday of month
1
2
East Kirehe Nyarubuye Nyarubuye/C
CI
2nd Wednesday of month
1
3
East Rwamagan
a
Nzige Nzige Every Tuesday
1
4
East Rwamagan
a
Gahengeri Gahengeri 2nd and 4th Tuesdays of month
1
5
East Nyagatare Nyagatare Nyagatare 4th Thursday of the month
1
6
East Nyagatare Matimba Kagitumba 2nd Wednesday of the month
1
7
Kigali
City
Kicukiro Masaka Kabuga 2nd Friday of the month
1
8
Kigali
City
Kicukiro Masaka Rusheshe 4th Friday of the month
1
9
Kigali
City
Nyarugeng
e
Mageragere Nyarurenzi 3rd Friday of the month
2
0
West Rubavu Kanama Mahoko 4th Tuesday of month

58
2
1
West Rutsiro Gihango Congo Nile 2nd & 4th Fridays of month
2
2
West Nyamashek
e
Kanjongo Kirambo 2nd and 4th Thursdays of month
2
3
West Rusizi Nkungu Kiziguro 4th Thursday of month
2
4
West Rusizi Bugarama Market 1st and 3rd Monday of month
2
5
West Karongi Rugabano Rugabano 2nd & 4th Fridays of month
2
6
West Karongi Rubengera Rubengera 1st & 3rd Wednesdays of month
2
7
West Ngororero Ngororero Ngororero 2nd and 4th Wednesday of
month
2
8
West Ngororero Nyange Nyange 2nd and 4th Wednesday of
month
2
9
West Nyabihu Shyira Vunga Every Wednesday
3
0
West Nyabihu Bigogwe Kora Market 1st & 3rd Wednesdays of month
3
1
South Ruhango Byimana Ntenyo 3rd Thursday of month
3
2
South Gisagara Ndora Ndora 3rd Wednesday of month
3
3
South Huye Rusatira Kinkanga 1st Wednesday of month
3
4
South Huye Rusatira Kimuna 1st and 3rd Tuesday of month
3
5
South Huye Kigoma Karambi 2nd and 4th Wednesday of
month
3
6
South Nyamagabe Tare Gasarenda 1st and 3rd Tuesday of month
3
7
South Nyanza Rwabicuma Rwabicuma 2nd Thursday of month
3
8
South Kamonyi Runda Nkoto 4th Wednesday of month
3
9
South Kamonyi Mugina Mugina 4th Thursday of month
4
0
South Nyaruguru Kibeho Ndago 1st and 4th Wednesday of
tmonth
4
1
South Nyaruguru Rusenge Rugarika 2nd and 4th Thursdays of
month
4
2
South Muhanga Shyogwe Kinini 1st and 4th Friday of month
4
3
North Musanze Busogo Byangabo 1st & 3rd Tuesdays of month
4
4
North Musanze Gashaki Gaheru 1st and 4th Friday of month
4
5
North Gakenke Gakenke market 2nd & 4th Tuesdys of month
4
6
North Gakenke Ruli Ruli 1st & 3rd Tuesdays of month
4
7
North Gakenke Janja Murambo 2nd and 4th Thursday
4
8
North Gicumbi Miyove Miyove 1st & 3rd Wednesdays of month
4
9
North Gicumbi Rutare Rutare 2nd and 4th Wednesday of
month
5
0
North Burera Rugarama Rugarama 2nd & 4th Wednesdays of
month
5
1
North Burera Butaro Butaro 1st and 3rd Friday of month
5
2
North Burera Ruhunde/Nem
ba
Gitanga 2nd and 4th Fridayday of month

59
5
3
North Rurindo Base Base 2nd and 4th Wednesdays
5
4
North Rulindo Buyoga 2nd and 4th Thursday
5
5
North Rulindo Cyungo Buyoga 1st & 3rd Thursdays of month
5. Cassava: Research Outputs
Mission and
Purpose
Cassava (Manihot esculenta Crantz) is a key food security staple in Rwanda. It is the second most
important food crop in the country in term of production after banana.
Achievements
2013-2014
The main agro-ecological zones for cassava are Mayaga, Bugesera and Imbo. There is growing interest
for commercial cassava growing because of its relatively good tolerance to drought and poor soils.
However, the production was compromised by cassava mosaic virus disease (CMD) and Cassava brown
streak disease (CBSD). Both viruses are spread via infected cuttings and white flies (Bemisia tabaci).
The disease management is focused on the development of resistant or tolerant cassava varieties, seed
field inspection and promotion of clean planting material. The Cassava Program activities during the
2013-2014 fiscal year were: introduction of new cassava clones/plantlets from KEPHIS, Kenya, (8
clones) and IITA, Nigeria, (28 clones), harvest of on-station and on-farm trials (during 2013A) in Eastern
Province (Bugesera, Kayonza and Rwamagana Districts), Southern Province (Kamonyi, Muhanga,
Ruhango, Nyanza and Huye Districts), Northern Province (Gakenke District) and in Western Province
during 2013B (Karongi and Rutsiro Districts), national survey on cassava diseases, establishment of
cassava germplasm in Rubona, Muhanga and Ntendezi RAB Stations.
Introduction of new cassava clones from KEPHIS and IITA: In order to increase genetic diversity to
fight against CMD and CBSD, eight new cassava clones were introduced from KEPHIS, Kenya. These
clones are: MM06/0138, MM06/0074, MM06/0143, MM06/0139, MM06/0046, MM06/0082,
MM06/0083 and MM06/0013. They were placed in Rubona tissue culture laboratory for multiplication.
Total number of plantlets was 400 (50 per clone). The clone MM06/0074 is currently under acclimatation
at greenhouse stage (17 plants), and 50 plants of the same clone were planted in field from the earlier
introduction from KEPHIS.
Harvest of on-station trials: The nursery trial with 2,000 true cassava seeds from 25 families was
evaluated during 2013A at Karama RAB station. The 398 best clones were selected for clonal evaluation
at Karama and Rubona RAB stations during 2014A.The Preliminary Yield Trial with 26 clones was
established in 2013A season at Karama and Rubona RAB stations. After harvesting, 20 clones were
identified for Advanced Yield Trial (AYT) at Karama, Nyagatare and Rubona RAB Stations.
Cassava disease survey: In July-August 2013, a survey was carried out in order to assess the current
status of CMD and CBSD in 67 young and 70 old farmers’ fields in a total of 7 cassava-growing Districts,
including: Bugesera, Kayonza, Kirehe and Nyagatare (Eastern Province), Gisagara, Nyanza and
Ruhango (Southern Province). The preliminary results showed that the severity of the CBS disease has
medium in the majority of the visited farms and high in relatively few farms (Figure _). During the year
2013-2014, Cassava program has produced pre-basic and basic seeds for further multiplication. A total
New cassava clones in tissue culture laboratory New cassava clones in tissue culture laboratory New cassava clones in tissue culture laboratory New cassava clones in tissue culture laboratory

60
of 57,000 cuttings of prebasic seeds were produced and given to service providers for further
multiplication in order to increase the quantity of available cuttings. A total of 115,500 cuttings of basic
seeds produced and disseminated to partners and NGO’s.
Other activities: Awareness campaigns about major cassava diseases and their management were
organized through radio talk shows at Community Radio Huye, and the talk show has been availed for
further dissemination as a CD.The farmer communities near Kinazi (Ruhango district) were facilitated
to access cassava cuttings, and there was increased cassava yield that was supplied to Kinazi Cassava
Plant.
SP 2.2.: Extension and Proximity Services for Producers
1. Support to SPAT II
Basic Information
Project cost: 18.6 million Euros
Donor: BTC
Government contribution: 620 thousand Euros
Implementation starting date: July 2011
Scheduled Completion date: 2016
Eventual extension: Not yet decided
Implementing agency: RAB and CICA
Mission and Purpose
The project’s goals it to increase agricultural outputs and incomes through sustainable
production systems for all groups of farmers, and to ensure food security. The specific objective
is improved access to advisory services for crops and livestock, and improved access to and use
of high quality food crop planting materials for men and women.
Severity of Cassava Brown Streak Disease (CBSD) Severity of Cassava Brown Streak Disease (CBSD) Severity of Cassava Brown Streak Disease (CBSD) Severity of Cassava Brown Streak Disease (CBSD)

61
Achievements
2013-2014
Main
Components
Outputs achieved
FY2013/14
Comments on the achievement
Support to
seed
266.54 Ha of basic
and pre-basic seed
under production in
RAB stations
27 seed staff trained
Training in MLND disease identification and
control and FFS group formulation
15 groups identified and formed trained using
FFS approach.
17 screen houses owners assisted practically in
the field on technical and business aspects
166 active seed
multipliers Trained in land preparation, crop management,
pest and disease control, soil fertilization,
spacing, seed law, seed inspection, post-harvest
handling.
Business training in: cost analysis, record
keeping, TIN registration and seed marketing.
92 private multipliers
assisted Assistance through business plans, cost analysis,
credit information, book keeping and recordings
- 425 accessions
collected,
- 53 accessions
collected and
stored,
- 110 accessions
characterized
- 216 accessions
conserved
Support to
advisory
services
65 varieties were
identified and tested
for various crops
Tested Varieties include:
5 varieties of rice,
13varieties of potato,
12 varieties of banana,
4 varieties of cassava,
12 varieties of maize,
5 varieties of tomatoes,
2 varieties of tamarillo,
1 variety of maracuja
4 varieties of Soya bean, and
12 varieties of forages
28 stakeholder
meetings held Meetings with local leaders about FFS and
BXW control through CMC
8 gap analysis The commodities concerned are wheat,
common bean, ,soybean, vegetables and
livestock
- 8 ToT sessions
held
- 1036 new FFS
groups formed
- 26021 more
farmers were
involved in FFS
activities
- 131,708 more
farmers were
involved in
CMC activities
- 45 MMT
trainees were
trained
- 2 crops with
positive
selection for
seed production
1 ToT for Livestock, 3 ToT on Wheat, 2 ToT on
Soybean, 1 ToT on Common beans and 1 ToT
on vegetables
FFS group established on new commodities
such as livestock, soybean wheat and common
beans.
Farmers involved in CMC banana rehabilitation
and BXW are 211780, farmers involved in CMC
maize are 3019 and on CMC striga management
farmers involved are 23344.
45 MTT are trained and conducted the ToT on
various commodities (crops & Livestock) and
also not yet graduated.
3966 farmers on potato have been involved in
positive selection and 50 farmers on tamarillo
One study tour for 236 facilitators on banana
from Musanze to Ngoma district, 37facilitators
on striga management from different districts of
Southern province to Kamonyi on striga

62
- 3 study tours of
FFS groups
management and banana and 109 facilitators on
tamarillo participated in a study tour on
tamarillo at Rwamagana.
- 4
Extension
materials
produced
- 3 issues of
Hinga
Worora
- 402
agriculture
related
articles
have been
published
15,000 copies on Climbing beans
5,000 Copies on Climbing beans
2,000 copies on Pigs
2,000 copies on Poultry
2 extension materials are being designed;
Passion fruits and soya bean
3 extension materials are being printed
Hinga Worora Issues no. 31, 32 and 33 have
been distributed
Articles have been published by local and
international media and have been shared with
MINAGRI management team and other partners
1 training session Training on AMIS website functional system.
1026 clients of CICA
library trained
Reading materials
distributed
Library maintained
The clients have been trained on Library
software
647 of newspapers (403 Imvaho nshya, 310
NewTimes, 4 East Africa business week),
Official Gazette and 60 magazines (52 Jeunes
Afriques, 4 The Economist, 4 Times) distributed
Final reception of the works of partition of
CICA Library. The
work stations have been delivered and the
barcode scanners have been delivered too.
812 Archives received are Classified.
3 websites of AMIS
and Minagri were
improved and
Noz'Ubz farmers
website is
operational, and
feeding the content
continues
119 new issues collected and uploaded in both
MINAGRI and AMIS 381
Questions / inputs raised and answered through
hotlines channel, Upload is done as sooner as
information is available.
MINAGRI upgrading website is done up to
100%
AMIS Upgrading activities are done up to 100%
Development of farmers website related
activities done up to 100% ,
Uploading content 56.2 %
3. Value chain development and private sector investment
SP3.2. Development of food crops
1. Banana Programme
The banana program increases productivity, production and management of bananas
The banana program increases productivity,
production and management of bananas The banana program increases productivity,
production and management of bananas The banana program increases productivity,
production and management of bananas
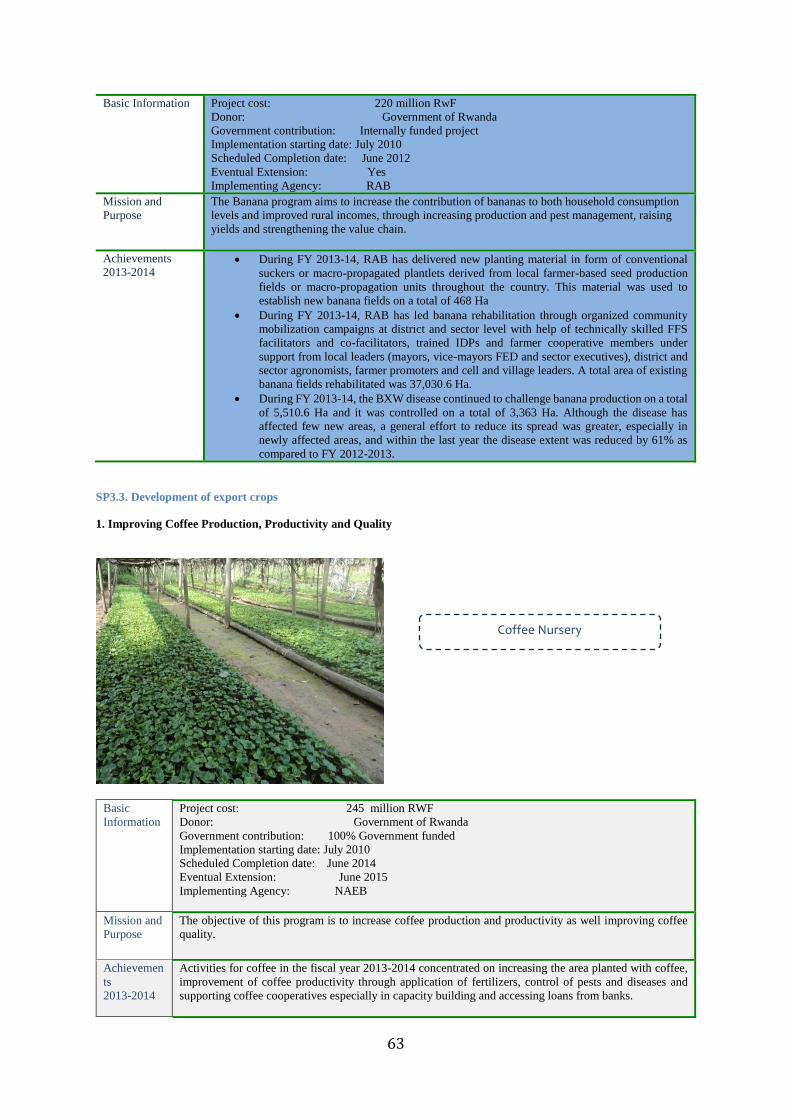
63
Basic Information
Project cost: 220 million RwF
Donor: Government of Rwanda
Government contribution: Internally funded project
Implementation starting date: July 2010
Scheduled Completion date: June 2012
Eventual Extension: Yes
Implementing Agency: RAB
Mission and
Purpose
The Banana program aims to increase the contribution of bananas to both household consumption
levels and improved rural incomes, through increasing production and pest management, raising
yields and strengthening the value chain.
Achievements
2013-2014
During FY 2013-14, RAB has delivered new planting material in form of conventional
suckers or macro-propagated plantlets derived from local farmer-based seed production
fields or macro-propagation units throughout the country. This material was used to
establish new banana fields on a total of 468 Ha
During FY 2013-14, RAB has led banana rehabilitation through organized community
mobilization campaigns at district and sector level with help of technically skilled FFS
facilitators and co-facilitators, trained IDPs and farmer cooperative members under
support from local leaders (mayors, vice-mayors FED and sector executives), district and
sector agronomists, farmer promoters and cell and village leaders. A total area of existing
banana fields rehabilitated was 37,030.6 Ha.
During FY 2013-14, the BXW disease continued to challenge banana production on a total
of 5,510.6 Ha and it was controlled on a total of 3,363 Ha. Although the disease has
affected few new areas, a general effort to reduce its spread was greater, especially in
newly affected areas, and within the last year the disease extent was reduced by 61% as
compared to FY 2012-2013.
SP3.3. Development of export crops
1. Improving Coffee Production, Productivity and Quality
Basic
Information
Project cost: 245 million RWF
Donor: Government of Rwanda
Government contribution: 100% Government funded
Implementation starting date: July 2010
Scheduled Completion date: June 2014
Eventual Extension: June 2015
Implementing Agency: NAEB
Mission and
Purpose
The objective of this program is to increase coffee production and productivity as well improving coffee
quality.
Achievemen
ts
2013-2014
Activities for coffee in the fiscal year 2013-2014 concentrated on increasing the area planted with coffee,
improvement of coffee productivity through application of fertilizers, control of pests and diseases and
supporting coffee cooperatives especially in capacity building and accessing loans from banks.
Coffee Nursery
Coffee Nursery
Coffee Nursery
Coffee Nursery
64
Increased Coffee Production Area:
Planting: A total of 24,058,622 seedlings were prepared. Out of a target of 10,000ha, 9,166 ha
were planted which is equivalent to 92% of the target. 8,625,000 seedlings were also prepared
for 2014-2015 fiscal year; they are currently under nursery beds.
The table shows planting patterns.
Planted area in the different Provinces
Province Target area
(ha)
Available
seedlings
Planted area (ha) % planted vs target
NAEB
East 3,512 7,017,498 2,713 77
South 2,422 6,669,430 2,525 104
West 2,376 6,110,090 2,238 94
North 1,664 4,189,947 1,661 100
Kigali City 26 71,657 28 109
Total 10,000 24,058,622 9,166 92
Increased Productivity of Coffee Plantations:
Fertiliser Application: During the season 2014 A&B, 3,300 tons were applied up to June 2014,
representing 106.4% of the target (3,100 tons). The distribution of fertilizers was done by 222
coffee washing stations out of 225 located across the country.
The table shows the mineral fertilizer application by Province.
Mineral fertilizer distribution and application in 2014 A&B
Province Target Total applied A&B
Eastern 562 512
Northern /Kigali City 361 417
Western 1,183 1,142
Southern 994 1,226
Total 3,100 3,300
Application of mineral fertilizer was supplemented by organic fertilizer produced from coffee
pulps. In total 7,876 tons was applied and this corresponded to 94% of the national target (8,420
tons). 200 coffee washing stations were involved in the production and application of organic
fertilizer.
The table shows the organic fertilizer application by Province.
Organic fertilizer production and application
Provinces Organic fertilizer
produced (T)
Organic fertilizer
Applied (T)
CWS involved
West 3,693 3,693 83
South 1,736 1,580 62
East 1,738 1,705 35
North and KC 898 898 20
Total 8,065 7,876 200
Pest and Disease Control:
NAEB assisted farmers to control pests and diseases in different locations where infestations occurred. The
major pest and diseases for coffee in Rwanda are antestia, coffee berry borer, and coffee leaf rust and coffee
berry disease.
For efficient control of antestia bug , imidacloprid and pyrethrum insecticides were applied. 6,359 litres of
imidacloprid and 202 litres of pyrethrum insecticides, 2,700 kg of copper oxychloride fungicides were

65
applied in coffee plantations for the control of antestia bug, coffee leaf rust and coffee berry disease
respectively.
Cooperative development and capacity building:
A study on cooperatives capacity building and training needs was conducted and presented to NAEB Staff.
The survey report on cooperatives status in terms of levels of management and governance was discussed
by NAEB in conjunction with RCA and recommendations were given.
More than 30 cooperatives received trainings in good governance, good agricultural practices and in
certification and verification through different funded projects in the Coffee Division.
Coffee Production and Export 2013-2014:
From July 2013 to June 2014, a production of 17,976 tons of green coffee and export volumes
of 17,827 tons that generated 47,488,081 USD were registered (Table below). However at the
end of June 2014, there was additional 5,000 tons of green coffee which was still in the different
warehouses outside NAEB and which is not recorded in the 17,976 tons.
Coffee Type 2012-2013 (kg) 2013-2014 (kg) % change
Fully washed 7,082,547 6,185,810 -13%
Semi washed 11,483,880 8,931,100 -22%
Triage 2,376,766 2,646,653 11%
Robusta 256,600 211,944 -17%
Total 21,199,793 17,975,507 -15%
Export Promotion: Marketing was a success in promoting quality and the year was
characterized by a certain increase of coffee prices in the international market especially between
April and June 2014, but not much coffee was available to sell because it was in processing.
Rwandan coffee was advertised by attending coffee exhibitions, conferences, international coffee
programs and international and regional adverts.
2. Tea Expansion Project
Basic
Information
Project cost: 575 million RWF
Donor: Government of Rwanda
Government contribution: 100% Government funded
Implementation starting date: July 2013
Scheduled Completion date: June 2017
Eventual Extension: June 2018
Implementing Agency: NAEB
Tea acreage expansion goes hand-in-hand with the construction of new tea factories; beside is a New Tea Factory at Mushubi, Nyamagabe District which was operational from October 2013 Tea acreage expansion goes hand-in-hand with the construction of new tea factories; beside is a New Tea Factory at Mushubi, Nyamagabe District which was operational from October 2013 Tea acreage expansion goes hand-in-hand with the construction of new tea factories; beside is a New Tea Factory at Mushubi, Nyamagabe District which was operational from October 2013 Tea acreage expansion goes hand-in-hand with the construction of new tea factories; beside is a New Tea Factory at Mushubi, Nyamagabe District which was operational from October 2013

66
Mission and
Purpose
The objective of this program is to increase Tea production by planting new 18,000 ha from 2012. Among
the 18,000ha, the 3,862 ha would be planted by existing tea factories, 4138 ha to be planted under tea
expansion phase I, while 10,000 ha are to be planted under tea expansion program phase II
Achievements
2013-2014
Tea expansion
Tea acreage expansion:
Achievement was 1,891 ha of new plantations at national level, meaning 82 % of the targets.
NAME OF TEA PROJECT TARGET AREA
(ha)
AREA PLANTED
(ha)
Percentage
score(%)
1. KARONGI 200 117.34 59
2. RUTSIRO 500 250.52 50
3. GATARE 500 402.48 80.5
4. MUSHUBI 100 57.11 57.1
5. MUGANZA KIVU 400 469.05 117.3
6. Private tea Factories 600 594 99
7. New sites 500
-
TOTAL PROJECTS & Factories 2,800 1,891 67.5
Total without new sites 2,300
82.21
Tea seedlings production: A total of 32,422,365 seedlings were produced from NAEB tea
projects, tea factories & tea cooperatives nurseries during the year 2013-2014.Tea factories
construction
Tea factories construction: For the ongoing tea expansion projects among the 5 targeted tea
factories which are Muganza Kivu, Karongi, Mushubi, Rutsiro, Gatare two of them were
completed (Karongi and Mushubi) and are operational. The Rutsiro and Muganza Kivu tea
factories are at 99 % completed while Gatare tea factory is still at the ground level.
Increase tea productivity
Fertilizer Application: 5,753 tons of NPK 25-5-5+3S were purchased through the Tea
Fertilizer Fund, distributed and applied representing 95.8% of the target that was set.
Tea Production & Export:
Green Leaf Production was 95,011 metric tons which was processed into 22,483 metric tonnes
of Made Tea, i.e. 79% of the set targets;
Export revenues were 53.5 million USD from the sales of 22,347 tons of Made Tea
Export Promotion: In order to showcase and promote Rwandan tea on the international market,
Rwanda to hosted the 2nd Africa Tea convention and Exhibition organized by the East African
Tea Trade Association (EATTA) in partnership with The National Agricultural Export Development Board (NAEB) on 28th -30th August 2013 at Kigali Serena Hotel.
3. Horticulture Commodity Chain - Intensification and Quality Management

67
Basic Information
Project cost: 372 891 496 RWF
Donor: Government of Rwanda
Government contribution: 100% Government funded
Implementation starting date: July 2010
Scheduled Completion date: June 2013
Eventual Extension: June 2014
Implementing Agency: NAEB
Mission and Purpose
This project aims to support and develop the horticulture value chain and new agricultural export
chains through three major activities:
1. Increasing the capacity of farmers in practicing market-oriented production of
horticultural commodities
2. Propagating healthy planting material for selected fruit trees
3. Developing logistical and postharvest infrastructure to reduce postharvest losses faced by
farmers.
Achievements
2013-2014
During this fiscal year, NAEB distributed 7,614 kg of different vegetable seeds that could be
planted on about 1877.4 ha that were consolidated in different marshlands. The total planted area
for different types of vegetables are shown in the table below:
Vegetable type Area planted under
NAEB seeds
Area planted under NAEB
mobilization (ha)
Total Area
covered (ha)
Carrots 126.25 222.9 349.15
French beans 125.6 190.9 316.5
Onion 41.5 300.25 341.75
Tomatoes 1,076 1117.2 2193.2
Peppers 122 86.3 208.3
Cabbage 202 582.9 784.9
Eggplant 0 217 217
Watermelon 184 221 405
Total 1,877.35 2,938 4,816
For fruits, the activities related to subsector had been carried out in different locations of the
country. During this fiscal year 2013/2014, a total of 75,212 seedlings of mangoes, 289,218
seedlings 0f avocados, 4,777 seedlings of citrus, 57,248 seedlings of Grapes, 6,672 seedlings of
plums , 16,770 seedlings of Macadamia, 7,722 seedlings of apples,4,050 seedlings of peaches
and 6,634 of pears were distributed as shown on below table;
Collection center for horticulture products to preserve the quality of Rwandafresh products.
Collection center for horticulture products to preserve the quality of Rwandafresh products.
Collection center for horticulture products to preserve the quality of Rwandafresh products.
Collection center for horticulture products to preserve the quality of Rwandafresh products.

68
Fruits Number of seedling planted Area covered(ha)
Mango 75,212 752
Avocado 289,218 2410
Citrus 4,777 60
Grapes 57,248 143
Plums 6,672 17
Peaches 4,050 10
pears 6,634 17
Apple 7,722 19
Macadamia 16,770 52
Total 468,303 3,480
For the sub sector of flowers, the expensing was done at 20 ha. By today, the planted area for
horticulture is evaluated to 35 ha.
About export, the sector performed the improved results. The increase in exported volumes was
translated into increase in export earnings. In total the exported volumes of 31, 933,834 kgs of
vegetables generated 9,494,442 USD while the 1,883,830 kgs of fruits results in 651,852 USD.
In framework of preserving Rwandafresh quality, the collection centers were equipped. These
collection centres have facilities for sorting, grading and packing. Equipments like grading tables
were supplied to the 3 constructed collection centers. Each of the collection centers has capacity
to handle 10 tonnes/day produce. On the other side, the ex-NAEB warehouse was equipped with
10 INOX tables.
4. NSC – National Sericulture Centre
Basic Information
Project cost: 100,000,000 RwF (Annual)
Donor: Government of Rwanda Project
Government contribution: Internally funded project
Implementation starting date: June 2009
Scheduled Completion date: Ongoing
Implementing Agency: NAEB
Fresh mulberry grown by cooperatives supported by the National Sericulture
Centre Fresh mulberry grown by cooperatives supported by the National Sericulture
Centre Fresh mulberry grown by cooperatives supported by the National Sericulture
Centre Fresh mulberry grown by cooperatives supported by the National Sericulture
Centre

69
Mission and Purpose
The National Sericulture Centre aims to increase sericulture productivity and to contribute to the
diversification of Rwandan exports. Activities include:
Supporting sericulture cooperatives
Supporting research related to sericulture
Strengthening the National Sericulture Centre, which coordinates farmer support
activities
Achievements
2013-2014
During the Financial year of 2013 – 2014, main achieved activities were:
Developed highly yielding and disease resistant mulberry varieties
Adaptation of silkworm breeds under the environmental conditions of Rwanda;
Carried out maintenance of mulberry and silkworm germplasm at Rubona research
station;
Developed disease monitoring system and prevention measures against pests within
mulberry plantation and silkworms;
Extension of proven technologies and strengthen capacity building of famers
SP3.4. Development of Priority Value Chains: Dairy and Meat
1. Dairy Value Chains Outputs
Mission and Purpose
Development of the dairy sector in Rwanda by increasing value addition at all stages of the Dairy
Value Chain. The development of this sector contributes toward improved livelihoods,
diversification of income sources and nutritional security.
Achievements
2013-2014
Transforming MCC into Hub Model: Farmers deliver milk to the Milk Collection
Center (MCC) and should be facilitated to get all the required services and farm input
including artificial insemination service, veterinary services and extension services; this
were the driving force to see how MCC should be transformed into dairy business HUB
Model centers that is aimed to revitalize the Milk Collection Network for efficient
services delivery to dairy farmers. As of now, out of 97 MCCs in the country, 40 were
transformed into Dairy Business Hub Models. Series of trainings were organized
whereby MINAGRI in collaboration with partners (RAB,LISP, RDCP II, and SNV)
have trained 2,400 dairy farmers on clean milk production.
New Dairy Plant and MCCs: Rusizi Dairy with a production capacity of 10,000 liters
of milk per day and Mukamira Dairy Plant with were continued to be constructed, the
works are at 90% of completion. And in addition to that 35 MCCs were constructed and
equipped with livestock SPIU/LISP
Milk Competition: MINAGRI in collaboration with RDCP II of USAID and private
sector in dairy business organized the second annual Milk Production Competition in
dairy cows. The purpose of the competition was to encourage farmers to have the best
animals within specific breeds to breed and create awareness on importance of keeping
high producing animals among the farmers for profitable livestock business. This
competition provided opportunity for appraisal of maximum genetic potential of the
animal for milk production. The winners for cross cow Holestein-Fresian 75% and Pure
Jersey were rewarded the prize valued 300,000 Rfw including Cup prize and Certificate
of appreciation
Milk week: MINAGRI in collaboration with Land o’Lakes and Ministry of Health the
Milk week Milk week, milk Consumption Campaign and Breastfeeding Week was
organized and launched in the District of Karongi and Gisagara. The objectives of the
campaign were to sensitive farmers especially of rural areas to drink milk and breast
their children and emphasis was on the children under 5 years vulnerable to malnutrition
and chronic diseases due to the lack of important nutrients.
SP3.5. Development of Priority Value Chains: Fisheries
1. Outputs for the Development of Aquaculture & Fisheries
Mission and Purpose
The development of aquaculture and fisheries sector contributes toward improved livelihoods,
diversification of income sources and nutritional security.
Achievements
2013-2014
Research Outputs on the Development of Aquaculture & Fisheries (RAB)
In fish farming and fisheries, planned research was related to development of Tilapia nilotica
strain more adapted to Rwanda conditions, fish feeds formulation, adaptation of Carps and
Clarias to rearing in ponds and study on salmonids rearing conditions, in the FY 2013-2014.

70
Research on Tilapia Nilotica: strain that was imported from Uganda, Lake Albert
was conducted at Kigembe Fish Farming Station. Breeding in order to maintain and
improve that strain (it has started, ongoing). In last year 4 successive offsprings were
collected from 13 parent families. The growing of these 4 offsprings are to be
followed up until we get a parent stock to start on in crossing with wild strains.
Carps and Clarias: 162 specimens of Clarias gariepinus were fished from lakes
Rwampanga and Cyambwe, taken to Kigembe station for acclimation. After,
fingerlings that will be gotten from them will be disseminated to fish farms where we
will condact on farm research. Specimens of Carps are being collected from different
water bodies. They will be transferred to Kigembe fish farming station for
acclimatation and further production of carp fingerling
Salmonids (trout): Identification of some sites where rainbow trout could perform
well was carried out in the Northern Agriculture Zone Division (Nyabihu district,
Musanze District). The parameters of water have to be analyzed. The identification is
to be continued in Gicumbi district.
Fish feeds: Identification of local ingredients for formulation of fish feeds have been
done in each Agriculture Zone Division. These potential ingredients are as follows:
o Northern Zone: Maize, Soja, Cassava, Sombe leaves, haricots, peas,
banana, cabbages, sorghum, wheat, fish meal, irish potato, sweet potato,
wastes from animal husbandry, different wastes from households, fruits,
wastes from slaughters, grass,
o Western Zone: wastes from sericulture, wastes from animal husbandry,
different wastes from households, fish meal, sweet potato, banana, fruits,
rice, Irish potato, beans, cassava, wastes from slaughters, grass,
o Southern Zone: Wastes from sericulture, wastes from animal husbandry,
different wastes from households, wastes from slaughters, grass, fruits,
banana, beans, maize, cassava, wheat, sorghum, rice,
o Eastern Zone: Wastes from sericulture, rice, sunseed, wastes from animal
husbandry, different wastes from households, wastes from slaughters, grass,
groundnuts.
Report of Activities in Fish Farming and Fisheries
• 3 private investors have been recommended for cage fish farming in Kivu Lake;
• 2 private investors in fish feeds have been facilitated in taxes exoneration;
• 24,765 MT OF Fish production
Monitoring and evaluation of Joint Youth and Women Employment Flagship
implementation in fish farming, in partnership with FAO and RAB;
• Establishment of Mini Laboratory of 20,000 $ at Kigembe Fish Center in collaboration with
Smart Fish and RAB ;
Ministry of Agriculture and Animal Resources has developed regulations for fish products
trading, fish farming and fisheries as stated by the Law no 58/2008 of 10/09/2008
determining the organization and management of aquaculture and fishing in Rwanda;
SP3.7. Agricultural finance
The following data to summarize agricultural finance lending in Rwanda over FY 2013/14 has been sourced from the
Central Bank.
Outstanding Loans (related to Agriculture) granted by banks
ACTIVITIES SECTOR End July 2013(Frw"000") End June 2014 (Frw"000")
Agricultural, fisheries& livestock (Primary) 22,595,406
27,142,531
Agro processing 23,063,508
39,443,508
MANUFACTURING INDUSTRIES 1,678,049
4,852,918
MANUFACTURING OF FOOD PRODUCTS 5,031,141
8,164,742
COFFEE FACTORIES 3,149,192
4,898,177
TEA FACTORIES 5,288,690
4,046,104
OTHER MANUFACTURING OF FOOD
PRODUCTS 4,121,588
4,224,639
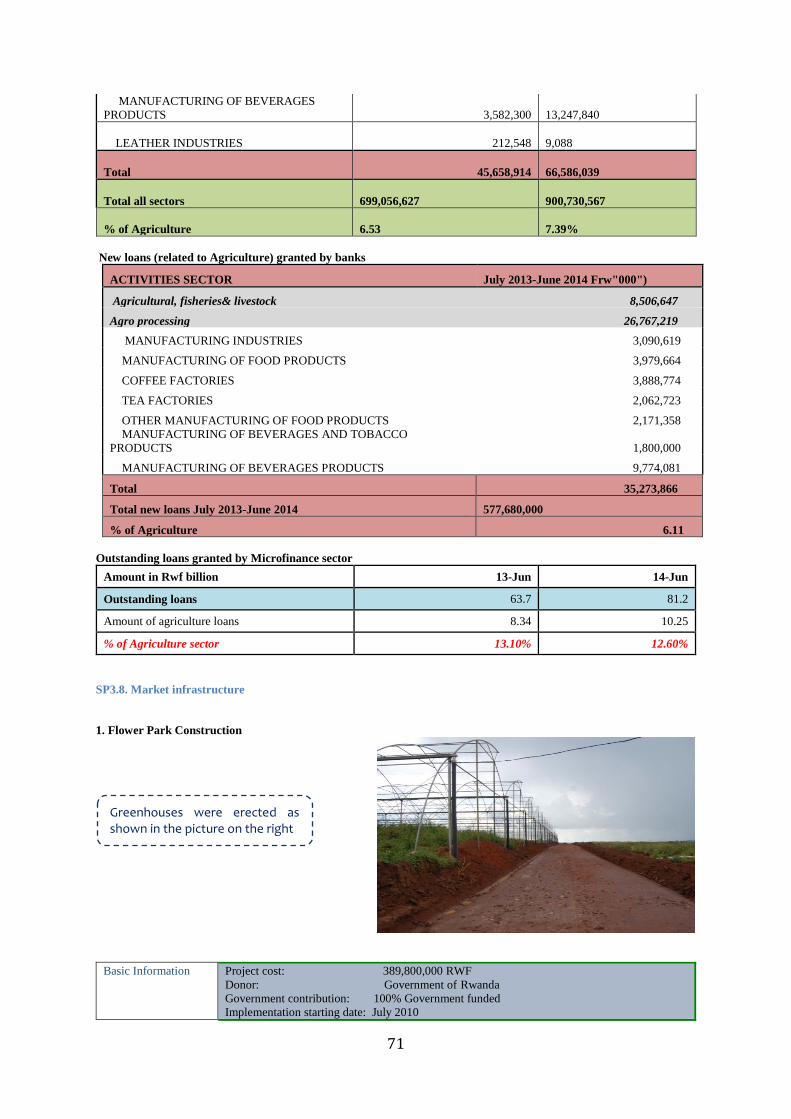
71
MANUFACTURING OF BEVERAGES
PRODUCTS 3,582,300
13,247,840
LEATHER INDUSTRIES 212,548
9,088
Total 45,658,914
66,586,039
Total all sectors
699,056,627
900,730,567
% of Agriculture
6.53 7.39%
New loans (related to Agriculture) granted by banks
ACTIVITIES SECTOR July 2013-June 2014 Frw"000")
Agricultural, fisheries& livestock 8,506,647
Agro processing 26,767,219
MANUFACTURING INDUSTRIES 3,090,619
MANUFACTURING OF FOOD PRODUCTS 3,979,664
COFFEE FACTORIES 3,888,774
TEA FACTORIES 2,062,723
OTHER MANUFACTURING OF FOOD PRODUCTS 2,171,358
MANUFACTURING OF BEVERAGES AND TOBACCO
PRODUCTS 1,800,000
MANUFACTURING OF BEVERAGES PRODUCTS 9,774,081
Total 35,273,866
Total new loans July 2013-June 2014 577,680,000
% of Agriculture 6.11
Outstanding loans granted by Microfinance sector
Amount in Rwf billion 13-Jun 14-Jun
Outstanding loans 63.7 81.2
Amount of agriculture loans 8.34 10.25
% of Agriculture sector 13.10% 12.60%
SP3.8. Market infrastructure
1. Flower Park Construction
Basic Information
Project cost: 389,800,000 RWF
Donor: Government of Rwanda
Government contribution: 100% Government funded
Implementation starting date: July 2010
Greenhouses were erected as shown in the picture on the right
Greenhouses were erected as shown in the picture on the right
Greenhouses were erected as shown in the picture on the right
Greenhouses were erected as shown in the picture on the right
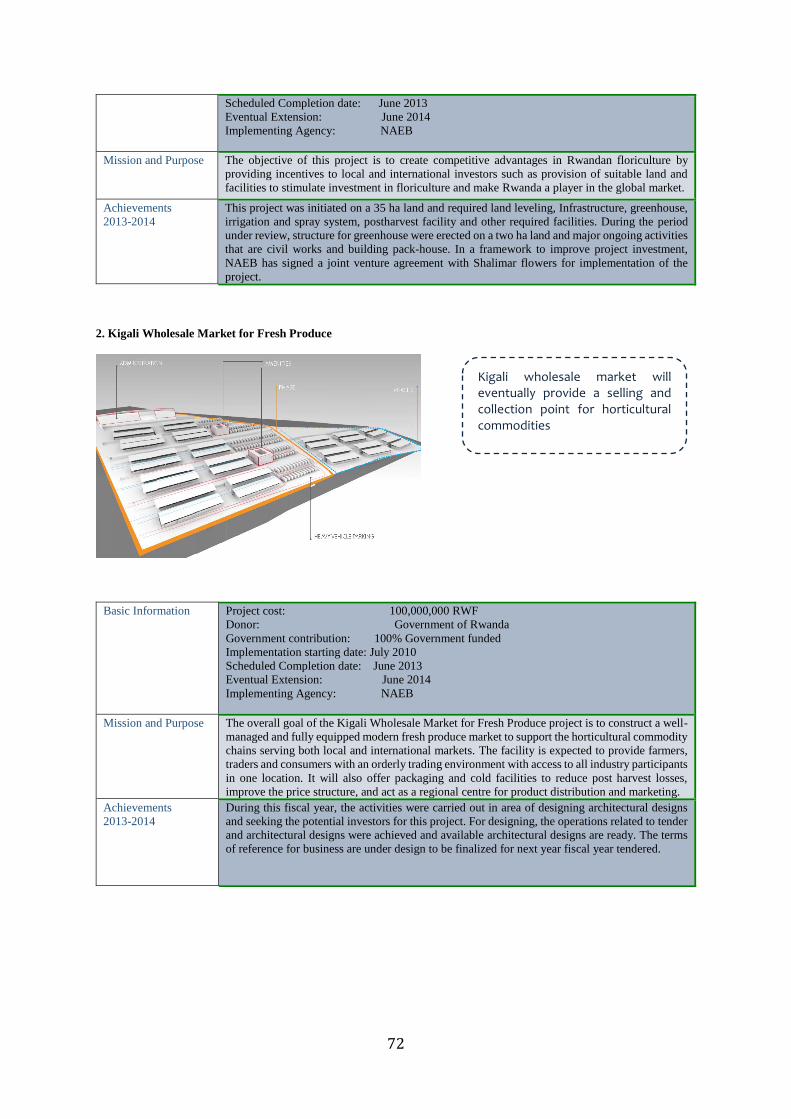
72
Scheduled Completion date: June 2013
Eventual Extension: June 2014
Implementing Agency: NAEB
Mission and Purpose
The objective of this project is to create competitive advantages in Rwandan floriculture by
providing incentives to local and international investors such as provision of suitable land and
facilities to stimulate investment in floriculture and make Rwanda a player in the global market.
Achievements
2013-2014
This project was initiated on a 35 ha land and required land leveling, Infrastructure, greenhouse,
irrigation and spray system, postharvest facility and other required facilities. During the period
under review, structure for greenhouse were erected on a two ha land and major ongoing activities
that are civil works and building pack-house. In a framework to improve project investment,
NAEB has signed a joint venture agreement with Shalimar flowers for implementation of the
project.
2. Kigali Wholesale Market for Fresh Produce
Basic Information
Project cost: 100,000,000 RWF
Donor: Government of Rwanda
Government contribution: 100% Government funded
Implementation starting date: July 2010
Scheduled Completion date: June 2013
Eventual Extension: June 2014
Implementing Agency: NAEB
Mission and Purpose
The overall goal of the Kigali Wholesale Market for Fresh Produce project is to construct a well-
managed and fully equipped modern fresh produce market to support the horticultural commodity
chains serving both local and international markets. The facility is expected to provide farmers,
traders and consumers with an orderly trading environment with access to all industry participants
in one location. It will also offer packaging and cold facilities to reduce post harvest losses,
improve the price structure, and act as a regional centre for product distribution and marketing.
Achievements
2013-2014
During this fiscal year, the activities were carried out in area of designing architectural designs
and seeking the potential investors for this project. For designing, the operations related to tender
and architectural designs were achieved and available architectural designs are ready. The terms
of reference for business are under design to be finalized for next year fiscal year tendered.
Kigali wholesale market will eventually provide a selling and collection point for horticultural commodities Kigali wholesale market will eventually provide a selling and collection point for horticultural commodities Kigali wholesale market will eventually provide a selling and collection point for horticultural commodities Kigali wholesale market will eventually provide a selling and collection point for horticultural commodities
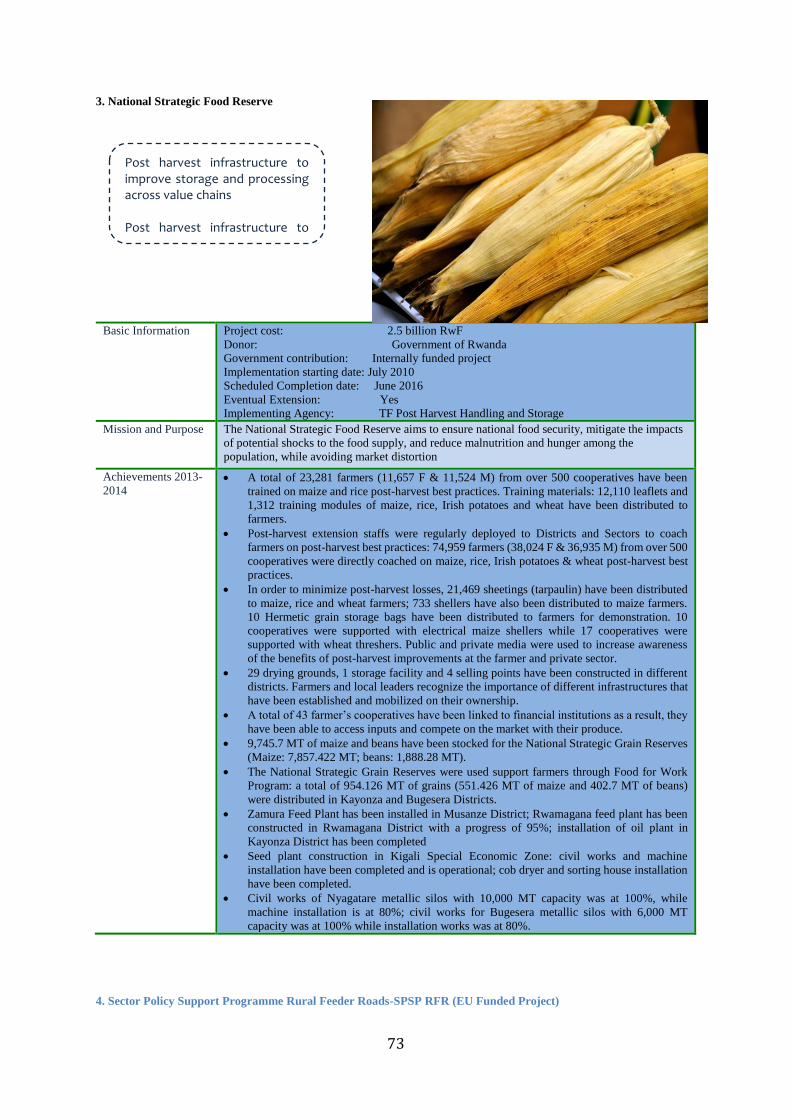
73
3. National Strategic Food Reserve
Basic Information
Project cost: 2.5 billion RwF
Donor: Government of Rwanda
Government contribution: Internally funded project
Implementation starting date: July 2010
Scheduled Completion date: June 2016
Eventual Extension: Yes
Implementing Agency: TF Post Harvest Handling and Storage
Mission and Purpose
The National Strategic Food Reserve aims to ensure national food security, mitigate the impacts
of potential shocks to the food supply, and reduce malnutrition and hunger among the
population, while avoiding market distortion
Achievements 2013-
2014
A total of 23,281 farmers (11,657 F & 11,524 M) from over 500 cooperatives have been
trained on maize and rice post-harvest best practices. Training materials: 12,110 leaflets and
1,312 training modules of maize, rice, Irish potatoes and wheat have been distributed to
farmers.
Post-harvest extension staffs were regularly deployed to Districts and Sectors to coach
farmers on post-harvest best practices: 74,959 farmers (38,024 F & 36,935 M) from over 500
cooperatives were directly coached on maize, rice, Irish potatoes & wheat post-harvest best
practices.
In order to minimize post-harvest losses, 21,469 sheetings (tarpaulin) have been distributed
to maize, rice and wheat farmers; 733 shellers have also been distributed to maize farmers.
10 Hermetic grain storage bags have been distributed to farmers for demonstration. 10
cooperatives were supported with electrical maize shellers while 17 cooperatives were
supported with wheat threshers. Public and private media were used to increase awareness
of the benefits of post-harvest improvements at the farmer and private sector.
29 drying grounds, 1 storage facility and 4 selling points have been constructed in different
districts. Farmers and local leaders recognize the importance of different infrastructures that
have been established and mobilized on their ownership.
A total of 43 farmer’s cooperatives have been linked to financial institutions as a result, they
have been able to access inputs and compete on the market with their produce.
9,745.7 MT of maize and beans have been stocked for the National Strategic Grain Reserves
(Maize: 7,857.422 MT; beans: 1,888.28 MT).
The National Strategic Grain Reserves were used support farmers through Food for Work
Program: a total of 954.126 MT of grains (551.426 MT of maize and 402.7 MT of beans)
were distributed in Kayonza and Bugesera Districts.
Zamura Feed Plant has been installed in Musanze District; Rwamagana feed plant has been
constructed in Rwamagana District with a progress of 95%; installation of oil plant in
Kayonza District has been completed
Seed plant construction in Kigali Special Economic Zone: civil works and machine
installation have been completed and is operational; cob dryer and sorting house installation
have been completed.
Civil works of Nyagatare metallic silos with 10,000 MT capacity was at 100%, while
machine installation is at 80%; civil works for Bugesera metallic silos with 6,000 MT
capacity was at 100% while installation works was at 80%.
4. Sector Policy Support Programme Rural Feeder Roads-SPSP RFR (EU Funded Project)
Post harvest infrastructure to improve storage and processing across value chains Post harvest infrastructure to improve storage and processing across value chains Post harvest infrastructure to improve storage and processing across value chains Post harvest infrastructure to improve storage and processing across value chains

74
Basic Information
Project cost: EUR 40,000,000
Donor: EU
Management Mode: Sector Policy Support Programme
Sector budget support: EUR 36,000,000
Project mode: EUR 4,000,000
Implementation starting Financial Year: 2013/2014
Scheduled Completion Financial Year: 2017/2018
Implementation Agency: ISFRRM/Minagri
Mission and Purpose
This project is a sector budget support programme for Rural Feeder Roads; where the Ministry of
Finance and Economic Planning(MINECOFIN), acting as EDF National Authorising
Officer(NAO), is responsible of disbursement requests for the SBS, transfers the funds to the
Districts and will be responsible of the contracting of the Programme Estimate.
The overall objective of the programme is to contribute to poverty reduction through the
promotion of equitable and inclusive economic growth within the framework of decentralization
and to improve consumer access to affordable food as well as access of food producers to markets,
thereby contributing to strengthen food security.
The specific programme objective is to support the implementation of rural feeder road network
policies and strategies at local level, by helping set up a sustainable system and reinforcing the
capacities of government in this domain.
The priority roads identified by the projects covers different category of roads as per the RoadAct:
National, District Class 1, District Class 2 and unclassified roads.
Achievements
2013-2014
Feeder Roads Rehabilitation:
o The project supported rehabilitation of 101.15km of Feeder Roads in 7 Districts
namely: Muhanga, Huye, Ngoma, Ngororero, Rulindo, Bugesera and Rubavu.
o The Districts achievements are as follows:
Muhanga:19Km
Huye:9Km
Ngoma:17.02Km
Ngororero:10.36Km
Rulindo:22Km
Bugesera:13.5Km
Rubavu:10.2Km
Capacity building:
o Establishment of the Rural Feeder Road Unit. The RFRU, now operational is composed
of: 7 Districts Engineers, 4Engineers attached to the central level(1 at MINAGRI and 3
at RTDA), 1Project Accountant, 1Project Procurement Specialist, 1 M&E Specialist and
1 International Technical Assistant/Institutional Specialist.
Project Management:
o The Programme Estimate being managed by the imprest administrator, Imprest
accounting officer, Deputy imprest administrator and Deputy imprest accounting
officer. Its meeting is held every month for the good management of the Project.
Bugesera Rehabilitated Feeder Road
Bugesera Rehabilitated Feeder
Road Bugesera Rehabilitated Feeder
Road Bugesera Rehabilitated Feeder
Road
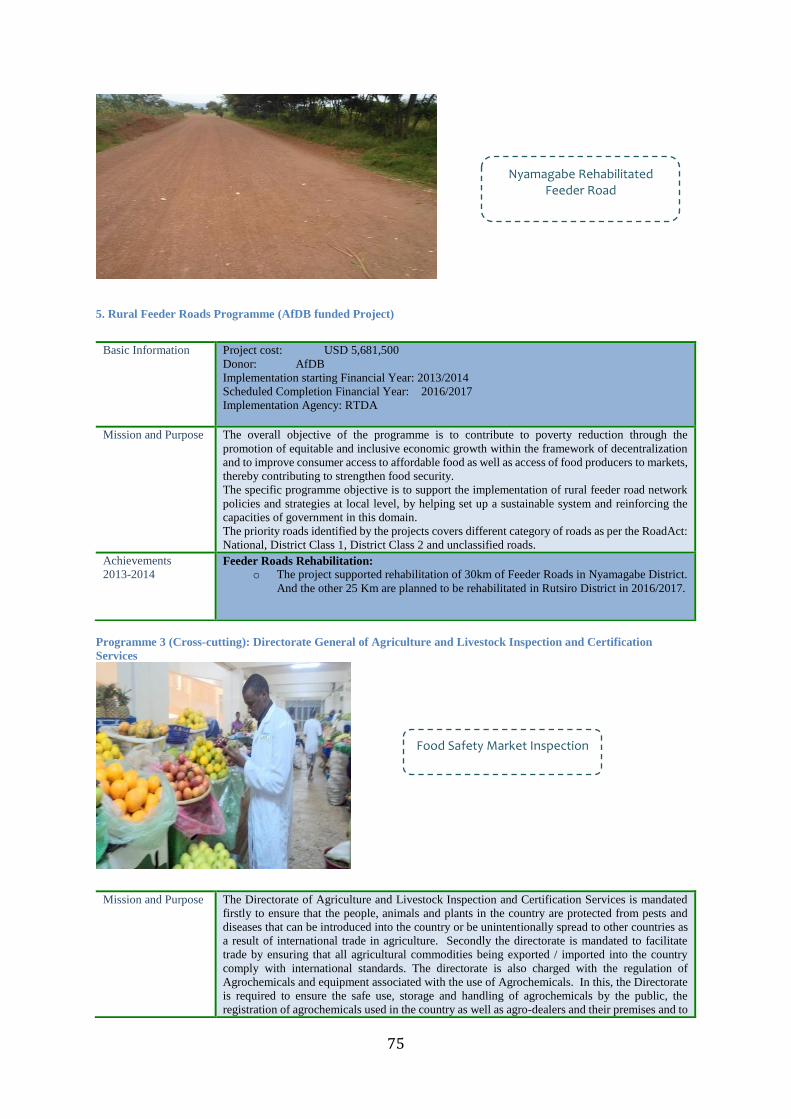
75
5. Rural Feeder Roads Programme (AfDB funded Project)
Programme 3 (Cross-cutting): Directorate General of Agriculture and Livestock Inspection and Certification
Services
Basic Information
Project cost: USD 5,681,500
Donor: AfDB
Implementation starting Financial Year: 2013/2014
Scheduled Completion Financial Year: 2016/2017
Implementation Agency: RTDA
Mission and Purpose
The overall objective of the programme is to contribute to poverty reduction through the
promotion of equitable and inclusive economic growth within the framework of decentralization
and to improve consumer access to affordable food as well as access of food producers to markets,
thereby contributing to strengthen food security.
The specific programme objective is to support the implementation of rural feeder road network
policies and strategies at local level, by helping set up a sustainable system and reinforcing the
capacities of government in this domain.
The priority roads identified by the projects covers different category of roads as per the RoadAct:
National, District Class 1, District Class 2 and unclassified roads.
Achievements
2013-2014 Feeder Roads Rehabilitation:
o The project supported rehabilitation of 30km of Feeder Roads in Nyamagabe District.
And the other 25 Km are planned to be rehabilitated in Rutsiro District in 2016/2017.
Mission and Purpose
The Directorate of Agriculture and Livestock Inspection and Certification Services is mandated
firstly to ensure that the people, animals and plants in the country are protected from pests and
diseases that can be introduced into the country or be unintentionally spread to other countries as
a result of international trade in agriculture. Secondly the directorate is mandated to facilitate
trade by ensuring that all agricultural commodities being exported / imported into the country
comply with international standards. The directorate is also charged with the regulation of
Agrochemicals and equipment associated with the use of Agrochemicals. In this, the Directorate
is required to ensure the safe use, storage and handling of agrochemicals by the public, the
registration of agrochemicals used in the country as well as agro-dealers and their premises and to
Nyamagabe Rehabilitated Feeder Road
Nyamagabe Rehabilitated
Feeder Road
Nyamagabe Rehabilitated Feeder Road
Nyamagabe Rehabilitated
Feeder Road
Food Safety Market Inspection Food Safety Market Inspection Food Safety Market Inspection Food Safety Market Inspection

76
maintain and update a list of agrochemicals that are prohibited and restricted in the country. In
addition, this directorate hosts the National Plant Protection Organization (NPPO) which is a
requirement for countries that are signatory to the International Plant Protection Convention
(IPPC) under the World Trade Organization (WTO) agreement on Sanitary and Phytosanitary
Standards (SPS).
The directorate is delivering its services through two main sections which are in turn subdivided
into sub sections as follows:
Section Sub-section
Plant health services Plant product certification
Plant Quarantine
Plant Pests surveillance
Animal health services Animal Quarantine
Animal Diseases surveillance
Animal product certification
Achievements
2013-2014 Improve the input distribution market, inspection and regulation
Directorate has conducted a countrywide inspection of agro-dealers and premises in order to
ensure the compliance with requirements in accordance with the agrochemical law and its bylaws.
In addition, codes of conduct and posters have been distributed to all agro-dealers. Within this
framework, The list of authorized agrochemicals was updated and two new products were
registered.
Table.1. Agrochemical products registered in 2013-2014
No Trade name Active ingredient Type of
product
Owner of
product
1 Agrothrin 0.11% Pyrethrins and
1.1% piperonyl
butoxide (PBO)
Insecticide Agropharm
Africa Ltd
2 Refined Pyrethrum
Concentrate (CAS
No: 8003-34-7)
Pyrethrins =75%w/w Insecticide Horizon
Sopyrwa
In collaboration with RAB, REMA, MINALOC, RBS, RRA, RNP, and MoH the lists of prohibited
and restricted agrochemicals and veterinary drugs were also updated and all lists were posted on
minagri website and RAB website and also distributed to all entry /exit points of the country, to
all agro-dealers.
Sanitary and Phytosanitary certification
Based On Different Plant Health Inspections Conducted On Farms And In Warehouses, 2,106
Phyto-sanitary Certificates Were Issued On Horticultural Products, Maize, Beans, Coffee And Tea
Exported At The International Market In 2013-2014 Fiscal Year. As Regards To Sanitary
Certification, Different Livestock Commodities Including Goats, Sheep, Fresh Fish, Meat And
Meat Products, Milk And Milk Products And Honey Were Inspected And Certified For Export.
In Order To Meet Transparency Principle Of WTO- SPS Agreement And Obtain Information For
Certification, Different Countrywide Surveys On Pest And Diseases Were Conducted For
Horticultural Crops, Coffee, Tea And Farm & Domestic Animals.
Export Certificates Issued For Livestock Commodities During Fiscal Year Of 2013-2014
Animals/ Products Exports/Re-Export
Quantity (Kg)
/Number
Destination
Goats 6875 Democratic Republic Of
Congo
Sheep 318
Fresh Fish 1002 Congo Brazzaville
Meat And Meat Products 20333 Congo Brazzaville
Milk And Milk Products 6123429 Democratic Republic Of
Congo
124.992 South Sudan
30000 Uganda
Honey 500 Singapore

77
10 Germany
Agricultural and livestock products import authorization
In order to protect the country from pest and diseases which may affect the country as a result of
international trade; the authorization of importation is issued after a thorough Pest and Diseases
Risk Analysis, from which, import conditions are determined.
In 2013-2014 fiscal year, 496 import permits were issued for various agricultural and livestock
products from different countries. The main imported agricultural commodities are seeds and other
planting materials, agrochemicals (fertilisers and pesticides), equipments used in agriculture,
Pest Risk analysis of imported agricultural products.
Commodity Country of origin Import conditions
Maize seeds Zambia - Free from pests and diseases
- To be accompanied by a Phytosanitary
Certificate and Certificate of Quality Analysis
complying with standards
- Accompanied by a copy of laboratory results
showing that those seeds are free from Maize
dwarf Mosaic virus (MDMV),Maize chlorotic
Mottle Virus (MCMV),Sugarcane Mosaic
Virus (SCMV), Wheat streak Mosaic Virus
(WSMV)
- Not be genetically modified
- The maize seeds must have been harvested in
the area free from Maize Lethal Necrosis
Disease (MLND)
Maize seeds Zimbabwe
Maize seeds Kenya
Maize seeds Mexico
Maize seeds Uganda
Soya bean Zambia - Free from pests and diseases
- Coming with phytosanitary certificate and
certificate of quality analysis complying the
standards of seeds
- Not be genetically modified
Soya bean Mozambique
Soya beans Zimbabwe - Free from pests and all insects should be
controlled by appropriate treatment before
dispatch.
- Not be genetically modified.
- Coming with phytosanitary certificate and
certificate of quality analysis
Rice seeds (For
research)
Zimbabwe - Free from seed born diseases
- Coming with phytosanitary certificate and
certificate of quality analysis
- Not be genetically modified Rice seeds (For
research)
Kenya
Irish potatoes
mini tubers
Peru - Free from pests and diseases
- All insects be treated with appropriated
pesticides before dispatch
- All insects should be Controlled by appropriate
treatment before dispatch
Flowers for
planting
Kenya - Free from pests and diseases
- Accompanied with phytosanitary certificate
- Free from soil and other foreign matter
Sunflowers Kenya
- Sunflowers must be free from pests and all
insects should be controlled by appropriate
treatment before dispatch.
- The sunflower seeds should be not genetically
modified.
- Coming with phytosanitary certificate and
certificate of quality analysis
Rice inbred lines
(For research)
Tanzania - Free from seed borne diseases
- Coming with phytosanitary
certificate and certificate of
quality analysis
- Not be genetically modified
Rice inbred lines
(For research)
Philippines

78
Rice seeds (for
research)
Burundi - Must be pure, cleaned and free from any foreign
matter, not mixed with other varieties, seed that
are broken, poorly developed or diseased.
- Not be genetically modified (GMO)
Brachiaria grass
Seeds
- Free from weed seeds, impurities, viruses.
accompanied with Phytosanitary certificate
- Not be genetically modified
Bean seeds Colombia - Free from pests and diseases
- Coming with Phytosanitary certificate and
certificate of quality analysis complying with
standards
- Not be genetically modified
Bean seeds Italy
Oregon Sugar
Pod II Seeds
(Pisum sativum)
Kenya - Free from pest and diseases and
- Coming with phytosanitary certificate and
certificate of quality analysis
- Killing all insects by appropriate treatment
Pastures
Sorghum
Wheat
Sunflower
Kenya - Free from pests and diseases
- Alls insects should be controlled by appropriate
treatment
- Not be genetically modified
Seedlings of
different crop
(Plums Pears
Peach Grapes
Apple Mango)
Kenya - Free from pests and diseases
- Alls insects should be controlled by appropriate
treatment
- Not be genetically modified
- Free from soil and other foreign matter and
debris
Groundnut seeds Uganda - Free from pests and diseases
- Alls insects should be controlled by appropriate
treatment
- Not be genetically modified
- Free from soil and other foreign matter and
debris
Authorized imports of animals/animal products during fiscal year of 2013-2014
Animals/
Products
Imports Import conditions
Quantity(kg)/number Origin
Pet animal(dog and
cat)
2dogs Kenya -To be accompanied by
:veterinary certificate,
vaccination certificate ,proof
of treatment against
Echinococcus multicularis
tape worm
8cats South
Africa
Eggs 46200 Uganda To be accompanied by
:veterinary certificate ,to be
clean and free from droppings
or any dirty materials .They
shall be non embryonated and
free from blood spots, and not
exceed 14 days being laid.
One day old
Chicks 37000 Uganda To be accompanied by
:veterinary certificate, to be
free from all OIE notifiable
diseases
Fresh fish 1000 Kenya To be accompanied
by::veterinary certificate,
certificate of origin ,to be free
from Salmonella spp,and E-
coli,
Canned fish 300 Belgium To be accompanied by
:veterinary certificate ,not
being genetically modified,
HACCP certificate
3000 Uganda To be accompanied by
:veterinary certificate ,not 1.500 Uganda

79
being genetically modified
,HACCP certificate
Meat and meat
products
2558.2Kg Kenya To be accompanied by
:veterinary certificate ,not
being genetically modified
,HACCP certificate
85.63 Italy To be accompanied by
:veterinary certificate ,not
being genetically modified
,HACCP certificate
804Kg Belgium To be accompanied by
:veterinary certificate ,not
being genetically modified
,HACCP certificate
Milk and milk
products
2886.91 Belgium To be accompanied by
:veterinary certificate ,not
being genetically modified
,HACCP certificate
Inspection of markets, storage facilities and abattoirs
In order to ensure sanitary and food safety compliance of imported and locally produced
agricultural products and animal feeds, inspections were conducted at various markets, abattoirs
and stores in the whole country.
Monitoring of pesticides and antibiotics residues for honey
The Pesticides Residue Monitoring Plan (PRMP) for honey was developed and submitted to the
European Union Commission together with the application for registration of Rwanda on the
list of countries allowed to export honey to the EU market. The developed plan is under
implementation. As result, Rwanda was added to the list. The PRMP Working group was also
established and is composed by stakeholders from MINAGRI, RAB, NAEB, RBS, Private sector.
Creating awareness on sanitary and phytosanitary standards and agrochemicals safe
use and handling
With the aim of increasing the awareness on the required standards to protect human or animal
life health within the country and the territory of Partner State from risks arising from biological,
chemical and physical substances including additives, contaminants, toxins or disease-causing
organisms; and establishment or spread of pests, diseases, disease-carrying organisms, RALIS
conducted a training workshop in Northern Province.
The training brought together participants from all districts of the Northern Province bordering
Uganda. Groups of trainees were composed by Extension officers, farmers’ representative,
Cyanika and Gatuna border officials, Agro-dealers and district agronomists.
The training sessions focused on; Sanitary and phytosanitary standards, Good agricultural
practices, safe use of agrochemicals and requirements for import and export of agricultural
commodities.
Other activities for Sanitary and phytosanitary standards awareness creation
- Meetings with seed importers and agro-dealers: Explanations on the requirements for
importation of agricultural inputs and their distribution within the county.
- Dissemination of posters showing details on safe use of agrochemical, seeds and
agrochemicals import conditions, international quality standards to be fulfilled for
importation and exportation of agricultural products.
- Meetings with border officials at all official borders of Rwanda: explanation of
requirements for imports/ exports in agricultural commodities. Information exchanges
on ways of collaboration
Institutional Capacity Building
In order to strengthen human capacity, the staffs of the Directorate of inspection have
benefited different trainings:
1. Hazard analysis and critical control point determination (HACCP analysis)
2. Implementation of food safety according to CODEX-HACCP
3. Crop protection
4. Food safety
5. Monitoring and Evaluation of Plant Clinics
6. Training on Up- gradation of Food Testing Skills of Food Processing Professional
7. WTO SPS National Notification Authority
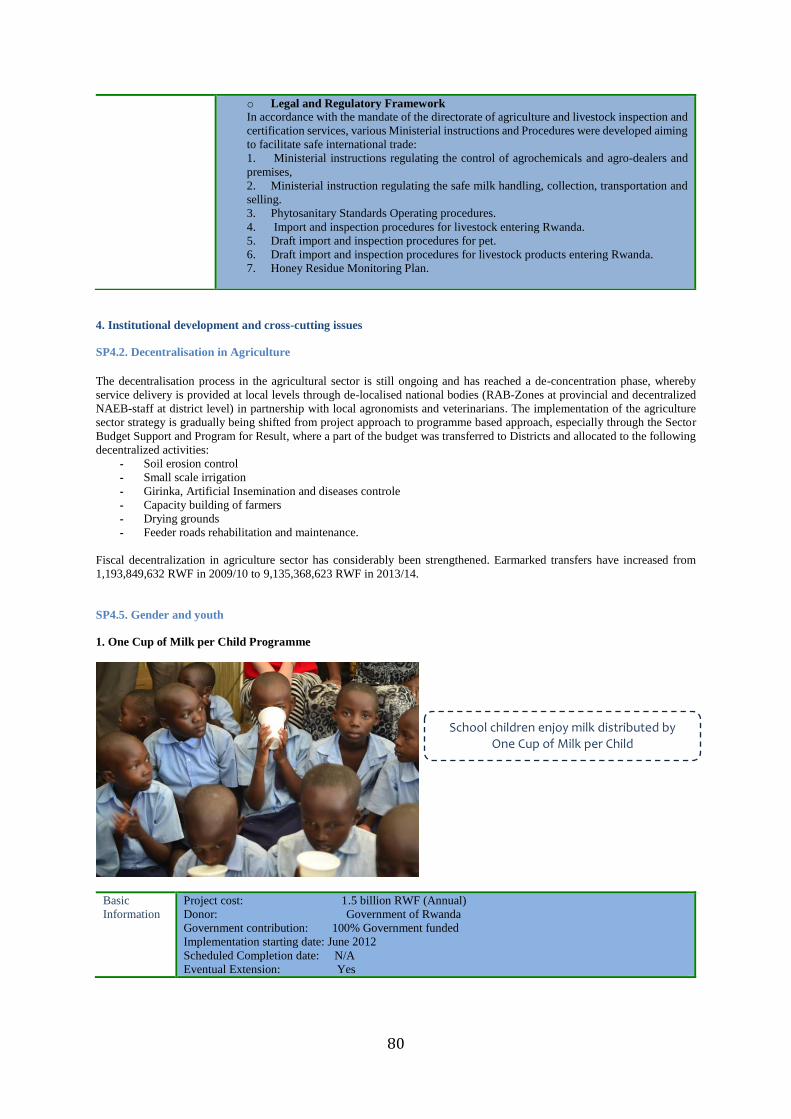
80
4. Institutional development and cross-cutting issues
SP4.2. Decentralisation in Agriculture
The decentralisation process in the agricultural sector is still ongoing and has reached a de-concentration phase, whereby
service delivery is provided at local levels through de-localised national bodies (RAB-Zones at provincial and decentralized
NAEB-staff at district level) in partnership with local agronomists and veterinarians. The implementation of the agriculture
sector strategy is gradually being shifted from project approach to programme based approach, especially through the Sector
Budget Support and Program for Result, where a part of the budget was transferred to Districts and allocated to the following
decentralized activities:
- Soil erosion control
- Small scale irrigation
- Girinka, Artificial Insemination and diseases controle
- Capacity building of farmers
- Drying grounds
- Feeder roads rehabilitation and maintenance.
Fiscal decentralization in agriculture sector has considerably been strengthened. Earmarked transfers have increased from
1,193,849,632 RWF in 2009/10 to 9,135,368,623 RWF in 2013/14.
SP4.5. Gender and youth
1. One Cup of Milk per Child Programme
Basic
Information
Project cost: 1.5 billion RWF (Annual)
Donor: Government of Rwanda
Government contribution: 100% Government funded
Implementation starting date: June 2012
Scheduled Completion date: N/A
Eventual Extension: Yes
o Legal and Regulatory Framework
In accordance with the mandate of the directorate of agriculture and livestock inspection and
certification services, various Ministerial instructions and Procedures were developed aiming
to facilitate safe international trade:
1. Ministerial instructions regulating the control of agrochemicals and agro-dealers and
premises,
2. Ministerial instruction regulating the safe milk handling, collection, transportation and
selling.
3. Phytosanitary Standards Operating procedures.
4. Import and inspection procedures for livestock entering Rwanda.
5. Draft import and inspection procedures for pet.
6. Draft import and inspection procedures for livestock products entering Rwanda.
7. Honey Residue Monitoring Plan.
School children enjoy milk distributed by One Cup of Milk per Child
School children enjoy milk distributed by
One Cup of Milk per Child
School children enjoy milk distributed by One Cup of Milk per Child
School children enjoy milk distributed by
One Cup of Milk per Child

81
Mission and
Purpose
One cup of milk per child has five key, complementary objectives:
1. Reduce malnutrition in children
2. Support children’s development and capacity to learn
3. Provide children with a balanced diet and instill good dietary practices
4. Reduce post-harvest losses in the dairy value chain
5. Develop the Rwandan dairy sector through increasing demand
Achievement
s
2013-2014
Currently 83, O12 pupils are on the program, and there is anecdotal evidence to suggest that
there has been improvement in the health of the children benefiting the programme, as well as
their consistency in attending classes.
The habit of milk drinking has been fostered in beneficiary families. In the areas where the
programme is being implemented, it has been found that parents have experienced the goodness
of taking milk and now they have started giving it to their children.
Dairy plants have benefited a lot from the programme.
For the monitoring procedures, RAB has stared signing MoU with districts where the program
is being implemented. Districts are now going to be fully involved in monitoring the activities,
follow how pupils take milk, compile reports and send them to RAB and timely communicate
to RAB some other problems that can occur at schools.
Inyange Industries Ltd was requested by RAB to design a new packaging material of UHT milk
for school feeding and that was
achieved. This new design will help reduce cases of stealing milk as their colour is very similar
compared to what is taken to markets.
The following table summarizes the achievements of the programme in 2013/14:
Outputs Baseline Annual
target
Achievements
Improve
health of
100,000
children
in 112
schools.
85028
children
84702
children
- 83012 children benefited from one cup of milk program.
- Efficient distribution of Milk in 112 schools throught the
year.
- Awareness of taking milk in families.
Ensuring
the
quality of
milk
distribute
d in 112
schools
-
Distribut
e milk in
112
schools
- Efficient distribution of Milk in 112 schools throught the
year and ensuring its quality.
Monitorin
g and
evaluatio
n
modalitie
s
- New monitoring tools (storecount templates, milk
requisition form)were developed and distributed to
schools
- We have developed milk purchase order which helped
as limit over/less supply at certain schools
- RAB has signed an agreement (MoU )with Districts
where the program is being implemeted, of participating
in monitoring of the program
Milk
Stores
were
evaluated
112
schools
- On site training of teachers about stock management
(recording, cleaniness).
SP4.7. Nutrition and Household Vulnerability
The projects contributing to this sub programme include the One Cup of Milk per Child & One Cow per Poor Family
(Girinka) projects. Kindly refer to the reports under Sub Programmes 4.5 and 1.6 respectively for more details.

82

83
SECTION 4: FINANCIAL YEAR
2013-2014 BUDGET ANALYSIS
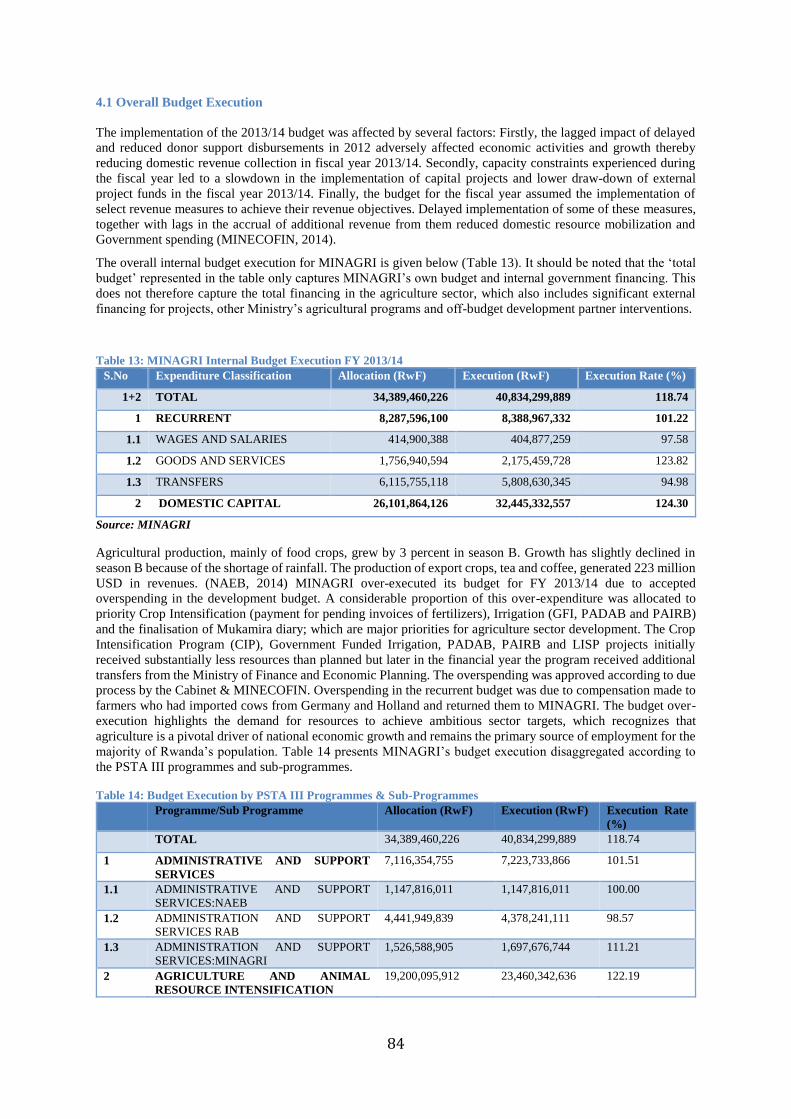
84
4.1 Overall Budget Execution
The implementation of the 2013/14 budget was affected by several factors: Firstly, the lagged impact of delayed
and reduced donor support disbursements in 2012 adversely affected economic activities and growth thereby
reducing domestic revenue collection in fiscal year 2013/14. Secondly, capacity constraints experienced during
the fiscal year led to a slowdown in the implementation of capital projects and lower draw-down of external
project funds in the fiscal year 2013/14. Finally, the budget for the fiscal year assumed the implementation of
select revenue measures to achieve their revenue objectives. Delayed implementation of some of these measures,
together with lags in the accrual of additional revenue from them reduced domestic resource mobilization and
Government spending (MINECOFIN, 2014).
The overall internal budget execution for MINAGRI is given below (Table 13). It should be noted that the ‘total
budget’ represented in the table only captures MINAGRI’s own budget and internal government financing. This
does not therefore capture the total financing in the agriculture sector, which also includes significant external
financing for projects, other Ministry’s agricultural programs and off-budget development partner interventions.
Table 13: MINAGRI Internal Budget Execution FY 2013/14
S.No Expenditure Classification Allocation (RwF) Execution (RwF) Execution Rate (%)
1+2 TOTAL 34,389,460,226 40,834,299,889 118.74
1 RECURRENT 8,287,596,100 8,388,967,332 101.22
1.1 WAGES AND SALARIES 414,900,388 404,877,259 97.58
1.2 GOODS AND SERVICES 1,756,940,594 2,175,459,728 123.82
1.3 TRANSFERS 6,115,755,118 5,808,630,345 94.98
2 DOMESTIC CAPITAL 26,101,864,126 32,445,332,557 124.30
Source: MINAGRI
Agricultural production, mainly of food crops, grew by 3 percent in season B. Growth has slightly declined in
season B because of the shortage of rainfall. The production of export crops, tea and coffee, generated 223 million
USD in revenues. (NAEB, 2014) MINAGRI over-executed its budget for FY 2013/14 due to accepted
overspending in the development budget. A considerable proportion of this over-expenditure was allocated to
priority Crop Intensification (payment for pending invoices of fertilizers), Irrigation (GFI, PADAB and PAIRB)
and the finalisation of Mukamira diary; which are major priorities for agriculture sector development. The Crop
Intensification Program (CIP), Government Funded Irrigation, PADAB, PAIRB and LISP projects initially
received substantially less resources than planned but later in the financial year the program received additional
transfers from the Ministry of Finance and Economic Planning. The overspending was approved according to due
process by the Cabinet & MINECOFIN. Overspending in the recurrent budget was due to compensation made to
farmers who had imported cows from Germany and Holland and returned them to MINAGRI. The budget over-
execution highlights the demand for resources to achieve ambitious sector targets, which recognizes that
agriculture is a pivotal driver of national economic growth and remains the primary source of employment for the
majority of Rwanda’s population. Table 14 presents MINAGRI’s budget execution disaggregated according to
the PSTA III programmes and sub-programmes.
Table 14: Budget Execution by PSTA III Programmes & Sub-Programmes
Programme/Sub Programme Allocation (RwF) Execution (RwF) Execution Rate
(%)
TOTAL 34,389,460,226 40,834,299,889 118.74
1 ADMINISTRATIVE AND SUPPORT
SERVICES
7,116,354,755 7,223,733,866 101.51
1.1 ADMINISTRATIVE AND SUPPORT
SERVICES:NAEB
1,147,816,011 1,147,816,011 100.00
1.2 ADMINISTRATION AND SUPPORT
SERVICES RAB
4,441,949,839 4,378,241,111 98.57
1.3 ADMINISTRATION AND SUPPORT
SERVICES:MINAGRI
1,526,588,905 1,697,676,744 111.21
2 AGRICULTURE AND ANIMAL
RESOURCE INTENSIFICATION
19,200,095,912 23,460,342,636 122.19
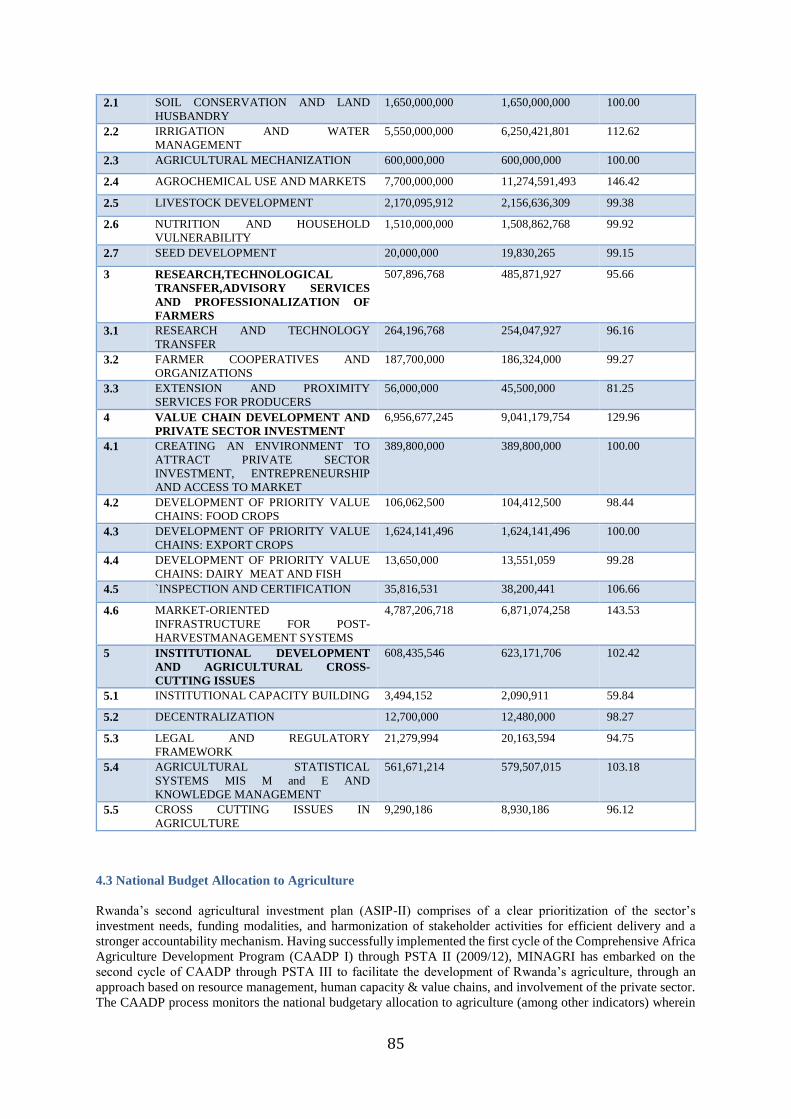
85
2.1 SOIL CONSERVATION AND LAND
HUSBANDRY
1,650,000,000 1,650,000,000 100.00
2.2 IRRIGATION AND WATER
MANAGEMENT
5,550,000,000 6,250,421,801 112.62
2.3 AGRICULTURAL MECHANIZATION 600,000,000 600,000,000 100.00
2.4 AGROCHEMICAL USE AND MARKETS 7,700,000,000 11,274,591,493 146.42
2.5 LIVESTOCK DEVELOPMENT 2,170,095,912 2,156,636,309 99.38
2.6 NUTRITION AND HOUSEHOLD
VULNERABILITY
1,510,000,000 1,508,862,768 99.92
2.7 SEED DEVELOPMENT 20,000,000 19,830,265 99.15
3 RESEARCH,TECHNOLOGICAL
TRANSFER,ADVISORY SERVICES
AND PROFESSIONALIZATION OF
FARMERS
507,896,768 485,871,927 95.66
3.1 RESEARCH AND TECHNOLOGY
TRANSFER
264,196,768 254,047,927 96.16
3.2 FARMER COOPERATIVES AND
ORGANIZATIONS
187,700,000 186,324,000 99.27
3.3 EXTENSION AND PROXIMITY
SERVICES FOR PRODUCERS
56,000,000 45,500,000 81.25
4 VALUE CHAIN DEVELOPMENT AND
PRIVATE SECTOR INVESTMENT
6,956,677,245 9,041,179,754 129.96
4.1 CREATING AN ENVIRONMENT TO
ATTRACT PRIVATE SECTOR
INVESTMENT, ENTREPRENEURSHIP
AND ACCESS TO MARKET
389,800,000 389,800,000 100.00
4.2 DEVELOPMENT OF PRIORITY VALUE
CHAINS: FOOD CROPS
106,062,500 104,412,500 98.44
4.3 DEVELOPMENT OF PRIORITY VALUE
CHAINS: EXPORT CROPS
1,624,141,496 1,624,141,496 100.00
4.4 DEVELOPMENT OF PRIORITY VALUE
CHAINS: DAIRY MEAT AND FISH
13,650,000 13,551,059 99.28
4.5 `INSPECTION AND CERTIFICATION 35,816,531 38,200,441 106.66
4.6 MARKET-ORIENTED
INFRASTRUCTURE FOR POST-
HARVESTMANAGEMENT SYSTEMS
4,787,206,718 6,871,074,258 143.53
5 INSTITUTIONAL DEVELOPMENT
AND AGRICULTURAL CROSS-
CUTTING ISSUES
608,435,546 623,171,706 102.42
5.1 INSTITUTIONAL CAPACITY BUILDING 3,494,152 2,090,911 59.84
5.2 DECENTRALIZATION 12,700,000 12,480,000 98.27
5.3 LEGAL AND REGULATORY
FRAMEWORK
21,279,994 20,163,594 94.75
5.4 AGRICULTURAL STATISTICAL
SYSTEMS MIS M and E AND
KNOWLEDGE MANAGEMENT
561,671,214 579,507,015 103.18
5.5 CROSS CUTTING ISSUES IN
AGRICULTURE
9,290,186 8,930,186 96.12
4.3 National Budget Allocation to Agriculture
Rwanda’s second agricultural investment plan (ASIP-II) comprises of a clear prioritization of the sector’s
investment needs, funding modalities, and harmonization of stakeholder activities for efficient delivery and a
stronger accountability mechanism. Having successfully implemented the first cycle of the Comprehensive Africa
Agriculture Development Program (CAADP I) through PSTA II (2009/12), MINAGRI has embarked on the
second cycle of CAADP through PSTA III to facilitate the development of Rwanda’s agriculture, through an
approach based on resource management, human capacity & value chains, and involvement of the private sector.
The CAADP process monitors the national budgetary allocation to agriculture (among other indicators) wherein
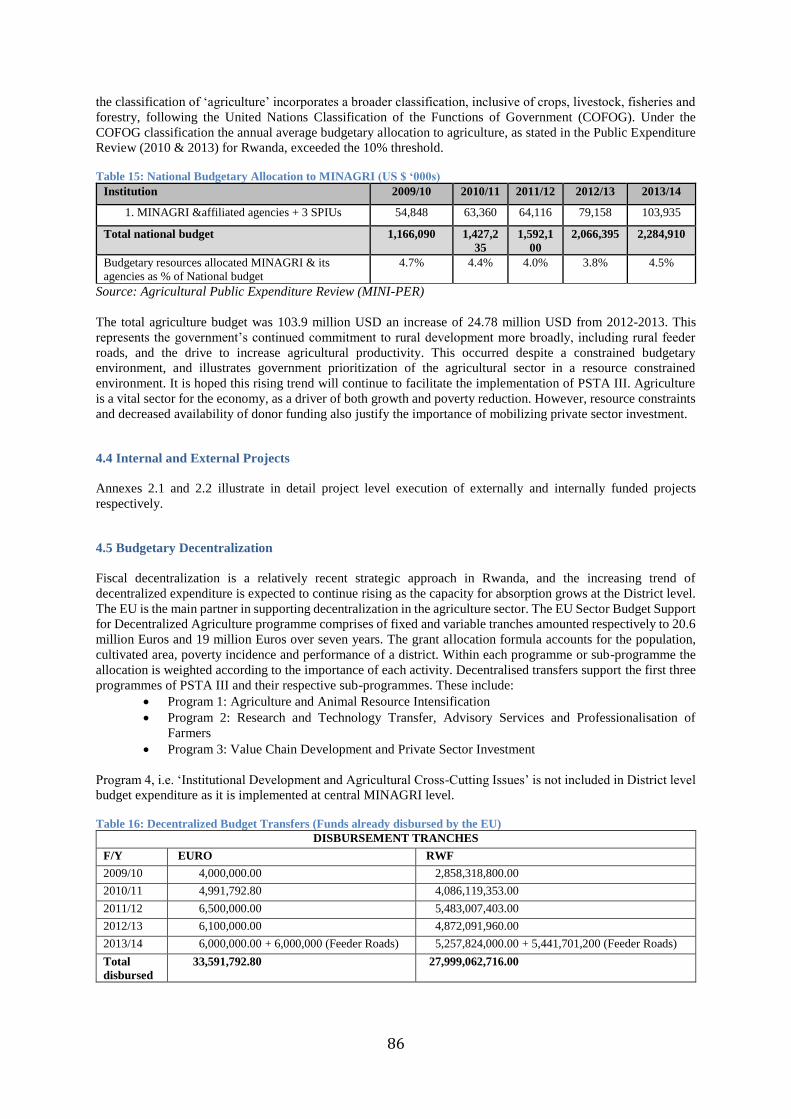
86
the classification of ‘agriculture’ incorporates a broader classification, inclusive of crops, livestock, fisheries and
forestry, following the United Nations Classification of the Functions of Government (COFOG). Under the
COFOG classification the annual average budgetary allocation to agriculture, as stated in the Public Expenditure
Review (2010 & 2013) for Rwanda, exceeded the 10% threshold.
Table 15: National Budgetary Allocation to MINAGRI (US $ ‘000s)
Institution 2009/10 2010/11 2011/12 2012/13 2013/14
1. MINAGRI &affiliated agencies + 3 SPIUs 54,848 63,360 64,116 79,158 103,935
Total national budget 1,166,090 1,427,2
35
1,592,1
00
2,066,395 2,284,910
Budgetary resources allocated MINAGRI & its
agencies as % of National budget
4.7% 4.4% 4.0% 3.8% 4.5%
Source: Agricultural Public Expenditure Review (MINI-PER)
The total agriculture budget was 103.9 million USD an increase of 24.78 million USD from 2012-2013. This
represents the government’s continued commitment to rural development more broadly, including rural feeder
roads, and the drive to increase agricultural productivity. This occurred despite a constrained budgetary
environment, and illustrates government prioritization of the agricultural sector in a resource constrained
environment. It is hoped this rising trend will continue to facilitate the implementation of PSTA III. Agriculture
is a vital sector for the economy, as a driver of both growth and poverty reduction. However, resource constraints
and decreased availability of donor funding also justify the importance of mobilizing private sector investment.
4.4 Internal and External Projects
Annexes 2.1 and 2.2 illustrate in detail project level execution of externally and internally funded projects
respectively.
4.5 Budgetary Decentralization
Fiscal decentralization is a relatively recent strategic approach in Rwanda, and the increasing trend of
decentralized expenditure is expected to continue rising as the capacity for absorption grows at the District level.
The EU is the main partner in supporting decentralization in the agriculture sector. The EU Sector Budget Support
for Decentralized Agriculture programme comprises of fixed and variable tranches amounted respectively to 20.6
million Euros and 19 million Euros over seven years. The grant allocation formula accounts for the population,
cultivated area, poverty incidence and performance of a district. Within each programme or sub-programme the
allocation is weighted according to the importance of each activity. Decentralised transfers support the first three
programmes of PSTA III and their respective sub-programmes. These include:
Program 1: Agriculture and Animal Resource Intensification
Program 2: Research and Technology Transfer, Advisory Services and Professionalisation of
Farmers
Program 3: Value Chain Development and Private Sector Investment
Program 4, i.e. ‘Institutional Development and Agricultural Cross-Cutting Issues’ is not included in District level
budget expenditure as it is implemented at central MINAGRI level.
Table 16: Decentralized Budget Transfers (Funds already disbursed by the EU)
DISBURSEMENT TRANCHES
F/Y EURO RWF
2009/10 4,000,000.00 2,858,318,800.00
2010/11 4,991,792.80 4,086,119,353.00
2011/12 6,500,000.00 5,483,007,403.00
2012/13 6,100,000.00 4,872,091,960.00
2013/14 6,000,000.00 + 6,000,000 (Feeder Roads) 5,257,824,000.00 + 5,441,701,200 (Feeder Roads)
Total
disbursed
33,591,792.80 27,999,062,716.00

87
The budget execution of decentralized transfers disaggregated across districts and sub-programmes have been
presented in Annex 3. The total district level budget was 5,027,052,080 Rwf in 2013/14 with the execution rate
of 97%. Funds already disbursed by the EU in this regard are detailed in Table 16.
88
SECTION 5: CHALLENGES FROM
FY 2013-2014 AND PRIORITIES FOR
FY 2014-2015

89
5.1 Challenges faced in FY 2013/14
Based on the analysis of MINAGRI implementation in FY 2013-2014, below are some key challenges faced by
the sector in the last financial year:
1. Over execution of the budget (at 118.74% for the total budget) is a concern as it represents the need for
further resources to meet the high level priorities of the Ministry. The financing gap for key projects such as
irrigation is a challenge in light of the Government of Rwanda Seven Year Plan and Vision 2020 targets,
which requires substantial increases in expensive interventions including irrigated land.
2. Leveraging private sector investment remains a challenge. The public sector alone cannot achieve the
ambitious targets set, even with development partner support. MINAGRI must continue to focus on attracting
private sector investors, creating a market for growth and removing barriers to market efficiency. This is
particularly important to ensure sustainability of different agricultural programmes.
3. MINAGRI must continue to engage with the ASWG and all sector actors on vital strategic issues, particularly
malnutrition. NGOs are an important part of the agricultural forum and collaboration must be increased to
facilitate effective and accountable actions in the development process.
4. Capacity gaps persist at all delivery levels and in all processes including planning and implementation. The
SCBI has started well and contributed to building capacity in key strategic areas, but capacity building efforts
need to be more uniformly adopted and the model expanded. After the plan is validated, training and other
actions will begin to close capacity and knowledge gaps.
5. Decentralised delivery is a challenge because it is still at an early stage in Rwanda, and local government
does not have the necessary systems to efficiently execute budget and programmes at the district, sector and
cell level. MINAGRI is working to counter this, with support from the EU, and the decentralisation of
responsibilities such as the Girinka programme and animal health will help build local skills and
implementation networks.
6. To better implement EDPRS II interventions with implications beyond the agricultural sector, and to leverage
integrated private sector investment MINAGRI must improve its coordination with other relevant institutions,
particularly RDB, MINECOFIN, MININFRA, MINALOC and MINICOM.
7. Knowledge management within the Ministry could be improved to ensure better sharing of plans, results and
best practices. M and E systems require extensive labour and travel to ensure figures are accurate. An online
Management Information System (MIS) and shared server which is being introduced would allow information
to be shared more easily and better and more timely tracking of data.
The 2014-2015 financial year is an opportunity to overcome these challenges with the continued implementation
of PSTA III. This is also an exciting time for the sector as we move towards a new model of financing and
investment, focused on the private sector.
5.2 Strategic Priorities for 2014-2015
Table 17: Key Priorities for FY 2014/15
Priorities for FY 2014/15 Projects & Programs Sub-
Programme
of PSTA III
Relation to EDPRS II
1. Irrigation & Soil
Conservation
1. GFI
2. RSSP (C.P)
3. LWH (C.P)
4. PAIRB (C.P)
5. KWAMP (C.P)
6.ETI
1.1,
1.2
Increase sustainably agricultural
productivity & mitigate production risks -
reduce dependence on rain-fed agricultural
productivity and help hedge against climactic
variability

90
2. Crop Intensification &
Extension
1. Crop Intensification
Program
2.Mechanization
Programme
1.4,
1.3,
2.1,
2.2
Food security and increased productivity –
farmer extension, together with research and
distribution of inputs, integrated with
mechanization/ modernization of farming
techniques
3. Post-Harvest Handling
and Storage Activities,
Feeder Road Management
& Strategic Grain Reserve
1.NSR
2.PASP
3.9 Improving quality of marketable produce
for consumption and income-generation,
securing national reserves which increases
food security. Also leveraging private
sector investment through improved quality
of goods and market access.
4. Livestock
Infrastructure &
Development
1.One-Cow Program
2. One-Cup of Milk
3. LISP
4. LIP
5. Integrated cattle
and goat production
and fattening project
1.6, 3.9,
1.7
Quality and quantity enhancement of animal
resource products and marketing for income
generation and food and nutritional
benefits
5. Export and Value-
Added Promotion for
Traditional and Non-
Traditional Products
Totals
1. Improving Coffee
Productivity
2. Commodity Chain
Development
3. Flower Park
Construction
4. Kigali Wholesale
Market
5. Tea expansion
project
6.Development of
new agric export
chains
7. Increasing
pyrethrum
productivity
3.3, 3.5, 3.9 Export revenues and growth, private sector
engagement, income-generation and
malnutrition reduction through diversified
production, and penetrating new export
markets
6. Research
Improvements &
Dissemination
1. SPAT II (C.P)
2. Gene bank
3. RAPP (Rwanda
Agriculture
Productivity Project)
2.3, 2.2, 2.1,
1.5
Innovation to improve productivity with
improved links to farmer extension, driving
up incomes.
Annex 1: Sector Indicators Matrix
Sector Outcome Indicator Baseline Targets Achievement
2013/14 2013/2014

91
1 Increased
sustainably
agriculture
productivity
Yield
(MT/ha/year) of
priority crops.
Maize: 2.45
Wheat: 1.8
Rice: 4.85
Bush Beans: 0.65
Climbing beans:
1.7
Irish Potato: 14
Soybeans: 0.63
Cassava: 12.3
Milk production
per cow(in liters)
Coffee yield(Kg
of
cherry/tree/year)
Maize: 4
Wheat: 3
Rice: 5.0
Bush Beans:
1.2
Climbing
Beans: 3.0
Irish Potato: 20
Soybeans: 1.8
Cassava: 18
Milk: 4.5
Coffee: 2.3
Maize: 2
Wheat: 2.038
Rice: 5.4
Bush Beans: 0.5
Climbing Beans:1.2
Irish Potato: 13
Soybeans: 0.66
Cassava: 16.3
Milk: 5
Coffee: 2.4
2 Increased
sustainably
animal resources
productivity
Proportion of
animal protein
production in
total of
recommended
''safe'' protein
consumption
14.2 16 16.7
3 Increased
household food
security and
nutrition
Percentage of
households that
reach acceptable
food consumption
standards (FCS))
79 80.2 To be provided by
CFSVA in next year
4 Transformed
agriculture
through research
and extension
services.
Ratio of extension
workers per
farmer household
1/839 1/500 1/500
Propotion of
Farmer
Households
adopting new
introduced
technologies
20% 25% 27%
5 Enhanced
agribusiness
environment for
agricultural
enterprises.
Increased cash
crops
commodities
revenues (%):
Coffee: 5%
(2012)
Tea: 7% (2012)
Pyrethrum: 16%
(2012)
14%/year
coffee
15%/year tea
20%/year
pyrethrum
60%/year
horticulture
-31%/year coffee
-16%/year tea
-56%/year pyrethrum
40%/year horticulture
Increase in
agricultural
finance lending
for agriculture
sector
(production and
agroprocessing)
(% of total)
3.60% 4.70% 6.10%
6 Improved post
harvest
management and
agro processing
promotion
% of post harvest
losses reduced
22% for maize
(2012)
15% for rice
(2012)
26.03% for wheat
(2013 A)
13% (maize);
12.6% (rice);
20% (wheat);
10.4(maize);
8.3 %(rice);
14.8% (wheat);
7 Developed
institutional
capacity and
Updated gender
sensitive MIS
Framework
No operational
MIS Framework
Draft M&E
Framework
Draft M&E Framework
is available
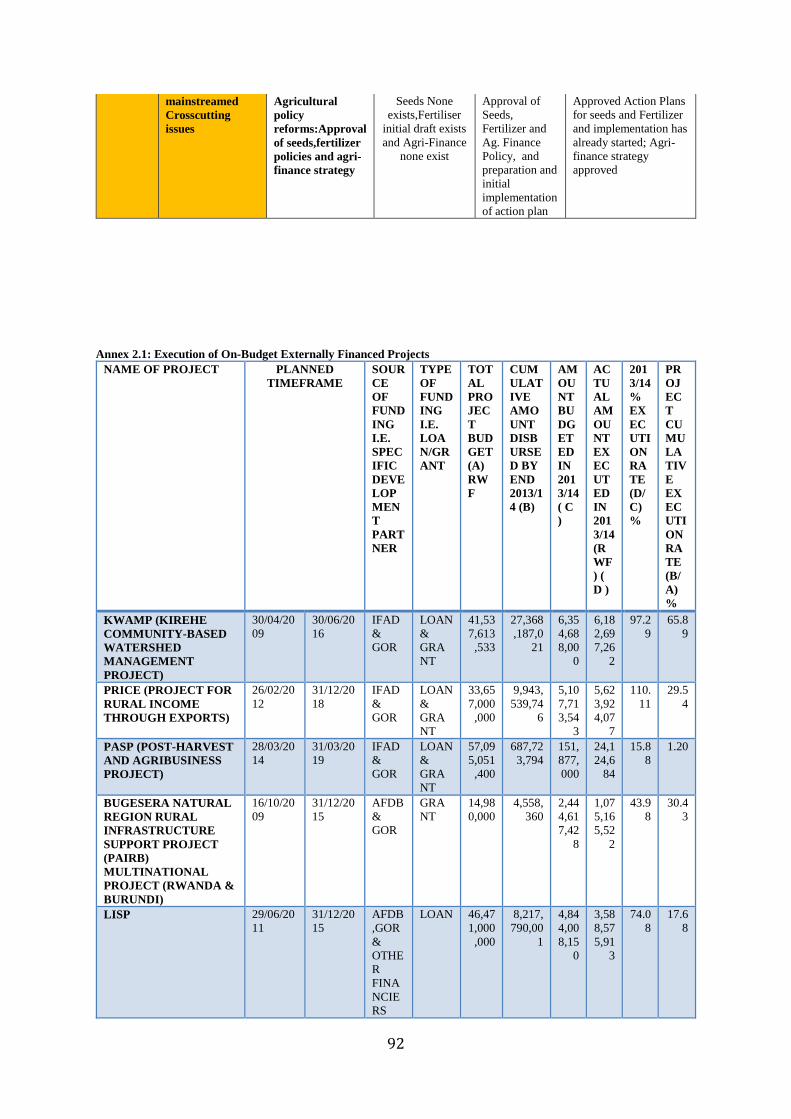
92
mainstreamed
Crosscutting
issues
Agricultural
policy
reforms:Approval
of seeds,fertilizer
policies and agri-
finance strategy
Seeds None
exists,Fertiliser
initial draft exists
and Agri-Finance
none exist
Approval of
Seeds,
Fertilizer and
Ag. Finance
Policy, and
preparation and
initial
implementation
of action plan
Approved Action Plans
for seeds and Fertilizer
and implementation has
already started; Agri-
finance strategy
approved
Annex 2.1: Execution of On-Budget Externally Financed Projects
NAME OF PROJECT PLANNED
TIMEFRAME
SOUR
CE
OF
FUND
ING
I.E.
SPEC
IFIC
DEVE
LOP
MEN
T
PART
NER
TYPE
OF
FUND
ING
I.E.
LOA
N/GR
ANT
TOT
AL
PRO
JEC
T
BUD
GET
(A)
RW
F
CUM
ULAT
IVE
AMO
UNT
DISB
URSE
D BY
END
2013/1
4 (B)
AM
OU
NT
BU
DG
ET
ED
IN
201
3/14
( C
)
AC
TU
AL
AM
OU
NT
EX
EC
UT
ED
IN
201
3/14
(R
WF
) (
D )
201
3/14
%
EX
EC
UTI
ON
RA
TE
(D/
C)
%
PR
OJ
EC
T
CU
MU
LA
TIV
E
EX
EC
UTI
ON
RA
TE
(B/
A)
%
KWAMP (KIREHE
COMMUNITY-BASED
WATERSHED
MANAGEMENT
PROJECT)
30/04/20
09
30/06/20
16
IFAD
&
GOR
LOAN
&
GRA
NT
41,53
7,613
,533
27,368
,187,0
21
6,35
4,68
8,00
0
6,18
2,69
7,26
2
97.2
9
65.8
9
PRICE (PROJECT FOR
RURAL INCOME
THROUGH EXPORTS)
26/02/20
12
31/12/20
18
IFAD
&
GOR
LOAN
&
GRA
NT
33,65
7,000
,000
9,943,
539,74
6
5,10
7,71
3,54
3
5,62
3,92
4,07
7
110.
11
29.5
4
PASP (POST-HARVEST
AND AGRIBUSINESS
PROJECT)
28/03/20
14
31/03/20
19
IFAD
&
GOR
LOAN
&
GRA
NT
57,09
5,051
,400
687,72
3,794
151,
877,
000
24,1
24,6
84
15.8
8
1.20
BUGESERA NATURAL
REGION RURAL
INFRASTRUCTURE
SUPPORT PROJECT
(PAIRB)
MULTINATIONAL
PROJECT (RWANDA &
BURUNDI)
16/10/20
09
31/12/20
15
AFDB
&
GOR
GRA
NT
14,98
0,000
4,558,
360
2,44
4,61
7,42
8
1,07
5,16
5,52
2
43.9
8
30.4
3
LISP 29/06/20
11
31/12/20
15
AFDB
,GOR
&
OTHE
R
FINA
NCIE
RS
LOAN 46,47
1,000
,000
8,217,
790,00
1
4,84
4,00
8,15
0
3,58
8,57
5,91
3
74.0
8
17.6
8

93
RSSP III (RURAL
SUPPORT SECTOR
PROJECT)
20/06/20
12
30/10/20
17
WB &
GOR
LOAN
&
GRA
NT
51,00
0,000
,000
23,857
,238,1
20
14,4
71,3
08,4
82
13,6
52,3
18,3
41
94
47
LWH (LAND
HUSBANDRY, WATER
HARVESTING AND
HILLSIDE
IRRIGATION
PROJECT)
2010/201
1
2017/201
8
GAFS
P,WB,
CIDA,
USAI
D &
GOR
LOAN
&
GRA
NT
88,24
2,362
,600
42,539
,338,9
14
19,1
30,9
76,8
96
17,2
71,7
42,4
56
90
48
SUPPORT TO SPAT
II/MINAGRI
01-JUL-
11
30-JUN-
16
THE
KING
DOM
OF
BELG
IUM
GRA
NT
18,00
0,000
11,591
,201
4,14
2,94
1,56
7
4,22
3,54
2,99
5
101.
95
64.4
0
*Total Budget for LISP including finances yet to be mobilized:50,000,000 UA=
[(38,000,000U.A=/Donors'amount=21,810,000 U.A from ADB+16,190,000 U.A from other co-financing partners not yet
found)+12,000,000 UA from GoR]
**1 USD=689.1779 RWF on 30.09.14
Annex 2.2: Execution of On-Budget Domestically Financed Projects
MINAGRI CENTRAL
PROJECT APPROVED COMMI
TED
BALANC
E
EXEC
.%
2316 GISHWATI LAND AND WATER MANAGEMENT (
GLWM)
1,500,000,000 1,500,000,
000
0 100
2311 IMMEDIATE ACTION IRRIGATION PROJECT (
GFI )
4,600,000,000 5,052,434,
758
-
452,434,7
58
110
2315 AGRICULTURAL MECHANISATION
PROGRAMME
600,000,000 600,000,0
00
0 100
2316 PRIORITY CROPS INTENSIFICATION (
INCLUDING FERTIZER IMPORTS )
6,200,000,000 8,558,880,
834
-
2,358,880,
834
138
2315 LISP ( OTHER SPECIALIZED EQUIPMENT ) 750,000,000 1,727,200,
000
-
977,200,0
00
230
2316 LISP ( OTHER CULTIVATED ASSETS ) 1,690,000,000 3,666,020,
780
-
1,976,020,
780
217
2321 STRATEGIC STOCKS 1,377,853,478 1,377,853,
478
0 100
SUB TOTAL 16,717,853,47
8
22,482,38
9,850
-
5,764,536,
372
134
PROJECTS COUNTER PART FUNDING
2642 LAND HUSBANDRY HILLSIDE IRRIGATION
AND WATER (LWH )
150,000,000 150,000,0
00
0 100
2642 RURAL SECTOR SUPPORT PROJECT ( RSSP ) 350,000,000 350,000,0
00
0 100
2642 PROJET D'APPUI AU DEVELOPPEMENT
AGRICOLE DE BUGESERA ( PADAB)
334,353,899 482,353,8
99
-
148,000,0
00
144
2642 PROJET D'APPUI AUX INFRASTRUCTURES
RURALES DE LA …….( PAIRB )
50,000,000 115,633,1
44
-
65,633,14
4
231
2642 KIREHE WATERSHED MANAGEMENT PROJECT
( KWAMP )
250,000,000 250,000,0
00
0 100

94
2642 SPAT II 160,000,000 160,000,0
00
0 100
2316 SERICULTURE 100,000,000 100,000,0
00
0 100
2642 PROJECT FOR RURAL INCOME THROUGH
EXPORTS ( PRICE )
150,000,000 150,000,0
00
0 100
SUB TOTAL 1,544,353,899 1,757,987,
043
-
213,633,1
44
114
TOTAL DEVELOPMENT BUDGET 18,262,207,37
7
24,240,37
6,893
-
5,764,536,
372
133
Notes:
Development Budget Figures from 01/07/2013 to 30/06/2014
Priority Crops Intensification: In order to pay the pending invoices of fertilizers, MINECOFIN authorised an
overspending of 2 358 880 834 Rwf, instead of spending 6 200 000 000 Rwf budgeted for, we spent a total
amount of 8 558 880 834 Rwf where the budget execution increased up to 138 %.
IMMEDIATE ACTION IRRIGATION PROJECT ( GFI ) : Budget execution increased up to 110 because
MIECOFIN authorised an overspending of 452,434,758 frws.
LISP : Budget execution increased up to 221% because MINECOFIN authorised an overspending of 2
,953,220,780 frws
PADAB : Budget execution increased up to 144 % because MINECOFIN authorised an overspending of
148,000,000 frws;
PAIRB : Budget execution increased up to 231% because MINECOFIN authorised an overspending of 65,633,144
frws;
RWANDA AGRICULTURAL BOARD (RAB)
2013 -14 GOR PROGRESS BUDGET EXECUTION BY
COMMITMENTS (30 JUNE 2014)
DESCRIPTION APPROVED
BUDGET AMOUNT
EXECUTION
AMOUNT
CURRENT
COMMITM
ENTS (OP
FOR
PAYMENT
AT OT,
PENDING
COMMITM
ENTS)
BUDGET
BALANCE
CURREN
T
EXECUTI
ON RATE
%
1. DEVELOPMENT
BUDGET
5,146,965,912 5,136,874,498 11,721,617 -1,630,203 99.80
BANANA
PROGRAM
100,000,000 98,350,000
1,650,000
98.35
GENETIC
IMPROVEMENT
500,000,000 476,916,054 23,083,946
95.38
POULTRY
DEVELOPMENT
178,902,734 157,852,709 21,050,025
88.23
ONE CUP OF
MILK PER CHILD
1,500,000,000 1,499,579,633 420,367
99.97
ONE COW PER
POOR FAMILY
1,168,063,178 1,211,302,719 5,075,000 -48,314,541
103.70
SUPPORT TO
RESEARCH
200,000,000 192,873,383 6,646,617 480,000
96.44
PRIORITY CROPS
INTENSIFICATION
(INCLUDING
FERTILIZERS
IMPORTS)
1,500,000,000 1,500,000,000 0
100.00
NATIONAL AGRICULTURAL EXPORT BOARD

95
PROGRAMME/ SUB-PROGRAMME/PROJECT Annual
budget
Realization as on
30/06/2014
Execution
rate
DEVELOPMENT BUDGET in Rwf 1,857,691,496 1,651,354,786 88.89
FLOWER PARK CONSTRUCTION 389,800,000 389,800,000 100.00
IMPROVING COFFEE PRODUCTION,
PRODUCTIVITY AND QUALITY
245,000,000 245,000,000 100.00
COMMODITY CHAIN PROGRAMME (
HORTICULTURE INTENSIFICATION )
372,891,496 372,891,496 100.00
TEA EXPANSION PROJECT 750,000,000 575,132,867 76.68
KIGALI WHOLESALES MARKET 100,000,000 68,530,423 68.53

96
Annex 3: Budget Execution Disaggregated by District & Sub-Programme
BUDGET COMMITMENT PAYMENT %
NGOMA 159,959,370 159,959,370 100
Construction of maize drying ground 13,544,851 13,544,851 100
Creation of Agribusiness modal fruit production centers 37,651,144 37,651,144 100
Veterinary Salaries 21,055,944 21,055,944 100
Afforestation project 25,910,694 25,910,694 100
Promotion of famers organization and capacity building 10,018,752 10,018,752 100
Livestock projects 51,777,985 51,777,985 100
BUGESERA 123,615,803 117,660,818 95
Veterinary services support project 23,819,940 17,864,955 75
Constriction of drying grounds in Rweru sector 12,090,000 12,090,000 100
Small scale irrigation in Juru sector,Mareba sector ,Mayange sector Mwogo sector 28,834,644 28,834,644 100
Farmers organisation and capacity building of producers project 6,019,403 6,019,403 100
Integrated system of intesive agricultural and livestock production project 52,851,816 52,851,816 100
GATSIBO 108,211,802 108,211,802 100
Installation of electricity in veternary lab 1,860,000 1,860,000 100
Veterinary services support project 21,055,944 21,055,944 100
Construction of water ponds 23,976,368 23,976,368 100
Girinka Programme 37,000,000 37,000,000 100
Animal disease contral 8,000,000 8,000,000 100
Artificial insermination 5,301,970 5,301,970 100
Construction drying ground 11,017,520 11,017,520 100
KAYONZA 117,279,103 117,279,103 100
Market oriented rural infrastrucure project 13,245,205 13,245,205 100
Veternary services support project 20,400,000 20,400,000 100
Integrated system of intensive agricultural and livestock production project 47,809,053 47,809,053 100

97
Irrigation develooment project 28,855,626 28,855,626 100
Farmers organisation and capacity building of producers project 6,969,219 6,969,219 100
KIREHE 87,212,473 87,212,473 100
Market oriented rural infrastructure project 12,631,320 12,631,320 100
Veterinary Services Support Project 19,977,492 19,977,492 100
Integrated system of intensive agricultural and livestock production project 44,433,381 44,566,608 100
Farmers organizations and capacity building of producers project 10,170,280 10,037,053 99
NYAGATARE 196,548,063 190,934,818 97
Supply of Damsheets 34,520,176 34,520,176 100
Salary veterinaries 21,800,000 16,186,755 74
PROGRESSIVES TERRACES 400 Ha 67,807,375 67,807,375 100
Drying ground in Karama Sector 12,889,758 12,889,758 100
Girinka Program 40,600,000 40,600,000 100
Insemination 3,500,000 3,500,000 100
Vaccination 8,279,447 8,279,447 100
Capacity building of farmers and producers 7,151,307 7,151,307 100
RWAMAGANA 136,949,127 136,949,127 100
Market oriented rural infrastructure project 11,107,319 11,107,319 100
Installation of one green house in Kitazigurwa IDP economic development
activities. 2,790,000 2,790,000 100
Construction of Ha 125 of progressive terraces in Kangabo and Gishike in
Munyaga Sector 32,287,713 32,287,713 100
Veterinary services support project 21,055,944 21,055,944 100
Integrated system of intensive agricultural and livestock production project 38,586,304 38,586,304 100
Irrigation development project 24,631,081 24,631,081 100
Farmers organizations and capacity building of producers project 6,490,766 6,490,766 100
HUYE 189,793,995 189,793,995 100
Construction of Gishamvu livestock market 26,175,236 26,175,236 100
Veterinary Services Support Project 21,055,944 21,055,944 100
Maraba Coffee Intensification Project 33,083,277 33,083,277 100

98
Integrated system of intensive agricultural and livestock production project 60,990,468 60,990,468 100
Farmers organizations and capacity building of producers project 5,598,887 5,598,887 100
Market oriented rural infrastructure project 8,923,244 8,923,244 100
Construction of progressive terraces 33,966,939 33,966,939 100
NYAMAGABE 145,102,702 145,102,702 100
Livestock Vaccination and Insemination 4,081,175 4,081,175 100
Purchase and Distribution of Cows (girinka program) 38,841,773 35,841,773 92
Capacity building of Farmers 8,870,299 8,870,299 100
Payment of Salaries to Livestock Officers ( sectors) 20,400,000 20,400,000 100
Construction of Kaduha Cassava Drying Grounds 11,158,980 11,158,980 100
Development and Valorisation of Radical terraces (30 ha) in musange sector 15,750,475 15,750,475 100
Development and Valorisation of Radical terraces (25 ha)in mugano 9,333,333 12,333,333 132
Development and Valorisation of Radical terraces (30 ha)in kibilizi 6,666,667 6,666,667 100
Development and Valorisationof Radical/progressive terraces (20 ha) in kageri
sector 30,000,000 30,000,000 100
GISAGARA 301,878,549 301,878,549 100
Support farmers to improve banana crop 12,000,000 30,576,189 255
Support the implimentation of banana production processing unit 20,000,000 20,000,000 100
Increase of land use under coffee plantations 92,880,944 74,304,755 80
Development of 100 ha of radical terraces and its valorisation at Nyanza,
Mugombwa, Muganza and Save Sectors (including pig breeding for organic
fumure ) 79,779,777 79,779,777 100
Increase land use consolidation scale for cassava, beans, rice and maize crops 7,545,000 7,195,000 95
Veterinary services support project 31,252,600 26,602,600 85
Farmers organizations and capacity building of producers project (including input
use promotion, training, viodeos for farmers mobilization, preservation parcels for
ecosystem purpose etc) 10,784,418 15,784,418 146
Construction of maize drying ground at kigembe sector 14,274,093 14,274,093 100
Development of progressive terraces 110 ha in Kigembe, Gishubi,
Nyanza,Muganza and Mugombwa 33,361,717 33,361,717 100
MUHANGA 110,652,603 110,652,603 100
Remuneration of Veterinary Sectors 27,146,592 27,146,592 100

99
Increase Post havest facilities 10,126,011 10,126,011 100
MUHANGA: Construction of 30 Ha radical Terracing and Road Gaseke-Nyahinda 0
Insemination of Cow 7,000,000 7,000,000 100
Vaccination 6,860,000 6,860,000 100
Purchase Cow for Girinka Program 39,060,000 39,060,000 100
IDP Model Gasave: Purchasing of cows (PW) 20,460,000 20,460,000 100
KAMONYI 108,447,118 126,218,695 116
Study of Construction of 1 hide and skins collection and treatment plant 7,000,000 7,000,000 100
Construction of 1 maize drying ground in Mugina Sector 7,731,503 5,731,503 74
Construction of 15 dams (Gacurabwenge & Rukoma) 17,098,650 33,535,745 196
Veterinary staff salaries 19,554,952 22,889,452 117
Soil control by Constructing/establishment progressive terraces (200ha) in
Musambira Sector 28,009,214 28,009,196 100
Development of mechanization center by purchasing 2 tractors 14,071,857 14,071,857 100
Vaccination 5,680,942 5,680,942 100
Provide 40 cows to vulnerable households 9,300,000 9,300,000 100
NYANZA 99,461,608 99,461,608 100
Veterinary services support project 15,039,960 15,039,960 100
Construction of maize drying ground in Karama at cyabakamyi sector 8,438,546 39,041,034 463
Purchase of 100 cows in Girinka program 35,340,000 9,931,658 28
Completion of intansification of Banana project in Busoro, Muyira, Ntyazo and
Busasamana Sector on 19,800,000 22,000,000 111
Unused land alluviated by intansification 11,396,882 4,002,736 35
Construct drying ground in Mukingo (Busogwe) Sectors 9,446,220 9,446,220 100
NYARUGURU 213,904,612 213,904,612 100
Construction of Ndago livestock market 32,075,199 32,075,199 100
Support veterinary services project 21,055,944 21,055,944 100
Construction of progressive terraces 27,591,975 27,591,975 100
Integrated system of intensive agricultural and livestock production project 14,760,295 14,760,295 100
Farmers organisations and capacity building of producers 22,676,142 22,676,142 100

100
Construction of Wheat drying ground in Muganza Sector 15,000,000 15,000,000 100
Progressive terraces and agro - forestery trees plantation in Ngera sector 9,524,817 9,524,817 100
Purchase of 200 cows through Girinka program 71,220,240 71,220,240 100
RUSIZI 205,387,057 205,387,057 100
Completion of Giheke Diary construction 13,950,000 13,950,000 100
Rehabilitation of Kamembe Slaughterhouse 4,650,000 4,650,000 100
Construction of Shara Drying ground in Muganza Sector 9,300,000 9,300,000 100
Veterinary services support project 21,600,000 21,600,000 100
Ubudehe Liverstock Projects 99,090,343 99,090,343 100
Integrated system of intesive agricultural and livestock production project 46,046,134 46,046,134 100
Farmers organisation and capacity building of producers project 10,750,580 10,750,580 100
NYABIHU 186,862,958 186,862,958 100
Veterinary services support project 18,047,952 18,047,952 100
Construction of selling points for staple crops products in Gashyushya (Rugera) &
Rubaya (Mukamira) 28,504,394 28,504,394 100
Construction of 35 ha of radical terraces in Mulinga Sector 26,603,050 26,603,050 100
Construction of 250ha of progress terraces in Bigogwe, Shyira, Jomba and
Rurembo VUP sectors 47,246,348 47,246,348 100
Farmers organizations and capacity building of producers project (Farmers
competition,training of agro-facilitators) 6,911,863 6,911,863 100
Integrated system of intensive agricultural and livestock production project
(Animal genetic improvement,animal feeding,animal desease and control,cow on
GIRINKA Programm) 46,553,285 46,553,285 100
Construction of dry ground in SHYIRA sector+Expropriation 12,996,066 12,996,066 100
RUBAVU 237,928,267 237,928,267 100
Construction of vegetable selling point in Nyakiliba sector 45,238,356 45,238,356 100
Construction of 400 ha progressive terraces in Kanama sector 38,600,000 38,600,000 100
Pay contractual personnel( terrassing) 7,286,150 7,286,150 100
Integrated system of intesive agricultural and livestock production project 50,389,222 50,389,222 100
Veterinary Services Support Project 13,896,000 13,896,000 100

101
Farmers organizations and capacity building of producers project (including input
use promotion, training, viodeos for farmers mobilization, preservation parcels for
ecosystem purpose etc) 4,947,795 4,947,795 100
Irrigation development project 9,018,244 9,018,244 100
Market oriented infrastructures project 13,427,306 13,427,306 100
Kabagali livestock market construction 46,177,500 46,177,500 100
Construction of vegetable selling point in Nyakiliba sector 8,947,694 8,947,694 100
Construction of workshop handcraft center in Gisenyi Sector (Agakiriro) 0
KARONGI 351,620,041 350,698,385 100
GIRINKA Program (Purchase of 120 cows and veterinary drugs) 57,798,218 92,012,432 159
Banana Field School at Bwishyura, Mubuga, Gishyita, Gashari, Murambi Sectors:
150 ha 143,000,000 142,078,344 99
Valorization of bench terraces at Rwankuba, Ruganda, Mutuntu, Gitesi, Gishyita,
Murundi, Gashari: 300 ha 51,922,158 51,922,158 100
Purchase and distribution of 1500 improved pigs (Murundi, Murambi, Gashari and
Ruganda) 68,428,428 34,214,214 50
Farmers organizations and capacity building of producers project 4,957,079 4,957,079 100
Veterinary services support project 15,600,000 15,600,000 100
Market oriented rural infrastructure project (ubwanikiro) 9,914,158 9,914,158 100
NGORORERO 314,002,247 314,002,247 100
Create 200 Ha of radical terraces and make them productive
(gatumba,ngorororero,hindiro,matyazo) 175,585,858 175,585,858 100
Market oriented rural infrastructure project 13,052,409 13,052,409 100
Purchase and distribute 350 cows to poor families 106,000,000 106,000,000 100
Veterinary Services Support Project 19,363,980 19,363,980 100
NYAMASHEKE 184,646,277 182,925,293 99
Veterinary services support project 22,559,943 20,838,959 92
Construct Radical Terraces in VUP Sectors (25 ha in Cyato Sector, 30 ha in
Rangiro Sector and 40 ha in Kirimbi Sector) 15,189,473 15,189,473 100
Viabalisation of Radical Terraces in VUP Sectors ( Kirimbi 40 ha, Rangiro 30 ha
and Cyato 25 ha). 55,000,000 78,250,000 142
Anti-Erosive Ditches in VUP Sectors ( Gihombo 45ha and Nyabitekeri 45ha) 33,500,000 33,500,000 100
Integrated system of intesive agricultural and livestock production project 50,676,393 27,426,393 54

102
Farmers organisation and capacity building of producers project 7,720,468 7,720,468 100
RUTSIRO 191,917,812 191,917,798 100
Completion of Construction of Congo Nil slaugther house 11,160,000 11,160,000 100
Construction of a Dry Ground in Musasa Sector 12,928,344 12,928,330 100
Production improvement Project (Banana promotion 52 ha ) in non VUP sectors 29,764,033 29,764,033 100
Production improvement in Radical terrasses (10ha)/Mushubati 7,440,000 7,440,000 100
Production improvement(Banana promotion 38ha ) in Kivumu and Mushubati
sectors 49,915,937 49,915,937 100
Livestock production project ( 90 Cows and veterinary services) 80,709,498 80,709,498 100
BURERA 104,143,156 96,459,178 93
Drying ground facilities construction 13,267,539 13,267,539 100
Veterinary services support project(Veterinary salaries) 25,567,932 17,883,954 70
Support to Girinka program 44,012,767 44,012,767 100
Livestock improvement activities 10,525,364 10,525,364 100
Farmers organizations and capacity building of producers project 9,653,554 9,653,554 100
Food supplies for TIGISTS in constructing terrces in Bungwe sector 1,116,000 1,116,000 100
GICUMBI 375,499,465 224,524,232 60
Drying ground Muko construction (MINAGRI) 12,175,169 12,175,169 100
Byumba Slaughterhouse phase 2 1,039,209 2,078,418 200
Mukarange Livestock Market 7,021,115 -
Construction and retaining walls of Rukomo Veternary laboratory 7,638,032 4,000,000 52
Salaries of sectors veterinaries (MINAGRI) 31,200,000 29,736,787 95
Training and study tours of sectors and cells agronomists (MINAGRI) 8,903,093 6,000,000 67
Artificial insemination (MINAGRI) 6,000,000 15,616,084 260
Vaccination (MINAGRI) 9,616,084 -
Girinka Programme (MINAGRI) 36,650,176 36,650,176 100
Radical terraces construction on 160 ha in MUKO , Giti and Rubaya Sectors (PW) 248,673,514 111,684,525 45
Construction of retaining walls of Rubaya seeds bank (Pw) 6,583,073 6,583,073 100
MUSANZE 68,624,750 68,624,750 100

103
Establish crop demonstration plots 3,219,750 3,219,750 100
Purchase planting materials and other agricultural inputs 14,420,000 14,420,000 100
Support veterinary activities 50,985,000 50,985,000 100
RULINDO 120,036,577 106,089,111 88
Promotion of famers organization and capacity Building 6,705,239 6,705,239 100
Veterinary services support (salaries of veterinarians) (MINAGRI) 25,567,932 11,635,003 46
Radical terracing (25ha) along Bahimba Mashland in MBONGO/BAHIMBA 45,167,931 45,167,931 100
Supply of differents crops (Casava,Coffee, Banana and Fruits Trees) 42,595,475 42,580,938 100
GAKENKE 190,268,003 190,968,003 100
Study ,construction and supervision of slaugther house 47,200,000 47,200,000 100
Veterinary services support project 28,800,000 29,500,000 102
Promotion of commerce agricurture for export (Coffee plantations extension in
Muhondo,Rushashi,Minazi, Ruli and coko sectors (on 500HA ( Phase I). 40,824,000 40,824,000 100
Integrated system of intensive agricultural and livestock production project 49,345,634 49,345,634 100
Farmers organizations and capacity building of producers project 11,632,234 11,632,234 100
Market oriented rural infrastructure project ( drying ground) 12,466,135 12,466,135 100
RUHANGO 163,071,231 192,121,231 118
Construction of Ruhango slaughter house 91,011,121 91,011,121 100
Veterinary services support project(Veterinary salaries) 13,535,964 13,535,964 100
Operationalization of Kabagali pineapple plant machinery 18,950,000 10,000,000 53
Artificial insemination 5,400,000 5,400,000 100
Disease control (vaccination) 7,921,287 2,521,287 32
Girinka Program 0 40,000,000
Farmers organizations and capacity building of producers project 12,142,605 20,808,432 171
Construction of Maize drying ground in Bweramana Sector 7,394,000 4,478,713 61
Construction of Greenhouses in Ruhango and Byimana Sectors 6,716,254 4,365,714 65
NYARUGENGE 59,291,429 59,291,429 100
Veterinary services support project 12,000,000 12,000,000 100
Integrated system of intensive agricultural and livestock production project 29,068,492 29,068,492 100

104
Farmers organizations and capacity building of producers project 8,199,319 8,199,319 100
Project development of high value non traditional export products 10,023,618 10,023,618 100
KICUKIRO 59,321,044 59,321,044 100
Veterinary services support project 12,000,000 12,000,000 100
Farmers organizations and capacity building of producers project 6,913,200 6,913,200 100
Integrated system of intensive agricultural and livestock production project 30,591,081 30,591,081 100
Project development of high value non traditional export products 9,816,763 9,816,763 100
GASABO 115,414,838 115,414,838 100
Veterinary services support Project 22,559,928 22,559,928 100
Farmers organizations and capacity builinding of producers project 10,036,544 10,036,544 100
Project development of haigh value non traditional export products 11,237,950 11,237,950 100
Distribution of 75 cows to Igikumba ( The vulnerable groups/IDP cooperative)
through tender 30,000,000 30,000,000 100
Integrated system of intensive agricultural and livestock production project 41,580,416 41,580,416 100
TOTAL 5,027,052,080 4,887,756,096 97
Annex 4: Schools with Kitchen Gardens
Secondary 2014
NO District Number of Schools Schools with nutrition garden %
1 Gisagara 38 24 63%
2 Huye 52 34 65%
3 Kamonyi 52 36 69%
4 Muhanga 59 39 66%
5 Nyamagabe 52 33 63%
6 Nyanza 47 25 53%

105
7 Nyaruguru 41 29 71%
8 Ruhango 50 33 66%
TOTAL SOUTHERN 391 253 65%
9 Karongi 58 36 62%
10 Ngororero 49 25 51%
11 Nyabihu 44 26 59%
12 Nyamasheke 59 30 51%
13 Rubavu 53 26 49%
14 Rusizi 58 39 67%
15 Rutsiro 47 25 53%
TOTAL WESTERN 368 207 56%
16 Bugesera 41 28 68%
17 Gatsibo 52 29 56%
18 Kayonza 42 32 76%
19 Kirehe 49 31 63%
20 Ngoma 55 29 53%
21 Nyagatare 51 33 65%
22 Rwamagana 56 32 57%
TOTAL EASTERN 346 214 62%
23 Burera 44 22 50%
24 Gakenke 56 37 66%
25 Gicumbi 75 50 67%
26 Musanze 51 30 59%
27 Rulindo 63 48 76%
TOTAL NORTHERN 289 187 65%
28 Gasabo 55 22 40%
29 Kicukiro 39 25 64%

106
30 Nyarugenge 33 12 36%
TOTAL KIGALI CITY 127 59 46%
TOTAL RWANDA 1,521 920 60.5%