minnesota demographic and economic trends
DESCRIPTION
Minnesota Demographic And Economic Trends. Tom Gillaspy, State Demographer Mn Dept of Administration May 2010. U.S. Employment Not Expected to Return to Pre-Recession High Until Spring 2013. Minnesota Wages and Employment Fell During This Recession. - PowerPoint PPT PresentationTRANSCRIPT
Minnesota Demographic And Economic Trends
Tom Gillaspy, State Demographer
Mn Dept of Administration
May 2010
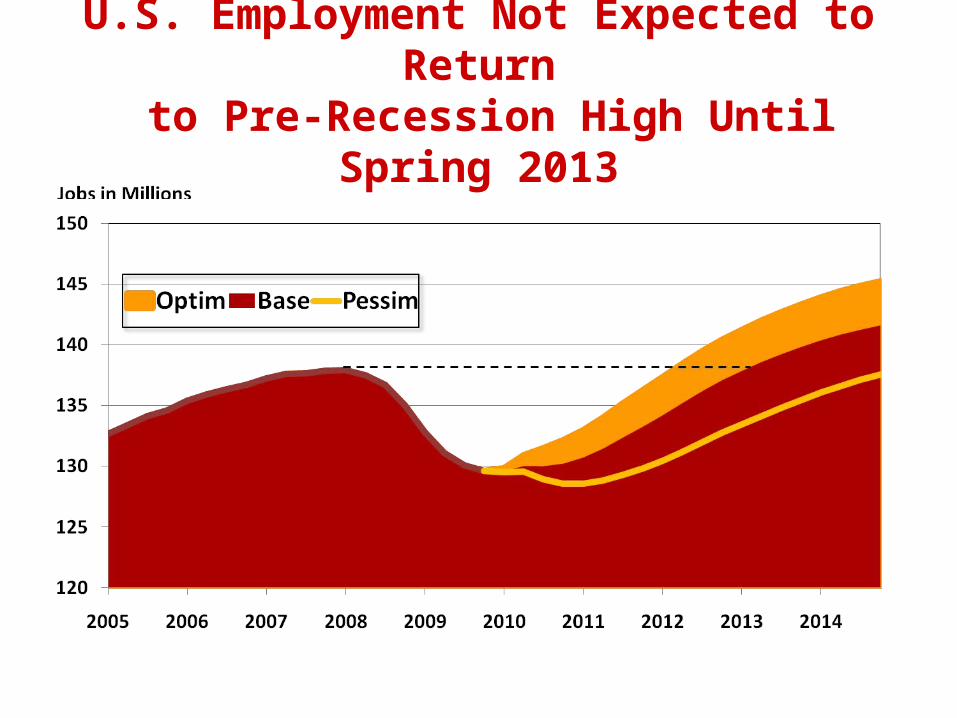
U.S. Employment Not Expected to Return to Pre-Recession High Until Spring 2013
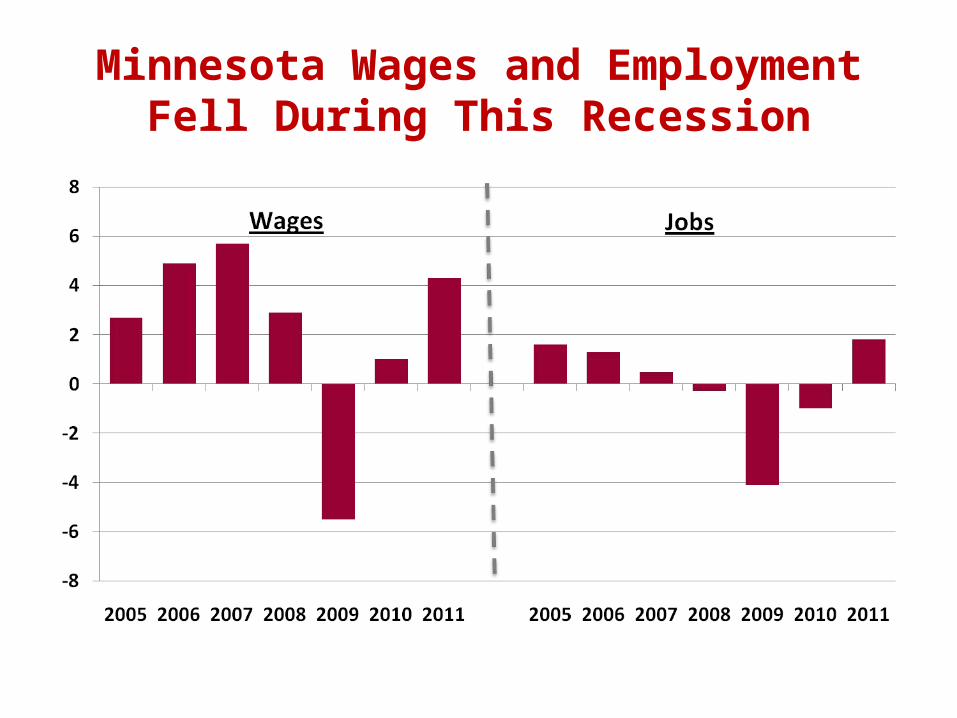
Minnesota Wages and Employment Fell During This Recession
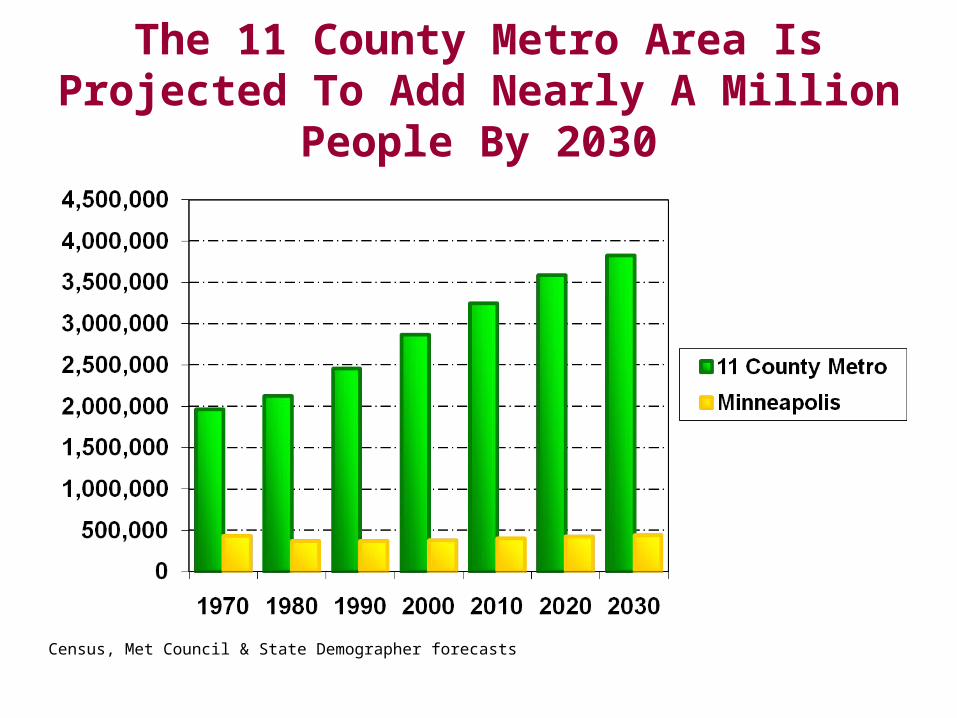
The 11 County Metro Area Is Projected To Add Nearly A Million People By 2030
Census, Met Council & State Demographer forecasts
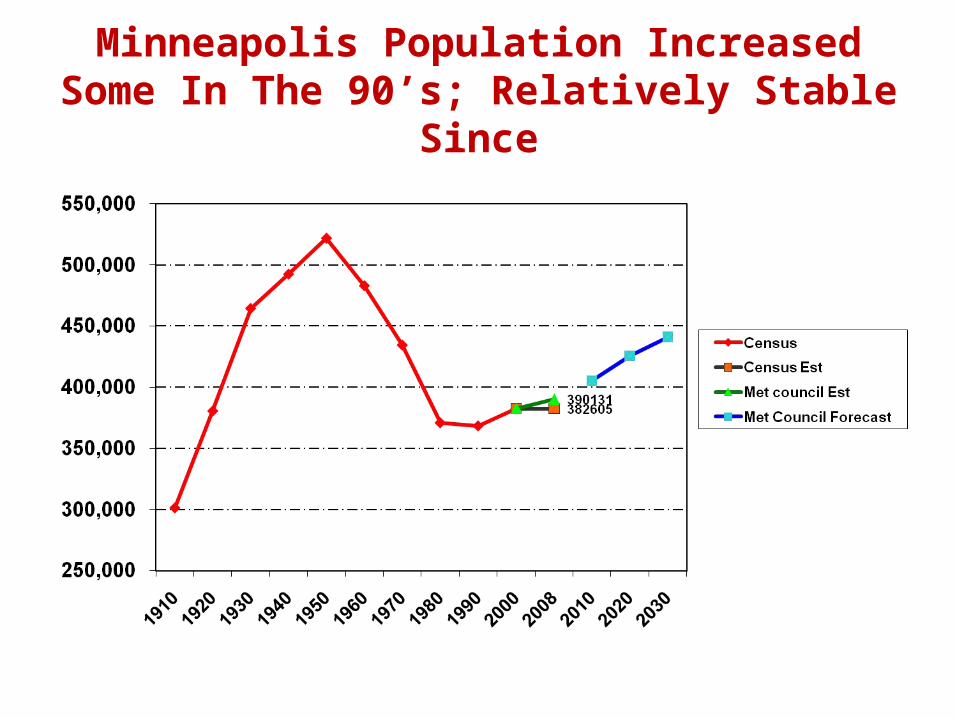
Minneapolis Population Increased Some In The 90’s; Relatively Stable Since
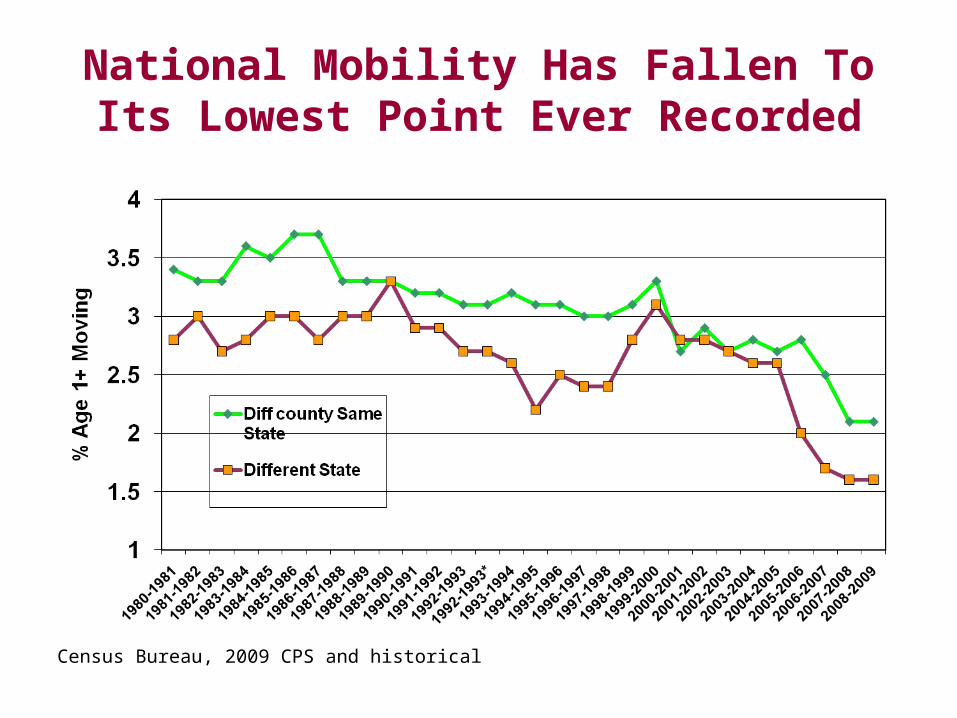
National Mobility Has Fallen To Its Lowest Point Ever Recorded
Census Bureau, 2009 CPS and historical
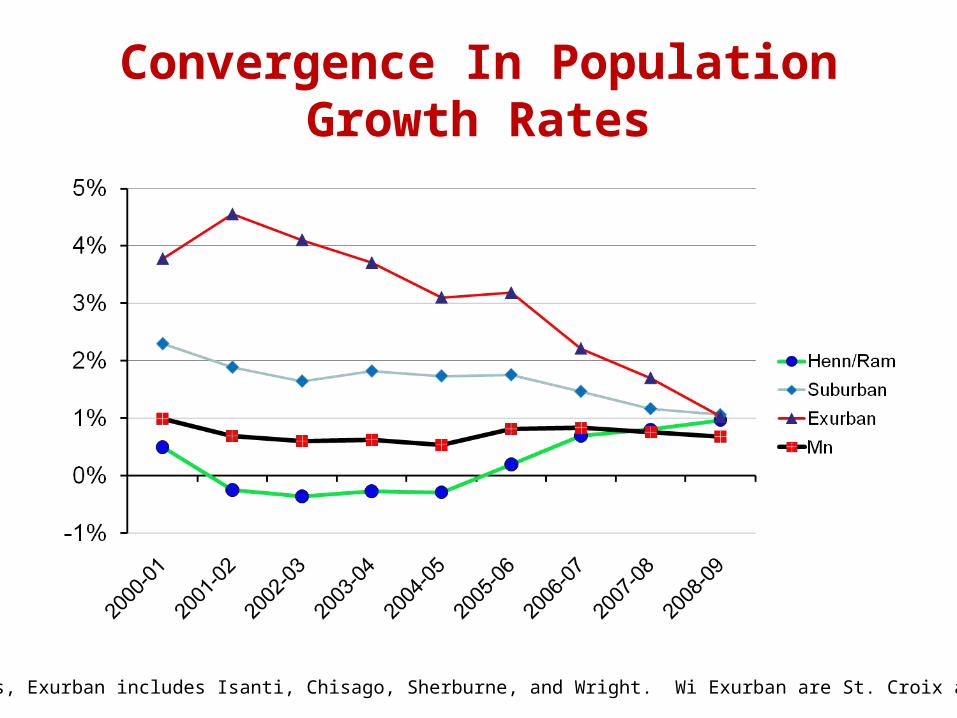
Convergence In Population Growth Rates
Census ests, Exurban includes Isanti, Chisago, Sherburne, and Wright. Wi Exurban are St. Croix and Pierce
The Economic/Demographic Environment Has Changed for as
Far as We Can Forecast
Short run economic cycle has merged with long run demographic cycle
We have entered the Age of Entitlement—economic growth in the next 25 years will be about half what it was in the past 25.
State revenue growth will slow while spending pressures will accelerate
This is a national/global issue

Minnesota Saw a 30 Percent Jump in Workers Turning Age 62 in 2008
0
10,000
20,000
30,000
40,000
50,000
60,000
7/05 to7/06
7/06 to7/07
7/07 to7/08
7/08 to7/09
7/09 to7/10
7/10 to7/11
7/11 to7/12
Year Turning Age 62
Wo
rke
d W
ith
in P
as
t 5
ye
ars
2005 ACS
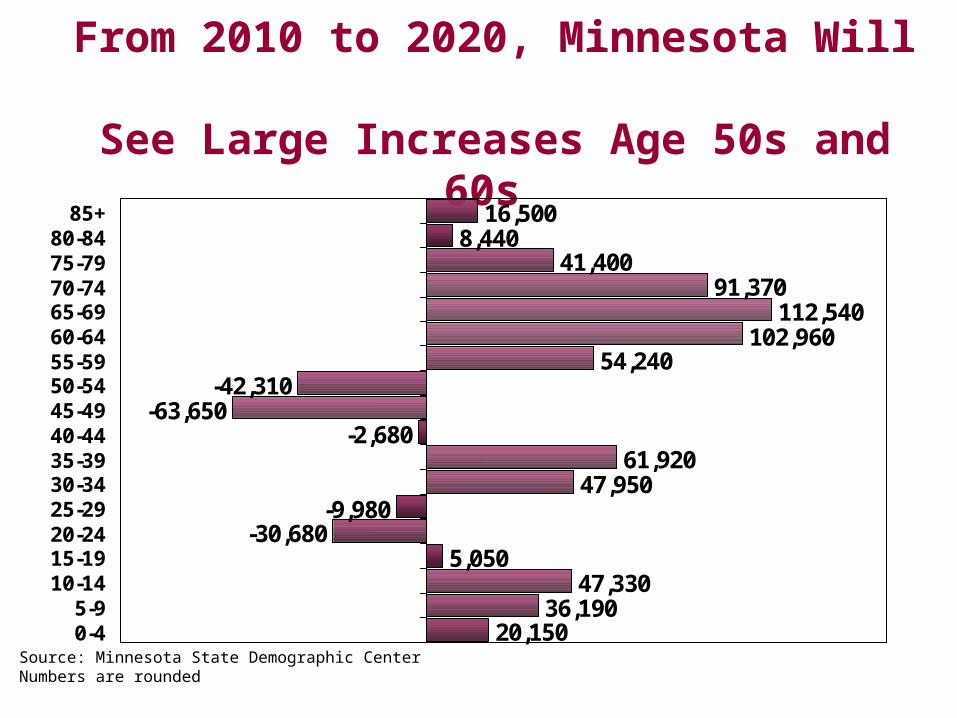
From 2010 to 2020, Minnesota Will See Large Increases Age 50s and 60s
20,15036,190
47,3305,050
-30,680-9,980
47,95061,920
-2,680-63,650
-42,31054,240
102,960112,540
91,37041,400
8,44016,500
0-45-9
10-1415-1920-2425-2930-3435-3940-4445-4950-5455-5960-6465-6970-7475-7980-84
85+
Source: Minnesota State Demographic CenterNumbers are rounded
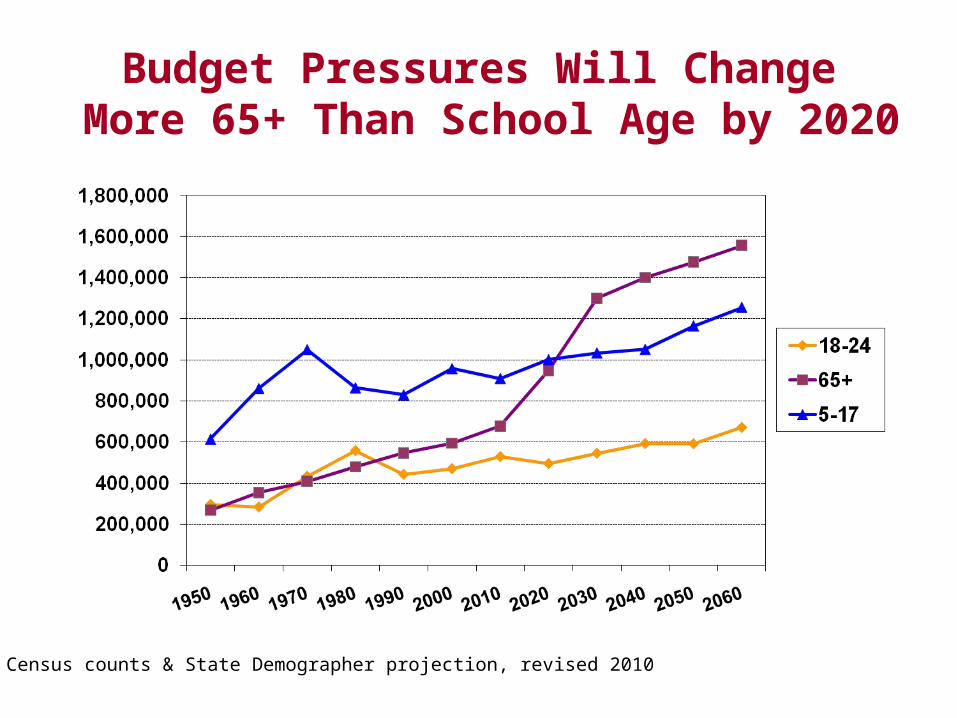
Budget Pressures Will Change More 65+ Than School Age by 2020
Census counts & State Demographer projection, revised 2010

Labor Force Growth Is About To Slow Sharply
1.52%
1.12%
0.75%
0.43%
0.10% 0.13%
0.27%
0.0%
0.2%
0.4%
0.6%
0.8%
1.0%
1.2%
1.4%
1.6%
1990-2000
2005-10 2010-15 2015-20 2020-25 2025-30 2030-35
Ave
An
nu
al C
han
ge
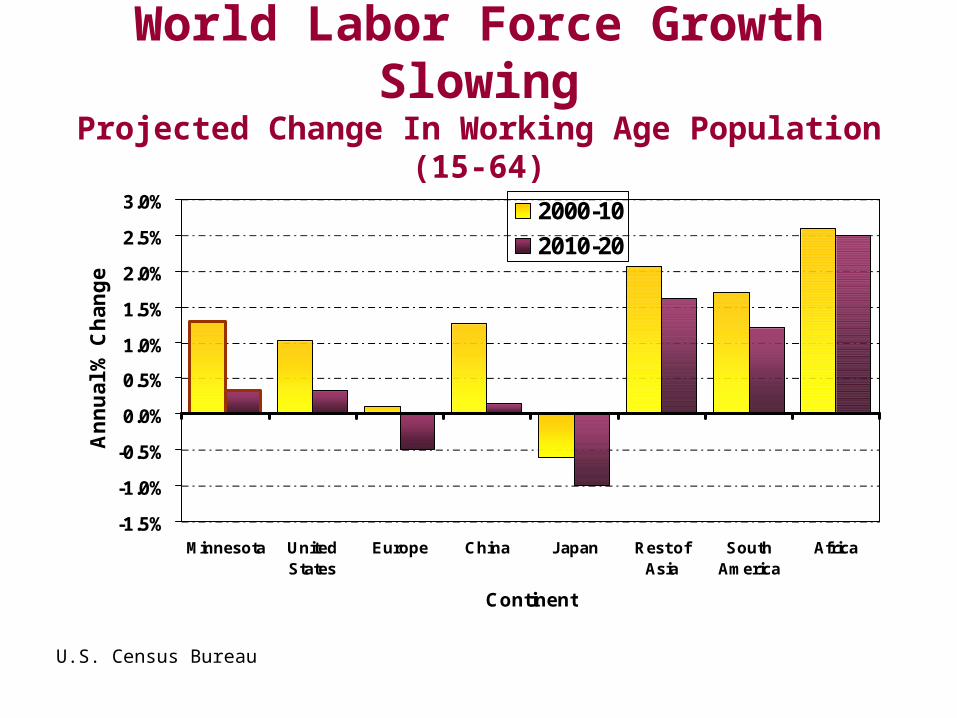
World Labor Force Growth SlowingProjected Change In Working Age Population (15-64)
-1.5%
-1.0%
-0.5%
0.0%
0.5%
1.0%
1.5%
2.0%
2.5%
3.0%
Minnesota UnitedStates
Europe China Japan Rest ofAsia
SouthAmerica
Africa
Continent
An
nu
al
% C
ha
ng
e
2000-10
2010-20
U.S. Census Bureau
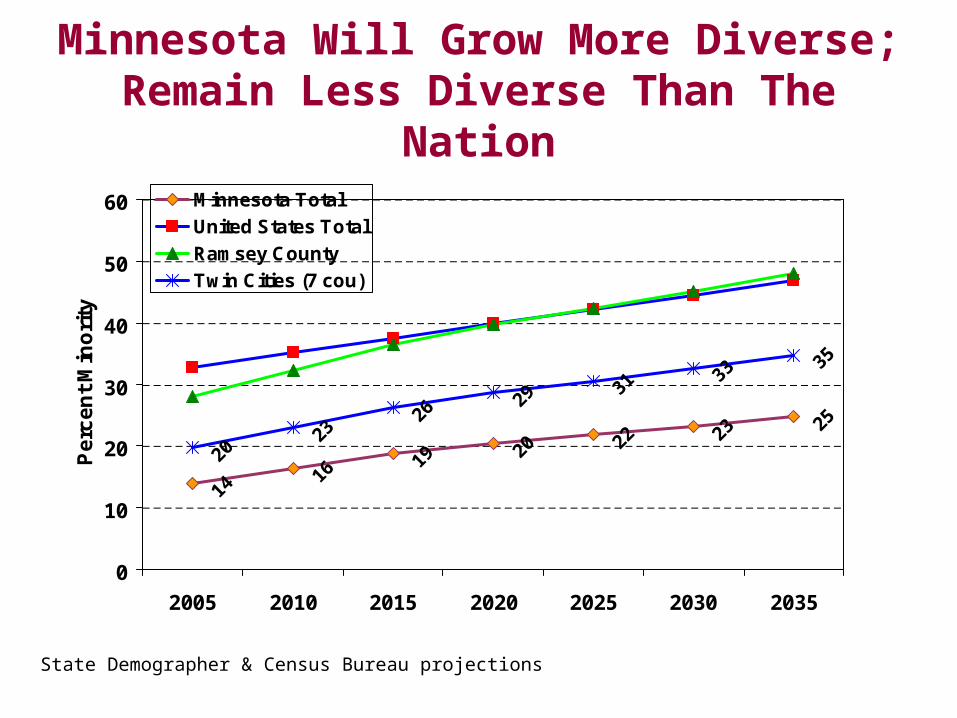
Minnesota Will Grow More Diverse; Remain Less Diverse Than The Nation
1416
19 20 22 23 25
2023
2629
3133
35
0
10
20
30
40
50
60
2005 2010 2015 2020 2025 2030 2035
Pe
rce
nt
Min
ori
ty
Minnesota Total
United States Total
Ramsey County
Twin Cities (7 cou)
State Demographer & Census Bureau projections
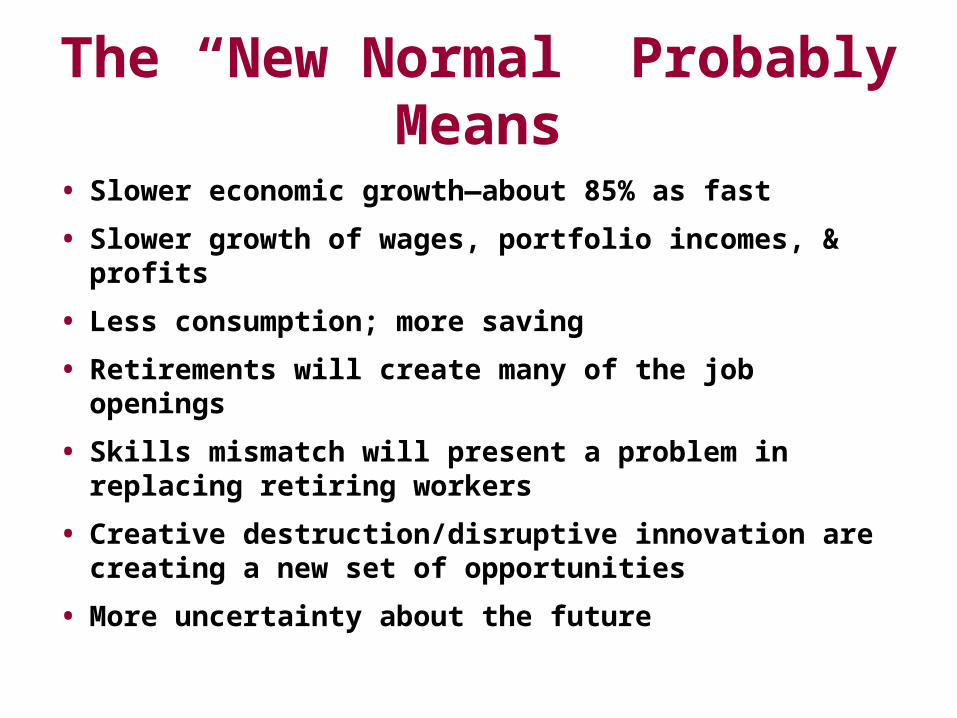
The “New Normal” Probably Means
• Slower economic growth—about 85% as fast
• Slower growth of wages, portfolio incomes, & profits
• Less consumption; more saving
• Retirements will create many of the job openings
• Skills mismatch will present a problem in replacing retiring workers
• Creative destruction/disruptive innovation are creating a new set of opportunities
• More uncertainty about the future
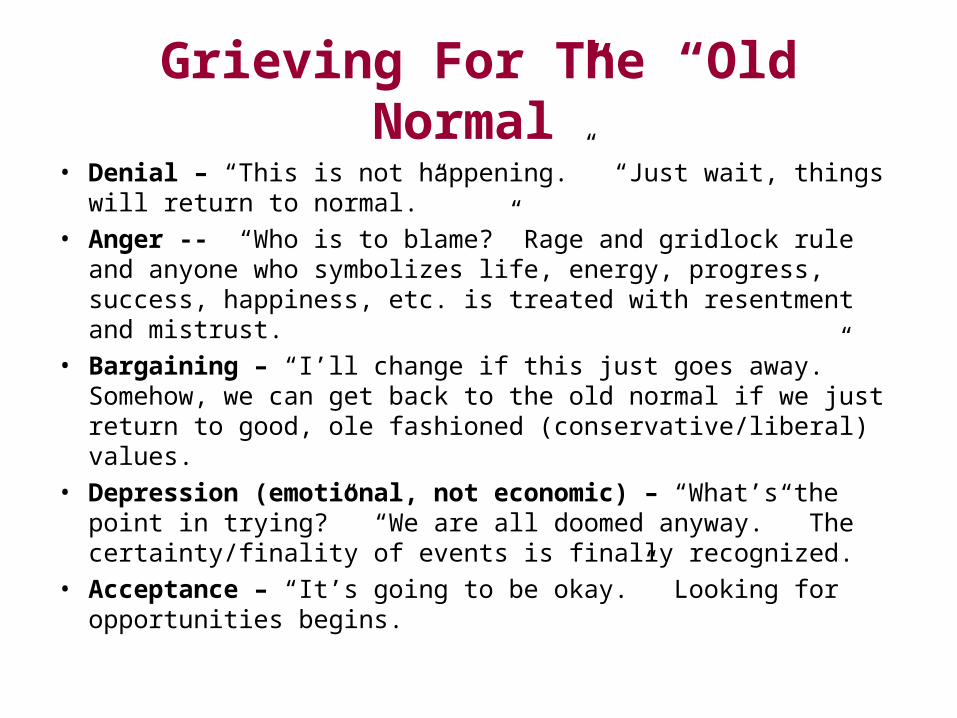
Grieving For The “Old Normal”
• Denial – “This is not happening.” “Just wait, things will return to normal.”
• Anger -- “Who is to blame?” Rage and gridlock rule and anyone who symbolizes life, energy, progress, success, happiness, etc. is treated with resentment and mistrust.
• Bargaining – “I’ll change if this just goes away.” Somehow, we can get back to the old normal if we just return to good, ole fashioned (conservative/liberal) values.
• Depression (emotional, not economic) – “What’s the point in trying?” “We are all doomed anyway.” The certainty/finality of events is finally recognized.
• Acceptance – “It’s going to be okay.” Looking for opportunities begins.
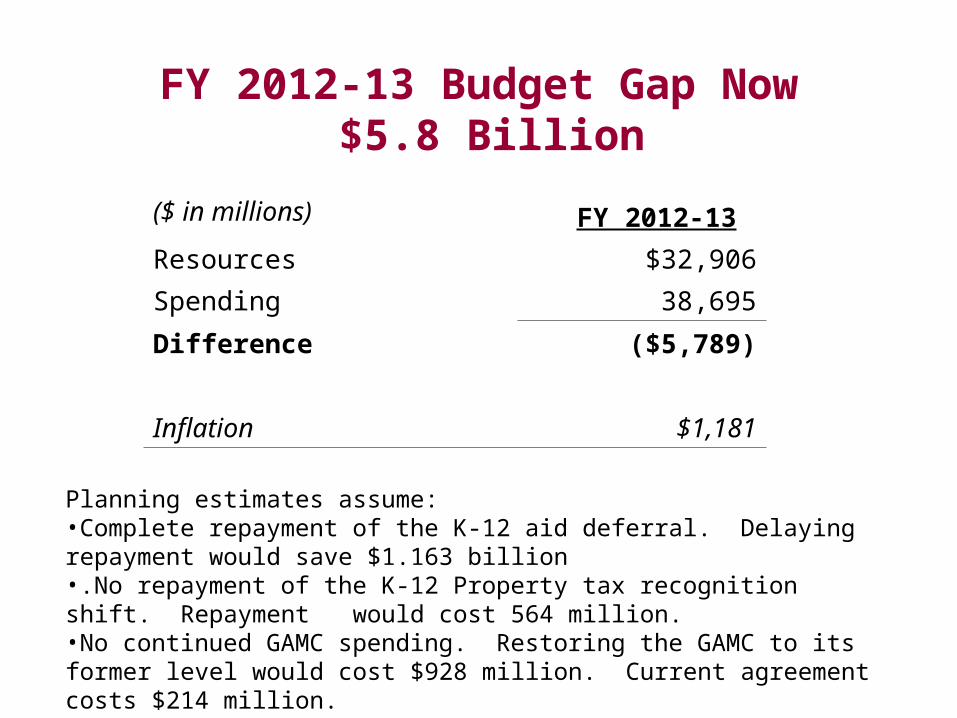
FY 2012-13 Budget Gap Now $5.8 Billion
($ in millions) FY 2012-13
Resources $32,906
Spending 38,695
Difference ($5,789)
Inflation $1,181
Planning estimates assume:•Complete repayment of the K-12 aid deferral. Delaying repayment would save $1.163 billion•.No repayment of the K-12 Property tax recognition shift. Repayment would cost 564 million.•No continued GAMC spending. Restoring the GAMC to its former level would cost $928 million. Current agreement costs $214 million.

But Why Fear The New Normal?It Plays To Our Strengths!
Future economic growth will depend increasingly on increasing productivity and less on labor force size
Education has been the key to Minnesota’s productivity and prosperity
Future productivity increases will depend on decisions and the investments we make now
Public Sector Productivity Growth Will Be Essential