minority health assessment report - portland, maine
TRANSCRIPT
Minority Health Assessment Report September 2014
City of Portland Minority Health Program

2014 Minority Health Assessment Report – Cumberland County
City of Portland Public Health Division’s Minority Health Program - Project funded by MeHAF
2
TABLE OF CONTENTS Page ACKNOWLEDGEMENTS…………………………………………………………….......3 ORGANIZATIONAL BACKGROUND…………………………………………………5 EXECUTIVE SUMMARY…………………………………………………………………..8 INTRODUCTION……………………………………………………………………………10 METHODOLOGY AND APPROACH...………………………………………………..12 DISCUSSION of FINDINGS……………………………………………………………..15 APPENDICES…….………………………………………………………………………….35

2014 Minority Health Assessment Report – Cumberland County
City of Portland Public Health Division’s Minority Health Program - Project funded by MeHAF
3
ACKNOWLEDGEMENTS The City of Portland Public Health Division’s Minority Health Program (MHP) would like to thank the individuals and organizations that contributed to the development and implementation of this community health needs assessment. Particular individuals, Community Health Outreach Workers (CHOWs), and groups helped to identify survey participants and provided key background information on the health care needs of the racial and ethnic language communities in Cumberland County. We especially wish to thank Lucie Rioux and Rachel Horton White of the Opportunity Alliance; and, Donna Wilkens and Joy Zacharia of Metis Associates from New York, who collaborated with us to conduct an expanded, extensive study of the Parkside Neighborhood. We thank Metis Associate and Opportunity Alliance for analyzing and writing a separate complementary Parkside Neighborhood report incorporating the health needs assessment components. We would also like to especially thank Rebecca Stabler for her expert analyses of the Cumberland County assessment data. Special thanks and appreciations are offered to: • The community leaders and representatives in the minority communities All City of Portland Public Health Division’s Minority Health Program Staff and Contract CHOWs: • Nelida Berke, MLT, BS (Spanish CHOW and Contract CHOWs Coordinator) • Malual Mabur, MD, MSc, DTM&H (Sudanese & Arabic CHOW) • Siyad Ahmed (Somali CHOW) • Jocelyne Ininahazwe, MA (French CHOW) The network of Community Health Outreach Workers (CHOW) involved in this project and their community of focus: • Saharo Sharif (Somali) • Qamar Ahmed (Arabic) • Gatdet Lul (Sudanese/South Sudanese) • Florence Olebe (Sudanese/South Sudanese) • Victoria Chicon (Spanish) • Jennifer Hernandez (Spanish) • Mohanad Mohammed (Arabic) • Sarah Madhi (Arabic) • Biljana Nedeljkovic (Serbian/Croatian/Bosnian) • Mom Hoeung (Cambodian) • Ricky Ho (Cambodian) • Minh Canfield (Vietnamese) • Tarlan Ahmadov (Russian/Azerbaijani) • Marisa Crommett (Caucasian-English Speaking) • Pious Ali (African American) • Meryl Troop (American Sign Language/Hearing-Impaired) • Asha Ali (Somali)

2014 Minority Health Assessment Report – Cumberland County
City of Portland Public Health Division’s Minority Health Program - Project funded by MeHAF
4
• Dirir Moulouko (Somali) • Sandra Ricker (Spanish) • Megan Sutherland (Caucasian-English Speaking) • Godard N-Diambu (French) • Joseph Kibukabayo (French) • Philemon Dushimire (French) • Ashraf Eldeknawey (Arabic) • Antoine Bikamba (French) • Jocelyne Kamijazi (French) • Birch Hincks (Caucasian-English Speaking), and, Others.
• Apollo Karara, Executive Director, Maine Association of New Americans (MANA) • Maine Center for Disease Control and Prevention’s Office of Health Equity • Toho Soma, MPH, Acting Director, Public Health Division; Health Equity &
Research Program Manager In addition, we would like to thank Tracy Chalecki for her time and administrative support during the project survey data processing. We extends our gratitude to the residents, stakeholders, service providers, business owners and the faith-based agencies for their involvement and providing direct and technical supports for this project. Finally, we send an unreserved appreciation and thank you to our funder – Maine Health Access Foundation (MeHAF)- for providing the grant for this assessment initiative. The Maine Health Access Foundation's mission is to promote access to quality health care, especially for those who are uninsured and underserved, and improve the health of everyone in Maine. - See more at: http://www.mehaf.org/about/#sthash.JD7hCWpq.dpuf Kolawole Bankole, MD, MS, OPIc Access Project Director Minority Health Program

2014 Minority Health Assessment Report – Cumberland County
City of Portland Public Health Division’s Minority Health Program - Project funded by MeHAF
5
ORGANIZATIONAL BACKGROUND
Minority Health Program
Who We Are
The Public Health Division (PHD), part of the City of Portland’s Health and Human Services Department, has consistently demonstrated its commitment to ensuring the health of Portland’s communities for nearly 120 years. All programming is guided by its mission to “improve the health of all people in the community by working together to prevent disease, promote health, and protect residents from environmental threats.” To that end, the Division has developed a staff that is not only clinically competent, but also culturally competent regarding issues of health equity and disparities.
The Minority Health Program of the Public Health Division, Health and Human Services Department, City of Portland (MHP) addresses the health issues and needs of all minority communities in Cumberland County. MHP links people to needed health and social services and improves community health status through Community Health Outreach Workers (CHOWs) and clinical partnerships.
The Minority Populations served includes the following racial, ethnic, and language groups:
Acholi African
American Arabic
Chinese Farsi
French Khmer
Nuer Russian Serbian
/Croatian
Somali Spanish Swahili
Vietnamese

2014 Minority Health Assessment Report – Cumberland County
City of Portland Public Health Division’s Minority Health Program - Project funded by MeHAF
6
Our Vision
MHP’s vision of a healthy community is one where: • Diversity within the community is respected and valued by community members
and institutions. • Everyone has access to quality health and social services. • Everyone has access to resources and conditions required for a healthy lifestyle. • Institutions and policy makers are responsive to community residents. • The assets and gifts of community residents are acknowledged and shared. • Work is conducted in partnership with community organizations and service
providers to identify and address health priorities of minority communities.
Our Mission
MHP’s mission is to: • Develop and provide evidence-based public health practices with services that
enhance access to quality and affordable health care to improve the well-being of minority communities in Cumberland County.
• Identify, evaluate, and respond to community needs through innovative services.
• Encourage community-clinical collaborations and partnerships through leadership and advocacy.
• Promote quality of care and best practices in our community by providing consultation, education, and training.
• Promote quality of care and best practices in our hospitals and clinics by providing consultation, education, and training.
Our Objectives - MHP’s objectives are to:
• Improve minority community health at the community, family, and individual levels.
• Increase the capacity of community groups to establish health and well-being priorities and to implement a locally defined community health agenda.
• Strengthen informal and formal social networks and sense of community focusing on the strengths and assets of Cumberland County’s racial, ethnic, and language groups.
• Ensure that institutions, including the Public Health Division, are more accessible and responsive to community interests by building an integrated channel of information through the establishment of a network of community health outreach workers.
• Active participation in health policy forums, health plans, task forces, workgroups-/-committees on issues to improve the health for minority groups.

2014 Minority Health Assessment Report – Cumberland County
City of Portland Public Health Division’s Minority Health Program - Project funded by MeHAF
7
Our Values
We recognize that healthy individuals, families, and communities are vital to a healthy society. We recognize the racial, ethnic, and language diversity and inherent worth of each individual, who collectively forms the backbone of our community. We value the importance of public health preventive measures and policies that enhance health equity and reduce health disparities. We respect the wisdom of community members, healthcare providers, faith-based leaders, and policy makers and their efforts toward improving access to care for our minority communities in a safe and healthy environment.
Our Operating Principles
We are guided by these basic operational principles in all our services and activities:
• Acting with Integrity – Integrity, trust, honesty, confidentiality, respect, and fiscal responsibility.
• Satisfying our clients and patients – helping our clients identify their needs and working diligently to meet or exceed their expectations.
• Community Service – Ensuring that assets and resources of our community are utilized to improve the health and wellness of the minority communities for optimum public health indicators. Our goal is to reduce health disparities for every individual and family in our community who needs our help.
• Using Sound Business Practices – We will use proven, sound business practices to manage Agency activities in a competitive environment.
2014 Minority Health Assessment Report – Cumberland County
City of Portland Public Health Division’s Minority Health Program - Project funded by MeHAF
8
EXECUTIVE SUMMARY In order to provide culturally appropriate public and clinical health services to the racial and ethnic minorities in Cumberland County, it is important to identify and describe community health needs and factors that affect their enjoying optimum health. This is very important to be able to developed community-informed public health interventions. This helps us improve our communication with the community, its members and other organizations addressing community health needs. Between January 14 and June 30, 2014, the Portland Public Health Division’s Minority Health Program administered a Minority Health Assessment to 1,264 members of the racial, ethnic, and language minority communities in Cumberland County. In addition, American-born individuals were included in this assessment to serve as a comparison group. This report represents the results of the assessment (excluding the Parkside Neighborhood assessment focus area) from the following groups: Somali, Iraqi, American-born (Caucasian), Great Lakes Region (Democratic Republic of Congo, Burundi, Rwanda, Kenya, Tanzania, Uganda, and Angola), Sudanese, South Sudanese, Russian, Latino, American-born (African American), Cambodian, Bosnian/Croatian/Serbian, and the hearing impaired/ASL, in Cumberland County. The groups were chosen based on their demographic population size and their unique vulnerability in accessing public and clinical health services. The assessments revealed important health issues covering several important trends, the most significant of which were: • Safety: Low crime/safe neighborhoods as the most important factor for a healthy
community • Chronic Disease: Diabetes as the most important health problems in the
community • Substance abuse: Alcohol abuse as the most important risky behavior in the
community
Other trends or common themes that showed up from the assessment include: • The presence of the uninsured and importance of the Affordable Care Act
enrollment. • Need for affordable housing, good place to raise children, good jobs, and healthy
economy • High blood pressure, mental health problems, domestic violence, dental
problems and aging-related problems • Lack of exercise and tobacco use habits

2014 Minority Health Assessment Report – Cumberland County
City of Portland Public Health Division’s Minority Health Program - Project funded by MeHAF
9
The outcomes of this project reiterate and complement findings of similar studies (e.g., Parkside Neighborhood, etc.) conducted elsewhere in the county and a set of interventions were designed to address the social determinants of health with specific health policy and programmatic interventions. These interventions also emphasize the importance of the use of Community Health Workers in the healthcare delivery system, community mobilization and engagement, and, preventive health promotion approaches to improve access to care for needed services. Some of these interventions were designed to reduce barriers to accessing public and clinical health care services, especially to improve: • Perceptions by the ethnic minority groups on the health care service system,
through training and support of Community Health Outreach Workers. • The health care service delivery to be more culturally appropriate, through
capacity building for interpreters/care managers operating in the health sector, and provision of appropriate health resources.
• Recognition for the cultural approaches/holistic measures provided by the ethnic minorities themselves and strengthening the knowledge of providers concerning health patterns in the home countries of racial and ethnic minorities.
• Selected pilot interventions aimed at identifying useful innovations in practice management that would serve to reduce barriers to accessing care.

2014 Minority Health Assessment Report – Cumberland County
City of Portland Public Health Division’s Minority Health Program - Project funded by MeHAF
10
INTRODUCTION According to the National Association of County & City Health Officials’ (NACCHO) “Definition of an Ideal Community Health Assessment,” by Julia Joh Elligers: “A community health assessment is a process that uses quantitative and qualitative methods to systematically collect and analyze data to understand health within a specific community. An ideal assessment includes information on risk factors, quality of life, mortality, morbidity, community assets, forces of change, social determinants of health and health inequity, and information on how well the public health system provides essential services. Community health assessment data inform community decision-making, the prioritization of health problems, and the development, implementation, and evaluation of community health improvement plans.” The City of Portland Public Health Division’s Minority Health Program in partnership with other key stakeholders (Opportunity Alliance, Metis Associates, and the City of Portland’s Health Equity and Research Program), conducted comprehensive community health needs assessments in Cumberland County and Portland’s Parkside Neighborhood (separate reports aside from this report) with survey respondents from the following racial and ethnic groups - Somali, Iraqi, American-born (Caucasian), Great Lakes Region (Democratic Republic of Congo, Burundi, Rwanda, Kenya, Tanzania, Uganda, and Angola), Sudanese, South Sudanese, Russian, Latino, American-born (African American), Cambodian, Bosnian/Croatian/Serbian, and, the hearing impaired/ASL in Cumberland County. The project activities were conducted under five stages over a period of twelve months (August 2013 to September 2014): 1. Partners and community engagement and survey development- August 1 -
December 31, 2013 2. Implementation of the community health assessment – January 24 - May 1, 2014 3. Data entry, collation, and analysis – May 1 -31, 2014 4. Assessment reporting and dissemination stages – June 1 – September 12, 2014.
The main purpose of this study is to get communities’ opinions about community health needs in Cumberland County with the intention of using results of the assessment survey to evaluate and address the most pressing needs through community action. This is conducted with an anticipated accomplishment of the following six objectives: • Determine what community members feel are important health issues • Find out if different communities want different resources
2014 Minority Health Assessment Report – Cumberland County
City of Portland Public Health Division’s Minority Health Program - Project funded by MeHAF
11
• Assess whether our current programs are meeting the needs of our community members
• Modify existing programs or develop new programs to address emerging health needs
• Find out where we need to communicate better with other city and private organizations to assist them in ensuring that community health needs are met
• Inform communities of existing resources to address their health concerns
2014 Minority Health Assessment Report – Cumberland County
City of Portland Public Health Division’s Minority Health Program - Project funded by MeHAF
12
METHODOLOGY AND APPROACH Background information on the partnership and stakeholders’ development The project began with mobilizing our current partners and collaborating with new ones to achieve the assessment purpose. To this, three agencies joined forces with the Minority Health Program to conduct the assessment, and these are the Maine Association of New Americans (MANA), Opportunity Alliance/ Metis Associates NY, and Maine CDC Office of Health Equity (through its Refugee Health Program). Questionnaire development process There were survey questions developed with a series of community meetings (four assessment meetings – two each at the Parkside Neighborhood and Portland City Hall) to ensure adequate sampling of preferred categories of groups. The surveys were pilot-tested with the community members for time estimate for survey implementation and cultural/linguistic appropriateness. The health need survey was submitted to the University of Southern Maine for Institutional Review Board (IRB) determination of project survey sampling and methodology and was approved. There were two separate types of surveys: One solely to focus on minority health needs in Cumberland County and another set with extended community needs assessment within the Parkside Neighborhood. The questions for the surveys with the ethnic minority groups were derived from informal interviews with their community leaders, review of tested questions in similar settings, and consulting community health outreach workers and neighborhood residents (survey questions attached as appendices). The survey questions were prepared primarily concerning the following themes: • Overall perceptions of community and personal health • Specific perceptions concerning the most important factors for a healthy
community • Specific perceptions concerning the health problems in the community • Perceived impressions on the most important risky behaviors in the community • Identification of the socio-economic, educational, and insurance factors in the
community as affecting accessing health care services • Perceptions concerning the role played by culture, age, gender, and ethnicity in
the utilization of health care services • Needs for what it takes for them to experience optimum mental health The questionnaire was developed initially in English, reviewed by stakeholders, residents and Community Health Outreach Workers, who then implemented it in various languages.

2014 Minority Health Assessment Report – Cumberland County
City of Portland Public Health Division’s Minority Health Program - Project funded by MeHAF
13
Implementation of the community health assessment process Involved: 1. The recruitment of Community Health Outreach Workers (CHOWs) per the targeted sampling groups and expected numbers of survey. A total number of 43 CHOWs were utilized across the two focus coverage areas (Cumberland County and Parkside Neighborhood). The CHOWs being trusted, indigenous community members served as survey implementers in their respective communities. 2. A 2-day Community-based participatory research (CBPR) project data training was conducted with the CHOWs on January 24 and 25, 2014 with the assistance of Metis Associates, NY. The CHOWs were trained on the purpose of project, its implementation plan and methodology, how to implement the surveys, and other survey logistics and reporting (distribution of surveys, supporting materials & survey return plans). See details of sampling methodology in appendix. 3. Survey implementation: There were two concentration areas, the Parkside Neighborhood and Cumberland County (without Parkside). An individual plan for recruiting participants was developed with each CHOW that includes; criteria for screening, target number of respondents, locations and approaches. Our anticipated total surveys were 2,164 surveys (actual return: 1,768; 82% returns) with 1,624 from Cumberland County (actual returns: 1,264) and 540 Parkside neighborhood (actual returns: 504) respondents. Methods of survey implementation included one-on-one personal and group implementations by the CHOWs. These were implemented at multiple outreach points, such as the faith-based congregations, schools, non-profit organizations, ethnic stores, community centers, Parkside neighborhood areas, homeless square, residential parks, etc. Our survey focused on the following communities; Somali, Sudanese, Spanish, Arabic, Serbian, French/Swahili, Cambodian, Vietnamese, Chinese, Russian, Native Americans, African Americans, Caucasian-English speaking, and the hearing-impaired /ASL communities. Analysis The City of Portland’s Minority Health Program collected, collated and inputted the data in a structured database for analysis. The analysis of the Cumberland County surveys was done by the City’s Health Equity and Research program consultant – Becca Stabler, while the Parkside surveys were analyzed by Metis Associates (a New York-based agency). This report provides a synthesis of the findings and their implications in the section below entitled “Discussion of findings.” Assessment reporting and dissemination stages: This involved the drafting of reports by City of Portland’s Minority Health Program for Cumberland County surveys and Metis Associates for Parkside surveys. Both

2014 Minority Health Assessment Report – Cumberland County
City of Portland Public Health Division’s Minority Health Program - Project funded by MeHAF
14
partners shared reports with various communities for feedback and review. The reports will be disseminated through various channels. All project partners are expected to be involved in the various disseminations of the assessment report. Disseminations within communities involve the community advisory committee (CAC) members’ distributions in their communities, community meetings, faith-based leaders, and trusted community leaders and representatives. Disseminations with agencies that have interest in or already serving the minority communities will be sent a copy for their information to inform their programs and services delivery. Examples of channels include, the Greater Portland Refugee and Immigrant Healthcare Collaborative, Refugee Providers Multicultural Committee, Offices of Health Equity and Multicultural Affairs, Universities of Southern Maine and New England, Multicultural Resource Centers, Neighborhood Parks/ Centers, Medical Homes and health provider offices, and through Community-based organizations.

2014 Minority Health Assessment Report – Cumberland County
City of Portland Public Health Division’s Minority Health Program - Project funded by MeHAF
15
DISCUSSION OF FINDINGS Between January 14 and June 30, 2014, the Portland Public Health Division’s Minority Health Program administered a Minority Health Assessment to 1,264 members of the racial, ethnic, and language minority communities in Cumberland County. In addition, American-born individuals were included in this assessment to serve as a comparison group. Using 2011 response rates and 2010 Census data, we determined the optimal number of respondents of each ethnicity that would allow us to reach at least 4% of the estimated current population of each target ethnicity. To provide the most accurate representation of the health concerns and interests of the whole population and each distinct ethnic group, we utilized a chain sampling approach. Utilizing a chain sampling approach, interviewers – who were recruited from the various ethnic communities – were asked to identify five diverse people in their community, taking into account different ages, genders, languages, residential locations, and political and religious views. Once our interviewers completed their first five interviews, they then asked the interviewees for a referral to another respondent within their target community. Respondents were limited to three referrals in order to help broaden the range of opinions in our response. Section 1. Demographics 97% of respondents listed their zip code of residence. Respondents were then grouped by county with the exception of Portland residents, who were placed in their own group due to large numbers (Table 1). It is important to note that Parkside Neighborhood in Portland was excluded from the Cumberland County survey, due to the Parkside Neighborhood being surveyed under a separate, complementary community survey. The Parkside Neighborhood surveys include the same survey questions asked in the Cumberland County survey and a comparison report is being compiled. Table 1. Place of residence
Residence Count Percent City of Portland
(excluding Parkside) 746 59%
Cumberland County (excluding Portland) 437 35%
York County 41 3% Androscoggin
County 1 0%
No Response 39 3% All but 6 respondents had an ethnic group listed (Table 2). The most frequently cited ethnicities were Latino, Iraqi, and Somali, with each accounting for more than 12% of the total sample. The Great Lakes Region is comprised of the Democratic Republic of Congo (DRC), Burundi, Rwanda, Kenya, Tanzania, and Uganda.

2014 Minority Health Assessment Report – Cumberland County
City of Portland Public Health Division’s Minority Health Program - Project funded by MeHAF
16
American-born Caucasians, comprised 8% of the total sample and were included to serve as a comparison group. Additionally, hearing impaired/ASL individuals and American-born African Americans were also sampled as a comparison minority group, but the sample size for both is very small (n=15 for African Americans and n=14 for ASL). Therefore it is not advised to draw any strong conclusions about these groups based on this assessment. In subsequent years it would benefit the survey to include a larger sample of hearing impaired/ASL individuals and American-born African Americans to provide more robust samples. Table 2. Ethnicity
Ethnic Group Count Percent Latino 189 15% Iraqi 182 14%
Somali 164 13% Bosnian/Serbs/Croats 149 12% Great Lakes Region 136 11%
American-born (Caucasian) 104 8%
South Sudanese 83 7% Sudanese 58 5% Russian 50 4%
Cambodian 43 3% American-born (African
American) 15 1%
Hearing Impaired/ASL 14 1% Other 71 6%
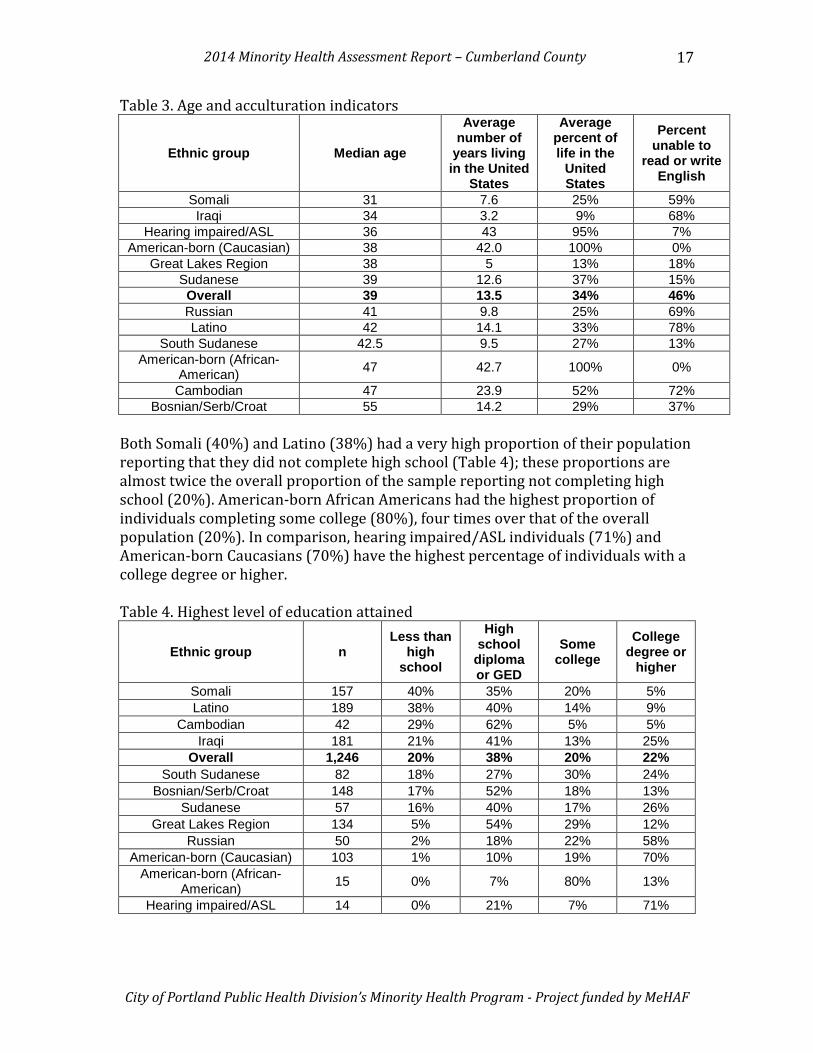
No Response 6 0% Additional analyses were conducted among the nine most common ethnic groups represented in the survey (shown in Table 3). Table 3 displays data related to participants’ age and acculturation levels. The median age among the various ethnic groups ranges from 31 years for Somalis to 55 years for Bosnians, Serbs, and Croatians. The Sudanese and Cambodians have spent the greatest proportion of their lives in the United States, at 37% and 52%, respectively. In addition, Sudanese have the third highest literacy rates among all ethnic groups, with only 15% unable to read and write in English; however, Cambodians have the second lowest literacy rate, at 72%.
2014 Minority Health Assessment Report – Cumberland County
City of Portland Public Health Division’s Minority Health Program - Project funded by MeHAF
17
Table 3. Age and acculturation indicators
Ethnic group Median age
Average number of
years living in the United
States
Average percent of life in the
United States
Percent unable to
read or write English
Somali 31 7.6 25% 59% Iraqi 34 3.2 9% 68%
Hearing impaired/ASL 36 43 95% 7% American-born (Caucasian) 38 42.0 100% 0%
Great Lakes Region 38 5 13% 18% Sudanese 39 12.6 37% 15% Overall 39 13.5 34% 46% Russian 41 9.8 25% 69% Latino 42 14.1 33% 78%
South Sudanese 42.5 9.5 27% 13% American-born (African-
American) 47 42.7 100% 0%
Cambodian 47 23.9 52% 72% Bosnian/Serb/Croat 55 14.2 29% 37%
Both Somali (40%) and Latino (38%) had a very high proportion of their population reporting that they did not complete high school (Table 4); these proportions are almost twice the overall proportion of the sample reporting not completing high school (20%). American-born African Americans had the highest proportion of individuals completing some college (80%), four times over that of the overall population (20%). In comparison, hearing impaired/ASL individuals (71%) and American-born Caucasians (70%) have the highest percentage of individuals with a college degree or higher. Table 4. Highest level of education attained
Ethnic group n Less than
high school
High school
diploma or GED
Some college
College degree or
higher
Somali 157 40% 35% 20% 5% Latino 189 38% 40% 14% 9%
Cambodian 42 29% 62% 5% 5% Iraqi 181 21% 41% 13% 25%
Overall 1,246 20% 38% 20% 22% South Sudanese 82 18% 27% 30% 24%
Bosnian/Serb/Croat 148 17% 52% 18% 13% Sudanese 57 16% 40% 17% 26%
Great Lakes Region 134 5% 54% 29% 12% Russian 50 2% 18% 22% 58%
American-born (Caucasian) 103 1% 10% 19% 70% American-born (African-
American) 15 0% 7% 80% 13%
Hearing impaired/ASL 14 0% 21% 7% 71%

2014 Minority Health Assessment Report – Cumberland County
City of Portland Public Health Division’s Minority Health Program - Project funded by MeHAF
18
30% of Bosnians, Serbians, and Croatians reported an annual household income of over $50,000; this was 3 times higher than the overall percentage of respondents’ whose annual income was over $50,000 (9%) (Table 5). Despite having spent the greatest percent of their lives in the United States, Cambodians have the fourth lowest annual income, with 84% reporting earning less than $20,000. Table 5. Household size and income
Ethnic group n Average
household size
Less than
$10,000
$10,000 to
$20,000
$20,000 to
$29,999
$30,000 to
$49,999 Over
$50,000
American-born (Caucasian) 100 2.4 15% 13% 15% 18% 39%
Bosnian/Serb/Croat 149 2.9 3% 10% 23% 34% 30%
Hearing impaired/ASL 14 2.8 14% 29% 21% 14% 21%
Russian 47 3.4 23% 19% 19% 21% 17% American-born
(African-American)
14 3.3 7% 21% 50% 7% 14%
Overall 1,207 3.5 33% 27% 19% 11% 9% Latino 179 2.8 25% 36% 24% 5% 5%
South Sudanese 78 4.3 12% 21% 33% 33% 1% Great Lakes
Region 134 3.3 35% 44% 20% 0% 1%
Iraqi 167 4.5 74% 25% 1% 0% 0% Somali 153 5.0 48% 37% 12% 3% 0%
Sudanese 58 4.4 29% 16% 45% 10% 0% Cambodian 43 3.3 44% 40% 14% 2% 0%
Section 2: Health Overall, only 80% of participants responded to the question asking whether or not they had enrolled into health insurance through the Affordable Care Act (ACA) Marketplace (Table 6). Of those who responded to the question, the Great Lakes Region had the greatest proportion of individuals who had enrolled through the federal Marketplace (38%). American-born Caucasians had the lowest response rate of all ethnic groups, with only 38% of participants responding to the question. Of those American-born Caucasians who responded, only 5% said they enrolled in health insurance through the ACA.

2014 Minority Health Assessment Report – Cumberland County
City of Portland Public Health Division’s Minority Health Program - Project funded by MeHAF
19
Table 6: Enrolled into health insurance through the Affordable Care Act Marketplace
Ethnic group n
Enrolled into health insurance
through the Affordable Care Act
MarketPlace Great Lakes Region 109 38%
Sudanese 56 23% South Sudanese 62 23%
Somali 129 22% Overall 1,008 13%
Bosnian/Serb/Croat 144 7% Latino 163 7%
American-born (Caucasian) 39 5%
Iraqi 162 2% Russian 47 0%
Cambodian 40 0% American-born (African-
American) 6 0%
Hearing impaired/ASL 14 0% Despite having the highest proportion of individuals enrolled into health insurance through the ACA, the Great Lake Region has the second highest proportion of uninsured individuals (52%). Latinos (63%) uninsured rates are over twice as high as the overall rate (30%). 77% of Bosnians, Serbs, and Croatians, compared to 73% of American-born Caucasians and 71% of American-born African Americans, have private health insurance. Table 7: Health insurance status (multiple answers possible)
Ethnic group n Uninsured Private
insurance Medicaid/MaineCare Medicare Latino 188 63% 14% 18% 20%
Great Lakes Region 135 52% 34% 6% 11% Russian 50 48% 34% 24% 28%
South Sudanese 80 44% 46% 15% 40% Overall 1,238 30% 33% 24% 22%
Cambodian 42 29% 19% 43% 48% American-born (African-
American) 14 21% 71% 14% 0% Sudanese 57 21% 49% 9% 44%
Somali 157 17% 3% 30% 46% American-born
(Caucasian) 98 14% 73% 9% 7% Bosnian/Serb/Croat 149 11% 77% 9% 3%
Iraqi 179 9% 1% 69% 9% Hearing impaired/ASL 14 7% 50% 29% 71%
2014 Minority Health Assessment Report – Cumberland County
City of Portland Public Health Division’s Minority Health Program - Project funded by MeHAF
20
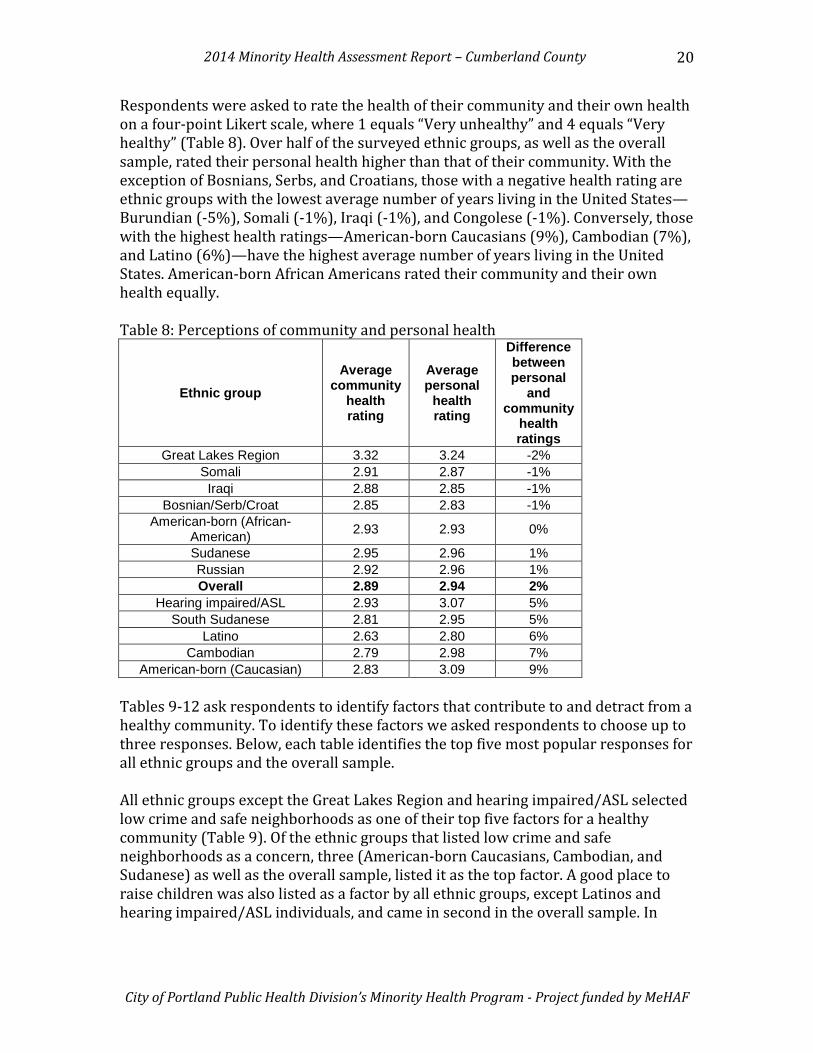
Respondents were asked to rate the health of their community and their own health on a four-point Likert scale, where 1 equals “Very unhealthy” and 4 equals “Very healthy” (Table 8). Over half of the surveyed ethnic groups, as well as the overall sample, rated their personal health higher than that of their community. With the exception of Bosnians, Serbs, and Croatians, those with a negative health rating are ethnic groups with the lowest average number of years living in the United States—Burundian (-5%), Somali (-1%), Iraqi (-1%), and Congolese (-1%). Conversely, those with the highest health ratings—American-born Caucasians (9%), Cambodian (7%), and Latino (6%)—have the highest average number of years living in the United States. American-born African Americans rated their community and their own health equally. Table 8: Perceptions of community and personal health
Ethnic group Average
community health rating
Average personal
health rating
Difference between personal
and community
health ratings
Great Lakes Region 3.32 3.24 -2% Somali 2.91 2.87 -1% Iraqi 2.88 2.85 -1%
Bosnian/Serb/Croat 2.85 2.83 -1% American-born (African-
American) 2.93 2.93 0%
Sudanese 2.95 2.96 1% Russian 2.92 2.96 1% Overall 2.89 2.94 2%
Hearing impaired/ASL 2.93 3.07 5% South Sudanese 2.81 2.95 5%
Latino 2.63 2.80 6% Cambodian 2.79 2.98 7%
American-born (Caucasian) 2.83 3.09 9% Tables 9-12 ask respondents to identify factors that contribute to and detract from a healthy community. To identify these factors we asked respondents to choose up to three responses. Below, each table identifies the top five most popular responses for all ethnic groups and the overall sample. All ethnic groups except the Great Lakes Region and hearing impaired/ASL selected low crime and safe neighborhoods as one of their top five factors for a healthy community (Table 9). Of the ethnic groups that listed low crime and safe neighborhoods as a concern, three (American-born Caucasians, Cambodian, and Sudanese) as well as the overall sample, listed it as the top factor. A good place to raise children was also listed as a factor by all ethnic groups, except Latinos and hearing impaired/ASL individuals, and came in second in the overall sample. In

2014 Minority Health Assessment Report – Cumberland County
City of Portland Public Health Division’s Minority Health Program - Project funded by MeHAF
21
addition, a good place to raise children was the top priority for the Great Lakes Region and South Sudanese communities. Affordable housing ranked third in the overall sample and was the top concern for Iraqis, Latinos, and Somalis. Good jobs and healthy economy ranked fourth among overall respondents and eight ethnic groups (American-born Caucasians and African Americans, Bosnian, Serbs, and Croatians, Great Lakes Region, Cambodian, Latino, Russians, and South Sudanese) also rate it highly. Good schools are cited as the fifth most popular overall factor, and figures into the top five among seven ethnic groups. Table 9: Most important factors for a healthy community, by ethnicity (up to 3 answers possible)
Overall n=1,260 1 Low crime/safe neighborhoods 38.8% 2 Good place to raise children 36.2% 3 Affordable housing 36.2% 4 Good and healthy economy 36.0% 5 Good schools 33.5%
Latino n=189 1t Affordable housing 42.9%
1t Good jobs and healthy
economy 42.9% 3 Good schools 36.0%
4 Low crime/safe neighborhoods 29.6%
5 Religious or spiritual values 21.2%
Iraqi n=179 1 Affordable housing 39.7% 2 Good schools 36.3% 3 Good place to raise children 34.6% 4 Low crime/safe neighborhoods 34.1% 5 Clean environment 30.7%
Somali n=163 1 Affordable housing 42.3% 2 Clean environment 35.6% 3t Low crime/safe neighborhoods 35.0% 3t Access to health care 35.0% 5 Good place to raise children 33.1%
Bosnian/Croat/Serb n=149
1 Good jobs and healthy
economy 63.8%
2 Low crime/safe neighborhoods 42.3%
3 Healthy behaviors and
lifestyles 36.2%
4 Good place to raise children 33.6% 5 Strong family life 32.2%
Great Lakes Region n=136 1 Good place to raise children 52.2% 2 Affordable housing 51.5% 3 Access to health care 44.9% 4 Good schools 33.1%
5 Good jobs and healthy economy 23.5%
American-born (Caucasian) n=104
1 Low crime/safe neighborhoods 49.0%
2 Good jobs and healthy
economy 35.6%
3 Healthy behaviors and
lifestyles 33.7% 4 Good place to raise children 29.8% 5 Clean environment 25.0%
South Sudanese n=83 1 Good place to raise children 59.0% 2 Low crime/safe neighborhoods 50.6% 3 Affordable housing 48.2% 4 Good schools 43.4%
5 Good jobs and healthy
economy 34.9%

2014 Minority Health Assessment Report – Cumberland County
City of Portland Public Health Division’s Minority Health Program - Project funded by MeHAF
22
Sudanese n=58 1 Low crime/safe neighborhoods 70.7% 2 Good place to raise children 67.2% 3 Good schools 53.4% 4 Access to health care 19.0% 5 Parks and recreation 17.2%
Russian n=50
1 Good jobs and healthy
economy 50.0% 2 Low crime/safe neighborhoods 48.0% 3 Good schools 42.0% 4 Good place to raise children 26.0% 5 Strong family life 22.0%
Cambodian n=43
1 Low crime/safe neighborhoods 58.1%
2 Good jobs and healthy
economy 46.5% 3 Affordable housing 39.5% 4 Access to health care 37.2% 5t Good place to raise children 32.6% 5t Strong family life 32.6% American-Born (African American) n=15 1 Affordable housing 53.3%
2t Low crime/safe neighborhoods 40.0%
2t Good jobs and healthy economy 40.0%
3t Good place to raise children 33.3% 3t Access to health care 33.3% 3t Excellent race relations 33.3%
Hearing impaired/ASL n=14
1 Healthy behaviors and lifestyles 42.9%
2t Good schools 35.7% 2t Clean environment 35.7% 2t Affordable housing 35.7% 5 Arts and cultural events 28.6%
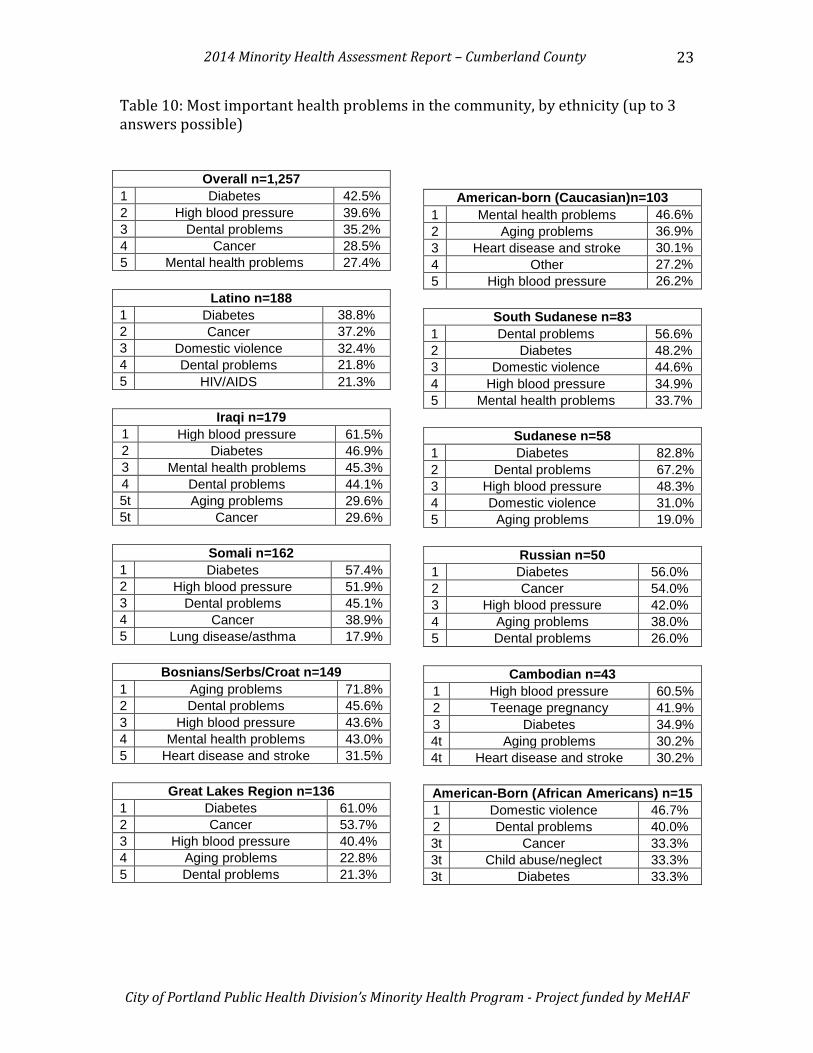
When asked to choose the three most important health problems in their community, diabetes was the top concern among the overall sample, as well as for five ethnic groups (Great Lakes Region, Latino, Somali, Russian, and Sudanese) (Table 10). All other ethnic groups, except for Bosnians, Serbs, and Croatians, hearing impaired/ASL individuals, and American-born Caucasians, listed diabetes as a top community health problem. Bosnians, Serbs, and Croatians and American-born Caucasians also report the highest numbers, over 70%, of individuals on private insurance, which is 37% higher than the overall sample response. High blood pressure ranked second among overall participants, with seven ethnic communities (Bosnians, Serbs, and Croatians, Great Lakes Region, Somali, South Sudanese, American-born Caucasians, Russian, and Sudanese) listing it as a problem and two (Cambodian and Iraqi) listing it as a top concern. Dental problems ranked third among the overall sample, with all ethnic groups, except for American-born Caucasians and Cambodians, listing it as a top community problem. Cancer ranked fourth overall, and was in the top five for six ethnic groups. Mental health problems ranked fifth overall, with American-born Caucasians listing it as their top concern.
2014 Minority Health Assessment Report – Cumberland County
City of Portland Public Health Division’s Minority Health Program - Project funded by MeHAF
23
Table 10: Most important health problems in the community, by ethnicity (up to 3 answers possible)
Overall n=1,257 1 Diabetes 42.5% 2 High blood pressure 39.6% 3 Dental problems 35.2% 4 Cancer 28.5% 5 Mental health problems 27.4%
Latino n=188 1 Diabetes 38.8% 2 Cancer 37.2% 3 Domestic violence 32.4% 4 Dental problems 21.8% 5 HIV/AIDS 21.3%
Iraqi n=179 1 High blood pressure 61.5% 2 Diabetes 46.9% 3 Mental health problems 45.3% 4 Dental problems 44.1% 5t Aging problems 29.6% 5t Cancer 29.6%
Somali n=162 1 Diabetes 57.4% 2 High blood pressure 51.9% 3 Dental problems 45.1% 4 Cancer 38.9% 5 Lung disease/asthma 17.9%
Bosnians/Serbs/Croat n=149 1 Aging problems 71.8% 2 Dental problems 45.6% 3 High blood pressure 43.6% 4 Mental health problems 43.0% 5 Heart disease and stroke 31.5%
Great Lakes Region n=136 1 Diabetes 61.0% 2 Cancer 53.7% 3 High blood pressure 40.4% 4 Aging problems 22.8% 5 Dental problems 21.3%
American-born (Caucasian)n=103
1 Mental health problems 46.6% 2 Aging problems 36.9% 3 Heart disease and stroke 30.1% 4 Other 27.2% 5 High blood pressure 26.2%
South Sudanese n=83 1 Dental problems 56.6% 2 Diabetes 48.2% 3 Domestic violence 44.6% 4 High blood pressure 34.9% 5 Mental health problems 33.7%
Sudanese n=58 1 Diabetes 82.8% 2 Dental problems 67.2% 3 High blood pressure 48.3% 4 Domestic violence 31.0% 5 Aging problems 19.0%
Russian n=50 1 Diabetes 56.0% 2 Cancer 54.0% 3 High blood pressure 42.0% 4 Aging problems 38.0% 5 Dental problems 26.0%
Cambodian n=43 1 High blood pressure 60.5% 2 Teenage pregnancy 41.9% 3 Diabetes 34.9% 4t Aging problems 30.2% 4t Heart disease and stroke 30.2% American-Born (African Americans) n=15 1 Domestic violence 46.7% 2 Dental problems 40.0% 3t Cancer 33.3% 3t Child abuse/neglect 33.3% 3t Diabetes 33.3%

2014 Minority Health Assessment Report – Cumberland County
City of Portland Public Health Division’s Minority Health Program - Project funded by MeHAF
24
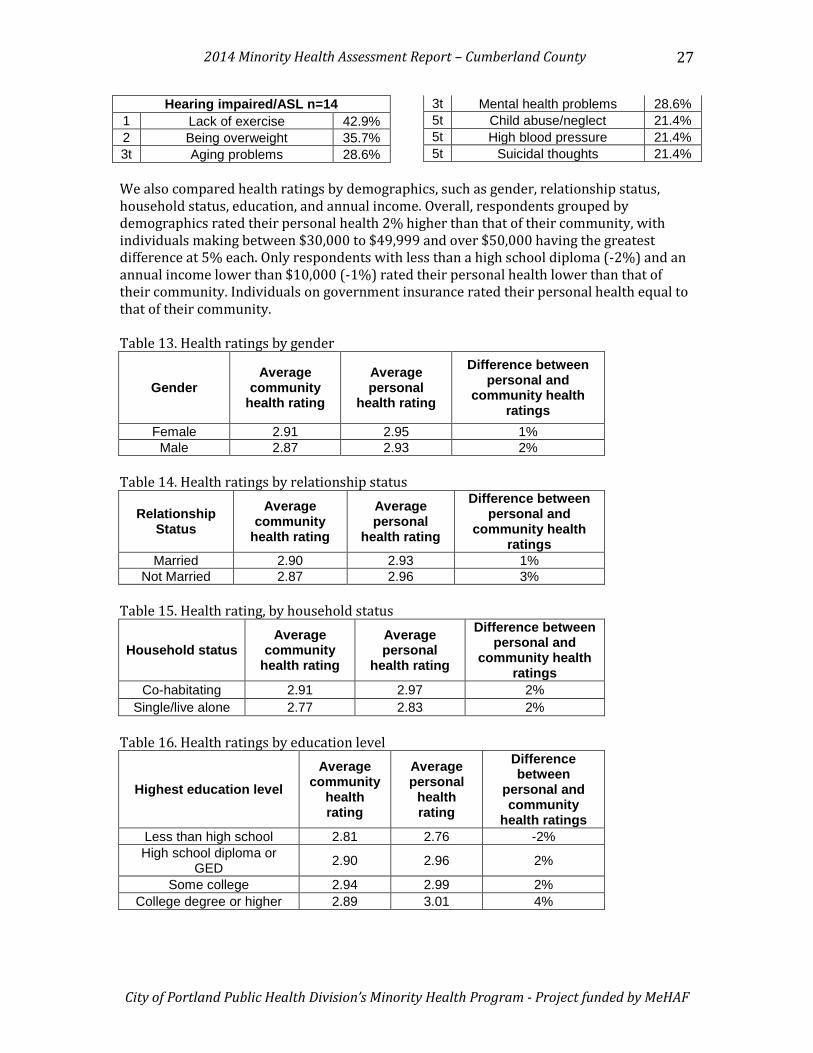
Hearing impaired/ASL n=14 1 Mental health problems 64.3% 2 Aging problems 50.0% 3 Domestic violence 35.7%
4 Dental problems 28.6% 5t Heart disease and stroke 21.4% 5t Teenage pregnancy 21.4%
Alcohol abuse was listed as the top risky community behavior overall, with all but Somalis listing it as a top concern (Table 11). Somalis ranked lack of exercise as their top community risky behavior. Lack of exercise ranked second overall and was chosen as a concern for seven other ethnic groups (Iraqi, Bosnian, Serbs, Croatians, Great Lakes Region, South Sudanese, Sudanese, hearing impaired/ASL, and Russian). Drug and tobacco abuse ranked as the third and fourth most risky behaviors, respectively, for the overall respondents, with six ethnic communities (American-born Caucasians and African Americans, Great Lakes Region, Cambodian, Latino, and Somali) listing both as a top risky behavior. Table 11: Most important risky behavior in the community, by ethnicity (up to 3 answers possible)
Overall n=1,256 1 Alcohol abuse 56.8% 2 Lack of exercise 42.8% 3 Drug abuse 41.3% 4 Tobacco use 38.4% 5 Being overweight 30.6%
Latino n=188 1 Alcohol abuse 70.7% 2 Drug abuse 62.8% 3 Tobacco use 38.8% 4 Being overweight 26.1% 5 Racism 25.5%
Iraqi n=179 1 Tobacco use 62.0% 2 Lack of exercise 57.5% 3 Being overweight 50.8% 4 Alcohol abuse 30.7% 5 Poor eating habits 29.6%
Somali n=162 1 Lack of exercise 65.4% 2 Tobacco use 40.1% 3 Dropping out of school 37.0% 4 Being overweight 34.6% 5 Drug abuse 24.1%
Bosnian/Serb/Croat n=149 1 Lack of exercise 55.7% 2 Alcohol abuse 51.0% 3 Poor eating habits 47.0% 4 Being overweight 40.3% 5 Tobacco use 38.9%
Great Lakes Region n=135 1 Alcohol abuse 69.6% 2 Drug abuse 55.6% 3 Tobacco use 42.2% 4 Lack of exercise 35.6% 5t Being overweight 23.0% 5t Racism 23.0%
American-born (Caucasian) n=104 1 Alcohol abuse 58.7% 2 Drug abuse 51.9% 3 Tobacco use 31.7% 4 Poor eating habits 26.0% 5 Other 22.1%
South Sudanese n=82 1 Alcohol abuse 92.7% 2 Drug abuse 74.4% 3 Lack of exercise 37.8% 4 Racism 25.6% 5 Dropping out of school 23.2%

2014 Minority Health Assessment Report – Cumberland County
City of Portland Public Health Division’s Minority Health Program - Project funded by MeHAF
25
Sudanese n=59 1 Alcohol abuse 93.1% 2 Lack of exercise 60.3% 3 Drug abuse 36.2%
4 Not getting "shots" to prevent
disease 34.5%
5 Dropping out of school 32.8%
Russian n=50 1 Lack of exercise 64.0% 2 Being overweight 60.0% 3 Alcohol abuse 44.0% 4 Tobacco use 34.0% 5 Poor eating habits 22.0%
Cambodian n=43 1 Alcohol abuse 90.7% 2 Dropping out of school 53.5% 3 Tobacco use 46.5% 4 Drug abuse 37.2%
5 Not using seat belts/child safety seats 27.9%
American-born (African American) n=15
1 Alcohol abuse 73.3% 2 Drug abuse 66.7% 3t Racism 53.3% 3t Tobacco use 53.3% 4t Being overweight 20.0% 4t Dropping out of school 20.0%
Hearing impaired/ASL n=14 1 Alcohol abuse 78.6% 2t Being overweight 42.9% 2t Lack of exercise 42.9% 4 Tobacco use 35.7% 5 Poor eating habits 28.6%
Overall, respondents cited dental problems as their most important health problem or risky behavior (Table 12). In addition, dental problems were a top concern for all ethnic groups, except American-born Caucasians and hearing impaired/ASL individuals. Lack of exercise ranked second among the overall sample, with four ethnic groups (American-born Caucasian, Bosnian, Serbs, and Croatian, Great Lakes Region, and Russian) citing it as a concern and three (Latino, Cambodian, and hearing impaired/ASL) ranking it as the top concern. Alcohol abuse came in third as overall problems and was the most common top response, placing first amongst four ethnic groups (American-born Caucasians, Great Lakes Region, South Sudanese, and Sudanese). Diabetes came in fourth overall. Of the six ethnic groups (Great Lakes Region, Iraqi, Latino, Somali, American-born African Americans, and Sudanese) that listed diabetes as a top concern, two (Great Lakes Region and Latino) have the highest rate of uninsured individuals. High blood pressure came in as the fifth most important concern overall and was listed as a problem for six communities (Great Lakes Region, Cambodian, Russian, Iraqi, hearing impaired/ASL, and Somali).

2014 Minority Health Assessment Report – Cumberland County
City of Portland Public Health Division’s Minority Health Program - Project funded by MeHAF
26
Table 12: Most important health problems or risky behaviors for the individual, by ethnicity (up to 3 answers possible)
Overall n=1,254 1 Dental problems 26.1% 2 Lack of exercise 26.0% 3 Alcohol use 25.0% 4 Diabetes 24.6% 5 High blood pressure 24.1%
Latino n=187 1 Lack of exercise 25.7% 2t Dental problems 20.3% 2t Diabetes 20.3% 2t Poor eating habits 20.3% 5 Aging problems 17.6%
Iraqi n=179 1 High blood pressure 39% 2 Mental health problems 34% 3 Dental problems 32% 4 Diabetes 29% 5 Being overweight 26%
Somali n=161 1 Diabetes 44.1% 2 High blood pressure 39.1% 3 Dental problems 34.2% 4 Cancer 26.1% 5 Mental health problems 23.0%
Bosnian/Serb/Croat n=149 1 Aging problems 44.3% 2 Lack of exercise 34.9% 3 Dental problems 29.5% 4 Being overweight 28.9% 5 Poor eating habits 26.8%
Great Lakes Region n=136 1 Alcohol use 40.4% 2 Diabetes 33.8% 3 Dental problems 27.2% 4 High blood pressure 25.7% 5 Lack of exercise 22.1%
American-born (Caucasian) n=103 1 Alcohol use 33.0% 2 Lack of exercise 30.1% 3 Aging problems 23.3% 4 Mental health problems 19.4% 5t Poor eating habits 18.4% 5t Other 18.4%
South Sudanese n=82 1 Alcohol use 79.3% 2 Drug use 40.2% 3 Mental health problems 29.3% 4 Dental problems 28.0% 5 Domestic violence 26.8%
Sudanese n=58 1 Alcohol use 53.4% 2 Diabetes 43.1% 3 Domestic violence 39.7% 4 Dental problems 36.2% 5 Drug use 20.7%
Russian n=50 1 Lack of exercise 34.0% 2t Dental problems 32.0% 2t High blood pressure 32.0% 4 Heart disease and stroke 30.0% 5t Being overweight 24.0% 5t Cancer 24.0%
Cambodian n=43 1 Lack of exercise 51.2% 2 High blood pressure 44.2% 3 Aging problems 32.6% 4 Alcohol use 30.2% 5t Dental problems 20.9% 5t Tobacco use 20.9% 5t Other 20.9% American-born (African American) n=15
1t Diabetes 26.7% 1t Tobacco use 26.7% 2t Being overweight 20.0% 2t Dental problems 20.0% 2t Poor eating habits 20.0%
2014 Minority Health Assessment Report – Cumberland County
City of Portland Public Health Division’s Minority Health Program - Project funded by MeHAF
27
Hearing impaired/ASL n=14 1 Lack of exercise 42.9% 2 Being overweight 35.7% 3t Aging problems 28.6%
3t Mental health problems 28.6% 5t Child abuse/neglect 21.4% 5t High blood pressure 21.4% 5t Suicidal thoughts 21.4%
We also compared health ratings by demographics, such as gender, relationship status, household status, education, and annual income. Overall, respondents grouped by demographics rated their personal health 2% higher than that of their community, with individuals making between $30,000 to $49,999 and over $50,000 having the greatest difference at 5% each. Only respondents with less than a high school diploma (-2%) and an annual income lower than $10,000 (-1%) rated their personal health lower than that of their community. Individuals on government insurance rated their personal health equal to that of their community. Table 13. Health ratings by gender
Gender Average
community health rating
Average personal
health rating
Difference between personal and
community health ratings
Female 2.91 2.95 1% Male 2.87 2.93 2%
Table 14. Health ratings by relationship status
Relationship Status
Average community
health rating
Average personal
health rating
Difference between personal and
community health ratings
Married 2.90 2.93 1% Not Married 2.87 2.96 3%
Table 15. Health rating, by household status
Household status Average
community health rating
Average personal
health rating
Difference between personal and
community health ratings
Co-habitating 2.91 2.97 2% Single/live alone 2.77 2.83 2%
Table 16. Health ratings by education level
Highest education level Average
community health rating
Average personal
health rating
Difference between
personal and community
health ratings Less than high school 2.81 2.76 -2% High school diploma or
GED 2.90 2.96 2%
Some college 2.94 2.99 2% College degree or higher 2.89 3.01 4%
2014 Minority Health Assessment Report – Cumberland County
City of Portland Public Health Division’s Minority Health Program - Project funded by MeHAF
28
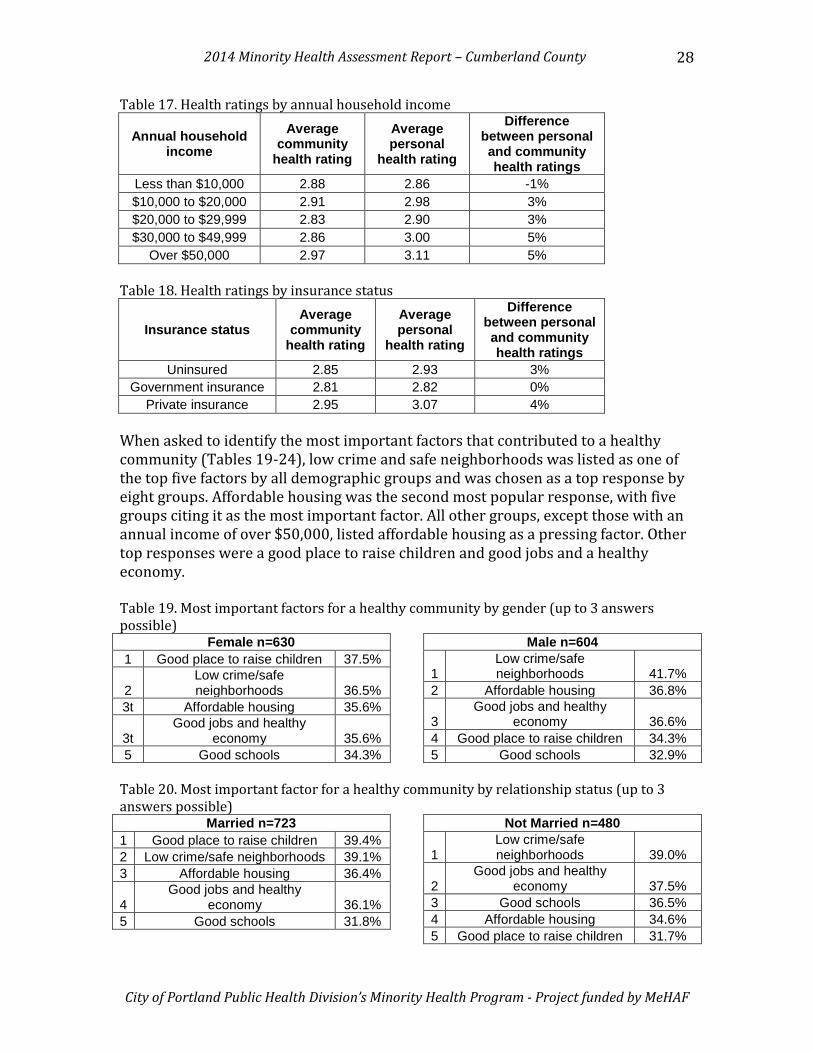
Table 17. Health ratings by annual household income
Annual household income
Average community
health rating
Average personal
health rating
Difference between personal and community health ratings
Less than $10,000 2.88 2.86 -1% $10,000 to $20,000 2.91 2.98 3% $20,000 to $29,999 2.83 2.90 3% $30,000 to $49,999 2.86 3.00 5%
Over $50,000 2.97 3.11 5% Table 18. Health ratings by insurance status
Insurance status Average
community health rating
Average personal
health rating
Difference between personal and community health ratings
Uninsured 2.85 2.93 3% Government insurance 2.81 2.82 0%
Private insurance 2.95 3.07 4% When asked to identify the most important factors that contributed to a healthy community (Tables 19-24), low crime and safe neighborhoods was listed as one of the top five factors by all demographic groups and was chosen as a top response by eight groups. Affordable housing was the second most popular response, with five groups citing it as the most important factor. All other groups, except those with an annual income of over $50,000, listed affordable housing as a pressing factor. Other top responses were a good place to raise children and good jobs and a healthy economy. Table 19. Most important factors for a healthy community by gender (up to 3 answers possible)
Female n=630 1 Good place to raise children 37.5%
2 Low crime/safe neighborhoods 36.5%
3t Affordable housing 35.6%
3t Good jobs and healthy
economy 35.6% 5 Good schools 34.3%
Male n=604
1 Low crime/safe neighborhoods 41.7%
2 Affordable housing 36.8%
3 Good jobs and healthy
economy 36.6% 4 Good place to raise children 34.3% 5 Good schools 32.9%
Table 20. Most important factor for a healthy community by relationship status (up to 3 answers possible)
Married n=723 1 Good place to raise children 39.4% 2 Low crime/safe neighborhoods 39.1% 3 Affordable housing 36.4%
4 Good jobs and healthy
economy 36.1% 5 Good schools 31.8%
Not Married n=480
1 Low crime/safe neighborhoods 39.0%
2 Good jobs and healthy
economy 37.5% 3 Good schools 36.5% 4 Affordable housing 34.6% 5 Good place to raise children 31.7%

2014 Minority Health Assessment Report – Cumberland County
City of Portland Public Health Division’s Minority Health Program - Project funded by MeHAF
29
Table 21. Most important factor for a healthy community by household status (up to 3 answers possible)
Co-habitating (e.g., roommates, family) n=961
1 Low crime/safe neighborhoods 38.9%
2 Good jobs and healthy
economy 36.9% 3 Good place to raise children 35.7% 4 Good schools 34.8% 5 Affordable housing 34.5%
Single/live alone n=193
1 Low crime/safe neighborhoods 40.9%
2 Affordable housing 38.3%
3 Good jobs and healthy
economy 35.2% 4 Good place to raise children 34.2% 5 Good schools 29.5%
Table 22. Most important factor for a healthy community by education level (up to 3 answers possible)
Less than high school n=252 1 Affordable housing 38.9%
2 Good jobs and healthy economy 36.9%
3 Low crime/safe neighborhoods 36.5% 4 Good place to raise children 32.9% 5 Good schools 32.5%
High school diploma/GED n=474
1 Good jobs and healthy economy 38.4%
2 Affordable housing 38.2% 3 Good place to raise children 37.1% 4 Good schools 35.9% 5 Low crime/safe neighborhoods 34.8%
Some college n=247 1 Affordable housing 40.5% 2 Low crime/safe neighborhoods 40.1% 3 Good place to raise children 38.5% 4 Good schools 34.4%
5 Good jobs and healthy economy 32.0%
College degree or higher n=269
1 Low crime/safe neighborhoods 48.0%
2t Good place to raise children 36.4%
2t Good jobs and healthy economy 36.4%
4 Good schools 29.7% 5 Affordable housing 26.4%
Table 23. Most important factors for a healthy community by annual household income (up to 3 answers possible)
Less than $10,000 n=399 1 Affordable housing 43.1% 2 Good schools 34.6% 3 Low crime/safe neighborhoods 34.1% 4 Good place to raise children 33.6% 5 Access to health care 31.1%
$10,000 to $20,000 n=323 1 Affordable housing 41.5%
2 Low crime/safe neighborhoods 38.4%
3 Good jobs and healthy economy 36.2%
4 Good place to raise children 35.3% 5 Good schools 33.4%
$20,000 to $29,999 n=232
1 Low crime/safe neighborhoods 47.4%
2 Good jobs and healthy economy 40.9%
3 Good place to raise children 40.5% 4 Good schools 34.1% 5 Affordable housing 34.1%
$30,000 to $49,999 n=138
1 Good jobs and healthy economy 42.8%
2 Low crime/safe neighborhoods 40.6%
3 Good place to raise children 36.2% 4 Good schools 34.1% 5 Affordable housing 30.4%

2014 Minority Health Assessment Report – Cumberland County
City of Portland Public Health Division’s Minority Health Program - Project funded by MeHAF
30
Over $50,000 n=111
1 Good jobs and healthy economy 58.6%
2 Low crime/safe neighborhoods 42.3%
3 Good place to raise children 37.8%
4 Healthy behaviors and lifestyles 36.9%
5 Good schools 29.7%
Table 24. Most important factors for a healthy community by insurance status (up to 3 answers possible)
Uninsured n=334 1 Affordable housing 45.5%
2 Good jobs and healthy economy 38.0%
3 Low crime/safe neighborhoods 32.9% 4 Good schools 32.6% 5 Good place to raise children 29.3%
Government Insurance n=519 1 Low crime/safe neighborhoods 40.8% 2 Affordable housing 39.5% 3 Good place to raise children 36.4% 4 Good schools 32.4%
5 Good jobs and healthy economy 31.2%
Private Insurance n=403
1 Low crime/safe neighborhoods 44.9%
2 Good jobs and healthy economy 43.2%
3 Good place to raise children 40.2% 4 Good schools 33.3% 5 Affordable housing 27.0%
When asked to identify the most important health problems in the community (Tables 25-30), all groups, except those with an annual household income above $50,000, cited diabetes as one of their top five concerns. High blood pressure was a top concern for five groups and was named as a concern for all. Other popular top community health problems were aging problems, such as arthritis and hearing and vision loss, and mental health problems. Table 25. Most important health problem in the community by gender (up to three answers possible)
Female n=629 1 Diabetes 44.7% 2 High blood pressure 37.7% 3 Dental problems 36.9% 4 Cancer 28.6% 5 Aging problems 27.5%
Male n=602 1 High blood pressure 41.4% 2 Diabetes 39.7% 3 Dental problems 33.2% 4 Cancer 28.9% 5 Mental health problems 28.1%
Table 26. Most important health problem in the community by relationship status (up to three answers possible)
Married n=720 1 High blood pressure 45.8% 2 Diabetes 44.6% 3 Dental problems 37.4% 4 Aging problems 29.7% 5 Mental health problems 28.5%
Not Married n=480 1 Diabetes 38.1% 2t Dental problems 31.0% 2t High blood pressure 31.0% 4 Cancer 29.4% 5 Mental health problems 26.5%

2014 Minority Health Assessment Report – Cumberland County
City of Portland Public Health Division’s Minority Health Program - Project funded by MeHAF
31
Table 27. Most important health problem in the community by household status (up to three answers possible)
Co-habitating (e.g., roommates, family) n=960
1 High blood pressure 41.8% 2 Diabetes 40.9% 3 Dental problems 35.7% 4 Aging problems 28.8% 5 Mental health problems 28.3%
Single/live alone n=192 1 Diabetes 45.3% 2 High blood pressure 33.9% 3 Dental problems 30.7% 4 Aging problems 29.7% 5 Cancer 28.6%
Table 28. Most important health problem in the community by education level (up to three answers possible)
Less than high school n=253 1 Diabetes 52.2% 2 High blood pressure 38.7% 3 Dental problems 33.2% 4 Cancer 30.4% 5 Mental health problems 21.7%
High school diploma or GED n=473
1 High blood pressure 41.4% 2 Diabetes 41.2% 3 Dental problems 38.9% 4t Cancer 26.8% 4t Mental health problems 26.8%
Some college n=245 1 Diabetes 38.8% 2 High blood pressure 38.0% 3 Dental problems 35.1% 4 Cancer 30.6% 5 Aging problems 26.5%
College degree or higher n=268
1 Diabetes 38.1% 2t High blood pressure 36.9% 2t Mental health problems 36.9% 4 Aging problems 35.4% 5 Dental problems 29.9%
Table 29. Most important health problem in the community by annual household income (up to three answers possible)
Less than $10,000 n=399 1 Diabetes 48.9% 2 High blood pressure 46.1% 3 Dental problems 37.1% 4 Cancer 30.8% 5 Mental health problems 29.8%
$10,000 to $20,000 n=323
1 Diabetes 44.6% 2 High blood pressure 41.5% 3 Cancer 33.7% 4 Dental problems 29.7% 5 Aging problems 23.2%
$20,000 to $29,999 n=232 1 Diabetes 45.7% 2 Dental problems 40.1% 3 High blood pressure 32.8% 4 Cancer 29.3% 5 Aging problems 24.1%
$30,000 to $49,999 n=137
1 Aging problems 41.6% 2 High blood pressure 40.1% 3 Dental problems 39.4% 4 Mental health problems 35.0% 5 Diabetes 29.2%
Over $50,000 n=110
1 Mental health problems 50.0% 2 Aging problems 49.1% 3 Heart disease and stroke 30.9% 4 Dental problems 26.4% 5 High blood pressure 24.5%
2014 Minority Health Assessment Report – Cumberland County
City of Portland Public Health Division’s Minority Health Program - Project funded by MeHAF
32
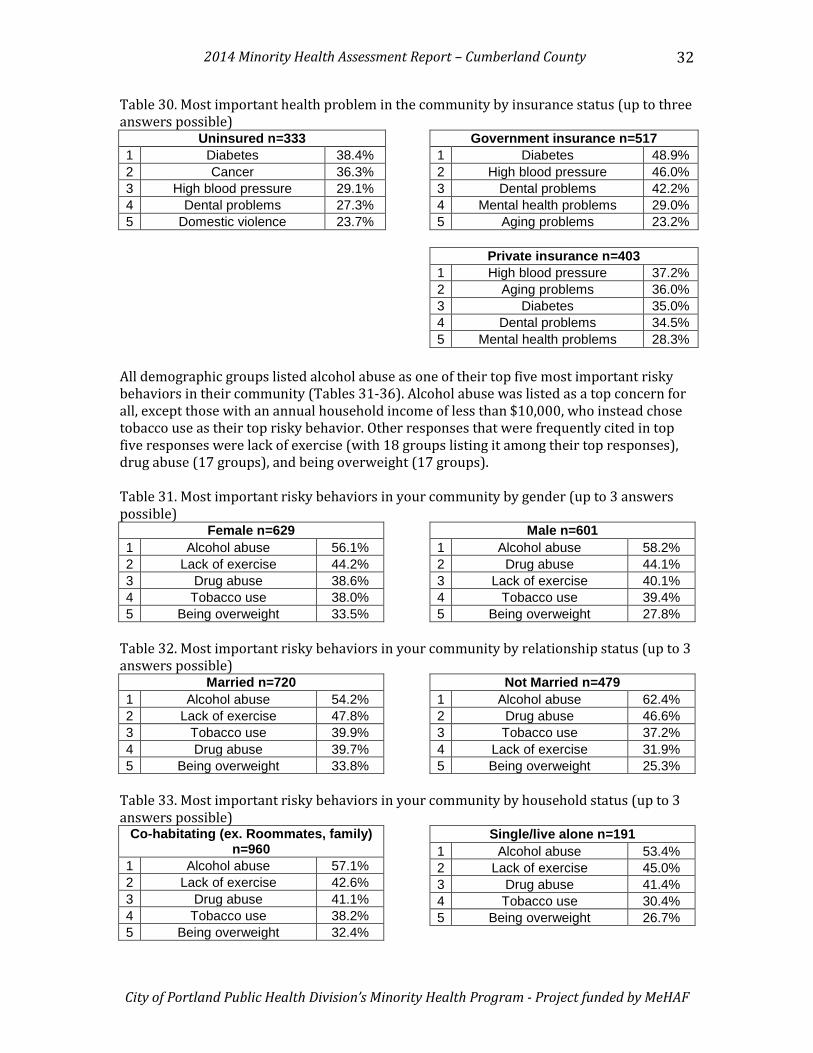
Table 30. Most important health problem in the community by insurance status (up to three answers possible)
Uninsured n=333 1 Diabetes 38.4% 2 Cancer 36.3% 3 High blood pressure 29.1% 4 Dental problems 27.3% 5 Domestic violence 23.7%
Government insurance n=517 1 Diabetes 48.9% 2 High blood pressure 46.0% 3 Dental problems 42.2% 4 Mental health problems 29.0% 5 Aging problems 23.2%
Private insurance n=403
1 High blood pressure 37.2% 2 Aging problems 36.0% 3 Diabetes 35.0% 4 Dental problems 34.5% 5 Mental health problems 28.3%
All demographic groups listed alcohol abuse as one of their top five most important risky behaviors in their community (Tables 31-36). Alcohol abuse was listed as a top concern for all, except those with an annual household income of less than $10,000, who instead chose tobacco use as their top risky behavior. Other responses that were frequently cited in top five responses were lack of exercise (with 18 groups listing it among their top responses), drug abuse (17 groups), and being overweight (17 groups). Table 31. Most important risky behaviors in your community by gender (up to 3 answers possible)
Female n=629 1 Alcohol abuse 56.1% 2 Lack of exercise 44.2% 3 Drug abuse 38.6% 4 Tobacco use 38.0% 5 Being overweight 33.5%
Male n=601 1 Alcohol abuse 58.2% 2 Drug abuse 44.1% 3 Lack of exercise 40.1% 4 Tobacco use 39.4% 5 Being overweight 27.8%
Table 32. Most important risky behaviors in your community by relationship status (up to 3 answers possible)
Married n=720 1 Alcohol abuse 54.2% 2 Lack of exercise 47.8% 3 Tobacco use 39.9% 4 Drug abuse 39.7% 5 Being overweight 33.8%
Not Married n=479 1 Alcohol abuse 62.4% 2 Drug abuse 46.6% 3 Tobacco use 37.2% 4 Lack of exercise 31.9% 5 Being overweight 25.3%
Table 33. Most important risky behaviors in your community by household status (up to 3 answers possible)
Co-habitating (ex. Roommates, family) n=960
1 Alcohol abuse 57.1% 2 Lack of exercise 42.6% 3 Drug abuse 41.1% 4 Tobacco use 38.2% 5 Being overweight 32.4%
Single/live alone n=191 1 Alcohol abuse 53.4% 2 Lack of exercise 45.0% 3 Drug abuse 41.4% 4 Tobacco use 30.4% 5 Being overweight 26.7%

2014 Minority Health Assessment Report – Cumberland County
City of Portland Public Health Division’s Minority Health Program - Project funded by MeHAF
33
Table 34. Most important risky behaviors in your community by education level (up to 3 answers possible)
Less than high school n=253 1 Alcohol abuse 53.8% 2 Lack of exercise 43.9% 3 Drug abuse 42.7% 4 Tobacco use 37.9% 5 Being overweight 28.5%
High school diploma or GED n=471
1 Alcohol abuse 56.5% 2 Drug abuse 41.4% 3 Tobacco use 40.3% 4 Lack of exercise 40.1% 5 Being overweight 32.7%
Some college n=245 1 Alcohol abuse 58.8% 2 Lack of exercise 42.9% 3 Drug abuse 41.6% 4 Tobacco use 36.3% 5 Being overweight 27.3%
College degree or higher n=269
1 Alcohol abuse 58.7% 2 Lack of exercise 44.2% 3 Drug abuse 40.5% 4 Tobacco use 35.7% 5 Being overweight 31.2%
Table 35. Most important risky behaviors in your community by annual household income (up to 3 answers possible)
Less than $10,000 n=398 1 Tobacco use 49.2% 2 Lack of exercise 47.2% 3 Alcohol abuse 46.2% 4 Drug abuse 34.7% 5 Being overweight 31.7%
$10,000 to $20,000 n=323
1 Alcohol abuse 57.3% 2 Drug abuse 47.4% 3 Lack of exercise 40.6% 4 Tobacco use 34.4% 5 Being overweight 27.9%
$20,000 to $29,999 n=232 1 Alcohol abuse 65.5% 2 Drug abuse 47.4% 3 Lack of exercise 44.4% 4 Tobacco use 28.0% 5 Being overweight 27.6%
$30,000 to $49,999 n=136
1 Alcohol abuse 69.1% 2 Drug abuse 47.1% 3 Lack of exercise 37.5% 4 Poor eating habits 31.6% 5 Being overweight 30.1%
Over $50,000 n=111
1 Alcohol abuse 61.3% 2 Being overweight 45.9% 3 Tobacco use 37.8% 4 Lack of exercise 36.0% 5 Poor eating habits 33.3%
Table 36. Most important risky behaviors in your community by insurance status (up to 3 answers possible)
Uninsured n=334 1 Alcohol abuse 64.4% 2 Drug abuse 56.3% 3 Tobacco use 36.5% 4 Lack of exercise 26.9% 5 Racism 24.9%
Government insurance n=515 1 Alcohol abuse 51.7% 2 Lack of exercise 50.5% 3 Tobacco use 41.4% 4 Drug abuse 37.9% 5 Being overweight 32.6%
2014 Minority Health Assessment Report – Cumberland County
City of Portland Public Health Division’s Minority Health Program - Project funded by MeHAF
34
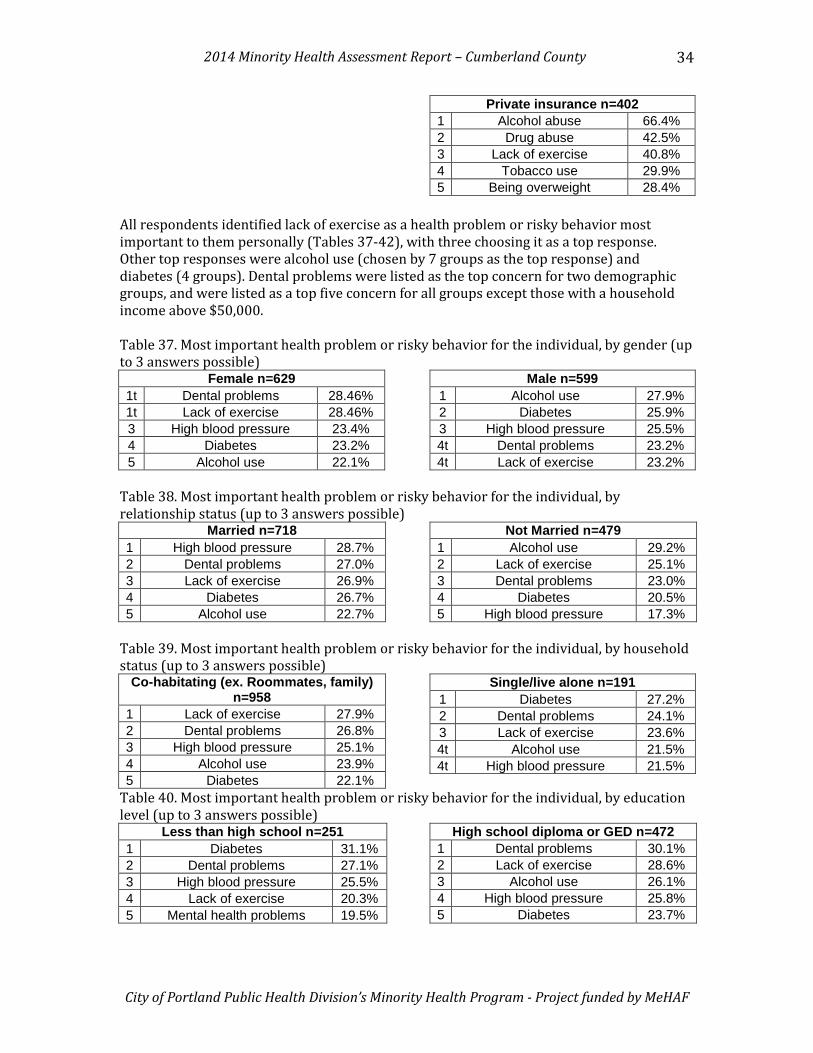
Private insurance n=402 1 Alcohol abuse 66.4% 2 Drug abuse 42.5% 3 Lack of exercise 40.8% 4 Tobacco use 29.9% 5 Being overweight 28.4%
All respondents identified lack of exercise as a health problem or risky behavior most important to them personally (Tables 37-42), with three choosing it as a top response. Other top responses were alcohol use (chosen by 7 groups as the top response) and diabetes (4 groups). Dental problems were listed as the top concern for two demographic groups, and were listed as a top five concern for all groups except those with a household income above $50,000. Table 37. Most important health problem or risky behavior for the individual, by gender (up to 3 answers possible)
Female n=629 1t Dental problems 28.46% 1t Lack of exercise 28.46% 3 High blood pressure 23.4% 4 Diabetes 23.2% 5 Alcohol use 22.1%
Male n=599 1 Alcohol use 27.9% 2 Diabetes 25.9% 3 High blood pressure 25.5% 4t Dental problems 23.2% 4t Lack of exercise 23.2%
Table 38. Most important health problem or risky behavior for the individual, by relationship status (up to 3 answers possible)
Married n=718 1 High blood pressure 28.7% 2 Dental problems 27.0% 3 Lack of exercise 26.9% 4 Diabetes 26.7% 5 Alcohol use 22.7%
Not Married n=479 1 Alcohol use 29.2% 2 Lack of exercise 25.1% 3 Dental problems 23.0% 4 Diabetes 20.5% 5 High blood pressure 17.3%
Table 39. Most important health problem or risky behavior for the individual, by household status (up to 3 answers possible)
Co-habitating (ex. Roommates, family) n=958
1 Lack of exercise 27.9% 2 Dental problems 26.8% 3 High blood pressure 25.1% 4 Alcohol use 23.9% 5 Diabetes 22.1%
Single/live alone n=191 1 Diabetes 27.2% 2 Dental problems 24.1% 3 Lack of exercise 23.6% 4t Alcohol use 21.5% 4t High blood pressure 21.5%
Table 40. Most important health problem or risky behavior for the individual, by education level (up to 3 answers possible)
Less than high school n=251 1 Diabetes 31.1% 2 Dental problems 27.1% 3 High blood pressure 25.5% 4 Lack of exercise 20.3% 5 Mental health problems 19.5%
High school diploma or GED n=472 1 Dental problems 30.1% 2 Lack of exercise 28.6% 3 Alcohol use 26.1% 4 High blood pressure 25.8% 5 Diabetes 23.7%

2014 Minority Health Assessment Report – Cumberland County
City of Portland Public Health Division’s Minority Health Program - Project funded by MeHAF
35
Some college n=245 1 Alcohol use 25.3% 2 High blood pressure 24.5% 3 Diabetes 23.7% 4 Dental problems 22.4% 5 Lack of exercise 20.4%
College degree or higher n=268 1 Lack of exercise 32.1% 2 Alcohol use 29.1% 3 Dental problems 20.9% 4 Diabetes 20.1% 5 High blood pressure 19.4%
Table 41. Most important health problem or risky behavior for the individual, by annual household income (up to 3 answers possible)
Less than $10,000 n=398 1 High blood pressure 30.4% 2 Diabetes 30.2% 3 Dental problems 27.6% 4 Lack of exercise 25.1% 5 Mental health problems 24.9%
$10,000 to $20,000 n=322
1 Diabetes 27.3% 2t Alcohol use 25.8% 2t Dental problems 25.8% 4 High blood pressure 24.5% 5 Lack of exercise 23.9%
$20,000 to $29,999 n=232 1 Alcohol use 31.5% 2 Dental problems 30.2% 3 Lack of exercise 21.6% 4 Diabetes 20.7% 5 Being overweight 19.4%
$30,000 to $49,999 n=136
1 Alcohol use 36.8% 2 Lack of exercise 30.1% 3t Aging problems 25.0% 3t Dental problems 25.0% 5t Being overweight 19.9% 5t Poor eating habits 19.9%
Over $50,000 n=110
1 Lack of exercise 40.9% 2t Aging problems 26.4% 2t Alcohol use 26.4% 4 Poor eating habits 25.5% 5 Being overweight 23.6%
Table 42. Most important health problem or risky behavior for the individual, by insurance status (up to 3 answers possible)
Uninsured n=332 1 Alcohol use 28.6% 2 Dental problems 25.0% 3 Diabetes 21.7% 4t Lack of exercise 20.8% 4t Mental health problems 20.8%
Government insurance n=515 1 Diabetes 31.1% 2 Dental problems 29.5% 3 High blood pressure 29.1% 4 Mental health problems 24.9% 5 Lack of exercise 24.1%
Private insurance n=402
1 Alcohol use 34.1% 2 Lack of exercise 29.4% 3 Dental problems 21.1% 4 Being overweight 20.6% 5 Aging problems 20.4%