minto mine closure failure modes and effects ... page i distribution list revision history revision...
TRANSCRIPT
MINTO MINE CLOSURE – FAILURE MODES AND EFFECTS ASSESSMENT
2017 WORKSHOP REPORT
MIN‐16‐03‐_008_Minto Mine Closure FMEA 2017 Final Report_RevA_180123
February 1, 2018
Prepared for:
MINTO EXPLORATIONS LTD.
MINTO MINE CLOSURE – FAILURE MODES AND EFFECTS ASSESSMENT
2017 WORKSHOP REPORTMINTO EXPLORATIONS LTD.
FEBRUARY 1, 2018
MIN‐16‐03‐_008_MINTO MINE CLOSURE FMEA 2017 FINAL REPORT_REVA_180123.DOCX PAGE I
DISTRIBUTION LIST
REVISION HISTORY
Revision Date:
Issued By: Revision Status: Description:
Dec 13, 2017 Scott Keesey Initial Draft Rev A
Jan 23, 2018 Scott Keesey Final Rev A
ALEXCO ENVIRONMENTAL GROUP INC. SIGNATURES
# of copies Company/Agency name
1 Minto Explorations Ltd.
Report prepared by:
13/12/2017
Ken Boldt, P.Eng.
Environmental Engineer
Report reviewed by:
1/23/2018
T. Scott Keesey, BSc, EP
Sr. Environmental Manager
MINTO MINE CLOSURE – FAILURE MODES AND EFFECTS ASSESSMENT
2017 WORKSHOP REPORTMINTO EXPLORATIONS LTD.
FEBRUARY 1, 2018
MIN‐16‐03‐_008_MINTO MINE CLOSURE FMEA 2017 FINAL REPORT_REVA_180123.DOCX PAGE II
TABLE OF CONTENTS
1. INTRODUCTION ............................................................................................................................................................... 1
1.1 BACKGROUND ................................................................................................................................................... 1
1.2 CURRENT PLANNING ........................................................................................................................................... 1
2. 2017 FMEA WORKSHOP ................................................................................................................................................. 3
2.1 WORKSHOP OBJECTIVES ..................................................................................................................................... 3
2.2 SCOPE AND APPROACH ....................................................................................................................................... 3
2.3 WORKSHOP STRUCTURE ..................................................................................................................................... 4
2.3.1 October Workshop ........................................................................................................................................ 4
2.3.2 December Workshop .................................................................................................................................... 4
2.4 FMEA PROCESS ................................................................................................................................................ 5
2.4.1 Removal of Select 2014 FMEA Risk Statements ........................................................................................... 5
2.4.2 Risk Rating Process ........................................................................................................................................ 5
2.4.3 Re‐ranking Process ........................................................................................................................................ 5
3. FMEA RESULTS ................................................................................................................................................................ 6
3.1 RISK REGISTERS (APPENDIX B) ............................................................................................................................. 6
3.2 RISK MATRICES (APPENDIX C) .............................................................................................................................. 6
3.3 RISKS NOT RE‐EVALUATED (APPENDIX D) .............................................................................................................. 9
3.4 PARKING LOT ITEMS ........................................................................................................................................... 9
4. SUMMARY ..................................................................................................................................................................... 11
LIST OF TABLES
Table 4‐1: October FMEA Workshop Participants ........................................................................................................................... 4
Table 4‐2: December FMEA Workshop Participants ....................................................................................................................... 4
LIST OF APPENDICES
RISK RATING TOOLS
2017 FMEA RISK REGISTERS
2017 FMEA RISK MATRICES
SUMMARY OF RISKS NOT RE‐EVALUATED IN 2017 FMEA
MINTO MINE CLOSURE – FAILURE MODES AND EFFECTS ASSESSMENT
2017 WORKSHOP REPORTMINTO EXPLORATIONS LTD.
FEBRUARY 1, 2018
MIN‐16‐03‐_008_MINTO MINE CLOSURE FMEA 2017 FINAL REPORT_REVA_180123.DOCX PAGE III
LIST OF ACRONYMS AND ABBREVIATIONS
ACG AccessConsultingGroupAEG AlexcoEnvironmentalGroupInc.AES AtmosphericEnvironmentServiceEMR EnergyMinesandResourcesFMEA FailureModesandEffectsAnalysisMWD MainWasteDumpPCMM PostClosureMonitoringandMaintenanceRCP ReclamationandClosurePlanSAT WasteRockthathasaNP:AP<3SFN SelkirkFirstNationWQ WaterQualityWUL WaterUseLicenceYESAA YukonEnvironmentalandSocio‐economicAssessmentActYESAB YukonEnvironmentalandSocio‐economicAssessmentBoardYG YukonGovernmentYWB YukonWaterBoard
MINTO MINE CLOSURE – FAILURE MODES AND EFFECTS ASSESSMENT
2017 WORKSHOP REPORTMINTO EXPLORATIONS LTD.
FEBRUARY 1, 2018
MIN‐16‐03‐_008_MINTO MINE CLOSURE FMEA 2017 FINAL REPORT_REVA_180123.DOCX PAGE 1
1. INTRODUCTION
FailureModesandEffectsAssessment(FMEA)isariskevaluationtoolthathasbeenusedtoidentifyandrankrisksassociated with the Minto Mine Reclamation and Closure Plan (RCP) since 2013. This report provides a briefbackgroundoftheseexercisesandpresentsasummaryofthe2017FMEAupdate,whichwasundertakentoevaluaterisksassociatedwithMinto’sRCPv2017‐01,andtoinformplanningandmitigativemeasureselectioninRCPv2018‐01.
1.1 BACKGROUND
In2013,inadvanceofthesubmissionofaReclamationandClosurePlan(RCP)forthePhaseIVmineplanattheMintoMine,MintoExplorationsLtd.(Minto)conductedamulti‐stakeholderFailureModesandEffectsAssessment(FMEA)onasuiteofexamplemineclosurescenarios. TheworkshopwasheldinWhitehorseinJanuaryof2013,andinvolvedparticipants representingMinto, Selkirk FirstNation (SFN), YukonGovernment‐EnergyMines andResources (YG‐EMR),andtheYukonWaterBoard(YWB).
Insupportofpermitamendmentapplications forthePhaseV/VIExpansionmineplan,MintopreparedanupdatedReclamationandClosurePlan (RCPv5.1,August2014).Mintohostedamulti‐stakeholderFMEAworkshop (in twoparts)forthePhaseV/VIRCP.ThefirstsessionwasheldinVancouverinAugust2014.Thetwo‐dayworkshopinAugust2014includedparticipationbyrepresentativesofMinto,SFN,andYG‐EMR.RepresentativesfromNorwestCorporation(in its third‐party review capacity on geotechnical subjects at Minto Mine, on behalf of Minto and SFN jointly)participatedontheseconddayonly.Asecond,supplementaryFMEAworkshopwasheldinWhitehorseinOctober2014withasmallersubsetoftheoriginalworkshopgrouptoaddressoutstandingminecomponentsandclosureaspectsthathadnotbeenaddressedinthefirstworkshop.The2014FMEAReportwasincludedasanappendixtosubsequentRCPversions(seeSection1.2).
1.2 CURRENT PLANNING
PeritsWaterUseLicencecondition,MintosubmittedanupdatedReclamationandClosurePlaninAugust2016(RCPv2016‐01)whichincorporatedchangesidentifiedaspertheWULandQML.It includedtheadvancementofclosuredesigns from conceptual to preliminary, as well as an updatedwater and load balancemodel, and addressed thenarrowedmineplanscopecomparedtoearlierversionsoftheRCP.AfurtherupdatedRCPwassubmittedinMarch2017(RCPv2017‐01,March2017)whichincorporatedthefinalPostClosureWaterQualityObjectivesandanupdatedClosureAdaptiveManagementPlan(AMP).
TheseRCPversionshavebeensubmittedtotheYWBasaWULamendmentapplication,andassuchhavebeensubjecttoanadequacyreview. OnMay26,2017,YWBissuedtheirTechnical InformationRequest#2,which includedthefollowingrelatedtotheFMEA:
IR2‐15.PleaseprovideanupdatedclosureFMEAthatincludesallcomponentsoftheproposedRCO,includingwatertreatment,anddealswitthe“parkinglot”issuesidentifiedonPage4ofexhibit1.2[theFMEAsummaryreport].
TheseparkinglotissueswereitemsraisedintheFMEAforwhicheithernotenoughinformationexistedregardingRCPdetailstobeabletoeffectivelyevaluatetherisk(e.g.passivewatertreatmentplan)ortheteamcouldnotdetermineaneffectivewaytoresolveadifferenceofopinion,anda ‘note’wasmade intheparking lot. Itwas identifiedthat thefollowingparkinglotitemsrequiredfurtherconsideration:
MINTO MINE CLOSURE – FAILURE MODES AND EFFECTS ASSESSMENT
2017 WORKSHOP REPORTMINTO EXPLORATIONS LTD.
FEBRUARY 1, 2018
MIN‐16‐03‐_008_MINTO MINE CLOSURE FMEA 2017 FINAL REPORT_REVA_180123.DOCX PAGE 2
Currentclosureplanisdeficientwithrespecttoshowingfinalreclaimedfacilities,toesofre‐gradedslopesandlocationofsecondaryandtertiarywaterconveyance;
MoreinformationrequestedregardingthestatusoftheReclamationResearchPlanandtheMainWasteDumprevegetationtrials;
TrafficabilitylayerisrequiredovertheRidgetopNorthPittailingsbackfillwhereascostingonlyallowsfor0.5mofoverburden;
Need to advance the discussion/determination of what constitutes “reasonable and practicable” passivetreatment,establishprotocolsandrevisittheoptionsevaluation;
SFN reiterated their concern that the consequence category of “Community/Media/Reputation” is biasedbecauseSFNarelumpedtogetherwithgroupshavingotherinterestsandperspective;and
Thecurrentclosureplandoesnotsufficientlyaddresssignageandaccesscontrol.There isaneedtoretaininstitutionalcontrolsandmaintainsignageinperpetuity.
Thisreportprovidesadescriptionofthe2017FMEAWorkshopproceedingsandoutcomes,undertakentomeettheseYWB information requests, and to informongoingplanning for thenext version of theMintoRCP. It includes theworkshopobjectivesandscope,theapproachtotheworkshop,adescriptionoftheworkshopactivitiesandthefinalriskregistersdevelopedintheexercise.

MINTO MINE CLOSURE – FAILURE MODES AND EFFECTS ASSESSMENT
2017 WORKSHOP REPORTMINTO EXPLORATIONS LTD.
FEBRUARY 1, 2018
MIN‐16‐03‐_008_MINTO MINE CLOSURE FMEA 2017 FINAL REPORT_REVA_180123.DOCX PAGE 3
2. 2017 FMEA WORKSHOP
InsupportoftheplannedRCPrevisionsandtheirsubmissiontoYWBintheformofRCPv2018‐01,andinanefforttosupplyYWBwiththerequestedinformation,MintoconductedthefirstFMEAsessioninVancouveronOctober18thand19th,2017.Thiswasaninternalexercise,andiseffectivelyare‐evaluationofthe2014riskregisterinthecontextofany new information. The first (of two)workshops covered site components forwhich a sufficient level of designcurrentlyexiststofacilitatethisriskassessment. Itwasfocusedonsite infrastructure(pits,wasterockdumps,drystack tailingsstorage facility,water conveyance, covers)andadministrative topics.ThesecondworkshopwasheldDecember1,2017tocoverwaterquality/watertreatmenttopics.
2.1 WORKSHOP OBJECTIVES
The primary objective of the FMEA workshop was to characterize the residual risks that would remain afterimplementationoftheRCPv2017‐01,particularlyinthecontextofhigheridentifiedrisksin2014andthroughamoreindepthlookatitemsthatwereincludedintheParkingLotin2014.
Thesecondaryobjectiveoftheworkshopwasto,foranyunacceptableresidualrisksidentifiedintherankingexercise,identifypotentialmitigationmeasuresthatwouldfurtherreducetheoverallriskrankingandbringtheresidualrisksintoamoreacceptable location in theriskmatrix. Thesepotentialmitigationscould thenbe incorporated intotheplanningworkbeingundertakencurrentlyforthedevelopmentoftheRCPv2018‐01.
2.2 SCOPE AND APPROACH
TheFMEAcoveredMinto’sRCPv2017‐01andrecentmineplanchanges(e.g.inclusionofRidgetopPitsandDump)andrelateddesignelementsfortheproposedclosuremeasures.ThisincludedRCPelementsthatwerenotfullydevelopedin 2014 (e.g. passive water treatment plan, waste dump re‐grading plans.) The FMEA was an ‘internal’ exercise(attendedonlybyMintomanagementandengineeringstaffandbyrelevantengineeringandplanningconsultants)andwas focused only on specific consequence types related to traditional engineering and design related‐risks andconsequences.FurtherdetailsontheriskratingtoolsareprovidedinSection2.4andAppendixA.
TheFMEAwascarriedoutbyrevisitingtherelevantriskregistercomponentsandentriesfrom2014,andmodifyingthe languageof the risk/consequencestatementsand the risk rankings if andwherenecessary. Risk/consequencestatementswereadded/modified/removedasrequired.
TheFMEAwasconductedbothona“Facility”basis(separateriskregistersforeachtypeoffacility)andontopicsthatare appropriately addressed on a “Site‐Wide” basis. These are generally reflective of the reclamation and closuremeasurespresentedinRCPSection7,andincluded:
Facilities:
OpenPits
WasteRockDumps
DryStackTailingsStorageFacility
Site‐WideTopics:
WaterQuality/WaterTreatment

MINTO MINE CLOSURE – FAILURE MODES AND EFFECTS ASSESSMENT
2017 WORKSHOP REPORTMINTO EXPLORATIONS LTD.
FEBRUARY 1, 2018
MIN‐16‐03‐_008_MINTO MINE CLOSURE FMEA 2017 FINAL REPORT_REVA_180123.DOCX PAGE 4
WaterConveyance
Administrative
2.3 WORKSHOP STRUCTURE
2.3.1 OCTOBER WORKSHOP
ThefirstFMEAworkshopwasheldatSRKConsulting’sVancouverofficeonOctober18thand19th,2017.TheworkshopwasfacilitatedbyS.KeeseyofAEG.Thetwo‐dayworkshopincludedparticipationbyrepresentativesofMinto,AlexcoEnvironmentalGroup,andSRKConsulting.ThetopicsratedintheOctoberworkshopincludedPits,WasteRockDumps,WaterConveyanceandAdministrative.
TheparticipantsarelistedinTable2‐1.
Table 2‐1: October FMEA Workshop Participants
Name Company
Ryan Herbert Minto Explorations Ltd.
Kevin Cymbalisty Minto Explorations Ltd.
Scott Keesey Alexco Environmental Group
Dylan MacGregor SRK Consulting
Erik Ketilson SRK Consulting
Sarah Portelance SRK Consulting
Peter Mikes SRK Consulting
2.3.2 DECEMBER WORKSHOP
The secondFMEAworkshopwas held at SRKConsulting’sVancouver office onDecember 1st, 2017 andwas againfacilitatedbyS.KeeseyofAEG.Theone‐dayworkshopincludedparticipationbyrepresentativesofMinto,ContangoStrategies, Alexco Environmental Group, and SRK Consulting. The December workshop was focused on WaterTreatmentandWaterQualityaspectsofMinto’sRCP.
TheparticipantsarelistedinTable2‐2.
Table 2‐2: December FMEA Workshop Participants
Name Company
Ryan Herbert Minto Explorations Ltd.
Monique Simair Contango Strategies Ltd.
Scott Keesey Alexco Environmental Group
Soren Jensen SRK Consulting
Dylan MacGregor SRK Consulting
MINTO MINE CLOSURE – FAILURE MODES AND EFFECTS ASSESSMENT
2017 WORKSHOP REPORTMINTO EXPLORATIONS LTD.
FEBRUARY 1, 2018
MIN‐16‐03‐_008_MINTO MINE CLOSURE FMEA 2017 FINAL REPORT_REVA_180123.DOCX PAGE 5
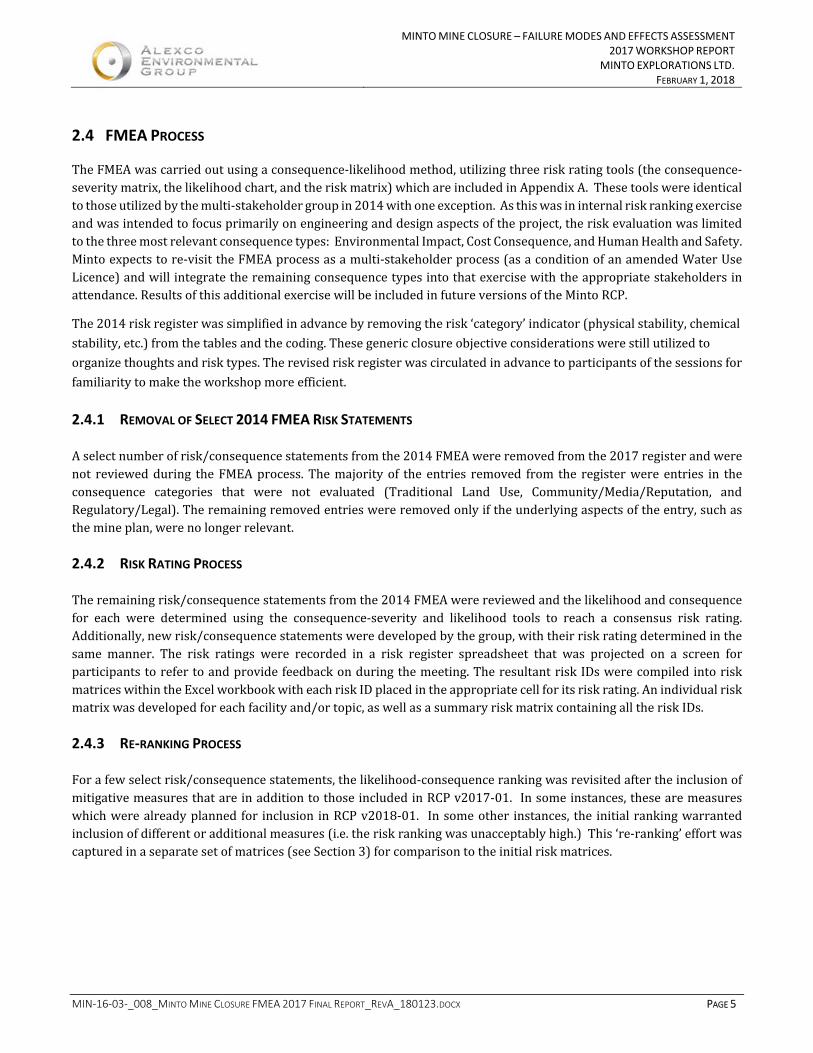
2.4 FMEA PROCESS
TheFMEAwascarriedoutusingaconsequence‐likelihoodmethod,utilizingthreeriskratingtools(theconsequence‐severitymatrix,thelikelihoodchart,andtheriskmatrix)whichareincludedinAppendixA.Thesetoolswereidenticaltothoseutilizedbythemulti‐stakeholdergroupin2014withoneexception.Asthiswasininternalriskrankingexerciseandwasintendedtofocusprimarilyonengineeringanddesignaspectsoftheproject,theriskevaluationwaslimitedtothethreemostrelevantconsequencetypes:EnvironmentalImpact,CostConsequence,andHumanHealthandSafety.Mintoexpectstore‐visittheFMEAprocessasamulti‐stakeholderprocess(asaconditionofanamendedWaterUseLicence)andwillintegratetheremainingconsequencetypesintothatexercisewiththeappropriatestakeholdersinattendance.ResultsofthisadditionalexercisewillbeincludedinfutureversionsoftheMintoRCP.
The2014riskregisterwassimplifiedinadvancebyremovingtherisk‘category’indicator(physicalstability,chemical
stability,etc.)fromthetablesandthecoding.Thesegenericclosureobjectiveconsiderationswerestillutilizedtoorganizethoughtsandrisktypes.Therevisedriskregisterwascirculatedinadvancetoparticipantsofthesessionsforfamiliaritytomaketheworkshopmoreefficient.
2.4.1 REMOVAL OF SELECT 2014 FMEA RISK STATEMENTS
Aselectnumberofrisk/consequencestatementsfromthe2014FMEAwereremovedfromthe2017registerandwerenot reviewedduring theFMEAprocess.Themajorityof the entries removed from the registerwere entries in theconsequence categories that were not evaluated (Traditional Land Use, Community/Media/Reputation, andRegulatory/Legal).Theremainingremovedentrieswereremovedonlyiftheunderlyingaspectsoftheentry,suchasthemineplan,werenolongerrelevant.
2.4.2 RISK RATING PROCESS
Theremainingrisk/consequencestatementsfromthe2014FMEAwerereviewedandthelikelihoodandconsequencefor each were determined using the consequence‐severity and likelihood tools to reach a consensus risk rating.Additionally,newrisk/consequencestatementsweredevelopedbythegroup,withtheirriskratingdeterminedinthesame manner. The risk ratings were recorded in a risk register spreadsheet that was projected on a screen forparticipantstorefertoandprovidefeedbackonduringthemeeting.TheresultantriskIDswerecompiledintoriskmatriceswithintheExcelworkbookwitheachriskIDplacedintheappropriatecellforitsriskrating.Anindividualriskmatrixwasdevelopedforeachfacilityand/ortopic,aswellasasummaryriskmatrixcontainingalltheriskIDs.
2.4.3 RE‐RANKING PROCESS
Forafewselectrisk/consequencestatements,thelikelihood‐consequencerankingwasrevisitedaftertheinclusionofmitigativemeasuresthatareinadditiontothoseincludedinRCPv2017‐01. Insomeinstances,thesearemeasureswhichwerealreadyplannedfor inclusion inRCPv2018‐01. Insomeother instances, the initialrankingwarrantedinclusionofdifferentoradditionalmeasures(i.e.theriskrankingwasunacceptablyhigh.)This‘re‐ranking’effortwascapturedinaseparatesetofmatrices(seeSection3)forcomparisontotheinitialriskmatrices.
MINTO MINE CLOSURE – FAILURE MODES AND EFFECTS ASSESSMENT
2017 WORKSHOP REPORTMINTO EXPLORATIONS LTD.
FEBRUARY 1, 2018
MIN‐16‐03‐_008_MINTO MINE CLOSURE FMEA 2017 FINAL REPORT_REVA_180123.DOCX PAGE 6
3. FMEA RESULTS
Theresultsofthe2017FMEAupdatearedescribedandreferencedinthefollowingsections,includingtheRiskRegister,summaryanddetailedRiskMatrices,riskswhichwerenotre‐evaluatedin2017(andrationale)andhow2014‘ParkingLot’itemswereaddressed.
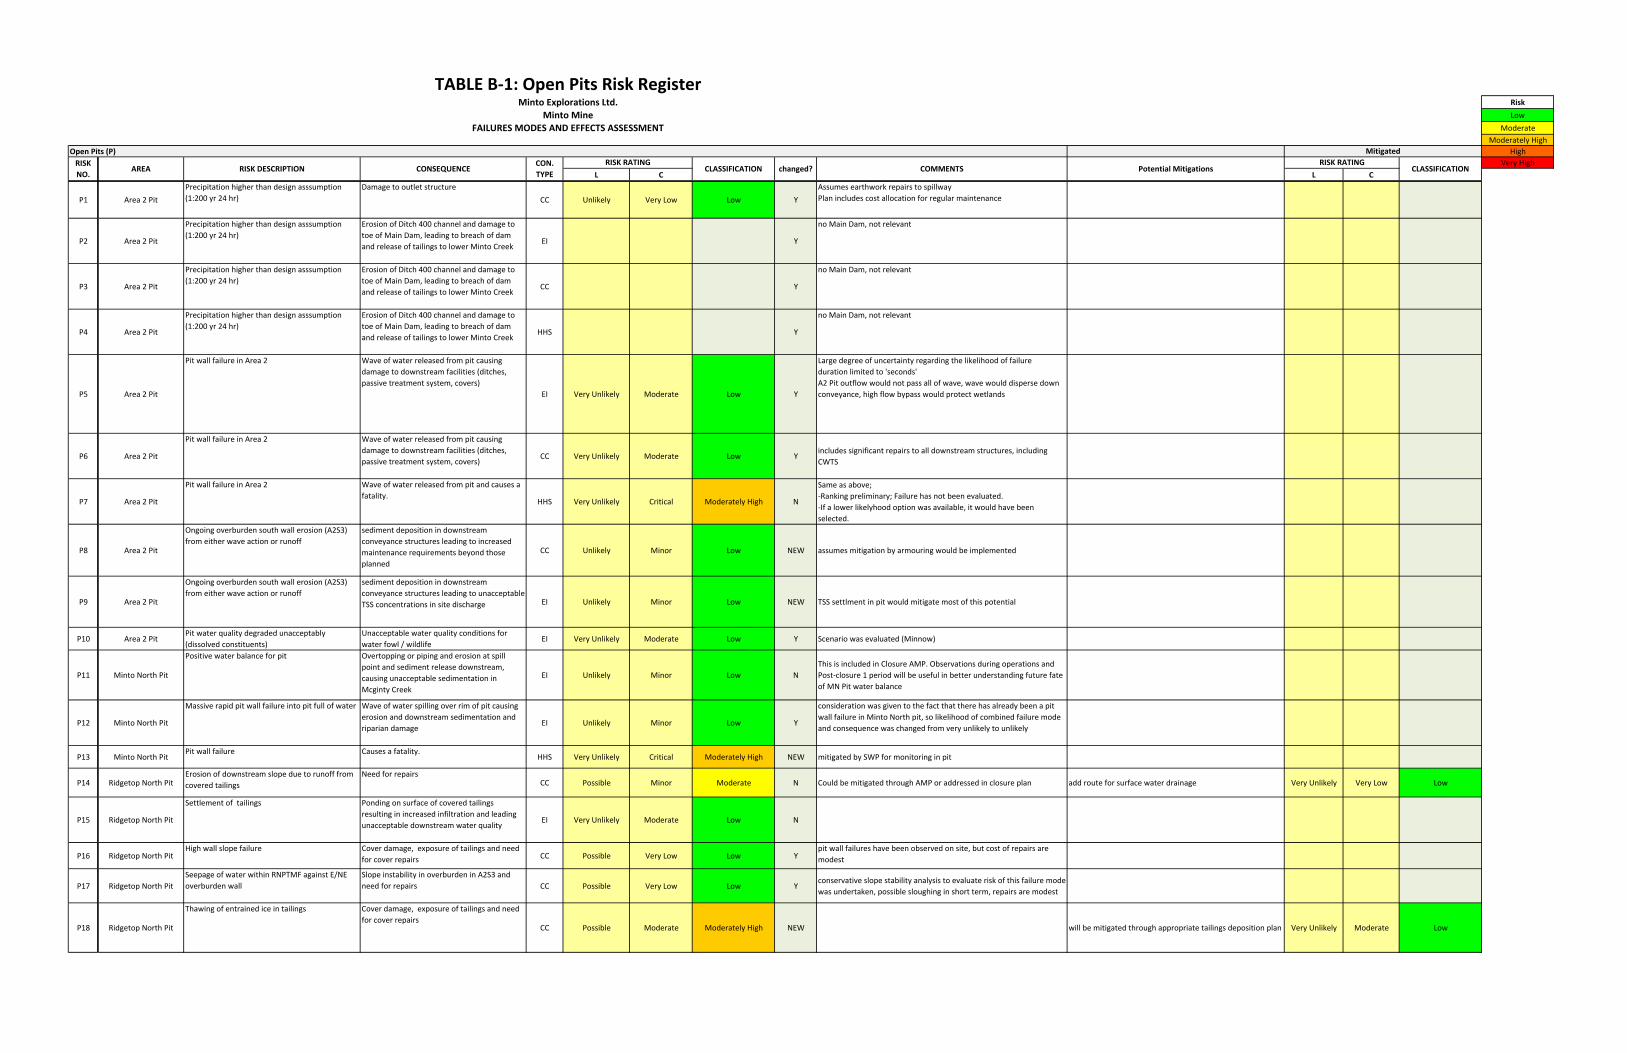
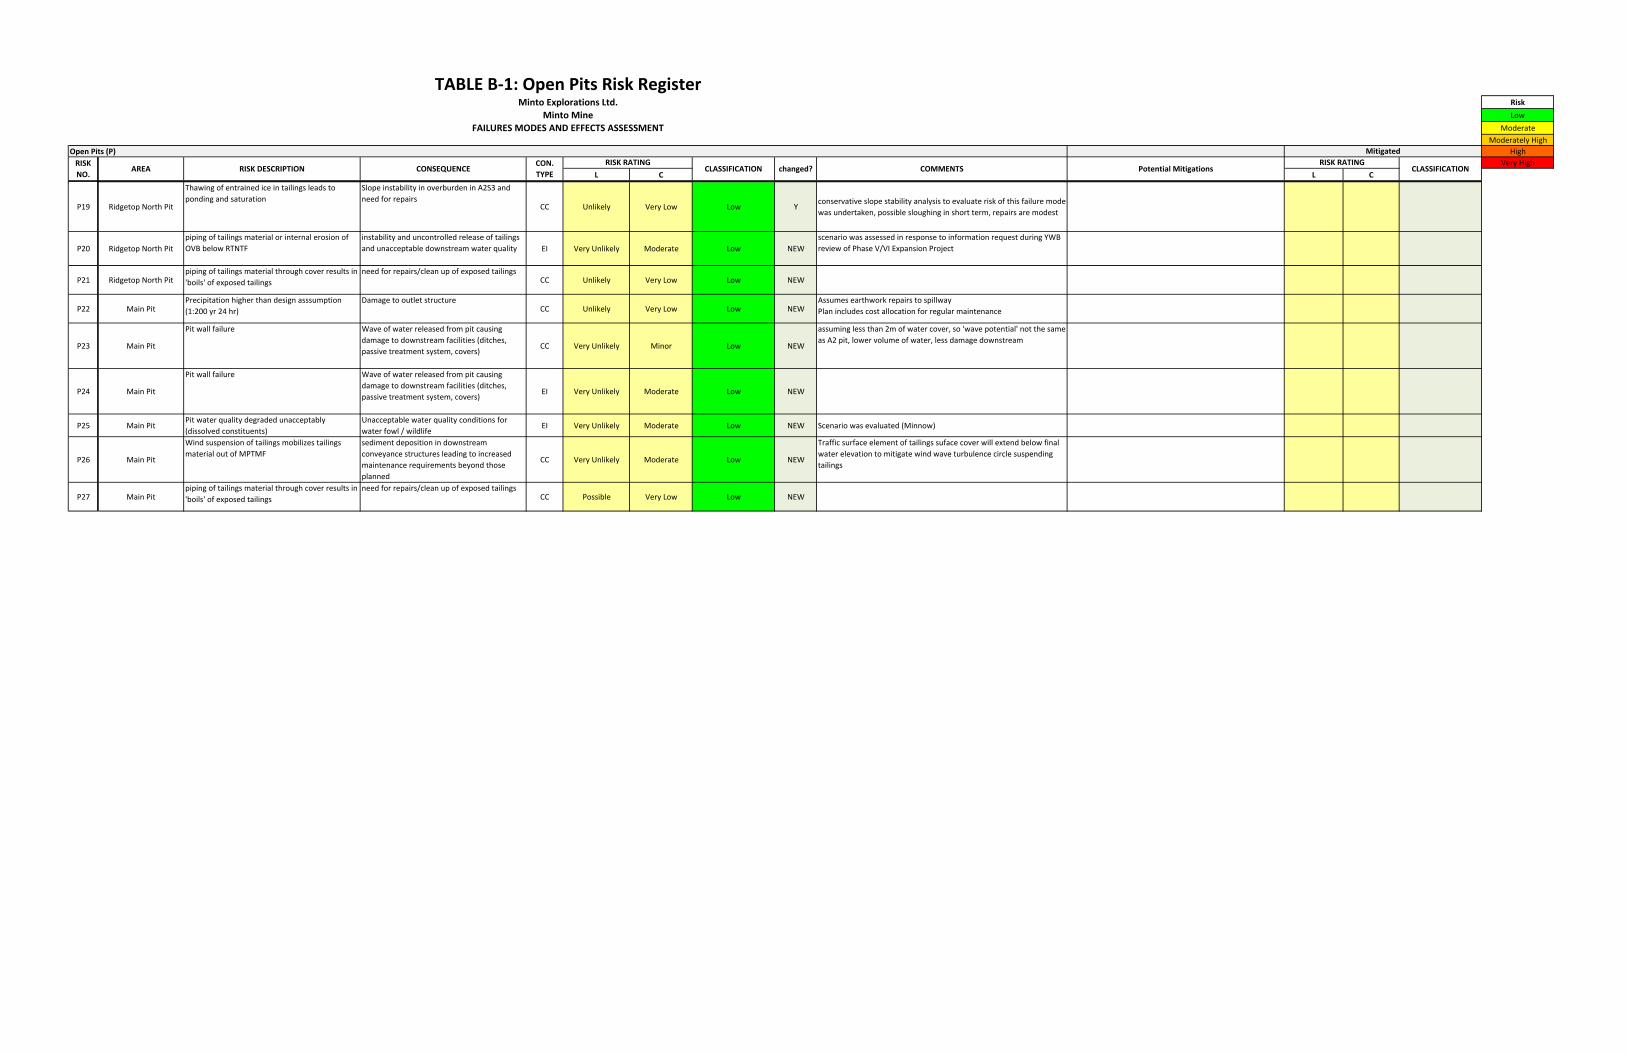
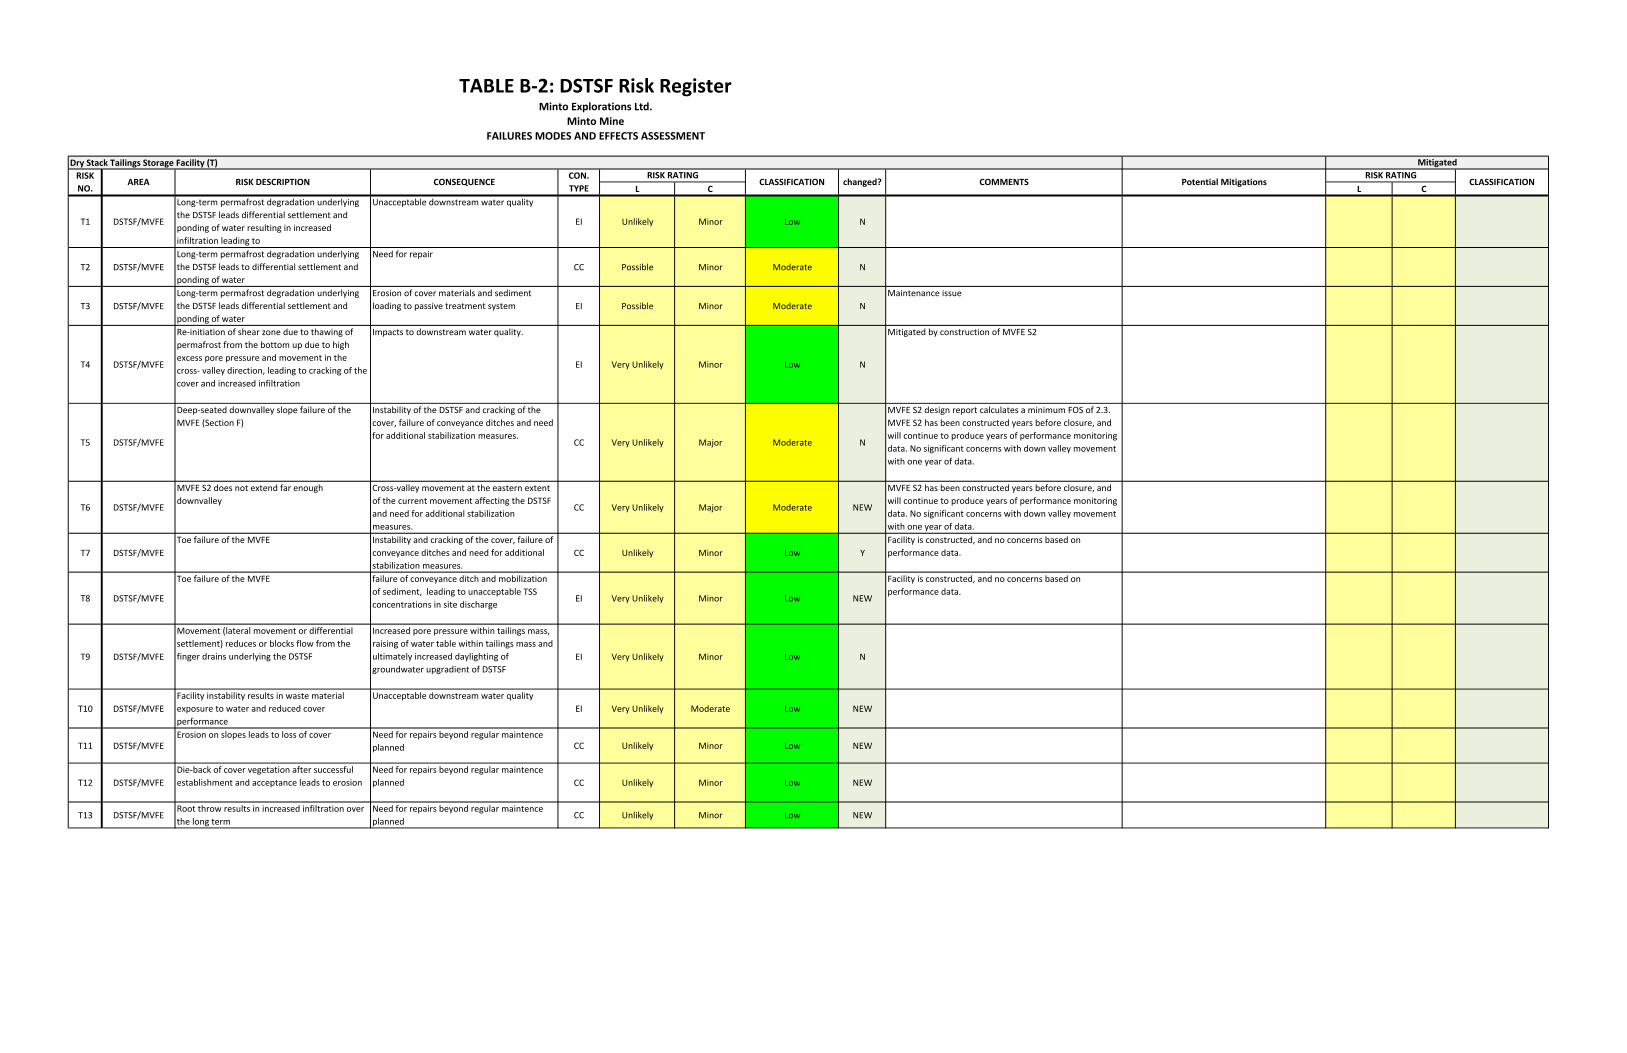
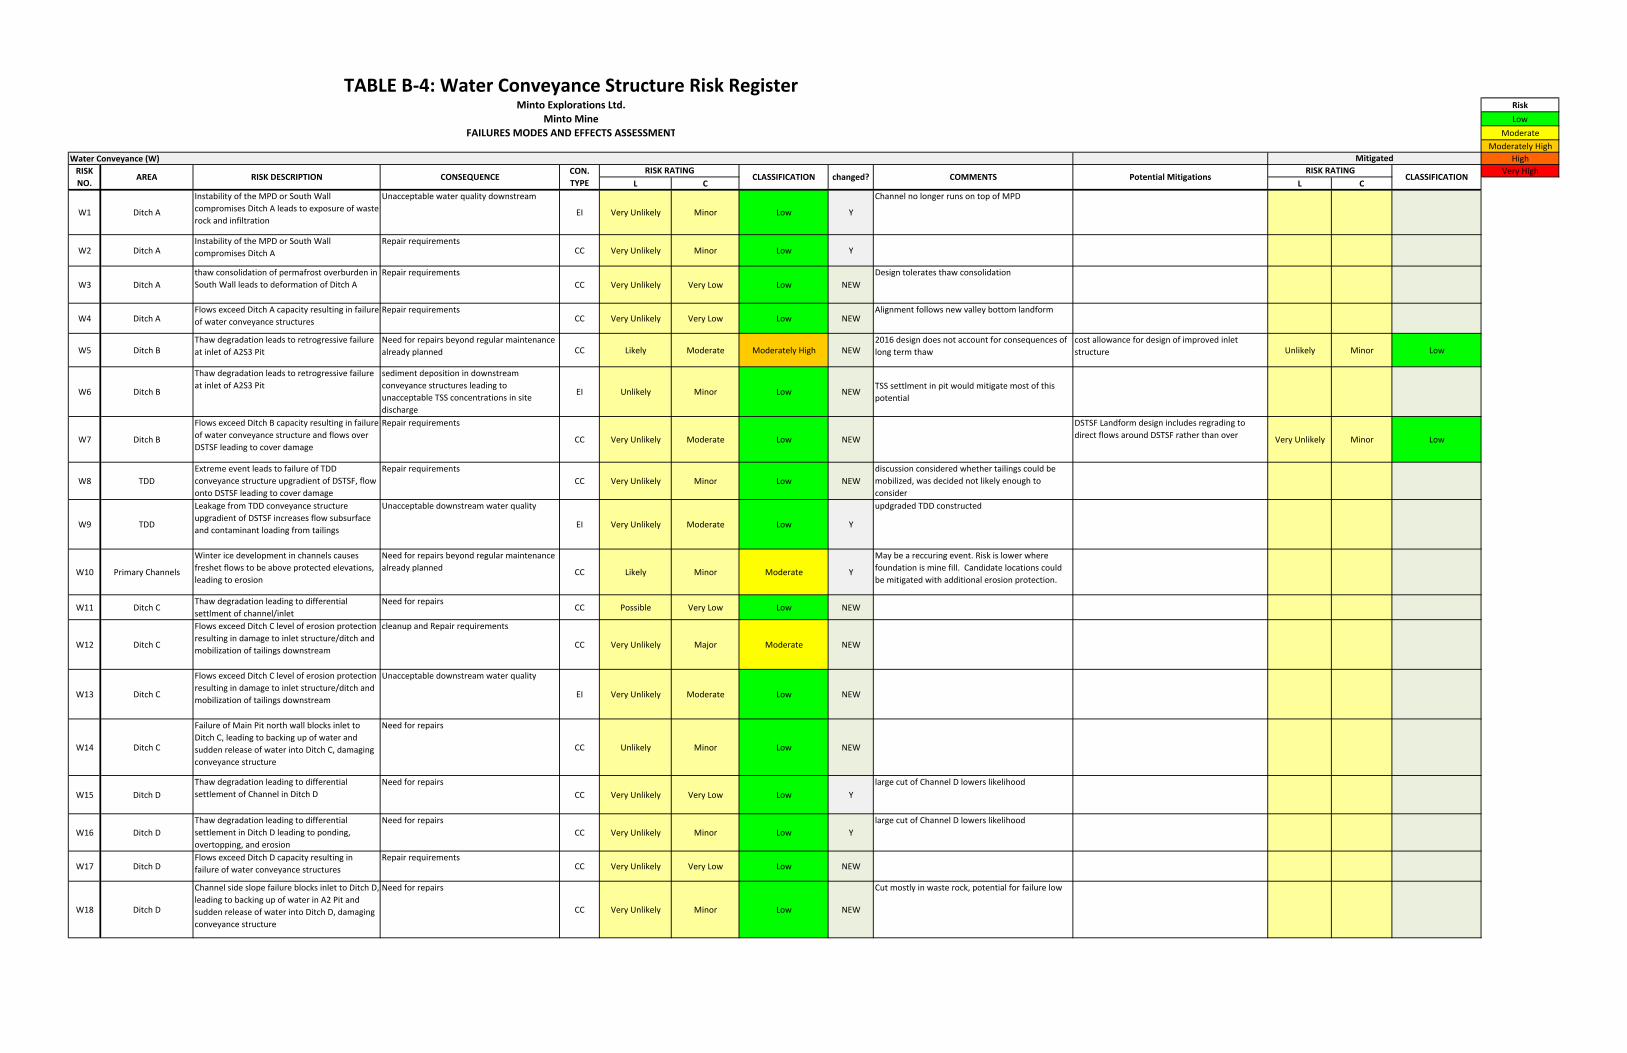
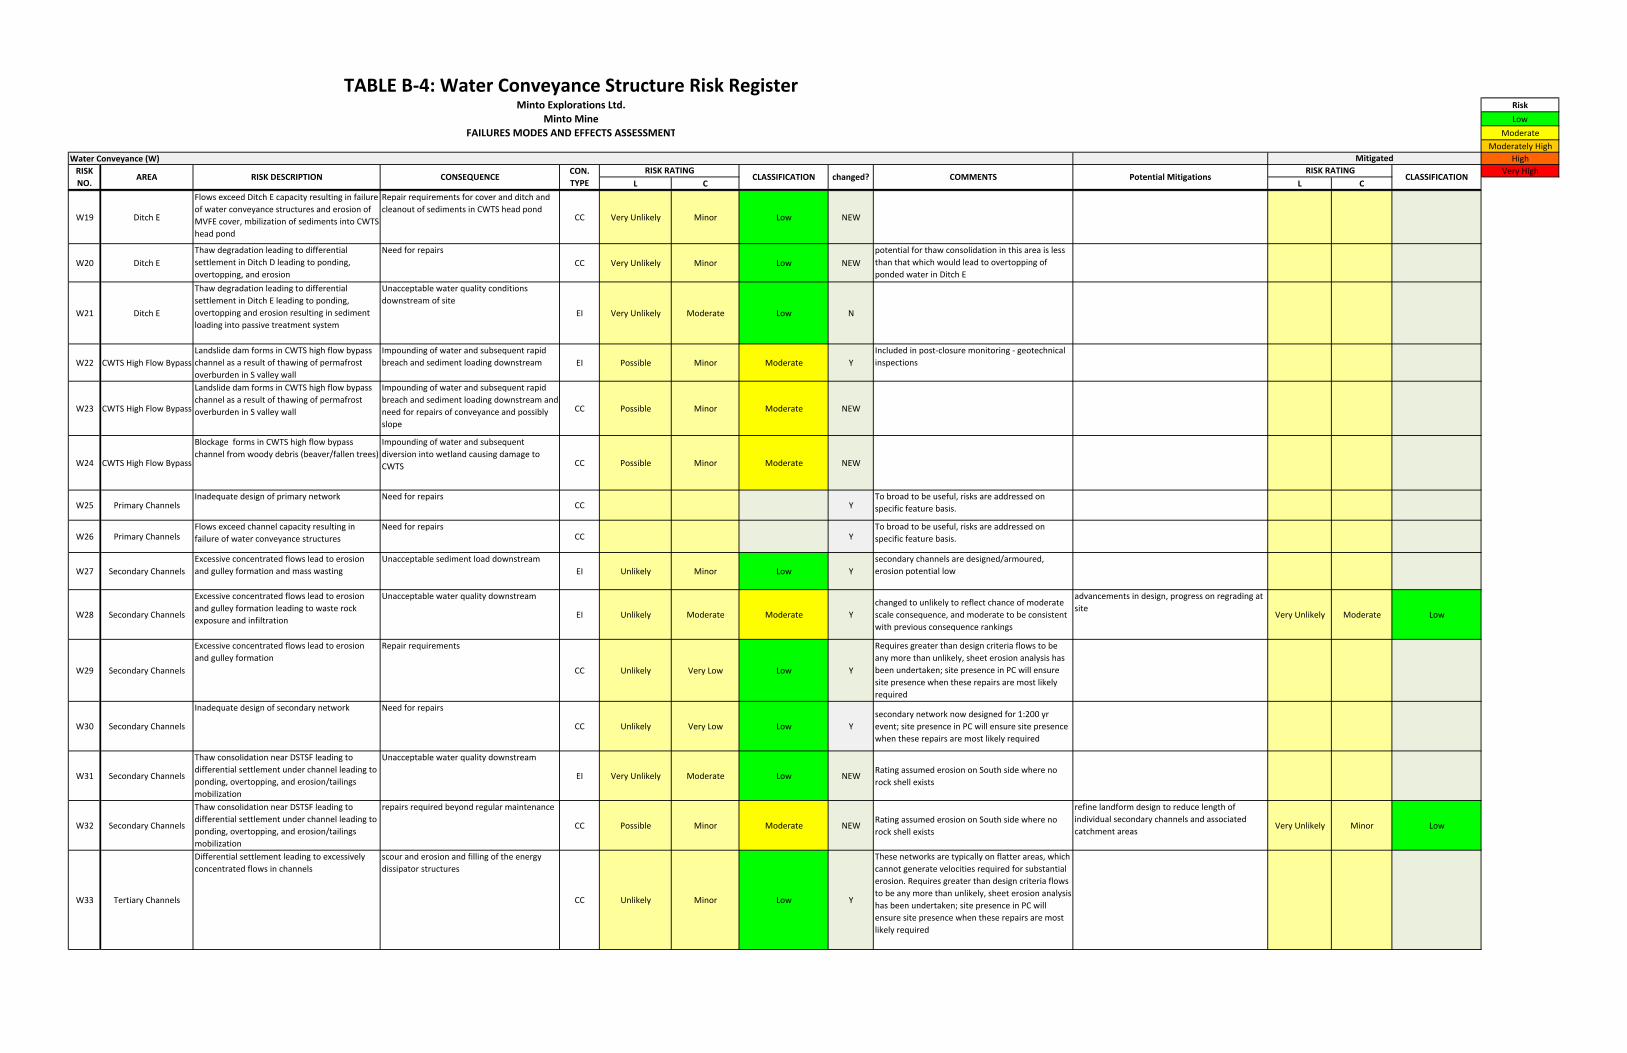
3.1 RISK REGISTERS (APPENDIX B)
TheseregistertablesB‐1throughB‐6inAppendixBcapturefollowingforeachtopicevaluated:
theriskandconsequencestatementswithanIDnumberandconsequencecategory;
thelikelihoodandconsequencerankingassignedbytheteam;
theresultantriskclassificationforthelikelihoodandconsequenceranking;
anindicationiftherisk/consequencestatementwaschangedfromthe2014entry,orifitisanewentry;
commentsthatidentifyassumptionsorclarificationsregardingtherankingselected;and
ifrequired–newpotentialmitigationsand‘re‐ranking’ofthemitigatedrisk.
TheIDnumberofeachrisk/consequencestatementislocatedontheoverallriskmatrix,asoutlinedbelowinsection3.2.TheregistersarethemostdetailedproductoftheFMEAexercise.
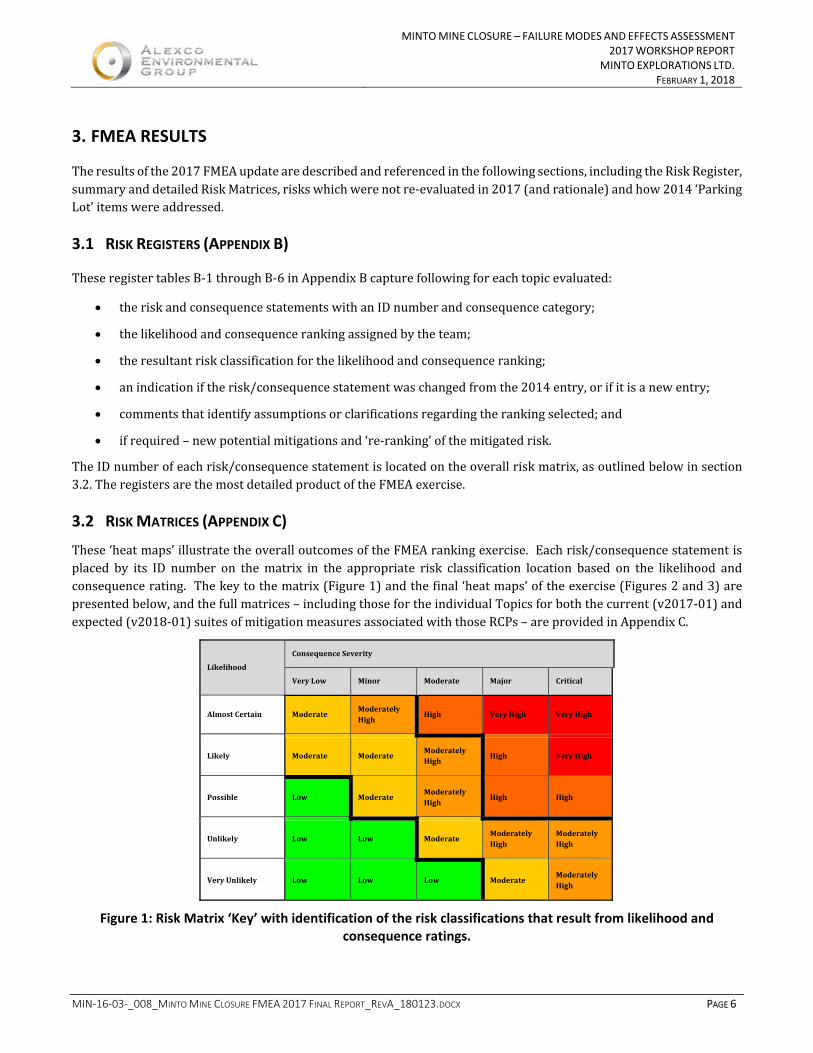
3.2 RISK MATRICES (APPENDIX C)
These‘heatmaps’illustratetheoveralloutcomesoftheFMEArankingexercise.Eachrisk/consequencestatementisplaced by its ID number on thematrix in the appropriate risk classification location based on the likelihood andconsequencerating.Thekeytothematrix(Figure1)andthefinal‘heatmaps’oftheexercise(Figures2and3)arepresentedbelow,andthefullmatrices–includingthosefortheindividualTopicsforboththecurrent(v2017‐01)andexpected(v2018‐01)suitesofmitigationmeasuresassociatedwiththoseRCPs–areprovidedinAppendixC.
Likelihood
ConsequenceSeverity
VeryLow Minor Moderate Major Critical
AlmostCertain ModerateModeratelyHigh
High VeryHigh VeryHigh
Likely Moderate ModerateModeratelyHigh
High VeryHigh
Possible Low ModerateModeratelyHigh
High High
Unlikely Low Low ModerateModeratelyHigh
ModeratelyHigh
VeryUnlikely Low Low Low ModerateModeratelyHigh
Figure 1: Risk Matrix ‘Key’ with identification of the risk classifications that result from likelihood and consequence ratings.
MINTO MINE CLOSURE – FAILURE MODES AND EFFECTS ASSESSMENT
2017 WORKSHOP REPORTMINTO EXPLORATIONS LTD.
FEBRUARY 1, 2018
MIN‐16‐03‐_008_MINTO MINE CLOSURE FMEA 2017 FINAL REPORT_REVA_180123.DOCX PAGE 7
Likelih
ood
Alm
ost Certain
5 D4 D27 Likely
4 WT18, WT32, W10 WT38, WT42, W5
Possible
3 P16, P17, P27, WT23,
W11
P14, T2, T3, D5, D12, D14, D18, D19, D29,
D30, D30, WT11, WT29, WT43, W22, W23, W24,
W32
P18, WT21, A4 A5, A6
Unlikely
2 P1, P19, P21, P22, D10,
D24, W29, W30
P8, P9, P11, P12, T1, T7, T11, T12, T13, D6, D11, D13, D20, D31, D31,
WT2, WT5, WT8, WT14, WT28, WT30, WT31, WT35, WT36, WT40, W6, W14, W27, W33,
W36, W37, A3
WT1, WT4, WT6, WT7, WT9, WT10, WT13, WT15, WT19, WT22,
WT34, W28
A1 WT3, WT12
Very
Unlikely
1 W3, W4, W15, W17
P23, T4, T8, T9, D23, D26, WT17, WT25, WT26, WT27, WT37, WT41, W1, W2, W8, W16, W18, W19, W20
P5, P6, P10, P15, P20, P24, P25, P26, T10, D1, D2, D3, D7, D8, D9, D15, D16, D17, D21, D22, D25, WT16, WT20, WT24, WT33, WT39, WT44, W7, W9, W13,
W21, W31
T5, T6, D28, W12, A8 P7, P13, A7
1 2 3 4 5
Very Low Minor Moderate Major Critical
Consequence
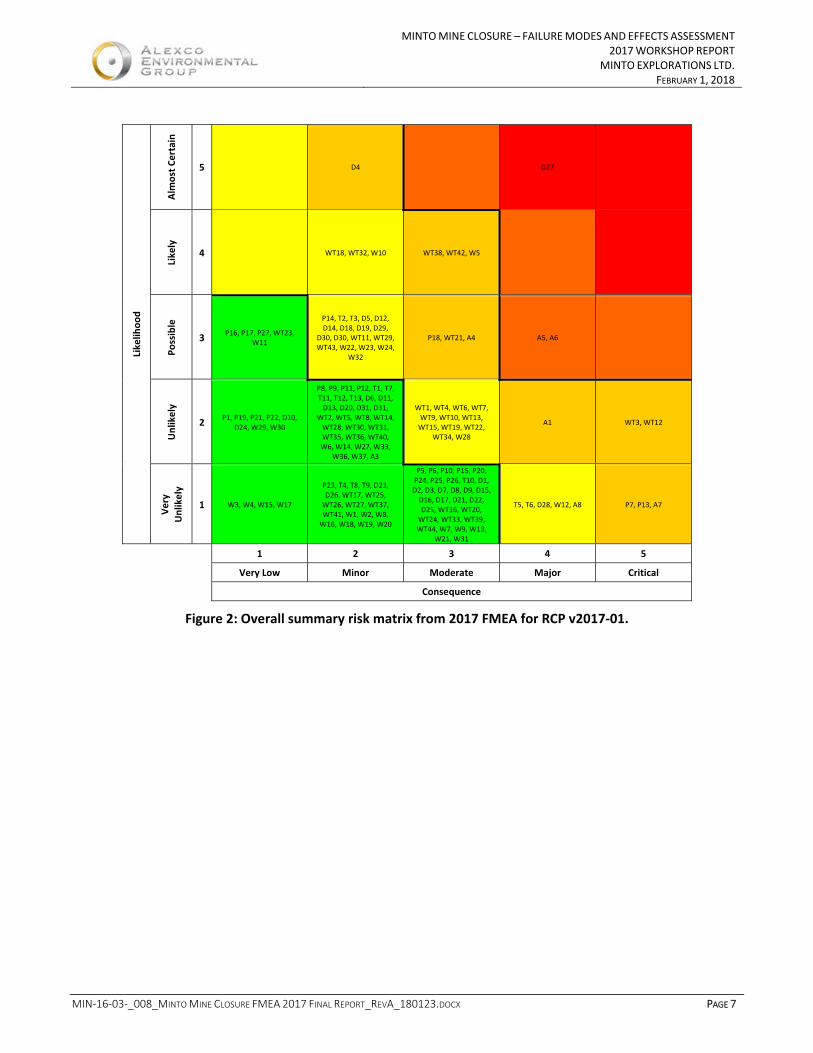
Figure 2: Overall summary risk matrix from 2017 FMEA for RCP v2017‐01.
MINTO MINE CLOSURE – FAILURE MODES AND EFFECTS ASSESSMENT
2017 WORKSHOP REPORTMINTO EXPLORATIONS LTD.
FEBRUARY 1, 2018
MIN‐16‐03‐_008_MINTO MINE CLOSURE FMEA 2017 FINAL REPORT_REVA_180123.DOCX PAGE 8
Likelih
ood
Alm
ost Certain
5
Likely
4 WT18, WT32, W10 WT38, WT42
Possible
3 P16, P17, P27, WT23,
W11
T2, T3, D5, D12, D14, D18, D19, D29, D30, D30, WT11, WT29, W22, W23,
W24
WT21, A4 A5, A6
Unlikely
2 P1, P19, P21, P22, D10,
D24, W29, W30
P8, P9, P11, P12, T1, T7, T11, T12, T13, D4, D6,
D11, D13, D20, D31, D31, WT2, WT5, WT8, WT14, WT28, WT30, WT31,
WT35, WT36, WT40, W5, W6, W14, W27, W33,
W36, W37, A3
WT1, WT4, WT6, WT7, WT9, WT10, WT13, WT15, WT19, WT22,
WT34
A1 WT3, WT12
Very
Unlikely
1 P14, D27, W3, W4, W15,
W17
P23, T4, T8, T9, D23, D26, WT17, WT25, WT26, WT27, WT37, WT41, WT43, W1, W2, W7, W8, W16, W18, W19, W20, W32
P5, P6, P10, P15, P18, P20, P24, P25, P26, T10, D1, D2, D3, D7, D8, D9, D15, D16, D17, D21, D22,
D25, WT16, WT20, WT24, WT33, WT39, WT44, W9, W13, W21,
W28, W31
T5, T6, D28, W12, A8 P7, P13, A7
1 2 3 4 5
Very Low Minor Moderate Major Critical
Consequence
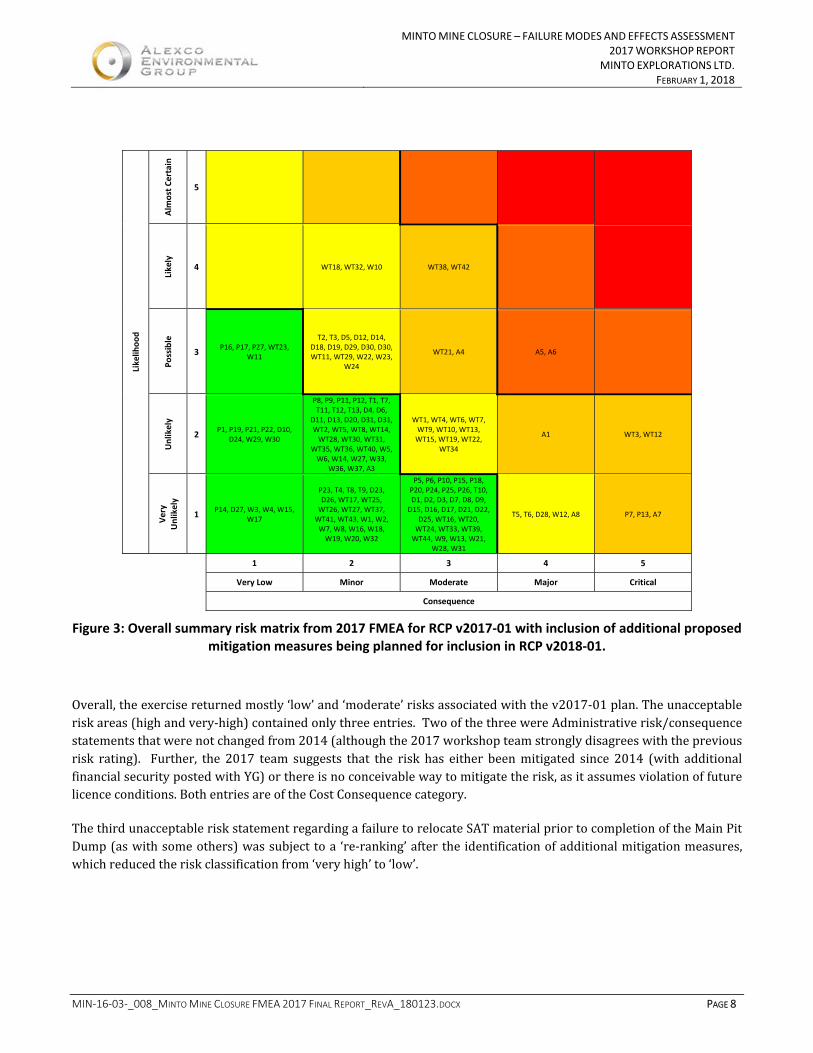
Figure 3: Overall summary risk matrix from 2017 FMEA for RCP v2017‐01 with inclusion of additional proposed mitigation measures being planned for inclusion in RCP v2018‐01.
Overall,theexercisereturnedmostly‘low’and‘moderate’risksassociatedwiththev2017‐01plan.Theunacceptableriskareas(highandvery‐high)containedonlythreeentries.TwoofthethreewereAdministrativerisk/consequencestatementsthatwerenotchangedfrom2014(althoughthe2017workshopteamstronglydisagreeswiththepreviousrisk rating). Further, the 2017 team suggests that the risk has either beenmitigated since 2014 (with additionalfinancialsecuritypostedwithYG)orthereisnoconceivablewaytomitigatetherisk,asitassumesviolationoffuturelicenceconditions.BothentriesareoftheCostConsequencecategory.
ThethirdunacceptableriskstatementregardingafailuretorelocateSATmaterialpriortocompletionoftheMainPitDump(aswithsomeothers)wassubjecttoa ‘re‐ranking’aftertheidentificationofadditionalmitigationmeasures,whichreducedtheriskclassificationfrom‘veryhigh’to‘low’.

MINTO MINE CLOSURE – FAILURE MODES AND EFFECTS ASSESSMENT
2017 WORKSHOP REPORTMINTO EXPLORATIONS LTD.
FEBRUARY 1, 2018
MIN‐16‐03‐_008_MINTO MINE CLOSURE FMEA 2017 FINAL REPORT_REVA_180123.DOCX PAGE 9
3.3 RISKS NOT RE‐EVALUATED (APPENDIX D)
TableD‐1(inAppendixD)includes2014registerentriesthatwerenotre‐evaluated.2014commentsregardingtheriskstatementswereretained,andrationalefortheentrynotbeingre‐evaluatedin2017isincluded.Themostcommonreasonsfornotre‐evaluatingentrieswere:
Theconsequencecategorywasnotutilizedinthe2017workshop;
Theentrywasexpandedintoanumberofmoredetailedriskstatements;
Theentrywasacarryoverfrom2013and/orisaddressedelsewhereandisredundant;and
TheentrypertainedtoanelementofthemineplanorRCPthatisnolongerrelevant(e.g.MainDam).
The2017FMEAteamacknowledgesthatsomeoftheserisksarestillworthyofre‐evaluation,yetisconfidentthatthe2017RCPaddressesmostoftheremaininghigherclassifiedriskstatements,particularlyfromcategoriesthatwerenotevaluatedinthe2017workshop.Forexample,thehighestclassifiedrisksinthistablerelatetoconsequencesfromageneralfailuretoconductpreventativemaintenanceandcorrectiveactionsleadingtosystemfailures.Thelikelihoodofthesefailureswasratedas‘LIKELY’in2014onthebasisofthedurationofpost‐closuremonitoringandmaintenancein RCP 2014‐01. RCP v2017‐01 includes a plan and a closure (security) cost allowance for amuch longer PCMMduration.
3.4 PARKING LOT ITEMS
The 2014 issues raised thatwere recorded in the Parking Lotwere itemized previously in Section 1.2. They arereproducedagainbelowwithanindicationofhoweachitemwasaddressedinRCPv2017‐01and/orthe2017FMEA.
Currentclosureplanisdeficientwithrespecttoshowingfinalreclaimedfacilities,toesofre‐gradedslopesandlocationofsecondaryandtertiarywaterconveyance;
Thedesigns for finalreclaimed facilitieshavebeenadvancedsubstantially inRCPv2017‐01,and the finalre‐gradingplansforthewastefacilitieswerealsoavailableforthe2017FMEAandwillbeincludedinRCPv2018‐01.
MoreinformationrequestedregardingthestatusoftheReclamationResearchPlanandtheMainWasteDumprevegetationtrials;
RCP v2017‐01 included additional information regarding the RRP, particularly related to the ConstructedWetlandTreatmentSystemresearch.RCPv2018‐01furtherupdatesworkonthisresearchcomponent(Section2.2) and the accompanying cover design report (Updated Closure Cover Design for the Minto Mine 2018Reclamation and Closure Plan (SRK Consulting, January 2018)) incorporates recommendations based onobservationsoftheMainWasteDumprevegetationtrialsduringinspectionscarriedoutduringJuly2017.
TrafficabilitylayerisrequiredovertheRidgetopNorthPittailingsbackfillwhereascostingonlyallowsfor0.5mofoverburden;
TheRidgetopPitswerenotapartofthemineplanthatunderpinnedRCPv2017‐01.NowthattheRidgetoppitshavebeenre‐integratedintothemineplan,atrafficabilitylayerovertheRidgetopNorthPittailingsbackfillhasbeenaddedtothemitigativemeasuresforthatfacilityinRCPv2018‐01.
Needtoadvancethediscussion/determinationofwhatconstitutes“reasonableandpracticable”passivetreatment,establishprotocolsandrevisittheoptionsevaluation;
RCPv2017‐01presentedthedocumentationofthesystematicprocessthatwasundertakentoidentifyandselectappropriatepassivetreatmenttechnologiesfortheMintoSite.TheRCPalsopresentedadetaileddesignfortheinstallationofa constructedwetland treatment systemaspartof the closure configuration,withassociated
MINTO MINE CLOSURE – FAILURE MODES AND EFFECTS ASSESSMENT
2017 WORKSHOP REPORTMINTO EXPLORATIONS LTD.
FEBRUARY 1, 2018
MIN‐16‐03‐_008_MINTO MINE CLOSURE FMEA 2017 FINAL REPORT_REVA_180123.DOCX PAGE 10
monitoring,maintenanceandadaptivemanagementplanstoensureitsefficacyinthepost‐closureperiod.ThesystemwasevaluatedindepthintheWaterTreatmenttopicinthe2017FMEAworkshop,whichincludedaselectgroupoftechnicalexpertswhowereresponsibleforthetreatmentsystemdesign.
SFNreiteratedtheirconcernthattheconsequencecategoryof“Community/Media/Reputation”isbiasedbecauseSFNarelumpedtogetherwithgroupshavingotherinterestsandperspective;and
Thisconsequencecategorywasnotincludedinthe2017workshopexercise.
Thecurrentclosureplandoesnotsufficientlyaddresssignageandaccesscontrol.Thereisaneedtoretaininstitutionalcontrolsandmaintainsignageinperpetuity.
ThisissuehasnotbeenaddressedinanyRCPupdates.ItcontinuestobeafuturelandusemanagementdecisionrequiringresolutionwithSFN.
MINTO MINE CLOSURE – FAILURE MODES AND EFFECTS ASSESSMENT
2017 WORKSHOP REPORTMINTO EXPLORATIONS LTD.
FEBRUARY 1, 2018
MIN‐16‐03‐_008_MINTO MINE CLOSURE FMEA 2017 FINAL REPORT_REVA_180123.DOCX PAGE 11
4. SUMMARY
Theriskregistersupdatedduringthe2017FMEAworkshopsareprovidedinAppendixBandtheriskmatrices,boththeinitial(RCPv2017‐01)andre‐ranked(includingproposedmitigationsinRCPv‐2018‐01),areprovidedinAppendixC.
Although some risk consequence categories utilized in previousFMEA sessionswerenot included in this exercise,previous risk entrieswere evaluated in amoredetailed fashion, leading tomore registry entries than in the2014exercise.AmoredetailedanddevelopedRCP, includingadetailedplan forconstructionandoperationofapassivetreatmentinstallation,allowedafulsomeevaluationofdetailedriskstatements,includingrisksandconsequencesoffailureofthepassivewatertreatmentsystem.The2017FMEAaddresseditemsfromthe2014FMEA‘ParkingLot’.
Overall,theexercisereturnedmostly‘low’and‘moderate’risksassociatedwiththev2017‐01plan.Theunacceptableriskareas(highandvery‐high)containedonlythreeentries.TwoofthethreewereAdministrativerisk/consequencestatementsthatwerenotchangedfrom2014(althoughthe2017workshopteamstronglydisagreeswiththepreviousrisk rating). Further, the 2017 team suggests that the risk has either beenmitigated since 2014 (with additionalfinancialsecuritypostedwithYG)orthereisnoconceivablewaytomitigatetherisk,asitassumesviolationoffuturelicenceconditions.BothentriesareoftheCostConsequencecategory.
ThethirdunacceptableriskstatementregardingafailuretorelocateSATmaterialpriortocompletionoftheMainPitDump(aswithsomeothers)wassubjecttoa ‘re‐ranking’aftertheidentificationofadditionalmitigationmeasures,whichreducedtheriskclassificationfrom‘veryhigh’to‘low’.

MIN‐16‐03‐_008_MINTO MINE CLOSURE FMEA 2017 FINAL REPORT_REVA_180123.DOCX
Risk Rating Tools
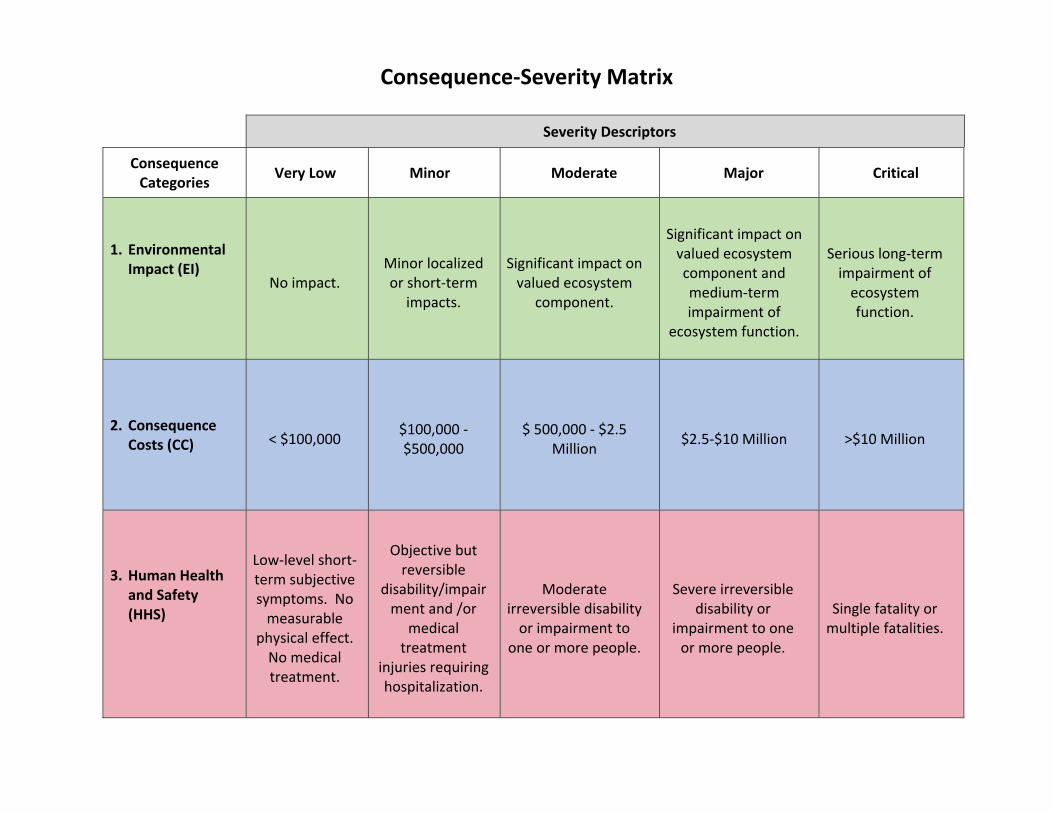
Consequence‐Severity Matrix
Severity Descriptors
Consequence Categories
Very Low Minor Moderate Major Critical
1. Environmental Impact (EI)
No impact. Minor localized or short‐term
impacts.
Significant impact on valued ecosystem
component.
Significant impact on valued ecosystem component and medium‐term impairment of
ecosystem function.
Serious long‐term impairment of ecosystem function.
2. Consequence Costs (CC) < $100,000
$100,000 ‐ $500,000
$ 500,000 ‐ $2.5 Million
$2.5‐$10 Million >$10 Million
3. Human Health and Safety (HHS)
Low‐level short‐term subjective symptoms. No measurable
physical effect. No medical treatment.
Objective but reversible
disability/impairment and /or
medical treatment
injuries requiring hospitalization.
Moderate irreversible disability or impairment to
one or more people.
Severe irreversible disability or
impairment to one or more people.
Single fatality or multiple fatalities.
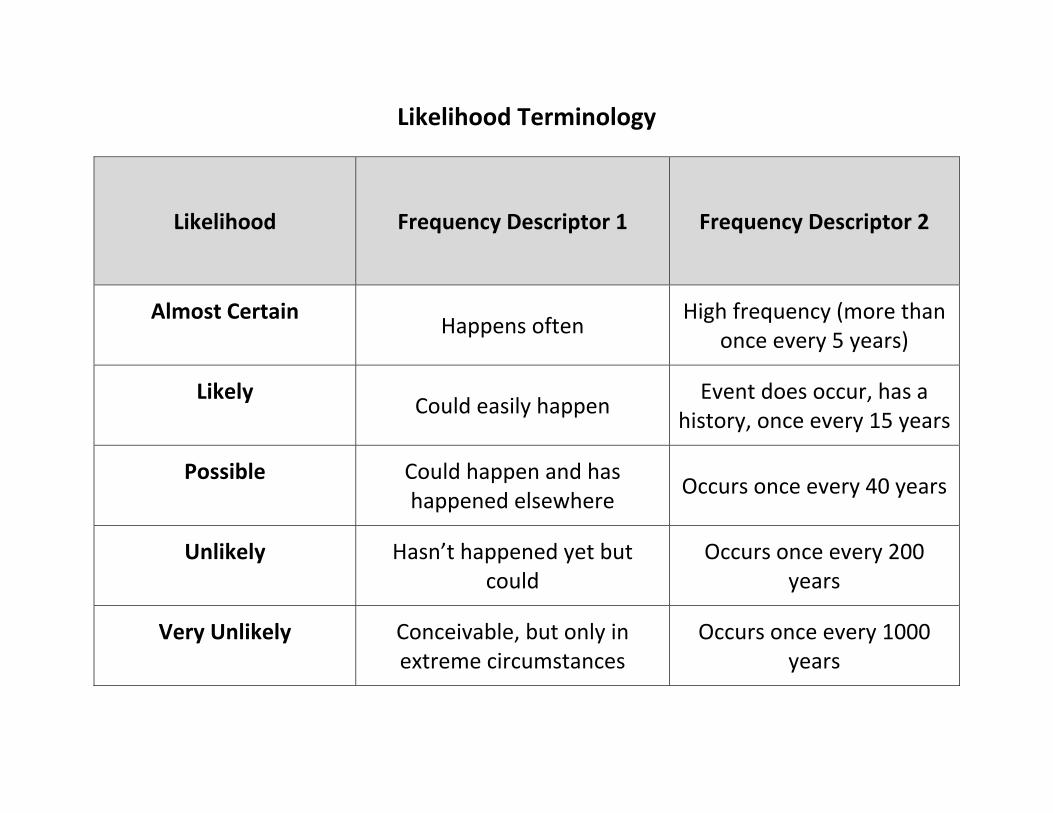
Likelihood Terminology
Likelihood Frequency Descriptor 1 Frequency Descriptor 2
Almost Certain
Happens often High frequency (more than
once every 5 years)
Likely
Could easily happen Event does occur, has a
history, once every 15 years
Possible
Could happen and has happened elsewhere
Occurs once every 40 years
Unlikely
Hasn’t happened yet but could
Occurs once every 200 years
Very Unlikely
Conceivable, but only in extreme circumstances
Occurs once every 1000 years
MIN‐16‐03‐_008_MINTO MINE CLOSURE FMEA 2017 FINAL REPORT_REVA_180123.DOCX
2017 FMEA Risk Registers
Risk
Low
Moderate
Moderately High
Open Pits (P) High
Very High
L C L C
P1 Area 2 Pit
Precipitation higher than design asssumption
(1:200 yr 24 hr)
Damage to outlet structure
CC Unlikely Very Low Low Y
Assumes earthwork repairs to spillway
Plan includes cost allocation for regular maintenance
P2 Area 2 Pit
Precipitation higher than design asssumption
(1:200 yr 24 hr)
Erosion of Ditch 400 channel and damage to
toe of Main Dam, leading to breach of dam
and release of tailings to lower Minto CreekEI Y
no Main Dam, not relevant
P3 Area 2 Pit
Precipitation higher than design asssumption
(1:200 yr 24 hr)
Erosion of Ditch 400 channel and damage to
toe of Main Dam, leading to breach of dam
and release of tailings to lower Minto CreekCC Y
no Main Dam, not relevant
P4 Area 2 Pit
Precipitation higher than design asssumption
(1:200 yr 24 hr)
Erosion of Ditch 400 channel and damage to
toe of Main Dam, leading to breach of dam
and release of tailings to lower Minto CreekHHS Y
no Main Dam, not relevant
P5 Area 2 Pit
Pit wall failure in Area 2 Wave of water released from pit causing
damage to downstream facilities (ditches,
passive treatment system, covers)
EI Very Unlikely Moderate Low Y
Large degree of uncertainty regarding the likelihood of failure
duration limited to 'seconds'
A2 Pit outflow would not pass all of wave, wave would disperse down
conveyance, high flow bypass would protect wetlands
P6 Area 2 Pit
Pit wall failure in Area 2 Wave of water released from pit causing
damage to downstream facilities (ditches,
passive treatment system, covers)CC Very Unlikely Moderate Low Y
includes significant repairs to all downstream structures, including
CWTS
P7 Area 2 Pit
Pit wall failure in Area 2 Wave of water released from pit and causes a
fatality.HHS Very Unlikely Critical Moderately High N
Same as above;
‐Ranking preliminary; Failure has not been evaluated.
‐If a lower likelyhood option was available, it would have been
selected.
P8 Area 2 Pit
Ongoing overburden south wall erosion (A2S3)
from either wave action or runoff
sediment deposition in downstream
conveyance structures leading to increased
maintenance requirements beyond those
planned
CC Unlikely Minor Low NEW assumes mitigation by armouring would be implemented
P9 Area 2 Pit
Ongoing overburden south wall erosion (A2S3)
from either wave action or runoff
sediment deposition in downstream
conveyance structures leading to unacceptable
TSS concentrations in site discharge EI Unlikely Minor Low NEW TSS settlment in pit would mitigate most of this potential
P10 Area 2 PitPit water quality degraded unacceptably
(dissolved constituents)
Unacceptable water quality conditions for
water fowl / wildlifeEI Very Unlikely Moderate Low Y Scenario was evaluated (Minnow)
P11 Minto North Pit
Positive water balance for pit Overtopping or piping and erosion at spill
point and sediment release downstream,
causing unacceptable sedimentation in
Mcginty Creek
EI Unlikely Minor Low N
This is included in Closure AMP. Observations during operations and
Post‐closure 1 period will be useful in better understanding future fate
of MN Pit water balance
P12 Minto North Pit
Massive rapid pit wall failure into pit full of water Wave of water spilling over rim of pit causing
erosion and downstream sedimentation and
riparian damageEI Unlikely Minor Low Y
consideration was given to the fact that there has already been a pit
wall failure in Minto North pit, so likelihood of combined failure mode
and consequence was changed from very unlikely to unlikely
P13 Minto North PitPit wall failure Causes a fatality.
HHS Very Unlikely Critical Moderately High NEW mitigated by SWP for monitoring in pit
P14 Ridgetop North PitErosion of downstream slope due to runoff from
covered tailings
Need for repairs CC Possible Minor Moderate N Could be mitigated through AMP or addressed in closure plan add route for surface water drainage Very Unlikely Very Low Low
P15 Ridgetop North Pit
Settlement of tailings Ponding on surface of covered tailings
resulting in increased infiltration and leading
unacceptable downstream water qualityEI Very Unlikely Moderate Low N
P16 Ridgetop North PitHigh wall slope failure Cover damage, exposure of tailings and need
for cover repairs CC Possible Very Low Low Ypit wall failures have been observed on site, but cost of repairs are
modest
P17 Ridgetop North Pit
Seepage of water within RNPTMF against E/NE
overburden wall
Slope instability in overburden in A2S3 and
need for repairs CC Possible Very Low Low Yconservative slope stability analysis to evaluate risk of this failure mode
was undertaken, possible sloughing in short term, repairs are modest
P18 Ridgetop North Pit
Thawing of entrained ice in tailings Cover damage, exposure of tailings and need
for cover repairsCC Possible Moderate Moderately High NEW will be mitigated through appropriate tailings deposition plan Very Unlikely Moderate Low
CLASSIFICATION
Mitigated
Potential MitigationsRISK RATING
changed?
TABLE B‐1: Open Pits Risk RegisterMinto Explorations Ltd.
Minto Mine
FAILURES MODES AND EFFECTS ASSESSMENT
RISK
NO.AREA RISK DESCRIPTION CONSEQUENCE
CON.
TYPECOMMENTS
RISK RATINGCLASSIFICATION
Risk
Low
Moderate
Moderately High
Open Pits (P) High
Very High
L C L CCLASSIFICATION
Mitigated
Potential MitigationsRISK RATING
changed?
TABLE B‐1: Open Pits Risk RegisterMinto Explorations Ltd.
Minto Mine
FAILURES MODES AND EFFECTS ASSESSMENT
RISK
NO.AREA RISK DESCRIPTION CONSEQUENCE
CON.
TYPECOMMENTS
RISK RATINGCLASSIFICATION
P19 Ridgetop North Pit
Thawing of entrained ice in tailings leads to
ponding and saturation
Slope instability in overburden in A2S3 and
need for repairsCC Unlikely Very Low Low Y
conservative slope stability analysis to evaluate risk of this failure mode
was undertaken, possible sloughing in short term, repairs are modest
P20 Ridgetop North Pit
piping of tailings material or internal erosion of
OVB below RTNTF
instability and uncontrolled release of tailings
and unacceptable downstream water quality EI Very Unlikely Moderate Low NEW
scenario was assessed in response to information request during YWB
review of Phase V/VI Expansion Project
P21 Ridgetop North Pitpiping of tailings material through cover results in
'boils' of exposed tailings
need for repairs/clean up of exposed tailingsCC Unlikely Very Low Low NEW
P22 Main PitPrecipitation higher than design asssumption
(1:200 yr 24 hr)
Damage to outlet structureCC Unlikely Very Low Low NEW
Assumes earthwork repairs to spillway
Plan includes cost allocation for regular maintenance
P23 Main Pit
Pit wall failure Wave of water released from pit causing
damage to downstream facilities (ditches,
passive treatment system, covers)CC Very Unlikely Minor Low NEW
assuming less than 2m of water cover, so 'wave potential' not the same
as A2 pit, lower volume of water, less damage downstream
P24 Main Pit
Pit wall failure Wave of water released from pit causing
damage to downstream facilities (ditches,
passive treatment system, covers)EI Very Unlikely Moderate Low NEW
P25 Main PitPit water quality degraded unacceptably
(dissolved constituents)
Unacceptable water quality conditions for
water fowl / wildlifeEI Very Unlikely Moderate Low NEW Scenario was evaluated (Minnow)
P26 Main Pit
Wind suspension of tailings mobilizes tailings
material out of MPTMF
sediment deposition in downstream
conveyance structures leading to increased
maintenance requirements beyond those
planned
CC Very Unlikely Moderate Low NEW
Traffic surface element of tailings suface cover will extend below final
water elevation to mitigate wind wave turbulence circle suspending
tailings
P27 Main Pitpiping of tailings material through cover results in
'boils' of exposed tailings
need for repairs/clean up of exposed tailingsCC Possible Very Low Low NEW
Dry Stack Tailings Storage Facility (T)
L C L C
T1 DSTSF/MVFE
Long‐term permafrost degradation underlying
the DSTSF leads differential settlement and
ponding of water resulting in increased
infiltration leading to
Unacceptable downstream water quality
EI Unlikely Minor Low N
T2 DSTSF/MVFE
Long‐term permafrost degradation underlying
the DSTSF leads to differential settlement and
ponding of water
Need for repair
CC Possible Minor Moderate N
T3 DSTSF/MVFE
Long‐term permafrost degradation underlying
the DSTSF leads differential settlement and
ponding of water
Erosion of cover materials and sediment
loading to passive treatment system EI Possible Minor Moderate N
Maintenance issue
T4 DSTSF/MVFE
Re‐initiation of shear zone due to thawing of
permafrost from the bottom up due to high
excess pore pressure and movement in the
cross‐ valley direction, leading to cracking of the
cover and increased infiltration
Impacts to downstream water quality.
EI Very Unlikely Minor Low N
Mitigated by construction of MVFE S2
T5 DSTSF/MVFE
Deep‐seated downvalley slope failure of the
MVFE (Section F)
Instability of the DSTSF and cracking of the
cover, failure of conveyance ditches and need
for additional stabilization measures.CC Very Unlikely Major Moderate N
MVFE S2 design report calculates a minimum FOS of 2.3.
MVFE S2 has been constructed years before closure, and
will continue to produce years of performance monitoring
data. No significant concerns with down valley movement
with one year of data.
T6 DSTSF/MVFE
MVFE S2 does not extend far enough
downvalley
Cross‐valley movement at the eastern extent
of the current movement affecting the DSTSF
and need for additional stabilization
measures.
CC Very Unlikely Major Moderate NEW
MVFE S2 has been constructed years before closure, and
will continue to produce years of performance monitoring
data. No significant concerns with down valley movement
with one year of data.
T7 DSTSF/MVFE
Toe failure of the MVFE Instability and cracking of the cover, failure of
conveyance ditches and need for additional
stabilization measures.
CC Unlikely Minor Low Y
Facility is constructed, and no concerns based on
performance data.
T8 DSTSF/MVFE
Toe failure of the MVFE failure of conveyance ditch and mobilization
of sediment, leading to unacceptable TSS
concentrations in site dischargeEI Very Unlikely Minor Low NEW
Facility is constructed, and no concerns based on
performance data.
T9 DSTSF/MVFE
Movement (lateral movement or differential
settlement) reduces or blocks flow from the
finger drains underlying the DSTSF
Increased pore pressure within tailings mass,
raising of water table within tailings mass and
ultimately increased daylighting of
groundwater upgradient of DSTSF
EI Very Unlikely Minor Low N
T10 DSTSF/MVFE
Facility instability results in waste material
exposure to water and reduced cover
performance
Unacceptable downstream water quality
EI Very Unlikely Moderate Low NEW
T11 DSTSF/MVFEErosion on slopes leads to loss of cover Need for repairs beyond regular maintence
planned CC Unlikely Minor Low NEW
T12 DSTSF/MVFE
Die‐back of cover vegetation after successful
establishment and acceptance leads to erosion
Need for repairs beyond regular maintence
planned CC Unlikely Minor Low NEW
T13 DSTSF/MVFERoot throw results in increased infiltration over
the long term
Need for repairs beyond regular maintence
plannedCC Unlikely Minor Low NEW
CON.
TYPEchanged? CLASSIFICATION
Mitigated
Potential MitigationsRISK RATING
TABLE B‐2: DSTSF Risk RegisterMinto Explorations Ltd.
Minto Mine
FAILURES MODES AND EFFECTS ASSESSMENT
RISK RATINGCLASSIFICATION COMMENTS
RISK
NO.AREA RISK DESCRIPTION CONSEQUENCE

Risk
Low
Moderate
Moderately High
Waste Rock Dumps (D) High
Very High
L C L C
D1 Main Waste Dump
Run‐on water from upgradient catchment of
MWD increases flow subsurface and contaminant
loading from waste rock
Unacceptable downstream water quality
EI Very Unlikely Moderate Low N
MWD has limited upgradient catchment area and limited resulting
run‐on
D2 Main Waste Dump
Ponding of water on surface of MWD leads to
excessive infiltration, increases flow subsurface
and contaminant loading from waste rock
Unacceptable downstream water quality
EI Very Unlikely Moderate Low Y
has been mitigated by shaping surface to limit ponding
D3 Main Waste DumpInstability results in waste material exposure to
water
Unacceptable downstream water qualityEI Very Unlikely Moderate Low N
Likelihood supported by stability evaluations in MWDE design
report
D4 Main Waste Dump
Erosion on steeper portion of MWD leads to loss
of cover
Need for repairs beyond regular maintence
planned CC Almost Certain Minor Moderately High Y
has been observed at site on this facilityWaste Rock wrap at toe to reduce slope of
bottom of slopesUnlikely Minor Low
D5 Main Waste Dump
Die‐back of cover vegetation after successful
establishment and acceptance leads to erosion
Need for repairs beyond regular maintence
planned
CC Possible Minor Moderate N
MWD has been covered/ planted for several years. Appropriate
selection of veg species would reduce chance of wholesale die‐
back. Can be mitigated through design and/or O&M plan. Three
additional years of monitoring observations of MWD revegetation
trials have not shown any signs of die‐back, however likelihood
was kept the same.
D6 Main Waste DumpRoot throw results in increased infiltration over
the long term
Need for repairs beyond those plannedCC Unlikely Minor Low N
D7Southwest Waste
Dump
Run‐on water from upgradient catchment of SWD
increases flow subsurface and contaminant
loading from waste rock
Unacceptable downstream water quality
EI Very Unlikely Moderate Low N
SWD has limited upgradient catchment area and limited resulting
run‐on
D8Southwest Waste
Dump
Ponding of water on surface of SWD leads to
excessive infiltration, increases flow subsurface
and contaminant loading from waste rock
Unacceptable downstream water quality
EI Very Unlikely Moderate Low Y
Requires failure of AMP to realize the scenario. Reclamation plan
now includes shaping surface to limit ponding ‐ likelihood
reduced; maintenance may be required to restore contouring (if
differential settlement occurs) to prevent ponding. There is a
BGM cover on HGW, so ponding+increased infiltration is less likely
for HGW
D9Southwest Waste
Dump
Instability results in cover compromised and
waste material exposure to water
Unacceptable downstream water quality
EI Very Unlikely Moderate Low N
Likelihood supported by stability evaluations in SWD design
report. Foundation includes permafrost overburden, but the
design considered the existing foundation conditions.
D10Southwest Waste
Dump
Instability results in cover compromised Need for repairs beyond regular maintence
planned CC Unlikely Very Low Low NEW
Planned maintenance most likely to cover this type of repair work.
D11Southwest Waste
Dump
Erosion on steeper portions of SWD leads to loss
of cover
Need for repairs beyond regular maintence
planned CC Unlikely Minor Low Y
Likelihood can be reduced through implementation of design,
including planned vegetation, and planned maintenance is most
likely to cover this type of repair work.
D12Southwest Waste
Dump
Die‐back of cover vegetation after successful
establishment and acceptance leads to erosion
Need for repairs beyond regular maintence
planned
CC Possible Minor Moderate N
SWD will have been covered/ planted for several years;
appropriate selection of veg species would reduce chance of
wholesale die‐back. Can be mitigated through design and/or O&M
plan. Expect experience from MWD to be replicated.
D13Southwest Waste
Dump
Root throw results in increased infiltration over
the long term
Need for repairs beyond regular maintence
planned CC Unlikely Minor Low N
D14Southwest Waste
Dump
Root throw results in damage to engineered
cover (BGM) over HGW leads to increased
infiltration over the long term
Need for repairs beyond regular maintence
plannedCC Possible Minor Moderate N
HGW will be removed prior to closure, area
treated similar to rest of SWD facility, therefore
this risk is eliminated (not ranked.)
D15 Ridgetop Waste Dump
Run‐on water from upgradient catchment of
RWD increases flow subsurface and contaminant
loading from waste rock
Unacceptable downstream water quality
EI Very Unlikely Moderate Low N
MWD has limited upgradient catchment area and limited resulting
run‐on
D16 Ridgetop Waste Dump
Ponding of water on surface of MWD leads to
excessive infiltration, increases flow subsurface
and contaminant loading from waste rock
Unacceptable downstream water quality
EI Very Unlikely Moderate Low Y
has been mitigated by shaping surface to limit ponding
D17 Ridgetop Waste DumpInstability results in waste material exposure to
water
Unacceptable downstream water qualityEI Very Unlikely Moderate Low N
Likelihood supported by stability evaluations in MWDE design
report
D18 Ridgetop Waste Dump
Erosion on steeper portion of MWD leads to loss
of cover
Need for repairs beyond regular maintence
planned CC Possible Minor Moderate N
Can be mitigated through design and/or O&M plan
CLASSIFICATION
Mitigated
Potential MitigationsRISK RATING
changed?
TABLE B‐3: Waste Rock Dump Risk RegisterMinto Explorations Ltd.
Minto MineFAILURES MODES AND EFFECTS ASSESSMENT
RISK RATINGCLASSIFICATION COMMENTS
RISK
NO.AREA RISK DESCRIPTION CONSEQUENCE
CON.
TYPE

Risk
Low
Moderate
Moderately High
Waste Rock Dumps (D) High
Very High
L C L CCLASSIFICATION
Mitigated
Potential MitigationsRISK RATING
changed?
TABLE B‐3: Waste Rock Dump Risk RegisterMinto Explorations Ltd.
Minto MineFAILURES MODES AND EFFECTS ASSESSMENT
RISK RATINGCLASSIFICATION COMMENTS
RISK
NO.AREA RISK DESCRIPTION CONSEQUENCE
CON.
TYPE
D19 Ridgetop Waste Dump
Die‐back of cover vegetation after successful
establishment and acceptance leads to erosion
Need for repairs beyond regular maintence
plannedCC Possible Minor Moderate N
RWD will have been covered/ planted for several years;
appropriate selection of veg species would reduce chance of
wholesale die‐back. Can be mitigated through design and/or O&M
plan
D20 Ridgetop Waste DumpRoot throw results in increased infiltration over
the long term
Need for repairs beyond those plannedCC Unlikely Minor Low N
D21
Reclamation OVB,
Ridgetop South & Area
118 Backfill Dumps
Run‐on water from upgradient catchments
increases flow subsurface and contaminant
loading from overburden
Unacceptable downstream water quality
EI Very Unlikely Moderate Low N
Dump contents are overburden
D22
Reclamation OVB,
Ridgetop South & Area
118 Backfill Dumps
Thawing of ice‐rich OVB leads to settlement and
ponding of water on surface of overburden
dumps leads to excessive infiltration, increases
flow subsurface and contaminant loading from
overburden
Unacceptable downstream water quality
EI Very Unlikely Moderate Low N
Designs of A118 and RS BD are mounded to shed water.
D23
Reclamation OVB,
Ridgetop South & Area
118 Backfill Dumps
RS BD is not constructed to design limits,
resulting in development of a pit lake within RS
BD pit leading to spill of pit water and erosion of
downgradient slope
Need for development of channel
CC Very Unlikely Minor Low N
Likely will not form lake based on lack of water encountered in
A118 pit. Could be mitigated by filling with waste rock during
mining or by filling later with ob or waste rock
D24
Reclamation OVB,
Ridgetop South & Area
118 Backfill Dumps
Die‐back of re‐vegetation after successful
establishment and acceptance leads to erosion
Need for repairs beyond regular maintence
plannedCC Unlikely Very Low Low Y
No requirement to maintain cover integrity due to dump material
(OVB); have observed natural revegetation on portions of ROD
D25 Site Wide ‐ CoversBurrowing animals burrow in covers, increasing
infiltration
Unacceptable downstream water qualityEI Very Unlikely Moderate Low NEW
D26 Site Wide ‐ CoversBurrowing animals burrow in covers and/or trail
footprints leading to erosion
Need for repairs beyond regular maintence
plannedCC Very Unlikely Minor Low NEW
D27Main Pit Dump/SAT
Dump
SAT material is not relocated prior to completion
of Main Pit Dump,
portion of MPD needs to be excavated for SAT
material relocation CC Almost Certain Major Very High NEW
Main Pit Dump has been revised to not cover SAT
material, and construction is underway Very Unlikely Very Low Low
D28Main Pit Dump/SAT
Dump
Construction of MPD leads to re‐activation of
South Wall shear zone and failure of
SouthWall/MPD into Main Pit
need for re‐stabilization and repairs to cover
and conveyance channels CC Very Unlikely Major Moderate NEW
D29Main Pit Dump/SAT
Dump
Erosion on steeper portion of MWD leads to loss
of cover
Need for repairs beyond regular maintence
planned CC Possible Minor Moderate NEW
Can be mitigated through design and/or O&M plan
D30Main Pit Dump/SAT
Dump
Die‐back of cover vegetation after successful
establishment and acceptance leads to erosion
Need for repairs beyond regular maintence
plannedCC Possible Minor Moderate NEW
MPD will have been covered/ planted for several years;
appropriate selection of veg species would reduce chance of
wholesale die‐back. Can be mitigated through design and/or O&M
plan
D31Main Pit Dump/SAT
Dump
Root throw results in increased infiltration over
the long term
Need for repairs beyond those plannedCC Unlikely Minor Low NEW
Risk
Low
Moderate
Moderately High
Water Conveyance (W) High
Very High
L C L C
W1 Ditch A
Instability of the MPD or South Wall
compromises Ditch A leads to exposure of waste
rock and infiltration
Unacceptable water quality downstream
EI Very Unlikely Minor Low Y
Channel no longer runs on top of MPD
W2 Ditch AInstability of the MPD or South Wall
compromises Ditch A
Repair requirementsCC Very Unlikely Minor Low Y
W3 Ditch A
thaw consolidation of permafrost overburden in
South Wall leads to deformation of Ditch A
Repair requirements
CC Very Unlikely Very Low Low NEW
Design tolerates thaw consolidation
W4 Ditch AFlows exceed Ditch A capacity resulting in failure
of water conveyance structures
Repair requirementsCC Very Unlikely Very Low Low NEW
Alignment follows new valley bottom landform
W5 Ditch BThaw degradation leads to retrogressive failure
at inlet of A2S3 Pit
Need for repairs beyond regular maintenance
already planned CC Likely Moderate Moderately High NEW2016 design does not account for consequences of
long term thaw
cost allowance for design of improved inlet
structure Unlikely Minor Low
W6 Ditch B
Thaw degradation leads to retrogressive failure
at inlet of A2S3 Pit
sediment deposition in downstream
conveyance structures leading to
unacceptable TSS concentrations in site
discharge
EI Unlikely Minor Low NEWTSS settlment in pit would mitigate most of this
potential
W7 Ditch B
Flows exceed Ditch B capacity resulting in failure
of water conveyance structure and flows over
DSTSF leading to cover damage
Repair requirements
CC Very Unlikely Moderate Low NEW
DSTSF Landform design includes regrading to
direct flows around DSTSF rather than over Very Unlikely Minor Low
W8 TDD
Extreme event leads to failure of TDD
conveyance structure upgradient of DSTSF, flow
onto DSTSF leading to cover damage
Repair requirements
CC Very Unlikely Minor Low NEW
discussion considered whether tailings could be
mobilized, was decided not likely enough to
consider
W9 TDD
Leakage from TDD conveyance structure
upgradient of DSTSF increases flow subsurface
and contaminant loading from tailings
Unacceptable downstream water quality
EI Very Unlikely Moderate Low Y
updgraded TDD constructed
W10 Primary Channels
Winter ice development in channels causes
freshet flows to be above protected elevations,
leading to erosion
Need for repairs beyond regular maintenance
already planned CC Likely Minor Moderate Y
May be a reccuring event. Risk is lower where
foundation is mine fill. Candidate locations could
be mitigated with additional erosion protection.
W11 Ditch CThaw degradation leading to differential
settlment of channel/inlet
Need for repairsCC Possible Very Low Low NEW
W12 Ditch C
Flows exceed Ditch C level of erosion protection
resulting in damage to inlet structure/ditch and
mobilization of tailings downstream
cleanup and Repair requirements
CC Very Unlikely Major Moderate NEW
W13 Ditch C
Flows exceed Ditch C level of erosion protection
resulting in damage to inlet structure/ditch and
mobilization of tailings downstream
Unacceptable downstream water quality
EI Very Unlikely Moderate Low NEW
W14 Ditch C
Failure of Main Pit north wall blocks inlet to
Ditch C, leading to backing up of water and
sudden release of water into Ditch C, damaging
conveyance structure
Need for repairs
CC Unlikely Minor Low NEW
W15 Ditch D
Thaw degradation leading to differential
settlement of Channel in Ditch D
Need for repairs
CC Very Unlikely Very Low Low Y
large cut of Channel D lowers likelihood
W16 Ditch D
Thaw degradation leading to differential
settlement in Ditch D leading to ponding,
overtopping, and erosion
Need for repairs
CC Very Unlikely Minor Low Y
large cut of Channel D lowers likelihood
W17 Ditch DFlows exceed Ditch D capacity resulting in
failure of water conveyance structures
Repair requirementsCC Very Unlikely Very Low Low NEW
W18 Ditch D
Channel side slope failure blocks inlet to Ditch D,
leading to backing up of water in A2 Pit and
sudden release of water into Ditch D, damaging
conveyance structure
Need for repairs
CC Very Unlikely Minor Low NEW
Cut mostly in waste rock, potential for failure low
CON.
TYPEchanged? CLASSIFICATION
Mitigated
Potential MitigationsRISK RATING
TABLE B‐4: Water Conveyance Structure Risk RegisterMinto Explorations Ltd.
Minto MineFAILURES MODES AND EFFECTS ASSESSMENT
RISK RATINGCLASSIFICATION COMMENTS
RISK
NO.AREA RISK DESCRIPTION CONSEQUENCE
Risk
Low
Moderate
Moderately High
Water Conveyance (W) High
Very High
L C L C
CON.
TYPEchanged? CLASSIFICATION
Mitigated
Potential MitigationsRISK RATING
TABLE B‐4: Water Conveyance Structure Risk RegisterMinto Explorations Ltd.
Minto MineFAILURES MODES AND EFFECTS ASSESSMENT
RISK RATINGCLASSIFICATION COMMENTS
RISK
NO.AREA RISK DESCRIPTION CONSEQUENCE
W19 Ditch E
Flows exceed Ditch E capacity resulting in failure
of water conveyance structures and erosion of
MVFE cover, mbilization of sediments into CWTS
head pond
Repair requirements for cover and ditch and
cleanout of sediments in CWTS head pondCC Very Unlikely Minor Low NEW
W20 Ditch E
Thaw degradation leading to differential
settlement in Ditch D leading to ponding,
overtopping, and erosion
Need for repairs
CC Very Unlikely Minor Low NEW
potential for thaw consolidation in this area is less
than that which would lead to overtopping of
ponded water in Ditch E
W21 Ditch E
Thaw degradation leading to differential
settlement in Ditch E leading to ponding,
overtopping and erosion resulting in sediment
loading into passive treatment system
Unacceptable water quality conditions
downstream of site
EI Very Unlikely Moderate Low N
W22 CWTS High Flow Bypass
Landslide dam forms in CWTS high flow bypass
channel as a result of thawing of permafrost
overburden in S valley wall
Impounding of water and subsequent rapid
breach and sediment loading downstream EI Possible Minor Moderate Y
Included in post‐closure monitoring ‐ geotechnical
inspections
W23 CWTS High Flow Bypass
Landslide dam forms in CWTS high flow bypass
channel as a result of thawing of permafrost
overburden in S valley wall
Impounding of water and subsequent rapid
breach and sediment loading downstream and
need for repairs of conveyance and possibly
slope
CC Possible Minor Moderate NEW
W24 CWTS High Flow Bypass
Blockage forms in CWTS high flow bypass
channel from woody debris (beaver/fallen trees)
Impounding of water and subsequent
diversion into wetland causing damage to
CWTS CC Possible Minor Moderate NEW
W25 Primary ChannelsInadequate design of primary network Need for repairs
CC YTo broad to be useful, risks are addressed on
specific feature basis.
W26 Primary ChannelsFlows exceed channel capacity resulting in
failure of water conveyance structures
Need for repairsCC Y
To broad to be useful, risks are addressed on
specific feature basis.
W27 Secondary Channels
Excessive concentrated flows lead to erosion
and gulley formation and mass wasting
Unacceptable sediment load downstream
EI Unlikely Minor Low Y
secondary channels are designed/armoured,
erosion potential low
W28 Secondary Channels
Excessive concentrated flows lead to erosion
and gulley formation leading to waste rock
exposure and infiltration
Unacceptable water quality downstream
EI Unlikely Moderate Moderate Y
changed to unlikely to reflect chance of moderate
scale consequence, and moderate to be consistent
with previous consequence rankings
advancements in design, progress on regrading at
siteVery Unlikely Moderate Low
W29 Secondary Channels
Excessive concentrated flows lead to erosion
and gulley formation
Repair requirements
CC Unlikely Very Low Low Y
Requires greater than design criteria flows to be
any more than unlikely, sheet erosion analysis has
been undertaken; site presence in PC will ensure
site presence when these repairs are most likely
required
W30 Secondary Channels
Inadequate design of secondary network Need for repairs
CC Unlikely Very Low Low Y
secondary network now designed for 1:200 yr
event; site presence in PC will ensure site presence
when these repairs are most likely required
W31 Secondary Channels
Thaw consolidation near DSTSF leading to
differential settlement under channel leading to
ponding, overtopping, and erosion/tailings
mobilization
Unacceptable water quality downstream
EI Very Unlikely Moderate Low NEWRating assumed erosion on South side where no
rock shell exists
W32 Secondary Channels
Thaw consolidation near DSTSF leading to
differential settlement under channel leading to
ponding, overtopping, and erosion/tailings
mobilization
repairs required beyond regular maintenance
CC Possible Minor Moderate NEWRating assumed erosion on South side where no
rock shell exists
refine landform design to reduce length of
individual secondary channels and associated
catchment areasVery Unlikely Minor Low
W33 Tertiary Channels
Differential settlement leading to excessively
concentrated flows in channels
scour and erosion and filling of the energy
dissipator structures
CC Unlikely Minor Low Y
These networks are typically on flatter areas, which
cannot generate velocities required for substantial
erosion. Requires greater than design criteria flows
to be any more than unlikely, sheet erosion analysis
has been undertaken; site presence in PC will
ensure site presence when these repairs are most
likely required
Risk
Low
Moderate
Moderately High
Water Conveyance (W) High
Very High
L C L C
CON.
TYPEchanged? CLASSIFICATION
Mitigated
Potential MitigationsRISK RATING
TABLE B‐4: Water Conveyance Structure Risk RegisterMinto Explorations Ltd.
Minto MineFAILURES MODES AND EFFECTS ASSESSMENT
RISK RATINGCLASSIFICATION COMMENTS
RISK
NO.AREA RISK DESCRIPTION CONSEQUENCE
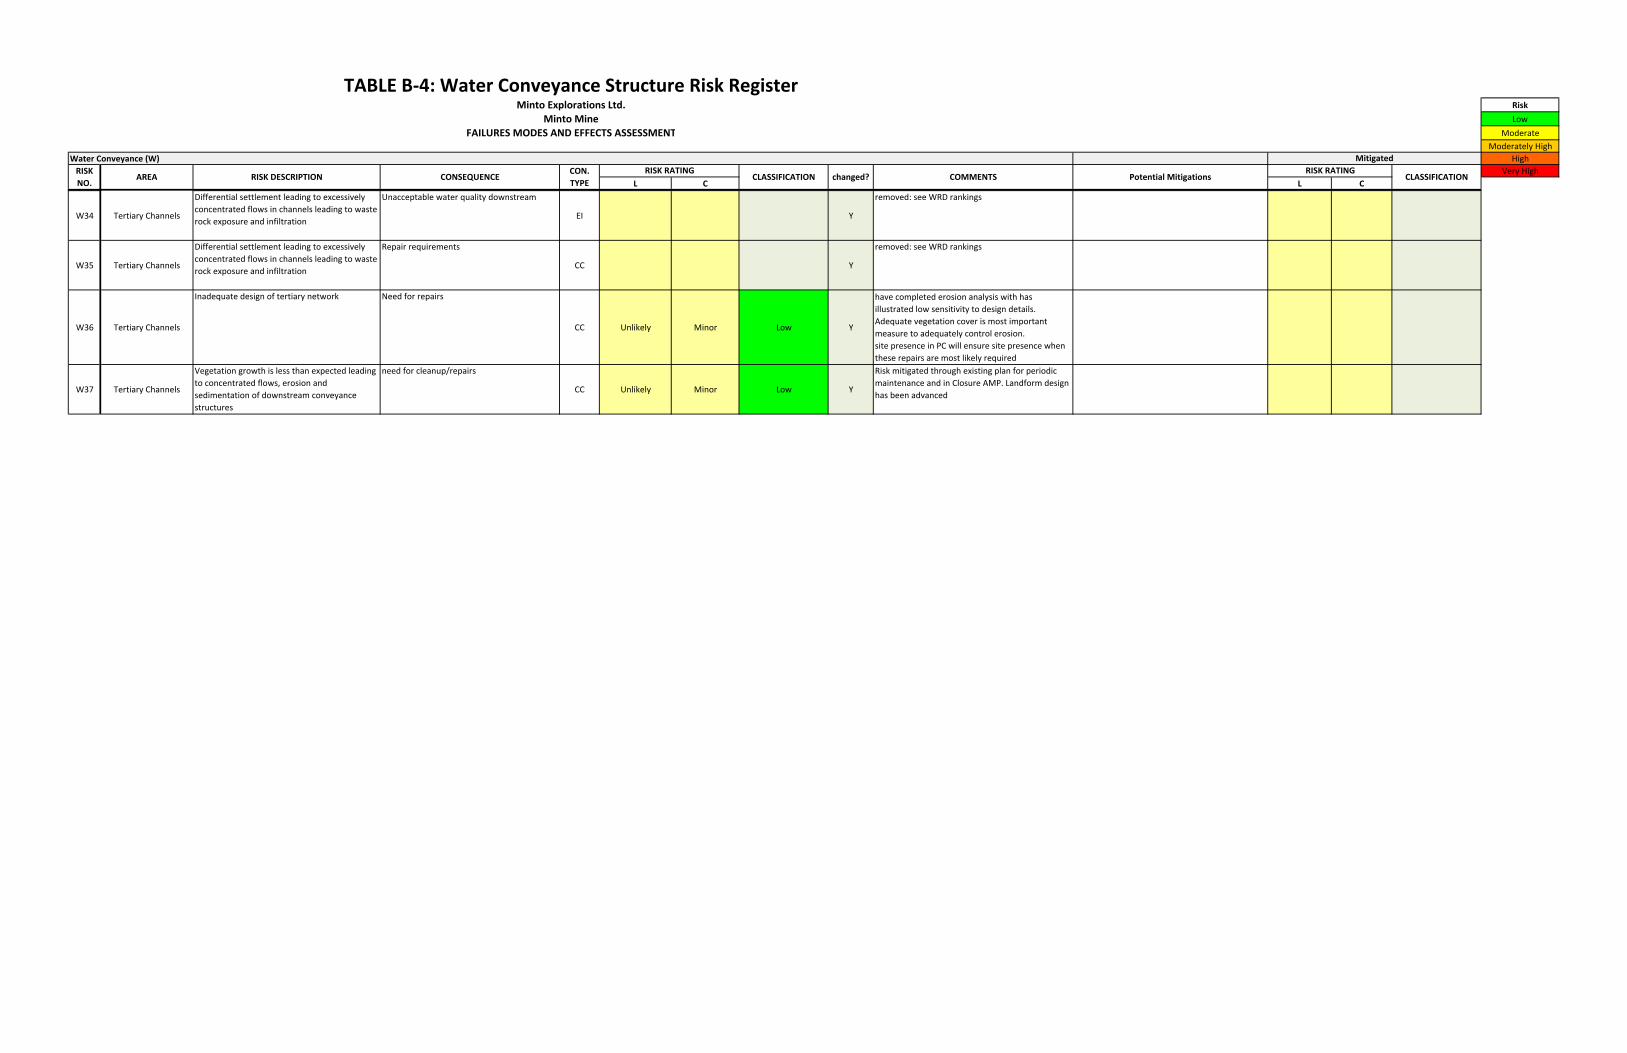
W34 Tertiary Channels
Differential settlement leading to excessively
concentrated flows in channels leading to waste
rock exposure and infiltration
Unacceptable water quality downstream
EI Y
removed: see WRD rankings
W35 Tertiary Channels
Differential settlement leading to excessively
concentrated flows in channels leading to waste
rock exposure and infiltration
Repair requirements
CC Y
removed: see WRD rankings
W36 Tertiary Channels
Inadequate design of tertiary network Need for repairs
CC Unlikely Minor Low Y
have completed erosion analysis with has
illustrated low sensitivity to design details.
Adequate vegetation cover is most important
measure to adequately control erosion.
site presence in PC will ensure site presence when
these repairs are most likely required
W37 Tertiary Channels
Vegetation growth is less than expected leading
to concentrated flows, erosion and
sedimentation of downstream conveyance
structures
need for cleanup/repairs
CC Unlikely Minor Low Y
Risk mitigated through existing plan for periodic
maintenance and in Closure AMP. Landform design
has been advanced
Administrative (A)
L C
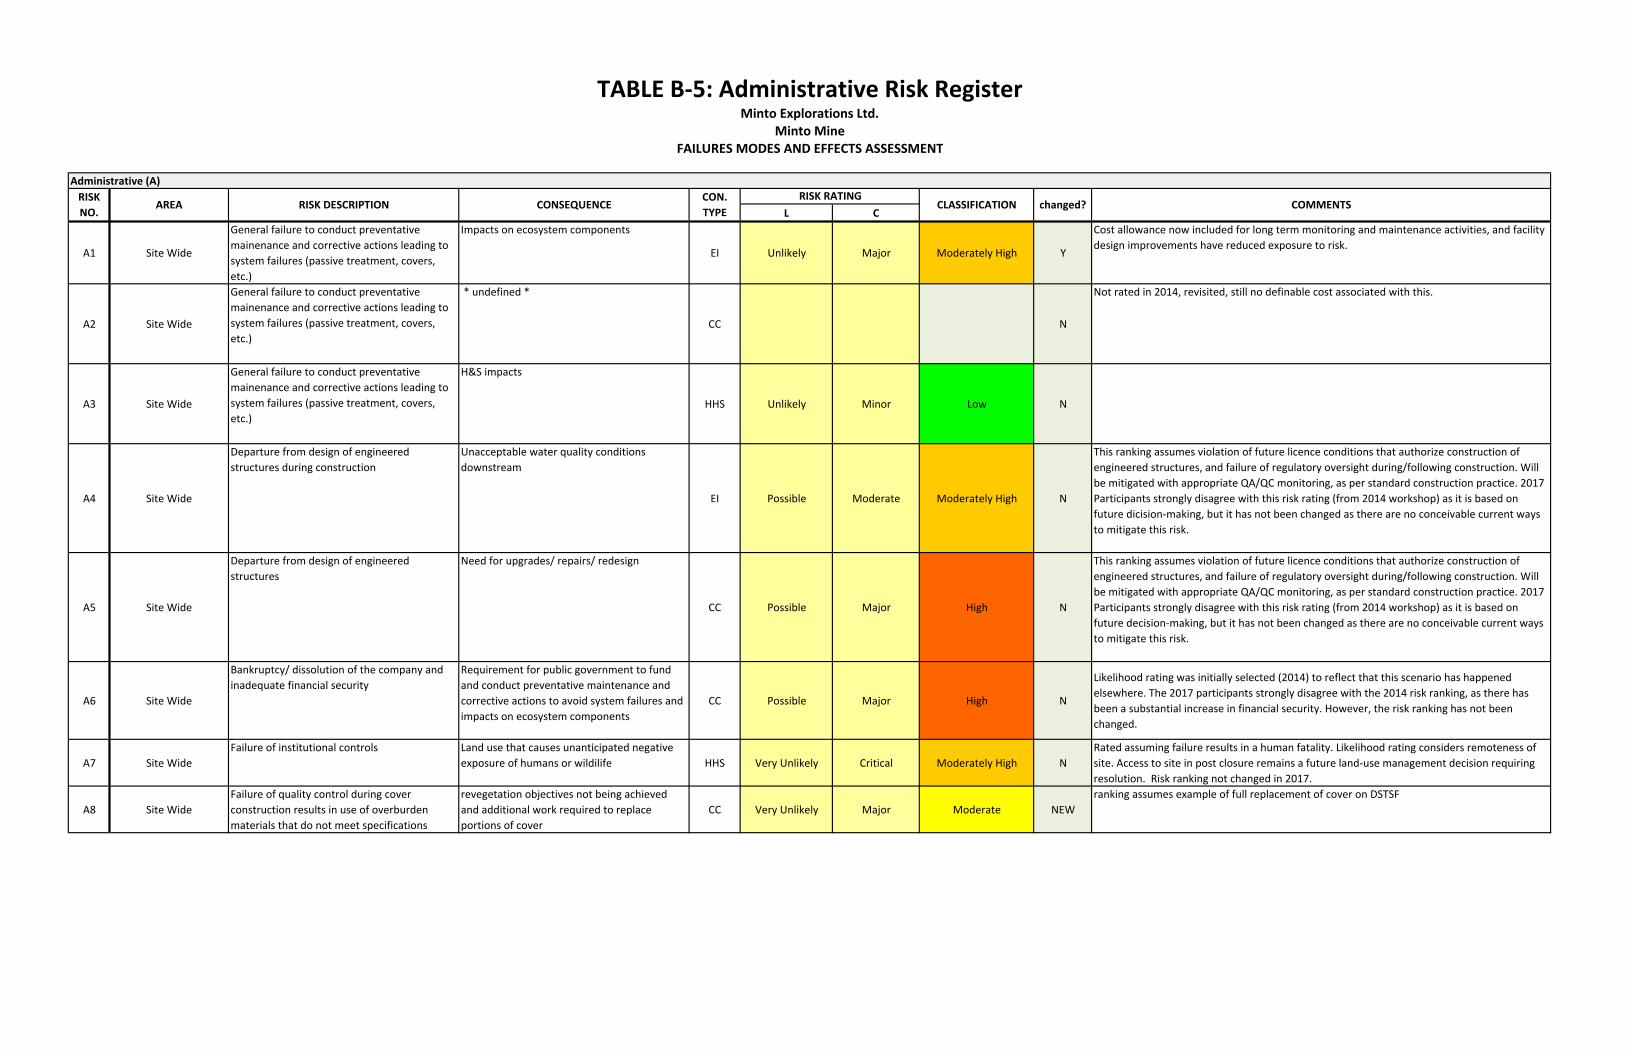
A1 Site Wide
General failure to conduct preventative
mainenance and corrective actions leading to
system failures (passive treatment, covers,
etc.)
Impacts on ecosystem components
EI Unlikely Major Moderately High Y
Cost allowance now included for long term monitoring and maintenance activities, and facility
design improvements have reduced exposure to risk.
A2 Site Wide
General failure to conduct preventative
mainenance and corrective actions leading to
system failures (passive treatment, covers,
etc.)
* undefined *
CC N
Not rated in 2014, revisited, still no definable cost associated with this.
A3 Site Wide
General failure to conduct preventative
mainenance and corrective actions leading to
system failures (passive treatment, covers,
etc.)
H&S impacts
HHS Unlikely Minor Low N
A4 Site Wide
Departure from design of engineered
structures during construction
Unacceptable water quality conditions
downstream
EI Possible Moderate Moderately High N
This ranking assumes violation of future licence conditions that authorize construction of
engineered structures, and failure of regulatory oversight during/following construction. Will
be mitigated with appropriate QA/QC monitoring, as per standard construction practice. 2017
Participants strongly disagree with this risk rating (from 2014 workshop) as it is based on
future dicision‐making, but it has not been changed as there are no conceivable current ways
to mitigate this risk.
A5 Site Wide
Departure from design of engineered
structures
Need for upgrades/ repairs/ redesign
CC Possible Major High N
This ranking assumes violation of future licence conditions that authorize construction of
engineered structures, and failure of regulatory oversight during/following construction. Will
be mitigated with appropriate QA/QC monitoring, as per standard construction practice. 2017
Participants strongly disagree with this risk rating (from 2014 workshop) as it is based on
future decision‐making, but it has not been changed as there are no conceivable current ways
to mitigate this risk.
A6 Site Wide
Bankruptcy/ dissolution of the company and
inadequate financial security
Requirement for public government to fund
and conduct preventative maintenance and
corrective actions to avoid system failures and
impacts on ecosystem components
CC Possible Major High N
Likelihood rating was initially selected (2014) to reflect that this scenario has happened
elsewhere. The 2017 participants strongly disagree with the 2014 risk ranking, as there has
been a substantial increase in financial security. However, the risk ranking has not been
changed.
A7 Site Wide
Failure of institutional controls Land use that causes unanticipated negative
exposure of humans or wildilife HHS Very Unlikely Critical Moderately High N
Rated assuming failure results in a human fatality. Likelihood rating considers remoteness of
site. Access to site in post closure remains a future land‐use management decision requiring
resolution. Risk ranking not changed in 2017.
A8 Site Wide
Failure of quality control during cover
construction results in use of overburden
materials that do not meet specifications
revegetation objectives not being achieved
and additional work required to replace
portions of cover
CC Very Unlikely Major Moderate NEW
ranking assumes example of full replacement of cover on DSTSF
CON.
TYPEchanged?
TABLE B‐5: Administrative Risk RegisterMinto Explorations Ltd.
Minto MineFAILURES MODES AND EFFECTS ASSESSMENT
RISK RATINGCLASSIFICATION COMMENTS
RISK
NO.AREA RISK DESCRIPTION CONSEQUENCE
Water Treatment (WT)
L C L C
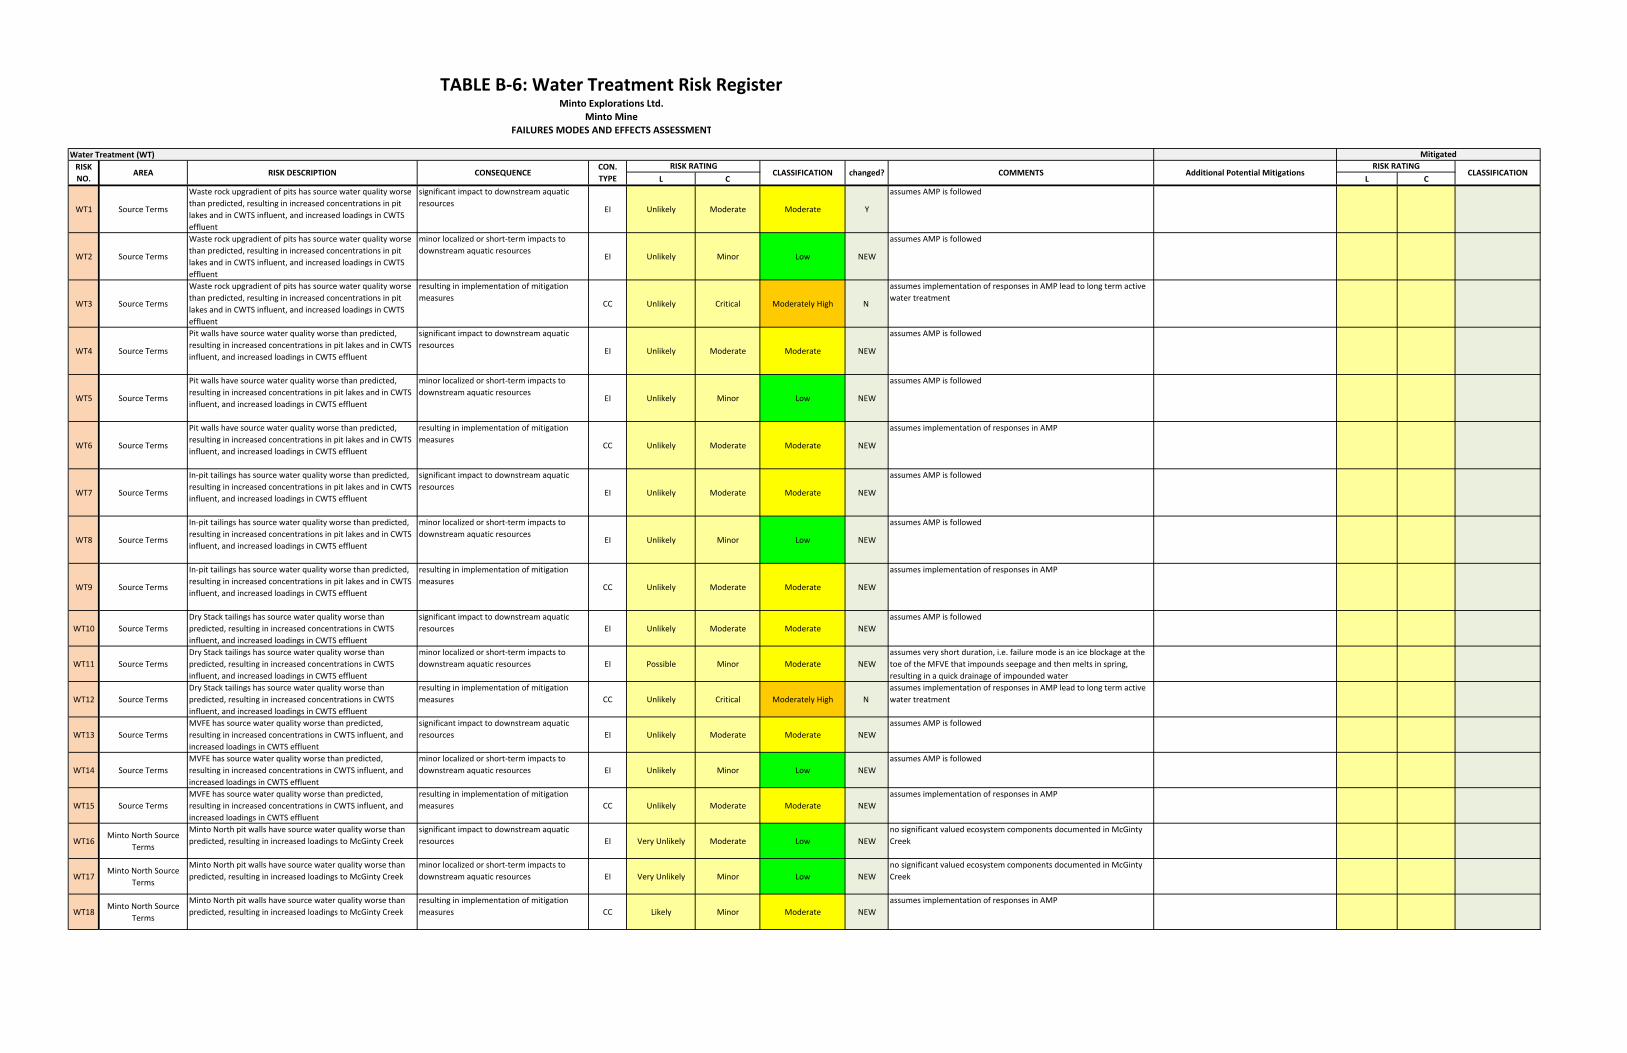
WT1 Source Terms
Waste rock upgradient of pits has source water quality worse
than predicted, resulting in increased concentrations in pit
lakes and in CWTS influent, and increased loadings in CWTS
effluent
significant impact to downstream aquatic
resourcesEI Unlikely Moderate Moderate Y
assumes AMP is followed
WT2 Source Terms
Waste rock upgradient of pits has source water quality worse
than predicted, resulting in increased concentrations in pit
lakes and in CWTS influent, and increased loadings in CWTS
effluent
minor localized or short‐term impacts to
downstream aquatic resourcesEI Unlikely Minor Low NEW
assumes AMP is followed
WT3 Source Terms
Waste rock upgradient of pits has source water quality worse
than predicted, resulting in increased concentrations in pit
lakes and in CWTS influent, and increased loadings in CWTS
effluent
resulting in implementation of mitigation
measuresCC Unlikely Critical Moderately High N
assumes implementation of responses in AMP lead to long term active
water treatment
WT4 Source Terms
Pit walls have source water quality worse than predicted,
resulting in increased concentrations in pit lakes and in CWTS
influent, and increased loadings in CWTS effluent
significant impact to downstream aquatic
resourcesEI Unlikely Moderate Moderate NEW
assumes AMP is followed
WT5 Source Terms
Pit walls have source water quality worse than predicted,
resulting in increased concentrations in pit lakes and in CWTS
influent, and increased loadings in CWTS effluent
minor localized or short‐term impacts to
downstream aquatic resourcesEI Unlikely Minor Low NEW
assumes AMP is followed
WT6 Source Terms
Pit walls have source water quality worse than predicted,
resulting in increased concentrations in pit lakes and in CWTS
influent, and increased loadings in CWTS effluent
resulting in implementation of mitigation
measuresCC Unlikely Moderate Moderate NEW
assumes implementation of responses in AMP
WT7 Source Terms
In‐pit tailings has source water quality worse than predicted,
resulting in increased concentrations in pit lakes and in CWTS
influent, and increased loadings in CWTS effluent
significant impact to downstream aquatic
resourcesEI Unlikely Moderate Moderate NEW
assumes AMP is followed
WT8 Source Terms
In‐pit tailings has source water quality worse than predicted,
resulting in increased concentrations in pit lakes and in CWTS
influent, and increased loadings in CWTS effluent
minor localized or short‐term impacts to
downstream aquatic resourcesEI Unlikely Minor Low NEW
assumes AMP is followed
WT9 Source Terms
In‐pit tailings has source water quality worse than predicted,
resulting in increased concentrations in pit lakes and in CWTS
influent, and increased loadings in CWTS effluent
resulting in implementation of mitigation
measuresCC Unlikely Moderate Moderate NEW
assumes implementation of responses in AMP
WT10 Source Terms
Dry Stack tailings has source water quality worse than
predicted, resulting in increased concentrations in CWTS
influent, and increased loadings in CWTS effluent
significant impact to downstream aquatic
resources EI Unlikely Moderate Moderate NEW
assumes AMP is followed
WT11 Source Terms
Dry Stack tailings has source water quality worse than
predicted, resulting in increased concentrations in CWTS
influent, and increased loadings in CWTS effluent
minor localized or short‐term impacts to
downstream aquatic resources EI Possible Minor Moderate NEW
assumes very short duration, i.e. failure mode is an ice blockage at the
toe of the MFVE that impounds seepage and then melts in spring,
resulting in a quick drainage of impounded water
WT12 Source Terms
Dry Stack tailings has source water quality worse than
predicted, resulting in increased concentrations in CWTS
influent, and increased loadings in CWTS effluent
resulting in implementation of mitigation
measures CC Unlikely Critical Moderately High N
assumes implementation of responses in AMP lead to long term active
water treatment
WT13 Source Terms
MVFE has source water quality worse than predicted,
resulting in increased concentrations in CWTS influent, and
increased loadings in CWTS effluent
significant impact to downstream aquatic
resources EI Unlikely Moderate Moderate NEW
assumes AMP is followed
WT14 Source Terms
MVFE has source water quality worse than predicted,
resulting in increased concentrations in CWTS influent, and
increased loadings in CWTS effluent
minor localized or short‐term impacts to
downstream aquatic resources EI Unlikely Minor Low NEW
assumes AMP is followed
WT15 Source Terms
MVFE has source water quality worse than predicted,
resulting in increased concentrations in CWTS influent, and
increased loadings in CWTS effluent
resulting in implementation of mitigation
measures CC Unlikely Moderate Moderate NEW
assumes implementation of responses in AMP
WT16Minto North Source
Terms
Minto North pit walls have source water quality worse than
predicted, resulting in increased loadings to McGinty Creek
significant impact to downstream aquatic
resources EI Very Unlikely Moderate Low NEW
no significant valued ecosystem components documented in McGinty
Creek
WT17Minto North Source
Terms
Minto North pit walls have source water quality worse than
predicted, resulting in increased loadings to McGinty Creek
minor localized or short‐term impacts to
downstream aquatic resources EI Very Unlikely Minor Low NEW
no significant valued ecosystem components documented in McGinty
Creek
WT18Minto North Source
Terms
Minto North pit walls have source water quality worse than
predicted, resulting in increased loadings to McGinty Creek
resulting in implementation of mitigation
measures CC Likely Minor Moderate NEW
assumes implementation of responses in AMP
RISK RATINGCLASSIFICATION
RISK RATINGCLASSIFICATION changed? COMMENTS Additional Potential Mitigations
TABLE B‐6: Water Treatment Risk RegisterMinto Explorations Ltd.
Minto MineFAILURES MODES AND EFFECTS ASSESSMENT
Mitigated
RISK
NO.AREA RISK DESCRIPTION CONSEQUENCE
CON.
TYPE

Water Treatment (WT)
L C L C
RISK RATINGCLASSIFICATION
RISK RATINGCLASSIFICATION changed? COMMENTS Additional Potential Mitigations
TABLE B‐6: Water Treatment Risk RegisterMinto Explorations Ltd.
Minto MineFAILURES MODES AND EFFECTS ASSESSMENT
Mitigated
RISK
NO.AREA RISK DESCRIPTION CONSEQUENCE
CON.
TYPE
WT19 Water Treatment
Blockage of high flow bypass prior to a high flow event leads
to routing of all high flows through CWTS, compromising
CWTS cell structure, leading to short circuiting and/or
compromising of CWTS vegetation and subsequent
functionality at routine flows
significant impact to downstream aquatic
resources
EI Unlikely Moderate Moderate NEWExtensive damage and performance impairment is possible, but unlikely
to result in significant impact to downstream resources
WT20 Water Treatment
Blockage of high flow bypass prior to a high flow event leads
to routing of all high flows through CWTS, flushing of
sediments downstream, and release of sediment‐bound
metals to the aquatic environment
significant impact to downstream aquatic
resourcesEI Very Unlikely Moderate Low NEW
Likelihood ranking is based on low likelihood of damage (above) and
low potential for sediment mobilization, as the location of sediment‐
bound metals is under protective vegetation.
WT21 Water Treatment
Blockage of high flow bypass prior to a high flow event leads
to routing of all high flows through CWTS, compromising
CWTS cell structure, leading to short circuiting and/or
compromising of CWTS vegetation and subsequent
functionality at routine flows
requiring maintenance and replanting beyond
regular planned maintenance
CC Possible Moderate Moderately High NEW likelihood of extensive damage is possible
WT22 Water Treatment
Sedimentation/erosion in cells leads to channelization and
non‐uniform flow field, reducing CWTS treatment efficacy
significant impact to downstream aquatic
resources EI Unlikely Moderate Moderate NEW
WT23 Water Treatment
Sedimentation/erosion in cells leads to channelization and
non‐uniform flow field, reducing CWTS treatment efficacy
intermittent exceedances of water quality
objectives but not effects thresholds EI Possible Very Low Low NEW
Routine monitoring and maintenance would reduce likelihood of this
happening to a degree that would cause water quality objective
exceedences
WT24 Water Treatment
Willows or alders grow into wetland area, leading to
channeling caused by roots and reduced treatment retention
time
significant impact to downstream aquatic
resources EI Very Unlikely Moderate Low NEW
WT25 Water Treatment
Willows or alders grow into wetland area, leading to
channeling caused by roots and reduced treatment retention
time
requiring repair beyond regular planned
maintenance CC Very Unlikely Minor Low NEW
Routine monitoring and maintenance would reduce likelihood of this
happening to a degree that would cause water quality objective
exceedences
WT26 Water Treatment
Willows or alders grow into wetland area, leading to
increased vegetation biodiversity and attraction of wildlife
and disturbance of treatment system
intermittent exceedances of water quality
objectives but not effects thresholdsEI Very Unlikely Minor Low NEW
WT27 Water Treatment
Willows or alders grow into wetland area, leading to
increased vegetation biodiversity and attraction of wildlife
and disturbance of treatment system
requiring repair beyond regular planned
maintenanceCC Very Unlikely Minor Low NEW
Routine monitoring and maintenance would reduce likelihood of this
happening to a degree that would cause water quality objective
exceedences
WT28 Water Treatment
Aphid infestation damages CWTS vegetation, decreasing
carbon yield and compromising subsequent years' treatment
performance
intermittent exceedances of water quality
objectives but not effects thresholdsEI Unlikely Minor Low NEW
Routine monitoring and maintenance would reduce likelihood of this
happening to a degree that would cause water quality objective
exceedences
WT29 Water Treatment
Aphid infestation damages CWTS vegetation, decreasing
carbon yield and compromising subsequent years' treatment
performance
requiring pest control/replanting beyond
regular planned maintenanceCC Possible Minor Moderate NEW
WT30 Water Treatment
CWTS vegetation growth is insufficient to supply required
carbon to feed treatment process
intermittent exceedances of water quality
objectives but not effects thresholds EI Unlikely Minor Low NEW
WT31 Water Treatment
CWTS vegetation growth is insufficient to supply required
carbon to feed treatment process
requiring amendment beyond regular
planned maintenance CC Unlikely Minor Low NEWRoutine monitoring and maintenance would reduce likelihood of this
happening to a degree that would cause need for amendment addition
WT32 Water Treatment
Inflow to CWTS from head pond is blocked, leading to all flow
entering high flow bypass
intermittent exceedances of water quality
objectives but not effects thresholds EI Likely Minor Moderate NEW
WT33 Water Treatment
Inflow to CWTS from head pond is blocked, leading to all flow
entering high flow bypass and drying out of CWTS,
compromising system functionality while vegetation re‐
establishes
significant impact to downstream aquatic
resources
EI Very Unlikely Moderate Low NEW
WT34 Water Treatment
lack of replacement for CWTS intallation in plan/costing at
end of CWTS design life
significant impact to downstream aquatic
resources EI Unlikely Moderate Moderate NEWRCP does not include CWTS replacement, by design. Assumes site
loadings have decreased to levels not requiring polishing.
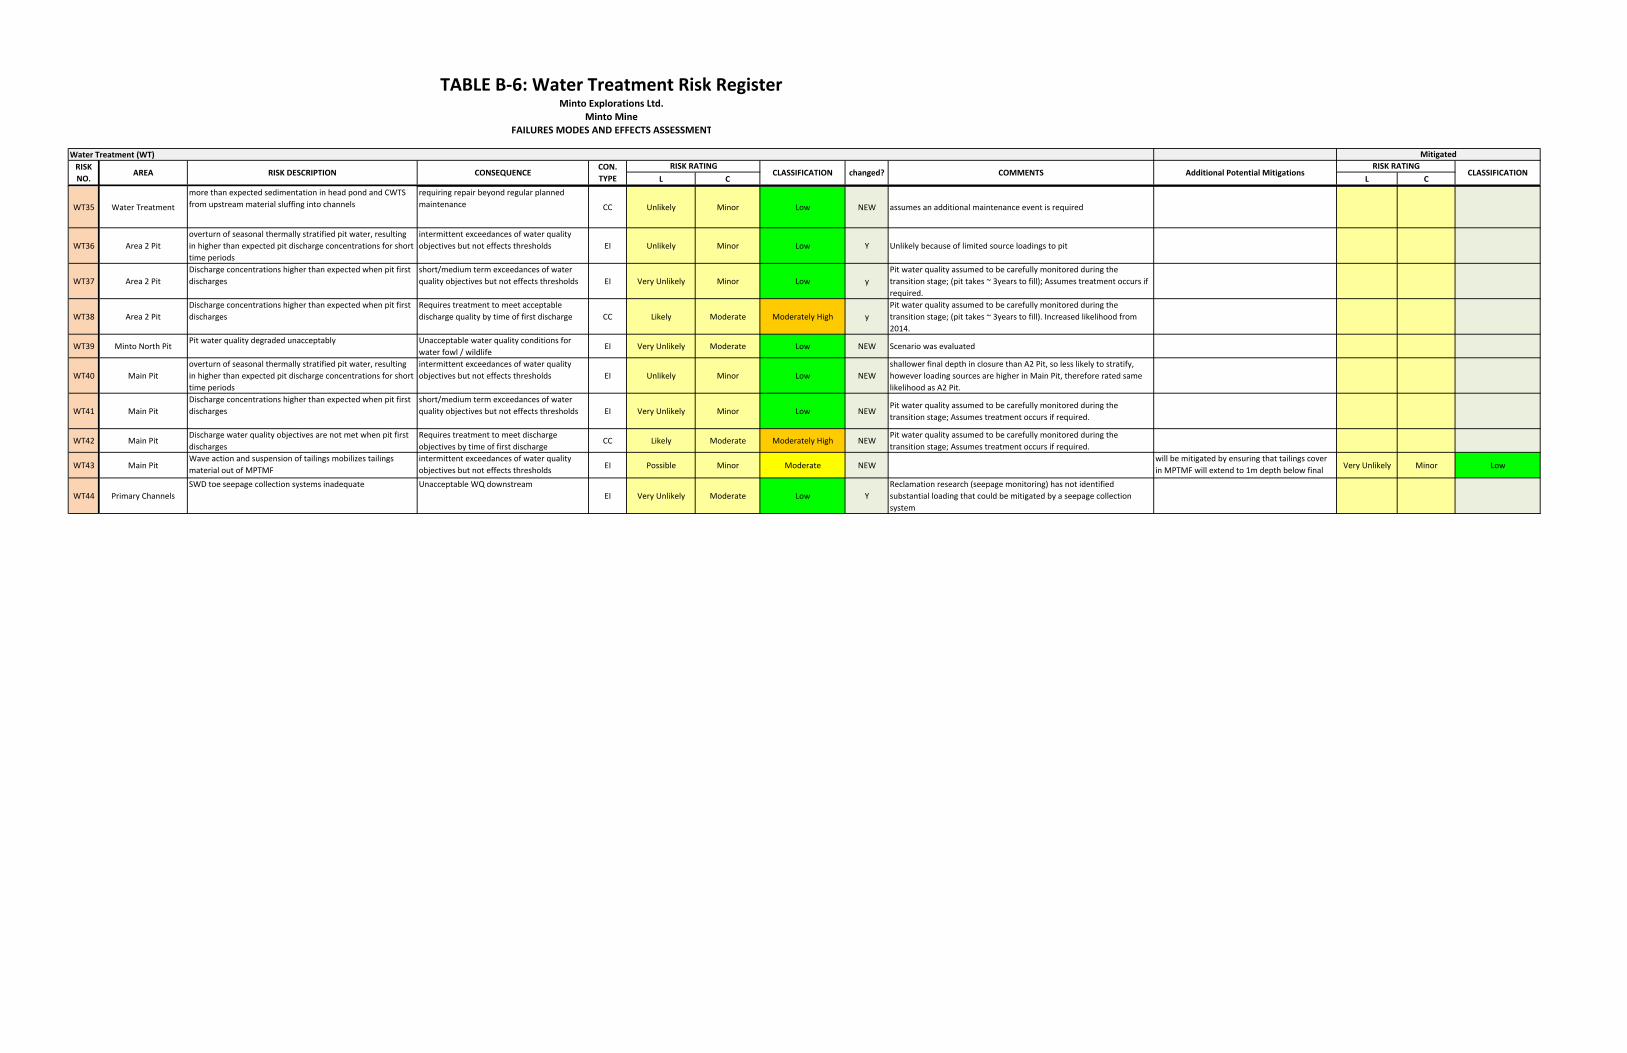
Water Treatment (WT)
L C L C
RISK RATINGCLASSIFICATION
RISK RATINGCLASSIFICATION changed? COMMENTS Additional Potential Mitigations
TABLE B‐6: Water Treatment Risk RegisterMinto Explorations Ltd.
Minto MineFAILURES MODES AND EFFECTS ASSESSMENT
Mitigated
RISK
NO.AREA RISK DESCRIPTION CONSEQUENCE
CON.
TYPE
WT35 Water Treatment
more than expected sedimentation in head pond and CWTS
from upstream material sluffing into channels
requiring repair beyond regular planned
maintenance CC Unlikely Minor Low NEW assumes an additional maintenance event is required
WT36 Area 2 Pit
overturn of seasonal thermally stratified pit water, resulting
in higher than expected pit discharge concentrations for short
time periods
intermittent exceedances of water quality
objectives but not effects thresholds EI Unlikely Minor Low Y Unlikely because of limited source loadings to pit
WT37 Area 2 Pit
Discharge concentrations higher than expected when pit first
discharges
short/medium term exceedances of water
quality objectives but not effects thresholds EI Very Unlikely Minor Low y
Pit water quality assumed to be carefully monitored during the
transition stage; (pit takes ~ 3years to fill); Assumes treatment occurs if
required.
WT38 Area 2 Pit
Discharge concentrations higher than expected when pit first
discharges
Requires treatment to meet acceptable
discharge quality by time of first discharge CC Likely Moderate Moderately High y
Pit water quality assumed to be carefully monitored during the
transition stage; (pit takes ~ 3years to fill). Increased likelihood from
2014.
WT39 Minto North PitPit water quality degraded unacceptably Unacceptable water quality conditions for
water fowl / wildlifeEI Very Unlikely Moderate Low NEW Scenario was evaluated
WT40 Main Pit
overturn of seasonal thermally stratified pit water, resulting
in higher than expected pit discharge concentrations for short
time periods
intermittent exceedances of water quality
objectives but not effects thresholds EI Unlikely Minor Low NEW
shallower final depth in closure than A2 Pit, so less likely to stratify,
however loading sources are higher in Main Pit, therefore rated same
likelihood as A2 Pit.
WT41 Main Pit
Discharge concentrations higher than expected when pit first
discharges
short/medium term exceedances of water
quality objectives but not effects thresholds EI Very Unlikely Minor Low NEWPit water quality assumed to be carefully monitored during the
transition stage; Assumes treatment occurs if required.
WT42 Main PitDischarge water quality objectives are not met when pit first
discharges
Requires treatment to meet discharge
objectives by time of first dischargeCC Likely Moderate Moderately High NEW
Pit water quality assumed to be carefully monitored during the
transition stage; Assumes treatment occurs if required.
WT43 Main PitWave action and suspension of tailings mobilizes tailings
material out of MPTMF
intermittent exceedances of water quality
objectives but not effects thresholdsEI Possible Minor Moderate NEW
will be mitigated by ensuring that tailings cover
in MPTMF will extend to 1m depth below final Very Unlikely Minor Low
WT44 Primary Channels
SWD toe seepage collection systems inadequate Unacceptable WQ downstream
EI Very Unlikely Moderate Low Y
Reclamation research (seepage monitoring) has not identified
substantial loading that could be mitigated by a seepage collection
system
MIN‐16‐03‐_008_MINTO MINE CLOSURE FMEA 2017 FINAL REPORT_REVA_180123.DOCX
2017 FMEA Risk Matrices
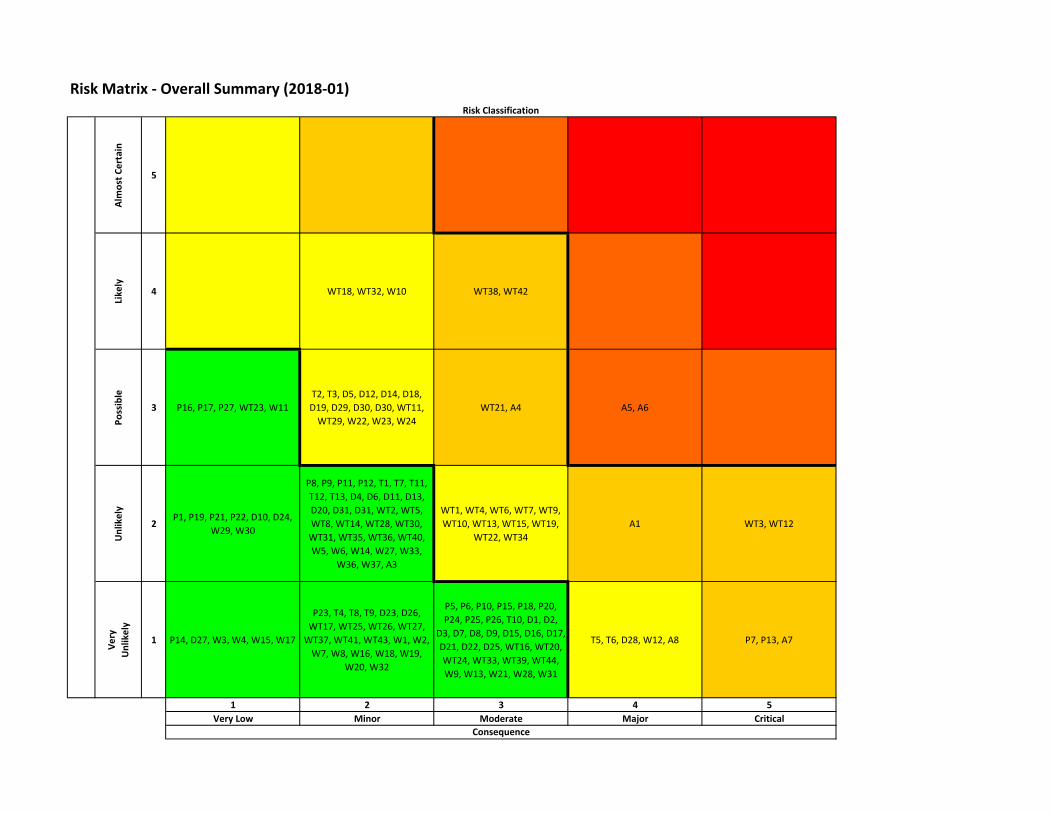
Risk Matrix ‐ Overall Summary (2018‐01)
Alm
ost Certain
5
Likely
4 WT18, WT32, W10 WT38, WT42
Possible
3 P16, P17, P27, WT23, W11
T2, T3, D5, D12, D14, D18,
D19, D29, D30, D30, WT11,
WT29, W22, W23, W24
WT21, A4 A5, A6
Unlikely
2P1, P19, P21, P22, D10, D24,
W29, W30
P8, P9, P11, P12, T1, T7, T11,
T12, T13, D4, D6, D11, D13,
D20, D31, D31, WT2, WT5,
WT8, WT14, WT28, WT30,
WT31, WT35, WT36, WT40,
W5, W6, W14, W27, W33,
W36, W37, A3
WT1, WT4, WT6, WT7, WT9,
WT10, WT13, WT15, WT19,
WT22, WT34
A1 WT3, WT12
Very
Unlikely
1 P14, D27, W3, W4, W15, W17
P23, T4, T8, T9, D23, D26,
WT17, WT25, WT26, WT27,
WT37, WT41, WT43, W1, W2,
W7, W8, W16, W18, W19,
W20, W32
P5, P6, P10, P15, P18, P20,
P24, P25, P26, T10, D1, D2,
D3, D7, D8, D9, D15, D16, D17,
D21, D22, D25, WT16, WT20,
WT24, WT33, WT39, WT44,
W9, W13, W21, W28, W31
T5, T6, D28, W12, A8 P7, P13, A7
1 2 3 4 5
Very Low Minor Moderate Major Critical
Consequence
Risk Classification
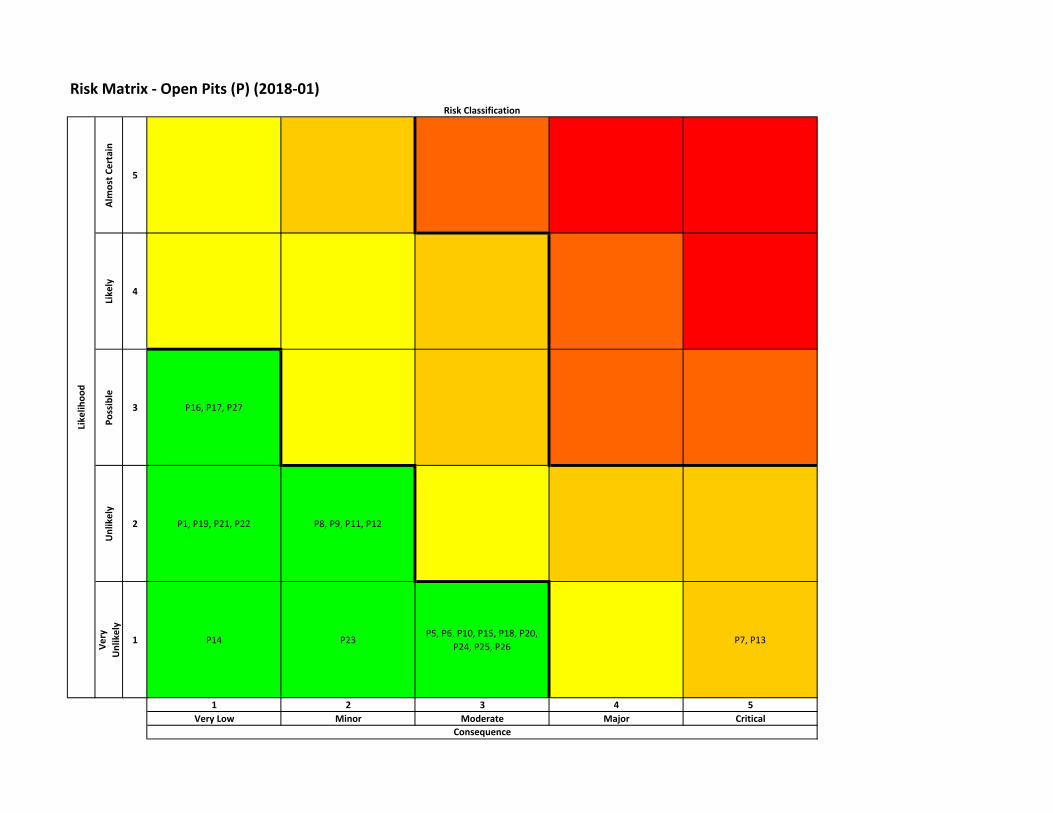
Risk Matrix ‐ Open Pits (P) (2018‐01)Alm
ost Certain
5
Likely
4
Possible
3 P16, P17, P27
Unlikely
2 P1, P19, P21, P22 P8, P9, P11, P12
Very
Unlikely
1 P14 P23P5, P6, P10, P15, P18, P20,
P24, P25, P26P7, P13
1 2 3 4 5
Very Low Minor Moderate Major Critical
Consequence
Risk Classification
Likelih
ood
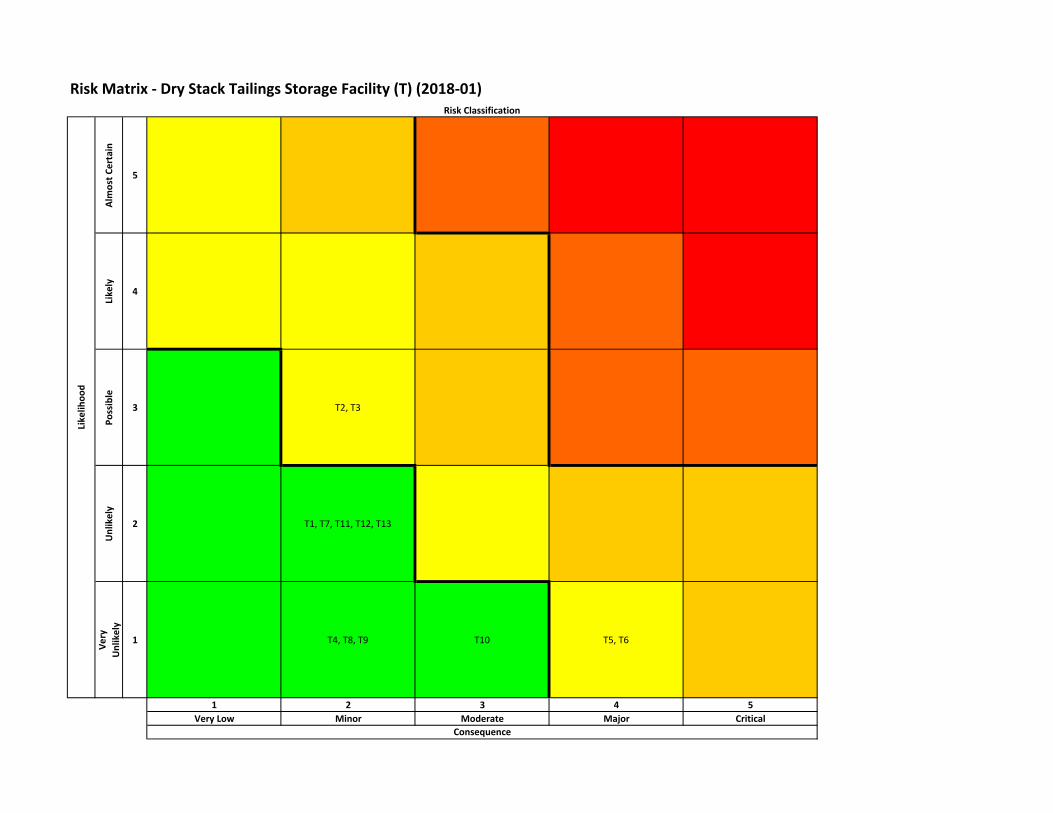
Risk Matrix ‐ Dry Stack Tailings Storage Facility (T) (2018‐01)Alm
ost Certain
5
Likely
4
Possible
3 T2, T3
Unlikely
2 T1, T7, T11, T12, T13
Very
Unlikely
1 T4, T8, T9 T10 T5, T6
1 2 3 4 5
Very Low Minor Moderate Major Critical
Consequence
Risk Classification
Likelih
ood

Risk Matrix ‐ Waste Rock Dumps (D) (2018‐01)Alm
ost Certain
5
Likely
4
Possible
3D5, D12, D14, D18, D19, D29,
D30, D30
Unlikely
2 D10, D24D4, D6, D11, D13, D20, D31,
D31
Very
Unlikely
1 D27 D23, D26D1, D2, D3, D7, D8, D9, D15,
D16, D17, D21, D22, D25D28
1 2 3 4 5
Very Low Minor Moderate Major Critical
Consequence
Risk Classification
Likelih
ood

Risk Matrix ‐ Water Treatment (WT) (2018‐01)Alm
ost Certain
5
Likely
4 WT18, WT32 WT38, WT42
Possible
3 WT23 WT11, WT29 WT21
Unlikely
2
WT2, WT5, WT8, WT14,
WT28, WT30, WT31, WT35,
WT36, WT40
WT1, WT4, WT6, WT7, WT9,
WT10, WT13, WT15, WT19,
WT22, WT34
WT3, WT12
Very
Unlikely
1WT17, WT25, WT26, WT27,
WT37, WT41, WT43
WT16, WT20, WT24, WT33,
WT39, WT44
1 2 3 4 5
Very Low Minor Moderate Major Critical
Likelih
ood
Consequence
Risk Classification

Risk Matrix ‐ Water Conveyance (W) (2018‐01)Alm
ost Certain
5
Likely
4 W10
Possible
3 W11 W22, W23, W24
Unlikely
2 W29, W30W5, W6, W14, W27, W33,
W36, W37
Very
Unlikely
1 W3, W4, W15, W17W1, W2, W7, W8, W16, W18,
W19, W20, W32W9, W13, W21, W28, W31 W12
1 2 3 4 5
Very Low Minor Moderate Major Critical
Likelih
ood
Consequence
Risk Classification
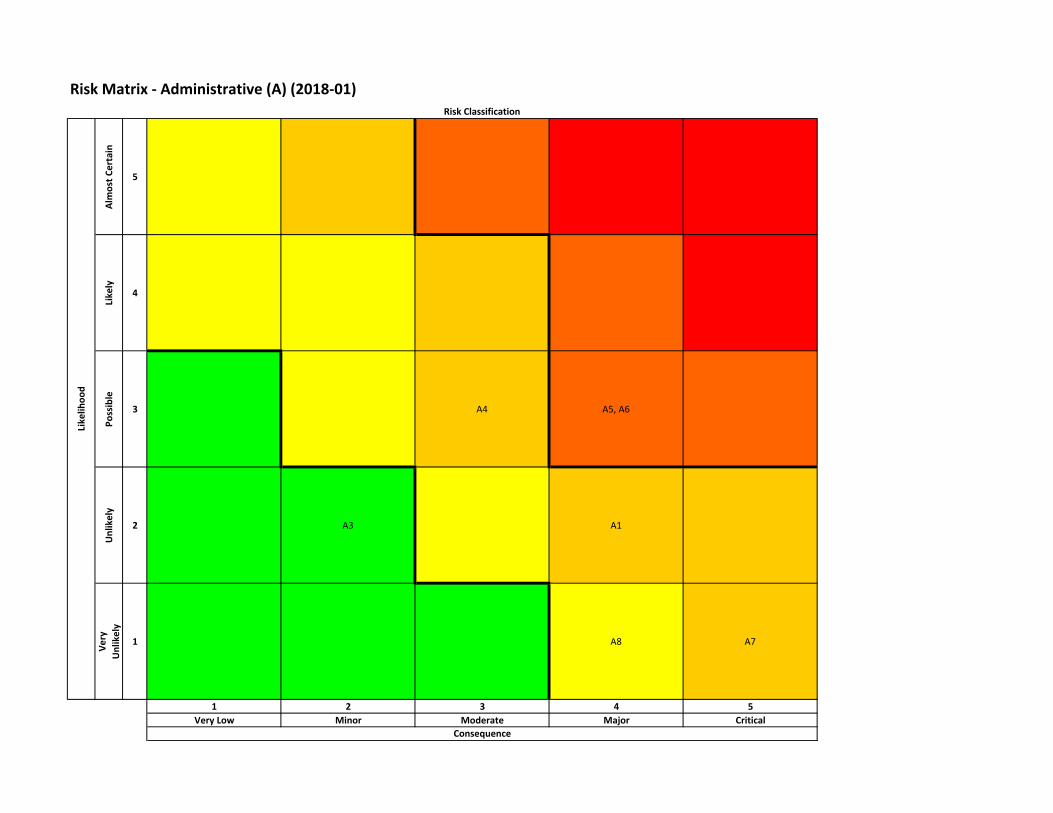
Risk Matrix ‐ Administrative (A) (2018‐01)Alm
ost Certain
5
Likely
4
Possible
3 A4 A5, A6
Unlikely
2 A3 A1
Very
Unlikely
1 A8 A7
1 2 3 4 5
Very Low Minor Moderate Major Critical
Consequence
Likelih
ood
Risk Classification
MIN‐16‐03‐_008_MINTO MINE CLOSURE FMEA 2017 FINAL REPORT_REVA_180123.DOCX
Summary of Risks Not Re‐Evaluated in 2017 FMEA
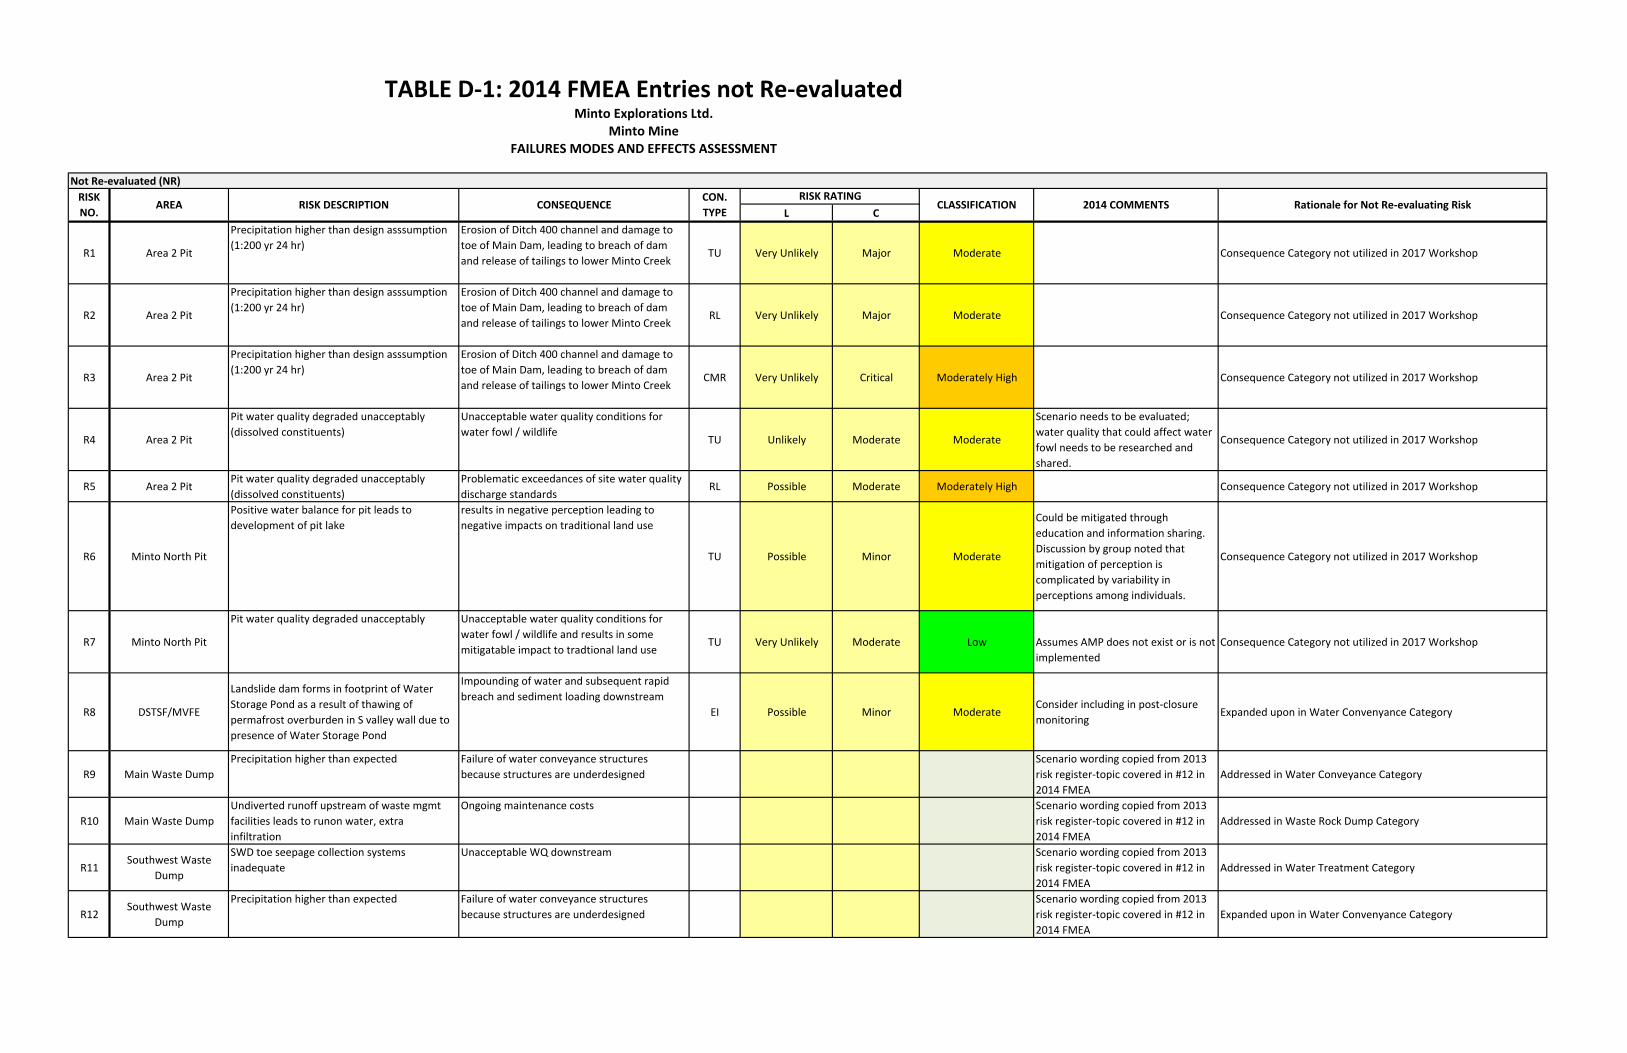
Not Re‐evaluated (NR)
L C
R1 Area 2 Pit
Precipitation higher than design asssumption
(1:200 yr 24 hr)
Erosion of Ditch 400 channel and damage to
toe of Main Dam, leading to breach of dam
and release of tailings to lower Minto CreekTU Very Unlikely Major Moderate Consequence Category not utilized in 2017 Workshop
R2 Area 2 Pit
Precipitation higher than design asssumption
(1:200 yr 24 hr)
Erosion of Ditch 400 channel and damage to
toe of Main Dam, leading to breach of dam
and release of tailings to lower Minto CreekRL Very Unlikely Major Moderate Consequence Category not utilized in 2017 Workshop
R3 Area 2 Pit
Precipitation higher than design asssumption
(1:200 yr 24 hr)
Erosion of Ditch 400 channel and damage to
toe of Main Dam, leading to breach of dam
and release of tailings to lower Minto CreekCMR Very Unlikely Critical Moderately High Consequence Category not utilized in 2017 Workshop
R4 Area 2 Pit
Pit water quality degraded unacceptably
(dissolved constituents)
Unacceptable water quality conditions for
water fowl / wildlifeTU Unlikely Moderate Moderate
Scenario needs to be evaluated;
water quality that could affect water
fowl needs to be researched and
shared.
Consequence Category not utilized in 2017 Workshop
R5 Area 2 PitPit water quality degraded unacceptably
(dissolved constituents)
Problematic exceedances of site water quality
discharge standardsRL Possible Moderate Moderately High Consequence Category not utilized in 2017 Workshop
R6 Minto North Pit
Positive water balance for pit leads to
development of pit lake
results in negative perception leading to
negative impacts on traditional land use
TU Possible Minor Moderate
Could be mitigated through
education and information sharing.
Discussion by group noted that
mitigation of perception is
complicated by variability in
perceptions among individuals.
Consequence Category not utilized in 2017 Workshop
R7 Minto North Pit
Pit water quality degraded unacceptably Unacceptable water quality conditions for
water fowl / wildlife and results in some
mitigatable impact to tradtional land useTU Very Unlikely Moderate Low Assumes AMP does not exist or is not
implemented
Consequence Category not utilized in 2017 Workshop
R8 DSTSF/MVFE
Landslide dam forms in footprint of Water
Storage Pond as a result of thawing of
permafrost overburden in S valley wall due to
presence of Water Storage Pond
Impounding of water and subsequent rapid
breach and sediment loading downstream
EI Possible Minor ModerateConsider including in post‐closure
monitoringExpanded upon in Water Convenyance Category
R9 Main Waste Dump
Precipitation higher than expected Failure of water conveyance structures
because structures are underdesigned
Scenario wording copied from 2013
risk register‐topic covered in #12 in
2014 FMEA
Addressed in Water Conveyance Category
R10 Main Waste Dump
Undiverted runoff upstream of waste mgmt
facilities leads to runon water, extra
infiltration
Ongoing maintenance costs Scenario wording copied from 2013
risk register‐topic covered in #12 in
2014 FMEA
Addressed in Waste Rock Dump Category
R11Southwest Waste
Dump
SWD toe seepage collection systems
inadequate
Unacceptable WQ downstream Scenario wording copied from 2013
risk register‐topic covered in #12 in
2014 FMEA
Addressed in Water Treatment Category
R12Southwest Waste
Dump
Precipitation higher than expected Failure of water conveyance structures
because structures are underdesigned
Scenario wording copied from 2013
risk register‐topic covered in #12 in
2014 FMEA
Expanded upon in Water Convenyance Category
RISK RATINGCLASSIFICATION 2014 COMMENTS Rationale for Not Re‐evaluating Risk
TABLE D‐1: 2014 FMEA Entries not Re‐evaluatedMinto Explorations Ltd.
Minto MineFAILURES MODES AND EFFECTS ASSESSMENT
RISK
NO.AREA RISK DESCRIPTION CONSEQUENCE
CON.
TYPE
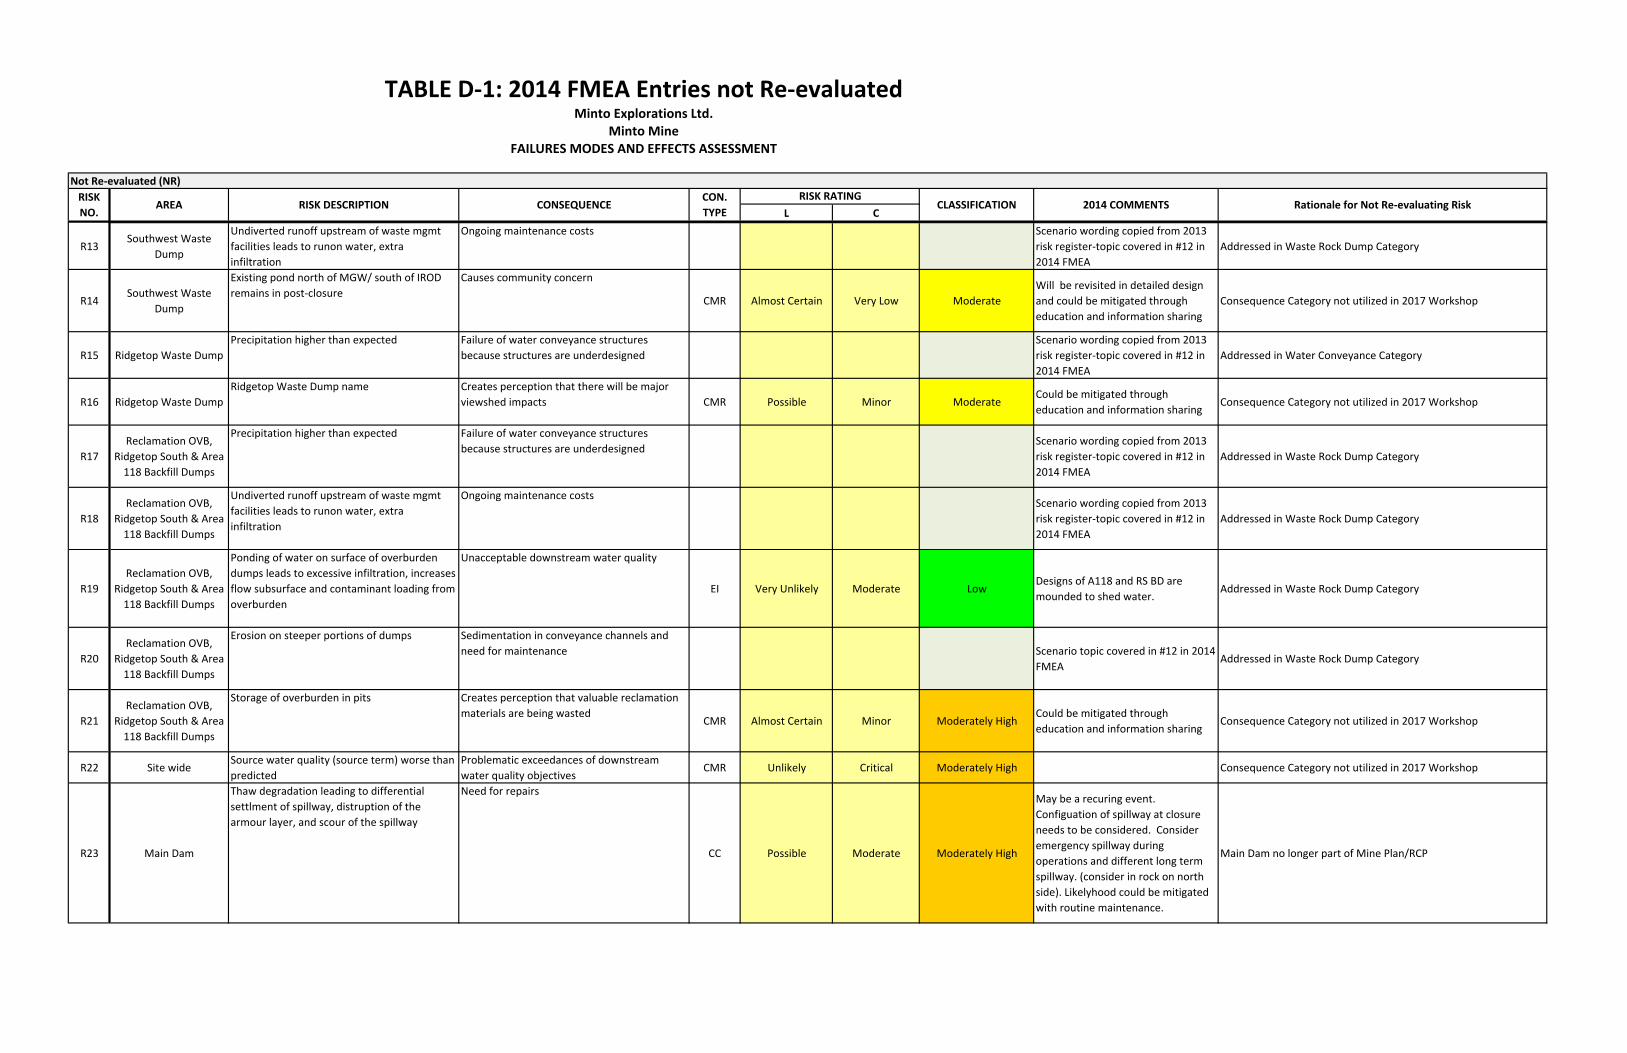
Not Re‐evaluated (NR)
L C
RISK RATINGCLASSIFICATION 2014 COMMENTS Rationale for Not Re‐evaluating Risk
TABLE D‐1: 2014 FMEA Entries not Re‐evaluatedMinto Explorations Ltd.
Minto MineFAILURES MODES AND EFFECTS ASSESSMENT
RISK
NO.AREA RISK DESCRIPTION CONSEQUENCE
CON.
TYPE
R13Southwest Waste
Dump
Undiverted runoff upstream of waste mgmt
facilities leads to runon water, extra
infiltration
Ongoing maintenance costs Scenario wording copied from 2013
risk register‐topic covered in #12 in
2014 FMEA
Addressed in Waste Rock Dump Category
R14Southwest Waste
Dump
Existing pond north of MGW/ south of IROD
remains in post‐closure
Causes community concern
CMR Almost Certain Very Low Moderate
Will be revisited in detailed design
and could be mitigated through
education and information sharing
Consequence Category not utilized in 2017 Workshop
R15 Ridgetop Waste Dump
Precipitation higher than expected Failure of water conveyance structures
because structures are underdesigned
Scenario wording copied from 2013
risk register‐topic covered in #12 in
2014 FMEA
Addressed in Water Conveyance Category
R16 Ridgetop Waste Dump
Ridgetop Waste Dump name Creates perception that there will be major
viewshed impacts CMR Possible Minor ModerateCould be mitigated through
education and information sharingConsequence Category not utilized in 2017 Workshop
R17
Reclamation OVB,
Ridgetop South & Area
118 Backfill Dumps
Precipitation higher than expected Failure of water conveyance structures
because structures are underdesigned Scenario wording copied from 2013
risk register‐topic covered in #12 in
2014 FMEA
Addressed in Waste Rock Dump Category
R18
Reclamation OVB,
Ridgetop South & Area
118 Backfill Dumps
Undiverted runoff upstream of waste mgmt
facilities leads to runon water, extra
infiltration
Ongoing maintenance costsScenario wording copied from 2013
risk register‐topic covered in #12 in
2014 FMEA
Addressed in Waste Rock Dump Category
R19
Reclamation OVB,
Ridgetop South & Area
118 Backfill Dumps
Ponding of water on surface of overburden
dumps leads to excessive infiltration, increases
flow subsurface and contaminant loading from
overburden
Unacceptable downstream water quality
EI Very Unlikely Moderate LowDesigns of A118 and RS BD are
mounded to shed water.Addressed in Waste Rock Dump Category
R20
Reclamation OVB,
Ridgetop South & Area
118 Backfill Dumps
Erosion on steeper portions of dumps Sedimentation in conveyance channels and
need for maintenance Scenario topic covered in #12 in 2014
FMEAAddressed in Waste Rock Dump Category
R21
Reclamation OVB,
Ridgetop South & Area
118 Backfill Dumps
Storage of overburden in pits Creates perception that valuable reclamation
materials are being wastedCMR Almost Certain Minor Moderately High
Could be mitigated through
education and information sharingConsequence Category not utilized in 2017 Workshop
R22 Site wideSource water quality (source term) worse than
predicted
Problematic exceedances of downstream
water quality objectivesCMR Unlikely Critical Moderately High Consequence Category not utilized in 2017 Workshop
R23 Main Dam
Thaw degradation leading to differential
settlment of spillway, distruption of the
armour layer, and scour of the spillway
Need for repairs
CC Possible Moderate Moderately High
May be a recuring event.
Configuation of spillway at closure
needs to be considered. Consider
emergency spillway during
operations and different long term
spillway. (consider in rock on north
side). Likelyhood could be mitigated
with routine maintenance.
Main Dam no longer part of Mine Plan/RCP
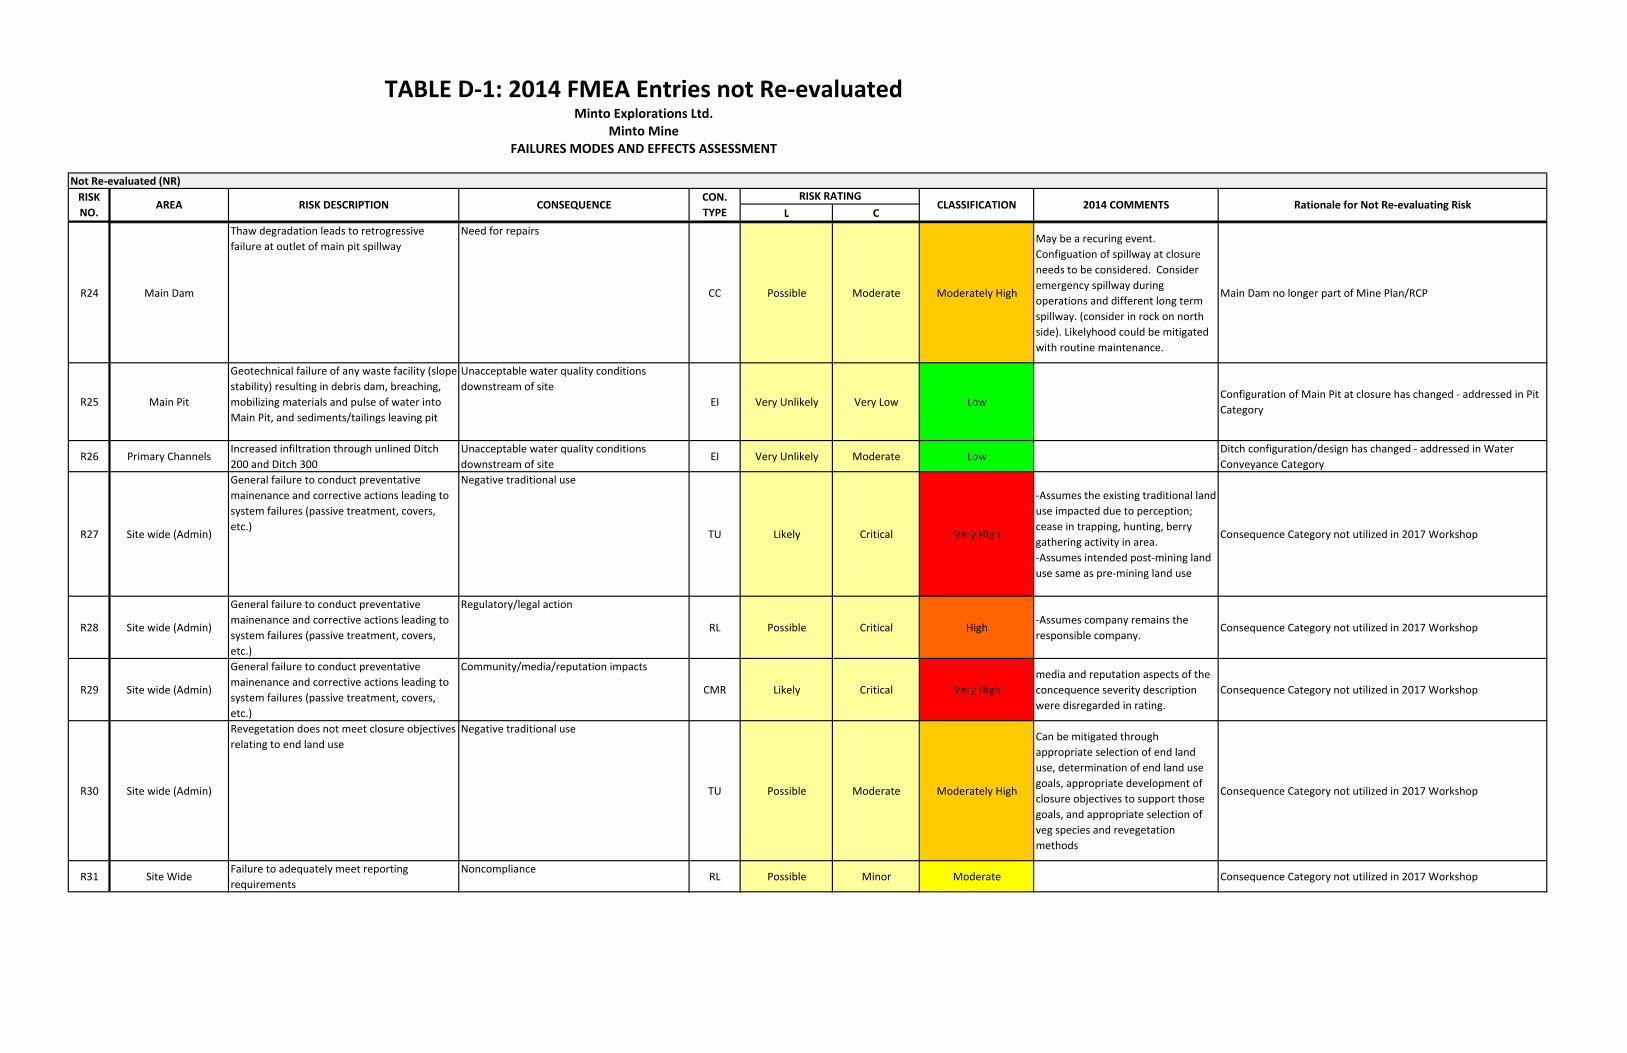
Not Re‐evaluated (NR)
L C
RISK RATINGCLASSIFICATION 2014 COMMENTS Rationale for Not Re‐evaluating Risk
TABLE D‐1: 2014 FMEA Entries not Re‐evaluatedMinto Explorations Ltd.
Minto MineFAILURES MODES AND EFFECTS ASSESSMENT
RISK
NO.AREA RISK DESCRIPTION CONSEQUENCE
CON.
TYPE
R24 Main Dam
Thaw degradation leads to retrogressive
failure at outlet of main pit spillway
Need for repairs
CC Possible Moderate Moderately High
May be a recuring event.
Configuation of spillway at closure
needs to be considered. Consider
emergency spillway during
operations and different long term
spillway. (consider in rock on north
side). Likelyhood could be mitigated
with routine maintenance.
Main Dam no longer part of Mine Plan/RCP
R25 Main Pit
Geotechnical failure of any waste facility (slope
stability) resulting in debris dam, breaching,
mobilizing materials and pulse of water into
Main Pit, and sediments/tailings leaving pit
Unacceptable water quality conditions
downstream of site
EI Very Unlikely Very Low LowConfiguration of Main Pit at closure has changed ‐ addressed in Pit
Category
R26 Primary ChannelsIncreased infiltration through unlined Ditch
200 and Ditch 300
Unacceptable water quality conditions
downstream of siteEI Very Unlikely Moderate Low
Ditch configuration/design has changed ‐ addressed in Water
Conveyance Category
R27 Site wide (Admin)
General failure to conduct preventative
mainenance and corrective actions leading to
system failures (passive treatment, covers,
etc.)
Negative traditional use
TU Likely Critical Very High
‐Assumes the existing traditional land
use impacted due to perception;
cease in trapping, hunting, berry
gathering activity in area.
‐Assumes intended post‐mining land
use same as pre‐mining land use
Consequence Category not utilized in 2017 Workshop
R28 Site wide (Admin)
General failure to conduct preventative
mainenance and corrective actions leading to
system failures (passive treatment, covers,
etc.)
Regulatory/legal action
RL Possible Critical High‐Assumes company remains the
responsible company. Consequence Category not utilized in 2017 Workshop
R29 Site wide (Admin)
General failure to conduct preventative
mainenance and corrective actions leading to
system failures (passive treatment, covers,
etc.)
Community/media/reputation impacts
CMR Likely Critical Very High
media and reputation aspects of the
concequence severity description
were disregarded in rating.
Consequence Category not utilized in 2017 Workshop
R30 Site wide (Admin)
Revegetation does not meet closure objectives
relating to end land use
Negative traditional use
TU Possible Moderate Moderately High
Can be mitigated through
appropriate selection of end land
use, determination of end land use
goals, appropriate development of
closure objectives to support those
goals, and appropriate selection of
veg species and revegetation
methods
Consequence Category not utilized in 2017 Workshop
R31 Site WideFailure to adequately meet reporting
requirements
Noncompliance RL Possible Minor Moderate Consequence Category not utilized in 2017 Workshop
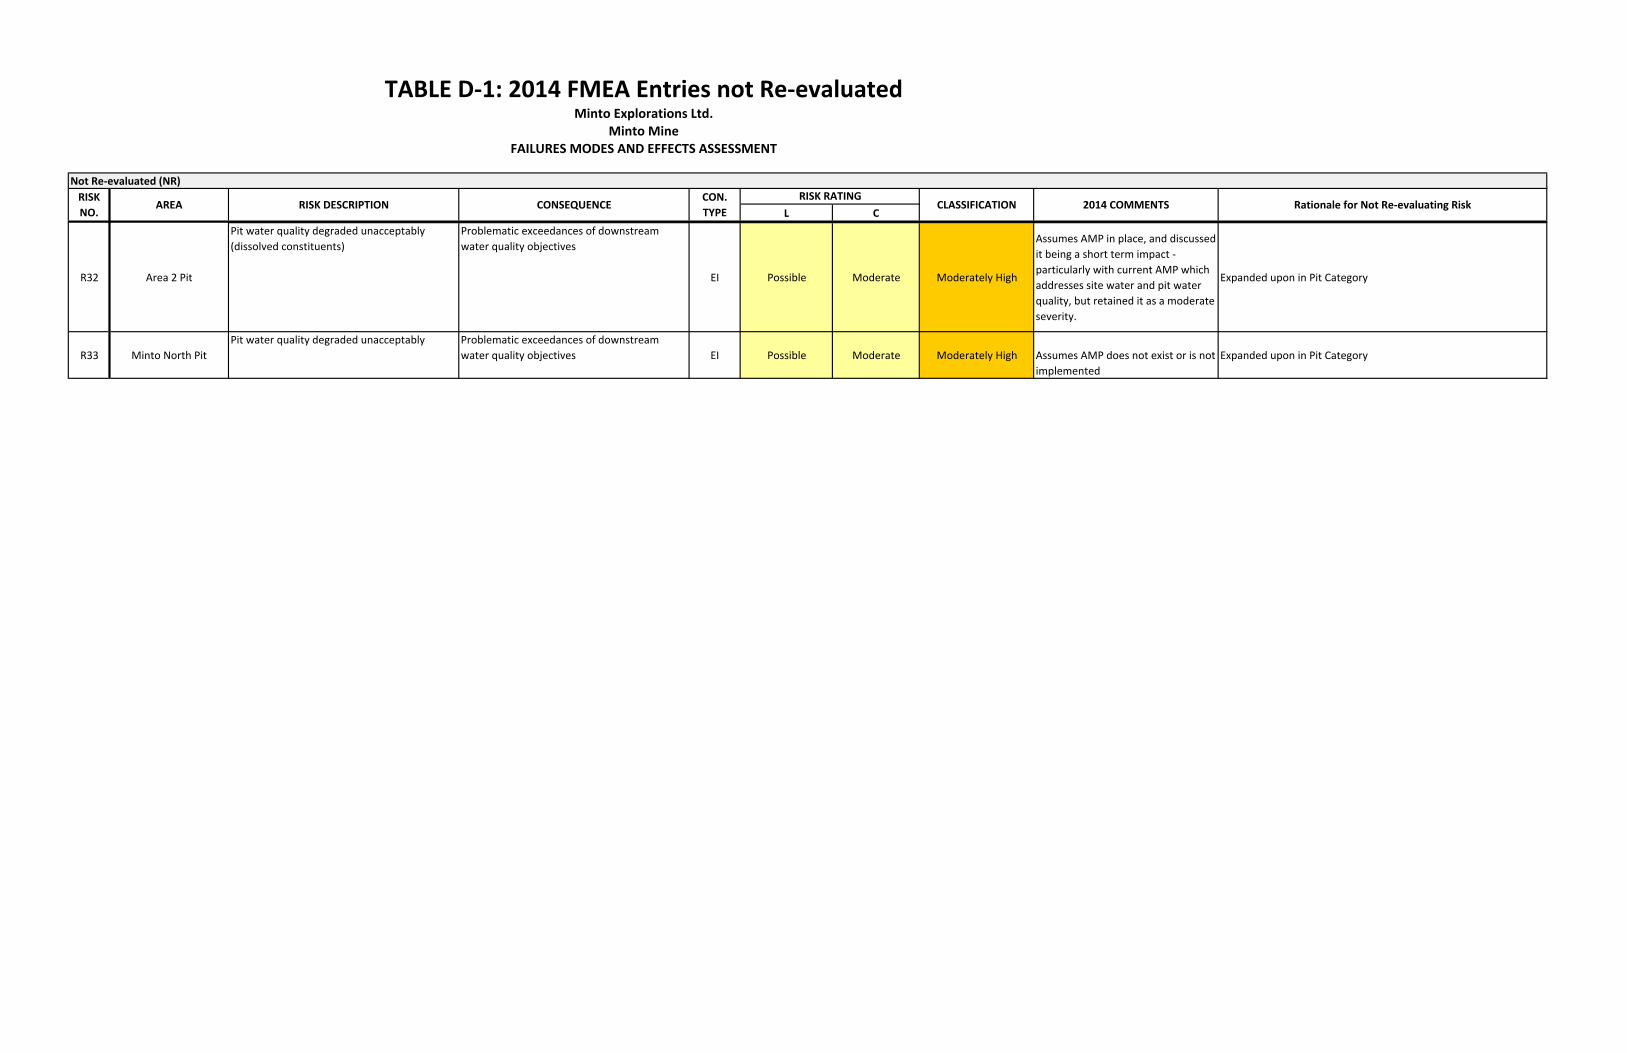
Not Re‐evaluated (NR)
L C
RISK RATINGCLASSIFICATION 2014 COMMENTS Rationale for Not Re‐evaluating Risk
TABLE D‐1: 2014 FMEA Entries not Re‐evaluatedMinto Explorations Ltd.
Minto MineFAILURES MODES AND EFFECTS ASSESSMENT
RISK
NO.AREA RISK DESCRIPTION CONSEQUENCE
CON.
TYPE
R32 Area 2 Pit
Pit water quality degraded unacceptably
(dissolved constituents)
Problematic exceedances of downstream
water quality objectives
EI Possible Moderate Moderately High
Assumes AMP in place, and discussed
it being a short term impact ‐
particularly with current AMP which
addresses site water and pit water
quality, but retained it as a moderate
severity.
Expanded upon in Pit Category
R33 Minto North Pit
Pit water quality degraded unacceptably Problematic exceedances of downstream
water quality objectives EI Possible Moderate Moderately High Assumes AMP does not exist or is not
implemented
Expanded upon in Pit Category