minutes of march 12, 2014 at littleton/englewood wwtpcwwuc.org/minutes/2014/mar.pdfmarch 12, 2014 ....
TRANSCRIPT
1
Minutes of
March 12, 2014 at Littleton/Englewood WWTP
In Attendance:
Martha Rudolph CDPHE Dick Parachini WQCD Michael Beck WQCD Jim Dorsch Metro Al Baker CWSD Donna Davis WQCD Bobby Anastasov Aurora Water Nancy Keller (via phone) City of Pueblo Dennis Stowe L/E WWTP Colleen Young Greeley Water & Sewer Mary Gardner L/E WWTP Richard Leger Aurora Water Dan DeLaughter BHCCSD/Leonard Rice Engineers Dave Meyer Westminster Bill Veydovec HMM Shelley Stanley Northglenn Jim Kendrick (via phone) Monument Sanitation District Martha Hahn PCWRA Ginny Johnson (via phone) Colorado Springs Utilities Tad Foster Tad Foster Law Firm Mike Bittner Silverthorne/Dillon Julie Tinetti L/E WWTP Jim Edwards Eagle River Water & Sanitation District Paul Ferraro CWWUC
I. State Environmental Program, Legislative Overview, Martha Rudolph (CDPHE)
• Martha thanked the Council and was very pleased that over 50 WQCD staff visited water and wastewater treatment plants. She said that it is good for the staff. Paul mentioned the new Council program, Building Relationships, and Martha said that she saw it on the Council’s websites. She would like a tour of the L/E WWTP.
• Legislation
o SB 14-134 was introduced but pulled since it did not give any of those affected a full opportunity to study the full implication of the legislation. The Department and the Division will conduct a stakeholder process between now and the Fall when the Division reports back to the Legislature recommending how the funding of the Division should be handled. Presently, the fees for funding the Division are in legislation. SB 14-134 was to allow the WQCC to set the fees and remove them from legislation. Three years ago a new JBC analyst recommended that the WQCC set the wastewater fees for the Division staff. Finally, the JBC approved the concept in 2014 as SB 14-134. Tad Foster
2
recommended that a credible process is needed. The first stakeholders’ meeting will be by the end of March.
o HB 14-1002 – Water Infrastructure Natural Disaster Grant Fund. The Bill provides $12 million for facilities (water and wastewater) damaged in the flood and wild fires. The Division supports the Bill. Funds not spent by 9/1/2015 will go to the Nutrient Fund.
o Simple Project. Martha mentioned that the Department is working on putting online records, permits, bill paying, etc. Someone will have to pay for building the online system. The CDPHE is presenting working on it and then they will develop a pilot project to insure it works. Martha will attend a fall Council meeting to update the Council.
II. Funding: State Revolving Fund, Donna Davis and Michael Beck (CWQCD) Highlights of their presentation are:
• Flood damage to water and wastewater treatment plants is estimated at $170 million.
• For every dollar of Federal funds, the State needs to match it with $.20. The Water & Power Authority receives the Federal funds and provides the match.
• Staff prepares a 2-year Workplan for the SRF that is approved by the CWQCC and the Water & Power Authority Board.
• Federal funds increase by 5% for 2014 to $1.4 Billion and Colorado’s share is $11.2 million for Clean Water and $15.4 million for Drinking Water. Buy America is back in the program.
• The Water & Power Authority can fund up to $100 million of projects for Clean Water and $70 million for Drinking Water.
• Rulemaking Hearing to approve the Division’s Plan is set for May 12, 2014 for projects damaged in the flood for water and wastewater projects.
• The Legislation for the Natural Disaster Fund will only need funding in future years.
• HB 14-1002 passed the House and is going to the Senate.
III. Nitrogen Removal 1.0 to 3.0: Sidestream and Mainstream, Charles Bott Charles gave a detailed and technical presentation on nitrogen removal which is attached.
IV. Updates
• Sediment Workgroup: Nancy updated the Council regarding activities of the workgroup. She is recommending that the Council continue funding GEI’s work with an additional $5,000 to cover 3 more workgroup meetings in the next month. The Council has funded $4,510 for workgroup meetings that needed GEI’s technical review.
Jim Kendrick moved, seconded by Richard Leger, that the Council provides $5,000 in support for the sediment project. Approved.
• NACWA Integrated Planning Workshop is March 31, 2014. Dennis Stowe moved, seconded by Richard Leger, that the Council contributes $300 to NACWA for the Planning Workshop. The motion passed unanimously.
• RM Arsenal Aquatic Life Hearing. Dennis attended the CWQCC hearing regarding the RM Arsenal. The hearing was to classify the lakes on the Arsenal as “Use protected for Aquatic Life.” The US Parks Service presented the proposal. The Division and EPA
3
opposed the recommendation. The Commission did not approve the recommendation from the US Park Service. The vote was 5 against and 4 in favor. Dennis said that this is a strong case against reuse. Denver Water participated in the hearing. Copper level is the issue. The designation remains as “reviewable.” Tad Foster recommenced that the Council send a letter to the Division and Denver Water asking that an antidegradation review be conducted.
• Colorado water Plan. The Colorado Water Plan will be discussed at the Colorado Water Quality Forum next week. Attached are the Council’s comments.
• Colorado Water Utility Council – No report.
• Stormwater – No report. Meeting adjourned at 4:00 pm.
Next meeting:
April 9, 2014 at 1 PM

Transitioning from Nitrogen Removal 1.0 to 3.0 --
Sidestream and Mainstream
Denitrification
NH4+
N2
NO2-
Anammox
Nitrification
NO3-
N-fixation
Charles B. Bott, PhD, PE, BCEE
Hampton Roads Sanitation District

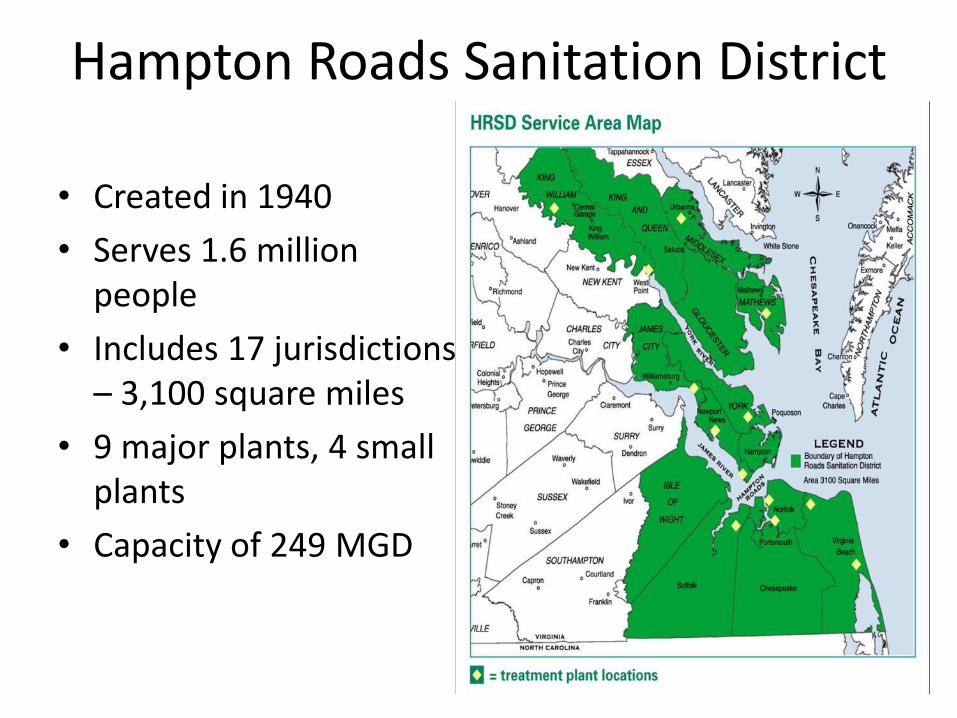
Hampton Roads Sanitation District
• Created in 1940
• Serves 1.6 million people
• Includes 17 jurisdictions – 3,100 square miles
• 9 major plants, 4 small plants
• Capacity of 249 MGD

HRSD’s Bubble Permit - 2011
• James River
– 6,000,000 lbs/yr TN
– 573,247 lbs/yr TP
• York River
– 288,315 lbs/yr TN
– 33,660 lbs/yr TP
• Rappahannock River (one plant)
– 1,218 lbs TN
– 91 lbs/yr TP
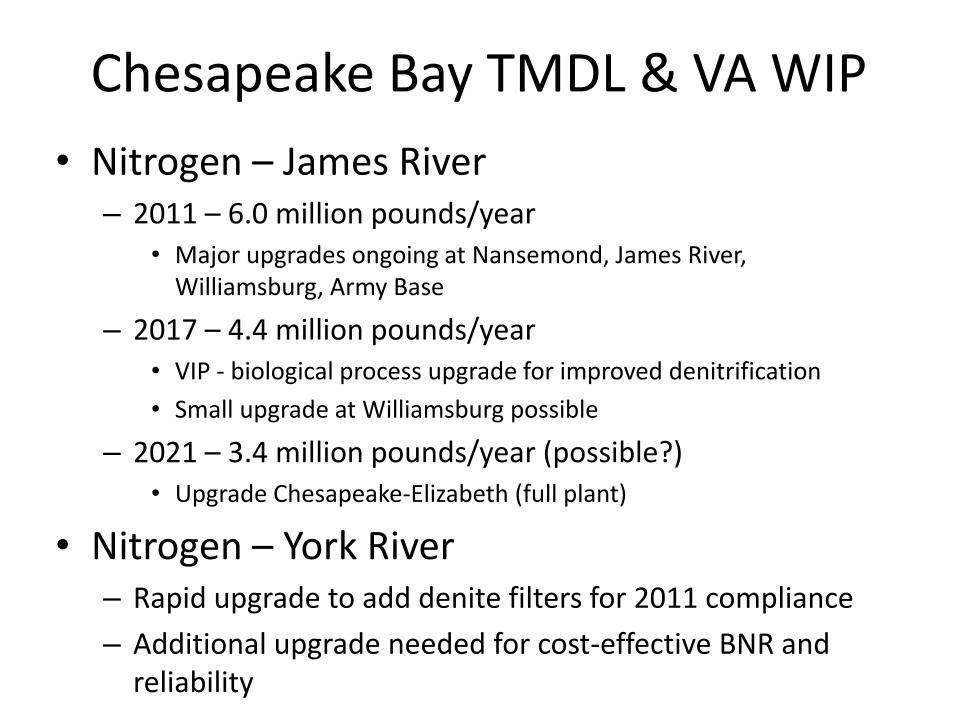
Chesapeake Bay TMDL & VA WIP
• Nitrogen – James River – 2011 – 6.0 million pounds/year
• Major upgrades ongoing at Nansemond, James River, Williamsburg, Army Base
– 2017 – 4.4 million pounds/year • VIP - biological process upgrade for improved denitrification
• Small upgrade at Williamsburg possible
– 2021 – 3.4 million pounds/year (possible?) • Upgrade Chesapeake-Elizabeth (full plant)
• Nitrogen – York River – Rapid upgrade to add denite filters for 2011 compliance
– Additional upgrade needed for cost-effective BNR and reliability
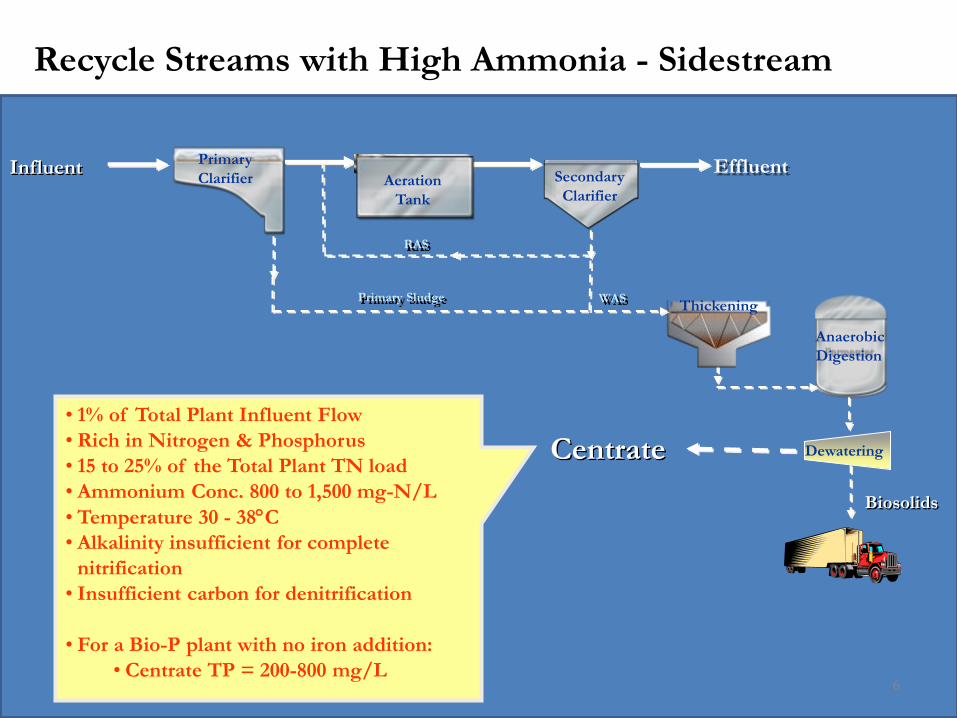
• 1% of Total Plant Influent Flow
• Rich in Nitrogen & Phosphorus
• 15 to 25% of the Total Plant TN load
• Ammonium Conc. 800 to 1,500 mg-N/L
• Temperature 30 - 38C
• Alkalinity insufficient for complete
nitrification
• Insufficient carbon for denitrification
• For a Bio-P plant with no iron addition:
• Centrate TP = 200-800 mg/L
Influent Primary
Clarifier Secondary
Clarifier
Effluent
Centrate
Primary Sludge WAS
Dewatering
Thickening
RAS
Anaerobic
Digestion
Biosolids
Aeration
Tank
Recycle Streams with High Ammonia - Sidestream
6

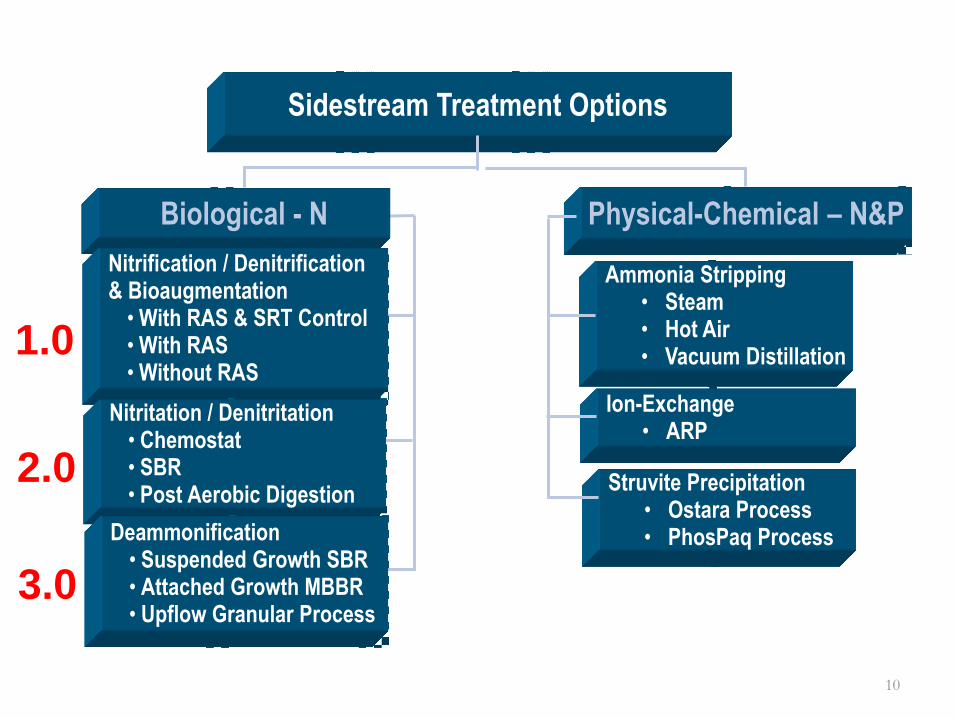
Sidestream Treatment Options
Biological - N Physical-Chemical – N&P
Ion-Exchange • ARP
Struvite Precipitation • Ostara Process • PhosPaq Process
Nitrification / Denitrification & Bioaugmentation
• With RAS & SRT Control • With RAS • Without RAS
Nitritation / Denitritation • Chemostat • SBR • Post Aerobic Digestion
Deammonification • Suspended Growth SBR • Attached Growth MBBR • Upflow Granular Process
Ammonia Stripping • Steam • Hot Air • Vacuum Distillation
7
1.0
2.0
3.0
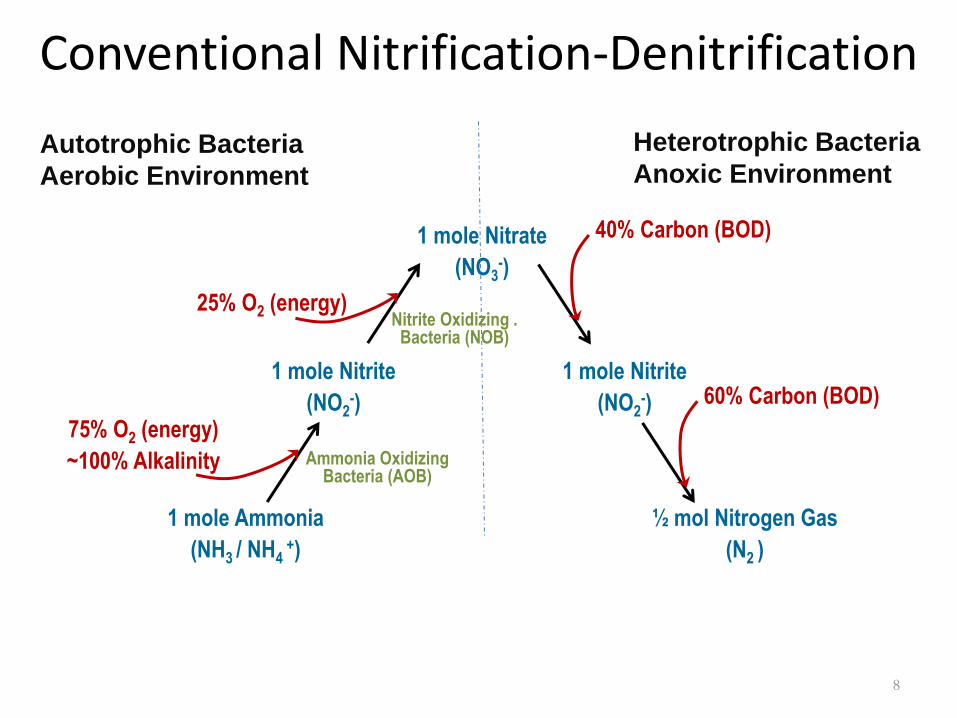
Conventional Nitrification-Denitrification
1 mole Ammonia
(NH3 / NH4 +)
½ mol Nitrogen Gas
(N2 )
1 mole Nitrite
(NO2-)
1 mole Nitrite
(NO2-)
1 mole Nitrate
(NO3-)
Autotrophic Bacteria
Aerobic Environment
Heterotrophic Bacteria
Anoxic Environment
75% O2 (energy)
~100% Alkalinity
25% O2 (energy)
40% Carbon (BOD)
60% Carbon (BOD)
Ammonia Oxidizing Bacteria (AOB)
Nitrite Oxidizing . Bacteria (NOB)
8
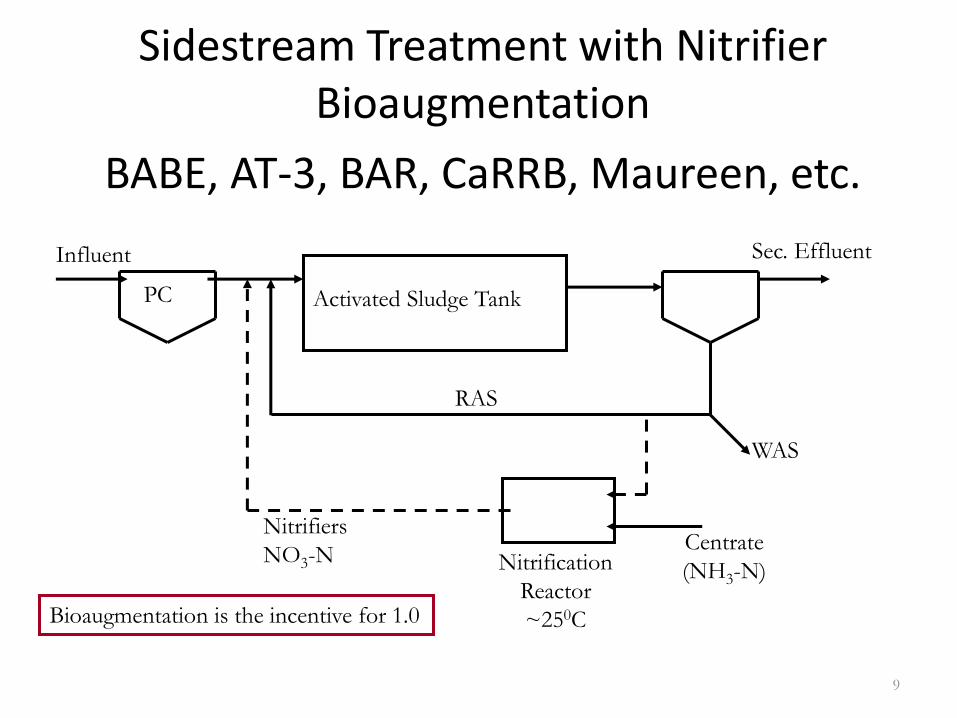
Sidestream Treatment with Nitrifier Bioaugmentation
BABE, AT-3, BAR, CaRRB, Maureen, etc.
PC
Influent Sec. Effluent
Activated Sludge Tank
RAS
WAS
Centrate
(NH3-N) Nitrification
Reactor
~250C
Nitrifiers
NO3-N
Bioaugmentation is the incentive for 1.0
9
Sidestream Treatment Options
Biological - N Physical-Chemical – N&P
Ion-Exchange • ARP
Struvite Precipitation • Ostara Process • PhosPaq Process
Nitrification / Denitrification & Bioaugmentation
• With RAS & SRT Control • With RAS • Without RAS
Nitritation / Denitritation • Chemostat • SBR • Post Aerobic Digestion
Deammonification • Suspended Growth SBR • Attached Growth MBBR • Upflow Granular Process
Ammonia Stripping • Steam • Hot Air • Vacuum Distillation
10
1.0
2.0
3.0
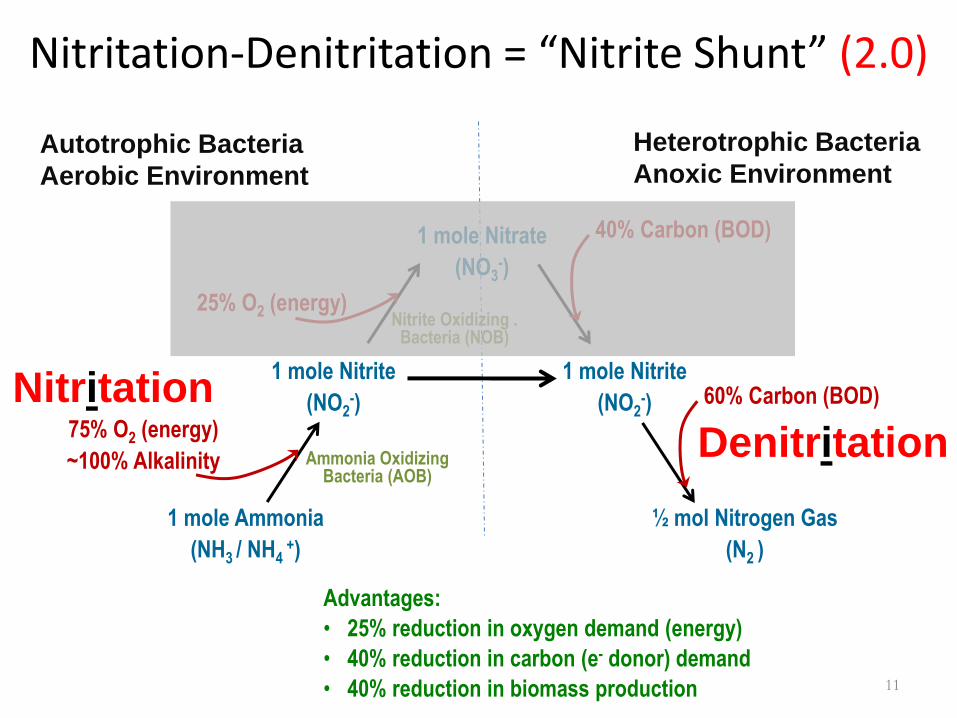
Nitritation-Denitritation = “Nitrite Shunt” (2.0)
1 mole Ammonia
(NH3 / NH4 +)
½ mol Nitrogen Gas
(N2 )
1 mole Nitrite
(NO2-)
1 mole Nitrite
(NO2-)
1 mole Nitrate
(NO3-)
Autotrophic Bacteria
Aerobic Environment
Heterotrophic Bacteria
Anoxic Environment
75% O2 (energy)
~100% Alkalinity
25% O2 (energy)
40% Carbon (BOD)
60% Carbon (BOD)
Ammonia Oxidizing Bacteria (AOB)
Nitrite Oxidizing . Bacteria (NOB)
Advantages:
• 25% reduction in oxygen demand (energy)
• 40% reduction in carbon (e- donor) demand
• 40% reduction in biomass production 11
Nitritation
Denitritation
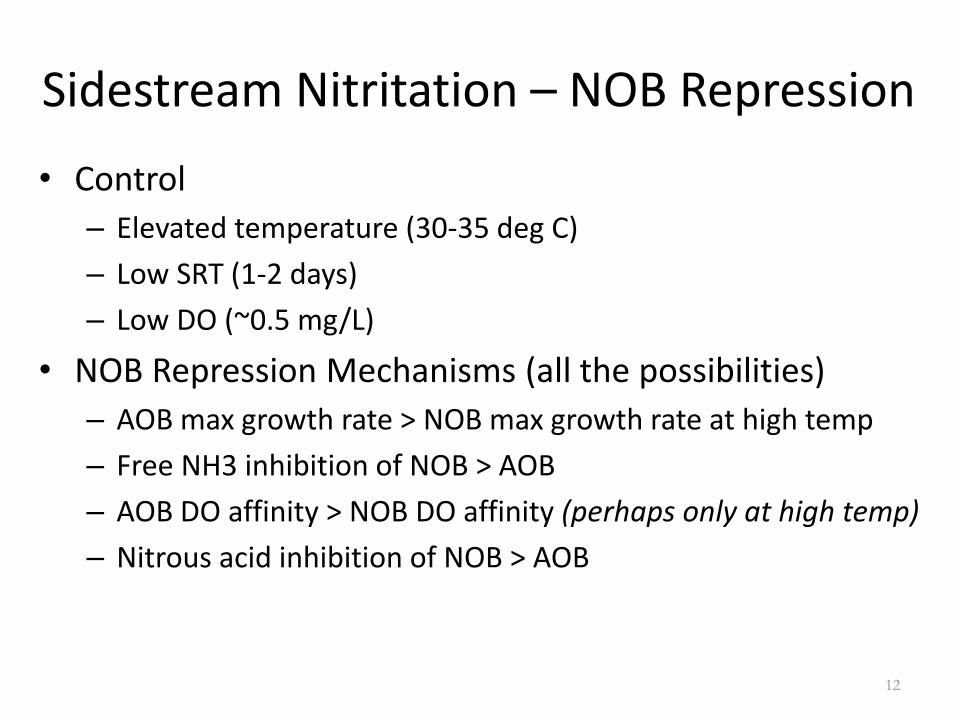
Sidestream Nitritation – NOB Repression
• Control
– Elevated temperature (30-35 deg C)
– Low SRT (1-2 days)
– Low DO (~0.5 mg/L)
• NOB Repression Mechanisms (all the possibilities)
– AOB max growth rate > NOB max growth rate at high temp
– Free NH3 inhibition of NOB > AOB
– AOB DO affinity > NOB DO affinity (perhaps only at high temp)
– Nitrous acid inhibition of NOB > AOB
12
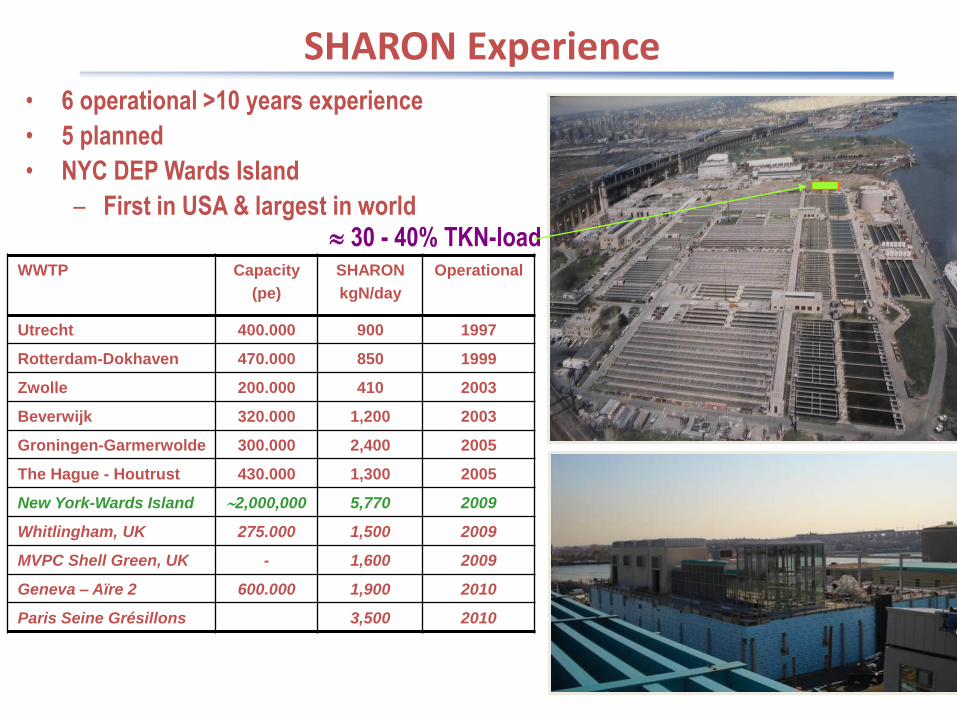
SHARON Experience
WWTP Capacity
(pe)
SHARON
kgN/day
Operational
Utrecht 400.000 900 1997
Rotterdam-Dokhaven 470.000 850 1999
Zwolle 200.000 410 2003
Beverwijk 320.000 1,200 2003
Groningen-Garmerwolde 300.000 2,400 2005
The Hague - Houtrust 430.000 1,300 2005
New York-Wards Island 2,000,000 5,770 2009
Whitlingham, UK 275.000 1,500 2009
MVPC Shell Green, UK - 1,600 2009
Geneva – Aïre 2 600.000 1,900 2010
Paris Seine Grésillons 3,500 2010
• 6 operational >10 years experience
• 5 planned
• NYC DEP Wards Island
– First in USA & largest in world
30 - 40% TKN-load

Sidestream Treatment Options
Biological - N Physical-Chemical – N&P
Ion-Exchange • ARP
Struvite Precipitation • Ostara Process • PhosPaq Process
Nitrification / Denitrification & Bioaugmentation
• With RAS & SRT Control • With RAS • Without RAS
Nitritation / Denitritation • Chemostat • SBR • Post Aerobic Digestion
Deammonification • Suspended Growth SBR • Attached Growth MBBR • Upflow Granular Process
Ammonia Stripping • Steam • Hot Air • Vacuum Distillation
14
1.0
2.0
3.0
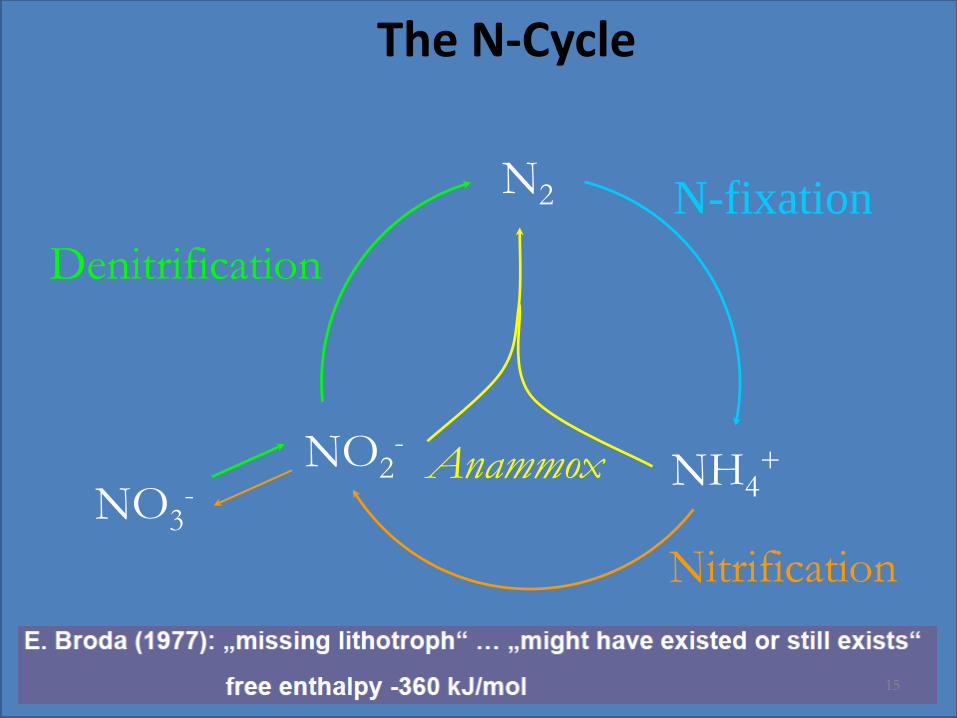
The N-Cycle
Denitrification
NH4+
N2
NO2- Anammox
Nitrification
NO3-
N-fixation
15

Partial Nitritation-Anammox = “Deammonification” (3.0)
1 mole Ammonia
(NH3 / NH4 +)
½ mol Nitrogen Gas (N2 ) +
a little bit of nitrate (NO3-)
0.5 mole Nitrite
(NO2-)
Autotrophic Bacteria
Aerobic Environment
Autotrophic Anoxic
Environment 37% O2 (energy)
~50% Alkalinity Ammonia Oxidizing Bacteria (AOB)
Advantages:
• 63% reduction in oxygen demand (energy)
• Nearly 100% reduction in carbon demand
• 80% reduction in biomass production
• No additional alkalinity required
ANAMMOX “Anaerobic” Ammonia Oxidation - (New Planctomycete - Strous et al, 1999)
NH4+ + 1.32 NO2
- + 0.066 HCO3- + 0.13 H+
0.26 NO3- + 1.02N2 + 0.066 CH2O0.5N0.15 + 2.03 H2O
16
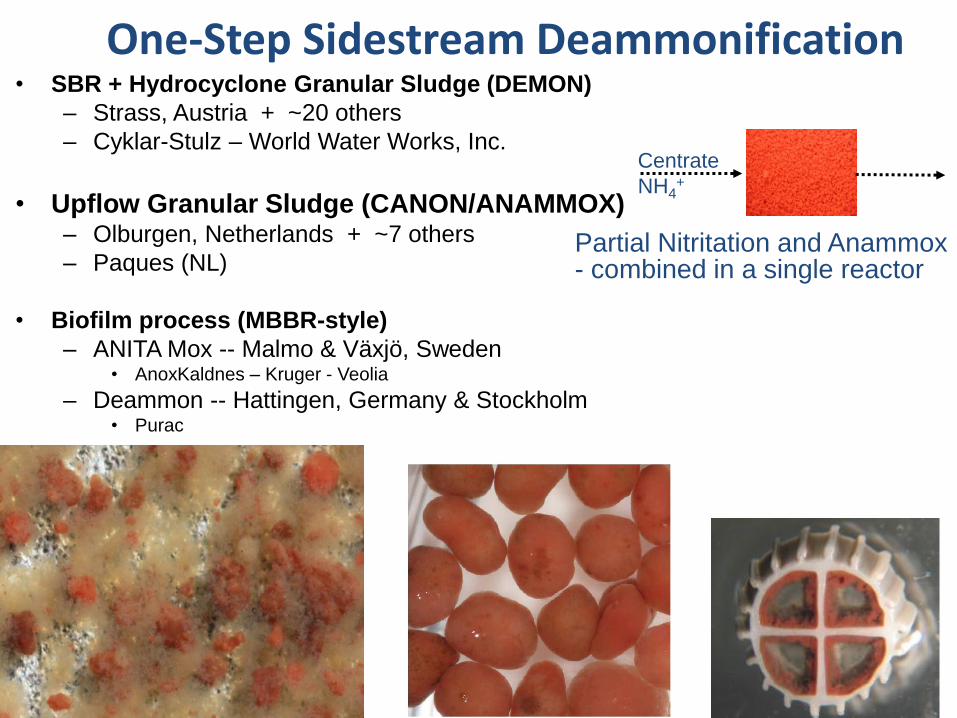
One-Step Sidestream Deammonification • SBR + Hydrocyclone Granular Sludge (DEMON)
– Strass, Austria + ~20 others
– Cyklar-Stulz – World Water Works, Inc.
• Upflow Granular Sludge (CANON/ANAMMOX) – Olburgen, Netherlands + ~7 others
– Paques (NL)
• Biofilm process (MBBR-style)
– ANITA Mox -- Malmo & Växjö, Sweden • AnoxKaldnes – Kruger - Veolia
– Deammon -- Hattingen, Germany & Stockholm • Purac
Centrate
NH4+
17
Partial Nitritation and Anammox - combined in a single reactor
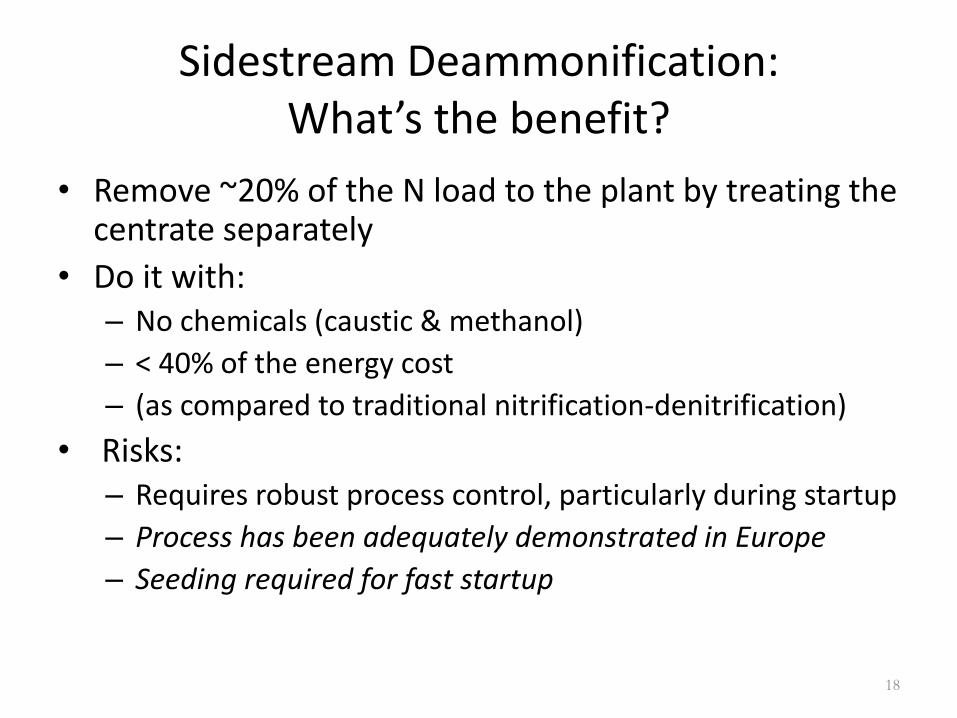
Sidestream Deammonification: What’s the benefit?
• Remove ~20% of the N load to the plant by treating the centrate separately
• Do it with: – No chemicals (caustic & methanol)
– < 40% of the energy cost
– (as compared to traditional nitrification-denitrification)
• Risks: – Requires robust process control, particularly during startup
– Process has been adequately demonstrated in Europe
– Seeding required for fast startup
18
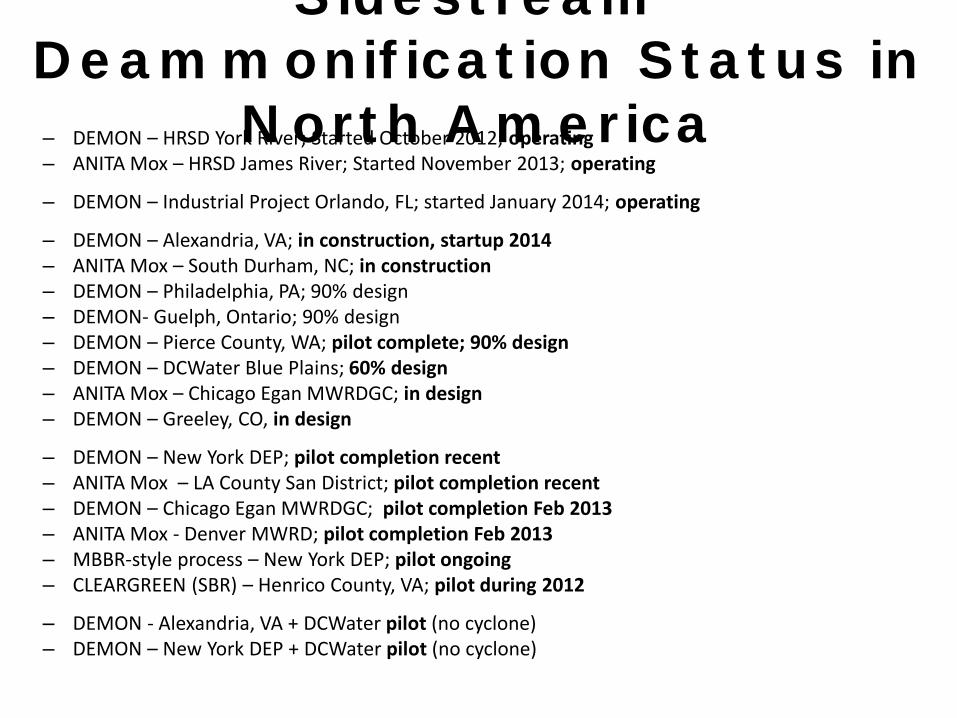
S ide st re a m
D e a m m onif ica t ion S t a t us in
N ort h A m e r ica – DEMON – HRSD York River; Started October 2012; operating – ANITA Mox – HRSD James River; Started November 2013; operating
– DEMON – Industrial Project Orlando, FL; started January 2014; operating
– DEMON – Alexandria, VA; in construction, startup 2014 – ANITA Mox – South Durham, NC; in construction – DEMON – Philadelphia, PA; 90% design – DEMON- Guelph, Ontario; 90% design – DEMON – Pierce County, WA; pilot complete; 90% design – DEMON – DCWater Blue Plains; 60% design – ANITA Mox – Chicago Egan MWRDGC; in design – DEMON – Greeley, CO, in design
– DEMON – New York DEP; pilot completion recent – ANITA Mox – LA County San District; pilot completion recent – DEMON – Chicago Egan MWRDGC; pilot completion Feb 2013 – ANITA Mox - Denver MWRD; pilot completion Feb 2013 – MBBR-style process – New York DEP; pilot ongoing – CLEARGREEN (SBR) – Henrico County, VA; pilot during 2012
– DEMON - Alexandria, VA + DCWater pilot (no cyclone) – DEMON – New York DEP + DCWater pilot (no cyclone)
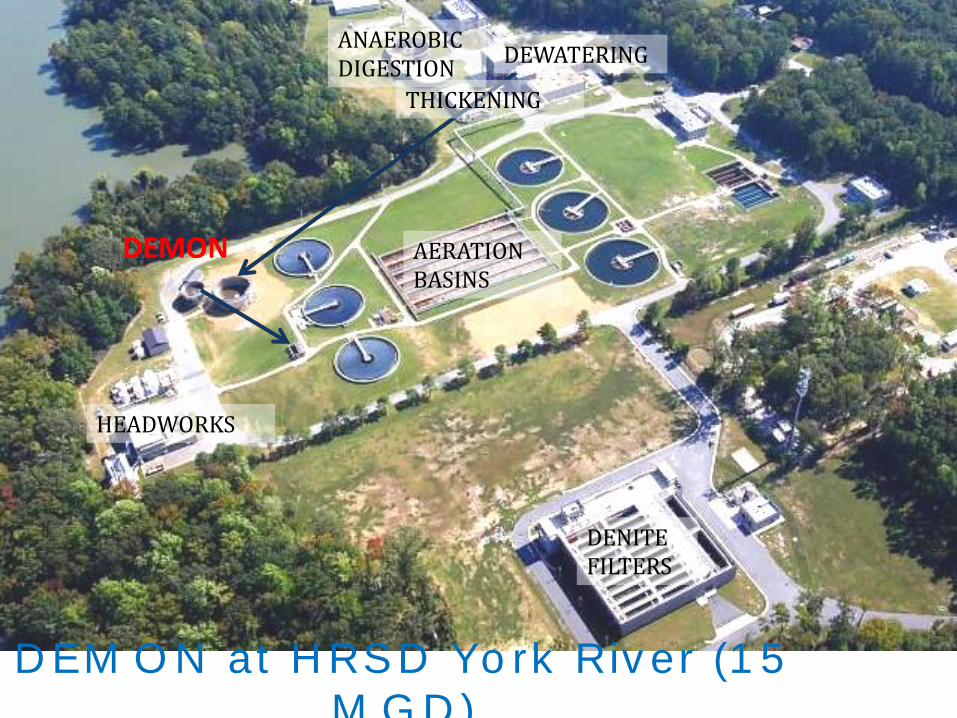
D EM O N at H RS D Yo rk Riv er (1 5
M G D )
DEMON
DENITE FILTERS
HEADWORKS
AERATION BASINS
ANAEROBIC DIGESTION
THICKENING
DEWATERING
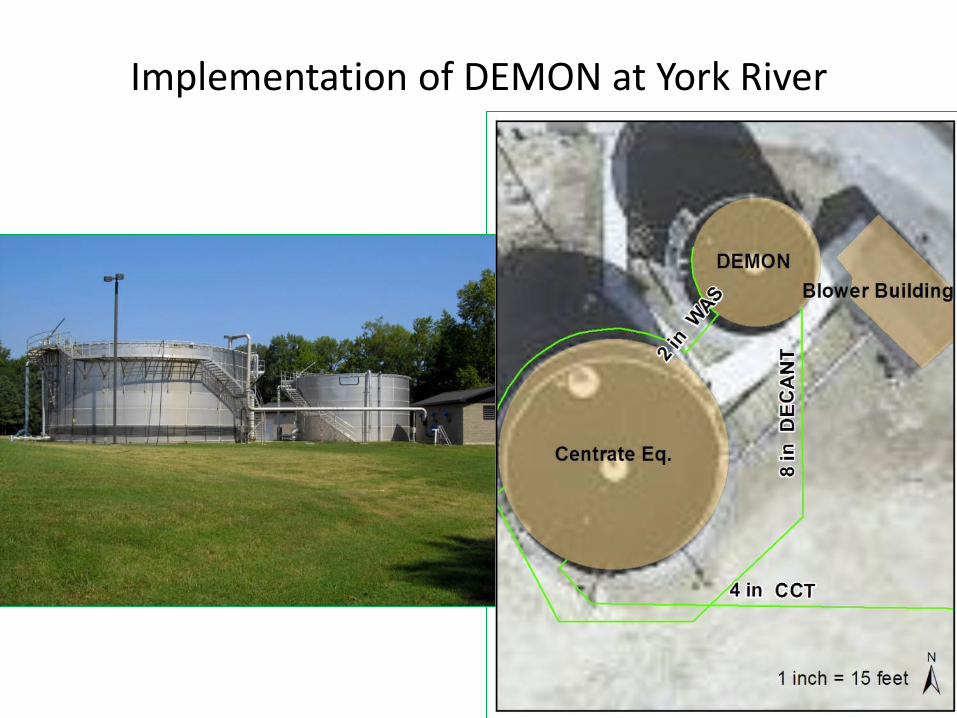
Implementation of DEMON at York River

22

ANITA Mox Process
Media
Anammox
Nitritation
NH4+
NH4+
O2 N2
NO2-
Aerobic
Anoxic
AOB
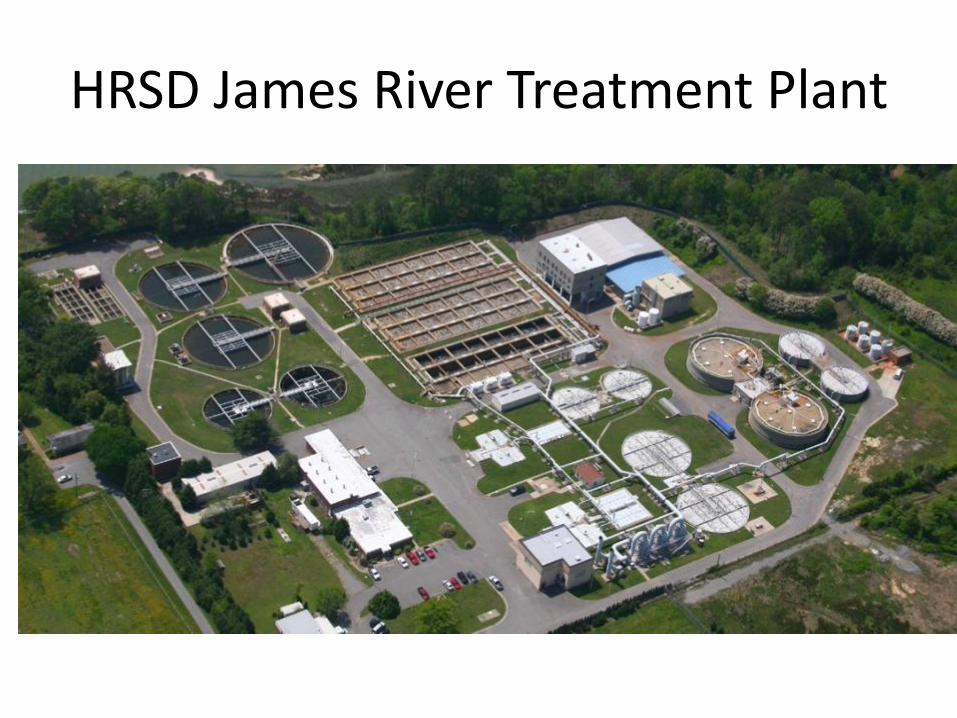
HRSD James River Treatment Plant
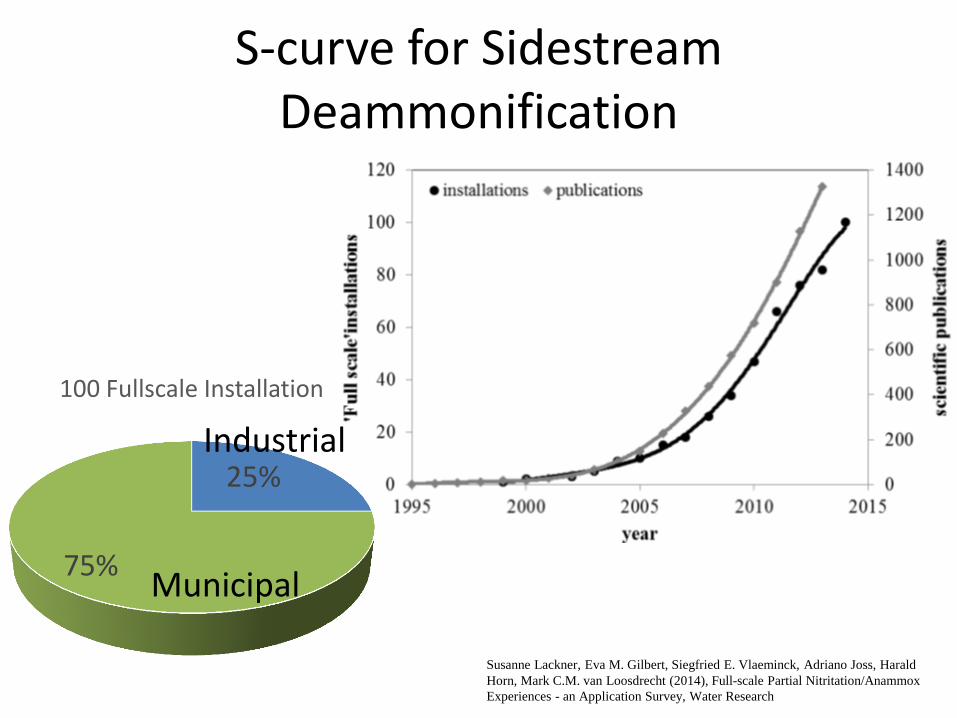
S-curve for Sidestream Deammonification
25%
75%
100 Fullscale Installation
Municipal
Industrial
Susanne Lackner, Eva M. Gilbert, Siegfried E. Vlaeminck, Adriano Joss, Harald
Horn, Mark C.M. van Loosdrecht (2014), Full-scale Partial Nitritation/Anammox
Experiences - an Application Survey, Water Research
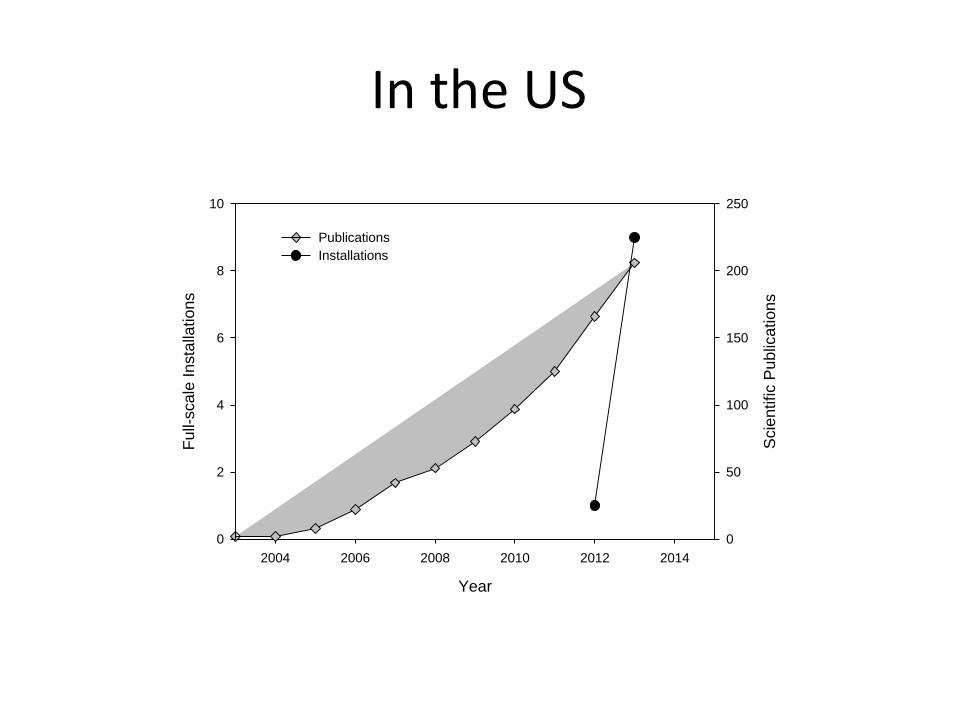
In the US
Year
2004 2006 2008 2010 2012 2014
Scie
ntific P
ub
lica
tio
ns
0
50
100
150
200
250F
ull-
sca
le I
nsta
llatio
ns
0
2
4
6
8
10
Publications
Installations

Short-Cut Nitrogen Removal Processes: Transitioning to Mainstream 2.0 & 3.0
COLLABORATORS
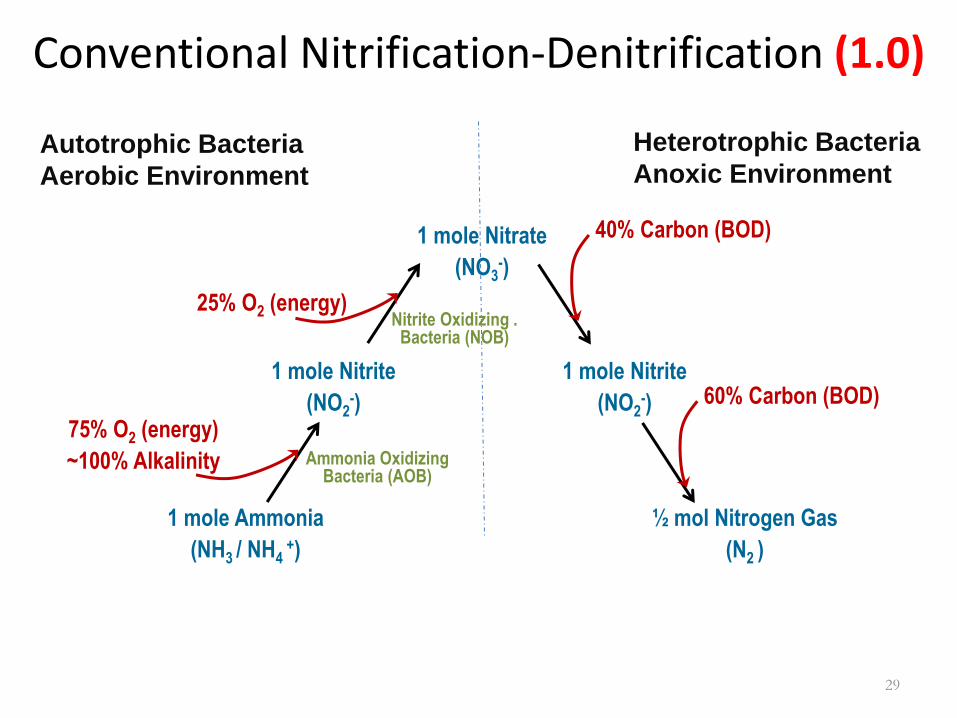
Conventional Nitrification-Denitrification (1.0)
1 mole Ammonia
(NH3 / NH4 +)
½ mol Nitrogen Gas
(N2 )
1 mole Nitrite
(NO2-)
1 mole Nitrite
(NO2-)
1 mole Nitrate
(NO3-)
Autotrophic Bacteria
Aerobic Environment
Heterotrophic Bacteria
Anoxic Environment
75% O2 (energy)
~100% Alkalinity
25% O2 (energy)
40% Carbon (BOD)
60% Carbon (BOD)
Ammonia Oxidizing Bacteria (AOB)
Nitrite Oxidizing . Bacteria (NOB)
29
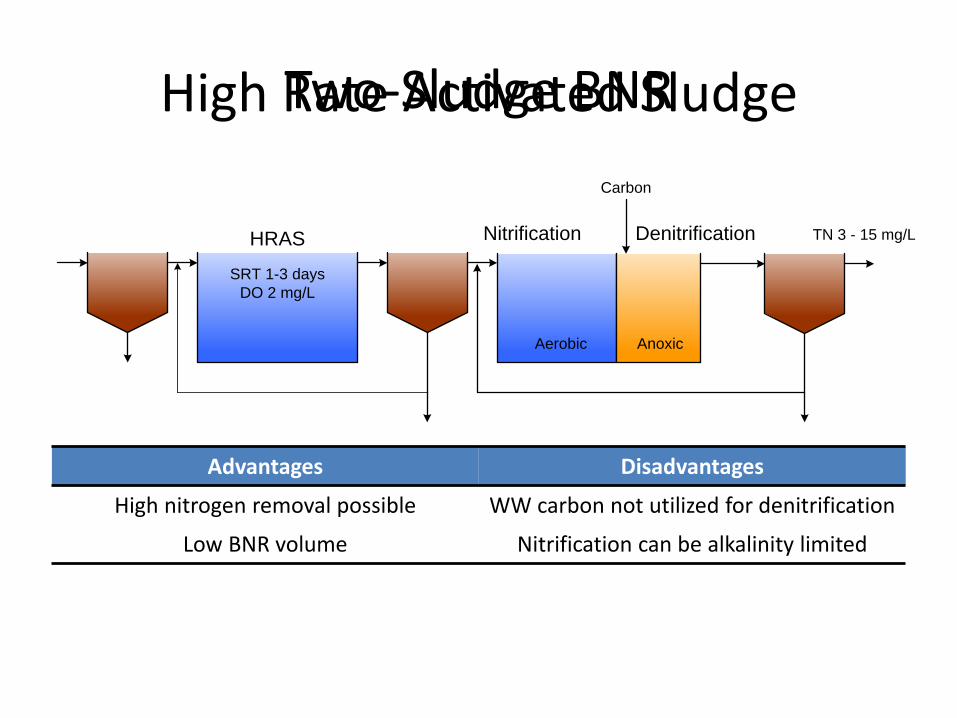
Two-Sludge BNR High Rate Activated Sludge
Advantages Disadvantages
High nitrogen removal possible WW carbon not utilized for denitrification
Low BNR volume Nitrification can be alkalinity limited
SRT 1-3 days
DO 2 mg/L
HRAS
Carbon
Nitrification Denitrification TN 3 - 15 mg/L
AnoxicAerobic
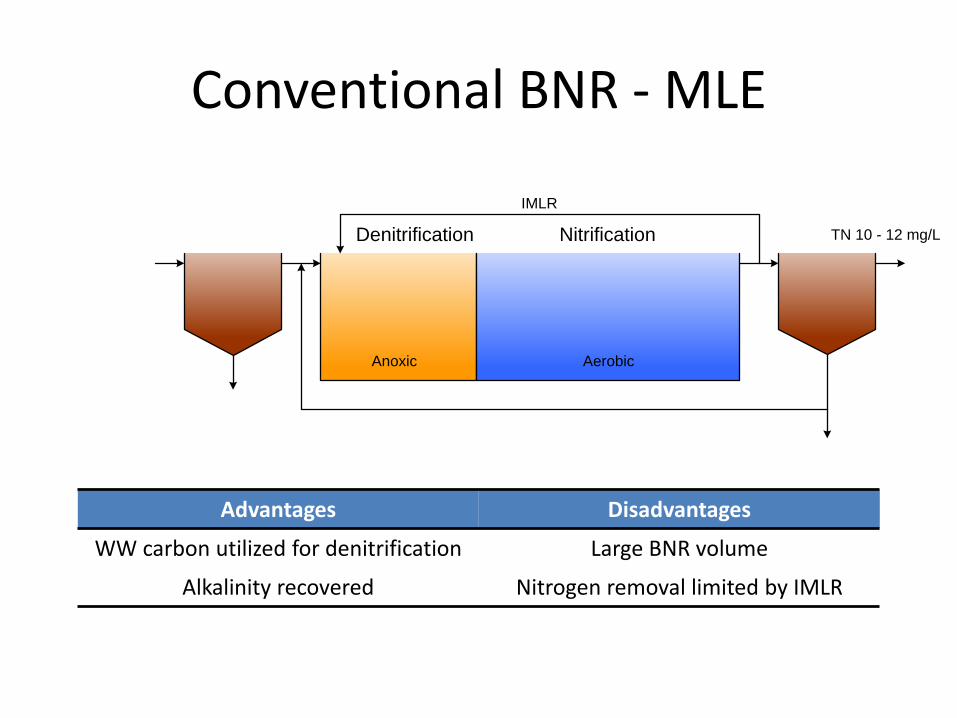
Conventional BNR - MLE
Advantages Disadvantages
WW carbon utilized for denitrification Large BNR volume
Alkalinity recovered Nitrogen removal limited by IMLR
Anoxic Aerobic
IMLR
NitrificationDenitrification TN 10 - 12 mg/L
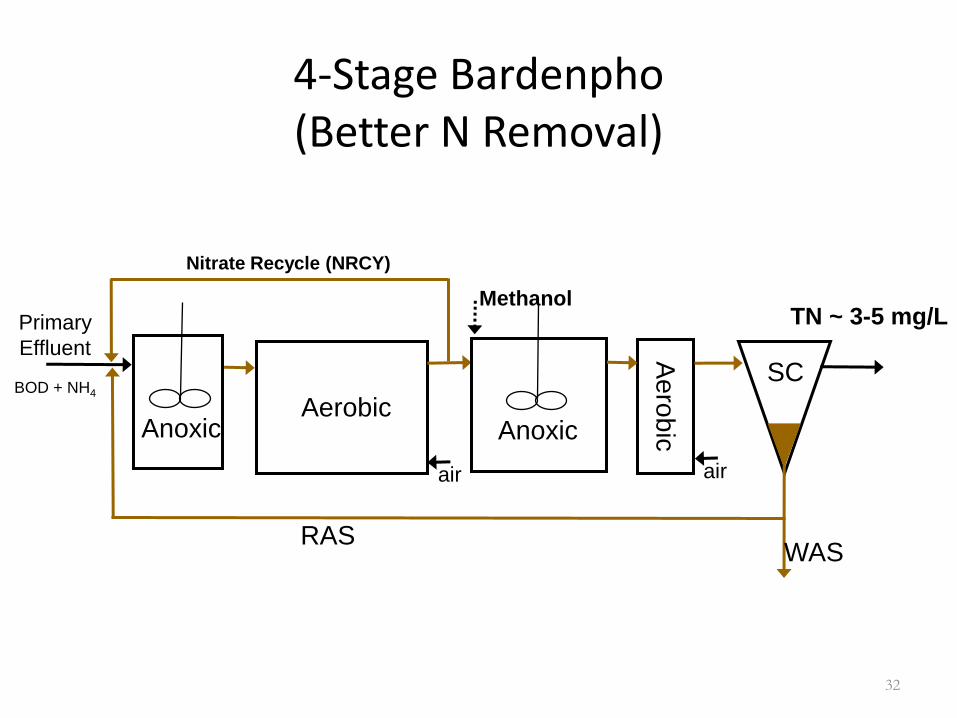
4-Stage Bardenpho (Better N Removal)
Aerobic
SC
RAS WAS
air
Anoxic
Ae
rob
ic
air
Anoxic
Methanol TN ~ 3-5 mg/L Primary
Effluent
BOD + NH4
Nitrate Recycle (NRCY)
32
NH4+
Probe
Anoxic Aerobic
IMLR
Nitrification/SNDDenitrification TN 10 - 12 mg/L
B-stage BNR
Anoxic Aerobic
IMLR
NitrificationDenitrification TN 16 - 18 mg/L
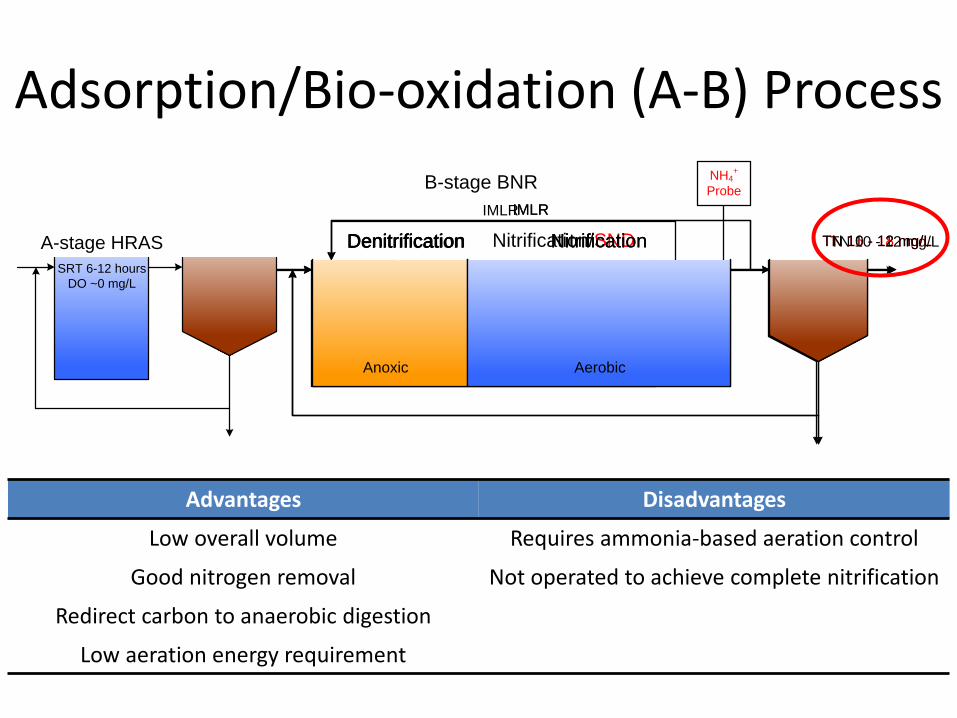
Adsorption/Bio-oxidation (A-B) Process
Advantages Disadvantages
Low overall volume Requires ammonia-based aeration control
Good nitrogen removal Not operated to achieve complete nitrification
Redirect carbon to anaerobic digestion
Low aeration energy requirement
Anoxic Aerobic
IMLR
NitrificationDenitrification TN 10 - 12 mg/L
SRT 6-12 hours
DO ~0 mg/L
A-stage HRAS

CONVENTIONAL A-STAGE
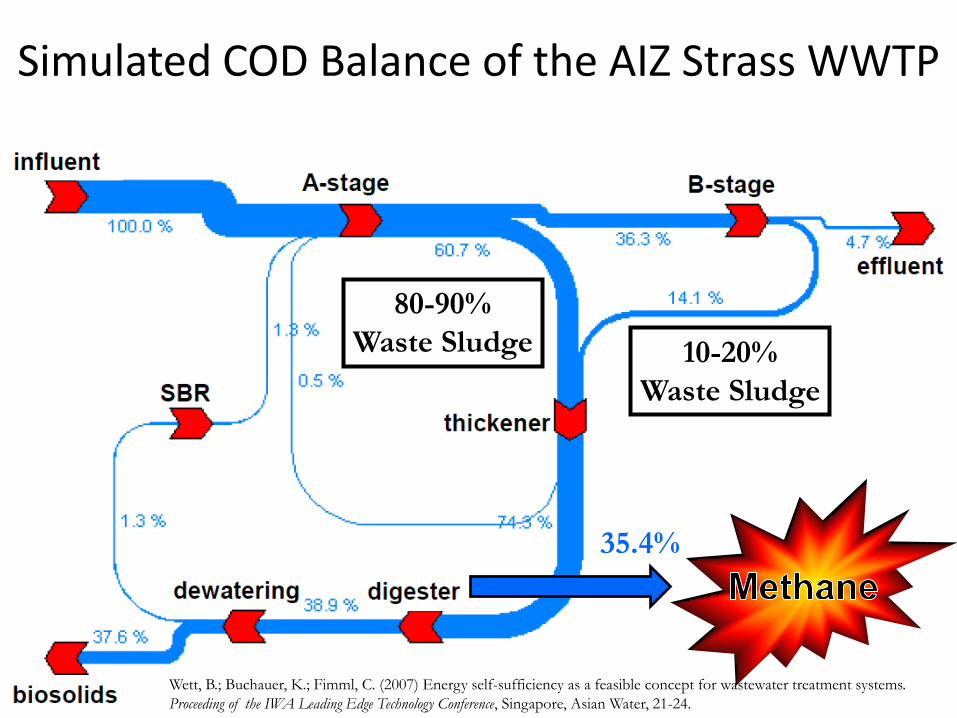
Simulated COD Balance of the AIZ Strass WWTP
Wett, B.; Buchauer, K.; Fimml, C. (2007) Energy self-sufficiency as a feasible concept for wastewater treatment systems.
Proceeding of the IWA Leading Edge Technology Conference, Singapore, Asian Water, 21-24.
35.4%
80-90%
Waste Sludge 10-20%
Waste Sludge
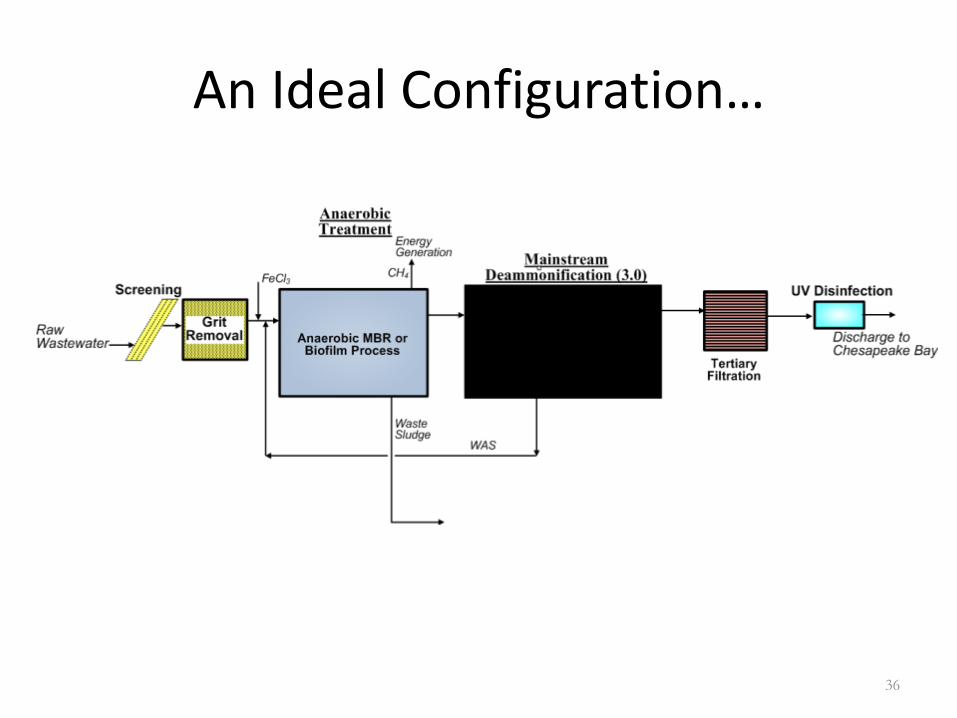
An Ideal Configuration…
36
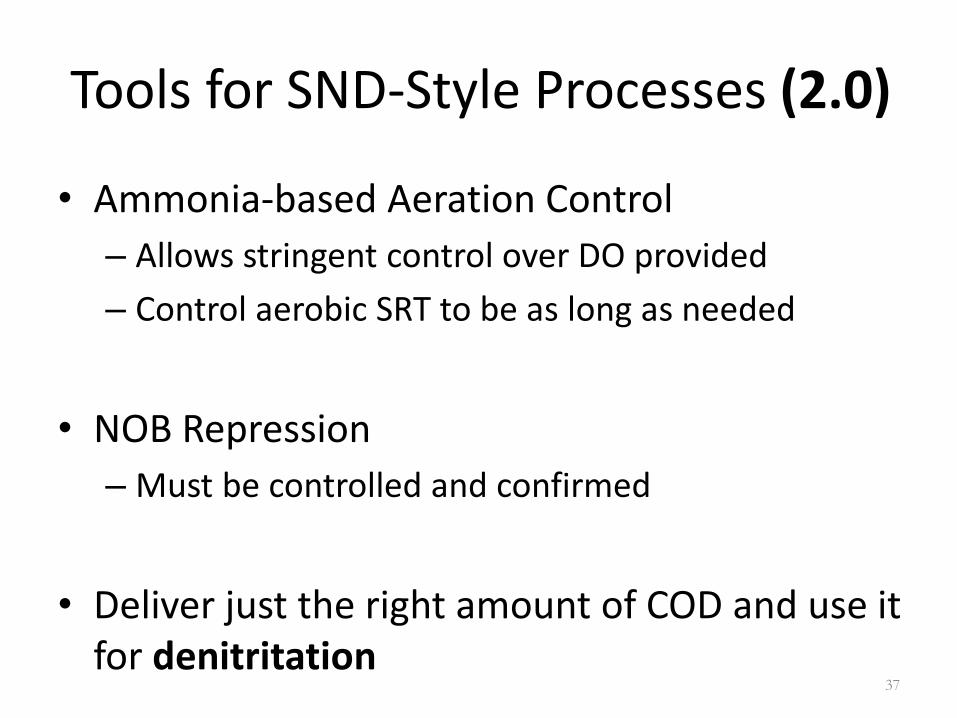
Tools for SND-Style Processes (2.0)
• Ammonia-based Aeration Control
– Allows stringent control over DO provided
– Control aerobic SRT to be as long as needed
• NOB Repression
– Must be controlled and confirmed
• Deliver just the right amount of COD and use it for denitritation
37
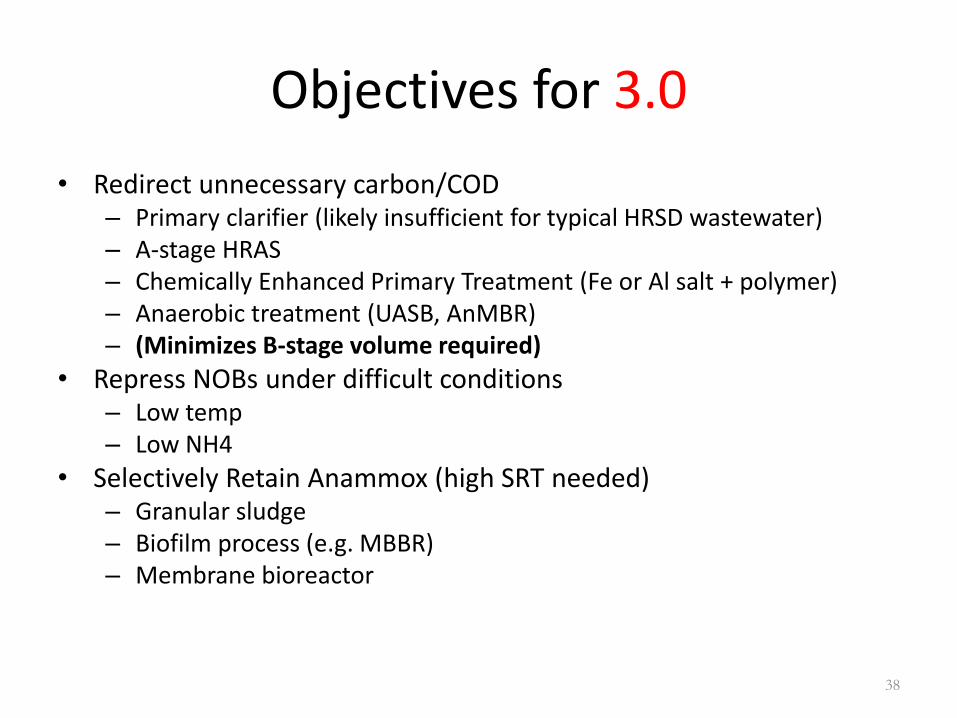
Objectives for 3.0
• Redirect unnecessary carbon/COD – Primary clarifier (likely insufficient for typical HRSD wastewater) – A-stage HRAS – Chemically Enhanced Primary Treatment (Fe or Al salt + polymer) – Anaerobic treatment (UASB, AnMBR) – (Minimizes B-stage volume required)
• Repress NOBs under difficult conditions – Low temp – Low NH4
• Selectively Retain Anammox (high SRT needed) – Granular sludge – Biofilm process (e.g. MBBR) – Membrane bioreactor
38

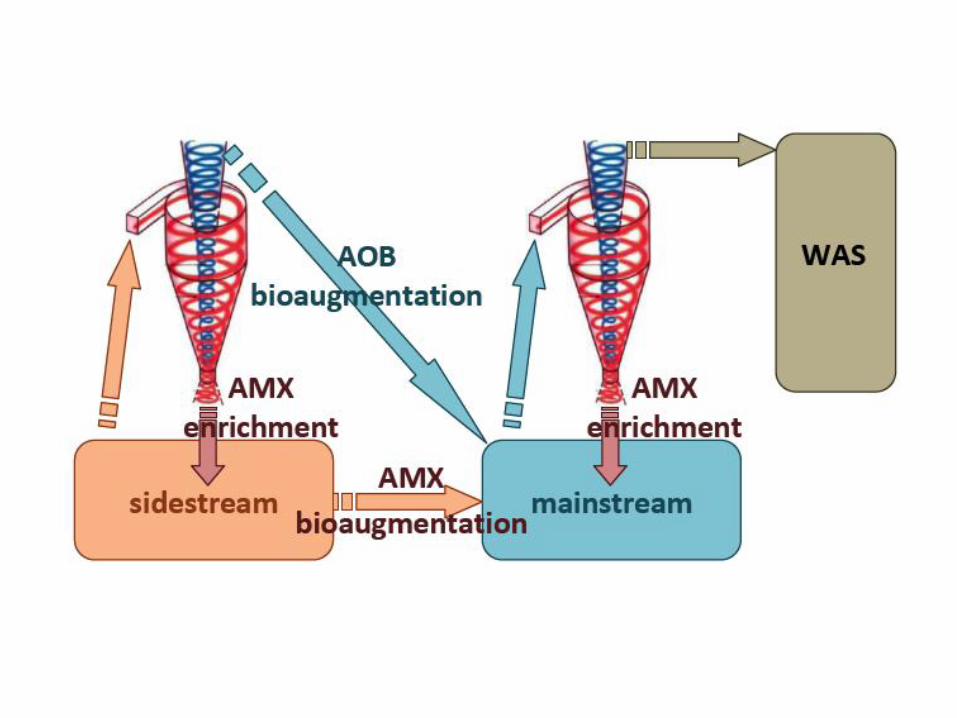
Plants with Anaerobic Digestion • Incentive for C-redirection
Key Features:
1. Bioaugment AOB in the sidestream cyclone overflow to the mainstream
2. Bioaugment anammox from sidestream to mainstream
3. Cyclone for anammox retention in mainstream
4. Repress NOB in mainstream (and sidestream)
C-redirectionMainstream
Deammonification
AnaerobicDigester
Sidestream Deammonification
Being piloted at DC Water and tested full-scale at Strass, AT and Glanerland,
CH
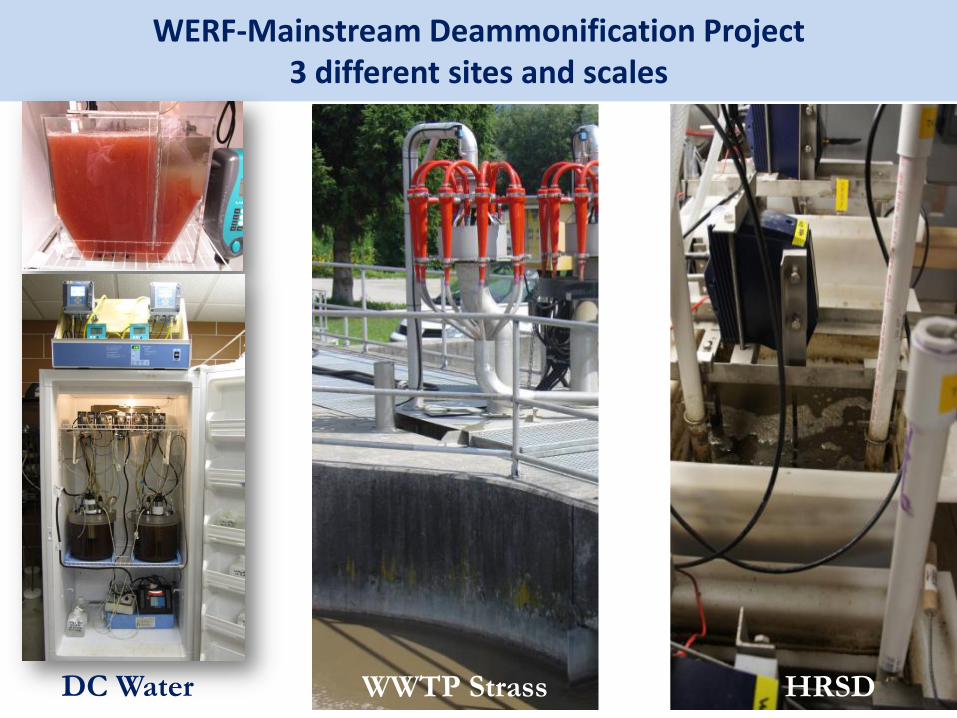
WERF-Mainstream Deammonification Project 3 different sites and scales
DC Water WWTP Strass HRSD
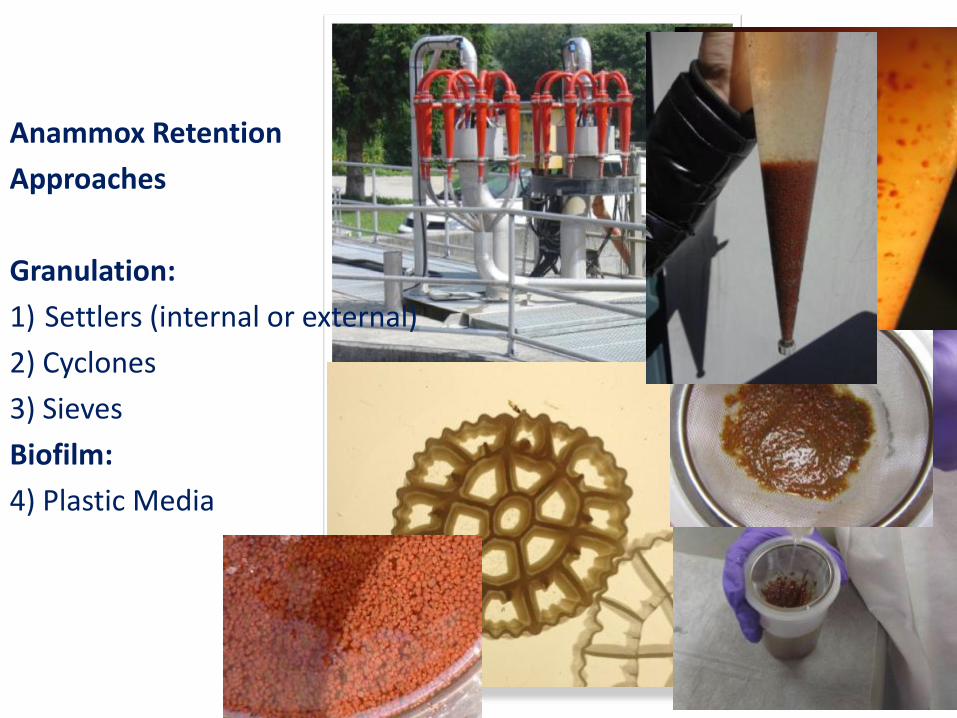
Anammox Retention
Approaches
Granulation:
1) Settlers (internal or external)
2) Cyclones
3) Sieves
Biofilm:
4) Plastic Media

43
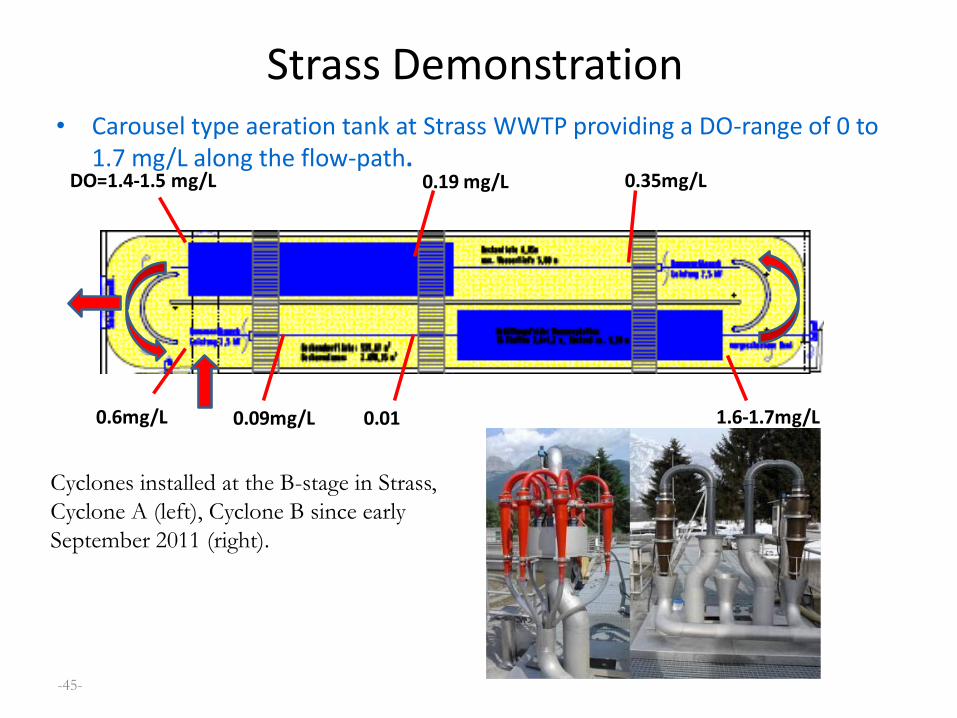
Strass Demonstration • Carousel type aeration tank at Strass WWTP providing a DO-range of 0 to
1.7 mg/L along the flow-path.
-45-
Cyclones installed at the B-stage in Strass,
Cyclone A (left), Cyclone B since early
September 2011 (right).
DO=1.4-1.5 mg/L 0.19 mg/L 0.35mg/L
0.010.09mg/L0.6mg/L 1.6-1.7mg/L
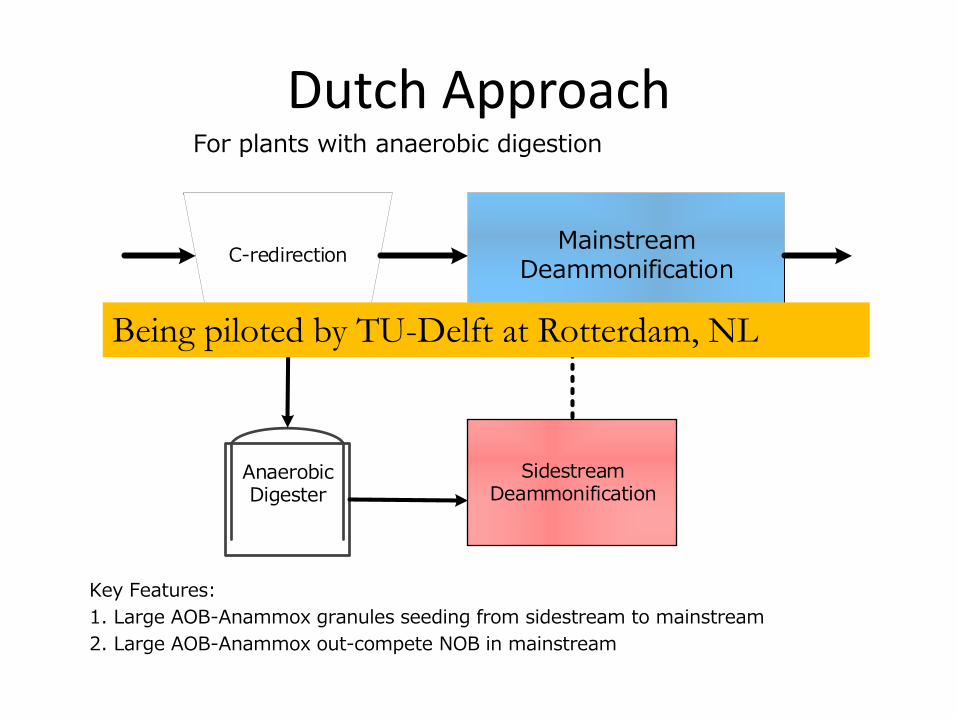
Dutch Approach
Key Features:
1. Large AOB-Anammox granules seeding from sidestream to mainstream
2. Large AOB-Anammox out-compete NOB in mainstream
C-redirectionMainstream
Deammonification
AnaerobicDigester
Sidestream Deammonification
Being piloted by TU-Delft at Rotterdam, NL
For plants with anaerobic digestion
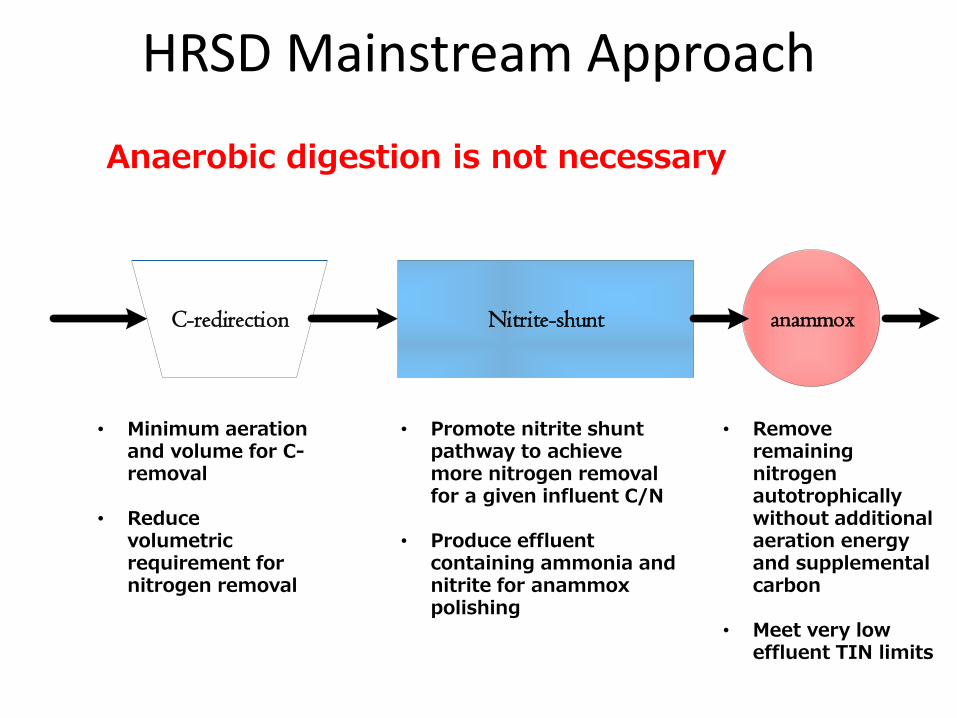
HRSD Mainstream Approach
Anaerobic digestion is not necessary
C-redirection Nitrite-shunt anammox
• Minimum aeration and volume for C-removal
• Reduce volumetric requirement for nitrogen removal
• Promote nitrite shunt pathway to achieve more nitrogen removal for a given influent C/N
• Produce effluent containing ammonia and nitrite for anammox polishing
• Remove remaining nitrogen autotrophically without additional aeration energy and supplemental carbon
• Meet very low effluent TIN limits
RAS
RAS
WAS
RAS
Chiller
Basket
Strainer
IMLR
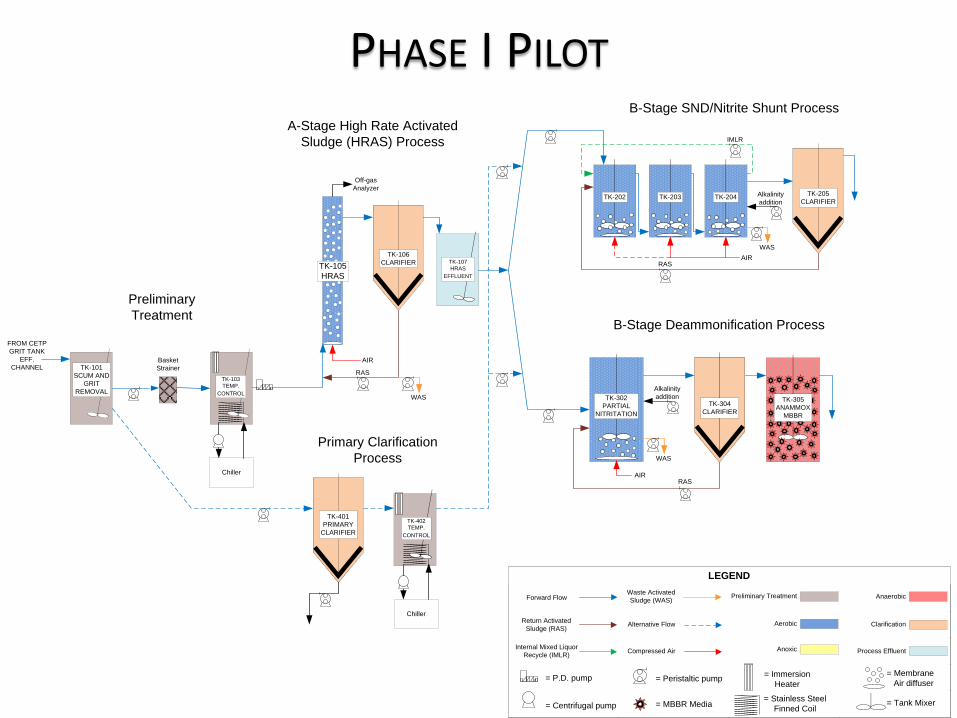
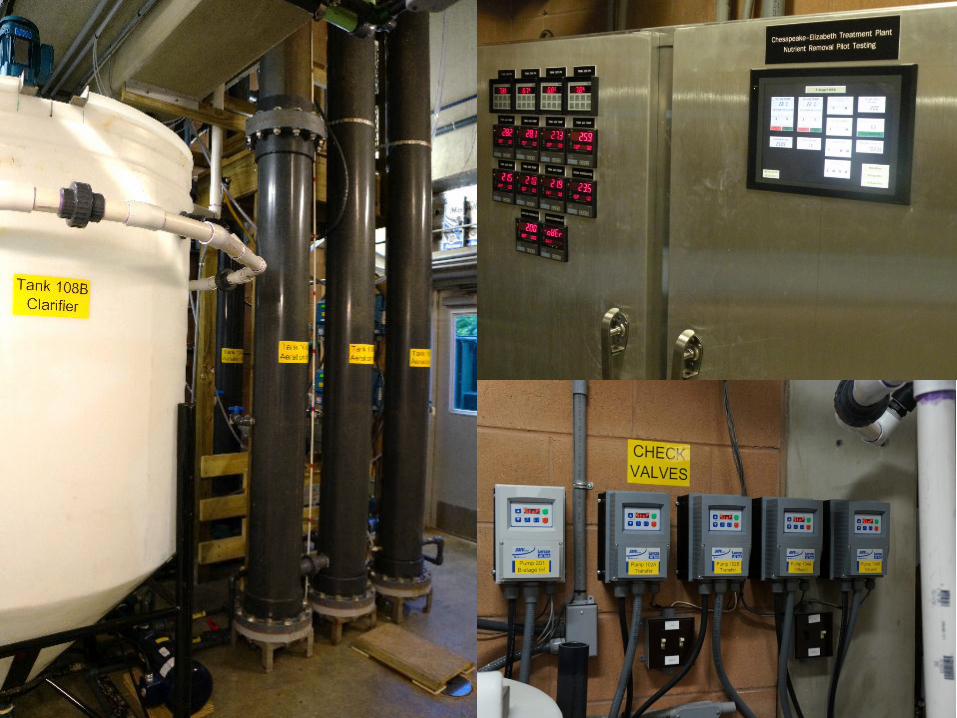
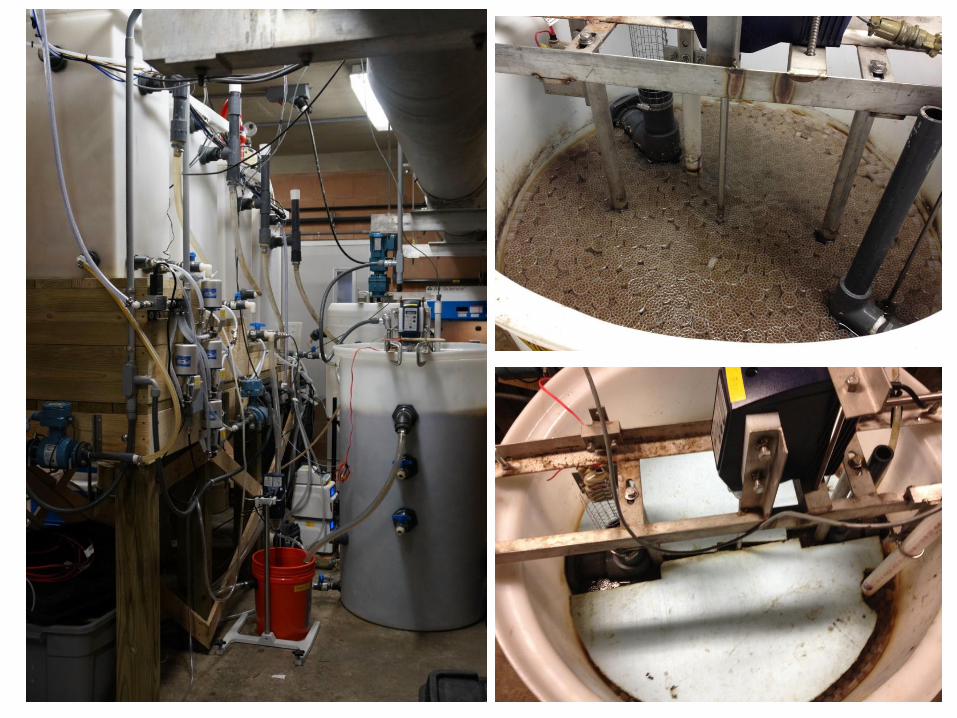
Hampton Roads Sanitation District
Chesapeake-Elizabeth Nutrient Removal Pilot Study
Process Flow Schematic
Alkalinity
addition
AIR
AIR
A-Stage High Rate Activated
Sludge (HRAS) Process
B-Stage Deammonification Process
B-Stage SND/Nitrite Shunt Process
Forward Flow
Return Activated
Sludge (RAS)
Internal Mixed Liquor
Recycle (IMLR)
Alternative Flow
Anoxic
Aerobic
Anaerobic
Clarification
Preliminary TreatmentWaste Activated
Sludge (WAS)
Compressed Air Process Effluent
LEGEND
= Centrifugal pump
= Peristaltic pump= Membrane
Air diffuser= P.D. pump
= Stainless Steel
Finned Coil
= Immersion
Heater
= MBBR Media
Off-gas
Analyzer
Primary Clarification
Process
= Tank Mixer
AIR
TK-105
HRAS
TK-305
ANAMMOX
MBBR
FROM CETP
GRIT TANK
EFF.
CHANNEL
Preliminary
Treatment
Alkalinity
addition
Chiller
TK-103
TEMP.
CONTROL
TK-101
SCUM AND
GRIT
REMOVAL
TK-106
CLARIFIER TK-107
HRAS
EFFLUENT
TK-401
PRIMARY
CLARIFIER
TK-402
TEMP.
CONTROL
TK-202TK-205
CLARIFIERTK-203 TK-204
TK-302
PARTIAL
NITRITATION
TK-304
CLARIFIER
WAS
WAS
PHASE I PILOT
P204
RAS
CHILLER
B
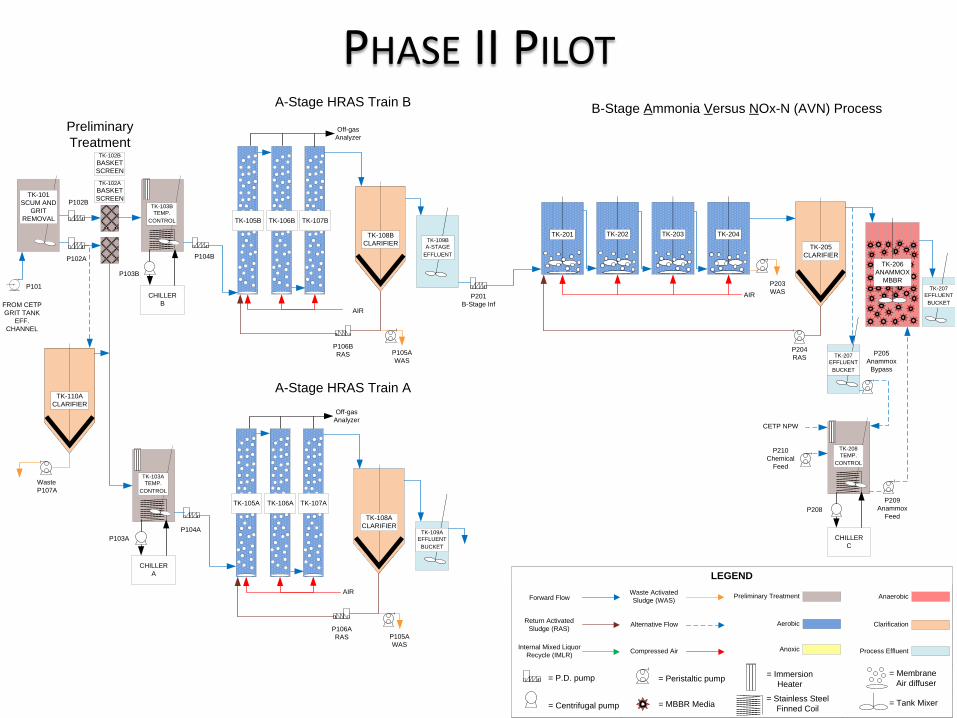
Hampton Roads Sanitation District
Chesapeake-Elizabeth Nutrient Removal Pilot Study
Process Flow Schematic
AIR
A-Stage HRAS Train BB-Stage Ammonia Versus NOx-N (AVN) Process
Forward Flow
Return Activated
Sludge (RAS)
Internal Mixed Liquor
Recycle (IMLR)
Alternative Flow
Anoxic
Aerobic
Anaerobic
Clarification
Preliminary TreatmentWaste Activated
Sludge (WAS)
Compressed Air Process Effluent
LEGEND
= Centrifugal pump
= Peristaltic pump= Membrane
Air diffuser= P.D. pump
= Stainless Steel
Finned Coil
= Immersion
Heater
= MBBR Media
Off-gas
Analyzer
A-Stage HRAS Train A
= Tank Mixer
AIR
TK-107B
FROM CETP
GRIT TANK
EFF.
CHANNEL
Preliminary
Treatment
TK-103B
TEMP.
CONTROL
TK-101
SCUM AND
GRIT
REMOVAL
TK-108B
CLARIFIERTK-109B
A-STAGE
EFFLUENT
TK-202
TK-205
CLARIFIER
TK-203 TK-204
P105A
WAS
TK-106B TK-105B
TK-201
Off-gas
Analyzer
AIR
TK-107A
TK-108A
CLARIFIER
TK-106A TK-105A
TK-206
ANAMMOX
MBBR
CHILLER
A
TK-103A
TEMP.
CONTROL
TK-102B
BASKET
SCREEN
TK-102A
BASKET
SCREEN
P101
P102B
P102A
P103B
P103A
P104B
P104A
TK-109A
EFFLUENT
BUCKET
P106B
RAS
P106A
RAS P105A
WAS
P201
B-Stage Inf
TK-110A
CLARIFIER
Waste
P107A
CHILLER
C
TK-208
TEMP.
CONTROL
P209
Anammox
Feed
CETP NPW
P210
Chemical
Feed
TK-207
EFFLUENT
BUCKET
P205
Anammox
Bypass
P203
WAS
TK-207
EFFLUENT
BUCKET
P208
PHASE II PILOT
Mainstream NOB Out-Selection
52
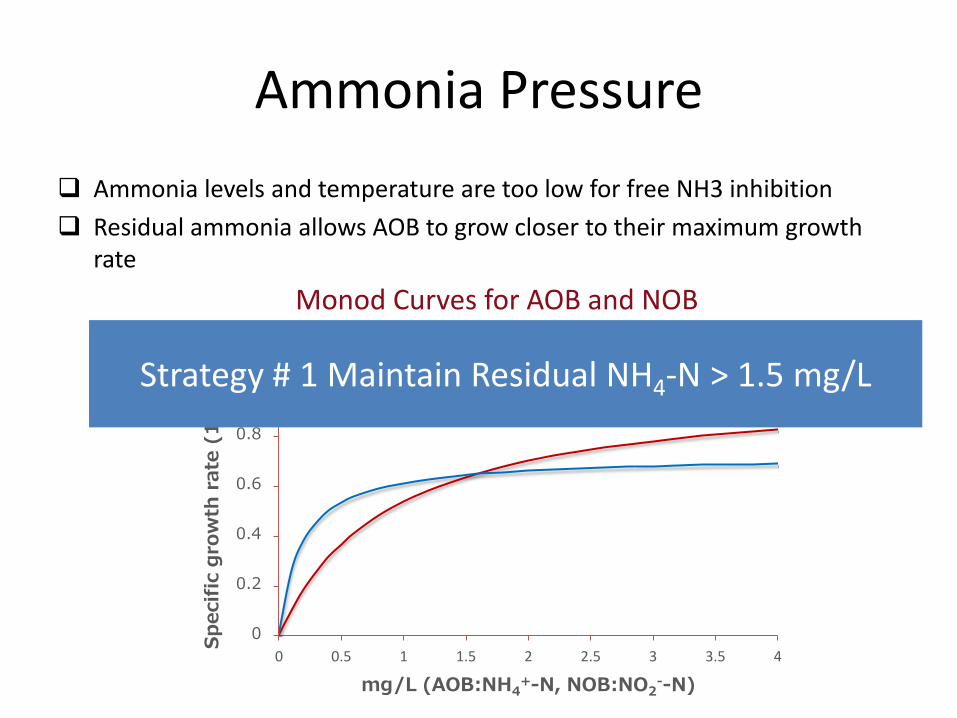
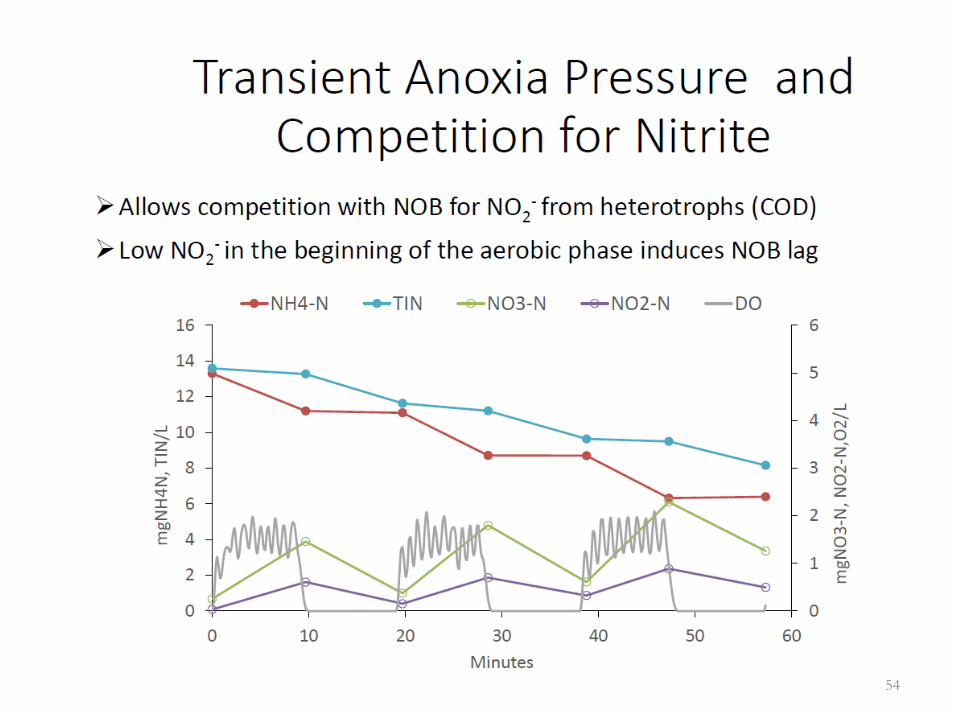
Ammonia Pressure
Ammonia levels and temperature are too low for free NH3 inhibition
Residual ammonia allows AOB to grow closer to their maximum growth rate
0
0.2
0.4
0.6
0.8
1
0 0.5 1 1.5 2 2.5 3 3.5 4
Sp
ecif
ic g
row
th r
ate
(1
/d
)
mg/L (AOB:NH4+-N, NOB:NO2
--N)
mu-AOB mu-NOB
Monod Curves for AOB and NOB
Strategy # 1 Maintain Residual NH4-N > 1.5 mg/L
54
DO (mg/L)
0.0 0.5 1.0 1.5 2.0
Act
ivit
y (
mg
N/L
.d)
0
100
200
300
400
AOB rate
NOB rate
Monod model NOB fit
Monod model AOB fit
Monod Curves for AOB and NOB
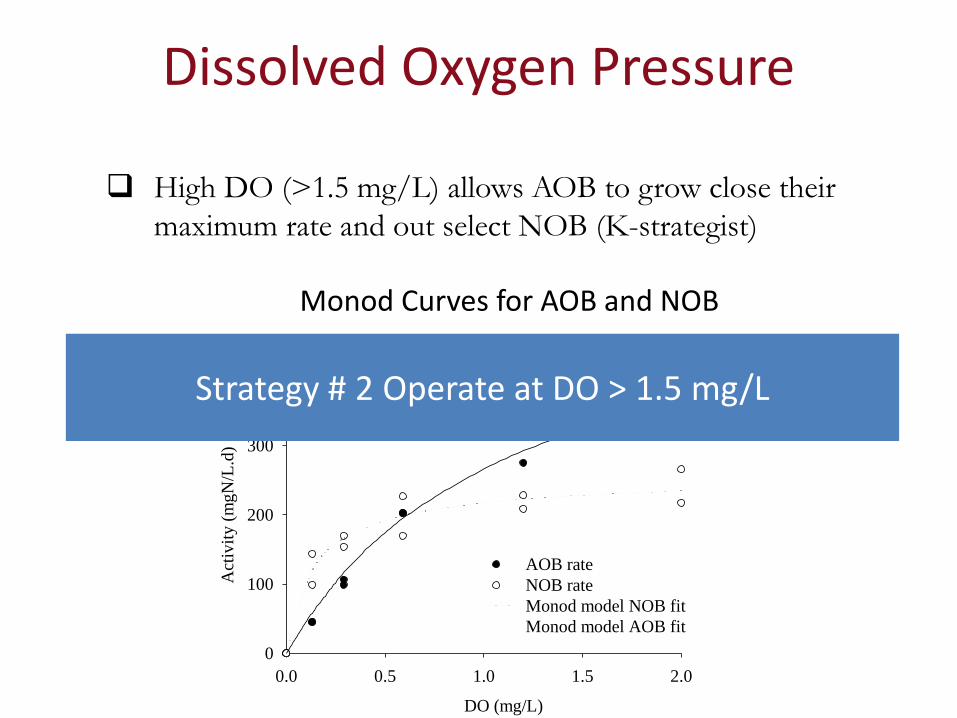
Strategy # 2 Operate at DO > 1.5 mg/L
Dissolved Oxygen Pressure
High DO (>1.5 mg/L) allows AOB to grow close their
maximum rate and out select NOB (K-strategist)
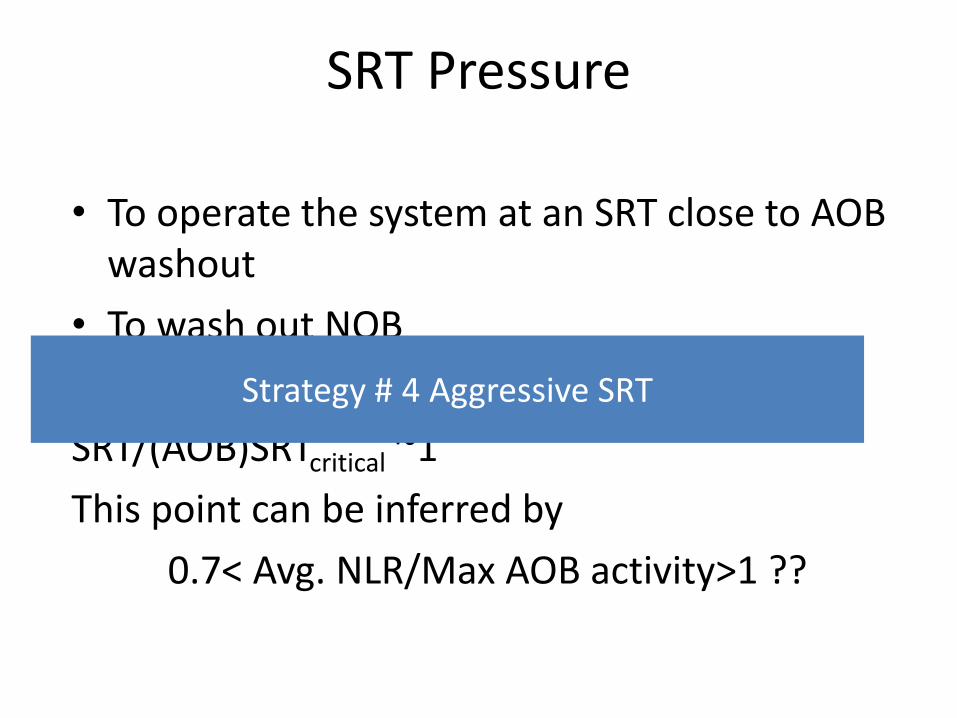
SRT Pressure
• To operate the system at an SRT close to AOB washout
• To wash out NOB
SRT/(AOB)SRTcritical ~1
This point can be inferred by
0.7< Avg. NLR/Max AOB activity>1 ??
Strategy # 4 Aggressive SRT
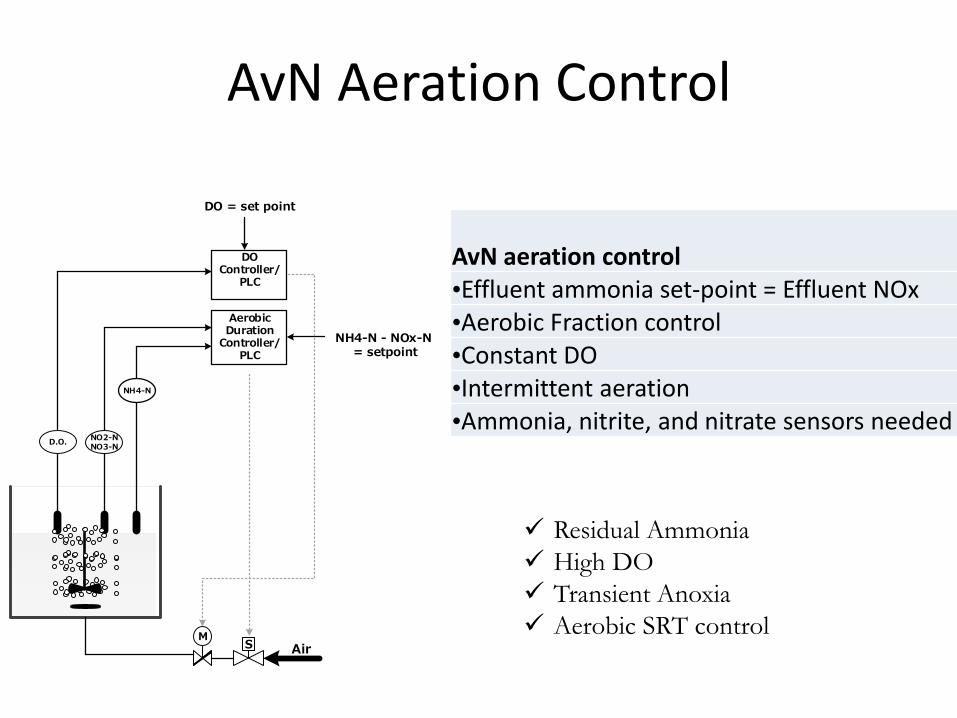
AvN Aeration Control
Residual Ammonia
High DO
Transient Anoxia
Aerobic SRT control
D.O.NO2-NNO3-N
NH4-N
Aerobic Duration
Controller/PLC
DOController/
PLC
DO = set point
NH4-N - NOx-N = setpoint
MAirS
AvN aeration control
•Effluent ammonia set-point = Effluent NOx
•Aerobic Fraction control
•Constant DO
•Intermittent aeration
•Ammonia, nitrite, and nitrate sensors needed
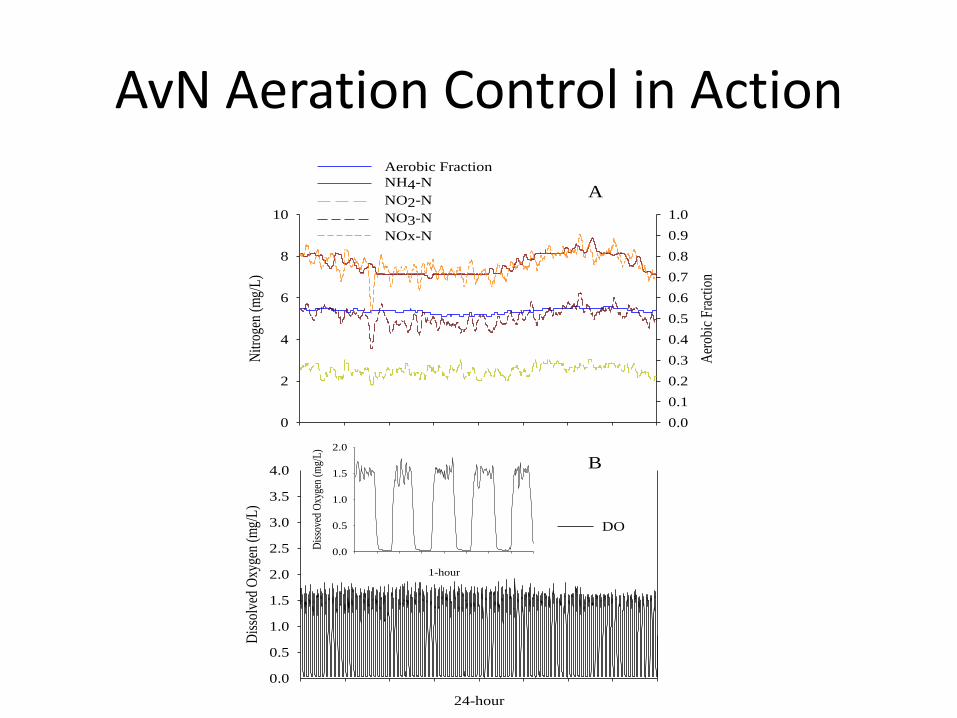
AvN Aeration Control in Action
Aer
obic
Fra
ctio
n
0.0
0.1
0.2
0.3
0.4
0.5
0.6
0.7
0.8
0.9
1.0
Nit
roge
n (m
g/L
)
0
2
4
6
8
10
Aerobic Fraction
NH4-N
NO2-N
NO3-N
NOx-N
24-hour
Dis
solv
ed O
xyge
n (m
g/L
)
0.0
0.5
1.0
1.5
2.0
2.5
3.0
3.5
4.0
DO
1-hour
Dis
sove
d O
xyge
n (m
g/L
)
0.0
0.5
1.0
1.5
2.0
A
B
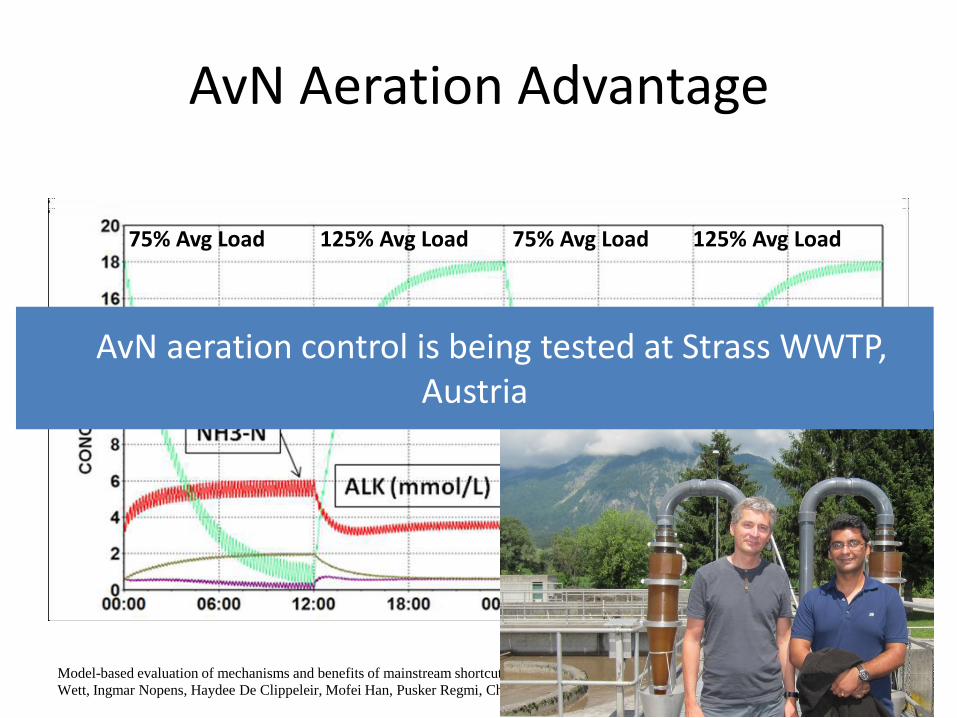
AvN Aeration Advantage
Model-based evaluation of mechanisms and benefits of mainstream shortcut nitrogen removal processes (2014), Ahmed Al-Omari, Bernhard
Wett, Ingmar Nopens, Haydee De Clippeleir, Mofei Han, Pusker Regmi, Charles Bott, Sudhir Murthy. WWTMOD
75% Avg Load 125% Avg Load 75% Avg Load 125% Avg Load
AvN aeration control is being tested at Strass WWTP, Austria
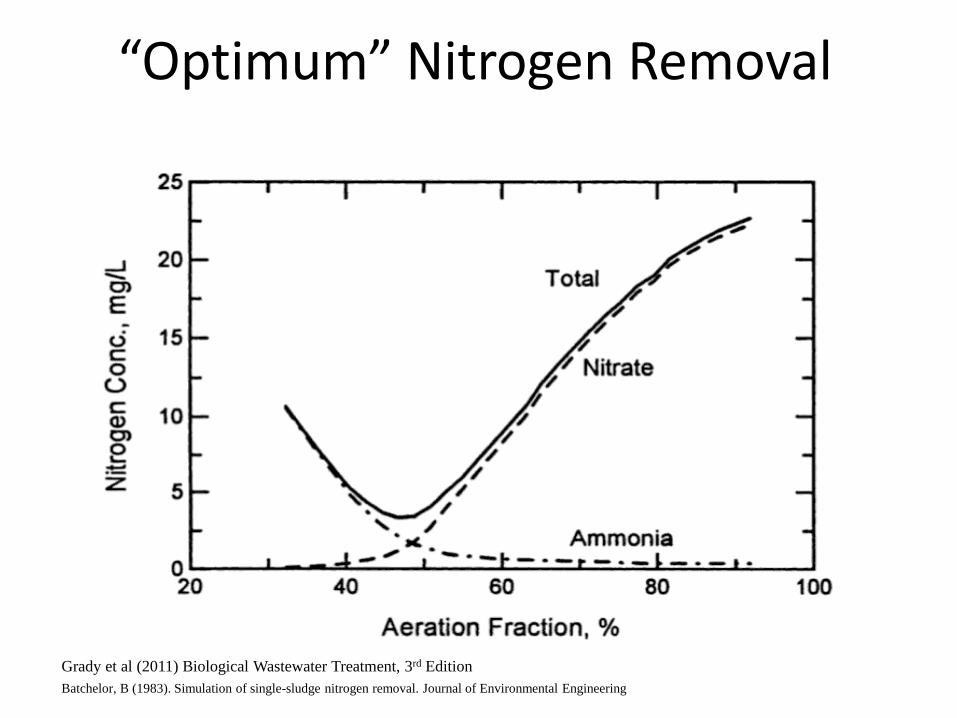
“Optimum” Nitrogen Removal
Grady et al (2011) Biological Wastewater Treatment, 3rd Edition
Batchelor, B (1983). Simulation of single-sludge nitrogen removal. Journal of Environmental Engineering

AvN SRT control
• An automated wasting strategy such that the system always operates close to an AOB wash out SRT
• Being tested now…
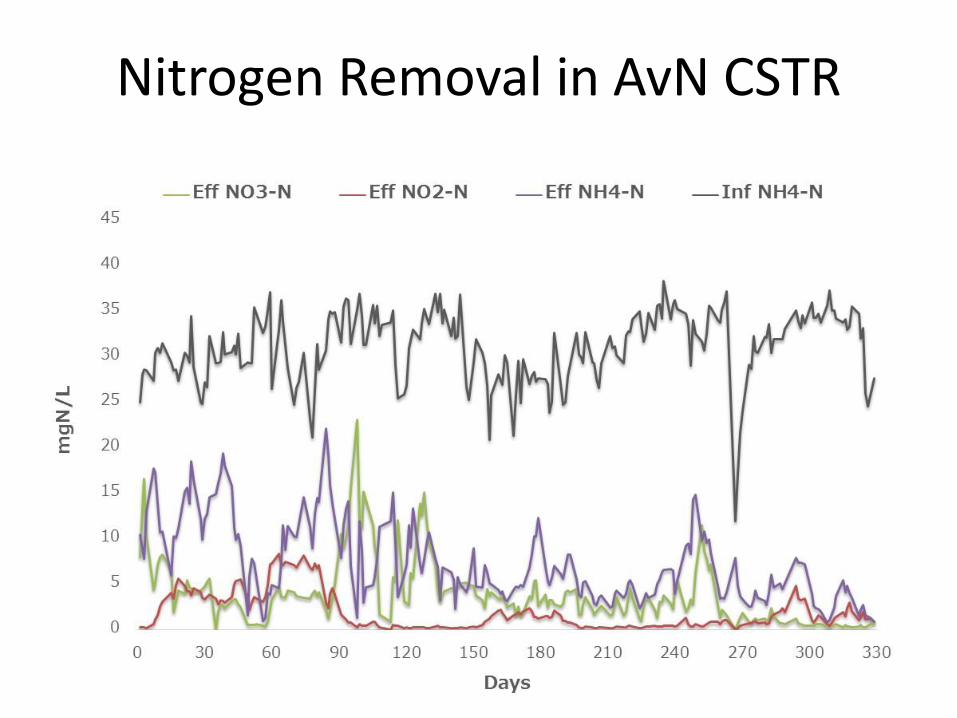
Nitrogen Removal in AvN CSTR
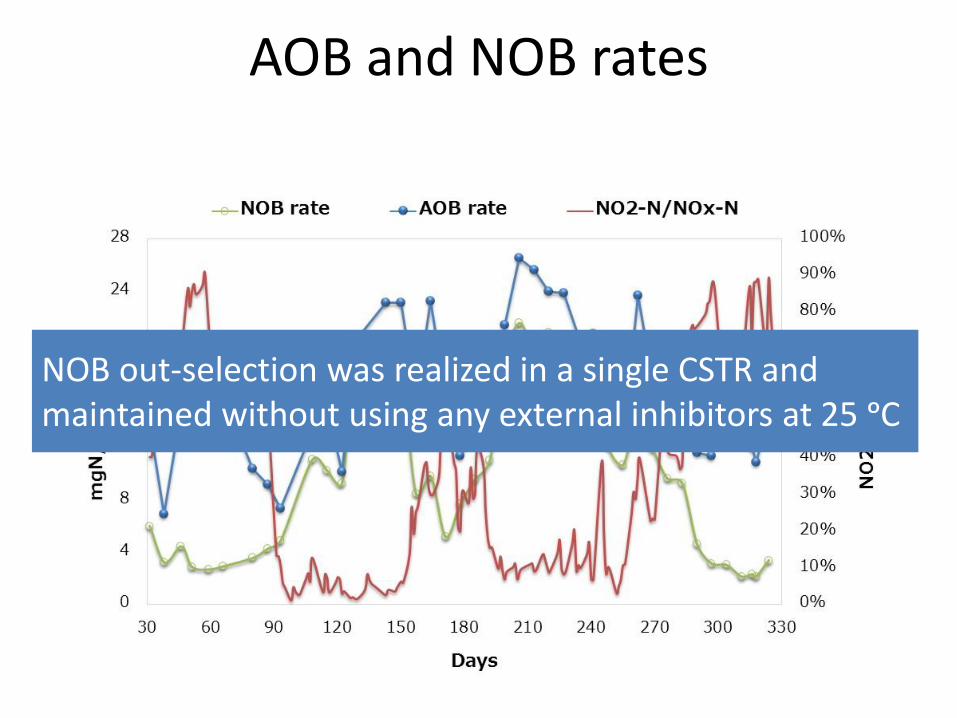
AOB and NOB rates
NOB out-selection was realized in a single CSTR and maintained without using any external inhibitors at 25 ᵒC
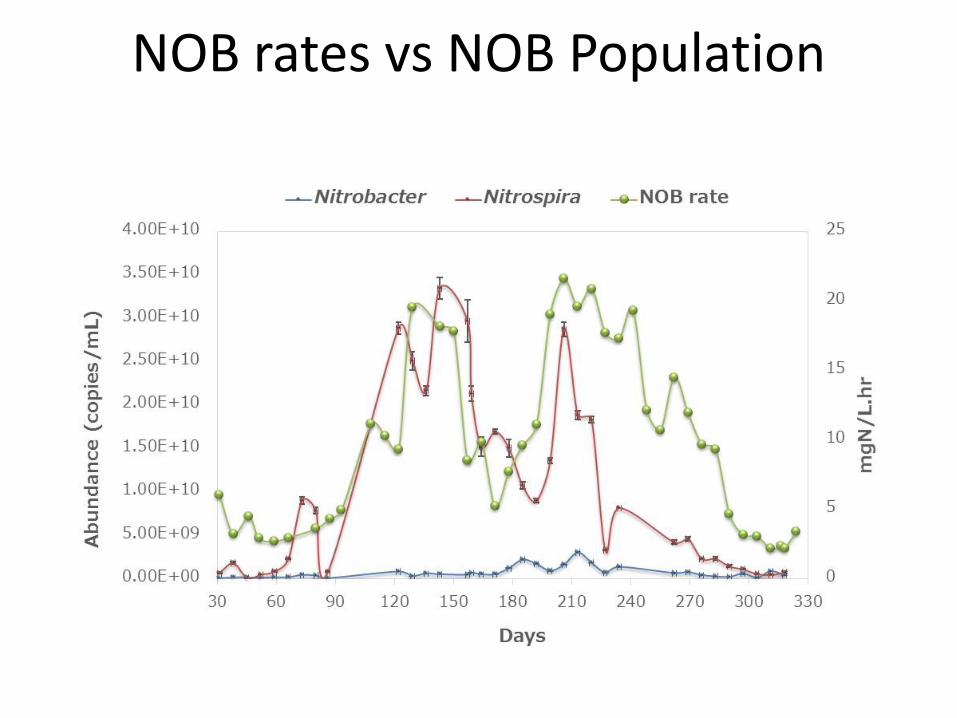
NOB rates vs NOB Population

Pilot Layout
RAS
WAS
AER PCL
A-stage
SCL
RAS
WAS
B-stage (AvN+)
AER ANX
AOB versus NOB (AvN) Anammox MBBR HRAS
Carbon concentration Nitrite-shunt Nitrogen Polish

Anammox polishing
0
2
4
6
8
10
12
14
16
270 285 300 315 330
mg
N/L
Days
Inf TIN Eff TIN
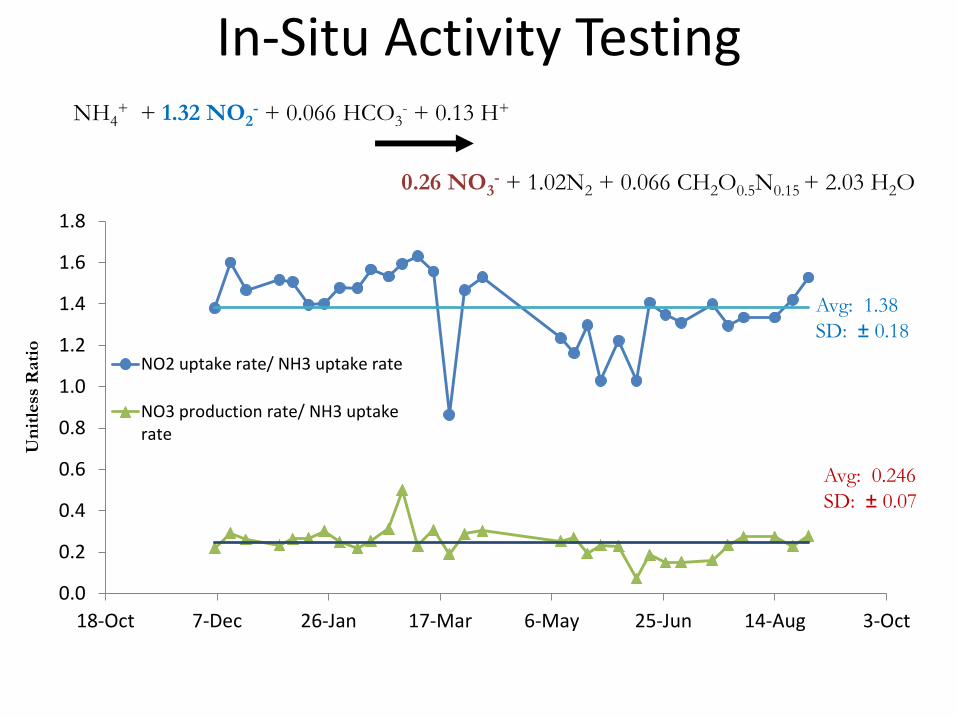
In-Situ Activity Testing NH4
+ + 1.32 NO2- + 0.066 HCO3
- + 0.13 H+
0.26 NO3- + 1.02N2 + 0.066 CH2O0.5N0.15 + 2.03 H2O
Un
itle
ss R
ati
o
0.0
0.2
0.4
0.6
0.8
1.0
1.2
1.4
1.6
1.8
18-Oct 7-Dec 26-Jan 17-Mar 6-May 25-Jun 14-Aug 3-Oct
NO2 uptake rate/ NH3 uptake rate
NO3 production rate/ NH3 uptakerate
Avg: 0.246
SD: ± 0.07
Avg: 1.38
SD: ± 0.18
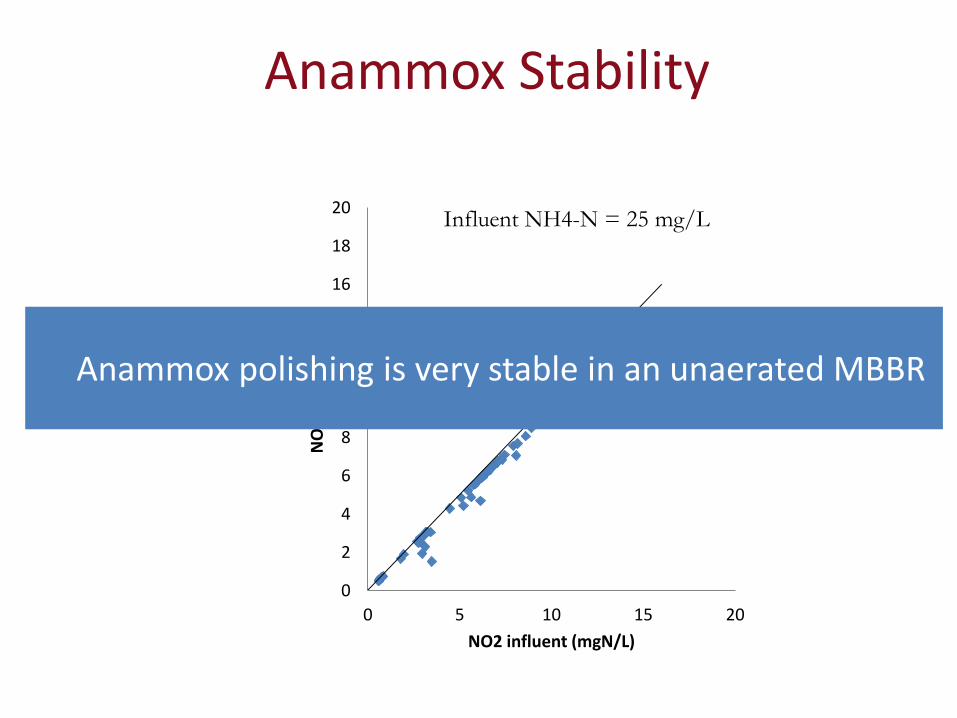
Anammox Stability
0
2
4
6
8
10
12
14
16
18
20
0 5 10 15 20
NO
2 r
em
ove
d
NO2 influent (mgN/L)
Anammox polishing is very stable in an unaerated MBBR
Influent NH4-N = 25 mg/L
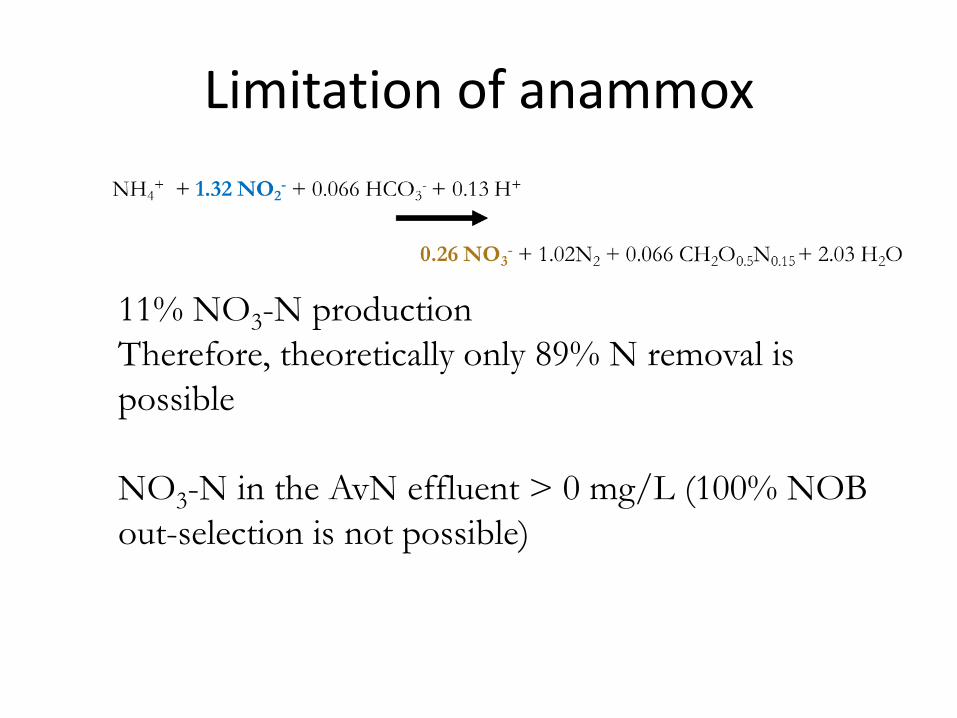
Limitation of anammox
11% NO3-N production
Therefore, theoretically only 89% N removal is
possible
NO3-N in the AvN effluent > 0 mg/L (100% NOB
out-selection is not possible)
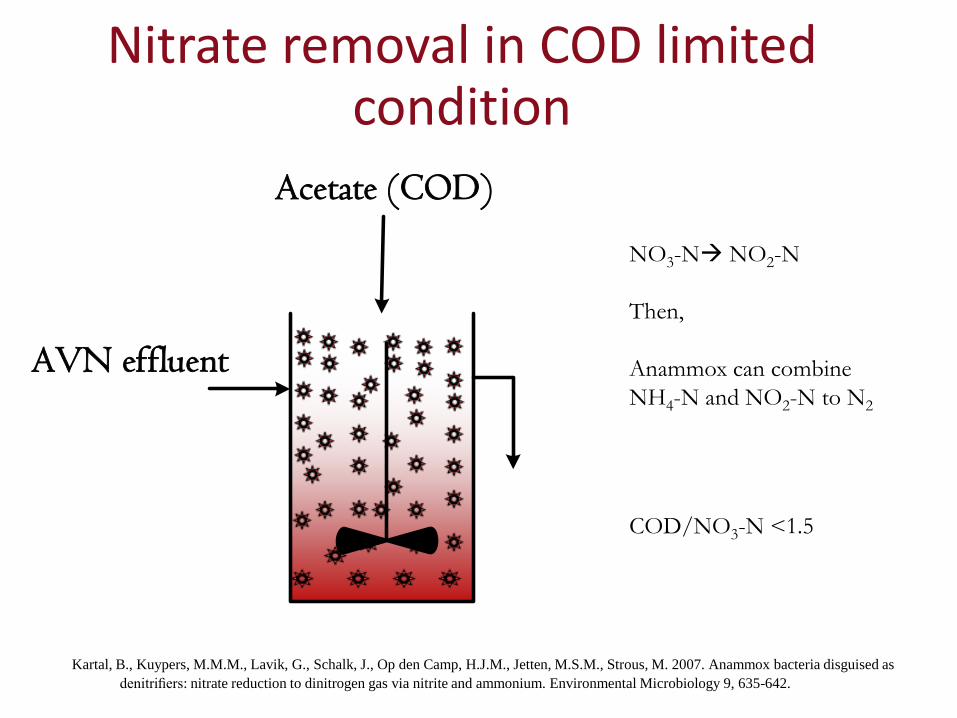
Nitrate removal in COD limited condition
Acetate (COD)
AVN effluent
NO3-N NO2-N
Then,
Anammox can combine
NH4-N and NO2-N to N2
COD/NO3-N <1.5
Kartal, B., Kuypers, M.M.M., Lavik, G., Schalk, J., Op den Camp, H.J.M., Jetten, M.S.M., Strous, M. 2007. Anammox bacteria disguised as
denitrifiers: nitrate reduction to dinitrogen gas via nitrite and ammonium. Environmental Microbiology 9, 635-642.
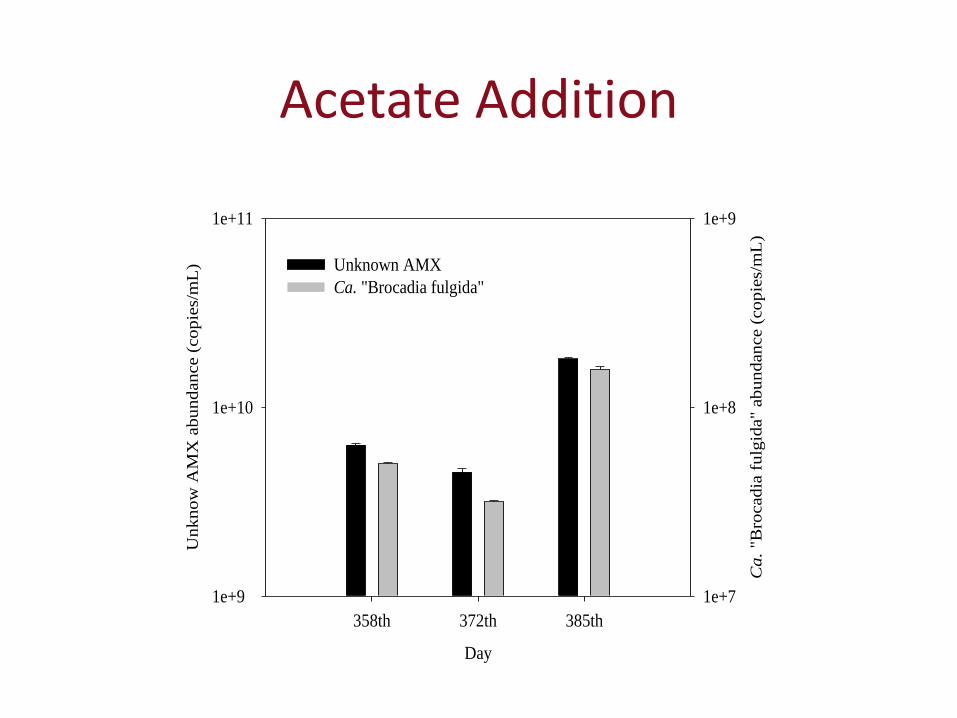
Acetate Addition
Influent Ac(COD)/NO3-N 0.83±0.22
NO2-N removed/ NH4-N removed 0.35±0.07
NOx-N removed/NH4-N removed 1.37±0.16
Overall TIN removal (%) 50±12
Anammox contribution 87±6
Ac(COD)/TIN removed = 0.81±0.15
Day
358th 372th 385th
Un
kn
ow
AM
X a
bu
nd
ance (
cop
ies/
mL
)
1e+9
1e+10
1e+11
Ca. "B
rocadia
fulg
ida"
abu
nd
ance (
cop
ies/
mL
)
1e+7
1e+8
1e+9
Unknown AMX
Ca. "Brocadia fulgida"
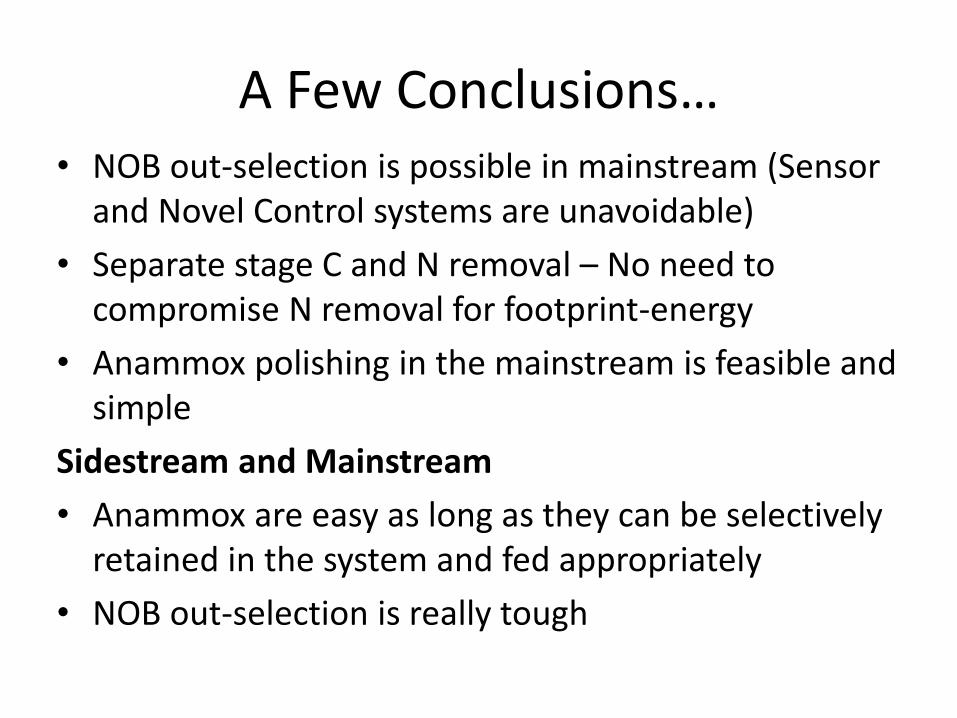
A Few Conclusions… • NOB out-selection is possible in mainstream (Sensor
and Novel Control systems are unavoidable)
• Separate stage C and N removal – No need to compromise N removal for footprint-energy
• Anammox polishing in the mainstream is feasible and simple
Sidestream and Mainstream
• Anammox are easy as long as they can be selectively retained in the system and fed appropriately
• NOB out-selection is really tough

The people
Olawale Akintayo
Charles Bott
Ryder Bunce
Kartik Chandran
Michael Desta
Norman Dockett
Haydee De Clippeleir
Dana Fredericks
M. Gomez Brandon
Mofei Han
Martin Hell
Becky Holgate
Jose Jimenez
Rebecca Jimenez
Hansa Keswani
David Kinnear
Yi Wei Ma
Matthew Michaelis
Mark Miller
Sudhir Murthy
Geert Nyhuis
Sylvia Okogi
Ahmed Omari
Maureen O’Shaughnessy
Hong Keun Park
Sabine Podmirseg
Pusker Regmi
Rumana Riffat
Andrew Shaw
Beverley Stinson
Imre Takacs
Claire Welling
Bernhard Wett
RAS
AIR
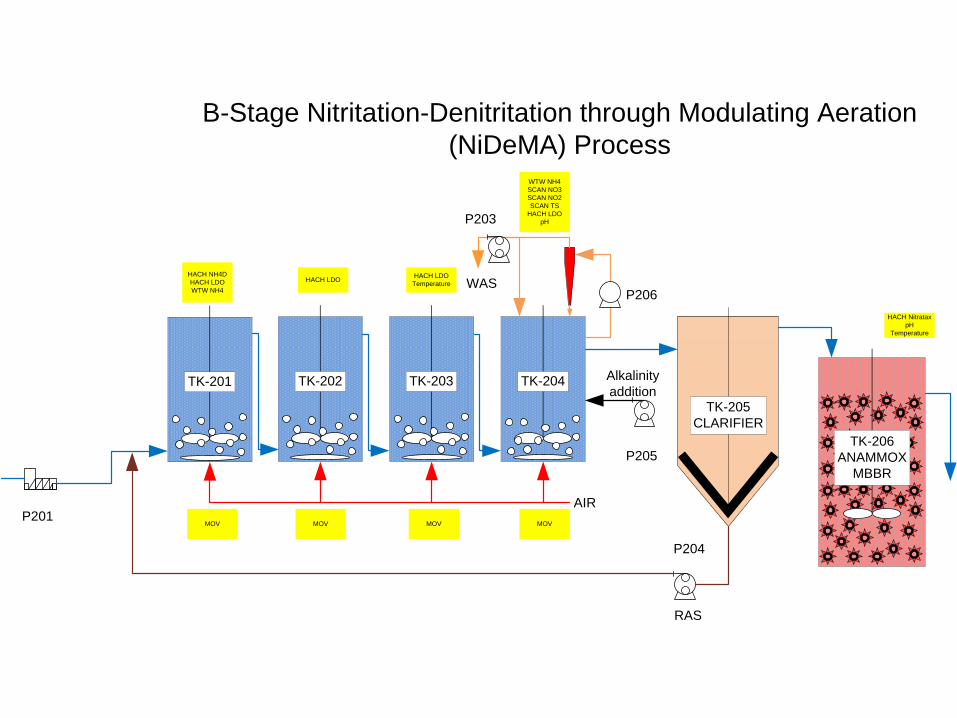
B-Stage Nitritation-Denitritation through Modulating Aeration
(NiDeMA) Process
Alkalinity
additionTK-202
TK-205
CLARIFIER
TK-203 TK-204
WAS
TK-201
TK-206
ANAMMOX
MBBR
HACH NH4D
HACH LDO
WTW NH4
WTW NH4
SCAN NO3
SCAN NO2
SCAN TS
HACH LDO
pH
HACH LDO
TemperatureHACH LDO
MOV MOV MOV MOV
HACH Nitratax
pH
Temperature
P201
P204
P205
P203
P206
RAS
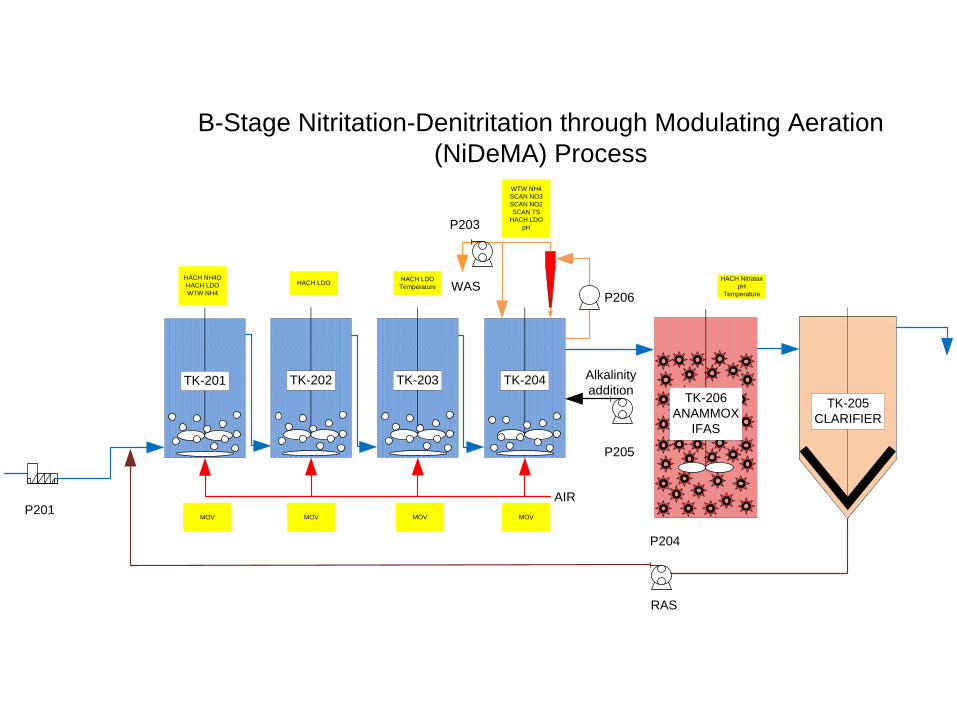
AIR
B-Stage Nitritation-Denitritation through Modulating Aeration
(NiDeMA) Process
Alkalinity
additionTK-202
TK-205
CLARIFIER
TK-203 TK-204
WAS
TK-201
TK-206
ANAMMOX
IFAS
HACH NH4D
HACH LDO
WTW NH4
WTW NH4
SCAN NO3
SCAN NO2
SCAN TS
HACH LDO
pH
HACH LDO
TemperatureHACH LDO
MOV MOV MOV MOV
HACH Nitratax
pH
Temperature
P201
P204
P205
P203
P206
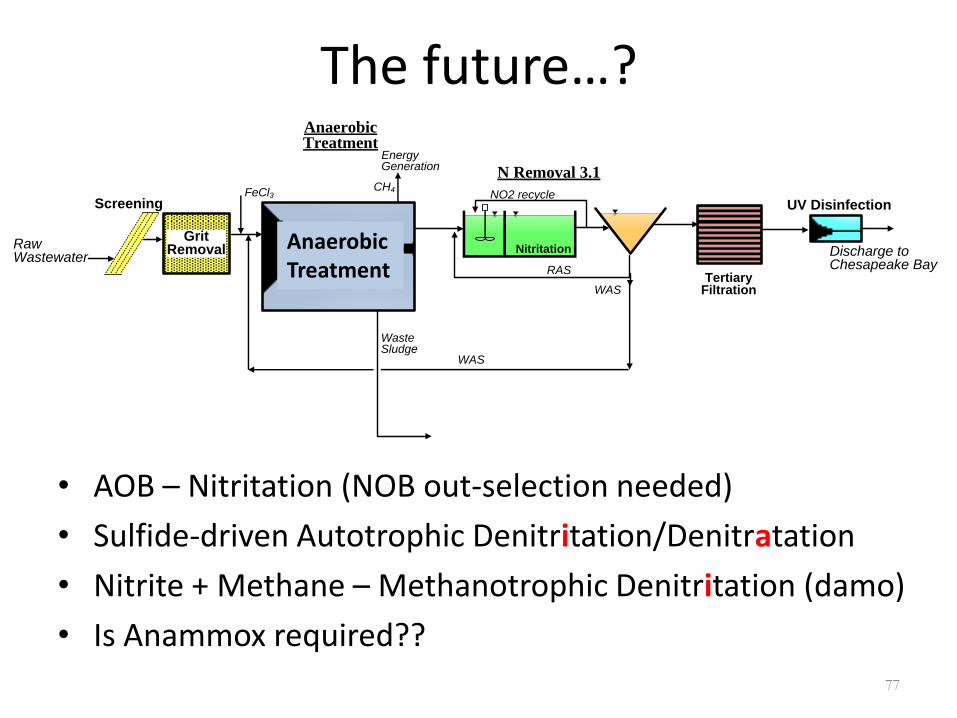
The future…?
• AOB – Nitritation (NOB out-selection needed)
• Sulfide-driven Autotrophic Denitritation/Denitratation
• Nitrite + Methane – Methanotrophic Denitritation (damo)
• Is Anammox required??
77
RawWastewater
Screening
GritRemoval
UV Disinfection
Anaerobic Treatment
Anaerobic MBR or Biofilm Process
N Removal 3.1CH4
Discharge to Chesapeake Bay
WasteSludge
FeCl3
TertiaryFiltration
WAS
EnergyGeneration
RAS
WAS
NO2 recycle
NitritationAnaerobic Treatment
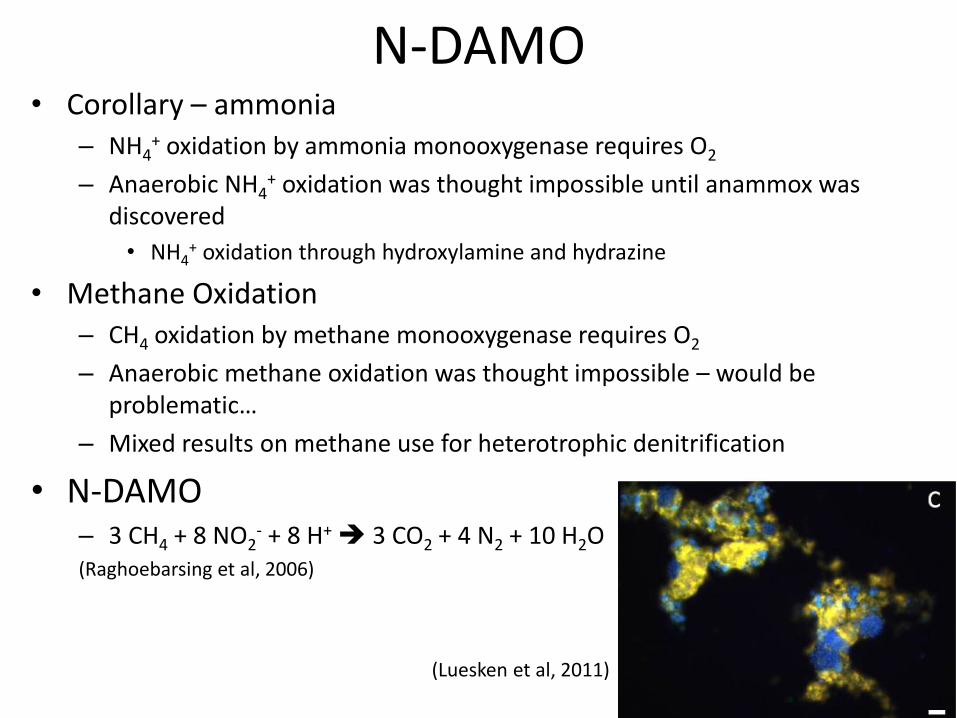
N-DAMO • Corollary – ammonia
– NH4+ oxidation by ammonia monooxygenase requires O2
– Anaerobic NH4+ oxidation was thought impossible until anammox was
discovered
• NH4+ oxidation through hydroxylamine and hydrazine
• Methane Oxidation – CH4 oxidation by methane monooxygenase requires O2
– Anaerobic methane oxidation was thought impossible – would be problematic…
– Mixed results on methane use for heterotrophic denitrification
• N-DAMO – 3 CH4 + 8 NO2
- + 8 H+ 3 CO2 + 4 N2 + 10 H2O (Raghoebarsing et al, 2006)
(Luesken et al, 2011)