minutes of the faculty senators council · pdf fileminutes of the faculty senators council...
TRANSCRIPT

194 Mercer Street, Suite 401 New York, New York 10012 Telephone: 212 998 2232 Facsimile: 212 995 4575 www.nyu.edu/fsc [email protected]
MINUTES OF THE FACULTY SENATORS COUNCIL MEETING OF May 8, 2014 The New York University Faculty Senators Council (FSC) met at noon on Thursday, May 8, 2014 in Room 802 in the Kimmel Center for University Life. In attendance were Senators Adelman, Allgood, Alter, Amkpa, Backus, Cappell, Carpenter, Chan, Cowin, Diner, Dinwiddie, Jacobs, Jelinek, Kamer, Kane, Karl, McIlwain, Miller, Mincer, Morning, Porfiri, Rajagopal, Rodwin, Simoncelli, Stanhope, Stokes, Sundaram, Uleman, Zwanziger; Active Alternates Dasanayake and Stewart; Alternate Senators Archer (for Goodwin), Simon, Sternhell (for Becker) and Tannenbaum; and Immediate Past Chair Magder. FSC Former Chair Lebowitz and Al-Askari attended as guests. Martin Lipton, Rachel Maxwell, Beth Morningstar, Alison Leary, Kelle Colyer-Brown, Randy Deike, and Mary Signor attended as Special Guests.
APPROVAL OF THE MINUTES OF THE MEETING HELD April 10, 2014 Upon a motion duly made and seconded, the minutes of the April 10, 2014 meeting were approved unanimously. ELECTION OF CANDIDATES FOR FSC VICE CHAIRPERSON AND SECRETARY 2014-2015 The election of FSC Vice Chairperson and Secretary for 2014-2015 took place by secret ballot from the following slate of candidates presented by the Nominating Committee: Candidate for Vice Chairperson:
- Allen Mincer (FAS)
- Angela Kamer (College of Dentistry)
Candidate for Secretary:
- Mitchell Kane (School of Law)
- Maurizio Porfiri (NYU Polytechnic Institute)
Senator Alter from the Nominating Committee supervised the counting of the 32 ballots and Alter reported the results of the election: Allen Mincer from the Faculty of Arts and Science School will serve as FSC Vice Chair and Mitchell Kane from School of Law will serve and FSC Secretary for academic year 2014-2015.
REPORT FROM THE CHAIRPERSON: RAGHU SUNDARAM
A. Requests for the FSC
1

Chairperson Sundaram reiterated the request sent from the NYPL, which was circulated to the council previously, for a member of the FSC to be part of the Researcher Advisory Committee. Sundaram mentioned that Senator Karl sent a nomination from the History Department. He was an ideal candidate but, he unfortunately declined because he is involved in other activities that might be compromised by his involvement. Sundaram urged council members to send nominees to himself and the FSC Coordinator.
Sundaram mentioned that he received a memo from the university asking for four FSC members to serve on the Stewardship Committee for the building that’s going to be taking place. Senators Stokes and Chan confirmed the four FSC members that will be on the committee (Senators Mincer, Kamer, Chan, and Goodwin). Senator Dasanayake will be an alternate if one of the mentioned four members cannot attend.
B. EC Meetings
Sundaram informed the council about the joint meeting with the Board of Trustees. The main discussions were GNU and governance. The discussion on GNU was on nothing the council doesn’t already know. The discussion on governance was what the joint committee was going to look like moving forward. Sundaram recommended to the Board of Trustees to meet subsequently with the elected faculty body in the form of the FSC and soon to be elected faculty body for the contract faculty. A third elected committee isn’t needed. The Board of Trustees will make a decision on how to handle this going forward and guaranteed they will meet with elected faculty on a regular basis.
There was also a meeting with the Provost. Main topic of discussion was hiring at the GNU. The Provost mentioned that the faculty at Shanghai to rise to 10 this year. Majority of the meeting was spent on discussing the archives that were created for the Faculty Handbook. All changes and discussion related to the handbook would now be available online. The Provost office is waiting for FSC approval before it goes live.
C. Summary of the Year
Sundaram expressed his highest praise to all the chairs and members of the FSC committees for a job well done throughout the year. Sundaram noted the headway that was made through shared governance. Sundaram emphasized that the work has barely begun. What has been achieved is the first step in obtaining the data needed to make meaningful recommendations. Continuity in leadership in the committees is very important. Sundaram recommended all committee chairs stay on for another year and select a co-chair to carry on. It is reiterated that all committee members participate in committee business. The entire burden should not be on the chair of the committee. Sundaram asked council members to choose one committee to invest their time and to be their primary focus. It was also asked of the council to better communicate with their school and departments. Sundaram announced that he would like to start involving the faculty councils of the various schools. Keep them informed about all the issues and circulating information to them rather than posting on the website and directing them there.
D. The Work Ahead
Sundaram raised a concern regarding the Social Media Policy. It has been with the council for a year and has not been discussed amongst the council. It is important that all senators read the draft policy and circulate it to their colleagues to get feedback. Sundaram mentioned sending draft policy to each school’s faculty council for feedback. The feedback period is 5-6 weeks so by

end of June the council’s summer committee can meet and discuss. Final recommendation won’t get to Administration until the fall meetings.
FSC COMMITTEE REPORTS Benefits and Housing: Committee Co-Chairs Sewin Chan and David Stokes
Final Report
See Document D: Benefits Year End Report
Senator Chan explained that the document is a better summary of what was presented in March. Chairperson Sundaram urged the council to read the document and send all inquiries to Senator Chan and Stokes.
Alison Leary, Executive Vice President Operations, NYU
Alison Leary addressed the council regarding the Apartment Improvement Program. Leary stressed that this is a new program and not one that replaces other programs. This will be a new program that adds to the needs of other programs already in existence. In a faculty housing lease, you are allowed re-painting upon renewal. This program expands the range of options if painting is not needed. The university wants to create a program that is budget controlled for the university and cost controlled for the residents. The university doesn’t want the residents to contribute anything to the program. There is also the need to provide as much choice as possible and sense of control in your home. Instead of limiting the resident to just painting, they have a range of options. Within each of those options, there is another layer of choice by letting the resident select the palette or design (traditional, modern, transitional). The way the university is staying budget neutral is the bundling of the requests. In September, the university will ask the residents to elect the nature of their improvement and finish so they can gather all the requirements and leverage the volume in order to get the best pricing for the university. This will be tricky since it is a pilot program. The university will ask for patience as they work out the kinks.
A question that has come up is what if a resident want a particular faucet or tile that is not part of the program, can they contribute something to have that item as an option. Leary brought the question to the council for feedback. No feedback was received. Senator Adelman suggested pooling the benefit so the resident that doesn’t need anything done in the current year that they can double it in the following year. Adelman pointed out that some residents may elect to do things that they don’t want to do in fear of losing the benefit.
A senator mentioned the window replacement issue in faculty housing. Leary responded that the university is aware of the window and heating issues in the faculty housing and they are currently working on improving the issue. They have started the procurement process and are trying to replace as many windows as possible in Washington Square Village by next winter. Also the university found lack of insulation in Washington Square Village and the university is trying to find an invasive way to fix the problem.
A senator asked how was all this going to be communicated to the faculty residents. Leary advised that the current timeline has everything completed by June and communication will be via email. Two layers of communication: a) announce the program and b) note that it’s only available for residents renewing leases.
Governance: Committee Chair Jim Uleman
Proposed Resolution: Amending the Faculty Handbook
See Document A: Proposed Resolution
Senator Uleman explained at the meeting on February 20, 2014, the Faculty Senators Council (FSC) discussed and approved a resolution to accept language developed at the request of the FSC and by members of the FSC Governance Committee in conjunction with members of the University Administration to be inserted into the Faculty Handbook that provides for the procedure to amend the Faculty Handbook. After the FSC approved the February 20, 2014 resolution some Senators received objections on the grounds that it appears to contradict the Five Principles of Shared Governance, and these objections were raised in discussion at the April 10, 2014 meeting of the FSC, where a new resolution to rescind the February 20, 2014 resolution was introduced, discussed, and failed to be adopted. During discussion it was suggested that the FSC might, instead of rescinding its February 20, 2014 resolution, propose a new resolution asking for assurances that the Board of Trustees will consult with the FSC before amending the Faculty Handbook except in exceptional circumstances. Uleman added that the proposed resolution was drafted be Senator Jelinek with the assistance of Chairperson Sundaram. It was discussed via email with committee members and came down to favor 2 to 1.
Sundaram emphasized that the principles of shared governance do not relate to the Board of Trustees. They relate to the faculty and the administration. The resolution states the Board of Trustees should “act in accordance with the principle of shared governance…” but Sundaram stated that you cannot act in accordance to a rule that does not apply to you. It is suggested to change it to “act in the spirit of shared governance…” Another change would be to the last sentence in the resolution. “The Faculty Senators Council asks for assurances from the Board of Trustees to this effect.” Sundaram expressed his dislike for this sentence because it places the FSC in the role of supplicant. Sundaram moves to strike the last sentence and change “accordance” to “spirit of”. Senator Uleman agrees with the friendly amendments Sundaram suggested.
Senator Tannenbaum asked if any part of the faculty handbook can be used in the court of law. Senator Uleman commented that the faculty handbook has been used in court cases against the Board of Trustees and/or the administration in the past.
Senator Uleman presented the Committee’s proposed resolution regarding Amending the Faculty Handbook. At the conclusion of the discussion, the following resolution was moved Senator Uleman, seconded by another Senator, and approved by vote 29 senators in favor and 10 senators opposed, with 2 abstentions of the Council.
Personnel Policies and Tenure Modifications: Committee Chair Charlton McIlwain
Diversity, Inclusion and Equity
See Document C: Report on Faculty and Student Diversity
Secretary McIlwain informed the council that the main concern of the committee was to address the issue of diversity starting with information and data. The information was compiled by the Office of Institutional Research and given to the committee. The committee also met with the Office of Equal Opportunity for NYU to aid with research. McIlwain presented the council with some trends that was found in his research that he wanted to highlight:

• There has been little change since 2003 in the proportions of faculty from historically underrepresented groups. There was an increase across most groups and then became relatively flat in current years. NYU is well within median scope amongst other comparative universities. How is NYU going to get out of this flat state and in a position of leading?
• Compared to 2003, a greater percentage of our total current faculty is non-tenure track. The overall proportion of tenure/tenure track faculty has decreased 12% from 2003-2011, while overall proportions of non-tenure track faculty increased 12% during the same time.
Office of Equal Opportunity - Mary Signor and Kelle Colyer-Brown
The office is responsible for faculty recruitment. They provide training, guidebooks, and legal advice regarding faculty recruitment. Goal for the year is to make an online module to help with faculty searches and recruitment that will launch in the fall. In the office there is an Outreach Resource Guide filled with publications and job banks to help with your faculty search which will be online by fall as well. The office is one of the founding universities of the Metro New York Connecticut Higher Education Recruitment Consortment. Great tool if the faculty recruits have a trailing spouse. The office also provides discounts to many job banks for recruitment which a lot are diversity focused. McIlwain asked the guests to elaborate on the self-identify procedure. Kelle Colyer-Brown explained how the faculty candidates are asked to self-identify. It is not required for schools to send in Affirmative Action reports to the Office of Equal Opportunity (OEO). OEO issued a survey to all schools except the Medical school and Poly and received information that the opportunity to self-identify is done post-offer. This information was collected by the school’s Human Resources during their new-hire onboarding paperwork. For the people that decline to self-identify, the information relied on visual best guesses. This process will be changing shortly. The OEO is under federal law to issue the invitation to self-identify. This is mandatory to happen at least at three points in time: pre-offer, post –offer, and post-hire. The OEO is currently working on a process with the Provost Office and Division of Human Resources. This is process the OEO can see how NYU’s recruitment resources are successful and where there needs to be improvements. A senator asked why Poly and the Medical School were excluded. Colyer-Brown responded that Poly was not fully onboard when the survey went out and the Medical School has their own Human Resources and OEO.
Office of Institutional Research – Rachel Maxwell and Randy Deike
The data in Document C is student and faculty trends over the past 10 years. The data was pulled from the National Center for Educational Statistics (NCES). A senator inquired about why NYU is not compared to Ivy League schools or regional universities that are in and around the NYC area. Rachel Maxwell explained that the NCES has certain classifications that they go by for the 180 school and universities in their registry. Senator Backus asked if the information is public data and could be used in other matters. Maxwell commented that the information is public but it’s usually not shared. The office is limited on how they can parcel the data.
Chairperson Sundaram raised a question to Randy Deike regarding the data. It was asked what the top challenges were in the data. Deike responded by noting certain populations of students, the number of those students graduating high school and then being prepared academically to do well in this kind of environment, with some populations of students is so small. It’s like that across the board with other universities because diversity is so important to everyone. It’s not just students of color, it’s geography and socioeconomics. That’s the biggest issue. It’s happening in K12 and in the community. Letting kids know college is an opportunity. Another challenge is funding. A lot has been done over the last five years to help better fund students especially lower socioeconomic students. But, the university is still not at the place it would like to be. An overarching challenge would be communication. Broad communication. There are cultural and community issues that are hard to break through sometimes. For instance, a lot of

lower income families do not even apply because they do not think it’s even possible financially. The university tries to explain that should not be a deterrent to apply. The cost is not known until after financial aid is processed. Another issue is if the community is welcoming. Does the student see themselves at the university? This is a very difficult issue. You look at the candidate and the percentage of underrepresented students at NYU compared to NYC, NYU is at a bit of an advantage on the sidewalks and a disadvantage in the classrooms.
Senator Morning mentioned that the OEO should bring up the notion of unconscious bias during faculty searches and recruitment.
Medical School Salary Policy – Mark Adelman
Senator Adelman presented that the Medical School relies on 2% tuition and for the Medical School to function economically it has to have extramural funding. Most of that is from patients and grant support. This is compared to the schools down at the Square where it is 80% tuition based. The Academic Excellence Commission was created in 2008 by a committee. The responsibilities of that committee were to determine excellence in productivity, the base salary, expectation for extramural funding, and departmental incentives. The committee looked at salary coverage benchmarks. What do other peer institutions require for extramural salary support at schools of medicine? The range is about 50-80% of salary must be supported by the individual faculty members of the school. The committee decided to require extramural funding and it was phased in 2008 – 2010. The extramural funding would be purely based on research funding. So if you have 100% salary: 20% is administrative, 80% research salary (60% would have to be funded extramurally). The Medical School would pay the remaining 40% of your research salary. This will be adjusted based on your other responsibilities. Every faculty member is required to have 50 contact hours with students. After this two year process, a salary reduction would go into effect. The maximum salary reduction would be 20%. The committee passed a resolution in 2012 stating there should be a base salary and salaries should not be able to go to zero. This offered financial security. Using the 25th percentile from the Association of Academic Medical Centers a “floor” was instituted. In 2010, for an associate professor the floor was $102k and for a full professor $144k. Since implementation, NIH funding has gone from #35 national to #21. The US News World Report ranking has gone from #34 to #19.
Martin Lipton, Chair, NYU Board of Trustees
Senator Jacobs expressed concern regarding a discussion about the Board of Trustees making money with their relationship with the university. Martin Lipton clarified that he is unaware of any of the members of the Board of Trustees making money with the university. Lipton added that the Vice Chair of the Board of Trustees contributed about $1 billion dollars to the university over the last twelve years or so. There is a very strict conflict of interest policy that everyone on the board signs.
Lipton confirmed that faculty will be represented on the search committee for the next president of NYU. The search committee welcomes any suggestions. The process will be completely transparent exception of the candidates’ identities. A senator asked if there will be space for elected representatives. Lipton noted that the faculty representation will be pooled from elected representatives. A senator inquired about favoritism regarding internal and external candidates. Lipton expressed that there is no view regarding favoritism. As of right now, there is no stand out candidate internally. It is a tough position to fill. An external candidate who is not familiar with the multitude of schools and complexities of this university is going to have a fairly long period to become familiar with everything. Hopefully, a stand out internal candidate will come forward and apply.

Another senator inquired about any emerging challenges the incoming president might have to deal with while in office. Lipton mentioned a challenge would be an impact of technology at a research university and the cost of education. Another challenge would be the integration of domestic operations at the Square, Abu Dhabi, and Shanghai. Lipton emphasized that the incoming president will have to be a champion fundraiser. The university needs to raise $1 million dollars a day for a year ($350 million dollars) to keep the budget balanced. Being a fundraiser is a key element in the selection of the incoming president. Lipton suggested the incoming president to be a Distinguished Scholar.
Lipton announced that his term as chair will be up in mid-2015. The nominating committee has unanimously recommended for election of Chair Designate to parallel with Lipton until next year. The person will be Bill Berkley who is Vice Chair of the Board. Lipton determined that Berkley will most likely succeed him as Chair of the Board.
ADJOURNMENT The meeting adjourned at 2:30 PM.

Background: At its meeting of February 20, 2014, the Faculty Senators Council (FSC) discussed and approved a resolution to accept language developed at the request of the FSC and by members of the FSC Governance Committee in conjunction with members of the University Administration to be inserted into the Faculty Handbook that provides for the procedure to amend the Faculty Handbook. That language contains the sentence: Nothing in this Handbook constrains the Board of Trustees from making changes to this Handbook with respect to any matter, and in the manner, it finds appropriate in carrying out its duties; and administration will notify the Executive Committee of the Faculty Senators Council if the Board of Trustees makes any change to the Faculty Handbook”, which provoked objections during FSC discussion, as it appears to be inconsistent with the Five Principles of Shared Governance adopted by the FSC and subsequently approved by the Board of Trustees, and inserted into the Faculty handbook. After the FSC approved the February 20, 2014 resolution some Senators received objections to the afore mentioned sentence from their constituents on the grounds that it appears to contradict the Five Principles of Shared Governance, and these objections were raised in discussion at the April 10, 2014 meeting of the FSC, where a new resolution to rescind the February 20, 2014 resolution was introduced, discussed, and failed to be adopted. During discussion it was suggested that the FSC might, instead of rescinding its February 20, 2014 resolution, propose a new resolution asking for assurances that the Board of Trustees will consult with the FSC before amending the Faculty Handbook except in exceptional circumstances. Resolution: WHEREAS, the Faculty Senators Council recognizes the legal right of the Board of Trustees to make changes to the Faculty Handbook with respect to any matter, and in the manner it finds appropriate in carrying out its duties, and WHEREAS, the Five Principles of Shared Governance are the recognized procedures by which the opinions of the elected representatives of the Faculty on matters that affect the Faculty are heard by the University Administration and. through them, by the Board of Trustees whenever relevant. RESOLVED, the Faculty Senators Council fully expects that the BoT will, except in exceptional circumstances, act in accordance with the principles of shared governance and consult with faculty prior to amending the Handbook and/or related (linked) policies affecting faculty. The Faculty Senators Council asks for assurances from the Board of Trustees to this effect.
FSC Meeting 5/8/14, Document A, Page 1
1
RESOLUTION TO AMEND THE FACULTY SENATORS COUNCIL RULES ON STANDING COMMITTEES
PRESENTED BY THE PERSONNEL POLICIES & TENURE MODIFICATIONS COMMITTEE Warren Jelinek, Co-Chair
Charlton McIlwain, Co-Chair Allen Mincer
Arthur Tannenbaum Benard Dreyer Celia Stewart David Backus
Herbert Samuels Salah Al-Askari
Victoria Stanhope
MARCH 8, 2014
WHEREAS: Inclusion, equity and diversity amongst Faculty, Students and administration is a priority for New York University; and WHEREAS: The Faculty Senators’ Council should play an integral role in advancing these priorities; and WHEREAS: A committee that is single-minded in its focus is necessary to fully address these priorities; it is RESOLVED: Section VI.1(K) of the Faculty Senators Council Rules shall be amended as follows: A). The name of the standing committee shall be AFFRIMATIVE ACTION. B). The current committee description shall be stricken in its entirety and replaced with the following:
collect, review, & disseminate institutional data as it relates to the representation and academic standing of underrepresented groups of faculty and students; serve as a liaison between the FSC and the Office of Equal Opportunity, Office of the Provost for Diversity, and Office of Institutional Research on policies and procedures that affect matters related to inclusion, equity, and diversity; and develop proposals for programs that further advance the university’s affirmative action mission.
RESOLVED: Section VI.1(L) of the Faculty Senators Council Rules shall be amended as follows:
FSC Meeting 5/8/14, Document B, Page 1

2
A). The name of the standing committee shall be PERSONNEL & TENURE MODIFICATIONS. B). The committee description will read: reviews University personnel policies and practices that affect the faculty, considers any proposals affecting tenure; and examines problems experienced under tenure rules and considers alternative solutions.
FSC Meeting 5/8/14, Document B, Page 2

1
PERSONNEL POLICIES & TENURE MODIFICATION COMMITTEE
Warren Jelinek, Co-Chair Charlton McIlwain, Co-Chair
Allen Mincer Arthur Tannenbaum
Benard Dreyer Celia Stewart David Backus
Herbert Samuels Salah Al-Askari
Victoria Stanhope
REPORT ON FACULTY & STUDENT DIVERSITY Presented in Advance of the May 8, 2014 Meeting of the Faculty Senators Council
The following report details the Personnel Policies & Tenure Modifications Committee’s efforts this year with respect to inclusion, equity and diversity at NYU. Given what appear to be disparate impressions across the university about where we stand on these matters with respect to both faculty and students, and motivated by a desire to understand how the Faculty Senators’ Council might assist in achieving the affirmative action mission of the university, we outlined the following goals at the beginning of the 2013-2014 academic year:
• To inquire about, and assess the current state of inclusion (are members of traditionally underrepresented groups represented in adequate numbers amongst the faculty and student body?), equity (are faculty from traditionally underrepresented groups – primarily race/ethnicity and gender treated equitably across the university with respect to compensation, benefits, etc.?), and diversity (how does the university foster an intellectually diverse environment?);
• To survey new and continuing programs across NYU’s schools and administrative offices
that seek to enhance NYU’s diversity mission; and
• To make recommendations to the FSC and administration about ways that we might enhance efforts to further institutionalize inclusion, equity and diversity at NYU; and to make our findings and recommendations accessible to the faculty and members of the university community at large.
To these ends, the committee initiated the following actions:
• Established a relationship and interfaced with NYU’s Office of Equal Opportunity;
FSC Meeting 5/8/14, Document C, Page 1
2
• Initiated a request for information about the institution’s process for collecting faculty race/ethnicity data; and
• Initiated a request for information about the current state of diversity at NYU with respect
to both faculty and students. The remainder of this report provides a detailed summary of these actions. The Office of Equal Opportunity The Committee and Co-Chair met with members of the Office of Equal Opportunity (OEO), including its Executive Director, Mary Signor, Deputy Director, Craig Jolley, and Equal Opportunity Specialist, Kelle Colyer-Brown. The OEO’s primary tasks is to develop and carry out the affirmative action mission of the university (including collecting demographic data on faculty and other university personnel, assisting schools and departments in faculty recruitment and hiring, and monitoring university progress on diversity benchmarks, enforcing Title IX, and coordinating the Americans With Disabilities Act (ADA). Members of the OEO briefed the committee on its mission, and resources available through its office to assist schools and departments across the university in recruiting diverse faculty members. These include, but are not limited to, (free) resources that help faculty search committees identify, target and place job postings in venues that reach diverse populations, provide advice to search committees on developing effective language for recruitment materials, and training on effective search process and protocols for securing diverse faculty, from the recruitment phase through the interview phase and hiring. This also includes training on how to mitigate the affects of unconscious bias during the search process. Through our interactions, we determined that both faculty and the OEO would benefit greatly from any efforts that can be undertaken to make schools, department chairs, and faculty at large aware of both the existence of, and resources available from the OEO, and the input that faculty might provide to enhance any of the initiatives and/or resource offerings available by the OEO. Faculty/Student Diversity Information Request Much of the committees’ efforts focused on developing a request for information and data that would help us to better understand the current landscape of diversity with respect to the representation of faculty and students from traditionally underrepresented racial/ethnic groups at NYU, as well as the historical trends that provide context for interpreting the current state of affairs. Our entire set of initial questions that formed the basis for this information request can be found in Appendix A. Our initial questions sought insight into a number of different areas such as numerical representation, faculty trajectory (tenure/tenure track, contract, promotion, etc.), student trajectory (graduation rates, changes in major, etc.), and salary distinctions by school and distinguished by both race/ethnicity and gender. Given some limitations of both human and existing data resources, our information request was narrowed considerably and the decision was made to focus largely on representation data that included in areas where available data allowed us to compare NYU with a number of similar, high-research universities. Details about how and why we made this decision to narrow the data request can be found in Appendix B.
FSC Meeting 5/8/14, Document C, Page 2

3
The results of our data request is collated in a report found in Appendix C, which includes a summary of the data by Rachel Maxwell, Director of Reporting and Survey Research at NYU’s Office of Institutional Research & Data Integrity. While all the details can be found in the summary report and data visualizations, a number of interesting general results/trends should be highlighted.
• There has been relatively little change since 2003 in the proportions of faculty from historically underrepresented groups. As a percent of all tenured/tenure-track faculty in 2011, those identifying as White make up 78%, a one percent decrease from their proportion in 2003; those identifying as Asian make up 9%, a two percent increase since 2011; Black 5%, the same as 2003), Hispanic 4%, a one percent increase since 2003); and Nonresident Aliens 4%, a two percent decrease since 2003. These trends are generally consistent with comparative institutions.
• Compared to 2003, a greater percentage of our total current faculty is non-tenure
track. The overall proportion of tenure/tenure track faculty has decreased twelve percent from 2003 to 2011, while the overall proportion of non-tenure track faculty increased twelve percent during the same time. Similarly, the proportion of tenured/tenure-track faculty from all racial ethnic groups decreased from 2003 to 2011 (non-resident aliens representing the greatest decrease, and Hispanic representing the lowest decrease), while each groups’ proportion of non-tenure track faculty increased over the same period. Each of these trends is consistent with comparative institutions.
• While Asian and international students have significantly increased their
representation among the undergraduate student body, Hispanic student growth has been marginal, and African Americans’ stagnate. As a percent of total undergraduate enrollment in 2012, White students account for 40% (-1 from 2003); Asian students, 19% (+5); Nonresident Alien students, 12% (+8); Hispanic students, 10% (+3); Black students, 5% (same). Students for whom race/ethnicity is unknown is 12% (-16). Our current percentage of Asian students outpaces comparator institutions significantly, while the percentages for all other groups are slightly above or below the median percent of comparative institutions.
• We excel at graduating all of our undergraduate students, compared to similar
institutions. Considering undergraduate cohorts from 2004 to 2013, a significantly greater proportion of our students (from all racial/ethnic groups) as compared to other institutions graduate within six years. Among our students alone, Asian students have the highest rate of graduation (89%) and African Americans have the lowest (79%); the former represents a five percent increase in 2013 from 2004, the latter, a ten percent increase.
These are among the trends that deserve greater attention in the coming years. Particularly, these data prompt questions about what NYU can and should do to not just to be average when it comes to the representation of underrepresented groups of both faculty and students. Rather, we might ask, how can we lead and become an exceptional model of diversity? With respect to the
FSC Meeting 5/8/14, Document C, Page 3

4
growth of our international student population and relatively flat representation of members of underrepresented groups – particularly Black and Hispanic – we might ask ourselves how we can use our institutional stature, and international presence to further expand both aspects of student diversity? Additionally, while we do exceptionally well in graduating all of our students, in the future we should delve further, and on a school-by-school basis, into graduation rates with respect to the fields of study students chose at the beginning of their NYU career. That is, we should ensure that students from underrepresented minority groups in particular are receiving the necessary support – from faculty, staff and the university – to pursue and achieve a degree in the field they came to NYU to earn. Finally, we should look further into the trends with respect to the decline of tenure track faculty and growth of contract faculty as a proportion of university faculty. With respect to diversity specifically, we should further inquire whether we are expanding our faculty diversity by simply adding to the ranks of our contract faculty, at the expense of efforts to recruit greater numbers of tenure-tenure track faculty. Further inquiry into these data will require access to school-level data that can be compared across schools and with respect to the university as a whole. Faculty Self-Identification “New York University (NYU) is subject to certain nondiscrimination and affirmative action recordkeeping and reporting requirements for the administration of civil rights laws and regulations. In order to comply with these laws, NYU invites applicants and employees to voluntarily self-identify their race/ethnicity. Submission of this information is voluntary and refusal to provide it will not subject you to any adverse treatment. The information obtained will be kept confidential and may only be used in accordance with the provisions of applicable federal laws, executive orders, and regulations, including those which require the information to be summarized and reported to the federal government for civil rights enforcement purposes.”1 Beyond the official purposes for which this data collection and reporting are required by federal law, the committee believes that collection of, and access to these data are crucial to understand the state of diversity at NYU, and as a foundation for setting affirmative action goals and monitoring progress. Central to this is determining what opportunities Faculty members have to identify their racial/ethnic identity if they choose to do so, and the process that the university and schools use to collect this information. Though the OEO is responsible for reporting this information, when it is collected, it is collected by the schools and then passed on to the OEO. As was reported to us, the Schools are not uniform in whether they collect the data, at what stage the data is collected, or their respective processes for communicating this information to OEO. As a response to the committee’s questions, the OEO polled each of NYU’s 15 Schools (not including NYU-Poly) about their respective process and found that:
• Most schools offer the invitation to self-identify only after faculty applicant has been offered a position (i.e., there is no data to monitor the demographic make up of faculty applicant pools);
1 http://www.nyu.edu/about/policies-guidelines-compliance/equal-opportunity/affirmative-action/invitation-to-self-identify.html
FSC Meeting 5/8/14, Document C, Page 4

5
• The invitation is extended by the local (School) HR office; and
• Schools offering the invitation post-offer have a 100% response rate, while those offering the invitation during the application stage report a 33% response rate.
The full details of this survey can be found in Appendix D. While the committee understands, and is sympathetic to the NYU school-based structure of local control and local decision making (including choices about various tools for information collection, etc.) the committee believes that some effort must be undertaken to ensure that all schools are making their best possible efforts to provide an invitation to self-identify to its faculty, and that there is some process whereby schools are routinely and seamlessly able to communicate their data to the OEO. Again, the committee believes that whatever the process, we must have regular and up-to-date data about faculty diversity readily available if we hope to both develop goals for increasing faculty diversity, and monitor our progress for reaching those goals.
FSC Meeting 5/8/14, Document C, Page 5

Appendix(A.(PPTM(Committee(Request(for(Information((
FACULTY(!Q1:$$ For$each$AY$200312013:$!
a. What!percentage!of!each!identified!racial/ethnic!group!are/were!represented!amongst!tenured!associate!and!tenured!full!professors!(by!gender!and!school)?!
!b. What percentage of each identified racial/ethnic group!were/are!represented!
amongst!tenure:track!faculty!(by!gender!and!school)?!!
c. What!percentage!of!each!identified!racial/ethnic!group!were/are!represented!among!contract!faculty!providing!full:time!service!to!the!university!(by!gender!and!school)?!
!d. What!percentage!of!each!identified!racial/ethnic!group!(by gender and school)
hired on tenure-track lines subsequently received tenure?!!
e. What!percentage!of!each!identified!racial/ethnic!group!(by gender and school) tenured at the associate rank was promoted to full professor? !
!f. What!percentage!of!each!identified!racial/ethnic!group!was/is!represented!
among!Deans!(all!levels),!Provosts!and!executive:level!administrators?!
g. What were/are are the mean and median salaries of tenured/tenure-track faculty (by gender, rank, and School), and what is the mean/median rate of salary increase among tenured/tenure-track faculty (by gender, rank, and School)?!
!!Q2:!! What!is!the!process!and!mechanism!by!which!faculty!are!invited!to!self:! identify!their!racial/ethnic!group!identity?!!
a. At!what!point(s)!during!a!faculty!member’s!tenure!at!the!university!is!one!invited!to!self:identify?!
!b. In!what!form!and!from!what!office!(university!OEO,!individual!School!Deans!
or!School!HR!representatives,!Department!chairs,!etc.)!is!the!invitation!to!self:identify!communicated!to!faculty!members?!
!c. What!percentage!of!faculty,!on!average,!respond!to!the!request!to!self:
identify,!and!of!those!what!percentage!respond!with!the!choice!to!not!identify?!
!
FSC Meeting 5/8/14, Document C, Page 6

d. What!is!the!mechanism!and!process!used!to!identify!those!not!self:identified,!i.e.!what!form!of!visual!survey!and/or!other!information!is!used!to!identify!faculty!members?!
!STUDENTS
1. For each identified racial/ethnic groups of undergraduate students groups (by gender) in each AY 2003-2013 graduating classes:
• What percentage graduated within 4, 5, 6+ years of matriculation? • What percentage graduated with degrees in the: performing arts, social sciences,
“hard” sciences, education, business, or the humanities? • What percentage graduated with the same degree program in which the
matriculated? • For those whose degree areas changed, what percentage of students moved from
each degree area, and what percentage moved “to” each degree area? • What percentage transferred out of or left NYU before graduating?
2. For each AY 2003-2013:
• What is the percentage breakdown of each identified racial/ethnic group within
the undergraduate student population (by gender and school)?
• What is the percentage breakdown of each identified racial/ethnic group within the graduate student population (by gender and school)?
3. What percentage of undergraduates from each identified racial/ethnic group found
employment within their general field of study within one year following graduation? What percentage of those not employed within one year continued on to post-secondary education?
!!!!!!
FSC Meeting 5/8/14, Document C, Page 7

Office of Equal Opportunity 726 BROADWAY, ROOM 721 NEW YORK, NEW YORK 10003 TELEPHONE: 212 998 2352 FACSIMILE: 212 995 4037
Meeting Minutes Memorandum
Re: Faculty Senators Council’s Request for Information January 23, 2014
Location: OAA/OEO Conference Room, 726 Broadway, Room 723 Attendance: Charlton McIlwain, Associate Professor, Co-Chair, Faculty Senators Council
Peter Gonzalez, Assistant Provost for Academic Appointments Daniel Dunphy, Director, HR Applications and Reporting Rachel Maxwell, Associate Director, Institutional Research Kelle Colyer-Brown, Equal Opportunity Specialist, Office of Equal Opportunity Mary Signor, Executive Director, Office of Equal Opportunity Mary Signor opened discussions by explaining that the purpose of today’s meeting was to brief Professor Charlton McIlwain on the progress made to date regarding the Faculty Senators Council’s (FSC) Request for Information dated October 29, 2013. Ms. Signor explained that the Office of Equal Opportunity asked the Division of Human Resources, Office of Academic Appointments (OAA), and Institutional Research (IR) for their assistance in gathering the requested information and that clarification was needed for certain questions posed by the FSC. Rachel Maxwell provided seven (7) charts representing the demographic population of New York University (NYU) students in differing formats (e.g., graduation rates by gender and entering cohort year, baccalaureate degrees conferred by discipline, etc.). Ms. Maxwell explained, however, that it would be difficult to interpret this information without the availability of national data or comparative benchmarks set by other private Universities. She further explained that the FSC’s request to provide demographic information for NYU students by gender and ethnicity combined raises concerns under the Family Educational Rights and Privacy Act (FERPA). The breakdown of students by gender and ethnicity is too small (pools of less than 5 individuals) and would unintentionally identify minority students, which could serve as a FERPA violation and the unauthorized disclosure of a student’s record without written consent. Daniel Dunphy then explained that there is limited peer data available regarding the faculty demographics. NYU and its peer institutions submit annual reports on their demographic information to the Integrated Postsecondary Education Data System (IPEDS) as required by the Higher Education Act of 1965, as amended. IPEDS gathers this information from every university, college, and technical/vocational institutional that participates in federal student
FSC Meeting 5/8/14, Document C, Page 8

2
financial aid programs, which can then be used to describe and analyze trends in postsecondary education in terms of student enrollment, staff employed, dollars expended, and degrees earned. This accuracy of information provided to IPEDS is unclear because it is unknown what systems are being used at other colleges and universities to gather data. Mr. Dunphy stated that while nationally trends may reveal that there are gaps in terms of tenured associate professors in certain underrepresented groups, we do not have any framework to go on without the requisite base-line information for comparison. Mr. Dunphy stated that it may be more accurate to explain where we are at as an institution in terms of making progress in our diversity numbers. For example, are we recruiting students from these underrepresented groups and graduating them? What happens when we recruit these diverse students, admit them and then they choose to enter another college or university? We have no way of tracking why these students choose another college or university after admittance. Regarding faculty, Mr. Dunphy and Ms. Maxwell expressed that low turnover rates complicated attempts to identify trends over time and may not wholly reflect the results of recent outreach efforts. It was suggested that the analysis begin with a broad view, perhaps identifying patterns in the New Hire population, and within the Tenure-track vs. Non Tenure-track populations. Mr. Dunphy and Ms. Maxwell further explained that the definitions used by IPEDS is not the same across all categories and ranks causing inconsistencies in its data. IPEDS excludes certain data (e.g., anyone uncompensated without pay would not be counted), and some definitions changed in 2010. Notwithstanding the above, however, it was determined that for purposes of responding to the FSC’s request for data, Ms. Maxwell and Mr. Dunphy would continue to use IPEDS as the primary source for information. It was agreed that information for the faculty would be presented using the six (6) ranks / categories utilized by the IPEDS. Ms. Maxwell indicated that she should be able to provide the requested information on or before March 1, 2014. Professor McIlwain noted that it would be his expectation that this information could be presented to the FSC Personnel Committee at its March/April 2014 meeting. He further stated that it is the hope of the FSC to use this information to incorporate ways to improve the University’s overall diversity efforts in recruiting underrepresented students and faculty.
FSC Meeting 5/8/14, Document C, Page 9

New York University Faculty and Student Peer Diversity Trends Report
Office of Institutional Research and Data Integrity April 2014
FSC Meeting 5/8/14, Document C, Page 10

Faculty and Student Peer Diversity Trends Report Spring 2014
TableofContents
Summary ....................................................................................................................................................... 1 Undergraduate Enrollment Trends by Gender and Race/ Ethnicity .......................................................... 4 Undergraduate Six‐year Graduation Rates by Gender and Race/Ethnicity ............................................. 12 Full‐time Faculty Demographic Trends by Gender and Race/Ethnicity .................................................... 20 Full‐time Faculty Trends by Faculty Status and Race/Ethnicity ................................................................ 29
Peer School List .......................................................................................................................................... 29
FSC Meeting 5/8/14, Document C, Page 11

New York University Office of Institutional Research and Data Integrity Faculty and Student Peer Diversity Trends Report
NYU and Other Carnegie Classified Very High Research Activity Institutions Introduction and Data Description This report examines faculty and student diversity trends for NYU and for the 297 other Carnegie classified very high research activity institutions using data from the National Center for Education Statistics (NCES). (Please refer to the last page of this packet for the full list of 297 institutions.) The student and faculty data use institution‐level data submissions for Enrollment, Graduation Rates, and Human Resources forms, which are a federal reporting requirement. The student enrollment information is from each institution’s fall census date, which is typically at the end of the third week of classes. The student diversity data shows undergraduate demographic trends from fall 2003 to fall 2012 in gender and race/ethnicity. The graduation rates information in this report include the first‐time, full‐time baccalaureate‐seeking freshman cohort six‐year graduation rates for the 2004 to 2013 reporting years. The faculty information shows fall 2003 to fall 2011 full‐time faculty who are not part of a medical school. This section shows data from the NCES Human Resources form that includes faculty who are on the institution’s payroll as of November 1. The faculty race and ethnicity data are from odd number years; 2011 is the most recent publicly available data. Unless otherwise noted, all comparative points for the other very high research activity institutions refers to the median value represented by those schools. Race and ethnicity categories are self‐identified by the student or faculty member. Nonresident alien students and faculty are not included in their identified race/ ethnicity categories, but categorized as nonresident alien; this follows federal and state reporting standards. Several race/ethnicity categories ‐‐ American Indian/ Alaska Native, Native Hawaiian or other Pacific Islander, and faculty who identify as two or more races ‐‐ are included in the denominator, but are not shown in the report due to too few faculty and students represented in those categories.
Office of Institutional Research and Data Integrity V.P. for Enrollment Management and University Institutional Research
1 Faculty and Student Peer Diversity Trends Report April 27, 2014
FSC Meeting 5/8/14, Document C, Page 12

Student Trends
Undergraduate Enrollment Diversity Trends The undergraduate enrollment section shows fall 2003 to fall 2012 undergraduate demographic trends, including gender and ethnicity, for NYU and for other very high research activity institutions.
NYU has a higher proportion of female undergraduate students than other very high research activity institutions.
Further, NYU has a higher proportion of undergraduate students who identify as Asian, Hispanic, and a higher proportion of non‐resident alien students. The other very high research activity institutions have a higher proportion of undergraduate students who identify as White; there is a similar proportion of undergraduate students who identify as Black or African American for NYU and for other very high research activity schools.
Between 2004 and 2012, the biggest shift in undergraduate diversity trends at NYU is an eight‐percentage point decrease in the proportion of students who identify as White and a ten‐percentage point increase in nonresident alien students. The biggest shift at other very high research activity institutions, between 2004 and 2012, is a seven‐percentage point decrease in the proportion of students who identify as White.
NYU has a higher proportion of student with an unknown race or ethnicity than other very high research activity institutions. Although, the gap between NYU and the other schools decreases over the reporting years, in 2012, NYU’s Unknown category is still nine‐percentage points higher than the other schools (12% “Unknown” for NYU, 3% “Unknown” for other very high research activity schools). Between 2003 and 2012, excluding the "Unknown" category from the denominator, the proportion of NYU students who identify as White decreases from 57 percent in 2003 to 46 percent in 2012. In contrast, between 2003 and 2012, including the “Unknown category in the denominator, the proportion of NYU students who identify as White decreases from 41 percent in 2003 to 40 percent in 2012.
Six‐year Baccalaureate Graduation Rates The graduation rates in this report tracks the six‐year graduation rate for the first‐time, full‐time baccalaureate degree‐seeking freshman cohorts. The year refers to reporting year and not the cohort year. For example, the 2013 data refers to the six‐year graduation rates that institutions reported to NCES in 2013 for the 2007 entering first‐time, full‐time baccalaureate degree‐seeking freshman cohort.
For all reporting years, NYU has a six‐year graduation rate that is higher than other very high research activity institutions. However, NYU’s six‐year graduation rate increased at a slower rate than the other very high research activity institutions. This is true across gender and all race/ethnicity categories.
Female students at NYU and other very high research activity institutions have, on average, a higher graduation rate than male students.
In 2013, students who identify as Black or African American at NYU and at other very high research activity institutions have the lowest graduation rate, and students who identify as Asian at NYU and students who identify as White at other very high research activity institutions have the highest graduation rate.
Between 2004 and 2013, graduation rates increased at NYU and at other very high research activity institutions across all race/ethnicity categories. The largest increase in graduation rates at NYU is for students who identify as Black or African American and at other very high research activity institutions the largest increase is for students who identify as Hispanic.
Office of Institutional Research and Data Integrity V.P. for Enrollment Management and University Institutional Research
2 Faculty and Student Peer Diversity Trends Report April 27, 2014
FSC Meeting 5/8/14, Document C, Page 13
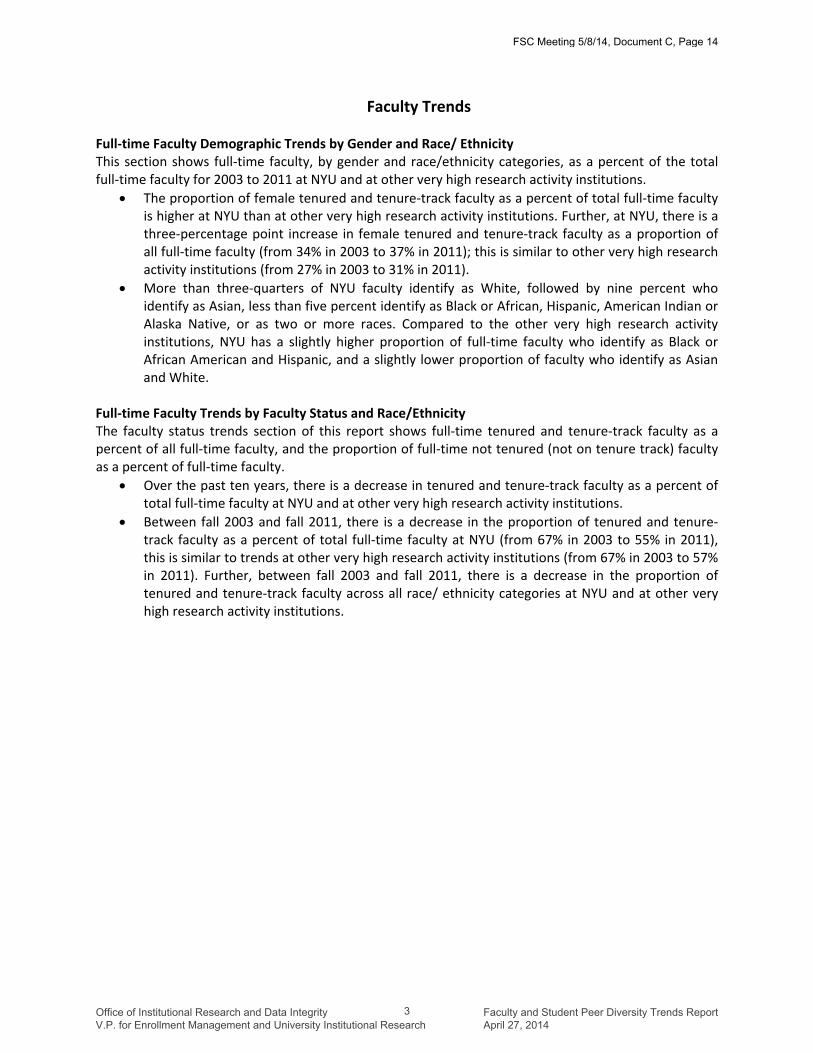
Faculty Trends Full‐time Faculty Demographic Trends by Gender and Race/ Ethnicity This section shows full‐time faculty, by gender and race/ethnicity categories, as a percent of the total full‐time faculty for 2003 to 2011 at NYU and at other very high research activity institutions.
The proportion of female tenured and tenure‐track faculty as a percent of total full‐time faculty is higher at NYU than at other very high research activity institutions. Further, at NYU, there is a three‐percentage point increase in female tenured and tenure‐track faculty as a proportion of all full‐time faculty (from 34% in 2003 to 37% in 2011); this is similar to other very high research activity institutions (from 27% in 2003 to 31% in 2011).
More than three‐quarters of NYU faculty identify as White, followed by nine percent who identify as Asian, less than five percent identify as Black or African, Hispanic, American Indian or Alaska Native, or as two or more races. Compared to the other very high research activity institutions, NYU has a slightly higher proportion of full‐time faculty who identify as Black or African American and Hispanic, and a slightly lower proportion of faculty who identify as Asian and White.
Full‐time Faculty Trends by Faculty Status and Race/Ethnicity The faculty status trends section of this report shows full‐time tenured and tenure‐track faculty as a percent of all full‐time faculty, and the proportion of full‐time not tenured (not on tenure track) faculty as a percent of full‐time faculty.
Over the past ten years, there is a decrease in tenured and tenure‐track faculty as a percent of total full‐time faculty at NYU and at other very high research activity institutions.
Between fall 2003 and fall 2011, there is a decrease in the proportion of tenured and tenure‐track faculty as a percent of total full‐time faculty at NYU (from 67% in 2003 to 55% in 2011), this is similar to trends at other very high research activity institutions (from 67% in 2003 to 57% in 2011). Further, between fall 2003 and fall 2011, there is a decrease in the proportion of tenured and tenure‐track faculty across all race/ ethnicity categories at NYU and at other very high research activity institutions.
Office of Institutional Research and Data Integrity V.P. for Enrollment Management and University Institutional Research
3 Faculty and Student Peer Diversity Trends Report April 27, 2014
FSC Meeting 5/8/14, Document C, Page 14

2003 2004 2005 2006 2007 2008 2009 2010 2011 2012
NYU 60%60%61%61%62%62%62%61%61%60%
Female Undergraduate Enrollment as Percent of Total Undergraduate Enrollment
Other Very High Research Activity Institutions 51%51%51%51%51%51%51%52%52%52%
New York University
Other Very High Research Activity Institutions
Female Undergraduate Enrollment as a Percent of Total Undergraduate Enrollment by InstitutionNYU Compared to Other Research Universities with Very High Research Activity***
2003 2004 2005 2006 2007 2008 2009 2010 2011 2012
30%
40%
50%
60%
70%
Percent 48%
52%54%
48%
52%54%
48%
52%54%
48%
51%54%
48%
51%54%
48%
51%53%
48%51%53%
48%
51%53%
48%51%53%
48%
51%53%
Source: National Center for Education Statistics*Based on 2010 Carnegie Classification. See institution list on last page.**Fall 2012 is the most recent student demographics data publicly available on race/ethnicity from the NCES.***Data labels indicate the 25th, 50th, and 75th percentile for other very high research activity institutions.
This page shows an overview of fall 2003 to fall 2012 demographic trends in undergraduate enrollment at NYU and at other very high research activity institutions. The views on this page show female undergraduate enrollment as a percent of total undergraduate enrollment. The top view shows the proportion of female students at NYU and the median value at other very high research activity institutions. For example, in 2012, female students represent slightly more than half of the undergraduate enrollment at other very high research activity institutions, and female students at NYU represent60% of undergraduate enrollment. The bottom view shows the range of female undergraduate enrollment as a percent of total undergraduate enrollment across all very high research activity institutions.For all years shown below, NYU has a higher proportion of female students than other very high research activity universities.
Undergraduate Enrollment Trends by GenderNYU and Other Very High Research Activity Institutions*
Fall 2003 to Fall 2012**
Office of Institutional Research and Data Integrity V.P. for Enrollment Management and University Institutional Research
4 Faculty and Student Peer Diversity Trends Report April 27, 2014
FSC Meeting 5/8/14, Document C, Page 15

2003 2004 2005 2006 2007 2008 2009 2010 2011 2012
NYU 40%40%39%39%38%38%38%39%39%40%
Male Undergraduate Enrollment as Percent of Total Undergraduate Enrollment
Other Very High Research Activity Institutions 49%49%49%49%49%49%49%48%48%48%
New York University
Other Very High Research Activity Institutions
Male Undergraduate Enrollment as Percent of Total Undergraduate Enrollment by InstitutionNYU and Other Very High Research Activity Instiutions***
2003 2004 2005 2006 2007 2008 2009 2010 2011 2012
30%
40%
50%
60%
70%
Percent
46%
48%
52%
46%48%
52%
46%48%
52%
46%
49%
52%
46%
49%
52%
47%49%
52%
47%
49%
52%
47%49%
52%
47%49%
52%
47%
49%
52%
Source: National Center for Education Statistics*Based on 2010 Carnegie Classification. See institution list on last page.**Fall 2012 is the most recent student demographics data publicly available on race/ethnicity from the NCES.***Data labels indicate the 25th, 50th, and 75th percentile for other very high research activity institutions.
This page shows an overview of fall 2003 to fall 2012 demographic trends in undergraduate enrollment for NYU and other very high research activity institutions. The views on this page show male undergraduate enrollment as a percent of total undergraduate enrollment. The top view shows the proportion of male students at NYU and the median value at other very high research activity institutions.For example, in 2012, male students represent a median value 49% of other very high research universities undergraduate enrollment and 40% of NYU's undergraduate enrollment. The bottom viewshows the range of male undergraduate enrollment as a percent of total undergraduate enrollment across all very high research activity institutions.
Undergraduate Enrollment Trends by GenderNYU and Other Very High Research Activity Institutions*
Fall 2003 to Fall 2012**
Office of Institutional Research and Data Integrity V.P. for Enrollment Management and University Institutional Research
5 Faculty and Student Peer Diversity Trends Report April 27, 2014
FSC Meeting 5/8/14, Document C, Page 16
NYU
2003 2004 2005 2006 2007 2008 2009 2010 2011 2012
Other Very High Research Activity Institutions
2003 2004 2005 2006 2007 2008 2009 2010 2011 2012
Asian
Black or African American
Hispanic
Nonresident alien
Race/ethnicity unknown
White 40%
12%
12%
10%
5%
19%
41%
14%
10%
9%
4%
19%
44%
13%
9%
8%
4%
20%
45%
15%
7%
8%
4%
20%
47%
15%
6%
8%
4%
19%
49%
15%
5%
7%
4%
18%
49%
16%
5%
8%
5%
17%
48%
19%
4%
8%
5%
16%
48%
19%
2%
8%
5%
16%
41%
28%
4%
7%
5%
14%
58%
3%
6%
7%
6%
8%
59%
3%
5%
7%
6%
8%
60%
3%
5%
6%
6%
8%
61%
5%
4%
6%
6%
9%
63%
6%
3%
5%
6%
8%
64%
5%
3%
5%
6%
8%
64%
5%
3%
5%
6%
8%
65%
5%
3%
5%
6%
8%
65%
5%
2%
5%
6%
8%
67%
5%
3%
4%
6%
8%
Race/Ethnicity Undergraduate Enrollment as a Percent of Total Undergraduate Enrollment
Race/EthnicityAsian
Black or African American
Hispanic
Nonresident alien
Race/ethnicity unknown
White
2003
2004
2005
2006
2007
2008
2009
2010
2011
2012
NYU
2003
2004
2005
2006
2007
2008
2009
2010
2011
2012
Other Very High Research Activity Institutions
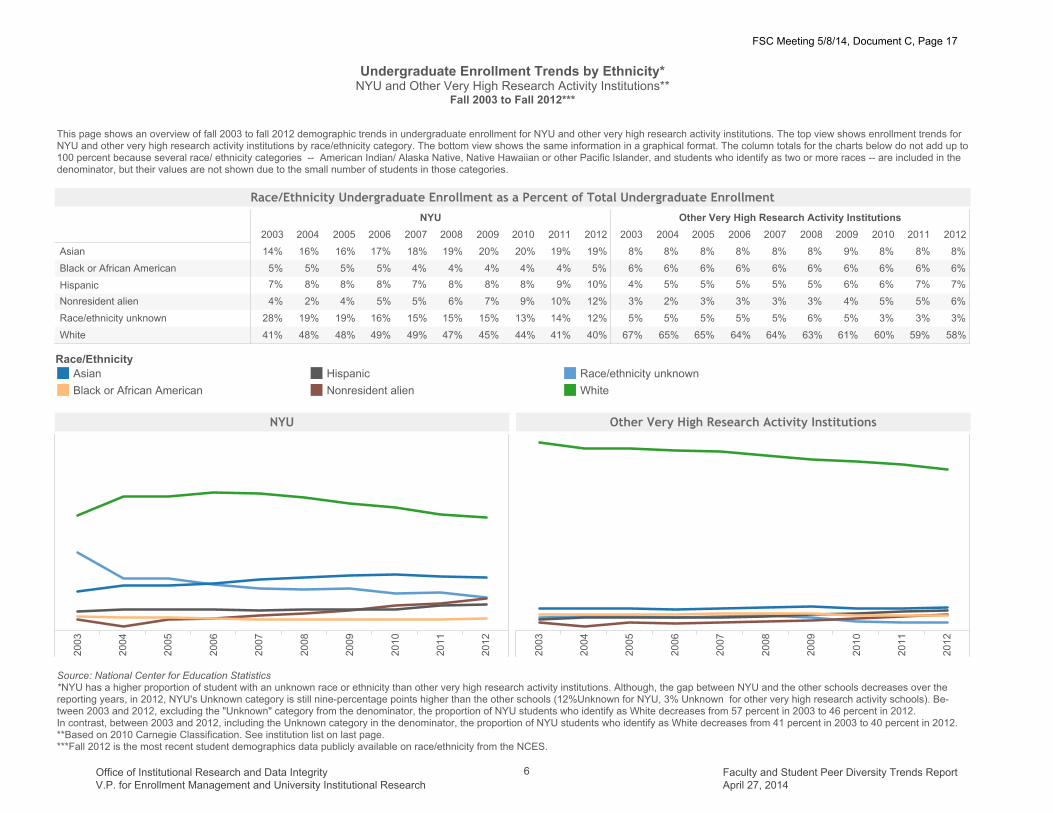
Source: National Center for Education Statistics*NYU has a higher proportion of student with an unknown race or ethnicity than other very high research activity institutions. Although, the gap between NYU and the other schools decreases over the reporting years, in 2012, NYU's Unknown category is still nine-percentage points higher than the other schools (12%Unknown for NYU, 3% Unknown for other very high research activity schools). Be-tween 2003 and 2012, excluding the "Unknown" category from the denominator, the proportion of NYU students who identify as White decreases from 57 percent in 2003 to 46 percent in 2012. In contrast, between 2003 and 2012, including the Unknown category in the denominator, the proportion of NYU students who identify as White decreases from 41 percent in 2003 to 40 percent in 2012.**Based on 2010 Carnegie Classification. See institution list on last page.***Fall 2012 is the most recent student demographics data publicly available on race/ethnicity from the NCES.
This page shows an overview of fall 2003 to fall 2012 demographic trends in undergraduate enrollment for NYU and other very high research activity institutions. The top view shows enrollment trends forNYU and other very high research activity institutions by race/ethnicity category. The bottom view shows the same information in a graphical format. The column totals for the charts below do not add up to100 percent because several race/ ethnicity categories -- American Indian/ Alaska Native, Native Hawaiian or other Pacific Islander, and students who identify as two or more races -- are included in thedenominator, but their values are not shown due to the small number of students in those categories.
Undergraduate Enrollment Trends by Ethnicity*NYU and Other Very High Research Activity Institutions**
Fall 2003 to Fall 2012***
Office of Institutional Research and Data Integrity V.P. for Enrollment Management and University Institutional Research
6 Faculty and Student Peer Diversity Trends Report April 27, 2014
FSC Meeting 5/8/14, Document C, Page 17

2003 2004 2005 2006 2007 2008 2009 2010 2011 2012
NYU 19%19%20%20%19%18%17%16%17%14%
Race/Ethnicity Undergraduate Enrollment as a Percent of Total Undergraduate EnrollmentRace/Ethnicity = Asian
Other Very High Research Activity Institutions 8%8%8%9%9%9%8%8%8%8%
New York University
Other Very High Research Activity Institutions
Race/Ethnicity Undergraduate Enrollment as a Percent of Total Undergraduate EnrollmentRace/Ethnicity = Asian
Very High Research Activity Institutions****
2003 2004 2005 2006 2007 2008 2009 2010 2011 2012
0%
20%
40%
60%
Percent
4%8%
15%
5%8%
16%
5%8%
16%
5%8%
16%
5%9%
16%
5%9%
17%
5%9%
17%
5%8%
17%
5%8%
17%
5%8%
18%
Source: National Center for Education Statistics*Several race/ ethnicity categories -- American Indian/ Alaska Native, Native Hawaiian or other Pacific Islander, and students who identify as two or more races -- are included in the denominator, but arenot shown in this report due to the small number of students in those categories. **Based on 2010 Carnegie Classification. See institution list on last page.***Fall 2012 is the most recent student demographics data publicly available on race/ethnicity from the NCES.****Data labels indicate the 25th, 50th, and 75th percentile for other very high research activity institutions.
This page shows enrollment trends for undergraduate students who identify as Asian as a percent of total undergraduate enrollment. The top view shows the proportion of students who identify as Asian atNYU and the median percentage of students who identify as Asian at other very high research activity institutions. For example, in 2012, students who identify as Asian represent a median value of 8% ofthe undergraduate enrollment at other very high research activity institutions and 19% of undergraduate enrollment at NYU. The bottom view shows the range of values for students who identify as Asianas a percent of total undergraduate enrollment across all very high research activity institutions. NYU has a higher proportion of students who identify as Asian than other very high research activity institutions.
Undergraduate Enrollment Trends by EthnicityIPEDS Race/Ethnicity Category = Asian*
NYU and Other Very High Research Activity Institutions**Fall 2003 to Fall 2012***
Office of Institutional Research and Data Integrity V.P. for Enrollment Management and University Institutional Research
7 Faculty and Student Peer Diversity Trends Report April 27, 2014
FSC Meeting 5/8/14, Document C, Page 18
2003 2004 2005 2006 2007 2008 2009 2010 2011 2012
NYU 5%4%4%4%4%4%5%5%5%5%
Race/Ethnicity Undergraduate Enrollment as a Percent of Total Undergraduate EnrollmentRace/Ethnicity = Black or African American
Other Very High Research Activity Institutions 6%6%6%6%6%6%6%6%6%6%
New York University
Other Very High Research Activity Institutions
2003 2004 2005 2006 2007 2008 2009 2010 2011 2012
0%
10%
20%
30%
40%
Percent
3%
6%
9%
3%
6%
9%
3%
6%
9%
3%
6%
9%
3%
6%
9%
4%
6%9%
3%
6%8%
3%6%8%
3%6%8%
3%6%8%
Race/Ethnicity Undergraduate Enrollment as a Percent of Total Undergraduate EnrollmentRace/Ethnicity = Black or African American
Very High Research Activity Institutions****
Source: National Center for Education Statistics*Several race/ ethnicity categories -- American Indian/ Alaska Native, Native Hawaiian or other Pacific Islander, and students who identify as two or more races -- are included in the denominator, but arenot shown in this report due to the small number of students in those categories. **Based on 2010 Carnegie Classification. See institution list on last page.***Fall 2012 is the most recent student demographics data publicly available on race/ethnicity from the NCES.****Data labels indicate the 25th, 50th, and 75th percentile for other very high research activity institutions.
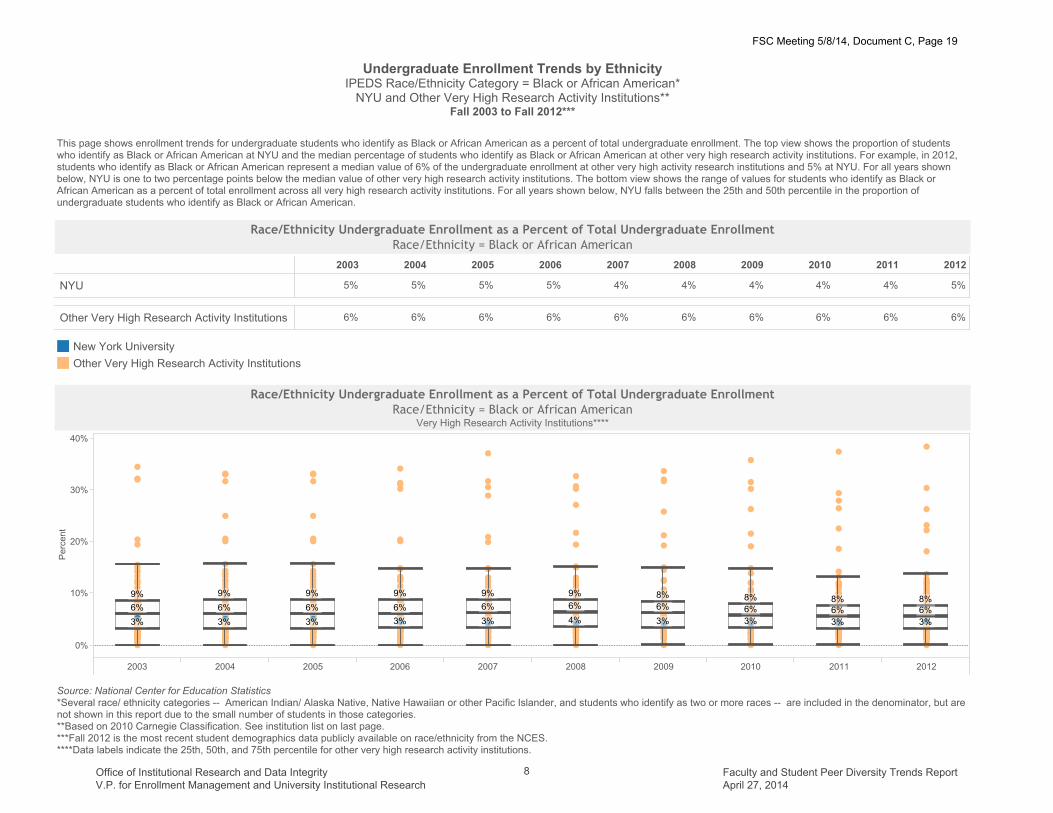
This page shows enrollment trends for undergraduate students who identify as Black or African American as a percent of total undergraduate enrollment. The top view shows the proportion of studentswho identify as Black or African American at NYU and the median percentage of students who identify as Black or African American at other very high research activity institutions. For example, in 2012, students who identify as Black or African American represent a median value of 6% of the undergraduate enrollment at other very high activity research institutions and 5% at NYU. For all years shown below, NYU is one to two percentage points below the median value of other very high research activity institutions. The bottom view shows the range of values for students who identify as Black orAfrican American as a percent of total enrollment across all very high research activity institutions. For all years shown below, NYU falls between the 25th and 50th percentile in the proportion of undergraduate students who identify as Black or African American.
Undergraduate Enrollment Trends by EthnicityIPEDS Race/Ethnicity Category = Black or African American*NYU and Other Very High Research Activity Institutions**
Fall 2003 to Fall 2012***
Office of Institutional Research and Data Integrity V.P. for Enrollment Management and University Institutional Research
8 Faculty and Student Peer Diversity Trends Report April 27, 2014
FSC Meeting 5/8/14, Document C, Page 19

2003 2004 2005 2006 2007 2008 2009 2010 2011 2012
NYU 10%9%8%8%8%7%8%8%8%7%
Race/Ethnicity Undergraduate Enrollment as a Percent of Total Undergraduate EnrollmentRace/Ethnicity = Hispanic
Other Very High Research Activity Institutions 7%7%6%6%5%5%5%5%5%4%
New York University
Other Very High Research Activity Institutions
2003 2004 2005 2006 2007 2008 2009 2010 2011 2012
0%
10%
20%
30%
40%
Percent
2%4%
8%
3%5%
9%
3%5%
9%
3%5%
9%
3%5%
9%
3%5%
9%
3%6%
10%
4%6%
11%
4%
7%
11%
5%
7%
12%
Race/Ethnicity Undergraduate Enrollment as a Percent of Total Undergraduate EnrollmentRace/Ethnicity = Hispanic
Very High Research Activity Institutions****
Source: National Center for Education Statistics*Several race/ ethnicity categories -- American Indian/ Alaska Native, Native Hawaiian or other Pacific Islander, and students who identify as two or more races -- are included in the denominator, but arenot shown in this report due to the small number of students in those categories. **Based on 2010 Carnegie Classification. See institution list on last page.***Fall 2012 is the most recent student demographics data publicly available on race/ethnicity from the NCES.****Data labels indicate the 25th, 50th, and 75th percentile for other very high research activity institutions.
This page shows enrollment trends for undergraduate students who identify as Hispanic as a percent of total undergraduate enrollment. The top view shows the proportion of students who identify as Hispanic at NYU and the median percentage of students who identify as Hispanic at other very high research activity institutions. For example, in 2012, students who identify as Hispanic represent a median value of 7% of the undergraduate enrollment at other very high research activity institutions and 10% at NYU. The bottom view shows the range of values for students who identify asHispanic as a percent of total enrollment across all very high research activity institutions. NYU has a slightly higher proportion of undergraduate students who identify as Hispanic than other very high research activity institutions.
Undergraduate Enrollment Trends by EthnicityIPEDS Race/Ethnicity Category = Hispanic*
NYU and Other Very High Research Activity Institutions**Fall 2003 to Fall 2012***
Office of Institutional Research and Data Integrity V.P. for Enrollment Management and University Institutional Research
9 Faculty and Student Peer Diversity Trends Report April 27, 2014
FSC Meeting 5/8/14, Document C, Page 20

2003 2004 2005 2006 2007 2008 2009 2010 2011 2012
NYU 12%10%9%7%6%5%5%4%2%4%
Race/Ethnicity Undergraduate Enrollment as a Percent of Total Undergraduate EnrollmentRace/Ethnicity = Nonresident alien
Other Very High Research Activity Institutions 6%5%5%4%3%3%3%3%2%3%
New York University
Other Very High Research Activity Institutions
2003 2004 2005 2006 2007 2008 2009 2010 2011 2012
0%
5%
10%
15%
Percent
2%
3%
5%
1%2%
3%
2%
3%
5%
2%
3%
5%
2%
3%
6%
2%
3%
7%
2%
4%
7%
2%
5%
8%
3%
5%
9%
3%
6%
10%
Race/Ethnicity Undergraduate Enrollment as a Percent of Total Undergraduate EnrollmentRace/Ethnicity = Nonresident alienVery High Research Activity Institutions****
Source: National Center for Education Statistics*Several race/ ethnicity categories -- American Indian/ Alaska Native, Native Hawaiian or other Pacific Islander, and students who identify as two or more races -- are included in the denominator, but arenot shown in this report due to the small number of students in those categories. **Based on 2010 Carnegie Classification. See institution list on last page.***Fall 2012 is the most recent student demographics data publicly available on race/ethnicity from the NCES.****Data labels indicate the 25th, 50th, and 75th percentile for other very high research activity institutions.
This page show undergraduate enrollment for nonresident alien students as a percent of total undergraduate enrollment. The top view shows the proportion of undergraduate nonresident alien students atNYU and the median percentage of nonresident alien students at other very high research activity institutions. Between fall 2003 and fall 2012, the proportion of nonresident alien undergraduate studentsat NYU increased at a higher rate than at other very high research activity institutions. Between fall 2003 and fall 2012, NYU's nonresident alien undergraduate enrollment increased eight percentagepoints -- 4% in 2003 to 12% in 2012-- compared to three percentage points -- 3% in 2003 to 6% in 2012 -- at other very high research activity institutions. The bottom view shows the range of values for undergraduate nonresident alien students as a percent of total undergraduate enrollment across all very high research activity institutions.
Undergraduate Enrollment Trends by EthnicityIPEDS Race/Ethnicity Category = Nonresident Alien*NYU and Other Very High Research Activity Institutions**
Fall 2003 to Fall 2012***
Office of Institutional Research and Data Integrity V.P. for Enrollment Management and University Institutional Research
10 Faculty and Student Peer Diversity Trends Report April 27, 2014
FSC Meeting 5/8/14, Document C, Page 21

2003 2004 2005 2006 2007 2008 2009 2010 2011 2012
NYU 40%41%44%45%47%49%49%48%49%41%
Race/Ethnicity Undergraduate Enrollment as a Percent of Total Undergraduate EnrollmentRace/Ethnicity = White
Other Very High Research Activity Institutions 57%59%60%61%62%63%64%65%65%67%
New York University
Other Very High Research Activity Institutions
2003 2004 2005 2006 2007 2008 2009 2010 2011 2012
20%
40%
60%
80%
100%
Percent
53%
67%
79%
52%
65%
77%
52%
65%
77%
52%
64%
77%
49%
63%
77%
49%
62%
77%
46%
61%
76%
46%
60%
75%
45%
59%
74%
44%
57%
72%
Race/Ethnicity Undergraduate Enrollment as a Percent of Total Undergraduate EnrollmentRace/Ethnicity = White
Very High Research Activity Institutions****
Source: National Center for Education Statistics*Several race/ ethnicity categories -- American Indian/ Alaska Native, Native Hawaiian or other Pacific Islander, and students who identify as two or more races -- are included in the denominator, but arenot shown in this report due to the small number of students in those categories. **Based on 2010 Carnegie Classification. See institution list on last page.***Fall 2012 is the most recent student demographics data publicly available on race/ethnicity from the NCES.****Data labels indicate the 25th, 50th, and 75th percentile for other very high research activity institutions.
This page shows undergraduate enrollment trends for students who identify as White as a percent of total undergraduate enrollment. The top view shows the proportion of students who identify as Whiteat NYU and the median percentage of students who identify as White at other very high research activity institutions. In 2012, students who identify as White represent a median value of 57% of the un-dergraduate enrollment at other very high research institutions and 40% at NYU. The bottom view shows the range of values for students who identify as White as a percent of total undergraduate enrollment across all very high research activity institutions.
Undergraduate Enrollment Trends by EthnicityIPEDS Race/Ethnicity Category = White*
NYU and Other Very High Research Activity Institutions**Fall 2003 to Fall 2012***
Office of Institutional Research and Data Integrity V.P. for Enrollment Management and University Institutional Research
11 Faculty and Student Peer Diversity Trends Report April 27, 2014
FSC Meeting 5/8/14, Document C, Page 22

Undergraduate Six-year Graduation Rates TrendsNYU and Other Very High Research Activity Institutions*
Reporting Years 2004 to 2013
This page shows the 2004 to 2013 first-time full-time baccalaureate-seeking freshman cohort six-year graduation rates at NYU and at other very high research activity institutions. (The year refers to theyear reported to NCES, not the entering cohort year.) The top view shows the six-year graduation rate at NYU and the median graduation rate at other very high research activity institutions. The secondview shows the six-year graduation rates across all very high research activity institutions. NYU has a higher overall graduation rate than the median value at other very high research activity institutionsfor all reporting years.
Six-year Graduation Rates
2004 2005 2006 2007 2008 2009 2010 2011 2012 2013
NYU 84%85%86%86%85%84%84%84%83%80%
Other Very High Research Activity Institutions 81%79%79%80%78%77%76%74%74%72%
New York University
Other Very High Research Activity Institutions
2004 2005 2006 2007 2008 2009 2010 2011 2012 2013
30%
40%
50%
60%
70%
80%
90%
100%
Graduation Rate
60%
72%
86%
60%
74%
86%
60%
74%
87%
61%
76%
88%
62%
77%
88%
63%
78%
88%
64%
80%
89%
64%
79%
90%
66%
79%
90%
66%
81%
90%
Graduation Rates by InstitutionVery High Research Activity Institutions**
*Based on the 2010 Carnegie Classification. See institution list on the last page.**Data labels indicate the 25th, 50th, and 75th percentile for other very high research activity institutions.Source: National Center for Education Statistics
Office of Institutional Research and Data Integrity V.P. for Enrollment Management and University Institutional Research
12 Faculty and Student Peer Diversity Trends Report April 27, 2014
FSC Meeting 5/8/14, Document C, Page 23

Undergraduate Six-year Graduation Rates Trends by GenderNYU and Other Very High Research Activity Institutions*
Reporting Years 2004 to 2013
This page shows the 2004 to 2013 first-time full-time baccalaureate-seeking freshman cohort six-year graduation rates at NYU and at other very high research activity institutions by gender. (The yearrefers to the year reported to NCES, not to the cohort year.) The top view shows the six-year graduation rate at NYU and the median graduation rate at other very high research activity institutions by gender. The second view shows the six-year graduation rates across all very high research activity institutions. NYU has a higher overall graduation rate than the median value at other very high research activity institutions for all reporting years across gender.
Six-year Graduation Rates by Gender
2004 2005 2006 2007 2008 2009 2010 2011 2012 2013
NYU Female
Male 82%
85%
85%
85%
87%
86%
85%
86%
86%
84%
83%
85%
84%
85%
85%
84%
82%
83%
78%
81%
Other Very High Research Activity Institutions Female
Male 78%
83%
77%
82%
77%
82%
76%
82%
76%
81%
74%
79%
73%
79%
72%
76%
71%
76%
69%
75%
New York University
Other Very High Research Activity Institutions
Female Male
2004
2005
2006
2007
2008
2009
2010
2011
2012
2013
2004
2005
2006
2007
2008
2009
2010
2011
2012
2013
63%
75%
87%
64%
76%
87%
64%
76%
88%
64%
79%
89%
66%
79%
89%
67%
81%
90%
68%
82%
90%
66%
82%
91%
69%
82%
90%
70%
83%
92%
55%
69%
84%
56%
71%
84%
57%
72%
85%
59%
73%
86%
58%
74%
86%
60%
76%
87%
60%
76%
88%
62%
77%
88%
63%
77%
89%
63%
78%
88%
Graduation Rates by Institution and GenderVery High Research Activity Institutions**
*Based on the 2010 Carnegie Classification. See institution list on the last page.**Data labels indicate the 25th, 50th, and 75th percentile for other very high research activity institutions.Source: National Center for Education Statistics
Office of Institutional Research and Data Integrity V.P. for Enrollment Management and University Institutional Research
13 Faculty and Student Peer Diversity Trends Report April 27, 2014
FSC Meeting 5/8/14, Document C, Page 24

Undergraduate Six-year Graduation Rates Trends by Ethnicity*NYU and Other Very High Research Activity Institutions**
Reporting Years 2004 to 2013
This page shows the 2004 to 2013 first-time full-time baccalaureate-seeking freshman cohort six-year graduation rates at NYU and at other very high research activity institutions by the IPEDS race/ethnicity category. (The year refers to the year reported to NCES, not to the entering cohort year.) The top view shows the six-year graduation rate at NYU and the median graduation rate at othervery high research activity institutions by IPEDS race/ethnicity category. The second view shows the same information in a graphical format. NYU has a higher overall graduation rate than the mediangraduate rate at other very high research activity institutions for all reporting years across all IPEDS race/ethnicity categories. Several race/ ethnicity categories -- American Indian/ Alaska Native, NativeHawaiian or other Pacific Islander, and students who identify as two or more races -- are included in the denominator, but are not shown in this report due to the small number of students in those categories.
NYU
2004 2005 2006 2007 2008 2009 2010 2011 2012 2013
Other Very High Research Activity Institutions
2004 2005 2006 2007 2008 2009 2010 2011 2012 2013
Asian
Black or African American
Hispanic
Nonresident alien
Race/ethnicity unknown
White
Overall 84%
83%
84%
80%
80%
79%
89%
85%
85%
81%
86%
82%
76%
91%
85%
86%
86%
83%
82%
78%
91%
82%
85%
86%
78%
82%
76%
92%
85%
85%
86%
85%
78%
77%
90%
84%
84%
84%
84%
80%
77%
90%
82%
82%
87%
87%
76%
78%
91%
82%
84%
86%
82%
77%
72%
90%
81%
81%
86%
79%
71%
71%
91%
76%
76%
89%
78%
72%
69%
84%
77%
82%
77%
76%
74%
68%
81%
75%
81%
78%
76%
72%
68%
81%
74%
80%
78%
74%
71%
67%
80%
74%
80%
80%
73%
70%
69%
80%
71%
77%
76%
71%
70%
67%
78%
71%
77%
75%
74%
69%
66%
78%
70%
77%
72%
72%
65%
66%
77%
69%
75%
68%
69%
68%
66%
77%
68%
74%
72%
71%
66%
60%
74%
68%
73%
70%
70%
65%
63%
73%
Six-year Graduation Rates by IPEDS Race/Ethnicity Categories
EthnicityAsian
Black or African American
Hispanic
Nonresident alien
Race/ethnicity unknown
White
NYU Other Very High Research Activity Institutions
2004
2005
2006
2007
2008
2009
2010
2011
2012
2013
2004
2005
2006
2007
2008
2009
2010
2011
2012
2013
*Excludes graduation rate information on students who identified as American Indian or Alaska Native, Native Hawaiian or Other Pacific Islander, or as two or more races due to the small number of stu-dents in these categories.**Based on the 2010 Carnegie Classification. See institution list on the last page.Source: National Center for Education Statistics
Office of Institutional Research and Data Integrity V.P. for Enrollment Management and University Institutional Research
14 Faculty and Student Peer Diversity Trends Report April 27, 2014
FSC Meeting 5/8/14, Document C, Page 25

Undergraduate Six-year Graduation Rates Trends by EthnicityIPEDS Race/Ethnicity Category = Asian
NYU and Other Very High Research Activity Institutions*Reporting Years 2004 to 2013
This page shows the 2004 to 2014 first-time full-time baccalaureate-seeking freshman cohort six-year graduation rates at NYU and at other very high research activity institutions for students who identifyas Asian. (The year refers to the year reported to NCES, not to the entering cohort year.) The top view shows the six-year graduation rate at NYU and the median graduation rate at other very high re-search activity institutions for students who identify as Asian. The second view shows the range of six-year graduation rates across all very high research activity institutions for students who identify asAsian. NYU has a higher overall graduation than the median graduation rate at other very high research activity institutions for all reporting years for students who identify as Asian.
Six-year Graduation RatesRace/Ethnicity = Asian
2004 2005 2006 2007 2008 2009 2010 2011 2012 2013
NYU 89%91%91%92%90%90%91%90%91%84%
Other Very High Research Activity Institutions 81%81%80%80%78%78%77%77%74%74%
New York University
Other Very High Research Activity Institutions
2004 2005 2006 2007 2008 2009 2010 2011 2012 2013
0%
20%
40%
60%
80%
100%
Graduation Rate 60%
74%
88%
62%
74%
90%
62%
77%
89%
63%
77%
89%
63%
78%
90%
63%
78%
91%
65%
80%
91%
66%
80%
91%
68%
81%
92%
69%
82%
92%
Graduation Rates by InstitutionRace/Ethnicity = Asian
Very High Research Activity Institutions**
*Based on the 2010 Carnegie Classification. See institution list on the last page.**Data labels indicate the 25th, 50th, and 75th percentile for other very high research activity institutions.Source: National Center for Education Statistics
Office of Institutional Research and Data Integrity V.P. for Enrollment Management and University Institutional Research
15 Faculty and Student Peer Diversity Trends Report April 27, 2014
FSC Meeting 5/8/14, Document C, Page 26
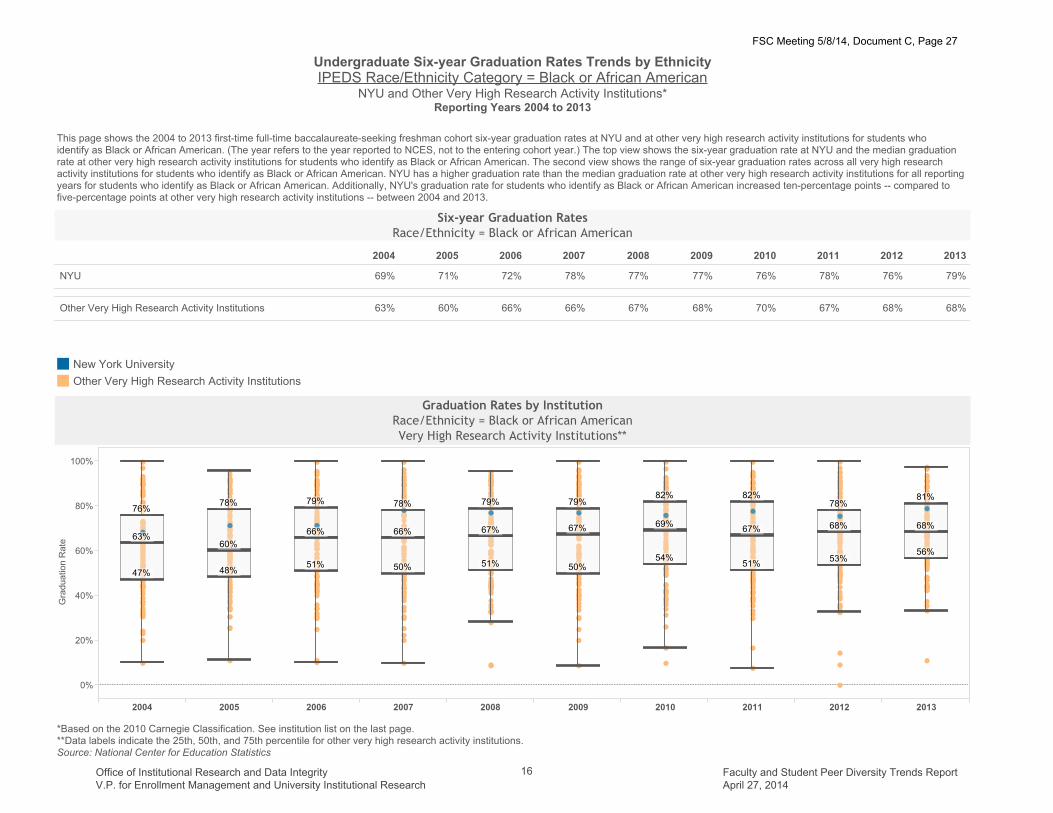
Undergraduate Six-year Graduation Rates Trends by EthnicityIPEDS Race/Ethnicity Category = Black or African American
NYU and Other Very High Research Activity Institutions*Reporting Years 2004 to 2013
This page shows the 2004 to 2013 first-time full-time baccalaureate-seeking freshman cohort six-year graduation rates at NYU and at other very high research activity institutions for students who identify as Black or African American. (The year refers to the year reported to NCES, not to the entering cohort year.) The top view shows the six-year graduation rate at NYU and the median graduationrate at other very high research activity institutions for students who identify as Black or African American. The second view shows the range of six-year graduation rates across all very high research activity institutions for students who identify as Black or African American. NYU has a higher graduation rate than the median graduation rate at other very high research activity institutions for all reportingyears for students who identify as Black or African American. Additionally, NYU's graduation rate for students who identify as Black or African American increased ten-percentage points -- compared to five-percentage points at other very high research activity institutions -- between 2004 and 2013.
Six-year Graduation RatesRace/Ethnicity = Black or African American
2004 2005 2006 2007 2008 2009 2010 2011 2012 2013
NYU 79%76%78%76%77%77%78%72%71%69%
Other Very High Research Activity Institutions 68%68%67%70%68%67%66%66%60%63%
New York University
Other Very High Research Activity Institutions
2004 2005 2006 2007 2008 2009 2010 2011 2012 2013
0%
20%
40%
60%
80%
100%
Graduation Rate
47%
63%
76%
48%
60%
78%
51%
66%
79%
50%
66%
78%
51%
67%
79%
50%
67%
79%
54%
69%
82%
51%
67%
82%
53%
68%
78%
56%
68%
81%
Graduation Rates by InstitutionRace/Ethnicity = Black or African AmericanVery High Research Activity Institutions**
*Based on the 2010 Carnegie Classification. See institution list on the last page.**Data labels indicate the 25th, 50th, and 75th percentile for other very high research activity institutions.Source: National Center for Education Statistics
Office of Institutional Research and Data Integrity V.P. for Enrollment Management and University Institutional Research
16 Faculty and Student Peer Diversity Trends Report April 27, 2014
FSC Meeting 5/8/14, Document C, Page 27

Undergraduate Six-year Graduation Rates Trends by EthnicityIPEDS Race/Ethnicity Category = White
NYU and Other Very High Research Activity Institutions*Reporting Years 2004 to 2013
This page shows the 2004 to 2013 first-time full-time baccalaureate-seeking freshman cohort six-year graduation rates at NYU and at other very high research activity institutions for students who identify as White. (The year refers to the year reported to NCES, not to the entering cohort year.) The top view shows the six-year graduation rate and the median graduation rate at other very high research activity institutions for students who identify as White. The second view shows the range of six-year graduation rates across all institutions categorized as very research activity for students whoidentify as White. NYU has a higher graduation rate than the median graduation rate at other very high research activity institutions for all reporting years, except in 2013, where the graduation rate is thesame for both groups. Further, between 2004 and 2013, the graduation rate at NYU for students who identify as White increased at a lower rate than at other very high research activity institutions. (NYU's graduation rate increased seven-percentage points and other very high research activity institutions increased nine-percentage points.)
2004 2005 2006 2007 2008 2009 2010 2011 2012 2013
NYU 83%85%86%85%85%84%82%84%81%76%
Six-Year Graduation RatesRace/Ethnicity = White
Other Very High Research Activity Institutions 83%81%81%80%78%77%78%75%74%74%
New York University
Other Very High Research Activity Institutions
2004 2005 2006 2007 2008 2009 2010 2011 2012 2013
40%
60%
80%
100%
Graduation Rate
61%
74%
86%
62%
74%
87%
61%
75%
87%
62%
78%
89%
63%
77%
88%
63%
78%
89%
65%
80%
89%
65%
81%
90%
66%
81%
91%
67%
83%
91%
Graduation Rates by InstitutionRace/Ethnicity = White
Very High Research Activity Institutions**
*Based on the 2010 Carnegie Classification. See institution list on the last page.**Data labels indicate the 25th, 50th, and 75th percentile for other very high research activity institutions.Source: National Center for Education Statistics
Office of Institutional Research and Data Integrity V.P. for Enrollment Management and University Institutional Research
17 Faculty and Student Peer Diversity Trends Report April 27, 2014
FSC Meeting 5/8/14, Document C, Page 28

Undergraduate Six-year Graduation Rates Trends by EthnicityIPEDS Race/Ethnicity Category = Hispanic
NYU and Other Very High Research Activity Institutions*Reporting Years 2004 to 2013
This page shows the 2004 to 2013 first-time full-time baccalaureate-seeking freshman cohort six-year graduation rates at NYU and at other very high research activity institutions for students who identify as Hispanic. (The year refers to the year reported to NCES, not to the entering cohort year.) The top view shows the six-year graduation rate at NYU and the median graduation rate at other veryhigh research activity institutions for students who identify as Hispanic. The second view shows the range of six-year graduation rates across all very high research activity institutions for students whoidentify as Hispanic. NYU has a higher graduation rate than the median graduate rate at other very high research activity institutions for all reporting years for students who identify as Hispanic. Further, between 2004 and 2013, the graduation rate for students who identify as Hispanic increased at a similar rate at NYU and at other very high research activity institutions.
2004 2005 2006 2007 2008 2009 2010 2011 2012 2013
NYU 80%82%82%82%78%80%76%77%71%72%
Six-year Graduation RatesRace/Ethnicity = Hispanic
Other Very High Research Activity Institutions 74%72%72%70%70%70%65%68%67%65%
New York University
Other Very High Research Activity Institutions
2004 2005 2006 2007 2008 2009 2010 2011 2012 2013
20%
40%
60%
80%
100%
Graduation Rate
51%
65%
80%
55%
67%
81%
54%
68%
84%
54%
65%
83%
55%
70%
82%
57%
70%
83%
57%
70%
84%
59%
72%
84%
57%
72%
86%
61%
74%
85%
Graduation Rates by InstitutionRace/Ethnicity = Hispanic
Very High Research Activity Institutions**
*Based on the 2010 Carnegie Classification. See institution list on the last page.**Data labels indicate the 25th, 50th, and 75th percentile for other very high research activity institutions.Source: National Center for Education Statistics
Office of Institutional Research and Data Integrity V.P. for Enrollment Management and University Institutional Research
18 Faculty and Student Peer Diversity Trends Report April 27, 2014
FSC Meeting 5/8/14, Document C, Page 29

Undergraduate Six-year Graduation Rates Trends by EthnicityIPEDS Race/Ethnicity Category = Nonresident AlienNYU and Other Very High Research Activity Institutions*
Reporting Years 2004 to 2013
This page shows the 2004 to 2013 first-time full-time baccalaureate-seeking freshman cohort six-year graduation rates at NYU and at other very high research activity institutions for nonresident alien stu-dents. (The year refers to the year reported to NCES, not to the entering cohort year.) The top view shows the six-year graduation rate at NYU and the median graduation rate at other very high research activity institutions for nonresident alien students. The second view shows the range of six-year graduation rates across all very high research activity institutions for nonresident alien students.NYU has a higher graduation rate than the median graduation rate at other very high research activity institutions for all reporting years for nonresident alien students. However, between 2004 and 2013,the graduation rate at NYU for nonresident alien students increased at a lower rate than at other very high research activity institutions. (The graduation rate at increased two percentage points and the median graduation rate at other very high research activity institutions increased six percentage points.)
2004 2005 2006 2007 2008 2009 2010 2011 2012 2013
NYU 80%86%83%78%85%84%87%82%79%78%
Six-year Graduation RatesRace/Ethnicity = Nonresident alien
Other Very High Research Activity Institutions 76%76%74%73%71%74%72%69%71%70%
New York University
Other Very High Research Activity Institutions
2004 2005 2006 2007 2008 2009 2010 2011 2012 2013
20%
40%
60%
80%
100%
Graduation Rate
57%
70%
84%
58%
71%
84%
56%
69%
84%
58%
72%
85%
62%
74%
86%
63%
71%
86%
62%
73%
88%
62%
74%
85%
66%
76%
86%
63%
76%
87%
Graduation Rates by InstitutionRace/Ethnicity = Nonresident alien
Very High Research Activity Institutions**
*Based on the 2010 Carnegie Classification. See institution list on the last page.**Data labels indicate the 25th, 50th, and 75th percentile for other very high research activity institutions.Source: National Center for Education Statistics
Office of Institutional Research and Data Integrity V.P. for Enrollment Management and University Institutional Research
19 Faculty and Student Peer Diversity Trends Report April 27, 2014
FSC Meeting 5/8/14, Document C, Page 30

Full-time Faculty Demographic Trends by GenderFull-time Male Faculty as a Percent of Total Full-time Faculty by Faculty Status
NYU and Other Very High Research Activity Institutions*Fall 2003 to Fall 2011**
This page shows fall 2003 to fall 2011 full-time male faculty as a percent of total full-time faculty at NYU and at other very high research activity institutions. Faculty data for NYU and for other very high research activity institutions excludes medical schools. The top view shows the proportion of full-time male tenured/ tenure track and not tenured/ not tenure track faculty as a percent of total full-time faculty at NYU and the median value at other very high research activity institutions. The bottom view shows the same information in a graphical format. In 2011, the proportion of full-time tenured/ tenuretrack male faculty as a percent of total full-time faculty at NYU is six-percentage points lower than at other very high research activity institutions (63% for NYU, 69% for other very high research activity institutions).
New York University2003 2005 2007 2009 2011
Other Very High Research Activity Institutions2003 2005 2007 2009 2011
Tenured/ Tenure-track
Not Tenured (not on tenure track) 52%
63%
53%
64%
51%
65%
53%
66%
48%
66%
54%
69%
54%
70%
55%
71%
56%
72%
57%
73%
Full-time Male Faculty as a Percent of Total Faculty by Faculty Status
New York University
Other Very High Research Activity Institutions
Tenured/ Tenure-track Not Tenured (not on tenure track)
2003 2005 2007 2009 2011 2003 2005 2007 2009 2011
30%
40%
50%
60%
70%
80%
90%
Percent
71%73%
76%
70%72%
75%
68%71%
74%
67%70%
74%
66%69%
73%
53%
57%
62%
52%
56%
61%
51%
55%
59%
51%
54%
58%
51%
54%
58%
Full-time Male Faculty as a Percent of Total Full-time Faculty***
Source: National Center for Education Statistics (NCES)*Based on 2010 Carnegie Classification. See last page for institution list. Excludes medical school faculty.**Fall 2011 is the most recent faculty demographics data publicly available on race/ethnicity from the NCES.***Data labels indicate the 25th, 50th, and 75th percentile for other very high research activity institutions.
Office of Institutional Research and Data Integrity V.P. for Enrollment Management and University Institutional Research
20 Faculty and Student Peer Diversity Trends Report April 27, 2014
FSC Meeting 5/8/14, Document C, Page 31

Full-time Faculty Demographic Trends by GenderFull-time Female Faculty as a Percent of Total Full-time Faculty by Faculty Status
NYU and Other Very High Research Activity Institutions*Fall 2003 to Fall 2011**
This page shows fall 2003 to fall 2011 full-time female faculty as a percent of total full-time faculty at NYU and at other very high research activity institutions. Faculty data for NYU and for other very high research activity institutions excludes medical schools. The top view shows the proportion of full-time female tenured/ tenure track and not tenured/ not tenure track faculty as a percent of total full-time faculty at NYU and the median value at other very high research activity institutions. The bottom view shows the same information in a graphical format. In 2011, the proportion of full-time tenured/ tenuretrack female faculty as a percent of total full-time faculty at NYU was six percentage points higher than at other very high research activity institutions (37% for NYU, 31% for other very high research activity institutions).
New York University2003 2005 2007 2009 2011
Other Very High Research Activity Institutions2003 2005 2007 2009 2011
Tenured/ Tenure-track
Not Tenured (not on tenure track) 48%
37%
47%
36%
49%
35%
47%
34%
52%
34%
46%
31%
46%
30%
45%
29%
44%
28%
43%
27%
Full-time Female Faculty as a Percent of Total Faculty by Faculty Status
New York University
Other Very High Research Activity Institutions
Tenured/ Tenure-track Not Tenured (not on tenure track)
2003 2005 2007 2009 2011 2003 2005 2007 2009 2011
10%
20%
30%
40%
50%
60%
70%
Percent
24%
27%29%
25%
28%30%
26%
29%32%
26%
30%33%
27%
31%34%
38%
43%
47%
39%
44%
48%
41%
45%
49%
42%
46%
49%
42%
46%
49%
Full-time Female Faculty as a Percent of Total Full-time Faculty***
Source: National Center for Education Statistics (NCES)*Based on 2010 Carnegie Classification. See last page for institution list. Excludes medical school faculty.**Fall 2011 is the most recent faculty demographics data publicly available on race/ethnicity from the NCES.***Data labels indicate the 25th, 50th, and 75th percentile for other very high research activity institutions.
Office of Institutional Research and Data Integrity V.P. for Enrollment Management and University Institutional Research
21 Faculty and Student Peer Diversity Trends Report April 27, 2014
FSC Meeting 5/8/14, Document C, Page 32

Full-time Faculty Demographic Trends by EthnicityFull-time Tenured/Tenure Track Faculty by Race/Ethnicity Categories as a Percent of Total
Full-time Tenured/Tenure Track FacultyNYU and Other Very High Research Activity Institutions*
Fall 2003 to Fall 2011**
This page shows fall 2003 to fall 2011 full-time faculty by race/ ethnicity as a percent of total full-time faculty at NYU and at other very high research activity institutions. Faculty data for NYU and for othervery high research activity institutions excludes medical schools. The top view shows the proportion of full-time tenured/ tenure track faculty as a percent of total full-time faculty by race/ethnicity at NYU and the median value at other very high research activity institutions. The bottom view shows the same information in a graphical format. Several race/ ethnicity categories -- American Indian/ Alaska Native, Native Hawaiian or other Pacific Islander, and faculty who identify as two or more races -- are included in the denominator, but are not shown in this reportdue to the small number of faculty members in those categories. In 2011, the proportion of tenured/ tenure track faculty who identify as Black or African American, Hispanic, and White at NYU is higherthan at other very high research activity institutions.
New York University2003 2005 2007 2009 2011
Other Very High Research Activity Institutions2003 2005 2007 2009 2011
AsianBlack or African AmericanHispanicNonresident AlienRace/ethnicity unknownWhite 78%
0%4%4%5%9%
78%0%5%4%4%8%
78%0%7%4%5%7%
78%0%7%3%4%7%
79%0%6%3%5%7%
76%1%3%3%3%11%
77%0%4%3%3%10%
78%0%4%3%3%9%
79%0%4%2%3%9%
81%0%4%2%3%8%
Full-time Faculty by Race/Ethnicity Categories as a Percent of Total Full-time FacultyTenured/ Tenure Track Only
Race/EthnicityAsian
Black or African American
Hispanic
Nonresident Alien
White
New York University Other Very High Research Activity Institutions
2003 2005 2007 2009 2011 2003 2005 2007 2009 20110%
20%
40%
60%
80%
Percent of Full-time Tenured/ On Tenure Track Fac..
Source: National Center for Education Statistics (NCES)*Based on 2010 Carnegie Classification. See last page for institution list. Excludes medical school faculty.**Fall 2011 is the most recent faculty demographics data publicly available on race/ethnicity from the NCES.
Office of Institutional Research and Data Integrity V.P. for Enrollment Management and University Institutional Research
22 Faculty and Student Peer Diversity Trends Report April 27, 2014
FSC Meeting 5/8/14, Document C, Page 33

Full-time Faculty Demographic Trends by EthnicityFull-time Not Tenured/Not Tenure Track Faculty by Race/Ethnicity as a Percent of Total
Full-time Not Tenured/ Not Tenure Track FacultyNYU and Other Very High Research Activity Institutions*
Fall 2003 to Fall 2011**
This page shows fall 2003 to fall 2011 full-time faculty by IPEDS race/ethnicity categories as a percent of total full-time faculty at NYU and at other very high research activity institutions. Faculty data forNYU and for other very high research activity institutions excludes medical schools. The top view shows the proportion of full-time not tenured/ not tenure track faculty as a percent of total full-time nottenured/ not tenure track faculty at NYU and the median value at other very high research activity institutions. The bottom view shows the same information in a graphical format. Several race/ ethnicity categories -- American Indian/ Alaska Native, Native Hawaiian or other Pacific Islander, and faculty who identify as two or more races -- are included in the denominator, but are not shown in this reportdue to the small number of faculty members in those categories. In 2011, the proportion of not tenured/not tenure track faculty who identify as Black or African American, Hispanic, and White at NYU ishigher than at other very high research activity institutions.
New York University2003 2005 2007 2009 2011
Other Very High Research Activity Institutions2003 2005 2007 2009 2011
AsianBlack or African AmericanHispanicNonresident AlienRace/ethnicity unknownWhite 74%
1%8%5%5%8%
77%0%7%4%5%7%
77%0%8%4%4%7%
80%0%7%3%4%6%
80%0%5%4%5%5%
68%2%10%3%3%10%
67%1%10%2%2%10%
68%0%10%3%2%9%
70%0%12%2%2%8%
73%0%8%2%2%8%
Full-time Faculty by Race/Ethnicity Categories as a Percent of Total Full-time FacultyNot Tenured/ Not Tenure Track Only
Race/EthnicityAsian
Black or African American
Hispanic
Nonresident Alien
White
New York University Other Very High Research Activity Institutions
2003 2005 2007 2009 2011 2003 2005 2007 2009 20110%
20%
40%
60%
80%
Percent of Full-time Not Tenured/ Not Tenure Track
Faculty
Source: National Center for Education Statistics (NCES)*Based on 2010 Carnegie Classification. Excludes medical school faculty.**Fall 2011 is the most recent faculty demographics data publicly available on race/ethnicity from the NCES.
Office of Institutional Research and Data Integrity V.P. for Enrollment Management and University Institutional Research
23 Faculty and Student Peer Diversity Trends Report April 27, 2014
FSC Meeting 5/8/14, Document C, Page 34

Full-time Faculty Demographic Trends by EthnicityIPEDS Race/Ethnicity = Asian
NYU and Other Very High Research Activity Institutions*Fall 2003 to Fall 2011**
This page shows full-time faculty who identify as Asian as a percent of total full-time faculty at NYU and at other very high research activity institutions. Faculty data for NYU and for other very high research activity institutions excludes medical schools. The top view shows the proportion of full-time tenured/ tenure track faculty who identify as Asian as a percent of total full-time faculty and the median value at other very high research activity institutions. The bottom view shows the range of values for full-time faculty who identify as Asian as a percent of total faculty across all very high research activity institutions. Between 2003 and 2011, the proportion of full-time tenured/ tenure track faculty who identify as Asian increased at the same rate at NYU and at other very high research activity institutions.
2003 2005 2007 2009 2011
New York University Tenured/ Tenure-track
Not Tenured (not on tenure track)
Other Very High ResearchActivity Institutions
Tenured/ Tenure-track
Not Tenured (not on tenure track)
8%
9%
7%
8%
7%
7%
6%
7%
5%
7%
10%
11%
10%
10%
9%
9%
8%
9%
8%
8%
Full-time Faculty by Race/Ethnicity as a Percent of Total Full-time FacultyIPEDS Race/Ethnicity Category = Asian
New York University
Other Very High Research Activity Institutions
Tenured/ Tenure-track Not Tenured (not on tenure track)
2003 2005 2007 2009 2011 2003 2005 2007 2009 2011
0%
10%
20%
30%
40%
Percent
6%8%10%
7%9%11%
8%9%12%
9%10%
13%
9%11%13%
5%
8%
11%
5%
8%
13%
5%
9%
13%
7%
10%
14%
7%
10%
13%
Full-time Faculty by Race/Ethnicity as a Percent of Total Full-time FacultyIPEDS Race/Ethnicity Category = AsianVery High Research Activity Institutions
Source: National Center for Education Statistics (NCES)*Based on 2010 Carnegie Classification. See last page for institution list. Excludes medical school faculty.**Fall 2011 is the most recent faculty demographics data publicly available on race/ethnicity from the NCES.***Data labels indicate the 25th, 50th, and 75th percentile for other very high research activity institutions.
Office of Institutional Research and Data Integrity V.P. for Enrollment Management and University Institutional Research
24 Faculty and Student Peer Diversity Trends Report April 27, 2014
FSC Meeting 5/8/14, Document C, Page 35
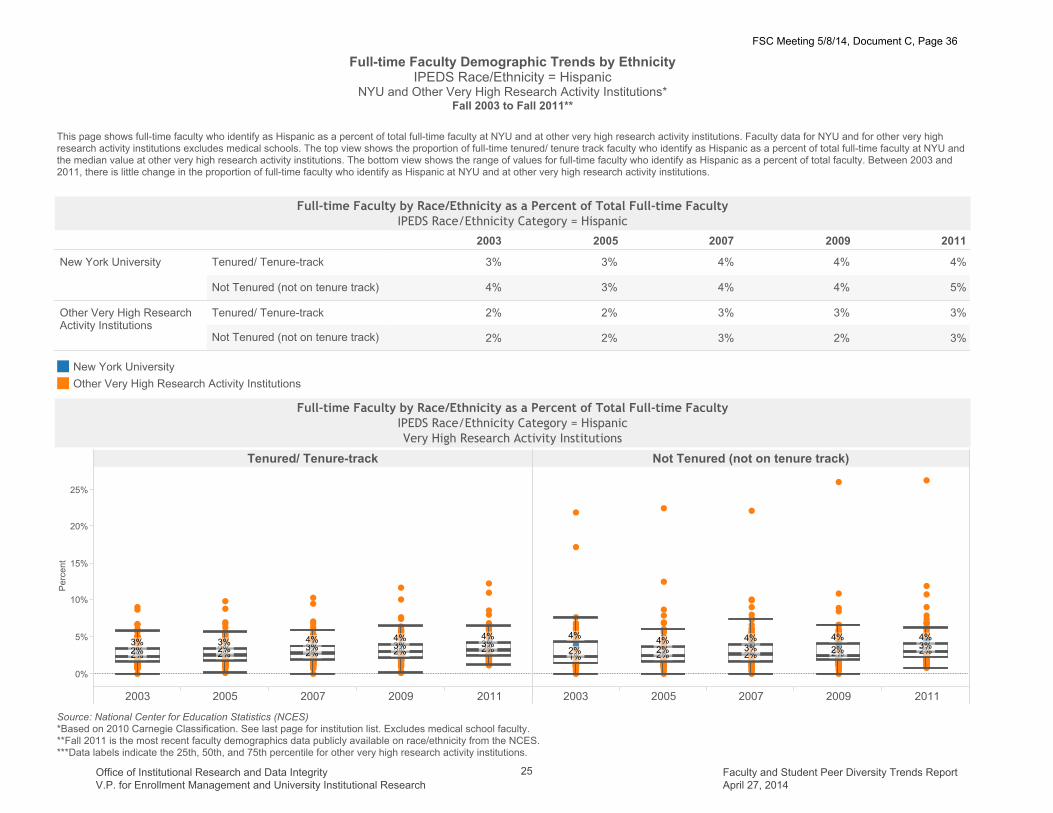
Full-time Faculty Demographic Trends by EthnicityIPEDS Race/Ethnicity = Hispanic
NYU and Other Very High Research Activity Institutions*Fall 2003 to Fall 2011**
This page shows full-time faculty who identify as Hispanic as a percent of total full-time faculty at NYU and at other very high research activity institutions. Faculty data for NYU and for other very high research activity institutions excludes medical schools. The top view shows the proportion of full-time tenured/ tenure track faculty who identify as Hispanic as a percent of total full-time faculty at NYU andthe median value at other very high research activity institutions. The bottom view shows the range of values for full-time faculty who identify as Hispanic as a percent of total faculty. Between 2003 and2011, there is little change in the proportion of full-time faculty who identify as Hispanic at NYU and at other very high research activity institutions.
2003 2005 2007 2009 2011
New York University Tenured/ Tenure-track
Not Tenured (not on tenure track)
Other Very High ResearchActivity Institutions
Tenured/ Tenure-track
Not Tenured (not on tenure track)
5%
4%
4%
4%
4%
4%
3%
3%
4%
3%
3%
3%
2%
3%
3%
3%
2%
2%
2%
2%
Full-time Faculty by Race/Ethnicity as a Percent of Total Full-time FacultyIPEDS Race/Ethnicity Category = Hispanic
New York University
Other Very High Research Activity Institutions
Tenured/ Tenure-track Not Tenured (not on tenure track)
2003 2005 2007 2009 2011 2003 2005 2007 2009 2011
0%
5%
10%
15%
20%
25%
Percent
2%2%3%
2%2%3%
2%3%4%
2%3%4%
2%3%4%
1%2%
4%
2%2%4%
2%3%4%
2%2%4%
2%3%4%
Full-time Faculty by Race/Ethnicity as a Percent of Total Full-time FacultyIPEDS Race/Ethnicity Category = HispanicVery High Research Activity Institutions
Source: National Center for Education Statistics (NCES)*Based on 2010 Carnegie Classification. See last page for institution list. Excludes medical school faculty.**Fall 2011 is the most recent faculty demographics data publicly available on race/ethnicity from the NCES.***Data labels indicate the 25th, 50th, and 75th percentile for other very high research activity institutions.
Office of Institutional Research and Data Integrity V.P. for Enrollment Management and University Institutional Research
25 Faculty and Student Peer Diversity Trends Report April 27, 2014
FSC Meeting 5/8/14, Document C, Page 36

Full-time Faculty Demographic Trends by EthnicityIPEDS Race/Ethnicity = Black or African AmericanNYU and Other Very High Research Activity Institutions*
Fall 2003 to Fall 2011**
This page shows full-time faculty who identify as Black or African American as a percent of total full-time faculty at NYU and at other very high research activity institutions. Faculty data for NYU and forother very high research activity institutions excludes medical schools. The top view shows the proportion of full-time tenured/ tenure track faculty who identify as Black or African American as a percent oftotal full-time faculty at NYU and the median value at other very high research activity institutions. The bottom view shows the range of values for full-time faculty who identify as Black or African Americanas a percent of total faculty. Between 2003 and 2011, there is little change in the proportion of full-time faculty who identify as Black or African American at NYU and at other very high research activity institutions.
2003 2005 2007 2009 2011
New York University Tenured/ Tenure-track
Not Tenured (not on tenure track)
Other Very High ResearchActivity Institutions
Tenured/ Tenure-track
Not Tenured (not on tenure track)
5%
5%
5%
4%
4%
5%
4%
4%
5%
5%
3%
3%
2%
3%
2%
3%
2%
3%
2%
3%
Full-time Faculty by Race/Ethnicity as a Percent of Total Full-time FacultyIPEDS Race/Ethnicity Category = Black or African American
New York University
Other Very High Research Activity Institutions
Tenured/ Tenure-track Not Tenured (not on tenure track)
2003 2005 2007 2009 2011 2003 2005 2007 2009 2011
0%
5%
10%
Percent
2%3%
4%
2%3%
4%
2%
3%
4%
2%
3%
4%
2%
3%
4%
2%
3%
5%
1%2%
4%
2%2%
4%
2%
2%
4%
2%
3%
4%
Full-time Faculty by Race/Ethnicity as a Percent of Total Full-time FacultyIPEDS Race/Ethnicity Category = Black or African American
Very High Research Activity Institutions
Source: National Center for Education Statistics (NCES)*Based on 2010 Carnegie Classification. See last page for institution list. Excludes medical school faculty.**Fall 2011 is the most recent faculty demographics data publicly available on race/ethnicity from the NCES.***Data labels indicate the 25th, 50th, and 75th percentile for other very high research activity institutions.
Office of Institutional Research and Data Integrity V.P. for Enrollment Management and University Institutional Research
26 Faculty and Student Peer Diversity Trends Report April 27, 2014
FSC Meeting 5/8/14, Document C, Page 37

Full-time Faculty Demographic Trends by EthnicityIPEDS Race/Ethnicity = Nonresident Alien
NYU and Other Very High Research Activity Institutions*Fall 2003 to Fall 2011**
This page shows full-time nonresident alien faculty as a percent of total full-time faculty at NYU and at other very high research activity institutions. Faculty data for NYU and for other very high research activity institutions excludes medical schools. The top view shows the proportion of full-time tenured/ tenure track nonresident alien faculty as a percent of total full-time faculty at NYU and at other veryhigh research activity institutions. The bottom view shows the range of values for full-time nonresident alien faculty as a percent of total full-time faculty. Between 2003 and 2011, there is a slight decreasein the proportion of full-time tenured/ tenure track nonresident alien faculty at NYU and at other very high research activity. However, during the same time period, there is an increase in the proportion offull-time not tenured/ not tenure track nonresident alien faculty at NYU and at other very high research activity institutions.
2003 2005 2007 2009 2011
New York University Tenured/ Tenure-track
Not Tenured (not on tenure track)
Other Very High ResearchActivity Institutions
Tenured/ Tenure-track
Not Tenured (not on tenure track)
8%
4%
7%
5%
8%
7%
7%
7%
5%
6%
10%
3%
10%
4%
10%
4%
12%
4%
8%
4%
Full-time Faculty by Race/Ethnicity as a Percent of Total Full-time FacultyIPEDS Race/Ethnicity Category = Nonresident Alien
New York University
Other Very High Research Activity Institutions
Tenured/ Tenure-track Not Tenured (not on tenure track)
2003 2005 2007 2009 2011 2003 2005 2007 2009 2011
0%
20%
40%
60%
Percent
3%4%6%
3%4%6%
3%4%6%
3%4%5%
2%3%4%5%8%
15%
7%
12%
18%
7%10%
20%
5%
10%
19%
6%10%
21%
Full-time Faculty by Race/Ethnicity as a Percent of Total Full-time FacultyIPEDS Race/Ethnicity Category = Nonresident Alien
Very High Research Activity Institutions
Source: National Center for Education Statistics (NCES)*Based on 2010 Carnegie Classification. See last page for institution list. Excludes medical school faculty.**Fall 2011 is the most recent publicly available faculty status data on race/ethnicity and gender available from the NCES.***Data labels indicate the 25th, 50th, and 75th percentile for other very high research activity institutions.
Office of Institutional Research and Data Integrity V.P. for Enrollment Management and University Institutional Research
27 Faculty and Student Peer Diversity Trends Report April 27, 2014
FSC Meeting 5/8/14, Document C, Page 38
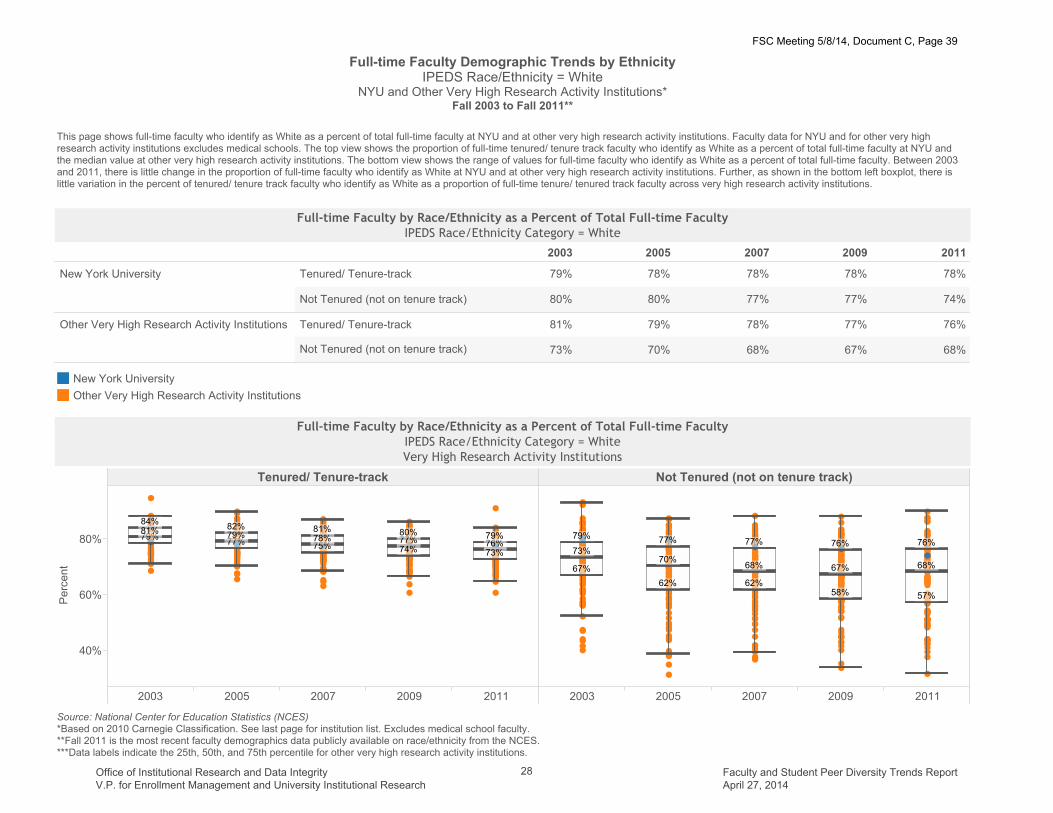
Full-time Faculty Demographic Trends by EthnicityIPEDS Race/Ethnicity = White
NYU and Other Very High Research Activity Institutions*Fall 2003 to Fall 2011**
This page shows full-time faculty who identify as White as a percent of total full-time faculty at NYU and at other very high research activity institutions. Faculty data for NYU and for other very high research activity institutions excludes medical schools. The top view shows the proportion of full-time tenured/ tenure track faculty who identify as White as a percent of total full-time faculty at NYU andthe median value at other very high research activity institutions. The bottom view shows the range of values for full-time faculty who identify as White as a percent of total full-time faculty. Between 2003and 2011, there is little change in the proportion of full-time faculty who identify as White at NYU and at other very high research activity institutions. Further, as shown in the bottom left boxplot, there is little variation in the percent of tenured/ tenure track faculty who identify as White as a proportion of full-time tenure/ tenured track faculty across very high research activity institutions.
2003 2005 2007 2009 2011
New York University Tenured/ Tenure-track
Not Tenured (not on tenure track)
Other Very High Research Activity Institutions Tenured/ Tenure-track
Not Tenured (not on tenure track)
74%
78%
77%
78%
77%
78%
80%
78%
80%
79%
68%
76%
67%
77%
68%
78%
70%
79%
73%
81%
Full-time Faculty by Race/Ethnicity as a Percent of Total Full-time FacultyIPEDS Race/Ethnicity Category = White
New York University
Other Very High Research Activity Institutions
Tenured/ Tenure-track Not Tenured (not on tenure track)
2003 2005 2007 2009 2011 2003 2005 2007 2009 2011
40%
60%
80%
Percent
79%81%84%
77%79%82%
75%78%81%
74%77%80%
73%76%79%
67%
73%
79%
62%
70%
77%
62%
68%
77%
58%
67%
76%
57%
68%
76%
Full-time Faculty by Race/Ethnicity as a Percent of Total Full-time FacultyIPEDS Race/Ethnicity Category = WhiteVery High Research Activity Institutions
Source: National Center for Education Statistics (NCES)*Based on 2010 Carnegie Classification. See last page for institution list. Excludes medical school faculty.**Fall 2011 is the most recent faculty demographics data publicly available on race/ethnicity from the NCES.***Data labels indicate the 25th, 50th, and 75th percentile for other very high research activity institutions.
Office of Institutional Research and Data Integrity V.P. for Enrollment Management and University Institutional Research
28 Faculty and Student Peer Diversity Trends Report April 27, 2014
FSC Meeting 5/8/14, Document C, Page 39

Full-time Faculty Trends by Faculty StatusFull-time Faculty Status as a Percent of Total Full-time Faculty
NYU and Other Very High Research Activity Institutions*Fall 2003 to Fall 2011**
This page shows fall 2003 to fall 2011 full-time faculty within faculty status at NYU and at other very high research activity institutions. Faculty data for NYU and for other very high research activity institutions excludes medical schools. The views on this page show a) full-time tenured/ on-tenure track faculty as a percent of full-time faculty and b) full-time not tenured (not on tenure track) faculty as apercent of full-time faculty. The top view shows the proportion of full-time tenured/ on tenure track and not tenured faculty as a percent of total full-time faculty at NYU and the median value at other veryhigh research activity institutions. The bottom left view shows the range of values for tenured/on tenure track faculty as a percent of total full-time faculty. The bottom right view shows the range of valuesfor not tenured/not tenure track faculty as a percent of total full-time faculty. Over the past ten years, tenured and tenure track faculty as a percent of total full-time faculty decreased at similar rates at NYUand at other very high research activity institutions. Between 2003 and 2011, the proportion of tenured/ on tenure track faculty at NYU decreased twelve-percentage points (from 67% in 2003 to 55% in2011); this trend is similar to other very high research activity institutions, which decreased ten-percentage points (from 67% in 2003 to 57% in 2011). In contrast, between 2003 and 2011, the proportion ofnot tenured/ not on tenured track faculty increased twelve-percentage points at NYU and increased ten-percentage points at other very high research activity institutions.
2003 2005 2007 2009 2011
New York University Tenured/On Tenure Track
Not Tenured (not on tenure track)
Very High Research ActivityInstitutions
Tenured/On Tenure Track
Not Tenured (not on tenure track)
45%
55%
42%
58%
40%
60%
36%
64%
33%
67%
43%
57%
40%
60%
37%
63%
37%
63%
33%
67%
Full-time Faculty Status as a Percent of Total Full-time Faculty
New York University
Very High Research Activity Institutions
Tenured/On Tenure Track Not Tenured (not on tenure track)
2003 2005 2007 2009 2011 2003 2005 2007 2009 2011
0%
20%
40%
60%
80%
100%
Percent within Status as a Percent of Total Full-time Faculty
55%
67%
78%
51%
63%
72%
52%
63%
71%
50%
60%
69%
46%
57%
66%
22%
33%
45%
27%
37%
48%
29%
37%
49%
31%
40%
50%
34%
43%
54%
Full-time Faculty within Faculty Status as a Percent of Total Full-time Faculty***
Source: National Center for Education Statistics (NCES)*Based on 2010 Carnegie Classification. See last page for institution list. Excludes medical school faculty.**Fall 2011 is the most recent publicly available faculty status data on race/ethnicity and gender available from the NCES.***Data labels indicate the 25th, 50th, and 75th percentiles for non-NYU research universities with very high research activity.
Office of Institutional Research and Data Integrity V.P. for Enrollment Management and University Institutional Research
29 Faculty and Student Peer Diversity Trends Report April 27, 2014
FSC Meeting 5/8/14, Document C, Page 40

Full-time Faculty Trends by Faculty Status and Race/EthnicityFull-time Tenured/ On Tenure Track Faculty as a Percent of Total Full-time Faculty by Race/Ethnicity
NYU and Other Very High Research Activity Institutions*Fall 2003 to Fall 2011**
This page shows fall 2003 to fall 2011 full-time tenured/ on tenure track faculty as a percent of total full-time faculty at NYU and at very high research activity institutions. Faculty data for NYU and for other very high research activity institutions excludes medical schools. The top view shows full-time tenured/ on tenure track faculty as a percent of total full-time faculty by IPEDS race/ ethnicity categoriesat NYU and the median value at other very high research activity institutions. The bottom view shows the same information in a graphical format. Several race/ ethnicity categories -- American Indian/Alaska Native, Native Hawaiian or other Pacific Islander, and faculty members who identify as two or more races -- are included in the denominator, but are not shown in this report due to the small number of faculty members in those categories. There is little variation in the proportion of tenured/ tenure track faculty by race ethnicity categories. In 2011, at NYU, 59% of faculty who identify as Asian,57% of faculty who identify as White, 56% of faculty who identify as Black or African American, and 55% of full-time faculty who identify as Hispanic are tenured/ on tenure track at NYU. These proportionsare slightly lower - two- to three-percentage points - than at other very high research activity institutions.
New York University2003 2005 2007 2009 2011
Very High Research Activity Institutions2003 2005 2007 2009 2011
Asian
Black or African American
Hispanic
Nonresident Alien
White 57%
35%
55%
56%
59%
58%
49%
58%
57%
61%
60%
57%
59%
62%
62%
63%
63%
68%
65%
67%
67%
70%
60%
67%
72%
61%
32%
57%
62%
60%
63%
34%
62%
66%
62%
65%
37%
62%
66%
63%
66%
34%
65%
68%
63%
69%
44%
69%
71%
70%
Full-time Tenured/ On Tenure Track Faculty as a Percent of Total Full-time Faculty
Race/EthnicityAsian
Black or African American
Hispanic
Nonresident Alien
White
New York University Very High Research Activity Institutions
2003 2005 2007 2009 2011 2003 2005 2007 2009 20110%
20%
40%
60%
FT Tenured/On Tenure Track Faculty as a % of Total
FTl Faculty
Source: National Center for Education Statistics (NCES)*Based on 2010 Carnegie Classification. See last page for institution list. Excludes medical school faculty.**Fall 2011 is the most recent publicly available faculty status data on race/ethnicity and gender available from the NCES.
Office of Institutional Research and Data Integrity V.P. for Enrollment Management and University Institutional Research
30 Faculty and Student Peer Diversity Trends Report April 27, 2014
FSC Meeting 5/8/14, Document C, Page 41

Full-time Faculty Trends by Faculty Status and Race/EthnicityFull-time Not Tenured/ Not Tenure Track Faculty as a Percent of Total Full-time Faculty by Race/Ethnicity
NYU and Other Very High Research Activity Institutions*Fall 2003 to Fall 2011**
This page shows fall 2003 to fall 2011 full-time not tenured/ not tenure track faculty as a percent of total full-time faculty at NYU and at very high research activity institutions. Faculty data for NYU and forother very high research activity institutions excludes medical schools. The top view shows full-time not tenured/ not tenure track faculty as a percent of total full-time faculty by IPEDS race/ ethnicity categories at NYU and the median value at other very high research activity institutions. The bottom view shows the same information in a graphical format. Several race/ ethnicity categories -- AmericanIndian/ Alaska Native, Native Hawaiian or other Pacific Islander, and faculty members who identify as two or more races -- are included in the denominator, but are not shown in this report due to thesmall number of faculty members in those categories. NYU has a slightly higher proportion of not tenured/ not tenure track faculty than other very high research activity institutions, this is true across allIPEDS race/ ethnicity categories with the exception of nonresident alien faculty.
New York University2003 2005 2007 2009 2011
Very High Research Activity Institutions2003 2005 2007 2009 2011
Asian
Black or African American
Hispanic
Nonresident Alien
White 43%
65%
45%
44%
41%
42%
51%
42%
43%
39%
40%
43%
41%
38%
38%
37%
37%
32%
35%
33%
33%
30%
40%
33%
28%
39%
68%
43%
38%
40%
37%
66%
38%
34%
38%
35%
63%
38%
34%
37%
34%
66%
35%
32%
37%
31%
56%
31%
29%
30%
Not Tenured/ Not Tenure Track as a Percent of Total Full-time Faculty
Race/EthnicityAsian
Black or African American
Hispanic
Nonresident Alien
White
New York University Very High Research Activity Institutions
2003 2005 2007 2009 2011 2003 2005 2007 2009 20110%
20%
40%
60%
FT Not Tenured/Not Tenure Track Faculty as a % of
Total FTl Faculty
Source: National Center for Education Statistics (NCES)*Based on 2010 Carnegie Classification. See last page for institution list. Excludes medical school faculty.**Fall 2011 is the most recent publicly available faculty status data on race/ethnicity and gender available from the NCES.
Office of Institutional Research and Data Integrity V.P. for Enrollment Management and University Institutional Research
31 Faculty and Student Peer Diversity Trends Report April 27, 2014
FSC Meeting 5/8/14, Document C, Page 42

Full-time Faculty Trends by Faculty Status and Ethnicity Full-time Faculty Status as a Percent of Total Full-time Faculty
IPEDS Race/Ethnicity Category = AsianNYU and Other Very High Research Activity Institutions*
Fall 2003 to Fall 2011**
This page shows fall 2003 to fall 2011 full-time faculty within faculty status at NYU and at other very high research activity institutions for faculty who identify as Asian. Faculty data for NYU and for othervery high research activity institutions excludes medical schools. The views on this page show full-time tenured/ on-tenure track faculty as a percent of total full-time faculty who identify as Asian, and full-time not tenured/ not tenure track faculty as a percent of total full-time faculty who identify as Asian. The top view shows the proportion of full-time tenured/ on tenure track and not tenured/ not tenuretrack faculty who identify as Asian as a percent of total full-time faculty who identify as Asian at NYU and the median value at other very high research activity institutions. The bottom left view shows therange of values for full-time tenured/on tenure track who identify as Asian as a percent of total full-time faculty who identify as Asian. The bottom right view shows the range of values for full-time nottenured/not tenure track who identify as Asian as a percent of total full-time faculty who identify as Asian. Between 2003 and 2011, at NYU, the proportion of tenured/ on tenure track faculty who identify asAsian decreased thirteen-percentage points (from 77% in 2003 to 59% in 2011); this is similar to other very high research activity institutions, which decreased ten-percentage points (from 70% in 2003 to60% in 2011).
2003 2005 2007 2009 2011
New York University Tenured/On Tenure Track
Not Tenured (not on tenure track)
Very High Research ActivityInstitutions
Tenured/On Tenure Track
Not Tenured (not on tenure track)
41%
59%
39%
61%
38%
62%
33%
67%
28%
72%
40%
60%
38%
62%
37%
63%
37%
63%
30%
70%
Full-time Faculty by Race/Ethnicity as a Percent of Total FacultyIPEDS Race/Ethnicity Category = Asian
New York University
Very High Research Activity Institutions
Tenured/On Tenure Track Not Tenured (not on tenure track)
2003 2005 2007 2009 2011 2003 2005 2007 2009 2011
0%
20%
40%
60%
80%
100%
Percent Within Status
54%
70%
83%
48%
63%
77%
48%
63%
76%
45%
62%
73%
46%
60%
73%
18%
30%
47%
23%
37%
52%
24%
37%
52%
27%
38%
54%
27%
40%
54%
Full-time Faculty within Faculty Status as a Percent of Total Full-time Faculty***
Source: National Center for Education Statistics (NCES)*Based on 2010 Carnegie Classification. See last page for institution list. Excludes medical school faculty.**Fall 2011 is the most recent publicly available faculty status data on race/ethnicity and gender available from the NCES.***Data labels indicate the 25th, 50th, and 75th percentiles for non-NYU research universities with very high research activity.
Office of Institutional Research and Data Integrity V.P. for Enrollment Management and University Institutional Research
32 Faculty and Student Peer Diversity Trends Report April 27, 2014
FSC Meeting 5/8/14, Document C, Page 43

Full-time Faculty Trends by Faculty Status and Ethnicity Full-time Faculty Status as a Percent of Total Full-time FacultyIPEDS Race/Ethnicity Category = Black or African AmericanNYU and Other Very High Research Activity Institutions*
Fall 2003 to Fall 2011**
This page shows fall 2003 to fall 2011 full-time faculty within faculty status at NYU and at other very high research activity institutions for faculty who identify as Black or African American. Faculty data forNYU and for other very high research activity institutions excludes medical schools. The views on this page show full-time tenured/ on-tenure track faculty as a percent of total full-time faculty who identifyas Black or African American, and full-time not tenured/ not tenure track faculty as a percent of total full-time faculty who identify as Black or African American. The top view shows the proportion of full-time tenured/ on tenure track and not tenured/ not tenure track faculty who identify as Black or African American as a percent of total full-time faculty who identify as Black or African American at NYUand the median value at other very high research activity institutions. The bottom left view shows the range of values for full-time tenured/on tenure track who identify as Black or African American as a percent of total full-time faculty who identify as Black or African American. The bottom right view shows the range of values for full-time not tenured/not tenure track who identify as Black or African American as a percent of total full-time faculty who identify as Black or African American. Between 2003 and 2011, at NYU, the proportion of tenured/ on tenure track faculty who identifyas Black or African American decreased eleven-percentage points (from 67% in 2003 to 56% in 2011); this is similar to other very high research activity institutions, which decreased nine-percentagepoints (from 71% in 2003 to 62% in 2011).
2003 2005 2007 2009 2011
New York University Tenured/On Tenure Track
Not Tenured (not on tenure track)
Very High Research ActivityInstitutions
Tenured/On Tenure Track
Not Tenured (not on tenure track)
44%
56%
43%
57%
38%
62%
35%
65%
33%
67%
38%
62%
34%
66%
34%
66%
32%
68%
29%
71%
Full-time Faculty within Faculty Status as a Percent of Total Full-time FacultyIPEDS Race/Ethnicity Category = Black or African American
New York University
Very High Research Activity Institutions
Tenured/On Tenure Track Not Tenured (not on tenure track)
2003 2005 2007 2009 2011 2003 2005 2007 2009 2011
0%
50%
100%
Percent Within Status
59%
71%
82%
54%
68%
80%
56%
66%
77%
52%
66%
74%
49%
62%
70%
18%
29%
41%
20%
32%
46%
23%
34%
44%
26%
34%
48%
30%
38%
51%
Full-time Faculty within Faculty Status as a Percent of Total Full-time Faculty***
Source: National Center for Education Statistics (NCES)*Based on 2010 Carnegie Classification. See last page for institution list. Excludes medical school faculty.**Fall 2011 is the most recent publicly available faculty status data on race/ethnicity and gender available from the NCES.***Data labels indicate the 25th, 50th, and 75th percentiles for non-NYU research universities with very high research activity.
Office of Institutional Research and Data Integrity V.P. for Enrollment Management and University Institutional Research
33 Faculty and Student Peer Diversity Trends Report April 27, 2014
FSC Meeting 5/8/14, Document C, Page 44
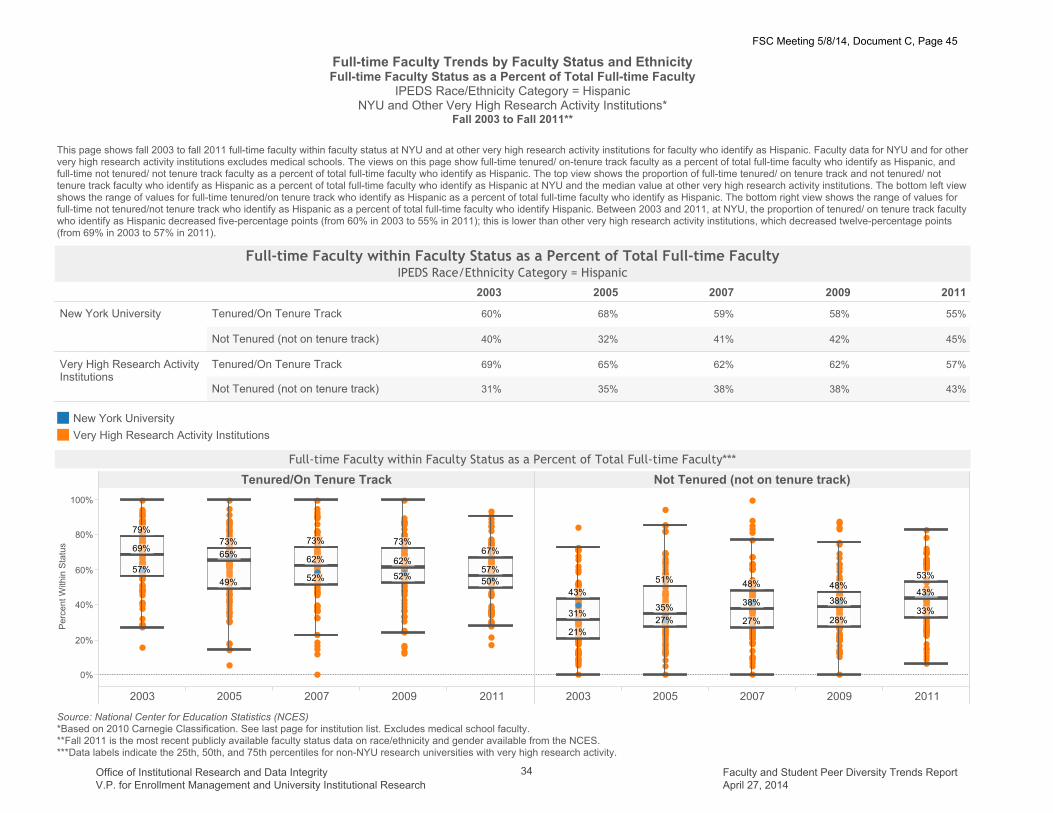
Full-time Faculty Trends by Faculty Status and Ethnicity Full-time Faculty Status as a Percent of Total Full-time Faculty
IPEDS Race/Ethnicity Category = HispanicNYU and Other Very High Research Activity Institutions*
Fall 2003 to Fall 2011**
This page shows fall 2003 to fall 2011 full-time faculty within faculty status at NYU and at other very high research activity institutions for faculty who identify as Hispanic. Faculty data for NYU and for othervery high research activity institutions excludes medical schools. The views on this page show full-time tenured/ on-tenure track faculty as a percent of total full-time faculty who identify as Hispanic, andfull-time not tenured/ not tenure track faculty as a percent of total full-time faculty who identify as Hispanic. The top view shows the proportion of full-time tenured/ on tenure track and not tenured/ nottenure track faculty who identify as Hispanic as a percent of total full-time faculty who identify as Hispanic at NYU and the median value at other very high research activity institutions. The bottom left viewshows the range of values for full-time tenured/on tenure track who identify as Hispanic as a percent of total full-time faculty who identify as Hispanic. The bottom right view shows the range of values forfull-time not tenured/not tenure track who identify as Hispanic as a percent of total full-time faculty who identify Hispanic. Between 2003 and 2011, at NYU, the proportion of tenured/ on tenure track facultywho identify as Hispanic decreased five-percentage points (from 60% in 2003 to 55% in 2011); this is lower than other very high research activity institutions, which decreased twelve-percentage points(from 69% in 2003 to 57% in 2011).
2003 2005 2007 2009 2011
New York University Tenured/On Tenure Track
Not Tenured (not on tenure track)
Very High Research ActivityInstitutions
Tenured/On Tenure Track
Not Tenured (not on tenure track)
45%
55%
42%
58%
41%
59%
32%
68%
40%
60%
43%
57%
38%
62%
38%
62%
35%
65%
31%
69%
Full-time Faculty within Faculty Status as a Percent of Total Full-time FacultyIPEDS Race/Ethnicity Category = Hispanic
New York University
Very High Research Activity Institutions
Tenured/On Tenure Track Not Tenured (not on tenure track)
2003 2005 2007 2009 2011 2003 2005 2007 2009 2011
0%
20%
40%
60%
80%
100%
Percent Within Status
57%
69%
79%
49%
65%73%
52%
62%
73%
52%
62%
73%
50%57%
67%
21%
31%
43%
27%35%
51%
27%
38%
48%
28%
38%
48%
33%
43%
53%
Full-time Faculty within Faculty Status as a Percent of Total Full-time Faculty***
Source: National Center for Education Statistics (NCES)*Based on 2010 Carnegie Classification. See last page for institution list. Excludes medical school faculty.**Fall 2011 is the most recent publicly available faculty status data on race/ethnicity and gender available from the NCES.***Data labels indicate the 25th, 50th, and 75th percentiles for non-NYU research universities with very high research activity.
Office of Institutional Research and Data Integrity V.P. for Enrollment Management and University Institutional Research
34 Faculty and Student Peer Diversity Trends Report April 27, 2014
FSC Meeting 5/8/14, Document C, Page 45

Full-time Faculty Trends by Faculty Status and Ethnicity Full-time Faculty Status as a Percent of Total Full-time Faculty
IPEDS Race/Ethnicity Category = WhiteNYU and Other Very High Research Activity Institutions*
Fall 2003 to Fall 2011**
This page shows fall 2003 to fall 2011 full-time faculty within faculty status at NYU and at other very high research activity institutions for faculty who identify as White. Faculty data for NYU and for othervery high research activity institutions excludes medical schools. The views on this page show full-time tenured/ on-tenure track faculty as a percent of total full-time faculty who identify as White, and full-time not tenured/ not tenure track faculty as a percent of total full-time faculty who identify as White. The top view shows the proportion of full-time tenured/ on tenure track and not tenured/ not tenuretrack faculty who identify as White as a percent of total full-time faculty who identify as White at NYU and the median value at other very high research activity institutions. The bottom left view shows therange of values for full-time tenured/on tenure track who identify as White as a percent of total full-time faculty who identify as White. The bottom right view shows the range of values for full-time nottenured/not tenure track who identify as White as a percent of total full-time faculty who identify White. Between 2003 and 2011, at NYU, the proportion of tenured/ on tenure track faculty who identify asWhite decreased ten-percentage points (from 67% in 2003 to 57% in 2011); this is slightly higher than other very high research activity institutions, which decreased eight-percentage points (from 69% in2003 to 58% in 2011).
2003 2005 2007 2009 2011
New York University Tenured/On Tenure Track
Not Tenured (not on tenure track)
Very High Research ActivityInstitutions
Tenured/On Tenure Track
Not Tenured (not on tenure track)
43%
57%
42%
58%
40%
60%
37%
63%
33%
67%
39%
61%
37%
63%
35%
65%
34%
66%
31%
69%
Full-time Faculty within Faculty Status as a Percent of Total Full-time FacultyIPEDS Race/Ethnicity Category = White
New York University
Very High Research Activity Institutions
Tenured/On Tenure Track Not Tenured (not on tenure track)
2003 2005 2007 2009 2011 2003 2005 2007 2009 2011
0%
20%
40%
60%
80%
100%
Percent Within Status
59%
69%
79%
55%
66%
74%
56%
65%
73%
55%
63%
71%
51%
61%
68%
21%
31%
41%
26%
34%
45%
27%
35%
44%
29%
37%
45%
32%
39%
49%
Full-time Faculty within Faculty Status as a Percent of Total Full-time Faculty***
Source: National Center for Education Statistics (NCES)*Based on 2010 Carnegie Classification. See last page for institution list. NYU's data excludes the School of Medicine (SOM).**Fall 2011 is the most recent publicly available faculty status data on race/ethnicity and gender available from the NCES.***Data labels indicate the 25th, 50th, and 75th percentiles for non-NYU research universities with very high research activity.
Office of Institutional Research and Data Integrity V.P. for Enrollment Management and University Institutional Research
35 Faculty and Student Peer Diversity Trends Report April 27, 2014
FSC Meeting 5/8/14, Document C, Page 46

Carnegie Classification: Research Universities (Very High Research Activity)
This page lists the 108 schools, including NYU, that are classified as "Research Universities (Very High Research Activity)" by the Carnegie Classification System. The schools on thispage represent the comparative group used in the student and faculty diversity trends analysis.
Arizona State University
Boston University
Brandeis University
Brown University
California Institute of Technology
Carnegie Mellon University
Case Western Reserve University
Colorado State University-Fort Collins
Columbia University in the City of New York
Cornell University
CUNY Graduate School and University Center
Dartmouth College
Duke University
Emory University
Florida State University
George Washington University
Georgetown University
Georgia Institute of Technology-Main Campus
Georgia State University
Harvard University
Indiana University-Bloomington
Iowa State University
Johns Hopkins University
Louisiana State University and Agricultural & Mechanical College
Massachusetts Institute of Technology
Michigan State University
Mississippi State University
Montana State University
New York University
North Carolina State University at Raleigh
North Dakota State University-Main Campus
Northwestern University
Ohio State University-Main Campus
Oregon State University
Pennsylvania State University-Main Campus
Princeton University
Purdue University-Main Campus
Rensselaer Polytechnic Institute
Rice University
Rockefeller University
Rutgers University-New Brunswick
Stanford University
Stony Brook University
SUNY at Albany
Texas A & M University-College Station
The University of Tennessee
The University of Texas at Austin
Tufts University
Tulane University of Louisiana
University at Buffalo
University of Alabama at Birmingham
University of Alabama in Huntsville
University of Arizona
University of Arkansas
University of California-Berkeley
University of California-Davis
University of California-Irvine
University of California-Los Angeles
University of California-Riverside
University of California-San Diego
University of California-Santa Barbara
University of California-Santa Cruz
University of Central Florida
University of Chicago
University of Cincinnati-Main Campus
University of Colorado Boulder
University of Connecticut
University of Delaware
University of Florida
University of Georgia
University of Hawaii at Manoa
University of Houston
University of Illinois at Chicago
University of Illinois at Urbana-Champaign
University of Iowa
University of Kansas
University of Kentucky
University of Louisville
University of Maryland-College Park
University of Massachusetts Amherst
University of Miami
University of Michigan-Ann Arbor
University of Minnesota-Twin Cities
University of Missouri-Columbia
University of Nebraska-Lincoln
University of New Mexico-Main Campus
University of North Carolina at Chapel Hill
University of Notre Dame
University of Oklahoma Norman Campus
University of Oregon
University of Pennsylvania
University of Pittsburgh-Pittsburgh Campus
University of Rochester
University of South Carolina-Columbia
University of South Florida-Main Campus
University of Southern California
University of Utah
University of Virginia-Main Campus
University of Washington-Seattle Campus
University of Wisconsin-Madison
Vanderbilt University
Virginia Commonwealth University
Virginia Polytechnic Institute and State University
Washington State University
Washington University in St Louis
Wayne State University
Yale University
Yeshiva University
Office of Institutional Research and Data Integrity V.P. for Enrollment Management and University Institutional Research
36 Faculty and Student Peer Diversity Trends Report April 27, 2014
FSC Meeting 5/8/14, Document C, Page 47

Office of Equal Opportunity 726 BROADWAY, ROOMS 715-721 NEW YORK, NEW YORK 10003 TELEPHONE: 212 998 2370 FACSIMILE: 212 995 4037
MEMORANDUM
To: Charlton McIlwain, Co-Chair, Faculty Senators Council Personnel Policies & Tenure Modifications Committee
From: Office of Equal Opportunity
Re: Status of Request for Information; Initiative on Inclusion, Equity & Diversity at NYU
In response to the Faculty Senators Council’s October 2013 request for information, the
Office of Equal Opportunity, in partnership with the Division of Human Resources, the Office of
Institutional Research, and the Office of Academic Appointments, conducted a survey of the
demographic data collection practices amongst 15 Colleges, Institutes, and Schools that comprise
New York University - New York. Specifically, we sought to identify how Race/Ethnicity and
Gender information is collected and stored for Faculty applicants and candidates. Please note that
NYU Polytechnic Institute was omitted from this survey, as the inquiry was initiated prior to the
January 1, 2014 merger.
In total, eleven (11) schools responded, with four (4) abstaining. Of the eleven responders,
ten (10) issue an invitation to self-identify to Faculty applicants and/or candidates at some point in
the recruitment cycle. Please note at the time this survey was conducted, all employees could input
or change their personal information at any time via the ePASS employee self-service module. As of
March 31, 2014 ePASS has been replaced with PeopleSync, accessible from the Work tab of NYU
Home.
FSC Meeting 5/8/14, Document C, Page 48

P a g e 2 | 5
Q2-a. At what point(s) during a faculty member’s tenure at the university is one invited to
self-identify?
The majority of schools (7 of 10) who issue an issue the invitation to self-identify do so to the final
candidate only, at the post-offer stage. Four (4) schools have an invitation to self-identify integrated
into the application process through a variety of methods including integration into the Applicant
Tracking System, standalone web-based surveys, or postcards. The collected demographic data is
stored separately from identifying candidate information and is not available to search committees.
One school issues the invitation at two stages, Application and Post-Hire.
4
0
7
1
APPLICATION STAGE INTERVIEW STAGE POST-‐OFFER POST-‐HIRE
Stage at Which Invita2on to Self-‐Iden2fy is Extended
FSC Meeting 5/8/14, Document C, Page 49
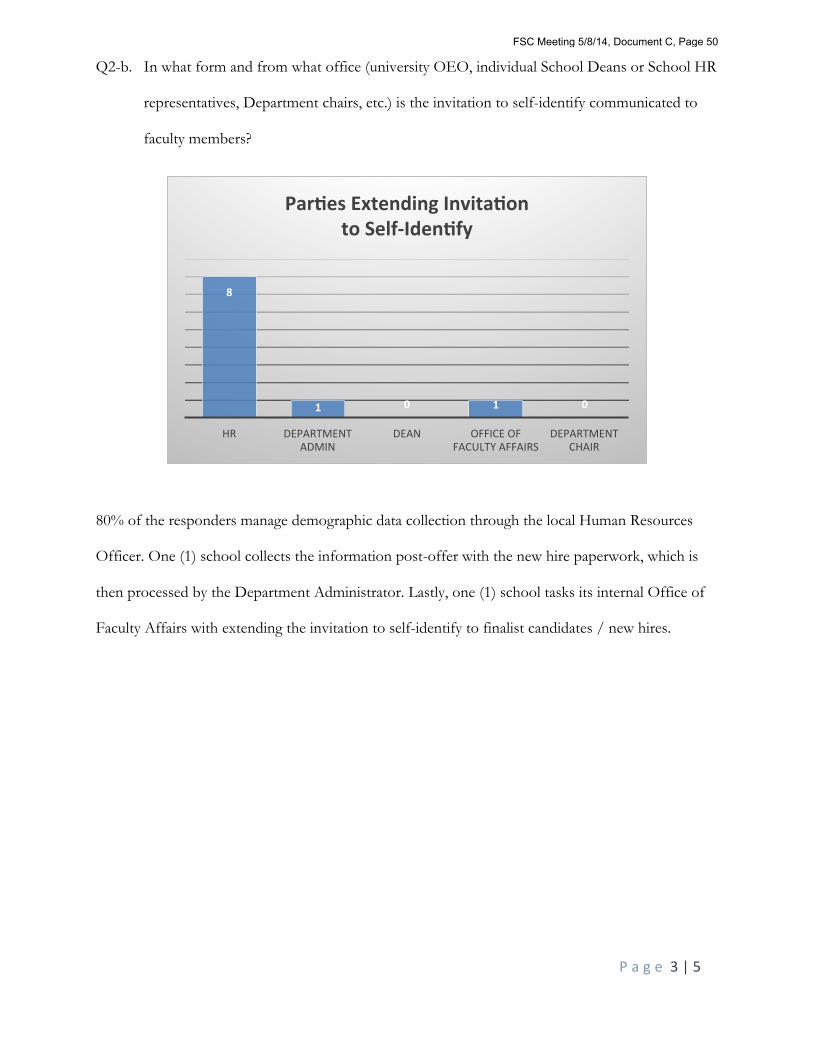
P a g e 3 | 5
Q2-b. In what form and from what office (university OEO, individual School Deans or School HR
representatives, Department chairs, etc.) is the invitation to self-identify communicated to
faculty members?
80% of the responders manage demographic data collection through the local Human Resources
Officer. One (1) school collects the information post-offer with the new hire paperwork, which is
then processed by the Department Administrator. Lastly, one (1) school tasks its internal Office of
Faculty Affairs with extending the invitation to self-identify to finalist candidates / new hires.
8
1 0 1 0
HR DEPARTMENT ADMIN
DEAN OFFICE OF FACULTY AFFAIRS
DEPARTMENT CHAIR
Par2es Extending Invita2on to Self-‐Iden2fy
FSC Meeting 5/8/14, Document C, Page 50

P a g e 4 | 5
Q2 - c. What percentage of faculty, on average, respond to the request to self-identify, and of those
what percentage respond with the choice to not identify?
60% of the responding schools reported a 100% response rate from the invitation to self-identify.
These schools also invite at the post-offer and new hire stages and thus reaching out to a much
smaller pool of individuals by integrating the invitation to self-identify into the onboarding process.
Of the four (4) schools that issue invitations at the applicant stage, one (1) measures a response rate
of 33%; the other schools do not maintain metrics on response rates.
6
0 0 1 0
3
100% 75%-‐99% 50%-‐74% 25%-‐49% <25% UNKNOWN
Response Rate of Invita2ons to Self-‐Iden2fy
FSC Meeting 5/8/14, Document C, Page 51

P a g e 5 | 5
Q2d. What is the mechanism and process used to identify those not self-identified, i.e. what form
of visual survey and/or other information is used to identify faculty members?
70% of the ten (10) responders utilize multiple methods as needed to identify candidates who have
declined to self-identify, and nine (9) schools conduct a visual “best guess” as needed. Please note
that Affirmative Action Recruitment Reports submitted to the Office of Equal Opportunity for
review require all interviewed candidates to be categorized by race / ethnicity and gender. Half of
the responding schools found Curriculum Vitae information helpful, looking to educational history
and professional affiliations as indicators of racial/ethnic and gender identity(ies).
9
2 2 0
5
VISUAL "BEST GUESS"
INTERNET SEARCH
CONSULT WITH COLLEAGUES
LEAVE BLANK INFORMATION FROM CV
Mechanism to Iden2fy Candidates Whom Decline to Self-‐Iden2fy
FSC Meeting 5/8/14, Document C, Page 52

1
NYU Faculty Senators Council Benefits & Housing 2013-2014 Year End Report 7 May 2014 Co-Chairs: Sewin Chan - Wagner David Stokes - Medicine Committee members: Everett Allgood - Libraries Adam Becker - FAS Hasia Diner - FAS Benard Dreyer - Medicine Mary Ann Jones - Social Work Angela Kamer - Dentistry Arthur Miller - SCPS Allen Mincer - FAS Jules Moskowitz - FAS Victoria Stanhope – Social Work
Meetings: October 3, 2013 (Benefits) November 7, 2013 (Housing) December 5, 2013 (Housing) January 13, 2014 (FSC Executive with Housing & Benefits) February 10, 2014 (Housing & Benefits) March 7, 2014 (Benefits) March 13, 2014 (Benefits presentation to FSC) April 2, 2014 (Housing) April 17, 2014 (Housing) April 23, 2014 (Benefits) May 7, 2014 (Benefits) May 8, 2014 (Housing presentation to FSC) May 14, 2014 (Benefits, planned) May 28, 2014 (Benefits, planed)
Primary representatives from NYU administration: Alison Leary (Executive VP for Operations) Benefits: Andrew Gordon (VP of Human Resources) & Ann Kraus (Senior Director, Global Compensation & Benefits) Housing: Karen Gulino (Asst. VP of Housing), Beth Morningstar (Director, Strategic Assessment and Communications Office of the Executive Vice President). Karen Gulino is transitioning to the Public Safety office as of April 2014. Committee Goals 2013-14, 2014-15 These are described in the Committee’s Interim Report to the FSC: http://www.nyu.edu/content/dam/nyu/facultySenatorsCouncil/documents/FSCBenefitsHousinggoals31314.pdf The Committee is working with the Faculty Housing Office to produce a report on housing issues in Fall 2014.
FSC Meeting 5/8/14, Document D, Page 1

2
Fringe Benefits Budget The report by Marty Dorph, presented to the FSC on April 10, 2014, provides details on the size of NYU’s fringe benefits expenses from 2002 to 2013. See page 19: http://www.nyu.edu/content/dam/nyu/facultySenatorsCouncil/documents/DocD.4.10.14-NYUFinancialDataRequest1.pdf About a quarter of NYU’s fringe benefits budget is statutory (FICA, Workers Comp, Unemployment insurance, etc.). Of the remainder, about half goes towards health care benefits (including drugs, dental and retiree medical), about one third is retirement savings and life insurance, and one tenth is tuition remission for employees and their families. Health Benefit Plans The Medical School has distinct health benefits that are not discussed here. For all other schools, full time faculty benefits are described here: http://www.nyu.edu/faculty/benefits/full-time.html Self-Insured Plan Like most large employers, NYU is a self-funded insurance plan. United Healthcare (UHC), Aetna and Oxford simply act as a conduit for services; NYU bears all of the underlying risk. This means that a few high cost claims can lead to sharply increased costs. These costs are covered by the fringe benefit pool and employee contributions, which together account for the total cost of the plan. Benefits Planning Timeline Review of health benefit plans for the following calendar year (2015) begins when data on the previous year’s claims (2013) become available, around April. Any significant plan design changes must be decided by mid-summer so that implementation can begin for open enrollment in November. It is important for the Benefits-Housing Committee to be staffed by some faculty who are available after the spring semester ends. At the time of writing, a subcommittee (co-chaired by Sewin and David) is working with HR to plan for 2015 and review possible plan changes. Some coordination with the AMC Benefits Committee is desirable because full time administrators and professional research staff receive the exact same package of health benefits, and because faculty have an interest in recruiting and retaining the best staff. 2014 Benefit Plans HR collaborated with last year’s FSC Benefits Committee (chaired by Mary Ann Jones) from March-June 2013. These recommendations were endorsed by NYU and are reflected in our current 2014 plans:
• No major changes to design of medical plans between 2013 and 2014 • Increase in employee contributions by 5% compared with 2013. . • Comparable increase for retiree medical plans • No increase in dental contributions
Employees who received a salary increase equal to the average AMI of 3% in 2013 and who chose the UHC Advantage plan for family coverage, would in fact have an effective salary increase of around 2.6% (depending on salary tier), in light of the benefit contribution increases.
FSC Meeting 5/8/14, Document D, Page 2

3
Enrollments In 2014, about 10 percent of eligible employees waived coverage. Among enrollees, the most popular plan is the UHC Advantage, with just under half of enrollees in this plan. Just over a quarter chose the UHC Value plan and a fifth chose one of the HMOs from Oxford or Aetna. A new High Deductible Health Plan (HDHP) with Health Savings Account (HSA) was launched in 2013 and now attracts about 5 percent of enrollees. Not including the new HDHP, the enrollment distribution across plans has been generally consistent for many years. The extent of switching between plans is very low. The Committee encourages faculty to consider carefully the HDHP option because it can offer cost savings for some people. In particularly, people with both high and low health care usage benefit from this plan. While the out-of-pocket expenses associated with deductibles are high, the monthly employee contributions are low. The deductibles (and other eligible out-of-pocket expenses) can be paid out of the HSA, which rolls over from year to year. Importantly, there is an out-of-pocket maximum, protecting people from excessive costs. If one reaches this maximum, the savings in cost of premiums outweighs the out-of-pocket expenses. The Affordable Care Act (ACA) HR began planning for the ACA in 2010. Various ACA requirements have been implemented in recent years, including the coverage of dependent children to age 26, 100% coverage for preventative care, and the elimination of lifetime caps, etc. ACA considerations led to the introduction of the HDHP in 2013, which given their low premiums may help avoid excise taxes in future years. The most important ACA consideration at this point is the excise tax, so-called Cadillac tax, that is slated to begin in 2018. This is a 40% tax to be paid by employers on the cost of health plans that exceed an annual threshold of $10,200 for individual coverage and $27,500 for family coverage (Cadillac plans). To be clear, the 40% excise tax applies to the overall plan cost that exceeds the threshold, regardless of how the employer and worker contributions are divided. Each individual enrollee is assessed separately so that a worker with a cheap plan cannot offset the tax liability of a worker with an expensive plan. For example, if an individual worker’s annual plan cost is $12,200 (exceeding the threshold by $2,000), then a tax of 40% on the $2,000 excess would be levied for that worker, i.e., $800. For a self-insured plan such as NYUs, the overall plan cost is the COBRA rate for each plan (essentially, the analog of the premium a health insurance company would charge for the plan). Any funds put into health care flexible spending accounts or HSAs must be included in the overall plan cost, but out-of-pocket expenses are excluded. Based on the current law (which, in light of the other ACA revisions to date, will probably be subject to change), and under a set of assumptions that maintain the existing benefit plan designs, HR estimates that the Cadillac tax liability will be substantial. All the current NYU plans would be deemed Cadillac plans under the existing law, with the possible exception of the HDHP (there is uncertainty here as the existing law is not specific enough to be completely sure). Most experts agree that the Cadillac tax’s liability is extremely difficult to forecast both because of legislative uncertainty and hard-to-predict changes in the health care market place as all employers react to the tax, as well as other ACA provisions. The challenge in the coming few years is to figure out how NYU should best respond, especially in the face of these uncertainties. As intended by the architects of the ACA, the response may involve some move towards more cash compensation, and less compensation in the form of health benefits (since this will be less tax advantaged). This underscores the importance of communication across FSC committees with responsibility for all components of compensation, including salaries and benefits.
FSC Meeting 5/8/14, Document D, Page 3

4
It is important to emphasize that under current law, large employers who now provide health benefits have little incentive to replace this coverage with extra salary that workers can use on the exchanges created by the ACA. Any such increases in salary (regardless of what the employer calls it) is deemed taxable income, whereas an employer provided health plan is tax free income that gives employers a cheaper way to provide total compensation. Moreover, the ACA charges a $2,000 per worker annual penalty to large employers that do not provide coverage to at least 70% of full time employees (increasing to 95% in future years). Tuition Remission These tuition remission (TR) policies were adopted by NYU in 2009: Employee: Undergraduate or graduate NYU tuition at certain schools is paid at 100% if salary is less than $50,000 and 90% if salary is over $50,000. Employee’s spouse: Undergraduate or graduate NYU tuition at certain schools is paid at 50% Dependent undergraduate child: NYU undergraduate tuition is paid at 100% if salary is less than $50,000 and 90% if salary is over $50,000. Portable tuition payment of up to $5,500 per year for undergraduate studies outside of NYU. Medical School Faculty have a different program: 100% TR at NYU for employees and dependent children for undergraduate and graduate degrees. No portable TR. A majority of the TR budget for non-Medical School employees is used for employee education with the remainder being provided to children and spouse/partners. Similar information has not been obtained about the Medical School. The Committee plans to further review these policies next semester and address the following:
• A comparison of NYU with peer institutions. Senior faculty recruits with high school or college aged children are being lost to competing institutions, according to some reports from faculty senators.
• Consider the net cost of a more generous portable tuition policy. This net cost should account for the extra revenue from a full-tuition paying student when a faculty child chooses not to attend NYU. It is possible that a more generous portable tuition policy would be less costly for NYU, as more faculty children choose to go elsewhere, freeing up full-tuition paying seats for non-affiliates. Under the current policy, faculty children have an enormous financial incentive to attend NYU, which may not be the best college match for them.
• The $50,000 salary threshold for 100% TR results in a range of salary over which an employee receiving TR would see a reduction in total compensation if his/her salary increased beyond $50,000. The Committee has discussed possible ways of eliminating this cliff and will revisit this issue next semester.
FSC Meeting 5/8/14, Document D, Page 4