mirror, mirror on the wall: how the performance of the u.s. health
TRANSCRIPT
Mirror, Mirror on the WallMirror, Mirror on the Wall
How the Performance of the U.S. Health Care System Compares Internationally
2010 Update
Karen Davis, Cathy Schoen, and Kristof Stremikis
June 2010

The Commonwealth Fund is a private foundation that promotes a high performance health care system providing better access, improved quality, and greater efficiency. The Fund’s work focuses particularly on society’s most vulnerable, including low-income people, the uninsured, minority Americans, young children, and elderly adults.The Fund carries out this mandate by supporting independent research on health care issues and making grants to improve health care practice and policy. An international program in health policy is designed to stimulate innovative policies and practices in the United States and other industrialized countries.
Mirror, Mirror on the WallMirror, Mirror on the Wall
How the Performance of the U.S. Health Care System Compares Internationally2010 Update
Karen Davis, Cathy Schoen, and Kristof Stremikis
June 2010
ABSTRACT: Despite having the most costly health system in the world, the United States consistently under-performs on most dimensions of performance, relative to other countries. This report—an update to three earlier editions—includes data from seven countries and incorporates patients’ and physicians’ survey results on care experiences and ratings on dimensions of care. Compared with six other nations—Australia, Canada, Germany, the Netherlands, New Zealand, and the United Kingdom—the U.S. health care system ranks last or next-to-last on five dimensions of a high performance health system: quality, access, efficiency, equity, and healthy lives. Newly enacted health reform legislation in the U.S. will start to address these prob-lems by extending coverage to those without and helping to close gaps in coverage—leading to improved disease management, care coordination, and better outcomes over time.
Support for this research was provided by The Commonwealth Fund. The views presented here are those of the authors and not necessarily those of The Commonwealth Fund or its directors, officers, or staff. To learn more about new publications when they become available, visit the Fund’s Web site and register to receive e-mail alerts. Commonwealth Fund pub. no. 1400.

CONTENTSAbout the Authors iii
Acknowledgments iv
Executive Summary v
Introduction 1
Results 3
Quality 5
Effective Care 5
Safe Care 5
Coordinated Care 7
Patient-Centered Care 9
Access 11
Cost-Related Access Problems 11
Timeliness of Care 11
Efficiency 13
Equity 13
Long, Healthy, and Productive Lives 16
Discussion 16
Notes 19
Methodology Appendix 21
LIST OF EXHIBITSExhibit ES-1 Overall Ranking v
Exhibit 1 International Comparison of Spending on Health, 1980–2007 2
Exhibit 2 Seven-Nation Summary Scores on Health System Performance 3
Exhibit 3 Overall Ranking 3
Exhibit 4a Effective Care Measures 4
Exhibit 4b Safe Care Measures 6
Exhibit 4c Coordinated Care Measures 7
Exhibit 4d Patient-Centered Care Measures 8
Exhibit 5 Access Measures 10
Exhibit 6 Efficiency Measures 12
Exhibit 7 Equity Measures 14
Exhibit 8 Long, Healthy, and Productive Lives Measures 16

iii
ABOUT THE AUTHORS
Karen Davis, Ph.D., is president of The Commonwealth Fund. She is a nationally recognized economist with a distinguished career in public policy and research. In recognition of her work, Ms. Davis received the 2006 AcademyHealth Distinguished Investigator Award. Before joining the Fund, she served as chairman of the Department of Health Policy and Management at The Johns Hopkins Bloomberg School of Public Health, where she also held an appointment as professor of economics. She served as deputy assistant secre-tary for health policy in the Department of Health and Human Services from 1977 to 1980, and was the first woman to head a U.S. Public Health Service agency. A native of Oklahoma, she received her doctoral degree in economics from Rice University, which recognized her achievements with a Distinguished Alumna Award in 1991. Ms. Davis has published a number of significant books, monographs, and articles on health and social policy issues, including the landmark books Health Care Cost Containment; Medicare Policy; National Health Insurance: Benefits, Costs, and Consequences; and Health and the War on Poverty. She can be e-mailed at [email protected].
Cathy Schoen, M.S., is senior vice president at The Commonwealth Fund, a member of the Fund’s execu-tive management team, and research director of the Fund’s Commission on a High Performance Health System. Her work includes strategic oversight of surveys, research, and policy initiatives to track health system performance. Previously Ms. Schoen was on the research faculty of the University of Massachusetts School of Public Health and directed special projects at the UMass Labor Relations and Research Center. During the 1980s, she directed the Service Employees International Union’s research and policy department. Earlier, she served as staff to President Carter’s national health insurance task force. Prior to federal service, she was a research fellow at the Brookings Institution. She has authored numerous publications on health policy and insurance issues, and national/ international health system performance, including the Fund’s 2006 and 2008 National Scorecards on U.S. Health System Performance and the 2007 and 2009 State Scorecards, and coau-thored the book Health and the War on Poverty. She holds an undergraduate degree in economics from Smith College and a graduate degree in economics from Boston College. She can be e-mailed at [email protected].
Kristof Stremikis, M.P.P., is senior research associate for Commonwealth Fund President Karen Davis. Previously, he was a graduate student researcher in the School of Public Health at the University of California, Berkeley, where he evaluated various state, federal, and global health initiatives while providing economic and statistical support to faculty and postdoctoral fellows. He has also served as consultant in the director’s office of the California Department of Healthcare Services, working on recommendations for a pay-for-performance system in the Medi-Cal program. Mr. Stremikis holds three undergraduate degrees in economics, political sci-ence, and history from the University of Wisconsin at Madison. He received a master of public policy degree from the Goldman School at the University of California, Berkeley, and is currently enrolled in the health policy and management program at Columbia University. He can be emailed at [email protected].
iv
ACKNOWLEDGMENTS
The authors gratefully acknowledge comments from Stephen C. Schoenbaum, M.D., and Michelle M. Doty, Ph.D., as well as other contributors to prior editions of Mirror Mirror, from which much of this report is drawn: Anne-Marie Audet, Alyssa Holmgren, Jennifer Nicholson, Katherine Shea, and Katie Tenney. They also extend thanks to Harris Interactive for survey development and administration of the 2007–2009 Commonwealth Fund International Health Policy Surveys. Finally, they thank The Commonwealth Fund communications team of Suzanne Augustyn, Paul Frame, Chris Hollander, and Deb Lorber for editorial support and report layout and design.
v
EXECUTIVE SUMMARYThe U.S. health system is the most expensive in the world, but comparative analyses consistently show the United States underperforms relative to other countries on most dimensions of performance. This report, which includes information from the most recent three Commonwealth Fund surveys of patients and primary care physicians about medical practices and views of their countries’ health systems (2007–2009), confirms findings discussed in previous editions of Mirror, Mirror. It also includes information on health care outcomes that were featured in the most recent (2008) U.S. health system scorecard issued by the Commonwealth Fund Commission on a High Performance Health System.
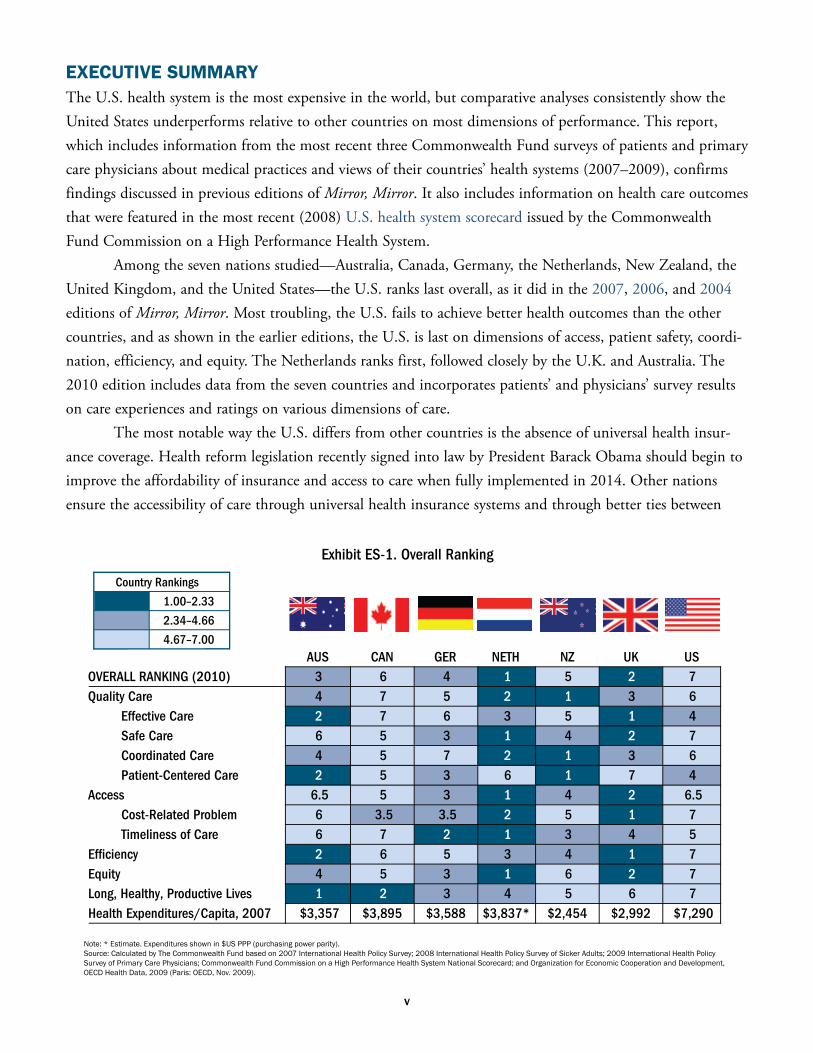
Among the seven nations studied—Australia, Canada, Germany, the Netherlands, New Zealand, the United Kingdom, and the United States—the U.S. ranks last overall, as it did in the 2007, 2006, and 2004 editions of Mirror, Mirror. Most troubling, the U.S. fails to achieve better health outcomes than the other countries, and as shown in the earlier editions, the U.S. is last on dimensions of access, patient safety, coordi-nation, efficiency, and equity. The Netherlands ranks first, followed closely by the U.K. and Australia. The 2010 edition includes data from the seven countries and incorporates patients’ and physicians’ survey results on care experiences and ratings on various dimensions of care.
The most notable way the U.S. differs from other countries is the absence of universal health insur-ance coverage. Health reform legislation recently signed into law by President Barack Obama should begin to improve the affordability of insurance and access to care when fully implemented in 2014. Other nations ensure the accessibility of care through universal health insurance systems and through better ties between
Exhibit ES-1. Overall Ranking
Note: * Estimate. Expenditures shown in $US PPP (purchasing power parity).Source: Calculated by The Commonwealth Fund based on 2007 International Health Policy Survey; 2008 International Health Policy Survey of Sicker Adults; 2009 International Health Policy Survey of Primary Care Physicians; Commonwealth Fund Commission on a High Performance Health System National Scorecard; and Organization for Economic Cooperation and Development, OECD Health Data, 2009 (Paris: OECD, Nov. 2009).
AUS CAN GER NETH NZ UK US OVERALL RANKING (2010) 3 6 4 1 5 2 7 Quality Care 4 7 5 2 1 3 6
Effective Care 2 7 6 3 5 1 4 Safe Care 6 5 3 1 4 2 7 Coordinated Care 4 5 7 2 1 3 6 Patient-Centered Care 2 5 3 6 1 7 4
Access 6.5 5 3 1 4 2 6.5 Cost-Related Problem 6 3.5 3.5 2 5 1 7 Timeliness of Care 6 7 2 1 3 4 5
Ef�ciency 2 6 5 3 4 1 7 Equity 4 5 3 1 6 2 7 Long, Healthy, Productive Lives 1 2 3 4 5 6 7 Health Expenditures/Capita, 2007 $3,357 $3,895 $3,588 $3,837* $2,454 $2,992 $7,290
Country Rankings
1.00–2.33
2.34–4.66
4.67–7.00
vi
patients and the physician practices that serve as their long-term “medical homes.” Without reform, it is not surprising that the U.S. currently underperforms relative to other countries on measures of access to care and equity in health care between populations with above-average and below-average incomes.
But even when access and equity measures are not considered, the U.S. ranks behind most of the other countries on most measures. With the inclusion of primary care physician survey data in the analysis, it is apparent that the U.S. is lagging in adoption of national policies that promote primary care, quality improvement, and information technology. Health reform legislation addresses these deficiencies; for instance, the American Recovery and Reinvestment Act signed by President Obama in February 2009 included approx-imately $19 billion to expand the use of health information technology. The Patient Protection and Affordable Care Act of 2010 also will work toward realigning providers’ financial incentives, encouraging more efficient organization and delivery of health care, and investing in preventive and population health.
For all countries, responses indicate room for improvement. Yet, the other six countries spend consid-erably less on health care per person and as a percent of gross domestic product than does the United States. These findings indicate that, from the perspectives of both physicians and patients, the U.S. health care sys-tem could do much better in achieving value for the nation’s substantial investment in health.
Key FindingsQuality:• The indicators of quality were grouped into four categories: effective care, safe care, coordinated care, and patient-centered care. Compared with the other six countries, the U.S. fares best on provision and receipt of preventive and patient-centered care. However, its low scores on chronic care management and safe, coordinated care pull its overall quality score down. Other countries are further along than the U.S. in using information technology and managing chronic conditions. Information systems in countries like Australia, New Zealand, and the U.K. enhance the ability of physicians to identify and monitor patients with chronic conditions.
Access:• Not surprisingly—given the absence of universal coverage—people in the U.S. go without needed health care because of cost more often than people do in the other countries. Americans with health problems were the most likely to say they had access issues related to cost, but if insured, patients in the U.S. have rapid access to specialized health care services. In other countries, like the U.K. and Canada, patients have little to no financial burden, but experience wait times for such specialized services. There is a frequent misperception that such tradeoffs are inevitable; but patients in the Netherlands and Germany have quick access to specialty services and face little out-of-pocket costs. Canada, Australia, and the U.S. rank lowest on overall accessibility of appointments with primary care physicians.
Efficiency:• On indicators of efficiency, the U.S. ranks last among the seven countries, with the U.K. and Australia ranking first and second, respectively. The U.S. has poor performance on measures of national health expenditures and administrative costs as well as on measures of the use of information technology, rehospitalization, and duplicative medical testing. Sicker survey respondents in Germany and the Netherlands are less likely to visit the emergency room for a condition that could have been treated by a regular doctor, had one been available.
vii
Equity:• The U.S. ranks a clear last on nearly all measures of equity. Americans with below-average incomes were much more likely than their counterparts in other countries to report not visiting a physician when sick, not getting a recommended test, treatment, or follow-up care, not filling a prescription, or not seeing a dentist when needed because of costs. On each of these indicators, nearly half of lower-income adults in the U.S. said they went without needed care because of costs in the past year.
Long, healthy, and productive lives:• The U.S. ranks last overall with poor scores on all three indicators of long, healthy, and productive lives. The U.S. and U.K. had much higher death rates in 2003 from conditions amenable to medical care than some of the other countries, e.g., rates 25 percent to 50 percent higher than Canada and Australia. Overall, Australia ranks highest on healthy lives, scoring in the top three on all of the indicators.
Summary and ImplicationsThe U.S. ranks last of seven nations overall. Findings in this report confirm many of those in the earlier three editions of Mirror, Mirror. As in the earlier editions, the U.S. ranks last on indicators of patient safety, effi-ciency, and equity. Australia and the U.K. continue to demonstrate superior performance. The Netherlands, which was included for the first time in this edition, ranked first overall. In the subcategories, the U.S. ranks first on preventive care, and is strong on waiting times for specialist care and nonemergency surgical care, but weak on access to needed services and ability to obtain prompt attention from primary care physicians.
Any attempt to assess the relative performance of countries has inherent limitations. These rankings summarize evidence on measures of high performance based on national mortality data and the perceptions and experiences of patients and physicians. They do not capture important dimensions of effectiveness or effi-ciency that might be obtained from medical records or administrative data. Patients’ and physicians’ assess-ments might be affected by their experiences and expectations, which could differ by country and culture.
Disparities in access to services signal the need to expand insurance to cover the uninsured and to ensure that all Americans have an accessible medical home. Under health care reform, young adults up to age 26 will be eligible for coverage under their parents’ insurance plans beginning in September 2010, and low- to moderate-income families will be eligible for assistance in obtaining coverage in 2014.
With the enactment of the American Recovery and Reinvestment Act, the U.S. has accelerated its efforts to adopt health information technology and provide an integrated medical record and information sys-tem that is accessible to providers and patients. Those efforts must come to fruition soon for the nation to deliver more effective and efficient care.
Many U.S. hospitals and health systems are dedicated to improving the process of care to achieve bet-ter safety and quality, but the U.S. can also learn from innovations in other countries—including public reporting of quality data, payment systems that reward high-quality care, and a team approach to manage-ment of chronic conditions. Based on these patient and physician reports, and with the enactment of health reform, the U.S. could improve the delivery, coordination, and equity of the health care system.

1
MIRROR, MIRROR ON THE WALL:How the Performance of the U.S. Health Care
System Compares Internationally, 2010 Update
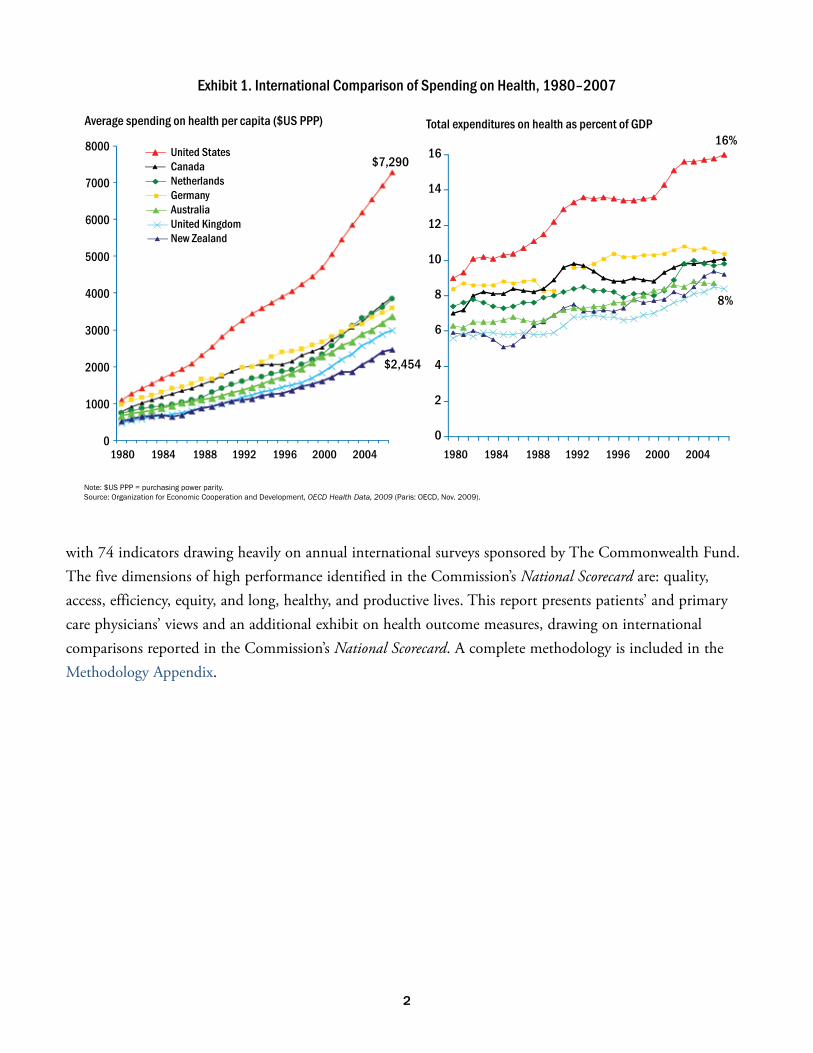
INTRODUCTIONOver the past decade, leaders in the United States have begun to realize that the nation’s health care system is far more costly and does not produce demonstrably better results than any other system in the world.1 It is increasingly clear that the United States has nowhere near “the best health care system in the world,” and that performance often falls markedly short of that of other countries.2 Despite this awareness, costs continue to accelerate relative to other countries (Exhibit 1). To do better, the U.S. must search for lessons that might be adopted or adapted to improve its system.
In the first major attempt to rank health care systems, the World Health Organization’s (WHO) World Health Report 2000 placed the U.S. health system 37th in the world.3 This called into question the value Americans receive for their investment in health care. The U.S. ranked 24th in terms of “health attain-ment,” even lower (32nd) in terms of “equity of health outcomes” across its population, and lower still (54th) in terms of “fairness of financial contributions” toward health care. In the same report, the U.S. ranked first in terms of “patient responsiveness.” Some experts have criticized the report’s measures, methods, and data, including the fact that the data did not include information derived directly from patients.4
Cross-national surveys of patients and their physicians offer a unique dimension that has been missing from international studies of health care system performance, including the WHO analysis. When such sur-veys include a common set of questions, they can overcome differences among national data systems and defi-nitions that frustrate cross-national comparisons. Since 1998, The Commonwealth Fund has supported sur-veys about patients’ and health professionals’ experiences with their health care systems in Australia, Canada, New Zealand, the United Kingdom, and the United States.5 Germany and the Netherlands were added in 2005 and 2006, respectively, and are included in this analysis.6 Focusing on access to care, costs, and quality, these sur-veys allow assessments of important dimensions of health system performance. However, they have their own limitations. In addition to lacking clinical data on effectiveness of care and including data from a limited number of countries, the surveys focus on only a slice of the health care quality picture—patient and primary care physician perceptions of the care they received and administered.
While each of the seven developed countries in this study has a unique health system, they all face cost and quality issues. Comparing patient- and physician-reported experiences in these countries can inform the ongoing debate over how to make the U.S. health care system more effective and responsive to patient needs and also can be useful to the others in improving their own systems.
In 2005, The Commonwealth Fund established a Commission on a High Performance Health System to assess the overall performance of the U.S. health care system. In July 2008, the Commission released the second National Scorecard on U.S. Health System Performance, which ranked the nation’s performance on 37 indicators, 11 of which were based on international comparisons.7 This report groups indicators into the same categories outlined in the Commission’s National Scorecard, but uses a more extensive international database
2
with 74 indicators drawing heavily on annual international surveys sponsored by The Commonwealth Fund. The five dimensions of high performance identified in the Commission’s National Scorecard are: quality, access, efficiency, equity, and long, healthy, and productive lives. This report presents patients’ and primary care physicians’ views and an additional exhibit on health outcome measures, drawing on international comparisons reported in the Commission’s National Scorecard. A complete methodology is included in the Methodology Appendix.
Exhibit 1. International Comparison of Spending on Health, 1980–2007
Average spending on health per capita ($US PPP) Total expenditures on health as percent of GDP
Note: $US PPP = purchasing power parity.Source: Organization for Economic Cooperation and Development, OECD Health Data, 2009 (Paris: OECD, Nov. 2009).
1980 1984 1988 1992 1996 2000 2004 1980 1984 1988 1992 1996 2000 2004
8000
7000
6000
5000
4000
3000
2000
1000
0
16
14
12
10
8
6
4
2
0
$2,454
$7,290
8%
16%United StatesCanadaNetherlandsGermanyAustraliaUnited KingdomNew Zealand

3
RESULTSOverall, the U.S. ranks last or next-to-last on all five dimensions of a high performance health system, as it did in the 2007, 2006, and 2004 editions of Mirror, Mirror.8 Exhibit 2 provides a snapshot of how the seven nations rank on the domains of quality, access, efficiency, equity, and long, healthy, and productive lives. The Netherlands ranks first overall, scoring highest on access and equity. The United Kingdom, which ranks sec-ond overall, scores best of the seven countries in terms of efficiency. Australia ranks highest on long, healthy, and productive lives. New Zealand is first on quality of care. Canada and the U.S. rank sixth and seventh overall, respectively.
The top-performing and lowest-performing countries have been relatively stable over time (Exhibit 3), though caution is warranted when examining trends in rankings given that indicators and domains have undergone minor variations in previous editions of this report. Overall rankings also may overshadow impor-tant absolute differences in performance, and closer examination of data is warranted when identifying high- and low-performing countries. Raw scores are included in tables and discussed in relevant sections of the report for this purpose.
Exhibit 2. Seven-Nation Summary Scores on Health System Performance
AUS CAN GER NETH NZ UK US
OVERALL RANKING 3 6 4 1 5 2 7
Quality Care 4 7 5 2 1 3 6
Effective Care 2 7 6 3 5 1 4
Safe Care 6 5 3 1 4 2 7
Coordinated Care 4 5 7 2 1 3 6
Patient-Centered Care 2 5 3 6 1 7 4
Access 6.5 5 3 1 4 2 6.5
Cost-Related Access Problems 6 3.5 3.5 2 5 1 7
Timeliness of Care 6 7 2 1 3 4 5
Efficiency 2 6 5 3 4 1 7
Equity 4 5 3 1 6 2 7
Long, Healthy, and Productive Lives 1 2 3 4 5 6 7
Exhibit 3. Overall Ranking
AUS CAN GER NETH NZ UK US
Overall Ranking (2010 edition) 3 6 4 1 5 2 7
Overall Ranking (2007 edition) 3.5 5 2 n/a 3.5 1 6
Overall Ranking (2006 edition) 4 5 1 n/a 2 3 6
Overall Ranking (2004 edition) 2 4 n/a n/a 1 3 5
Health Expenditures per Capita, 2007* $3,357 $3,895 $3,588 $3,837 $2,454 $2,992 $7,290* Expenditures shown in $US PPP (purchasing power parity). Netherlands is estimated.Data: OECD, OECD Health Data, 2009 (Nov. 2009).
4
Exhibit 4a. Effective Care Measures
Raw Scores (Percent) Ranking ScoresSource AUS CAN GER NETH NZ UK US AUS CAN GER NETH NZ UK US
Overall Benchmark Ranking (with average of subcategories): 2 7 6 3 5 1 4
Prevention 2 7 6 5 3.5 3.5 1Physicians reporting it is easy to print out a list of patients who are due or overdue for tests or preventive care
2009 63 18 37 65 57 90 24 3 7 5 2 4 1 6
Patients sent computerized reminder notices for preventive or follow-up care
2009 82 10 17 48 92 76 18 2 7 6 4 1 3 5
Receive reminders for preventive/follow-up care
2007 44 40 57 58 48 58 70 6 7 4 2.5 5 2.5 1
Doctor asked if emotional issues were affecting health
2007 37 36 25 27 31 25 46 2 3 6.5 5 4 6.5 1
Received advice from doctor on weight, nutrition, or exercise
2007 41 46 37 24 36 29 56 3 2 4 7 5 6 1
Chronic Care 3 7 5 2 6 1 4Diabetics receiving all four recommended services†
2008 36 39 40 59 55 67 43 7 6 5 2 3 1 4
Practice routinely uses written guidelines to treat diabetes
2009 87 82 77 98 93 96 82 4 5.5 7 1 3 2 5.5
Patients with hypertension who have had cholesterol checked in past year
2008 82 83 88 78 75 81 85 4 3 1 6 7 5 2
Practice routinely uses written guidelines to treat hypertension
2009 83 81 75 90 75 96 78 3 4 6.5 2 6.5 1 5
Practice routinely uses written guidelines to treat depression
2009 71 45 26 31 65 80 49 2 5 7 6 3 1 4
Has chronic condition and did not follow recommended care or treatment plan because of cost
2007 11 7 0 1 9 10 24 6 3 1 2 4 5 7
Primary care practices that routinely provide patients with chronic diseases written instructions
2009 24 16 23 22 15 33 30 3 6 4 5 7 1 2
Physicians reporting it is easy to print out a list of patients by diagnosis
2009 61 34 68 67 56 97 41 4 7 2 3 5 1 6
Physicians reporting it is easy to print out a list of all medications taken by individual patients, including those prescribed by other doctors
2009 71 33 55 70 57 89 45 2 7 5 3 4 1 6
Doctor sometimes, rarely, or never reviewed all medications, including those prescribed by other doctors (base: taking prescriptions regularly)
2008 41 40 49 62 48 48 41 2.5 1 6 7 4.5 4.5 2.5
† Recommended services include hemoglobin A1c checked in past six months and feet examined, eye exam, and cholesterol checked in past year.
5
QUALITYHigh-quality care is defined in the Commission’s National Scorecard as care that is effective, safe, coordinated, and patient-centered. New Zealand ranks first and Canada last, based on averages of the scores in these four areas (Exhibit 2).
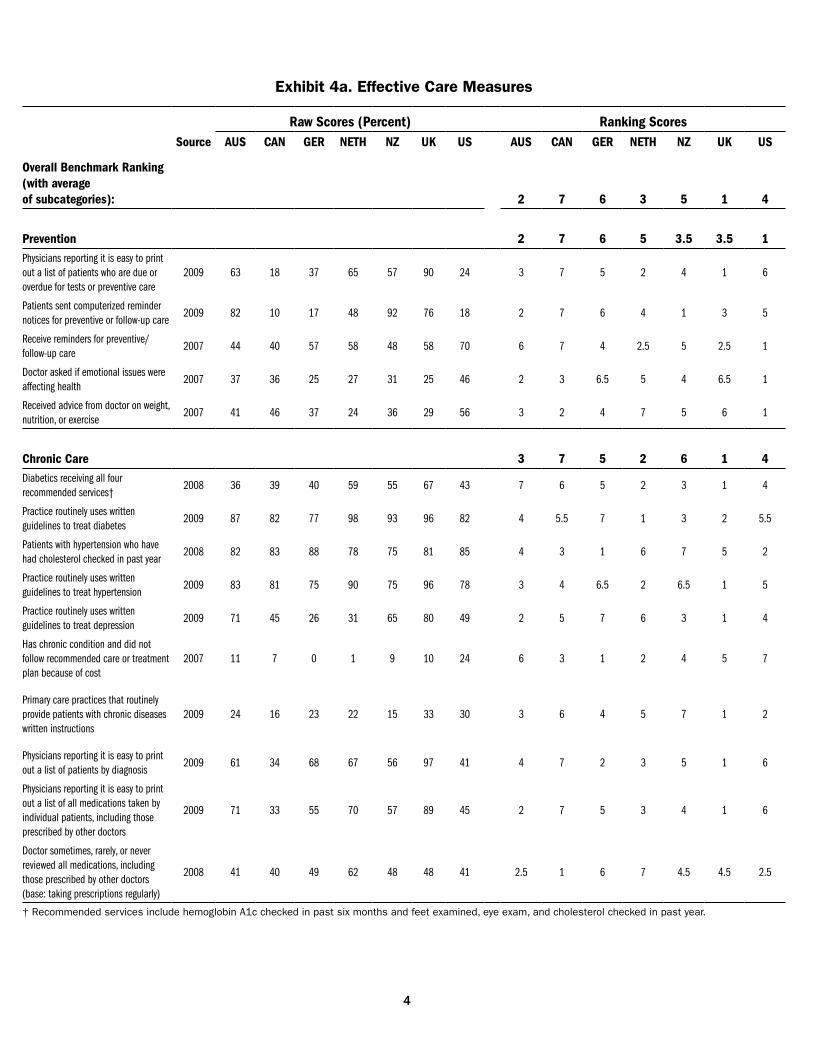
Effective CareIn its discussion of effective care, the Commission’s National Scorecard states that an important indicator of quality is the degree to which patients receive “services that are effective and appropriate for preventing or treating a given condition and controlling chronic illness.”9 In this report, the indicators used to define effec-tive care are grouped into two categories: prevention and chronic care (Exhibit 4a).
Prevention: Preventive care is crucial to an effective health care delivery system. When utilized appropriately, lists of patients who are due or overdue for tests or preventive care, reminders for preventive care visits, and discussions of emotional and lifestyle issues can increase the effectiveness of care through the early diagnosis or prevention of illness. Consistent with previous editions of Mirror, Mirror, the U.S. does especially well in providing preventive care for its population. Respondents in the U.S. were more likely than those in other countries to receive preventive care reminders and advice from their doctors on diet and exercise.
Chronic Care: Carefully managing the care of patients with chronic illnesses is another sign of an effective health care system. Overall, the U.K. outperforms the other countries on six of the 10 chronic care manage-ment indicators, while New Zealand and Canada lag behind. Different countries however, were successful on different aspects of chronic care. U.K. physicians are most likely to report it is easy to print out a list of all their patients by diagnosis. This finding may reflect the major push made by the U.K. government to imple-ment health information technology (IT). Alternatively, low levels of IT use pull down the U.S. and Canada’s scores.10 Germany does well on the percentage of hypertensive patients having their cholesterol checked and the extremely low percentage of patients with chronic conditions who do not follow recommended treatment or care because of cost.
The U.S. is fourth on effective care overall, performing well on prevention but average in comparison to other industrialized nations on quality chronic care management. The U.K. and Australia scored first and second place, respectively, in terms of effective care. The increased use of IT in the U.K. plays a large role in the country’s high score on the chronic care management indicators, as well as its performance on system aspects of preventive care delivery. All countries, however, have room for improvement to ensure patients uni-formly receive effective care.
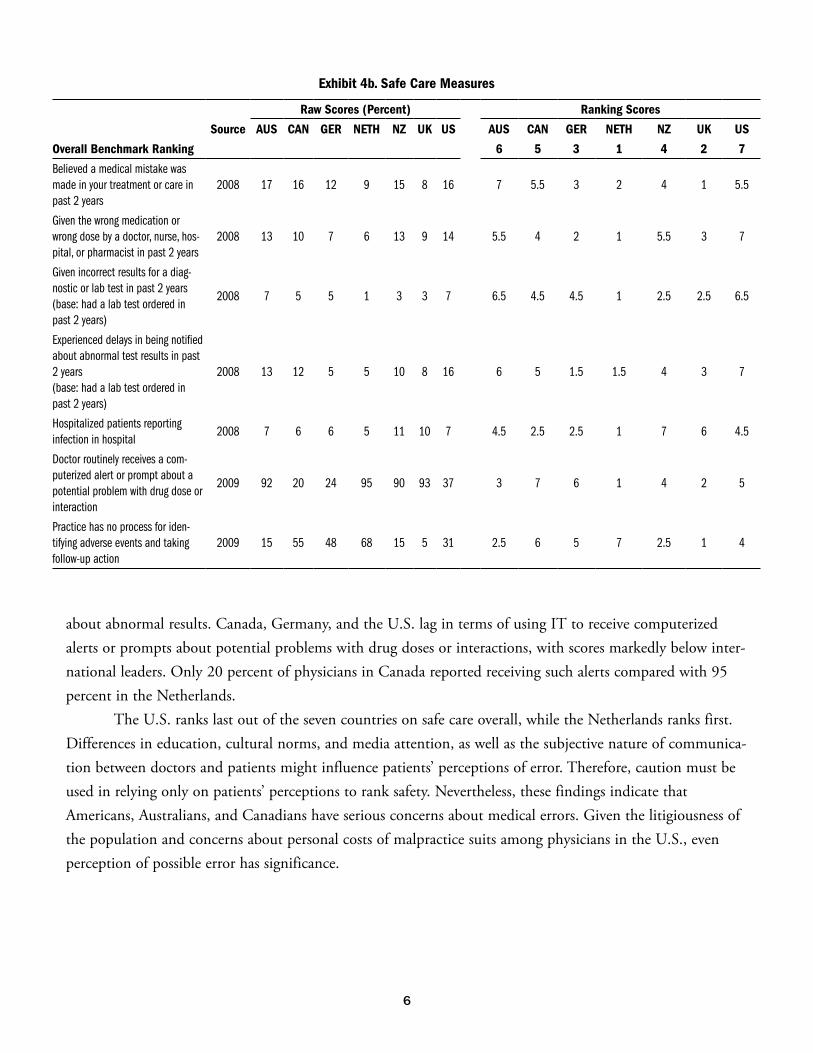
Safe CareThe Institute of Medicine describes safe care as “avoiding injuries to the patients from the care that is intended to help them.”11 Sicker adults in Australia, Canada, and the U.S. reported the highest rates of medical and medication errors (Exhibit 4b). Among those who had a lab test in the previous two years, sicker adults in the U.S. were more likely to have been given incorrect medication or experience delays in being notified
6
about abnormal results. Canada, Germany, and the U.S. lag in terms of using IT to receive computerized alerts or prompts about potential problems with drug doses or interactions, with scores markedly below inter-national leaders. Only 20 percent of physicians in Canada reported receiving such alerts compared with 95 percent in the Netherlands.
The U.S. ranks last out of the seven countries on safe care overall, while the Netherlands ranks first. Differences in education, cultural norms, and media attention, as well as the subjective nature of communica-tion between doctors and patients might influence patients’ perceptions of error. Therefore, caution must be used in relying only on patients’ perceptions to rank safety. Nevertheless, these findings indicate that Americans, Australians, and Canadians have serious concerns about medical errors. Given the litigiousness of the population and concerns about personal costs of malpractice suits among physicians in the U.S., even perception of possible error has significance.
Exhibit 4b. Safe Care Measures
Raw Scores (Percent) Ranking Scores
Source AUS CAN GER NETH NZ UK US AUS CAN GER NETH NZ UK US
Overall Benchmark Ranking 6 5 3 1 4 2 7
Believed a medical mistake was made in your treatment or care in past 2 years
2008 17 16 12 9 15 8 16 7 5.5 3 2 4 1 5.5
Given the wrong medication or wrong dose by a doctor, nurse, hos-pital, or pharmacist in past 2 years
2008 13 10 7 6 13 9 14 5.5 4 2 1 5.5 3 7
Given incorrect results for a diag-nostic or lab test in past 2 years (base: had a lab test ordered in past 2 years)
2008 7 5 5 1 3 3 7 6.5 4.5 4.5 1 2.5 2.5 6.5
Experienced delays in being notified about abnormal test results in past 2 years (base: had a lab test ordered in past 2 years)
2008 13 12 5 5 10 8 16 6 5 1.5 1.5 4 3 7
Hospitalized patients reporting infection in hospital
2008 7 6 6 5 11 10 7 4.5 2.5 2.5 1 7 6 4.5
Doctor routinely receives a com-puterized alert or prompt about a potential problem with drug dose or interaction
2009 92 20 24 95 90 93 37 3 7 6 1 4 2 5
Practice has no process for iden-tifying adverse events and taking follow-up action
2009 15 55 48 68 15 5 31 2.5 6 5 7 2.5 1 4
7
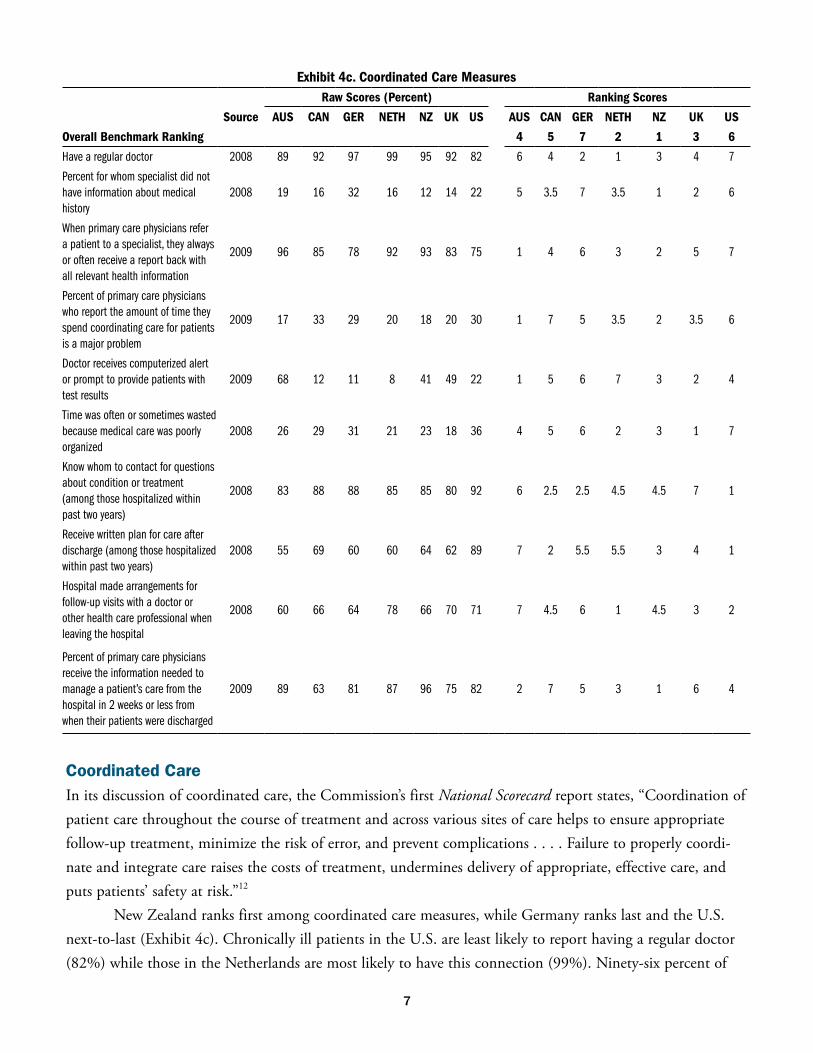
Coordinated CareIn its discussion of coordinated care, the Commission’s first National Scorecard report states, “Coordination of patient care throughout the course of treatment and across various sites of care helps to ensure appropriate follow-up treatment, minimize the risk of error, and prevent complications . . . . Failure to properly coordi-nate and integrate care raises the costs of treatment, undermines delivery of appropriate, effective care, and puts patients’ safety at risk.”12
New Zealand ranks first among coordinated care measures, while Germany ranks last and the U.S. next-to-last (Exhibit 4c). Chronically ill patients in the U.S. are least likely to report having a regular doctor (82%) while those in the Netherlands are most likely to have this connection (99%). Ninety-six percent of
Exhibit 4c. Coordinated Care MeasuresRaw Scores (Percent) Ranking Scores
Source AUS CAN GER NETH NZ UK US AUS CAN GER NETH NZ UK US
Overall Benchmark Ranking 4 5 7 2 1 3 6
Have a regular doctor 2008 89 92 97 99 95 92 82 6 4 2 1 3 4 7
Percent for whom specialist did not have information about medical history
2008 19 16 32 16 12 14 22 5 3.5 7 3.5 1 2 6
When primary care physicians refer a patient to a specialist, they always or often receive a report back with all relevant health information
2009 96 85 78 92 93 83 75 1 4 6 3 2 5 7
Percent of primary care physicians who report the amount of time they spend coordinating care for patients is a major problem
2009 17 33 29 20 18 20 30 1 7 5 3.5 2 3.5 6
Doctor receives computerized alert or prompt to provide patients with test results
2009 68 12 11 8 41 49 22 1 5 6 7 3 2 4
Time was often or sometimes wasted because medical care was poorly organized
2008 26 29 31 21 23 18 36 4 5 6 2 3 1 7
Know whom to contact for questions about condition or treatment (among those hospitalized within past two years)
2008 83 88 88 85 85 80 92 6 2.5 2.5 4.5 4.5 7 1
Receive written plan for care after discharge (among those hospitalized within past two years)
2008 55 69 60 60 64 62 89 7 2 5.5 5.5 3 4 1
Hospital made arrangements for follow-up visits with a doctor or other health care professional when leaving the hospital
2008 60 66 64 78 66 70 71 7 4.5 6 1 4.5 3 2
Percent of primary care physicians receive the information needed to manage a patient’s care from the hospital in 2 weeks or less from when their patients were discharged
2009 89 63 81 87 96 75 82 2 7 5 3 1 6 4
8
Exhibit 4d. Patient-Centered Care Measures
Raw Scores (Percent) Ranking Scores
Source AUS CAN GER NETH NZ UK US AUS CAN GER NETH NZ UK US
Overall Benchmark Ranking 3 6 2 5 1 7 4
Communication 2 5 7 4 1 6 3
Patients reporting very or somewhat easy to contact doctor/GP’s prac-tice by telephone during regular business hours about a health problem
2007 83 75 45 77 89 81 79 2 6 7 5 1 3 4
Patients can communicate with regular place of care by email
2007 15 9 16 15 22 11 20 4.5 7 3 4.5 1 6 2
Doctor always explains things in a way you can understand
2007 79 75 71 71 80 71 70 2 3 5 5 1 5 7
Received clear instructions about symptoms to watch for and when to seek further care when leaving the hospital (among those who had been hospitalized)
2008 74 79 70 75 71 72 87 4 2 7 3 6 5 1
Continuity and Feedback 5 6 1 2.5 4 2.5 7
With same doctor 5 years or more 2008 61 66 80 79 62 73 53 6 4 1 2 5 3 7
Doctor routinely receives and reviews data on patient satisfaction and experiences with care
2009 52 15 24 23 65 96 55 4 7 5 6 2 1 3
Regular doctor always knows important information about patient’s medical history
2007 69 67 78 71 69 63 62 3.5 5 1 2 3.5 6 7
Engagement and Patient Preferences 4.5 4.5 3 6 1 7 2
Doctor always tells you about treatment options and involves you in decisions about the best treatment for you
2007 66 62 62 60 67 54 61 2 3 4.5 6 1 7 4.5
Regular doctor always or often tells you about care, treatment choices and asks opinions
2008 74 76 79 79 80 69 76 6 4.5 2.5 2.5 1 7 4.5
Regular doctor always or often encouraged you to ask questions
2008 67 70 60 55 67 60 74 3.5 2 5.5 7 3.5 5.5 1
Regular doctor always or often gives clear instructions about symptoms, when to seek further care
2008 79 77 81 75 79 69 80 3 5 1 6 3 7 2
9
Australian primary care physicians report they always or often receive relevant information back from special-ists, compared with 75 percent in the U.S. Only 17 percent of Australian physicians said the amount of time they spend coordinating care for patients is a major problem, roughly half the rate of those in the U.S. (30%) and Canada (33%).
Effective communication among patients, physicians, and hospitals is essential for high-quality care. Among chronically ill respondents who had been hospitalized within the past two years, American patients were the most likely to receive a written plan for care after discharge and to know whom to contact for ques-tions about their condition or treatment when leaving the hospital. Seventy-one percent of American patients had arrangements for follow-up visits with a doctor or other health care professional made for them when leaving the hospital, second only to the Netherlands (78%). Physicians in New Zealand and Australia reported the highest rates of receiving information from the hospital needed to manage a patient’s care within two weeks of discharge.
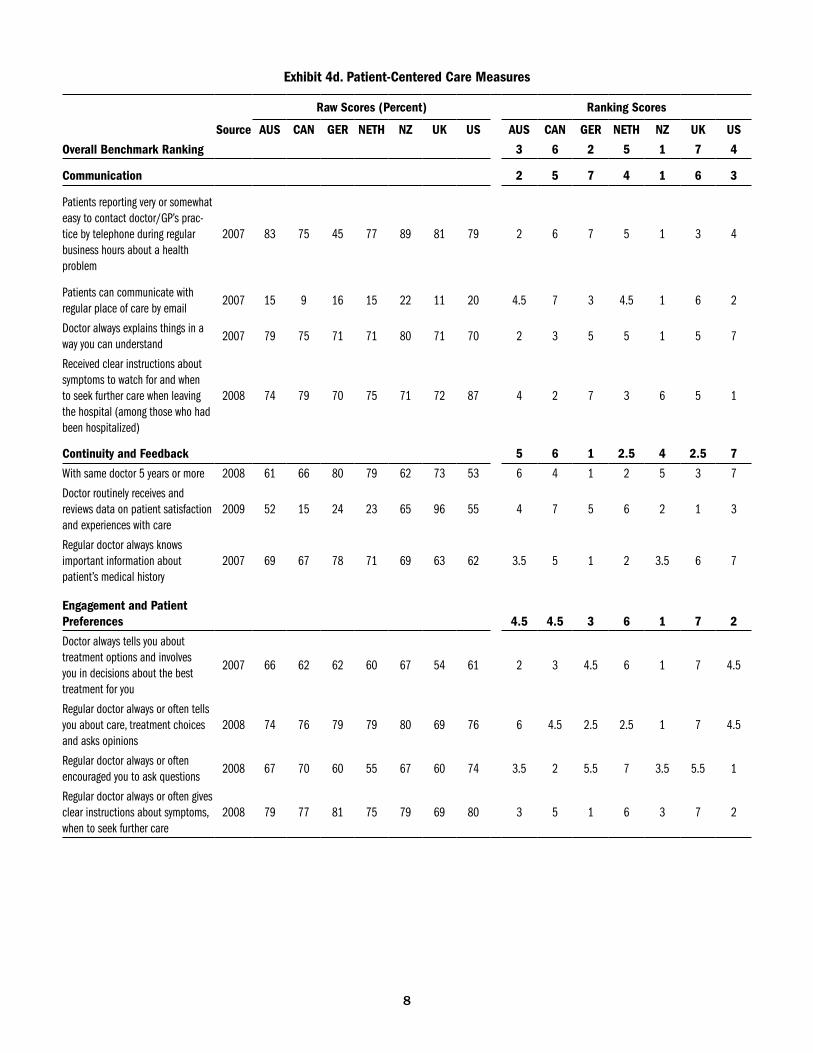
Patient-Centered CareThe Commission defines patient-centeredness as “care delivered with the patient’s needs and preferences in mind.”13 The surveys explored issues related to provider–patient communication, physician continuity and feedback, and engagement and patient preferences. New Zealand ranked first and Australia second—although the two countries had fairly similar raw scores—among the group of seven countries with respect to engage-ment and patient preference, communication, and continuity and feedback measures. The U.S. was in the middle of the pack, ranking fourth (Exhibit 4d). All countries could improve substantially in this area.
Communication: Communication measures included whether patients reported it was very or somewhat easy to contact a doctor’s practice during regular business hours, whether they could communicate with their regular place of care by e-mail, and whether their doctor always explains things in a way they can understand. Patients who had been hospitalized were asked whether they had received clear instructions about what to watch for or when to seek further care. The U.S. ranked fourth in terms of the percentage of respondents who were able to contact the doctor’s office by phone and ask about a health problem during regular business hours. The country did well relative to other nations on the measure of communicating by e-mail and had the best score on receiving clear instructions about further care when leaving the hospital. However, the U.S. was last on having doctors explain things in an understandable way.
Continuity and Feedback: The U.S. scores in the midrange on measures of continuity and feedback. Only slightly more than half (53%) of U.S. respondents had been with the same doctor for five years or more, compared with more than three-quarters (79%) of respondents in the Netherlands. The U.S. ranks third among the seven countries in terms of physicians routinely receiving data on patient satisfaction and experi-ences with care; 55 percent of American physicians receive such data. As in previous editions of this report, the U.K. continues to lead other nations in feedback: nearly all (96%) physicians in the U.K. receive patient satisfaction data.
10
Exhibit 5. Access Measures
Raw Scores (Percent) Ranking Scores
Source AUS CAN GER NETH NZ UK US AUS CAN GER NETH NZ UK US
Overall Benchmark Ranking 6.5 5 3 1 4 2 6.5
Cost-Related Access Problems 6 3.5 3.5 2 5 1 7
Did not fill a prescription; skipped recommended medical test, treatment, or follow-up; or had a medical problem but did not visit doctor or clinic in the past 2 years, because of cost
2008 36 25 26 7 31 13 54 6 3 4 1 5 2 7
Patient had serious problems paying or was unable to pay medical bills
2007 8 4 4 5 8 1 19 5.5 2.5 2.5 4 5.5 1 7
Physicians think their patients often have difficulty paying for medications or out-of-pocket costs
2009 23 27 28 33 25 14 58 2 4 5 6 3 1 7
Out-of-pocket expenses for medical bills more than $1,000 in the past year, US$ equivalent
2008 25 20 13 8 14 4 41 6 5 3 2 4 1 7
Timliness of Care 6 7 2 1 3 4 5
Last time needed medical attention had to wait 6 or more days for an appointment
2008 18 34 26 3 8 14 23 4 7 6 1 2 3 5
Percent of primary care practices who report almost all patients who request same- or next-day appointment can get one
2009 36 17 57 62 45 64 44 6 7 3 2 4 1 5
Primary care practices that have an arrangment where patients can be seen by a doctor or nurse if needed when the practice is closed, not including ER
2009 50 43 54 97 89 89 29 5 6 4 1 2.5 2.5 7
Somewhat or very difficult to get care on nights or weekends (base: sought care)
2008 62 56 35 30 39 44 60 7 5 2 1 3 4 6
Waiting time for emergency care was less than 1 hour (base: used an emergency room in past 2 years)
2007 54 38 73 73 61 50 52 4 7 1.5 1.5 3 6 5
Waiting time to see a specialist was less than 4 weeks (base: saw or needed to see a specialist in past two years)
2008 45 40 68 69 45 42 74 4.5 7 3 2 4.5 6 1
Waiting time of 4 months or more for elective/nonemergency surgery (base: those needing elective surgery in past year)
2007 18 27 5 7 13 30 8 5 6 1 2 4 7 3
11
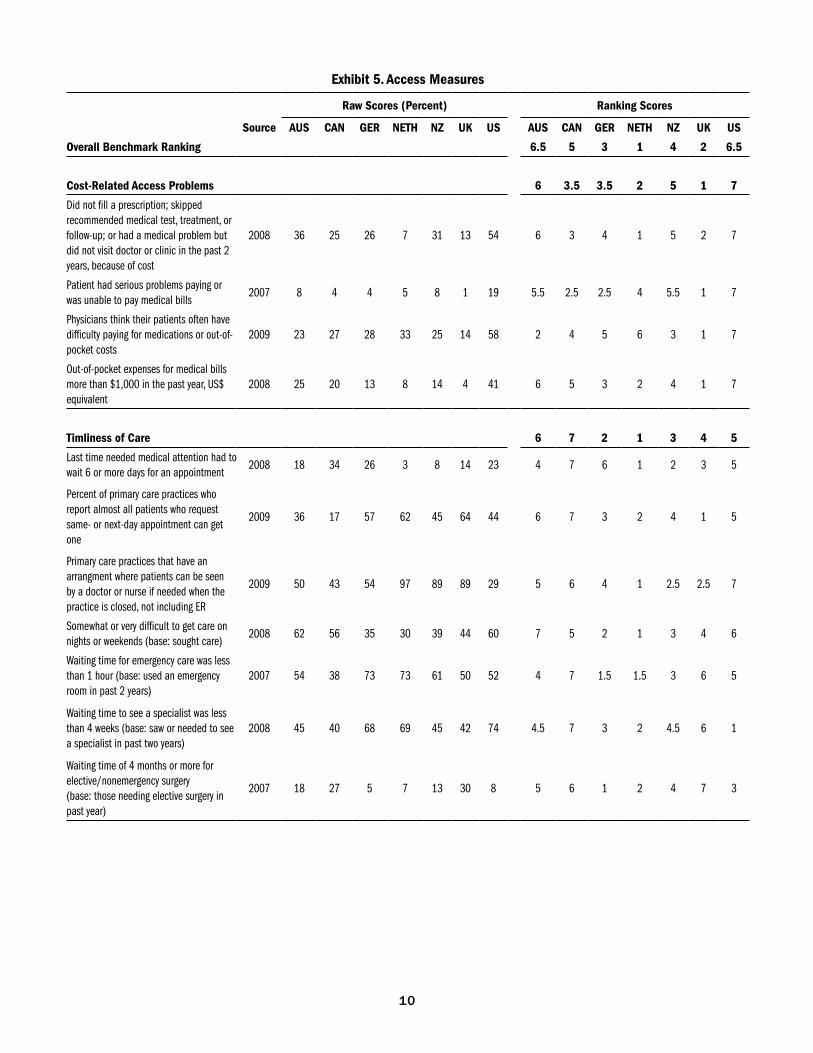
Engagement and Patient Preferences: The surveys measured patient engagement by asking respondents whether their regular doctor always tells them about their options for care and asks their opinions; always or often encourages them to ask questions; or gives clear instructions about symptoms to watch for and when to seek treatment. While the U.S. set the benchmark in terms of doctors encouraging patients to ask questions, involvement in decision-making overall remains a problem for U.S. patients, as well as those in Canada, the Netherlands, and the U.K. As shown in Exhibit 4d, the U.S. rank is average to poor on two of the four mea-sures of patient engagement. New Zealand ranks highest on measures of being informed about treatment options and patients being asked for their opinion. German patients were most likely to receive clear instruc-tions about symptoms and when to seek further care.
ACCESSPatients have good access to health care when they can obtain affordable care and receive attention in a timely manner. The 2007 and 2008 surveys included questions about whether patients were able to afford needed care (Exhibit 5). Specifically, respondents were asked if, because of cost, they did not fill prescriptions; get a recommended test, treatment, or follow-up care; or visit a doctor or clinic when they had a medical problem. The surveys also asked whether patients had serious problems paying medical bills and assessed out-of-pocket costs in each of the seven countries.
Cost-Related Access ProblemsThe U.S. population continues to fare much worse than others surveyed in terms of going without needed care because of cost. Americans with health problems were the most likely to say they had access problems because of cost. More than half (54%) said they had problems getting a recommended test, treatment, or fol-low-up care; filling a prescription; or visiting a doctor or clinic when they had a medical problem because of cost. In the next-highest country, Australia, the comparable percentage was 36; patients in the Netherlands were the least likely to report having these problems (7%). Americans with health problems were significantly more likely to have out-of-pocket costs greater than $1,000 for medical bills (41%), as opposed to only 4 per-cent of adults in the U.K. Physicians in the U.S. acknowledge their patients have difficulty paying for care, with 58 percent believing affordability is a problem.
Timeliness of CareWhile the Netherlands ranks very highly on all measures of timeliness, different national patterns surface for the other countries in the study, depending on the particular health care service. Patients in the U.S. face financial burdens, but if insured, they have relatively rapid access to specialized health care services. The U.K. has relatively short waiting times for basic medical care and nonemergency access to services after hours, but has longer waiting times for specialist care and elective, nonemergency surgery. Conversely, a large number of German patients report waiting six or more days for an appointment the last time they needed medical care, yet the country has some of the shortest wait times for emergency care, specialist care, and elective, nonemer-gency surgery. Canada ranks last or next-to-last on almost all measures of timeliness of care. It is a common
12
misconception to associate universal or near-universal coverage with long waiting times for care. That is not true either for meeting immediate care needs, as in the United Kingdom, or for specialist care—patients in Germany and the Netherlands have similar rapid access to specialists as U.S. patients.
Exhibit 6. Efficiency Measures
Raw Scores (Percent) Ranking Scores
Source AUS CAN GER NETH NZ UK US AUS CAN GER NETH NZ UK US
Overall Benchmark Ranking 2 6 5 3 4 1 7
Total expenditures on health as a percent of GDP*
2007 8.9 10.1 10.4 9.8 9 8.4 16 2 5 6 4 3 1 7
Percentage of national health expenditures spent on health administration and insurance**
2007 2.6 3.6 5.3 5.2 7.4 3.4 7.1 1 3 5 4 7 2 6
Patient did not spend any time on paperwork or disputes related to medical bills or health insurance
2007 90 88 86 68 87 97 76 2 3 5 7 4 1 6
Visited ED for a condition that could have been treated by a regular doctor, had he/she been available
2008 17 23 6 6 8 8 19 5 7 1.5 1.5 3.5 3.5 6
Medical records/test results did not reach MD office in time for appointment, in past 2 years
2008 16 19 12 11 17 15 24 4 6 2 1 5 3 7
Sent for duplicate tests by different health care professionals, in past 2 years
2008 12 11 18 4 10 7 20 5 4 6 1 3 2 7
Hospitalized patients went to ER or rehospitalized for complication after discharge
2008 11 17 9 17 11 10 18 3.5 5.5 1 5.5 3.5 2 7
Practice with high clinical information technology functions***
2009 91 14 36 54 92 89 26 2 7 5 4 1 3 6
* Data: OECD, OECD Health Data, 2009 (Nov. 2009). Netherlands is estimated. ** Data: OECD, OECD Health Data, 2009 (Nov. 2009). Netherlands is estimated. U.K. data are from 1999. *** Primary care practice has 9 to 14 of the following IT functions: EMR; EMR access to other doctors, outside offices, and patients; routine tasks, in-cluding ordering of tests and prescriptions and accessing test results and hospital records; computerized patient reminders, prescription alerts and tests results; “easy” generation of lists of patients by diagnosis, medications, needed tests, or preventive care. Significant differences between countries are indicated for distribution of summary variable rather than individual responses.Health expenditures per capita figures are adjusted for differences in cost of living.
13
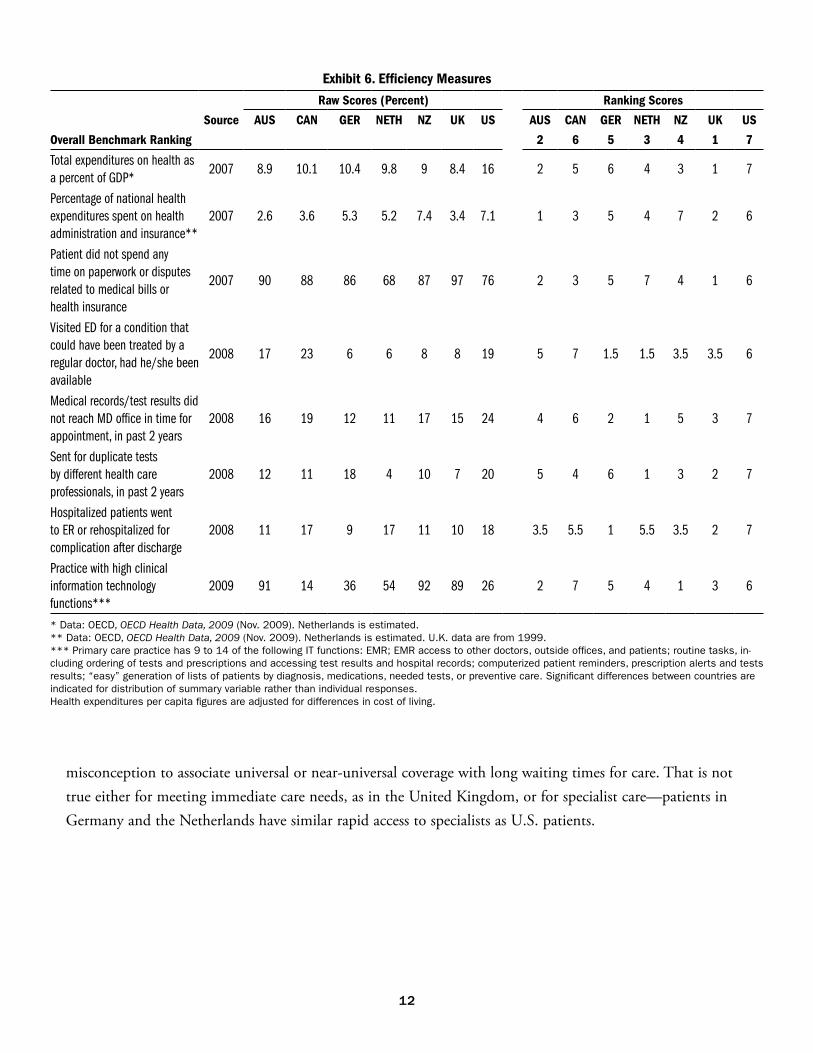
EFFICIENCYIn the Commission’s first National Scorecard report, efficiency is described in the following way: “An efficient, high-value health care system seeks to maximize the quality of care and outcomes given the resources commit-ted, while ensuring that additional investments yield net value over time.”14 To measure efficiency, this report examines total national expenditures on health as a percent of gross domestic product (GDP), as well as the percent spent on health administration and insurance. An important indicator from the 2007 survey of adults includes whether patients spent any time on paperwork or disputes related to medical bills or health insurance.
Exhibit 6 also shows data from the 2008 survey on adults with health problems who visited the emer-gency department for a condition that could have been treated by a regular doctor had one been available, those whose medical records did not reach the doctor’s office in time for an appointment, and those who were sent for duplicate tests. It also reports on the incidence of hospitalized sicker adults who went to the emergency department or were rehospitalized for complications during recovery. Indicators from the 2009 survey include primary care physicians’ use of multidisciplinary teams and practices with high clinical IT functions. To be defined as a primary care practice with high clinical IT functionality, the practice must have or use nine of the following 14 tools: electronic medical records (EMRs); EMR access to other doctors, out-side offices, and patients; routine tasks, including ordering tests and prescriptions and accessing test results and hospital records; computerized patient reminders, prescription alerts, and test results; easy generation of lists of patients by diagnosis, medications, needed tests, or preventive care.
On indicators of efficiency, the U.S. scores last overall with poor performance on the two measures of national health expenditures, as well as on measures of timely access to records and test results, duplicative tests, rehospitalization, and physicians’ use of IT. Of sicker respondents, those in Canada and the U.S. were most likely to visit the emergency department for a condition that could have been treated by a regular doc-tor had one been available, with rates three to four times that of Germany and the Netherlands. In the sum-mary ranking, the U.K. scores first and the U.S. scores last.
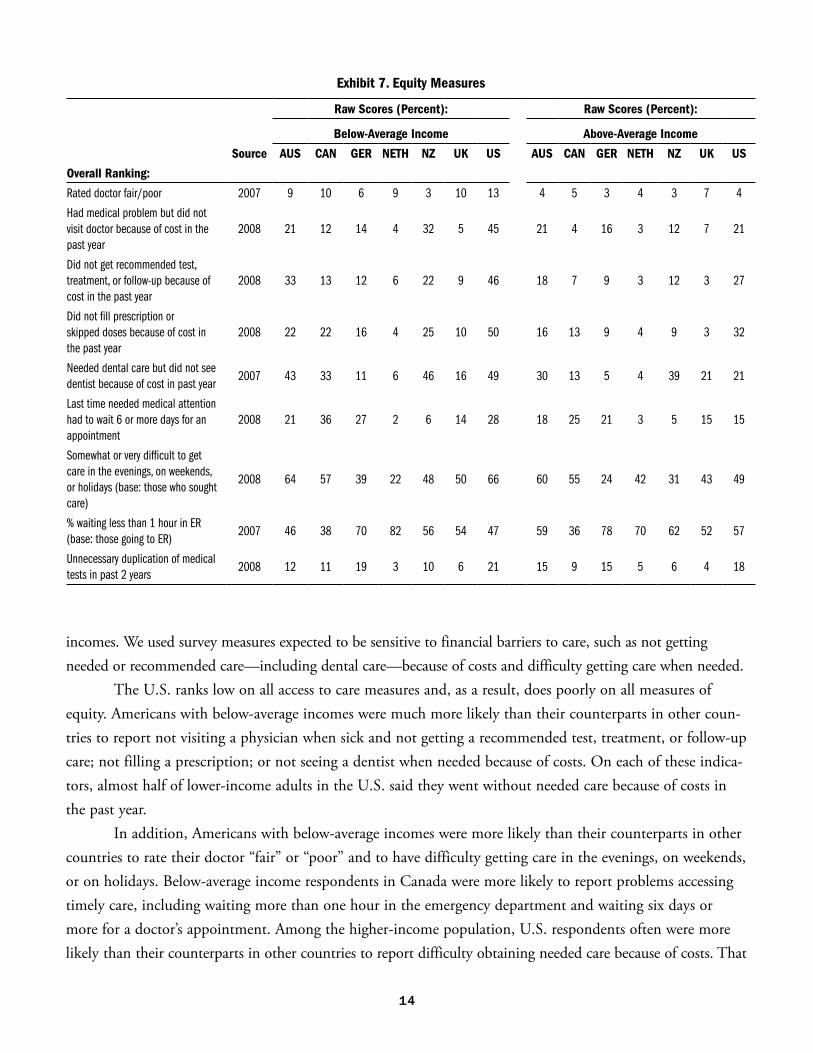
EQUITYThe Institute of Medicine defines equity as “providing care that does not vary in quality because of personal characteristics such as gender, ethnicity, geographic location, and socioeconomic status.”15 We grouped adults by two income categories: those who reported their incomes as above the country median and those who reported their incomes as below the country median. In all seven countries, adults reporting below-average incomes were more likely to report chronic health problems (not shown). Thus, reports from these lower-income adults provide particularly sensitive measures for how well each country performs in terms of meeting the needs of its most vulnerable population.
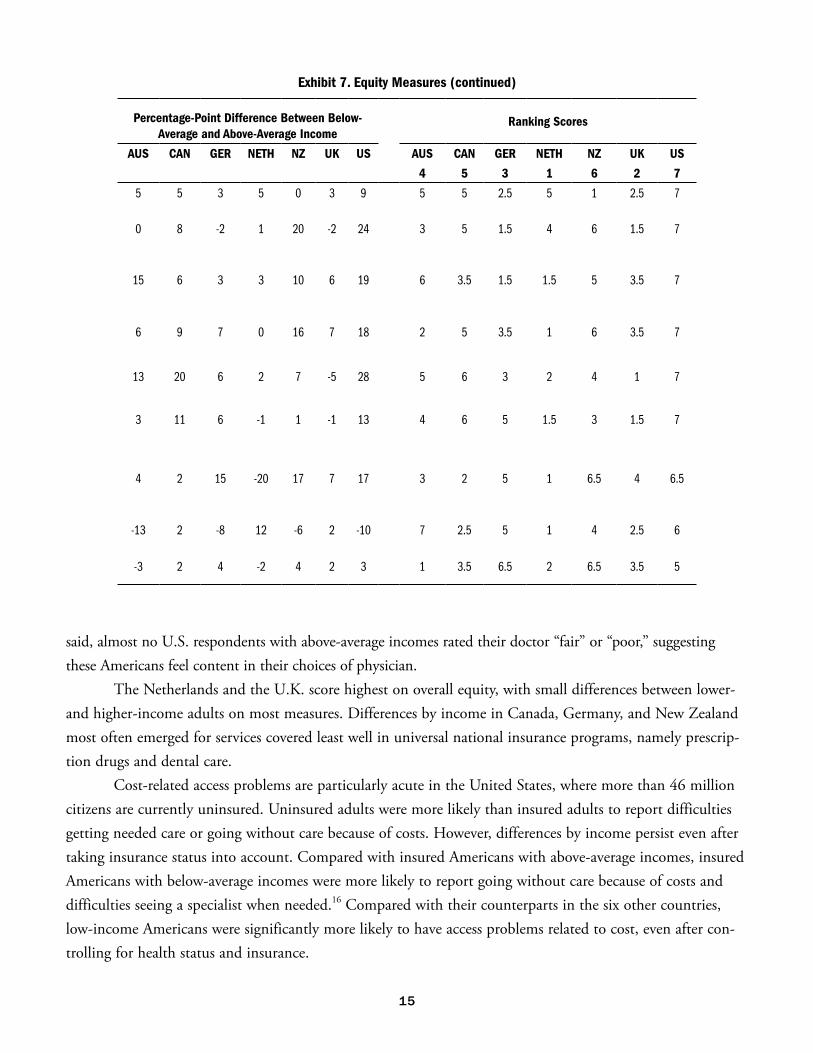
In Exhibit 7, we compare patient reports on various measures of access to care for adults reporting their incomes as below average and those reporting their incomes as above average. The rankings are based on the percentage-point difference between the responses of below-average income respondents to above-average income respondents, with a higher score indicating greater access problems for those with below-average
14
incomes. We used survey measures expected to be sensitive to financial barriers to care, such as not getting needed or recommended care—including dental care—because of costs and difficulty getting care when needed.
The U.S. ranks low on all access to care measures and, as a result, does poorly on all measures of equity. Americans with below-average incomes were much more likely than their counterparts in other coun-tries to report not visiting a physician when sick and not getting a recommended test, treatment, or follow-up care; not filling a prescription; or not seeing a dentist when needed because of costs. On each of these indica-tors, almost half of lower-income adults in the U.S. said they went without needed care because of costs in the past year.
In addition, Americans with below-average incomes were more likely than their counterparts in other countries to rate their doctor “fair” or “poor” and to have difficulty getting care in the evenings, on weekends, or on holidays. Below-average income respondents in Canada were more likely to report problems accessing timely care, including waiting more than one hour in the emergency department and waiting six days or more for a doctor’s appointment. Among the higher-income population, U.S. respondents often were more likely than their counterparts in other countries to report difficulty obtaining needed care because of costs. That
Exhibit 7. Equity Measures
Raw Scores (Percent): Raw Scores (Percent):
Below-Average Income Above-Average Income
Source AUS CAN GER NETH NZ UK US AUS CAN GER NETH NZ UK US
Overall Ranking:
Rated doctor fair/poor 2007 9 10 6 9 3 10 13 4 5 3 4 3 7 4
Had medical problem but did not visit doctor because of cost in the past year
2008 21 12 14 4 32 5 45 21 4 16 3 12 7 21
Did not get recommended test, treatment, or follow-up because of cost in the past year
2008 33 13 12 6 22 9 46 18 7 9 3 12 3 27
Did not fill prescription or skipped doses because of cost in the past year
2008 22 22 16 4 25 10 50 16 13 9 4 9 3 32
Needed dental care but did not see dentist because of cost in past year
2007 43 33 11 6 46 16 49 30 13 5 4 39 21 21
Last time needed medical attention had to wait 6 or more days for an appointment
2008 21 36 27 2 6 14 28 18 25 21 3 5 15 15
Somewhat or very difficult to get care in the evenings, on weekends, or holidays (base: those who sought care)
2008 64 57 39 22 48 50 66 60 55 24 42 31 43 49
% waiting less than 1 hour in ER (base: those going to ER)
2007 46 38 70 82 56 54 47 59 36 78 70 62 52 57
Unnecessary duplication of medical tests in past 2 years
2008 12 11 19 3 10 6 21 15 9 15 5 6 4 18
15
said, almost no U.S. respondents with above-average incomes rated their doctor “fair” or “poor,” suggesting these Americans feel content in their choices of physician.
The Netherlands and the U.K. score highest on overall equity, with small differences between lower- and higher-income adults on most measures. Differences by income in Canada, Germany, and New Zealand most often emerged for services covered least well in universal national insurance programs, namely prescrip-tion drugs and dental care.
Cost-related access problems are particularly acute in the United States, where more than 46 million citizens are currently uninsured. Uninsured adults were more likely than insured adults to report difficulties getting needed care or going without care because of costs. However, differences by income persist even after taking insurance status into account. Compared with insured Americans with above-average incomes, insured Americans with below-average incomes were more likely to report going without care because of costs and difficulties seeing a specialist when needed.16 Compared with their counterparts in the six other countries, low-income Americans were significantly more likely to have access problems related to cost, even after con-trolling for health status and insurance.
Percentage-Point Difference Between Below-Average and Above-Average Income
Ranking Scores
AUS CAN GER NETH NZ UK US AUS CAN GER NETH NZ UK US
4 5 3 1 6 2 7
5 5 3 5 0 3 9 5 5 2.5 5 1 2.5 7
0 8 -2 1 20 -2 24 3 5 1.5 4 6 1.5 7
15 6 3 3 10 6 19 6 3.5 1.5 1.5 5 3.5 7
6 9 7 0 16 7 18 2 5 3.5 1 6 3.5 7
13 20 6 2 7 -5 28 5 6 3 2 4 1 7
3 11 6 -1 1 -1 13 4 6 5 1.5 3 1.5 7
4 2 15 -20 17 7 17 3 2 5 1 6.5 4 6.5
-13 2 -8 12 -6 2 -10 7 2.5 5 1 4 2.5 6
-3 2 4 -2 4 2 3 1 3.5 6.5 2 6.5 3.5 5
Exhibit 7. Equity Measures (continued)
16
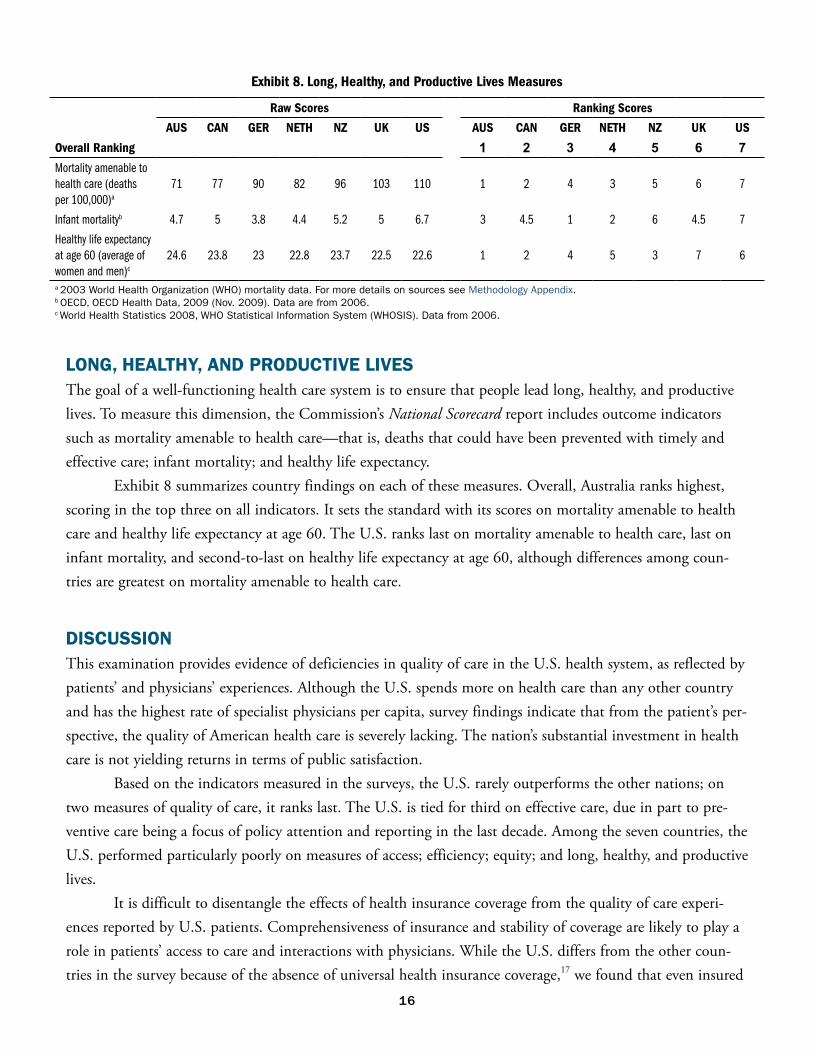
LONG, HEALTHY, AND PRODUCTIVE LIVESThe goal of a well-functioning health care system is to ensure that people lead long, healthy, and productive lives. To measure this dimension, the Commission’s National Scorecard report includes outcome indicators such as mortality amenable to health care—that is, deaths that could have been prevented with timely and effective care; infant mortality; and healthy life expectancy.
Exhibit 8 summarizes country findings on each of these measures. Overall, Australia ranks highest, scoring in the top three on all indicators. It sets the standard with its scores on mortality amenable to health care and healthy life expectancy at age 60. The U.S. ranks last on mortality amenable to health care, last on infant mortality, and second-to-last on healthy life expectancy at age 60, although differences among coun-tries are greatest on mortality amenable to health care.
DISCUSSIONThis examination provides evidence of deficiencies in quality of care in the U.S. health system, as reflected by patients’ and physicians’ experiences. Although the U.S. spends more on health care than any other country and has the highest rate of specialist physicians per capita, survey findings indicate that from the patient’s per-spective, the quality of American health care is severely lacking. The nation’s substantial investment in health care is not yielding returns in terms of public satisfaction.
Based on the indicators measured in the surveys, the U.S. rarely outperforms the other nations; on two measures of quality of care, it ranks last. The U.S. is tied for third on effective care, due in part to pre-ventive care being a focus of policy attention and reporting in the last decade. Among the seven countries, the U.S. performed particularly poorly on measures of access; efficiency; equity; and long, healthy, and productive lives.
It is difficult to disentangle the effects of health insurance coverage from the quality of care experi-ences reported by U.S. patients. Comprehensiveness of insurance and stability of coverage are likely to play a role in patients’ access to care and interactions with physicians. While the U.S. differs from the other coun-tries in the survey because of the absence of universal health insurance coverage,17 we found that even insured
Exhibit 8. Long, Healthy, and Productive Lives Measures
Raw Scores Ranking Scores
AUS CAN GER NETH NZ UK US AUS CAN GER NETH NZ UK US
Overall Ranking 1 2 3 4 5 6 7Mortality amenable to health care (deaths per 100,000)a
71 77 90 82 96 103 110 1 2 4 3 5 6 7
Infant mortalityb 4.7 5 3.8 4.4 5.2 5 6.7 3 4.5 1 2 6 4.5 7
Healthy life expectancy at age 60 (average of women and men)c
24.6 23.8 23 22.8 23.7 22.5 22.6 1 2 4 5 3 7 6
a 2003 World Health Organization (WHO) mortality data. For more details on sources see Methodology Appendix.b OECD, OECD Health Data, 2009 (Nov. 2009). Data are from 2006.c World Health Statistics 2008, WHO Statistical Information System (WHOSIS). Data from 2006.
17
Americans and higher-income Americans were more likely than their counterparts in other countries to report problems such as not getting recommended tests, treatments, or prescription drugs.18 This is undoubtedly a reflection of the lack of comprehensive health insurance coverage and the high out-of-pocket costs for care in the U.S., even among the insured and those with above-average incomes. Fragmented coverage and insurance instability undermine efforts in the U.S. to improve care coordination, including the sharing of information among providers. Patients in other countries, in addition, are more likely to have a regular physician and long-time continuity with the same physician.19
The comprehensive health reform legislation recently signed into law in the United States will undoubtedly ameliorate some of these problems. The establishment of health insurance exchanges, income-related premium subsidies, minimum standard benefit packages, and new insurance market regulations, effec-tive in 2014, will help extend coverage to 32 million previously uninsured Americans and contribute greatly to the stability and security of coverage of those who already have it.20 Closing gaps in coverage will lend itself to better disease management, greater care coordination, and superior outcomes over time.
Any international comparison of health care is subject to inherent data weaknesses, such as the absence of medical record clinical information or timely health outcomes data. The measures, methods, and data used in this analysis—like those used in the WHO report—are far from perfect. Different measures, moreover, are given equal weight in the rankings and are not weighted based on independent evidence of what patients value most highly. That is, patients may, in fact, value a measure of effective care—whether they received a reminder for preventive care or recommended diabetic services if warranted—over a measure of timeliness. However, for the purposes of this report, all measures are weighted equally.
One definition of “quality” care is health services that meet or exceed consumer expectations. Even if the expectations of U.S. patients were higher than patients in other countries, the U.S. health care system should be held to the standard of meeting its consumers’ needs. Thus, while patient perspectives are only one lens through which to view health systems, the overall conclusion remains: the U.S. health care system is not the “fairest of them all,” at least from the viewpoint of those who use it to stay healthy, get better, or manage their chronic illnesses, or who are vulnerable because of low income and poor health. Patients’ perceptions on issues of financial accessibility are reflected, too, by physicians’ views.
Improving on patient- and physician-reported dimensions of quality in the U.S. will require a sus-tained effort to improve coordination of care and promote the adoption of systems that support better trans-fer of information across multiple providers and assist clinicians in providing safe and effective care. The 2009 International Survey of Primary Care Physicians found that the U.S. and Canada lag far behind other indus-trialized countries in information capacity. The majority of primary care doctors in Australia, New Zealand, and the U.K. use EMRs, as well as electronic prescribing and electronic access to test results. With the enact-ment of the American Recovery and Reinvestment Act, the U.S. has started to accelerate its efforts to adopt health information technology and provide an integrated medical record and information system accessible to providers and patients.21 Those efforts must come to fruition soon for the nation’s health system to deliver more effective and efficient care.
18
Other countries’ experiences suggest models for the U.S. to explore in seeking to improve health sys-tem performance. Australia ranks high on health outcomes and efficiency; the Netherlands on quality, access, and equity; New Zealand on quality; and the U.K. on the measures of efficiency and equity. Rather than focus solely on best practices within its borders, the U.S. would benefit from analysis of promising innova-tions in other countries and greater investment in cross-national research. That said, examination of the raw scores shows that in many or most instances the top-ranked country is performing at less than an “ideal” level. It is likely that, as within the U.S. (illustrated by The Commonwealth Fund’s State Scorecard on Health System Performance), there is significant variation within each of the countries and all countries could improve performance by looking for best practices within and outside their borders. This will require better ways of diffusing models that have been shown to be effective locally or in demonstration projects. For example, there is evidence that an advanced-access approach to scheduling office visits can enable patients to make appoint-ments—even walk-in or same-day appointments—that match their needs.22 This practice, however, has not been widely implemented. Another major source of dissatisfaction—the communications process—could be improved through a shared decision-making model, developed by Wennberg and colleagues, which has been proven to raise patients’ levels of satisfaction.23 The benefits of the model could improve many dimensions of quality, including patient-centeredness, effectiveness, and safety. Yet, such approaches and tools are not widely used by physicians and patients, pointing to the need for more effective diffusion strategies.
These results indicate a consistent relationship between how a country performs in terms of equity and how patients then rate performance on other dimensions of quality: the lower the performance score for equity, the lower the performance on other measures. This suggests that, when a country fails to meet the needs of the most vulnerable, it also fails to meet the needs of the average citizen. Rather than disregarding performance on equity as a separate and lesser concern, the U.S. should devote far greater attention to seeing a health system that works well for all Americans. The U.S. has passed historic legislation that promises to improve health insurance coverage and quality of care for low- and moderate-income families. This is an important first step, but the nation must remain vigilant about monitoring the experiences and outcomes of vulnerable populations. In doing so, it can continue to make progress toward a high performance health sys-tem that can truly be called “the best in the world.”
19
NOTES1 C. Schoen, R. Osborn, M. M. Doty, M. Bishop, J. Peugh, and N. Murukutla, “Toward Higher-Performance
Health Systems: Adults Health Care Experiences in Seven Countries, 2007,” Health Affairs Web Exclusive, Oct. 31, 2007, w717–w734; C. Schoen, R. Osborn, S. K. H. How, M. M. Doty, and J. Peugh, “In Chronic Condition: Experiences of Patients with Complex Health Care Needs, in Eight Countries, 2008,” Health Affairs Web Exclusive, Nov. 13, 2008, w1–w16; C. Schoen, R. Osborn, M. M. Doty, D. Squires, J. Peugh, and S. Applebaum, “A Survey of Primary Care Physicians in 11 Countries, 2009: Perspectives on Care, Costs, and Experiences,” Health Affairs Web Exclusive, Nov. 5, 2009, w1171–w1183; K. Davis, C. Schoen, S. C. Schoenbaum, M. M. Doty, A. L. Holmgren, J. L. Kriss, and K. K. Shea, Mirror, Mirror on the Wall: An International Update on the Comparative Performance of American Health Care (New York: The Commonwealth Fund, May 2007); and World Health Organization, World Health Report 2000 (Geneva: WHO, 2000).
2 E. J. Emanuel, “What Cannot Be Said on Television About Health Care,” Journal of the American Medical Association, May 16, 2007 297(19):2131–33.
3 World Health Organization, World Health Report 2000 (Geneva: WHO, 2000).
4 R. J. Blendon, M. Kim, and J. M. Benson, “The Public Versus the World Health Organization on Health System Performance,” Health Affairs, May/June 2001 20(3):10–20; C. Murray, K. Kawabata, and N. Valentine, “People’s Experience Versus People’s Expectations,” Health Affairs, May/June 2001 20(3):21–24; J. Mulligan, J. Appleby, and A. Harrison, “Measuring the Performance of Health Systems,” BMJ, July 22, 2000 321(7255):191–92; V. Navarro, “Assessment of the World Health Report 2000,” Lancet, Nov. 4, 2000 356(9241):1598–601; C. Almeida, P. Braveman, M. R. Gold et al., “Methodological Concerns and Recommendations on Policy Consequences of the World Health Report 2000,” Lancet, May 26, 2001 357(9269):1692–97; D. B. Evans, A. Tandon, C. J. Murray et al., “Comparative Efficiency of National Health Systems: Cross National Econometric Analysis,” BMJ, Aug. 11, 2001 323(7308):307–10; and P. Braveman, B. Starfield, and H. J. Geiger, “World Health Report 2000: How It Removes Equity from the Agenda for Public Health Monitoring and Policy,” BMJ, Sept. 22, 2001 323(7314):678–81.
5 Commonwealth Fund 1998 International Health Policy Survey, Commonwealth Fund 1999 International Health Policy Survey of the Elderly, Commonwealth Fund 2000 International Health Policy Survey of Physicians, Commonwealth Fund 2001 International Health Policy Survey, Commonwealth Fund 2002 International Health Policy Survey of Adults with Health Problems, Commonwealth Fund 2004 International Health Policy Survey of Adults’ Experiences with Primary Care, Commonwealth Fund 2005 International Health Policy Survey of Sicker Adults, Commonwealth Fund 2006 International Health Policy Survey of Primary Care Physicians, Commonwealth Fund 2007 International Health Policy Survey, Commonwealth Fund 2008 International Health Policy Survey of Sicker Adults, and Commonwealth Fund 2009 International Health Policy Survey of Primary Care Physicians.
6 France, Italy, Sweden, and Norway were added in subsequent years but not included because of incom-plete data over the 2007–2009 period.
7 The Commonwealth Fund Commission on a High Performance Health System, Why Not the Best? Results from the National Scorecard on U.S. Health System Performance, 2008 (New York: The Commonwealth Fund, July 2008).
8 K. Davis, C. Schoen, S. C. Schoenbaum, A.-M. J. Audet, M. M. Doty, and K. Tenney, Mirror, Mirror on the Wall: Looking at the Quality of American Health Care Through the Patient’s Lens (New York: The Commonwealth Fund, Jan. 2004); K. Davis, C. Schoen, S. C. Schoenbaum, A.-M. J. Audet, M. M. Doty, A. L. Holmgren, and J. L. Kriss, Mirror, Mirror on the Wall: An Update on the Quality of American Health Care Through the Patient’s Lens (New York: The Commonwealth Fund, Apr. 2006); and Davis, Schoen, Schoenbaum, Doty, Holmgren, Kriss, and Shea, Mirror, Mirror on the Wall, 2007.
20
9 Ibid.
10 Commission on a High Performance Health System, Why Not the Best?, 2008.
11 Institute of Medicine, Crossing the Quality Chasm: A New Health System for the 21st Century (Washington, D.C.: National Academies Press, 2001).
12 Commission on a High Performance Health System, Why Not the Best?, 2008.
13 Ibid.
14 Ibid.
15 Institute of Medicine, Crossing the Quality Chasm, 2001.
16 P. T. Huynh, C. Schoen, R. Osborn, and A. L. Holmgren, The U.S. Health Care Divide: Disparities in Primary Care Experiences by Income (New York: The Commonwealth Fund, Apr. 2006).
17 K. Davis, “Uninsured in America: Problems and Possible Solutions,” BMJ, Feb. 17, 2007 334(7589):346–48.
18 Huynh, Schoen, Osborn, and Holmgren, U.S. Health Care Divide, 2006.
19 Schoen, Osborn, Doty, Bishop, Peugh, and Murukutla, “Toward Higher-Performance Health Systems,” 2007.
20 S. R. Collins, K. Davis, J. L. Nicholson, S. D. Rustgi, and R. Nuzum, The Health Insurance Provisions of the 2009 Congressional Health Reform Bills: Implications for Coverage, Affordability, and Costs (New York: The Commonwealth Fund, Jan. 2010); and K. Davis, S. Guterman, S. R. Collins, K. Stremikis, S. D. Rustgi, and R. Nuzum, Starting on the Path to a High Performance Health System: Analysis of Health System Reform Provisions of Reform Bills in the House of Representatives and Senate (New York: The Commonwealth Fund, Dec. 2009).
21 R. Nuzum, S. Mika, C. Schoen, and K. Davis, Finding Resources for Health Reform and Bending the Health Care Cost Curve (New York: The Commonwealth Fund, June 2009).
22 M. Murray and D. M. Berwick, “Advanced Access: Reducing Waiting and Delays in Primary Care,” Journal of the American Medical Association, Feb. 26, 2003 289(8):1035–40.
23 J. E. Wennberg, “Shared Decision-Making and the Future of Managed Care,” Disease Management and Clinical Outcomes, Jan. 1997 1(1):15–16.
24 Data from France, Italy, Norway, and Sweden not shown.
25 Schoen, Osborn, How, Doty, and Peugh, “In Chronic Condition,” 2008.
26 Schoen, Osborn, Doty, Bishop, Peugh, and Murukutla, “Toward Higher-Performance Health Systems,” 2007; Schoen, Osborn, How, Doty, and Peugh, “In Chronic Condition,” 2008; Schoen, Osborn, Doty, Squires, Peugh, and Applebaum, “A Survey of Primary Care Physicians in 11 Countries,” 2009.
27 For more details see: C. Schoen and S. K. H. How, National Scorecard on U.S. Health System Performance: Chartpack Technical Appendix (New York: The Commonwealth Fund, Sept. 2006).
21
METHODOLOGY APPENDIX
Data are drawn from the Commonwealth Fund 2007 International Health Policy Survey, conducted by tele-phone in Australia, Canada, Germany, the Netherlands, New Zealand, the United Kingdom, and the United States; the 2008 International Health Policy Survey of Sicker Adults, conducted in the same seven countries plus France; and the Commonwealth Fund 2009 International Health Policy Survey of Primary Care Physicians, conducted in the same eight countries plus Italy, Norway, and Sweden.24 The 2007 survey focuses on the primary care experiences of nationally representative samples of adults age 18 and older in the seven countries. The 2008 survey targets a representative sample of “sicker adults,” defined as those who rated their health status as fair or poor, had a serious illness in the past two years, had been hospitalized for something other than a normal birth delivery, or had undergone major surgery in the past two years.25 The 2009 survey looks at the experiences of primary care physicians.
Approximately 1,000 adults in Australia and New Zealand; 1,500 in Germany, the Netherlands, and the U.K.; 2,500 in the U.S; and 3,000 in Canada were included in 2007. Approximately 750 sicker adults in Australia and New Zealand; 1,000 in the Netherlands; 1,200 in Germany, the U.K., and U.S.; and 2,600 in Canada were included in 2008. In 2009, 500 to 1,000 physicians in Germany, the Netherlands and New Zealand and 1,000 to 1,500 in Australia, the U.S., Canada, and the U.K. were included. The total sample across these countries was 11,910 adults in 2007, 8,742 sicker adults in 2008, and 6,750 primary care physi-cians in 2009.
The 2007 survey focuses on patients’ self-reported experiences getting and using health care services, as well as their opinions on health system structure and recent reforms. The 2008 survey examines sicker patients’ views of the health care system, quality of care, care coordination, medical errors, patient–physician communication, waiting times, and access problems. The 2009 survey looks at primary care physicians’ expe-riences providing care to patients, as well as the use of information technology and teamwork in the provision of care. Further details of the survey methodology are described in this section and elsewhere.26
For this report, we selected and grouped indicators from these three surveys using the National Scorecard’s dimensions of quality. Quality was measured by 42 indicators, broken down into four areas (15 effective care measures, seven safe care measures, 10 coordinated care measures, and 10 patient-centered care measures). There are 11 access indicators (four for cost-related access problems, and seven indicators of timeli-ness of care), and nine efficiency indicators. For the equity measure, we compared experiences of adults with incomes above or below national median incomes to examine low-income experiences across countries and differences between those with lower and higher incomes for each of nine indicators. For the long, healthy, and productive lives dimension, we compiled three indicators from OECD and WHO.27
In all, 74 indicators of performance are included. We ranked countries by calculating means and rank-ing scores from highest to lowest (where 1 equals the highest score) across the seven countries. For ties, the tied observations were both assigned the average score that would be assigned if no tie had occurred. For each Scorecard domain of quality and access, a summary ranking was calculated by averaging the individual ranked scores within each country and ranking these averages from highest (value=1) to lowest (value=7) score.

1 East 75th Street • New York, NY 10021
Tel: 212.606.3800
1150 17th Street NW • Suite 600 • Washington, DC 20036
Tel: 202.292.6700