missing values in cardiac arrest...
TRANSCRIPT

Missing values in cardiac arrest studiesFRIAS workshop, Session 2
Christian Torp-Pedersen1 & Thomas Alexander Gerds2
Medical doctor, 1Department of Epidemiology, University of Aalborg, Denmark
Mathematician, 2Department of Biostatistics, University of Copenhagen, Denmark
22 September 2016
1 / 49

Appetizer
2 / 49
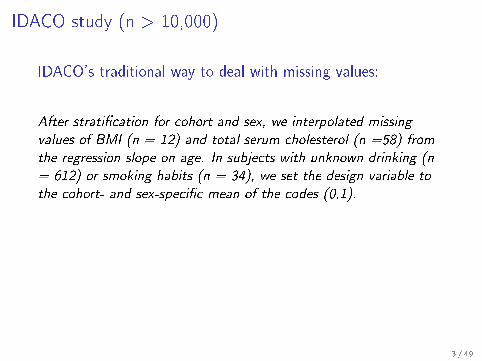
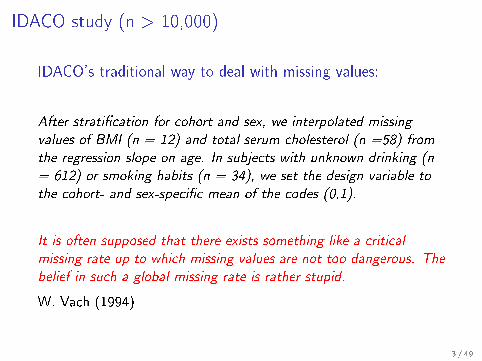
IDACO study (n > 10,000)
IDACO's traditional way to deal with missing values:
After strati�cation for cohort and sex, we interpolated missing
values of BMI (n = 12) and total serum cholesterol (n =58) from
the regression slope on age. In subjects with unknown drinking (n
= 612) or smoking habits (n = 34), we set the design variable to
the cohort- and sex-speci�c mean of the codes (0,1).
It is often supposed that there exists something like a critical
missing rate up to which missing values are not too dangerous. The
belief in such a global missing rate is rather stupid.
W. Vach (1994)
3 / 49

PART I:
Setting the stage
4 / 49
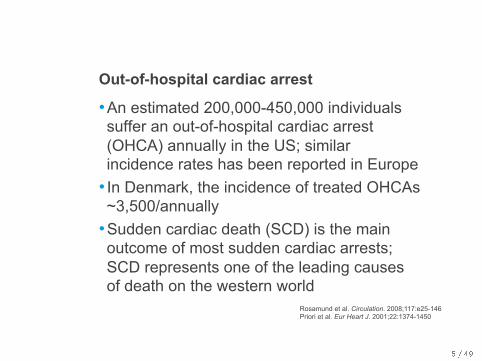
Out-of-hospital cardiac arrest
• An estimated 200,000-450,000 individuals suffer an out-of-hospital cardiac arrest (OHCA) annually in the US; similar incidence rates has been reported in Europe
• In Denmark, the incidence of treated OHCAs ~3,500/annually
• Sudden cardiac death (SCD) is the main outcome of most sudden cardiac arrests; SCD represents one of the leading causes of death on the western world
Rosamund et al. Circulation. 2008;117:e25-146 Priori et al. Eur Heart J. 2001;22:1374-1450
5 / 49
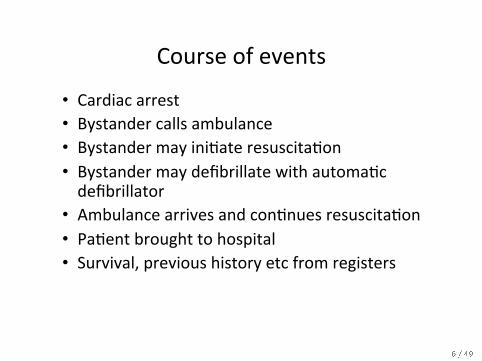
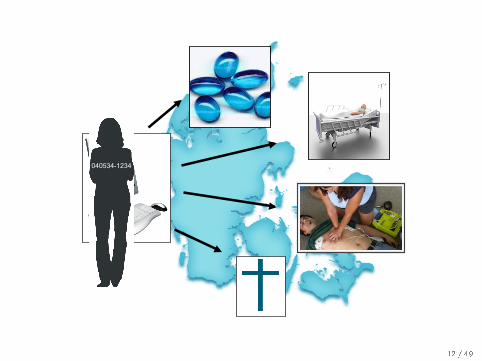
Courseofevents
• Cardiacarrest• Bystandercallsambulance• Bystandermayini5ateresuscita5on• Bystandermaydefibrillatewithautoma5cdefibrillator
• Ambulancearrivesandcon5nuesresuscita5on• Pa5entbroughttohospital• Survival,previoushistoryetcfromregisters
6 / 49
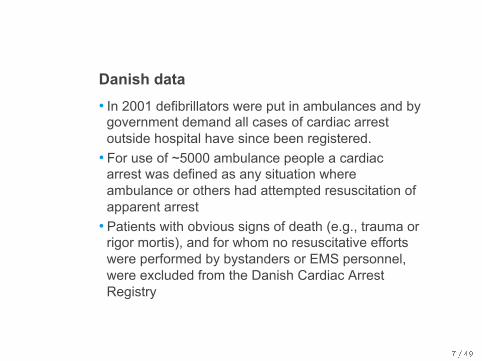
Danish data • In 2001 defibrillators were put in ambulances and by
government demand all cases of cardiac arrest outside hospital have since been registered.
• For use of ~5000 ambulance people a cardiac arrest was defined as any situation where ambulance or others had attempted resuscitation of apparent arrest
• Patients with obvious signs of death (e.g., trauma or rigor mortis), and for whom no resuscitative efforts were performed by bystanders or EMS personnel, were excluded from the Danish Cardiac Arrest Registry
7 / 49

8 / 49

9 / 49
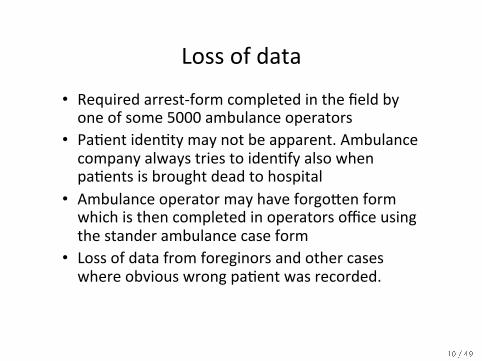
Lossofdata
• Requiredarrest-formcompletedinthefieldbyoneofsome5000ambulanceoperators
• Pa5entiden5tymaynotbeapparent.Ambulancecompanyalwaystriestoiden5fyalsowhenpa5entsisbroughtdeadtohospital
• AmbulanceoperatormayhaveforgoFenformwhichisthencompletedinoperatorsofficeusingthestanderambulancecaseform
• Lossofdatafromforeginorsandothercaseswhereobviouswrongpa5entwasrecorded.
10 / 49
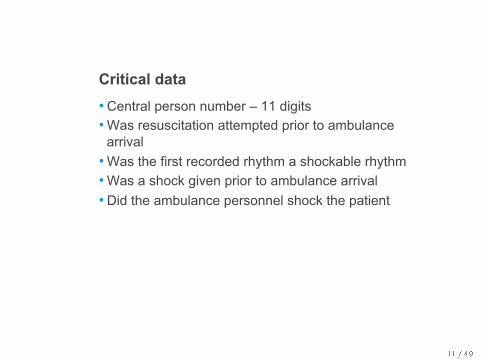
Critical data • Central person number – 11 digits • Was resuscitation attempted prior to ambulance
arrival • Was the first recorded rhythm a shockable rhythm • Was a shock given prior to ambulance arrival • Did the ambulance personnel shock the patient
11 / 49
040534-1234
12 / 49
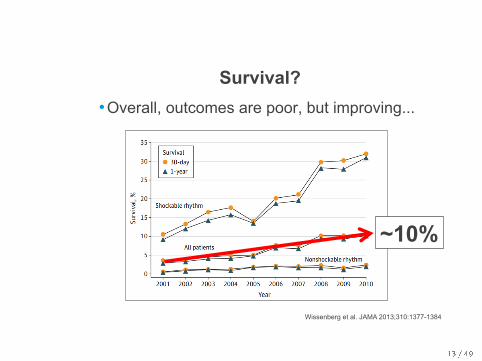
Survival? • Overall, outcomes are poor, but improving...
Wissenberg et al. JAMA 2013;310:1377-1384
~10%
13 / 49
Questions for today • How much value is bystander defibrillation • What is the impact of automatic defibrillators used
by lay people • What is the cerebral outcome after resuscitated
cardiac arrest
14 / 49
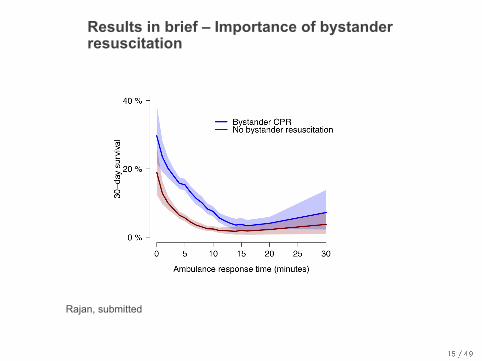
Results in brief – Importance of bystander resuscitation
Rajan, submitted
15 / 49
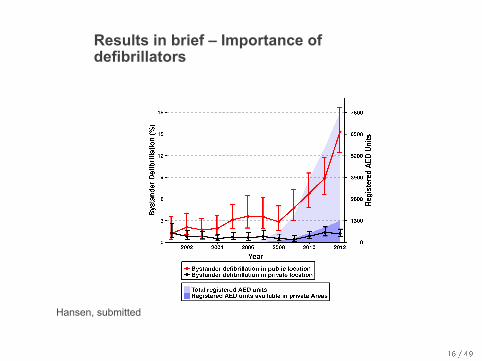
Results in brief – Importance of defibrillators
Hansen, submitted
16 / 49
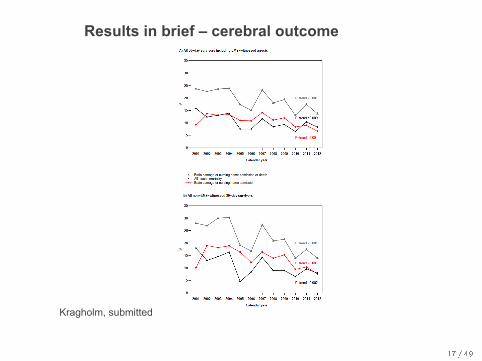
Results in brief – cerebral outcome
Kragholm, submitted
17 / 49
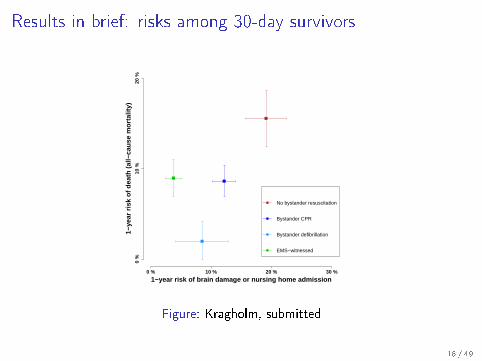
Results in brief: risks among 30-day survivors
1−year risk of brain damage or nursing home admission
1−ye
ar r
isk
of d
eath
(al
l−ca
use
mor
talit
y)
0 % 10 % 20 % 30 %
0 %
10 %
20 %
No bystander resuscitation
Bystander CPR
Bystander defibrillation
EMS−witnessed
Figure: Kragholm, submitted
18 / 49

PART II:
Design of statistical analysis
19 / 49
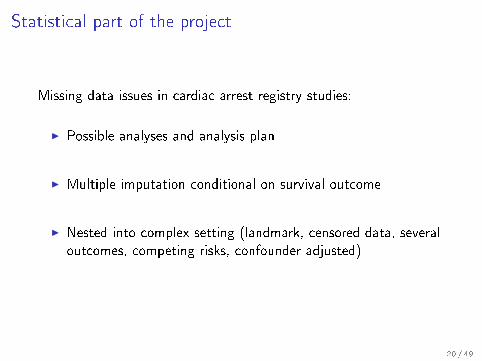
Statistical part of the project
Missing data issues in cardiac arrest registry studies:
I Possible analyses and analysis plan
I Multiple imputation conditional on survival outcome
I Nested into complex setting (landmark, censored data, severaloutcomes, competing risks, confounder adjusted)
20 / 49
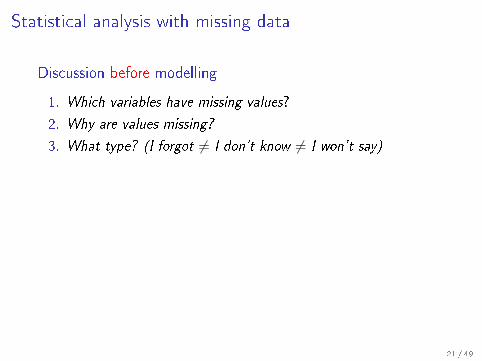
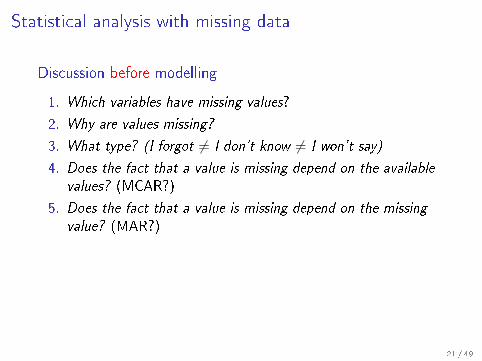
Statistical analysis with missing data
Discussion before modelling
1. Which variables have missing values?
2. Why are values missing?
3. What type? (I forgot 6= I don't know 6= I won't say)
4. Does the fact that a value is missing depend on the available
values? (MCAR?)
5. Does the fact that a value is missing depend on the missing
value? (MAR?)
6. What are the outcome(s) and exposure(s)?
7. What are the parameters of interest (substantive models) ?
8. What are the potential confounders (auxiliary variables)?
21 / 49
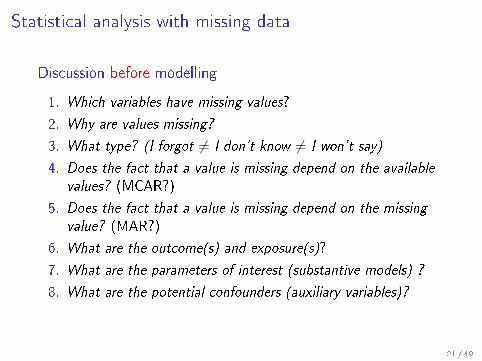
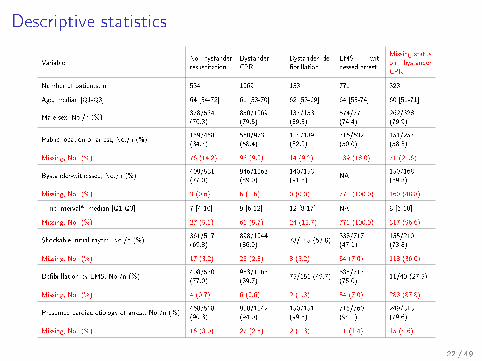
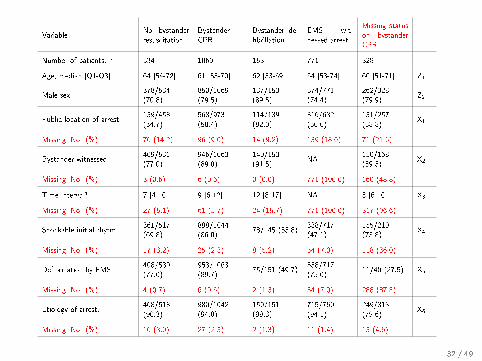
Descriptive statistics
VariableNo bystanderresuscitation
BystanderCPR
Bystander de-�brillation
EMS wit-nessed arrest
Missing statuson bystanderCPR
Number of patients, n 534 1069 153 771 328
Age, median [Q1-Q3] 64 [54-72] 61 [53-70] 62 [53-69] 64 [53-74] 60 [51-71]
Male sex, No./n (%)378/534(70.8)
850/1069(79.5)
137/153(89.5)
574/771(74.4)
262/328(79.9)
Public location of arrest, No./n (%)159/458(34.7)
568/973(58.4)
114/139(82.0)
316/632(50.0)
151/257(58.8)
Missing, No. (%) 76 (14.2) 96 (9.0) 14 (9.2) 139 (18.0) 71 (21.6)
Bystander-witnessed, No./n (%)409/531(77.0)
946/1063(89.0)
140/153(91.5)
NA150/168(89.3)
Missing, No. (%) 3 (0.6) 6 (0.6) 0 (0.0) 771 (100.0) 160 (48.8)
Time interval*, median [Q1-Q3] 7 [4-10] 9 [6-12] 12 [8-17] NA 8 [6-10]
Missing, No. (%) 27 (5.1) 61 (5.7) 24 (15.7) 771 (100.0) 317 (96.6)
Shockable initial rhytm, No./n (%)361/517(69.8)
898/1044(86.0)
78/145 (53.8)338/717(47.1)
155/210(73.8)
Missing, No. (%) 17 (3.2) 25 (2.3) 8 (5.2) 54 (7.0) 118 (36.0)
De�brillation by EMS, No./n (%)408/530(77.0)
953/1063(89.7)
75/151 (49.7)538/717(75.0)
11/40 (27.5)
Missing, No. (%) 4 (0.7) 6 (0.6) 2 (1.3) 54 (7.0) 288 (87.8)
Presumed cardiac etiology of arrest, No./n (%)468/518(90.3)
980/1042(94.0)
150/151(99.3)
715/760(94.1)
249/313(79.6)
Missing, No. (%) 16 (3.0) 27 (2.5) 2 (1.3) 11 (1.4) 15 (4.6)
22 / 49
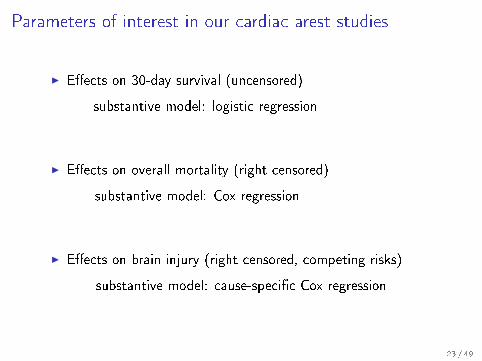
Parameters of interest in our cardiac arest studies
I E�ects on 30-day survival (uncensored)
substantive model: logistic regression
I E�ects on overall mortality (right censored)
substantive model: Cox regression
I E�ects on brain injury (right censored, competing risks)
substantive model: cause-speci�c Cox regression
23 / 49

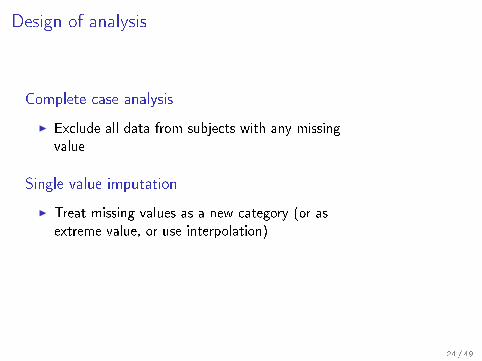
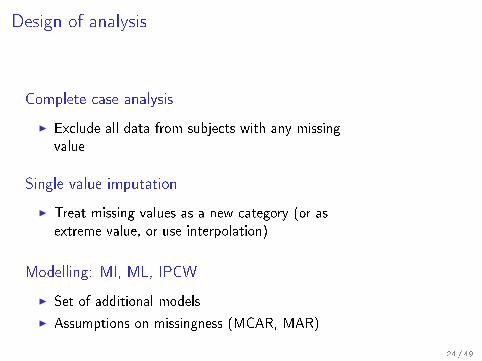
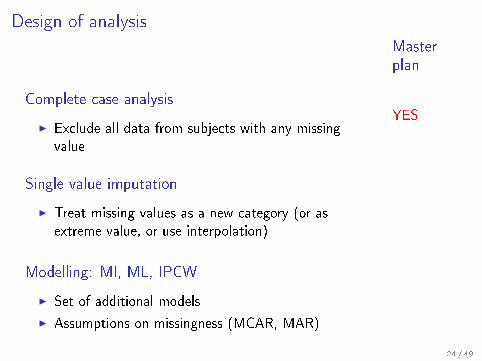
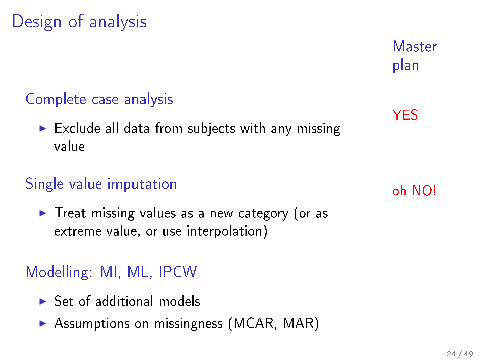
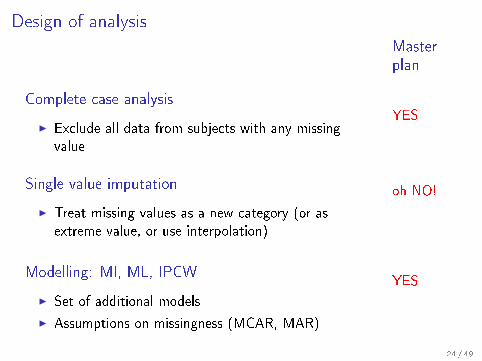
Design of analysis
Complete case analysis
I Exclude all data from subjects with any missingvalue
Single value imputation
I Treat missing values as a new category (or asextreme value, or use interpolation)
Modelling: MI, ML, IPCW
I Set of additional models
I Assumptions on missingness (MCAR, MAR)
Masterplan
YES
oh NO!
YES
24 / 49
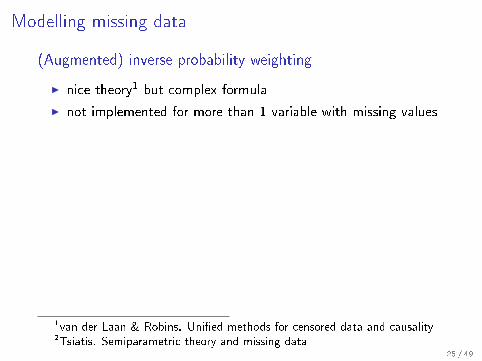
Modelling missing data
(Augmented) inverse probability weighting
I nice theory1 but complex formula
I not implemented for more than 1 variable with missing values
Full information maximum likelihood
I not implemented for survival outcome. Hard to implementwhen some variables with missing values are not normal
Multiple imputation
I related to �rst step of EM algorithm 2
I provided in several software packages
1van der Laan & Robins. Uni�ed methods for censored data and causality2Tsiatis. Semiparametric theory and missing data
25 / 49
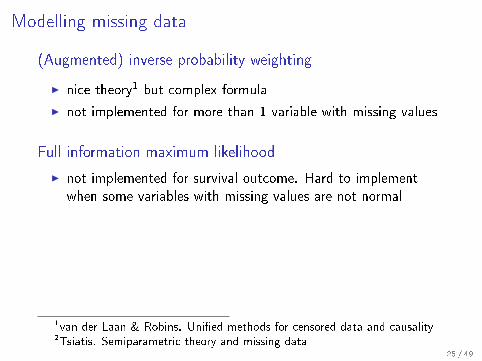
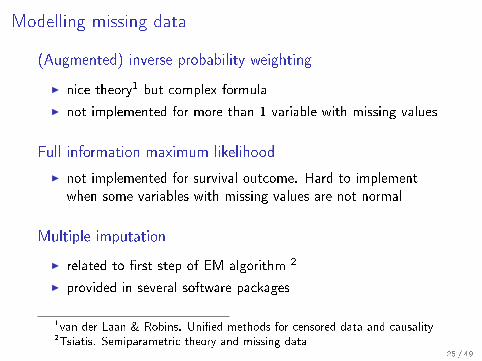
Statistical analysis with missing data
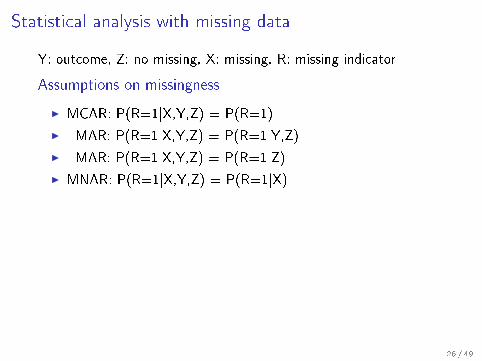
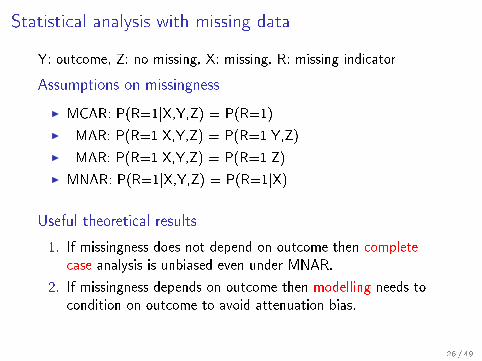
Y: outcome, Z: no missing, X: missing, R: missing indicator
Assumptions on missingness
I MCAR: P(R=1|X,Y,Z) = P(R=1)
I MAR: P(R=1|X,Y,Z) = P(R=1|Y,Z)
I MAR: P(R=1|X,Y,Z) = P(R=1|Z)
I MNAR: P(R=1|X,Y,Z) = P(R=1|X)
Useful theoretical results
1. If missingness does not depend on outcome then completecase analysis is unbiased even under MNAR.
2. If missingness depends on outcome then modelling needs tocondition on outcome to avoid attenuation bias.
26 / 49
Statistical analysis with missing data
Y: outcome, Z: no missing, X: missing, R: missing indicator
Assumptions on missingness
I MCAR: P(R=1|X,Y,Z) = P(R=1)
I MAR: P(R=1|X,Y,Z) = P(R=1|Y,Z)
I MAR: P(R=1|X,Y,Z) = P(R=1|Z)
I MNAR: P(R=1|X,Y,Z) = P(R=1|X)
Useful theoretical results
1. If missingness does not depend on outcome then completecase analysis is unbiased even under MNAR.
2. If missingness depends on outcome then modelling needs tocondition on outcome to avoid attenuation bias.
26 / 49

Proof of result 1 (thanks Torben & Frank)Assume:
P(R=0|X,Y,Z) = h(X,Z) NMAR
The outcome distribution for complete case subjects
f (Y |X ,Z ,R = 0)
=f (Y ,X ,Z ,R = 0)
f (X ,Z ,R = 0)
=f (X ,Z )P(R = 0|Y ,X ,Z )f (Y |X ,Z )
f (X ,Z )∫Y P(R = 0|Y ,X ,Z )f (Y |X ,Z )
NMAR=
h(X ,Z )f (Y |X ,Z )
h(X ,Z )∫Y f (Y |X ,Z )
= f (Y |X ,Z )
27 / 49
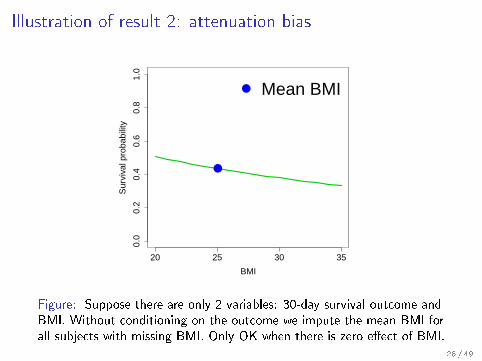
Illustration of result 2: attenuation bias
20 25 30 35
0.0
0.2
0.4
0.6
0.8
1.0
BMI
Sur
viva
l pro
babi
lity
●
● Mean BMI
Figure: Suppose there are only 2 variables: 30-day survival outcome andBMI. Without conditioning on the outcome we impute the mean BMI forall subjects with missing BMI. Only OK when there is zero e�ect of BMI.
28 / 49
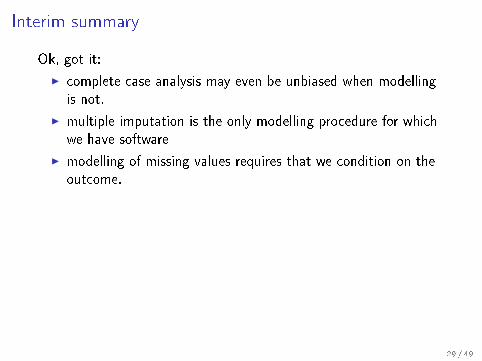
Interim summary
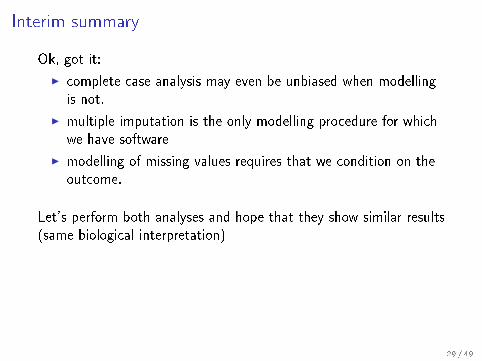
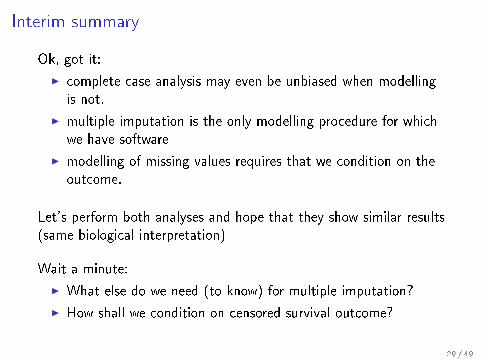
Ok, got it:
I complete case analysis may even be unbiased when modellingis not.
I multiple imputation is the only modelling procedure for whichwe have software
I modelling of missing values requires that we condition on theoutcome.
Let's perform both analyses and hope that they show similar results(same biological interpretation)
Wait a minute:
I What else do we need (to know) for multiple imputation?
I How shall we condition on censored survival outcome?
29 / 49
Interim summary
Ok, got it:
I complete case analysis may even be unbiased when modellingis not.
I multiple imputation is the only modelling procedure for whichwe have software
I modelling of missing values requires that we condition on theoutcome.
Let's perform both analyses and hope that they show similar results(same biological interpretation)
Wait a minute:
I What else do we need (to know) for multiple imputation?
I How shall we condition on censored survival outcome?
29 / 49
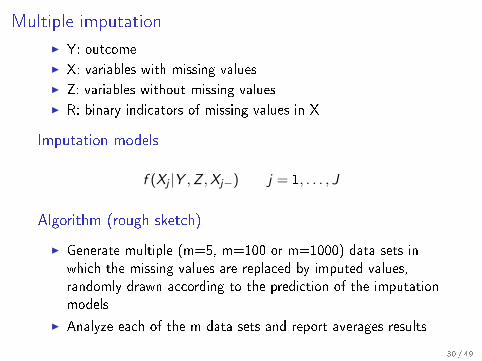
Multiple imputation
I Y: outcome
I X: variables with missing values
I Z: variables without missing values
I R: binary indicators of missing values in X
Imputation models
f (Xj |Y ,Z ,Xj−) j = 1, . . . , J
Algorithm (rough sketch)
I Generate multiple (m=5, m=100 or m=1000) data sets inwhich the missing values are replaced by imputed values,randomly drawn according to the prediction of the imputationmodels
I Analyze each of the m data sets and report averages results
30 / 49
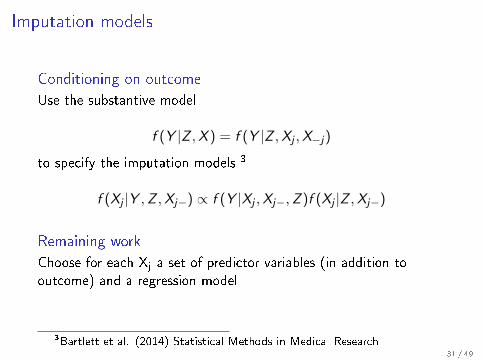
Imputation models
Conditioning on outcome
Use the substantive model
f (Y |Z ,X ) = f (Y |Z ,Xj ,X−j)
to specify the imputation models 3
f (Xj |Y ,Z ,Xj−) ∝ f (Y |Xj ,Xj−,Z )f (Xj |Z ,Xj−)
Remaining work
Choose for each Xj a set of predictor variables (in addition tooutcome) and a regression model
3Bartlett et al. (2014) Statistical Methods in Medical Research31 / 49
VariableNo bystanderresuscitation
BystanderCPR
Bystander de-�brillation
EMS wit-nessed arrest
Missing statuson bystanderCPR
Number of patients, n 534 1069 153 771 328
Age, median [Q1-Q3] 64 [54-72] 61 [53-70] 62 [53-69] 64 [53-74] 60 [51-71] Z1
Male sex,378/534(70.8)
850/1069(79.5)
137/153(89.5)
574/771(74.4)
262/328(79.9)
Z2
Public location of arrest,159/458(34.7)
568/973(58.4)
114/139(82.0)
316/632(50.0)
151/257(58.8)
X1
Missing, No. (%) 76 (14.2) 96 (9.0) 14 (9.2) 139 (18.0) 71 (21.6)
Bystander-witnessed,409/531(77.0)
946/1063(89.0)
140/153(91.5)
NA150/168(89.3)
X2
Missing, No. (%) 3 (0.6) 6 (0.6) 0 (0.0) 771 (100.0) 160 (48.8)
Time interval* 7 [4-10] 9 [6-12] 12 [8-17] NA 8 [6-10] X3
Missing, No. (%) 27 (5.1) 61 (5.7) 24 (15.7) 771 (100.0) 317 (96.6)
Shockable initial rhytm,361/517(69.8)
898/1044(86.0)
78/145 (53.8)338/717(47.1)
155/210(73.8)
X4
Missing, No. (%) 17 (3.2) 25 (2.3) 8 (5.2) 54 (7.0) 118 (36.0)
De�brillation by EMS,408/530(77.0)
953/1063(89.7)
75/151 (49.7)538/717(75.0)
11/40 (27.5) X5
Missing, No. (%) 4 (0.7) 6 (0.6) 2 (1.3) 54 (7.0) 288 (87.8)
Etiology of arrest,468/518(90.3)
980/1042(94.0)
150/151(99.3)
715/760(94.1)
249/313(79.6)
X6
Missing, No. (%) 16 (3.0) 27 (2.5) 2 (1.3) 11 (1.4) 15 (4.6)
32 / 49
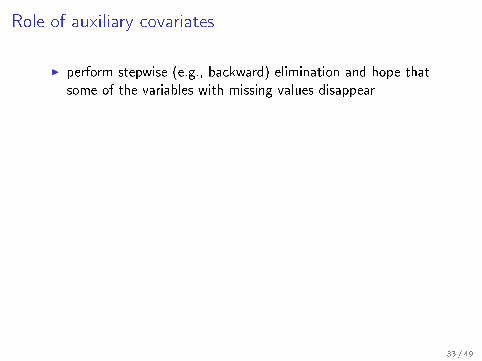
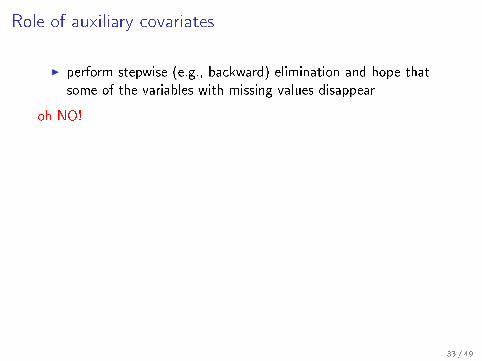
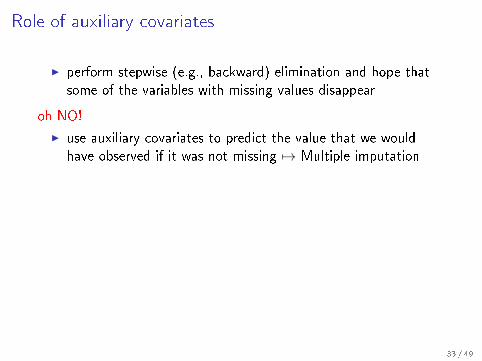
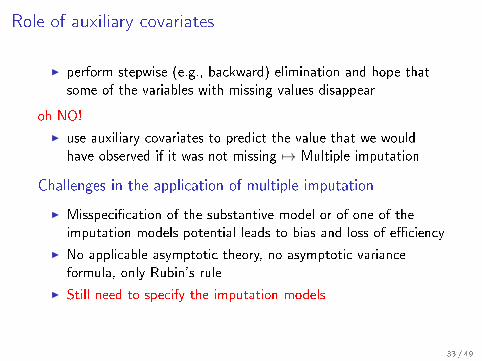
Role of auxiliary covariates
I perform stepwise (e.g., backward) elimination and hope thatsome of the variables with missing values disappear
oh NO!
I use auxiliary covariates to predict the value that we wouldhave observed if it was not missing 7→ Multiple imputation
Challenges in the application of multiple imputation
I Misspeci�cation of the substantive model or of one of theimputation models potential leads to bias and loss of e�ciency
I No applicable asymptotic theory, no asymptotic varianceformula, only Rubin's rule
I Still need to specify the imputation models
33 / 49
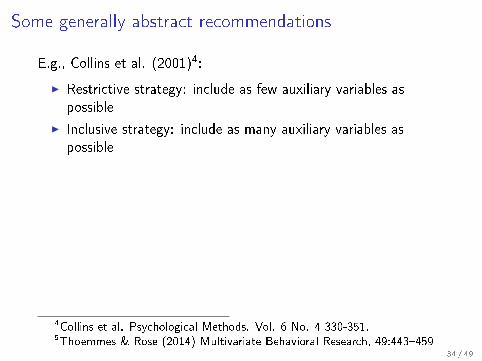
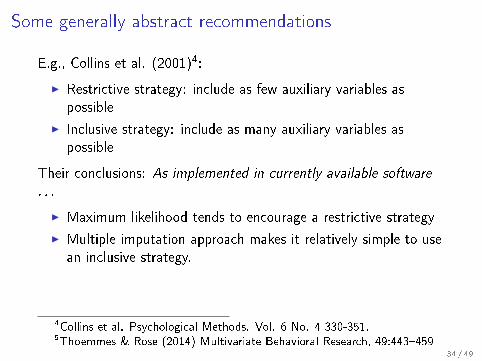
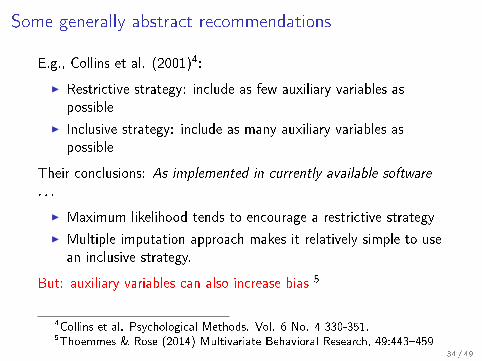
Some generally abstract recommendations
E.g., Collins et al. (2001)4:
I Restrictive strategy: include as few auxiliary variables aspossible
I Inclusive strategy: include as many auxiliary variables aspossible
Their conclusions: As implemented in currently available software
. . .
I Maximum likelihood tends to encourage a restrictive strategy
I Multiple imputation approach makes it relatively simple to usean inclusive strategy.
But: auxiliary variables can also increase bias 5
4Collins et al. Psychological Methods. Vol. 6 No. 4 330-351.5Thoemmes & Rose (2014) Multivariate Behavioral Research, 49:443�459
34 / 49
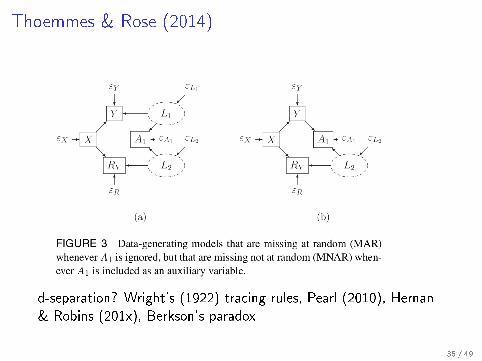
Thoemmes & Rose (2014)
d-separation? Wright's (1922) tracing rules, Pearl (2010), Hernan& Robins (201x), Berkson's paradox
35 / 49

PART III
Results
36 / 49
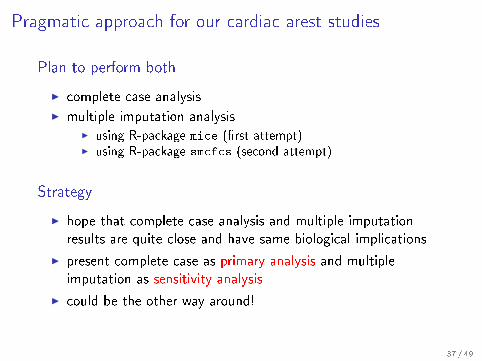
Pragmatic approach for our cardiac arest studies
Plan to perform both
I complete case analysis
I multiple imputation analysisI using R-package mice (�rst attempt)I using R-package smcfcs (second attempt)
Strategy
I hope that complete case analysis and multiple imputationresults are quite close and have same biological implications
I present complete case as primary analysis and multipleimputation as sensitivity analysis
I could be the other way around!
37 / 49
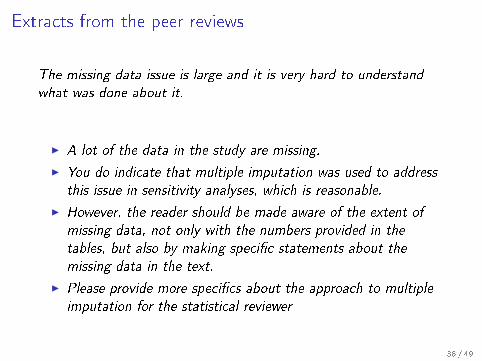
Extracts from the peer reviews
The missing data issue is large and it is very hard to understand
what was done about it.
I A lot of the data in the study are missing.
I You do indicate that multiple imputation was used to address
this issue in sensitivity analyses, which is reasonable.
I However, the reader should be made aware of the extent of
missing data, not only with the numbers provided in the
tables, but also by making speci�c statements about the
missing data in the text.
I Please provide more speci�cs about the approach to multiple
imputation for the statistical reviewer
38 / 49
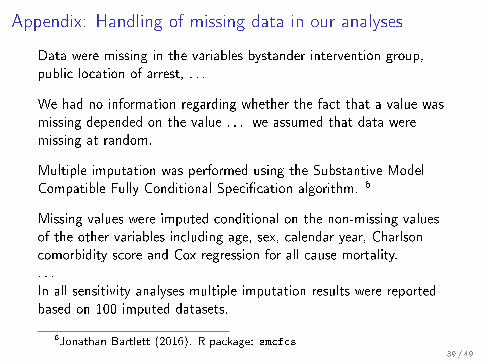
Appendix: Handling of missing data in our analyses
Data were missing in the variables bystander intervention group,public location of arrest, . . .
We had no information regarding whether the fact that a value wasmissing depended on the value . . . we assumed that data weremissing at random.
Multiple imputation was performed using the Substantive ModelCompatible Fully Conditional Speci�cation algorithm. 6
Missing values were imputed conditional on the non-missing valuesof the other variables including age, sex, calendar year, Charlsoncomorbidity score and Cox regression for all cause mortality.. . .In all sensitivity analyses multiple imputation results were reportedbased on 100 imputed datasets.
6Jonathan Bartlett (2016). R package: smcfcs39 / 49
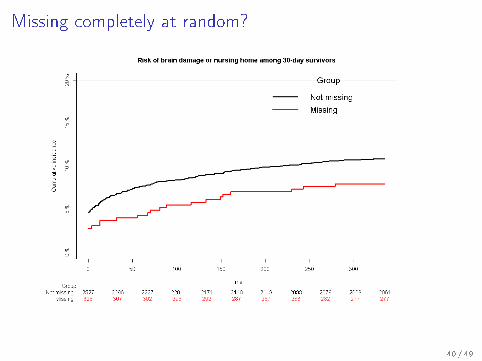
Missing completely at random?
40 / 49
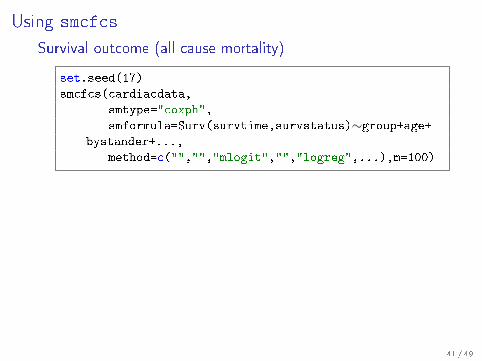
Using smcfcs
Survival outcome (all cause mortality)
set.seed(17)
smcfcs(cardiacdata,
smtype="coxph",
smformula=Surv(survtime,survstatus)∼group+age+bystander+...,
method=c("","","mlogit","","logreg",...),m=100)
Competing risks outcome (brain damage)
set.seed(17)
smcfcs(cardiacdata,
smtype="compet",
smformula=c(Surv(tt,e==1)∼group+age+bystander+...,
Surv(tt,e==2)∼group+age+bystander+...,),method=c("","","mlogit","","logreg",...),m=100)
41 / 49
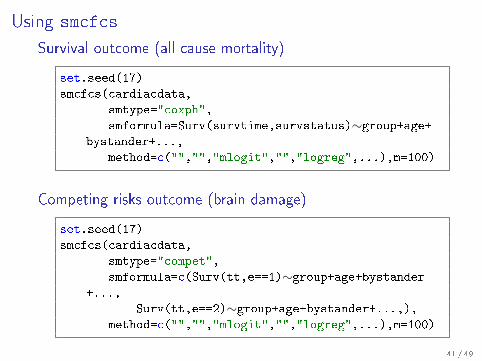
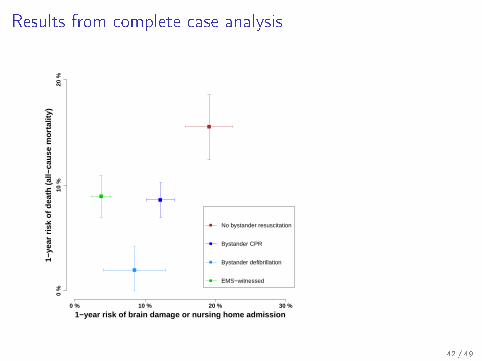
Results from complete case analysis
1−year risk of brain damage or nursing home admission
1−ye
ar r
isk
of d
eath
(al
l−ca
use
mor
talit
y)
0 % 10 % 20 % 30 %
0 %
10 %
20 %
No bystander resuscitation
Bystander CPR
Bystander defibrillation
EMS−witnessed
42 / 49
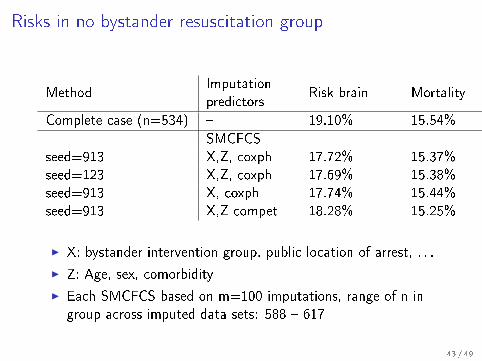
Risks in no bystander resuscitation group
MethodImputationpredictors
Risk brain Mortality
Complete case (n=534) � 19.10% 15.54%
SMCFCSseed=913 X,Z, coxph 17.72% 15.37%seed=123 X,Z, coxph 17.69% 15.38%seed=913 X, coxph 17.74% 15.44%seed=913 X,Z compet 18.28% 15.25%
I X: bystander intervention group, public location of arrest, . . .
I Z: Age, sex, comorbidity
I Each SMCFCS based on m=100 imputations, range of n ingroup across imputed data sets: 588 � 617
43 / 49
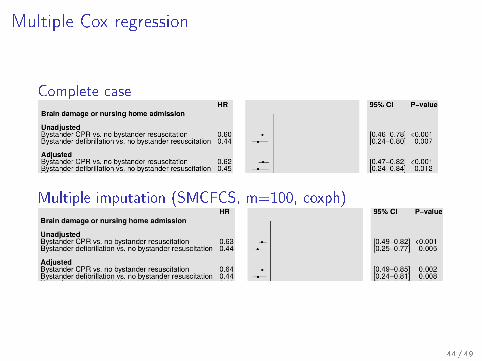
Multiple Cox regression
Complete case
Multiple imputation (SMCFCS, m=100, coxph)
44 / 49

PART IV
Discussion
45 / 49
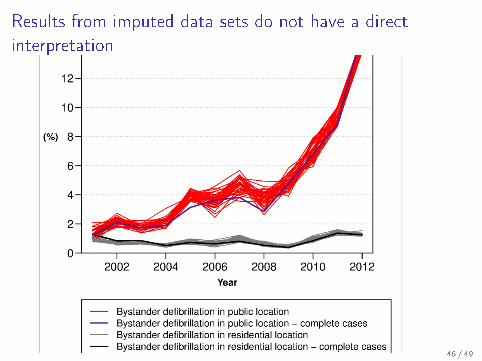
Results from imputed data sets do not have a directinterpretation
46 / 49
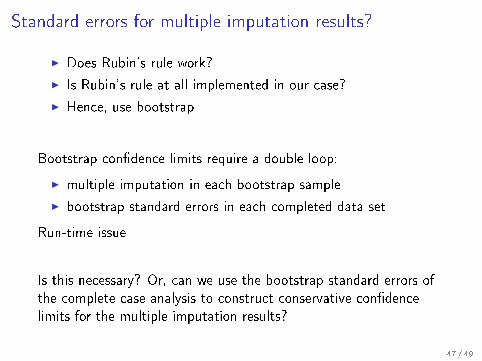
Standard errors for multiple imputation results?
I Does Rubin's rule work?
I Is Rubin's rule at all implemented in our case?
I Hence, use bootstrap
Bootstrap con�dence limits require a double loop:
I multiple imputation in each bootstrap sample
I bootstrap standard errors in each completed data set
Run-time issue
Is this necessary? Or, can we use the bootstrap standard errors ofthe complete case analysis to construct conservative con�dencelimits for the multiple imputation results?
47 / 49
Summary
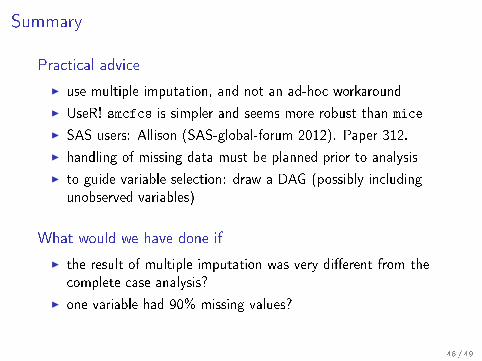
Practical advice
I use multiple imputation, and not an ad-hoc workaround
I UseR! smcfcs is simpler and seems more robust than mice
I SAS users: Allison (SAS-global-forum 2012). Paper 312.
I handling of missing data must be planned prior to analysis
I to guide variable selection: draw a DAG (possibly includingunobserved variables)
What would we have done if
I the result of multiple imputation was very di�erent from thecomplete case analysis?
I one variable had 90% missing values?
48 / 49
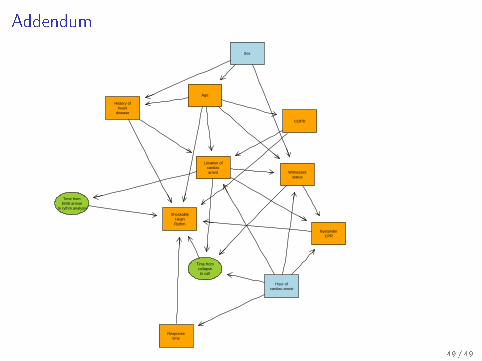
Addendum
ShockableHeartRythm
BystanderCPR
Responsetime
Age
COPD
History ofheart
disease
Location ofcardiacarrest
Sex
Witnessedstatus
Hour ofcardiac arrest
Time fromcollapseto call
Time fromEMS arrival
to rythm analysis
49 / 49